UNITED STATES
SECURITIES AND EXCHANGE COMMISSION
WASHINGTON, D.C. 20549
FORM 10-K
(Mark One)
| ANNUAL REPORT PURSUANT TO SECTION 13 OR 15(d) OF THE SECURITIES EXCHANGE ACT OF 1934 | |||||
For the fiscal year ended December 31 , 2023
OR
| TRANSITION REPORT PURSUANT TO SECTION 13 OR 15(d) OF THE SECURITIES EXCHANGE ACT OF 1934 | |||||
For the Transition Period from to
Commission file number. 1-39681
(Exact name of registrant as specified in its charter)
| (State or other jurisdiction of incorporation or organization) | (I. R. S. Employer Identification No.) | ||||||||||||||||
| (Address of principal executive offices) | (Zip Code) | ||||||||||||||||
Registrant’s telephone number, including area code: (678 ) 402-3000
Securities registered pursuant to Section 12(b) of the Act:
| Title of each class | Trading Symbol | Name of each exchange on which registered | ||||||
Securities registered pursuant to Section 12(g) of the Act: NONE
Indicate by check mark if the registrant is a well-known seasoned issuer, as defined in Rule 405 of the Securities Act. Yes ☐ No ☒
Indicate by check mark if the registrant is not required to file reports pursuant to Section 13 or Section 15(d) of the Act. Yes ☐ No ☒
Indicate by check mark whether the registrant (1) has filed all reports required to be filed by Section 13 or 15(d) of the Securities Exchange Act of 1934 during the preceding 12 months (or for such shorter period that the registrant was required to file such reports), and (2) has been subject to such filing requirements for the past 90 days. Yes ☒ No ☐
Indicate by check mark whether the registrant has submitted electronically every Interactive Data File required to be submitted pursuant to Rule 405 of Regulation S-T (§ 232.405 of this chapter) during the preceding 12 months (or for such shorter period that the registrant was required to submit such files). Yes ☒ No ☐
Indicate by check mark whether the registrant is a large accelerated filer, an accelerated filer, a non-accelerated filer, a smaller reporting company, or an emerging growth company. See the definitions of "large accelerated filer," "accelerated filer," "smaller reporting company," and "emerging growth company" in Rule 12b-2 of the Exchange Act.
| Large Accelerated Filer | ☐ | ý | |||||||||||||||
| Non-Accelerated Filer | ☐ | Smaller Reporting Company | |||||||||||||||
| Emerging Growth Company | |||||||||||||||||
| If an emerging growth company, indicate by check mark if the registrant has elected not to use the extended transition period for complying with any new or revised financial accounting standards provided pursuant to Section 13(a) of the Exchange Act. | ☐ | ||||||||||||||||
Indicate by check mark whether the registrant has filed a report on and attestation to its management’s assessment of the effectiveness of its internal control over financial reporting under Section 404(b) of the Sarbanes-Oxley Act (15 U.S.C. 7262(b)) by the registered public accounting firm that prepared or issued its audit report. | |||||||||||||||||
If securities are registered pursuant to Section 12(b) of the Act, indicate by check mark whether the financial statements of the registrant included in the filing reflect the correction of an error to previously issued financial statements. ☐
Indicate by check mark whether any of those error corrections are restatements that required a recovery analysis of incentive-based compensation received by any of the registrant’s executive officers during the relevant recovery period pursuant to §240.10D-1(b). ☐
Indicate by check mark whether the registrant is a shell company (as defined in Rule 12b-2 of the Act). Yes ☐ No ☒
The aggregate market value of the common stock held by non-affiliates of the registrant as of June 30, 2023 was $300,964,232 based on the closing price of the common stock on that date as reported by the New York Stock Exchange. Solely for the purpose of this calculation and for no other purpose, the non-affiliates of the registrant are assumed to be all shareholders of the registrant other than (i) directors of the registrant, (ii) executive officers of the registrant, and (iii) any shareholder that beneficially owns 10% or more of the registrant’s common stock.
As of February 23, 2024, there were 30,361,434 shares of the Company’s common stock outstanding.
DOCUMENTS INCORPORATED BY REFERENCE
Portions of the registrant’s definitive Proxy Statement for the 2024 annual meeting of shareholders, to be filed with the Securities and Exchange Commission within 120 days after the end of the fiscal year to which this report relates, are incorporated by reference into Part III of this Annual Report on Form 10-K.
1
2
CAUTIONARY NOTE REGARDING FORWARD LOOKING STATEMENTS
This Annual Report on Form 10-K (this "Annual Report") contains forward-looking statements within the meaning of the Private Securities Litigation Reform Act of 1995. Forward-looking statements are all statements other than those of historical fact. These statements may include, among others, statements regarding our expectations, plans or intentions, such as those relating to management strategies, future financial performance, and capital allocation. The words "believe," "expect," "expectation," "anticipate," "may," "could," "should," "intend," "seek," "estimate," "plan," "target," "project," "likely," "will," "forecast," "outlook," or other similar words, phrases or expressions, among others, generally identify forward-looking statements, which speak only as of the date the statements are made. The matters discussed in these forward-looking statements are inherently subject to risks, uncertainties and other factors that could cause actual results to differ materially from those projected, anticipated or implied in the forward-looking statements. In particular, information included under "Risk Factors," "Financial Statements and Supplementary Data," and "Management’s Discussion and Analysis of Financial Condition and Results of Operations" contain forward-looking statements. Where, in any forward-looking statement, an expectation or belief as to future results or events is expressed, such expectation or belief is based on the current plans and expectations of our management and is expressed in good faith and believed to have a reasonable basis, but there can be no assurance that the expectation or belief will result or be achieved or accomplished. Whether any such forward-looking statements are in fact achieved will depend on future events, many of which are beyond our control. Comparisons of results for any prior periods are not intended to express any future trends, or indications of future performance, unless expressed as such, and should only be viewed as historical data.
Factors, risks, trends and uncertainties that could cause actual results or events to differ materially from those anticipated include the matters described under "Risk Factors" and "Management’s Discussion and Analysis of Financial Condition and Results of Operations," in addition to the following other factors, risks, trends and uncertainties:
•changes in the enforcement of existing laws and regulations and the adoption of new laws and regulations that may unfavorably impact our business, and failures to comply with existing or new laws or regulations, including those related to consumer protection, as well as an increased focus on our industry by federal and state regulatory authorities;
•our ability to execute on our multi-year strategic plan and achieve the benefits and outcomes we expect, including improving our business, centralizing key processes such as customer lease decisioning and payments, real estate optimization, enhancing our e-commerce platform and digital acquisition channels, enhancing and growing BrandsMart, and optimizing our cost structure;
•our ability to attract and retain key personnel;
•our ability to manage cybersecurity risks, disruptions or failures in our information technology ("IT") systems and to protect the security of personal information of our customers and employees;
•weakening general market and economic conditions, especially as they may affect retail sales, increased interest rates, unemployment and consumer confidence or spending levels;
•the concentration of our stores in certain regions or limited markets;
•the current inflationary environment could result in increased labor, raw materials or logistics costs that we are unable to offset or accelerating prices that result in lower lease volumes;
•any future potential pandemics, as well as related measures taken by governmental or regulatory authorities to combat the pandemic;
•business disruptions due to political and economic instability resulting from global conflicts such as the Russia-Ukraine conflict and related economic sanctions and the conflict in Israel, Palestine and surrounding areas, as well as domestic civil unrest;
•challenges faced by our business, including commoditization of consumer electronics, our high fixed-cost operating model and the ongoing labor shortage;
•increased competition from direct-to-consumer and virtual lease-to-own competitors, as well as from traditional and online retailers and other competitors;
•increases in lease merchandise write-offs;
•the Company may fail to realize the benefits expected from the acquisition of Interbond Corporation of America, doing business as BrandsMart U.S.A., including projected synergies;
•the acquisition of BrandsMart U.S.A. may create risks and uncertainties which could materially and adversely affect our business and results of operations;
•our ability to successfully acquire and integrate businesses and to realize the projected results and expected benefits of
3
acquisitions or strategic transactions;
•our ability to maintain or improve market share in the categories in which we operate despite heightened competitive pressure;
•our ability to improve operations and realize cost savings;
•our ability to access the capital markets or raise capital, if needed;
•our ability to protect our intellectual property and other material proprietary rights;
•changes in our services or products;
•negative reputational and financial impacts resulting from future acquisitions or strategic transactions;
•restrictions contained in our debt agreements;
•other factors described in this Annual Report and from time to time in documents that we file with the SEC.
You should read this Annual Report completely and with the understanding that actual future results may be materially different from expectations. All forward-looking statements made in this Annual Report are qualified by these cautionary statements. These forward-looking statements are made only as of the date of this Annual Report, and we do not undertake any obligation, other than as may be required by law, to update or revise any forward-looking or cautionary statements to reflect changes in assumptions, the occurrence of events, unanticipated or otherwise, and changes in future operating results over time or otherwise.
4
PART I
ITEM 1. BUSINESS
Unless otherwise indicated or unless the context otherwise requires, all references in this Annual Report on Form 10-K to the "Company," "our Company," "The Aaron's Company," "we," "us," "our" and similar expressions are references to The Aaron’s Company, Inc. and its consolidated subsidiaries.
Our Company
The Company is a leading, technology-enabled, omni-channel provider of lease-to-own ("LTO") and retail purchase solutions of furniture, electronics, appliances, and other home goods across its brands: Aaron's, BrandsMart U.S.A., BrandsMart Leasing, and Woodhaven Furniture Industries ("Woodhaven"). Aaron’s offers a direct-to-consumer lease-to-own solution through its 1,243 Company-operated and franchised stores in 47 states and Canada, as well as its e-commerce platform. BrandsMart U.S.A. is one of the leading appliance retailers in the country with 11 retail stores in Florida and Georgia. BrandsMart Leasing offers lease-to-own solutions to customers of BrandsMart U.S.A. Woodhaven is the Company's furniture manufacturing division.
On April 1, 2022, the Company completed the previously announced transaction to acquire 100% ownership of Interbond Corporation of America, doing business as BrandsMart U.S.A. The Company paid total consideration of $230 million in cash under the terms of the agreement and additional amounts for working capital adjustments and transaction related fees.
Management believes that the acquisition will strengthen the Company's ability to deliver on its mission of enhancing people’s lives by providing easy access to high quality furniture, appliances, electronics, and other home goods through affordable lease to own and retail purchase options. Management also believes that value creation opportunities include leveraging the Company's LTO expertise to provide BrandsMart U.S.A.'s customers enhanced payment options and offering a wider selection of products to millions of Aaron’s customers, as well as generating procurement savings and other cost synergies.
The following table presents store count by ownership type:
Stores as of December 31 | 2023 | 2022 | 2021 | ||||||||||||||
Company-operated Aaron's Stores1 | 1,019 | 1,034 | 1,074 | ||||||||||||||
| Franchisee-operated Aaron's Stores | 224 | 232 | 236 | ||||||||||||||
BrandsMart U.S.A. Stores2 | 11 | 10 | — | ||||||||||||||
| Systemwide Stores | 1,254 | 1,276 | 1,310 | ||||||||||||||
The following table presents the composition of Company-operated Aaron's Stores as of December 31, 2023:
Company-operated Aaron's Store Types as of December 31, 2023 | GenNext | Legacy | Total | ||||||||
| Store | 186 | 605 | 791 | ||||||||
| Hub | 58 | 56 | 114 | ||||||||
| Showroom | 10 | 104 | 114 | ||||||||
| Total | 254 | 765 | 1,019 | ||||||||
1 The typical layout for a Company-operated Aaron's store is a combination of showroom, customer service and warehouse space, generally comprising 6,000 to 15,000 square feet. Certain Company-operated Aaron's stores consist solely of a showroom.
2 BrandsMart U.S.A. stores average approximately 96,000 square feet and have been included in this table subsequent to the acquisition date of April 1, 2022.
Strategic Priorities
Our management team is committed to executing against the following multi-year strategic priorities to further transform and grow the overall business:
•Transform the Aaron's Business
•Promote our Value Proposition to Retain and Attract New Customers to our Brand – We continue to invest in e-commerce, innovative marketing campaigns, and our lease decisioning and digital platforms to illustrate our value proposition to new and existing customers. Such initiatives and investments include:
◦Making investments to drive growth and consumer traffic through our e-commerce customer acquisition channel by investing in enhancements that provide a fully transactional, mobile, and
5
seamless shopping experience that includes broader product selections, all of which are intended to attract new and younger customers.
◦Utilizing a broad spectrum of traditional and digital marketing communications in both English and Spanish, ranging from direct mail, social media, display, and local market media, all allowing us to customize messages around price, value, and payment flexibility. The Company is also increasing its local marketing and promotional focus on weekly payment offerings to attract more customers and gain market share.
◦Continuing investments in lease decisioning and other digital platforms that allow us to optimize lease portfolio performance and lease renewal rate through analytics, machine learning, and operational practices. Other digital investments, aimed at enhancing the customer's experience and improving customer payment activity, include digital payment and servicing platforms.
•Align the Aaron's Store Footprint to our Customer Opportunity – We continue to invest in our market strategy capabilities to make better-informed, evidence-driven decisions around store location and the optimization of operating expenses. We regularly review our Aaron's real estate portfolio, which we expect will increase profitability through repositioning, remodeling, and consolidating our existing stores via our next-generation store concept ("GenNext"). The GenNext store concept features include larger showrooms and/or re-engineered store layouts, updated signage, expanded product assortment, enhanced technology-enabled shopping and checkout, and an innovative operating model. We have also enhanced our market optimization strategy with a new "Hub and Showroom" model which leverages existing infrastructure to more efficiently serve markets by combining servicing capabilities of multiple stores into a "hub" store while converting other nearby stores into "showrooms" that focus exclusively on sales activities.
We expect that our market optimization program, together with our aarons.com e-commerce platform and increased use of technology to better serve our customers, will continue to enable us to reduce store operating costs and lower working capital requirements while better serving our existing markets, and attracting new customers through expansion into new markets in the future. As of December 31, 2023, we have 254 GenNext stores in our portfolio with plans to open up to an additional 20 GenNext concept stores and 10 showrooms during 2024.
•Enhance and Grow BrandsMart
•Grow Addressable Market - The acquisition of BrandsMart U.S.A. broadens our customer reach and significantly expands our total addressable market. Our BrandsMart growth initiatives include:
◦Capturing share in adjacent geographic markets by opening new BrandsMart stores. In 2023, we opened one new store, and we expect to open 1-2 new stores each year going forward.
◦Making investments to drive growth and customer traffic by investing in enhanced customer payment and financing programs, improved online shopping experience, enhanced digital marketing strategies, and expanded product selection.
•Achieve Transaction Synergies - We continue to make progress in executing our synergy initiatives in connection with the acquisition of BrandsMart U.S.A. in order to drive meaningful value-creation opportunities for the Company.
•Enterprise Initiatives
•Strengthen Operational Efficiencies and Optimize Cost Structure - During the third quarter of 2022, the Company initiated an operational efficiency and optimization restructuring program intended to reduce the Company's overall costs. This program includes the optimization of store support center functions, multi-unit store oversight, store labor and operations, supply chain, and the expansion of the Hub and Showroom model, as well as other reductions in real estate and third party spend. Management believes that implementing this program will help the Company optimize its cost profile, allocate capital resources towards long-term strategic objectives, and generate incremental value for shareholders.
•Further environmental, social, and governance initiatives ("ESG") – We continue to invest in building a people-focused workplace culture and in opportunities to make a positive impact on the environment and the communities where our customers and team members live and work. To do this, we continue to enhance our compliance, enterprise risk management, corporate governance, diversity and inclusion, and environmental management programs and have developed roadmaps for enhancing these programs in 2024 and beyond.
6
Business Segments
For all periods prior to April 1, 2022, the Company only had one operating and reportable segment. Effective as of April 1, 2022 and in connection with the acquisition of BrandsMart U.S.A., the Company updated its reportable segments to align with the current organizational structure and the operating results that the chief operating decision maker regularly reviews to analyze performance and allocate resources, which includes two operating and reportable segments: the Aaron's Business and BrandsMart, along with an Unallocated Corporate category for remaining unallocated costs. The Company has retroactively adjusted, for all periods presented, its segment disclosures to align with the current composition of reportable segments.
The Aaron's Business segment is comprised of (i) Aaron's branded Company-operated and franchise-operated stores; (ii) aarons.com e-commerce platform ("aarons.com"); (iii) Woodhaven; and (iv) BrandsMart Leasing (collectively, the "Aaron’s Business").
The retail store and e-commerce operations of BrandsMart U.S.A. (excluding BrandsMart Leasing) comprise the BrandsMart segment (collectively, "BrandsMart").
Aaron’s Business Segment
Since its founding in 1955, Aaron's has been committed to serving the overlooked and underserved customer with a dedication to inclusion and improving the communities in which it operates. Through a portfolio of approximately 1,240 stores and its aarons.com e-commerce platform, Aaron's, together with its franchisees, provide consumers with LTO and retail purchase solutions for the products they need and want, with a focus on providing its customers with unparalleled customer service, high approval rates, lease plan flexibility, and an attractive value proposition, including competitive monthly payments and total cost of ownership, as compared to other LTO providers.
Woodhaven manufactures and supplies a significant portion of the upholstered furniture leased and sold in Company-operated and franchised Aaron's stores.
Launched in 2022, BrandsMart Leasing offers LTO purchase solutions to customers of BrandsMart U.S.A.
BrandsMart Segment
Founded in 1977, BrandsMart U.S.A. is one of the leading appliance and consumer electronics retailers in the southeast United States ("U.S.") and one of the largest appliance retailers in the country with 11 stores in Florida and Georgia and a growing e-commerce presence on brandsmartusa.com. The operations of BrandsMart U.S.A. (other than BrandsMart Leasing) comprise the BrandsMart segment.
The operating results of our reportable segments may be found in (i) Item 7. Management's Discussion and Analysis of Financial Condition and Results of Operations and (ii) Item 8. Financial Statements and Supplementary Data.
Competitive Assets
We have a unique set of physical and intangible assets developed over decades in the retail and LTO market, which are difficult, expensive, and time consuming to replicate. We have developed a comprehensive strategy to leverage these assets including the following:
•Our Aaron's brand and physical presence in over 670 unique markets – With nearly 70 years in business, Aaron's is recognized nationwide as a leader in the LTO marketplace. This brand recognition has led to an approximate 65% repeat customer rate for the new leases we enter into, and as of December 31, 2023, our Company-operated and franchised stores had approximately 0.9 million customers with active leases. We believe that having delivery trucks located throughout our network enables us to successfully serve diverse markets including rural, suburban, and urban markets, helping mitigate the impact of local economic disruptions resulting from specific industry economic cycles, weather, and other disruptive events.
•Industry leading technology and analytics at the Aaron's Business – The Company has invested in technology to improve the customer experience and its operational execution. These investments include platforms for enhanced data analytics, data-enabled lease decisioning, digital customer onboarding, centralized payment processing and an e-commerce website that allows the customer to review and select merchandise, complete the lease application and, if approved, complete the LTO agreement and make lease payments online. Our technology-enabled platforms simplify the transaction and provide customers with enhanced transparency and flexibility throughout their lease, and provide management with information needed to optimize the financial performance of the business.
•BrandsMart U.S.A.'s competitive pricing and strong brand recognition – BrandsMart U.S.A.'s best in class pricing, broad product assortment and strong storefront presence and brand awareness within the Florida and Georgia markets positions the brand to thrive among its competitors.
7
•Management teams with deep industry experience and customer relationships – The Company's Aaron's branded stores are managed by a group of tenured managers and multi-unit leaders who have deep knowledge of the LTO transaction, as well as experience with our overlooked and underserved customer base. Our high levels of customer service within the Aaron's Business are enhanced by years of relationship building and LTO industry experience that is hard to replicate. Our average management tenure for the Aaron's Business operations is as follows: 9 years for store managers; 12 years for regional managers; 20 years for divisional vice presidents; and 25 years for our Chief Store Operations Officer. The Company's BrandsMart stores are managed by a group of tenured managers who have deep knowledge of retail operations. Our average management tenure for the BrandsMart operations is as follows: 25 years for general managers; 17 years for store managers; and 24 years for vice presidents of key functional areas.
•Last-mile, reverse logistics and refurbishment capabilities – Through both the Aaron's and BrandsMart businesses we are able to offer our customers prompt delivery, in-home set-up, product repair or replacement services, and reverse logistics (with respect to the Aaron's business) for the products our customers obtain from us. Our Aaron's stores also include refurbishment operations for returned merchandise, allowing us to provide pre-leased products for lease or sale in our stores and maximize lease merchandise utilization. We have approximately 2,000 delivery trucks located throughout our Aaron's Business network enabling us to provide last-mile and reverse logistics capabilities in our markets. While BrandsMart product deliveries are primarily outsourced through third-party logistics firms, each BrandsMart store has two to three trucks to assist with delivery, installation, and servicing of product.
•In-house upholstered furniture manufacturing – Under our Woodhaven Furniture Industries ("Woodhaven") manufacturing division, we have the capacity to manufacture approximately 1.1 million furniture units per year, utilizing over 738,000 square feet of manufacturing capacity in six primary furniture facilities. In-house manufacturing provides control over quality and construction, fast response to changing customer tastes and market trends, exclusive products, reduced inventory fulfillment lead times, and mitigation of inventory supply disruptions.
Operations
Aaron's Business Omni-channel Operations
We are committed to providing our customers with an exceptional omni-channel platform which includes an in-store and online shopping experience that allows Aaron’s to engage customers in ways that are convenient and preferable for them. This platform includes a digital guided experience of the customer's LTO transaction through data-enabled lease decisioning, digital servicing and payment options, as well as a digitally streamlined shopping experience on our e-commerce website, aarons.com. Through aarons.com, customers can shop over 10,000+ products, apply for a lease, complete the lease transaction, and access online self-service of lease payments and account management. As a result of our technology-enabled omni-channel strategy, we are attracting new and younger customers to our brand, and many of the aarons.com transactions come from individuals who previously had not shopped at Aaron's.
As of December 31, 2023, we have stores located in 47 states and Canada, and our portfolio is comprised of 1,019 company-operated locations and 224 franchised locations, which are owned and operated by independent franchisees on a licensed basis. We have developed a distinctive store concept including specific merchandising standards, store designs, and flexible payment options, all designed to appeal to our customer base. Our typical store layout is a combination of showroom, customer service and warehouse space, generally comprising 6,000 to 15,000 square feet. Our GenNext store concept generally features larger showrooms and/or re-engineered store layouts, increased product selection, technology-enabled shopping and checkout, and a refined operating model. Most stores have at least two trucks for prompt last-mile delivery, service and return of product. We have also enhanced our market optimization strategy with a new Hub and Showroom model which leverages existing infrastructure to more efficiently serve markets by combining servicing capabilities of multiple stores into a "hub" store while converting other nearby stores into "showrooms" that focus on sales activities.
We have various levels of leadership that oversee our business operations, including divisional vice presidents and regional managers. At the individual store level, the general manager is primarily responsible for managing and supervising all aspects of store operations, including (a) customer relations and account management, (b) deliveries and pickups, (c) warehouse and inventory management, (d) merchandise selection, (e) employment decisions, including hiring, training, and terminating store team members, and (f) certain marketing initiatives. General managers also administer the process of returning merchandise including making determinations with respect to inspection, product repair or replacement, sales, reconditioning and subsequent re-leasing.
We use management information systems to facilitate customer orders, lease renewal payments, merchandise returns and inventory monitoring. Substantially all of our stores are network-linked directly to corporate headquarters enabling us to monitor single store performance on a daily basis. This network system assists the general manager in (a) tracking merchandise on the showroom floor and warehouse, (b) minimizing delivery times, (c) assisting with product purchasing, and (d) matching customer needs with available inventory.
8
By leveraging our investments in technology, including aarons.com, data-enabled lease decisioning, and our omni-channel customer service and payment platforms, we believe that we can serve our existing markets through a more efficient store portfolio while continuing to provide the high level of service our customers expect.
BrandsMart Operations
Our BrandsMart store operations are committed to providing our customers with best-in-class pricing and a broad product assortment, which, along with our dedicated and knowledgeable sales team members, drives a positive customer service experience that differentiates BrandsMart from other retailers. BrandsMart's omni-channel platform includes an in-store and online shopping experience that allows BrandsMart U.S.A. to engage customers in ways that are convenient and preferable for them. This platform includes streamlined shopping experiences on the BrandsMart e-commerce website, brandsmartusa.com, which allows customers to shop over 6,000+ products, access product ratings and reviews, compare prices and opt for direct shipping or same or next day in-store pick-up. Site visitors are also able to sign up for our membership program to access competitive member pricing.
As of December 31, 2023, we have 11 BrandsMart U.S.A. stores across Florida and Georgia. Our BrandsMart stores average approximately 96,000 square feet, with a combination of showroom and warehouse space. While BrandsMart product deliveries are primarily outsourced through third-party logistics firms, each BrandsMart store has two to three trucks to assist with delivery, installation, and servicing of product.
We have various levels of leadership that oversee our BrandsMart business operations. At the individual store level, team member success is driven by a predominantly commission-based compensation structure. The store layout is designed such that each product category is segregated as a department, which allows for dedicated sales managers with specific product knowledge to oversee each department. Each store also typically has at least two managers to assist with and oversee operational and sales efforts. The store general manager is primarily responsible for managing and supervising all aspects of store operations, and the Chief of Staff is responsible for managing the seamless operations of all stores and the supporting store support center functions.
BrandsMart Leasing
Launched in 2022, BrandsMart Leasing is an in-house LTO purchase solution that is offered to customers of BrandsMart U.S.A. In addition to traditional credit offerings, BrandsMart U.S.A. customers have the option to apply for an LTO plan through BrandsMart Leasing, which provides the option to acquire ownership of merchandise through a renewable LTO plan, usually 12 to 18 months, typically by making weekly, semi-monthly, or monthly lease renewal payments. BrandsMart Leasing is supported by proprietary centralized lease decisioning technology, described further below.
Lease Agreement Approval and Decisioning
Our lease decisioning platforms are core to managing the risk of our LTO portfolio. We have developed proprietary lease approval processes with respect to our Aaron's and BrandsMart Leasing operations through a fully automated technology-driven algorithm-enabled centralized digital decisioning platform, which is designed to improve our customer experience by streamlining and standardizing the lease decisioning process and shortening transaction times. Customers receive lease approval decisions either online at aarons.com or at an Aaron's Company-operated and franchise retail location enabling them to shop with approval where they choose, or by applying in-store at a BrandsMart U.S.A. location. Our lease decisioning platforms have allowed us to optimize approval rates, lease payment amounts, full ownership conversions, write-offs, and revenue outcomes. We believe continuous innovation and frequent enhancements to our lease decisioning platforms are competitively advantageous.
At the core of the lease decisioning platforms are the Aaron's lease decisioning models. Our models development efforts utilize modern Artificial Intelligence and Machine Learning techniques. We utilize a multitude of traditional and alternative data sources in the model training process in an effort to maximize the predictive power of the decisioning models, while working with appropriate internal and external resources to assure compliant and consistent results. The combination of modern data science techniques and a wide breadth of data produces models that are capable of analyzing lease applications immediately to produce decisions in real time for each lease application.
The second pillar of our lease decisioning platforms is a robust set of post-model processes that determine the appropriate lease amounts depending on the risk associated with the lease application. Higher scored applications are eligible for larger lease payments and thus a broader range of merchandise categories.
Lastly, our lease decisioning platforms include fraud prevention processes. Our fraud prevention processes focus on identity and the digital file associated with lease applications. To reduce our synthetic fraud risk exposure, we evaluate risks associated with emails, phones, and devices used in an application. Depending on the fraud risk level of each lease application, we may employ automated knowledge-based authentication. We believe this authentication reduces our fraud risk while still offering a streamlined lease application experience for the consumer.
9
We continue to enhance our decisioning capabilities by adopting an iterative "test and learn" approach and expect that we will continue to drive positive outcomes through incremental enhancements. In addition to utilizing this decisioning platform, Aaron's stores may occasionally complete the lease approval process by verifying the applicant’s employment, or other reliable sources of income, and using personal references, which was the approval method used by our stores prior to the implementation of our data-enabled digital decisioning platform and is used in our Canadian operated stores.
Merchandising
The Aaron's Business and BrandsMart operations employ a merchandising strategy that spans three primary key product categories: furniture, home appliances and electronics. We have long-term relationships with many well-known and aspirational brands, including Samsung®, LG®, Whirlpool®, Apple®, GE®, HP®, JBL®, and Ashley®. We purchase merchandise directly from manufacturers and local distributors at competitive prices. One of our largest suppliers is our own Woodhaven Furniture Industries manufacturing division, which supplies a significant portion of the upholstered furniture leased and sold in the Aaron's branded Company-operated and franchised stores, which we have introduced in BrandsMart U.S.A. stores. In recent years, we have strategically focused on growing the revenue contribution of certain merchandise categories to align with macro-economic expansion in these categories and attract new customers. In addition, we continue to increase our product offerings through expanded assortment on aarons.com and brandsmartusa.com, our e-commerce shopping platforms.
The following table shows the percentage of our Aaron's Business segment revenues attributable to different merchandise categories:
| Year Ended December 31, | |||||||||||||||||
| Aaron's Business Merchandise Category | 2023 | 2022 | 2021 | ||||||||||||||
| Furniture | 41 | % | 41 | % | 43 | % | |||||||||||
| Appliances | 32 | % | 31 | % | 31 | % | |||||||||||
| Consumer Electronics | 24 | % | 25 | % | 23 | % | |||||||||||
| Other | 3 | % | 3 | % | 3 | % | |||||||||||
The following table shows the percentage of our BrandsMart segment revenues attributable to different merchandise categories:
| Year Ended December 31, | |||||||||||
| BrandsMart Merchandise Category | 2023 | 2022 | |||||||||
| Appliances | 53 | % | 55 | % | |||||||
| Consumer Electronics | 36 | % | 35 | % | |||||||
| Other | 11 | % | 10 | % | |||||||
Marketing and Advertising
Our marketing efforts target previous, existing, and potential new customers through a variety of traditional and digital media channels including online search, TV, radio, digital video, and direct mail, with a combination of brand and promotional messaging in both English and Spanish. We continue to test new ways to engage potential customers and identify audience segments that find our retail and LTO options appealing. Given BrandsMart's storefront presence and strong brand awareness and recognition within the Florida and Georgia markets, regional marketing strategies are effective in appealing to BrandsMart's audience segments.
With our fast-growing Aaron's and BrandsMart e-commerce businesses, we focus heavily on digital marketing including search, display, and social media to help drive traffic to both stores and our e-commerce websites. Our e-commerce marketing is dynamically managed on a daily basis and is growing as a share of spend relative to traditional marketing channels.
We continue to refine and expand our overall contact strategy to grow our consolidated customer base. We test various types of advertising and marketing campaigns and strategies, analyze the results of those tests and, based on our learnings, refine those campaigns and strategies to attempt to maximize their effectiveness with current and potential customers. By understanding optimal offers and products to promote to current and former customers, along with potential prospects, we look to continue improvements in marketing return on investment. With respect to existing customers, direct mail and email serve as the primary tools we utilize in our marketing strategies. With respect to marketing to potential customers, our primary tools currently include digital, direct mail, traditional broadcast and search advertising.
10
Franchising
As of December 31, 2023, we had 55 franchisees, who operate a total of 224 Aaron's franchised store locations. We have existing agreements with our current franchisees to govern the operations of franchised stores. Our standard agreement is for a term of 10 years, with one ten-year renewal option, and requires our franchisees to operate in compliance with our policies and procedures. In collaboration with our franchisees, we are able to refine, further develop and test operating standards, marketing concepts and product and pricing strategies that we believe will ultimately benefit our Company-operated stores. Franchisees are obligated to remit to us royalty payments of 6% of the weekly cash revenue collections from their stores.
From time to time, we may enter into franchise agreements with new franchisees or purchase store locations from our franchisees. We have purchased 306 store locations from our franchisees since January 1, 2017. We have not entered into a franchise agreement with a new franchisee in more than five years. We will continue to assess opportunities to both acquire existing franchise locations and franchise new markets that we wish to develop.
Some qualifying franchisees took part in a financing arrangement we established with several financial institutions to assist our existing franchisees in establishing and operating their store(s). Under that arrangement, which was originally established in 1994, we provide guarantees to the financial institutions that provide the loan facilities for amounts outstanding under this franchise financing program. On December 31, 2023, the maximum amount that the Company would be obligated to repay in the event franchisees defaulted was $4.9 million, all of which would be due within the next two years. However, due to franchisee borrowing limits, we believe any losses associated with defaults would be substantially mitigated through recovery of lease merchandise and other assets. Since the inception of the franchise loan program in 1994, the Company's losses associated with the program have been immaterial. The Company believes that any future amounts to be funded by the Company in connection with these guarantees will be immaterial.
Manufacturing
Woodhaven Furniture Industries, our domestic manufacturing division, was established in 1982. Woodhaven consists of six furniture facilities totaling approximately 738,000 square feet of manufacturing space. Our in-house manufacturing capabilities help to ensure that during periods of supply chain volatility, we are better positioned to provide our stores with suitable inventory to meet customer demand. The majority of the items Woodhaven produces continue to be leased or sold through our Aaron's and BrandsMart stores, including franchised stores. However, we also manufacture and sell furniture products through other channels.
Woodhaven is a vertically integrated operation. Vertical integration enables us to better manage product availability, quality and cost with processes that include (a) digital design, construction and rendering, as well as physical prototyping, (b) cut and sew operations to process fabric and rolled goods into covers, (c) frame mills to process 100% of our frame components with hardwood and engineered panels, (d) foam fabrication operations to control foam and fiber quality, (e) product testing to assure product standards are met, and (f) multiple locations and material sources that support our business continuity planning.
Woodhaven produces upholstered living-room furniture (including sofas, chairs, sleepers and sectional sofa and ottoman collections in a variety of natural and synthetic fabrics). The furniture produced by our integrated manufacturing operations incorporates features that we believe result in enhanced durability and improved LTO operational support, as compared to furniture we would otherwise purchase from third parties. These features include (a) standardized components, (b) reduced number of parts and features susceptible to wear or damage, (c) more resilient foam, (d) durable fabrics and sturdy frames that translate to longer life and higher residual value, and (e) exclusive products and features that provide market differentiation. The division also provides replacement covers for all styles and fabrics of its upholstered furniture, as well as other parts, for use in reconditioning leased furniture that has been returned, so that our stores can continue to offer that furniture to our customers at a relatively low price point.
Woodhaven is also able to generate ancillary income and right-size production by selling furniture to third parties, including national and regional retailers, e-commerce distributors, and student housing developers. During each of the years ended December 31, 2023, 2022 and 2021, 23%, 21%, and 18%, respectively, of total non-retail sales, which we define as sales of new merchandise to third-party channels, were generated by Woodhaven through these channels.
Lease Renewal
We continue to emphasize renewals-related compliance training, monitoring, and improvement initiatives, to ensure compliance with federal and state laws and regulations and our internal policies. One of the factors in the success of our operations is timely management of lease renewal payments, which are monitored by general managers and team members and our centralized Customer Retention team members. Customers who fail to make lease renewal payments are contacted within a few days after their renewal date to discuss arrangement for future payments in order to keep their agreements active. When we have been unable to reach the customer by telephone, we may visit those customers at their residences to encourage them to keep their agreement active or potentially return the lease merchandise. Careful attention to managing lease renewal payments is particularly important in LTO operations, where the customer has the option to cancel the agreement at the conclusion of each periodic payment term by returning the product covered by the agreement, and each contractually due payment is considered a
11
renewal of the agreement. Approximately 90% of the payments that we collect are via payment card options such as debit and credit cards for our Aaron's Business and BrandsMart Leasing customers, respectively, which allows our store team members to be more productive and increase operational efficiencies. At the Aaron's Business, we continue to encourage customers to take advantage of the convenience of enrolling in our automatic payment program, and approximately 56% of our customer lease agreements are enrolled for automatic payments as of December 31, 2023.
The provision for lease merchandise write-offs as a percentage of consolidated lease revenues was 5.8%, 6.4% and 4.2% in 2023, 2022 and 2021, respectively.
Customer Success
We believe our strong focus on customer satisfaction generates repeat business and long-lasting relationships with our customers and a high likelihood that our customers will recommend the Aaron's and BrandsMart brands to friends and family. Our strong culture of customer service begins with our team members and requires that we develop skilled, empathetic team members who value our customers and who possess and project a genuine desire to understand and serve our customers’ needs. To meet this requirement, we maintain and continuously enhance a comprehensive team member development program for both new and tenured team members. This development program and our commitment to diversity and inclusion is designed to enable our team members to provide a friendly and welcoming environment for our customers as well as a compliant, consistent, and helpful customer service experience. Further details can be found within the "Human Capital Management" section below.
At the Aaron's Business our customers receive multiple complimentary service benefits. These benefits vary according to applicable state law but generally include early purchase options, free delivery and set-up, free relocation of product to a new address within a specified geographic area, reinstatement options, product repair or replacement, access to digital tools to manage their account, and other discounts and benefits. Unlike traditional transactional retail sales, we have the unique opportunity over the span of the LTO agreement to build a closer relationship with our customers, often celebrating, assisting, and supporting them through significant moments in their lives. During the year ended December 31, 2023, approximately 65% of the new lease agreements we entered into were with repeat customers. Customers who begin agreements online also have the support and service of a local store throughout the duration of the agreement.
Our Aaron's branded store-based operations also offer customers the option to obtain a membership in the Aaron’s Club Program (the "Club Program"). The benefits to customers of the Club Program are separated into three general categories: (a) lease protection benefits; (b) health & wellness discounts; and (c) dining, shopping, and consumer savings. Club Program enrollment is optional and may be canceled by the member at any time. The lease protection benefits may provide Club Program members with lease payment waivers for up to four months or a maximum of $1,000 on active customer lease agreements if the customer becomes unemployed or ill; replacement of the product if the product is stolen or damaged by an act of God; waiver of remaining lease payments on lease agreements where any member named on the lease agreement dies; and/or product repair or replacement for an extended period after the customer takes ownership. Club Program benefits vary by state.
At BrandsMart, our customers receive a number of complimentary service benefits, including a 30-day price guarantee on most items and the ability to return or exchange eligible products within the specified return period. Customers also have access to sign-up for exclusive member benefits, which include alert notifications on sales and promotions and special financing offers. BrandsMart also offers our customers other benefits for additional costs, including delivery, installation and a product protection plan that can be purchased at the point of sale that provides extended warranty coverage on eligible product purchases. If a product under warranty needs repair, BrandsMart's service team will repair the product or work directly with the manufacturer to replace it. BrandsMart also offers repair and servicing of products that are not covered under warranty for a low cost.
E-commerce and Store-based Operation's Distribution Channels
At the Aaron's Business, e-commerce and store businesses utilize our 13 fulfillment centers to control merchandise and offer our customers a wide product assortment. These centers average approximately 150,000 square feet, giving us approximately 1,950,000 square feet of logistics capacity outside of our network of Aaron's stores. Our BrandsMart e-commerce and store operations utilize three distribution centers for its Florida and Georgia store operations, which provide BrandsMart with approximately 1,000,000 square feet of logistics capacity outside of the BrandsMart U.S.A. stores.
We believe that our network of fulfillment centers provides a strategic advantage over our competitors. Our distribution system allows us to deliver merchandise promptly to our stores to quickly meet customer demand and effectively manage inventory levels. Most of our contiguous U.S. stores are within a 250-mile radius of a fulfillment center, facilitating timely shipment of products to the stores and fast delivery of orders to customers.
We realize freight savings and inventory productivity through centralized distribution of merchandise by using fulfillment centers. We use various contract carriers to make deliveries weekly to our stores nationwide. A fleet of approximately 2,000
12
store-based delivery trucks provide industry leading heavy goods last mile delivery and reverse logistics for returned products and the servicing of products.
Human Capital Management
We believe in being an inclusive workplace for all of our team members and are committed to having a diverse workforce that is representative of the customers that choose to shop with us in-store or online and the communities in which we operate our businesses. We believe that a variety of perspectives enriches our culture, leads to innovative solutions for our business, enables us to better meet the needs of a diverse customer base, and reflects the communities we serve. Team members are encouraged and supported to create value and drive professional and personal growth, and we are committed to respecting each other in all interactions.
On December 31, 2023, we employed 9,071 full-time and part-time team members, the majority of which were full-time team members. Approximately 6,441 of our team members were Aaron's store, fulfillment center, service center or divisional/regional staff; 1,385 of our team members were BrandsMart store and warehouse staff; 329 of our team members were Woodhaven staff; and 916 of our team members were store support center staff supporting Aaron’s, BrandsMart, and Woodhaven. None of our team members are covered by a collective bargaining agreement, and we believe that our relations with team members are good, driven by our commitment to listen, learn, and continually improve.
Diversity and Inclusivity
Our aim is to develop inclusive leaders and an inclusive culture, while also recruiting, developing, mentoring, training, and retaining a diverse workforce, including a diverse group of management-level team members. The information in the tables below summarizes our gender, ethnicity and race diversity, and age metrics as of December 31, 2023 for our total workforce and management (which we define as management level employees and above).
| Year Ended December 31, 2023 | |||||||||||||||||
| Male | Female | Undisclosed | |||||||||||||||
| Total Workforce | 66.9 | % | 31.8 | % | 1.3 | % | |||||||||||
| Management | 69.4 | % | 30.2 | % | 0.4 | % | |||||||||||
| Year Ended December 31, 2023 | ||||||||||||||||||||||||||||||||
| Hispanic or Latino | White | Black or African American | Native Hawaiian or Pacific Islander | Asian | American Indian or Alaskan Native | Two or More Races | Undisclosed | |||||||||||||||||||||||||
| Total Workforce | 20.2 | % | 35.2 | % | 27.6 | % | 0.3 | % | 1.0 | % | 0.9 | % | 2.1 | % | 12.7 | % | ||||||||||||||||
| Management | 16.1 | % | 47.5 | % | 18.8 | % | 0.3 | % | 1.1 | % | 0.6 | % | 1.7 | % | 13.9 | % | ||||||||||||||||
| Year Ended December 31, 2023 | ||||||||||||||
Baby Boomer1 | Gen-X2 | Millennial3 | Post Millennial/Gen-Z4 | |||||||||||
| Total Workforce | 7.9 | % | 28.6 | % | 45.2 | % | 18.3 | % | ||||||
| Management | 8.3 | % | 48.9 | % | 40.6 | % | 2.2 | % | ||||||
1 Born between 1946 – 1964 (i.e., Baby Boomer)
2 Born between 1965 – 1980 (i.e., Gen X)
3 Born between 1981 – 1996 (i.e., Millennial)
4 Born in 1997 or later (i.e., Post Millennial/Gen Z)
As noted in our Code of Conduct, we maintain an inclusive work environment where differences are valued and respected. We make employment decisions based on merit, and we prohibit any form of discrimination or conduct based on race, color, sex, sexual orientation, gender identity, gender expression, national origin, age, religion, disability, pregnancy, veteran status, military duty, genetic information, or any other factor protected by applicable law.
Fostering a diverse and inclusive environment and creating a true sense of belonging are among our top priorities. Our vision starts with our belief that we are stronger together. We believe our best future is one we build together. We embrace diverse backgrounds, experiences, and perspectives. We are passionate about creating a community where everyone is valued and has opportunities to thrive. To support these efforts, we are dedicated to building diversity, inclusion, and belonging into all aspects of our operations and company culture.
Our diversity and inclusion initiatives for Aaron's include the following, and we look forward to extending many of these
13
initiatives to our BrandsMart segment in the near future:
•Delivering on our Diversity and Inclusion vision, designed with the support and guidance of a strategic consulting firm, through our Diversity and Inclusion strategic priorities that include:
•Developing, retaining, and attracting team members from diverse backgrounds;
•Fostering a supportive environment that builds trust and makes team members feel comfortable;
•Actively listening to the voice of team members to champion the best ideas; and
•Enhancing communication channels to facilitate collaboration and promote transparency;
•Responding to Aaron's Business team member sentiments regarding Diversity and Inclusion gathered through an all-employee voluntary and anonymous survey, available to more than 9,000 Aaron's Business team members, one-on-one interviews and focus groups, and leadership culture sessions to inform future Diversity and Inclusion planning and programming, which resulted in actions that included, but were not limited to, adding two new Employee Business Resource Groups ("EBRGs") in the fourth quarter of 2022 with the creation of Aaron’s Veterans and Allies and Aaron’s Disability Education Collective;
•Sponsoring and participating in several local and national events that provide best practices and latest thinking around inclusion;
•Providing opportunities for team members to serve on boards and participate in roundtables focused on diversity;
•Including Diversity and Inclusion training in required quarterly compliance training for all team members;
•Providing access to unconscious bias training for all people leaders across the Aaron's Business through an e-learning platform;
•Providing executive sponsorship and other support to each of the Aaron's Business EBRGs, each of which allow a safe space for traditionally underrepresented team members and their allies to connect and discuss experiences, provide educational and motivational events, enable mentorship opportunities for team members, provide professional development opportunities, and support the Company’s objectives related to developing team members and creating diversity awareness. Our active EBRGs include:
•Aaron's Women's Leadership Network (AWLN), whose mission is to connect team members who want to attract, develop, and advance talented women leaders at Aaron’s;
•Aaron's Black Leadership Exchange (ABLE), whose mission is to exchange information and ideas that foster personal and professional development of Black team members while strengthening our connection with our customers and community;
•Aaron's Pride Alliance (PRIDE), whose mission is to increase awareness, inclusion and well-being of lesbian, gay, bisexual, transgender, and questioning team members at Aaron’s, and to provide resources for community members and allies;
•Inspiring Growth and Unity at Aaron's for Latinos/Hispanics (IGUAL), whose mission is to create a foundation that empowers Latinos at Aaron’s by advocating for the betterment of the Latino community, both internally and externally, with various areas of focus such as business transformation, engagement, growth and leadership development within the organization;
•Aaron's Veterans and Allies (AVA), whose mission is to connect veterans and allies within Aaron’s for the purpose of providing support and education, engaging the communities we serve, and fostering personal and professional development through mentorships and access to resources; and
•Aaron's Disability Education Collective (ADEC), whose mission is to connect disabled team members and their allies within Aaron’s to provide support, education, and tools for interactions with the disabled community, engage with the communities we serve to support and advocate for the disabled community, and support disabled team members with both personal and professional growth opportunities;
•Sponsoring or attending various community-focused events benefiting underserved communities and representing causes identified by team members;
•Engaging the Aaron's Business Diversity and Inclusion Council, which includes leaders from multiple functional areas and executive leadership, to provide management with support and oversight to our EBRGs;
•Celebrating cultural events for our Aaron's Business team members led by our EBRGs, including, but not limited to, Black History Month, Women's History Month, National Hispanic Heritage Month, LGBTQIA+ Pride Month, Día de los Muertos, Juneteenth, International Day for Tolerance, International Women's Day, Martin Luther King, Jr. Day,
14
Veteran's Day, National Disability Independence Day, BIPOC Mental Health Awareness Month, and National Crown Day;
•Utilizing diversity job boards to advertise job opportunities within the Aaron's Business;
•Participating in the Metro Atlanta Chamber's ATL Action for Racial Equity; and
•Conducting a talent review process designed to utilize a multi-factor approach to understand the talents of our Aaron's Business field leadership team members and their potential to become future Company leaders.
Development and Career Opportunities
We believe in providing an environment where team members have clear growth and development opportunities. To help facilitate that growth, we provide tools, resources and programs that adapt and grow with our team members. Our efforts include:
•Providing all Aaron’s Business store support center team members and all Aaron's Business management access to a library of more than 20,000 third-party courses enabling the development of new skills that contribute to career growth and development. Team members consumed more than 4,100 hours of learning via this third-party platform in 2023. In addition, this learning content is scanned and reviewed internally, leading to targeted library content that focuses on curriculum determined to be of greatest relevance and importance to the organization;
•Delivering an in-house designed continuous learning program to avail Aaron's store team members a career path with the destination of their choosing while using custom learning solutions designed to build and reinforce competencies and proficiencies throughout all levels of their career. The learning takes a blended approach involving formal courses, self-directed learning, and structured on-the-job training. In addition, the curriculum features internal experts educating and coaching others;
•Coordinating and deploying training to our management-level team members in 2023, including compliance, ethics and leadership training;
•Providing team members with ongoing training on critical issues such as safety and security, compliance, ethics and integrity, and information security; and
•Gathering engagement feedback from our team members on a regular basis and responding to that feedback in a variety of ways including personal, one-on-one interactions, team meetings, leadership communications, and town hall meetings with team members, led by senior executives.
Health and Well-being Offerings
We aim to enhance the well-being of our team members by providing comprehensive benefits that go beyond traditional offerings. We are committed to taking care of the whole employee, recognizing their diverse needs and aspirations. Through a range of thoughtful benefits, we empower our team members to prioritize not only their individual health but also the well-being of their families. Our goal is to foster a workplace culture that supports healthy and prosperous ways of living, promoting balance between personal and professional life. Our efforts include:
•Offering health, dental, and vision benefits for all eligible team members, including our eligible hourly store-based, fulfillment center, manufacturing, and call-center team members;
•Matching team members’ 401(k) plan contributions of up to 5% of eligible pay after one year of service;
•Providing paid time off (including volunteer activities in the community for eligible team members);
•Providing employee discounts for merchandise purchased;
•Providing confidential counseling for Aaron's Business team members through our Employee Assistance Program ("EAP");
•Providing a comprehensive suite of well-being offerings, including unlimited health coaching sessions, unlimited financial coaching sessions with a certified financial planner, and emotional support through our EAP counseling sessions and unlimited behavioral health coaching sessions via text, at no cost to our Aaron's Business team members;
•Providing paid parental leave to eligible Aaron's Business team members – maternity, paternity and adoption;
•Offering a tuition reimbursement program that provides eligible Aaron’s Business team members up to $3,000 per year (increased from $1,500 in prior years) for courses related to current or future roles at the Company; and
•Offering an employee stock purchase program for eligible Aaron's Business team members with a lookback and discount.
15
We strive to help team members maintain job stability so they are encouraged to stay with the Company and positioned to grow their skills and knowledge on the job. To reduce team member turnover, we engage in surveys with team members, conduct stay interviews to help identify any issues before they cause a team member to leave the Company, and review exit interview data, hotline calls and root cause analysis to help deter turnover.
Compliance Management Program
As a company with a formal Compliance Management Program, we maintain a robust program with oversight of policy and procedures, training, third party oversight, issues management, and monitoring and testing. The Compliance Management Program fosters collaboration between line of business owners to create a culture of compliance by assisting the business owners with establishing and maintaining current policies and procedures that align with the Company’s goals, strategy, and business objectives, including adherence to applicable laws and regulations.
We are committed to compliance with all applicable federal, state, provincial and local laws and regulations and conduct ongoing monitoring for new laws, regulations, and regulatory activity that impact our industry, business, or operational risk. We have mechanisms in place for consumers to submit complaints or feedback.
Compliance training is completed for new hires during onboarding and supplemented with annual and periodic refresher training thereafter to reinforce core compliance principles. Our compliance training is customized to our risk profile, business strategy and operations. Training of the Board of Directors, management and other team members is essential. Our training is comprehensive and specifically tailored to the particular responsibilities of the team members receiving it.
Under our Compliance Management Program, we are making ongoing improvements to our compliance-related policies and procedures, training, third party oversight, issues management, and testing and monitoring programs. This program is overseen by the Audit Committee of the Board of Directors as well as our management-level Compliance Committee.
Health and Safety of Team Members and Customers
The Company takes the safety of our team members and our customers seriously. The Company's policies and training programs support our health and safety practices. Throughout the year, team members complete safety and compliance training relevant to their role. Completion of required safety and compliance training is closely managed to ensure that team members have the required skills and knowledge to perform safely and ethically. The following summarizes the Company's Health & Safety Programs:
•Health & safety teams providing program oversight and continued maturation efforts;
•Required annual and new hire formal safety training curriculum;
•Business unit driver qualification programs;
•Continued investment in equipment and technology to provide our team members with the safest experience;
•Reporting on safety Key Performance Indicators to field and senior management regularly;
•Oversight and governance by our Safety Committee made up of key executives and other members of management; and
•Environmental, Health & Safety Audit Program for our Aaron's Business fulfillment centers, service centers and manufacturing operations.
Our business has been, and may in the future be, impacted by a pandemic or other health crises. We continually evaluate our existing prevention controls and the need for different or additional controls, and conduct periodic inspections at our stores to identify unhealthy conditions, work practices, and work procedures to help ensure compliance with our policies and procedures.
Labor Practices and Human Rights
All of our team members earn more than the federal minimum wage. The average hourly wage of a full-time hourly operations employee in our Company-operated stores, fulfillment and service centers, and divisional support staff, as of December 31, 2023, is $16.28, with a meaningful portion of those team members earning an average hourly wage of $17.20 or more. The average total compensation and benefits for a full-time hourly operations employee in our Company-operated stores, fulfillment and service centers, and divisional support staff is approximately $35,000 including wages, bonuses and benefits, such as paid time off. Also, more than 97% of our Company-operated stores, fulfillment and service centers, and divisional support staff team members are eligible to earn an incentive payment which allows us to meaningfully reward our high performing team members.
In addition to team member surveys and the analysis of exit interview data to deter turnover and support our team members in their job stability and growth, we maintain a Team Member Hotline, available 24 hours a day, through which team members may report (including anonymous reporting, if desired by the team member) concerns via phone or via an online portal. All
16
reported matters are taken seriously and routed to the appropriate departments (i.e., Human Resources, Compliance, or Legal) for review, investigation, and closure after appropriate resolution. The 2023 annualized voluntary turnover rate in all corporate, stores, fulfillment centers and warehouse operations was 63%, and the 2023 annualized involuntary turnover rate in all corporate stores, fulfillment centers and warehouse operations was 33%.
The Company respects the rights of workers who offer services and create the products that we purchase from our suppliers. We communicate our expectations to provide us with safe, energy-efficient, high-quality products, and we hold our suppliers to a high standard because we strive to be an example of good human rights and labor practices throughout our business activities. We take care in the selection of our suppliers, and the Company also communicates its expectations on social conditions, worker safety and integrity in the workplace, and compliance with applicable laws through Aaron's Supplier Code of Conduct. The Supplier Code of Conduct outlines Aaron's expectations with respect to hiring practices, forced labor, child labor, discrimination, and other labor rights. Aaron's expects its suppliers to conduct their business with a high level of integrity, and maintain accurate records to demonstrate that compliance. Specifically, Aaron's requires its suppliers, in accordance with applicable laws, to meet the following standards per the Supplier Code of Conduct and conditions:
•Treat all workers with dignity and respect;
•Provide a safe, healthy, and clean work environment;
•Provide safe and healthy housing if supplier provides residential housing for its team members;
•Provide a discrimination, harassment, and punishment free environment;
•Pay workers at least the minimum wage and benefits required;
•Follow minimum working hour restrictions;
•Prohibit child labor, forced labor and human trafficking; and
•Comply with applicable laws (including any changes from time to time).
One of Aaron's largest suppliers is our own Woodhaven Furniture Industries manufacturing division, which supplies a significant portion of the upholstered furniture we lease or sell in Aaron's stores. All of Woodhaven's operations are based in the U.S., creating U.S. jobs, and all of the products manufactured are made in the U.S.
In December 2022, the Company adopted a Human Rights Policy that affirms our commitment to operating our business in a manner that recognizes the importance of human rights both locally and abroad. As such, the Company believes in upholding fundamental human rights and operating in compliance with human rights laws. The Company does not use or condone the use of slave labor or human trafficking. The Company also believes that team members should be treated fairly and with dignity by providing a work environment that is free from conduct that can be considered harassing, discriminatory, intimidating and/or disruptive, including sexual harassment. The Company does not tolerate harassment or discrimination and is committed to a workplace that fosters respect and dignity for all.
From time to time, we are party to legal proceedings arising in the ordinary course of business, including those alleging employment discrimination, violations of wage-and-hour laws, or violations of other laws affecting the employment relationship. During 2023, the total amount we paid to resolve proceedings alleging employment claims was immaterial to our earnings. In our efforts to have all team members comply with applicable employment-related laws, to drive positive workplace conduct, to strive to foster a fair and equitable workplace, and to reduce the number of employment discrimination claims brought against us, we provide a variety of resources, including diversity, non-discrimination and anti-harassment training as part of the Company’s mandatory compliance training, for all eligible Aaron's Business team members, including team members in our call centers, fulfillment and service centers, store support center, and stores. We also have a team member hotline accessible to our team members via phone or the internet so that any concerns can be investigated promptly and thoroughly.
Working Capital
Our LTO model results in us remaining the owner of merchandise on lease until the customer obtains ownership of the item; therefore, our most significant working capital asset is lease merchandise currently on lease. Our store-based and e-commerce LTO and retail operations also require us to maintain significant levels of retail and lease merchandise inventories available for lease and retail purchase to provide the service levels demanded by our customers and to ensure timely delivery of our products. Consistent and dependable sources of liquidity are required to maintain such merchandise levels. We believe our cash on hand, operating cash flows, and availability under our credit agreement is adequate to meet our normal liquidity requirements.
Raw Materials
The principal raw materials we use in furniture manufacturing at Woodhaven are fabric, foam, fiber, metal components, plywood, oriented strand board and hardwood. All of these materials are purchased in the open market from unaffiliated
17
sources. We have a diverse base of suppliers; therefore, we are not dependent on any single supplier. The sourcing of raw materials from our suppliers is not overly dependent on any particular country. While we have not had any material interruptions in our manufacturing operations due to current macroeconomic conditions impacting the pricing and availability of raw materials, there can be no assurances that disruptions to our supply of raw materials will not become more significant, or that the costs of those raw materials will not increase significantly going forward due to inflation or other factors related to current macroeconomic conditions.
Seasonality
Our revenue mix for the Aaron's Business is moderately seasonal. The first quarter of each year generally has higher lease renewal rates and corresponding lease revenues than any other quarter. Our customers will also more frequently exercise the early purchase option on their existing lease agreements or purchase merchandise during the first quarter of the year. We believe that each is primarily due to the receipt by our customers in the first quarter of federal and state income tax refunds. In addition, lease portfolio size typically increases gradually in the fourth quarter as a result of the holiday season. We expect these trends to continue in future periods.
Due to the seasonality of our business, results for any quarter or period are not necessarily indicative of the results that may be achieved for a full fiscal year.
Discussion regarding seasonality trends for BrandsMart will be included when prior year comparable periods are included in the financial results.
Competition
We operate in a highly competitive market with competition from national, regional and local operators of direct-to-consumer LTO stores and websites, virtual LTO and rent-to-rent companies, Buy Now, Pay Later companies, traditional and e-commerce retailers (including many that offer layaway programs, point of sale financing, and title or installment lending), traditional and online sellers of used merchandise, and various types of consumer finance companies that may enable our customers to shop at traditional or online retailers, as well as with rental stores that do not offer their customers a purchase option. We also compete with retail stores for customers desiring to purchase merchandise for cash or on credit. Competition is based primarily on product selection and availability, customer service, payment amounts, store location and terms, as well as total cost of merchandise ownership, the number and frequency of payments in lease ownership plans, and other factors.
The Lease-to-Own Business Model
The LTO model offers customers an attractive alternative to traditional methods of purchasing furniture, appliances, electronics, computers and a variety of other products and accessories. In a standard LTO transaction, the customer has the option to acquire ownership of merchandise through a renewable LTO plan, usually 12 to 24 months, typically by making weekly, semi-monthly, or monthly lease renewal payments. The customer also has the option to cancel the agreement at any time without penalty by returning the merchandise to the lessor and only making payments required for the accrued lease period. If the customer renews the lease for each periodic renewal period through the completion of the lease ownership plan, they then obtain ownership of the item. In addition, LTO transactions typically include early ownership options, free delivery and in-home set-up of the merchandise, free repairs for defective merchandise, and other benefits.
An LTO agreement provides flexibility, affordable payments, and no long-term commitment, and is available to all customers who are approved, including those who are credit challenged. Other consumers who find the LTO model appealing are those who have a temporary need for merchandise, those who want to try a product at home before committing to the full cost of ownership, and those who, despite access to credit, do not wish to incur additional debt. We believe the LTO value proposition results in high customer loyalty and repeat purchase behavior, which reduces customer acquisition costs and improves customer lifetime value.
18
LTO businesses benefit from relatively stable, renewable lease revenues and predictable cash flows provided by pools of lease agreements originated in prior periods. Our renewable lease revenue streams help insulate the business in times of macro-economic disruption and reduce reliance on current period sales and customer traffic for cash flows as compared to other retailing models. During the year ended December 31, 2023, approximately 65% of the Company's total revenue was generated from recurring revenue streams related to our contracted lease payments.
Our Market Opportunity
Our Aaron's Business core customer base is principally comprised of overlooked and underserved consumers in the U.S. and Canada with limited access to traditional credit sources. Historically, during economic downturns, our customer base expands due to tightened credit underwriting by banks and credit card issuers, as well as employment-related factors which may impact customers’ ability to otherwise purchase products from traditional retailers using cash or traditional financing sources. We have Aaron's stores strategically located in over 670 unique markets across the U.S. and Canada and are within five miles of 38.5% of U.S. households. Our stores are designed and merchandised to appeal to customers across different types of markets, including urban, suburban, and rural markets.
BrandsMart U.S.A. is the low-price leader and retailer of choice for consumers looking to purchase appliances, consumer electronics, and other household goods in the key markets we serve, primarily south Florida and Georgia. We believe our competitive position in both price and selection is a meaningful differentiator in attracting new and repeat customers from across the income and credit spectrum.
Government Regulation
Our LTO operations are extensively regulated by and subject to the requirements of various federal, state, provincial, and local laws and regulations, and are subject to oversight by various government agencies. In general, such laws regulate applications for leases, pricing, late charges and other fees, lease disclosures, advertising content, lease agreement provisions, penalties, price tags, lease renewal, reinstatement and collection procedures, and related areas.
Violations of certain provisions of these laws may result in material penalties. We are unable to predict the nature or effect on our operations or earnings of unknown future legislation, regulations and judicial decisions or future interpretations of existing and future legislation or regulations relating to our operations. Further, there can be no assurance that future laws, decisions or interpretations will not have a material adverse effect on our business, results of operations or financial condition.
At the present time, no federal law specifically regulates the LTO transaction. Federal legislation to regulate the transaction has been proposed from time to time. In addition, certain elements of the business including matters such as renewal activity, marketing disclosures to customers and customer contact may be subject to federal laws, regulation, and/or oversight by federal regulators.
There has been increased legislative and regulatory attention in the U.S., at both the federal and state levels, on LTO products specifically and on financial services products offered to near-prime and subprime consumers in general, which may result in an increase in legislative regulatory efforts directed at the LTO industry. We cannot predict whether any such legislation or regulations will be enacted and what the impact would be on us.
Additional regulations at both the state and federal level are under consideration, as the attention placed on financial services products and consumer debt transactions, including consumer debt collection practices, has grown significantly.
We believe we are in material compliance with all applicable laws and regulations. Although we are unable to predict the results of any regulatory initiatives, we do not believe that existing and currently proposed regulations will have a material adverse impact on our business, results of operations or financial condition.
Federal regulatory authorities are increasingly focused on the subprime financial and credit-restricted marketplace within which much of our LTO customer base obtains products and services. Any of these agencies may propose and adopt new regulations, or interpret existing regulations, in a manner that could result in significant adverse changes in the regulatory landscape for businesses such as ours. In addition, with increasing frequency, federal and state regulators are holding businesses like ours to higher standards of training, monitoring and compliance.
Federal regulatory agencies and state attorneys general have increasingly directed investigations or regulatory initiatives toward the LTO industry, or toward certain companies within the industry, as demonstrated by recent federal and state regulatory enforcement actions against LTO industry participants.
In addition to federal regulatory oversight, currently, nearly every state and most provinces in Canada specifically regulate LTO transactions via state or provincial statutes, including states and provinces in which we currently operate our stores. Most LTO laws require LTO companies to disclose to their customers the total number of payments, the amount and timing of each payment, the total amount of all payments to acquire ownership of any item, any other charges that may be imposed and miscellaneous other items. The more restrictive state LTO laws may limit the retail price for an item, the total amount that a customer may be charged for an item, or regulate the "cost-of-rental" amount that LTO companies may charge on LTO
19
transactions, generally defining "cost-of-rental" as the amount paid for lease ownership in excess of the "retail" price of the goods. Our long-established policy in all states is to disclose the terms of our LTO transactions as a matter of good business ethics and customer service. We believe we are in material compliance with the various state LTO laws.
Available Information
We make available free of charge on our website, www.aarons.com, our Annual Report on Form 10-K, Quarterly Reports on Form 10-Q, Current Reports on Form 8-K and amendments to those reports and the Proxy Statement for our Annual Meeting of Shareholders.
The SEC maintains a website that contains reports, proxy and information statements, and other information regarding issuers that file electronically with the SEC at http://www.sec.gov.
ITEM 1A. RISK FACTORS
The Company’s business is subject to certain risks and uncertainties. Any of the following risk factors to one or more of our business segments could cause our actual results to differ materially from historical or anticipated results. These risks and uncertainties are not the only ones we face, but represent the risks that we believe are material. There may be additional risks that we currently consider not to be material or of which we are not currently aware, and any of these risks could cause our actual results to differ materially from historical or anticipated results.
Summary of Risk Factors
Risks Related to Our Business
•In addition to being subject to various existing federal, state and provincial laws and regulations, we may be subject to new or additional laws and regulations that could expose us to government investigations, pricing restrictions, fines, penalties or other government-required payments, significant additional costs or compliance-related burdens that could have a material adverse effect on our business, results of operations or financial condition.
•From time to time we are subject to regulatory and legal proceedings which seek material damages or seek to place significant restrictions on our business operations. These proceedings may be negatively perceived by the public and materially and adversely affect our business, liquidity and financial condition.
•Judicial or regulatory decisions may restrict or eliminate the enforceability of certain types of contractual provisions designed to limit costly litigation, such as mandatory arbitration clauses and class action waivers as dispute resolution methods, which could have a material adverse effect on our business.
•Product safety and quality control issues, including product recalls, could harm our reputation, divert resources, reduce sales and increase costs.
•The current inflationary environment has adversely impacted, and could continue to adversely impact, our business through increased costs and the acceleration of prices beyond the norm resulting in lower lease volumes.
•Our inability to recruit, select, train and retain qualified team members or violations by us of employment or wage and hour laws or regulations could have a material adverse effect on our business, results of operations or financial condition.
•The loss of the services of our key executives, or our inability to attract, develop and retain key talent could have a material adverse effect on our business and operations.
•If we do not maintain the privacy and security of customer, employee or other confidential information, due to cybersecurity-related risks or otherwise, we could incur significant costs, litigation, regulatory enforcement actions and damage to our reputation.
•If our IT systems are impaired as of a ransomware incident or other cyber incident, our business could be interrupted, our reputation could be harmed and we may experience lost revenues and increased costs and expenses.
•We may incorporate artificial intelligence ("AI") solutions into our platforms, decisioning technology, products, productivity tools, services, and features, and these applications may become more important in our operations over time. Our competitors or other third parties may incorporate AI into their products more quickly or more successfully than us, which could impair our ability to compete effectively and adversely affect our results of operations. Additionally, if our AI applications are based on data, algorithms, or other inputs that are flawed, or if they assist in producing content, analyses, or recommendations that AI applications assist in producing are or are alleged to be deficient, inaccurate, or biased, our business, financial condition, and results of operations may be adversely affected. The use of AI applications has resulted in, and may in the future result in, cybersecurity incidents that implicate the personal data of end users of such applications. Any such cybersecurity incidents related to our use of AI applications
20
could adversely affect our reputation and results of operations. AI also presents emerging ethical issues, and if our use of AI becomes controversial, we may experience brand or reputational harm, competitive harm, or legal liability. The rapid evolution of AI, including the potential regulation of AI by government or other regulatory agencies, will require significant resources to develop, test, and maintain our platforms decisioning technology, products, productivity tools, services, and features in order to implement AI ethically and minimize any unintended or harmful impacts.
Risks Related to the BrandsMart U.S.A. Acquisition
•The BrandsMart U.S.A. acquisition may create risks and uncertainties which could materially and adversely affect our business and results of operations.
•We may be unable to realize the anticipated synergies from the BrandsMart U.S.A. acquisition or may incur additional and/or unexpected costs in order to realize them.
Risks Related to Operations and Strategy
•The commoditization of certain product categories, increasing competition, a decentralized, high-fixed-cost operating model, adverse consequences to our supply chain function from decreased procurement volumes, and lower lease volumes could have a material adverse effect on our results of operations.
•We are implementing a multi-year strategic plan within our business designed to strengthen and grow our business and generate capital for investment by growing revenue, further reducing costs and strengthening operating margins, and there is no guarantee that such plan will be successful.
•Our growth strategies may be unsuccessful if we are unable to identify and complete future acquisitions and successfully integrate acquired businesses or assets.
•We could lose our access to third-party data sources, including, for example, those sources that provide us with data that we use as inputs into our centralized decisioning tools, which could cause us competitive harm.
•We must successfully order and manage our inventory to reflect customer demand and anticipate changing consumer preferences and buying trends or our revenue and profitability will be adversely affected.
•Our competitors could impede our ability to attract new customers, or cause current customers to cease doing business with us.
•Our proprietary algorithms and customer lease decisioning tools used to approve customers depend, in part, on customer behavior, and unexpected changes in such behavior could cause such algorithms and decisioning tools to no longer be indicative of our customers' ability to perform under their lease agreements with us.
•Our business and operations are subject to risks related to climate change.
Risk Related to the LTO Industry
•The transactions offered to consumers by our businesses may be negatively characterized by consumer advocacy groups, the media and government officials, and if those negative characterizations become increasingly accepted by consumers, demand for our services and the transactions we offer could decrease.
Risks Related to our Franchisees
•We may engage in, or be subject to, litigation with our franchisees.
•Operational compliance and other failures by our franchisees may adversely impact us.
•Our ability to enforce our rights against our franchisees may be adversely affected by applicable laws, which could impair our growth strategy and cause our franchise revenues to decline.
•Changes to current law with respect to the assignment of liabilities in the franchise business model could materially and adversely affect our profitability.
Risks Related to Ownership of Our Common Stock
•We cannot guarantee the timing, amount or payment of dividends on our common stock.
•As a public company, we are required to maintain effective internal control over financial reporting in accordance with Section 404 of the Sarbanes-Oxley Act and our failure to do so could materially and adversely affect us.
•Our amended and restated bylaws designate the Georgia State-wide Business Court in the State of Georgia as the exclusive forum for certain litigation, which may limit our shareholders’ ability to choose a judicial forum for disputes with us.
21
•Certain provisions in our articles of incorporation and bylaws, and of Georgia law, may deter or delay an acquisition of us.
General Risks
•The success of our business is dependent on factors impacting consumer spending that are not under our control, including general economic conditions, and unfavorable economic conditions in the markets where we operate could result in increases in lease merchandise write-offs, among other things, which could materially and adversely affect our financial performance.
•The geographic concentration of our store locations may have an adverse impact on our financial performance due to economic downturns and severe weather events in regions where we have a high concentration of stores.
•Our current insurance program may expose us to unexpected costs, including casualty and accident-related self-insured losses, and negatively affect our financial performance.
Risks Related to Our Business
Legal and Regulatory Risks
Federal and state regulatory authorities are increasingly focused on consumer-facing industries, including LTO and retail, and in addition to being subject to various existing federal, state and provincial laws and regulations, we may be subject to new or additional federal, state and provincial laws and regulations (or changes in interpretations of existing laws and regulations) that could expose us to government investigations, pricing restrictions, fines, penalties or other government-required payments by us, significant additional costs or compliance-related burdens that could have a material adverse effect on our business, results of operations or financial condition.
Federal regulatory authorities such as the Federal Trade Commission (the "FTC") and the Consumer Financial Protection Bureau are increasingly focused on the subprime financial marketplace in which the LTO industry operates, and these federal agencies, as well as state regulatory authorities, may propose and adopt new regulations, or interpret existing regulations in a manner, that could result in significant adverse changes in the regulatory landscape for businesses such as our Aaron's and BrandsMart Leasing businesses that include LTO. In addition, we believe federal and state regulators are increasingly holding LTO businesses to higher standards of monitoring, disclosure and reporting, regardless of whether new laws or regulations governing the LTO industry have been adopted. We expect this increased focus by federal and state regulatory authorities to continue to intensify. Regulators and courts may apply laws or regulations to our businesses in inconsistent or unpredictable ways that may make compliance more difficult, expensive and uncertain. This increased attention at the federal and state levels, as well as the potential for scrutiny by certain municipal governments, could increase our compliance costs significantly and materially and adversely impact the manner in which we operate. For more information, see "Business—Government Regulation."
Nearly every state, the District of Columbia, and most provinces in Canada specifically regulate LTO transactions. Furthermore, certain aspects of our business segments, such as the content of our advertising and other disclosures to customers about our LTO transactions, our lease renewal and collection practices (as well as those of third parties), the manner in which we contact our customers, our customer lease decisioning process regarding whether to lease merchandise to customers, and any payment information we may decide to furnish to consumer reporting agencies are subject to federal and state laws and regulatory oversight.
In addition, the manner in which we process and store certain customer, employee and other information are subject to federal and state laws and regulatory oversight. For example, the California Consumer Privacy Act of 2018 (the "CCPA"), has changed the manner in which our LTO and retail transactions with California residents are regulated with respect to the manner in which we collect, store and use consumer data, and has resulted in increased regulatory oversight and litigation risks and increased our compliance-related costs in California. In addition, the California Privacy Rights Act ("CPRA"), significantly modified the CCPA, by expanding consumers’ rights with respect to certain personal information and creating a new state agency to oversee implementation and enforcement efforts. Many of the CPRA’s provisions became effective on January 1, 2023. Moreover, other states have adopted or may adopt privacy-related laws whose restrictions and requirements differ from those of the CCPA and CPRA, requiring us to design, implement and maintain different types of state-based, privacy-related compliance controls and programs simultaneously in multiple states, thereby further increasing the complexity and cost of compliance.
Many of these laws and regulations are evolving, creating unclear and inconsistent requirements across various jurisdictions, and complying with them is difficult, expensive and uncertain. Furthermore, legislative or regulatory proposals regarding our industry, or interpretations of them, may subject us to "headline risks" that could negatively impact our business in a particular market or in general and, therefore, may adversely affect our share price. New laws and regulations (or differing interpretations of existing regulations), if adopted, could also adversely impact or current operations and the regulatory landscape for businesses such as ours.
22
We have incurred and will continue to incur substantial costs to comply with federal, state and provincial laws and regulations. In addition to compliance costs, we may incur substantial expenses to respond to federal, state and provincial government investigations and enforcement actions, proposed fines and penalties, criminal or civil sanctions, and private litigation, including those arising out of our or our franchisees’ alleged violations of existing laws and/or regulations.
Additionally, as we execute on our strategic plans, we may continue to expand into complementary businesses that engage in retail, financial or lending services, or LTO or rent-to-rent transactions involving products that we do not currently offer our customers, all of which may be subject to a variety of statutes and regulatory requirements in addition to those regulations currently applicable to our legacy operations, which may impose significant costs, limitations or prohibitions on the manner in which we currently conduct our businesses as well as those we may acquire in the future.
From time to time we are subject to regulatory and legal proceedings which seek material damages or seek to place significant restrictions on our business operations. These proceedings may be negatively perceived by the public and materially and adversely affect our business, liquidity and financial condition.
We are subject to legal and regulatory proceedings from time to time which may result in material damages or place significant restrictions on our business operations, and/or divert our management’s attention from other business issues and opportunities and from our ongoing strategic plan to improve our performance. There can be no assurance that we will not incur material damages or penalties in a lawsuit or other proceeding in the future and/or significant defense costs related to such lawsuits or regulatory proceedings. Significant adverse judgments, penalties, settlement amounts, amounts needed to post a bond pending an appeal or defense costs could materially and adversely affect our liquidity and financial condition. It is also possible that, as a result of a present or future governmental or other proceeding or settlement, significant restrictions will be placed upon, or significant changes made to, our business practices, operations or methods, including pricing or similar terms. Any such restrictions or changes may adversely affect our profitability or increase our compliance costs.
Judicial or regulatory decisions may restrict or eliminate the enforceability of certain types of contractual provisions designed to limit costly litigation, such as mandatory arbitration clauses and class action waivers as dispute resolution methods, which could have a material adverse effect on our business.
To attempt to limit costly and lengthy consumer, employee and other litigation, including class actions, we require customers entering into LTO transactions and team members across all business segments to sign arbitration agreements and class action waivers, many of which offer opt-out provisions. Recent judicial and regulatory actions have attempted to restrict or eliminate the enforceability of such agreements and waivers. If we are not permitted to use arbitration agreements and/or class action waivers, or if the enforceability of such agreements and waivers is restricted or eliminated, we could incur increased costs to resolve legal actions brought by customers, team members and others, as we would be forced to participate in more expensive and lengthy dispute resolution processes, any of which could have a material adverse effect on our business.
Product safety and quality control issues, including product recalls, could harm our reputation, divert resources, reduce sales and increase costs.
The products we lease and sell through our business segments are subject to regulation by the United States Consumer Product Safety Commission and similar state regulatory authorities, as well as regulatory authorities in Canada. Such products could be subject to recalls and other actions by these authorities. Such recalls and voluntary removal of products can result in, among other things, lost sales, diverted resources, potential harm to our reputation and increased customer service costs, which could have a material adverse effect on our business, results of operations or financial condition. In addition, given the terms of our lease agreements with our customers, in the event of such a product quality or safety issue, customers who have leased the defective merchandise from us could terminate their lease agreements for that merchandise and/or not renew those lease agreements, which could have a material adverse effect on our business, results of operations or financial condition, if we are unable to recover those losses from the vendor who supplied the defective merchandise.
Inflation Risk
The current inflationary environment has adversely impacted and could continue to adversely impact our business through increased costs to attract and retain talent, increased raw materials costs, increased logistical costs to get product from suppliers to customer’s homes and the acceleration of prices beyond the norm resulting in lower lease volumes.
Our financial performance has been adversely impacted and could continue to be adversely impacted by relative rates of inflation, which are subject to market conditions. The ongoing labor shortages have increased the costs to attract and retain talent. Sign-on bonuses, enhanced wages and other inducements related to labor rates have increased our costs and are expected to continue to increase our costs, which could have an adverse effect on our margins and profitability. Commodities and other raw goods used in some of our products, including our Woodhaven manufactured products, can be subject to availability constraints and price volatility caused by supply conditions, government regulations and general economic conditions and other unpredictable factors, which may further increase our costs. Our logistical costs related to both domestic and overseas freight
23
transporting and shipping our merchandise to our distribution centers and store locations and delivery to our customers may increase. Additionally, the cost of construction materials we use to build and remodel our stores is also subject to price volatility based on market and economic conditions. Higher construction material prices could increase the capital expenditures needed to construct our new store concept or for re-engineering or remodeling an existing store and, as a result, could increase the investment required.
We have limited or no control over many of these inflationary forces on our costs. These inflationary pressures could impact our net sales and earnings. If the price of goods changes as a result of inflation, we may be unable to adjust our retail prices and lease payments accordingly, which could adversely impact our earnings. Changes in prices could also negatively impact our sales and earnings if our competitors react more aggressively or if our customers curtail entering into sales and lease agreements for the merchandise we offer or enter into agreements that generate less revenue for us, resulting in lower lease volumes.
Talent Management Risks
We depend on hiring an adequate number of hourly team members to run our business and are subject to government laws and regulations concerning these and our other team members, including wage and hour regulations. Our inability to recruit, select, train and retain qualified team members or violations by us of employment or wage and hour laws or regulations could have a material adverse effect on our business, results of operations or financial condition.
Our workforce is comprised primarily of team members who work on an hourly basis. To grow our operations and meet the needs and expectations of our customers, we must attract, select, train, and retain a large number of hourly team members, while at the same time controlling labor costs. These positions have historically had high turnover rates, which can lead to increased training, retention and other costs. In certain areas where we operate, there has historically been significant competition for team members, including from retailers distribution centers, delivery services and restaurants. In addition, the competitive nature of the hourly labor market, including an increasing number of jobs, whether in-person or remote work, and increasing wage rates for those jobs, may make it more difficult for us to attract candidates for our open hourly positions. The lack of availability of an adequate number of hourly team members, or our inability to attract and retain them, or an increase in wages and benefits to attract and retain current team members, could adversely affect our business, results of operations or financial condition. We are subject to applicable rules and regulations relating to our relationship with our team members, including wage and hour regulations, health benefits, unemployment and payroll taxes, overtime and working conditions and immigration status. Accordingly, federal, state or local legislated increases in the minimum wage, as well as increases in additional labor cost components such as employee benefit costs, workers’ compensation insurance rates, compliance costs and fines, would increase our labor costs, which could have a material adverse effect on our business, results of operations or financial condition.
The loss of the services of our key executives, or our inability to attract, develop and retain key talent could have a material adverse effect on our business and operations.
We believe that we have benefited substantially from our current executive leadership and that the unexpected loss of their services in the future could adversely affect our business and operations. We also depend on the continued services of the rest of our management team. The loss of certain of these individuals without adequate replacement could adversely affect our business. Further, we believe that the unexpected loss of certain key talent in the future could have a material adverse effect on our business and operations. We do not carry key business person life insurance on any of our key business personnel. The inability to attract, develop and retain qualified individuals, or a significant increase in the costs to do so, could have a material adverse effect on our operations.
Cyber-Security and Technology Risks
If we do not maintain the privacy and security of customer, employee or other confidential information, due to cybersecurity-related "hacking" attacks, ransomware, intrusions into our systems by unauthorized parties or otherwise, we could incur significant costs – including the loss of some or all of our IT systems, litigation, regulatory enforcement actions and damage to our reputation, any of which could have a material adverse effect on our business, results of operations or financial condition.
Our business involves the collection, processing, transmission and storage of customers’ personal and confidential information, as well as confidential information about our team members, among others. Much of this data constitutes confidential personally identifiable information ("PII") which, if unlawfully accessed, either through a "hacking" attack or otherwise, could subject us to significant liabilities as further discussed below.
Companies like us that possess significant amounts of PII and/or other confidential information have experienced a significant increase in cybersecurity risks in recent years from increasingly aggressive and sophisticated cyberattacks, including hacking, computer viruses, malicious or destructive code, ransomware, social engineering attacks (including phishing and impersonation), denial-of-service attacks and other attacks and similar disruptions from the unauthorized use of or access to IT
24
systems. Our IT systems are subject to constant attempts to gain unauthorized access in order to disrupt our business operations and capture, destroy or manipulate various types of information that we rely on, including PII and/or other confidential information. In addition, various third parties, including franchisees, team members, contractors or others with whom we do business may attempt to circumvent our security measures in order to obtain such information, or inadvertently cause a breach involving such information. Any significant compromise or breach of our data security, whether external or internal, or misuse of PII and/or other confidential information may result in significant costs, litigation and regulatory enforcement actions and, therefore, may have a material adverse impact on our business, results of operations or financial condition. Further, if any such compromise, breach or misuse is not detected quickly, the effect could be compounded.
While we have implemented information security systems and processes (including engagement of third-party security services) to protect against unauthorized access to or use of secured data and to prevent data loss and theft, there is no guarantee that these procedures are adequate to safeguard against all data security breaches or misuse of the data. In addition, certain of our confidential information, and information regarding our customers, may be gathered, processed, and or/stored through, or on, the networks or other systems of third-party vendors or service providers whom we have engaged. While we endeavor to conduct due diligence on those third parties regarding their data security and protection policies and procedures, and the methods they use to safeguard such information, we ultimately do not, and are unable to, manage or control those third parties' efforts to safeguard against data security breaches or misuse of data, or data loss or theft, that may involve our confidential information or the confidential information of our customers. We maintain private liability insurance intended to help mitigate the financial risks of such incidents, but there can be no guarantee that insurance will be sufficient to cover all losses related to such incidents, and our exposure resulting from any serious unauthorized access to, or use of, secured data, or serious data loss or theft, could far exceed the limits of our insurance coverage for such events. Further, a significant compromise of PII and/or other confidential information could result in regulatory penalties and harm our reputation with our customers and others, potentially resulting in a material adverse effect on our business, results of operations or financial condition.
The regulatory environment related to information security, data collection and use, and consumer privacy is increasingly rigorous, with new and constantly changing requirements applicable to our business, and compliance with those requirements could result in additional costs. For example, the CCPA (as amended by the CPRA), has changed the manner in which our transactions with California residents are regulated with respect to the manner in which we collect, store and use consumer and employee data; exposed our operations in California to increased regulatory oversight and litigation risks; and increased our compliance-related costs. Moreover, other states have adopted or may adopt privacy-related laws whose restrictions and requirements differ from those of the CCPA and CPRA. Compliance with changes in consumer privacy and information security laws may result in significant expense due to increased investment in technology, the development of new operational processes and oversight. Failure to comply with these laws subjects us to potential regulatory enforcement activity, fines, private litigation including class actions, and other costs. We also have data privacy and security-related contractual obligations that might be breached if we fail to comply. A significant privacy breach or failure to comply with privacy and information security laws could have a material adverse effect on our reputation, business, results of operations or financial condition.
We also believe successful data breaches or cybersecurity incidents at other companies, whether or not we are involved, could lead to a general loss of customer confidence that could negatively affect us, including harming the market perception of the effectiveness of our security measures or financial technology in general.
If our or third-party IT systems are impaired or we otherwise lost the ability to utilize our or third-party IT systems, our business could be interrupted, our reputation could be harmed and we may experience lost revenues and increased costs and expenses, any of which could have a material adverse impact on our business, results of operations and financial condition.
We rely on our and third-party IT systems to carry out our in-store and e-commerce customer lease decisioning process and to process lease and retail transactions with our customers, including tracking and processing lease payments on merchandise, processing retail transactions and lease or credit applications, and other important functions of our business. Failures of our systems, such as "bugs", crashes, internet failures and outages, operator error, or catastrophic events such as a cybersecurity incident or ransomware, could seriously impair our ability to operate our business, and our business continuity and contingency plans related to such IT failures may not be adequate to prevent that type of serious impairment. If our or third-party IT systems are impaired, our business (and that of our franchisees) could be interrupted, our reputation could be harmed, we may experience lost revenues or sales, including due to an interruption to our data-enabled customer lease decisioning and lease renewal and collection functions, and we could experience increased costs and expenses to remediate the problem. As we continue to centralize more of our operations, the risks and potential unfavorable impacts of systems failures will become more significant, and there can be no assurances that we can successfully mitigate such heightened risks.
Risks Related to BrandsMart U.S.A. Acquisition
The BrandsMart U.S.A acquisition may create risks and uncertainties which could materially and adversely affect our business and results of operations.
25
Since the consummation of the BrandsMart acquisition, we have experienced significantly more sales, and have more assets and employees than we did prior to the transaction. The integration process requires us to expend significant capital and significantly expand the scope of our operations and financial systems. Our management is required to devote a significant amount of time and attention to the process of integrating the operations of our business with that of the BrandsMart business. There is a significant degree of difficulty and management involvement inherent in that process.
These difficulties include:
•integrating the operations of the BrandsMart business while carrying on the ongoing operations of the Aaron's and Woodhaven businesses;
•developing, launching, and managing an in-house LTO purchase solution, BrandsMart Leasing;
•managing a significantly larger company than before consummation of the BrandsMart business;
•the possibility of faulty assumptions underlying our expectations regarding the integration process, including, among other things, unanticipated delays, costs or inefficiencies;
•the effects of unanticipated liabilities;
•operating a more diversified business;
•integrating two separate business cultures;
•attracting and retaining the necessary personnel associated with the BrandsMart business;
•maintaining relationships with suppliers;
•the challenge of integrating complex systems, IT systems, data privacy and security systems and our ability to maintain the privacy and security of BrandsMart's customer, employee or other confidential information;
•creating uniform standards, controls, procedures, policies and information systems and controlling the costs associated with such matters;
•integrating information, purchasing, accounting, finance, sales, billing, payroll and regulatory compliance systems; and
•integrating compliance with the Sarbanes-Oxley Act, including implementing internal controls over financial reporting.
If any of these factors limit our ability to integrate the BrandsMart business into our operations successfully or on a timely basis, the expectations of future results of operations, including certain run-rate synergies expected to result from the BrandsMart U.S.A. acquisition, might not be met. As a result, we may not be able to realize the expected benefits that we seek to achieve from the BrandsMart U.S.A acquisition, which could also affect our ability to service our debt obligations. In addition, we may be required to spend additional time or money on integration that otherwise would be spent on the development and expansion of our larger Aaron's Business, including efforts to further expand our product selection.
We may be unable to realize the anticipated synergies from the BrandsMart U.S.A. acquisition or may incur additional and/or unexpected costs in order to realize them.
There can be no assurance that we will be able to realize the anticipated synergies from the BrandsMart U.S.A. acquisition in the anticipated amounts or within the anticipated timeframes or costs expectations or at all. We have implemented a series of initiatives that we expect to result in recurring, annual run-rate synergies. We have incurred, and expect to incur, one-time, non-recurring costs to achieve such synergies. These or any other cost savings or operational improvements that we realize may differ materially from our estimates. We cannot provide assurances that these anticipated synergies will be achieved or that our programs and improvements will be completed as anticipated or at all. In addition, any cost savings that we realize may be offset, in whole or in part, by reductions in revenues or through increases in other expenses.
Risks Related to Operations and Strategy
We face many challenges which could have a material adverse effect on our overall results of LTO and retail operations, including the commoditization of certain product categories, increasing competition from a growing variety of sources, a decentralized, high-fixed-cost operating model, adverse consequences to our supply chain function from decreased procurement volumes and from supply chain disruptions, and with respect to the LTO business, lower lease volumes, and thus, less recurring revenues written into our customer lease portfolio.
Our business currently faces and may face new challenges relating to the commoditization of certain product categories. For example, due to an increasing supply of electronics, and retail strategies that include implementing frequent price-lowering sales and using certain electronics as “loss leaders” to increase customer traffic in stores, there is significant price-based competition or “commoditization” of electronics, particularly for televisions. We do not expect the commoditization of the electronics category to subside and it may expand to other product categories with increasing frequency in the future, including
26
appliances and furniture. We also face competition from national, regional and local operators of direct-to-consumer LTO stores and websites, virtual LTO and rent-to-rent companies, Buy Now, Pay Later companies, traditional and e-commerce retailers (including many that offer layaway programs, point of sale financing, and title or installment lending), traditional and online sellers of used merchandise, and various types of consumer finance companies that may enable our customers to shop at traditional or online retailers, as well as with rental stores that do not offer their customers a purchase option. We also compete with retail stores for customers desiring to purchase merchandise for cash or on credit. This increasing competition from these sources may reduce our market share as well as our operating margins, and may have a material adverse effect on our overall results of operations. Many of the competitors discussed above have more advanced and modern e-commerce, logistics and other technology applications and systems that offer them a competitive advantage in attracting and retaining customers for whom we compete, especially with respect to younger customers. In addition, those competitors may offer a larger selection of products and more competitive prices.
We believe the significant increase in the amount and type of competition, as discussed above, may result in LTO customers curtailing entering into sales and lease ownership agreements for the types of merchandise we offer, or entering into agreements that generate less revenue for us, resulting in lower revenue and profits, or entering into lease agreements with our competitors.
Our business has a decentralized, high fixed cost operating model due to, among other factors, our significant labor related to our selling and lease renewal and collections functions, the costs associated with our last-mile delivery, our fulfillment centers and related logistics functions, and our manufacturing operations. That model may result in negative operating leverage in a declining revenue environment, as we may not be able to reduce or "deleverage" those fixed costs in proportion to any reduction in the revenues of our business, if at all, and our failure to do so may adversely affect our overall results of operations.
In addition, our supply chain function and financial performance may suffer adverse consequences related to the decreases we have experienced, and may continue to experience, in the volume of merchandise we purchase from third party suppliers, due to, among other factors, our store closures, declining sales of merchandise to franchisees, and lower lease volumes. Those consequences may include, for example, smaller discounts from our vendors, or the elimination of discount programs previously offered to us, which may have an adverse impact on our results of operations. Declining merchandise purchase volumes have caused us to rationalize and consolidate, and may result in us further rationalizing and consolidating, vendors for certain product categories, and we may not effectively implement those vendor consolidation initiatives, which could lead to disruptions to our supply chain, including delivery delays or unavailability of certain types of merchandise for our stores and our franchisees’ stores.
We have experienced and may continue to experience increases in the costs we incur to purchase certain merchandise that we offer for sale or lease to our customers, due to tariffs, increases in prices for certain commodities, supply chain disruptions, and increases in the costs of transportation and shipping the merchandise to our distribution centers and store locations. We have limited or no control over many of these inflationary forces on our costs. In addition, we may not be able to recover all or even a portion of such cost increases by increasing our merchandise prices, fees, or otherwise, and even if we are able to increase merchandise prices or fees, those cost increases to our customers could result in the customers curtailing entering into sales and lease ownership agreements for the types of merchandise we offer, or entering into agreements that generate less revenue for us, resulting in lower revenues and profits.
If we are unable to successfully address these challenges, our overall business, results of operations or financial condition may be materially and adversely affected as well.
We are implementing a multi-year strategic plan within our business designed to strengthen and grow our business and generate capital for investment by growing revenue, further reducing costs and strengthening operating margins, and there is no guarantee such plan will be successful.
Our multi-year strategic plan for our business includes a number of key initiatives to grow revenue, further reduce costs and improve profitability, and operating margins, including centralizing and investing in key processes, such as customer lease decisioning and payments, rationalizing and repositioning real estate, enhancing our e-commerce platforms and digital optimization channels, enhancing and growing BrandsMart, achieving BrandsMart synergies announced at the acquisition date, and optimizing our cost structure. There is no guarantee that these initiatives will be successful. For example, we may not be successful in our attempts to attract new customers to our brand, develop the technology needed to further enhance our customers’ experiences with us, or align our store footprint with market opportunities due to an inability to secure new store locations, or otherwise.
With respect to centralizing key processes, we have implemented a data-enabled customer lease decisioning process in all of our company-operated Aaron's stores and within our BrandsMart Leasing business, and in the franchised Aaron's stores as well. We may not execute the procedural and operational changes and systems necessary to successfully implement the centralized decisioning initiative, and it is possible that data-enabled customer lease decisioning will not be as effective or accurate as the decentralized, store-based decisioning process we historically used in our business.
27
Regarding our real estate strategy, the buildout of our new Aaron's store concept and operating model includes geographically repositioning a significant number of our store locations into larger buildings and/or into different geographic locations that we believe will be more advantageous, and also re-engineering and remodeling certain existing stores, to provide for larger selections of merchandise and other more complex features. We expect to incur significant capital costs, including build-out or remodeling costs for this new store concept and operating model and exit costs from the termination of current leases and sale of current properties. We have not historically managed or operated stores with larger footprints or more complex, reengineered stores and operating models, and thus, we expect that our management team and store team members for those locations will need to adjust to managing and operating larger, more complex stores, and there can be no assurances that those stores will be successful. In addition, we are exploring a new "Hub and Showroom" model to improve operational efficiencies in select markets. This is a new strategy and we have not historically managed and operated stores in this capacity and thus there can be no assurances that this "Hub and Showroom" model will be successful.
Our BrandsMart U.S.A. strategy consists of maintaining our current store locations and expanding our reach to additional markets by opening one or two new stores per year. With each store, we expect to incur significant capital costs, including building and development costs, and to enter into a multi-year lease.
There can be no assurance that the real estate component of our strategy will be successful. For example, we may not be successful in transitioning the customers of our stores that are closed or repositioned to other stores that remain open or to our new store concept and operating model, and thus, could experience a reduction in revenue and profits associated with such a loss of customers. In addition, we may not be able to identify and secure a sufficient number of store locations that are able to support our new Aaron's store concept and/or our new BrandsMart U.S.A. stores, at reasonable lease rates and terms, or at all.
Our e-commerce platforms also are a significant component of our strategic plan and we believe they will drive future growth of both segments. However, to promote our products and services and allow customers to transact online and reach new customers, we must effectively maintain, improve and grow our e-commerce platforms and digital acquisition channels. While we believe our aarons.com e-commerce platform currently is superior to those of our traditional LTO competitors, many of the traditional, virtual and "big-box" retailers and other companies with whom we compete have more robust e-commerce platforms and logistics networks than ours, and have more resources to dedicate to improving and growing their e-commerce platforms. In addition, although we continue to make improvements to our BrandsMart U.S.A. e-commerce platform, we may not have the same e-commerce platforms and logistics as our larger nationwide competitors. For both our business segments, there can be no assurance that we will be able to effectively compete against those companies’ e-commerce platforms and logistics networks, or maintain, improve or grow our e-commerce platform in a profitable manner.
There can be no guarantee that our strategy for our business, and our current or future business improvement initiatives related thereto, will yield the results we currently anticipate (or results that will exceed those that might be obtained under prior or other strategies). We may fail to successfully execute on one or more elements of our current strategy, even if we successfully implement one or more other components. In addition, the estimated costs and charges associated with these initiatives may vary materially and adversely based upon various factors.
If we cannot address these challenges successfully, or overcome other critical obstacles that may emerge as we continue to pursue our current strategy, it may adversely impact our business, results of operations or financial condition.
Our growth strategies may be unsuccessful if we are unable to identify and complete future acquisitions and successfully integrate acquired businesses or assets.
We will consider potential acquisitions on a selective basis. From time-to-time we may approach, or may be approached by, other public companies or large privately-held companies to explore consolidation opportunities. There can be no assurance that we will be able to identify suitable acquisition opportunities in the future or that we will be able to consummate any such transactions on terms and conditions acceptable to us.
In addition, it is possible that we will not realize the expected benefits from any completed acquisition over the timeframe we expect, or at all, or that our existing operations will be adversely affected as a result of acquisitions. Acquisitions entail certain risks, including:
•unrecorded liabilities of acquired companies and unidentified issues that we fail to discover during our due diligence investigations or that are not subject to indemnification or reimbursement by the seller;
•greater than expected expenses such as the need to obtain additional debt or equity financing for any transaction;
•unfavorable accounting treatment and unexpected increases in taxes;
•adverse effects on our ability to maintain relationships with customers, team members, suppliers or other key stakeholders;
•inherent risk associated with entering a geographic area or line of business in which we have no or limited experience;
28
•difficulty in assimilating the operations and personnel of an acquired company within our existing operations, including the consolidation of corporate and administrative functions;
•the challenge of integrating complex systems, IT systems, data privacy and security systems and our ability to maintain the privacy and security of customer, employee or other confidential information;
•difficulty in conforming standards, controls, procedures and policies, business cultures and compensation structures;
•difficulty in identifying and eliminating redundant and underperforming operations and assets;
•loss of key team members of the acquired company;
•operating inefficiencies that have a negative impact on profitability;
•impairment of goodwill or other acquisition-related intangible assets;
•failure to achieve anticipated synergies or receiving an inadequate return of capital; and
•strains on management and other personnel time and resources to evaluate, negotiate and integrate acquisitions.
Our failure to address these risks or other problems encountered in connection with any future acquisition could cause us to fail to realize the anticipated benefits of the acquisitions, cause us to incur unanticipated liabilities and harm our business generally. In addition, if we are unable to successfully integrate our acquisitions with our existing business, we may not obtain the advantages that the acquisitions were intended to create, which may materially and adversely affect our business, results of operations, financial condition, cash flows, our ability to introduce new services and products and the market price of our stock.
We would expect to pay for any future acquisitions using cash, capital stock, indebtedness and/or assumption of indebtedness. To the extent that our existing sources of cash are not sufficient, we would expect to need additional debt or equity financing, which involves its own risks, such as the dilutive effect on shares held by our stockholders if we financed acquisitions by issuing convertible debt or equity securities, or the risks associated with debt incurrence.
Acquisitions place strains on our management and other personnel time and resources, and require timely and continued investment in facilities, personnel and financial and management systems and controls. We may not be successful in implementing all of the processes that are necessary to support any of our growth initiatives, which could result in our expenses increasing disproportionately to our incremental revenues, causing our operating margins and profitability to be adversely affected.
We could lose our access to third-party data sources, including, for example, those sources that provide us with data that we use as inputs into our centralized decisioning tools, which could cause us competitive harm and have a material adverse effect on our business, results of operations or financial condition.
Our Aaron's Business and BrandsMart Leasing businesses are heavily dependent on data provided by third-party providers such as customer attribute data provided by external sources, including for use as inputs in our centralized decisioning tools. Our centralized decisioning tools rely on these third-party data providers for data inputs that are a critical part of our centralized decisioning processes. Our data providers could experience outages or otherwise stop providing data, provide untimely, incorrect or incomplete data, or increase the costs for their data for a variety of reasons, including a perception that our systems are insecure as a result of a data security breach, regulatory concerns or for competitive reasons. We could also become subject to increased legislative, regulatory or judicial restrictions or mandates on the collection, disclosure, retention or use of such data, in particular if such data is not collected by our providers in a way that allows us to legally use the data. If we were to lose access to this external data or if our access or use were restricted or were to become less economical or desirable, our business, and our centralized decisioning processes in particular, would be negatively impacted, which could have a material adverse effect on our business, results of operations or financial condition. We cannot provide assurance that we will be successful in maintaining our relationships with these external data source providers or that we will be able to continue to obtain data from them on acceptable terms or at all. Furthermore, we cannot provide assurance that we will be able to obtain data from alternative sources if our current sources become unavailable.
We must successfully order and manage our inventory to reflect customer demand and anticipate changing consumer preferences and buying trends or our revenue and profitability will be adversely affected.
The success of our business depends upon our ability to successfully manage our inventory and to anticipate and respond to merchandise trends and customer demands in a timely manner. We cannot always accurately predict consumer preferences and they may change over time. We must order certain types of merchandise, such as electronics, well in advance of seasonal increases in customer demand for those products. The extended lead times for many of our purchases may make it difficult for us to respond rapidly to new or changing product trends or changes in prices. If we misjudge either the market for our merchandise, our customers’ product preferences or our customers’ leasing or buying habits, our revenue may decline significantly, and we may not have sufficient quantities of merchandise to satisfy customer demand or we may be required to mark down excess inventory, either of which would result in lower profit margins. In addition, our level of profitability and
29
success in the LTO business depends on our ability to successfully re-lease or sell our inventory of merchandise that is returned by customers that are unwilling or unable to continue making their lease renewal payments, or otherwise.
Our competitors could impede our ability to attract new customers, or cause current customers to cease doing business with us, which could have a material adverse effect on our business, results of operations or financial condition.
The industries in which we operate are highly competitive and highly fluid, particularly in light of the sweeping new regulatory environment we are witnessing from regulators such as the FTC, among others, as discussed above.
Our competitors include national, regional and local operators of direct-to-consumer LTO stores and websites, virtual LTO and rent-to-rent companies, Buy Now, Pay Later companies, traditional and e-commerce retailers (including many that offer layaway programs, point of sale financing, and title or installment lending), traditional and online sellers of used merchandise, and various types of consumer finance companies that may enable our customers to shop at traditional or online retailers, as well as with rental stores that do not offer their customers a purchase option. We also compete with retail stores for customers desiring to purchase merchandise for cash or on credit. Our competitors in the traditional and virtual sales and lease ownership and traditional retail markets may have significantly greater financial and operating resources and greater name recognition in certain markets. Greater financial resources may allow our competitors to grow faster than us, including through acquisitions. This in turn may enable them to enter new markets before we can, which may decrease our opportunities in those markets. Greater name recognition, or better public perception of a competitor’s reputation, may help them divert market share away from us, even in our established markets. Some competitors may be willing to offer competing products on an unprofitable basis in an effort to gain market share, which could compel us to match their pricing strategy or lose business. In addition, some of our competitors may be willing to lease certain types of products that we will not agree to lease, enter into customer leases that have services, as opposed to goods, as a significant portion of the lease value, or engage in other practices related to pricing, compliance, and other areas that we will not, in an effort to gain market share at our expense. Our inability to attract new customers, or loss of current customers, could have a material adverse effect on our business, results of operations or financial condition.
Our proprietary algorithms and customer lease decisioning tools used to approve customers depend, in part on customer behavior, and unexpected changes in such behavior could cause such algorithms and decisioning tools to no longer be indicative of our customers' ability to perform under their lease agreements with us.
We assume behavior and attributes observed for prior customers, among other factors, are indicative of performance by future customers. Unexpected changes in behavior caused by macroeconomic conditions, including, for example, the United States economy experiencing a prolonged recession and job losses related to the global pandemic, the reduction of any government stimulus programs, the impacts of a prolonged inflationary period, the impacts from, and governmental responses to, the resumption of any eviction proceedings, the resumption of student loan payments, availability of alternative products or other factors, and changes in consumer behavior relating thereto, could lead to increased incidence and costs related to lease merchandise write-offs. Due to the nature of the inherent risk in modeling customer behavior, our customer lease decisioning process may require adjustments and the application of greater management judgment in the interpretation and adjustment of the results produced by our decisioning tools and we may be unable to accurately predict and respond to the impact of a prolonged economic downturn or changes to consumer behaviors, which in turn may limit our ability to manage risk, avoid lease merchandise write-offs and could result in our accounts receivable allowance being insufficient.
Our business and operations are subject to risks related to climate change.
The long-term effects of global climate change present both physical risks (such as extreme weather conditions or rising sea levels) and transition risks (such as regulatory or technology changes), which are expected to be widespread and unpredictable. These changes could over time affect, for example, the availability and costs of products, commodities and energy (including utilities), which in turn may impact our ability to procure goods or services required for the operation of our business at the quantities and levels we require. Our stores, distribution centers and fulfillment centers may be impacted by the physical risks of climate change, and we face the risk of losses incurred as a result of physical damage, loss or spoilage of inventory and business interruption caused by such events. In addition, consumers leaving coastal areas and those areas most impacted by climate change and relocating could cause greater concentration of our customers in certain markets potentially increasing our costs relating to our store relocation strategy if we have to relocate additional stores. We also use natural gas, diesel fuel, gasoline and electricity in our operations, all of which could face increased regulation as a result of climate change or other environmental concerns. Regulations limiting greenhouse gas emissions and energy inputs may also increase in coming years, which may increase our costs associated with compliance and merchandise. These events and their impacts could adversely affect our business, results of operations or financial condition.
Risks Related to the LTO Industry
The transactions offered to consumers by our LTO business may be negatively characterized by consumer advocacy groups, the media and certain federal, state, provincial and local government officials. If those negative
30
characterizations become increasingly accepted by consumers, demand for our services and the transactions we offer could decrease and our business, results of operations or financial condition could be materially and adversely affected.
Certain consumer advocacy groups, media reports, federal and state regulators, and certain candidates for political offices have asserted that laws and regulations should be broader and more restrictive regarding LTO transactions. These consumer advocacy groups and media reports generally focus on the total cost to a consumer to acquire an item, which is often alleged to be higher than the interest typically charged by banks or similar lending institutions to consumers with better credit histories. This "cost-of-rental" amount, which is generally defined as the amount paid for lease ownership in excess of the "retail" price of the goods, is from time to time characterized by consumer advocacy groups and media reports as predatory or abusive without discussing the benefits associated with our LTO programs or the lack of viable alternatives for our customers’ needs. Although we strongly disagree with these characterizations, if the negative characterization of these types of LTO transactions becomes increasingly accepted by consumers, demand for our products and services could significantly decrease, which could have a material adverse effect on our business, results of operations or financial condition. Additionally, if the negative characterization of these types of transactions is accepted by regulators and legislators, or if political candidates who have a negative view of the LTO industry are ultimately elected, we could become subject to more restrictive laws and regulations and more stringent enforcement of existing laws and regulations, any of which could have a material adverse effect on our business, results of operations or financial condition. The vast expansion and reach of technology, including social media platforms, has increased the risk that our reputation could be significantly impacted by these negative characterizations in a relatively short amount of time. If we are unable to quickly and effectively respond to such characterizations, we may experience declines in customer loyalty and traffic, which could have a material adverse effect on our business, results of operations or financial condition. Additionally, any failure by our competitors, including smaller, regional competitors, or our franchisees, for example, to comply with the laws and regulations applicable to the traditional and/or e-commerce models, or any actions by those competitors that are challenged by consumers, advocacy groups, the media or governmental agencies or entities as being abusive or predatory could result in our business being mischaracterized, by implication, as engaging in similar unlawful or inappropriate activities or business practices, merely because we operate in the same general industries as such competitors.
Risks Related to Our Aaron's Business Franchisees
We may engage in, or be subject to, litigation with our franchisees.
Although we believe we generally enjoy a positive working relationship with our franchisees, the nature of the franchisor-franchisee relationship may give rise to litigation with our franchisees. In the ordinary course of business, we are the subject of complaints or litigation from franchisees, usually related to alleged breaches of contract or wrongful termination under the franchise arrangements. We may also engage in future litigation with franchisees to enforce the terms of our franchise agreements and compliance with our brand standards as determined necessary to protect our brand, the consistency of our products and the customer experience. In addition, we may be subject to claims by our franchisees relating to our franchise disclosure documents, including claims based on financial information contained in those documents. Engaging in such litigation may be costly, time-consuming and may distract management and materially adversely affect our relationships with franchisees. Any negative outcome of these or any other claims could materially adversely affect our business, results of operations or financial condition and may damage our reputation and brand. Furthermore, existing and future franchise-related legislation could subject us to additional litigation risk in the event we terminate or fail to renew a franchise relationship.
Operational and other failures by our franchisees may adversely impact us.
Qualified franchisees who conform to our standards and requirements are important to the overall success of our business. Our franchisees, however, are independent businesses and not team members, and consequently we cannot and do not control them to the same extent as our company-operated stores. Our franchisees may fail in key areas, or experience significant business or financial difficulties, which could slow our growth, reduce our franchise revenues, damage our reputation, expose us to regulatory enforcement actions or private litigation and/or cause us to incur additional costs. If our franchisees experience business or financial difficulties, including, for example, in connection with inflation, rising interest rates, the slowing of consumer demand, labor shortages, and business disruptions due to the ongoing Russia-Ukraine conflict and the conflict in Israel, Palestine and surrounding areas, we could suffer a loss of franchisee fees, royalties, and revenues and profits derived from our sales of merchandise to franchisees, and could suffer write-downs of outstanding receivables those franchisees owe us if they fail to make those payments to us. If we fail to adequately mitigate any such future losses, our business, results of operations or financial condition could be adversely impacted.
We are subject to laws that regulate franchisor-franchisee relationships. Our ability to enforce our rights against our franchisees may be adversely affected by these laws, which could impair our growth strategy and cause our franchise revenues to decline.
As a franchisor, we are subject to regulation by the FTC, state laws and certain Canadian provincial laws regulating the offer and sale of franchises. Our failure to comply with applicable franchise regulations could cause us to lose franchise fees and ongoing royalty revenues. Moreover, state and provincial laws that regulate substantive aspects of our relationships with
31
franchisees may limit our ability to terminate or otherwise resolve conflicts with our franchisees or enforce contractual duties or rights we believe we have with respect to our franchisees.
Changes to current law with respect to the assignment of liabilities in the franchise business model could materially and adversely affect our profitability.
As of December 31, 2023, we have 55 franchisees that operate a total of 224 stores. One of the legal foundations fundamental to the franchise business model has been that, absent special circumstances, a franchisor is generally not responsible for the acts, omissions or liabilities of its franchisees. In recent years, established law has been challenged and questioned by the plaintiffs’ bar and certain regulators, and the outcome of these challenges and new regulatory positions remains unknown. If these challenges and/or new positions are successful in altering currently settled law, it could significantly change the relationship between us and our franchisees and the way we and other franchisors conduct business and adversely impact our profitability.
For example, a determination that we are a joint employer with our franchisees or that franchisees are part of one unified system with joint and several liability under the National Labor Relations Act, statutes administered by the Equal Employment Opportunity Commission, OSHA regulations and other areas of labor and employment law could subject us and/or our franchisees to liability for the unfair labor practices, wage-and-hour law violations, employment discrimination law violations, OSHA regulation violations and other employment-related liabilities of one or more franchisees. Furthermore, any such change in law would create an increased likelihood that certain franchised networks would be required to employ unionized labor, which could impact franchisors like us through, among other things, increased labor costs and difficulty in attracting new franchisees. In addition, if these changes were to be expanded outside of the employment context, we could be held liable for other claims against franchisees. If such changes occur, our operating expenses may increase as a result of required modifications to our business practices, increased litigation, governmental investigations or proceedings, administrative enforcement actions, fines, penalties and civil liability, which could materially and adversely affect our results of operations.
Risks Related to Ownership of Our Common Stock
We cannot guarantee the timing, amount or payment of dividends on our common stock.
Although we expect to continue to pay a regular quarterly cash dividend, the timing, declaration, amount and payment of future dividends to shareholders will fall within the discretion of our Board. Our Board regularly evaluates our capital allocation strategy and dividend policy, and any future determination regarding the payment of dividends will depend on many factors, including financial condition, liquidity, earnings, our ability to retain future earnings in order to fund operations and future growth, capital requirements, debt service obligations, corporate strategy, regulatory constraints, industry practice, statutory and contractual restrictions and other factors deemed relevant by our Board. No assurance can be given that cash dividends will continue to be declared and paid, and, if declared and paid, the amount of such dividends.
As a public company, we are required to maintain effective internal control over financial reporting in accordance with Section 404 of the Sarbanes-Oxley Act and our failure to do so could materially and adversely affect us.
We are subject to the reporting requirements of the Securities Exchange Act of 1934 (the "Exchange Act"), the Sarbanes-Oxley Act and the Dodd-Frank Act and are required to prepare our financial statements according to the rules and regulations required by the SEC. In addition, the Exchange Act requires that we file annual, quarterly and current reports. Our failure to prepare and disclose this information in a timely manner or to otherwise comply with applicable law could subject us to penalties under federal securities laws, expose us to lawsuits and restrict our ability to access financing. In addition, the Sarbanes-Oxley Act requires, among other things, that we establish and maintain effective internal controls and procedures for financial reporting and disclosure purposes. Internal control over financial reporting is complex and may be revised over time to adapt to changes in our business, or changes in applicable accounting rules.
As more fully disclosed in Item 9A. "Controls and Procedures", management has concluded that, because of a material weakness in internal controls within the BrandsMart segment, which we acquired on April 1, 2022, our disclosure controls and procedures were not effective as of December 31, 2023. The material weakness related to the design of information technology general controls ("ITGCs") related to user access, program change or appropriate segregation of duties for certain IT applications within the segment that were deemed ineffective. This ineffective design impacted controls over the completeness and accuracy of information used in the segment's business process controls resulting in the impacted controls also being deemed ineffective. The material weakness did not result in any errors, however it was not remediated as of December 31, 2023. The material weakness will not be considered remediated until the applicable remedial controls operate for a sufficient period of time and management has concluded, through testing, that these controls are operating effectively. We cannot be certain that these measures will be successful or that we will be able to prevent future material weaknesses.
Failure to remediate any material weakness in our internal control over financial reporting or other matters affecting our internal controls may cause us to be unable to report our financial information on a timely basis or may cause us to restate previously issued financial information, and thereby subject us to adverse regulatory consequences, including sanctions or investigations
32
by the SEC, violations of applicable stock exchange listing rules, and litigation brought by our shareholders and others. There could also be a negative reaction in the financial markets due to a loss of investor confidence in us and the reliability of our financial statements. Confidence in the reliability of our financial statements could also suffer if we or our independent registered public accounting firm reports a material weakness in our internal control over financial reporting. This could have a material and adverse effect on us by, for example, leading to a decline in our share price and impairing our ability to raise additional capital, and also could result in litigation brought by our shareholders and others.
Our amended and restated bylaws designate the Georgia State-wide Business Court in the State of Georgia as the exclusive forum for certain litigation, which may limit our shareholders’ ability to choose a judicial forum for disputes with us.
Pursuant to our amended and restated bylaws, unless we consent in writing to the selection of an alternative forum, to the fullest extent permitted by law, the sole and exclusive forum for any shareholder (including a beneficial owner) to bring (a) any derivative action or proceeding brought on behalf of The Aaron's Company, (b) any action asserting a claim of breach of a fiduciary or legal duty owed by any current or former director, officer, employee, shareholder, or agent of The Aaron's Company to The Aaron's Company or The Aaron's Company shareholders, including a claim alleging the aiding and abetting of any such breach of fiduciary duty, (c) any action asserting a claim against the Company, its current or former directors, officers, team members, shareholders, or agents arising pursuant to any provision of the Georgia Business Code or our articles of incorporation or bylaws (as either may be amended from time to time), (d) any action asserting a claim against us, our current or former directors, officers, team members, shareholders, or agents governed by the internal affairs doctrine, or (e) any action against us, our current or former directors, officers, team members, shareholders, or agents asserting a claim identified in O.C.G.A. § 15-5A-3 shall be the Georgia State-wide Business Court. Our amended and restated bylaws also provide that, to the fullest extent permitted by law, if any action the subject matter of which is within the scope of the foregoing exclusive forum provisions is filed in a court other than the Georgia State-wide Business Court, such shareholder shall be deemed to have consented to (i) the personal jurisdiction of the Georgia State-wide Business Court in connection with any action brought in any such foreign court to enforce these exclusive forum provisions and (ii) having service of process made upon such shareholder in any such action by service upon such shareholder’s counsel in the foreign action as agent for such shareholder. Our amended and restated bylaws also provide that the foregoing exclusive forum provisions do not apply to any action asserting claims under the Exchange Act or the Securities Act. These exclusive forum provisions will require our shareholders to bring certain types of actions or proceedings in the Georgia State-wide Business Court in the State of Georgia and therefore may prevent our shareholders from bringing such actions or proceedings in another court that a shareholder may view as more convenient, cost-effective, or advantageous to the shareholder or the claims made in such action or proceeding, and may discourage the actions or proceedings covered by these exclusive forum provisions.
Certain provisions in our articles of incorporation and bylaws, and of Georgia law, may deter or delay an acquisition of us.
Our articles of incorporation and bylaws, and Georgia law, contain provisions that are intended to deter coercive takeover practices and inadequate takeover bids by making such practices or bids more expensive to the acquiror and to encourage prospective acquirors to negotiate with our Board rather than to attempt a hostile takeover. These provisions include rules regarding how shareholders may present proposals or nominate directors for election at shareholder meetings and the right of our Board to issue preferred stock without shareholder approval. Georgia law also imposes some restrictions on mergers and other business combinations between any holder of 10 percent or more of our outstanding common stock and us.
We believe that these provisions will help to protect our shareholders from coercive or otherwise unfair takeover tactics by requiring potential acquirers to negotiate with our Board and by providing our Board with more time to assess any acquisition proposal. These provisions are not intended to make us immune from takeovers. However, these provisions will apply even if the offer may be considered beneficial by some shareholders and could deter or delay an acquisition that our Board determines is not in our best interests or the best interests of our shareholders. Accordingly, in the event that our Board determines that a potential business combination transaction is not in the best interests of us and our shareholders but certain shareholders believe that such a transaction would be beneficial to us and our shareholders, such shareholders may elect to sell their shares in us and the trading price of the Company's common stock could decrease.
In addition, an acquisition or further issuance of our stock could trigger the application of Section 355(e) of the Code. Under the November 29, 2020 Tax Matters Agreement entered into in connection with the spin-off transaction, the Company would be required to indemnify PROG Holdings, Inc. for the resulting tax, and this indemnity obligation might discourage, delay or prevent a change of control that may be considered favorable.
Shareholders’ percentage of ownership in us may be diluted in the future.
In the future, shareholders' percentage ownership in us may be diluted because of equity issuances for acquisitions, capital market transactions or otherwise, including equity and stock-based awards that we will be granting to our directors, officers and
33
team members. Such awards have a dilutive effect on our earnings per share, which could adversely affect the market price of our common stock.
In addition, our amended and restated articles of incorporation allow us to issue, without approval of our shareholders, one or more classes or series of preferred stock having such designation, powers, preferences and relative, participating, optional and other special rights, including preferences over our common stock respecting dividends and distributions, as our Board generally may determine. The terms of one or more classes or series of preferred stock could dilute the voting power or reduce the value of our common stock. Similarly, the repurchase or redemption rights or liquidation preferences we could assign to holders of preferred stock could affect the residual value of our common stock.
General Risks
The success of our business is dependent on factors impacting consumer spending that are not under our control, including general economic conditions, and unfavorable economic conditions in the markets where we operate could result in increases in lease merchandise write-offs, among other things, which could materially and adversely affect our financial performance.
The success of our business is dependent on factors impacting consumer spending that are not under our control, including general economic conditions in the markets where we operate, such as levels of employment, consumer disposable income, rising interest rates, consumer debt and availability of credit, cost of food, energy, and housing and inflationary trends related thereto, recessions and fears of economic downturns, business disruptions due to political or economic instability, including global conflicts such as the Russia-Ukraine conflict and related economic sanctions and the conflict in Israel, Palestine and surrounding areas, domestic civil unrest, and consumer confidence in general, all of which are beyond our control. Unfavorable general economic conditions, due to any one or more of these or other factors, could cause our customers and potential customers to forego purchasing or leasing merchandise from us, or to decrease the amount of merchandise that they otherwise may purchase or lease from us, especially with respect to merchandise considered to be discretionary items. Such unfavorable economic conditions and their related impact on our customers’ confidence could result in lower lease renewal rates, fewer new leases being entered into, increases in product returns, decreases in collections, and increases in lease merchandise write-offs, which could materially and adversely affect our business and financial results, including our revenue and profitability.
The geographic concentration of our store locations may have an adverse impact on our financial performance due to economic downturns and severe weather events in regions where we have a high concentration of stores.
The concentration of our stores in certain regions or limited markets may expose us to increased risk of adverse economic developments compared to a more geographically diverse store portfolio. In addition, our store operators are subject to the effects of adverse acts of nature, such as winter storms, hurricanes, hail storms, strong winds, extreme heat, earthquakes and tornadoes. Such events have previously caused flooding and other damage, particularly in specific geographic areas, including in Florida and Texas, two of our large markets. In addition to the occurrence of natural disasters, acts of violence, terrorism or civil unrest could result in physical damage to our properties (some of which may be excluded from insurance coverage), the temporary closure of stores or distributions centers and/or temporary disruptions to our business. Such events may, depending upon their location and severity, unfavorably impact our business continuity.
Our current insurance program may expose us to unexpected costs, including casualty and accident-related self-insured losses, and negatively affect our financial performance.
Our insurance coverage is subject to deductibles, self-insured retentions, limits of liability, policy exclusions and the related terms and conditions underlying such policies, and similar provisions that we believe are prudent based on our overall operations. We may incur certain types of losses that we cannot insure or which we believe are not economically reasonable to insure, such as theft, damage or destruction of merchandise that is on-lease to our customers and not in our possession, and pandemic diseases. If we incur these losses and they are material, our business could suffer. Certain material events may result in sizable losses for the insurance industry and adversely impact the availability of adequate insurance coverage or result in excessive premium increases. To offset negative cost trends in the insurance market, we may elect to self-insure, accept higher deductibles or reduce the amount of coverage in response to these market changes. In addition, we self-insure a portion of expected losses under our workers’ compensation, general liability, and group health insurance programs. Unanticipated changes in any applicable actuarial assumptions and management estimates underlying our recorded liabilities for these self-insured losses, including potential increases in medical and indemnity costs, could result in significantly different expenses than expected under these programs, which could have an unfavorable effect on our financial condition and results of operations. Although we continue to maintain insurance for certain types of catastrophic events, including property loss and cybersecurity incidents, we are self-insured for losses up to the amount of our deductibles and self-insured retentions.
We are subject to sales, income and other taxes, which can vary by jurisdiction and be difficult and complex to calculate due to the nature of our business. A failure to correctly calculate and pay such taxes could result in substantial tax liabilities and a material adverse effect on our results of operations.
34
The application of indirect taxes, such as sales tax, is a complex and evolving issue. Many of the fundamental statutes and regulations that impose these taxes were established before the growth of the e-commerce industry and, therefore, in many cases it is not clear how existing statutes apply to us. In addition, governments are increasingly looking for ways to increase revenues, which has resulted in evolving interpretations of existing tax laws, discussions about tax reform and other legislative actions to increase tax revenues, including through indirect taxes. This also could result in other adverse changes in interpretations of existing sales, income and other tax regulations. For example, from time to time, some taxing authorities in the United States have notified us that they believe we owe them certain taxes imposed on transactions with our customers. Although these notifications have not resulted in material tax liabilities to date, there is a risk that one or more jurisdictions may be successful in the future, which could have a material adverse effect on our results of operations.
Employee misconduct could harm us by subjecting us to monetary loss, significant legal liability, regulatory scrutiny, and reputational harm.
Our reputation is critical to maintaining and developing relationships with our existing and potential customers and third parties with whom we do business. There is a risk that our team members could engage in misconduct that adversely affects our reputation and business, or fail to follow our compliance policies and procedures related to business operations, including with respect to lease originations and lease renewal and collections. For example, if one of our team members engages in discrimination or harassment in the workplace, or if an employee were to engage in, or be accused of engaging in, illegal or suspicious activities including fraud or theft of our customers’ information, we could suffer direct losses from the activity and, in addition, we could be subject to regulatory sanctions and suffer serious harm to our reputation, financial condition, customer relationships and ability to attract future customers. Employee misconduct could prompt regulators to allege or to determine based upon such misconduct that we have not established adequate supervisory systems and procedures to inform team members of applicable rules or to detect violations of such rules. The precautions that we take to prevent, detect, and remediate misconduct may not be effective in all cases. Misconduct by our team members who are directly or indirectly associated with our business, or even unsubstantiated allegations of misconduct, could result in a material adverse effect on our reputation and our business.
ITEM 1B. UNRESOLVED STAFF COMMENTS
None.
ITEM 1C. CYBERSECURITY
Risk Management and Strategy
As a part of the Company’s overall risk management and compliance programs, we have developed an enterprise cybersecurity program designed to identify, protect, detect, respond to and recover from cybersecurity and other data security threats. This enterprise cybersecurity program is based in-part on, and its maturity is measured using, the U.S. Department of Commerce’s National Institute of Standards and Technology (NIST) Cybersecurity Framework (CSF). Our enterprise cybersecurity program classifies potential threats by risk levels and we typically prioritize our threat mitigation efforts based on those risk classifications, while focusing on maintaining the resiliency of our systems. In recent years, we have increased our investments in our ability to identify, protect, detect, respond to and recover from cybersecurity and other data privacy risks within our environment. In the event we identify a potential cybersecurity, privacy or other data security issue, we have defined procedures for responding to such issues, including procedures that address when and how to engage with Company management, our Board of Directors, third-party advisors, other stakeholders and law enforcement when responding to such issues.
With respect to cybersecurity and other data privacy risks associated with third parties, the Aaron's Business has a Third Party Oversight Program that manages the risk of our third party relationships. We assess our vendors' compliance with applicable laws, regulations, and industry standards and negotiate appropriate contractual provisions to mitigate risk. We expect each of our vendors to appropriately manage its internal risks as well as risks the relationship poses to our Company.
We also understand the importance of collecting, storing, using, sharing and disposing of personal information in a manner that complies with all applicable laws. To facilitate compliance with those laws, we have privacy policies in place regarding our treatment of customer data in both our offline and online retail environments, as well as policies relating to the protection of employee and vendor data. Our policies provide explanations of the types of information we collect, how we use and share information, and generally describe the measures we take to protect the security of that information. Our policies also describe how customers may initiate inquiries and raise concerns regarding the collection, storage, sharing and use of their personal data. In addition, our team members also must complete mandatory training to understand the behaviors and technical requirements necessary to safeguard information resources at the Company.
Some of the other steps we have taken to detect, identify, classify and attempt to mitigate data security and privacy risks include:
35
•Establishing a new Cyber Incident Sub-Committee of the management level Disclosure Committee that is responsible for evaluating the Company’s disclosure obligations relating to matters of cybersecurity and related incidents.
•Adopting and periodically reviewing and updating information security and privacy policies and procedures;
•Conducting targeted audits and penetration tests throughout the year, using both internal and external resources;
•Conducting security maturity posture assessments, including engaging an industry-leading, nationally-known third party to independently evaluate our information security maturity on a regular basis;
•Utilizing technologies, processes, and capabilities designed to protect our systems and data and detect potential suspicious activity;
•Complying with the Payment Card Industry Data Security Standard;
•Adopting a vendor risk management program, which includes receiving the results of cybersecurity and data privacy audits conducted on certain vendors, classifying vendor, service provider or business partner risk based on several factors and evaluating and monitoring related risk mitigation efforts;
•Providing security and privacy training and awareness to all of our team members;
•Conducting periodic phishing simulations to test our team members’ responses to suspicious emails and to inform targeted cyber awareness training; and
•Maintaining cyber liability insurance.
We have experienced targeted and non-targeted cybersecurity attacks and incidents in the past that have resulted in unauthorized persons gaining access to our information systems, and we could in the future experience similar attacks. To date, no cybersecurity attack or incident, or any risk from cybersecurity threats, has materially affected or has been determined to be reasonably likely to materially affect the Company or our business strategy, results of operations, or financial condition. For additional information regarding the risks from cybersecurity threats we face, see the section captioned "Risks Relating to Our Business – Cyber-Security and Technology Risks" under Part I, Item 1A "Risk Factors" above.
Governance
Our Board of Directors recognizes the important role of information security and mitigating cybersecurity and other data security threats, as part of our efforts to protect and maintain the confidentiality and security of customer, employee and vendor information, as well as non-public information about our Company. Although our full Board of Directors has ultimate responsibility with respect to risk management oversight, the Audit Committee of our Board of Directors is charged with, among other matters, overseeing risks attendant to the identification and mitigation of cybersecurity risks.
As part of this risk oversight role, our full Board of Directors and the Audit Committee periodically receive reports from management, external professional advisors and others regarding various types of risks faced by the Company and the Company’s risk mitigation efforts related thereto, including cybersecurity risks and related mitigation efforts. The Board and the Audit Committee receive presentations from management regarding trends in cybersecurity risks and risk mitigation initiatives and plans, including briefings on recent and notable breaches at other companies and key takeaways and lessons learned that are applicable to our business. The Board and the Audit Committee also review key cybersecurity-related benchmarks for the Company. Furthermore, our Board of Directors and Audit Committee review our cybersecurity-related investments, initiatives and plans with management.
In addition, we have a dedicated team of employees overseeing our day-to-day cybersecurity and data privacy initiatives, led by our Chief Information Security Officer, in consultation with internal and external attorneys and other professional advisors. Our cybersecurity and data privacy employees have a vast background in cybersecurity, including prior relevant experience in government entities, network security, cybersecurity consulting firms, and a variety of industry standard certifications.
We also have an Enterprise Information Security Steering Committee (EISSC) comprised of a cross-functional group of senior executives and other team members that meets on a regular basis to provide oversight with respect to our cybersecurity and data privacy identification, protection, detection, response and recovery-related efforts. The EISSC and other senior personnel, including the Audit Committee and our Board of Directors, are informed of cybersecurity incidents as prescribed by the Company’s incident response plan and related processes, procedures, and standards.
Our internal audit function, along with external consultants, are also participants in our cybersecurity risk identification and analysis processes. Our Chief Information Security Officer regularly provides updates to the Audit Committee and to our Board of Directors regarding the status and effectiveness of our cybersecurity and data privacy programs.
36
ITEM 2. PROPERTIES
The Company leases retail store and warehouse space for most of its store-based operations, as well as corporate office space for store and e-commerce supporting functions, under operating leases expiring at various times through 2038. Most of the leases contain renewal options for additional periods ranging from one to 20 years or provide for options to purchase the related property at predetermined purchase prices that do not represent bargain purchase options. The Company also has leased properties for furniture manufacturing, fulfillment centers, and service centers across the U.S.
The typical layout for a Company-operated Aaron's store is a combination of showroom, customer service and warehouse space, generally comprising 6,000 to 15,000 square feet. Certain Company-operated Aaron's stores consist solely of a showroom. Below is a summary of our Aaron's Business Company-operated stores by location:
| Stores | Stores | ||||||||||
| Alaska | 2 | Mississippi | 27 | ||||||||
| Alabama | 30 | North Carolina | 62 | ||||||||
| Arkansas | 10 | New Hampshire | 5 | ||||||||
| Arizona | 25 | New Jersey | 9 | ||||||||
| California | 32 | New Mexico | 19 | ||||||||
| Colorado | 8 | Nevada | 5 | ||||||||
| Connecticut | 9 | New York | 31 | ||||||||
| Delaware | 1 | Ohio | 58 | ||||||||
| Florida | 76 | Oklahoma | 24 | ||||||||
| Georgia | 68 | Oregon | 20 | ||||||||
| Iowa | 1 | Pennsylvania | 34 | ||||||||
| Idaho | 7 | Rhode Island | 2 | ||||||||
| Illinois | 18 | South Carolina | 32 | ||||||||
| Indiana | 25 | Tennessee | 41 | ||||||||
| Kansas | 6 | Texas | 143 | ||||||||
| Kentucky | 6 | Utah | 2 | ||||||||
| Louisiana | 40 | Virginia | 34 | ||||||||
| Massachusetts | 13 | Vermont | 3 | ||||||||
| Maryland | 10 | Washington | 16 | ||||||||
| Maine | 7 | West Virginia | 1 | ||||||||
| Michigan | 27 | Wyoming | 1 | ||||||||
| Missouri | 13 | Canada | 16 | ||||||||
| Total Company-operated Aaron's Stores | 1,019 | ||||||||||
BrandsMart U.S.A. stores average approximately 96,000 square feet. Below is a summary of our BrandsMart U.S.A stores by location:
| Stores | |||||
| Florida | 8 | ||||
| Georgia | 3 | ||||
| Total BrandsMart U.S.A. Stores | 11 | ||||
Our principal executive office is located at 400 Galleria Parkway SE, Suite 300, Atlanta, Georgia 30339. Below is a list of our principal facilities that are operational as of December 31, 2023:
| LOCATION | SEGMENT, PRIMARY USE AND HOW HELD | SQ. FT. | ||||||
| Atlanta, Georgia | Executive/Administrative Offices – Leased | 74,000 | ||||||
| Ft. Lauderdale, Florida | Administrative Offices – Leased | 25,150 | ||||||
| Various properties in Cairo and Coolidge, Georgia | Furniture Manufacturing, Furniture Parts Warehouse, Administration and Showroom – Primarily Owned | 738,000 | ||||||
We believe that all of our facilities are well maintained and adequate for their current and reasonably foreseeable uses.
37
ITEM 3. LEGAL PROCEEDINGS
In Jacob Atkinson v. Aaron’s, LLC dba Aaron’s Sales & Lease Ownership, LLC, Civil Action No. 2:23-cv-01742-BJR (W.D. Wash.), filed on October 11, 2023, currently before the United States District Court for the Western District of Washington, plaintiff alleges that the Company violated Washington’s Equal Pay and Opportunity Act, RCW 49.58.110, because certain of the Company’s job postings did not include a wage scale or salary range. Because the statute is new, issues including standing, applicability as to who it covers, and the constitutionality of the statutory penalty have not been determined. Plaintiff seeks injunctive and declaratory relief and also seeks certification of a putative class. On January 22, 2024, the Company filed a motion to dismiss the lawsuit.
The assessment as to whether a loss is probable or reasonably possible, and as to whether such loss or a range of such losses is estimable, often involves significant judgment about future events, and the outcome of litigation is inherently uncertain. Other than as described above, there is no material pending or threatened litigation against the Company that remains outstanding as of December 31, 2023. For further information, see Note 10 in the accompanying consolidated financial statements under the heading "Legal Proceedings," which discussion is incorporated by reference in response to this Item 3.
ITEM 4. MINE SAFETY DISCLOSURES
Not applicable.
38
PART II
ITEM 5. MARKET FOR REGISTRANT'S COMMON EQUITY, RELATED STOCKHOLDER MATTERS AND ISSUER PURCHASES OF EQUITY
Market Information, Holders, and Dividends
The Aaron's Company, Inc. is listed on the NYSE under the symbol "AAN".
The number of shareholders of record of the Company's common stock at February 21, 2024 was 251.
Dividends will be payable only when, and if, declared by our Board and will be subject to our ongoing ability to generate sufficient income and free cash flow, any future capital needs and other contingencies. Under the Credit Facility (as defined in Note 8 of the accompanying consolidated financial statements), we may pay cash dividends in any year so long as, after giving pro forma effect to the dividend payment, we maintain compliance with our financial covenants and no event of default has occurred or would result from the payment.
Issuer Purchases of Equity Securities
The following table presents our share repurchase activity for the three months ended December 31, 2023:
| Period | Total Number of Shares Purchased | Average Price Paid per share | Total Number of Shares Purchased as Part of Publicly Announced Plans or Programs | Maximum Dollar Value of Shares that May Yet Be Purchased Under the Plans or Programs1 | ||||||||||
October 1, 2023 through October 31, 2023 | — | $ | — | — | $ | 127,033,496 | ||||||||
November 1, 2023 through November 30, 2023 | 1,945 | 8.07 | 1,945 | 127,017,800 | ||||||||||
December 1, 2023 through December 31, 2023 | — | — | — | 127,017,800 | ||||||||||
| Total | 1,945 | 1,945 | ||||||||||||
1 Share repurchases are conducted under authorizations made from time to time by our Board. The most recent authorization was publicly announced on March 2, 2022, which increased the Company's share repurchase authorization amount to $250.0 million from the previous authorized amount of $150.0 million, and extended the maturity date by one year to December 31, 2024. Subject to the terms of our Board's authorization and applicable law, repurchases may be made at such times and in such amounts as the Company deems appropriate through December 31, 2024. Repurchases may be discontinued at any time.
39
Performance Graph
Comparison of 37 Month Cumulative Total Return*
Among The Aaron's Company, Inc., the S&P Smallcap 600 Index, and the S&P 600 Specialty Retail Index
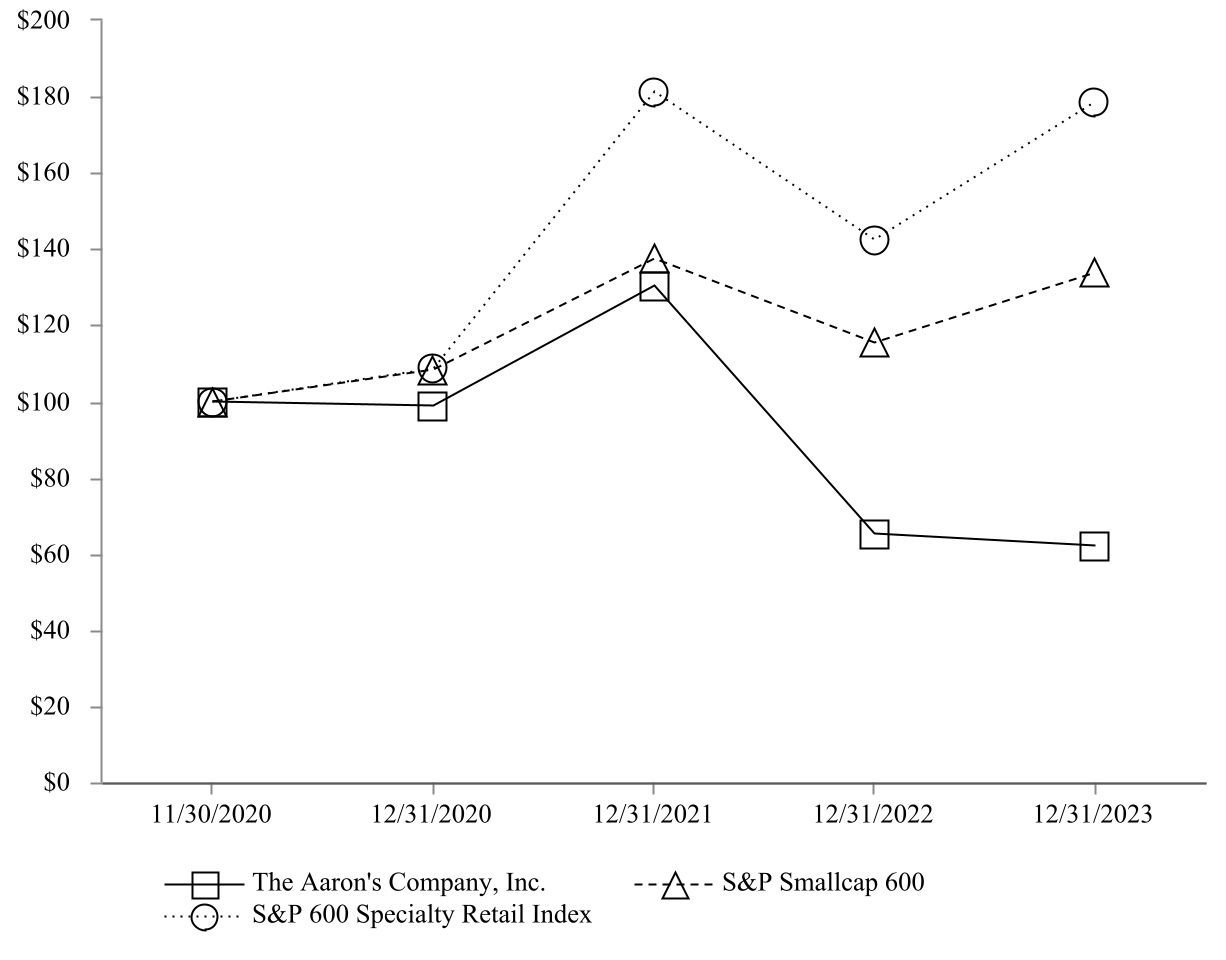
*$100 invested on 11/30/2020 in stock or index, including reinvestment of dividends for the fiscal period ending December 31, 2023.
The line graph above and the table below compare, for the period immediately after the separation and distribution date (as described in the 2022 Annual Report) through the remainder of the fiscal year ending December 31, 2020 and the fiscal years ending December 31, 2021, December 31, 2022 and December 31, 2023, the dollar change in the cumulative total shareholder returns (assuming reinvestment of dividends) on the Company's common stock with that of the S&P Smallcap 600 Index and the S&P 600 Specialty Retail Index. We regularly evaluate our Peer Group Indexes to ensure each is reflective of our Company's business operations and characteristics. Prior to 2022, the Company's Peer Group indexes consisted of the S&P Smallcap 600 Index and the S&P 600 Retailing Index. During the year ended December 31, 2022, management elected to update the indexes for the Company's Peer Group to include the S&P 600 Specialty Retail Index, as it was determined to better align with the Company for benchmarking and performance incentive purposes.
| 11/30/2020 | 12/31/2020 | 12/31/2021 | 12/31/2022 | 12/31/2023 | |||||||||||||
| The Aaron's Company, Inc. | $ | 100.00 | $ | 98.80 | $ | 130.33 | $ | 65.13 | $ | 62.03 | |||||||
| S&P Smallcap 600 | 100.00 | 108.32 | 137.37 | 115.26 | $ | 133.76 | |||||||||||
| S&P 600 Specialty Retail Index | 100.00 | 108.42 | 181.12 | 142.31 | $ | 178.66 | |||||||||||
ITEM 6. [RESERVED]
Not applicable.
40
MANAGEMENT’S DISCUSSION AND ANALYSIS OF FINANCIAL CONDITION AND RESULTS OF OPERATIONS
The following Management's Discussion and Analysis ("MD&A") should be read in conjunction with other documents filed by The Aaron's Company, Inc. ("the Company") with the Securities and Exchange Commission (the "SEC") and the audited Consolidated Financial Statements and corresponding notes thereto included in Item 8 of this Annual Report on Form 10-K. A review of the Company’s fiscal 2023 performance compared to fiscal 2022 appears below under "Results of Operations," "Overview of Financial Position," and "Liquidity and Capital Resources." A review of the Company’s fiscal 2022 performance compared to fiscal 2021 can be found in Item 7 of the Company's Annual Report on Form 10-K for the year ended December 31, 2022, filed with the SEC on March 1, 2023, which is hereby incorporated by reference.
This MD&A contains forward-looking statements and the matters discussed in these forward-looking statements are subject to risk, uncertainties, and other factors that could cause actual results to differ materially from those made, projected or implied in the forward-looking statements. Please see "Risk Factors" and "Cautionary Statement Concerning Forward-Looking Statements" for a discussion of the uncertainties, risks, and assumptions associated with these statements included in Item 1A of this Annual Report on Form 10-K.
Business Overview
The Company is a leading, technology-enabled, omni-channel provider of lease-to-own ("LTO") and retail purchase solutions of furniture, appliances, electronics, and other home goods across its brands: Aaron's, BrandsMart U.S.A., BrandsMart Leasing, and Woodhaven Furniture Industries ("Woodhaven").
As of December 31, 2023, the Company's operating and reportable segments are the Aaron's Business and BrandsMart, each as described below.
The Aaron's Business segment is comprised of (i) Aaron's branded Company-operated and franchise operated stores; (ii) its e-commerce platform ("aarons.com"); (iii) Woodhaven; and (iv) BrandsMart Leasing (collectively, the "Aaron’s Business").
The operations of BrandsMart U.S.A. (excluding BrandsMart Leasing) comprise the BrandsMart segment (collectively, "BrandsMart").
Aaron's Business Segment
Since its founding in 1955, Aaron's has been committed to serving the overlooked and underserved customer with a dedication to inclusion and improving the communities in which it operates. Through a portfolio of approximately 1,240 stores and its aarons.com e-commerce platform, Aaron's, together with its franchisees, provide consumers with LTO and retail purchase solutions for the products they need and want, with a focus on providing its customers with unparalleled customer service, high approval rates, lease plan flexibility, and an attractive value proposition, including competitive monthly payments and total cost of ownership, as compared to other LTO providers.
Woodhaven manufactures and supplies a significant portion of the upholstered furniture leased and sold in Company-operated and franchised Aaron's stores.
Launched in 2022, BrandsMart Leasing offers LTO purchase solutions to customers of BrandsMart U.S.A.
BrandsMart Segment
Founded in 1977, BrandsMart U.S.A. is one of the leading appliance and consumer electronics retailers in the southeast United States and one of the largest appliance retailers in the country with 11 stores in Florida and Georgia and a growing e-commerce presence on brandsmartusa.com.
BrandsMart U.S.A. Acquisition
On April 1, 2022, the Company completed the previously announced transaction to acquire a 100% ownership of Interbond Corporation of America, doing business as BrandsMart U.S.A. The Company paid total consideration of $230 million in cash under the terms of the agreement and additional amounts for working capital adjustments and transaction related fees. Consideration transferred also included the off-market value associated with certain operating leases entered into in
conjunction with the transaction. The results of BrandsMart, which is presented as a separate reportable segment, have been included in the Company's consolidated results from the April 1, 2022 acquisition date.
Management believes that the BrandsMart U.S.A. acquisition will strengthen the Company's ability to deliver on its mission of enhancing people’s lives by providing easy access to high quality furniture, appliances, electronics, and other home goods through affordable lease to own and retail purchase options. Management also believes that value creation opportunities include leveraging the Company's lease-to-own expertise to provide BrandsMart U.S.A.'s customers enhanced payment options and offering a wider selection of products to millions of Aaron’s customers, as well as generating procurement savings and other cost synergies.
41
Multi-Year Strategic Plan
Our management team is committed to executing against the following multi-year strategic priorities to further transform and grow the overall business:
•Transform the Aaron's Business
•Promote our Value Proposition to Retain and Attract New Customers to our Brand – We continue to invest in e-commerce, innovative marketing campaigns, and our lease decisioning and digital platforms to illustrate our value proposition to new and existing customers. Such initiatives and investments include:
◦Making investments to drive growth and consumer traffic through our e-commerce customer acquisition channel by investing in enhancements that provide a fully transactional, mobile, and seamless shopping experience that includes broader product selections, all of which are intended to attract new and younger customers.
◦Utilizing a broad spectrum of traditional and digital marketing communications in both English and Spanish, ranging from direct mail, social media, display, and local market media, all allowing us to customize messages around price, value, and payment flexibility. The Company is also increasing its local marketing and promotions focus on weekly payment offerings to attract more customers and gain market share.
◦Continuing investments in lease decisioning and other digital platforms that allow us to optimize lease portfolio performance and lease renewal rate through analytics, machine learning, and operational practices. Other digital investments, aimed at enhancing the customer's experience and improving customer payment activity, include digital payment and servicing platforms.
•Align the Aaron's Store Footprint to our Customer Opportunity – We continue to invest in our market strategy capabilities to make better-informed, evidence-driven decisions around store location and the optimization of operating expenses. We regularly review our Aaron's real estate portfolio, which we expect will increase profitability through repositioning, remodeling, and consolidating our existing stores via our next-generation store concept ("GenNext"). The GenNext store concept features include larger showrooms and/or re-engineered store layouts, updated signage, expanded product assortment, enhanced technology-enabled shopping and checkout, and an innovative operating model. We have also enhanced our market optimization strategy with a new "Hub and Showroom" model which leverages existing infrastructure to more efficiently serve markets by combining servicing capabilities of multiple stores into a "hub" store while converting other nearby stores into "showrooms" that focus exclusively on sales activities.
We expect that our market optimization program, together with our aarons.com e-commerce platform and increased use of technology to better serve our customers, will continue to enable us to reduce store operating costs and lower working capital requirements while better serving our existing markets, and attracting new customers through expansion into new markets in the future. As of December 31, 2023, we have 254 GenNext stores in our portfolio with plans to open up to an additional 20 GenNext concept stores and 10 showrooms during 2024.
•Enhance and Grow BrandsMart
•Grow Addressable Market - The acquisition of BrandsMart U.S.A. broadens our customer reach and significantly expands our total addressable market. Our BrandsMart growth initiatives include:
◦Capturing share in adjacent geographic markets by opening new BrandsMart stores. In 2023, we opened one new store, and we expect to open 1-2 new stores each year going forward.
◦Making investments to drive growth and customer traffic by investing in enhanced customer payment and financing programs, improved online shopping experience, enhanced digital marketing strategies, and expanded product selection.
•Achieve Transaction Synergies - We continue to make progress in executing our synergy initiatives in connection with the acquisition of BrandsMart U.SA. in order to drive meaningful value-creation opportunities for the business.
•Enterprise Initiatives
•Strengthen Operational Efficiencies and Optimize Cost Structure - During the third quarter of 2022, the Company initiated an operational efficiency and optimization restructuring program intended to reduce the Company’s overall costs. This program includes the optimization of store support center functions, multi-unit
42
store oversight, store labor and operations, supply chain, the expansion of the Hub and Showroom model, as well as other reductions in real estate and third party spend. Management believes that implementing this program will help the Company optimize its cost profile, allocate capital resources towards long-term strategic objectives, and generate incremental value for shareholders.
•Further environmental, social, and governance initiatives ("ESG") - We continue to invest in building a people-focused workplace culture and in opportunities to make a positive impact on the environment and the communities where our customers and team members live and work. To do this, we continued to enhance our compliance, enterprise risk management, corporate governance, diversity and inclusion, and environmental management programs and have developed roadmaps for continuing to enhance these programs in 2024 and beyond.
Restructuring Programs
As management continues to execute on its long-term strategic plan, additional benefits and charges are expected to result from our restructuring programs. The extent of any future charges related to our restructuring programs are not currently estimable and depend on various factors including the timing and scope of future cost optimization initiatives.
Real Estate Repositioning and Optimization Restructuring Program
During the first quarter of 2020, the Company initiated a real estate repositioning and optimization program to optimize our Company-operated Aaron's store portfolio via our GenNext store concept, which features larger showrooms and/or re-engineered store layouts, increased product selection, technology-enabled shopping and checkout, and a refined operating model. We expect that this strategy, together with our aarons.com e-commerce platform and increased use of technology to better serve our customers, will enable us to reduce store operating costs while continuing to better serve our existing markets, as well as attract new customers and expand into new markets in the future.
Since initiation, the program has resulted in the closure, consolidation or relocation of a total of 250 Company-operated Aaron's stores through 2023. This program also resulted in the closure of one administrative store support building and a further rationalization of our store support center staff, which included a reduction in employee headcount in those areas to more closely align with current business conditions.
During 2023, the Company opened 43 new GenNext locations. Combined with the 211 locations open at the beginning of the year, total GenNext stores contributed 29.7% of total lease revenues and fees and retail revenues for the Aaron's Business segment in 2023. As of December 31, 2023, we have identified approximately 12 remaining stores for closure, consolidation, or relocation that have not yet been closed and vacated, which are generally expected to close in 2024. We will continue to evaluate our Company-operated Aaron's store portfolio to determine how to best rationalize and reposition our store base to better align with marketplace demand.
While not all specific locations have been identified under the real estate repositioning and optimization restructuring program, the Company's current strategic plan is to remodel, reposition and consolidate our Company-operated Aaron's store footprint over the next two to three years. We believe that such strategic actions will allow the Company to continue to successfully serve our markets while continuing to utilize our growing aarons.com shopping and servicing platform. Management expects that this strategy, along with our increased use of technology, will enable us to reduce store count while retaining a significant portion of our existing customer relationships and attract new customers.
43
Since inception of the real estate repositioning and optimization program, the Company has incurred charges of $70.8 million under the plan. These cumulative charges are primarily comprised of operating lease right-of-use asset and fixed impairment charges, losses recognized related to contractual lease obligations, and severance related to reductions in store support center and field support staff headcount. We expect future restructuring expenses (reversals) due to potential future early buyouts of leases with landlords, as well as continuing variable occupancy costs related to closed stores.
Operational Efficiency and Optimization Restructuring Program
During the third quarter of 2022, the Company initiated an operational efficiency and optimization restructuring program intended to reduce the Company’s overall costs. Management believes that implementing this restructuring program will help the Company sharpen its operational focus, optimize its cost profile, allocate capital resources towards long-term strategic objectives, and generate incremental value for shareholders through investments in technological capabilities, and fulfillment center and logistics competencies. The program resulted in the closure or consolidation of 38 Company-operated Aaron's stores during the year ended December 31, 2023. This program also includes the Hub and Showroom model to optimize labor in markets, store labor realignments, optimization of the Company's supply chain, the centralization and optimization of store support center, operations, and multi-unit store oversight functions, as well as other real estate and third party spend costs reductions.
Total net restructuring expenses under the Operational Efficiency and Optimization Restructuring Program related to the initiatives described above were $6.4 million during the year ended December 31, 2023. Such expenses were recorded within the Unallocated Corporate category for segment reporting and were comprised mainly of professional advisory fees, severance, operating lease right-of-use asset impairment charges, fixed asset impairment charges and continuing variable occupancy costs incurred related to closed stores. Management expects future restructuring expenses (reversals) due to potential early buyouts of leases with landlords, as well as continuing variable occupancy costs related to closed stores.
In January 2024, the Company completed a headcount reduction of its store support center to more closely align with current business conditions resulting in the recognition of $2.1 million in severance charges. Additional cost saving initiatives are planned to improve earnings in 2024 and later years.
Operating Segment Performance
As discussed above, the Company conducts its operations through two primary operating business segments: the Aaron’s Business and BrandsMart. Effective April 1, 2022, the Company changed its composition of reportable segments to align the reportable segments with the current organizational structure, which includes separate segments for the Aaron's Business and BrandsMart, along with an Unallocated Corporate category for remaining unallocated costs including equity-based compensation, interest income and expense, information security, executive compensation, legal and compliance, corporate governance, accounting and finance, human resources and other corporate functions. The Unallocated Corporate category also includes acquisition-related costs, restructuring charges, goodwill impairment charges, and separation costs for which the individual operating segments are not being evaluated.
The Company evaluates segment performance based primarily on revenues and earnings (loss) from operations before unallocated corporate costs, which are evaluated on a consolidated basis and not allocated to the Company's business segments. Intersegment sales between BrandsMart and the Aaron's Business pertaining to BrandsMart Leasing, are completed at retail prices. Since the intersegment profit affects cost of goods sold, depreciation and lease merchandise valuation, they are adjusted when intersegment profit is eliminated in consolidation.
The Company has retroactively adjusted, for all periods presented, its segment disclosures to align with the current composition of reportable segments. The discussion of the results of operations for segment performance measures within the "Segment Performance" sections throughout this Management's Discussion and Analysis do not include unallocated corporate expenses.
Fiscal Year 2023 Highlights
We have been actively monitoring the impact of the current challenging macroeconomic environment, including inflation, rising interest rates, the slowing of consumer demand, labor shortages, and business disruptions due to political or economic instability, including global conflicts such as the Russia-Ukraine conflict and related economic sanctions and the conflict in Israel, Palestine and surrounding areas, on all aspects of our business. We anticipate that demanding market conditions, including reduced consumer demand and elevated levels of inflation, will continue throughout 2024 and beyond. We anticipate that these headwinds will be partially mitigated by our cost cutting and real estate repositioning and optimization strategies further described above.
The following summarizes significant highlights from the year ended December 31, 2023:
•Consolidated revenues were $2.14 billion in 2023 compared to $2.25 billion in 2022, a decrease of 4.9%. This decrease is primarily due to a year over year decline in the Aaron's Business segment of $157.0 million, partially offset by a full-year inclusion of BrandsMart in the Company's consolidated results.
44
•Total revenues for the Aaron's Business were $1.55 billion in 2023 compared to $1.70 billion in 2022, a decrease of 9.2%. This decrease is primarily driven by a lower lease portfolio size throughout the year, as well as a lower exercise of early purchase options and lower retail and non-retail sales.
•The lease portfolio size, excluding BrandsMart Leasing, began 2023 at $126.5 million, down 7.2% compared to the beginning of 2022, and ended 2023 at $117.7 million, down 7.0% compared to the end of 2022.
•E-commerce revenues, increased 6.6% at the Aaron's Business and by 2.9% at BrandsMart during the year ended December 31, 2023.
•During the year ended December 31, 2023, the Company opened 43 new GenNext locations. Combined with the 211 locations open at the beginning of the year, total GenNext stores contributed 29.7% of total lease and retail revenues for the Aaron's Business during the year ended December 31, 2023.
•The loss before income taxes was $1.1 million during the year ended December 31, 2023 and was negatively impacted by restructuring charges of $15.6 million, BrandsMart U.S.A. acquisition-related costs of $3.6 million, and acquisition-related intangible amortization expense of $10.3 million.
•Diluted earnings per share for the year ended December 31, 2023 were $0.09 compared with diluted losses per share of $0.17 in 2022.
•The Company repurchased 608,007 shares of common stock for $6.5 million during the year ended December 31, 2023.
Key Performance Metrics
The following table presents store activity by ownership type:
| 2023 | 2022 | 2021 | |||||||||||||||
Company-operated Aaron's Stores1 | |||||||||||||||||
| Company-operated Aaron's stores open at January 1, | 1,034 | 1,074 | 1,092 | ||||||||||||||
| Opened | — | — | — | ||||||||||||||
| Added through acquisition | — | — | 11 | ||||||||||||||
| Closed, sold or merged | (15) | (40) | (29) | ||||||||||||||
| Company-operated Aaron's stores open at December 31, | 1,019 | 1,034 | 1,074 | ||||||||||||||
| GenNext (included in Company-Operated) | 254 | 211 | 116 | ||||||||||||||
| Franchised Aaron's Stores | |||||||||||||||||
| Franchised Aaron's stores open at January 1, | 232 | 236 | 248 | ||||||||||||||
| Purchased by the Company | — | — | (11) | ||||||||||||||
| Closed, sold or merged | (8) | (4) | (1) | ||||||||||||||
| Franchised Aaron's stores open at December 31, | 224 | 232 | 236 | ||||||||||||||
BrandsMart U.S.A. Stores2 | |||||||||||||||||
| BrandsMart U.S.A. stores open at January 1, | 10 | — | — | ||||||||||||||
| Purchased by the Company | — | 10 | — | ||||||||||||||
Opened following the acquisition | 1 | — | — | ||||||||||||||
| BrandsMart U.S.A. stores open at December 31, | 11 | 10 | — | ||||||||||||||
1 The typical layout for a Company-operated Aaron's store is a combination of showroom, customer service and warehouse space, generally comprising 6,000 to 15,000 square feet. Certain Company-operated Aaron's stores consist solely of a showroom.
2 BrandsMart U.S.A. stores average approximately 96,000 square feet and have been included in this table subsequent to the acquisition date of April 1, 2022.
The following table presents Company-operated Aaron's stores by type:
45
Company-operated Aaron's Store Types as of December 31, 2023 | GenNext | Legacy | Total | ||||||||
| Store | 186 | 605 | 791 | ||||||||
| Hub | 58 | 56 | 114 | ||||||||
| Showroom | 10 | 104 | 114 | ||||||||
| Total | 254 | 765 | 1,019 | ||||||||
Aaron's Business
Lease Portfolio Size. Our lease portfolio size for the Aaron's Business, excluding BrandsMart Leasing, represents the total balance of collectible lease payments for the next month derived from our aggregate outstanding customer lease agreements at a point in time. As of the end of any month, the lease portfolio size is calculated as the lease portfolio size at the beginning of the period plus collectible lease payments for the next month derived from new lease agreements originated in the period less the reduction in collectible lease payments for the next month primarily as a result of customer agreements that reach full ownership, customer early purchase option exercises, lease merchandise returns, and write-offs. Lease portfolio size provides management insight into expected future collectible lease payments. The Company ended the fourth quarter of 2023 with a lease portfolio size for all Company-operated Aaron's stores of $117.7 million, a decrease of 7.0% compared to the lease portfolio size as of December 31, 2022.
Lease Renewal Rate. Our lease renewal rate for the Aaron's Business, excluding BrandsMart Leasing, for any given period represents the weighted average of the monthly lease renewal rates for each month in the period. The monthly lease renewal rate for any month is calculated by dividing (i) the lease revenues collected or renewed related to leased merchandise for such month by (ii) the lease portfolio size as of the beginning of such month. The lease renewal rate provides management insight into the Company's success in retaining current customers within our customer lease portfolio over a given period and provides visibility into expected future customer lease payments and the related lease revenue. The lease renewal rate for 2023 was 87.1%, compared to 87.5% for 2022.
BrandsMart
Comparable Sales. We believe that changes in comparable sales is a key performance indicator for the BrandsMart operating segment as it provides management insight into the performance of existing stores and e-commerce business by measuring the change in sales for a particular period over the comparable prior period. Comparable sales includes retail sales generated at BrandsMart stores (including retail sales to BrandsMart Leasing), e-commerce sales initiated on the website or app, warranty revenue, gift card breakage, and sales of merchandise to wholesalers and dealers, as applicable. Comparable sales excludes service center related revenues.
Comparable sales for the year ended December 31, 2023 have not been provided, as a comparable period was not included in the prior period consolidated results as of December 31, 2022, due to the completion of the BrandsMart acquisition on April 1, 2022.
Key Components of Loss Before Income Taxes
In this management’s discussion and analysis section, we review our consolidated results. The financial statements for the year ended December 31, 2023 and comparable prior year period are consolidated financial statements of the Company and its wholly-owned subsidiaries, and are based on the financial position and results of operations of the Company. The results of BrandsMart, which is presented as a separate reportable segment, have been included in the Company's consolidated results from the April 1, 2022 acquisition date.
For the year ended December 31, 2023 and the comparable prior year period, some of the key revenue, cost and expense items that affected loss before income taxes were as follows:
Revenues. We separate our total revenues into four components: (a) lease revenues and fees; (b) retail sales; (c) non-retail sales; and (d) franchise royalties and other revenues. Lease revenues and fees primarily include all revenues derived from lease agreements at both our Aaron's and BrandsMart Leasing brands and fees from our Aaron's Club program. Lease revenues and fees are recorded net of a provision for uncollectible accounts receivable related to lease renewal payments from lease agreements with customers. Retail sales primarily include the sale of merchandise inventories from our BrandsMart operations and the related warranty revenues, as well as the sale of both new and pre-leased merchandise from our Company-operated Aaron's stores. Non-retail sales primarily represent new merchandise sales to our Aaron's franchisees and, to a lesser extent, sales of Woodhaven manufactured products to third-party retailers. Franchise royalties and other revenues primarily represent fees from the sale of franchise rights and royalty payments from franchisees, as well as other related income from our franchised stores. Franchise royalties and other revenues also include revenues from leasing Company-owned real estate properties to unrelated third parties, as well as other miscellaneous revenues.
46
Depreciation of Lease Merchandise and Other Lease Revenue Costs. Depreciation of lease merchandise and other lease revenue costs is comprised of the depreciation expense associated with depreciating merchandise held for lease and leased to customers by our Company-operated Aaron's stores, aarons.com and BrandsMart Leasing, as well as the costs associated with the Aaron's Club program.
Retail Cost of Sales. Retail cost of sales includes cost of merchandise inventories sold through our BrandsMart U.S.A. stores and the depreciated cost of merchandise sold through our Company-operated Aaron's stores. Retail cost of sales for the BrandsMart segment during the year ended December 31, 2022 includes a one-time $23.1 million non-cash charge for a fair value adjustment to the acquired merchandise inventories.
Non-Retail Cost of Sales. Non-retail cost of sales primarily represents the cost of merchandise sold to our Aaron's franchisees and, to a lesser extent, the cost of Woodhaven's manufactured products sold to third-party retailers.
Personnel Costs. Personnel costs represents total compensation costs incurred for services provided by team members of the Company with the exception of compensation costs that are eligible for capitalization.
Other Operating Expenses, Net. Other operating expenses, net includes occupancy costs (including rent expense, store maintenance and depreciation expense related to non-manufacturing facilities), shipping and handling, advertising and marketing, intangible asset amortization expense, professional services expense, bank and credit card related fees and other miscellaneous expenses. Other operating expenses, net also includes gains or losses on sales of Company-operated stores and delivery vehicles, fair value adjustments on assets held for sale and gains or losses on other transactions involving property, plant and equipment. Other operating expenses, net excludes costs that have been capitalized or that are a component of the Company's restructuring programs.
Provision for Lease Merchandise Write-offs. Provision for lease merchandise write-offs represents charges incurred related to estimated and actual lease merchandise write-offs.
Restructuring Expenses, Net. Restructuring expenses, net are comprised principally of closed store operating lease right-of-use asset impairment and operating lease charges, fixed asset impairment charges, professional advisory fees, and expenses related to workforce reductions. Such costs are recorded within the Unallocated Corporate category of segment reporting. Refer to Note 11 of the accompanying consolidated financial statements for further discussion of restructuring expenses, net.
Impairment of Goodwill. Impairment of goodwill is the full write-off of the goodwill balance at the Aaron's Business reporting unit that occurred during the year ended December 31, 2022. Refer to Note 3 of the accompanying consolidated financial statements for further discussion of the interim goodwill impairment assessment and the resulting impairment charge. This impairment charge was recorded within the Unallocated Corporate category of segment reporting.
Separation Costs. Separation costs represent employee-related expenses associated with the 2020 spin-off transaction, including employee-related costs, incremental stock-based compensation expense associated with the conversion and modification of unvested and unexercised equity awards and other one-time expenses incurred by the Company to operate as an independent, standalone public entity. Such costs are recorded within the Unallocated Corporate category of segment reporting.
Acquisition-Related Costs. Acquisition-related costs primarily represent third-party consulting, banking and legal expenses associated with the acquisition of BrandsMart U.S.A. in April 2022. Such costs are recorded within the Unallocated Corporate category of segment reporting.
Interest Expense. Interest expense consists primarily of interest on the Company's variable rate borrowings, commitment fees on unused balances of the Credit Facility (as defined below), as well as the amortization of debt issuance costs. Such costs are recorded within the Unallocated Corporate category of segment reporting.
Other Non-Operating Income (Expense), Net. Other non-operating income (expense), net includes the impact of foreign currency remeasurement, as well as gains and losses resulting from changes in the cash surrender value of Company-owned life insurance related to the Company’s deferred compensation plan. This activity also includes earnings on cash and cash equivalent investments.
47
Consolidated Results of Operations – Years Ended December 31, 2023 and 2022
The results of BrandsMart, which is presented as a separate reportable segment, have been included in the Company's consolidated results from the April 1, 2022 acquisition date.
| Change | |||||||||||||||||||||||
| Year Ended December 31, | 2023 vs. 2022 | ||||||||||||||||||||||
| (In Thousands) | 2023 | 2022 | $ | % | |||||||||||||||||||
| REVENUES: | |||||||||||||||||||||||
| Lease Revenues and Fees | $ | 1,399,514 | $ | 1,529,125 | $ | (129,611) | (8.5) | % | |||||||||||||||
| Retail Sales | 620,665 | 585,624 | 35,041 | 6.0 | |||||||||||||||||||
| Non-Retail Sales | 96,710 | 110,531 | (13,821) | (12.5) | |||||||||||||||||||
Franchise Royalties and Other Revenues | 23,001 | 24,154 | (1,153) | (4.8) | |||||||||||||||||||
| 2,139,890 | 2,249,434 | (109,544) | (4.9) | ||||||||||||||||||||
| COSTS OF REVENUES: | |||||||||||||||||||||||
| Depreciation of Lease Merchandise and Other Lease Revenue Costs | 466,648 | 513,659 | (47,011) | (9.2) | |||||||||||||||||||
| Retail Cost of Sales | 471,946 | 474,879 | (2,933) | (0.6) | |||||||||||||||||||
| Non-Retail Cost of Sales | 81,977 | 99,123 | (17,146) | (17.3) | |||||||||||||||||||
| 1,020,571 | 1,087,661 | (67,090) | (6.2) | ||||||||||||||||||||
| GROSS PROFIT | 1,119,319 | 1,161,773 | (42,454) | (3.7) | |||||||||||||||||||
| Gross Profit % | 52.3% | 51.6% | |||||||||||||||||||||
| OPERATING EXPENSES: | |||||||||||||||||||||||
| Personnel Costs | 507,819 | 515,144 | (7,325) | (1.4) | |||||||||||||||||||
| Other Operating Expenses, Net | 498,019 | 490,143 | 7,876 | 1.6 | |||||||||||||||||||
| Provision for Lease Merchandise Write-Offs | 81,495 | 97,564 | (16,069) | (16.5) | |||||||||||||||||||
Restructuring Expenses, Net | 15,597 | 32,717 | (17,120) | (52.3) | |||||||||||||||||||
| Impairment of Goodwill | — | 12,933 | (12,933) | (100.0) | |||||||||||||||||||
| Separation Costs | 201 | 1,204 | (1,003) | (83.3) | |||||||||||||||||||
| Acquisition-Related Costs | 3,638 | 14,616 | (10,978) | (75.1) | |||||||||||||||||||
| 1,106,769 | 1,164,321 | (57,552) | (4.9) | ||||||||||||||||||||
OPERATING PROFIT (LOSS) | 12,550 | (2,548) | 15,098 | nmf | |||||||||||||||||||
| Interest Expense | (15,512) | (9,875) | 5,637 | 57.1 | |||||||||||||||||||
| Other Non-Operating Income (Expense), Net | 1,904 | (2,320) | 4,224 | nmf | |||||||||||||||||||
LOSS BEFORE INCOME TAXES | (1,058) | (14,743) | 13,685 | 92.8 | |||||||||||||||||||
INCOME TAX BENEFIT | (3,881) | (9,463) | (5,582) | (59.0) | |||||||||||||||||||
NET EARNINGS (LOSS) | $ | 2,823 | $ | (5,280) | $ | 8,103 | nmf | ||||||||||||||||
nmf—Calculation is not meaningful
48
Revenues. Total consolidated revenues were $2.14 billion during the year ended December 31, 2023, a $109.5 million decrease compared to the year ended December 31, 2022. This decrease was primarily due to a $157.0 million decrease in revenues at the Aaron's Business segment during the year ended December 31, 2023, as further discussed in the "Segment Performance" section below. This decrease was partially offset by full year results from the BrandsMart segment in 2023.
Gross Profit. Consolidated gross profit for the Company was $1.12 billion during the year ended December 31, 2023, a $42.5 million decrease compared to the prior year period. This decrease was primarily driven by an $84.7 million decrease in gross profit at the Aaron's Business segment during the year ended December 31, 2023, as further discussed in the "Segment Performance" section below. This decrease was partially offset by full year results from the BrandsMart segment in 2023. Gross profit for the BrandsMart segment during 2022 includes a one-time $23.1 million non-cash charge for a fair value adjustment to the acquired merchandise inventories.
As a percentage of total consolidated revenues, consolidated gross profit increased to 52.3% during 2023 compared to 51.6% in 2022 primarily due to higher gross profit margin on non-retail sales in the Aaron's Business segment and the non-cash charge in the BrandsMart segment mentioned above.
Personnel Costs. Personnel costs decreased by $7.3 million due primarily to the optimization of store labor, store support, and operational oversight functions at both business segments, partially offset by an increase in incentive based compensation and the BrandsMart segment contributing a full year of personnel cost expense in 2023.
Other Operating Expenses, Net. Information about certain significant components of other operating expenses, net for the consolidated Company is as follows:
| Change | |||||||||||||||||||||||
| Year Ended December 31, | 2023 vs. 2022 | ||||||||||||||||||||||
| (In Thousands) | 2023 | 2022 | $ | % | |||||||||||||||||||
| Occupancy Costs | $ | 226,526 | $ | 215,431 | $ | 11,095 | 5.2 | % | |||||||||||||||
| Other Miscellaneous Expenses, net | 115,021 | 119,599 | (4,578) | (3.8) | |||||||||||||||||||
| Shipping and Handling | 64,126 | 70,144 | (6,018) | (8.6) | |||||||||||||||||||
| Advertising Costs | 41,361 | 39,121 | 2,240 | 5.7 | |||||||||||||||||||
| Bank and Credit Card Related Fees | 33,382 | 31,081 | 2,301 | 7.4 | |||||||||||||||||||
| Professional Services | 16,351 | 17,102 | (751) | (4.4) | |||||||||||||||||||
| Intangible Amortization | 10,348 | 9,330 | 1,018 | 10.9 | |||||||||||||||||||
| Gains on Dispositions of Store-Related Assets, net | (9,096) | (11,665) | 2,569 | 22.0 | |||||||||||||||||||
| Other Operating Expenses, net | $ | 498,019 | $ | 490,143 | $ | 7,876 | 1.6 | % | |||||||||||||||
As a percentage of total revenues, other operating expenses, net increased to 23.3% for the year ended December 31, 2023 from 21.8% for the same period in 2022.
Occupancy costs increased during the year ended December 31, 2023 primarily due to the acquisition of BrandsMart U.S.A., which resulted in occupancy costs of $41.1 million in the BrandsMart segment during the year ended December 31, 2023, as compared to $31.1 million for the nine months ended December 31, 2022. Occupancy costs were also impacted by higher rent and depreciation of property, plant, and equipment associated with newer Company-operated Aaron's store locations under our repositioning and optimization initiatives. These increases were partially offset by lower maintenance and utility costs as well as lower occupancy costs due to the net reduction of 55 Company-operated Aaron's stores during the 24-month period ended December 31, 2023.
Other miscellaneous expenses, net primarily represent the depreciation of IT-related property, plant and equipment, software licensing expenses, franchisee-related reserves, and other expenses. The decrease in this category during the year ended December 31, 2023 is primarily due to the receipt in January 2023 of a $3.8 million settlement of a class action lawsuit related to alleged anti-competitive conduct by several manufacturers of cathode ray tubes, partially offset by the acquisition of BrandsMart U.S.A, which included a full year of results for the year ended December 31, 2023.
Shipping and handling costs decreased during the year ended December 31, 2023 primarily due to lower fuel and distribution costs driven by inflationary and other economic pressures that were present during the year ended December 31, 2022, as well as lower product deliveries and returns during the year ended December 31, 2023 as compared to the same period in 2022.
Advertising costs increased primarily due to higher spend to support the new store opening at BrandsMart U.S.A., partially offset by a decrease in advertising spend at the Aaron's Business, including an increase in vendor marketing credits eligible to be applied as a reduction of advertising costs.
49
Bank and credit card related fees increased primarily due to the acquisition of BrandsMart U.S.A., which resulted in bank and credit card related fees of $13.3 million in the BrandsMart segment during the year ended December 31, 2023, as compared to $9.8 million for the nine months ended December 31, 2022.
Intangible amortization increased primarily due to the amortization of intangible assets acquired in the BrandsMart U.S.A. acquisition for the full year ended December 31, 2023, as compared to only nine months during the year ended December 31, 2022.
Gains on dispositions of store-related assets, net decreased primarily due to gains of $8.5 million recognized during the year ended December 31, 2022 related to sale and leaseback transactions for seven Company-owned Aaron's store properties. During year ended December 31, 2023, the Company recognized gains of $5.4 million related to sale and leaseback transactions for five Company-owned Aaron's store properties.
Provision for Lease Merchandise Write-offs. The provision for lease merchandise write-offs as a percentage of lease revenues and fees for the Aaron's Business was 5.8% for the year ended December 31, 2023 compared to 6.4% for the comparable period in 2022. Although economic pressures within the broader macroeconomic environment continued to impact the liquidity of our customers which resulted in lower lease renewal rates, decisioning enhancements made prior to 2023 contributed to lower write-offs of lease merchandise and a lower provision for lease merchandise write-offs, as compared to the year ended December 31, 2022.
Restructuring Expenses, Net. Restructuring activity for the year ended December 31, 2023 resulted in expenses of $15.6 million, which were primarily comprised of $7.1 million of continuing variable occupancy costs incurred related to previously closed stores, $4.1 million of operating lease right-of-use asset and fixed asset impairment for Company-operated Aaron's stores identified for closure in 2023, and $2.4 million of professional advisory fees and other charges. Restructuring expenses for the year ended December 31, 2022 were $32.7 million, which were primarily comprised of $16.2 million of operating lease right-of-use asset and fixed asset impairment for Company-operated Aaron's stores identified for closure in 2022 as well as an administrative building in Kennesaw, Georgia, $7.2 million of continuing variable occupancy costs incurred related to previously closed stores, $4.9 million of professional advisory fees related to costs optimization initiatives, and $3.1 million of severance charges related to reductions in store support center staff.
Separation Costs. Separation costs recognized during the years ended December 31, 2023 and December 31, 2022 were $0.2 million and $1.2 million, respectively, and primarily represent incremental stock-based compensation expense associated with the conversion and modification of unvested and unexercised equity awards, employee-related expenses associated with the 2020 spin-off transaction and other one-time expenses incurred by the Company to operate as an independent, separate public entity. These costs will be fully expensed in the first quarter of 2024.
Acquisition-Related Costs. Acquisition-related costs recognized during the years ended December 31, 2023 and December 31, 2022 were $3.6 million and $14.6 million, respectively, and primarily represent third-party consulting, banking and legal expenses associated with the acquisition of BrandsMart U.S.A.
Operating Profit (Loss)
Interest Expense. Interest expense increased to $15.5 million for the year ended December 31, 2023 from $9.9 million for the year ended December 31, 2022. Interest expense for the year ended December 31, 2023 and December 31, 2022 consists primarily of interest on the Company's variable rate borrowings under the Credit Facility (defined below) and commitment fees on unused balances, as well as the amortization of debt issuance costs.
Other Non-Operating Income (Expense), Net. Other non-operating income (expense), net, includes (a) net gains and losses resulting from changes in the cash surrender value of Company-owned life insurance related to the Company's deferred compensation plan; (b) the impact of foreign currency remeasurement; and (c) earnings on cash and cash equivalent investments. The changes in the cash surrender value of Company-owned life insurance resulted in net gains of $1.9 million and net losses of $2.3 million during the years ended December 31, 2023 and 2022, respectively. Foreign currency remeasurement net losses resulting from changes in the value of the U.S. dollar against the Canadian dollar and earnings on cash and cash equivalent investments were not significant in 2023 or 2022.
Income Tax (Benefit) Expense
The Company recorded a net income tax benefit of $3.9 million during the year ended December 31, 2023 compared to an income tax benefit of $9.5 million for the same period in 2022. The effective tax rate increased to 366.8% for the year ended December 31, 2023 compared to 64.2% for the same period in 2022. The net income tax benefit recognized in 2023 and resulting increase in the effective tax rate was primarily due to a loss before income taxes of $1.1 million during the year ended December 31, 2023 as a result of the factors further described above, as well as the impact of a deferred income tax benefit of $5.3 million generated by the remeasurement of state deferred tax assets and liabilities in connection with an election to file a
50
consolidated state income tax return and a change in the expected state apportionment percentages related to the election to treat Aaron's, LLC, a subsidiary of the Company, as a corporation for income tax purposes effective January 1, 2023.
Segment Performance – Years Ended December 31, 2023 and 2022
Aaron's Business Segment Results
Revenues. The following table presents revenue by source for the Aaron's Business segment for the years ended December 31, 2023 and 2022:
| Year Ended December 31, | Change | ||||||||||||||||||||||
| (In Thousands) | 2023 | 2022 | $ | % | |||||||||||||||||||
| Lease Revenues and Fees | $ | 1,399,514 | $ | 1,529,125 | $ | (129,611) | (8.5) | % | |||||||||||||||
| Retail Sales | 27,248 | 39,693 | (12,445) | (31.4) | |||||||||||||||||||
| Non-Retail Sales | 96,710 | 110,531 | (13,821) | (12.5) | |||||||||||||||||||
| Franchise Royalties and Fees | 22,312 | 23,376 | (1,064) | (4.6) | |||||||||||||||||||
| Other | 689 | 778 | (89) | (11.4) | |||||||||||||||||||
| Total Revenues - Aaron's Business | $ | 1,546,473 | $ | 1,703,503 | $ | (157,030) | (9.2) | % | |||||||||||||||
The decreases in lease revenues and fees and retail sales during the year ended December 31, 2023 were primarily due to a lower average lease portfolio size during the period, a lower lease renewal rate, lower exercise of early purchase options, and lower retail sales during the year ended December 31, 2023 compared to the prior year period.
E-commerce revenues increased 6.6% compared to the prior year period and were 18.7% and 15.9% of total lease revenues and fees during the years ended December 31, 2023 and 2022, respectively.
The decrease in non-retail sales is primarily due to comparatively lower lease merchandise inventory purchases by Aaron's franchisees stemming from lower customer demand during 2023. Non-retail sales also decreased due to the reduction of 12 franchised stores during the 24-month period ended December 31, 2023.
The decrease in franchise royalties and fees is primarily the result of a lower lease portfolio size at Aaron's franchisees during the period, due in part to the reduction of 12 franchised stores during the 24-month period ended December 31, 2023, lower early purchase options, and lower retail sales.
Gross Profit and Earnings Before Income Taxes
| Year Ended December 31, | Change | ||||||||||||||||||||||
| (In Thousands) | 2023 | 2022 | $ | % | |||||||||||||||||||
| Gross Profit | $ | 976,547 | $ | 1,061,266 | $ | (84,719) | (8.0) | % | |||||||||||||||
| Earnings Before Income Taxes | 99,041 | 122,220 | (23,179) | (19.0) | |||||||||||||||||||
As a percentage of total revenues, gross profit for the Aaron's Business increased to 63.1% during the year ended December 31, 2023 compared to 62.3% for the comparable period in 2022. The factors impacting the change in gross profit are discussed below.
Gross profit for lease revenues and fees for the Aaron's Business was $0.9 billion and $1.0 billion during the years ended December 31, 2023 and 2022, respectively, which represented a gross profit margin of 66.6% and 66.4% for the respective periods. The increase in gross profit margin is primarily due to a decreasing mix of lower margin early payout revenue in 2023 as compared to 2022.
Gross profit for retail sales for the Aaron's Business was $7.1 million and $10.7 million during the years ended December 31, 2023 and 2022, respectively, which represented a gross profit margin of 26.2% and 27.0% for the respective periods. The decline in gross profit margin is primarily an unfavorable mix shift from retail sales of new merchandise to retail sales of returned merchandise in 2023 as compared to 2022.
Gross profit for non-retail sales for the Aaron's Business was $14.7 million and $11.4 million during the years ended December 31, 2023 and 2022, respectively, which represented a gross profit margin of 15.2% and 10.3% for the respective periods. The increase in gross profit percentage is primarily due to a reduction in inventory costs during the year ended December 31, 2023, combined with pricing initiatives implemented by the Company.
Earnings before income taxes for the Aaron's Business segment decreased by $23.2 million during the year ended December 31, 2023 compared to the prior year period primarily due to the $84.7 million decrease in gross profit, partially offset by lower personnel costs and other operating expenses at the Aaron's Business.
51
BrandsMart Segment Results
| Year Ended December 31, | Change | ||||||||||||||||||||||
| (In Thousands) | 2023 | 2022 | $ | % | |||||||||||||||||||
| Retail Sales | $ | 604,413 | $ | 552,465 | $ | 51,948 | 9.4 | % | |||||||||||||||
| Gross Profit | 143,660 | 101,364 | 42,296 | 41.7 | |||||||||||||||||||
Loss Before Income Taxes | (5,029) | (11,171) | 6,142 | 55.0 | |||||||||||||||||||
Revenues. BrandsMart segment revenues, entirely comprised of retail sales, have been included in the Company's consolidated results from the April 1, 2022 acquisition date and were $604.4 million and $552.5 million during the years ended December 31, 2023 and 2022, respectively. This increase was primarily driven by a full year of results being reflected for the year ended December 31, 2023, including the impact of a new BrandsMart store that opened in the third quarter of 2023, compared to only nine months for the year ended December 31, 2022, partially offset by a decline in average ticket and transaction volume.
Gross Profit. Gross profit for retail sales for the BrandsMart segment has been included in the Company's consolidated results from the April 1, 2022 acquisition date and was $143.7 million and $101.4 million during the years ended December 31, 2023 and 2022, respectively. As a percentage of revenues, gross profit for the BrandsMart segment was 23.8% and 18.3% during the years ended December 31, 2023 and 2022, respectively. The increase in gross profit margin was primarily driven by a one-time $23.1 million non-cash charge for a fair value adjustment to the acquired merchandise inventories during the year ended December 31, 2022.
Loss Before Income Taxes. The BrandsMart segment reported a loss before income taxes of $5.0 million and $11.2 million during the years ended December 31, 2023 and 2022, respectively. The results for the BrandsMart segment during the year ended December 31, 2022 reflect a one-time $23.1 million non-cash charge for a fair value adjustment to the acquired merchandise inventories.
Overview of Financial Position
The primary changes in the consolidated balance sheets from December 31, 2022 to December 31, 2023 include:
•Cash and cash equivalents increased $31.3 million to $59.0 million at December 31, 2023. For additional information, refer to the "Liquidity and Capital Resources" section below.
•Debt decreased $48.5 million primarily due to repayments of $119.7 million on the Company's outstanding borrowings, partially offset by $71.1 million in proceeds from the Company's Revolver and Term Loan during the year ended December 31, 2023. Refer to the "Liquidity and Capital Resources" section below for further details regarding the Company’s financing arrangements.
•Treasury shares increased $9.0 million due primarily to the Company's repurchase of 608,007 shares of common stock for $6.5 million during the year ended December 31, 2023.
Liquidity and Capital Resources
General
Our primary uses of capital have historically consisted of (a) buying merchandise; (b) personnel expenditures; (c) purchases of property, plant and equipment, including leasehold improvements for our new store concept and operating model; (d) expenditures related to corporate operating activities; (e) income tax payments; and (f) expenditures for acquisitions. The Company also periodically repurchases common stock and pays quarterly cash dividends. In 2023, uses of capital have included purchases, including leasehold improvements and merchandise inventory, associated with the opening of a new BrandsMart store.
We currently expect to finance our primary capital requirements through cash flows from operations, and as necessary, borrowings under our Revolving Facility. The Credit Facility (defined below) provides for a $175 million term loan (the "Term Loan") and a $375 million revolving credit facility (the "Revolving Facility"), which includes (i) a $35 million sublimit for the issuance of letters of credit on customary terms, and (ii) a $35 million sublimit for swing line loans on customary terms.
As of December 31, 2023, the Company had $59.0 million of cash and $331.0 million of availability under its $375.0 million Revolving Facility which is further described in Note 8 to the accompanying consolidated financial statements.
52
Cash Provided by Operating Activities
Cash provided by operating activities was $180.4 million and $170.4 million during the years ended December 31, 2023 and 2022, respectively. The increase in operating cash flows was primarily driven by improved consolidated earnings results as well as lower lease merchandise purchases for the year ended December 31, 2023 compared to the year ended December 31, 2022. The increases in cash provided by operating activities were partially offset by a lower average lease portfolio size and a lower lease renewal rate during the year ended December 31, 2023 compared to 2022. Other changes in cash provided by operating activities are discussed above in our discussion of results for the year ended December 31, 2023.
Cash Used in Investing Activities
Cash used in investing activities was $76.9 million and $351.4 million during the years ended December 31, 2023 and 2022, respectively.
The $274.5 million decrease in investing cash outflows was primarily due to the purchase consideration of $265.6 million in 2022 related to the BrandsMart U.S.A. acquisition, as well $13.6 million lower cash outflows for purchases of property, plant and equipment primarily related to GenNext initiatives in 2023 compared to 2022, partially offset by $4.2 million lower proceeds from the sale of property, plant and equipment during the year ended December 31, 2023, compared to the prior year period.
Cash (Used in) Provided by Financing Activities
Cash used in financing activities was $72.2 million during the year ended December 31, 2023 compared to cash provided by financing activities of $185.9 million during the year ended December 31, 2022. The $258.1 million change in financing cash flows during the year ended December 31, 2023 was primarily due to the Company's borrowings under the Term Loan (defined above) and the Revolving Facility (defined above) that occurred during April 2022 to finance the BrandsMart U.S.A. acquisition, as well as a higher amount of repayments on the Company's outstanding borrowings during the year ended December 31, 2023, compared to 2022. This was partially offset by $6.9 million lower outflows related to the repurchase of the Company's common stock during the year ended December 31, 2023 compared to 2022, net repayments of $15.5 million under the Company's inventory financing agreement during the year ended December 31, 2022, and debt issuance costs of $2.8 million being paid in 2022.
Share Repurchases
During the year ended December 31, 2023, the Company repurchased 608,007 shares of the Company's common stock for a total purchase price of $6.5 million. The total shares outstanding as of December 31, 2023 were 30,361,434 compared to 30,619,658 as of December 31, 2022. On March 2, 2022, the Company's Board of Directors increased the share repurchase authorization to $250.0 million from the original $150.0 million plan and extended the maturity to December 31, 2024. As of December 31, 2023, we have the authority to purchase additional shares of $127.0 million up to our remaining authorization limit.
Dividends
At its November 2023 meeting, our Board approved a quarterly dividend of $0.125 per share, which was paid to shareholders on January 4, 2024. Aggregate dividend payments for the year ended December 31, 2023 were $15.0 million. We expect to continue paying this quarterly cash dividend, subject to further approval from our Board. Although we expect to continue to pay a quarterly cash dividend, the timing, declaration, amount and payment of future dividends to shareholders falls within the discretion of our Board. We cannot guarantee that we will pay a dividend in the future or continue to pay any dividend.
On February 26, 2024, our Board declared a regular cash dividend of $0.125 per share, payable on April 3, 2024, to shareholders on record as of March 14, 2024.
Debt Financing
As of December 31, 2023, the total available credit under our $375.0 million Credit Facility (defined below) was $331.0 million, which reflects borrowings of $169.5 million under the Term Loan, $25.0 million of outstanding borrowings under the Revolving Facility and $19.0 million for our outstanding letters of credit.
On April 1, 2022, the Company entered into a new unsecured credit facility (the "Credit Facility") which replaced its previous $250 million unsecured credit facility. The Credit Facility provides for a $175 million Term Loan and a $375 million Revolving Facility, which includes (i) a $35 million sublimit for the issuance of letters of credit on customary terms, and (ii) a $35 million sublimit for swing line loans on customary terms. The Company borrowed $175 million under the Term Loan and $117 million under the Revolving Facility to finance the BrandsMart U.S.A. acquisition.
53
Borrowings under the Revolving Facility and the Term Loan bear interest at a rate per annum equal to, at the option of the Company, (i) the forward-looking term rate based on the Secured Overnight Financing Rate ("SOFR") plus an applicable margin ranging between 1.50% and 2.25%, based on the Company’s Total Net Debt to EBITDA Ratio (as defined in the Credit Facility agreement), or (ii) the base rate plus an applicable margin, which is 1.00% lower than the applicable margin for SOFR loans.
The loans and commitments under the Revolving Facility mature or terminate on April 1, 2027. The Term Loan amortizes in quarterly installments, commencing on December 31, 2022, in an aggregate annual amount equal to (i) 2.50% of the original principal amount of the Term Loan during the first and second years after the closing date, (ii) 5.00% of the original principal amount of the Term Loan during the third, fourth and fifth years after the closing date, with the remaining principal balance of the Term Loan to be due and payable in full on April 1, 2027.
The Credit Facility contains customary financial covenants including (a) a maximum Total Net Debt to EBITDA Ratio of 2.75 to 1.00 and (b) a minimum Fixed Charge Coverage Ratio of 1.75 to 1.00.
If we fail to comply with these covenants, we will be in default under these agreements, and all borrowings outstanding could become due immediately. Under the Credit Facility and the Franchise Loan Facility (as defined below), we may pay cash dividends in any year so long as, after giving pro forma effect to the dividend payment, we maintain compliance with our financial covenants and no event of default has occurred or would result from the payment. We are in compliance with all of these covenants at December 31, 2023.
On February 23, 2024, the Company amended its revolving credit and term loan agreement (the "Credit Facility") to, among other things: (i) decrease the Revolving Facility commitment from $375 million to $275 million, (ii) include a Security Agreement consisting of a first priority lien (subject to Permitted Liens) on certain agreed upon assets of the Borrower and Guarantors, including a pledge of the capital stock of all existing and future Material Subsidiaries of Holdings and excluding Real Property, and (iii) amend the existing Fixed Charge Coverage Ratio to lower the required minimum threshold.
Commitments
During the year ended December 31, 2023, we made net income tax payments of $11.7 million. During the year ending December 31, 2024, we anticipate making estimated cash payments of $9.0 million for federal income taxes and $1.0 million for state income taxes.
The Tax Cuts and Jobs Act of 2017, which was enacted in December 2017, provides for 100% expense deduction of certain qualified depreciable assets, including lease merchandise inventory, purchased by the Company after September 27, 2017 (but would be phased down starting in 2023). Because of our sales and lease ownership model, in which the Company remains the owner of merchandise on lease, we benefit more from bonus depreciation, relatively, than traditional furniture, electronics and appliance retailers.
We estimate the deferred tax liability associated with bonus depreciation from the Tax Act and the prior tax legislation is approximately $118.0 million as of December 31, 2023, of which approximately 70% is expected to reverse as a deferred income tax benefit in 2024 and most of the remainder during 2025. These amounts exclude bonus depreciation the Company will receive on qualifying expenditures after December 31, 2023.
Leases. We lease retail store and warehouse space for most of our store-based operations, as well as corporate office space for store and e-commerce supporting functions, under operating leases expiring at various times through 2038, and our stores have an average remaining lease term of approximately six years. Most of the leases contain renewal options for additional periods ranging from one to 20 years. Approximate future minimum rental payments required under operating leases that have initial or remaining non-cancelable terms in excess of one year as of December 31, 2023 are disclosed in Note 7 to the accompanying consolidated financial statements in this Annual Report.
Franchise Loan Guaranty. We have guaranteed the borrowings of certain independent franchisees under a franchise loan agreement (the "Franchise Loan Facility") with a bank that is a party to our Revolving Facility. As further described in Note 8 to the accompanying consolidated financial statements, a new Franchise Loan Facility agreement was entered into by the Company on April 1, 2022. This new agreement reduced the total commitment under the Franchise Loan Facility, from $15.0 million to $12.5 million and extended the commitment termination date to March 31, 2023. As of December 31, 2023, the Franchise Loan Facility has a total commitment amount of $10.0 million and a maturity date of March 30, 2024, due to amendments executed in 2023. On February 23, 2024, the Company amended its Franchise Loan Facility to conform to the changes resulting from the amendment to its Credit Facility (described above), and to extend the maturity date to March 29, 2025. We are able to request an additional 364-day extension of our Franchise Loan Facility, as long as we are not in violation of any of the covenants under that facility or our Revolving Facility, and no event of default exists under those agreements, until such time as our Revolving Facility expires. We currently expect to include a franchise loan facility as part of any extension or renewal of our Revolving Facility thereafter. At December 31, 2023, the maximum amount that the Company
54
would be obligated to repay in the event franchisees defaulted was $4.9 million, which would be due in full within 75 days of the event of default.
Since the inception of the franchise loan program in 1994, losses associated with the program have been insignificant. However, such losses could be significant in a future period due to potential adverse trends in the liquidity and/or financial performance of the Company's franchisees resulting in an event of default or impending defaults by franchisees. The Company records a liability related to estimated future losses from repaying the franchisees' outstanding debt obligations upon any possible future events of default. This liability is included in accounts payable and accrued expenses in the consolidated balance sheets and was $1.0 million and $1.3 million as of December 31, 2023 and December 31, 2022, respectively. The liability for both periods included qualitative consideration of potential losses, including uncertainties impacting the operations and liquidity of our franchisees. Uncertainties include inflationary pressures in the macroeconomic environment.
Purchase Obligations. The Company has non-cancellable purchase obligations of $18.0 million primarily related to certain advertising and marketing programs, software licenses, and hardware and software maintenance. Payments under these commitments are scheduled to be $11.3 million in 2024, $5.6 million in 2025 and $1.1 million in 2026. These amounts include only those purchase obligations for which the timing and amount of payments is certain. We have no long-term commitments to purchase merchandise nor do we have significant purchase agreements that specify minimum quantities or set prices that exceed our expected requirements for three months.
Critical Accounting Estimates
Our critical accounting estimates are estimates made in accordance with U.S. generally accepted accounting principles ("GAAP") that involve a significant level of management estimation and have had or are reasonably likely to have a material impact on our consolidated financial statements. Accordingly, the actual results may differ materially from such estimates. For a discussion of the Company’s significant accounting policies, see Note 1 to the accompanying consolidated financial statements.
Insurance
We retain a substantial portion of the risk related to employee health, workers’ compensation and general liability claims. However, we maintain stop-loss coverage to limit the exposure related to certain insurance risks. We base our health insurance liability estimation trends in claim payment history, historical trends in claims incurred but not yet reported and other components such as expected increases in medical costs, projected premium costs and the number of plan participants. Additionally, we base our estimates for workers’ compensation, general and product liability on an actuarial analysis performed by an independent third-party actuary. We review our insurance liability on a regular basis and adjust our accruals accordingly.
Changes in facts and circumstances may lead to a change in the estimated liability due to revisions of the estimated ultimate costs that affect our liability insurance coverage. Our liabilities could be significantly affected if actual results differ from our expectations or prior actuarial analyses.
Goodwill and Other Intangible Asset Impairment
We review goodwill and other intangible assets for impairment annually, or when events or circumstances indicate it is more-likely-than-not that the value of the asset may be impaired. In assessing these types of assets for impairment, there are significant estimates and assumptions used to determine the fair value, including relevant market and economic conditions, anticipated future revenues and cash flows, royalty rates, and discount rates.
During a quantitative assessment, we use a weighted guideline public company method and/or a discounted cash flow method to determine an estimated fair value. If it is determined that the fair value of a reporting unit is less than its carrying value, an impairment charge is recorded to bring the carrying value down to its fair value.
We conducted a quantitative assessment at October 1, 2023. The analysis requires management to make estimates and assumptions, which may differ significantly from actual results, particularly if there are significant adverse changes in our operating environment.
Based on a weighted guideline public company method and discounted cash flow method analysis, we estimated that the fair value for our BrandsMart reporting unit to be more than its carrying value and based on a discounted cash flow method analysis, we estimated that the fair value for our BrandsMart Leasing reporting unit to be more than its carrying value at October 1, 2023, respectively. Goodwill allocated to the BrandsMart and BrandsMart Leasing reporting units at October 1, 2023 were $29.2 million and $26.5 million, respectively.
BrandsMart Reporting Unit. The critical assumptions used as part of the weighted guideline public company method were last twelve months, enterprise value to revenue multiples, and next fiscal year enterprise value to revenue multiples. The critical assumptions used as part of the weighted discounted cash flow method were a projected long-term revenue growth rate and a discount rate based on a weighted-average cost of capital analysis (adjusted for company specific risk).
55
BrandsMart Leasing Reporting Unit. The critical assumptions used as part of the discounted cash flow method were a projected long-term growth rate and a discount rate based on a weighted average cost of capital analysis (adjusted for company specific risk).
We performed sensitivity analyses for the BrandsMart and BrandsMart Leasing reporting units during the annual assessment, including considering reasonably possible alternative assumptions for long-term growth or decline rates and weighted-average cost of capital rates. The sensitivity analyses performed supported our conclusion of no impairment for either reporting unit as of October 1, 2023.
We may be required to recognize material impairments to the BrandsMart or BrandsMart Leasing goodwill balances in the future if: (i) we fail to successfully execute on one or more elements of the BrandsMart strategic plan; (ii) actual results are unfavorable to our estimates and assumptions used to calculate fair value; (iii) the BrandsMart or BrandsMart leasing carrying values increase without an associated increase in the fair value; and/or (iv) BrandsMart or BrandsMart Leasing is materially impacted by further deterioration of macroeconomic conditions, including inflation and rising interest rates.
Recent Accounting Pronouncements
Refer to Note 1 to the accompanying consolidated financial statements for a discussion of recently issued accounting pronouncements.
ITEM 7A. QUANTITATIVE AND QUALITATIVE DISCLOSURES ABOUT MARKET RISK
As of December 31, 2023, the Company had $194.5 million of outstanding borrowings under the Credit Facility, further described in Note 8 to the accompanying consolidated financial statements. Borrowings under the Credit Facility bear interest at a rate per annum equal to, at the option of the Company, (i) the forward-looking term rate based on the SOFR plus an applicable margin ranging between 1.50% and 2.25%, based on the Company's Total Net Debt to EBITDA Ratio, or (ii) the base rate plus an applicable margin, which is 1.00% lower than the applicable margin for SOFR loans. The variable rates associated with these facilities exposes us to the risk of increased costs if interest rates rise while we have outstanding borrowings tied to variable rates.
In March 2023, the Company entered into a non-speculative interest rate swap agreement for an aggregate notional amount of $100.0 million with a forward effective date of April 28, 2023 and a termination date of March 31, 2027. The purpose of this hedge is to limit the Company's exposure of its variable interest rate debt by effectively converting it to fixed interest rate debt. Based on the Company’s variable-rate debt outstanding as of December 31, 2023, a hypothetical 10% increase or decrease in interest rates would increase or decrease interest expense by $0.7 million on an annualized basis.
We do not use any significant market risk sensitive instruments to hedge commodity, foreign currency or other risks, and hold no market risk sensitive instruments for trading or speculative purposes.
56
ITEM 8. FINANCIAL STATEMENTS AND SUPPLEMENTARY DATA
Report of Independent Registered Public Accounting Firm
To the Shareholders and the Board of Directors of The Aaron’s Company, Inc.
Opinion on the Financial Statements
We have audited the accompanying consolidated balance sheets of The Aaron’s Company, Inc. (the Company) as of December 31, 2023 and 2022, the related consolidated statements of earnings, comprehensive income (loss), equity and cash flows for each of the three years in the period ended December 31, 2023, and the related notes (collectively referred to as the “consolidated financial statements”). In our opinion, the consolidated financial statements present fairly, in all material respects, the financial position of the Company at December 31, 2023 and 2022, and the results of its operations and its cash flows for each of the three years in the period ended December 31, 2023, in conformity with U.S. generally accepted accounting principles.
We also have audited, in accordance with the standards of the Public Company Accounting Oversight Board (United States) (PCAOB), the Company's internal control over financial reporting as of December 31, 2023, based on criteria established in Internal Control-Integrated Framework issued by the Committee of Sponsoring Organizations of the Treadway Commission (2013 framework), and our report dated February 29, 2024 expressed an adverse opinion thereon.
Basis for Opinion
These financial statements are the responsibility of the Company's management. Our responsibility is to express an opinion on the Company’s financial statements based on our audits. We are a public accounting firm registered with the PCAOB and are required to be independent with respect to the Company in accordance with the U.S. federal securities laws and the applicable rules and regulations of the Securities and Exchange Commission and the PCAOB.
We conducted our audits in accordance with the standards of the PCAOB. Those standards require that we plan and perform the audit to obtain reasonable assurance about whether the financial statements are free of material misstatement, whether due to error or fraud. Our audits included performing procedures to assess the risks of material misstatement of the financial statements, whether due to error or fraud, and performing procedures that respond to those risks. Such procedures included examining, on a test basis, evidence regarding the amounts and disclosures in the financial statements. Our audits also included evaluating the accounting principles used and significant estimates made by management, as well as evaluating the overall presentation of the financial statements. We believe that our audits provide a reasonable basis for our opinion.
Critical Audit Matters
The critical audit matters communicated below are matters arising from the current period audit of the financial statements that were communicated or required to be communicated to the audit committee and that: (1) relate to accounts or disclosures that are material to the financial statements and (2) involved our especially challenging, subjective or complex judgments. The communication of critical audit matters does not alter in any way our opinion on the consolidated financial statements, taken as a whole, and we are not, by communicating the critical audit matters below, providing separate opinions on the critical audit matters or on the accounts or disclosures to which they relate.
57
| Estimated claims liabilities costs | ||||||||
| Description of the Matter | At December 31, 2023, the Company recorded $64.1 million associated with its estimated claims liabilities costs, which primarily relate to workers compensation and vehicle liability insurance for the Aaron’s Business segment (collectively, the estimated claims liabilities). As discussed in Note 1 to the consolidated financial statements, the estimated claims liabilities are recorded based on actual reported but unpaid claims and actuarial analysis of the projected claims run off for both reported and incurred but not reported claims. This analysis is based upon an assessment of the likely outcome or historical experience. Auditing the Company's estimated claims liabilities is complex and required us to involve our actuarial specialists due to the measurement uncertainty associated with the estimates and the use of various actuarial methods. The Company’s analyses of the estimated claims liabilities consider a variety of factors, including the actuarial loss forecasts, company-specific development factors, and general industry loss development factors. The estimated claims liabilities are sensitive to changes in these factors. | |||||||
| How We Addressed the Matter in Our Audit | We obtained an understanding, evaluated the design, and tested the operating effectiveness of the Company’s controls over the estimated claims liabilities process. For example, we tested controls over the factors mentioned above that management used in the calculations and the completeness and accuracy of the historical claims data underlying the ultimate expected losses. To evaluate the reserve for estimated claims liabilities, we performed audit procedures that included, among others, testing the completeness and accuracy of the underlying claims data used in the Company’s actuarial analyses. Additionally, we involved our actuarial specialists to assist in our evaluation of the key factors mentioned above and management’s methodologies to establish the actuarially determined ultimate expected losses and to develop a range for ultimate expected loss estimates based on independently developed assumptions, which we compared to the Company's recorded estimated claims liabilities. | |||||||
58
Valuation of Goodwill – BrandsMart and BrandsMart Leasing reporting units | ||||||||
| Description of the Matter | As discussed in Note 3 of the consolidated financial statements, goodwill is tested for impairment at least annually at the reporting unit level. This requires management to estimate the fair value of the reporting units with goodwill allocated to them. The Company estimates the fair value based on a combination of the discounted cash flow method and guideline public-company method for the BrandsMart reporting unit and based on the discounted cash flow method for the BrandsMart Leasing reporting unit. As of the annual impairment testing date of October 1, 2023, the BrandsMart reporting unit goodwill balance totaled $29.2 million and the BrandsMart Leasing reporting unit goodwill balance totaled $26.5 million. Auditing management’s goodwill impairment tests involved especially subjective judgments due to the significant estimation required in determining the fair value of the reporting units. In particular, the estimate of the fair value for the Company’s BrandsMart and BrandsMart Leasing reporting units is sensitive to changes in assumptions such as the discount rate, and expected future net cash flows, specifically projected revenue and operating results and as it relates to the BrandsMart reporting unit capital expenditures. These assumptions are affected by expectations about future reporting unit operating performance, market and economic conditions. | |||||||
| How We Addressed the Matter in Our Audit | We obtained an understanding, evaluated the design and tested the operating effectiveness of controls over the Company’s goodwill impairment review process. For example, we tested controls over the estimation of the fair value of the reporting unit, including the Company’s controls over the valuation model, the mathematical accuracy of the valuation model and development of underlying assumptions used to estimate the fair value of the reporting units. We also tested management’s review of the reconciliation of the aggregate estimated fair value of the reporting units to the market capitalization of the Company. To test the estimated fair value of the Company’s BrandsMart and BrandsMart Leasing reporting units, our audit procedures included, among others, assessing the valuation methodologies and the completeness and accuracy of the underlying data used by the Company in its analyses, including testing the significant assumptions discussed above. We compared the significant assumptions used by management to current industry and economic trends and historical trends at the reporting units. We performed sensitivity analyses over the significant assumptions to evaluate the changes in the fair value of the reporting units that would result from changes in these assumptions. We involved valuation specialists to assist in our evaluation of the valuation methodology and the significant assumptions used in determining the fair value of the reporting units. We also tested the reconciliation of the aggregate estimated fair value of the reporting units to the market capitalization of the Company. | |||||||
We have served as the Company's auditor since 2020.
/s/ Ernst & Young LLP
Atlanta, Georgia
February 29, 2024
59
Report of Independent Registered Public Accounting Firm
To the Shareholders and the Board of Directors of The Aaron's Company, Inc.
Opinion on Internal Control over Financial Reporting
We have audited The Aaron’s Company, Inc.’s internal control over financial reporting as of December 31, 2023, based on criteria established in Internal Control-Integrated Framework issued by the Committee of Sponsoring Organizations of the Treadway Commission (2013 framework) (the COSO criteria). In our opinion, because of the effect of the material weakness described below on the achievement of the objectives of the control criteria, The Aaron’s Company, Inc. (the Company) has not maintained effective internal control over financial reporting as of December 31, 2023, based on the COSO criteria.
A material weakness is a deficiency, or combination of deficiencies, in internal control over financial reporting, such that there is a reasonable possibility that a material misstatement of the company’s annual or interim financial statements will not be prevented or detected on a timely basis. The following material weakness has been identified and included in management’s assessment.
Management identified a material weakness in internal control over financial reporting in the BrandsMart segment. The design of information technology general controls (“ITGCs”) related to user access, program change or appropriate segregation of duties for certain IT applications within the BrandsMart segment was not effective. This ineffective design impacted controls over the completeness and accuracy of information used in the BrandsMart segment’s business process controls resulting in the impacted controls also being deemed ineffective.
We also have audited, in accordance with the standards of the Public Company Accounting Oversight Board (United States) (PCAOB), the consolidated balance sheets of the Company as of December 31, 2023 and 2022, the related consolidated statements of earnings, comprehensive income (loss), equity and cash flows for each of the three years in the period ended December 31, 2023, and the related notes. This material weakness was considered in determining the nature, timing and extent of audit tests applied in our audit of the 2023 consolidated financial statements, and this report does not affect our report dated February 29, 2024, which expressed an unqualified opinion thereon.
Basis for Opinion
The Company’s management is responsible for maintaining effective internal control over financial reporting and for its assessment of the effectiveness of internal control over financial reporting included in the accompanying Management Report on Internal Control Over Financial Reporting. Our responsibility is to express an opinion on the Company’s internal control over financial reporting based on our audit. We are a public accounting firm registered with the PCAOB and are required to be independent with respect to the Company in accordance with the U.S. federal securities laws and the applicable rules and regulations of the Securities and Exchange Commission and the PCAOB.
We conducted our audit in accordance with the standards of the PCAOB. Those standards require that we plan and perform the audit to obtain reasonable assurance about whether effective internal control over financial reporting was maintained in all material respects.
Our audit included obtaining an understanding of internal control over financial reporting, assessing the risk that a material weakness exists, testing and evaluating the design and operating effectiveness of internal control based on the assessed risk, and performing such other procedures as we considered necessary in the circumstances. We believe that our audit provides a reasonable basis for our opinion.
60
Definition and Limitations of Internal Control Over Financial Reporting
A company’s internal control over financial reporting is a process designed to provide reasonable assurance regarding the reliability of financial reporting and the preparation of financial statements for external purposes in accordance with generally accepted accounting principles. A company’s internal control over financial reporting includes those policies and procedures that (1) pertain to the maintenance of records that, in reasonable detail, accurately and fairly reflect the transactions and dispositions of the assets of the company; (2) provide reasonable assurance that transactions are recorded as necessary to permit preparation of financial statements in accordance with generally accepted accounting principles, and that receipts and expenditures of the company are being made only in accordance with authorizations of management and directors of the company; and (3) provide reasonable assurance regarding prevention or timely detection of unauthorized acquisition, use, or disposition of the company’s assets that could have a material effect on the financial statements.
Because of its inherent limitations, internal control over financial reporting may not prevent or detect misstatements. Also, projections of any evaluation of effectiveness to future periods are subject to the risk that controls may become inadequate because of changes in conditions, or that the degree of compliance with the policies or procedures may deteriorate.
/s/ Ernst & Young LLP
February 29, 2024
61
Management Report on Internal Control over Financial Reporting
Management of The Aaron's Company, Inc. and subsidiaries (the "Company") is responsible for establishing and maintaining adequate internal control over financial reporting as defined in Rules 13a-15(f) and 15d-15(f) under the Securities Exchange Act of 1934, as amended. Internal control over financial reporting is a process designed to provide reasonable assurance regarding the reliability of financial reporting and the preparation of financial statements for external reporting purposes in accordance with accounting principles generally accepted in the United States of America.
Because of its inherent limitations, internal control over financial reporting may not prevent or detect misstatements. Projections of any evaluation of effectiveness to future periods are subject to the risk that controls may become inadequate because of changes in conditions or that the degree of compliance with the policies or procedures may deteriorate.
The Company’s management assessed the effectiveness of the Company’s internal control over financial reporting as of December 31, 2023. In making this assessment, the Company’s management used the criteria set forth by the Committee of Sponsoring Organizations of the Treadway Commission (2013 framework) in Internal Control-Integrated Framework.
Management identified a material weakness in internal control over financial reporting in the BrandsMart segment. The design of information technology general controls ("ITGCs") related to user access, program change and appropriate segregation of duties for certain IT applications within the segment was not effective. This ineffective design impacted controls over the completeness and accuracy of information used in the segment's business process controls resulting in the impacted controls also being deemed ineffective.
While this material weakness did not result in a material misstatement of our financial statements, these control deficiencies were not remediated as of December 31, 2023, and there is a reasonable possibility that it could have resulted in a material misstatement in the Company's annual or interim financial statements that would not be detected. Accordingly, we determined that this control deficiency constituted a material weakness.
As a result of this material weakness, management has concluded that we did not maintain effective internal control over financial reporting as of December 31, 2023.
Our auditors, Ernst & Young LLP, an independent registered public accounting firm, have audited and reported on our consolidated financial statements and on the effectiveness of our internal control over financial reporting. Ernst & Young LLP has issued a report expressing an adverse opinion on the effectiveness of the Company's internal control over financial reporting as of December 31, 2023, Their reports are contained in Part II, Item 8 of this Annual Report on Form 10-K.
62
THE AARON'S COMPANY, INC.
CONSOLIDATED BALANCE SHEETS
| December 31, | |||||||||||
| 2023 | 2022 | ||||||||||
| (In Thousands, Except Share Data) | |||||||||||
| ASSETS: | |||||||||||
| Cash and Cash Equivalents | $ | $ | |||||||||
Accounts Receivable (net of allowances of $ | |||||||||||
Lease Merchandise (net of accumulated depreciation and allowances of $ | |||||||||||
| Merchandise Inventories, Net | |||||||||||
| Property, Plant and Equipment, Net | |||||||||||
| Operating Lease Right-of-Use Assets | |||||||||||
| Goodwill | |||||||||||
| Other Intangibles, Net | |||||||||||
| Income Tax Receivable | |||||||||||
| Prepaid Expenses and Other Assets | |||||||||||
| Total Assets | $ | $ | |||||||||
| LIABILITIES & SHAREHOLDERS' EQUITY: | |||||||||||
| Accounts Payable and Accrued Expenses | $ | $ | |||||||||
| Deferred Income Taxes Payable | |||||||||||
| Customer Deposits and Advance Payments | |||||||||||
| Operating Lease Liabilities | |||||||||||
| Debt | |||||||||||
| Total Liabilities | |||||||||||
Commitments and Contingencies (Note 10) | |||||||||||
SHAREHOLDERS' EQUITY: | |||||||||||
Common Stock, Par Value $ | |||||||||||
| Additional Paid-in Capital | |||||||||||
| Retained Earnings | |||||||||||
| Accumulated Other Comprehensive Loss | ( | ( | |||||||||
Treasury Shares at Cost: | ( | ( | |||||||||
| Total Shareholders' Equity | |||||||||||
| Total Liabilities & Shareholders' Equity | $ | $ | |||||||||
The accompanying notes are an integral part of the Consolidated Financial Statements.
63
THE AARON'S COMPANY, INC.
CONSOLIDATED STATEMENTS OF EARNINGS
| Year Ended December 31, | |||||||||||||||||
| 2023 | 2022 | 2021 | |||||||||||||||
| (In Thousands, Except Per Share Data) | |||||||||||||||||
| REVENUES: | |||||||||||||||||
| Lease Revenues and Fees | $ | $ | $ | ||||||||||||||
| Retail Sales | |||||||||||||||||
| Non-Retail Sales | |||||||||||||||||
| Franchise Royalties and Other Revenues | |||||||||||||||||
| COSTS OF REVENUES: | |||||||||||||||||
| Depreciation of Lease Merchandise and Other Lease Revenue Costs | |||||||||||||||||
| Retail Cost of Sales | |||||||||||||||||
| Non-Retail Cost of Sales | |||||||||||||||||
| GROSS PROFIT | |||||||||||||||||
| OPERATING EXPENSES: | |||||||||||||||||
| Personnel Costs | |||||||||||||||||
| Other Operating Expenses, Net | |||||||||||||||||
| Provision for Lease Merchandise Write-Offs | |||||||||||||||||
| Restructuring Expenses, Net | |||||||||||||||||
| Impairment of Goodwill | |||||||||||||||||
| Separation Costs | |||||||||||||||||
| Acquisition-Related Costs | |||||||||||||||||
| OPERATING PROFIT (LOSS) | ( | ||||||||||||||||
| Interest Expense | ( | ( | ( | ||||||||||||||
| Other Non-Operating Income (Expense), Net | ( | ||||||||||||||||
| LOSS BEFORE INCOME TAXES | ( | ( | |||||||||||||||
| INCOME TAX (BENEFIT) EXPENSE | ( | ( | |||||||||||||||
| NET EARNINGS (LOSS) | $ | $ | ( | $ | |||||||||||||
| EARNINGS (LOSS) PER SHARE | $ | $ | ( | $ | |||||||||||||
| EARNINGS (LOSS) PER SHARE ASSUMING DILUTION | $ | $ | ( | $ | |||||||||||||
The accompanying notes are an integral part of the Consolidated Financial Statements.
64
THE AARON'S COMPANY, INC.
CONSOLIDATED STATEMENTS OF COMPREHENSIVE INCOME (LOSS)
| Year Ended December 31 | |||||||||||||||||
| (In Thousands) | 2023 | 2022 | 2021 | ||||||||||||||
| Net Earnings (Loss) | $ | $ | ( | $ | |||||||||||||
| Other Comprehensive Income (Loss): | |||||||||||||||||
Unrealized (Loss) on Derivative Instruments, net of Tax1 | ( | ( | |||||||||||||||
Foreign Currency Translation Adjustment, net of Tax1 | ( | ||||||||||||||||
| Total Other Comprehensive Income (Loss) | ( | ||||||||||||||||
| Comprehensive Income (Loss) | $ | $ | ( | $ | |||||||||||||
1 For the year ended December 31, 2023, the Unrealized Loss on Derivative Instruments is presented net of a tax benefit of $0.1 million, and the Foreign Currency Translation Adjustment is presented net of a tax benefit of $0.3 million. The tax components of the prior year amounts are insignificant.
The accompanying notes are an integral part of the Consolidated Financial Statements.
65
THE AARON'S COMPANY, INC.
CONSOLIDATED STATEMENTS OF EQUITY
| Treasury Stock | Common Stock | Additional Paid-In Capital | Retained Earnings | Accumulated Other Comprehensive Loss | Total Equity | ||||||||||||||||||||||||||||||||||||||||||
| (In Thousands, Except Per Share) | Shares | Amount | Shares | Amount | |||||||||||||||||||||||||||||||||||||||||||
Balance, January 1, 2021 | ( | $ | ( | $ | $ | $ | $ | ( | $ | ||||||||||||||||||||||||||||||||||||||
Cash Dividends, $ | — | — | — | — | — | ( | — | ( | |||||||||||||||||||||||||||||||||||||||
| Stock-Based Compensation | — | — | — | — | — | — | |||||||||||||||||||||||||||||||||||||||||
Reclassification of liability awards to equity awards | — | — | — | — | — | — | |||||||||||||||||||||||||||||||||||||||||
| Issuance of Shares under Equity Plan | ( | ( | — | — | ( | ||||||||||||||||||||||||||||||||||||||||||
| Acquisition of Treasury Stock | ( | ( | — | — | — | — | — | ( | |||||||||||||||||||||||||||||||||||||||
| Net Earnings | — | — | — | — | — | — | |||||||||||||||||||||||||||||||||||||||||
| Foreign Currency Translation Adjustment | — | — | — | — | — | — | |||||||||||||||||||||||||||||||||||||||||
Balance at December 31, 2021 | ( | ( | ( | ||||||||||||||||||||||||||||||||||||||||||||
Cash Dividends, $ | — | — | — | — | — | ( | — | ( | |||||||||||||||||||||||||||||||||||||||
| Stock-Based Compensation | — | — | — | — | — | — | |||||||||||||||||||||||||||||||||||||||||
| Issuance of Shares under Equity Plans | ( | ( | — | — | ( | ||||||||||||||||||||||||||||||||||||||||||
| Acquisition of Treasury Stock | ( | ( | — | — | — | — | — | ( | |||||||||||||||||||||||||||||||||||||||
Net Loss | — | — | — | — | — | ( | — | ( | |||||||||||||||||||||||||||||||||||||||
| Unrealized Loss on Fuel Hedge Derivative Instrument | — | — | — | — | — | — | ( | ( | |||||||||||||||||||||||||||||||||||||||
| Foreign Currency Translation Adjustment | — | — | — | — | — | — | ( | ( | |||||||||||||||||||||||||||||||||||||||
Balance at December 31, 2022 | ( | ( | ( | ||||||||||||||||||||||||||||||||||||||||||||
Cash Dividends, $ | — | — | — | — | — | ( | — | ( | |||||||||||||||||||||||||||||||||||||||
| Stock-Based Compensation | — | — | — | — | — | — | |||||||||||||||||||||||||||||||||||||||||
| Issuance of Shares under Equity Plans | ( | ( | — | — | ( | ||||||||||||||||||||||||||||||||||||||||||
| Acquisition of Treasury Stock | ( | ( | — | — | — | — | — | ( | |||||||||||||||||||||||||||||||||||||||
Net Earnings | — | — | — | — | — | — | |||||||||||||||||||||||||||||||||||||||||
Unrealized Loss on Derivative Instruments, net of tax | — | — | — | — | — | — | ( | ( | |||||||||||||||||||||||||||||||||||||||
| Foreign Currency Translation Adjustment | — | — | — | — | — | — | |||||||||||||||||||||||||||||||||||||||||
Balance at December 31, 2023 | ( | $ | ( | $ | $ | $ | $ | ( | $ | ||||||||||||||||||||||||||||||||||||||
The accompanying notes are an integral part of the Consolidated Financial Statements.
66
THE AARON'S COMPANY, INC.
CONSOLIDATED STATEMENTS OF CASH FLOWS
| Year Ended December 31, | |||||||||||||||||
| (In Thousands) | 2023 | 2022 | 2021 | ||||||||||||||
| OPERATING ACTIVITIES: | |||||||||||||||||
Net Earnings (Loss) | $ | $ | ( | $ | |||||||||||||
Adjustments to Reconcile Net Earnings (Loss) to Net Cash Provided by Operating Activities: | |||||||||||||||||
| Depreciation of Lease Merchandise | |||||||||||||||||
| Other Depreciation and Amortization | |||||||||||||||||
| Provision for Lease Merchandise Write-Offs | |||||||||||||||||
| Non-Cash Inventory Fair Value Adjustment | |||||||||||||||||
| Accounts Receivable Provision | |||||||||||||||||
| Stock-Based Compensation | |||||||||||||||||
| Deferred Income Taxes | ( | ( | |||||||||||||||
| Impairment of Assets | |||||||||||||||||
| Non-Cash Lease Expense | |||||||||||||||||
| Other Changes, Net | ( | ( | ( | ||||||||||||||
| Changes in Operating Assets and Liabilities: | |||||||||||||||||
| Lease Merchandise | ( | ( | ( | ||||||||||||||
| Merchandise Inventories | |||||||||||||||||
| Accounts Receivable | ( | ( | ( | ||||||||||||||
| Prepaid Expenses and Other Assets | ( | ( | |||||||||||||||
| Income Tax Receivable | ( | ( | ( | ||||||||||||||
| Operating Lease Right-of-Use Assets and Liabilities | ( | ( | ( | ||||||||||||||
| Accounts Payable and Accrued Expenses | ( | ||||||||||||||||
| Customer Deposits and Advance Payments | ( | ( | ( | ||||||||||||||
| Cash Provided by Operating Activities | |||||||||||||||||
| INVESTING ACTIVITIES: | |||||||||||||||||
| Purchases of Property, Plant & Equipment | ( | ( | ( | ||||||||||||||
| Proceeds from Dispositions of Property, Plant, and Equipment | |||||||||||||||||
| Acquisition of BrandsMart U.S.A., Net of Cash Acquired | ( | ||||||||||||||||
| Acquisitions of Businesses and Customer Agreements, Net of Cash Acquired | ( | ( | |||||||||||||||
| Proceeds from Other Investing-Related Activities | |||||||||||||||||
| Cash Used in Investing Activities | ( | ( | ( | ||||||||||||||
| FINANCING ACTIVITIES: | |||||||||||||||||
| Repayments on Swing Line Loans, Net | ( | ||||||||||||||||
| Proceeds from Revolver and Term Loan | |||||||||||||||||
| Repayments on Revolver, Term Loan and Financing Leases | ( | ( | |||||||||||||||
| Repayments on Inventory Loan Program, Net | ( | ||||||||||||||||
| Dividends Paid | ( | ( | ( | ||||||||||||||
| Acquisition of Treasury Stock | ( | ( | ( | ||||||||||||||
| Issuance of Stock Under Stock Option Plans | |||||||||||||||||
| Shares Withheld for Tax Payments | ( | ( | ( | ||||||||||||||
| Debt Issuance Costs | ( | ||||||||||||||||
| Cash (Used in) Provided by Financing Activities | ( | ( | |||||||||||||||
EFFECT OF EXCHANGE RATE CHANGES ON CASH, CASH EQUIVALENTS, AND RESTRICTED CASH | ( | ( | |||||||||||||||
| Increase (Decrease) in Cash, Cash Equivalents, and Restricted Cash | ( | ||||||||||||||||
| Cash, Cash Equivalents, and Restricted Cash at Beginning of Year | |||||||||||||||||
| Cash and Cash Equivalents at End of Year: | |||||||||||||||||
| Cash and Cash Equivalents | $ | $ | $ | ||||||||||||||
| Restricted Cash included in Prepaid Expenses and Other Assets | |||||||||||||||||
| Total Cash, Cash Equivalents, and Restricted Cash at End of Year | $ | $ | $ | ||||||||||||||
The accompanying notes are an integral part of the Consolidated Financial Statements.
67
THE AARON'S COMPANY, INC.
NOTES TO CONSOLIDATED FINANCIAL STATEMENTS
NOTE 1: BUSINESS AND SUMMARY OF SIGNIFICANT ACCOUNTING POLICIES
As described elsewhere in this Annual Report, the lingering effects of the global pandemic, continued inflationary pressures, general macroeconomic conditions and rising interest rates have led to significant market disruption and has impacted various aspects of our operations, directly and indirectly. Throughout these notes to the consolidated financial statements, the impacts of these items on the financial results for the year ended December 31, 2023 and comparable prior periods have been identified to the best of our ability under the respective sections. For a discussion of trends that we believe have affected our business as a result of these items, see Item 7. "Management’s Discussion and Analysis of Financial Condition and Results of Operations", including the "Highlights," "Consolidated Results of Operations" and "Liquidity and Capital Resources", and Part I, Item 1A "Risk Factors", above.
BrandsMart U.S.A. Acquisition
On April 1, 2022, the Company completed the previously announced transaction to acquire a 100 % ownership of Interbond Corporation of America, doing business as BrandsMart U.S.A. The Company paid total consideration of $230 million in cash under the terms of the agreement and additional amounts for working capital adjustments and transaction related fees. Refer to Note 2 to these consolidated financial statements for additional information regarding the acquisition.
Management believes that the BrandsMart U.S.A. acquisition will strengthen the Company's ability to deliver on its mission of enhancing people’s lives by providing easy access to high quality furniture, appliances, electronics, and other home goods through affordable lease-to-own and retail purchase options. Management also believes that value creation opportunities include leveraging the Company's lease-to-own expertise to provide BrandsMart U.S.A.'s customers enhanced payment options and offering a wider selection of products to millions of Aaron's customers, as well as generating procurement savings and other cost synergies.
Business Overview
Description of Business
The Company is a leading, technology-enabled, omni-channel provider of lease-to-own ("LTO") and retail purchase solutions of furniture, electronics, appliances, and other home goods across its brands: Aaron's, BrandsMart U.S.A., BrandsMart Leasing, and Woodhaven Furniture Industries ("Woodhaven").
As of December 31, 2023, the Company's operating and reportable segments are the Aaron's Business and BrandsMart, each as described below.
The Aaron's Business segment is comprised of (i) Aaron's branded Company-operated and franchise operated stores; (ii) aarons.com e-commerce platform ("aarons.com"); (iii) Woodhaven; and (iv) BrandsMart Leasing (collectively, the "Aaron’s Business").
The operations of BrandsMart U.S.A. (excluding BrandsMart Leasing) comprise the BrandsMart segment (collectively, "BrandsMart").
Aaron's Business Segment
Since its founding in 1955, Aaron's has been committed to serving the overlooked and underserved customer with a dedication to inclusion and improving the communities in which it operates. Through a portfolio of approximately 1,240 stores and its aarons.com e-commerce platform, Aaron's, together with its franchisees, provide consumers with LTO and retail purchase solutions for the products they need and want, with a focus on providing its customers with unparalleled customer service, high approval rates, lease plan flexibility, and an attractive value proposition, including competitive monthly payments and total cost of ownership, as compared to other LTO providers.
Woodhaven manufactures and supplies a significant portion of the upholstered furniture leased and sold in Company-operated and franchised Aaron's stores.
Launched in 2022, BrandsMart Leasing offers LTO purchase solutions to customers of BrandsMart U.S.A.
BrandsMart Segment
Founded in 1977, BrandsMart U.S.A. is one of the leading appliance and consumer electronics retailers in the southeast United States and one of the largest appliance retailers in the country with 11 stores in Florida and Georgia and a growing e-commerce presence on brandsmartusa.com. The operations of BrandsMart U.S.A. (other than BrandsMart Leasing) comprise the BrandsMart segment.
68
THE AARON'S COMPANY, INC.
NOTES TO CONSOLIDATED FINANCIAL STATEMENTS
Basis of Presentation
The accompanying consolidated financial statements of the Company and its wholly-owned subsidiaries for the years ended December 31, 2023, December 31, 2022, and December 31, 2021 reflect the historical results of operations, financial position and cash flows of the Company in accordance with accounting principles generally accepted in the United States ("U.S. GAAP"). Intercompany balances and transactions between consolidated entities have been eliminated and reflect the historical results of operations, financial position and cash flows of the Company in accordance with accounting principles generally accepted in the United States ("U.S. GAAP").
Reclassifications
The following reclassifications have been made to the prior periods to conform to the current period presentation.
For all previously reported periods prior to April 1, 2022, the Company presented all revenues derived from lease agreements and the related fees, as well as the retail sale of both new and returned lease merchandise from our Company-operated Aaron's stores and fees from our Aaron's Club program within one line in the consolidated statements of earnings, presented as lease and retail revenues. Effective April 1, 2022, the Company revised its presentation to separately present revenues derived from lease agreements at our Company-operated Aaron's stores and e-commerce platform and fees from our Aaron's Club program as lease revenues and fees in the consolidated statements of earnings, with the sale of both new and returned lease merchandise from our Company-operated Aaron's stores being classified as retail sales. This revised presentation does not have an impact on total revenues presented in prior periods.
Similarly, for all previously reported periods prior to April 1, 2022, the Company presented the depreciation expense associated with lease merchandise as well as the depreciated costs of merchandise sold within one line in the consolidated statements of earnings, presented as the cost of lease and retail revenues. Effective April 1, 2022, the Company revised its presentation to separately present the depreciation expense associated with lease merchandise in the consolidated statements of earnings, with the costs associated with merchandise sold through our Company-operated Aaron's stores presented as retail cost of sales. This revised presentation does not have an impact on total costs of revenues presented in prior periods.
Significant Accounting Policies
Segment Reporting
As of December 31, 2023, the Company has two
The Aaron's Business segment provides consumers with LTO and retail purchase solutions through the Company's Aaron's stores in the United States and Canada and the aarons.com e-commerce platform. This operating segment also supports franchisees of its Aaron's stores. In addition, the Aaron's Business segment includes the operations of BrandsMart Leasing, which offers lease-to-own solutions to BrandsMart U.S.A. customers, and Woodhaven, which manufactures and supplies a significant portion of the upholstered furniture leased and sold in Company-operated and franchised Aaron's stores.
69
THE AARON'S COMPANY, INC.
NOTES TO CONSOLIDATED FINANCIAL STATEMENTS
Revenue Recognition
The Company provides lease and retail merchandise, consisting of appliances, electronics, furniture, and other home goods to its customers for lease under certain terms agreed to by the customer and through retail sales. The Company's Aaron's stores, aarons.com e-commerce platform, and BrandsMart Leasing components of the Aaron's Business segment offer leases with flexible ownership plans that can be generally renewed weekly, bi-weekly, semi-monthly, or monthly up to 12 , 18 or 24 months. The Aaron's Business segment also earns revenue from the sale of merchandise to customers and Aaron's franchisees, and earns ongoing revenue from Aaron's franchisees in the form of royalties and through advertising efforts that benefit the franchisees.
The Company's BrandsMart U.S.A. stores and related brandsmartusa.com e-commerce platform offer the sale of merchandise directly to its customers via retail sales.
Earnings (Loss) Per Share
Earnings per share is computed by dividing net earnings (loss) by the weighted average number of shares of common stock outstanding during the period. The computation of earnings (loss) per share assuming dilution includes the dilutive effect of stock options, RSUs, RSAs, PSUs and other awards issuable under the Company's ESPP (collectively, "share-based awards") as determined under the treasury stock method, unless the inclusion of such awards would be anti-dilutive.
The following table shows the calculation of weighted-average shares outstanding assuming dilution:
| Year Ended December 31, | |||||||||||||||||
| (Shares In Thousands) | 2023 | 2022 | 2021 | ||||||||||||||
| Weighted Average Shares Outstanding | |||||||||||||||||
Dilutive Effect of Share-Based Awards1 | |||||||||||||||||
| Weighted Average Shares Outstanding Assuming Dilution | |||||||||||||||||
1 There was no dilutive effect to the loss per common share for the year ended December 31, 2022 due to the net loss incurred in the period.
For the years ended December 31, 2023 and December 31, 2021, 1.3 million and 0.1 million weighted-average share based awards were excluded from the computation of earnings per share assuming dilution, respectively, as the awards would have been anti-dilutive for the period.
Lease Merchandise
The Company’s lease merchandise is recorded at the lower of depreciated cost, including overhead costs from our distribution centers, or net realizable value. The cost of merchandise manufactured by our Woodhaven operations is recorded at cost and includes overhead from production facilities, shipping costs and warehousing costs. The Company begins depreciating furniture and appliances at the earlier of the lease date or 24 months and one day from its purchase, while all other lease merchandise begins depreciating at the earlier of the lease date or 12 months and one day from its purchase. Lease merchandise fully depreciates over the lease agreement period when on lease, generally 12 to 24 months, and generally 36 months when not on lease. Depreciation is accelerated upon early payout.
70
THE AARON'S COMPANY, INC.
NOTES TO CONSOLIDATED FINANCIAL STATEMENTS
The following is a summary of lease merchandise, net of accumulated depreciation and allowances:
| December 31, | |||||||||||
| (In Thousands) | 2023 | 2022 | |||||||||
| Merchandise on Lease, net of Accumulated Depreciation and Allowances | $ | $ | |||||||||
Merchandise Not on Lease, net of Accumulated Depreciation and Allowances1 | |||||||||||
Lease Merchandise, net of Accumulated Depreciation and Allowances2 | $ | $ | |||||||||
1 Includes Woodhaven's inventory, which is primarily comprised of raw materials, that has been classified within lease merchandise in the consolidated balance sheets of $8.7 million and $12.9 million as of December 31, 2023 and 2022, respectively.
2 General and administrative overhead costs capitalized into the cost of lease merchandise were $54.0 million, $55.7 million, and $55.0 million for the years ended December 31, 2023, 2022 and 2021, respectively. Capitalized overhead costs remaining in lease merchandise were $55.9 million and $55.1 million as of December 31, 2023 and 2022, respectively.
The Aaron's store-based operations' policies require weekly merchandise counts at its store-based operations, which include write-offs for unsalable, damaged, or missing merchandise inventories. Monthly cycle counting procedures are performed at both the Aaron's distribution centers and Woodhaven manufacturing facilities. Physical inventories are also taken at the manufacturing facilities annually. The Company also monitors merchandise levels and mix by division, store, and distribution center, as well as the average age of merchandise on hand. If obsolete merchandise cannot be returned to vendors, its carrying amount is adjusted to its net realizable value or written off. Generally, all merchandise not on lease is available for lease or sale. On a monthly basis, all damaged, lost or unsalable merchandise identified is written off and is included as a component of the provision for lease merchandise write-offs in the accompanying consolidated statements of earnings.
The Company records a provision for write-offs using the allowance method, which is included within lease merchandise, net within the consolidated balance sheets. The allowance method for lease merchandise write-offs estimates the merchandise losses incurred but not yet identified by management as of the end of the accounting period based primarily on historical write-off experience. Other qualitative factors are considered in estimating the allowance, such as seasonality and the impacts of uncertainty surrounding inflationary and other economic pressures in the current macroeconomic environment. Therefore, actual lease merchandise write-offs could differ from the allowance. The provision for write-offs is included in provision for lease merchandise write-offs in the accompanying consolidated statements of earnings. The Company writes off lease merchandise on lease agreements that are 60 days or more past due on pre-determined dates twice monthly. The Company writes off lease merchandise on lease agreements for its BrandsMart Leasing operations that are 90 days or more past due on pre-determined dates twice monthly.
The following table shows the components of the allowance for lease merchandise write-offs:
| Year Ended December 31, | |||||||||||||||||
| (In Thousands) | 2023 | 2022 | 2021 | ||||||||||||||
| Beginning Balance | $ | $ | $ | ||||||||||||||
| Merchandise Written off, net of Recoveries | ( | ( | ( | ||||||||||||||
| Provision for Write-offs | |||||||||||||||||
| Ending Balance | $ | $ | $ | ||||||||||||||
Merchandise Inventories
The Company’s merchandise inventories are stated at the lower of weighted average cost or net realizable value, and consist entirely of merchandise held for sale by the BrandsMart segment. In-bound freight-related costs from vendors, net of allowances and vendor rebates, are included as part of the net cost of merchandise inventories. Costs associated with storing and transporting merchandise inventories to our retail stores are expensed as incurred and included within retail cost of sales in the consolidated statements of earnings.
During the year ended December 31, 2022, the Company recognized a one-time non-cash charge for a fair value adjustment to the acquired BrandsMart merchandise inventories of $23.1 million, which was included within retail cost of sales in the consolidated statements of earnings.
71
THE AARON'S COMPANY, INC.
NOTES TO CONSOLIDATED FINANCIAL STATEMENTS
The Company periodically evaluates aged and distressed inventory and establishes an inventory markdown which represents the excess of the carrying value over the amount the Company expects to realize from the ultimate sale of the inventory. Markdowns establish a new cost basis for the inventory and are recorded within retail cost of sales within the consolidated statements of earnings. The write-offs of merchandise inventories associated with the Company's cycle and physical inventory count processes are also included within retail cost of sales in the consolidated statements of earnings. The Company records an inventory reserve for the anticipated loss associated with selling inventories below cost. This reserve is based on management’s current knowledge with respect to inventory levels, sales trends, and historical experience selling or disposing of aged or obsolete inventory.
The following is a summary of merchandise inventories, net of allowances:
| (In Thousands) | December 31, 2023 | December 31, 2022 | |||||||||
| Merchandise Inventories, gross | $ | $ | |||||||||
| Reserve for Merchandise Inventories | ( | ( | |||||||||
| Merchandise Inventories, net | $ | $ | |||||||||
The following table shows the components of the reserve for merchandise inventories:
| Year Ended | |||||||||||
| (In Thousands) | December 31, 2023 | December 31, 2022 | |||||||||
| Beginning Balance | $ | $ | |||||||||
| Merchandise Written off | ( | ||||||||||
| Provision for Write-offs | |||||||||||
| Ending Balance | $ | $ | |||||||||
Retail and Non-Retail Cost of Sales
Included in retail cost of sales, as well as non-retail cost of sales, is the net book value of merchandise sold via retail and non-retail sales, primarily using specific identification. The components of cost of sales are further described below.
Depreciation of Lease Merchandise and Other Lease Revenue Costs
The primary items classified under the expense category "Depreciation of Lease Merchandise and Other Lease Revenue Costs" are:
•Depreciation of the capitalized costs (recorded at the lower of depreciated costs or net realizable value) of available and on rent lease merchandise at the Aaron’s Business segment. Capitalized costs include:
◦Landed Inventory Costs
◦Overhead Costs incurred at our internal distribution centers, including transportation costs incurred to transfer inventory from the Company's fulfillment centers to Company Operated stores
◦Freight expenses associated with receiving the inventory from our vendors
◦Costs of manufactured inventory at our Woodhaven operations including overhead from production facilities, shipping costs and warehousing costs
•Accelerated depreciation associated with early payout transactions
•Amortization of Aaron's Business cooperative advertising consideration, received from vendors, that are not specifically identifiable incremental costs incurred in selling those vendor's products
•Amortization of rebate credits associated with the leasing of lease merchandise at the Aaron's Business
•External service provider fees associated with hosting the Aaron's Club program
72
THE AARON'S COMPANY, INC.
NOTES TO CONSOLIDATED FINANCIAL STATEMENTS
Retail Cost of Sales - Aaron's Business
The primary items classified under the expense category "Retail Cost of Sales" for the Aaron's Business segment are:
•Costs of the NBV of lease merchandise (recorded at the lower of depreciated costs or net realizable value) at the Aaron's Business segment including:
◦Landed Inventory Costs
◦Overhead Costs incurred at our internal distribution centers, including transportation costs incurred to transfer inventory from the Company's fulfillment centers to Company Operated stores
◦Freight expenses associated with receiving the inventory from our vendors
◦Costs of manufactured inventory at our Woodhaven operations including overhead from production facilities, shipping costs and warehousing costs
•Amortization of Aaron's Business cooperative advertising consideration, received from vendors, that are not specifically identifiable incremental costs incurred in selling those vendor's products
•Amortization of rebate credits associated with the retail sale of lease merchandise at the Aaron's Business
Retail Cost of Sales - BrandsMart
The primary items classified under the expense category "Retail Cost of Sales" for the BrandsMart Business segment are:
•Weighed average costs of landed inventory invoice costs (recorded at the lower of weighted average costs or net realizable value)
•Overhead Costs incurred at our internal distribution centers
•Freight expenses associated with receiving the inventory from our vendors
•Transportation costs incurred to transfer inventory from the Company's fulfillment centers to stores
•Cooperative advertising consideration, received from vendors, that are not specifically identifiable incremental costs incurred in selling those vendor's products
•Vendor rebate credits associated with the retail sale of merchandise inventories
•Subsequent markdowns of merchandise inventories
•Third party transportation and internal vehicle charges associated with customer shipping and handling
•Charges/Provisions for shrink and obsolescence
•Cost of services provided including personnel related costs, replacement costs, and freight expenses
Non-Retail Cost of Sales - Aaron's Business
The primary items classified under the expense category "Non-Retail Cost of Sales" for the Aaron's Business segment are:
•Cost of the NBV of lease merchandise (recorded at the lower of depreciated costs or net realizable value) sold to Aaron's Business franchisees or wholesale customers of our Woodhaven operations which includes:
◦Landed Inventory Costs
◦Overhead Costs incurred at our internal distribution centers
◦Freight expenses associated with receiving the inventory from our vendors
◦Costs of manufactured inventory at our Woodhaven operations including overhead from production facilities, shipping costs and warehousing costs
◦Transportation costs incurred to transfer inventory from the Company's fulfillment centers to franchisees and non-retail customers
•Amortization of Aaron's Business cooperative advertising consideration, received from vendors, that are not specifically identifiable incremental costs incurred in selling those vendor's products
73
THE AARON'S COMPANY, INC.
NOTES TO CONSOLIDATED FINANCIAL STATEMENTS
Shipping and Handling Costs
Shipping and handling costs are primarily classified within other operating expenses, net in the accompanying consolidated statements of earnings and to a lesser extent, capitalized into the cost of lease merchandise and subsequently depreciated or recognized as cost of retail sales. Shipping and handling costs classified within other operating expenses, net were $64.1 million, $70.1 million and $60.4 million for the years ended December 31, 2023, 2022 and 2021, respectively. Shipping and handling costs capitalized into the cost of lease merchandise were $23.3 million, $27.4 million and $25.4 million for the years ended December 31, 2023, 2022 and 2021, respectively.
Advertising
Total advertising costs are classified within other operating expenses, net in the consolidated statements of earnings. These advertising costs are presented net of cooperative advertising considerations received from vendors, which represents reimbursement of specific, identifiable and incremental costs incurred in selling those vendors’ products, and are recorded as a reduction of advertising costs.
The following table shows total advertising costs, net of cooperative advertising consideration:
| Year Ended December 31, | |||||||||||||||||
| (In Thousands) | 2023 | 2022 | 2021 | ||||||||||||||
| Advertising Costs, Gross | $ | $ | $ | ||||||||||||||
| Less: Cooperative Advertising Considerations | ( | ( | ( | ||||||||||||||
Advertising Costs, Net | $ | $ | $ | ||||||||||||||
Stock-Based Compensation
The Company has stock-based employee compensation plans, which are more fully described in Note 13 to these consolidated financial statements. The Company estimates the fair value for the options granted on the grant date using a Black-Scholes-Merton option-pricing model. The fair value of each share of restricted stock units ("RSUs"), restricted stock awards ("RSAs") and performance share units ("PSUs") with Company-specific performance criteria is equal to the market value of a share of the Company's common stock on the grant date. For PSUs that are granted with a total shareholder return ("TSR") component, management estimates the fair value using a Monte Carlo simulation valuation model, as these awards are subject to a market condition. For all stock award types, the Company considers whether any material nonpublic information is known to the Company at the time the awards are granted that could impact the determined grant date fair value. No adjustments to fair value were deemed necessary for the years ended December 31, 2023, 2022 or 2021 based on these considerations.
The Company estimates the fair value of awards issued under the Company's employee stock purchase plan ("A&R ESPP") using a series of Black-Scholes-Merton pricing models that consider the components of the "lookback" feature of the plan, including the underlying stock, call option, and put option. The design of awards issued under the A&R ESPP is more fully described in Note 13 to these consolidated financial statements.
74
THE AARON'S COMPANY, INC.
NOTES TO CONSOLIDATED FINANCIAL STATEMENTS
Separation Costs
Separation costs include actual expenses after November 30, 2020 associated with the separation and distribution from PROG Holdings, Inc. (referred to herein as "PROG Holdings"), including personnel-related costs and incremental stock-based compensation expense associated with the conversion and modification of unvested and unexercised equity awards related to Company employees, as well as an allocation of similar expenses related to PROG Holdings' corporate and shared function employees. See Note 13 to these consolidated financial statements for additional information regarding the modification of awards that were converted concurrent with the separation and distribution. Separation costs also include one-time expenses incurred by the Company in order to begin operating as an independent, standalone public entity after the completion of the separation and distribution. These costs will be fully expensed in the first quarter of 2024.
Acquisition-Related Costs
Acquisition-related costs of $3.6 million and $14.6 million were incurred during the years ended December 31, 2023 and 2022, respectively, and primarily represent third-party consulting in 2023, while in 2022 it included third-party consulting as well as banking and legal expenses associated with the acquisition of BrandsMart U.S.A completed April 1, 2022.
Income Taxes
The Company and its subsidiaries file U.S. federal consolidated income tax returns in the United States, and separate legal entities file in various state and foreign jurisdictions. In all periods presented, the income tax provision has been computed for the entities comprising the Company on a standalone, separate return basis as if the Company were a separate taxpayer.
The provision for income taxes is determined using the asset and liability approach of accounting for income taxes. Under this approach, deferred taxes represent the future tax consequences expected to occur when the reported amounts of assets and liabilities are recovered or paid. Income taxes as presented attribute deferred income taxes of the Company's standalone consolidated financial statements in a manner that is systematic, rational and consistent with the asset and liability method.
The provision for income taxes represents income taxes paid or payable for the current year plus the change in deferred taxes during the year. Deferred taxes result from differences between the financial and tax basis of the Company’s assets and liabilities and are adjusted for changes in tax rates and tax laws when such changes are enacted. The Company's largest temporary differences arise principally from the use of accelerated depreciation methods on lease merchandise for tax purposes. Valuation allowances are recorded to reduce deferred tax assets when it is more likely than not that a tax benefit will not be realized.
The Company recognizes uncertain tax positions in the consolidated financial statements when it is more likely than not that the tax position will be sustained upon examination. Uncertain tax positions are measured based on the probabilities that the uncertain tax position will be realized upon final settlement.
See further details on income taxes within Note 9 to these consolidated financial statements.
Sales Taxes
The Company applies the net basis for sales taxes imposed on goods and services in the consolidated statements of earnings. The Company is required by the applicable governmental authorities to collect and remit sales taxes. Accordingly, such amounts are charged to the customer, collected, and remitted directly to the appropriate jurisdictional entity.
Cash and Cash Equivalents
The Company classifies as cash equivalents any highly liquid investments that have maturity dates of three months or less at the time they are purchased. The Company maintains its cash and cash equivalents at various banks. Bank balances may exceed coverage provided by the Federal Deposit Insurance Corporation ("FDIC"). However, due to the size and strength of the banks in which balances that exceed the FDIC coverage are held, any exposure to loss is believed to be minimal. Cash and cash equivalents also includes amounts in transit due from financial institutions related to credit card and debit card transactions, which generally settle within three business days from the original transaction.
75
THE AARON'S COMPANY, INC.
NOTES TO CONSOLIDATED FINANCIAL STATEMENTS
Supplemental Cash Flow Information
The following table shows supplemental cash flow information:
| Year Ended December 31, | |||||||||||||||||
| (In Thousands) | 2023 | 2022 | 2021 | ||||||||||||||
Net Cash Paid During the Year: | |||||||||||||||||
| Interest | $ | $ | $ | ||||||||||||||
| Income Taxes | $ | $ | $ | ||||||||||||||
Accounts Receivable
Accounts receivable consist primarily of receivables due from customers on lease agreements, corporate receivables incurred during the normal course of business (primarily for vendor consideration and third-party warranty providers) and franchisee obligations.
Accounts receivable, net of allowances, consist of the following:
| December 31, | |||||||||||
| (In Thousands) | 2023 | 2022 | |||||||||
| Customers | $ | $ | |||||||||
| Corporate | |||||||||||
| Franchisee | |||||||||||
| $ | $ | ||||||||||
The Company maintains an accounts receivable allowance for the Aaron's Business customer lease agreements, under which its policy is to record a provision for returns and uncollectible contractually due renewal payments based on historical payments experience, which is recognized as a reduction of lease revenues and fees within the consolidated statements of earnings. Other qualitative factors are considered in estimating the allowance, such as current and forecasted business trends. The Company writes off customer lease receivables for its Aaron's Business operations that are 60 days or more past due on pre-determined dates twice monthly. The Company writes off customer lease receivables for its BrandsMart Leasing operations that are 90 days or more past due on pre-determined dates twice monthly.
The Company also maintains an allowance for outstanding franchisee accounts receivable. The Company's policy is to estimate future losses related to certain franchisees that are deemed to have a higher risk of non-payment and record an allowance for these estimated losses. The estimated allowance on franchisee accounts receivable includes consideration of the financial position of each franchisee and qualitative consideration of potential losses associated with uncertainties impacting the franchisee's ability to satisfy their obligations. Uncertainties include inflationary and other economic pressures in the current macroeconomic environment. Accordingly, actual accounts receivable write-offs could differ from the allowance. The provision for uncollectible franchisee accounts receivable is recorded as bad debt expense in other operating expenses, net within the consolidated statements of earnings.
The allowance related to corporate receivables is not significant for the years ended December 31, 2023 and 2022.
The following table shows the components of the accounts receivable allowance:
| Year Ended December 31, | |||||||||||||||||
| (In Thousands) | 2023 | 2022 | 2021 | ||||||||||||||
| Beginning Balance | $ | $ | $ | ||||||||||||||
| Accounts Written Off, net of Recoveries | ( | ( | ( | ||||||||||||||
| Accounts Receivable Provision | |||||||||||||||||
| Ending Balance | $ | $ | $ | ||||||||||||||
76
THE AARON'S COMPANY, INC.
NOTES TO CONSOLIDATED FINANCIAL STATEMENTS
The following table shows the components of the accounts receivable provision, which includes amounts recognized for bad debt expense and the provision for returns and uncollected payments:
| Year Ended December 31, | |||||||||||
| (In Thousands) | 2023 | 2022 | |||||||||
Bad Debt Expense | $ | $ | |||||||||
| Provision for Returns and Uncollectible Renewal Payments | |||||||||||
| Accounts Receivable Provision | $ | $ | |||||||||
Property, Plant and Equipment
The Company records property, plant and equipment at cost. Depreciation and amortization are computed on a straight-line basis over the estimated useful lives of the respective assets, which range from to 20 years for buildings and improvements and from to 15 years for other depreciable property and equipment.
Costs incurred to develop software for internal use are capitalized and amortized over the estimated useful life of the software, which ranges from to ten years . Management uses an agile development methodology in which feature-by-feature updates are made to its software. Certain costs incurred during the application development stage of an internal-use software project are capitalized when members of management who possess the authority to do so authorize and commit to funding a feature update and it is probable that the project will be completed and the software will be used to perform the function intended. Generally, the life cycle for each feature update implementation is one month . Capitalization of costs ceases when the feature update is substantially complete and ready for its intended use. All costs incurred during preliminary and post-implementation project stages are expensed appropriately.
Gains and losses related to dispositions and retirements are recognized as incurred. Maintenance and repairs are also expensed as incurred, and leasehold improvements are capitalized and amortized over the lesser of the expected lease term or the asset's useful life. Depreciation expense for property, plant and equipment is classified within other operating expenses, net in the accompanying consolidated statements of earnings and was $79.9 million, $76.8 million and $64.2 million during the years ended December 31, 2023, 2022 and 2021, respectively. Amortization of previously capitalized internal use software development costs, which is a component of depreciation expense for property, plant and equipment, was $19.6 million, $20.8 million and $18.6 million during the years ended December 31, 2023, 2022 and 2021, respectively.
Management assesses its long-lived assets other than goodwill for impairment whenever facts and circumstances indicate that the carrying amount may not be fully recoverable. If it is determined that the carrying amount of an asset is not recoverable, based on analysis of undiscounted cash flows expected to be generated by the asset or asset group, management compares the carrying amount of the asset to its fair value as estimated using discounted expected future cash flows, market values or replacement values for similar assets. The amount by which the carrying amount exceeds the fair value of the asset, if any, is recognized as an impairment loss.
77
THE AARON'S COMPANY, INC.
NOTES TO CONSOLIDATED FINANCIAL STATEMENTS
Prepaid Expenses and Other Assets
Prepaid expenses and other assets consist of the following:
| December 31, | |||||||||||
| (In Thousands) | 2023 | 2022 | |||||||||
| Prepaid Expenses | $ | $ | |||||||||
| Insurance Related Assets | |||||||||||
| Company-Owned Life Insurance | |||||||||||
| Deferred Tax Assets | |||||||||||
Other Assets1,2 | |||||||||||
| $ | $ | ||||||||||
1 Amounts as of December 31, 2023 and 2022 included restricted cash of $1.6
2 Amounts included $0.9 million and $1.9 million for the years ended December 31, 2023 and 2022, respectively, of certain properties classified as held for sale. Assets held for sale are recorded at the lower of their carrying value or fair value less estimated cost to sell and are classified within prepaid expenses and other assets in the consolidated balance sheets. Depreciation is suspended on assets upon classification as held for sale. The highest and best use of these assets is as real estate land parcels for development or real estate properties for use or lease, though the Company has chosen not to develop or use these properties, and plans to sell them to third parties as quickly as practicable.
Derivative Instruments
In March 2023, the Company entered into a non-speculative interest rate swap agreement for an aggregate notional amount of $100.0 million with an effective date of April 28, 2023 and a termination date of March 31, 2027. The purpose of this hedge is to limit the Company's exposure of its variable interest rate debt by effectively converting it to fixed interest rate debt. Under the terms of the agreement, the Company will receive a floating interest rate based on 1-month Chicago Mercantile Exchange ("CME") Term Secured Overnight Financing Rate ("SOFR") and pay a fixed interest rate of 3.87 % on the notional amount. The Company has accounted for the interest rate swap as a cash flow hedge instrument in accordance with ASC 815, Derivatives and Hedging. Accordingly, the effective portion of the gains and losses associated with the changes in the fair value of the cash flow hedge instrument are recognized as a component of accumulated other comprehensive loss in the Company's consolidated balance sheets. Such amounts are reclassified into earnings in the same period during which the cash flow hedging instrument affects earnings. As of December 31, 2023, the facts and circumstances of the hedged relationship remain consistent with the initial effectiveness assessment and the hedging instrument remains an effective accounting hedge.
The fair value of the hedge as of December 31, 2023 was a liability of $0.5 million, and has been recorded within accounts payable and accrued expenses in the Company's consolidated balance sheets. During the year ended December 31, 2023, the Company reclassified $0.9 million of net gains from accumulated other comprehensive loss to interest expense. Gains and losses related to the hedge were classified within operating activities in the consolidated statements of cash flows. See Note 4 to these consolidated financial statements for further information regarding the fair value determination of the Company's interest rate swap agreement. Derivative instruments in place in prior years were not significant.
78
THE AARON'S COMPANY, INC.
NOTES TO CONSOLIDATED FINANCIAL STATEMENTS
Accumulated Other Comprehensive (Loss) Income
Changes in accumulated other comprehensive income (loss) ("AOCI") by component for the years ended December 31, 2023 and 2022 are summarized below:
| Year Ended December 31, 2023 | |||||||||||
| (In Thousands) | Derivative Instruments | Foreign Currency | Total | ||||||||
| Balance at December 31, 2022 | $ | ( | $ | ( | $ | ( | |||||
Other Comprehensive (Loss) Income, net of Tax | ( | ||||||||||
Balance at December 31, 2023 | $ | ( | $ | ( | $ | ( | |||||
| Year Ended December 31, 2022 | |||||||||||
| (In Thousands) | Derivative Instruments | Foreign Currency | Total | ||||||||
Balance at December 31, 2021 | $ | $ | ( | $ | ( | ||||||
Other Comprehensive Loss, net of Tax | ( | ( | ( | ||||||||
Balance at December 31, 2022 | $ | ( | $ | ( | $ | ( | |||||
Accounts Payable and Accrued Expenses
Accounts payable and accrued expenses consist of the following:
| December 31, | |||||||||||
| (In Thousands) | 2023 | 2022 | |||||||||
| Accounts Payable | $ | $ | |||||||||
| Estimated Claims Liability Costs | |||||||||||
| Accrued Salaries and Benefits | |||||||||||
| Accrued Real Estate and Sales Taxes | |||||||||||
| Other Accrued Expenses and Liabilities | |||||||||||
| $ | $ | ||||||||||
Estimated Claims Liability Costs
Estimated claims liability costs are accrued primarily for workers compensation and vehicle liability at the Aaron's Business segment, as well as general liability and group health insurance benefits provided to team members. These liabilities are recorded within estimated claims liability costs within accounts payable and accrued expenses in the consolidated balance sheets. Estimates for these claims liabilities are made based on actual reported but unpaid claims and actuarial analysis of the projected claims run off for both reported and incurred but not reported claims. This analysis is based upon an assessment of the likely outcome or historical experience and considers a variety of factors, including the actuarial loss forecasts, company-specific development factors, general industry loss development factors and third-party claim administrator loss estimates of individual claims. The Company makes periodic prepayments to its insurance carriers to cover the projected claims run off for both reported and incurred but not reported claims, considering its retention or stop loss limits. In addition, we have prefunding balances on deposit and other insurance receivables with the insurance carriers which are recorded within prepaid expenses and other assets in our consolidated balance sheets.
79
THE AARON'S COMPANY, INC.
NOTES TO CONSOLIDATED FINANCIAL STATEMENTS
Asset Retirement Obligations
The Company accrues for asset retirement obligations, which relate to expected costs to remove exterior signage, in the period in which the obligations are incurred. These costs are accrued at fair value. When the related liability is initially recorded, the Company capitalizes the cost by increasing the carrying amount of the related long-lived asset. Over time, the liability is accreted to its settlement value and updated for changes in estimates. Upon settlement of the liability, the Company recognizes a gain or loss for any differences between the settlement amount and the liability recorded. Asset retirement obligations, which are included in accounts payable and accrued expenses in the consolidated balance sheets, amounted to $2.1 million and $2.2 million as of December 31, 2023 and 2022, respectively. The capitalized cost is depreciated over the useful life of the related asset.
Fair Value Measurement
Fair value is defined as the price that would be received to sell an asset or paid to transfer a liability in an orderly transaction between market participants at the measurement date. To increase the comparability of fair value measures, the following hierarchy prioritizes the inputs to valuation methodologies used to measure fair value:
Level 1—Valuations based on quoted prices for identical assets and liabilities in active markets.
Level 2—Valuations based on observable inputs other than quoted prices included in Level 1, such as quoted prices for similar assets and liabilities in active markets, quoted prices for identical or similar assets and liabilities in markets that are not active, or other inputs that are observable or can be corroborated by observable market data.
Level 3—Valuations based on unobservable inputs reflecting management’s own assumptions, consistent with reasonably available assumptions made by other market participants. These valuations require significant judgment.
The fair values of the Company’s current financial assets and liabilities, such as cash and cash equivalents, accounts receivable and accounts payable, approximate their carrying values due to their short-term nature. The Company's outstanding debt borrowings as of December 31, 2023 and December 31, 2022 were subject to a variable interest rate. Therefore, the fair value of these borrowings also approximates its carrying value. These assets and liabilities are measured within Level 2 of the fair value hierarchy. The Company also measures certain non-financial assets at fair value on a nonrecurring basis, such as goodwill, intangible assets, operating lease right-of-use assets, and property, plant and equipment, in connection with periodic evaluations for potential impairment.
The Company measures a liability related to its non-qualified deferred compensation plan, which represents benefits accrued for participants that are part of the plan and is valued at the quoted market prices of the participants' investment election, at fair value on a recurring basis. The Company measures assets held for sale at fair value on a nonrecurring basis and records impairment charges when they are deemed to be impaired.
On April 1, 2022, the Company completed the previously announced acquisition of all of the issued and outstanding shares of capital stock of BrandsMart U.S.A. For the fair value measurements performed related to the net assets acquired, including acquired intangible assets, the Company utilized multiple Level 3 inputs and assumptions, such as estimates about costs of capital, future projected performance and cash flows.
Foreign Currency
The financial statements of the Company’s Canadian subsidiary are translated from the Canadian dollar functional currency to U.S. dollars using month-end rates of exchange for assets and liabilities, and average rates of exchange for revenues, costs and expenses. Translation gains and losses of the subsidiary are recorded in accumulated other comprehensive loss as a component of equity. The Company's assets include assets from Canadian operations of $13.4 million and $13.1 million as of December 31, 2023 and 2022, respectively.
Foreign currency remeasurement gains and losses are recorded primarily due to remeasurement of the financial assets and liabilities of the Company's Canadian stores between the Canadian dollar and the U.S. dollar and were not significant in 2023, 2022 or 2021.
80
THE AARON'S COMPANY, INC.
NOTES TO CONSOLIDATED FINANCIAL STATEMENTS
Recent Accounting Pronouncements
Adopted
In October 2021, the Financial Accounting Standards Board ("FASB") issued ASU 2021-08, Business Combinations (Topic 805): Accounting for Contract Assets and Contract Liabilities from Contracts with Customers ("ASU 2021-08"), which requires contract assets and contract liabilities (e.g., deferred revenue) acquired in a business combination to be recognized and measured in accordance with ASC Topic 606, Revenue from Contracts with Customers, rather than at its assumed acquisition date fair value. The Company elected to early adopt ASU 2021-08 in the second quarter of 2022, and therefore accounted for deferred revenue contracts acquired in connection with the BrandsMart U.S.A. acquisition under this standard. The adoption of the standard has no retrospective impact to the Company's historical consolidated and combined financial statements.
Effective in Future Periods
In October 2023, the FASB issued an accounting pronouncement (ASU 2023-06) related to disclosure or presentation requirements for various subtopics in the FASB’s Accounting Standards Codification ("Codification"). The amendments in the update are intended to align the requirements in the Codification with the U.S. Securities and Exchange Commission's ("SEC") regulations and facilitate the application of GAAP for all entities. The effective date for each amendment is the date on which the SEC removal of the related disclosure requirement from Regulation S-X or Regulation S-K becomes effective, or if the SEC has not removed the requirements by June 30, 2027, this amendment will be removed from the Codification and will not become effective for any entity. Early adoption is prohibited. We do not expect this update to have a material impact on our consolidated financial statements.
In November 2023, the FASB issued an accounting pronouncement (ASU 2023-07) related to the disclosure of incremental segment information on an annual and interim basis. This update is effective for annual periods beginning after December 15, 2023, and interim periods within fiscal years beginning after December 15, 2024, and requires retrospective application to all prior periods presented in the financial statements. We plan to adopt this pronouncement beginning with our fiscal year ended December 31, 2024, and we do not expect it to have a material effect on our consolidated financial statements.
In December 2023, the FASB issued an accounting pronouncement (ASU 2023-09) related to income tax disclosures. The amendments in this update are intended to enhance the transparency and decision usefulness of income tax disclosures primarily through changes to the rate reconciliation and income taxes paid information. This update is effective for annual periods beginning after December 15, 2024, though early adoption is permitted. We plan to adopt this pronouncement for our fiscal year beginning January 1, 2025, and we do not expect it to have a material effect on our consolidated financial statements.
81
THE AARON'S COMPANY, INC.
NOTES TO CONSOLIDATED FINANCIAL STATEMENTS
NOTE 2: ACQUISITIONS
BrandsMart U.S.A. Acquisition
On April 1, 2022, the Company completed the acquisition of BrandsMart U.S.A for a total consideration of $230 million in cash under the terms of the agreement and additional amounts for working capital adjustments and transaction related fees. Consideration transferred also included the off-market value associated with certain operating leases entered into in conjunction with the transaction, which is further described in the table below. Measurement period adjustments recorded during the year ended December 31, 2023 primarily relate to opening balance adjustments to certain asset and liability balances further illustrated in the table below:
| (In Thousands) | Preliminary Amounts Recognized as of Acquisition Date | 2023 Measurement Period Adjustments | Final Amounts Recognized as of Acquisition Date | ||||||||
Cash Consideration to BrandsMart U.S.A. | $ | $ | $ | ||||||||
| Acquired Cash | |||||||||||
| Estimated Excess Working Capital, net of Cash | |||||||||||
Non-Cash Off-Market Lease Agreement | |||||||||||
| Aggregate Consideration Transferred | |||||||||||
| Total Purchase Consideration, Net of Cash Acquired | $ | $ | $ | ||||||||
| Estimated Fair Value of Identifiable Assets Acquired and Liabilities Assumed | |||||||||||
| Accounts Receivable | |||||||||||
| Merchandise Inventories | |||||||||||
| Property, Plant and Equipment | ( | ||||||||||
| Operating Lease Right-of-Use Assets | |||||||||||
Other Intangibles | |||||||||||
Prepaid Expenses and Other Assets | ( | ||||||||||
| Total Identifiable Assets Acquired | ( | ||||||||||
| Accounts Payable and Accrued Expenses | ( | ||||||||||
| Customer Deposits and Advance Payments | |||||||||||
| Operating Lease Liabilities | |||||||||||
| Debt | |||||||||||
| Total Liabilities Assumed | ( | ||||||||||
| Net Assets Acquired | ( | ||||||||||
Goodwill | |||||||||||
| Total Estimated Fair Value of Net Assets Acquired | $ | $ | $ | ||||||||
Franchisee Acquisitions
The Company acquired the store operations of various Aaron's franchisees during the year ended December 31, 2021, for a combined purchase price of $10.6 million. The franchisee acquisitions have been accounted for as business combinations and the results of operations of the acquired businesses are included in the Company’s results of operations from their dates of acquisition. The primary tangible asset acquired as part of these transactions was lease merchandise and the primary intangible assets allocated to were reacquired franchise rights and customer lease contracts during the year ended December 31, 2021. As a result of these business combinations, the Company recorded $5.6 million in goodwill during the year ended December 31, 2021. The effect of these acquisitions on the consolidated financial statements for the years ended December 31, 2023, 2022 and 2021 was not significant. There were no material measurement period adjustments recognized in 2023 or 2022 related to the 2021 franchisee acquisitions and there were no franchise acquisitions in 2023 or 2022.
82
THE AARON'S COMPANY, INC.
NOTES TO CONSOLIDATED FINANCIAL STATEMENTS
NOTE 3: GOODWILL AND INTANGIBLES
Goodwill
Goodwill represents the excess of the purchase price over the fair value of the identifiable net tangible and intangible assets acquired in connection with business acquisitions. All acquisition-related goodwill balances are allocated amongst the Company's reporting units based on the nature of the acquired operations that originally created the goodwill and are comprised of the following:
(i) Aaron’s Business (a component of the Aaron’s Business operating segment)
•Aaron’s branded Company-operated and franchise operated stores,
•Aarons.com e-commerce platform ("aarons.com") and,
•Woodhaven
(ii) BrandsMart Leasing (a component of the Aaron’s Business operating segment)
(iii) BrandsMart (the sole component of the BrandsMart operating segment)
Management considered the aggregation of the BrandsMart Leasing reporting unit and Aaron's Business reporting unit as a single reporting unit and determined that these components were economically dissimilar and reviewed separately by the segment managers of the Aaron's Business operating segment, and therefore should not be aggregated.
The Company’s goodwill is not amortized but is subject to an impairment test at the reporting unit level annually as of October 1 and more frequently if events or circumstances indicate that an impairment may have occurred. An interim goodwill impairment test is required if the Company believes it is more likely than not that the carrying amount of its reporting unit exceeds the reporting unit's fair value.
The Company concluded that the need for an interim goodwill impairment test was triggered as of August 31, 2022. Factors that led to this conclusion included:
(i) the continued decline in the Company's stock price and market capitalization during the third quarter of 2022,
(ii) uncertainty regarding the short-term and long-term impacts that adverse macroeconomic conditions, including inflation and rising interest rates, may have on the financial health of our Aaron's Business customers and franchisees.
The Company determined that the Aaron’s Business Reporting Unit’s goodwill was fully impaired and recorded a goodwill impairment charge of $12.9 million during the quarter ended September 30, 2022. The Company concluded that given the recency of the BrandsMart acquisition, the provisional nature of the goodwill balance, the carrying value of our acquisition accounting as preliminary and subject to adjustment during the measurement period, the BrandsMart reporting unit goodwill was not impaired as of September 30, 2022.
The Company also performed its annual goodwill impairment test on the remaining goodwill balance allocated to BrandsMart Leasing and BrandsMart reporting units as of its annual testing dates, October 1, 2022, and 2023, respectively, and determined that no impairment had occurred and that the fair value of the reporting units were in excess of their carrying amounts. The Company also determined that there were no events that occurred or circumstances that changed during the fourth quarter of 2023 that would more likely than not reduce the fair value of the reporting units below their carrying amounts.
Management engaged the assistance of a third-party valuation firm to perform the goodwill impairment tests mentioned above. This entailed assessments of the Aaron's Business, BrandsMart, and BrandsMart Leasing reporting units' fair values relative to their respective carrying values that were derived using a combination of both income and market approaches and by performing a market capitalization reconciliation, which included assessments of the control premiums implied from the Company's estimated fair values of its reporting units. The fair value measurements involved significant unobservable inputs (Level 3 inputs, as discussed more fully below). The income approaches utilized the discounted future expected cash flows, which required assumptions about short-term and long-term revenue growth or decline rates, operating margins, capital requirements, and a weighted-average cost of capital.
The market approaches, which includes the guideline public company methods, utilized pricing multiples derived from an analyses of comparable publicly traded companies. We believe the comparable companies we evaluate as marketplace participants serve as an appropriate reference when calculating fair value because those companies have similar risks, participate in similar markets, provide similar products and services for their customers, and compete with us directly.
The following table provides information related to the carrying amount of the Company’s goodwill:
83
THE AARON'S COMPANY, INC.
NOTES TO CONSOLIDATED FINANCIAL STATEMENTS
| (In Thousands) | Aaron's Business | BrandsMart | BrandsMart Leasing | Total | ||||||||||
Balance at January 1, 2022 | $ | $ | $ | $ | ||||||||||
| Acquisitions | ||||||||||||||
Currency Translation Adjustments | ( | ( | ||||||||||||
| Acquisition Accounting Adjustments | ( | ( | ( | |||||||||||
Impairment Loss | ( | ( | ||||||||||||
| Balance at December 31, 2022 | $ | $ | $ | $ | ||||||||||
| Acquisitions | ||||||||||||||
| Currency Translation Adjustments | ||||||||||||||
| Acquisition Accounting Adjustments | ||||||||||||||
| Balance at December 31, 2023 | $ | $ | $ | $ | ||||||||||
Definite-Lived Intangible Assets
The following table summarizes information related to the Company's definite-lived intangible assets at December 31:
| 2023 | 2022 | |||||||||||||||||||||||||||||||
| (In Thousands) | Gross | Accumulated Amortization | Net | Gross | Accumulated Amortization | Net | ||||||||||||||||||||||||||
| Customer Relationships | $ | $ | ( | $ | $ | $ | ( | $ | ||||||||||||||||||||||||
| Reacquired Franchise Rights | ( | ( | ||||||||||||||||||||||||||||||
| Non-Compete Agreements | ( | ( | ||||||||||||||||||||||||||||||
| Expanded Customer Base | ( | ( | ||||||||||||||||||||||||||||||
| Trade Names | ( | ( | ||||||||||||||||||||||||||||||
| Customer List | ( | ( | ||||||||||||||||||||||||||||||
| Total | $ | $ | ( | $ | $ | $ | ( | $ | ||||||||||||||||||||||||
The Company's definite-lived intangible assets were acquired in connection with store-based business acquisitions, asset acquisitions of customer contracts, franchisee acquisitions, and the BrandsMart U.S.A. acquisition. The customer relationship intangible asset is amortized on a straight-line basis over a three-year estimated useful life. Reacquired franchise rights are amortized on a straight-line basis over the remaining life of the franchisee’s ten-year license term. The non-compete intangible asset is amortized on a straight-line basis over the life of the agreement (generally to five years ). The expanded customer base intangible asset represents the estimated fair value paid in an asset acquisition for the ability to advertise and execute lease agreements with a larger pool of customers in the respective markets, and is generally amortized on a straight-line basis over to six years . The trade names acquired in the BrandsMart U.S.A. acquisition are amortized over a 20-year estimated useful life, and the customer list acquired in the BrandsMart U.S.A. acquisition is amortized over a four-year estimated useful life.
Total amortization expense of the Company's definite-lived intangible assets included in other operating expenses, net in the accompanying consolidated statements of earnings was $10.3 million, $9.3 million and $5.5 million during the years ended December 31, 2023, 2022 and 2021, respectively.
As of December 31, 2023, estimated future amortization expense for the next five years related to the Company's definite-lived intangible assets is as follows:
| (In Thousands) | |||||
| 2024 | $ | ||||
| 2025 | |||||
| 2026 | |||||
| 2027 | |||||
| 2028 | |||||
84
THE AARON'S COMPANY, INC.
NOTES TO CONSOLIDATED FINANCIAL STATEMENTS
NOTE 4: FAIR VALUE MEASUREMENT
Financial Assets and Liabilities Measured at Fair Value on a Recurring Basis
The following table summarizes financial liabilities measured at fair value on a recurring basis:
| December 31, 2023 | December 31, 2022 | ||||||||||||||||||||||||||||||||||
| (In Thousands) | Level 1 | Level 2 | Level 3 | Level 1 | Level 2 | Level 3 | |||||||||||||||||||||||||||||
| Deferred Compensation Liability | $ | $ | ( | $ | $ | $ | ( | $ | |||||||||||||||||||||||||||
| Interest Rate Swap Liability | $ | $ | ( | $ | $ | $ | $ | ||||||||||||||||||||||||||||
The Company maintains The Aaron's Company, Inc. Deferred Compensation Plan, which is an unfunded, nonqualified deferred compensation plan for a select group of management, highly compensated employees and non-employee directors. The liability represents benefits accrued for plan participants and is valued at the quoted market prices of the participants’ investment elections, which consist of equity and debt "mirror" funds. As such, the Company has classified the deferred compensation liability as a Level 2 liability, which is recorded in accounts payable and accrued expenses in the consolidated balance sheets.
In March 2023, the Company entered into an interest rate swap agreement for an aggregate notional amount of $100.0 million which is further described in Note 1 to these consolidated financial statements. The fair value of the interest rate swap agreement is derived by using widely accepted valuation techniques and reflects the contractual terms of the interest rate swap including the period to maturity and uses observable market-based inputs, including interest rate curves. The fair value associated with the interest rate swap is recorded within prepaid expenses and other assets (when the resulting fair value is an asset) or accounts payable and accrued expenses (when the resulting fair value is a liability) within the Company's consolidated balance sheets.
NOTE 5: PROPERTY, PLANT, AND EQUIPMENT
The following is a summary of the Company’s property, plant, and equipment:
| December 31 | |||||||||||
| (In Thousands) | 2023 | 2022 | |||||||||
| Land | $ | $ | |||||||||
| Buildings and Improvements | |||||||||||
| Leasehold Improvements and Signs | |||||||||||
| Vehicles | |||||||||||
| Fixtures and Equipment | |||||||||||
Software - Internal Use | |||||||||||
| Construction in Progress | |||||||||||
Less: Accumulated Depreciation and Amortization1 | ( | ( | |||||||||
| $ | $ | ||||||||||
1 Includes accumulated amortization of internal-use software development costs which amounted to $113.6 million and $93.4 million as of December 31, 2023 and 2022, respectively.
85
THE AARON'S COMPANY, INC.
NOTES TO CONSOLIDATED FINANCIAL STATEMENTS
NOTE 6: REVENUE RECOGNITION
The following table disaggregates revenue by source:
| Year Ended December 31, | |||||||||||
| (In Thousands) | 2023 | 2022 | 2021 | ||||||||
| Lease Revenues and Fees | $ | $ | $ | ||||||||
| Retail Sales | |||||||||||
| Non-Retail Sales | |||||||||||
| Franchise Royalties and Fees | |||||||||||
| Other | |||||||||||
Total1 | $ | $ | $ | ||||||||
1 Includes revenues from Canadian operations of $17.2 million, $18.6 million and $22.7 million during the years ended December 31, 2023, 2022, and 2021, which are primarily lease revenues and fees.
Lease Revenues and Fees
The Aaron's Business segment, which includes BrandsMart Leasing, provides lease merchandise, consisting of furniture, appliances, electronics, computers, and other home goods to their customers for lease under certain terms agreed to by the customer. The Aaron's Business segment offers leases with flexible ownership plans that can be generally renewed weekly, bi-weekly, semi-monthly, or monthly up to 12 , 18 or 24 months and does not require deposits upon inception of customer agreements. The customer has the right to acquire ownership either through an early purchase option or through payment of all required lease payments through the end of the ownership plan. Aaron's also offers customers the option to obtain a membership in the Aaron’s Club program. The benefits to customers of the Aaron's Club program are separated into three general categories: (a) lease protection benefits; (b) health & wellness discounts; and (c) dining, shopping and consumer savings. Lease agreements offered by the Aaron's Business segment including the Aaron's Club program memberships and BrandsMart Leasing, are cancellable at any time by either party without penalty, and as such, these offerings are renewable period to period arrangements.
Lease revenues related to the leasing of merchandise and Aaron's Club membership fees are recognized as revenue in the month they are earned. Payments received prior to the month earned are recorded as deferred lease revenue, and this amount is included in customer deposits and advance payments in the accompanying consolidated balance sheets. Substantially all of the prior year deferred lease revenue was recognized in the current year according to lease terms. Lease payments due but not received prior to month end are recorded as accounts receivable in the accompanying consolidated balance sheets. Lease revenues are recorded net of a provision for returns and uncollectible renewal payments.
All of Aaron's customer lease agreements, including BrandsMart Leasing, are considered operating leases. The Company maintains ownership of the lease merchandise until all payment obligations are satisfied under lease agreements. Initial direct costs related to customer agreements are expensed as incurred and have been classified as other operating expenses, net in the accompanying consolidated statements of earnings. The consolidated statements of earnings effects of expensing the initial direct costs as incurred are not materially different from amortizing initial direct costs over the lease ownership plan.
Substantially all lease revenues and fees were within the scope of ASC 842, Leases, during the years ended December 31, 2023, 2022, and 2021. Included in lease revenues and fees above, the Company had $24.8 million, $27.2 million and $27.3 million of other revenue during the years ended December 31, 2023, 2022, and 2021, respectively, within the scope of ASC 606, Revenue from Contracts with Customers, which is included in lease revenues and fees above in the accompanying consolidated statements of earnings.
86
THE AARON'S COMPANY, INC.
NOTES TO CONSOLIDATED FINANCIAL STATEMENTS
Retail Sales
All retail sales revenue is within the scope of ASC 606, Revenue from Contracts with Customers, during the years ended December 31, 2023, 2022 and 2021.
Aaron's Business
Revenues from the retail sale of lease merchandise to individual consumers are recognized at the point of sale and are recorded within retail sales in the accompanying consolidated statements of earnings. Generally, the transfer of control occurs near or at the point of sale for retail sales. Aaron's Business retail sales are not subject to a returns policy. All retail sales revenue is within the scope of ASC 606, Revenue from Contracts with Customers, during the years ended December 31, 2023, 2022 and 2021.
BrandsMart
Revenues from the retail sale of merchandise inventories are recorded within retail sales in the accompanying consolidated statements of earnings and are recognized at a point in time that the Company has satisfied its performance obligation and transferred control of the product to the respective customer. Revenues associated with retail sales transactions for which control has not transferred are deferred and are recorded within customer deposits and advance payments within the accompanying consolidated balance sheets. Substantially all of the prior year deferred retail sales were recognized in the current year.
Retails sales at the BrandsMart segment, both in store and online, are subject to the segment's 30-day return policy. Accordingly, an allowance, based on historical returns experience, for sales returns is recorded as a component of retail sales in the period in which the related sales are recorded as well as an asset for the returned merchandise. The return asset and allowance for sales returns was $2.5 million and $3.4 million as of December 31, 2023 and $3.0 million and $4.0 million as of December 31, 2022, respectively. The return asset and allowance for sales returns was recorded within prepaid and other assets and accounts payable and accrued expenses within the accompanying consolidated balance sheets, respectively.
Additional protection plans can be purchased by BrandsMart U.S.A. customers that provides extended warranty coverage on their product purchases, with payment being due for this protection at the point of sale. A third-party underwriter assumes the risk associated with the coverage and is primarily responsible for fulfillment. The Company is an agent to the contract and records the fixed commissions. These fixed commissions on the warranty coverages are included within retail sales in the accompanying consolidated statements of earnings on a net basis.
Non-Retail Sales
Revenues for the non-retail sale of merchandise to Aaron's franchisees are recognized when control transfers to the franchisee, which is upon delivery of the merchandise and are recorded within non-retail sales in the accompanying statements of earnings. All non-retail sales revenue is within the scope of ASC 606, Revenue from Contracts with Customers, during the years ended December 31, 2023, 2022 and 2021.
Franchise Royalties and Fees
We have existing agreements with our current Aaron's franchisees to govern the operations of franchised stores. Our standard agreement is for a term of ten years , with one ten-year renewal option. Franchisees are obligated to remit to us royalty payments of 6 % of the weekly cash revenue payments received, which is recognized as the fees become due.
The Company guarantees certain debt obligations of some of the franchisees and receives guarantee fees based on the outstanding debt obligations of such franchisees. Refer to Note 10 to these consolidated financial statements for additional discussion of the franchise-related guarantee obligation. The Company also charges fees for advertising efforts that benefit the franchisees, which are recognized at the time the advertising takes place.
Substantially all franchise royalties and fee revenue is within the scope of ASC 606, Revenue from Contracts with Customers. Of the franchise royalties and fees, $17.8 million, $18.6 million and $19.8 million during the years ended December 31, 2023, 2022 and 2021 respectively, is related to franchise royalty income that is recognized as the fees become due. The remaining revenue is primarily related to advertising fees charged to franchisees. Franchise royalties and fees are recorded within franchise royalties and other revenues in the accompanying consolidated statements of earnings.
87
THE AARON'S COMPANY, INC.
NOTES TO CONSOLIDATED FINANCIAL STATEMENTS
NOTE 7: LEASES
Lessor Information
Refer to Note 6 to these consolidated financial statements for further information about the Company's revenue generating activities as a lessor. All of the Company's customer lease agreements are considered operating leases, and the Company currently does not have any sales-type or direct financing leases.
Lessee Information
The Company leases retail store and warehouse space for most of its store-based operations, as well as corporate office space for store and e-commerce supporting functions (collectively "real estate leases"), transportation vehicles, and office equipment under operating leases expiring at various times through 2038. The Company does not record lease liability or right-of-use assets for any leases that have a lease term of under 12 months or less at commencement. For all leases in which it is a lessee, the Company has elected to include both lease and non-lease components as a single component and account for it as a lease. Operating lease costs are recorded on a straight-line basis and are primarily classified within other operating expenses, net in the consolidated statements of earnings.
Real Estate Leases
Most of the Company’s real estate leases contain renewal options for additional periods ranging from to 20 years. At lease inception or upon modification, the Company does not consider renewal options to be reasonably certain for exercise except for leases associated with restructuring programs described in Note 11 to these consolidated financial statements. Additionally, renewal option rental rates are in line with market rates and do not include significant penalties or business disruptions if the Company elects not to exercise. Leases related to restructuring programs variable occupancy costs that continue to be incurred after the impairment of operating lease right-of-use assets are recognized within restructuring expenses, net in the consolidated statements of earnings.
Residual Value Guarantees
Real estate and office equipment leases do not contain any material residual value guarantees; however, vehicle leases include a residual value that is guaranteed to the lessor, which ensures that the vehicles will be returned to the lessor in reasonable working condition.
Other Lease Information
The Company did not have any finance lease costs in 2023 or 2022. In 2021, finance lease costs and their associated cash flow impacts were immaterial. The Company’s total operating lease costs are comprised of the following:
Year Ended December 31, | |||||||||||||||||
| (In Thousands) | 2023 | 2022 | 2021 | ||||||||||||||
| Operating Lease cost: | |||||||||||||||||
Non-Cash Lease Expense classified within Other Operating Expenses, Net1 | |||||||||||||||||
Non-Cash Lease Expense classified within Restructuring Expenses, Net2 | |||||||||||||||||
Sublease Receipts3 | ( | ( | ( | ||||||||||||||
| Total Operating Lease cost | $ | $ | $ | ||||||||||||||
1 Includes short-term and variable lease costs, which are not significant. Short-term lease expense include lease terms of greater than one month, but not greater than 12 months.
2 Excludes right-of-use asset impairment charges of $3.1 million, $11.2 million and $4.2 million recognized during the years ended December 31, 2023, 2022 and 2021, respectively, which were recognized within restructuring expenses, net in the consolidated statements of earnings and within impairment of assets in the consolidated statements of cash flows.
88
THE AARON'S COMPANY, INC.
NOTES TO CONSOLIDATED FINANCIAL STATEMENTS
Additional information regarding the Company’s leasing activities is as follows:
Year Ended December 31, | |||||||||||||||||
| (In Thousands) | 2023 | 2022 | 2021 | ||||||||||||||
Cash paid for amounts included in measurement of Operating Lease Liabilities | |||||||||||||||||
Right-of-Use Assets obtained in exchange for new Operating Lease Liabilities1 | $ | $ | $ | ||||||||||||||
1 During the year ended December 31, 2022, $160.2 million of the right-of-use assets obtained in exchange for new operating lease liabilities relates to the acquisition of BrandsMart U.S.A. The carrying value of these right-of-use assets was subsequently reduced by the $6.8 million value of the off-market element of the BrandsMart U.S.A. lease agreements, which is reflected in the amounts noted in the table above.
The Company uses its incremental borrowing rate as the discount rate for its leases, as the implicit rate in the lease is not readily determinable. Below is a summary of the weighted-average discount rate and weighted-average remaining lease term for operating leases:
| December 31, | ||||||||||||||
| 2023 | 2022 | |||||||||||||
Weighted Average Discount Rate1 | Weighted Average Remaining Lease Term (in years) | Weighted Average Discount Rate | Weighted Average Remaining Lease Term (in years) | |||||||||||
| Operating Leases | % | % | ||||||||||||
The table below is a summary of undiscounted operating lease liabilities that have terms in excess of one year and reconciles to the present value of the operating lease liabilities included in the consolidated balance sheets as of December 31, 2023.
| (In Thousands) | Total | ||||
2024 | $ | ||||
2025 | |||||
2026 | |||||
2027 | |||||
2028 | |||||
| Thereafter | |||||
Total Future Undiscounted Cash Flows1 | |||||
| Less: Interest | |||||
| Present Value of Lease Liabilities | $ | ||||
1 Future undiscounted cash flows do not include $6.0 million of future operating lease payments for leases that have not yet commenced. These leases will commence during 2024.
Sale-Leaseback Transactions
The Company entered into one and four sale and leaseback transactions during the years ended December 31, 2023, and 2022, respectively. The 2023 transaction related to five Company-owned Aaron’s store properties and the 2022 transactions related to a total of seven Company-owned Aaron’s store properties. Net proceeds from the sales were $9.1 million and $12.9 million, respectively. Proceeds are presented within proceeds from dispositions of property, plant, and equipment in the consolidated statement of cash flows. The Company recognized gains of $5.4 million in 2023 and $8.5 million in 2022, which were classified within other operating expenses, net in the consolidated statements of earnings.
89
THE AARON'S COMPANY, INC.
NOTES TO CONSOLIDATED FINANCIAL STATEMENTS
NOTE 8: INDEBTEDNESS
The following is a summary of the Company’s debt, net of applicable unamortized debt issuance costs:
| (In Thousands) | December 31, 2023 | December 31, 2022 | |||||||||
| Revolving Facility | $ | $ | |||||||||
Term Loan, Due in Installments through April 20271 | |||||||||||
| Total Outstanding Borrowings under the Credit Facility | |||||||||||
| Total Debt | |||||||||||
| Less: Current Maturities | |||||||||||
| Long-Term Debt | $ | $ | |||||||||
1 Includes unamortized debt issuance costs of $0.6 million and $0.7 million at December 31, 2023 and December 31, 2022. The Company has included $2.2 million and $2.9 million of debt issuance costs as of December 31, 2023 and December 31, 2022, respectively, related to the revolving credit facility within prepaid expenses and other assets in the consolidated balance sheets.
Revolving Credit Facility and Term Loan
To finance the BrandsMart U.S.A. acquisition, on April 1, 2022 the Company entered into a new unsecured credit facility (the "Credit Facility") which replaced its previous $250 million unsecured credit facility. The Credit Facility provides for a $175 million term loan (the "Term Loan") and a $375 million revolving credit facility (the "Revolving Facility"), which includes (i) a $35 million sublimit for the issuance of letters of credit on customary terms, and (ii) a $35 million sublimit for swing line loans on customary terms. The Company pays a commitment fee on unused balances related to the revolving facility, which ranges from 0.20 % to 0.30 % as determined by the Company's ratio of total net debt to EBITDA (as defined by the agreement). All borrowings for swing line loans under the Revolving Facility are short-term in nature. The weighted average interest rate on the outstanding short-term borrowings as of December 31, 2023, under the Revolving Facility was 7.08 %.
On April 1, 2022, the Company borrowed $175 million under the Term Loan and $117 million under the Revolving Facility to finance the purchase price for the BrandsMart U.S.A. acquisition and other customary acquisition and financing-related closing costs and adjustments. The Company expects that future additional borrowings under the Revolving Facility will be used to provide for working capital and capital expenditures, to finance future permitted acquisitions and for other general corporate purposes. As of December 31, 2023, $169.5 million and $25.0 million remained outstanding under the Term Loan and Revolving Facility, respectively, compared to $173.9 million and $69.3 million outstanding at December 31, 2022.
Borrowings under the Revolving Facility and the Term Loan bear interest at a rate per annum equal to, at the option of the Company, (i) the forward-looking term rate based on SOFR plus an applicable margin ranging between 1.50 % and 2.25 %, based on the Company's Total Net Debt to EBITDA Ratio, or (ii) the base rate (as defined in the Credit Facility) plus an applicable margin, which is 1.00 % lower than the applicable margin for SOFR loans.
The loans and commitments under the Revolving Facility mature or terminate on April 1, 2027. The Term Loan amortizes in quarterly installments, commencing on December 31, 2022, in an aggregate annual amount equal to (i) 2.50 % of the original principal amount of the Term Loan during the first and second years after the closing date, (ii) 5.00 % of the original principal amount of the Term Loan during the third, fourth and fifth years after the closing date, with the remaining principal balance of the Term Loan to be due and payable in full on April 1, 2027.
On February 23, 2024, the Company amended its revolving credit and term loan agreement (the "Credit Facility") to, among other things: (i) decrease the Revolving Facility commitment from $375 million to $275 million, (ii) include a Security Agreement consisting of a first priority lien (subject to Permitted Liens) on certain agreed upon assets of the Borrower and Guarantors, including a pledge of the capital stock of all existing and future Material Subsidiaries of Holdings and excluding Real Property, and (iii) amend the existing Fixed Charge Coverage Ratio to lower the required minimum threshold.
Franchise Loan Facility Amendment
On April 1, 2022, the Company also entered into a new $12.5 million unsecured franchise loan facility (the "Franchise Loan Facility"), which replaced its previous $15.0 million amended and restated unsecured franchise loan facility dated as of November 10, 2021. The Franchise Loan Facility operates as a guarantee by the Company of certain debt obligations of certain Aaron's franchisees (the "Borrower") under a franchise loan program.
90
THE AARON'S COMPANY, INC.
NOTES TO CONSOLIDATED FINANCIAL STATEMENTS
In the event these franchisees are unable to meet their debt service payments or otherwise experience an event of default, the Company would be unconditionally liable for the outstanding balance of the franchisees’ debt obligations under the Franchise Loan Facility, which would be due in full within 90 days of such event of default. Borrowings under the Franchise Loan Facility bear interest at a rate per annum equal to SOFR plus an applicable margin ranging between 1.50 % and 2.25 %, based on the Company's Total Net Debt to EBITDA Ratio (as defined in the Franchise Loan Facility). The Franchise Loan Facility is available for a period of 364 days commencing on April 1, 2022, and permits the Borrower to request extensions for additional 364 -day periods. As of December 31, 2023, the Franchise Loan Facility has a total commitment amount of $10.0 million and a maturity date of March 30, 2024, due to amendments executed in 2023. On February 23, 2024, the Company amended its Franchise Loan Facility to conform to the changes resulting from the amendment to its Credit Facility (described above), and to extend the maturity date to March 29, 2025.
Financial Covenants
The Credit Facility and the Franchise Loan Facility contain customary financial covenants including (a) a maximum Total Net Debt to EBITDA Ratio of 2.75 to 1.00 and (b) a minimum Fixed Charge Coverage Ratio of 1.75 to 1.00.
If the Company fails to comply with these covenants, the Company will be in default under these agreements, and all borrowings outstanding could become due immediately. Under the Credit Facility and Franchise Loan Facility, the Company may pay cash dividends in any year so long as, after giving pro forma effect to the dividend payment, the Company maintains compliance with its financial covenants and no event of default has occurred or would result from the payment. The Company is in compliance with all of these covenants at December 31, 2023.
The table below shows all scheduled maturities for borrowings outstanding under the Revolving Facility and Term Loan as of December 31, 2023:
| (In Thousands) | Total | ||||
| 2024 | $ | ||||
| 2025 | |||||
| 2026 | |||||
20271 | |||||
| Total | $ | ||||
1 Amount includes $25.0 million of outstanding borrowings under the Revolving Facility as of December 31, 2023.
91
THE AARON'S COMPANY, INC.
NOTES TO CONSOLIDATED FINANCIAL STATEMENTS
NOTE 9: INCOME TAXES
On April 1, 2022, the Company acquired BrandsMart U.S.A. in a deemed asset acquisition for federal and state income tax purposes. Due to the early adoption of ASU 2021-08, the Company recorded a deferred tax asset of $1.1 million related to the assumed acquisition date fair value of deferred revenue with an offsetting reduction to goodwill. No additional deferred tax assets or liabilities were recorded as part of business combination accounting.
The following is a summary of the Company’s income tax (benefit) expense:
| Year Ended December 31, | |||||||||||||||||
| (In Thousands) | 2023 | 2022 | 2021 | ||||||||||||||
| Current Income Tax (Benefit) Expense | |||||||||||||||||
| Federal | $ | $ | $ | ||||||||||||||
| State | |||||||||||||||||
| Foreign | ( | ( | |||||||||||||||
| Deferred Income Tax (Benefit) Expense: | |||||||||||||||||
| Federal | ( | ( | |||||||||||||||
| State | ( | ( | |||||||||||||||
| Foreign | |||||||||||||||||
| ( | ( | ||||||||||||||||
| Income Tax (Benefit) Expense | $ | ( | $ | ( | $ | ||||||||||||
Significant components of the Company’s deferred income tax liabilities and assets are as follows:
| December 31, | |||||||||||
| (In Thousands) | 2023 | 2022 | |||||||||
| Deferred Tax Liabilities: | |||||||||||
| Lease Merchandise and Property, Plant and Equipment | $ | $ | |||||||||
| Operating Lease Right-of-Use Assets | |||||||||||
Prepaid Expenses | |||||||||||
| Other, Net | |||||||||||
| Total Deferred Tax Liabilities | |||||||||||
| Deferred Tax Assets: | |||||||||||
| Goodwill and Other Intangibles | |||||||||||
| Accrued Liabilities | |||||||||||
| Advance Payments | |||||||||||
| Operating Lease Liabilities | |||||||||||
| Net Operating Loss | |||||||||||
Stock-Based Compensation | |||||||||||
263A Inventory Capitalization | |||||||||||
Other Comprehensive Income | |||||||||||
| Other, Net | |||||||||||
| Total Deferred Tax Assets | |||||||||||
| Less Valuation Allowance | |||||||||||
| Net Deferred Tax Liabilities | $ | $ | |||||||||
92
THE AARON'S COMPANY, INC.
NOTES TO CONSOLIDATED FINANCIAL STATEMENTS
Activity in the Company's deferred tax asset valuation allowance is as follows:
| Year Ended | |||||||||||
| (In Thousands) | December 31, 2023 | December 31, 2022 | |||||||||
Beginning Balance | $ | $ | |||||||||
Valuation allowance provided for taxes related to: | |||||||||||
State net operating loss carryforwards | |||||||||||
| Ending Balance | $ | $ | |||||||||
The Company’s effective tax rate differs from the statutory United States federal income tax rate as follows:
| Year Ended December 31, | |||||||||||||||||
| 2023 | 2022 | 2021 | |||||||||||||||
| Statutory Rate | % | % | % | ||||||||||||||
| Increases (Decreases) in United States Federal Taxes | |||||||||||||||||
| Resulting From: | |||||||||||||||||
| State Income Taxes, net of Federal Income Tax Benefit | ( | ||||||||||||||||
Nondeductible Officers Compensation | ( | ( | |||||||||||||||
Permanent Differences | ( | ( | |||||||||||||||
| Remeasurement of net Deferred Tax Liabilities | |||||||||||||||||
| Federal Tax Credits | ( | ||||||||||||||||
Stock-Based Compensation - Tax Deficiency | ( | ( | |||||||||||||||
Valuation Allowance | ( | ||||||||||||||||
| Other, net | ( | ||||||||||||||||
| Effective Tax Rate | % | % | % | ||||||||||||||
The net income tax benefit recognized in 2022 includes a $5.1 million deferred income tax benefit generated by the remeasurement of state deferred tax assets and liabilities in connection with the acquisition of BrandsMart U.S.A.
The net income tax benefit recognized in 2023 includes a $5.3 million deferred income tax benefit generated by the remeasurement of state deferred tax assets and liabilities in connection with an election to file a consolidated state income tax return and a change in the expected state apportionment percentages related to an election to treat Aaron's, LLC, a subsidiary of the Company, as a corporation for income tax purposes effective January 1, 2023.
At December 31, 2023, the Company had $0.2 million of federal tax credit carryforwards which will begin to expire in 2031. In addition, at December 31, 2023, the Company had $8.2 million of tax-effected state net operating loss carryforwards which will begin to expire in 2027 and state tax credit carryforwards of $0.8 million which will begin to expire in 2031.
A valuation allowance has been provided where it is more likely than not that deferred tax assets related to state net operating loss carryforwards will not be realized. As of December 31, 2023, the valuation allowance totaled $0.4 million for state net operating loss carryforwards.
The Company files a federal income tax return in the United States and files in various state and foreign jurisdictions. The Company filed its initial U.S. federal income tax return for the year ended December 31, 2020; currently, there are no open IRS examinations. With few exceptions, the Company is no longer subject to foreign and state and local tax examinations by tax authorities for years before 2020.
93
THE AARON'S COMPANY, INC.
NOTES TO CONSOLIDATED FINANCIAL STATEMENTS
The following table summarizes the activity related to the Company’s uncertain tax positions:
| Year Ended December 31, | |||||||||||||||||
| (In Thousands) | 2023 | 2022 | 2021 | ||||||||||||||
| Balance at January 1, | $ | $ | $ | ||||||||||||||
| Additions Based on Tax Positions Related to the Current Year | |||||||||||||||||
| Additions for Tax Positions of Prior Years | |||||||||||||||||
| Prior Year Reductions | ( | ||||||||||||||||
| Statute Expirations | ( | ( | ( | ||||||||||||||
| Settlements | |||||||||||||||||
| Amounts Transferred to Former Parent | |||||||||||||||||
| Balance at December 31, | $ | $ | $ | ||||||||||||||
As of December 31, 2023, 2022 and 2021, the amount of uncertain tax benefits that, if recognized, would affect the effective tax rate is $0.7 million, $0.5 million and $0.5 million, respectively, including interest and penalties.
NOTE 10: COMMITMENTS AND CONTINGENCIES
Guarantees
The Company has guaranteed certain debt obligations of some of its Aaron's franchisees under a franchise loan program (the "Franchise Loan Facility") as described in further detail in Note 8 to these consolidated financial statements. The Company has recourse rights to franchisee assets securing the debt obligations, which consist primarily of lease merchandise and fixed assets. Since the inception of the franchise loan program in 1994, the Company's losses associated with the program have been insignificant. However, such losses could be significant in a future period due to potential adverse trends in the liquidity and/or financial performance of Aaron's franchisees resulting in an event of default or impending defaults by franchisees.
The Company entered into a new Franchise Loan Facility agreement on April 1, 2022, which has been amended several times since that date. As of December 31, 2023, the Franchise Loan Facility has a total commitment amount of $10.0 million and a commitment termination date of March 30, 2024. On February 23, 2024, the Company amended its Franchise Loan Facility to conform to the changes resulting from the amendment to its Credit Facility (described above), and to extend the maturity date to March 29, 2025. At December 31, 2023, the maximum amount that the Company would be obligated to repay in the event franchisees defaulted was $4.9 million. The Company is subject to financial covenants under the Franchise Loan Facility as detailed in Note 8 to these consolidated financial statements. At December 31, 2023, the Company was in compliance with all covenants under the Franchise Loan Facility agreement.
The Company records a liability related to estimated future losses from repaying the franchisees' outstanding debt obligations upon any possible future events of default. This liability is included in accounts payable and accrued expenses in the consolidated balance sheets and was $1.0 million and $1.3 million at December 31, 2023 and 2022, respectively. The balances at December 31, 2023 and 2022 included qualitative consideration of potential losses, associated with uncertainties impacting the operations and liquidity of our franchisees. Uncertainties include inflationary pressures in the current macroeconomic environment.
94
THE AARON'S COMPANY, INC.
NOTES TO CONSOLIDATED FINANCIAL STATEMENTS
Legal Proceedings
From time to time, the Company is party to various legal and regulatory proceedings arising in the ordinary course of business, certain of which have been described below. The Company establishes an accrued liability for legal and regulatory proceedings when it determines that a loss is both probable and the amount of the loss can be reasonably estimated. The Company continually monitors its litigation and regulatory exposure and reviews the adequacy of its legal and regulatory reserves on a quarterly basis. The amount of any loss ultimately incurred in relation to matters for which an accrual has been established may be higher or lower than the amounts accrued for such matters due to the inherent uncertainty in litigation, regulatory and similar adversarial proceedings, and substantial losses from these proceedings or the costs of defending them could have a material adverse impact upon the Company’s business, financial position, and results of operations.
At December 31, 2023 and 2022, the Company had accrued $0.7 million and $2.7 million, respectively, for pending legal and regulatory matters for which it believes losses are probable and is management’s best estimate of its exposure to loss. The Company records these liabilities in accounts payable and accrued expenses in the consolidated balance sheets.
Those matters for which a loss is reasonably possible but not probable and those matters for which a reasonable estimate is not possible are not included within these estimated ranges and, therefore, the estimated ranges do not represent the Company’s maximum loss exposure.
In Jacob Atkinson v. Aaron’s, LLC dba Aaron’s Sales & Lease Ownership, LLC, Civil Action No. 2:23-cv-01742-BJR (W.D. Wash.), filed on October 11, 2023, currently before the United States District Court for the Western District of Washington, plaintiff alleges that the Company violated Washington’s Equal Pay and Opportunity Act, RCW 49.58.110, because certain of the Company’s job postings did not include a wage scale or salary range. Because the statute is new, issues including standing, applicability as to who it covers, and the constitutionality of the statutory penalty have not been determined. Plaintiff seeks injunctive and declaratory relief and also seeks certification of a putative class. On January 22, 2024, the Company filed a motion to dismiss the lawsuit.
The assessment as to whether a loss is probable or reasonably possible, and as to whether such loss or a range of such losses is estimable, often involves significant judgment about future events, and the outcome of litigation is inherently uncertain. Other than as described above, there is no material pending or threatened litigation against the Company that remains outstanding as of December 31, 2023.
Other Contingencies
At December 31, 2023, the Company had non-cancelable commitments primarily related to certain advertising and marketing programs, software licenses, and hardware and software maintenance of $18.0 million. Payments under these commitments are scheduled to be $11.3 million in 2024, $5.6 million in 2025 and $1.1 million in 2026.
Management regularly assesses the Company’s insurance deductibles, monitors litigation and regulatory exposure with the Company’s attorneys, and evaluates its loss experience. The Company also enters into various contracts in the normal course of business that may subject it to risk of financial loss if counterparties fail to perform their contractual obligations.
NOTE 11: RESTRUCTURING
As management continues to execute on its long-term strategic plan, additional benefits and charges are expected to result from our restructuring programs. The extent of any future charges related to our restructuring programs are not currently estimable and depend on various factors including the timing and scope of future cost optimization initiatives.
Operational Efficiency and Optimization Restructuring Program
During the third quarter of 2022, the Company initiated the Operational Efficiency and Optimization Restructuring Program intended to strengthen operational efficiencies and reduce the Company’s overall costs. Management believes that this restructuring program will help the Company sharpen its operational focus, optimize its cost profile, allocate capital resources towards long-term strategic objectives, and generate incremental value for shareholders through investments in technological capabilities, and fulfillment center logistics competencies. Since initiation, the program resulted in the closure or consolidation of 38 Company-operated Aaron's stores through the year ended December 31, 2023. This program also includes the Hub and Showroom model to optimize labor in markets, store labor realignments, optimization of the Company's supply chain, the centralization and optimization of store support center, operations, and multi-unit store oversight functions, as well as other real estate and third party spend costs reductions.
95
THE AARON'S COMPANY, INC.
NOTES TO CONSOLIDATED FINANCIAL STATEMENTS
Total net restructuring expenses under the Operational Efficiency and Optimization Restructuring Program related to the initiatives described above were $6.4 million during the year ended December 31, 2023. Such expenses were recorded within the Unallocated Corporate category for segment reporting and were comprised mainly of professional advisory fees, severance, operating lease right-of-use asset impairment charges, fixed asset impairment charges and continuing variable occupancy costs incurred related to closed stores. Management expects future restructuring expenses (reversals) due to potential early buyouts of leases with landlords, as well as continuing variable occupancy costs related to closed stores.
Since inception of the Operational Efficiency and Optimization Restructuring Program, the Company has incurred charges of $18.0 million under the plan. These cumulative charges are primarily comprised of operating lease right-of-use asset and fixed impairment charges, continuing variable occupancy costs incurred related to closed stores, professional advisory fees, and severance related to reductions in its store support center and Aaron's Business store oversight functions.
In January 2024, the Company completed a headcount reduction of its store support center to more closely align with current business conditions resulting in the recognition of $2.1 million in severance charges.
Real Estate Repositioning and Optimization Restructuring Program
During the first quarter of 2020, the Company initiated a real estate repositioning and optimization restructuring program. This program includes a strategic plan to remodel, reposition, and consolidate our Company-operated Aaron's store footprint over the next to three years . We believe that such strategic actions will allow Aaron's to continue to successfully serve our markets while continuing to utilize our growing aarons.com platform. Management expects that this strategy, along with our increased use of technology, will enable us to reduce store count while retaining a significant portion of our existing customer relationships as well as attract new customers. Since initiation, the program has resulted in the closure, consolidation, or relocation of 250 Company-operated stores through 2023. This program also resulted in the closure of one administrative store support building and a further rationalization of our store support center staff, which included a reduction in employee headcount in those areas to more closely align with current business conditions. As of December 31, 2023, we have identified approximately 12 remaining stores for closure, consolidation, or relocation that have not yet been closed and vacated, which generally are expected to close during 2024.
Total net restructuring expenses under the real estate repositioning and optimization restructuring program of $9.2 million were recorded for the year ended December 31, 2023. Restructuring expenses were recorded within the Unallocated Corporate category for segment reporting and were comprised mainly of operating lease right-of-use asset and fixed asset impairment charges related to the vacancy or planned vacancy of stores identified for closure.
Since inception of the real estate repositioning and optimization program, the Company has incurred charges of $70.8 million under the plan. These cumulative charges are primarily comprised of operating lease right-of-use asset and fixed impairment charges, losses recognized related to contractual lease obligations, and severance related to reductions in store support center and field support staff headcount. We expect future restructuring expenses (reversals) due to potential future early buyouts of leases with landlords, as well as continuing variable occupancy costs related to closed stores.
The following table summarizes restructuring charges incurred under the Company's restructuring programs:
| Year Ended December 31, | |||||||||||||||||
| (In Thousands) | 2023 | 2022 | 2021 | ||||||||||||||
| Right-of-Use Asset Impairment | $ | $ | $ | ||||||||||||||
Operating Lease Charges | |||||||||||||||||
| Fixed Asset Impairment | |||||||||||||||||
| Severance | |||||||||||||||||
| Professional Advisory Fees | |||||||||||||||||
| Other Expenses | |||||||||||||||||
| Gain on Sale of Store Properties | ( | ( | ( | ||||||||||||||
| Total Restructuring Expenses, Net | $ | $ | $ | ||||||||||||||
96
THE AARON'S COMPANY, INC.
NOTES TO CONSOLIDATED FINANCIAL STATEMENTS
The following table summarizes the corresponding accrual balances as of December 31, 2023 and December 31, 2022 for the restructuring programs:
| (In Thousands) | Severance | Operating Lease Charges1 | Professional Advisory Fees | ||||||||
| Balance at December 31, 2022 | $ | $ | $ | ||||||||
| Restructuring Charges | $ | $ | $ | ||||||||
| Payments | $ | ( | $ | ( | $ | ( | |||||
Balance at December 31, 2023 | $ | $ | $ | ||||||||
NOTE 12. SEGMENTS
Segment Reporting
For all periods prior to April 1, 2022, the Company only had one two
The Aaron's Business segment provides consumers with LTO and retail purchase solutions through the Company's Aaron's stores, along with its franchisees, in the United States and Canada and the aarons.com e-commerce platform. In addition, the Aaron's Business segment includes the operations of BrandsMart Leasing, which offers a lease-to-own solution to customers of BrandsMart U.S.A., and Woodhaven, which manufactures and supplies a significant portion of the upholstered furniture leased and sold in Company-operated and franchised Aaron's stores.
The BrandsMart segment includes the operations of BrandsMart U.S.A. (other than BrandsMart Leasing), which is one of the leading appliance and consumer electronics retailers in the southeastern United States and one of the largest appliance retailers in the country with 11 stores in Florida and Georgia and a growing e-commerce presence on brandsmartusa.com. The results of BrandsMart have been included in the Company's consolidated results from the April 1, 2022 acquisition date.
Measurement of Segment Profit or Loss and Segment Assets
The Company evaluates segment performance based primarily on revenues and earnings (loss) from operations before unallocated corporate costs, which are evaluated on a consolidated basis and not allocated to the Company's business segments. Intersegment sales between BrandsMart and the Aaron's Business pertaining to BrandsMart Leasing, are recognized at retail prices. Since the intersegment profit affects cost of goods sold, depreciation and lease merchandise valuation, they are adjusted when intersegment profit is eliminated in consolidation. The Company determines earnings (loss) before income taxes for all reportable segments in accordance with U.S. GAAP.
Unallocated Corporate costs are presented separately and generally include unallocated costs associated with the following: equity-based compensation, interest income and expense, information security, executive compensation, legal and compliance, corporate governance, accounting and finance, human resources and other corporate functions. The Unallocated Corporate category also includes acquisition-related costs, restructuring charges and separation costs for which the individual operating segments are not being evaluated.
The Company does not evaluate performance or allocate resources based on segment asset data, and therefore total segment assets are not presented.
97
THE AARON'S COMPANY, INC.
NOTES TO CONSOLIDATED FINANCIAL STATEMENTS
| Year Ended December 31, 2023 | ||||||||||||||
| (In Thousands) | Aaron's Business | BrandsMart | Elimination of Intersegment Revenues | Total | ||||||||||
| Lease Revenues and Fees | $ | $ | $ | $ | ||||||||||
| Retail Sales | ( | |||||||||||||
| Non-Retail Sales | ||||||||||||||
| Franchise Royalties and Fees | ||||||||||||||
| Other | ||||||||||||||
| Total | $ | $ | $ | ( | $ | |||||||||
| Year Ended December 31, 2023 | |||||||||||||||||
| (In Thousands) | Aaron's Business1 | BrandsMart | Unallocated Corporate2 | Elimination | Total | ||||||||||||
| Gross Profit | $ | $ | $ | $ | ( | $ | |||||||||||
| Earnings (Loss) Before Income Taxes | ( | ( | ( | ( | |||||||||||||
Depreciation and Amortization3 | |||||||||||||||||
| Capital Expenditures | |||||||||||||||||
1 Earnings before income taxes for the Aaron's Business segment during the year ended December 31, 2023 included gains of $5.4 million related to a sale and leaseback transaction for five Company-owned Aaron's store properties.
2 The loss before income taxes for the Unallocated Corporate category during the year ended December 31, 2023 was impacted by restructuring charges of $15.6 million, BrandsMart U.S.A. acquisition-related costs of $3.6 million and separation-related costs of $0.2 million.
3 Excludes depreciation of lease merchandise, which is not included in the chief operating decision maker's measure of depreciation and amortization.
| Year Ended December 31, 2022 | ||||||||||||||
| (In Thousands) | Aaron's Business | BrandsMart | Elimination of Intersegment Revenues | Total | ||||||||||
| Lease Revenues and Fees | $ | $ | $ | $ | ||||||||||
| Retail Sales | ( | |||||||||||||
| Non-Retail Sales | ||||||||||||||
| Franchise Royalties and Fees | ||||||||||||||
| Other | ||||||||||||||
| Total | $ | $ | $ | ( | $ | |||||||||
| Year Ended December 31, 2022 | |||||||||||||||||
| (In Thousands) | Aaron's Business1 | BrandsMart2 | Unallocated Corporate3 | Elimination | Total | ||||||||||||
| Gross Profit | $ | $ | $ | $ | ( | $ | |||||||||||
Earnings (Loss) Before Income Taxes | ( | ( | ( | ( | |||||||||||||
Depreciation and Amortization4 | |||||||||||||||||
| Capital Expenditures | |||||||||||||||||
1 Earnings before income taxes for the Aaron's Business segment during the year ended December 31, 2022 included gains of $8.5 million related to sale and leaseback transactions for seven Company-owned Aaron's store properties.
2 The loss before income taxes for the BrandsMart segment during the year ended December 31, 2022 was impacted by a one-time, non-cash charge for a fair value adjustment to the acquired merchandise inventories of $23.1 million.
98
THE AARON'S COMPANY, INC.
NOTES TO CONSOLIDATED FINANCIAL STATEMENTS
3 The loss before income taxes for the Unallocated Corporate category during the year ended December 31, 2022 was impacted by restructuring charges of $32.7 million, BrandsMart U.S.A. acquisition-related costs of $14.6 million, a goodwill impairment charge of $12.9 million to fully write-off the goodwill balance of the Aaron's Business reporting unit and separation-related costs of $1.2 million.
4 Excludes depreciation of lease merchandise, which is not included in the chief operating decision maker's measure of depreciation and amortization.
| Year Ended December 31, 2021 | ||||||||||||||
| (In Thousands) | Aaron's Business | BrandsMart | Elimination of Intersegment Revenues | Total | ||||||||||
| Lease Revenues and Fees | $ | $ | $ | $ | ||||||||||
| Retail Sales | ||||||||||||||
| Non-Retail Sales | ||||||||||||||
| Franchise Royalties and Fees | ||||||||||||||
| Other | ||||||||||||||
| Total | $ | $ | $ | $ | ||||||||||
| Year Ended December 31, 2021 | |||||||||||||||||
| (In Thousands) | Aaron's Business | BrandsMart | Unallocated Corporate2 | Elimination | Total | ||||||||||||
| Gross Profit | $ | $ | $ | $ | $ | ||||||||||||
Earnings (Loss) Before Income Taxes | ( | ||||||||||||||||
Depreciation and Amortization1 | |||||||||||||||||
| Capital Expenditures | |||||||||||||||||
1 Excludes depreciation of lease merchandise, which is not included in the chief operating decision maker's measure of depreciation and amortization.
NOTE 13: STOCK COMPENSATION
Description of Plans
The Company grants stock options, RSUs, RSAs and PSUs to certain employees and directors of the Company under the 2020 Equity and Incentive Plan ("the 2020 Plan"), and previously did so under Aaron's Inc. stock-based compensation plans. The Aaron's Inc. stock-based compensation plans were discontinued in connection with the separation and distribution from PROG Holdings effective November 30, 2020. The 2020 Plan was approved by the Company's Board of Directors on November 11, 2020 and subsequently amended and restated with shareholder approval on August 25, 2021 to increase the number of shares available under the 2020 Plan. Beginning in 2021, as part of the Company’s long-term incentive compensation program and pursuant to the Company’s 2020 Plan, the Company granted a mix of stock options, RSUs, RSAs and PSUs to eligible employees and directors. As of December 31, 2023, the aggregate number of shares of common stock that may be issued or transferred under the 2020 Plan is 1,301,147 .
Conversion at Separation and Distribution
In accordance with the terms of the Employee Matters Agreement between The Aaron's Company and PROG Holdings, all unexercised, unissued and/or unvested share-based awards previously granted to The Aaron's Company employees and directors under the Aaron's, Inc. equity plans through the separation and distribution date of November 30, 2020 were converted at the time of distribution to replacement stock options, RSUs, PSUs and RSAs.
The replacement awards were converted using formulas designed to preserve the intrinsic economic value of the awards after taking into consideration the distribution. Employees who held unvested RSAs and PSUs of Aaron's Holdings Company, Inc. on the record date of November 27, 2020 generally had the option to elect one of two conversion methods for determining the replacement awards:
99
THE AARON'S COMPANY, INC.
NOTES TO CONSOLIDATED FINANCIAL STATEMENTS
i) to receive replacement awards of both The Aaron's Company and PROG Holdings for the number of whole units, rounded down to the nearest whole unit, of The Aaron's Company and PROG Holdings common stock that they would have received as a shareholder of Aaron's Holdings Company, Inc. at the date of separation, which is one share of The Aaron's Company for every two shares of PROG Holdings (i.e., "the shareholder method"); or
ii) to receive replacement awards only of the respective employer's common stock of an amount determined by a conversion ratio determined by calculating the product of the pre-distribution share price of Aaron's Holdings Company, Inc. and the pre-distribution number of awards being cancelled and replaced pursuant to this conversion, and then dividing the product by the post-distribution volume weighted adjusted three-day average share price of the respective employer's common stock rounded down to the nearest whole share (i.e., "the employee method").
In accordance with the Employee Matters Agreement, the conversion of certain awards, including substantially all unvested and unexercised vested stock options, was required to be determined following the employee method. The conversion of RSUs held by the Company's board of directors was required to be determined following the shareholder method.
Under both the shareholder method and the employee method, the terms and conditions of the converted awards were replicated, and, as necessary, adjusted to ensure that the vesting schedules were unchanged and the awards were converted in accordance with the Employee Matters Agreement. As a result, on the separation date, 2.9 million shares of The Aaron's Company, Inc. common stock (the "converted awards") were converted and deemed issued under the 2020 Plan. In connection with the conversion, certain employees and directors of The Aaron's Company have outstanding equity awards of PROG Holdings, which are not reflected in the tables below.
The Company accounted for the conversion of the awards as award modifications in accordance with ASC 718. The Company compared the fair value of the outstanding awards immediately prior to the conversion with the fair value immediately after the conversion, and determined that the conversion of equity awards held by The Aaron's Company employees resulted in incremental compensation expense of $5.5 million which reflects the incremental fair value of the converted awards. Of this total amount, $1.1 million was related to vested but unexercised or unissued equity awards and was recognized immediately on the separation and distribution date. The remaining incremental expense was amortized and recognized over the remaining service periods of the respective awards, with $2.7 million being recognized during the year ended December 31, 2021. The amount recognized during the years ended December 31, 2022 and 2023 was immaterial
Stock-based Compensation Expense
The Company has elected a policy to estimate forfeitures in determining the amount of stock compensation expense. Total long-term incentive stock-based compensation expense recognized by the Company was $11.9 million, $12.1 million and $12.8 million for the years ended December 31, 2023, 2022 and 2021, respectively. These costs were included as components of personnel costs, separation costs, and retirement charges, as applicable, in the consolidated statements of earnings.
The total income tax benefit recognized in the consolidated statements of earnings for stock-based compensation arrangements was $2.9 million, $3.1 million and $3.2 million in the years ended December 31, 2023, 2022 and 2021, respectively. For the year ended December 31, 2023, compensation cost exceeded the tax deduction resulting in recognition of a tax deficiency of $0.9 million. For the years ended December 31, 2022 and 2021, tax deductions exceeded compensation cost, resulting in recognition of tax benefits of $0.1 million and $0.6 million, respectively. Tax deficiencies and benefits related to compensation cost are included within operating cash flows.
As of December 31, 2023, there was $14.8 million of total unrecognized compensation expense related to non-vested stock-based compensation. This expense is expected to be recognized by the Company over a period of 1.42 years.
Stock Options
Under the 2020 Plan, options granted become exercisable after a period of to three years and unexercised options lapse 10 years after the date of the grant. The vesting schedules of converted awards were unchanged by the conversion. Unvested options are subject to forfeiture upon termination of service. The Company recognizes compensation expense for options that have a graded vesting schedule on a straight-line basis over the requisite service period. Upon stock option exercises, shares are to be issued by the Company with common stock or from its treasury shares, based on treasury share availability.
100
THE AARON'S COMPANY, INC.
NOTES TO CONSOLIDATED FINANCIAL STATEMENTS
The Company determines the fair value of stock options on the grant date using a Black-Scholes-Merton option pricing model that incorporates expected volatility, expected option life, risk-free interest rates and expected dividend yields. The expected volatility is based upon a time-weighted average of the Company's historical life-to-date volatility and the historical volatility of a group of similar peers over the most recent period generally commensurate with the expected estimated life of each respective grant, as well as implied volatilities from traded options on the Company's stock. Due to limited Company-specific exercise history following the November 30, 2020 separation and distribution, the expected life of the options is derived utilizing the simplified method, which finds the midpoint of the vesting date and the end of the contractual term. The risk-free interest rates are determined using the implied yield available for zero-coupon U.S. Treasury STRIPS that have a term equal to the expected life of the grant. The expected dividend yields are based on the approved annual dividend rate and market price of the underlying common stock at the time of grant.
The Company granted 273,000 , 148,000 , and 194,000 stock options during the years ended December 31, 2023, 2022, and 2021, respectively. The weighted-average fair value of options granted and the weighted-average assumptions used in the Black-Scholes-Merton option pricing model for such grants were as follows:
| 2023 | 2022 | 2021 | |||||||||
| Dividend Yield | % | % | % | ||||||||
| Expected Volatility | % | % | % | ||||||||
| Risk-free Interest Rate | % | % | % | ||||||||
| Expected Term (in years) | |||||||||||
| Fair Value of Stock Options Granted | $ | $ | $ | ||||||||
The table below summarizes the Company's stock option activity for the year ended December 31, 2023:
| Options (In Thousands) | Weighted Average Exercise Price | Weighted Average Remaining Contractual Term (in Years) | Aggregate Intrinsic Value (in Thousands) | Weighted Average Fair Value | |||||||||||||||||||||||||
| Outstanding at January 1, 2023 | $ | ||||||||||||||||||||||||||||
| Granted | |||||||||||||||||||||||||||||
| Exercised | ( | ||||||||||||||||||||||||||||
| Forfeited/expired | ( | ||||||||||||||||||||||||||||
| Outstanding at December 31, 2023 | $ | $ | |||||||||||||||||||||||||||
| Expected to Vest | |||||||||||||||||||||||||||||
| Exercisable at December 31, 2023 | |||||||||||||||||||||||||||||
The aggregate intrinsic value of options exercised by the Company's employees, which represents the value of The Aaron's Company, Inc. common stock at the time of exercise in excess of the exercise price was insignificant for the year ended December 31, 2023, and was $0.1 million and $1.8 million for the years ended December 31, 2022 and 2021, respectively.
The total grant-date fair value of options vested during the years ended December 31, 2023, 2022, and 2021 was $1.4 million, $1.2 million, and $0.9 million, respectively.
The following table summarizes information about the Company's stock options outstanding at December 31, 2023:
| Options Outstanding | Options Exercisable | ||||||||||||||||||||||||||||
| Range of Exercise Prices | Number Outstanding December 31, 2023 (In Thousands) | Weighted Average Remaining Contractual Life (in Years) | Weighted Average Exercise Price | Number Exercisable December 31, 2023 (In Thousands) | Weighted Average Exercise Price | ||||||||||||||||||||||||
$ | $ | $ | |||||||||||||||||||||||||||
$ | |||||||||||||||||||||||||||||
$ | |||||||||||||||||||||||||||||
$ | |||||||||||||||||||||||||||||
101
THE AARON'S COMPANY, INC.
NOTES TO CONSOLIDATED FINANCIAL STATEMENTS
Restricted Stock
Restricted stock units or restricted stock awards (collectively, "restricted stock") may be granted to employees and directors under the 2020 Plan and typically vest over to three-year periods. Restricted stock grants are settled in stock and may be subject to one or more objective employment, performance or other forfeiture conditions as established at the time of grant. The Company generally recognizes compensation expense for restricted stock with a graded vesting schedule on a straight-line basis over the requisite service period as restricted stock is not subject to performance metrics. Upon vesting, shares are issued by the Company with common stock or from its treasury shares, based on treasury share availability. Any shares of restricted stock that are forfeited may again become available for issuance. Certain unvested time-based restricted stock awards entitle participants to vote and accrue dividends, if declared by the Board of Directors, during the vesting period. The accrued dividends for these awards are forfeitable upon termination prior to vesting. As of December 31, 2023, there are 882,000 unvested restricted stock awards that contain voting rights, but are not presented as outstanding on the consolidated balance sheet.
The fair value of restricted stock is generally based on the fair market value of common stock on the date of grant. The fair value of the converted awards was adjusted in accordance with the Employee Matters Agreement and conversion methodology to ensure that the economic value of the awards was unchanged by the conversion.
The Company granted 683,000 , 557,000 , and 347,000 shares of restricted stock at weighted-average fair values of $11.99 , $21.38 , and $22.89 during the years ended December 31, 2023, 2022, and 2021, respectively. The following table summarizes information about restricted stock activity during 2023:
| Restricted Stock (In Thousands) | Weighted Average Fair Value | |||||||
| Non-vested at January 1, 2023 | $ | |||||||
Granted | ||||||||
| Vested | ( | |||||||
| Forfeited/unearned | ( | |||||||
| Non-vested at December 31, 2023 | ||||||||
The total vest-date fair value of restricted stock described above that vested during the period was $3.8 million, $4.3 million, and $3.1 million during the years ended December 31, 2023, 2022, and 2021, respectively.
Performance Share Units
For performance share units granted prior to December 31, 2021, the number of shares earned is determined at the end of a one-year performance period based upon achievement of various Company-specific performance criteria, which have included adjusted EBITDA, revenue, adjusted pre-tax profit and return on capital metrics. When the performance criteria are met, the award is earned and one-third of the award vests. Another one-third of the earned award is subject to an additional one-year service period and the remaining one-third of the earned award is subject to an additional two-year service period. For performance share units granted during the years ended December 31, 2023 and 2022, the number of shares earned is determined at the end of a three-year performance period based upon the average achievement of Company-specific adjusted EBITDA metrics for each of the three performance years. When the performance criteria are met, the award is earned and will cliff vest.
The fair value of performance share units with Company-specific performance criteria is based on the fair market value of common stock on the date of grant. The compensation expense associated with performance share units with a graded vesting schedule is amortized on an accelerated basis over the vesting period and performance share units with a cliff vesting schedule are amortized on a straight-line basis over the requisite service period based on the projected assessment of the level of performance that will be achieved and earned. In the event the Company determines it is no longer probable that the minimum Company-specific performance criteria specified in the plan will be achieved, all previously recognized compensation expense is reversed in the period such a determination is made.
During the years ended December 31, 2023 and 2022, the Company also issued performance share units with a relative total shareholder return ("TSR") component. For the TSR performance share units, the number of shares earned is determined based on the Company's share price performance relative to a specified peer group's stock performance at the end of a three-year performance period. When the market-based performance criteria are met, the TSR performance share units will cliff vest.
102
THE AARON'S COMPANY, INC.
NOTES TO CONSOLIDATED FINANCIAL STATEMENTS
The fair value of each TSR performance share unit is determined using a Monte Carlo simulation. The compensation expense associated with performance share units with a cliff vesting schedule is amortized on a straight-line basis over the requisite service period and is based upon the assumption of 100% achievement of the TSR goal. In the event that the market-based performance criteria are not achieved, the TSR awards will not vest; however the compensation expense associated with TSR awards will not be reversed even if the threshold level of TSR is not achieved.
The assumptions used in the Monte Carlo valuation for the TSR performance share units granted during the years ended December 31, 2023 and 2022 were as follows:
| 2023 | 2022 | |||||||
| Risk-free Interest Rate | % | % | ||||||
| Expected Dividend Yield | % | % | ||||||
| Expected Volatility | % | % | ||||||
| Expected Term (in years) | ||||||||
| Fair Value of TSR Performance Share Units Granted | $ | $ | ||||||
Upon vesting, all performance share units are to be issued by the Company with common stock or from its treasury shares, based on treasury share availability. The number of performance-based shares which could potentially be issued ranges from zero to 200 % of the target award. The vesting schedules and performance achievement levels of converted awards were unchanged by the conversion.
The Company granted 398,000 , 355,000 , and 136,000 performance share units at weighted-average fair values of $13.91 , $26.77 , and $27.54 during the years ended December 31, 2023, 2022 and 2021, respectively. The following table summarizes information about the Company's performance share unit activity during the year ended December 31, 2023:
| Performance Share Units (In Thousands) | Weighted Average Fair Value | ||||||||||
| Non-vested at January 1, 2023 | $ | ||||||||||
| Granted | |||||||||||
| Vested | ( | ||||||||||
| Forfeited/unearned | ( | ||||||||||
| Non-vested at December 31, 2023 | |||||||||||
The total vest-date fair value of performance share units described above that vested during the period was $2.3 million and $4.6 million, and $3.9 million during the years ended December 31, 2023, 2022, and 2021, respectively.
Employee Stock Purchase Plan
Effective November 30, 2020, the Company's Board of Directors approved the Employee Stock Purchase Plan (the "2020 ESPP"), which is a tax-qualified plan under Section 423 of the Internal Revenue Code. The 2020 ESPP was subsequently amended and restated with shareholder approval on May 3, 2023 in the form of The Aaron's Company, Inc. Amended and Restated Employee Stock Purchase Plan (the "A&R ESPP") to:
•Increase the Share Reserve from 200,000 to 1,050,000 ;
•Allow participation of highly compensated employees of the Company or a subsidiary who are subject to the disclosure requirements of Section 16(a) of the Securities and Exchange Act of 1934 ("Section 16 officers"); and
•Remove the requirement that employees must hold shares of Common Stock purchased for one year prior to exercise.
The purpose of the A&R ESPP is to encourage ownership of the Company's common stock by eligible employees. Eligible employees are allowed to purchase common stock of the Company during six-month offering periods at the lower of: (a) 85 % of the closing trading price per share of the common stock on the first trading date of an offering period in which a participant is enrolled; or (b) 85 % of the closing trading price per share of the common stock on the last day of an offering period. Employees participating in the A&R ESPP can contribute up to an amount not exceeding 10 % of their base salary and wages up to an annual maximum of $25,000 in total fair market value of the common stock. The first offering period began on January 1, 2021. As of December 31, 2023, the aggregate number of shares of common stock that may be issued under the A&R ESPP was 836,435 .
103
THE AARON'S COMPANY, INC.
NOTES TO CONSOLIDATED FINANCIAL STATEMENTS
NOTE 14: COMPENSATION ARRANGEMENTS
Deferred Compensation
The Company maintains The Aaron's Company, Inc. Deferred Compensation Plan, which is an unfunded, nonqualified deferred compensation plan for a select group of management, highly compensated employees and non-employee directors. On a pre-tax basis, eligible employees can defer receipt of up to 75 % of their base compensation and up to 75 % of their incentive pay compensation, and eligible non-employee directors can defer receipt of up to 100 % of their cash and stock director fees.
Compensation deferred under the plan is recorded as a deferred compensation liability, which is recorded in accounts payable and accrued expenses in the consolidated balance sheets. The deferred compensation plan liability was $10.6 million and $8.6 million as of December 31, 2023 and 2022, respectively. Liabilities under the plan are recorded at amounts due to participants, based on the fair value of participants’ selected investments, which consist of equity and debt "mirror" funds. The obligations are unsecured general obligations of the Company and the participants have no right, interest or claim in the assets of the Company, except as unsecured general creditors. The Company has established a rabbi trust to fund obligations under the plan primarily with company-owned life insurance policies. The value of the assets within the rabbi trust, which is primarily the cash surrender value of the life insurance, was $15.2 million and $13.4 million as of December 31, 2023 and 2022, respectively, and is included in prepaid expenses and other assets in the consolidated balance sheets. The Company recorded a gain of $1.9 million during the year ended December 31, 2023, a loss of $2.3 million during the year ended December 31, 2022, and a gain of $1.6 million during the year ended December 31, 2021, related to changes in the cash surrender value of the life insurance plans. These gains and losses were recorded within other non-operating income (expense), net in the consolidated statements of earnings.
Benefits of $0.7 million, $1.3 million and $2.3 million were paid to plan participants during the years ended December 31, 2023, 2022 and 2021, respectively. The terms of The Aaron's Company, Inc. deferred compensation plan include a discretionary match. The match allows eligible employees to receive % matching by the Company on the first % of contributions and % on the next % of contributions for a total of a % match. The annual match is not to exceed $13,200 , $12,200 , and $11,600 for an individual employee for 2023, 2022, and 2021, respectively, and is subject to a cliff vesting schedule. Deferred compensation expense for the matching contributions was not significant during the periods presented herein.
401(k) Defined Contribution Plan
The Company maintains a 401(k) retirement savings plan for employees who meet certain eligibility requirements. The Aaron's Company, Inc. 401(k) savings plan allows employees to contribute up to 75 % of their annual compensation in accordance with federal contribution limits with 100 % matching by the Company on the first 3 % of compensation and 50 % on the next 2 % of compensation for a total of a 4 % match. The Company’s expense related to the plan was $6.3 million in 2023, $6.3 million in 2022 and $5.6 million in 2021.
Employee Stock Purchase Plan
104
THE AARON'S COMPANY, INC.
NOTES TO CONSOLIDATED FINANCIAL STATEMENTS
NOTE 15: RELATED PARTY TRANSACTIONS
Related Party Transactions with the Sellers of BrandsMart U.S.A.
Effective as of the BrandsMart U.S.A. acquisition date, the Company entered into lease agreements for six store locations retained by the sellers of BrandsMart U.S.A., including Michael Perlman, who was employed by the Company for a short period following the acquisition. While Mr. Perlman was no longer employed by the Company as of December 31, 2022, the Company continued to treat the lease agreements as potential related party transactions under the Company's Related Party Transactions Policy through December 2023. The lease agreements include initial terms of ten years , with options to renew each location for up to 20 years thereafter. The Company has recorded these leases within operating lease right-of-use assets and operating lease liabilities in the Company's consolidated balance sheets. The six operating leases are considered to be above market. The value of the off-market element of the lease agreements has been included as a component of the consideration transferred to the sellers of BrandsMart U.S.A. and has been recognized as a reduction to the operating lease right-of-use-asset.
The total amounts paid to the sellers of BrandsMart U.S.A. during the year ended December 31, 2023 and 2022 related to real estate activities, including rental payments, maintenance and taxes, were $12.9 million and $9.9 million, respectively.
105
ITEM 9. CHANGES IN AND DISAGREEMENTS WITH ACCOUNTANTS ON ACCOUNTING AND FINANCIAL DISCLOSURE
None.
ITEM 9A. CONTROLS AND PROCEDURES
Disclosure Controls and Procedures
An evaluation of the Company's disclosure controls and procedures, as defined in Rule 13a-15(e) and 15d-15(e) under the Securities Exchange Act of 1934, was carried out by management, with the participation of the Chief Executive Officer (CEO) and Chief Financial Officer (CFO), as of the end of the period covered by this Annual Report on Form 10-K. Based on management’s evaluation, the CEO and CFO concluded that the Company’s disclosure controls and procedures were not effective as of December 31, 2023, as a result of the material weakness described below.
Management's Annual Report on Internal Control over Financial Reporting
See Management's Report on Internal Control over Financial Reporting and the Report of Independent Registered Public Accounting Firm on our internal control over financial reporting in Item 8, which are incorporated herein by reference.
Material Weakness
On April 1, 2022, the Company acquired 100% ownership of Interbond Corporation of America, doing business as BrandsMart U.S.A. The operations of BrandsMart U.S.A. (excluding BrandsMart Leasing) comprise the BrandsMart segment (collectively, "BrandsMart") and represent approximately 28% of the Company’s total revenues for the year ended December 31, 2023. BrandsMart was not included in the Company's assessment of the effectiveness of our internal control over financial reporting as of December 31, 2022, as the Securities and Exchange Commission ("SEC") rules provide companies one year to assess controls at an acquired entity. Additionally, prior to being acquired by the Company, BrandsMart was not required to file reports with the SEC. Accordingly, during the year ended December 31, 2023, we performed our first comprehensive assessment of the design and operating effectiveness of internal controls over financial reporting at BrandsMart.
Management identified a material weakness in internal control over financial reporting in the BrandsMart segment. The design of information technology general controls ("ITGCs") related to user access, program change or appropriate segregation of duties for certain IT applications within the segment was not effective. This ineffective design impacted controls over the completeness and accuracy of information used in the segment's business process controls resulting in the impacted controls also being deemed ineffective.
Remediation Efforts
Management has and will continue to evaluate the design and operating effectiveness of ITGCs for key applications at BrandsMart. Where needed, access rights and assigned job responsibilities are being modified to resolve instances of inappropriate user access capabilities, program changes, and segregation of duties conflicts. Additionally, management is working to standardize the BrandsMart ITGCs to operate consistently with the Company's existing ITGC control structure.
We expect that the material weakness will be remediated in 2024, once the remediated controls have operated for a sufficient period for management to conclude, through testing, that the controls are designed and operating effectively.
Changes in Internal Control Over Financial Reporting
Other than the remediation efforts described above, there were no changes in the Company’s internal control over financial reporting, as defined in Rule 13a-15(f) under the Exchange Act, during the three months ended December 31, 2023, that have materially affected, or are reasonably likely to materially affect, the Company’s internal control over financial reporting.
ITEM 9B. OTHER INFORMATION
Securities Trading Plans of Directors and Officers
During the three months ended December 31, 2023, no director or officer (as defined in Rule 16a-1(f) of the Exchange Act) of the Company adopted terminated any "Rule 10b5-1 trading arrangement" or any "non-Rule 10b5-1 trading arrangement," as such terms are defined in Item 408 of Regulation S-K except as set forth below:
106
Name and Title | Action | Date of Action | Duration of Trading Arrangements | Rule 10b5-1 Trading Arrangement? (Y/N)* | Aggregate Number of Securities Subject to Trading Arrangement | ||||||||||||
November 2, 2023 - October 31, 2024 | Y | ||||||||||||||||
* Denotes whether the trading plan is intended, when adopted, to satisfy the affirmative defense of Rule 10b5-1(c).
ITEM 9C. DISCLOSURE REGARDING FOREIGN JURISDICTIONS THAT PREVENT INSPECTIONS
Not applicable.
107
PART III
ITEM 10. DIRECTORS, EXECUTIVE OFFICERS OF THE REGISTRANT AND CORPORATE GOVERNANCE
The information required in response to this Item is contained under the captions "Nominees to Serve as Directors", "Executive Officers Who Are Not Directors", "Communicating with the Board of Directors and Corporate Governance Documents", and "Composition, Meetings and Committees of the Board of Directors" in the Proxy Statement to be filed with the SEC pursuant to Regulation 14A. These portions of the Proxy Statement are hereby incorporated by reference.
We have adopted a written code of business conduct and ethics that applies to all our directors, officers and team members, including our principal executive officer, principal financial officer, principal accounting officer or controller and other executive officers identified pursuant to this Item 10 who perform similar functions, which we refer to as the Selected Officers. The code is posted on our investor website at http://www.investor.aarons.com. We will disclose any material changes in or waivers from our code of business conduct and ethics applicable to any Selected Officer on our investor website at http://www.investor.aarons.com or by filing a Form 8-K.
ITEM 11. EXECUTIVE COMPENSATION
The information required in response to this Item is contained under the captions "Compensation Discussion and Analysis," "Summary Compensation Table," "Grants of Plan Based Awards in Fiscal Year 2023," "Outstanding Equity Awards at 2023 Fiscal Year-End," "Option Exercises and Stock Vested in Fiscal Year 2023," "Non-Qualified Deferred Compensation as of December 31, 2023," "Potential Payments Upon Termination or Change in Control," "Non-Management Director Compensation in 2023," "Employment Agreements with Named Executive Officers," "Annual Cash Incentive Awards," "The Aaron's Company, Inc. Amended and Restated 2020 Equity and Incentive Plan," "Compensation Committee Interlocks and Insider Participation" and "Compensation Committee Report" in the Proxy Statement. These portions of the Proxy Statement are hereby incorporated by reference.
ITEM 12. SECURITY OWNERSHIP OF CERTAIN BENEFICIAL OWNERS AND MANAGEMENT AND RELATED STOCKHOLDER MATTERS
The information required in response to this Item is contained under the captions "Beneficial Ownership of Common Stock" and "Securities Authorized for Issuance under Equity Compensation Plans" in the Proxy Statement. These portions of the Proxy Statement are hereby incorporated by reference.
ITEM 13. CERTAIN RELATIONSHIPS AND RELATED TRANSACTIONS, AND DIRECTOR INDEPENDENCE
The information required in response to this Item is contained under the captions "Certain Relationships and Related Transactions" and "Composition, Meetings and Committees of the Board of Directors" in the Proxy Statement. These portions of the Proxy Statement are hereby incorporated by reference.
ITEM 14. PRINCIPAL ACCOUNTANT FEES AND SERVICES
The information required in response to this Item is contained under the caption "Audit Matters" in the Proxy Statement. This portion of the Proxy Statement is hereby incorporated by reference.
108
PART IV
ITEM 15. EXHIBITS, FINANCIAL STATEMENTS and SCHEDULES
a) 1. FINANCIAL STATEMENTS
The following financial statements and notes thereto of The Aaron’s Company, Inc. and the related Report of Independent Registered Public Accounting Firm are set forth in Item 8.
Consolidated Balance Sheets—December 31, 2023 and 2022 | ||
Consolidated Statements of Earnings—Years ended December 31, 2023, 2022 and 2021 | ||
Consolidated Statements of Comprehensive Income (Loss)—Years ended December 31, 2023, 2022 and 2021 | ||
Consolidated Statements of Equity—Years ended December 31, 2023, 2022 and 2021 | ||
Consolidated Statements of Cash Flows—Years ended December 31, 2023, 2022 and 2021 | ||
Notes to Consolidated Financial Statements | ||
Report of Independent Registered Public Accounting Firm (PCAOB ID: | ||
2. FINANCIAL STATEMENT SCHEDULES
All schedules for which provision is made in the applicable accounting regulations of the SEC have been omitted because they are not applicable, or the required information is included in the financial statements or notes thereto.
3. EXHIBITS
| EXHIBIT NO. | DESCRIPTION OF EXHIBIT | ||||
| Plan of acquisition, reorganization, arrangement, liquidation or succession | |||||
2.1† | |||||
| Articles of Incorporation and Bylaws | |||||
| 3.1 | |||||
| 3.2 | |||||
| Instruments Defining the Rights of Security Holders, Including Indentures | |||||
| 4.1 | |||||
| Material Contracts | |||||
| 10.1 | |||||
| 10.2 | |||||
| 10.3 | |||||
| 10.4 | |||||
109
110
10.24 | |||||
10.25 | |||||
10.26 | |||||
10.27 | |||||
10.28 | |||||
| Other Exhibits and Certifications | |||||
| 21* | |||||
| 23* | |||||
| 31.1* | |||||
| 31.2* | |||||
| 32.1* | |||||
| 32.2* | |||||
97.1* | |||||
| 101.INS | XBRL Instance Document - The instance document does not appear in the interactive data file because its XBRL tags are embedded within the inline XBRL document. | ||||
| 101.SCH | XBRL Taxonomy Extension Schema Document | ||||
| 101.CAL | XBRL Taxonomy Extension Calculation Linkbase Document | ||||
| 101.DEF | XBRL Taxonomy Extension Definition Linkbase Document | ||||
| 101.LAB | XBRL Taxonomy Extension Labels Linkbase Document | ||||
| 101.PRE | XBRL Taxonomy Extension Presentation Linkbase Document | ||||
| 104 | Cover Page Interactive Data File (formatted as Inline XBRL and embedded within Exhibit 101) | ||||
† The Company hereby agrees to furnish supplementally a copy of any omitted schedule or exhibit to the SEC upon the request of the SEC. | |||||
| * Filed herewith. | |||||
** Certain equity awards under this form of agreement were granted by Aaron’s, Inc. prior to the spin-off of the Company from PROG Holdings, Inc. Such awards were adjusted pursuant to the Employee Matters Agreement between the Company and PROG Holdings, Inc. to relate to the Company’s common stock and are generally subject to the same terms and conditions as this form of agreement. | |||||
(b) EXHIBITS
The exhibits listed in Item 15(a)(3) are included elsewhere in this Report.
(c) FINANCIAL STATEMENTS AND SCHEDULES
The financial statements listed in Item 15(a)(1) are included in Item 8 in this Report.
ITEM 16. FORM 10-K SUMMARY
None.
111
SIGNATURES
Pursuant to the requirements of Section 13 or 15 (d) of the Securities Exchange Act of 1934, the registrant has duly caused this report to be signed on its behalf by the undersigned, thereunto duly authorized, on February 29, 2024.
| The Aaron's Company, Inc. | ||||||||
| By: | /s/ C. Kelly Wall | |||||||
| C. Kelly Wall | ||||||||
| Chief Financial Officer | ||||||||
Pursuant to the requirements of the Securities Exchange Act of 1934, this report has been signed below by the following persons on behalf of the registrant and in the capacities indicated on February 29, 2024.
| SIGNATURE | TITLE | |||||||||||||
/s/ Douglas A. Lindsay | Chief Executive Officer and Director (Principal Executive Officer) | |||||||||||||
| Douglas A. Lindsay | ||||||||||||||
/s/ C. Kelly Wall | Chief Financial Officer (Principal Financial Officer) | |||||||||||||
| C. Kelly Wall | ||||||||||||||
/s/ Douglass L. Noe | Vice President and Corporate Controller (Principal Accounting Officer) | |||||||||||||
| Douglass L. Noe | ||||||||||||||
/s/ Wangdali Bacdayan | Director | |||||||||||||
Wangdali Bacdayan | ||||||||||||||
/s/ Laura N. Bailey | Director | |||||||||||||
Laura N. Bailey | ||||||||||||||
/s/ Kelly H. Barrett | Director | |||||||||||||
Kelly H. Barrett | ||||||||||||||
/s/ Walter G. Ehmer | Director | |||||||||||||
Walter G. Ehmer | ||||||||||||||
/s/ Hubert L. Harris, Jr. | Director | |||||||||||||
Hubert L. Harris, Jr. | ||||||||||||||
/s/ Timothy A. Johnson | Director | |||||||||||||
Timothy A. Johnson | ||||||||||||||
/s/ Kristine K. Maloski | Director | |||||||||||||
Kristine K. Malkoski | ||||||||||||||
/s/ Marvonia P. Moore | Director | |||||||||||||
Marvonia P. Moore | ||||||||||||||
/s/ John W. Robinson, III | Director | |||||||||||||
John W. Robinson, III | ||||||||||||||
112