Use these links to rapidly review the document
TABLE OF CONTENTS
UNITED STATES
SECURITIES AND EXCHANGE COMMISSION
Washington, D.C. 20549
FORM 20-F
o REGISTRATION STATEMENT PURSUANT TO SECTION 12(b) OR (g) OF THE SECURITIES EXCHANGE ACT
OF 1934
OR
ý ANNUAL REPORT PURSUANT TO SECTION 13 OR 15(d) OF THE SECURITIES EXCHANGE ACT OF 1934
For the fiscal year ended December 31, 2012
OR
o TRANSITION REPORT PURSUANT TO SECTION 13 OR 15(d) OF THE SECURITIES EXCHANGE ACT OF 1934
OR
o SHELL COMPANY REPORT PURSUANT TO SECTION 13 OR 15(d) OF THE SECURITIES EXCHANGE ACT OF 1934
Date of event requiring this shell company report
For the transition period from to
Commission file number: 1-13422
AGNICO-EAGLE MINES LIMITED
(Exact name of Registrant as Specified in its Charter)
Not Applicable
(Translation of Registrant's Name into English)
Ontario, Canada
(Jurisdiction of Incorporation or Organization)
145 King Street East, Suite 400
Toronto, Ontario, Canada M5C 2Y7
(Address of Principal Executive Offices)
R. Gregory Laing
145 King Street East, Suite 400
Toronto, Ontario, Canada M5C 2Y7
Telephone: 416-947-1212 Fax: 416-367-4681
(Name, Telephone, E-mail and/or Facsimile number and Address of Company Contact Person)
Securities registered or to be registered pursuant to Section 12(b) of the Act:
| Common Shares, without par value (Title of Class) |
The Toronto Stock Exchange and the New York Stock Exchange (Name of exchange on which registered) |
Securities registered or to be registered pursuant to Section 12(g) of the Act:
None
Securities for which there is a reporting obligation pursuant to Section 15(d) of the Act:
None
(Title of Class)
Indicate the number of outstanding shares of each of the issuer's classes of capital or common stock as of the close of the period covered by the annual report.
172,006,593 Common Shares as of December 31, 2012
Indicate by check mark if the registrant is a well-known seasoned issuer, as defined in Rule 405 of the Securities Act.
Yes ý No o
If this report is an annual or transition report, indicate by check mark if the registrant is not required to file reports pursuant to Section 13 or 15(d) of the Securities Act.
Yes o No ý
Indicate by check mark whether the registrant (1) has filed all reports required to be filed by Section 13 or 15(d) of the Securities Exchange Act of 1934 during the preceding 12 months (or for such shorter period that the registrant was required to file such reports) and (2) has been subject to such filing requirements for the past 90 days.
Yes ý No o
Indicate by check mark whether the registrant has submitted electronically and posted on its corporate Web site, if any, every Interactive Data File required to be submitted and posted pursuant to Rule 405 of Regulation S-T (§232.405 of this chapter) during the preceding 12 months (or for such shorter period that the registrant was required to submit and post such files).
Yes ý No o
Indicate by check mark whether the registrant is a large accelerated filer, an accelerated filer, or a non-accelerated filer. See definition of "accelerated filer and large accelerated filer" in Rule 12b-2 of the Exchange Act. (Check one)
Large Accelerated Filer ý Accelerated Filer o Non-Accelerated Filer o
Indicate by check mark which basis of accounting the registrant has used to prepare the financial statements included in this filing:
U.S. GAAP
ý International Financial Reporting Standards as
issued Other o
by the International Accounting Standards Board o
If "Other" has been checked in response to the previous question, indicate by check mark which financial statement item the registrant has elected to follow.
Item 17 o Item 18 o
If this is an annual report, indicate by check mark whether the registrant is a shell company (as defined in Rule 12b-2 of the Exchange Act):
Yes o No ý
i
- *
- Omitted
pursuant to General Instruction E(b) of Form 20-F.
- **
- The registrant provides the financial statements and related information specified in Item 18.
ii
Currencies: Agnico-Eagle Mines Limited ("Agnico-Eagle" or the "Company") presents its consolidated financial statements in United States dollars. All dollar amounts in this Annual Report on Form 20-F ("Form 20-F") are stated in United States dollars ("U.S. dollars", "$" or "US$"), except where otherwise indicated. Certain information in this Form 20-F is presented in Canadian dollars ("C$") or European Union euros ("Euro" or "€"). See "Item 3 Key Information – Currency Exchange Rates" for a history of exchange rates of Canadian dollars into U.S. dollars.
Generally Accepted Accounting Principles: Agnico-Eagle reports its financial results using United States generally accepted accounting principles ("US GAAP") due to its substantial U.S. shareholder base and to maintain comparability with other gold mining companies. Unless otherwise specified, all references to financial results herein are to those calculated under US GAAP.
Forward-Looking Information: Certain statements in this Form 20-F, referred to herein as "forward-looking statements", constitute "forward-looking statements" within the meaning of the United States Private Securities Litigation Reform Act of 1995 and "forward-looking information" under the provisions of Canadian provincial securities laws. These statements relate to, among other things, the Company's plans, objectives, expectations, estimates, beliefs, strategies and intentions and can generally be identified by the use of words such as "anticipate", "believe", "budget", "could", "estimate", "expect", "forecast", "intend", "likely", "may", "plan", "project", "schedule", "should", "target", "will", "would" or other variations of these terms or similar words. Forward-looking statements in this report include, but are not limited to, the following:
- •
- the
Company's outlook for 2013 and future periods;
- •
- statements
regarding future earnings, and the sensitivity of earnings to gold and other metal prices;
- •
- anticipated
levels or trends for prices of gold and byproduct metals mined by the Company or for exchange rates between currencies in which capital is raised, revenue is
generated or expenses are incurred by the Company;
- •
- estimates
of future mineral production and sales;
- •
- estimates
of future costs, including mining costs, total cash costs per ounce, all-in sustaining costs, minesite costs per tonne and other expenses;
- •
- estimates
of future capital expenditure, exploration expenditure and other cash needs, and expectations as to the funding thereof;
- •
- statements
regarding the projected exploration, development and exploitation of certain ore deposits, including estimates of exploration, development and production and
other capital costs and estimates of the timing of such exploration, development and production or decisions with respect thereto;
- •
- estimates
of mineral reserves, mineral resources and ore grades and statements regarding anticipated future exploration results;
- •
- estimates
of cash flow;
- •
- estimates
of mine life;
- •
- anticipated
timing of events with respect to the Company's minesites, mine construction projects and exploration projects;
- •
- estimates
of future costs and other liabilities for environmental remediation;
- •
- statements
regarding anticipated legislation and regulation regarding climate change and estimates of the impact on the Company; and
- •
- other anticipated trends with respect to the Company's capital resources and results of operations.
Forward-looking statements are necessarily based upon a number of factors and assumptions that, while considered reasonable by Agnico-Eagle as of the date of such statements, are inherently subject to significant business, economic and competitive uncertainties and contingencies. The factors and assumptions of Agnico-Eagle upon which the forward-looking statements in this Form 20-F are based, and which may prove to be incorrect, include, but are not limited to, the assumptions set out elsewhere in this Form 20-F as well as: that there are no significant disruptions affecting Agnico-Eagle's operations, whether due to labour disruptions, supply disruptions, damage to equipment, natural or man-made occurrences, mining or milling issues, political changes, title issues or otherwise; that permitting, development and
2012 ANNUAL REPORT 1
expansion at each of Agnico-Eagle's mines and mine development projects proceed on a basis consistent with current expectations, and that Agnico-Eagle does not change its exploration or development plans relating to such projects; that the exchange rates between the Canadian dollar, Euro, Mexican peso and the U.S. dollar will be approximately consistent with current levels or as set out in this Form 20-F; that prices for gold, silver, zinc, copper and lead will be consistent with Agnico-Eagle's expectations; that prices for key mining and construction supplies, including labour costs, remain consistent with Agnico-Eagle's current expectations; that production meets expectations; that Agnico-Eagle's current estimates of mineral reserves, mineral resources, mineral grades and mineral recovery are accurate; that there are no material delays in the timing for completion of development projects; and that there are no material variations in the current tax and regulatory environment that affect Agnico-Eagle.
The forward-looking statements in this Form 20-F reflect the Company's views as at the date of this Form 20-F and involve known and unknown risks, uncertainties and other factors which could cause the actual results, performance or achievements of the Company or industry results to be materially different from any future results, performance or achievements expressed or implied by such forward-looking statements. Such factors include, among others, the Risk Factors set out in "Item 3 Key Information – Risk Factors". Given these uncertainties, readers are cautioned not to place undue reliance on these forward-looking statements, which speak only as of the date made. Except as otherwise required by law, the Company expressly disclaims any obligation or undertaking to release publicly any updates or revisions to any such statements to reflect any change in the Company's expectations or any change in events, conditions or circumstances on which any such statement is based. This Form 20-F contains information regarding anticipated total cash costs per ounce, all-in sustaining costs and minesite costs per tonne at certain of the Company's mines and mine development projects. The Company believes that these generally accepted industry measures are realistic indicators of operating performance and are useful in allowing year over year comparisons. Investors are cautioned that this information may not be suitable for other purposes.
Meaning of "including" and "such as": When used in this Form 20-F, the terms "including" and "such as" mean including and such as, without limitation.
NOTE TO INVESTORS CONCERNING ESTIMATES OF MINERAL RESOURCES
The mineral reserve and mineral resource estimates contained in this Form 20-F have been prepared in accordance with the Canadian securities regulatory authorities' (the "CSA") National Instrument 43-101 Standards of Disclosure for Mineral Projects ("NI 43-101"). These standards are similar to those used by the United States Securities and Exchange Commission's (the "SEC") Industry Guide No. 7, as interpreted by Staff at the SEC ("Guide 7"). However, the definitions in NI 43-101 differ in certain respects from those under Guide 7. Accordingly, mineral reserve information contained or incorporated by reference herein may not be comparable to similar information disclosed by U.S. companies. Under the requirements of the SEC, mineralization may not be classified as a "reserve" unless the determination has been made that the mineralization could be economically and legally produced or extracted at the time the reserve determination is made. The SEC does not recognize measures of "mineral resource".
The mineral reserve figures presented herein are estimates, and no assurance can be given that the anticipated tonnages and grades will be achieved or that the indicated level of recovery will be realized. The Company does not include equivalent gold ounces for byproduct metals contained in mineral reserves in its calculation of contained ounces.
Cautionary Note to Investors Concerning Estimates of Measured and Indicated Mineral Resources
This document uses the terms "measured mineral resources" and "indicated mineral resources". Investors are advised that while those terms are recognized and required by Canadian regulations, the SEC does not recognize them. Investors are cautioned not to assume that any part or all of mineral deposits in these categories will ever be converted into mineral reserves.
Cautionary Note to Investors Concerning Estimates of Inferred Mineral Resources
This document uses the term "inferred mineral resources". Investors are advised that while this term is recognized and required by Canadian regulations, the SEC does not recognize it. "Inferred mineral resources" have a great amount of uncertainty as to their existence and as to their economic and legal feasibility. It cannot be assumed that any part or all of an inferred mineral resource will ever be upgraded to a higher category. Under Canadian rules, estimates of inferred mineral resources may not form the basis of feasibility or pre-feasibility studies, except in rare cases. Investors are cautioned not to assume that any part or all of an inferred mineral resource exists, or is economically or legally mineable.
2 AGNICO-EAGLE MINES LIMITED
NOTE TO INVESTORS CONCERNING CERTAIN MEASURES OF PERFORMANCE
This Form 20-F presents certain measures, including "total cash costs per ounce" and "minesite costs per tonne", that are not recognized measures under US GAAP. This data may not be comparable to data presented by other gold producers. For a reconciliation of these measures to the figures presented in the consolidated financial statements prepared in accordance with US GAAP, see "Item 5 Operating and Financial Review and Prospects – Results of Operations – Production Costs". The Company believes that these generally accepted industry measures are realistic indicators of operating performance and are useful in allowing year over year comparisons. However, these non-US GAAP measures should be considered together with other data prepared in accordance with US GAAP, and these measures, taken by themselves, are not necessarily indicative of operating costs or cash flow measures prepared in accordance with US GAAP. This Form 20-F also contains information as to estimated future total cash costs per ounce, all-in sustaining costs and minesite costs per tonne. The estimates of total cash costs per ounce, all-in sustaining costs and minesite costs per tonne are based upon the total cash costs per ounce, all-in sustaining costs and minesite costs per tonne that the Company expects to incur to mine gold at its projects and, consistent with the reconciliation provided, do not include production costs attributable to accretion expense and other asset retirement costs, which will vary over time as each project is developed and mined. It is therefore not practicable to reconcile these forward-looking non-US GAAP financial measures to the most comparable US GAAP measure.
2012 ANNUAL REPORT 3
ITEM 1 IDENTITY OF DIRECTORS, SENIOR MANAGEMENT AND ADVISERS
Pursuant to the instructions to Item 1 of Form 20-F, this information has not been provided.
ITEM 2 OFFER STATISTICS AND EXPECTED TIMETABLE
Not applicable.
4 AGNICO-EAGLE MINES LIMITED
The following selected financial data for each of the years in the five-year period ended December 31, 2012 are derived from the consolidated financial statements of Agnico-Eagle audited by Ernst & Young LLP. The selected financial data should be read in conjunction with the Company's operating and financial review and prospects set out in Item 5 of this Form 20-F, the consolidated financial statements and the notes thereto set out in Item 18 of this Form 20-F and other financial information included elsewhere in this Form 20-F.
| Year Ended December 31, | ||||||||||||
| 2012 | 2011 | 2010 | 2009 | 2008 | ||||||||
| (in thousands of U.S. dollars, US GAAP basis, other than share and per share information) |
||||||||||||
| Income Statement Data | ||||||||||||
| Revenues from mining operations | 1,917,714 | 1,821,799 | 1,422,521 | 613,762 | 368,938 | |||||||
| Production costs | 897,712 | 876,078 | 677,472 | 306,318 | 186,862 | |||||||
| Exploration and corporate development | 109,500 | 75,721 | 54,958 | 36,279 | 34,704 | |||||||
| Amortization | 271,861 | 261,781 | 192,486 | 72,461 | 36,133 | |||||||
| General and administrative | 119,085 | 107,926 | 94,327 | 63,687 | 47,187 | |||||||
| Write-down of available-for-sale securities | 12,732 | 8,569 | – | – | 74,812 | |||||||
| Loss (Gain) on derivative financial instruments | 820 | (3,683 | ) | (7,612 | ) | – | – | |||||
| Provincial capital tax | 4,001 | 9,223 | (6,075 | ) | 5,014 | 5,332 | ||||||
| Interest | 57,887 | 55,039 | 49,493 | 8,448 | 2,952 | |||||||
| Interest and sundry income | (1,667 | ) | 5,188 | (10,254 | ) | (16,172 | ) | (11,721 | ) | |||
| Loss on Goldex mine | – | 302,893 | – | – | – | |||||||
| Impairment loss on Meadowbank mine | – | 907,681 | – | – | – | |||||||
| Gain on acquisition of Comaplex, net of transaction costs | – | – | (57,526 | ) | – | – | ||||||
| Gain on sale of available-for-sale-securities | (9,733 | ) | (4,907 | ) | (19,487 | ) | (10,142 | ) | (25,626 | ) | ||
| Foreign exchange (gain) loss | 16,320 | (1,082 | ) | 19,536 | 39,831 | (77,688 | ) | |||||
| Income before income and mining taxes | 435,141 | (778,628 | ) | 435,203 | 108,038 | 95,991 | ||||||
| Income and mining taxes (recoveries) | 124,225 | (209,673 | ) | 103,087 | 21,500 | 22,824 | ||||||
| Net income | 310,916 | (568,955 | ) | 332,116 | 86,538 | 73,167 | ||||||
| Attributed to non-controlling interest | – | (60 | ) | – | – | – | ||||||
| Attributed to common shareholders | 310,916 | (568,895 | ) | – | – | – | ||||||
| Net income per share – basic | 1.82 | (3.36 | ) | 2.05 | 0.55 | 0.51 | ||||||
| Net income per share – diluted | 1.81 | (3.36 | ) | 2.00 | 0.55 | 0.50 | ||||||
| Weighted average number of shares outstanding – basic | 171,250,179 | 170,275,475 | 162,342,686 | 155,942,151 | 144,740,658 | |||||||
| Weighted average number of shares outstanding – diluted | 171,485,615 | 170,275,475 | 165,842,259 | 158,620,888 | 145,888,728 | |||||||
| Dividends declared per common share | 1.02 | – | 0.64 | 0.18 | 0.18 | |||||||
2012 ANNUAL REPORT 5
| Balance Sheet Data (at end of period) | ||||||||||||
| Mining properties (net) | 4,067,456 | 3,895,355 | 4,564,563 | 3,581,798 | 2,997,500 | |||||||
| Total assets | 5,225,842 | 5,034,262 | 5,500,351 | 4,247,357 | 3,378,824 | |||||||
| Long-term debt | 830,000 | 920,095 | 650,000 | 715,000 | 200,000 | |||||||
| Reclamation provision and other liabilities | 127,735 | 145,988 | 145,536 | 96,255 | 71,770 | |||||||
| Net assets | 3,410,212 | 3,215,163 | 3,665,450 | 2,751,761 | 2,517,756 | |||||||
| Common shares | 3,241,922 | 3,181,381 | 3,078,217 | 2,378,759 | 2,299,747 | |||||||
| Shareholders' equity | 3,410,212 | 3,215,163 | 3,665,450 | 2,751,761 | 2,517,756 | |||||||
| Total common shares outstanding | 172,296,610 | 170,859,604 | 168,720,355 | 156,625,174 | 154,808,918 | |||||||
All dollar amounts in this Form 20-F are in U.S. dollars, except where otherwise indicated. The following tables set out, in Canadian dollars, the exchange rates for the U.S. dollar, based on the noon buying rate as reported by the Bank of Canada (the "Noon Buying Rate"). On March 11, 2013, the Noon Buying Rate was US$1.00 equals C$1.0268.
| Year Ended December 31, | |||||||||||
| 2012 | 2011 | 2010 | 2009 | 2008 | |||||||
| High | 1.0418 | 1.0604 | 1.0778 | 1.3000 | 1.2969 | ||||||
| Low | 0.9710 | 0.9449 | 0.9946 | 1.0292 | 0.9719 | ||||||
| End of Period | 0.9949 | 1.0170 | 0.9946 | 1.0466 | 1.2246 | ||||||
| Average | 0.9996 | 0.9891 | 1.0299 | 1.1420 | 1.0660 | ||||||
| 2013 | 2012 | ||||||||||||||
| March (to March 11 |
) |
February | January | December | November | October | September | ||||||||
| High | 1.0314 | 1.0285 | 1.0078 | 0.9952 | 1.0028 | 1.0004 | 0.9902 | ||||||||
| Low | 1.0268 | 0.9960 | 0.9839 | 0.9841 | 0.9927 | 0.9763 | 0.9710 | ||||||||
| End of Period | 1.0268 | 1.0285 | 0.9992 | 0.9949 | 0.9932 | 0.9996 | 0.9837 | ||||||||
| Average | 1.0290 | 1.0098 | 0.9921 | 0.9896 | 0.9970 | 0.9872 | 0.9783 | ||||||||
On December 31, 2012 and March 11, 2013, US$1.00 equalled €0.7579 and €0.7696, respectively, as reported by the European Central Bank.
6 AGNICO-EAGLE MINES LIMITED
The Company's financial performance and results may fluctuate widely due to volatile and unpredictable commodity prices.
The Company's earnings are directly related to commodity prices, as revenues are derived from the sale of precious metals (gold and silver), zinc, copper and lead. Gold prices, which have the greatest impact on the Company's financial performance, fluctuate widely and are affected by numerous factors beyond the Company's control, including central bank purchases and sales, producer hedging and de-hedging activities, expectations of inflation, investment demand, the relative exchange rate of the U.S. dollar with other major currencies, interest rates, global and regional demand, political and economic conditions, production costs in major gold-producing regions, speculative positions taken by investors or traders in gold and changes in supply, including worldwide production levels. The aggregate effect of these factors is impossible to predict with accuracy. In addition, the price of gold has on occasion been subject to very rapid short-term changes because of speculative activities. Fluctuations in gold prices may materially adversely affect the Company's financial performance or results of operations. If the market price of gold falls below the Company's total cash costs per ounce of production at one or more of its projects at that time and remains so for any sustained period, the Company may experience losses and/or may curtail or suspend some or all of its exploration, development and mining activities at such projects or at other projects. In addition, such fluctuations may require changes to the mine plan. The Company's decisions to proceed with the operations at its currently operating mines were based on a market price of gold between $400 and $690 per ounce. If the market price of gold falls below these levels, the mines may be rendered uneconomic and production may be suspended. The Company's evaluation of the acquisition of the Meliadine project was based on an assumption of a market price of gold of $950 per ounce, the evaluation of the acquisition of the La India mine project was based on an assumption of a market price of gold of $1,150 per ounce and the decision to proceed with the development and mining of the M and E Zones at Goldex was based on a market price of gold of $1,342 per ounce. If the market price of gold falls below these respective levels, future activity at the Meliadine project, the La India mine project or the Goldex mine project may be rendered uneconomic and activities may be suspended. The Company's current mine plans are all based on a gold price of $1,342 per ounce and reserve and resource estimates are based on a gold price of $1,490 per ounce or $1,345 per ounce (see "Item 4 – Information on the Company – Property, Plant and Equipment – Mineral Reserves and Mineral Resources – Information on Mineral Reserves and Mineral Resources of the Company"); if the price of gold falls below these levels the mine plans may have to be changed, which may result in reduced production, higher costs than anticipated or both and estimates of reserves and resources may have to be reduced. Further, the prices received from the sale of the Company's byproduct metals produced at its LaRonde mine (zinc, silver, copper and lead) and its Pinos Altos mine (silver) affect the Company's ability to meet its targets for total cash costs per ounce or all-in sustaining costs of gold produced. These byproduct metal prices fluctuate widely and are also affected by numerous factors beyond the Company's control. The Company's policy and practice is not to sell forward its future gold production; however, under the Company's price risk management policy, approved by the Company's board of directors (the "Board" or the "Board of Directors"), the Company may review this practice on a project by project basis. See "Item 11 Quantitative and Qualitative Disclosures about Market Risk – Derivatives" for more details on the Company's use of derivative instruments. The Company occasionally uses derivative instruments to mitigate the effects of fluctuating byproduct metal prices; however, these measures may not be successful.
The volatility of gold prices is illustrated in the following table which sets out, for the periods indicated, the high, low and average afternoon fixing prices for gold on the London Bullion Market (the "London P.M. Fix").
| 2013 (to March 11) |
2012 | 2011 | 2010 | 2009 | 2008 | ||||||||
| High price ($ per ounce) | 1,694 | 1,792 | 1,895 | 1,421 | 1,212 | 1,011 | |||||||
| Low price ($ per ounce) | 1,574 | 1,540 | 1,319 | 1,058 | 810 | 712 | |||||||
| Average price ($ per ounce) | 1,640 | 1,669 | 1,572 | 1,125 | 972 | 872 | |||||||
On March 11, 2013, the London P.M. Fix was $1,579 per ounce of gold.
The assumptions that underlie the estimate of future operating results and the strategies used to mitigate the effects of risks of metal prices are set out herein and in "Item 5 Operating and Financial Review and Prospects – Outlook – Gold Production Growth" of this Form 20-F.
2012 ANNUAL REPORT 7
Based on 2013 production estimates, the approximate sensitivities of the Company's after-tax income to a 10% change in certain metal prices from 2012 market average prices are as follows:
| Income per share |
|||
| Gold | $0.69 | ||
| Silver | $0.01 | ||
| Zinc | $0.02 | ||
| Copper | $0.06 | ||
Sensitivities of the Company's after-tax income to changes in metal prices will increase with increased production.
The Company is largely dependent upon its mining and milling operations at its Meadowbank mine in Nunavut and Pinos Altos mine in Mexico, and any adverse condition affecting those operations may have a material adverse effect on the Company.
The Company's operations at the Meadowbank mine in Nunavut accounted for approximately 35% of the Company's gold production in 2012 and are expected to account for approximately 36% of the Company's gold production in 2013. The Pinos Altos mine in northern Mexico accounted for approximately 23% of the Company's gold production in 2012 and is expected to account for approximately 19% of the Company's gold production in 2013. Also, in 2012 the Meadowbank mine and the Pinos Altos mine accounted for approximately 26% and 29%, respectively, of the Company's operating margin. In 2011, gold production at the Meadowbank mine was approximately 90,000 ounces below the Company's expectation as a result of issues that included a fire that destroyed the minesite's kitchen facilities and above anticipated dilution. In addition, for the year ended December 31, 2011, the Company performed a full review of the Meadowbank mine's operation and updated the related life of mine plan. The review considered the exploration potential of the area, the current mineral reserves and resources, the projected operating costs in light of persistently high operating costs experienced since the commencement of commercial operations, metallurgical performance and gold price. The updated life of mine plan contemplated a shorter mine life and reduced reserves and resources and required the Company to incur a pre-tax asset impairment charge of $907.7 million. Any adverse condition affecting mining or milling conditions at the Meadowbank or Pinos Altos mines could be expected to have a material adverse effect on the Company's financial performance and results of operations (see "– The Company's recently opened mines, mine construction projects and expansion projects are subject to risks associated with new mine development, which may result in delays in the start-up of mining operations, delays in existing operations and unanticipated costs" and "– If the Company experiences mining accidents or other adverse conditions, the Company's mining operations may yield less gold than indicated by its estimated gold production" below). Gold production at the Meadowbank mine is also subject to risks relating to operating in a remote location (see "– The Company may experience difficulties operating its Meadowbank mine and developing the Meliadine project as a result of their remote location" below). The Company also anticipates using revenue generated by its operations at the Meadowbank and Pinos Altos mines to finance a substantial portion of its capital expenditures in 2013, including projects at the Kittila and Pinos Altos mines, the Goldex and La India mine projects and the Meliadine project.
Unless the Company acquires or develops other significant gold-producing assets, the Company will continue to be dependent on its operations at the Meadowbank and Pinos Altos mines for a substantial portion of its gold production and cash flow provided by operating activities. Further, there can be no assurance that the Company's current exploration and development programs at Meadowbank or Pinos Altos will result in any new economically viable mining operations or yield new mineral reserves to replace and expand current mineral reserves.
The Company may experience difficulties operating its Meadowbank mine and developing the Meliadine project as a result of their remote location.
The Company's Meadowbank mine is located in the Kivalliq District of Nunavut in northern Canada, approximately 70 kilometres north of Baker Lake. The closest major city is Winnipeg, Manitoba, approximately 1,500 kilometres to the south. The Company constructed a 110-kilometre all-weather road from Baker Lake, which provides summer shipping access via Hudson Bay to the Meadowbank mine. However, the Company's operations are constrained by the remoteness of the mine, particularly as the port of Baker Lake is only accessible approximately 2.5 months per year. Most of the materials that the Company requires for the operation of the Meadowbank mine must be transported through the port of
8 AGNICO-EAGLE MINES LIMITED
Baker Lake during this shipping season, which may be further truncated due to weather conditions. If the Company is unable to acquire and transport necessary supplies during this time, this may result in a slowdown or stoppage of operations at the Meadowbank mine. Furthermore, if major equipment fails, items necessary to replace or repair such equipment may have to be shipped through Baker Lake during this window. Failure to have available the necessary materials required for operations or to repair or replace malfunctioning equipment at the Meadowbank mine may require the slowdown or stoppage of operations. For example, the March 2011 fire at the kitchen facilities of the Meadowbank mine required operations to be reduced at the mine, which resulted in lower gold production at the mine.
The Company's Meliadine project, 290 kilometres southeast of the Meadowbank mine, is also located in the Kivalliq District of Nunavut, approximately 25 kilometres northwest of the hamlet of Rankin Inlet on the west coast of Hudson Bay. Access to the property is by helicopter from Rankin Inlet year-round and by tracked vehicles overland on a winter road from approximately late December to mid-May. The Company's operations at the Meliadine project may be constrained by its remoteness and, if the all-weather access road from Rankin Inlet is not completed as scheduled in mid-2013, lack of access if the winter road season is shortened by permit delays or unusually warm weather. Most of the materials that the Company requires to operate the advanced exploration program, and may require if it determines to build a mine in the future, must be transported through the port of Rankin Inlet during its six-week shipping season. If the Company cannot identify and procure suitable equipment and materials within a timeframe that permits transporting them to the project within this shipping season, it could result in delays and/or cost increases in the exploration program and, if the Company determines to build a mine, any construction or development on the property.
The remoteness of the Meadowbank mine and Meliadine project also necessitates the use of fly-in/fly-out camps for the accommodation of site employees and contractors, which may have an impact on the Company's ability to attract and retain qualified mining, exploration and construction personnel. If the Company is unable to attract and retain sufficient personnel or sub-contractors on a timely basis, the Company's operations at the Meadowbank mine and future development plans at the Meliadine project may be adversely affected.
The Company's recently opened mines, mine construction projects and expansion projects are subject to risks associated with new mine development, which may result in delays in the start-up of mining operations, delays in existing operations and unanticipated costs.
The Company's production forecasts are based on full production being achieved at all of its mines, and the Company's ability to achieve and maintain full production rates at these mines is subject to a number of risks and uncertainties. Production from these mines in 2013 may be lower than anticipated if the anticipated full production rate cannot be achieved.
The LaRonde mine extension, which commenced operation in late 2011, is one of the deepest operations in the Western Hemisphere with an expected maximum depth of 3,110 metres. The operations of the LaRonde mine extension rely on new infrastructure for hauling ore and materials to the surface, including a winze (or internal shaft) and a series of ramps linking mining deposits to the Penna Shaft that services current operations at the LaRonde mine. The depth of the operations poses significant challenges to the Company, such as geomechanical risks and ventilation and air conditioning requirements, which may result in difficulties and delays in achieving gold production objectives. In 2012, challenges associated with excess heat and congestion at the lower parts of the mine delayed the ramp up of production. While production in 2012 was not reduced, the Company has reduced its annual production forecast for 2013 and 2014 due to these factors.
The further development of the Kittila and Pinos Altos mines, as well as the development of the M Zone and E Zone at the Goldex mine project, requires the construction and operation of new underground mining operations and the development of the La India mine project requires the construction and operation of open pit and heap leach facilities. The construction and operation of underground mining facilities and open pit and heap leach facilities are subject to a number of risks, including unforeseen geological formations, implementation of new mining processes, delays in obtaining required construction, environmental or operating permits and engineering and mine design adjustments.
If the Company experiences mining accidents or other adverse conditions, the Company's mining operations may yield less gold than indicated by its estimated gold production.
The Company's gold production may fall below estimated levels as a result of mining accidents such as cave-ins, rock falls, rock bursts, pit wall failures, fires or flooding or as a result of other operational problems such as a failure of a production hoist, autoclave, filter press or semi-autogenous grinding ("SAG") mill. In addition, production may be reduced if, during the course of mining or processing, unfavourable weather conditions, ground conditions or seismic activity are encountered, ore grades are lower than expected, the physical or metallurgical characteristics of the ore are less amenable
2012 ANNUAL REPORT 9
than expected to mining or treatment, dilution increases, electrical power is interrupted or heap leach processing results in containment discharge. While the Company met production forecasts in 2012, it failed to do so in seven of the last ten years primarily due to: a rock fall, production drilling challenges and lower than planned mill recoveries in 2003; higher than expected dilution in 2004; increased stress levels in a sill pillar requiring the temporary closure of production sublevels in 2005; and delays in the commissioning of the Goldex production hoist and the Kittila autoclave in 2008. In 2009, gold production was 492,972 ounces, down from the Company's initial estimate of 590,000 ounces, primarily as a result of delays in the commencement of production at the Kittila mine due to issues with the autoclave, at the Pinos Altos mine resulting from problems in commissioning the dry tailings filter presses and at the Lapa mine resulting from dilution issues. In 2010, gold production of 987,607 ounces was below the initial anticipated range of 1 million to 1.1 million ounces primarily as a result of lower throughput at the Meadowbank mine mill due to a bottleneck in the crushing circuit and because there were autoclave issues at the Kittila mine in the first half of the year. In 2011, gold production of 985,460 ounces was below the initial anticipated range of 1.13 to 1.23 million ounces primarily as a result of suspension of mining operations at the Goldex mine due to geotechnical concerns with the rock above the mining horizon, a fire in the Meadowbank mine kitchen complex which negatively impacted production and lower than expected grades at the Meadowbank and LaRonde mines. Although gold production of 1,043,811 ounces exceeded estimates in 2012, a movement of leached ore from the upper lifts of the Creston Mascota deposit at Pinos Altos phase one leach pad on September 30, 2012 suggested that the integrity of the phase one leach pad liner had been compromised and caused the suspension of active leaching in the fourth quarter. Occurrences of this nature and other accidents, adverse conditions or operational problems in future years may result in the Company's failure to achieve current or future production estimates.
The Company's total cash costs per ounce of gold production depend, in part, on external factors that are subject to fluctuation and, if such costs increase, some or all of the Company's activities may become unprofitable.
The Company's total cash costs per ounce of gold are dependent on a number of factors, including the exchange rate between the U.S. dollar and the Canadian dollar, Euro or Mexican peso, smelting and refining charges, production royalties, the price of gold and byproduct metals and the cost of inputs used in mining operations. At the LaRonde mine, the Company's total cash costs per ounce of production are affected by the prices and production levels of byproduct zinc, silver and copper, the revenue from which is offset against the cost of gold production. Total cash costs per ounce from the Company's operations at the Pinos Altos mine are affected by the exchange rate between the U.S. dollar and the Mexican peso and the price and production level of byproduct silver, the revenue from which is offset against the cost of gold production. Total cash costs per ounce from the Company's operations at its mines in Canada and the Kittila mine are affected by changes in the exchange rates between the U.S. dollar and the Canadian dollar and the Euro, respectively. Total cash costs per ounce at all of the Company's mines are also affected by the costs of inputs used in mining operations, including labour (including contractors), steel, chemical reagents and energy. All of these factors are beyond the Company's control. If the Company's total cash costs per ounce of gold rise above the market price of gold and remain so for any sustained period, the Company may experience losses and may curtail or suspend some or all of its exploration, development and mining activities.
Total cash costs per ounce is not a recognized measure under US GAAP, and this data may not be comparable to data presented by other gold producers. Management uses this generally accepted industry measure in evaluating operating performance and believes it to be a realistic indicator of such performance and useful in allowing year over year comparisons. The data also reflects the Company's ability to generate cash flow and operating income at various gold prices. This additional information should be considered together with other data prepared in accordance with US GAAP and is not necessarily indicative of operating costs or cash flow measures prepared in accordance with US GAAP. See "Item 5 Operating and Financial Review and Prospects – Results of Operations – Production Costs" for reconciliation of total cash costs per ounce and minesite costs per tonne to their closest US GAAP measure and "Note to Investors Concerning Certain Measures of Performance" for a discussion of non-US GAAP measures.
The Company may experience operational difficulties at its operations in Finland and Mexico.
The Company's operations include a mine in Finland and a mine and a mine development project in northern Mexico. These operations are subject to various levels of political, economic and other risks and uncertainties that are different from those encountered at the Company's Canadian properties. These risks and uncertainties vary from country to country and may include: extreme fluctuations in currency exchange rates; high rates of inflation; labour unrest; risks of war or civil unrest; expropriation and nationalization; renegotiation or nullification of existing concessions, licences, permits and contracts; illegal mining; corruption; restrictions on foreign exchange and repatriation; hostage taking; and changing political conditions and currency controls. In addition, the Company must comply with multiple and potentially conflicting regulations in Canada, the United States, Europe and Mexico, including export requirements, taxes, tariffs, import duties and other trade barriers, as well as health, safety and environmental requirements.
10 AGNICO-EAGLE MINES LIMITED
Changes, if any, in mining or investment policies or shifts in political attitude in Finland or Mexico may adversely affect the Company's operations or profitability. Operations may be affected in varying degrees by government regulations with respect to matters including restrictions on production, price controls, export controls, currency controls or restrictions, currency remittance, income and other taxes, expropriation of property, foreign investment, maintenance of claims, environmental legislation, land use, land claims of local people, water use and mine safety. Failure to comply strictly with applicable laws, regulations and local practices relating to mineral rights applications and tenure could result in loss, reduction or expropriation of entitlements or the imposition of additional local or foreign parties as joint venture partners with carried or other interests.
In addition, Finland and Mexico have significantly different laws and regulations than Canada and there exist cultural and language differences between these countries and Canada. Also, the Company faces challenges inherent in efficiently managing employees over large geographical distances, including the challenges of staffing and managing operations in several international locations and implementing appropriate systems, policies, benefits and compliance programs. These challenges may divert management's attention to the detriment of the Company's operations in Canada. There can be no assurance that difficulties associated with the Company's foreign operations can be successfully managed.
Mineral reserve and mineral resource estimates are only estimates and such estimates may not accurately reflect future mineral recovery.
The figures for mineral reserves and mineral resources published by the Company are estimates and no assurance can be given that the anticipated tonnages and grades will be achieved or that the indicated level of recovery of gold will be realized. Mineral reserve and resource estimates are based on gold recoveries in small scale laboratory tests and may not be indicative of the mineralization in the entire orebody and the Company may not be able to achieve similar results in larger scale tests under on-site conditions or during production. The ore grade actually recovered by the Company may differ from the estimated grades of the mineral reserves and mineral resources. The estimates of mineral reserves and mineral resources have been determined based on assumed metal prices, foreign exchange rates and operating costs. For example, the Company has estimated proven and probable mineral reserves on its LaRonde, Kittila, Pinos Altos, La India and Tarachi properties based on, among other things, a $1,345 per ounce gold price. Estimated proven and probable reserves on the Company's other properties (including the Creston Mascota deposit at Pinos Altos) are based on a $1,490 per ounce gold price. Monthly average gold prices have been above $1,345 per ounce since November 2010; however, prior to that time, monthly average gold prices were below $1,345 per ounce. Prolonged declines in the market price of gold (or applicable byproduct metal prices) may render mineral reserves containing relatively lower grades of mineralization uneconomical to recover and could materially reduce the Company's mineral reserves. Should such reductions occur, the Company may be required to take a material write-down of its investment in mining properties, reduce the carrying value of one or more of its assets or delay or discontinue production or the development of new projects, resulting in increased net losses and reduced cash flow. Market price fluctuations of gold (or applicable byproduct metal prices), as well as increased production costs or reduced recovery rates, may render mineral reserves containing relatively lower grades of mineralization uneconomical to recover and may ultimately result in a restatement of mineral resources. Short-term factors relating to the mineral reserve, such as the need for orderly development of orebodies or the processing of new or different grades, may impair the profitability of a mine in any particular accounting period.
Mineral resource estimates for properties that have not commenced production or at deposits that have not yet been exploited are based, in most instances, on very limited and widely spaced drill hole information, which is not necessarily indicative of conditions between and around the drill holes. Accordingly, such mineral resource estimates may require revision as more drilling information becomes available or as actual production experience is gained.
The Company may experience problems in executing acquisitions or managing and integrating any completed acquisitions with its existing operations.
The Company regularly evaluates opportunities to acquire securities or assets of other mining businesses. Such acquisitions may be significant in size, may change the scale of the Company's business and may expose the Company to new geographic, political, operating, financial or geological risks. The Company's success in its acquisition activities depends on its ability to identify suitable acquisition candidates, acquire them on acceptable terms and integrate their operations successfully with those of the Company. Any acquisition would be accompanied by risks, such as the difficulty of assimilating the operations and personnel of any acquired businesses; the potential disruption of the Company's ongoing business; the inability of management to maximize the financial and strategic position of the Company through the successful integration of acquired assets and businesses; the maintenance of uniform standards, controls,
2012 ANNUAL REPORT 11
procedures and policies; the impairment of relationships with employees, customers and contractors as a result of any integration of new management personnel; and the potential unknown liabilities associated with acquired assets and businesses. In addition, the Company may need additional capital to finance an acquisition. Debt financing related to any acquisition may expose the Company to the risks related to increased leverage, while equity financing may cause existing shareholders to suffer dilution. The Company is permitted under the terms of its unsecured revolving bank credit facility and its guaranteed senior unsecured notes referred to under "Item 10 Additional Information – Material Contracts" to incur additional unsecured indebtedness, provided that it maintains certain financial ratios and meets financial condition covenants and, in the case of the bank credit facility, that it complies with certain covenants. These covenants include that no event of default under the bank credit facility has occurred and is continuing, or would occur as a result of the incurrence or assumption of such indebtedness, the terms of such indebtedness are no more onerous to the Company than those under the bank credit facility and such indebtedness does not require principal payments until at least 12 months following the then existing maturity date of the bank credit facility. There can be no assurance that the Company would be successful in overcoming these or any other problems encountered in connection with such acquisitions.
Fluctuations in foreign currency exchange rates in relation to the U.S. dollar may adversely affect the Company's results of operations.
The Company's operating results and cash flow are significantly affected by changes in the U.S. dollar/Canadian dollar exchange rate. All of the Company's revenues are earned in U.S. dollars but the majority of its operating costs at the LaRonde, Lapa and Meadowbank mines, as well as the Goldex mine project and the Meliadine project, are incurred in Canadian dollars. The U.S. dollar/Canadian dollar exchange rate has fluctuated significantly over the last several years. From January 1, 2008 to January 1, 2013, the Noon Buying Rate fluctuated from a high of C$1.3000 per $1.00 to a low of C$0.9449 per $1.00. Historical fluctuations in the U.S. dollar/Canadian dollar exchange rate are not necessarily indicative of future exchange rate fluctuations. Based on the Company's anticipated 2013 after-tax operating results, a 10% change in the U.S. dollar/Canadian dollar exchange rate from the 2012 market average exchange rate would affect net income by approximately $0.37 per share. To attempt to mitigate its foreign exchange risk and minimize the impact of exchange rate movements on operating results and cash flow, the Company has periodically used foreign currency options and forward foreign exchange contracts to purchase Canadian dollars; however, there can be no assurance that these strategies will be effective. See "Item 5 Operating and Financial Review and Prospects – Outlook – Gold Production Growth" for a description of the assumptions underlying the sensitivity and the strategies used to mitigate the effects of risks. In addition, the majority of the Company's operating costs at the Kittila mine are incurred in Euros and a significant portion of operating costs at the Pinos Altos mine and exploration and development costs at the La India mine project are incurred in Mexican pesos. Each of these currencies has fluctuated significantly against the U.S. dollar over the past several years. There can be no assurance that the Company's foreign exchange derivatives strategies will be successful or that foreign exchange fluctuations will not materially adversely affect the Company's financial performance and results of operations.
If the Company fails to comply with restrictive covenants in its debt instruments, the Company's ability to borrow under its unsecured revolving bank credit facility could be limited and the Company may then default under other debt agreements, which could harm the Company's business.
The Company's unsecured revolving bank credit facility limits, among other things, the Company's ability to permit the creation of certain liens, make investments other than investments in businesses related to mining or a business ancillary or complementary to mining, dispose of the Company's material assets or, in certain circumstances, pay dividends. In addition, the Company's guaranteed senior unsecured notes limit, among other things, the Company's ability to permit the creation of certain liens, carry on business unrelated to mining or dispose of the Company's material assets. The bank credit facility and the guaranteed senior unsecured notes also require the Company to maintain specified financial ratios and meet financial condition covenants. Events beyond the Company's control, including changes in general economic and business conditions, may affect the Company's ability to satisfy these covenants, which could result in a default under the bank credit facility or the guaranteed senior unsecured notes and, by extension, the Company's C$150 million uncommitted letter of credit facility. At March 11, 2013, there was approximately $1.1 million drawn under the bank credit facility (reflecting outstanding letters of credit) and approximately C$135 million drawn under the letter of credit facility. If an event of default under the unsecured revolving bank credit facility or the notes occurs, the Company would be unable to draw down further on the bank credit facility and the lenders could elect to declare all principal amounts outstanding thereunder at such time, together with accrued interest, to be immediately due and it could cause an event of default under the Company's guaranteed senior unsecured notes and the uncommitted letter of credit facility. An event of default under the unsecured revolving bank credit facility, the guaranteed senior unsecured notes or the uncommitted letter of
12 AGNICO-EAGLE MINES LIMITED
credit facility may also give rise to an event of default under other existing and future debt agreements and, in such event, the Company may not have sufficient funds to repay amounts owing under such agreements.
The exploration of mineral properties is highly speculative, involves substantial expenditures and is frequently unsuccessful.
The Company's profitability is significantly affected by the costs and results of its exploration and development programs. As mines have limited lives based on proven and probable mineral reserves, the Company actively seeks to replace and expand its mineral reserves, primarily through exploration and development as well as through strategic acquisitions. Exploration for minerals is highly speculative in nature, involves many risks and is frequently unsuccessful. Among the many uncertainties inherent in any gold exploration and development program are the location of economic orebodies, the development of appropriate metallurgical processes, the receipt of necessary governmental permits and the construction of mining and processing facilities. Substantial expenditures are required to pursue such exploration and development activities. Assuming discovery of an economic orebody, depending on the type of mining operation involved, several years may elapse from the initial phases of drilling until commercial operations are commenced and during such time the economic feasibility of production may change. Accordingly, there can be no assurance that the Company's current or future exploration and development programs will result in any new economically viable mining operations or yield new mineral reserves to replace and expand current mineral reserves.
The mining industry is highly competitive, and the Company may not be successful in competing for new mining properties.
There is a limited supply of desirable mineral lands available for claim staking, leasing or other acquisitions in the areas where the Company contemplates conducting exploration activities. Many companies and individuals are engaged in the mining business, including large, established mining companies with substantial capabilities and long earnings records. The Company may be at a competitive disadvantage in acquiring mining properties, as it must compete with these companies and individuals, some of which have greater financial resources and larger technical staff than the Company. Accordingly, there can be no assurance that the Company will be able to compete successfully for new mining properties.
The success of the Company is dependent on good relations with its employees and on its ability to attract and retain employees and key personnel.
Production at the Company's mines and mine projects is dependent on the efforts of the Company's employees and contractors. The Company competes with mining and other companies on a global basis to attract and retain employees at all levels with appropriate technical skills and operating experience necessary to operate its mines. Relationships between the Company and its employees may be affected by changes in the scheme of labour relations that may be introduced by relevant government authorities in the jurisdictions that the Company operates. Changes in applicable legislation or in the relationship between the Company and its employees or contractors may have a material adverse effect on the Company's business, results of operations and financial condition.
The Company is also dependent on a number of key management personnel. The loss of the services of one or more of such key management personnel could have a material adverse effect on the Company. The Company's ability to manage its operating, development, exploration and financing activities will depend in large part on the efforts of these individuals.
The Company faces significant competition to attract and retain qualified personnel and there can be no assurance that the Company will be able to attract and retain such personnel.
The Company may have difficulty financing its additional capital requirements for its planned mine construction, exploration and development.
The sustaining capital required for operations (including potential expansions) and the development of the La India and Goldex mine projects and the Meliadine project and the exploration and development of the Company's properties, including continuing exploration and development projects in Quebec, Nunavut, Finland, Mexico and Nevada, will require substantial capital expenditures. The Company estimates that capital expenditures will be approximately $596 million in 2013. As at March 11, 2013, the Company had approximately $1.199 billion available to be borrowed under its bank credit facility. Based on current funding available to the Company and expected cash from operations, the Company believes it has sufficient funds available to fund its projected capital expenditures for all of its current properties. However, if cash from operations is lower than expected or capital costs at these mines or projects exceed current estimates, or if the Company incurs major unanticipated expenses related to exploration, development or maintenance of its properties, or if
2012 ANNUAL REPORT 13
advances from the bank credit facility are unavailable, the Company may be required to seek additional financing to maintain its capital expenditures at planned levels. In addition, the Company will have additional capital requirements to the extent that it decides to expand its present operations and exploration activities, construct additional mining and processing operations at any of its properties or take advantage of opportunities for acquisitions, joint ventures or other business opportunities that may arise. Additional financing may not be available when needed or, if available, the terms of such financing may not be favourable to the Company and, if raised by offering equity securities, or securities convertible into equity securities, any additional financing may involve substantial dilution to existing shareholders. Failure to obtain any financing necessary for the Company's capital expenditure plans may result in a delay or indefinite postponement of exploration, development or production on any or all of the Company's properties, which may have a material adverse effect on the Company's business, financial condition and results of operations.
The continuing weakness in the global credit and capital markets could have a material adverse impact on the Company's liquidity and capital resources.
The credit and capital markets experienced significant deterioration in 2008, including, without limitation, the failure of significant and established financial institutions in the United States and abroad, and have continued to show weakness and volatility. These severe disruptions in the credit and capital markets have had a negative impact on the availability and terms of credit and capital. If uncertainties in these markets continue, or these markets deteriorate further, it could have a material adverse effect on the Company's liquidity, ability to raise capital and costs of capital. Failure to raise capital when needed or on reasonable terms may have a material adverse effect on the Company's business, financial condition and results of operations.
Due to the nature of the Company's mining operations, the Company may face liability, delays and increased production costs from environmental and industrial accidents and pollution, and the Company's insurance coverage may prove inadequate to satisfy future claims against the Company.
The business of gold mining is generally subject to risks and hazards, including environmental hazards, industrial accidents, unusual or unexpected rock formations, changes in the regulatory environment, cave-ins, rock bursts, rock falls, pit wall failures and flooding and gold bullion losses. Such occurrences could result in damage to, or destruction of, mineral properties or production facilities, personal injury or death, environmental damage, delays in mining, monetary losses and possible legal liability. As well, such risks may arise with respect to the closure of mines and the management of closed mine sites and mine waste (whether the Company operated the mine site or acquired it after operations were conducted by others). The Company carries insurance to protect itself against certain risks of mining and processing in amounts that it considers to be adequate but which may not provide adequate coverage in certain unforeseen circumstances. The Company may also become subject to liability for pollution, cave-ins or other hazards against which it cannot insure or against which it has elected not to insure because of high premium costs or other reasons, or the Company may become subject to liabilities which exceed policy limits. In these circumstances, the Company may incur significant costs that could have a material adverse effect on its financial performance and results of operations.
The Company's operations are subject to numerous laws and extensive government regulations which may require significant expenditures or cause a reduction in levels of production, delay or the prevention of the development of new mining properties or otherwise cause the Company to incur costs that adversely affect the Company's results of operations.
The Company's mining and mineral processing operations, exploration activities and properties are subject to the laws and regulations of federal, provincial, state and local governments in the jurisdictions in which the Company operates. These laws and regulations are extensive and govern prospecting, exploration, development, production, exports, taxes, labour standards, occupational health and safety, waste disposal and tailings management, toxic substances, environmental protection, mine safety and other matters. Compliance with such laws and regulations increases the costs of planning, designing, drilling, developing, constructing, operating, managing, closing, reclaiming and rehabilitating mines and other facilities and features. New laws or regulations, amendments to current laws and regulations governing operations and activities on mining properties or more stringent implementation or interpretation thereof could have a material adverse impact on the Company, cause a reduction in levels of production and delay or prevent the development of new mining properties.
14 AGNICO-EAGLE MINES LIMITED
Title to the Company's properties may be uncertain and subject to risks.
The acquisition of title to mineral properties is a very detailed and time-consuming process. Title to, and the area of, mineral concessions may be disputed. Although the Company believes it has taken reasonable measures to ensure proper title to its properties, there is no guarantee that title to any of its properties will not be challenged or impaired. Third parties may have valid claims on underlying portions of the Company's interests, including prior unregistered liens, agreements, transfers or claims, including land claims by indigenous groups, and title may be affected by, among other things, undetected defects. In addition, although the Company believes that it has sufficient surface rights for its operations, the Company may be unable to operate its properties as permitted or to enforce its rights in respect of its properties.
The Company's properties and mining operations may be subject to rights or claims of indigenous groups and the assertion of such rights or claims may impact the Company's ability to develop or operate its mining properties.
The Company operates in some areas currently or traditionally inhabited or used by indigenous peoples and subject to indigenous rights or claims. Accordingly, the Company is subject to the risk that one or more groups may oppose the continued operation, further development or new development of the Company's current or future properties. Such opposition may be directed through legal or administrative proceedings, or though protests or other campaigns against the Company's activities. Any such actions may have an adverse impact on the Company's operations. Although the Company attempts to develop and maintain good working relationships with all stakeholders, there can be no assurance that these relationships can be successfully managed.
Increased regulation of greenhouse gas emissions and climate change issues may adversely affect the Company's operations.
The Company operates in jurisdictions where regulatory requirements have taken effect or are proposed to monitor, report and/or reduce greenhouse gas emissions. Increased regulation of greenhouse gas emissions and climate change issues may adversely affect the Company's operations. For example, Canada has targeted to reduce greenhouse gas emissions by 17% from 2005 levels by 2020 through a sector-by-sector approach and intends to participate in the negotiation of a new international climate treaty, which would come into force in 2020. Canada's federal and provincial regulations also impose mandatory greenhouse gas emissions reporting requirements and Quebec recently adopted a cap-and-trade regulation, which took effect January 1, 2013. Similarly, Finland participates in the European Union's cap-and-trade system and Mexico has enacted climate change legislation with a greenhouse gas emission reduction target of 30% (from business-as-usual levels) by 2020.
The Company monitors and reports annually its direct and indirect greenhouse gas emissions to the international Carbon Disclosure Project. In Quebec, the Company uses primarily hydroelectric power and is not a large producer of greenhouse gases. As a result, Quebec's new regulatory requirements are not expected to have a material adverse impact on the Company. The Meadowbank mine produces approximately 167,926 tonnes of greenhouse gases per year from the production of electricity from diesel power generation, which is approximately 51% of the Company's total direct greenhouse gas emissions. It is expected that the La India mine project and any mining operation at the Meliadine project will also use diesel power generation. The Pinos Altos mine purchases electricity that is largely fossil-fuel generated and is the Company's second highest greenhouse gas producer (at 102,341 tonnes of greenhouse gases per year), which is approximately 31% of the Company's total direct greenhouse gas emissions. None of the Company's other operations emit more than 30,000 tonnes of greenhouse gases per year. While these new regulatory requirements in respect of greenhouse gases and the additional costs required to comply are not expected to have a material adverse effect on the Company's operations, such requirements may not be adopted as currently proposed, may be amended or may have unexpected effects on the Company and, as a result, may have a material adverse effect on the Company's financial performance and its results of operations.
The Company is subject to the risk of litigation, the causes and costs of which cannot be known.
The Company is subject to litigation arising in the normal course of business and may be involved in disputes with other parties in the future which may result in litigation. The causes of potential future litigation cannot be known and may arise from, among other things, business activities, environmental laws, volatility in stock price or failure to comply with disclosure obligations. Currently, the Company is the subject of certain class action lawsuits relating to the Company's disclosure prior to the suspension of mining operations at the Goldex mine in October 2011, as described in note 21 to the financial statements contained in Item 18 hereof. The results of litigation cannot be predicted with certainty. If the Company is unable to resolve these disputes favourably, either by judicial determination or settlement, it may have a material adverse impact on the Company's financial performance, cash flow and results of operations.
2012 ANNUAL REPORT 15
In the event of a dispute involving the foreign operations of the Company, the Company may be subject to the exclusive jurisdiction of foreign courts or may not be successful in subjecting foreign persons to the jurisdiction of courts in Canada. The Company's ability to enforce its rights could have an adverse effect on its future cash flows, earnings, results of operations and financial condition.
The use of derivative instruments for the Company's byproduct metal production may prevent gains from being realized from subsequent byproduct metal price increases.
While the Company's general policy is not to sell forward its future gold production, the Company has used, and may in the future use, various byproduct metal derivative strategies, such as selling future contracts or purchasing put options. The Company continually evaluates the potential short and long term benefits of engaging in such derivative strategies based upon current market conditions. No assurance can be given, however, that the use of byproduct metal derivative strategies will benefit the Company in the future. There is a possibility that the Company could lock in forward deliveries at prices lower than the market price at the time of delivery. In addition, the Company could fail to produce enough byproduct metals to offset its forward delivery obligations, requiring the Company to purchase the metal in the spot market at higher prices to fulfill its delivery obligations or, for cash settled contracts, make cash payments to counterparties in excess of byproduct revenue. If the Company is locked into a lower than market price forward contract or has to buy additional quantities at higher prices, its net income could be adversely affected. None of the current contracts establishing the byproduct metal derivatives positions qualify for hedge accounting treatment under US GAAP and therefore any year-end mark-to-market adjustments are recognized in the "Gain on derivative financial instruments" line item of the consolidated statements of income and comprehensive income. See "Item 11 Quantitative and Qualitative Disclosures about Market Risk – Derivatives".
The trading price for the Company's securities is volatile.
The trading price of the Company's common shares and, consequently, the trading price of securities convertible into or exchangeable for the Company's common shares, have been and may continue to be subject to large fluctuations which may result in losses to investors. The trading price of the Company's common shares and securities convertible into or exchangeable for common shares may increase or decrease in response to a number of events and factors, including:
- •
- changes
in the market price of gold or other byproduct metals the Company sells;
- •
- events
affecting economic circumstances in Canada, the United States and elsewhere;
- •
- trends
in the mining industry and the markets in which the Company operates;
- •
- changes
in financial estimates and recommendations by securities analysts;
- •
- acquisitions
and financings;
- •
- quarterly
variations in operating results;
- •
- the
operating and share price performance of other companies that investors may deem comparable; and
- •
- purchases or sales of large blocks of the Company's common shares or securities convertible into or exchangeable for the Company's common shares.
Wide price swings are currently common in the markets on which the Company's securities trade. This volatility may adversely affect the prices of the Company's common shares and the securities convertible into or exchangeable for the Company's common shares regardless of the Company's operating performance.
The Company may not be able to comply with the requirements of Section 404 of the Sarbanes-Oxley Act.
Section 404 of the Sarbanes-Oxley Act of 2002 ("SOX") requires an annual assessment by management of the effectiveness of the Company's internal control over financial reporting. Section 404 of SOX also requires an annual attestation report by the Company's independent auditors addressing the effectiveness of the Company's internal control over financial reporting. The Company has completed its Section 404 assessment and received the auditors' attestation as of December 31, 2012.
If the Company fails to maintain the adequacy of its internal control over financial reporting, as such standards are modified, supplemented or amended from time to time, the Company may not be able to conclude that it has effective internal control over financial reporting in accordance with Section 404 of SOX. The Company's failure to satisfy the requirements of Section 404 of SOX on an ongoing, timely basis could result in the loss of investor confidence in the
16 AGNICO-EAGLE MINES LIMITED
reliability of its financial statements, which in turn could harm the Company's business and negatively impact the trading price of its common shares and securities convertible or exchangeable for common shares. In addition, any failure to implement required new or improved controls, or difficulties encountered in their implementation, could harm the Company's operating results or cause it to fail to meet its reporting obligations. Future acquisitions of companies may provide the Company with challenges in implementing the required processes, procedures and controls in its acquired operations. Acquired companies may not have disclosure controls and procedures or internal control over financial reporting that are as thorough or effective as those required by securities laws currently applicable to the Company.
No evaluation can provide complete assurance that the Company's internal control over financial reporting will prevent misstatement due to error or fraud or will detect or uncover all control issues or instances of fraud, if any. The effectiveness of the Company's controls and procedures could also be limited by simple errors or faulty judgments. In addition, as the Company continues to expand, the challenges involved in maintaining adequate internal control over financial reporting will increase and will require that the Company continue to improve its internal control over financial reporting. The Company cannot be certain that it will be successful in continuing to comply with Section 404 of SOX.
Potential unenforceability of civil liabilities and judgments.
The Company is incorporated under the laws of the Province of Ontario, Canada. A majority of the Company's directors and officers as well as the experts named in this Form 20-F are residents of Canada. Also, almost all of the Company's assets and the assets of these persons are located outside of the United States. As a result, it may be difficult for shareholders to initiate a lawsuit within the United States against these non-U.S. residents, or to enforce U.S. judgments against the Company or these persons. The Company's Canadian counsel has advised the Company that a monetary judgment of a U.S. court predicated solely upon the civil liability provisions of U.S. federal securities laws would likely be enforceable in Canada if the U.S. court in which the judgment was obtained had a basis for jurisdiction in the matter that was recognized by a Canadian court for such purposes. The Company cannot provide assurance that this will be the case. It is less certain that an action could be brought in Canada in the first instance on the basis of liability predicated solely upon the civil liability provisions of U.S. federal securities laws.
ITEM 4 INFORMATION ON THE COMPANY
History and Development of the Company
The Company is an established Canadian-based international gold producer with mining operations in northwestern Quebec, northern Mexico, northern Finland and Nunavut and exploration activities in Canada, Europe, Latin America and the United States. The Company's operating history includes over three decades of continuous gold production primarily from underground operations. Since its formation on June 1, 1972, the Company has produced approximately 8.5 million ounces of gold. For definitions of certain technical terms used in the following discussion, see "– Glossary of Selected Mining Terms" in this Item 4.
The Company's strategy is to focus on the continued exploration, development and expansion of its properties, all of which are located in politically stable jurisdictions. The Company has spent approximately $3.1 billion on mine development over the last five years. Through this development program, the Company transformed itself from a regionally focused, single mine producer to a multi-mine international gold producer with five operating, 100% owned mines, two mine development projects and one advanced exploration project.
Since 1988, the LaRonde mine, in the Abitibi region of Quebec, has been the Company's flagship operation, producing approximately 4.5 million ounces of gold as well as valuable byproducts. The Lapa mine, one of the Company's highest grade metals mines, is 11 kilometres east of the LaRonde mine, and the Goldex mine project, where mine construction on the M and E zones was approved in July 2012, is 60 kilometres east of the LaRonde mine. The synergies between these sites contribute to the Company's efforts to reduce costs. The Kittila mine in Finland, which achieved commercial production in May 2009, has a long reserve life and has significant production expansion potential. In February 2012, the Board approved expansion of mining operations at the Kittila mine to a capacity of 3,750 tonnes per day. The Pinos Altos mine, in Mexico, achieved commercial production in November 2009 and also has significant production expansion potential. The Company's fifth mine, Meadowbank, in Nunavut, achieved commercial production in March 2010 and is expected to produce the most gold (approximately 360,000 ounces) in 2013. In September 2012, the Company began the development and construction at the La India mine project in Mexico. The La India mine project and the Goldex mine project are both expected to achieve commercial production in the second quarter of 2014. In addition, the Company plans to pursue opportunities for growth in gold production and gold reserves through the prudent acquisition or development of exploration properties, development properties, producing properties and other mining businesses in the Americas and Europe.
2012 ANNUAL REPORT 17
In 2012, the Company produced 1,043,811 ounces of gold at total cash costs per ounce of $640 net of revenues from byproduct metals. For 2013, the Company expects to produce between 970,000 and 1,010,000 ounces of gold at a total cash cost per ounce of gold produced of between $700 and $750 net of byproduct revenue. These expected higher total cash costs compared to 2012 reflect the high proportion of production coming from the Meadowbank mine, which is expected to have higher total cash costs per ounce compared to the Company's average; higher costs associated with the transition to underground mining operations at the Pinos Altos mine and the Kittila mine; and increased production from the Company's mines that do not contain byproduct metals, revenue from which reduces total cash costs per ounce. In addition, the higher total cash costs per ounce also reflect the strength of the Canadian dollar against the U.S. dollar and continued escalations in labour, shipping and transportation costs. See "Note to Investors Concerning Certain Measures of Performance" for a discussion of the use of the non-US GAAP measure total cash costs per ounce. The Company has traditionally sold all of its production at the spot price of gold due to its general policy not to sell forward its future gold production.
The Company expects its all-in sustaining costs for 2013 to be approximately $1,075 per ounce of gold. The Company calculates all-in sustaining costs as the aggregate of total cash costs (net of byproduct credits), sustaining capital expense, corporate, general and administrative expense (net of stock option expense) and exploration expenses divided by the number of ounces produced. All-in sustaining costs is a non-US GAAP measure and is used to show the full cost of gold production from current operations. The Company's methodology for calculating all-in sustaining costs may not be similar to the methodology used by other producers that disclose all-in sustaining costs. The Company may change the methodology it uses to calculate all-in sustaining costs in the future, including in response to the adoption of formal industry guidance regarding this measure by the World Gold Council.
The Company operates through four segments: Canada, Europe, Latin America and Exploration.
The Canadian Segment is comprised of the Company's operations in the Province of Quebec and the Nunavut Territory. The Company's Quebec properties include the LaRonde mine, the Lapa mine and the Goldex mine project, each of which is held directly by the Company. In 2012, the Quebec properties accounted for approximately 25% of the Company's gold production, comprised of approximately 15% from the LaRonde mine and approximately 10% from the Lapa mine. In 2013, the Company anticipates that its Quebec properties will account for approximately 28% of the Company's gold production, of which 18% and 10% of the Company's gold production will come from the LaRonde mine and the Lapa mine, respectively.
The Company's Nunavut properties are comprised of the Meadowbank mine and the Meliadine project, which are both held directly by the Company. In 2012, the Meadowbank mine accounted for approximately 35% of the Company's gold production and the Company anticipates that in 2013 the Meadowbank mine will account for approximately 36% of the Company's gold production.
The Company's operations in the European Segment are conducted through its indirect subsidiary, Agnico Eagle Finland Oy, which owns the Kittila mine in Finland. In 2012, the Kittila mine accounted for approximately 17% of the Company's gold production and the Company anticipates that in 2013 the Kittila mine will again account for approximately 17% of the Company's gold production.
In the Latin American Region, the Company's mining at Pinos Altos are conducted through its subsidiary, Agnico Eagle Mexico S.A. de C.V., which owns the Pinos Altos mine, including the Creston Mascota deposit. The La India mine project is owned by the Company's indirect subsidiary, Agnico Sonora, S.A. de C.V. In 2012, the Pinos Altos mine accounted for approximately 23% of the Company's gold production and the Company anticipates that in 2013 the Pinos Altos mine will account for approximately 19% of the Company's gold production.
The Exploration Segment includes the Company's grassroots exploration operations in the United States, the European exploration office, the Canadian exploration offices and the Latin American exploration office. In addition, the Company has international exploration offices in Reno, Nevada and Vancouver, Canada.
18 AGNICO-EAGLE MINES LIMITED
The following table sets out the date of acquisition, the date of commencement of construction and the date of achieving commercial production for the Company's mines and mine projects.
| Date of Acquisition (1) | Date of Commencement of Construction |
Date of achieving Commercial Production |
|||||
| LaRonde mine | 1992 | 1985 | 1988 | ||||
| Lapa mine | June 2003 | June 2006 | May 2009 | ||||
| Goldex mine project (2) | December 1993 | July 2012 | Second quarter of 2014 (3) | ||||
| Kittila mine | November 2005 | June 2006 | May 2009 | ||||
| Pinos Altos mine | March 2006 | August 2007 | November 2009 | ||||
| La India mine project | November 2011 | September 2012 | Second quarter of 2014 (3) | ||||
| Meadowbank mine | April 2007 | Pre-April 2007 | March 2010 | ||||
Notes:
- (1)
- Date
when 100% ownership was acquired.
- (2)
- Construction
of infrastructure for purposes of mining the Goldex Extraction Zone (the "GEZ") commenced in July 2005 and the GEZ achieved commercial production in
August 2008. Mining operations on the GEZ were suspended in October 2011. In July 2012, the Company approved the construction of a mine at the M and E Zones at Goldex.
- (3)
- Anticipated.
The Company's exploration program focuses primarily on the identification of new mineral reserves and resources and new development opportunities in proven gold producing regions. Current exploration activities are concentrated in Canada, Europe, Latin America and the United States. Several projects were evaluated during 2012 in other countries where the Company believes the potential for gold occurrences is excellent and which the Company believes to be politically stable and supportive of the mining industry. The Company currently manages 69 properties in Canada, four properties in the United States, three groups of properties in Finland, one property in Sweden, eight projects in Mexico and one project in Argentina. Exploration activities are managed from offices in Val d'Or, Quebec; Reno, Nevada; Chihuahua, Mexico; Kittila, Finland; and Vancouver, British Columbia.
In addition, the Company continuously evaluates opportunities to make strategic acquisitions. Five of the Company's new mines or projects came from relatively recent acquisitions.
In the second quarter of 2004, the Company acquired an approximate 14% ownership interest in Riddarhyttan Resources AB ("Riddarhyttan"), a Swedish precious and base metals exploration and development company that was at the time listed on the Stockholm Stock Exchange. In November 2005, the Company completed a tender offer (the "Riddarhyttan Offer") for all of the issued and outstanding shares of Riddarhyttan that it did not own. The Company issued 10,023,882 of its common shares and paid and committed an aggregate of $5.1 million cash as consideration to Riddarhyttan shareholders in connection with the Riddarhyttan Offer. On March 28, 2011, Riddarhyttan was merged with Agnico-Eagle AB and Agnico-Eagle Sweden AB, with Agnico-Eagle Sweden AB as the continuing entity. The Kittila mine, located approximately 900 kilometres north of Helsinki near the town of Kittila in Finnish Lapland, is currently 100% owned by Agnico-Eagle Finland Oy, which is owned by Agnico-Eagle Sweden AB.
In the first quarter of 2005, the Company entered into an exploration and option agreement with Industrias Penoles S.A. de C.V. ("Penoles") to acquire the Pinos Altos property in northern Mexico. The Pinos Altos property is comprised of approximately 11,000 hectares in the Sierra Madre gold belt, approximately 225 kilometres west of the city of Chihuahua in the state of Chihuahua in northern Mexico. In February 2006, the Company exercised its option and acquired the Pinos Altos property on March 15, 2006. Under the terms of the exploration and option agreement, the purchase price of $66.8 million was comprised of $32.5 million in cash and 2,063,635 common shares of the Company.
In February 2007, the Company made an exchange offer for all of the outstanding shares of Cumberland Resources Ltd. ("Cumberland") not already owned by the Company. At the time, Cumberland was a pre-production development stage company listed on the Toronto Stock Exchange (the "TSX") and American Stock Exchange whose primary asset was the Meadowbank property. In May 2007, the Company acquired approximately 92% of the issued and outstanding shares of Cumberland that it did not previously own and, in July 2007, the Company completed the acquisition of all Cumberland
2012 ANNUAL REPORT 19
shares by way of a compulsory acquisition. The Company issued 13,768,510 of its common shares and paid $9.6 million in cash as consideration to Cumberland shareholders in connection with its acquisition of Cumberland.
In April 2010, the Company entered into an agreement in principle with Comaplex Minerals Corp. ("Comaplex") to acquire all of the outstanding shares of Comaplex that it did not already own. At the time, Comaplex owned a 100% interest in the advanced stage Meliadine gold property, which is located approximately 300 kilometres southeast of the Company's Meadowbank mine. In May 2010, the Company executed the definitive agreements with Comaplex and, in July 2010 by plan of arrangement, the Company acquired 100% of the Meliadine gold property through the acquisition of Comaplex, which was renamed Meliadine Holdings Inc. ("Meliadine"). Pursuant to the arrangement, Comaplex transferred to Geomark Exploration Ltd. all assets and related liabilities other than those relating to the Meliadine project. In connection with the arrangement, the Company issued 10,210,848 of its common shares as consideration to Comaplex shareholders.
In September 2011, the Company entered into an acquisition agreement with Grayd Resource Corporation ("Grayd"), a Canadian-based natural resource company listed on the TSX Venture Exchange, pursuant to which the Company agreed to make an offer to acquire all of the issued and outstanding common shares of Grayd. At the time, Grayd held a 100% interest in the La India property located in the Mulatos Gold Belt of Sonora, Mexico and had recently discovered the Tarachi gold porphyry prospect located approximately ten kilometres north of the La India property. In October 2011, the Company made the offer by way of a take-over bid circular, as amended and supplemented, and, in November 2011, acquired approximately 95% of the outstanding common shares of Grayd. In January 2012, the Company completed a compulsory acquisition of the remaining outstanding common shares of Grayd and Grayd became a wholly-owned subsidiary of the Company. In aggregate, the Company issued 1,319,418 of its common shares and paid C$179.7 million in cash as consideration to Grayd shareholders in connection with the transaction.
In 2012, the Company's capital expenditures were $445.6 million. The 2012 capital expenditures included $75.2 million at the LaRonde mine, $18.5 million at the Lapa mine, $26.8 million at the Goldex mine project, $60.0 million at the Kittila mine, $30.0 million at the Pinos Altos mine (which included approximately $5.8 million related to the Creston Mascota deposit), $39.2 million at the La India mine project, $105.1 million at the Meadowbank mine, $83.3 million at the Meliadine project and $7.5 million at other minor projects. In addition, the Company spent $5.0 million on mine site exploration and $104.5 million on exploration activities at the Company's grassroots exploration properties, including corporate development expenses.
Budgeted 2013 capital expenditures of $596 million include $91 million at the LaRonde mine, $19 million at the Lapa mine, $63 million at the Goldex mine project (M and E Zones), $75 million at the Pinos Altos mine, $92 million at the La India mine project, $73 million at the Kittila mine, $79 million at the Meadowbank mine and $38 million in capitalized exploration expenditures. In addition, the Company plans exploration expenditures on grassroots exploration projects of approximately $71 million, including $17 million at the Meliadine project. Depending on the success of the exploration programs at these and other properties, the Company may be required to make additional capital expenditures for exploration, development and pre-production.
The funds for the expenditures set out above are expected to be from internally generated cash flow from operations, from the Company's existing cash balances and from drawdowns of the Company's bank credit facility. Please see "Item 10 Additional Information – Material Contracts – Credit Agreement". Based on current funding available to the Company and expected cash flows from operations, the Company believes it has sufficient funds available to fund its 2013 projected capital expenditures for all its properties.
Capital expenditures by the Company in 2011 and 2010 were $482.8 million and $512 million, respectively. The 2011 capital expenditures included $90.7 million at the LaRonde mine (which included approximately $49.5 million of expenditures relating to the LaRonde mine extension), $18.4 million at the Lapa mine, $42.2 million at Goldex, $86.5 million at the Kittila mine, $40.0 million at the Pinos Altos mine (which included approximately $7.6 million related to the Creston Mascota deposit), $116.9 million at the Meadowbank mine and $73.9 million at the Meliadine project. In addition, the Company spent $11.0 on mine site exploration and $64.7 million on exploration activities at the Company's grassroots exploration properties. The 2010 capital expenditures included $97 million at the LaRonde mine (which included approximately $62 million of expenditures relating to the LaRonde mine extension), $33 million at the Lapa mine, $24 million at Goldex, $72 million at the Kittila mine, $104 million at the Pinos Altos mine (which included approximately $43 million related to the Creston Mascota deposit), $174 million at the Meadowbank mine and $8 million at the Meliadine project and other minor properties. In addition, the Company spent $35 million on exploration activities at the Company's grassroots exploration properties.
The Company was formed by articles of amalgamation under the laws of the Province of Ontario on June 1, 1972, as a result of the amalgamation of Agnico Mines Limited ("Agnico Mines") and Eagle Gold Mines Limited ("Eagle"). Agnico
20 AGNICO-EAGLE MINES LIMITED
Mines was incorporated under the laws of the Province of Ontario on January 21, 1953 under the name "Cobalt Consolidated Mining Corporation Limited". Eagle was incorporated under the laws of the Province of Ontario on August 14, 1945.
On December 19, 1989, Agnico-Eagle acquired the remaining 57% interest in Dumagami Mines Limited not already owned by it, as a consequence of the amalgamation of Dumagami Mines Limited with a wholly-owned subsidiary of Agnico-Eagle, to continue as one company under the name Dumagami Mines Inc. ("Dumagami"). On December 29, 1992, Dumagami transferred all of its property and assets, including the LaRonde mine, to Agnico-Eagle and was subsequently dissolved.
On December 8, 1993, the Company acquired the remaining 46.3% interest in Goldex Mines Limited not already owned by it, as a consequence of the amalgamation of Goldex Mines Limited with a wholly-owned subsidiary of the Company, to continue as one company under the name Goldex Mines Limited. On January 1, 1996, the Company amalgamated with two wholly-owned subsidiaries, including Goldex Mines Limited.
In October 2001, under a plan of arrangement, the Company amalgamated with an associated corporation, Mentor Exploration and Development Co., Limited ("Mentor"). In connection with the arrangement, the Company issued 369,348 of its common shares in consideration for the acquisition of all of the issued and outstanding shares of Mentor that it did not already own.
On August 1, 2007, the Company, Agnico-Eagle Acquisition Corporation, Cumberland and a wholly-owned subsidiary of Cumberland, Meadowbank Mining Corporation, amalgamated under the laws of the Province of Ontario and continued under the name of Agnico-Eagle Mines Limited.
On January 1, 2011, the Company and 1816276 Ontario Inc. (the successor corporation to Meliadine, which in turn was the successor corporation to Comaplex) amalgamated under the laws of the Province of Ontario and continued under the name of Agnico-Eagle Mines Limited.
On January 1, 2013, the Company and its wholly-owned subsidiary, 1886120 Ontario Inc. (the successor corporation to 9237-4925 Québec Inc.), amalgamated under the laws of the Province of Ontario and continued under the name of Agnico-Eagle Mines Limited.
The Company's executive and registered office is located at Suite 400, 145 King Street East, Toronto, Ontario, Canada M5C 2Y7; telephone number (416) 947-1212; website: http://www.agnico-eagle.com. The information contained on the website is not part of this Form 20-F. The Company's principal place of business in the United States is located at 1675 E. Prater Way, Suite 102, Sparks, Nevada 89434.
Business Overview
The Company believes that it has a number of key operating strengths that provide distinct competitive advantages.
Growth Profile. The Company has a proven track record of increasing production capacity through a combination of acquisitions, operational improvements, expansions and development. The suspension of mining operations at the Goldex mine in October 2011 had a negative impact on the growth profile, however, the Company anticipates production of between 970,000 and 1,010,000 ounces of gold in 2013 and growth in 2014 with the expected commencement of production at the La India and Goldex mine projects. Over the last five years, the Company has spent over $2.7 billion on the development of five new mines and the significant extension of the LaRonde mine at depth. Future capital expenditures are expected to be primarily for incremental expansion projects and exploration and development of the La India and Goldex mine projects and the Meliadine project.
Operations in Politically Stable, Mining Friendly Regions. The Company and its predecessors have over three decades of continuous gold production experience and expertise in metals mining. The Company's operations and exploration and development projects are located in regions that the Company believes are supportive of the mining industry. The Company's LaRonde and Lapa mines and Goldex mine project are located in the Abitibi region of northwestern Quebec, one of North America's principal gold-producing regions. The Company's Kittila mine in northern Finland, Pinos Altos mine and La India mine project in northern Mexico and Meadowbank mine and Meliadine project in Nunavut are also located in regions which the Company believes are supportive of the mining industry.
Strong Operating Base. Through its acquisition, exploration and development program, the Company has been transformed from a regionally focused, single mine producer to a multi-mine international gold producer with five operating, 100% owned mines. The Company's operations at its existing mines provide a strong base for additional
2012 ANNUAL REPORT 21
mineral reserve and production development at these properties and for the development of its mines and growth projects in Nunavut, Finland, Mexico and the Abitibi region. The experience gained through building and operating the LaRonde mine has assisted with the Company's development of its other mine projects. In addition, the extensive infrastructure associated with the LaRonde mine supports the nearby Lapa mine and Goldex mine project. Experience gained at the Meadowbank mine in Nunavut is assisting with the Company's permitting and exploration work at the nearby Meliadine project. Similarly, experience building and operating the Pinos Altos mine in Chihuahua, Mexico has assisted the Company's efforts to develop the La India mine project 70 kilometres away in Sonora, Mexico.
Highly Experienced Management Team. The members of the Company's senior management team have an average of over 22 years of experience in the mining industry. Management's significant experience has underpinned the Company's historical growth and provides a solid base upon which to expand the Company's operations.
Based on these strengths, the Company's corporate strategy is to grow production and reserves in mining-friendly regions.
Optimize and Further Expand Operations. The Company continues to focus its resources and efforts on the exploration and development of its properties in Quebec, Nunavut, Finland and Mexico with a view to increasing annual gold production and gold mineral reserves.
Leverage Mining Experience. The Company believes it can benefit not only from the existing infrastructure at its mines but also from the geological knowledge that it has gained in mining and developing its properties. The Company's strategy is to capitalize on its mining expertise to exploit fully the potential of its properties.
Expand Gold Reserves. The Company is conducting drilling programs at all of its properties with a goal of further increasing its gold reserves. In 2012, on a contained gold ounces basis, the gold reserves of the Company were 18.68 million ounces (184 million tonnes grading 3.16 grams of gold per tonne), essentially unchanged from the 18.75 million ounces reported as at December 31, 2011.
Growth Through Primary Exploration and Acquisitions. The Company's growth strategy has been to pursue the expansion of its development base through the acquisition of additional properties in the Americas and Europe. Historically, the Company's producing properties have resulted from a combination of investments in advanced exploration companies and primary exploration activities. By investing in pre-development stage companies, the Company believes that it has been able to acquire control of projects at favourable prices and reasonable valuations.
Mining Legislation and Regulation
Canada
The mining industry in Canada operates under both federal and provincial or territorial legislation governing prospecting and the exploration, development, operation and decommissioning of mines and mineral processing facilities. Such legislation relates to the method of acquisition and ownership of mining rights, labour, occupational or worker health and safety standards, royalties, mining, exports, reclamation, closure and rehabilitation of mines and other matters. Laws and regulations regarding the decommissioning, reclamation and rehabilitation of mines may require approval by provincial or territorial authorities of reclamation plans, provision of financial guarantees and long-term management of closed mines and related waste and tailings. Obligations under mining legislation may arise with respect to proposed, operating and closed facilities (including those that the Company owns but never operated).
The mining industry in Canada is also subject to extensive laws and regulations at both the federal and provincial or territorial levels concerning the protection of the environment. The primary federal regulatory authorities with jurisdiction over the Company's mining operations in respect of environmental matters are the Department of Fisheries and Oceans (Canada) and Environment Canada. The construction, development and operation of a mine, mill or refinery requires compliance with applicable environmental laws and regulations and/or review processes, including obtaining land use permits, water permits, air emissions certifications, industrial depollution attestations, hazardous substances management and similar authorizations from various governmental agencies. Environmental laws and regulations impose high standards on the mining industry to reduce or eliminate the effects of waste generated by mining and processing operations and subsequently deposited on the ground or affecting the air or water.
Quebec
In Quebec, mining rights are governed by the Mining Act (Quebec) and, subject to limited exceptions, are owned by the province. A mining claim entitles its holder to explore for minerals on the subject land. It remains in force for a term of two
22 AGNICO-EAGLE MINES LIMITED
years from the date it is registered and may be renewed indefinitely subject to continued exploration works in relation thereto. In order to retain title to mining claims, in addition to paying a small bi-annual rental fee currently ranging from C$27.75 to C$126 per claim, depending on its location and area (as set by Quebec government regulations), exploration work (or an equivalent value cash payment) has to be completed in advance (either on the claim or on adjacent mining claims, concessions or leases) and filed with the Ministry of Natural Resources (Quebec) prior to the date of expiry of the claim. The amount of exploration work required bi-annually currently ranges from C$48 to C$3,600 per claim, depending on its location, area and period of validity (as set by Quebec government regulations). In 1966, the mining concession system set out for lands containing mineralized zones in the Mining Act (Quebec) was replaced by a system of mining leases, but the mining concessions sold prior to such replacement remain in force. A mining lease entitles its holder to mine and remove valuable mineral substances from the subject land, provided it pays the annual rent set by Quebec government regulations, which currently ranges from C$21.50 per hectare (on privately held land) to C$45 per hectare (on land owned by the province). Leases are granted initially for a term of 20 years and are renewable up to three times, each for a duration of ten years. After the third renewal, the Minister of Natural Resources (Quebec) may grant an extension thereof on the conditions, for the rental and for the term he or she determines.
In Quebec, the primary provincial regulatory authorities with jurisdiction over the Company's mining operations in respect of environmental matters are the Ministry of Sustainable Development, Environment, Wildlife and Parks (Quebec) and the Ministry of Natural Resources (Quebec).
Nunavut
Under the Nunavut Land Claims Agreement (the "Land Claims Agreement"), ownership of large tracts of land in Nunavut was granted to the Inuit. These Inuit-owned lands include areas with high mineral potential. Further, as a result of other rights granted to the Inuit under the Land Claims Agreement, Inuit organizations play an important role in the management of natural resources and the environment in Nunavut. These duties are shared among the federal and territorial governments and Inuit organizations. Under the Land Claims Agreement, the Inuit own surface rights to certain lands representing approximately 16% of Nunavut. For a portion of the Inuit-owned lands representing approximately 2% of Nunavut, the Inuit also own mineral (subsurface) rights in addition to the surface rights.
In Nunavut, the Crown's mineral rights are administered by the Aboriginal Affairs and Northern Development Canada in accordance with the Northwest Territories and Nunavut Mining Regulations (the "Territorial Mining Regulations") under the Territorial Lands Act (Canada). The Inuit mineral rights in subsurface Inuit-owned lands are owned and administered by Nunavut Tunngavik Incorporated ("Nunavut Tunngavik"), a corporation representing the Inuit people of Nunavut.
Future production from Nunavut Tunngavik-administered mineral claims is subject to production leases which include a 12% net profits interest royalty from which annual deductions are limited to 85% of gross revenue. Production from Crown mining leases is subject to a royalty of up to 14% of adjusted net profits, as defined in the Territorial Mining Regulations. Before the operation of a Major Development Project, as defined in the Land Claims Agreement, can begin, developers must also negotiate an Inuit Impact and Benefit Agreement ("IIBA") with the regional Inuit Association.
The Kivalliq Inuit Association ("KIA")is the Inuit organization that holds surface title to the Inuit-owned lands in the Kivalliq region and is responsible for administering surface rights on these lands on behalf of the Inuit of the region. In order to conduct exploration work on Inuit-owned lands, the Company is required to submit a project proposal or work plan. This proposal is subject to approval by the KIA for surface land tenure and to review by other boards established by the Land Claims Agreement to determine environmental effects and, if needed, to grant water rights. Federal and territorial government departments participate in the reviews conducted by these boards. For mine development, the Company requires a surface lease and water compensation agreement with the KIA and a licence under federal legislation for the use of water, including the deposit of waste.
During mine construction and operations, the Company is subject to additional Nunavut and federal government regulations related to environmental, safety, fire and other operational matters.
Finland
Mining legislation in Finland consists of the Mining Act, the Mining Decree, the Mining Safety Decree and the Mining Hoisting Equipment Decree. The new Mining Act was implemented on July 1, 2011 and replaced the previous Mining Act (503/1965) as a result of still on-going overall reform of mining legislation in Finland. Set out below is a general, brief overview of certain relevant aspects of Finnish mining legislation.
2012 ANNUAL REPORT 23
In Finland, subject to certain area restrictions, anyone has a right irrespective of land ownership to conduct survey work and make geological measurements and observations, with the right to take small samples from the soil provided that these measures do not cause other than only minor damage or inconvenience. However, before sampling, a notice must be given to the owner of the respective land.
A prospecting permit is required for more comprehensive survey work. The prospecting permit entitles its holder to conduct necessary research and exploration in a defined area in order to discover the quality and extent of a deposit and to build or move temporary facilities and machinery onto the prospecting area for such purposes. The prospecting permit does not grant a right to exploit a deposit, for which purpose a mining permit is required, but it does grant its holder a priority to receive the mining permit on the prospecting area.
A mining permit entitles its holder to exploit all minerals found on the mining area defined in the permit as well as all organic and non-organic surface material and the soil and bedrock, as considered necessary for the purposes of the mining work. In addition to the mining permit, a mining safety permit regarding safety measures of the contemplated mining operations is required in order to build and operate a mine.
Generally, the mining area must either be owned or leased by the permit holder. However, provided that the mining project is required by the public interest, the Council of State of Finland may in certain cases grant a mining area redemption permit, which entitles the holder to establish a mining area without the consent of the landowner if the mining operator and the landowner cannot come to a voluntary agreement regarding use of the land.
The Finnish Safety and Chemicals Agency is responsible for granting prospecting permits, mining permits and mining safety permits upon an application, provided that statutory requirements are fulfilled. Prospecting permits and mining permits are transferrable and eligible to be pledged as security under Finnish law.
Prospecting permits are issued for fixed periods of time (a maximum period of four years at a time, which can be extended for three-year periods, up to a maximum of 15 years). Mining permits are generally granted without an expiry date. However, the Safety and Chemicals Agency investigates grounds for the continued existence of the permit at least once every ten years. In some cases, depending on the prevailing circumstances and the deposit, mining permits may only be granted for a fixed period of time (to a maximum period of ten years at a time). Prospecting permits and mining permits may be cancelled if the holder of the permit does not perform mining operations in accordance with the terms of the permit or the permit holder violates rules of the Mining Act.
Without specific permission of the National Board of Patents and Registrations of Finland, a right to apply for and acquire a prospecting permit and/or mining permit is limited to Finnish corporations and individuals and foreign individuals and corporations domiciled in a state belonging to the European Economic Area.
In addition to compliance with mining legislation, all mining operations must be carried out in accordance with the permit terms and with laws and regulations concerning conservation and environmental protection issues. Under the Finnish Environmental Protection Act, mining activities require an environmental permit which may be issued either for a definite or indefinite period of time. The Environmental Protection Act is based on the principles of prevention and minimization of damages and hazards, the application of the best available technology, the application of the best environmental practice and the "polluter pays" principle.
The Act on Compensation for Environmental Damage includes provisions on the compensation for damage to a person or a property resulting from pollution of water, air, soil, noise, vibration, radiation, light, heat, smell or other similar nuisances, caused by an activity carried out at a fixed location. This act is based on the principle of strict liability.
In addition to the permits listed above, mining operators may require several other permits and may be subject to other obligations under Finnish legislation.
According to the Act on Environmental Impact Assessment Procedure, certain projects require compliance with an environmental impact assessment procedure. These include major projects with a considerable impact on the environment, such as the excavation, enrichment and handling of metals and other minerals in cases where the excavated material is estimated to exceed 550,000 tonnes annually or the operating area exceeds 25 hectares. An environmental permit authority may not give its approval to an activity covered by the scope of the Act on the Environmental Impact Assessment Procedure without having taken an environmental impact assessment report into consideration.
Mexico
Mining in Mexico is subject to the Mining Law, a federal law. Under the Mexican Constitution, all minerals belong to the Mexican Nation. Private parties may explore and extract minerals pursuant to mining concessions granted by the
24 AGNICO-EAGLE MINES LIMITED
executive branch of the Mexican government, which as a general rule, are granted to whoever first claims them. While the Mining Law touches briefly upon labour, occupational and worker health and safety standards, these are primarily dealt with by the Federal Labour Law. The Mining Law also briefly addresses environmental matters, which are primarily regulated by the General Law of Ecological Balance and Protection of the Environment, also of federal jurisdiction.
The primary agencies with jurisdiction over mining activities are the Ministry of the Economy, the Ministry of Labor and Social Welfare and the Ministry of the Environment and Natural Resources. The National Water Commission has jurisdiction regarding the granting of water rights and the Ministry of Defense with respect to the use of explosives.
Concessions are granted for 50 years, renewable once. The main obligations to keep concessions current are the semi-annual payment of mining duties (taxes), based on the surface area of the concession, and the performance of work in the areas covered by the concessions, which is evidenced by minimum expenditures or by the extraction of ore.
Organizational Structure
The Company's significant subsidiaries (all of which are directly or indirectly wholly-owned by the Company, unless otherwise indicated) are 1715495 Ontario Inc., Agnico-Eagle Mines Sweden Cooperatie U.A., which owns all of the shares of Agnico-Eagle Sweden AB, a Swedish company through which the Company holds its interest in Oijarvi Resources Oy, and Agnico-Eagle Finland Oy, a Finnish company through which the Kittila mine is held. The Company's interest in the Pinos Altos mine in northern Mexico is held through its direct and indirect wholly-owned Mexican subsidiary, Agnico Eagle Mexico, S.A. de C.V., which is, in turn, owned, in part, by 1641315 Ontario Inc. and Tenedora Agnico Eagle Mexico, S.A. de C.V., which is, in turn, owned in part by Agnico-Eagle Mines Mexico Cooperatie U.A. The Company's interest in the La India mine project in Mexico is held through its indirect wholly-owned Mexican subsidiary, Agnico Sonora, S.A. de C.V., which is owned by Grayd, Agnico Eagle Mexico, S.A. de C.V. and Tenedora Agnico Eagle Mexico, S.A. de C.V. The LaRonde mine, the Lapa mine, the Goldex mine project, the Meadowbank mine and the Meliadine project are owned directly by the Company.
Certain of the Company's subsidiaries, Servicios Agnico Eagle Mexico, S.A. de C.V., Servicios Pinos Altos, S.A. de C.V. and Minera Agave, S.A. de C.V., provide services in connection with the Company's operations in Mexico. The Company's operations in the United States are conducted through Agnico-Eagle (USA) Limited.
2012 ANNUAL REPORT 25
The following chart sets out the corporate structure of the Company, each of its significant subsidiaries and certain other subsidiaries, together with the jurisdiction of organization of the Company and each such subsidiary as at March 11, 2013:
Agnico-Eagle Organizational Chart

26 AGNICO-EAGLE MINES LIMITED
Location Map of the Abitibi Region (as at December 31, 2012)
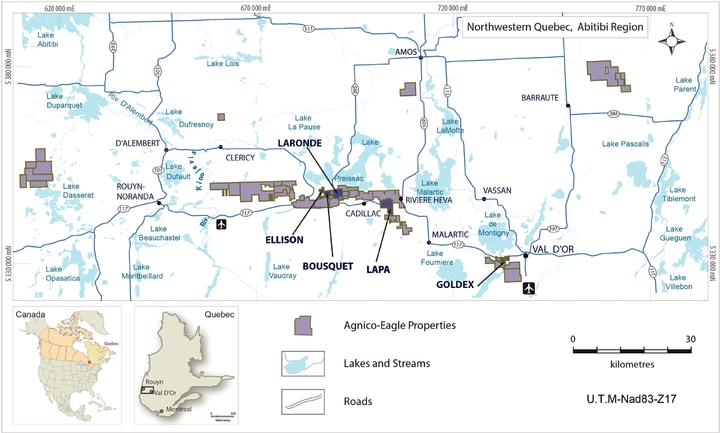
LaRonde Mine
The LaRonde mine is situated approximately halfway between the City of Rouyn-Noranda and the City of Val d'Or in northwestern Quebec (approximately 470 kilometres northwest of Montreal, Quebec) in the municipalities of Preissac and Cadillac. At December 31, 2012, the LaRonde mine was estimated to have proven and probable mineral reserves containing approximately 4.2 million ounces of gold comprised of 28.8 million tonnes of ore grading 4.54 grams per tonne. The Company's LaRonde mine consists of the LaRonde property and the adjacent El Coco and Terrex properties, each of which is 100% owned and operated by the Company. The LaRonde mine can be accessed either from Val d'Or in the east or from Rouyn-Noranda in the west, each of which are located approximately 60 kilometres from the LaRonde mine via Quebec provincial highway No. 117. The LaRonde mine is situated approximately two kilometres north of highway No. 117 on Quebec regional highway No. 395. The Company has access to the Canadian National Railway at Cadillac, Quebec, approximately six kilometres from the LaRonde mine.
The LaRonde mine operates under mining leases obtained from the Ministry of Natural Resources (Quebec) and under certificates of approval granted by the Ministry of Sustainable Development, Environment, Wildlife and Parks (Quebec). The LaRonde property consists of 36 contiguous mining claims and one provincial mining lease and covers in total 1,047.4 hectares. The El Coco property consists of 22 contiguous mining claims and one provincial mining lease and covers in total 356.7 hectares. The Terrex property consists of 21 mining claims that cover in total 424.4 hectares. The mining leases on the LaRonde and El Coco properties expire in 2018 and 2021, respectively, and are automatically renewable for three further ten-year terms upon payment of a small fee. The Company also has three surface rights leases that cover in total approximately 301.5 hectares that relate to the water pipeline right of way from Lake Preissac and the eastern extension of the LaRonde tailings pond #7 on the El Coco property. The surface rights leases are renewable annually.
2012 ANNUAL REPORT 27
Location Map of the LaRonde Mine (as at December 31, 2012)
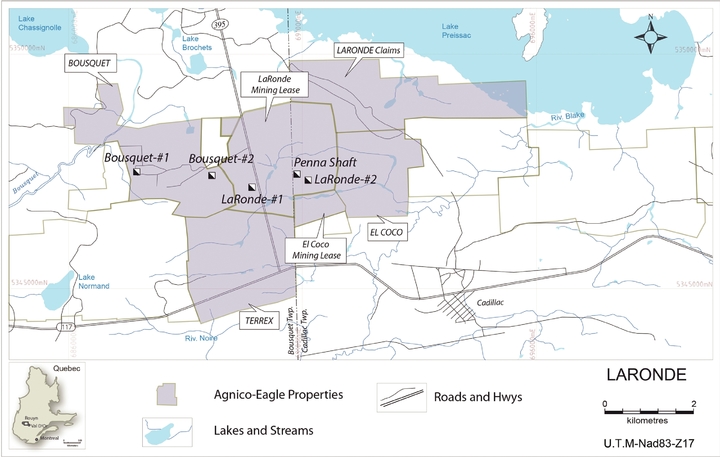
The LaRonde mine includes underground operations at the LaRonde and El Coco properties that can both be accessed from the Penna Shaft, a mill, a treatment plant, a secondary crusher building and related facilities. The El Coco property is subject to a 50% net profits interest in favour of Barrick Gold Corporation ("Barrick") on future production from approximately 500 metres east of the LaRonde property boundary. The remaining 1,500 metres is subject to a 4% net smelter return royalty. This area of the property is now substantially mined out and the Company has not paid royalties since 2004 and does not expect to pay royalties in 2013. In 2003, exploration work started to extend outside of the LaRonde property onto the Terrex property where a down-plunge extension of Zone 20 North was discovered. The Terrex property is subject to a 5% net profits royalty to Delfer Gold Mines Inc. and a 2% net smelter return royalty to Barrick. The Company does not expect to pay royalties in respect of this part of the property in 2013. In addition, the Company owns 100% of the Sphinx property immediately to the east of the El Coco property. In 2012, 18% of the ore processed from the LaRonde mine was extracted from the deeper portion of the LaRonde mine (that is, below Level 245), that was previously referred to as the "LaRonde extension". In 2013, the Company anticipates that approximately 49% of the ore processed will be from this deeper part of the mine.
In 2013, payable gold production at the LaRonde mine is expected to increase to approximately 177,000 ounces, and total cash costs per ounce are expected to be approximately $650. The Company expects future byproduct metal recoveries at the LaRonde mine to decline as production continues to shift towards deeper sections of the mine where gold grades are higher and byproduct metals are less prevalent. The decreased byproduct revenues will result in higher total cash costs per ounce attributable to ore extracted from these parts of the mine.
The Abitibi region has a continental climate with average annual rainfall of 64 centimetres and average annual snowfall of 318 centimetres. The average monthly temperatures range from a minimum of -23 degrees Celsius in January to a maximum of 23 degrees Celsius in July. Under normal circumstances, mining operations are conducted year-round without interruption due to weather conditions. The Company believes that the Abitibi region of northwestern Quebec has sufficient experienced mining personnel to staff its operations in the Abitibi region. The elevation is 337 metres above sea level. The LaRonde property is relatively flat with a maximum relief of approximately 40 metres. The topography gently slopes down from north to south and is characterized by boreal-type forest at LaRonde and the nearby properties. All of the LaRonde mine's power requirements are supplied by Hydro-Quebec through connections to its main power transmission grid. Water used in the LaRonde mine's operations is sourced from Lake Preissac and is transported approximately four kilometres to the minesite through a surface pipeline.
28 AGNICO-EAGLE MINES LIMITED
Mining and Milling Facilities
Surface Plan of the LaRonde Mine (as at December 31, 2012)
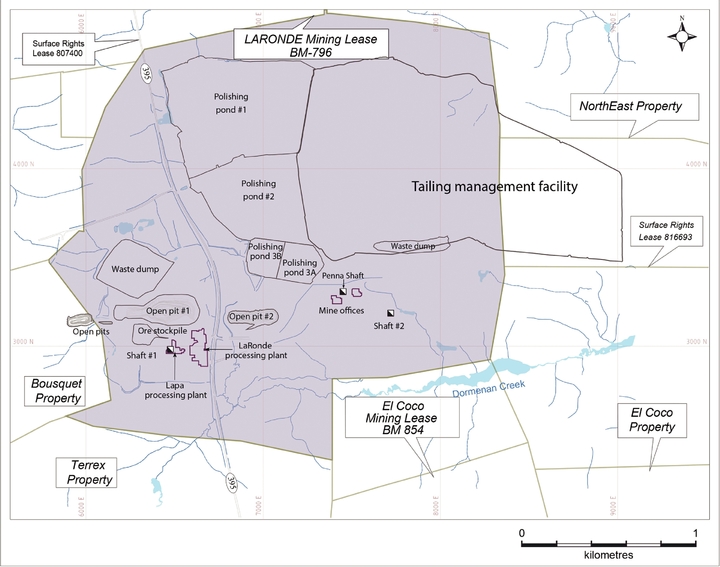
The LaRonde mine was originally developed utilizing a 1,207-metre shaft (Shaft #1) and an underground ramp access system. The ramp access system is available down to Level 25 of Shaft #1 and continues down to Level 248 at the Penna Shaft. The mineral reserve accessible from Shaft #1 was depleted in September 2000 and Shaft #1 is no longer in use. A second production shaft (Shaft #2), located approximately 1.2 kilometres to the east of Shaft #1, was completed in 1994 to a depth of 525 metres and was used to mine Zones 6 and 7. Both ore zones were depleted in March 2000 and the workings were allowed to flood up to Level 6 (approximately 280 metres). A third shaft (the Penna Shaft), located approximately 800 metres to the east of Shaft #1, was completed down to a depth of 2,250 metres in March 2000. The Penna Shaft is used to mine Zones 20 North, 20 South, 6 and 7. In 2009, as part of the LaRonde mine extension, the Company completed construction of an 823-metre internal shaft from Level 203 to access the ore below Level 245, approximately 2,858 metres below surface.
Production from the deeper levels of the LaRonde mine has only recently started to ramp-up to anticipated steady state levels and there is currently only limited development of stopes in this portion of the mine. As a result, logistical problems, such as congestion in the underground workings, occur from time to time. The Company anticipates that these issues, and any other issues that may prevent or delay extraction and transportation of ore from a particular stope, will be less prevalent when the stope development work at depth is more advanced.
Mining Methods
Four mining methods have historically been used at the LaRonde mine: open pit for the three surface deposits; sublevel retreat; longitudinal retreat with cemented rock backfill or paste backfill; and transverse open stoping with paste, cemented rock backfill or unconsolidated backfill. The primary source of ore at the LaRonde mine continues to be from
2012 ANNUAL REPORT 29
underground mining methods. During 2012, two of the traditional mining methods were used: longitudinal retreat with cemented rock backfill or paste backfill and transverse open stoping with cemented rock backfill, paste or unconsolidated backfill. In addition, to address concerns regarding the frequency and intensity of seismic events encountered at the lower levels of the LaRonde mine, a hybrid of these two methods was developed and used. In the underground mine, sublevels are driven at between 30-metre and 40-metre vertical intervals, depending on the depth. Stopes are undercut in 15-metre wide panels. In the longitudinal method, panels are mined in 15-metre sections and backfilled with 100% cemented rock backfill or paste backfill. The paste backfill plant was completed in 2000 and is located on the surface at the processing facility. In the transverse open stoping method, approximately 50% of the ore is mined in the first pass and filled with cemented rock backfill or paste backfill. On the second pass, the remainder of the ore is mined and filled with unconsolidated waste rock backfill or cemented paste backfill.
The throughput at LaRonde in 2012 averaged 6,444 tonnes per day compared with 6,593 tonnes per day in 2011. The reduced throughput in 2012 was largely due to the transition to the lower mine, where factors such as heat, congestion and lack of operational flexibility underground negatively impacted the mine's ability to provide the planned tonnage to the mill.
Surface Facilities
Surface facilities at the LaRonde mine include a processing plant with a daily capacity of 7,200 tonnes of ore, which has been expanded four times since 1987 from the original rate of 1,630 tonnes per day. Beginning in 1999, transition to the LaRonde mine's poly metallic massive sulphide orebody required several modifications to the processing plant, including a new coarse-ore handling system, new SAG and ball mills, the addition of a zinc flotation circuit and capacity increases to the existing copper flotation and precious metals circuits. In 2008, the installation of a limited copper/lead separation flotation circuit, following the copper flotation circuit, was completed. Also in 2008, a cyanidation plant began operation for the treatment of sulphide concentrate from the Goldex mine. A new carbon-in-leach ("CIL") circuit is under construction and is expected to replace the existing LaRonde precious metal Merrill-Crowe circuit at the end of March 2013. The LaRonde mine is also the site for the Lapa mine ore processing plant (1,500 tonnes per day) that was commissioned in the second quarter of 2009.
The ore requires a series of grinding, copper/lead flotation and separation, zinc flotation and zinc tails precious metals leaching circuits, followed by a counter-current decantation circuit and Merrill-Crowe precipitation (which will be replaced by CIL recovery in 2013). Paste backfill and cyanide destruction plants operate intermittently. The tailings area has a dedicated cyanide destruction and metals precipitation plant that water passes through prior to recirculating to the mill. A biological water treatment plant was commissioned in 2005 to address the build-up of thiocyanate in the tailings ponds at the LaRonde mine. This build-up was the result of the high sulphide content of the LaRonde mine ore and 90% recirculation of the process water. The plant uses bacteria to oxidize and destroy thiocyanate and removes phosphate from the water before it is released to the environment.
The Goldex concentrate circuit consists of pulp received from the Goldex mill via truck and subsequent leaching of the pulp with cyanide. The leached material was sent to the Lapa CIL circuit for gold recovery along with Lapa residual pulp until the Goldex circuit ceased to operate in November 2011 following the suspension of mining operations at Goldex on October 19, 2011. The Goldex circuit is currently on standby until mining begins at the M and E Zones of the Goldex mine, which is expected to occur in the second quarter of 2014. At that time, the Goldex circuit tails will be pumped directly into the new LaRonde CIL circuit, which has been designed to handle leached material from both LaRonde and Goldex. The Lapa CIL circuit is expected to be operating near full capacity by then with material from Lapa alone.
The Lapa process consists of a two-stage grinding circuit to reduce the granularity of the ore. A gravity recovery circuit that is incorporated into the grinding circuit recovers up to 45% of the available gold, depending on feed grades. The residual pulp is leached in a conventional CIL circuit to dissolve the balance of the precious metal. A carbon strip circuit recovers the gold from the carbon which is recycled to the leach circuit.
Annual production at the LaRonde mill in 2013 is expected to consist of approximately 2,097,023 ounces of silver, 5,223.4 tonnes of copper, up to 1,176.9 tonnes of lead and 27,298.6 tonnes of zinc. Gold recovery at the LaRonde mine is distributed approximately as follows: 57.7% in the copper concentrate, 6.56% in the lead concentrate, 4.25% in the zinc concentrate and 23.49% via leaching.
Mineral Recoveries
During 2012, gold and silver recovery averaged 89.8% and 85.49%, respectively. Zinc recovery averaged 87.13% with a concentrate quality of 56.13% zinc. Copper recovery averaged 78.56% with a concentrate quality of 11.88% copper.
30 AGNICO-EAGLE MINES LIMITED
Approximately 2.36 million tonnes of ore were processed averaging 6,780 tonnes of ore per day at 95.39% of available time.
The following table sets out the metal recoveries, concentrate grades and contained metals for the 2,358,499 tonnes of ore extracted by the Company at the LaRonde mine in 2012.
| Copper Concentrate (37,918 tonnes produced) |
Zinc Concentrate (80,987 tonnes produced) |
Lead Concentrate (2,096 tonnes produced) |
|||||||||||||||||
| Head Grades |
Grade | Recovery | Grade | Recovery | Grade | Recovery | Overall Metal Recoveries |
Payable Production |
|||||||||||
| Gold | 2.362 g/t | 79.55 g/t | 54.25% | 3.25 g/t | 4.81% | 200.4 g/t | 8.01% | 89.8% | 160,854 oz | ||||||||||
| Silver | 40.156 g/t | 1,073 g/t | 43.26% | 177 g/t | 14.78% | 3,529.9 g/t | 7.22% | 85.49% | 2,243,674 oz | ||||||||||
| Copper | 0.242% | 11.88% | 78.56% | 0.42% | 5.96% | 4.56% | 1.87% | 81.03% | 4,126 t | ||||||||||
| Lead | 0.252% | 7.14% | 45.68% | 0.53% | 7.22% | 53.47% | 18% | 64.38% | 1,058 t | ||||||||||
| Zinc | 2.203% | 4.15% | 2.98% | 56.13% | 87.13% | 2.89% | 0.2% | 90.61% | 38,637 t | ||||||||||
Environmental Matters
Currently, water is treated at various facilities at the LaRonde mine operations. Water contained in the tailings to be used as underground backfill is treated to degrade cyanide using a sulphur dioxide and air process. The tailings entering the tailings pond are first decanted and the clear water subjected to natural cyanide degradation. This water is then transferred to sedimentation pond #1 to undergo a secondary treatment at a plant located between sedimentation ponds #1 and #2 that uses a peroxy-silicate process to destroy cyanide, lime and coagulant to precipitate metals. The tailings pond occupies an area of about 175 hectares. Waste rock that is not used underground for backfill is brought up to the surface and stored in close proximity to the tailings pond to be used to build coffer dams inside the pond. A waste rock pile containing approximately 500,000 tonnes of waste and occupying about nine hectares is located west of the mill.
Due to the high sulphur content of the LaRonde mine ore, the Company has had to address toxicity issues in the tailings ponds since the 1990s. Since introducing and optimizing a biological treatment plant in 2004, the treatment process is now stable and the effluent has remained non-toxic since 2006. In 2006, the Company commenced an ammonia stripping operation involving an effluent partially treated by the biological treatment plant which allowed an increase in treatment flow rate, while keeping the final effluent toxicity-free. Since 2010, the Company has operated ammonia stripping towers to further increase the treatment flow rate of the biological plant. In addition, water from mine dewatering and drainage water are treated to remove metals prior to discharge at a high-density sludge lime treatment plant located at the LaRonde mill.
Capital Expenditures
In 2006, the Company initiated construction to extend the infrastructure at the LaRonde mine to access the ore below Level 245. Hoisting from this deeper part of the LaRonde mine began in the fourth quarter of 2011 and commercial production was achieved in November 2011. Access to the deeper part of the LaRonde mine is provided through a 823-metre internal shaft (completed in November 2009) starting from Level 203, for a total depth of 2,858 metres from surface. A ramp is used to access the lower part of the orebody down to 3,110 metres in depth. The internal winze system is used to hoist ore from depth to facilities on Level 215, approximately 2,150 metres below surface, where it is transferred to the Penna Shaft hoist.
Capital expenditures at the LaRonde mine during 2012 were approximately $75.2 million, which included $22.2 million on sustaining capital expenditures and $41.9 million in deferred expense. Budgeted 2013 capital expenditures at the LaRonde mine are $91.3 million. Another $3 million will be added to the carbon-in-pulp ("CIP") project. Total capital expenditures for the LaRonde mine are estimated at $572.1 million from 2013 to 2026 (including the CIP project).
2012 ANNUAL REPORT 31
Development
In 2012, a total of 13,113 metres of lateral development was completed. Development was focused on stope preparation of mining blocks for production in 2012 and 2013, especially the preparation of the lower mine production horizon. A total of 5,213 metres of development work was completed for the LaRonde mine extension infrastructure and the ramp to access the LaRonde mine extension.
A total of 13,500 metres of lateral development is planned for 2013. The main focus of development work continues to be stope preparation and the LaRonde mine extension access toward the orebody.
Geology, Mineralization and Exploration
Geology
The LaRonde property is located near the southern boundary of the Archean-age (2.7 billion years old) Abitibi Subprovince and the Pontiac Subprovince within the Superior Geological Province of the Canadian Shield. The most important regional structure is the Cadillac-Larder Lake ("CLL") fault zone marking the contact between the Abitibi and Pontiac Subprovinces, located approximately two kilometres to the south of the LaRonde property.
The geology that underlies the LaRonde mine consists of three east-west-trending, steeply south-dipping and generally south-facing regional groups of rock formations. From north to south, they are: (i) 400 metres (approximate true thickness) of the Kewagama Group, which is made up of a thick band of interbedded wacke; (ii) 1,500 metres of the Blake River Group, a volcanic assemblage that hosts all the known economic mineralization on the property; and (iii) 500 metres of the Cadillac Group, made up of a thick band of wacke interbedded with pelitic schist and minor iron formation.
Zones of strong sericite and chlorite alteration that enclose massive to disseminated sulphide mineralization (including the ore that is mined for gold, silver, zinc, copper and lead at the LaRonde mine) follow steeply dipping, east-west-trending, anastomosing shear zone structures within the Blake River Group volcanic units across the property. These shear zones are part of the larger Doyon-Dumagami Structural Zone that hosts several important gold occurrences (including the Doyon gold mine, the Westwood project and the former Bousquet mines) and has been traced for over ten kilometres within the Blake River Group, from the LaRonde mine westward to the Mouska gold mine.
Mineralization
The gold-bearing zones at the LaRonde mine are lenses of disseminated stringers through to massive, aggregates of coarse pyrite with zinc, copper and silver content. Ten zones that vary in size from 50,000 to 40,000,000 tonnes have been identified, of which four are (or are believed to be) economic. Gold content is not proportional to the total sulphide content but does increase with copper content. Gold values are also higher in areas where the pyrite lenses are crosscut by tightly spaced north-south fractures.
These historical relationships, which were noted at LaRonde Shaft #1's Main Zone, are maintained at the Penna Shaft zones. The zinc-silver (i.e. Zone 20 North) mineralization with lower gold values, common in the upper mine, grades into gold-copper mineralization within the lower mine. The predominant base metal sulphides within the LaRonde mine are chalcopyrite (copper) and sphalerite (zinc).
The Company believes that Zone 20 North is one of the largest gold-bearing massive sulphide mineralized zones in the world and one of the largest known mineralized zones in the Abitibi region of Ontario and Quebec. Zone 20 North contains the majority of the mineral reserves and resources at the LaRonde mine, including 27.3 million tonnes of proven and probable mineral reserves grading 4.64 grams of gold per tonne, representing 95% of the total proven and probable mineral reserves at the LaRonde mine, 4.4 million tonnes of indicated mineral resources grading 1.80 grams of gold per tonne, representing 82% of the total measured and indicated mineral resources at the LaRonde mine, and 9.6 million tonnes of inferred mineral resources grading 4.02 grams of gold per tonne, representing 81% of the total inferred mineral resources at LaRonde.
Zone 20 North extends between 700 metres below surface and at least 3,500 metres below surface, and remains open at depth. With increased access on the lower levels of the mine (i.e., below Level 215 and from the internal shaft on levels 257 and 278), the transformation from a "zinc/silver" orebody to a "gold/copper" deposit is expected to continue during 2013.
Zone 20 North can be divided into an upper zinc/silver-enriched gold-poor zone and a lower gold/copper-enriched zone. The zinc zone has been traced over a vertical distance of 1,700 metres and a horizontal distance of 570 metres, with thicknesses approaching 40 metres. The gold zone has been traced over a vertical distance of over 2,200 metres and a
32 AGNICO-EAGLE MINES LIMITED
horizontal distance of 900 metres, with thicknesses varying from three to 40 metres. The zinc zone consists of massive zinc/silver mineralization containing 50% to 90% massive pyrite and 10% to 50% massive light brown sphalerite. The gold zone mineralization consists of 30% to 70% finely disseminated to massive pyrite containing 1% to 10% chalcopyrite veinlets, minor disseminated sphalerite and rare specks of visible gold. Gold grades are generally related to the chalcopyrite or copper content. At depth, the massive sulphide lens becomes richer in gold and copper. During 2012, 2.0 million tonnes of ore grading 2.34 grams of gold per tonne, 43.35 grams of silver per tonne, 2.41% zinc, 0.26% copper and 0.28% lead were mined from Zone 20 North.
Exploration
The combined tonnage of proven and probable mineral reserves at the LaRonde mine for year-end 2012 is 28.8 million tonnes, which represents a 13% decrease in the amount compared to year-end 2011 (33.2 million tonnes). This mineral reserve includes the replacement of 2.4 million tonnes of ore that were mined in 2012. The reduction in reserves is principally associated with ore mined during 2012 and application of a mining recovery factor of 95% on the remaining reserves.
Diamond drilling is used for exploration on the LaRonde property. In 2012, a total of 252 holes were drilled on the LaRonde property for a total length of 22,255 metres, compared to 181 holes for a total length of 16,190 metres in 2011. Of the drilling in 2012, 222 holes (10,194 metres) were for production stope delineation, 26 holes (8,261 metres) were for definition drilling and 4 holes (3,701 metres) were for exploration. In 2011, 165 holes (8,181 metres) were for production stope delineation, 12 holes (2,614 metres) were for definition drilling and 4 holes (5,396 metres) were for exploration. Expenditures on diamond drilling at the LaRonde mine during 2012 were approximately C$2.8 million, including C$1.6 million in definition and delineation drilling expenses charged to operating costs at the LaRonde mine. Expenditures on exploration in 2012 were C$1.2 million, and are expected to be C$2.1 million in 2013.
The main focus of the 2012 exploration program was continuing the investigation of Zone 20 North and Zone 6-7 horizons at depth. This program was conducted from the level 215 exploration drift, approximately 2,150 metres below the surface. The first deep hole of the program was completed at the end of 2009 to a final length of 1,852 metres. This hole intersected Zone 20 North at a depth of 3,520 metres below surface, which is approximately 410 metres below the current reserve envelope. The intersection returned 14.3 metres (true width) grading 3.03 grams of gold per tonne. In 2010, a second branch was drilled from this mother hole and returned 4.1 metres grading 1.77 grams of gold per tonne at a depth of 3,595 metres below surface. Another deep hole was initiated in 2011 and intersected Zone 6 horizon in 2012 at a depth of 3,551 meters below surface. The 22.8-meters-thick massive sulfide zone returned 1.58 grams of gold per tonne, 27.1 grams of silver per tonne, 0.38% copper and 3.36% zinc and has the same characteristics as other deposits on the property. A follow-up campaign is planned in 2013 from level 278 to determine the extent of the deposit.
In addition, definition and delineation drilling was undertaken in the 20 North and 20 South Zones to assist in finalizing mining stope designs. Zone 20 North was the main focus of the definition drilling in 2012. Infill drilling mainly from Level 272 to Level 245 confirmed the previous Zone 20 North reserves.
Bousquet and Ellison Properties
The Bousquet property is located immediately west of the LaRonde mine and consists of two mining leases covering 80.0 hectares and 31 claims covering 384.9 hectares. The property, along with various equipment and other mining properties, was acquired from Barrick in September 2003 for $2.9 million in cash, $1.1 million in common shares of the Company and the assumption of specific reclamation and other obligations related to the Bousquet property. The property is subject to a 2% net smelter return royalty interest in favour of Barrick.
From 2004 to 2007, the Company recovered 108,407 tonnes of ore grading 2.33 grams of gold per tonne from Zone 4 in a small open pit. In 2006 and 2007, the Company recovered 99,342 tonnes of ore grading 7.02 grams of gold per tonne from two small ore blocks underground at Bousquet. There has been no mining of this property since 2007.
In 2011, the Company completed a diamond drilling program consisting primarily of twinning and resampling historic holes to evaluate the production potential of an open pit at Bousquet Zone 5. This work led to a new resource estimate for Zone 5 and an internal feasibility study has been conducted for a resumption of production in the Zone 5 open pit. This study led to a positive scenario. For the whole Bousquet property, including Zone 5, as at December 31, 2012, probable reserves totalled approximately 0.2 million ounces of gold comprised of 2.9 million tonnes grading 1.88 grams per tonne, as well as indicated mineral resources totalling approximately 9.8 million tonnes grading 2.44 grams of gold per tonne and inferred mineral resources totalling approximately 4.6 million tonnes grading 4.04 grams of gold per tonne.
2012 ANNUAL REPORT 33
The Ellison property is located immediately west of the Bousquet property and consists of eight claims covering 101.0 hectares. The property was acquired in August 2002 for $0.32 million in cash and a commitment to spend $0.49 million in exploration over four years. The commitment was fulfilled in 2004 and the property is 100% owned by the Company. The property is subject to a net smelter return royalty interest in favour of Yorbeau Resources Inc. that varies between 1.5% and 2.5% depending on the price of gold. Should commercial production from the Ellison property commence, the Company will be required to pay Yorbeau Resources Inc. an additional C$0.5 million in cash.
Expenditures on exploration in 2012 on both the Bousquet and Ellison properties were C$1.4 million, which includes the cost of drilling 3,850 metres in 12 holes drilled on the Ellison property. In 2013, the Company expects to spend C$0.84 million to continue the optimization of the internal feasibility study completed in March 2012 regarding the Bousquet property.
The December 31, 2012 indicated mineral resources at Ellison were approximately 0.4 million tonnes grading 5.68 grams of gold per tonne, and the inferred mineral resources were approximately 0.8 million tonnes grading 5.81 grams of gold per tonne.
Lapa Mine
The Lapa mine, which achieved commercial production in May 2009, is located approximately 11 kilometres east of the LaRonde mine near Cadillac, Quebec. At December 31, 2012, the Lapa mine was estimated to contain proven and probable mineral reserves of 0.4 million ounces of gold comprised of 2 million tonnes of ore grading 6.0 grams per tonne. The Lapa property is made up of the Tonawanda property, which consists of 44 contiguous mining claims and one provincial mining lease covering an aggregate of 702.4 hectares, and the Zulapa property, which consists of one mining concession of 93.5 hectares. The mining lease at Lapa expires in 2029.
Location Map of the Lapa Mine (as at December 31, 2012)
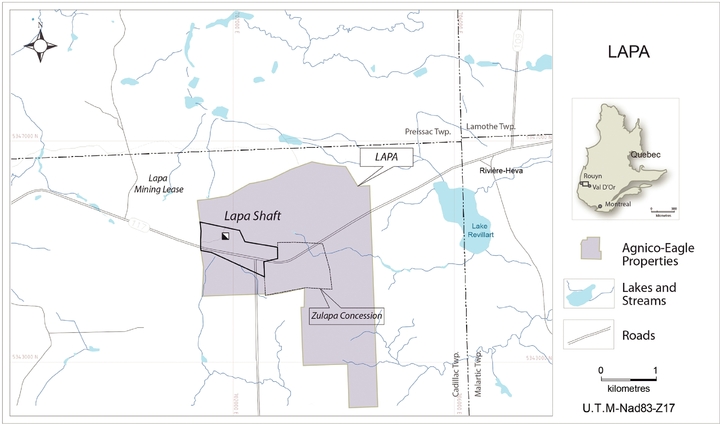
The Company's initial interest in the Lapa property was acquired in 2002 through an option agreement with Breakwater Resources Ltd. ("Breakwater"). The Company undertook an aggressive exploration program and discovered a new gold deposit almost 300 metres below the surface. In 2003, the Company purchased the Lapa property from Breakwater for a payment of $8.9 million, a 1% net smelter return royalty on the Tonawanda property and a 0.5% net smelter return royalty on the Zulapa property. In 2008, the Company purchased all royalties from Breakwater for C$6.35 million. In addition, both the Zulapa and Tonawanda properties are subject to a 5% net profit royalty payable to Alfer Inc. and René Amyot. In
34 AGNICO-EAGLE MINES LIMITED
2004, an additional claim of 9.4 hectares was added to the Company's holdings at the Lapa mine. In January 2009, a mining lease covering 66.8 hectares was entered into with the Ministry of Natural Resources (Quebec).
The Lapa mine is accessible by provincial highway. The elevation varies between approximately 320 and 390 metres above sea level. All of the Lapa mine's power requirements are supplied by Hydro-Quebec through connections to its main power transmission grid. All of the water required at the Lapa mine is sourced from the Heva river located 3.5 kilometres to the south of the mine. The water is pumped into an existing open pit nearby the property that has been allowed to flood and from which the mine is supplied. The topography slopes relatively gently from north to south. The property is generally covered by a boreal-type forest consisting mainly of black spruce and white pine with minor amounts of birch and poplar.
For additional information regarding the Abitibi region in which the Lapa mine is located, see "– Property, Plant and Equipment – LaRonde Mine".
Gold production during 2013 at the Lapa mine is expected to be approximately 105,000 ounces at estimated total cash costs per ounce of approximately $787.
Mining and Milling Facilities
Surface Plan of the Lapa Mine (as at December 31, 2012)
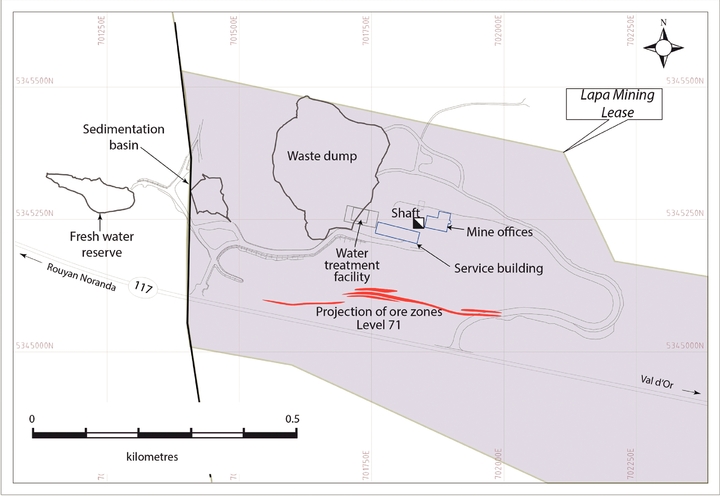
The Lapa site hosts an underground mining operation and the ore is trucked to the processing facility at the LaRonde mine, which has been modified to treat the ore, recover the gold and store the residues. Tailings from the Lapa mine are deposited in the tailings pond at the LaRonde mine.
2012 ANNUAL REPORT 35
In July 2004, the Company initiated the sinking of an 825-metre deep shaft at the Lapa property. In April 2006, 2,800 tonnes of development ore was extracted at Lapa and was estimated to contain on average 10.65 grams of gold per tonne. These results and results from other sampling methods were incorporated into a feasibility study and in June 2006, the Company accelerated construction of the Lapa mine. This construction included extending the shaft to a depth of 1,369 metres, which was completed in October 2007. Significant additional construction was required in order for the Lapa mine to achieve commercial production in May 2009, including the construction of the mill.
Mining Methods
Two underground mining methods are used at the Lapa mine: longitudinal retreat with cemented backfill and locally transverse open stoping with cemented backfill. Sublevels are driven at 30-metre vertical intervals. Stopes are mined in 12-metre sections and backfilled with 100% cemented rock backfill. Excavated ore from the Lapa site is trucked via provincial highway to the processing facility at the LaRonde mine.
Surface Facilities
The infrastructure on the Lapa property includes the refurbished former LaRonde Shaft #1 headframe and shafthouse, service buildings, offices, a settling pond for waste water, dry facilities, an ore bin, a diesel reservoir and a water treatment plant. In November 2007, lateral development began on three horizons. A backfill plant was commissioned in December 2008 and the sedimentation pond was extended in 2007 to control suspended solids from underground dewatering discharge.
Ore at the Lapa mine is processed through grinding, gravity and leaching circuits. Dedicated milling facilities have been integrated into the mill at the LaRonde mine. Based on an average ore head grade of 6.49 grams per tonne, gold recovery averaged 79.7% in 2012. With an average production of 1,750 tonnes per day in 2012, the mine operated consistently above its design rate of 1,500 tonnes per day. Dilution averaged 64% in 2012, a significant improvement over previous years.
Mineral Recoveries
In 2012, the Lapa mine produced 640,832 tonnes of ore grading 6.49 grams of gold per tonne. The Lapa processing facility treated 640,305 tonnes of ore in 2012 (approximately 1,749 tonnes per day) and operated at about 97.6% of available time.
| Head Grades |
Overall Metal Recoveries |
Payable Production |
|||||
| Gold | 6.49 g/t | 79.7% | 106,191 oz | ||||
Environmental Matters
Water used underground at the Lapa mine was initially re-circulated from mine dewatering after settling in the sedimentation pond. The re-circulation led to ammonia concentration in the water, and the Company experienced occasional toxicity problems in the water pond in 2008 and 2009. To address the ammonia content in the water, the Company built a 3.5-kilometre pipeline to obtain fresh water from the Heva River. The pipeline was commissioned in November 2009. The Company also commissioned a water treatment plant on site in the fourth quarter of 2010 to reduce the ammonia from mine dewatering. Output is currently within the target range at approximately eight parts per million of ammonia and average efficiency is at approximately 70%. Optimization of the plant is ongoing.
In the second quarter of 2012, an Oberlin filtration unit located inside the treatment plant was installed to improve the removal of suspended solids from water coming from the underground operation. A sedimentation pond also is used to remove suspended solids from the dewatering water before either release to the environment or re-use in the underground mining operation. The waste rock pile naturally drains towards the sedimentation pond. A waste rock sampling program implemented during the shaft sinking phase verified the non-acid generating nature of the waste rock. Water effluent from the sedimentation pond is being sampled as required under the Quebec mining effluent guidelines, and is expected to comply with the water quality criteria. The mill residues will be sent to the LaRonde mine tailings area.
36 AGNICO-EAGLE MINES LIMITED
There are no known environmental liabilities associated with the Lapa site. The Certificates of Authorization to proceed with mine production and with mill construction were issued by the Ministry of Sustainable Development, Environment and Parks (Quebec) in October and December 2007, respectively. The Certificate of Authorization for mill and tailings production was received in 2008.
Capital Expenditures
The Company incurred approximately $18.4 million in capital expenditures at the Lapa mine in 2012 and expects to incur approximately $20.7 million in 2013, including $13.7 million for deferred development, $5.4 million for sustaining capital expenditures (including underground construction and mining equipment) and $1.6 million for exploration.
Development
In 2012, a total of 6,062 metres of lateral development was completed. Development focused on permanent drifts (ramps and haulage way), stope preparation of mining blocks set for production in 2012 and 2013 and access to the East zone and the Deep Project, which is expected to begin production in 2013.
Geology, Mineralization and Exploration
Geology
The Lapa property is located near the southern boundary of the Archean-age (2.7 billion years old) Abitibi Subprovince and the Pontiac Subprovince within the Superior Province of the Canadian Shield. The most important regional structure is the CLL fault zone marking the contact between the Abitibi and Pontiac Subprovinces. The fault zone passes through the property from west to east, and is marked by schists and mafic to ultramafic volcanic flows that comprise the Piché group (up to approximately 300 metres thick in the mine area). On the Lapa property, the fault zone displays a "Z" shaped fold to which all of the lithologic groups in the region conform. Feldspathic dykes cut the Piché group, especially near the fold. North of the Piché group lies the Cadillac sedimentary group, which consists of 500 metres or more of well-banded wacke, conglomerate and siltstone with intercalations of iron formation. The Pontiac group sedimentary rocks (up to approximately 300 metres thick) that occur to the south of the Piché group are similar to the Cadillac group but do not contain conglomerate nor iron formation.
Mineralization
All of the known gold mineralization along the CLL fault zone is epigenetic (late) vein type, controlled by the structure. The mineralization is associated with the fault zone and occurs within or immediately adjacent to the Piché group rocks.
The Lapa deposit is comprised of the Contact zone and five satellite zones. The Contact zone accounts for approximately 84% of the mineral reserves.
The ore zones are made up of multiple quartz veins and veinlets, often smoky and anastomosing, within a sheared and altered envelope containing minor sulphides and visible gold. The Contact zone is generally located at the contact between the Piché group and the Cadillac group. The satellite zones are located within the Piché group at a distance varying from ten to 50 metres from the contact with the Cadillac group, except for the Contact North zone, which is located approximately ten metres north of the Contact zone within the Cadillac group. The sheared envelope consists of millimetre-thick foliation bands of biotite or sericite with silica and, in places, cuts across rock units. Quartz veins and millimetre-sized veinlets parallel to the foliation account for 5% to 25% of the mineralization. Visible gold is common in the veins and veinlets but can also be found in the altered host rock. Sulphides account for 1% to 3% of the mineralization; the most common sulphides, in order of decreasing importance, are arsenopyrite, pyrite, pyrrhotite and stibnite. Graphite is also rarely observed as inclusions in smoky quartz veins.
The Contact and satellite zones are tabular mineralized envelopes oriented east-west and dipping very steeply to the north, turning south at depth. The economic portion of the zone has been traced from depths of approximately 450 metres to more than 1,300 metres below surface. The Contact zone has an average strike length of 300 metres, varies in thickness from 2.8 to 5.0 metres and is open at depth. Locally some thicker intervals have been intersected but their continuity has not been demonstrated. The satellite zones have thicknesses similar to the Contact zone.
Exploration
Two exploration diamond drilling programs were completed at the Lapa mine during 2012. The first program concentrated on confirming and expanding the known orebodies (in the Contact zone and the other satellite zones) in the immediate
2012 ANNUAL REPORT 37
vicinity of the ore zones. The drilling tested the eastern area of the Contact zone reserve from 1,000 metres to 1,500 metres depth below the surface and 300 metres east of the Contact zone reserve limit. The 2013 program will focus on expanding mineral resources in this area. Additional drilling was done below Level 128 (the deepest producing level) targeting the Zulapa corridor, which returned good results and allowed for the identification of new resources. Further drilling will be need to be completed in 2013 to evaluate the economics of this area. The second program was executed from the exploration track drift on Level 101 (one kilometre deep) toward the east and from the newly excavated west exploration track drift on Level 101. This program will continue through 2013.
Overall, there was a reduction of approximately 106,000 ounces of gold in reserves at Lapa in 2012 after mining 129,000 ounces of gold. The net reduction of 106,000 ounces in reserves was a result of a lower-than-expected grade from 2012 delineation diamond drilling and a decrease in the mining recovery factor for sill stopes, offset by additional ounces from the deep drilling project. Mineral underground resources at the Lapa mine decreased by 0.8 million tonnes (decrease of 0.4 million tonnes due to conversion of resources below Level 128 of the Contact zone and below Level 113 of the East zone and decrease of 0.4 million tonnes following the re-interpretation of drilling results and new drilling on the Lapa property). Approximately 0.2 million tonnes of inferred resources were added following underground drilling in 2012. Drilling and evaluation will continue in 2013.
In 2012, a total of 234 holes were drilled on the Lapa property for a total length of 37,699 metres, compared to 231 holes for a total length of 28,386 metres in 2011. Of the drilling in 2012, 177 holes (11,026 metres) were for production stope delineation and 57 holes (26,672 metres) were for exploration. In 2011, 165 holes (9,257 metres) were for production stope delineation, and 66 holes (19,129 metres) were for exploration. Expenditure on diamond drilling at the Lapa mine during 2012 was approximately $3.0 million, including $0.9 million in definition and delineation drilling expenses charged to operating costs.
In 2013, the Company expects to spend $2.6 million on exploration. In 2013, 61% of the exploration drilling budget will be used for exploration in close vicinity of the mine infrastructure and 39% will be used for drilling from the exploration drift.
Goldex Mine Project
The Goldex mine project, which achieved commercial production in August 2008, is located in the City of Val d'Or, Quebec, approximately 60 kilometres east of the LaRonde mine. On October 19, 2011, the Company suspended mining operations and gold production from the GEZ at Goldex, following the receipt of recommendations from independent consultants to halt underground mining operations during the investigation into geotechnical concerns with the rock above the mining horizon. As a result, the Company wrote off substantially all of its investment in the Goldex mine (approximately $254 million), took a closure provision of approximately $44 million and reclassified all of the remaining 1.6 million ounces of proven and probable gold reserves (approximately 0.9 million ounces of gold in proven reserves (14.8 million tonnes grading 1.87 grams of gold per tonne) and approximately 0.7 million ounces of gold in probable reserves (13.0 million tonnes grading 1.6 grams of gold per tonne) estimated as of December 31, 2010), other than the ore stockpiled on surface, as mineral resources in the third quarter of 2011. The surface stockpile was processed in the Goldex mill by October 30, 2011.
In July 2012, the Company approved the development of the M Zone and the E Zone of the Goldex mine project. Production from these zones is expected to be achieved in the second quarter of 2014. Development work is continuing underground on the M and E Zones. Exploration on the D Zone continues with underground diamond drilling.
The proven and probable reserves at Goldex as at December 31, 2012 were approximately 0.3 million ounces of gold comprised of 7.0 million tonnes grading 1.55 grams per tonne, all in the M and E Zones. Goldex also had measured and indicated resources of approximately 27.2 million tonnes grading 1.84 grams of gold per tonne, and inferred resources of approximately 34.6 million tonnes grading 1.52 grams of gold per tonne as at December 31, 2012.
The Company anticipates that 5,100 tonnes of ore per day grading 1.54 grams per tonne (diluted) will be extracted and processed at the M and E Zones over the next 3.5 years. Commercial production is expected to be achieved during the second quarter of 2014. Total cash costs per ounce are estimated to be approximately $900 in 2013 and estimated 2013 capital expenditures are $70 million.
Certain satellite zones at the Goldex mine project are under evaluation to give more flexibility for the operation and/or extend the mine life.
38 AGNICO-EAGLE MINES LIMITED
Location Map of the Goldex Mine Project (as at December 31, 2012)
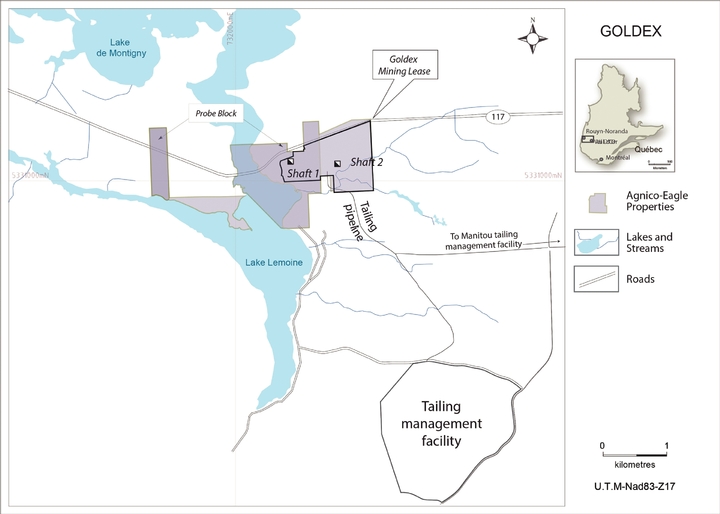
The Goldex property is accessible by provincial highway. The elevation is approximately 302 metres above sea level. All of the Goldex mine project's power requirements were supplied by Hydro-Quebec through connections to its main power transmission grid. All of the water that was required at the Goldex mine project was sourced directly by aqueduct from the Thompson River immediately adjacent to the minesite or through recirculation of water from the surface pond and the auxiliary tailings pond. For additional information regarding the Abitibi region in which the Goldex mine project is located, including information with respect to climate, topography, vegetation and mining personnel, see "– Property, Plant and Equipment – LaRonde Mine".
The Goldex mine project operates under a mining lease obtained from the Ministry of Natural Resources (Quebec) and under certificates of approval granted by the Ministry of Sustainable Development, Environment and Parks (Quebec). The Goldex property, in which the Company has a 100% working interest, consists of 22 contiguous mining claims and, since April 2006, one provincial mining lease (98.6 hectares), covering an aggregate of 331.2 hectares. The property is made up of three blocks: the Probe block (130.7 hectares); the Dalton block (10.4 hectares); and the Goldex Extension block (190.1 hectares). The claims are renewable every second year upon payment of a small fee. The mining lease expires in 2028 and is automatically renewable for three further ten-year terms upon payment of a small fee. The Company also has one lease covering 418.5 hectares of surface rights that are used for the auxiliary tailings pond. This lease is renewable annually upon payment of a small fee.
The Goldex property includes underground operations that can be accessed from two shafts, a processing plant, an ore storage facility and other related facilities. The GEZ, which was the gold deposit on which the Company was focusing its production efforts before production was suspended indefinitely on October 19, 2011, was discovered in 1989 on the Goldex Extension block (although the Company believes a small portion of the GEZ occurs on the Probe block). On November 29, 2012, the Company purchased the 5% net smelter return royalty interest on the Probe block from Probe Mines Limited ("Probe") for cash consideration of C$14 million. Up to an additional C$4 million (in cash or common shares of the Company, at the election of Probe) may become payable by the Company to Probe if certain production
2012 ANNUAL REPORT 39
thresholds are achieved on the Probe block. In 2012, exploration and development work continued on the M Zone and the E Zone.
In late 1997, the Company completed a mining study that indicated the deposit was not economically viable to mine at the then-prevailing gold price (approximately $323 per ounce of gold) using the mining approach chosen and drill-hole-indicated grade. The property was placed on care and maintenance and the workings were allowed to flood. In February 2005, a new mineral reserve and resource estimate was completed for the GEZ which, coupled with a feasibility study, led to a probable mineral reserve estimate of 1.6 million ounces of gold contained in 20.1 million tonnes of ore grading 2.54 grams of gold per tonne. The GEZ resource model was revised and, in March 2005, the Company approved a feasibility study and the construction of the Goldex mine. The mine achieved commercial production on August 1, 2008 and consistently operated at or above the designed rate of 6,900 tonnes per day until its operations were suspended in October 2011.
Based on the results of a scoping study completed in July 2009, the Company determined to expand the mine and mill operations at Goldex to 8,000 tonnes per day. This project was completed in 2010. Capital costs in connection with the expansion totalled $10 million. The crusher for the expansion was commissioned at the end of the first quarter of 2010 at a rate of 7,811 tonnes per day.
The Goldex mine produced 135,478 ounces of gold in 2011 at total cash costs of $472 per ounce. The Goldex mine project is not expected to produce more gold from the GEZ until at least the geotechnical concerns with the rock above the mining horizon are resolved.
Mining and Milling Facilities
Surface Plan of the Goldex Mine Project (as at December 31, 2012)
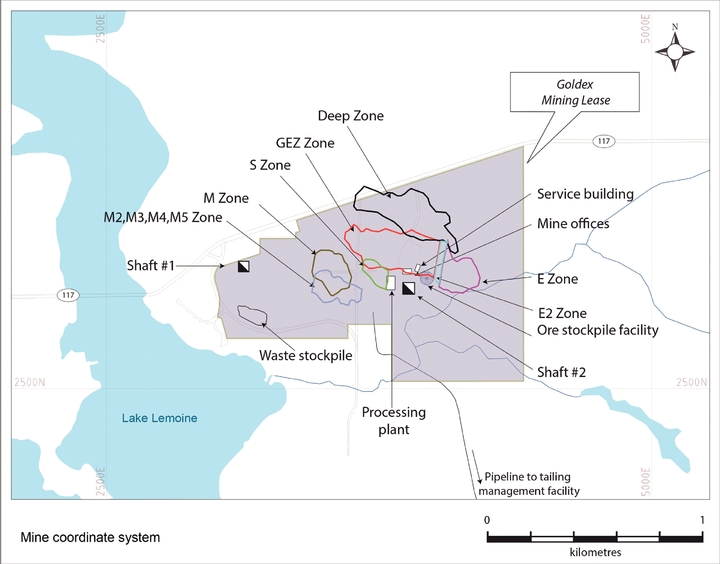
40 AGNICO-EAGLE MINES LIMITED
At the time the Company commenced construction of the Goldex mine, the surface facilities included a headframe, a hoistroom, a surface building containing a mechanical shop, a warehouse and an office. In addition, the Goldex property had a 790-metre deep shaft (Shaft #1), which provided access to underground workings. Shaft #1 is predominantly used to hoist waste rock from development activities.
The sinking of a new production shaft was completed in 2007. This shaft (Shaft #2) is a 5.5-metre diameter shaft with a 50-centimetre thick concrete lining and is used for ventilation as well as hoisting services. Shaft #2 is 865 metres deep and includes five stations. A refurbished friction hoist was installed for production and service duties, and an auxiliary hoist was installed for emergency and personnel service. The production hoist is equipped with one cageskip. Each skip has a 21.5-tonne capacity and the shaft can hoist an average of 7,000 to 8,000 tonnes of ore per day.
Mining Methods
Prior to the suspension of mining operations on October 19, 2011, the Goldex mine used a high volume bulk mining method, which was made possible through the use of large mining stopes. Drilling and blasting of 165-millimetre production holes was used to obtain a muck size large enough to be economically efficient. Using this method required a percentage of the broken ore to be kept in the stope to reduce the backfilling cost and to reduce sloughing on the walls. Little ore and waste development was necessary to mine out the deposit.
The Company expects to mine the M and E Zones using primary and secondary stope methods. The Company also plans to paste fill to ensure long term stability. For both zones, stopes are planned to be 55 metres high. The width and length will depend on rock mass quality, but an average stope should be approximately 100,000 tonnes. Ore pass systems and scoop trams will be used for the M Zone, while trucks and scoop trams are planned for the E Zone.
Surface Facilities
Plant construction at Goldex commenced in the second quarter of 2006 and was completed in the first quarter of 2008. The plant reached design capacity in the second quarter of 2009. Grinding at the Goldex mill was done through a two-stage circuit comprised of a SAG mill and a ball mill. As part of the expansion project commenced in 2009, a surface crusher was added to reduce the size of ore transferred to the surface from 150 millimetres to 50 millimetres. A lamellar decanter was also added to recover small particles present in the water overflow of the concentrate thickener. The underflow pump of this thickener was upgraded following flotation circuit modification to increase the pull rate of the small particles. Approximately two-thirds of the gold was recovered through a gravity circuit, passed over shaking tables and smelted on site. The remainder of the gold and pyrite was recovered by a flotation process. The concentrate was then thickened and trucked to the mill at the LaRonde mine where it was further treated by cyanidation. Gold recovered was consolidated with precious metals from the LaRonde and Lapa mines. The Company reached an average gold recovery of 93.38% in 2011, prior to the suspension of mining.
A new backfill plant is currently under construction at the surface. The plant will fill stope in the M and E Zones. The tailing thickener underflow will feed the backfill plant and two disk filters will increase the density before the continuous mixer. Cement will be added at a ratio of 6% and then sent to the underground mine with a positive displacement pump. The capacity of the paste production is expected to be 5,500 tonnes per day.
Following the metallurgical tests that have been performed on the M and E Zones, the results show no significant change on the performance obtained. The only factor that will influence the flotation circuit is the cement present in the backfill stope that will be sloping with the ore as dilution. This will require a pH control (using sulphuric acid), a chemicals reservoir and pumps to be added to the mill.
In addition, surface facilities at the Goldex property include an electrical sub-station, a compressor building, a service building for administration and changing rooms, a warehouse building, a concrete headframe above Shaft #2, a hazardous waste storage facility and a dome covering the ore stockpile.
2012 ANNUAL REPORT 41
Mineral Recoveries
Prior to the suspension of mining operations on October 19, 2011, the Goldex mill processed approximately 2.48 million tonnes of ore, averaging approximately 8,173 tonnes of ore treated per day and operating at approximately 95% of available time. The following table sets out the metal recoveries at the Goldex mine in 2011.
| Head Grades |
Gravity Recovery | Flotation-Cyanidation Recovery |
Global Recovery | Payable Production |
|||||||||
| Gold | 1.82 g/t | 67.76% | 25.63% | 93.38% | 135,478 oz | ||||||||
The Company expects that approximately 5,100 tonnes of ore per day will be mined at the M and E Zones.
Environmental Matters
Environmental permits for the construction and operation of an ore extracting infrastructure at the Goldex mine were received from the Ministry of Sustainable Development, Environment and Parks (Quebec) in October 2005. The permits also covered the construction and operation of a sedimentation pond for mine water treatment and sewage facilities, and these facilities were built at the Goldex mine site. In June 2009, the permits were revised to allow the expansion of the mine and mill operations to 8,500 tonnes per day. In June 2012, environmental permits were received for the construction and operation of a paste backfill plant in connection with the development of the M and E Zones.
In November 2006, the Company and the Quebec government signed an agreement permitting the Company to dispose of the Goldex tailings at the Manitou minesite, a tailings site formerly used by an unrelated third party and abandoned to the Quebec government. The Manitou tailings site has issues relating to acid drainage, and the construction of tailings facilities by the Company and the deposit of tailings from the Goldex plant on the Manitou tailings site was accepted by the Ministry of Sustainable Development, Environment and Parks (Quebec) as a valid rehabilitation plan to address the acid generation problem at Manitou. Under the agreement, the Company managed the construction and operation of the tailings facilities and the Quebec government paid all additional costs above the Company's budget for tailings facilities set out in the Goldex feasibility study. The Quebec government retains responsibility for all environmental contamination at the Manitou tailings site and for final closure of the facilities. In addition, the Company built a separate tailings deposit area (auxiliary tailings pond) near the Goldex mine. Environmental permits for the construction and operation of the auxiliary tailings pond were received in March 2007. In 2011, 237,615 tonnes of Goldex tailings were discharged to the auxiliary pond for a total to date of 764,077 tonnes. At the Manitou site, 2.20 million tonnes of Goldex tailings were discharged for a total to date of 8.095 million tonnes. In 2012, no tailings were sent to the auxiliary tailings pond or to the Manitou tailings site.
A new dyke was built in the summer of 2011 in the auxiliary tailings pond to create a second polishing basin to reduce total suspended solids in the discharged water during spring time. Construction of this dyke was necessary following a notice of infraction received in 2011 from the Quebec Ministry of Environment for exceeding of the permitted total suspended solids.
Following suspension of mining operations at the Goldex property, the mine closure costs were revised to account for the change in conditions at the site. The estimated total for the closure costs of the Goldex mine is approximately $51.4 million, comprised of the following: $1.2 million for demolition, $1 million for engineering, $0.45 million for site preliminary works, $5.4 million for mining site rehabilitation (primarily for backfilling of the zone with high subsidence), $23.2 million for rock grouting and soil improvement, $0.26 million for revegetation of the site, $0.06 million to rehabilitate the sedimentation pond, $0.2 million to rehabilitate the waste rock pile, $1.03 million to rehabilitate the South Tailings basin area, $0.7 million for geotechnical and environmental monitoring, $17.6 million for property purchases and $0.3 million for Baie-Dorée road rehabilitation. In addition, a separate provision of approximately $4.6 million exists for the remaining participation of the Company in the rehabilitation of the Manitou site. In 2011 and 2012, the Company spent $7.7 million and $21.5 million, respectively, on mine closure costs at Goldex.
Capital Expenditures
As a result of the Goldex mine closure, from January to mid-October 2012, Goldex was considered an exploration project and, accordingly, none of the expenses incurred at Goldex were capitalized. A feasibility study for the M and E Zones was completed in mid-October 2012, which demonstrated the potential for a new mining project at the M and E Zones.
42 AGNICO-EAGLE MINES LIMITED
Accordingly, from mid-October until the end of 2012, all expenses were capitalized at Goldex. Total expenditures at Goldex in 2012 were $26.7 million for development of the M and E Zones and $14.3 million for remediation.
Capital expenditures of $70 million have been approved to further develop the M Zone and the E Zone in 2013. This amount includes $21 million for the paste plant and $5 million for new mining equipment and infrastructure refurbishing. The sustaining capital for the life of mine is approximately $26 million.
Development
During 2011, approximately 4,256 metres of lateral and vertical development were completed at a cost of $15.3 million, including development following the suspension of mining operations on October 19, 2011. At the present time, development work continues underground on the M Zone, and exploration continues with diamond drilling. In 2012, 4,534 metres of development were completed at a total cost of $23.7 million to develop the M Zone and the E Zone and for exploration of the D Zone.
Development work continues underground on the M and E Zones. A total of 4,800 metres of development at a cost of approximately $23 million is planned for both zones in 2013. In 2014, 4,320 metres will be required to complete the development of the M and E Zones.
Geology, Mineralization and Exploration
Geology
The Goldex property is located near the southern boundary of the Archean-age (2.7 billion years old) Abitibi Subprovince, a typical granite-greenstone terrane located within the Superior Province of the Canadian Shield. The southern contact of the Abitibi Subprovince with the Pontiac Subprovince is marked by the east-southeast trending CLL Fault Zone, the most important regional structural feature. The Goldex deposit is hosted within a quartz diorite sill, the "Goldex Granodiorite", located in a succession of mafic to ultramafic volcanic rocks that are all generally oriented west-northwest.
The GEZ extends from 500 to 800 metres below the surface and is entirely hosted by the Goldex Granodiorite. The limits of the zone are defined by the intensity of the quartz vein stockwork envelope and by gold assays. The zone is almost egg-shaped; it is over 300 metres tall by 450 metres long (in a west-northwest direction) and its thickness increases rapidly from 25 metres along the east-west edges to almost 150 metres in the centre.
In 2012, exploration efforts at Goldex were focused on the M Zone, E Zone and D Zone. These zones are defined by quartz tourmaline veins and gold assays are similar to the GEZ. The M Zone has been defined as having a length of 160 metres, a height of 120 metres and a thickness of 115 metres. The E Zone is adjacent to the eastern end of the GEZ, and has a length of 150 metres, a height of 150 metres and a thickness of 100 metres. The D Zone is approximately 150 metres below the GEZ and close to 1,500 metres below the surface. It appears to have an approximate length of 500 metres.
Mineralization
Gold mineralization at Goldex corresponds to the quartz-tourmaline vein deposit type. The Goldex gold-bearing quartz-tourmaline-pyrite veins and veinlets have strong structural control. The most significant structure directly related to mineralization is a discrete shear zone, the Goldex Mylonite, that is up to five metres wide and occurs within the Goldex Granodiorite, just south of the GEZ and north of the M Zone. The quartz-tourmaline-pyrite vein mineralization is controlled by minor fracture zones that are oriented west-northwest and dip steeply north or south. The fractures are parallel to, but north of, the Goldex Mylonite. Within the GEZ and the M and E Zones are three vein sets, the most important of which are extensional-shear veins dipping 30 degrees south and usually less than 10 centimetres thick. The vein sets and associated alteration combine to form stacked envelopes up to 30 metres thick.
2012 ANNUAL REPORT 43
Strong albite-sericite alteration of the host-rock quartz diorite surrounds the quartz-tourmaline-pyrite veins and covers almost 80% of the mineralized zone; outside of the envelopes, prior chlorite alteration affects the quartz diorite and gives it a darker grey-green colour. Occasionally, enclaves of relatively unaltered medium grey-green-coloured quartz diorite (with no veining or gold) are found within the GEZ and the M and E Zones; they are included exceptionally as internal waste to allow for a smooth shape, required for mining purposes.
Most of the gold occurs as microscopic particles that are almost always associated with pyrite, generally adjacent to grains and crystals but also 20% included within the pyrite. The gold-bearing pyrite occurs in the quartz-tourmaline veins and in narrow fractures in the sericite-albite-altered quartz diorite (generally immediately adjacent to the veins). Less than 1.5% of the gold occurs as the mineral calaverite, a gold telluride.
Exploration
Three different zones in the Goldex granodiorite intrusive were drilled in 2012. The main exploration focus was the D Zone, with 41.9 kilometres of drilling (representing approximately 60% of total drilling). 12.7 kilometres (18%) were drilled in the satellite zones above the M Zone and 15.5 kilometres (22%) were drilled in the E Zone sector to the east of the GEZ.
In 2012, $14.1 million was spent on exploration at Goldex. A total of 202 holes were drilled using diamond drilling methods for a total length of approximately 70.1 kilometres, compared to 107 holes for a total length of approximately 47 kilometres in 2011. Expenses in 2012 included the extension of the exploration ramp to level 95 and general costs for underground activities (such as electricity and pumping expenses) amounting to approximately $5 million and a study of the D Zone at a cost of $0.32 million.
The 2013 exploration program is budgeted to include 21.6 kilometres of diamond drilling at a cost of $3.5 million. The primary target is the upper portion of the D Zone, where 17 kilometres of drilling is planned. An additional 4.6 kilometres of drilling is planned for the satellites zones above the M Zone (M2-M5) and the S Zone. In 2013, a geo-mechanical study relating to mineralized zones is also planned at an expected cost of $0.5 million. Accordingly, the aggregate cost of the 2013 exploration program is expected to be $4 million.
Kittila Mine
The Kittila mine, which commenced commercial production in May 2009, is located approximately 900 kilometres north of Helsinki and 50 kilometres northeast of the town of Kittila in northern Finland. At December 31, 2012, the Kittila mine was estimated to contain proven and probable mineral reserves of 4.8 million ounces of gold comprised of 33.1 million tonnes of ore grading 4.49 grams per tonne. The Kittila mine is accessible by paved road from the village of Kiistala, which is located on the southern portion of the main claim block. The gold deposit is located near the small village of Rouravaara, approximately ten kilometres north of the village of Kiistala, accessible via a paved road. The property is close to infrastructure, including hydro power, an airport and the town of Kittila. The project also has access to a qualified labour force, including mining and construction contractors.
The total landholdings surrounding and including the Kittila mine comprise one mining licence (licence area of 845 hectares and licence extension application area of 288 hectares) and 236 tenements covering approximately 21,212 hectares. The mineral titles form a continuous block around the Kittila mining licence. The block has been divided into the Suurikuusikko area, the Suurikuusikko West area, the Suurikuusikko East area and the Kittila mining licence centred at 25.4110 degrees longitude east and 67.9683 degrees latitude north.
The boundary of the mining licence is determined by ground-surveyed points whereas the boundaries of the other tenements are not required to be surveyed. All of the tenements in the Kittila mine are registered in the name of Agnico-Eagle Finland Oy, an indirect, wholly-owned subsidiary of the Company. According to the Finnish government's land tenure records, all tenements are in good standing. The expiry dates of the tenements vary from June 2013 to August 2017. Tenements are initially valid for four years, provided exploration work in the area is reported annually and a small annual fee is paid to maintain title; extensions for titles can be granted for 11 additional years on payment of a slightly higher fee and active exploration in the area. Agnico-Eagle Finland Oy also holds the mining licence in respect of the Kittila mine. The mine is subject to a 2.0% net smelter return royalty payable to the Republic of Finland.
The Kittila mine area is sparsely populated and is situated between 200 and 245 metres above sea level. The topography is characterized by low rolling forested hills separated by marshes, lakes and interconnected rivers. The gold deposit is situated on an area of land that has no special use at present and there is sufficient land available for tailings facilities. Water requirements for the Kittila mine are sourced from the nearby Seurujoki River, recirculation of water from pit
44 AGNICO-EAGLE MINES LIMITED
dewatering and tailings pond water. The Kittila region is located within the South-West Lapland zone of the northern boreal vegetation zone characterized by spruce forests, marshes and bogs.
The mine is located within the Arctic Circle but the climate is moderated by the Gulf Stream off the coast of Norway such that northern Finland's climate is comparable to that of eastern Canada. Winter temperatures range from -10 to -30 degrees Celsius, whereas summer temperatures range from 10 degrees Celsius to the mid-20s. Exploration and mining work can be carried out year-round. Because of its northern latitude, winter days are extremely short with a brief period of 24-hour darkness around the winter solstice. Conversely, summer days are very long with a brief period of 24-hour daylight in early summer around the summer solstice. Annual precipitation varies between five and 50 centimetres, one-third of which falls as snow. Snow accumulation usually begins in November and remains until March or April.
Location Map of the Kittila Mine (as at December 31, 2012)
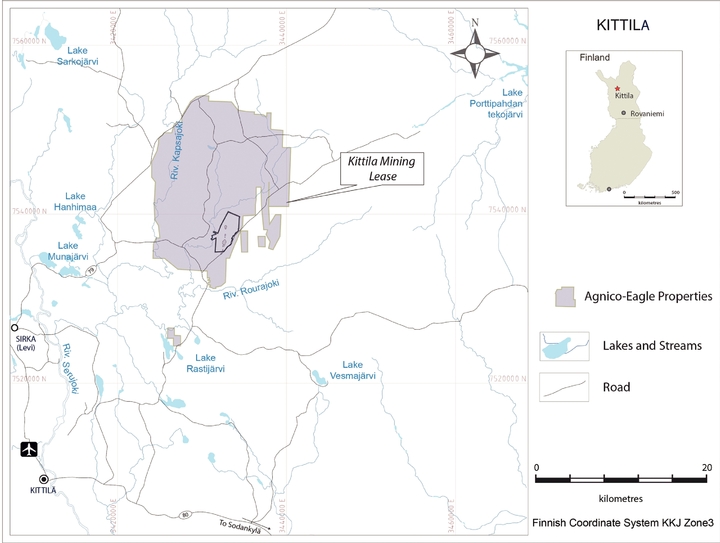
The Company acquired its 100%, indirect interest in the Kittila mine through the acquisition of Riddarhyttan completed in November 2005. See "– History and Development of the Company". In June 2006, on the basis of an independently reviewed feasibility study, the Company approved construction of the Kittila mine. Mining at Kittila started initially as open pit mining. This open pit mining was completed in November 2011 and all mining is currently carried out from the underground via ramp access. The initial underground stope was mined in early 2010. Ore is processed in a 3,000-tonne per day surface processing plant that was commissioned in late 2008. Limited gold concentrate production started in September 2008 and gold dore bar production commenced in January 2009. During 2010, throughput at the Kittila mine occurred at design levels and gold recoveries continued to improve. The Kittila mine is anticipated to produce approximately 173,708 ounces of gold in 2013 at estimated total cash costs per ounce of approximately $565. Over the period of 2013 to 2043, total annual average gold production of approximately 141,442 ounces is anticipated. A scoping study is underway to assess the feasibility of significantly increasing the annual gold production.
2012 ANNUAL REPORT 45
Mining and Milling Facilities
Surface Plan of the Kittila Mine (as at December 31, 2012)
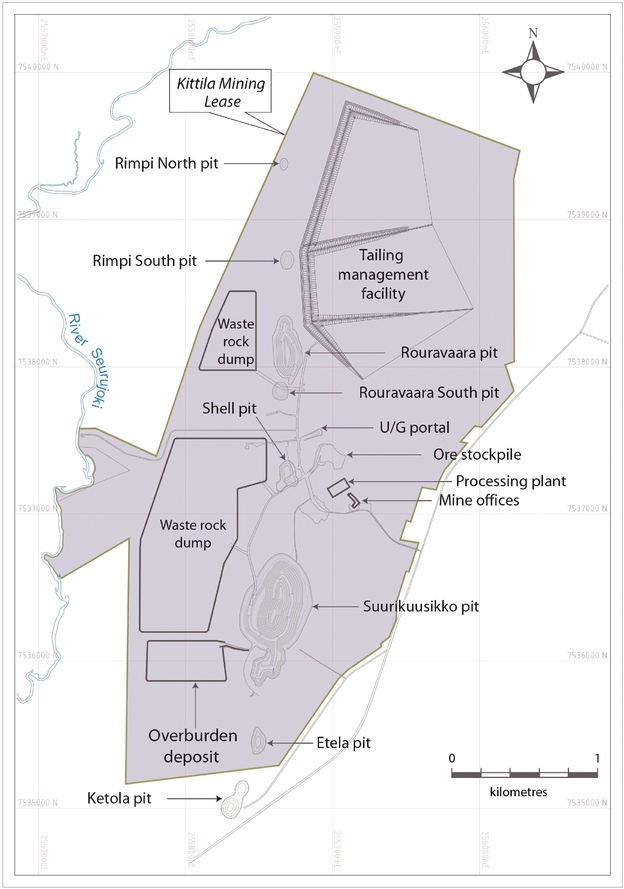
The orebodies at Kittila were mined initially from two open pits, followed by underground operations to mine the deposits at depth. Additional, smaller open pits will be used to mine any remaining mineral reserves close to the surface in the future. Open pit mining started in May 2008 and the extracted ore was stockpiled. As of December 2012, a total of 3.9 million
46 AGNICO-EAGLE MINES LIMITED
tonnes of ore have been processed, including ore both from the open pits and underground, 0.46 million tonnes of ore are currently stockpiled and 33.1 million tonnes of waste rock have been excavated. Work on the ramp and other work to access the reserves underground continued throughout 2012. Total underground (lateral and vertical) development at the end of 2012 is approximately 29,000 metres. Underground mining commenced in the fourth quarter of 2010 and, at the end of 2012, a total of 0.93 million tonnes of ore has been mined from the underground portion of the mine.
Mining Methods
At the Kittila mine, the Suurikuusikko and the Rouravaara orebodies are currently mined by underground mining methods and access to the underground mine is via ramp. Approximately 3,000 tonnes of ore per day are fed to the concentrator. The underground mining method is open stoping with delayed backfill. Stopes are between 25 and 40 metres high and yield approximately 10,000 tonnes of ore per stope. To ensure sufficient ore production is available to supply the mill, over 6,000 metres of tunnels will be developed each year. After extraction, stopes are filled with paste backfill or cemented backfill to enable the safe extraction of ore in adjacent stopes. Ore will be trucked to the surface crusher via the ramp access system.
Surface mining finished in 2012; mining stopped at the Rouvaara open pit in April 2012 and mining at the Suurikuusikko pit was completed in early November.
Surface Facilities
Construction of the processing plant and associated equipment was completed in 2008 and facilities on site include an office building, a maintenance facility for the open pit equipment, a warehouse, a maintenance shop, an oxygen plant, a processing plant, a paste backfill plant, a tank farm, a crusher, conveyor housings and an ore bin. In addition, some temporary structures house contractor offices and work areas.
The ore at Kittila is treated by grinding, flotation, pressure oxidation and CIL circuits. Gold is recovered from the carbon in a Zadra elution circuit and is recovered from the solution using electrowinning and then poured into dore bars using an electric induction furnace.
Mineral Recoveries
In 2012, the Kittila mill processed 1,090,365 million tonnes of ore with an availability of 86% for an average throughput of 2,996 tonnes per day.
The following table sets out the gold production at the Kittila mine in 2012:
| Head Grade |
Overall Metal Recovery |
Payable Production |
|||||
| Gold | 5.68 g/t | 88.3% | 175,878 oz | ||||
Ore processing at Kittila consists of two stages. In the first stage, ore is enriched by flotation and in the second stage the gold is extracted by pressure oxidation and cyanide-in-leach processes. Flotation recoveries were very stable and continued to improve during 2012. They averaged 94.8% during the year.
Recoveries in the second stage of the process were also very stable and good in 2012, averaging 93.2% over the year. Modifications done in 2012 inside the autoclave resulted in better oxygen distribution and sludge flow resulting in improved recoveries. Test work will continue in 2012 to try to further improve the control of the process.
Environmental Matters
The Company currently holds a mining licence, an environmental permit and operational permits in respect of the Kittila mine. All permits necessary to begin production were received during 2008.
The construction of the first phase of the tailings dam and waterproof bottom layer was completed in the fall of 2008. This first phase is sufficient to hold tailings from three years of production. Work began on the second phase in 2009 and continues according to plans and permit requirements. Water from dewatering the mine and water used in the mine and
2012 ANNUAL REPORT 47
mill is collected and treated by sedimentation. Emissions and environmental impact are monitored in accordance with the comprehensive monitoring program that has been approved by the Finnish environmental authorities. Work on enhancing the scrubbing of mill gases initiated in 2012 was postponed to 2014 due to reviews by authorities of the permit levels. There are no material environmental liabilities related to the Kittila mine.
Capital Expenditures
Capital expenditures at the Kittila mine during 2012 totaled approximately 59.9 million, which included paste backfill plant construction, mill modification, underground development, exploration and conversion drilling costs within the mining licence area and sustaining capital costs. The Company expects capital expenditures at the Kittila mine to be approximately $49 million in 2013, most of which will be used for mining equipment, development and construction of underground infrastructure and exploration and conversion drilling on the mining licence area.
Development
Open pit mining was completed at the Roura pit in April 2012 and at the Suurikuusikko pit in November 2012. A total of 492,178 tonnes of ore were mined from the Suurikuusikko pit and 86,130 tonnes of ore were mined from the Roura pit in 2012.
In 2012, underground development continued in both the Suurikuusikko and Rouravaara zones. 7,518 metres of ramp and sublevel access development was completed during the year. A total of 118,000 tonnes of ore from development and 523,000 tonnes of stope ore were mined in 2012. The Company expects to complete 8,223 metres of lateral development and 635 metres of vertical development during 2013.
Geology, Mineralization and Exploration
Geology
The Kittila mine is situated within the Kittila Greenstone belt, part of the Lapland Greenstone belt in the Proterozoic-age Svecofennian geologic province. The appearance and geology of the area is similar to that of the Abitibi region of the Canadian Shield. In northern Finland, the bedrock is typically covered by a thin but uniform blanket of unconsolidated glacial till. Bedrock exposures are scarce and irregularly distributed.
The mine area is underlain by mafic volcanic and sedimentary rocks metamorphosed to greenschist assemblages and assigned to the Kittila group. The major rock units trend north to north-northeast and are near-vertical. The volcanics are further sub-divided into iron-rich tholeiitic basalts (Kautoselka Formation) located to the west and magnesium-rich tholeiitic basalt, coarse volcaniclastic units, graphitic schist and minor chemical sedimentary rocks (Vesmajarvi Formation) located to the east. The contact between these two rock units consists of a transitional zone (the Porkonen Formation) varying between 50 and 200 metres in thickness. This zone is strongly sheared, brecciated and characterized by intense hydrothermal alteration and gold mineralization, features consistent with major brittle-ductile deformation zones. It includes the north-northeast-oriented Suurikuusikko Trend.
Mineralization
The Porkonen Formation hosts the Kittila gold deposit, which contains multiple mineralized zones stretching over a strike length of more than 25 kilometres. Most of the work has been focused on the 4.5-kilometre stretch that hosts the known gold reserves and resources. From north to south, the zones are Rimminvuoma ("Rimpi-S"), the deep extension of Rimminvuoma ("Rimpi Deep"), North Rouravaara ("Roura-N"), Central Rouravaara ("Roura-C"), depth extension of Rouravaara and Suurikuusikko ("Suuri/Roura Deep"), Suurikuusikko ("Suuri"), Etela and Ketola. The Suuri and Suuri/Roura Deep zones include several parallel sub-zones that have previously been referred to as Main East, Main Central and Main West. The Suuri zone hosts approximately 26% of the current probable gold reserve estimate on a contained-gold basis, while Suuri Deep has approximately 19%, Roura-C approximately 7%, Roura Deep approximately 22%, Roura-N approximately 1%, Rimpi Deep approximately 19%, Rimpi-S approximately 5%, Ketola approximately 1% and Etela approximately 0.2%.
Gold mineralization in these zones is associated with intense hydrothermal alteration (carbonate-albite-sulphide), and is almost exclusively refractory, locked inside fine-grained sulphide minerals: arsenopyrite (approximately 73%) or pyrite (approximately 23%). The rest is "free gold", which is manifested as extremely small grains of gold in pyrite.
48 AGNICO-EAGLE MINES LIMITED
Exploration
In 1986, the discovery of coarse visible gold in quartz-carbonate veining along a road cut near the village of Kiistala alerted the Geological Survey of Finland ("GTK") to the gold exploration potential of the area. Following this discovery, GTK initiated regional exploration over the area and deployed a wide range of indirect exploration tools to explore this relatively unexplored area. From 1987 to 2005, GTK, and later Riddarhyttan, undertook drilling programs and other testing on the property. After it acquired the property in 1998, Riddarhyttan continued to investigate the metallurgical properties of the refractory gold mineralization with the objective of demonstrating its recoverability and assessing suitable processing scenarios and initiated engineering and environmental studies to assess the feasibility of a mining project.
Diamond drilling is used for exploration on the Kittila property. Most of the work on the mining licence area has focused on the Suuri and Roura zones. As of December 31, 2012, a total of 2,625 drill holes, totalling 762,554 metres, have been completed on the property. In 2012, between three and eight drill machines worked on the Kittila property: one to two drills on underground infill drilling; two to six drills on mine exploration; and one to two drills on resource-to-reserve conversion drilling. A total of 330 drill holes were completed for a length of 70,897 metres. Of these drill holes, 232 (21,040 metres) were for definition drilling, 37 (7,959 metres) were for conversion drilling and 61 (41,898 metres) were related to mine exploration. Total expenditures for diamond drilling in 2012 were $16.2 million, including $2.8 million for definition and delineation drilling
In 2012, proven and probable gold reserves decreased by 0.4 million ounces to 4.8 million ounces (33.1 million tonnes of ore grading 4.49 grams per tonne). This decrease was primarily due to a combination of the introduction of more stringent criteria for determining the cut-off, a more conservative stope-design and production planning process and higher operating costs. The Rimpi Deep zone was the only zone where reserves increased (+0.9 million ounces) as a result of exploration drilling. Indicated mineral resources decreased by 5.1 million tonnes to 7.9 million tonnes of ore grading 2.65 grams per tonne. Inferred mineral resources increased by 11.0 million tonnes to 19.0 million tonnes of ore grading 3.88 grams per tonne.
A successful deep drilling program in 2012 at the Rimpi Deep zone, which is located immediately below the Rimpi-S zone, has converted a large amount of inferred resources into probable reserves in this area. The gold mineralization in Rimpi Deep is still open at depth and to the north.
A resource-to-reserve conversion drilling campaign was carried out at Suuri, Roura and Rimpi-S in 2012, which did not increase reserves significantly.
Outside of the Kittila mining licence area, systematic diamond drilling and target focused ground geophysics continued along the Suurikuusikko Trend, and a number of new targets were tested by diamond drilling. Encouraging results were obtained from new gold zones in the Kuotko West area located approximately 10 kilometres north of the Kittila mine site. A total of 44 diamond drill holes totalling 15,436 metres were drilled on exploration targets outside of the mining licence area in 2012.
The 2013 exploration budget for the Kittila mine is approximately $7.4 million ($6.2 million for minesite exploration and $1.2 million for resource-to-reserve conversion) and includes over 24,600 metres in diamond drilling (16,200 metres for minesite exploration and 8,400 metres for resource-to-reserve conversion), using up to four drills throughout the year to help further identify the gold reserve and resource potential of the Kittila property.
In addition, $2.6 million of exploration expenditures, including an estimated 11,000 metres of diamond drilling, is planned for exploration along the 25-kilometre Suurikuusikko Trend in 2013.
2012 ANNUAL REPORT 49
Pinos Altos Mine
The Pinos Altos mine achieved commercial production in November 2009. It is located on an 11,000-hectare property in the Sierra Madre gold belt, 285 kilometres west of the City of Chihuahua in the State of Chihuahua in northern Mexico. At December 31, 2012, the Pinos Altos mine, including the Creston Mascota deposit, was estimated to contain proven and probable mineral reserves of 2.7 million ounces of gold and 74.4 million ounces of silver comprised of 38.1 million tonnes of ore grading 2.21 grams of gold per tonne and 60.71 grams of silver per tonne. The Pinos Altos property is made up of two blocks: the Agnico Eagle Mexico Concessions (22 concessions, 26,810.2 hectares), and the Pinos Altos Concessions (18 concessions, 5,053.1 hectares).
Location Map of the Pinos Altos Mine (as at December 31, 2012)
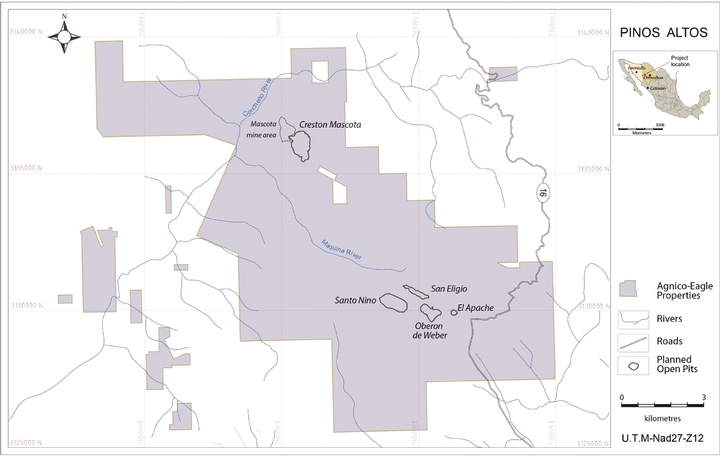
Approximately 74% of the current Pinos Altos mineral reserves and resources are subject to a net smelter royalty of 3.5% payable to Pinos Altos Explotación y Exploración S.A. de C.V. ("PAEyE") and the remaining 26% of the current mineral reserves and resources at Pinos Altos are subject to a 2.5% net smelter return royalty payable to the Consejo de Recursos Minerales, a Mexican Federal Government agency. After 2029, this portion of the property will also be subject to a 3.5% net smelter return royalty payable to PAEyE.
The assets acquired by the Company from PAEyE in 2006 included the right to use up to 400 hectares of land for mining installations for a period of 20 years after formal mining operations have been initiated. The Company also obtained sole ownership of the Agnico Eagle Mexico Concessions previously owned by Compania Minera La Parreña S.A. de C.V. During 2008, the Company and PAEyE entered into an agreement under which the Company acquired further surface rights for open pit mining operations and additional facilities. Infrastructure payments, surface rights payments and advance royalty payments totalling $35.5 million were made to PAEyE in 2009 as a result of this agreement.
In 2006, the Company concluded negotiations with communal land owners (ejidos) and others for the purchase of 5,745 hectares of land contained within the Agnico Eagle Mexico and Pinos Altos Concessions. In addition, a temporary occupation agreement with a 30-year term expiring in 2036 was negotiated with ejido Jesus del Monte for 1,470 hectares of land covered by these same concession blocks. The acquisition of these surface rights for the geologically prospective lands within the district surrounding the Pinos Altos property will facilitate future exploration and mining development in these areas.
50 AGNICO-EAGLE MINES LIMITED
The Pinos Altos mine is directly accessible by a paved interstate highway that links the cities of Chihuahua and Hermosillo and is connected to a state power grid that is within ten kilometres of the Pinos Altos property. The Company anticipates existing and planned underground mine workings will intercept water resources sufficient to sustain the requirements for future operation. The land position is sufficient for construction of all planned surface, infrastructure and mining facilities at the Pinos Altos mine, including its tailings impoundment area. The Company further believes that a sufficient local and trained workforce is available in northern Mexico to continue to support the operation of the mine.
The Pinos Altos property is characterized by moderate to rough terrain with mixed forest (pine and oak) and altitudes that vary from 1,770 metres to 2,490 metres above sea level. The climate is sub-humid, with about one metre of annual precipitation. The average annual temperature is 18.3 degrees Celsius. Exploration and mining work can be carried out year-round.
In August 2007, on the basis of an independently reviewed feasibility study, the Company approved construction of a mine at Pinos Altos. The mine achieved commercial production in November 2009.
Combined production from the Pinos Altos mine and the nearby Creston Mascota deposit was 234,837 payable ounces of gold and 2,312,013 payable ounces of silver in 2012 at total cash costs per ounce of gold of $286. In 2013, combined gold production from the Pinos Altos mine and the Creston Mascota deposit is expected to be approximately 191,000 ounces and silver production is expected to be approximately 2,263,841 ounces. Total cash costs per ounce of gold are forecast at approximately $300. Under the current mine plan, from 2013 to 2029, combined gold production from the Pinos Altos mine, including the Creston Mascota deposit, is expected to average approximately 154,000 ounces of gold per year.
Based on a feasibility study prepared in 2009, the Company decided to build a stand-alone heap leach operation at the satellite open pit Creston Mascota deposit. Creston Mascota is expected to produce approximately 51,489 ounces of gold per year during the next five years (2013-2017). Capital costs in connection with the project were approximately $65 million. The first gold pour from the Creston Mascota deposit occurred on December 28, 2010 and commercial production from the Creston Mascota deposit was achieved in the first quarter of 2011. On September 30, 2012, a movement of ore material was detected on the lower levels of the Creston Mascota leach pad (Phase 1). As a result of this movement, leaching operations were temporarily suspended at Creston Mascota until the upper level of the leach pad (Phase 2) could be prepared as an isolated containment area. These modifications are expected to be completed in early 2013 and resumption of leaching operations is expected during the second quarter of 2013. The Company continues to evaluate opportunities to develop other mineral resources that have been identified in the Pinos Altos area as satellite operations.
The Company has engaged the local communities in the project area with hiring, local contracts, education support and medical support programs to ensure that the project provides long-term benefits to the residents living and working in the region. Approximately 70% of the operating workforce at Pinos Altos are locally hired and 100% of the permanent workforce at the Company operations in Mexico are Mexican nationals.
2012 ANNUAL REPORT 51
Mining and Milling Facilities
Surface Plan of the Pinos Altos Mine (as at December 31, 2012)
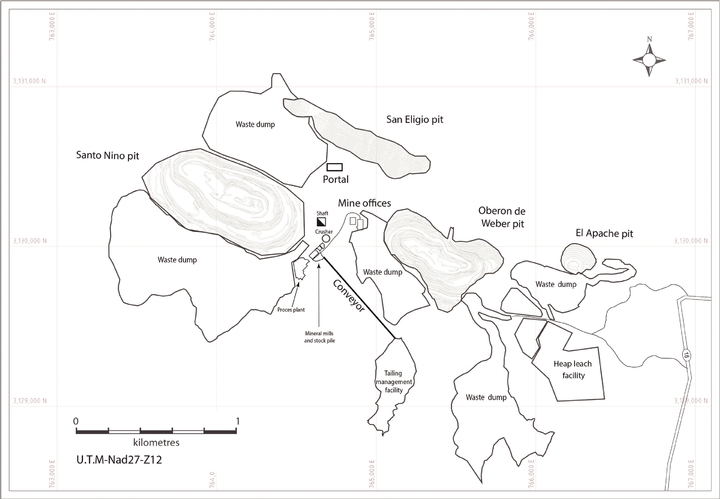
52 AGNICO-EAGLE MINES LIMITED
Surface Plan of the Creston Mascota Deposit (as at December 31, 2012)
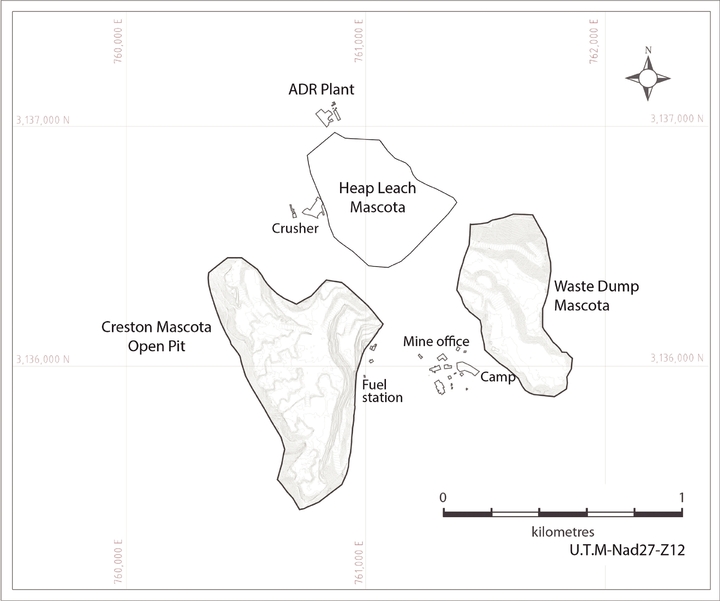
Milling operations during 2012 at Pinos Altos averaged 5,020 tonnes processed per day as compared to the design expectation of 4,000 tonnes per day. The underground mine at Pinos Altos produced an average 3,193 tonnes of ore per day as compared to the design expectation of 3,000 tonnes per day. The open pit mines at Pinos Altos and the Creston Mascota deposit produced 23,465,263 tonnes of ore, overburden and waste in 2012, which met the expectation of the mine plan for the year.
Mining Methods
The surface operations at the Pinos Altos mine use traditional open pit mining techniques with bench heights of seven metres and double benches on the footwall and single benching on the hanging wall. Mining is accomplished with front end loaders, trucks, track drills and various support equipment. Based upon geotechnical evaluations, the final pit slopes will vary between 45 degrees and 50 degrees. Performance at the open pit mining operation at Pinos Altos during 2012 continues to indicate that the equipment, mining methods and personnel selected for the project are satisfactory for future production phases. 16,007,364 tonnes of ore, overburden and waste were mined during 2012, exceeding the expected production for the year by 2%.
The underground mine, which commenced operations in the second quarter of 2010, uses the long hole sublevel stoping method to extract the ore. The Company has considerable expertise with this mining method, having used the same method at the LaRonde mine in Quebec. This method has also been used at various other Mexican mining operations. The stope height is planned at 30 metres and the stope width at 15 metres. Ore is hauled to the surface utilizing underground trucks via a ramp system. The paste backfill system and ventilation system were commissioned in the fourth quarter of
2012 ANNUAL REPORT 53
2010 and are now fully operational. During 2012, approximately 1,155,200 tonnes of ore were produced from the underground portion of the mine, averaging 3,164 tonnes per day. Currently, the full capacity of the underground mine is 3,000 tonnes of ore per day. However, construction of a shaft hoisting facility to increase the mining capacity to 4,500 tonnes of ore per day was initiated in 2012, with completion of this project expected in 2016. The shaft hoisting capacity will reduce the number of underground trucks required and will continue to maintain mill feed rates at 4,500 tonnes per day in future years as the open pit mines at Pinos Altos become depleted. Approximately 30 kilometres of total lateral development have been completed as of December 31, 2012.
Surface Facilities
The principal mineral processing facilities at the Pinos Altos mine are designed to process 4,000 tonnes of ore per day in a conventional process plant circuit which includes single stage crushing, grinding in a SAG and ball mill in closed loop, gravity separation followed by agitated leaching, counter current decantation and metals recovery in the Merrill-Crowe process. Tailings are detoxified and filtered and then used for paste backfill in the underground mine or deposited as dry tailings in an engineered tailings impoundment area. The Pinos Altos mill processed an average of 5,033 tonnes of ore per day during 2012. Low grade ore at Pinos Altos is processed in a heap leach system designed to accommodate approximately five million tonnes of mineralized material over the life of the project. The production from heap leach operations is expected to be relatively minor, contributing about 5% of total metal production planned for the life of the mine.
As noted above, a separate heap leach operation and ancillary support facilities were built at the Creston Mascota deposit, which is designed to process approximately 4,000 tonnes of ore per day in a three stage crushing, agglomeration and heap leach circuit with carbon adsorption. This project began commissioning in the latter part of 2010, with commercial production achieved in the first quarter of 2011. During 2012, a total of 1,397,599 tonnes of ore were produced at the Creston Mascota deposit, averaging 3,819 tonnes per day. Based on early performance of the mine and process facilities at the Creston Mascota deposit, the equipment, mining methods and personnel are satisfactory for completion of the planned production phases. The Creston Mascota deposit is expected to produce approximately 53,000 ounces of gold per year during the six-year remaining projected mine life (2013-2018).
Surface facilities at the Pinos Altos mine include: a heap leach pad, pond, liner and pumping system; administrative support offices and change room facilities; camp facilities; a laboratory; a process plant shop; a maintenance shop; a generated power station; surface power transmission lines and substations; the engineered tailings management system; and a warehouse.
Over the life of the mine, recoveries of gold and silver in the milling circuit at Pinos Altos (other than from the Creston Mascota deposit) are expected to average approximately 93% and 48%, respectively. The Company anticipates precious metals recovery from low grade ore processed in the Pinos Altos heap leach facility will average about 68% for gold and 12% for silver. Heap leach recoveries for Creston Mascota ore are expected to average 71% for gold and 16% for silver.
Mineral Recoveries
During 2012, the Pinos Altos mill processed 1,837,333 tonnes of ore, averaging approximately 5,020 tonnes of ore treated per day and operating at approximately 90.6% of available time. The following table sets out the metal recoveries at the Pinos Altos mill in 2012.
| Head Grade |
Overall Metal Recovery |
Payable Production |
|||||
| Gold | 2.974 g/t | 94.0% | 165,056 oz | ||||
| Silver | 82.29 g/t | 44.0% | 2,124,334 oz | ||||
An additional 1,024,976 tonnes of ore were processed and placed on the heap leach pad at Pinos Altos in 2012, with an average grade of 0.74 grams of gold per tonne and 24.8 grams of silver per tonne. Cumulative metals recovery on the heap leach pad at Pinos Altos are 64.14% gold and 11.99% silver. Heap leach recovery is following the expected cumulative recovery curve and it is anticipated that the ultimate recovery of 68% for gold and 12% for silver will be achieved when leaching is completed.
54 AGNICO-EAGLE MINES LIMITED
An additional 1,532,364 tonnes of ore were processed and placed on the heap leach pad at the Creston Mascota deposit in 2012, with an average grade of 1.74 grams of gold per tonne and 14.77 grams of silver per tonne. Cumulative metals recovery on the heap leach pad at the Creston Mascota deposit are 54% gold and 7.61% silver. Heap leach recovery is following the expected cumulative recovery curve and it is anticipated that the ultimate recovery of 71% for gold and 16% for silver will be achieved when leaching is completed.
Total metal production (from mill and heap leach) at Pinos Altos, including the Creston Mascota deposit, during 2012 was 234,837 payable ounces of gold and 2,312,013 payable ounces of silver.
Environmental Matters
The Pinos Altos mine has received the necessary permit authorizations for construction and operation of a mine, including a Change of Land Use permit and an Environmental Impact Study approval from the Mexican environmental agency ("SEMARNAT"). As of December 31, 2012, all permits necessary for the operation of the Pinos Altos mine, including the operations at the Creston Mascota deposit, had been received. Pinos Altos uses the dry stack tailings technology to minimize the geotechnical and environmental risk that can be associated with the rainfall intensities and topographic relief in the Sierra Madre region of Mexico. All of the Mexican environmental regulatory requirements are expected to be met or exceeded by the Pinos Altos mine (including operations at the Creston Mascota deposit). Operations at Pinos Altos and the Creston Mascota deposit were deemed to qualify for the "Industria Limpia" (clean industry) designation by SEMARNAT in 2012.
Capital Expenditures
Capital expenditures at the Pinos Altos mine during 2012 were approximately $25.2 million. Capital expenditures at the Creston Mascota deposit during 2012 were approximately $2.0 million.
The Company expects sustaining and deferred capital expenditures at Pinos Altos to be approximately $62 million in 2013 with average sustaining and deferred capital of approximately $18 million per year for a projected mine life of approximately 17 years. Approximately $13 million in development capital is forecast at the Creston Mascota deposit in 2013, with sustaining capital expenditures of $5.4 million during its remaining six-year mine life.
Development
As of December 31, 2012, for the mine life to date, more than 92.7 million tonnes of ore, overburden and waste had been removed from the open pit mine at Pinos Altos and more than 30 kilometres of lateral development had been completed in the underground mine. At the Creston Mascota deposit, approximately 18.0 million tonnes of ore, overburden, and waste had been removed from the open pit mine as of December 31, 2012.
Geology, Mineralization and Exploration
Geology
The Pinos Altos mine is in the northern part of the Sierra Madre geologic province, on the northeast margin of the Ocampo Caldera, which hosts many epithermal gold and silver occurrences including the nearby Ocampo mining operation and Moris mine.
The property is underlain by Tertiary-age (less than 45 million years old) volcanic and intrusive rocks that have been disturbed by faulting. The volcanic rocks belong to the lower volcanic complex and the discordantly-overlying upper volcanic supergroup. The lower volcanic complex is represented on the property by the Navosaigame conglomerates (including thinly-bedded sandstone and siltstone) and the El Madrono volcanics (felsic tuffs and lavas intercalated with rhyolitic tuffs, sandy volcanoclastics and sediments). The upper volcanic group is made up of the Victoria ignimbrites (explosive felsic volcanics), the Frijolar andesites (massive to flow-banded, porphyritic flows) and the Buenavista ignimbrites (dacitic to rhyolitic pyroclastics).
Intermediate and felsic dykes as well as rhyolitic domes intrude all of these units. The Santo Nino andesite is a dyke that intrudes along the Santo Nino fault zone.
Structure on the property is dominated by a 10-kilometre by 3-kilometre horst, a fault-uplifted block structure oriented west-northwest, that is bounded on the south by the south-dipping Santo Nino fault and on the north by the north-dipping Reyna de Plata fault. Quartz-gold vein deposits are emplaced along these faults and along transfer faults that splay from the Santo Nino fault.
2012 ANNUAL REPORT 55
Mineralization
Gold and silver mineralization at the Pinos Altos mine consists of low sulphidation epithermal type hydrothermal veins and breccias. The Santo Nino structure outcrops over a distance of roughly six kilometres. It strikes at 060 degrees azimuth on its eastern portion and turns to strike roughly 090 degrees azimuth on its western fringe. The structure dips at 70 degrees towards the south. The four mineralized sectors hosted by the Santo Nino structure consist of discontinuous quartz rich lenses named from east to west: El Apache, Oberon de Weber, Santo Nino and Cerro Colorado.
The El Apache lens is the most weakly mineralized. The area hosts a weakly developed white quartz dominated breccia. Gold values are low and erratic over its roughly 750 metre strike length. Past drilling suggests that this zone is of limited extent at depth.
The Oberon de Weber lens has been followed on surface and by diamond drilling over an extent of roughly 500 metres. Shallow holes drilled by the Company show good continuity both in grade and thickness over roughly 550 metres. From previous drilling done by Penoles, continuity at depth appears to be erratic with a weakly defined western rake.
The Santo Nino lens is the most vertically extensive of these lenses. It has been traced to a depth of approximately 750 metres below surface. The vein is followed on surface over a distance of 550 metres and discontinuously up to 650 metres. Beyond its western and eastern extents, the Santo Nino andesite is massive and only weakly altered. Gold grades found are systematically associated with green quartz brecciated andesite.
The Cerro Colorado lens is structurally more complex than the three described above. Near the surface, it is marked by a complex superposition of brittle faults with mineralized zones which are difficult to correlate from hole to hole. Its relation to the Santo Nino fault zone is not clearly defined. Two deeper holes drilled by the Company suggest better grade continuity is possible at depth.
The San Eligio zone is located approximately 250 metres north of Santo Nino. The host rock is brecciated Victoria Ignimbrite, occasionally with stockworks. There is no andesite in this sector. Unlike the other lenses, the San Eligio lens dips towards the north. The lateral extent seems to be continuous for 950 metres. Its average width is five metres and never exceeds 15 metres. Surface mapping and prospecting has suggested good potential for additional mineralization on strike and at depths below 150 metres. Visible gold has been seen in the drill core.
Several other promising zones are associated with the horst feature in the northwest part of the property. The Creston Mascota deposit is 7 kilometres northwest of the Santo Nino deposit, and is similar, but dips shallowly to the west. The Creston Mascota deposit is about 1,000 metres long and 4 to 40 metres wide, and extends from surface to more than 200 metres depth. Ore production from the Creston Mascota deposit began in July 2010, with the first gold poured in December 2010 and commercial productions commencing in February 2011.
Exploration
In 2012, minesite exploration activities were primarily focused on definition and delineation of the resources at Santo Nino, Oberon de Weber, San Eligio and Creston Mascota. A total of 25.9 kilometres of minesite exploration drilling, 17.9 kilometres of definition drilling and 8 kilometres of delineation drilling were completed during the year. Regional exploration in 2012 focused on the Penasco Blanco, Veta Escalon, Veta Colorada and Veta Flor prospects. Diamond drilling consisted of 5.7 kilometres. More than 23,800 core samples and 5,220 rock samples were sent to a certified laboratory and assayed mainly for gold and silver.
The Cubiro mineralization is two kilometres west of the Creston Mascota deposit. Cubiro is a surface deposit that strikes northwest, has a steep dip and has been followed along strike for approximately 850 metres. Drilling has intersected significant gold and silver mineralization up to 30 metres wide. The Cubiro deposit is split by a fault that caused 200 metres of displacement to the west, which has been traced by drilling. The zone is still open to the southeast and possibly at depth.
The Sinter zone is 1,500 metres north-northeast of the Santo Nino zone and is part of the Reyna de Plata gold structure. The steeply dipping mineralization is four to 35 metres wide and almost 900 metres long, with over 350 metres of vertical depth. Sinter is being evaluated for its open pit mining and heap leach potential.
56 AGNICO-EAGLE MINES LIMITED
Other identified mineral resources in the Pinos Altos region include the Bravo and Carola zones adjacent to the Creston Mascota deposit and the Reyna de la Plata prospect further to the east. Exploration efforts will be allocated to these zones as the development continues at Pinos Altos and the Creston Mascota deposit.
In 2013, the Company expects to spend approximately $6.5 million on exploration at the Pinos Altos mine, including $3.5 million on 14,000 metres of conversion drilling and $3.0 million on 12,000 metres of exploration drilling.
La India Mine Project
Construction began at La India in September 2012 and commercial production is anticipated for the second quarter of 2014, three months ahead of the original plan. On average, the La India mine is expected to produce approximately 90,000 ounces of gold annually at total cash costs per ounce of approximately $500 over a mine life of approximately nine years. At December 31, 2012, the La India mine was estimated to contain proven and probable mineral reserves of 0.8 million ounces of gold comprised of 33.5 million tonnes of ore grading 0.72 grams per tonne.
The La India property consists of 43 mining concessions totalling approximately 56,000 hectares in the Mulatos Gold Belt. The La India mine project includes the Tarachi deposit and several other prospective targets in the belt. At Tarachi, indicated resources are 34.5 million tonnes grading 0.41 grams of gold per tonne and inferred resources are 72.0 million tonnes grading 0.38 grams of gold per tonne. A metallurgical testing program on Tarachi composite samples has been initiated.
Location Map of the La India Mine Project (as at December 31, 2012)
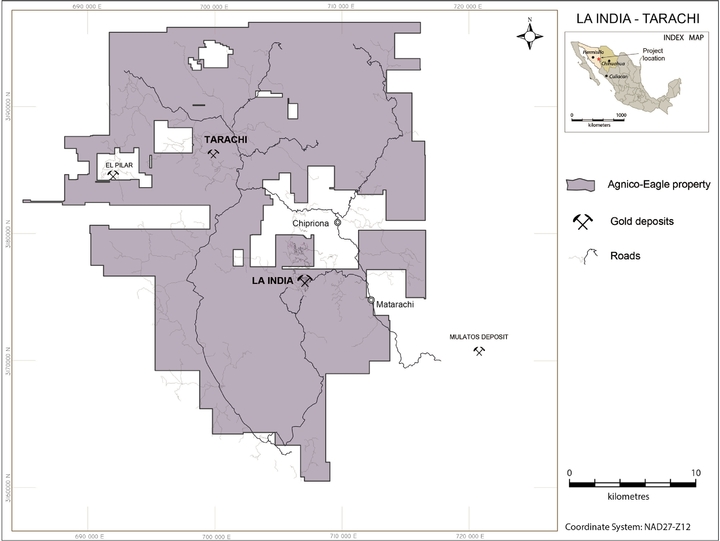
The Mulatos Gold Belt is part of the Sierra Madre gold and silver belt that also hosts the operating Mulatos gold mine immediately southeast of the La India property and the Pinos Altos mine and the Creston Mascota deposit 70 kilometres to the southeast.
2012 ANNUAL REPORT 57
The La India mine project is located in the municipality of Sahuaripa, southeastern Sonora State, between the small rural towns of Tarachi and Matarachi, which offer basic infrastructure in the form of roads, rural telephone service, small grocery stores and unpaved air strips. More services are available in the town of Sahuaripa located 60 kilometres by gravel road (approximately 2.5 hours) northwest of the La India mine project. The population of the district is estimated to be a few thousand, with most of the inhabitants involved in cattle ranching, farming, forestry and mining and exploration. An adequate supply of labour for mining operations can be drawn from the region. Trained exploration personnel for the La India mine project are mainly sourced from northern Mexico including Hermosillo, Sonora.
The closest major city with an international airport is Hermosillo, the capital of Sonora, located 210 kilometres west-northwest of the La India mine project. Road travel from Hermosillo to the site takes approximately seven hours. Alternatively, the project can be accessed by small aircraft. The Company anticipates that the power supply at the La India project will be provided by diesel generators.
The Company acquired the La India property in November 2011 as part of its acquisition of Grayd. Grayd had explored the property since 2004 and had prepared a preliminary economic assessment of the La India project in December 2010 based on a June 2010 NI 43-101-compliant resource estimate.
Infill drilling at La India from November 2011 to May 2012 allowed the Company to confirm and expand the mineral resources reported in the December 2010 preliminary economic assessment. On August 31, 2012, the Company completed a feasibility study for the construction of a multi-pit mine and heap leach operation on the La India deposit.
Engineering studies and operating and capital cost estimates were developed to exploit only the oxide mineralization at La India; there is no plan to mine sulphide minerals. Metallurgical test results indicate an overall gold recovery of 80%. Total cash costs are expected to be $497 per ounce of gold produced net of by-product silver credits. The pre-production capital cost is estimated at $157.6 million and the life of mine capital cost is expected to total $183.4 million.
As of December 31, 2012, the environmental permits required for construction of the mine had been obtained and the following advances had been achieved:
- •
- construction
camp was completed and contractors began construction of the sites for the crusher, leach pad/pond facilities, process plant, truck shop, warehouse, office and
permanent camp facilities;
- •
- surface
water rights were obtained to enable project water requirements to be secured through the construction of rain catchment ponds close to the project;
- •
- permission
was obtained to use the airstrip in the town of Tarachi (20 kilometres from the project site) to improve access to the project; and
- •
- the initial ramp-up of operating personnel and equipment.
The climate at La India is semi-arid with seasonal temperatures ranging from 35 degrees celsius to – 2 degrees celsius, and torrential rainfall from July to September. Exploration activities may be conducted year-round.
At the Tarachi deposit, the surface rights in the project area are owned by the Matarachi Ejido (agrarian community) and private parties. All measured, indicated and inferred project resources lie within privately owned or ejido possessed land. Surface access lease agreements have been executed with the property owners or possessors for all identified target areas. The existing agreements permit exploration activities only; if mining activity is contemplated in this exploration area the Company will require further negotiations to acquire the surface rights needed for project development.
Mining and Milling Facilities
Mining Methods
Operations at the La India mine will use traditional open pit mining techniques with bench heights of six metres with front end loaders, trucks, track drills and various support equipment. Based upon geotechnical evaluations, the final pit slopes will vary between 45 degrees and 50 degrees.
Surface Facilities
Current facilities at the La India mine project include an exploration camp and a construction camp. The power for the camps is supplied by diesel generators and water is supplied by a local spring and septic discharges are managed in their respective leach fields. Non-organic waste from the camp is disposed in the Matarachi Ejido landfill.
Construction of the mine began September 2012 and commercial production is expected the second quarter of 2014. The following surface plan details the ultimate mine layout showing ultimate pits and waste rock dump locations, roads, the leach pad and other infrastructure.
58 AGNICO-EAGLE MINES LIMITED
Surface Plan of the La India Mine Project (as at December 31, 2012)
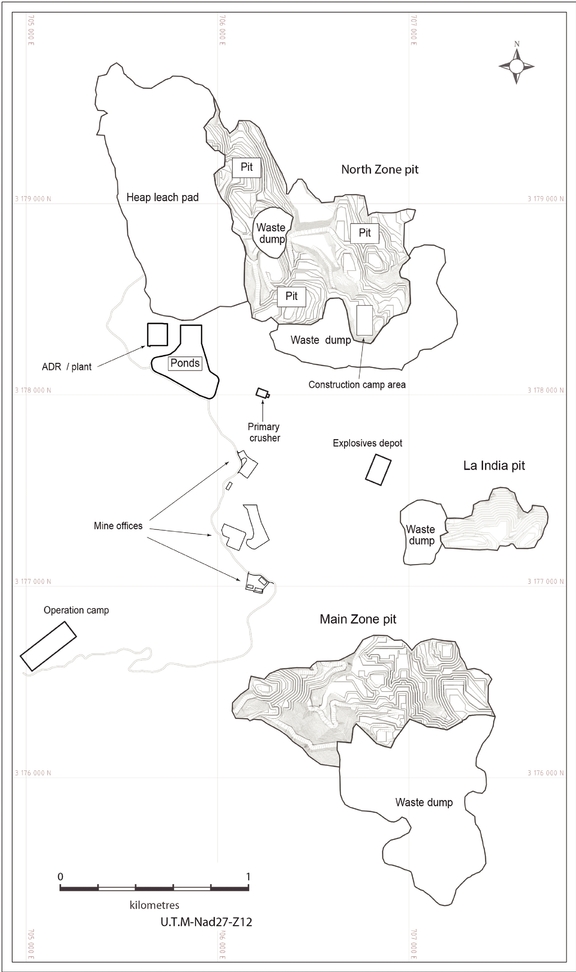
2012 ANNUAL REPORT 59
Surface facilities at the La India mine project include: a three-stage ore crushing facility; a 50 million tonne capacity lined heap leach pad with process ponds and pumping system; a carbon adsorption plant; a laboratory; a process plant shop; a mining equipment maintenance shop; a generated power station; surface power transmission lines and substations; a warehouse; administrative support offices; and camp facilities.
Environmental Matters
Baseline environmental information has been collected at the La India mine project since late 2008. This information includes surface water sampling, archeological assessment and soil, fauna and flora assessments.
The La India mine project is not located in an area with a special federal environmental protection designation. Both the Manifesto de Impacto Ambiental (an environmental impact statement) and Cambio de Uso de Suelo (a land use change permit) required for project development were granted by the authorities in 2012 once all the prerequisites were provided by the Company.
Some historic mining has been observed in the area but the remaining waste dumps and tailings are small and are not considered to present significant environmental issues.
Capital Expenditures
Pre-production capital cost at La India is estimated at $157.6 million and the life of mine capital cost is expected to amount to $183.4 million. Capital expenditures at the La India mine project during 2012 were approximately $39.2 million and the Company expects capital expenditures to be approximately $92 million in 2013.
Development
Mining at La India is scheduled to begin in late 2013 and early 2014 to achieve commercial production in the second quarter of 2014.
Agreements & Licences
The mining concessions for the La India mine project and Tarachi are controlled by the Company by means of direct ownership and by 11 separate agreements whereby Agnico-Eagle can earn a 100% interest in certain concessions by making cash and share payments. Payment has been made in full for the claims that host most of the measured, indicated and inferred resources. Some concessions are subject to underlying net smelter royalties varying between 1% and 3%, some of which may be purchased by the Company which would result in net smelter royalties of up to 0.5% remaining.
For the Tarachi deposit, payments totalling $3.3 million and shares with value equivalent to $967,500 over an eight year period are required for the Company to earn a 100% interest in the relevant concessions. To date, $1 million has been paid toward these concessions. Some concessions are subject to underlying net smelter royalties varying between 1% and 3%, some of which may be purchased by the Company, which would result in net smelter royalties of up to 0.5% remaining.
The defined mineral reserve and resource and all lands required for infrastructure for the La India mine project are wholly-contained within three privately-held properties which Agnico-Eagle has acquired in order to permit exploration, construction and mine development activities.
At the Tarachi deposit, the surface rights in the project area are owned by the Matarachi Ejido and private parties. All measured, indicated and inferred project resources lie within privately owned or ejido possessed land. Surface access lease agreements have been executed with the property owners or possessors for all identified target areas. The existing agreements permit exploration activities only, further negotiation would be required for any future mine development at the Tarachi deposit.
Geology, Mineralization and Exploration
Geology and Mineralization
The La India mine project lies within the Sierra Madre Occidental ("SMO") province, an extensive Eocene to Miocene volcanic field from the United States-Mexico border to central Mexico. The La India mine project lies within the western limits of the SMO in an area dominated by outcrops of andesite and dacitic tuffs, overlain by rhyolites and rhyolitic tuffs that were affected by large-scale north-northwest-striking normal faults and intruded by granodiorite and diorite stocks. Incised fluvial canyons cut the uppermost strata and expose the Lower Series volcanic strata.
60 AGNICO-EAGLE MINES LIMITED
The project area is predominantly underlain by a volcanic sequence comprised of andesitic and felsic extrusive volcanic strata with interbedded epiclastic volcaniclastic strata of similar composition. The mineral occurrences present in the project area, and the deposit type being sought, are volcanic-hosted epithermal, high-sulphidation gold-silver deposits. Such deposits may be present as veins and/or disseminated deposits. The La India mine project deposit area is one of several high-sulphidation epithermal mineralization centres recognized in the region.
Epithermal high-sulphidation mineralization at the La India mine project developed as a cluster of gold zones (Main and North) aligned north-south within a genetically related zone of hydrothermal alteration in excess of 20 square kilometres in area. Gold mineralization is confined to the Late Eocene rocks within zones of intermediate and advanced argillitic alteration originally containing sulphides, and subsequently oxidized by supergene processes. The North and Main zones are within two kilometres of each other.
Surface outcrop mapping and drill-hole data so far indicate that the gold system at the Tarachi deposit is likely best classified as a gold porphyry deposit.
Exploration
Gold was discovered at the Mulatos deposit by the Spanish colonials in 1806, but indigenous peoples likely exploited the native-gold-bearing oxidized zone of the deposit prior to this. Small underground mines and prospects are present throughout the La Cruz and La Viruela areas, where modern exploration was conducted by New Golden Sceptre Minerals Ltd. and New Goliath Minerals Ltd. (late 1980s), Noranda Inc. (early 1990s) and San Fernando Mining Co. Ltd. (from 1993).
Grayd began to actively explore the project in 2004, including geologic mapping, geochemical rock chip sampling, airborne and ground geophysical surveys, photogrammetric topographic mapping, diamond drilling, reverse circulation drilling, baseline environmental studies and metallurgical testing. Newmont Mining Corp. funded the work between July 2005 and July 2006 and then declined to continue, retaining no interest in the property. The Tarachi deposit, located approximately 10 kilometres north of the La India mine project on the same property, was discovered in 2010.
From 2004 through February 7, 2011, Grayd completed 129 diamond drill holes (13,834 metres) and 560 reverse circulation drill holes (49,552 metres) at the La India mine project. In 2011, 13 diamond drill holes (1,119 metres) and 30 reverse circulation drill holes (2,728 metres) were drilled at the La India mine project and 25 diamond drill holes (5,400 metres) and 67 reverse circulation drill holes (16,144 metres) were drilled at the Tarachi deposit.
The Company expects to spend approximately $2.0 million on exploration at the La India mine project in 2013, which will include drilling the underlying sulphide extensions and the Viruela and Cerro de Oro areas.
From the acquisition of Grayd in November 2011 until December 31, 2012, the Company completed 246 diamond drill holes (19,268 metres) and 108 reverse circulation drill holes (10,460 metres) at the La India mine project, and 42 diamond drill holes (11,190 metres) and 25 reverse circulation drill holes (7,170 metres) at the Tarachi deposit.
The Company expects to spend approximately $6.0 million on exploration at the Tarachi deposit in 2013.
Meadowbank Mine
The Meadowbank mine, which achieved commercial production in March 2010, is located in the Third Portage Lake area in the Kivalliq District of Nunavut in northern Canada, approximately 70 kilometres north of Baker Lake. At December 31, 2012, the Meadowbank mine was estimated to contain proven and probable mineral reserves of 2.3 million ounces of gold comprised of 25.3 million tonnes of ore grading 2.82 grams of gold per tonne. The Company acquired its 100% interest in the Meadowbank mine in 2007 as the result of the acquisition of Cumberland (see "– History and Development of the Company").
The fresh water required for domestic camp use, mining and milling is obtained from the intake barge at Third Portage Lake. Power is supplied by a 29-megawatt diesel electric power generation plant with heat recovery.
2012 ANNUAL REPORT 61
Location Map of the Meadowbank Mine (as at December 31, 2012)
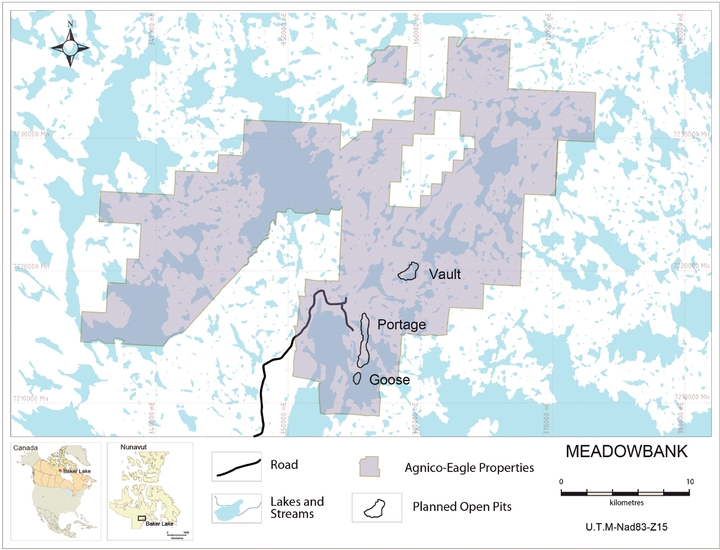
The Meadowbank mine is held under ten Crown mining leases, three exploration concessions and 40 Crown mineral claims. The Crown mining leases, which cover the Portage, Goose and Goose South deposits, are administered under federal legislation. The mining leases, which have renewable ten-year terms, have no annual work commitments but are subject to annual rent fees that vary according to their renewal date. The mining leases cover approximately 7,400 hectares and expire in either 2016 or 2019. The production lease with the KIA is a surface lease covering 1,354 hectares and requires payment of C$127,800 annually. Production from subsurface lease areas is subject to a royalty of up to 14% of the adjusted net profits, as defined in the Territorial Mining Regulations. In order to conduct exploration on the Inuit-owned lands at Meadowbank, the Company must receive approval for an annual work proposal from the KIA, the body that holds the surface rights in the Kivalliq District and administers land use in the region through various boards. The Nunavut Water Board (the "NWB"), one such board, provided the recommendation to Aboriginal Affairs and Northern Development Canada to grant the Meadowbank mine's construction and operating licences in July 2008. The Company has obtained all of the approvals and licences required to build and operate the Meadowbank mine.
The three Meadowbank exploration concessions comprise approximately 23,126 hectares and are granted by Nunavut Tunngavik Inc., the corporation responsible for administering subsurface mineral rights on Inuit-owned lands in Nunavut. Exploration concessions cover the Vault deposit at Meadowbank and in 2013 will require annual rental fees of approximately C$92,924 and exploration expenditures of approximately C$696,930. During the exploration phase, the concessions can be held for up to 20 years and the concessions can be converted into production leases with annual fees of C$1 per hectare, but no annual work commitments. Production from the concessions is subject to a 12% net profits interest royalty from which annual deductions are limited to 85% of the gross revenue.
62 AGNICO-EAGLE MINES LIMITED
In 2012, the Company signed a production lease with Nunavut Tunngavik Inc. covering the extraction and processing of gold from the Vault deposit. This lease authorizes the Company to mine and process gold from the Vault deposit and sets in place royalty payments that are equivalent to those being paid by the Company at the Portage and Goose pits.
The 40 Crown mineral claims cover approximately 36,433 hectares at Meadowbank and are subject to land fees and work commitments. Land fees are payable only when work is filed. The most recent filing was in 2012, when approximately C$8,998 in land fees were paid and C$5,491,178 in assessment work was submitted.
The Kivalliq region in which the Meadowbank mine is located has an arid arctic climate. The Meadowbank property is situated in an area characterized by low, rolling hills that are covered predominantly in heath tundra with numerous lakes and ponds. All of the open pit mines operate beneath the water level of adjacent lakes and use dykes to prevent water inflow. Elevation ranges from approximately 130 metres at lakeshores up to 200 metres on ridge crests. Operations at the Meadowbank mine are expected to be year-round with only minor weather-related interruptions to mining operations; however, these interruptions are not expected to affect ore availability for milling operations or other operating activities.
The Meadowbank mine is accessible from Baker Lake, located 70 kilometres to the south, over a 110-kilometre all-weather road completed in March 2008. Baker Lake provides 2.5 months of summer shipping access via Hudson Bay and year-round airport facilities. The Meadowbank mine also has a 1,100-metre long gravel airstrip, permitting access by air. The Company uses ocean transportation for fuel, equipment, bulk materials and supplies from Montreal, Quebec, (or Hudson Bay port facilities) via barges and ships into Baker Lake during the summer port access period that starts at the end of July in each year. Fuel and supplies are transported year-round to the site from Baker Lake by conventional tractor trailer units. Transportation for personnel and air cargo are provided on scheduled or chartered flights. The permanent bases for employees from which to service the Meadowbank mine are Val D'Or and Montreal in Quebec and the Kivalliq communities. Since February 2009, all chartered flights have landed directly at Meadowbank.
The Meadowbank mine achieved commercial production in March 2010 and produced 366,030 ounces of gold in 2012 at total cash costs per ounce of $913. In 2013, total cash costs at Meadowbank are expected to be approximately $1,000 per ounce.
In 2013, payable gold production at Meadowbank is expected to be approximately 362,172 ounces. The expected mine life is up to 2018.
2012 ANNUAL REPORT 63
Mining and Milling Facilities
Surface Plan of the Meadowbank Mine (as at December 31, 2012)
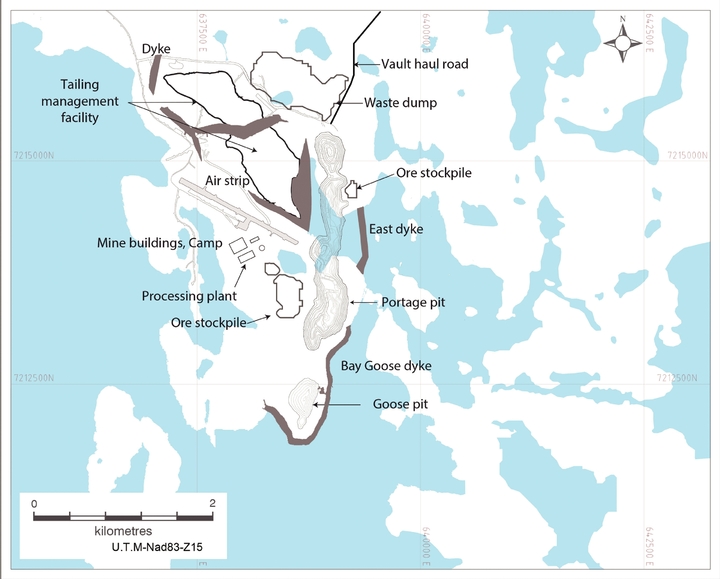
64 AGNICO-EAGLE MINES LIMITED
Surface Plan of the Vault Deposit (as at December 31, 2012)
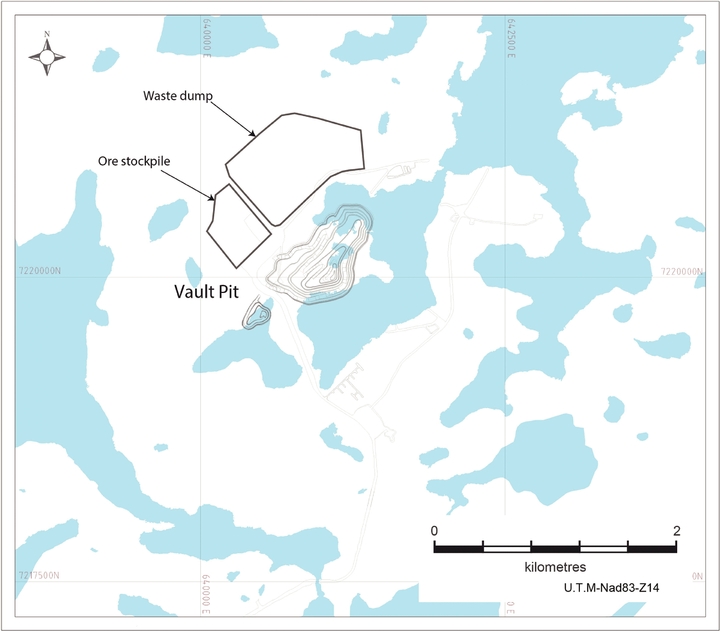
Meadowbank has three major deposits that have sufficient drilling definition to sustain reserves: Portage, Goose and Vault. By the end of 2009, all of the camp infrastructure (dormitories and kitchen), a mill, a service building shop and generator buildings were built. All required aggregates used in the mining process are produced from waste material taken from the north end of the Portage pit. In 2008, a dewatering dyke was constructed in order to access the north half of the Portage pit in preparation for production in 2010. Construction of the Bay-Goose dyke, a major dewatering dyke required to access the southern portion of the Portage and the Goose pits, commenced in the summer of 2009 and was completed in the spring of 2011. Three tailings impoundment dykes, Saddle Dam 1, Saddle Dam 2 and Stormwater Dykes, were built in 2009 and 2010. Also, the first phase of the main tailings impoundment dyke, Central Dyke, was started in 2012 and will be in construction for the duration of the mine life. The eight-kilometre long access road to the Vault pit was started in 2011 and completed in 2012.
Mining Methods
Mining at the Meadowbank mine is done by open pit with trucks and excavators. The ore is extracted conventionally using drilling and blasting, then hauled by trucks to a primary gyratory crusher adjacent to the mill. The marginal-grade material (material grading under the cut-off grade at a gold price of $1,490 per ounce but which has the potential to increase the reserves at the end of the mine life if the metal prices justify its processing) is stockpiled separately. Also, low-grade material stockpiles (material that has been extracted but currently is lower than the mill feed grade) were created. This low-grade material is processed when the mining fronts cannot supply enough material to the mill. Waste rock is hauled to
2012 ANNUAL REPORT 65
one of two waste storages on the property, used for dyke construction or construction material or backfilled into the mined out area.
Mining first commenced in the Portage pit in 2010 and in the Goose pit in March 2012, and is scheduled to commence in the Vault pit in 2014.
Surface Facilities
The accommodations complex at the Meadowbank mine consists of a permanent camp and a temporary camp to accommodate extra workers. The camp is supported with a sewage treatment, solid waste disposal and potable water plant. In 2008, the exploration group was relocated eight kilometres south of the minesite location to a separate camp with an 80-person capacity. A major fire in March 2011 destroyed the kitchen facilities at the Meadowbank mine. New kitchen facilities were built in the summer of 2011 and commissioned in December 2011.
Plant site facilities include a mill building, a maintenance mechanical shop building, a generator building, an assay lab and a heavy vehicle maintenance shop. A structure comprised of two separate crushers flank the main process complex. Power is supplied by an 29-megawatt diesel electric power generation plant with heat recovery and an onsite fuel storage (5.6 million litres) and distribution system. The mill-service-power complex is connected to the accommodations complex by enclosed corridors. In addition, the Company is building peripheral infrastructure including tailings and waste impoundment areas. In January 2012, the Company identified naturally occurring asbestos fibres in dust samples taken from the secondary crusher building at the Meadowbank mine and subsequently found small concentrations of fibres in the ore coming from certain areas of the open pit mines. The Company has instituted additional monitoring and an asbestos management program at the site to ensure that asbestos levels are within applicable territorial, regulatory and industry standards.
Facilities constructed at Baker Lake include a barge landing site located three kilometres east of the community and a storage compound. A fuel storage and distribution complex with a 60-million litre capacity has been built next to the barge landing facility.
In 2013, new facilities will be built near the Vault deposit as a result of the remoteness of this pit (the Vault deposit is located approximately 8 kilometres from the mine complex). The new facilities will include a refuge, a storage area, a fuel farm, an electrical power generation plant and a water treatment plant.
The process design is based on a conventional gold plant flowsheet consisting of two-stage crushing, grinding, gravity concentration, cyanide leaching and gold recovery in a CIP circuit. The mill is designed for year-round operations with a design capacity of 9,800 tonnes per day. The overall gold recovery is projected to be approximately 92.8%, based on projections from metallurgical test work, with approximately 15% typically recovered in the gravity circuit.
The run-of-mine ore is transported to the crusher using an off-road truck. The ore is dumped into the gyratory crusher or into designated ore-type stockpiles. The product from the primary crusher is conveyed to the cone crusher in closed circuit with a vibrating screen. The crushed ore is delivered to the coarse ore stockpile and ore from the stockpile is conveyed to the mill. The grinding circuit is comprised of a primary SAG mill operated in open circuit and a secondary ball mill operated in closed circuit with cyclones. A portion of the cyclone underflow stream is sent to the concentrator, which separates the heavy minerals from the ore. The grinding circuit incorporates a gravity process to recover free gold and the free gold concentrate is leached in an intensive cyanide leach-direct electrowinning recovery process.
The cyclone overflow is sent to the grinding thickener. The clarified overflow is recycled to the grinding circuit and thickened underflow is pumped to a pre-aeration and leach circuit. The cyanide circuit consists of seven tanks providing approximately 42 hours retention time. The leached slurry flows to a train of six CIP tanks. Gold in the solution flowing from the leaching circuit is adsorbed into the activated carbon. Gold is recovered from the carbon in a Zadra elution circuit and is recovered from the solution using an electrowinning recovery process. The gold sludge is then poured into dore bars using an electric induction furnace.
The CIP tailings are treated for the destruction of cyanide using the standard sulphur-dioxide-air process. The detoxified tailings are then pumped to the permanent tailings facility. The tailings storage is designed for zero discharge, with all process water being reclaimed for re-use in the mill to minimize water requirements.
Mineral Recoveries
Gold recoveries are expected to average 92.8% for all deposits. The different ore zones have slightly different grind sensitivities to gold recovery and, as such, different particle size distributions are recommended as target grinds in the
66 AGNICO-EAGLE MINES LIMITED
process. The use of a slightly coarser grind for the Vault ores will allow all three of the ore zones to be processed at a consistent process throughput.
During 2012, gold recovery averaged 93.91%. Approximately 3,820,000 tonnes of ore were processed, averaging 10,440 tonnes of ore per day with the mill operating 94.1% of available time. The following table sets out the metal recoveries for the 3,200,000 tonnes of ore extracted at the Meadowbank mine in 2012. Mill processing exceeded extraction from the mine in 2012; 346,000 tonnes came from the marginal stockpile and 274,000 tonnes from the low-grade stockpile.
| Head Grade |
Overall Metal Recovery |
Payable Production |
|||||
| Gold | 3.18 g/t | 93.91% | 366,030 oz | ||||
Environmental Matters (including Inuit Impact and Benefit Agreement)
The development of the Meadowbank mine was subject to an extensive environmental review process under the Land Claims Agreement administered by the Nunavut Impact Review Board (the "NIRB"). On December 30, 2006, a predecessor to the Company received the Project Certificate from the NIRB, which included the terms and conditions to ensure the environmental integrity of the development process. Subsequently, in July 2008, the Company received a water licence from the NWB for construction and operation of the mine subject to additional terms and conditions. Both authorizations were approved by the then Minister of Aboriginal Affairs and Northern Development Canada.
In February 2007, a predecessor to the Company and the Nunavut government signed a Development Partnership Agreement (the "DPA") with respect to the Meadowbank mine. The DPA provides a framework for stakeholders, including the federal and municipal governments and the KIA, to maximize the long-term socio-economic benefits of the Meadowbank mine to Nunavut.
An IIBA for the Meadowbank mine (the "Meadowbank IIBA") was signed with the KIA in March 2006. This agreement was renegotiated and a revised Meadowbank IIBA was signed on October 18, 2011. The Meadowbank IIBA ensures that local employment, training and business opportunities arising from all phases of the project are accessible to the Kivalliq Inuit. The Meadowbank IIBA also outlines the special considerations and compensation that must be provided to the Inuit regarding traditional, social and cultural matters.
The Company currently holds a renewable exploration lease from the KIA that expires December 31, 2015. In July 2008, the Company signed a production lease for the construction and the operation of the mine, the mill and all related activities. In April 2008, the Company and the KIA signed a water compensation agreement for the Meadowbank mine addressing Inuit rights under the Land Claims Agreement respecting compensation for water use and water impacts associated with the project.
The Meadowbank mine consists of three gold-bearing deposits: Portage, Goose and Vault. A series of four dykes have been built to isolate the mining activities at the Portage and Goose deposits from neighbouring lakes. An additional dyke will be built in 2013 to isolate the mining activities at the Vault deposit. Waste rock from the Portage, Goose Island and Vault pits is primarily stored in the Portage and Vault rock storage facilities, and a portion of the waste is placed in the Portage Pit. The control strategy to minimize the onset of oxidation and the subsequent generation of acid mine drainage includes freeze control of the waste rock through permafrost encapsulation and capping with an insulating convective layer of neutralizing rock (ultramafic and non-acid generating volcanic rocks). The Vault rock storage facility does not require an insulating convective layer due to the non-acid generating nature of the rock in that area. Waste rock deposited in the Portage pit will be covered with water during the closure phase flooding of the pit which will prevent any acid generation. Because the site is underlain by about 450 metres of permafrost, the waste rock below the capping layer is expected to freeze, resulting in low (if any) rates of acid rock drainage generation in the long term.
Tailings are stored in the dewatered portion of the Second Portage Lake. The tailings are deposited on tailings beaches within a two cell tailings storage facility. A reclamation pond is located within the tailings storage facility. The control strategy to minimize water infiltration into the tailings storage facility and the migration of constituents out of the facility includes freeze control of the tailings through permafrost encapsulation and through comprehensive, engineered dyke
2012 ANNUAL REPORT 67
liners. A four-metre-thick dry cover of acid neutralizing ultramafic rock backfill will be placed over the tailings as an insulating convective layer to confine the permafrost active layer within relatively inert tailings materials.
The water management objective for the project is to minimize the potential impact on the quality of surface water and groundwater resources at the site. Diversion ditches were constructed in 2012 to avoid the contact of clean runoff water with areas affected by the mine or mining activities. Contact water originating from affected areas is intercepted, collected, conveyed to the tailings storage facility or a site attenuation pond for re-use in process or decanted to treatment for removal of solids (if needed) prior to release to the Third Portage Lake.
Capital Expenditures/Development
A total of $86 million has been budgeted to be spent at the Meadowbank mine (excluding exploration) in 2013, including $55 million on dyke construction, $25.6 million on sustaining capital and equipment and $1.4 million on construction projects carried over from 2012. As well, $2.2 million has been budgeted to complete 11,500 metres of delineation drilling in the starter pit and an additional $0.8 million to complete 3,500 metres of diamond drilling in the Vault East deposit area in order to define additional resources. It is also expected that there will be 5,000 metres of diamond drilling representing $1 million to continue testing the goose underground structure below the ultimate pit. Regional exploration in the Meadowbank area has been budgeted at $1.8 million and will include 4,000 metres of exploration diamond drilling.
The Meadowbank mine started production in 2010. Total capital costs of construction incurred since the date of acquisition by the Company amounted to $1.1 billion as at December 31, 2012. The remaining mine life is expected to be five years.
Geology, Mineralization and Exploration
Geology
The Meadowbank mine comprises a number of Archean-age gold deposits hosted within polydeformed volcanic and sedimentary rocks of the Woodburn Lake Group, part of the Western Churchill supergroup in northern Canada.
Three minable gold deposits – Goose, Portage and Vault – have been discovered along the 25-kilometre long Meadowbank gold trend, and the PDF deposit (a fourth deposit) has been outlined on the northeast gold trend. These known gold resources are within 225 metres of the surface, making the project amenable to open pit mining.
Mineralization
The predominant gold mineralization found in the Portage and Goose deposits is associated with iron sulfides, mainly pyrite and pyrrhotite, which occur as a replacement of magnetite in the oxide facies iron formation host rock. To a lesser extent, pyrite and chalcopyrite may be found and, on rare occasions, arsenopyrite may be associated with the other sulphides. Gold is mainly observed in native form (electrum), occurring in isolated specs or as plating around sulfide grains. The ore zones are typically 6-7 metres wide, following the contacts between the iron formation units and the surrounding host rock. Zones extend up to several hundred metres along strike and at depth. The sulphides primarily occur as replacement of the primary magnetite layers, as well as narrow stringers or bands of disseminated sulphides that almost always crosscut the main foliation and/or bedding which would imply an epigenetic mode of emplacement. The percentage of sulphides is quite variable and may range from trace to semi-massive amounts over several centimetres to several metres in length. The higher gold grades and the occasional occurrence of visible gold are almost always associated with greater than 20% sulphide content.
The main mineralized banded iron formation unit is bounded by an ultramafic unit to the west which locally occurs interlayered with the banded iron formation and to the east by an intermediate to felsic metavolcaniclastic unit.
In the Vault deposit, pyrite is the principal ore-bearing sulphide. The disseminated sulphides occur along sheared horizons that have been sericitized and silicified. These zones are several metres wide and may continue for hundreds of metres along strike and down dip.
Three of the four known gold deposits are currently planned to be mined. The Goose Island and Portage deposits are hosted within highly deformed, magnetite-rich iron formation rocks, while intermediate volcanic rock assemblages host the majority of the mineralization at the more northerly Vault deposit. The fourth deposit, PDF, shows the same characteristics as Vault, though it is not currently anticipated to be a mineable deposit.
68 AGNICO-EAGLE MINES LIMITED
Defined over a 1.85-kilometre strike length and across lateral extents ranging from 100 to 230 metres, the geometry of the Portage deposit consists of general north-northwest-striking ore zones that are highly folded. The mineralization in the lower limb of the fold is typically six to eight metres in true thickness, reaching up to 20 metres in the hinge area.
The Goose deposit is located just south of the Portage deposit and is also associated with iron formation but exhibits different geometry, with a north-south trend and a steep westerly dip. Mineralized zones typically occur as a single unit near surface, splaying into several limbs at depth. The deposit is currently defined over a 750-metre strike length and down to 500 metres at depth (mainly in the southern end), with true thicknesses of three to 12 metres (reaching up to 20 metres locally). The Goose underground resource (100 to 500 metres at depth) extends 700 metres to the south of the Goose pit. The ore zones show the same characteristics as the Goose pit, which is two to five main zones sub-parallel and undulating. The average thickness rarely exceeds three to five metres.
The Vault deposit is located seven kilometres northeast of the Portage and Goose deposits. It is planar and shallow-dipping with a defined strike of 1,100 metres. The deposit has been disturbed by two sets of normal faults striking east-west and north-south and dipping moderately to the southeast and steeply to the east, respectively. The main lens has an average true thickness of eight to 12 metres, reaching as high as 18 metres locally. The hanging wall lenses are typically three to five metres, and up to seven metres, in true thickness.
Exploration
Grassroots exploration in the project area began as early as 1980. Several companies conducted various types of work between 1980 and 2007. Throughout these years, six deposits were the main focus of exploration: Portage, Cannu, Bay Zone, Goose, Vault and PDF. Over time, the Cannu, Bay Zone and Portage deposits were combined into one mineable deposit referred to as Portage. Exploration has extended the Goose Island deposit southward, adding the Goose South and Gosling zones.
In 2009, the mine exploration group took over the pit and adjacent areas. Three goals were targeted: exploration drilling, resource conversion and waste pad condemnation.
In 2010, 102 holes totalling 37,928 metres were drilled. The focus of the exploration campaign was testing the underground potential of the Goose deposit, resource conversions at the Vault deposit and on the south continuity of the Portage and Goose deposits. On the Goose underground deposit, a total of 23 holes for 11,145 metres were drilled from 200 to 750 metres in depth. These holes contributed to increase the continuity and understanding of the mineralization. The drilling was predominantly to expand the Goose deposit at depth and towards the south, as well as to conduct infill drilling in areas where large gaps occurred between auriferous intersections. The program was successful in expanding the Goose deposit at depth and towards the south.
On the Vault deposit, a total of 39 holes for 5,943 metres were drilled from 25 to 200 metres in depth during 2010. These holes were aimed at converting resources close to the pit shell and also to extending resources to the south-west continuity towards the Tern Lake porphyry.
On the southern portion of the Portage deposit, a total of 18 holes for 8,070 metres were drilled from 50 to 250 metres in depth during 2010, with the aim of converting resources directly south of the Portage pit and other inferred occurrences within a close proximity to the pit.
On the Goose south trend, a total of 13 holes for 7,320 metres were drilled from 150 to 250 metres in depth during 2010. These holes were aimed at following the south trend of the Portage Goose iron formation.
In 2011, 284 diamond drill holes totalling 24,229 metres were drilled. The exploration program had four goals: exploring the southern trend of the Goose deposit at depth; following-up on the regional results of testing on the Farwest Iron Formation and the geophysics of the Tern Lake porphyry completed in 2010; continuing resource conversion work initiated on the Vault deposit in 2010 and extending resources on the south west part of deposit; and a resources conversion with a definition program in Portage pit.
The definition program on the Portage pit was conducted in phases from May to December 2011 and represented 165 holes totalling 11,431 metres of diamond drilling. In addition, reverse circulation drilling was used to drill over 42 holes totalling 1,074 metres. This method is expected to reduce the cost of drilling.
On the Goose South trend, 6 holes totalling 2,382 metres were drilled during 2011. On the Farwest Iron Formation, 7 holes for a total of 2,721 metres were drilled along the trend and verified the potential of the west contact with the granitic mass. On the Tern Lake porphyry, 19 holes totalling 931 metres were drilled.
2012 ANNUAL REPORT 69
At the Vault pit during 2011, 19 holes were drilled for a total of 1,250 metres, 43 holes totalling 3,545 metres were drilled in Vault South and 25 holes totalling 1,969 metres were drilled in Vault East.
In 2012, 517 diamond and reverse circulation drill holes totalling 28,052 metres were drilled. Exploration focused on delineation and infill drilling on the Portage and Goose pits and resource conversion, definition and condemnation drilling at Vault. In addition, two deep exploration holes were drilled to follow up on earlier testing of the north and south extension of the Portage main structure.
The delineation drilling program on the Portage pit was conducted throughout the year with a break between June and September while waiting for the reverse circulation drill to arrive by sealift. A total of 134 reverse circulation holes in 3,254 metres and 205 diamond drill holes in 11,304 metres were drilled in the north pit and south pit, including the Pushback area. The drilling program resulted in the completion of a 25x25 metre grid over the entire pit and the commencement of a 12.5x12.5 metre infill grid.
At the Goose Island pit, 1,902 metres in 7 reverse circulation holes and 3,347 metres in 74 diamond drill holes were drilled in 2012. The diamond drill holes were drilled in January and February, primarily to complete the 25x25 metre delineation grid in the pit. The reverse circulation holes were drilled in selected areas on a 12.5x12.5 metre grid in October and November 2012.
At the Vault project, 3,441 metres in 70 diamond drill holes were drilled between mid-February and early April 2012 to partially complete the delineation program (25x25 metre grid) within the starter pit. Additional drilling to complete this program is planned for 2013. A condemnation drilling program for the waste storage facility was also completed by early April 2012, with 3,777 metres drilled in 25 holes.
Drilling carried out during the period of 2009 to 2012 returned significant results on the Goose underground and Vault deposits. At the Goose deposit, the increase in indicated mineral resources comes from a confirmation of continuity towards the south and at depth. At the Vault deposit, the increase in mineral reserves is the result of converting resources to reserves at depth along the east pit wall. Positive drill results show continuity of mineralization toward the southwest where reserves have been defined in what is currently called the Phaser pit.
Meliadine Project
The Meliadine project is an advanced exploration property located near the western shore of Hudson Bay in the Kivalliq region of Nunavut, about 25 kilometres north of the hamlet of Rankin Inlet and 290 kilometres southeast of the Meadowbank mine. The closest major city is Winnipeg, Manitoba, about 1,500 kilometres to the south.
The Company acquired its 100% interest in the Meliadine project through its acquisition of Comaplex in July 2010 (see "– History and Development of the Company").
The mineral reserves and resources of the Meliadine project are estimated at December 31, 2012 to contain proven and probable mineral reserves of 3.0 million ounces of gold in 13.3 million tonnes of ore grading 7.0 grams per tonne. In addition, the project had 17.2 million tonnes of indicated mineral resources grading 3.9 grams of gold per tonne and 14.8 million tonnes of inferred mineral resources grading 6.2 grams of gold per tonne at December 31, 2012.
The Meliadine property is a large, almost entirely contiguous land package that is nearly 80 kilometres long. It consists of 65,499 hectares of mineral rights, of which 62,069 hectares are held under the Canada Mining Regulations and administered by the Aboriginal Affairs and Northern Development Canada and referred to as Crown Land. The Crown Land is made up of mining claims covering 10,783 hectares and mineral leases covering 51,286 hectares. There are also 3,430 hectares of subsurface Nunavut Tunngavik Inc. concessions administered by a division of the Nunavut Territorial government. In 2012, C$126,734 was paid to Aboriginal Affairs and Northern Development Canada for the mining lease; Nunavut Tunngavik Inc. requires annual rental fees of C$13,721 and exploration expenditures of C$102,909.
The Kivalliq region has an arid arctic climate. The Meliadine property is mainly covered by glacial overburden with the presence of deep-seated permafrost. The property is about 60 metres above sea level in low-lying topography with numerous lakes. Surface waters are usually frozen by early October and remain frozen until early June. Surface geological work can be carried out from mid-May to mid-October, while exploration drilling can take place throughout the year, though is reduced in December and January due to cold and darkness.
Equipment, fuel and dry goods are transported on the annual warm-weather sealift by barge to Rankin Inlet via Hudson Bay. Ocean-going barges from Churchill, Manitoba or eastern Canadian ports can access the community from late June to early October. Churchill, which is approximately 470 kilometres south of Rankin Inlet, has a deep-water port facility and a year-round rail link to locations to the south.
70 AGNICO-EAGLE MINES LIMITED
Personnel, perishables and lighter goods arrive at the Rankin Inlet regional airport by commercial or charter airline, from which they can be flown to the property by chartered helicopter or delivered by tracked vehicles by a winter-road from Rankin Inlet directly to the Meliadine project exploration camp from January to mid-May. In 2011, the Company submitted an application to the NIRB and other regulatory agencies proposing the building of a 23.8-kilometre-long all-weather gravel road (including three bridges) linking Rankin Inlet with the project site to support ongoing exploration activities at the Meliadine project property. Approval from the NIRB on the application was received in February 2012 and a water license from the NWB was received in March 2012. Construction of the road began in March 2012. As at December 31, 2012, 11.5 kilometres of the road and all three of the bridges had been completed. The construction of the road is expected to be completed by mid-2013.
Exploration personnel for the Meliadine project are mainly sourced from other parts of Canada on a fly-in/fly-out rotation from Val d'Or, Quebec, and Winnipeg, Manitoba, although there is preferential employment of qualified people from the Kivalliq region. The hamlet of Rankin Inlet has developed a strong taskforce of entrepreneurs who provide a wide variety of services, such as freight expediting, equipment supply and outfitting.
Location Map of the Meliadine Project (as at December 31, 2012)
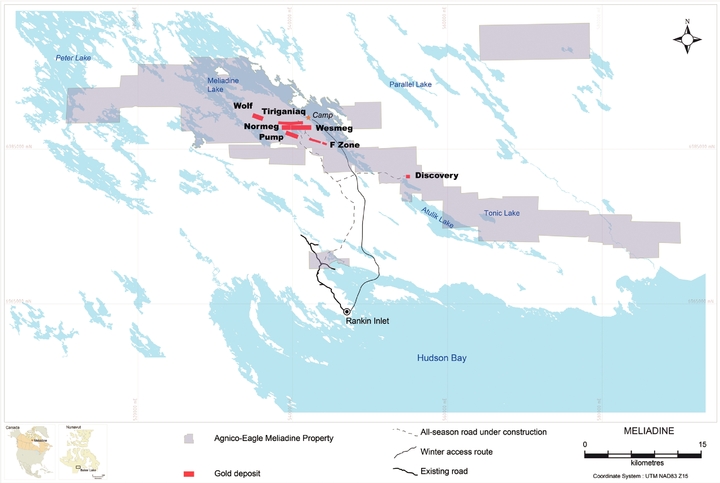
2012 ANNUAL REPORT 71
Mining and Milling Facilities
Surface Plan of the Meliadine Project (as at December 31, 2012)
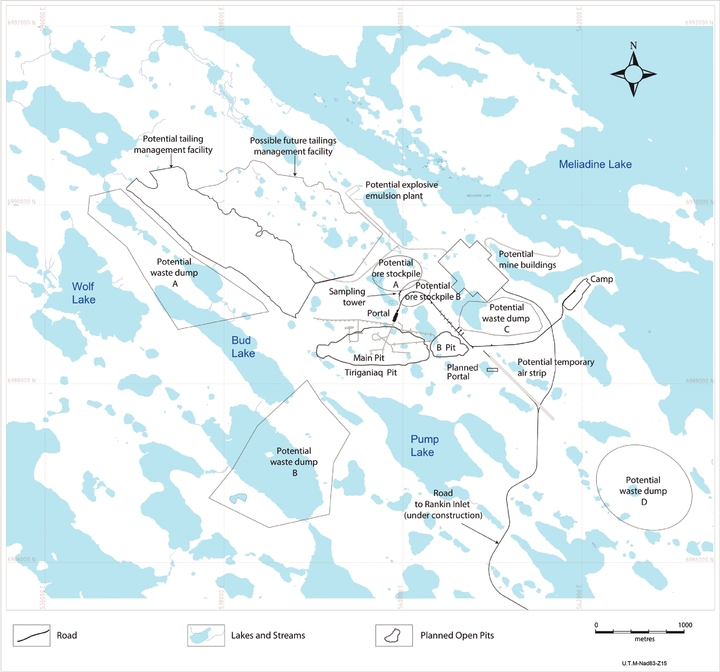
Facilities
Current facilities include the Meliadine project exploration camp located on the shore of Meliadine Lake, approximately 2.3 kilometres east of the Tiriganiaq deposit. The self-contained camp consists of four wings of new trailers that can accommodate up to 200 personnel and includes new kitchen facilities, complete with diesel generators. These new facilities replaced the previous tent exploration camp.
As described above, construction of an all-weather access road linking Rankin Inlet to the Meliadine site began in March 2012 and is expected to be completed by mid-2013.
Power is currently generated using diesel generators for the Meliadine exploration camp on an as-required basis. Potable water for the Meliadine project camp is pumped from Meliadine Lake and water for the previous underground operations and surface drill programs is pumped from Pump Lake. The current water licence allows for a maximum daily water use of 290 cubic metres on the Meliadine West licence and 299 cubic metres on the Meliadine East licence.
72 AGNICO-EAGLE MINES LIMITED
The Meliadine project exploration camp has an incinerator on site to burn all flammable materials, such as camp and food wastes. Plastics and metal objects, along with incinerator ash, are set aside for transport to be disposed of in the Rankin Inlet landfill. All hazardous and liquid wastes are held at the Meliadine project site for transport to a waste management company in southern Canada.
Sewage has been treated through a Biodisk treatment system since the summer of 2010. Run-off water is contained in the primary water containment area and released only when sampling results meet acceptable water quality standards. Routine water sampling has been conducted since the mid-1990s and reported on a monthly basis to the authorities.
The Meliadine East camp on Atulik Lake was decommissioned during the summer of 2010, with completion in the winter of 2010 and 2011. The core shack and storage building remain at the former camp site.
An underground portal allowing access to an exploration decline was built at the Tiriganiaq deposit in 2007 and 2008 in order to extract a bulk sample for study purposes. A waste rock and ore storage pad was generated during excavation of the decline and a sampling tower was installed for processing the bulk sample. There is a two-kilometre-long road between the Meliadine project exploration camp and the portal site. Another underground bulk sample of 4,600 tonnes of ore was taken from the Tiriganiaq deposit via this portal in 2011. The results confirmed the resource estimation model that has been developed for the two principal zones (Zones 1000 and 1100) at Tiriganiaq, and in fact indicated approximately 6% more gold than had been predicted by the block model for these areas. The 2011 bulk sample program also confirmed the previous assessment of the Company's block model in terms of grade continuity, consistency and distribution, and the evaluation of related mining properties through geological mapping, underground chip-, channel- and muck-sampling, and geotechnical observations.
Environmental Matters (including IIBA)
Land and environmental management in the region of the Meliadine project is generally governed by the provisions of the Land Claims Agreement. Pursuant to the Land Claims Agreement, land use leases must be obtained from the KIA. The Meliadine project has been granted a commercial lease for exploration and underground development activity, a prospecting and land use lease for exploration and development activities, an exploration land use lease for exploration and drilling on the Inuit-owned lands of Meliadine East and a parcel drilling permit for drilling activity on Inuit-owned lands. A number of right-of-way leases covering road access to the Meliadine project property and esker quarrying on the Inuit-owned lands were also granted by the KIA.
Pursuant to the Land Claims Agreement, an exploration water licence and a bulk sample water licence were granted by the NWB in March 2012. A project certificate from the NIRB is the next approval required for the Meliadine project. In connection therewith, the NIRB issued guidelines to the Company in February 2012 for the preparation of an environmental impact statement ("EIS") for the Meliadine project. The Company submitted a draft EIS to the NIRB for review in January 2013. The Company received comments from the NIRB regarding the draft EIS and expects to resubmit the draft EIS to the NIRB in April 2013. Upon completion of a public and technical review, a final EIS will be submitted to the NIRB and the Company expects to be granted a project certificate in mid-2014.
Other operating permits and licences can only be issued after a project certificate is received from the NIRB. An IIBA, an Inuit Water Compensation Agreement and a Production Lease will also need to be negotiated between the Company and the KIA. Negotiations regarding an IIBA between the Company and KIA commenced in January 2012.
Geology, Mineralization and Exploration
Geology and Mineralization
Archean volcanic and sedimentary rocks of the Meliadine greenstone belt underlie the property, which is mainly covered by glacial overburden with deep-seated permafrost and is part of the Western Churchill supergroup in northern Canada. The rock layers have been folded, sheared and metamorphosed, and have been truncated by the Pyke Fault, a regional structure that extends the entire 80-kilometre length of the large property.
The Pyke Fault appears to control gold mineralization on the Meliadine project property. At the southern edge of the fault is a series of oxide iron formations that host the seven Meliadine project deposits currently known. The deposits consist of multiple lodes of mesothermal quartz-vein stockworks, laminated veins and sulphidized iron formation mineralization with strike lengths of up to three kilometres. The Upper Oxide iron formation hosts the Tiriganiaq and Wolf North zones. The two Lower Lean iron formations contain the F Zone, Pump, Wolf Main and Wesmeg deposits. The Normeg zone was discovered in 2011 on the eastern end of the Wesmeg zone, near Tiriganiaq. The Wolf (North and Main), F Zone, Pump and Wesmeg/Normeg deposits are all within five kilometres of Tiriganiaq. The Discovery deposit is 17 kilometres east
2012 ANNUAL REPORT 73
southeast of Tiriganiaq and is hosted by the Upper Oxide iron formation. Each of these deposits has mineralization within 120 metres of surface, making them potentially mineable by open pit methods. They also have deeper ore that could potentially be mined with underground methods, which is being examined in the feasibility study.
Exploration
The Meliadine property was explored for gold from 1987 through 2010 at a cost of C$166.8 million by former owners Asamera Inc., Rio Algom Limited, Comaplex, Cumberland and Western Mining International, as well as the Company and numerous consultants. For many years the property was divided into two halves – Meliadine East and Meliadine West – which were consolidated into the Meliadine property in December 2009.
Lack of outcropping bedrock in the area resulted in the use of high-density magnetic surveying followed by diamond drilling as the most common and successful exploration strategy on the property. This included 193,318 metres of drilling in 682 holes from 1993 through 2010, as well as geophysical surveying, prospecting and sampling. In 2007 and 2008, there was an underground exploration and bulk sample program on the Tiriganiaq deposit. This was followed by a preliminary assessment for the property in 2009, which indicated the potential of the project to support a mining operation.
In 2010, there were 128 exploration drill holes (32,000 metres) at the Meliadine project, of which 53% were drilled by the Company after acquiring the property in July 2010. The Company spent $10 million on exploration from July through December 2010.
The Company initiated an exploration and development program in the summer of 2010. Approximately 300,000 metres of drilling was completed by the end of 2012 to convert and extend the known mineral resources to reserves. This drilling was primarily carried out at Tiriganiaq, but also took place at other known mineralized zones. At the end of 2012, the Company had spent $150.2 million, broken down as follows: $45.7 million on exploration diamond drilling, $30.7 million on construction and equipment purchases (camp and road), $30.4 million on site services, transportation and accommodation, $11.6 million on environmental expenses and permitting, $11.3 million on underground work and equipment purchases, $11.0 million on administration and technical services, $6.5 million on a bulk sample and $3.0 million on studies. In 2013, a total of $91 million is budgeted on the project, including $15 million for a feasibility study, $6 million for permitting activities, $13 million for site infrastructure, $13 million for exploration ramp development, $15.9 million for camp operations and logisitics and $13.8 million for 55,000 metres of conversion and exploration drilling within the known deposits. An additional $10.4 million is budgeted for 35,000 metres of regional exploration drilling outside of the known deposits.
A feasibility study completed in 2011 confirmed the viability of the Meliadine project at an operating rate of 3,000 tonnes per day. Internal studies that incorporate the recent exploration results are currently underway looking to increase project throughput and improve the rate of return.
Regional Exploration Activities
During 2012, the Company continued to actively explore in Quebec, Ontario, Nunavut, Nevada, Finland, Sweden, Mexico and Argentina. The Canadian exploration activities were focused on the Goldex, Wyoming, Maritime and Lapa properties in Quebec, as well as on the Meadowbank property in Nunavut where activities were conducted both within and outside the mining lease and the Meliadine project, also in Nunavut. In the United States, exploration activities during 2012 were concentrated on the West Pequop and Summit projects located in northeast Nevada and the Rattlesnake project located in Wyoming. At the LaRonde, Lapa, Pinos Altos and Kittila mines, the Company continued exploration programs around the mines. Most of the exploration budget was spent on drilling programs near the mine infrastructure along previously recognized gold trends.
At the end of 2012, the Company's land holdings in Canada consisted of 69 projects comprised of 2,748 mineral titles covering an aggregate of 220,060 hectares. Land holdings in the United States consisted of four properties comprised of 2,620 mineral titles covering an aggregate of 21,585 hectares. Land holdings in Finland consisted of three groups of properties comprised of 289 mineral titles covering an aggregate of 25,654 hectares. Land holdings in Sweden consisted of one project comprised of seven mineral titles covering an aggregate of 8,957 hectares. Land holdings in Mexico consisted of eight projects comprised of 116 mining concession titles covering an aggregate of 129,258 hectares. Land holdings in Argentina consisted of one project with two mineral titles covering an aggregate of 2,691 hectares.
74 AGNICO-EAGLE MINES LIMITED
The total amount spent on regional exploration in 2012 was $76.8 million, which included drilling 860 holes for an aggregate of approximately 237 kilometres. The budget for regional exploration expenditures in 2013 is approximately $52.1 million, including approximately 142.8 kilometres of drilling.
Mineral Reserves and Mineral Resources
Cautionary Note to Investors Concerning Estimates of Measured and Indicated Mineral Resources
This section uses the terms "measured mineral resources" and "indicated mineral resources". Investors are advised that while these terms are recognized and required by Canadian regulations, the SEC does not recognize them. Investors are cautioned not to assume that any part or all of mineral deposits in these categories will ever be converted into mineral reserves.
Cautionary Note to Investors Concerning Estimates of Inferred Mineral Resources
This section uses the term "inferred mineral resources". Investors are advised that while this term is recognized and required by Canadian regulations, the SEC does not recognize it. "Inferred mineral resources" have a great amount of uncertainty as to their existence, and great uncertainty as to their economic and legal feasibility. It cannot be assumed that any part or all of an inferred mineral resource will ever be upgraded to a higher category. Under Canadian rules, estimates of inferred mineral resources may not form the basis of feasibility or pre-feasibility studies, except in rare cases. Investors are cautioned not to assume that any part or all of an inferred mineral resource exists, or is economically or legally mineable.
Information on Mineral Reserves and Mineral Resources of the Company
The preparation of the information set out below with respect to the mineral reserves at the LaRonde, Lapa, Kittila, Pinos Altos and Meadowbank mines, the Goldex and La India mine projects and the Meliadine and Bousquet projects has been supervised by Daniel Doucet, P.Eng., the Corporate Director, Reserve Development of the Company, a "qualified person" as that term is defined in NI 43-101. The Company's mineral reserves estimate was derived from internally generated data or geology reports. All of the Company's reserve and resource estimates have been audited by independent consultants.
The criteria set out in NI 43-101 for reserve definitions and guidelines for classification of mineral reserves are similar to those used by Guide 7. However, the definitions in NI 43-101 differ in certain respects from those under Guide 7. Under Guide 7, among other things, a mineral reserve estimate must have a "final" or "bankable" feasibility study. Guide 7 also requires the use of commodity prices that reflect current economic conditions at the time of reserve determination, which Staff of the SEC has interpreted to mean historic three-year average prices. In addition to the differences noted above, Guide 7 does not recognize mineral resources.
The assumptions used for the 2012 mineral reserves and resources estimates for the Lapa, Goldex, Meadowbank, Meliadine and Creston Mascota properties reported by the Company in this Form 20-F were based on three-year average prices for the period ending December 31, 2012 of $1,490 per ounce of gold, $29.00 per ounce of silver, $0.95 per pound of zinc, $3.67 per pound of copper, $1.00 per pound of lead and exchange rates of C$1.00 per $1.00, 12.75 Mexican pesos per $1.00 and $1.34 per €1.00. The assumptions used for the 2012 mineral reserves and resources estimates for the LaRonde, Kittila, Pinos Altos, La India and Tarachi properties reported by the Company in this Form 20-F used more conservative metal price assumptions of $1,345 per ounce of gold, $25.00 per ounce of silver, $0.95 per pound of zinc, $3.49 per pound of copper, $0.99 per pound of lead and exchange rates of C$1.00 per $1.00, 13.00 Mexican pesos per $1.00 and $1.30 per €1.00. The assumptions used for the 2011 mineral reserves and resources estimate reported by the Company in this Form 20-F were based on three-year average prices for the period ending December 31, 2011 of $1,255 per ounce of gold, $23.00 per ounce of silver, $0.91 per pound of zinc, $3.25 per pound of copper, $0.95 per pound of lead and exchange rates of C$1.05 per $1.00, 12.86 Mexican pesos per $1.00 and $1.37 per €1.00. The assumptions used for the 2010 mineral reserves and resources estimate reported by the Company in this Form 20-F were based on three-year average prices for the period ending December 31, 2010 of $1,024 per ounce gold, $16.62 per ounce silver, $0.86 per pound zinc, $2.97 per pound copper, $0.90 per pound lead and exchange rates of C$1.08 per $1.00, 12.43 Mexican pesos per $1.00 and $1.40 per €1.00. Other assumptions used for estimating 2011 and 2010 mineral reserve and resource information may be found in the Company's annual filings in respect of the years ended December 31, 2011 and December 31, 2010, respectively.
2012 ANNUAL REPORT 75
Set out below are the reserve estimates as of December 31, 2012, as calculated in accordance with NI 43-101 and Guide 7, respectively (tonnages and contained gold quantities are rounded to the nearest thousand):
| National Instrument 43-101 | Industry Guide No. 7 | ||||||||||||
| Property | Tonnes | Gold Grade (g/t) |
Contained Gold (oz) |
Tonnes | Gold Grade (g/t) |
Contained Gold (oz) |
|||||||
| Proven Reserves | |||||||||||||
| LaRonde mine (underground) | 6,323,000 | 2.96 | 602,000 | 6,323,000 | 2.96 | 602,000 | |||||||
| Lapa mine (underground) | 1,129,000 | 6.25 | 227,000 | 1,129,000 | 6.25 | 227,000 | |||||||
| Goldex mine project (underground) | 59,000 | 1.70 | 3,000 | 59,000 | 1.70 | 3,000 | |||||||
| Kittila mine (open pit) | 272,000 | 4.30 | 38,000 | 272,000 | 4.30 | 38,000 | |||||||
| Kittila mine (underground) | 1,189,000 | 4.66 | 178,000 | 1,189,000 | 4.66 | 178,000 | |||||||
| Kittila mine total proven | 1,461,000 | 4.59 | 216,000 | 1,461,000 | 4.59 | 216,000 | |||||||
| Pinos Altos mine (open pit) | 457,000 | 0.93 | 14,000 | 457,000 | 0.93 | 14,000 | |||||||
| Pinos Altos mine (underground) | 2,610,000 | 2.82 | 237,000 | 2,610,000 | 2.82 | 237,000 | |||||||
| Pinos Altos mine total proven | 3,067,000 | 2.54 | 250,000 | 3,067,000 | 2.54 | 250,000 | |||||||
| Meadowbank mine (open pit) | 1,764,000 | 1.56 | 88,000 | 1,764,000 | 1.56 | 88,000 | |||||||
| Meliadine project (open pit) | 34,000 | 7.31 | 8,000 | 34,000 | 7.31 | 8,000 | |||||||
| Total Proven Reserves | 13,836,000 | 3.13 | 1,394,000 | 13,836,000 | 3.13 | 1,394,000 | |||||||
| Probable Reserves | |||||||||||||
| LaRonde mine (underground) | 22,462,000 | 4.99 | 3,604,000 | 22,462,000 | 4.99 | 3,604,000 | |||||||
| Bousquet (open pit) | 2,943,000 | 1.88 | 178,000 | 2,943,000 | 1.88 | 178,000 | |||||||
| Lapa mine (underground) | 939,000 | 5.58 | 168,000 | 939,000 | 5.58 | 168,000 | |||||||
| Goldex mine project (underground) | 6,936,000 | 1.55 | 346,000 | 6,936,000 | 1.55 | 346,000 | |||||||
| Kittila mine (open pit) | 182,000 | 3.51 | 21,000 | 182,000 | 3.51 | 21,000 | |||||||
| Kittila mine (underground) | 31,480,000 | 4.49 | 4,547,000 | 31,480,000 | 4.49 | 4,547,000 | |||||||
| Kittila mine total probable | 31,662,000 | 4.49 | 4,567,000 | 31,662,000 | 4.49 | 4,567,000 | |||||||
| Pinos Altos mine (open pit) | 15,692,000 | 1.75 | 884,000 | 15,692,000 | 1.75 | 884,000 | |||||||
| Pinos Altos mine (underground) | 19,382,000 | 2.54 | 1,580,000 | 19,382,000 | 2.54 | 1,580,000 | |||||||
| Pinos Altos mine total probable | 35,074,000 | 2.18 | 2,464,000 | 35,074,000 | 2.18 | 2,464,000 | |||||||
| La India mine project (open pit) | 33,457,000 | 0.72 | 776,000 | 33,457,000 | 0.72 | 776,000 | |||||||
| Meadowbank mine (open pit) | 23,560,000 | 2.91 | 2,206,000 | 23,560,000 | 2.91 | 2,206,000 | |||||||
| Meliadine project (open pit) | 5,172,000 | 5.85 | 973,000 | 5,172,000 | 5.85 | 973,000 | |||||||
| Meliadine project (underground) | 8,094,000 | 7.71 | 2,006,000 | 8,094,000 | 7.71 | 2,006,000 | |||||||
| Meliadine project total probable | 13,266,000 | 6.98 | 2,979,000 | 13,266,000 | 6.98 | 2,979,000 | |||||||
| Total Probable Reserves | 170,300,000 | 3.16 | 17,286,000 | 170,300,000 | 3.16 | 17,286,000 | |||||||
| Total Proven and Probable Reserves | 184,136,000 | 3.16 | 18,681,000 | 184,136,000 | 3.16 | 18,681,000 | |||||||
76 AGNICO-EAGLE MINES LIMITED
In the following tables setting out mineral reserve information about the Company's mineral projects, tonnage information is rounded to the nearest thousand tonnes and the total contained gold ounces stated do not include equivalent gold ounces for byproduct metals contained in the mineral reserve. For all reserves and resources other than inferred mineral resources, the reported metal grades in the estimates reflect losses in the recovery process, that is, the metallurgical losses associated with processing the extracted ore. The mineral reserve and mineral resource figures presented in this Form 20-F are estimates, and no assurance can be given that the anticipated tonnages and grades will be achieved or that the indicated level of recovery will be realized.
LaRonde Mine Mineral Reserves and Mineral Resources
| As at December 31, | ||||||||
| 2012 | 2011 | 2010 | ||||||
| Gold-Rich Orebody | ||||||||
| Proven mineral reserves – tonnes | 5,300,000 | 4,100,000 | 3,200,000 | |||||
| Average grade – gold grams per tonne | 3.30 | 3.10 | 3.07 | |||||
| Probable mineral reserves – tonnes | 21,800,000 | 26,700,000 | 27,900,000 | |||||
| Average grade – gold grams per tonne | 5.11 | 4.91 | 4.90 | |||||
| Gold-Poor Orebody | ||||||||
| Proven mineral reserves – tonnes | 1,000,000 | 1,200,000 | 1,600,000 | |||||
| Average grade – gold grams per tonne | 1.23 | 0.97 | 0.95 | |||||
| Probable mineral reserves – tonnes | 700,000 | 1,200,000 | 2,000,000 | |||||
| Average grade – gold grams per tonne | 1.11 | 1.22 | 1.01 | |||||
| Total proven and probable mineral reserves – tonnes | 28,800,000 | 33,200,000 | 34,700,000 | |||||
| Average grade – gold grams per tonne | 4.54 | 4.40 | 4.32 | |||||
| Total contained gold ounces | 4,206,000 | 4,700,000 | 4,818,000 | |||||
Notes:
- (1)
- The
2012 proven and probable mineral reserves set out in the table above are based on a net smelter return cut-off value of the ore that varies between C$88 per tonne and
C$118 per tonne depending on the deposit. The Company's historical metallurgical recovery rates at the LaRonde mine from January 1, 2004 to December 31, 2012 averaged 90.7% for gold,
87.0% for silver, 81.6% for zinc and 86.4% for copper. The historical metallurgical recovery rate for lead from January 1, 2008 to December 31, 2012 was 15.4%. The Company estimates that
a 10% change in the gold price would result in an approximate 0.9% change in mineral reserves.
- (2)
- In
addition to the mineral reserves set out above, at December 31, 2012, the LaRonde mine contained indicated mineral resources of 5,432,000 tonnes grading
1.88 grams of gold per tonne and inferred mineral resources of 11,887,000 tonnes grading 3.73 grams of gold per tonne.
- (3)
- The following table shows the reconciliation of mineral reserves (in nearest thousand tonnes) at the LaRonde mine by category at December 31, 2012 with those at December 31, 2011. Revision means additional mineral reserves converted from mineral resources or other categories of mineral reserves and mineral reserves added from exploration activities during 2012.
| Proven | Probable | Total | ||||||
| December 31, 2011 | 5,331 | 27,901 | 33,232 | |||||
| Processed in 2012 | 2,359 | – | 2,359 | |||||
| Revision | 3,351 | (5,439 | ) | (2,087 | ) | |||
| December 31, 2012 | 6,323 | 22,462 | 28,786 | |||||
- (4)
- Complete
information on the verification procedures, the quality assurance program, quality control procedures, parameters and methods and other factors that may materially affect
scientific and technical information presented in this Form 20-F relating to the LaRonde mine may be found in the Technical Report on the 2005 LaRonde Mineral Resource &
Mineral Reserve Estimate filed with Canadian securities regulatory authorities on the System for Electronic Document Analysis and Retrieval ("SEDAR") on March 23, 2005.
- (5)
- At December 31, 2012, the Bousquet project contained probable mineral reserves of 2,943,000 tonnes grading 1.88 grams of gold per tonne. In addition, the Bousquet project contained indicated mineral resources of 9,805,000 tonnes grading 2.44 grams of gold per tonne and inferred mineral resources of 4,567,000 tonnes grading 4.04 grams of gold per tonne.
2012 ANNUAL REPORT 77
Lapa Mine Mineral Reserves and Mineral Resources
| As at December 31, | ||||||||
| 2012 | 2011 | 2010 | ||||||
| Gold | ||||||||
| Proven mineral reserves – tonnes | 1,129,000 | 1,044,000 | 1,122,000 | |||||
| Average grade – gold grams per tonne | 6.25 | 6.45 | 7.24 | |||||
| Probable mineral reserves – tonnes | 939,000 | 1,340,000 | 1,709,000 | |||||
| Average grade – gold grams per tonne | 5.58 | 6.61 | 7.56 | |||||
| Total proven and probable mineral reserves – tonnes | 2,068,000 | 2,384,000 | 2,831,000 | |||||
| Average grade – gold grams per tonne | 5.95 | 6.54 | 7.43 | |||||
| Total contained gold ounces | 395,000 | 501,000 | 677,000 | |||||
Notes:
- (1)
- The
2012 mineral reserve estimates were calculated using an assumed metallurgical gold recovery of 71% and a cut-off grade of 3.9 grams of gold per tonne, and the
resource estimates were calculated using an assumed metallurgical gold recovery of 75% and a cut-off grade of 2.8 grams of gold per tonne. The operating cost per tonne estimate for
the Lapa mine in 2012 was C$131.71. The Company estimates that a 10% change in the gold price would result in an approximate 12% change in mineral reserves.
- (2)
- In
addition to the mineral reserves set out above, at December 31, 2012, the Lapa mine contained indicated mineral resources of 1,118,000 tonnes grading
4.08 grams of gold per tonne and inferred mineral resources of 934,000 tonnes grading 6.69 grams of gold per tonne.
- (3)
- The following table shows the reconciliation of mineral reserves (in nearest thousand tonnes) at the Lapa mine by category at December 31, 2012 with those at December 31, 2011. Revision means additional mineral reserves converted from mineral resources or other categories of mineral reserves and mineral reserves added from exploration activities during 2012.
| Proven | Probable | Total | |||||
| December 31, 2011 | 1,044 | 1,340 | 2,384 | ||||
| Processed in 2012 | 640 | – | 640 | ||||
| Revision | 725 | (401 | ) | 324 | |||
| December 31, 2012 | 1,129 | 939 | 2,068 | ||||
- (4)
- Complete information on the verification procedures, the quality assurance program, quality control procedures, parameters and methods and other factors that may materially affect scientific and technical information presented in this Form 20-F relating to the Lapa mine may be found in the Technical Report on the Lapa Gold Project, Cadillac Township, Quebec, Canada filed with Canadian securities regulatory authorities on SEDAR on June 8, 2006.
78 AGNICO-EAGLE MINES LIMITED
Goldex Mine Project Mineral Reserves and Mineral Resources
| As at December 31, | ||||||||
| 2012 | 2011 | 2010 | ||||||
| Gold | ||||||||
| Proven mineral reserves – tonnes | 59,000 | – | 14,804,000 | |||||
| Average grade – gold grams per tonne | 1.70 | – | 1.87 | |||||
| Probable mineral reserves – tonnes | 6,936,000 | – | 13,722,000 | |||||
| Average grade – gold grams per tonne | 1.55 | – | 1.63 | |||||
| Total proven and probable mineral reserves – tonnes | 6,995,000 | – | 28,526,000 | |||||
| Average grade – gold grams per tonne | 1.55 | – | 1.75 | |||||
| Total contained gold ounces | 349,000 | – | 1,609,000 | |||||
Notes:
- (1)
- The
suspension of mining operations at the Goldex mine on October 19, 2011 resulted in a restatement, as of that date, of all Goldex proven or probable reserves
(as stated on December 31, 2010) that had not already been mined, as measured or indicated resources, except stockpiled ore on surface; the stockpiled ore was processed by the end of
October 2011.
- (2)
- On
July 25, 2012, the Board of Directors approved the development of underground mining operations in the M and E Zones, where initial reserves were estimated in a feasibility
study completed on October 14, 2012.
- (3)
- The
2012 proven and probable mineral reserves set forth in the table above were estimated using an assumed metallurgical gold recovery of 93%. Mining costs were estimated to be
C$41.77 per tonne for the E Zone and C$40.28 per tonne for the M Zone. The cut-off grade used for mineral reserves was 1.05 grams of gold per tonne for the E Zone and
1.01 grams of gold per tonne for the M Zone. The Company estimates that a 10% change in the gold price would result in an approximate 4.4% change in mineral reserves.
- (4)
- In
addition to the mineral reserves set out above, at December 31, 2012, the Goldex mine project contained measured mineral resources of 12,360,000 tonnes grading
1.86 grams of gold per tonne, indicated mineral resources of 14,808,000 tonnes grading 1.83 grams of gold per tonne and inferred mineral resources of 34,645,000 tonnes
grading 1.52 grams of gold per tonne.
- (5)
- Complete information on the verification procedures, the quality assurance program, quality control procedures, parameters and methods and other factors that may materially affect scientific and technical information presented in this Form 20-F relating to the Goldex mine project may be found in the Technical Report on Restatement of the Mineral Resources at Goldex Mine, Quebec, Canada as at October 19, 2011 filed with the Canadian securities regulatory authorities on SEDAR on December 5, 2011 and the Technical Report on Production of the M and E Zones at Goldex Mine dated October 14, 2012 filed with the Canadian securities regulatory authorities on SEDAR on November 1, 2012.
Kittila Mine Mineral Reserves and Mineral Resources
| As at December 31, | ||||||||
| 2012 | 2011 | 2010 | ||||||
| Gold | ||||||||
| Proven mineral reserves – tonnes | 1,461,000 | 702,000 | 403,000 | |||||
| Average grade – gold grams per tonne | 4.59 | 5.09 | 4.23 | |||||
| Probable mineral reserves – tonnes | 31,662,000 | 33,862,000 | 32,329,000 | |||||
| Average grade – gold grams per tonne | 4.49 | 4.65 | 4.64 | |||||
| Total proven and probable mineral reserves – tonnes | 33,122,000 | 34,564,000 | 32,732,000 | |||||
| Average grade – gold grams per tonne | 4.49 | 4.66 | 4.64 | |||||
| Total contained gold ounces | 4,783,000 | 5,177,000 | 4,880,000 | |||||
Notes:
- (1)
- The
2012 proven and probable mineral reserve and mineral resource estimates were calculated using a metallurgical gold recovery of 89%. Gold cut-off grades used were
1.98 grams per tonne, undiluted (1.76 grams per tonne, diluted) for open pit reserves and between 3.33 grams per tonne and 3.49 grams per tonne, undiluted (between
2.82 grams per tonne and 3.00 grams per tonne, diluted), depending on the deposit, for underground reserves. The open pit operating cost was estimated to be
€50.57 per tonne in 2012, while the underground cost averaged €79.38 per tonne in 2012. The Company estimates that a 10% change in the gold price would
result in an approximate 9.2% change in mineral reserves.
- (2)
- In addition to the mineral reserves set out above, at December 31, 2012, the Kittila mine contained indicated mineral resources of 7,854,000 tonnes grading 2.65 grams of gold per tonne and inferred mineral resources of 18,966,000 tonnes grading 3.88 grams of gold per tonne.
2012 ANNUAL REPORT 79
- (3)
- The breakdown of proven and probable mineral reserves between planned open pit operations and underground operations at the Kittila mine (with tonnage and contained ounces rounded to the nearest thousand) at December 31, 2012 is:
| Category | Mining Method |
Tonnes | Gold Grade (g/t) |
Contained Gold (oz) |
|||||
| Proven mineral reserves | Open pit | 272,000 | 4.30 | 38,000 | |||||
| Proven mineral reserves | Underground | 1,189,000 | 4.66 | 178,000 | |||||
| Total proven mineral reserves | 1,461,000 | 4.59 | 216,000 | ||||||
| Probable mineral reserves | Open pit | 182,000 | 3.51 | 21,000 | |||||
| Probable mineral reserves | Underground | 31,480,000 | 4.49 | 4,547,000 | |||||
| Total probable mineral reserves | 31,662,000 | 4.49 | 4,567,000 | ||||||
- (4)
- The following table shows the reconciliation of mineral reserves (in nearest thousand tonnes) at the Kittila mine by category at December 31, 2012 with those at December 31, 2011. Revision means additional mineral reserves converted from mineral resources or other categories of mineral reserves and mineral reserves added from exploration activities during 2012.
| Proven | Probable | Total | ||||||
| December 31, 2011 | 702 | 33,862 | 34,564 | |||||
| Processed in 2012 | 1,090 | – | 1,090 | |||||
| Revision | 1,849 | (2,200 | ) | (352 | ) | |||
| December 31, 2012 | 1,461 | 31,662 | 33,122 | |||||
- (5)
- Complete information on the verification procedures, the quality assurance program, quality control procedures, parameters and methods and other factors that may materially affect scientific and technical information presented in this Form 20-F relating to the Kittila mine may be found in the Technical Report on the December 31, 2009, Mineral Resource and Mineral Reserve Estimate and the Suuri Extension Project, Kittila Mine, Finland, filed with the Canadian securities regulatory authorities on SEDAR on March 4, 2010.
80 AGNICO-EAGLE MINES LIMITED
Pinos Altos Mine Mineral Reserves and Mineral Resources
| As at December 31, | ||||||||
| 2012 | 2011 | 2010 | ||||||
| Gold and Silver | ||||||||
Proven mineral reserves – tonnes |
3,067,000 |
1,987,000 |
2,864,000 |
|||||
| Average gold grade – grams per tonne | 2.54 | 1.83 | 1.90 | |||||
| Average silver grade – grams per tonne | 81.31 | 51.59 | 54.06 | |||||
| Probable mineral reserves – tonnes | 35,074,000 | 44,792,000 | 41,298,000 | |||||
| Average gold grade – grams per tonne | 2.18 | 2.07 | 2.33 | |||||
| Average silver grade – grams per tonne | 58.90 | 59.17 | 65.53 | |||||
| Total proven and probable mineral reserves – tonnes | 38,141,000 | 46,779,000 | 44,162,000 | |||||
| Average gold grade – grams per tonne | 2.21 | 2.06 | 2.30 | |||||
| Average silver grade – grams per tonne | 60.71 | 58.85 | 64.78 | |||||
| Total contained gold ounces | 2,714,000 | 3,103,000 | 3,271,000 | |||||
| Total contained silver ounces | 74,441,000 | 88,508,000 | 91,982,000 | |||||
Notes:
- (1)
- The
2012 proven and probable mineral reserve estimates are based on a net smelter return cut-off value of the open pit ore between $9.01 per tonne and $28.43 per tonne,
depending on the deposit, and a net smelter return cut-off value of the underground ore of $59.11 per tonne. The operating cost per tonne estimate for the Pinos Altos mine in 2012 was
$35.41 without deferred stripping ($32.24 with deferred stripping). The metallurgical gold recovery used in the reserve estimates varied between 59% and 96%, depending on the deposit. The
metallurgical silver recovery used in the reserve estimates varied between 10% and 44.21%, depending on the deposit. The Company estimates that a 10% change in the gold price would result in an
approximate 2.2% change in mineral reserves.
- (2)
- In
addition to the mineral reserves set out above, at December 31, 2012, the Pinos Altos mine contained indicated mineral resources of 17,947,000 tonnes grading
1.52 grams of gold per tonne and 33.13 grams of silver per tonne and inferred mineral resources of 24,592,000 tonnes grading 1.19 grams of gold per tonne and
25.00 grams of silver per tonne.
- (3)
- The
proven and probable mineral reserves of the Pinos Altos mine set out in the table above include proven mineral reserves from the Creston Mascota deposit of 136,000 tonnes
grading 0.96 grams of gold per tonne and 7.42 grams of silver per tonne and probable mineral reserves from the Creston Mascota deposit of 9,950,000 tonnes grading
1.12 grams of gold per tonne and 12.00 grams of silver per tonne. The indicated mineral resource at the Pinos Altos mine also includes indicated mineral resources from the Creston
Mascota deposit of 1,765,000 tonnes grading 0.58 grams of gold per tonne and 3.78 grams of silver per tonne. The inferred mineral resource at the Pinos Altos mine also includes
inferred mineral resources from the Creston Mascota deposit of 1,079,000 tonnes grading 0.79 grams of gold per tonne and 5.95 grams of silver per tonne.
- (4)
- The breakdown of mineral reserves between planned open pit operations and underground operations at the Pinos Altos mine (with tonnage and contained ounces rounded to the nearest thousand) at December 31, 2012 is:
| Category | Mining Method |
Tonnes | Gold Grade (g/t) |
Silver Grade (g/t) |
Contained Gold (oz) |
Contained Silver (oz) |
|||||||
| Proven mineral reserves | Open pit stock pile | 457,000 | 0.93 | 19.45 | 14,000 | 286,000 | |||||||
| Proven mineral reserves | Underground | 2,610,000 | 2.82 | 92.14 | 237,000 | 7,732,000 | |||||||
| Total proven mineral reserves | 3,067,000 | 2.54 | 81.31 | 250,000 | 8,018,000 | ||||||||
| Probable mineral reserves | Open pit | 15,692,000 | 1.75 | 37.43 | 884,000 | 18,886,000 | |||||||
| Probable mineral reserves | Underground | 19,382,000 | 2.54 | 76.29 | 1,580,000 | 47,537,000 | |||||||
| Total probable mineral reserves | 35,074,000 | 2.18 | 58.90 | 2,464,000 | 66,424,000 | ||||||||
2012 ANNUAL REPORT 81
- (5)
- The following table shows the reconciliation of mineral reserves (in nearest thousand tonnes) at the Pinos Altos mine by category at December 31, 2012 with those at December 31, 2011. Revision means additional mineral reserves converted from mineral resources or other categories of mineral reserves and mineral reserves added from exploration activities during 2012.
| Proven | Probable | Total | ||||||
| December 31, 2011 | 1,987 | 44,792 | 46,779 | |||||
| Processed in 2012 | 4,395 | – | 4,395 | |||||
| Revision | 5,475 | (9,718 | ) | (4,243 | ) | |||
| December 31, 2012 | 3,067 | 35,074 | 38,141 | |||||
- (6)
- Complete information on the verification procedures, the quality assurance program, quality control procedures, parameters and methods and other factors that may materially affect scientific and technical information presented in this Form 20-F relating to the Pinos Altos mine may be found in the Pinos Altos Gold-Silver Mining Project, Chihuahua State, Mexico, Technical Report on the Mineral Resources and Reserves as of December 31, 2008 filed with the Canadian securities regulatory authorities on SEDAR on March 25, 2009.
La India Mine Project Mineral Reserves and Mineral Resources
| As at December 31, | ||||||||
| 2012 | 2011 | 2010 | ||||||
| Gold | ||||||||
Probable mineral reserves – tonnes |
33,457,000 |
– |
n/a |
|||||
| Average grade – gold grams per tonne | 0.72 | – | n/a | |||||
| Total proven and probable mineral reserves – tonnes | 33,457,000 | – | n/a | |||||
| Average grade – gold grams per tonne | 0.72 | – | n/a | |||||
| Total contained gold ounces | 776,000 | – | n/a | |||||
Notes:
- (1)
- The
2012 mineral reserve and mineral resource estimates for the La India mine project (including the Tarachi deposit) were calculated using a metallurgical gold recovery of 62%
or 89%, depending on the deposit. The economic cut-off grade used to determine the open pit reserves varied from 0.2 grams of gold per tonne to 0.4 grams of gold per tonne,
depending on the deposit, and is 0.15/0.30 grams of gold per tonne as a marginal cut-off grade. The estimated operating cost used for the 2012 mineral reserve estimate was $7.10 per
tonne. The Company estimates that a 10% change in the gold price would result in an approximate 1.9% change in mineral reserves.
- (2)
- In
addition to the mineral reserves set out above, at December 31, 2012, the La India mine project (including the Tarachi deposit) contained measured mineral resources
of 1,662,000 tonnes grading 0.29 grams of gold per tonne, indicated mineral resources of 41,530,000 tonnes grading 0.42 grams of gold per tonne and inferred mineral
resources of 81,002,000 tonnes of ore grading 0.39 grams of gold per tonne.
- (3)
- Complete information on the verification procedures, the quality assurance program, quality control procedures, parameters and methods and other factors that may materially affect scientific and technical information presented in this Form 20-F relating to the La India mine project may be found in the Technical Report on the June 30, 2012 Update of the Mineral Resources and Mineral Reserves, La India Gold Project, Municipality of Sahuaripa, Sonora, Mexico, dated August 31, 2012, filed with the Canadian securities regulatory authorities on SEDAR on October 12, 2012.
82 AGNICO-EAGLE MINES LIMITED
Meadowbank Mine Mineral Reserves and Mineral Resources
| As at December 31, | ||||||||
| 2012 | 2011 | 2010 | ||||||
| Gold | ||||||||
Proven mineral reserves – tonnes |
1,764,000 |
1,931,000 |
839,000 |
|||||
| Average grade – gold grams per tonne | 1.56 | 1.49 | 3.13 | |||||
| Probable mineral reserves – tonnes | 23,560,000 | 22,563,000 | 33,259,000 | |||||
| Average grade – gold grams per tonne | 2.91 | 2.91 | 3.18 | |||||
| Total proven and probable mineral reserves – tonnes | 25,324,000 | 24,494,000 | 34,098,000 | |||||
| Average grade – gold grams per tonne | 2.82 | 2.79 | 3.18 | |||||
| Total contained gold ounces | 2,294,000 | 2,201,000 | 3,486,000 | |||||
Notes:
- (1)
- The
2012 mineral reserve and mineral resource estimates were calculated using a metallurgical gold recovery of 91% or 94%, depending on the deposit. The economic cut-off
grade used to determine the open pit reserves varied from 1.14 grams of gold per tonne to 1.16 grams of gold per tonne, depending on the deposit, and is 1.03 to 1.06 grams of gold
per tonne as a marginal cut-off grade, depending on the deposit. The estimated ore-based operating costs used for the 2012 mineral reserve estimate varied between C$53.60 per
tonne and C$54.72 per tonne, depending on the deposit, with an additional haulage cost of C$1.12 for Vault deposit reserves. The Company estimates that a 10% change in the gold price would result in
an approximate 0.2% change in mineral reserves.
- (2)
- In
addition to the mineral reserves set out above, at December 31, 2012, the Meadowbank mine contained measured mineral resources of 1,441,000 tonnes grading
0.93 grams of gold per tonne, indicated mineral resources of 8,885,000 tonnes grading 2.75 grams of gold per tonne and inferred mineral resources of 3,589,000 tonnes of ore
grading 3.81 grams of gold per tonne.
- (3)
- The following table shows the reconciliation of mineral reserves (in nearest thousand tonnes) at the Meadowbank mine by category at December 31, 2012 with those at December 31, 2011. Revision means additional mineral reserves converted from mineral resources or other categories of mineral reserves, an update to mineral reserves based on changed mine plans, and mineral reserves added from exploration activities during 2012.
| Proven | Probable | Total | |||||
| December 31, 2011 | 1,931 | 22,563 | 24,494 | ||||
| Processed in 2012 | 3,821 | – | 3,821 | ||||
| Revision | 3,654 | 997 | 4,651 | ||||
| December 31, 2012 | 1,764 | 23,560 | 25,324 | ||||
- (4)
- Complete information on the verification procedures, the quality assurance program, quality control procedures, parameters and methods and other factors that may materially affect scientific and technical information presented in this Form 20-F relating to the Meadowbank mine may be found in the Technical Report on the Mineral Resources and Mineral Reserves at Meadowbank Gold Mine, Nunavut, Canada as at December 31, 2011 filed with Canadian securities regulatory authorities on SEDAR on March 23, 2012.
2012 ANNUAL REPORT 83
Meliadine Project Mineral Reserves and Mineral Resources
| As at December 31, | ||||||||
| 2012 | 2011 | 2010 | ||||||
| Gold | ||||||||
| Proven mineral reserves – tonnes | 34,000 | 34,000 | – | |||||
| Average grade – gold grams per tonne | 7.31 | 7.31 | – | |||||
| Probable mineral reserves – tonnes | 13,266,000 | 12,434,000 | 9,467,000 | |||||
| Average grade – gold grams per tonne | 6.98 | 7.18 | 6.49 | |||||
| Total proven and probable mineral reserves – tonnes | 13,300,000 | 12,468,000 | 9,467,000 | |||||
| Average grade – gold grams per tonne | 6.98 | 7.18 | 6.49 | |||||
| Total contained gold ounces | 2,987,000 | 2,877,000 | 2,600,000 | |||||
Notes:
- (1)
- The
2012 mineral reserve and mineral resource estimates were calculated using metallurgical gold recovery curves for Tiriganiaq and F Zone. The curves give a maximum recovery of 96%
for Tiriganiaq and 93% for F Zone. The 2012 mineral resource estimates for all other zones were calculated using a metallurgical gold recovery of 94%, except for Wolf and Pump, which were calculated
using a metallurgical gold recovery of 95% and 90%, respectively. The cut-off grade used to determine the open pit reserves was 1.94 grams of gold per tonne, undiluted
(1.69 grams of gold per tonne, diluted), and the cut-off grade used to determine the underground reserves was 4.89 grams of gold per tonne, undiluted (3.62 grams of
gold per tonne, diluted). The estimated operating cost used for the 2012 mineral reserve estimate was C$74.71 per tonne for open pit and C$165.65 per tonne for underground. The Company estimates that
a 10% change in the gold price would result in an approximate 3.5% change in mineral reserves.
- (2)
- In
addition to the mineral reserves set out above, at December 31, 2012, the Meliadine project contained indicated mineral resources of 17,234,000 tonnes grading
3.94 grams of gold per tonne and inferred mineral resources of 14,816,000 tonnes of ore grading 6.15 grams of gold per tonne.
- (3)
- The breakdown of mineral reserves between planned open pit operations and underground operations at the Meliadine project (with tonnage and contained ounces rounded to the nearest thousand) at December 31, 2012 is:
| Category | Mining Method |
Tonnes | Gold Grade (g/t) |
Contained Gold (oz) |
|||||
| Proven mineral reserves | Open pit stockpile | 34,000 | 7.31 | 8,000 | |||||
| Probable mineral reserves | Open pit | 5,172,000 | 5.85 | 973,000 | |||||
| Probable mineral reserves | Underground | 8,094,000 | 7.71 | 2,006,000 | |||||
| Total probable mineral reserves | 13,266,000 | 6.98 | 2,979,000 | ||||||
| Total proven and probable mineral reserves | 13,300,000 | 6.98 | 2,987,000 | ||||||
- (4)
- Complete information on the verification procedures, the quality assurance program, quality control procedures, parameters and methods and other factors that may materially affect scientific and technical information presented in this Form 20-F relating to the Meliadine project may be found in the Technical Report on the December 31, 2010 Mineral Resource and Mineral Reserve Estimate, Meliadine Gold Project, Nunavut, Canada filed with the Canadian securities regulatory authorities on SEDAR on March 8, 2011.
Risk Mitigation
The Company mitigates the likelihood and potential severity of the various risks it encounters in its day-to-day operations through the application of high standards in the planning, construction and operation of mining facilities. In addition, emphasis is placed on hiring and retaining competent personnel and developing their skills through training in safety and loss control. The Company's operating and technical personnel have a solid track record of developing and operating precious metal mines and several of the Company's mines have been recognized for excellence in this regard with various safety and development awards. Nevertheless, the Company and its employees continue with a focused effort to improve workplace safety and the Company has placed additional emphasis on safety procedure training for both mining and supervisory employees.
The Company also mitigates some of the Company's normal business risk through the purchase of insurance coverage. An Insurable Risk Management Policy, approved by the Board, governs the purchase of insurance coverage and only permits the purchase of coverage from insurance companies of the highest credit quality. For a more complete list of the risk factors affecting the Company, please see "Item 3 Key Information – Risk Factors".
84 AGNICO-EAGLE MINES LIMITED
Glossary of Selected Mining Terms
| "acid mine drainage" | Acidic run-off water from mines and mine waste containing sulphide minerals. | |
| "alteration" | Any physical or chemical change in the mineral composition of a rock subsequent to its formation, generally produced by weathering or hydrothermal solutions. Milder and more localized than metamorphism. | |
| "anastomosing" | A network of branching and rejoining fault or vein surfaces or surface traces. | |
| "andesite" | A dark-coloured, fine-grained calc-alkaline volcanic rock of intermediate composition. | |
| "assay" | To analyze the proportions of metals in an ore; to test an ore or mineral for composition, purity, weight or other properties of commercial interest. | |
| "banded iron formation" | An iron formation that shows marked banding, generally of iron-rich minerals and chert or fine-grained quartz. | |
| "bedrock" | Solid rock exposed at the surface of the Earth or overlain by unconsolidated material, weathered rock or soil. | |
| "bench" | A ledge in an open-pit mine that forms a single level of operation above which minerals or waste rock are excavated. The ore or waste is removed in successive layers (benches), several of which may be in operation simultaneously. | |
| "breccia" | A rock in which angular rock fragments are surrounded by a mass of fine-grained minerals. | |
| "brittle" | Of minerals, proneness to fracture under low stress. A quality affecting behaviour during comminution of ore, whereby one species fractures more readily than others in the material being crushed. | |
| "bulk mining" | A method of mining in which large quantities of low-grade ore are mined without attempt to segregate the high-grade portions. | |
| "byproduct" | A secondary metal or mineral product recovered from the processing of rock. | |
| "carbon-in-leach (CIL)" | A precious metals recovery step in the mill. Gold and silver are leached from the ground ore and at the same time adsorbed onto granules of activated carbon, which is then separated by screening and processed to remove the precious metals. | |
| "carbon-in-pulp (CIP)" | A precious metals recovery step in the mill. After gold and silver have been leached from ground ore, they are adsorbed onto granules of activated carbon, which is then separated by screening and processed to remove the precious metals. A CIP circuit comprises a series of tanks through which leached slurry flows. Gold is captured onto captive activated carbon that will periodically be moved counter-currently from tank to tank. Head tank carbon is extracted periodically to further recover adsorbed gold before being returned to the circuit tails tank. | |
| "chalcopyrite" | A sulphide mineral of copper and iron; the most important ore mineral of copper. | |
| "concentrate" | The clean product recovered by froth flotation in the plant. | |
| "conglomerate" | A coarse-grained sedimentary rock composed of rounded fragments set in a fine-grained cemented matrix. | |
| "contact" | A plane or irregular surface between two types or ages of rock. | |
| "counter-current decantation" | The clarification of washery water and the concentration of tailings by the use of several thickeners in series. The water flows in the opposite direction from the solids. The final products are slurry that is removed and clear water that is reused in the circuit. | |
| "crosscut" | An underground passage driven from a shaft toward the ore, at (or near) right angles to the strike of a vein or other orebody. | |
| "cut-off grade" | The minimum metal grade in an ore that can be mined profitably. |
2012 ANNUAL REPORT 85
| "cyanidation" | A method of extracting exposed gold or silver grains from crushed or ground ore by dissolving (leaching) it in a weak cyanide solution. May be carried out in tanks inside a mill or in heaps of ore out of doors (heap leach). | |
| "deposit" | A natural occurrence of mineral or mineral aggregate, in such quantity and quality to invite exploitation. | |
| "development" | The preparation of a mining property or area so that an orebody can be analyzed and its tonnage and quality estimated. Development is an intermediate stage between exploration and mining. | |
| "diamond drill" | A drilling machine with a rotating, hollow, diamond-studded bit that cuts a circular channel around a core, which can be recovered to provide a more-or-less continuous and complete columnar sample of the rock penetrated. | |
| "dilution" | The contamination of ore with barren wall rock in stoping, increasing tonnage mined and lowering the overall ore grade. | |
| "dip" | The angle at which a vein, structure or rock bed is inclined from the horizontal as measured at right angles to the strike. | |
| "disseminated" | Said of a mineral deposit (especially of metals) in which the desired minerals occur as scattered particles in the rock, but in sufficient quantity to make the deposit an ore. Some disseminated deposits are very large. | |
| "dore" | Unrefined gold and silver bullion bars, which will be further refined to almost pure metal. | |
| "drift" | A horizontal opening in or near an orebody and parallel to the long dimension of the orebody, as opposed to a crosscut that crosses the orebody. | |
| "ductile" | Of rock, able to sustain, under a given set of conditions, 5% to 10% deformation before fracturing or faulting. | |
| "dyke" | An earthen embankment, as around a drill sump or tank, or to impound a body of water or mill tailings. Also, a tabular body of igneous rock that cuts across the structure of adjacent rocks. | |
| "electrowinning" | An electrochemical process in which a metal dissolved within an electrolyte is plated onto an electrode. Used to recover metals such as copper and gold from solution in the leaching of concentrates, etc. | |
| "envelope" | 1. The outer or covering part of a fold, especially of a folded structure that includes some sort of structural break. | |
| 2. A metamorphic rock surrounding an igneous intrusion. | ||
| 3. In a mineral, an outer part different in origin from an inner part. | ||
| "epigenetic" | Orebodies formed by hydrothermal fluids and gases that were introduced into the host rocks from elsewhere, filling cavities in the host rock. | |
| "epithermal" | Referring to a mineral deposit that formed later than the enclosing rocks consisting of veins and replacement bodies, containing precious metals or, more rarely, base metals. | |
| "extensional-shear vein" | A vein put in place in an extension fracture caused by the deformation of a rock. | |
| "fault" | A fracture or a fracture zone in crustal rocks along which there has been displacement of the two sides relative to one another parallel to the fracture. The displacement may be a few inches or many kilometres long. |
86 AGNICO-EAGLE MINES LIMITED
| "feasibility study" | A comprehensive technical and economic study of the selected development option for a mineral project that includes appropriately detailed assessments of realistically assumed mining, processing, metallurgical, economic, marketing, legal, environmental, social and governmental considerations, together with any other relevant operational factors and a detailed financial analysis, that are necessary to demonstrate at the time of reporting that extraction is reasonably justified (economically mineable). The results of the study may reasonably serve as the basis for a final decision by a proponent or financial institution to proceed with, or finance, the development of the project. The confidence level of the study will be higher than that of a pre-feasibility study. | |
| "felsic" | A term used to describe light-coloured rocks containing feldspar, feldspathoids and silica. | |
| "flotation" | The method of mineral separation in which a froth created by a variety of reagents floats some finely crushed minerals, whereas other minerals sink. The metal-rich flotation concentrate is then skimmed off the surface. | |
| "flowsheet" | A diagram showing the progress of material through a treatment plant. | |
| "foliation" | A general term for a planar arrangement of features in any type of rock, especially the planar structure that results in a metamorphic rock. | |
| "footwall" | The rock beneath an inclined vein or ore deposit. (Opposite of a hanging wall). | |
| "fracture" | Any break in a rock, whether or not it causes displacement, due to mechanical failure by stress; includes cracks, joints and faults. | |
| "free gold" | Gold not combined with other substances. | |
| "glacial till" | Dominantly unsorted and unstratified, unconsolidated rock debris, deposited directly by and underneath a glacier. | |
| "grade" | The relative quantity or the percentage of metal content of an orebody, e.g., grams of gold per tonne of rock, or percent copper. | |
| "greenstone belt" | An area underlain by metamorphosed volcanic and sedimentary rocks, usually in a continental shield. | |
| "grouting" | The process of sealing off a water flow in rocks by forcing a thin slurry of cement or other chemicals into the crevices; usually done through a diamond drill hole. | |
| "hanging wall" | The rock on the upper side of a vein or ore deposit. | |
| "head grade" | The average grade of ore fed into a mill. | |
| "hectare" | A metric measurement of area. 1 hectare = 10,000 square metres = 2.47 acres. | |
| "horst" | An up-faulted block of rock. | |
| "hydrothermal alteration" | Alteration of rocks or minerals by reaction with hydrothermal (magmatic) fluids. | |
| "igneous rock" | Rock formed by the solidification of molten material that originated within the Earth. | |
| "indicated mineral resource" | That part of a mineral resource for which quantity, grade or quality, densities, shape and physical characteristics can be estimated with a level of confidence sufficient to allow the appropriate application of technical and economic parameters to support mine planning and evaluation of the economic viability of the deposit. The estimate is based on detailed and reliable exploration and testing information gathered through appropriate techniques from locations such as outcrops, trenches, pits, workings and drill holes that are spaced closely enough for geological and grade continuity to be reasonably assumed. | |
| While this term is recognized and required by Canadian regulations, the SEC does not recognize it. Investors are cautioned not to assume that any part or all of the mineral deposits in this category will ever be converted into mineral reserves. |
2012 ANNUAL REPORT 87
| "inferred mineral resource" | That part of a mineral resource for which quantity and grade or quality can be estimated on the basis of geological evidence and limited sampling and reasonably assumed, but not verified, geological and grade continuity. The estimate is based on limited information and sampling gathered through appropriate techniques from locations such as outcrops, trenches, pits, workings and drill holes. | |
| While this term is recognized and required by Canadian regulations, the SEC does not recognize it. Investors are cautioned not to assume that any part or all of the mineral deposits in this category will ever be converted into mineral reserves. Investors are cautioned not to assume that part of or all of an inferred mineral resource exists, or is economically or legally mineable. | ||
| "infill drilling" | Drilling within a defined mineralized area to improve the definition of known mineralization. | |
| "intrusive" | A body of igneous rock formed by the consolidation of magma intruded below surface into other rocks, in contrast to lavas, which are extruded upon the Earth's surface. | |
| "iron formation" | A chemical sedimentary rock, typically thin-bedded or finely laminated, containing at least 15% iron of sedimentary origin and commonly containing layers of chert. | |
| "kilometre" | A metric measurement of distance. 1.0 kilometre = 1,000 metres = 0.62 miles. | |
| "leaching" | A chemical process for the extraction of valuable minerals from ore; also, a natural process by which ground waters dissolve minerals. | |
| "lens" | A geological deposit that is thick in the middle and tapers towards the ends, resembling a convex lens. | |
| "lithologic groups" | Groups of rock formations. | |
| "lode" | A mineral deposit consisting of a zone of veins, veinlets or disseminations. | |
| "longitudinal retreat" | An underground mining method where the ore is excavated in horizontal slices along the orebody and the stoping starts below and advances upwards. The ore is recovered underneath in the stope. | |
| "mafic" | Igneous rocks composed mostly of dark, iron- and magnesium-rich silicate minerals. | |
| "massive" | Said of a mineral deposit, especially of sulphides, characterized by a great concentration of ore in one place, as opposed to a disseminated or vein-like deposit. Said of any rock that has a homogeneous texture or fabric over a large area, with an absence of layering or any similar directional structure. | |
| "matrix" | The fine-grained rock material in which a larger mineral is embedded. | |
| "measured mineral resource" | That part of a mineral resource for which quantity, grade or quality, densities, shape and physical characteristics are so well established that they can be estimated with confidence sufficient to allow the appropriate application of technical and economic parameters to support production planning and evaluation of the economic viability of the deposit. The estimate is based on detailed and reliable exploration, sampling and testing information gathered through appropriate techniques from locations such as outcrops, trenches, pits, workings and drill holes that are spaced closely enough to confirm both geological and grade continuity. | |
| While this term is recognized and required by Canadian regulations, the SEC does not recognize it. Investors are cautioned not to assume that any part or all of the mineral deposits in this category will ever be converted into mineral reserves. |
88 AGNICO-EAGLE MINES LIMITED
| "Merrill-Crowe process" | A separation technique for removing gold from a cyanide solution. The solution is separated from the ore by methods such as filtration and counter-current decantation, and then the gold is precipitated onto zinc dust. Silver and copper may also precipitate. The precipitate is filtered to capture the gold slimes, which are further refined, e.g., by smelting, to remove the zinc and by treating with nitric acid to dissolve the silver. | |
| "metallurgical properties" | Properties characterizing metals and minerals behaviour under various processing techniques. | |
| "metamorphism" | The process by which the form or structure of sedimentary or igneous rocks is changed by heat and pressure. | |
| "mill" | A mineral treatment plant in which crushing, wet grinding and further treatment of ore is conducted; also a revolving drum used for the grinding of ores in preparation for treatment. | |
| "mineral resource" | A concentration or occurrence of diamonds, natural solid inorganic material or natural solid fossilized organic material including base and precious metals, coal and industrial minerals in or on the Earth's crust in such form and quantity and of such a grade or quality that it has reasonable prospects for economic extraction. The location, quantity, grade, geological characteristics and continuity of a mineral resource are known, estimated or interpreted from specific geological evidence and knowledge. Investors are cautioned not to assume that any part or all of the mineral deposits in any category of resources will ever be converted into mineral reserves. | |
| "mineral reserve" | The economically mineable part of a measured or indicated mineral resource demonstrated by at least a preliminary feasibility study. This study must include adequate information on mining, processing, metallurgical, economic and other relevant factors that demonstrate, at the time of reporting, that economic extraction can be justified. A mineral reserve includes diluting materials and allowances for losses that may occur when the material is mined. | |
| "muck" | Finely blasted rock (ore or waste) underground. | |
| "net smelter return royalty" | A royalty payment made by a producer of metals based on the proceeds from the sale of mineral products after deducting off-site processing and distribution costs including smelting, refining, transportation and insurance costs. | |
| "ounce" | A measurement of weight, especially used for gold, silver and platinum group metals. 1 troy ounce = 31.1035 grams. | |
| "outcrop" | The part of a rock formation that appears at the surface of the Earth. | |
| "oxidation" | A chemical reaction caused by exposure to oxygen, which results in a change in the chemical composition of a mineral. | |
| "phenocryst" | Large crystals or mineral grains floating in the matrix or groundmass of a porphyry. | |
| "pillar" | A block of ore or other rock entirely surrounded by stoping, left intentionally for purposes of ground control or on account of low value. | |
| "plunge" | The inclination of a fold axis or other linear structure from a horizontal plane, measured in the vertical plane. | |
| "polydeformed" | A rock that has been subjected to more than one instance of folding, faulting, shearing, compression or extension as a result of various tectonic forces. | |
| "porphyritic" | Rock texture in which one or more minerals has a larger grain size than the accompanying minerals. | |
| "porphyry" | Any igneous rock in which relatively large crystals, called phenocrysts, are set in a fine-grained groundmass. |
2012 ANNUAL REPORT 89
| "preliminary feasibility study" or "pre-feasibility study" | A comprehensive study of a range of options for the technical and economic viability of a mineral project that has advanced to a stage where a preferred mining method (in the case of underground mining) or the pit configuration (in the case of an open pit) is established, and an effective method of mineral processing is determined. It includes a financial analysis based on reasonable assumptions on mining, processing, metallurgical, economic, marketing, legal, environmental, social and governmental considerations and the evaluation of any other relevant factors which are sufficient for a qualified person, acting reasonably, to determine if all or part of the mineral resource may be classified as a mineral reserve. | |
| "pressure oxidation" | A process by which sulphide minerals are oxidized in order to expose gold that is encapsulated in the mineral lattice. The main component of a pressure oxidation circuit consists of a pressurized vessel (autoclave) where the oxygen level, process temperature and acidity are the primary control parameters. | |
| "probable mineral reserve" | The economically mineable part of an indicated and, in some circumstances, a measured mineral resource demonstrated by at least a preliminary feasibility study. | |
| "proven mineral reserve" | The economically mineable part of a measured mineral resource demonstrated by at least a preliminary feasibility study. | |
| "pyrite" | A yellow iron sulphide mineral, FeS2, normally of little value. It is sometimes referred to as "fool's gold". | |
| "pyroclastic" | Rocks produced by explosive or aerial ejection of ash, fragments and glassy material from a volcanic vent. | |
| "recovery" | The percentage of valuable metal in the ore that is recovered by metallurgical treatment. | |
| "reverse circulation drilling" | A type of drilling into rock using a solid bit to produce a hole and deliver rock chips (rather than core) to surface for analysis. | |
| "rock burst" | A sudden and often violent breaking of a mass of rock from the walls of a mine, caused by failure of highly stressed rock and the rapid release of accumulated strain energy. | |
| "run-of-mine ore" | The raw, mined material as it is delivered, prior to sorting, stockpiling or treatment. | |
| "sandstone" | A sedimentary rock consisting of grains of sand cemented together. | |
| "schist" | A strongly foliated crystalline rock that can be readily split into thin flakes or slabs due to the well-developed parallelism of more than 50% of the minerals present in it, such as mica or hornblende. | |
| "sedimentary rocks" | Rocks resulting from the consolidation of loose sediment that has accumulated in layers. Examples are limestone, shale and sandstone. | |
| "semi-autogenous grinding (SAG)" | A method of grinding rock whereby larger chunks of the rock itself and steel balls form the grinding media. | |
| "shear" or "shearing" | The deformation of rocks by lateral movement along innumerable parallel planes, generally resulting from pressure and producing metamorphic structures such as cleavage and schistosity. | |
| "shear zone" | A tabular zone of rock that has been crushed and brecciated by many parallel fractures due to shear stress. Such an area is often mineralized by ore-forming solutions. | |
| "sill" | An intrusive sheet of igneous rock of roughly uniform thickness that has been forced between the bedding planes of existing rock. | |
| "slurry" | Fine rock particles in circulating water in a treatment plant. |
90 AGNICO-EAGLE MINES LIMITED
| "stope" | 1. Any excavation in a mine, other than development workings, made for the purpose of extracting ore. | |
| 2. To excavate ore in an underground mine. | ||
| "strike" | The direction, or bearing from true north, of a horizontal line on a vein or rock formation at right angles to the dip. | |
| "stringers" | Mineral veinlets or filaments occurring in a discontinuous subparallel pattern in a host rock. | |
| "sublevel retreat" | An underground mining method in which the ore is excavated in horizontal slices along the orebody, starting below and advancing upwards. The ore is recovered underneath in the stope. | |
| "sulphide" | A mineral characterized by the linkage of sulphur with a metal, such as pyrite, FeS2. | |
| "tabular" | Said of a feature having two dimensions that are much larger or longer than the third, such as a dyke. | |
| "tailings" | Material rejected from a mill after the economically and technically recoverable valuable minerals have been extracted. | |
| "tailings dam" or "tailings impoundment" or "tailings pond" | Area closed at the lower end by a constraining wall or dam to which mill effluents are sent, the prime function of which is to allow enough time for metals to settle out or for cyanide to be naturally destroyed before the water is returned to the mill or discharged into the local watershed. | |
| "tenement" | The right to enter, develop and work a mineral deposit. Includes a mining claim or a mining lease. A synonym of mineral title. | |
| "thickener" | A vessel for reducing the proportion of water in a pulp by means of sedimentation. | |
| "thickness" | The distance at right angles between the hanging wall and the footwall of a lode or lens. | |
| "tonne" | A metric measurement of mass. 1 tonne = 1,000 kilograms = 2,204.6 pounds = 1.1 tons. | |
| "transfer fault" | A structure that can accommodate lateral variations of deformation and strain. | |
| "transverse open stoping" | An underground mining method in which the ore is excavated in horizontal slices perpendicular to the orebody length and the stoping starts below and advances upwards. The ore is recovered underneath the stope through a drawpoint system. | |
| "trench" | A narrow excavation dug through overburden, or blasted out of rock, to expose a vein or ore structure for sampling or observation. | |
| "vein" | A mineral filling of a fault or other fracture in a host rock. | |
| "wacke" | A "dirty" sandstone that consists of a mixture of poorly sorted mineral and rock fragments in an abundant matrix of clay and fine silt. | |
| "winze" | An internal mine shaft. | |
| "Zadra elution circuit" | The process in this part of a gold mill strips gold and silver from carbon granules and puts them into solution. | |
| "zone" | An area of distinct mineralization, i.e., a deposit. |
ITEM 4A UNRESOLVED STAFF COMMENTS
None.
2012 ANNUAL REPORT 91
ITEM 5 OPERATING AND FINANCIAL REVIEW AND PROSPECTS
Results of Operations
Revenues from Mining Operations
In 2012, revenue from mining operations increased by 5% to $1,917.7 million from $1,821.8 million in 2011. The increase in revenue was primarily attributable to higher sales prices and sales volumes realized on gold in 2012 compared with 2011.
In 2012, sales of precious metals (gold and silver) accounted for 97% of revenues from mining operations, up from 95% in 2011 and 93% in 2010. The increase in the percentage of revenues from precious metals compared with 2011 is due primarily to higher sales prices and sales volumes realized on gold and lower sales volumes on zinc, offset partially by decreases in sales volumes and sales prices realized on silver. Revenues from mining operations are accounted for net of related smelting, refining, transportation and other charges.
The table below details revenues from mining operations, production volumes and sales volumes by metal:
| 2012 | 2011 | 2010 | |||||
| (thousands of United States dollars) | |||||||
| Revenues from mining operations: | |||||||
| Gold | $1,712,666 | $1,563,760 | $1,216,249 | ||||
| Silver | 140,221 | 171,725 | 104,544 | ||||
| Zinc | 45,797 | 70,522 | 77,544 | ||||
| Copper | 19,018 | 14,451 | 22,219 | ||||
| Lead | 12 | 1,341 | 1,965 | ||||
| $1,917,714 | $1,821,799 | $1,422,521 | |||||
Production volumes: |
|||||||
| Gold (ounces) | 1,043,811 | 985,460 | 987,609 | ||||
| Silver (000s ounces) | 4,646 | 5,080 | 4,812 | ||||
| Zinc (tonnes) | 38,637 | 54,894 | 62,544 | ||||
| Copper (tonnes) | 4,126 | 3,216 | 4,224 | ||||
Sales volumes: |
|||||||
| Gold (ounces) | 1,028,062 | 996,090 | 973,057 | ||||
| Silver (000s ounces) | 4,556 | 5,089 | 4,722 | ||||
| Zinc (tonnes) | 42,604 | 54,499 | 59,566 | ||||
| Copper (tonnes) | 4,115 | 3,194 | 4,223 | ||||
Revenues from gold sales increased by $148.9 million, or 10%, in 2012 compared with 2011. Gold production increased by 6% to 1,043,811 ounces in 2012 from 985,460 ounces in 2011. A 35% increase in gold production at the Meadowbank mine due to higher gold grades and ore milled and increases in gold grades at the LaRonde and Kittila mines were the primary contributors to the Company's overall gold production increase in 2012 compared with 2011. Partially offsetting these increases in gold production was the absence of production from the Goldex mine project in 2012 due to the suspension of mining operations at the GEZ on October 19, 2011. Average realized gold price increased 6% to $1,667 per ounce in 2012 from $1,573 per ounce in 2011.
Revenues from silver sales decreased by $31.5 million, or 18%, in 2012 compared with 2011 due primarily to a lower realized silver price and lower silver grade and silver mill recoveries at the LaRonde mine. Revenues from zinc sales
92 AGNICO-EAGLE MINES LIMITED
decreased by $24.7 million, or 35%, to $45.8 million in 2012 compared with 2011 due primarily to lower zinc grades at the LaRonde mine. Revenues from copper sales increased by $4.6 million, or 32%, in 2012 compared with 2011 due primarily to higher realized copper sales prices between periods and higher copper grades at the LaRonde mine.
Production Costs
In 2012, total production costs were $897.7 million compared with $876.1 million in 2011. This increase is due primarily to a 28% increase in throughput at the Meadowbank mine between 2011 and 2012 made possible by the addition of a secondary crusher in June 2011 and improved equipment availability. The overall increase in production costs was partially offset by the suspension of mining operations at the Goldex mine on October 19, 2011.
The table below details production costs by mine:
| Production Costs | 2012 | 2011 | 2010 | ||||
| (thousands of United States dollars) | |||||||
| LaRonde mine | $225,647 | $209,947 | $189,146 | ||||
| Goldex mine | – | 56,939 | 61,561 | ||||
| Lapa mine | 73,376 | 68,599 | 66,199 | ||||
| Kittila mine | 98,037 | 110,477 | 87,740 | ||||
| Pinos Altos mine | 152,942 | 145,614 | 90,293 | ||||
| Meadowbank mine | 347,710 | 284,502 | 182,533 | ||||
| Production costs per consolidated statements of income (loss) and comprehensive income (loss) | $897,712 | $876,078 | $677,472 | ||||
Production costs at the LaRonde mine were $225.6 million in 2012, an increase of 7% compared with 2011 production costs of $209.9 million. During 2012, the LaRonde mine processed an average of 6,444 tonnes of ore per day compared with 6,592 tonnes of ore per day during 2011. The decrease in throughput between periods was due primarily to heat and congestion challenges associated with ore sourced from the deeper LaRonde mine extension. Minesite costs per tonne were C$98 in the fourth quarter of 2012 compared with C$79 in the fourth quarter of 2011. For the full year 2012, minesite costs per tonne were C$95 compared with C$84 per tonne in 2011. The increase in minesite costs per tonne in 2012 compared with 2011 is attributable primarily to lower throughput and general cost increases.
Production costs at the Goldex mine were nil in 2012 compared with $56.9 million in 2011. The absence of production costs in 2012 is a result of the suspension of Goldex mine operations on October 19, 2011. Minesite costs per tonne were nil in the fourth quarter of 2012 compared to C$21 in the fourth quarter of 2011 when the surface stockpile that remained after the suspension of mining operations was milled. For the full year 2012, minesite costs per tonne were nil compared with C$21 per tonne in 2011.
Production costs at the Lapa mine were $73.4 million in 2012, an increase of 7% compared with 2011 production costs of $68.6 million. During 2012, the Lapa mine processed an average of 1,749 tonnes of ore per day, an increase of 3% over the 1,701 tonnes of ore per day processed during 2011. The increase in throughput between 2011 and 2012 was due primarily to improved maintenance scheduling and mill optimization. Minesite costs per tonne were C$113 in the fourth quarter of 2012 compared with C$117 in the fourth quarter of 2011. For the full year 2012, minesite costs per tonne were up slightly but essentially unchanged at C$115 compared with C$110 per tonne in 2011.
Production costs at the Kittila mine were $98.0 million in 2012, a decrease of 11% compared with 2011 production costs of $110.5 million. During 2012, the Kittila mine processed an average of 2,979 tonnes of ore per day, an increase of 5% over the 2,824 tonnes of ore per day processed during 2011 due primarily to an increase in autoclave availability. Minesite costs per tonne were €69 in the fourth quarter of 2012 compared with €80 in the fourth quarter of 2011. For the full year 2012, minesite costs per tonne were €69 compared with €75 per tonne in 2011 due primarily to increased contractor efficiencies and to relatively lower costs associated with mining the final benches of the open pit during 2012.
2012 ANNUAL REPORT 93
Production costs at the Pinos Altos mine, including the Creston Mascota deposit, were $152.9 million in 2012, an increase of 5% compared with 2011 production costs of $145.6 million. During 2012, the Pinos Altos mine processed an average of 12,007 tonnes of ore per day, a decrease of 3% compared with the 12,355 tonnes of ore per day processed during 2011 due primarily to the temporary suspension of heap leach stacking at the Creston Mascota deposit in September 2012. Minesite costs per tonne were $46 in the fourth quarter of 2012 compared with $24 in the fourth quarter of 2011. For the full year 2012, minesite costs per tonne were $31 compared with $27 per tonne in 2011. The increase in minesite costs per tonne between 2011 and 2012 is mainly attributable to the absence of lower cost heap leach tonnes processed from the Creston Mascota deposit during the fourth quarter of 2012.
Production costs at the Meadowbank mine were $347.7 million in 2012, an increase of 22% compared with 2011 production costs of $284.5 million. During 2012, the Meadowbank mine processed an average of 10,440 tonnes of ore per day, an increase of 28% over the 8,158 tonnes of ore per day processed during 2011 due primarily to the June 2011 addition of the permanent secondary crusher and improvements in equipment availability and equipment maintenance. Minesite costs per tonne were C$90 in the fourth quarter of 2012 compared with C$98 in the fourth quarter of 2011. For the full year 2012, minesite costs per tonne were C$88 compared with C$91 per tonne in 2011. The decrease in minesite costs per tonne between 2011 and 2012 is mainly attributable to a reduction in waste tonnes moved under the revised Meadowbank mine plan and overall productivity gains.
Total Production Costs by Category
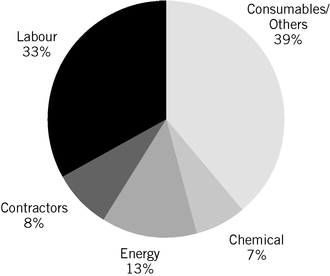
Total cash costs per ounce of gold produced, representing the weighted average of all of the Company's producing mines, increased to $640 in 2012 from $580 in 2011 and $451 in 2010. At the LaRonde mine, total cash costs per ounce of gold increased from $77 in 2011 to $569 in 2012 due primarily to significantly lower byproduct revenue as the mine transitions to ore sourced from lower levels, and previously noted challenges with heat and congestion at the deeper levels. Total cash costs per ounce of gold at the Goldex mine were $401 in 2011 until the suspension of operations on October 19, 2011. At the Lapa mine, total cash costs per ounce of gold increased from $650 in 2011 to $697 in 2012 due to general mining industry cost increases. At the Kittila mine, total cash costs per ounce of gold decreased from $739 in 2011 to $565 in 2012 due primarily to a 23% increase in gold production and improved efficiencies in the use of consumables and contractors. Total cash costs per ounce of gold at the Pinos Altos mine, including the Creston Mascota deposit, decreased from $299 in 2011 to $286 in 2012 due primarily to increased production between these periods. Despite the temporary suspension of heap leach operations at the Creston Mascota deposit effective October 1, 2012, gold production increased by 30,457 ounces at the Pinos Altos mine overall in 2012 compared with 2011. At the Meadowbank mine, total cash costs per ounce of gold decreased from $1,000 in 2011 to $913 in 2012 due primarily to increased gold production and to the successful implementation of the revised mine plan in 2012.
Total cash costs per ounce of gold produced is not a recognized measure under US GAAP and this data may not be comparable to data presented by other gold producers. This measure is calculated by adjusting production costs as recorded in the consolidated statements of income (loss) and comprehensive income (loss) for byproduct revenues, unsold concentrate inventory production costs, non-cash reclamation provisions, deferred stripping costs and other adjustments, and then dividing by the number of ounces of gold produced. The Company believes that this generally accepted industry measure is a realistic indication of operating performance and is a useful comparison point between
94 AGNICO-EAGLE MINES LIMITED
periods. Total cash costs per ounce of gold produced is intended to provide investors with information about the cash generating capabilities of the Company's mining operations. Management also uses this measure to monitor the performance of the Company's mining operations. As market prices for gold are quoted on a per ounce basis, using this per ounce measure allows management to assess a mine's cash generating capabilities at various gold prices. Management is aware that this per ounce measure of performance can be impacted by fluctuations in byproduct metal prices and exchange rates. Management compensates for these inherent limitations by using this measure in conjunction with minesite costs per tonne (discussed below) as well as other data prepared in accordance with US GAAP. Management also performs sensitivity analyses in order to quantify the effects of fluctuating metal prices and exchange rates.
The World Gold Council and its members are working to develop a new production cost measure, potentially termed "all-in sustaining cash costs". The Company will work with the World Gold Council and its members to define and endorse this new measure, expected to be finalized in 2013.
Minesite costs per tonne is not a recognized measure under US GAAP and this data may not be comparable to data presented by other gold producers. This measure is calculated by adjusting production costs as shown in the consolidated statements of income (loss) and comprehensive income (loss) for unsold concentrate inventory production costs, non-cash reclamation provisions, deferred stripping costs and other adjustments, and then dividing by tonnes of ore processed. As the total cash costs per ounce of gold produced measure can be impacted by fluctuations in byproduct metal prices and exchange rates, management believes that the minesite costs per tonne measure provides additional information regarding the performance of mining operations. Management is aware that this per tonne measure of performance can be impacted by fluctuations in production levels and compensates for this inherent limitation by using this measure in conjunction with production costs prepared in accordance with US GAAP.
The Company reports total cash costs per ounce of gold produced and minesite costs per tonne using a common industry practice of deferring certain stripping costs that can be attributed to future production. The purpose of adjusting for these stripping costs is to enhance the comparability of total cash costs per ounce of gold produced and minesite costs per tonne to the Company's peers within the mining industry.
The following tables provide a reconciliation of total cash costs per ounce of gold produced and minesite costs per tonne to production costs as presented in the consolidated statements of income (loss) and comprehensive income (loss) in accordance with US GAAP.
Total Production Costs by Mine
| 2012 | 2011 | 2010 | |||||
| (thousands of United States dollars) | |||||||
| Production costs per consolidated statements of income (loss) and comprehensive income (loss) | $897,712 | $876,078 | $677,472 | ||||
| LaRonde mine | 225,647 | 209,947 | 189,146 | ||||
| Goldex mine | – | 56,939 | 61,561 | ||||
| Lapa mine | 73,376 | 68,599 | 66,199 | ||||
| Kittila mine | 98,037 | 110,477 | 87,740 | ||||
| Pinos Altos mine(i) | 146,503 | 145,614 | 90,293 | ||||
| Meadowbank mine | 347,710 | 284,502 | 182,533 | ||||
| Total | $891,273 | $876,078 | $677,472 | ||||
2012 ANNUAL REPORT 95
Reconciliation of Production Costs to Total Cash Costs per Ounce of Gold Produced by Mine
| LaRonde Mine – Total Cash Costs per Ounce of Gold Produced | 2012 | 2011 | 2010 | ||||||||
| (thousands of United States dollars, except as noted) | |||||||||||
| Production costs | $ | 225,647 | $ | 209,947 | $ | 189,146 | |||||
| Adjustments: | |||||||||||
| Byproduct metal revenues, net of smelting, refining and marketing charges | (131,750 | ) | (194,000 | ) | (192,155 | ) | |||||
| Inventory and other adjustments(ii) | 107 | (2,309 | ) | 3,287 | |||||||
| Non-cash reclamation provision | (2,422 | ) | (4,062 | ) | (1,344 | ) | |||||
| Cash operating costs | $ | 91,582 | $ | 9,576 | $ | (1,066 | ) | ||||
| Gold production (ounces) | 160,875 | 124,173 | 162,806 | ||||||||
| Total cash costs per ounce of gold produced ($ per ounce)(iii) | $ | 569 | $ | 77 | $ | (7 | ) | ||||
| Goldex Mine – Total Cash Costs per Ounce of Gold Produced | 2012 | 2011 | 2010 | ||||||||
| (thousands of United States dollars, except as noted) | |||||||||||
| Production costs | $ | – | $ | 56,939 | $ | 61,561 | |||||
| Adjustments: | |||||||||||
| Byproduct metal revenues, net of smelting, refining and marketing charges | – | 395 | 727 | ||||||||
| Inventory and other adjustments(ii) | – | (2,778 | ) | (253 | ) | ||||||
| Non-cash reclamation provision | – | (173 | ) | (216 | ) | ||||||
| Cash operating costs | $ | – | $ | 54,383 | $ | 61,819 | |||||
| Gold production (ounces) | – | 135,478 | 184,386 | ||||||||
| Total cash costs per ounce of gold produced ($ per ounce)(iii) | $ | – | $ | 401 | $ | 335 | |||||
| Lapa Mine – Total Cash Costs per Ounce of Gold Produced | 2012 | 2011 | 2010 | ||||||||
| (thousands of United States dollars, except as noted) | |||||||||||
| Production costs | $ | 73,376 | $ | 68,599 | $ | 66,199 | |||||
| Adjustments: | |||||||||||
| Byproduct metal revenues, net of smelting, refining and marketing charges | 513 | 663 | 644 | ||||||||
| Inventory and other adjustments(ii) | (71 | ) | 631 | (4,683 | ) | ||||||
| Non-cash reclamation provision | 191 | (348 | ) | (57 | ) | ||||||
| Cash operating costs | $ | 74,009 | $ | 69,545 | $ | 62,103 | |||||
| Gold production (ounces) | 106,191 | 107,068 | 117,456 | ||||||||
| Total cash costs per ounce of gold produced ($ per ounce)(iii) | $ | 697 | $ | 650 | $ | 529 | |||||
96 AGNICO-EAGLE MINES LIMITED
| Kittila Mine – Total Cash Costs per Ounce of Gold Produced | 2012 | 2011 | 2010 | ||||||||
| (thousands of United States dollars, except as noted) | |||||||||||
| Production costs | $ | 98,037 | $ | 110,477 | $ | 87,740 | |||||
| Adjustments: | |||||||||||
| Byproduct metal revenues, net of smelting, refining and marketing charges | 391 | 152 | 252 | ||||||||
| Inventory and other adjustments(ii) | 1,564 | (1,267 | ) | (4,774 | ) | ||||||
| Non-cash reclamation provision | (551 | ) | (206 | ) | (334 | ) | |||||
| Stripping costs(iv) | – | (3,018 | ) | – | |||||||
| Cash operating costs | $ | 99,441 | $ | 106,138 | $ | 82,884 | |||||
| Gold production (ounces) | 175,878 | 143,560 | 126,205 | ||||||||
| Total cash costs per ounce of gold produced ($ per ounce)(iii) | $ | 565 | $ | 739 | $ | 657 | |||||
| Pinos Altos Mine – Total Cash Costs per Ounce of Gold Produced(i) | 2012 | 2011 | 2010 | ||||||||
| (thousands of United States dollars, except as noted) | |||||||||||
| Production costs | $ | 146,503 | $ | 145,614 | $ | 90,293 | |||||
| Adjustments: | |||||||||||
| Byproduct metal revenues, net of smelting, refining and marketing charges | (69,478 | ) | (60,653 | ) | (25,052 | ) | |||||
| Inventory and other adjustments(ii) | 2,658 | 1,871 | 2,925 | ||||||||
| Non-cash reclamation provision | (764 | ) | (1,372 | ) | (858 | ) | |||||
| Stripping costs(iv) | (12,762 | ) | (24,260 | ) | (11,857 | ) | |||||
| Cash operating costs | $ | 66,157 | $ | 61,200 | $ | 55,451 | |||||
| Gold production (ounces) | 231,277 | 204,380 | 130,431 | ||||||||
| Total cash costs per ounce of gold produced ($ per ounce)(iii) | $ | 286 | $ | 299 | $ | 425 | |||||
| Meadowbank Mine – Total Cash Costs per Ounce of Gold Produced | 2012 | 2011 | 2010 | ||||||||
| (thousands of United States dollars, except as noted) | |||||||||||
| Production costs | $ | 347,710 | $ | 284,502 | $ | 182,533 | |||||
| Adjustments: | |||||||||||
| Byproduct metal revenues, net of smelting, refining and marketing charges | (1,651 | ) | (546 | ) | (584 | ) | |||||
| Inventory and other adjustments(ii) | 4,582 | (1,670 | ) | 6,911 | |||||||
| Non-cash reclamation provision | (1,611 | ) | (1,679 | ) | (1,315 | ) | |||||
| Stripping costs(iv) | (14,806 | ) | (9,746 | ) | (4,321 | ) | |||||
| Cash operating costs | $ | 334,224 | $ | 270,861 | $ | 183,224 | |||||
| Gold production (ounces) | 366,030 | 270,801 | 264,576 | ||||||||
| Total cash costs per ounce of gold produced ($ per ounce)(iii) | $ | 913 | $ | 1,000 | $ | 693 | |||||
2012 ANNUAL REPORT 97
Reconciliation of Production Costs to Minesite Costs per Tonne by Mine
| LaRonde Mine – Minesite Costs per Tonne | 2012 | 2011 | 2010 | ||||||||
| (thousands of United States dollars, except as noted) | |||||||||||
| Production costs | $ | 225,647 | $ | 209,947 | $ | 189,146 | |||||
| Adjustments: | |||||||||||
| Inventory adjustment(v) | 984 | (22 | ) | 3,287 | |||||||
| Non-cash reclamation provision | (2,421 | ) | (4,062 | ) | (1,344 | ) | |||||
| Minesite operating costs | $ | 224,210 | $ | 205,863 | $ | 191,089 | |||||
| Minesite operating costs (thousands of C$) | $ | 225,159 | $ | 202,957 | $ | 194,993 | |||||
| Tonnes of ore milled (thousands of tonnes) | 2,359 | 2,406 | 2,592 | ||||||||
| Minesite costs per tonne (C$)(vi) | $ | 95 | $ | 84 | $ | 75 | |||||
| Goldex Mine – Minesite Costs per Tonne | 2012 | 2011 | 2010 | ||||||||
| (thousands of United States dollars, except as noted) | |||||||||||
| Production costs | $ | – | $ | 56,939 | $ | 61,561 | |||||
| Adjustments: | |||||||||||
| Inventory adjustment(v) | – | (2,407 | ) | (253 | ) | ||||||
| Non-cash reclamation provision | – | (173 | ) | (216 | ) | ||||||
| Minesite operating costs | $ | – | $ | 54,359 | $ | 61,092 | |||||
| Minesite operating costs (thousands of C$) | $ | – | $ | 53,208 | $ | 62,545 | |||||
| Tonnes of ore milled (thousands of tonnes) | – | 2,477 | 2,782 | ||||||||
| Minesite costs per tonne (C$)(vi) | $ | – | $ | 21 | $ | 22 | |||||
| Lapa Mine – Minesite Costs per Tonne | 2012 | 2011 | 2010 | ||||||||
| (thousands of United States dollars, except as noted) | |||||||||||
| Production costs | $ | 73,376 | $ | 68,599 | $ | 66,199 | |||||
| Adjustments: | |||||||||||
| Inventory adjustment(v) | 54 | 1,071 | (4,683 | ) | |||||||
| Non-cash reclamation provision | 191 | (348 | ) | (57 | ) | ||||||
| Minesite operating costs | $ | 73,621 | $ | 69,322 | $ | 61,459 | |||||
| Minesite operating costs (thousands of C$) | $ | 73,813 | $ | 68,403 | $ | 62,771 | |||||
| Tonnes of ore milled (thousands of tonnes) | 641 | 621 | 552 | ||||||||
| Minesite costs per tonne (C$)(vi) | $ | 115 | $ | 110 | $ | 114 | |||||
98 AGNICO-EAGLE MINES LIMITED
| Kittila Mine – Minesite Costs per Tonne | 2012 | 2011 | 2010 | ||||||||
| (thousands of United States dollars, except as noted) | |||||||||||
| Production costs | $ | 98,037 | $ | 110,477 | $ | 87,740 | |||||
| Adjustments: | |||||||||||
| Inventory adjustment(v) | 1,569 | (1,324 | ) | (4,774 | ) | ||||||
| Non-cash reclamation provision | (551 | ) | (206 | ) | (334 | ) | |||||
| Stripping costs(iv) | – | (3,018 | ) | – | |||||||
| Minesite operating costs | $ | 99,055 | $ | 105,929 | $ | 82,632 | |||||
| Minesite operating costs (thousands of €) | € | 75,305 | € | 76,817 | € | 63,464 | |||||
| Tonnes of ore milled (thousands of tonnes) | 1,090 | 1,031 | 960 | ||||||||
| Minesite costs per tonne (€)(vi) | € | 69 | € | 75 | € | 66 | |||||
| Pinos Altos Mine – Minesite Costs per Tonne(i) | 2012 | 2011 | 2010 | ||||||||
| (thousands of United States dollars, except as noted) | |||||||||||
| Production costs | $ | 146,503 | $ | 145,614 | $ | 90,293 | |||||
| Adjustments: | |||||||||||
| Inventory adjustment(v) | 2,755 | (169 | ) | 2,925 | |||||||
| Non-cash reclamation provision | (764 | ) | (1,372 | ) | (858 | ) | |||||
| Stripping costs(iv) | (12,762 | ) | (24,260 | ) | (11,857 | ) | |||||
| Minesite operating costs | $ | 135,732 | $ | 119,813 | $ | 80,503 | |||||
| Tonnes of ore milled (thousands of tonnes) | 4,316 | 4,509 | 2,318 | ||||||||
| Minesite costs per tonne (US$)(vi) | $ | 31 | $ | 27 | $ | 35 | |||||
2012 ANNUAL REPORT 99
| Meadowbank Mine – Minesite Costs per Tonne | 2012 | 2011 | 2010 | ||||||||
| (thousands of United States dollars, except as noted) | |||||||||||
| Production costs | $ | 347,710 | $ | 284,502 | $ | 182,533 | |||||
| Adjustments: | |||||||||||
| Inventory adjustment(v) | 4,407 | 253 | 6,911 | ||||||||
| Non-cash reclamation provision | (1,610 | ) | (1,679 | ) | (1,315 | ) | |||||
| Stripping costs(iv) | (14,806 | ) | (9,746 | ) | (4,321 | ) | |||||
| Minesite operating costs | $ | 335,701 | $ | 273,330 | $ | 183,808 | |||||
| Minesite operating costs (thousands of C$) | $ | 336,431 | $ | 272,157 | $ | 190,980 | |||||
| Tonnes of ore milled (thousands of tonnes) | 3,821 | 2,978 | 2,001 | ||||||||
| Minesite costs per tonne (C$)(vi) | $ | 88 | $ | 91 | $ | 95 | |||||
Notes:
- (i)
- Includes
the Creston Mascota deposit at Pinos Altos, except for fourth quarter 2012 total cash costs per ounce of gold produced and minesite costs per tonne, as heap leach operations
at the Creston Mascota deposit were suspended effective October 1, 2012.
- (ii)
- Under
the Company's revenue recognition policy, revenue is recognized on concentrates when legal title passes. As total cash costs per ounce of gold produced are calculated on a
production basis, this inventory adjustment reflects the sales margin on the portion of concentrate production not yet recognized as revenue.
- (iii)
- Total
cash costs per ounce of gold produced is not a recognized measure under US GAAP and this data may not be comparable to data presented by other gold producers. This measure is
calculated by adjusting production costs as recorded in the consolidated statements of income (loss) and comprehensive income (loss) for byproduct revenues, unsold concentrate inventory production
costs, non-cash reclamation provisions, deferred stripping costs and other adjustments, and then dividing by the number of ounces of gold produced. The Company believes that this generally
accepted industry measure is a realistic indication of operating performance and is a useful comparison point between periods. Total cash costs per ounce of gold produced is intended to provide
investors with information about the cash generating capabilities of the Company's mining operations. Management also uses this measure to monitor the performance of the Company's mining operations.
As market prices for gold are quoted on a per ounce basis, using this per ounce measure allows management to assess a mine's cash generating capabilities at various gold prices. Management is aware
that this per ounce measure of performance can be impacted by fluctuations in byproduct metal prices and exchange rates. Management compensates for these inherent limitations by using this measure in
conjunction with minesite costs per tonne (discussed below) as well as other data prepared in accordance with US GAAP. Management also performs sensitivity analyses in order to quantify the effects of
fluctuating metal prices and exchange rates.
- (iv)
- The
Company reports total cash costs per ounce of gold produced and minesite costs per tonne using a common industry practice of deferring certain stripping costs that can be
attributed to future production. The purpose of adjusting for these stripping costs is to enhance the comparability of total cash costs per ounce of gold produced and minesite costs per tonne to the
Company's peers within the mining industry.
- (v)
- This
inventory adjustment reflects production costs associated with unsold concentrates.
- (vi)
- Minesite costs per tonne is not a recognized measure under US GAAP and this data may not be comparable to data presented by other gold producers. This measure is calculated by adjusting production costs as shown in the consolidated statements of income (loss) and comprehensive income (loss) for unsold concentrate inventory production costs, non-cash reclamation provisions, deferred stripping costs and other adjustments, and then dividing by tonnes of ore milled. As the total cash costs per ounce of gold produced measure can be impacted by fluctuations in byproduct metal prices and exchange rates, management believes that the minesite costs per tonne measure provides additional information regarding the performance of mining operations, eliminating the impact of varying production levels. Management also uses this measure to determine the economic viability of mining blocks. As each mining block is evaluated based on the net realizable value of each tonne mined, in order to be economically viable the estimated revenue on a per tonne basis must be in excess of the minesite costs per tonne. Management is aware that this per tonne measure of performance can be impacted by fluctuations in processing levels and compensates for this inherent limitation by using this measure in conjunction with production costs prepared in accordance with US GAAP.
Exploration and Corporate Development Expense
Proven and probable gold reserves totalled 18.7 million ounces at December 31, 2012 compared with 18.8 million ounces at December 31, 2011. The decrease in proven and probable gold reserves was due primarily to 2012 gold production at the Company's operating mines and was almost entirely offset by newly declared proven and probable reserves at the Goldex and La India mine projects and at the Meliadine project.
A summary of the Company's significant 2012 exploration and corporate development activities is detailed below:
- •
- Canadian
regional exploration expenditures, excluding the Goldex mine project, amounted to $22.7 million in 2012 compared with $29.9 million in 2011. This
decrease was due primarily to a $6.5 million reduction in exploration expenditures at the Meliadine project between periods.
- •
- On October 19, 2011, mining operations at the Goldex mine were suspended as a result of geotechnical concerns with the rock above the mining horizon. In 2011, investigation expenditures of $19.7 million were incurred which included rock mechanic and mining studies, drilling and development exploration of the deeper D zone and care
100 AGNICO-EAGLE MINES LIMITED
- •
- Latin
American regional exploration expenses increased to $28.4 million in 2012 compared with $8.3 million in 2011, due primarily to drilling at the
La India mine project in Mexico which is expected to be developed as an open pit heap leach operation.
- •
- Exploration
expenditures in the United States and Europe of $14.9 million in 2012 were comparable with expenditures of $13.9 million in 2011.
- •
- The Company's corporate development team remained active in 2012, evaluating new properties and potential acquisition opportunities.
and maintenance of general infrastructure. In 2012, exploration expenditures increased to $37.6 million with focus on the new M and E Zones at the Goldex mine project which were approved for development during the year.
The table below details exploration expense by region and total corporate development expense:
| 2012 | 2011 | 2010 | ||||||||
| (thousands of United States dollars) | ||||||||||
| Canada | $ | 22,733 | $ | 29,885 | $ | 28,346 | ||||
| Latin America | 28,419 | 8,263 | 8,268 | |||||||
| United States | 7,397 | 7,520 | 7,042 | |||||||
| Europe | 7,458 | 6,332 | 4,569 | |||||||
| Goldex mine project | 37,627 | 19,656 | – | |||||||
| Corporate development expense | 5,866 | 4,065 | 6,733 | |||||||
| $ | 109,500 | $ | 75,721 | $ | 54,958 | |||||
Amortization of Property, Plant and Mine Development
Amortization of property, plant and mine development expense increased to $271.9 million in 2012 compared with $261.8 million in 2011 due primarily to the achievement of commercial production at the LaRonde mine extension on December 1, 2011. Amortization expense commences once a mine or project achieves commercial production.
General and Administrative Expense
General and administrative expense increased to $119.1 million in 2012 from $107.9 million in 2011 due primarily to increases in salaries, benefits, retirement costs and legal expenses associated with securities class action lawsuits. Partially offsetting these increases, stock option expense decreased to $33.8 million in 2012, representing a 20% decrease compared with 2011, due to a decrease in the Black-Scholes calculated value of the employee stock options granted between periods.
Provincial Capital Tax
Prior to 2011, provincial capital tax was assessed on the Company's capitalization (paid-up capital and debt) less certain allowances and tax credits for exploration expenses incurred. Ontario capital tax was eliminated on July 1, 2010, while Quebec capital tax was eliminated at the end of 2010. Provincial capital tax expenses of $4.0 million and $9.2 million were recorded in 2012 and 2011, respectively, due to government audit assessments relating to prior years. In 2010, the Company recorded a provincial capital tax recovery of $6.1 million due to non-recurring items relating to prior years. Provincial capital tax is expected to be nil going forward.
2012 ANNUAL REPORT 101
Interest Expense
In 2012, interest expense increased to $57.9 million from $55.0 million in 2011 and $49.5 million in 2010. The table below details the components of interest expense:
| 2012 | 2011 | 2010 | |||||||||
| (thousands of United States dollars) | |||||||||||
| Stand-by fees on credit facilities | $ | 3,734 | $ | 7,345 | $ | 8,159 | |||||
| Amortization of credit facilities, financing and note issuance costs | 3,432 | 4,810 | 3,507 | ||||||||
| Government interest, penalties and other | 4,869 | 3,078 | 2,165 | ||||||||
| Interest on credit facilities | 3,460 | 1,764 | 10,795 | ||||||||
| Interest on Notes | 43,886 | 39,067 | 29,423 | ||||||||
| Interest capitalized to construction in progress | (1,494 | ) | (1,025 | ) | (4,556 | ) | |||||
| $ | 57,887 | $ | 55,039 | $ | 49,493 | ||||||
Foreign Currency Translation Gain (Loss)
The Company's operating results and cash flow are significantly impacted by changes in the US dollar/Canadian dollar exchange rate, as all of the Company's revenues are earned in US dollars but most of its operating costs and a substantial portion of its capital costs are incurred in Canadian dollars. The US dollar/Canadian dollar exchange rate has varied significantly over the past three years. During the period from January 1, 2010 through December 31, 2012, the daily noon exchange rate as reported by the Bank of Canada has fluctuated between C$0.94 per US$1.00 and C$1.08 per US$1.00. In addition, a significant portion of the Company's expenditures at the Kittila mine and the Pinos Altos mine are denominated in Euros and Mexican pesos, respectively. The Euro and Mexican peso have also varied significantly against the US dollar over the past three years.
A foreign currency translation loss of $16.3 million was recorded in 2012 compared with a foreign currency translation gain of $1.1 million in 2011. On average, the US dollar strengthened against the Canadian dollar, the Euro and the Mexican peso in 2012 compared with 2011. The US dollar weakened against the Canadian dollar, the Euro and the Mexican peso between December 31, 2011 and December 31, 2012. The foreign currency translation loss in 2012 is due primarily to the impact of translation on liabilities denominated in Euros, Canadian dollars and Mexican pesos, offset partially by the impact of translation on non-US dollar cash balances.
Income and Mining Taxes
In 2012, the Company had an effective tax rate of 28.5% compared with 26.9% in 2011 and 23.7% in 2010. In 2012, the effective tax rate of 28.5% was higher than the statutory tax rate of 26.3% due to permanent differences, principally stock-based compensation that is not deductible for tax purposes in Canada. In 2011, an income and mining taxes recovery was recorded due to impairment losses on the Meadowbank and Goldex mines.
Supplies Inventories
Supplies inventories increased by 22% to $222.6 million at December 31, 2012 compared with $182.4 million at December 31, 2011. This increase is mainly attributable to the build-up of supplies inventories at the Meadowbank mine to support increased gold production and related maintenance requirements. In addition, supplies inventories increased at the Kittila, Pinos Altos and LaRonde mines to facilitate increased gold production levels and underground mining operations.
Liquidity and Capital Resources
At December 31, 2012, the Company's cash and cash equivalents, short-term investments and restricted cash totalled $332.0 million, compared with $221.5 million at December 31, 2011. Cash provided by operating activities increased by $28.8 million to $696.0 million in 2012 compared with 2011 due primarily to a 6% increase in both gold prices realized
102 AGNICO-EAGLE MINES LIMITED
and gold production. The increase in cash provided by operating activities was partially offset by a $15.2 million increase in production costs and a $33.8 million increase in exploration and corporate development expenses between 2011 and 2012. Cash used in investing activities decreased significantly to $376.2 million in 2012 from $760.5 million in 2011 due primarily to the acquisition of Grayd in November 2011, a decrease in available-for-sale securities investments, an increase in proceeds on available-for-sale securities and a decrease in capital expenditures between these periods. Cash used in financing activities was $202.6 million in 2012 compared with cash provided by financing activities of $178.8 million in 2011 due primarily to a change from net proceeds from long-term debt of $270.0 million in 2011 to net repayments of long-term debt of $290.0 million in 2012.
In 2012, the Company invested cash of $445.6 million in projects and sustaining capital expenditures. Significant capital expenditures in 2012 included $105.1 million at the Meadowbank mine, $83.3 million at the Meliadine project, $39.2 million at the La India mine project, $26.8 million at the Goldex mine project and $183.7 million at the LaRonde, Kittila, Pinos Altos and Lapa mines. Capital expenditures to complete the Company's growth initiatives are expected to be funded by cash provided by operating activities and cash on hand. A significant portion of the Company's cash and cash equivalents are denominated in US dollars.
In 2012, the Company received net proceeds on available-for-sale securities of $73.4 million compared with $9.4 million in 2011. Purchases of available-for-sale securities decreased to $2.7 million in 2012 compared with purchases of $91.1 million in 2011.
On November 26, 2012, the Company disposed of 7,795,574 shares of Queenston Mining Inc. for total proceeds of $42.6 million, recording a $16.5 million gain on sale of available-for-sale securities.
On July 27, 2011, the Company acquired 21,671,827 common shares of Rubicon Minerals Corporation ("Rubicon") for cash consideration of approximately $73.8 million. On June 1, 2012, the Company disposed of 11,000,000 common shares of Rubicon for total proceeds of $30.7 million, recording a $6.7 million loss on sale of available-for-sale securities. After closing the transaction, the Company holds 10,671,827 common shares of Rubicon.
On November 29, 2012, the Company purchased the 5% net smelter returns royalty on the Probe block of the Goldex property from Probe for cash consideration of C$14.0 million. This amount was capitalized to the property, plant and mine development line item of the consolidated balance sheets. Up to an additional C$4.0 million (in cash or common shares of the Company, at the election of Probe) may become payable by the Company to Probe if certain production thresholds are achieved on the Probe block of the Goldex property.
On December 12, 2012, the Company declared a cash dividend payable on March 15, 2013, marking the 31st consecutive year that the Company has paid a cash dividend. During 2012, the Company paid dividends of $118.1 million compared with $98.4 million in 2011. Although the Company expects to continue paying dividends, future dividends will be at the discretion of the Board and will be subject to factors such as income, financial condition and capital requirements. The Company also issued common shares for gross proceeds of $32.7 million in 2012 due primarily to stock option exercises and issuances under the Company's employee share purchase plan.
On July 24, 2012, the Company closed a private placement consisting of $200.0 million aggregate principal amount of guaranteed senior unsecured notes due in 2022 and 2024 (the "2012 Notes") with a weighted average maturity of 11.0 years and weighted average yield of 4.95%. Proceeds from the 2012 Notes were used to repay amounts outstanding under the Company's 1.2 billion unsecured revolving bank credit facility.
On July 20, 2012, the Company amended and restated its bank credit facility (as so amended, the "Credit Facility"). The total amount available under the Credit Facility remains unchanged at $1.2 billion; however, the maturity date was extended from June 22, 2016 to June 22, 2017. Pricing terms were amended to reflect improved current market conditions. As at December 31, 2012, the Company had drawn $30.0 million under the Credit Facility. In addition, the amount available under the Credit Facility is reduced by outstanding letters of credit under the Credit Facility, amounting to $1.1 million at December 31, 2012. Therefore, $1,168.9 million was available for future drawdown under the Credit Facility at December 31, 2012. The Credit Facility requires the Company to maintain specified financial ratios and meet financial condition covenants. These financial condition covenants were met as of December 31, 2012.
The Company entered into a credit agreement on June 26, 2012 with a financial institution relating to a new C$150 million uncommitted letter of credit facility (the "Letter of Credit Facility"). The obligations of the Company under the Letter of Credit Facility are guaranteed by certain of its subsidiaries. The Letter of Credit Facility may be used to support the reclamation obligations or non-financial or performance obligations of the Company or its subsidiaries. As at December 31, 2012, $127.5 million had been drawn under the Letter of Credit Facility.
2012 ANNUAL REPORT 103
On April 7, 2010, the Company closed a private placement consisting of $600.0 million aggregate principal amount of guaranteed senior unsecured notes due in 2017, 2020 and 2022 (the "2010 Notes") with a weighted average maturity of 9.84 years and weighted average yield of 6.59%. Proceeds from the offering of the 2010 Notes were used to repay amounts under the Company's then outstanding credit facilities.
In June 2009, the Company entered into a C$95 million financial security guarantee issuance agreement with Export Development Canada (the "EDC Facility"). Under the agreement, which matures in June 2014, Export Development Canada agreed to provide guarantees in respect of letters of credit issued on behalf of the Company in favour of certain beneficiaries in respect of obligations relating to the Meadowbank mine. As at December 31, 2012, outstanding letters of credit drawn under the EDC Facility totaled nil.
Agnico-Eagle's contractual obligations as at December 31, 2012 are detailed below:
| Contractual Obligations | Total | Less than 1 Year |
1-3 Years | 4-5 Years | Thereafter | |||||||||||
| (millions of United States dollars) | ||||||||||||||||
| Letter of credit obligations | $ | 2.3 | $ | – | $ | 2.3 | $ | – | $ | – | ||||||
| Reclamation obligations(i) | 349.0 | 16.8 | 2.8 | 3.7 | 325.7 | |||||||||||
| Purchase commitments | 63.6 | 12.3 | 19.5 | 9.5 | 22.3 | |||||||||||
| Pension obligations(ii) | 4.2 | 0.1 | 0.3 | 0.2 | 3.6 | |||||||||||
| Capital and operating leases | 35.1 | 15.5 | 14.5 | 1.6 | 3.5 | |||||||||||
| Long-term debt repayment obligations(iii) | 830.0 | – | – | 145.0 | 685.0 | |||||||||||
| Total(iv) | $ | 1,284.2 | $ | 44.7 | $ | 39.4 | $ | 160.0 | $ | 1,040.1 | ||||||
Notes:
- (i)
- Mining
operations are subject to environmental regulations that require companies to reclaim and remediate land disturbed by mining operations. The Company has submitted closure plans
to the appropriate governmental agencies which estimate the nature, extent and costs of reclamation for each of its mining properties. The estimated undiscounted cash outflows of these reclamation
obligations are presented here. These estimated costs are recorded in the Company's consolidated financial statements on a discounted basis in accordance with
ASC 410-20 – Asset Retirement Obligations and ASC
410-30 – Environmental Obligations. See Note 6(a) to the consolidated financial
statements.
- (ii)
- The
Company provides a non-registered supplementary executive retirement defined benefit plan for certain senior officers (the "Executives Plan"). The Executives Plan provides
pension benefits to certain senior officers equal to 2% of their final three-year average pensionable earnings for each year of service with the Company, less the annual pension payable
under the Company's basic defined contribution pension plan. Payments under the Executives Plan are secured by letter of credit from a Canadian chartered bank. The figures presented in this table have
been actuarially determined.
- (iii)
- For
the purposes of the Company's obligations to repay amounts outstanding under its Credit Facility, the Company has assumed that the indebtedness will be repaid at its current
expiry date.
- (iv)
- The Company's estimated future cash flows are expected to be sufficient to satisfy the obligations detailed above.
Off-Balance Sheet Arrangements
The Company's off-balance sheet arrangements include operating leases of $7.6 million (see Note 13(b) to the consolidated financial statements) and outstanding letters of credit for environmental and site restoration costs, custom credits, government grants and other general corporate purposes of $147.3 million of (see Note 12 to the consolidated financial statements). If the Company were to terminate these off-balance sheet arrangements, the penalties or obligations would be insignificant based on the Company's liquidity position, as outlined in the table below.
104 AGNICO-EAGLE MINES LIMITED
2013 Liquidity and Capital Resources Analysis
The Company believes that it has sufficient capital resources to satisfy its 2013 mandatory expenditure commitments (including the contractual obligations detailed above) and discretionary expenditure commitments. The following table details expected capital requirements and resources for 2013:
| Amount | ||||
| (millions of United States dollars) |
||||
| 2013 Mandatory Commitments: | ||||
| Contractual obligations (from table above) | $ | 44.7 | ||
| Dividends payable (declared in December 2012) | 37.9 | |||
| Total 2013 mandatory expenditure commitments | $ | 82.6 | ||
2013 Discretionary Commitments: |
||||
| Budgeted capital expenditures | $ | 596.0 | ||
| Dividends payable (undeclared) | 113.7 | |||
| Total 2013 discretionary expenditure commitments | $ | 709.7 | ||
| Total 2013 mandatory and discretionary expenditure commitments | $ | 792.3 | ||
2013 Capital Resources: |
||||
| Cash, cash equivalents and short term investments (at December 31, 2012) | $ | 306.6 | ||
| Budgeted 2013 cash provided by operating activities | 729.4 | |||
| Working capital, excluding cash, cash equivalents and short-term investments (at December 31, 2012) | 320.0 | |||
| Available under the Credit Facility | 1,168.9 | |||
| Total 2013 Capital Resources | $ | 2,524.9 | ||
While the Company believes its capital resources will be sufficient to satisfy all 2013 commitments (mandatory and discretionary), the Company may choose to decrease certain of its discretionary expenditure commitments, which includes certain capital expenditures and undeclared dividends, should unexpected financial circumstances arise in the future.
Outlook
The following section contains "forward-looking statements" and "forward-looking information" within the meaning of applicable securities laws. Please see "Preliminary Note – Forward-Looking Information" for a discussion of assumptions and risks relating to such statements and information.
Gold Production Growth
LaRonde Mine
In 2013, payable gold production at the LaRonde mine is expected to be approximately 177,000 ounces. Over the 2013 to 2015 period, annual average payable gold production at the LaRonde mine is expected to be approximately 214,000 ounces. Challenges associated with heat and congestion in the LaRonde mine extension, which achieved commercial production on December 1, 2011, have delayed the ramp up of production. Despite these challenges, overall gold production and throughput are expected to remain unchanged over the life of the LaRonde mine.
Total cash costs per ounce of gold produced at the LaRonde mine are expected to be approximately $650 in 2013 compared with $569 in 2012, reflecting expectations of lower grades and lower metal prices for the mine's byproducts going forward. However, depending on prevailing byproduct prices over the next several years, the potential exists to
2012 ANNUAL REPORT 105
extend the life of the upper mine by mining lower grade (predominantly zinc) ore that becomes economic. The effect of this would likely be lower total cash costs per ounce due to the byproduct metal revenue.
Goldex Mine Project
The Goldex mine is expected to commence production from the M and E Zones in the second quarter of 2014. In 2014, payable gold production at the Goldex mine project is expected to be approximately 49,000 ounces. Annual average payable gold production at the Goldex mine project is expected to be approximately 80,000 ounces at total cash costs per ounce of gold produced of approximately $900 over a mine life of approximately three to four years. Exploration on several other satellite zones, including the deeper D Zone, has the potential to extend mine life at Goldex.
Lapa Mine
Payable gold production in 2013 is expected to be approximately 97,000 ounces at estimated total cash costs per ounce of gold produced of approximately $840. Over the 2013 to 2015 period, annual average payable gold production of approximately 86,000 ounces is expected. 2014 is expected to be the last full year of payable gold production based on the current mine life. Additional exploration results expected in 2013 could potentially extend the Lapa mine's life.
Kittila Mine
In 2013, payable gold production at the Kittila mine is expected to be approximately 165,000 ounces, while annual average payable gold production of approximately 163,333 ounces is expected between 2013 and 2015. Total cash costs per ounce of gold produced are expected to be approximately $660 in 2013 compared with $565 in 2012 as ore will be processed exclusively from the higher cost underground mine since the open pit mine was fully depleted in the fourth quarter of 2012. Further, a gradual decline in gold grade towards the average reserve grade is expected in 2013.
The Board has approved a capital expansion at the Kittila mine that is expected to result in a 750 tonne per day throughput capacity increase commencing in the second half of 2015. Current guidance for production at the Kittila mine includes 10,000 ounces of payable gold production resulting from this capital expansion.
Pinos Altos Mine
In 2013, payable gold production at the Pinos Altos mine is expected to be approximately 191,000 ounces, including 32,000 ounces from the Creston Mascota deposit. Total cash costs per ounce of gold produced of approximately $300 are expected in 2013 at the Pinos Altos mine, including the Creston Mascota deposit. Between 2013 and 2015, payable gold production is expected to average 152,000 ounces annually at the Pinos Altos mine and 46,333 ounces annually at the Creston Mascota deposit.
An increase in payable gold production is expected at the Pinos Altos mine in 2015 due to increased mill throughput from the completion of the underground shaft project.
Commercial production at the Creston Mascota deposit heap leach operation was achieved in March 2011. On September 30, 2012, a movement of leached ore from the upper lifts of the Creston Mascota deposit phase one leach pad was observed and active leaching was suspended. During the fourth quarter of 2012, further assessment suggested that the integrity of the phase one leach pad liner had been compromised by the September 30, 2012 event and further leaching on the phase one leach pad is not expected as a result. The Company expects production to commence from the Creston Mascota deposit phase two leach pad in the second quarter of 2013. Payable gold production forecasts reflect a buildup of inventory on the phase two leach pad and a related ramp up in production in 2013, with steady state operations commencing in 2014.
Meadowbank Mine
In 2013, payable gold production at the Meadowbank mine is expected to be approximately 360,000 ounces at estimated total cash costs per ounce of gold produced of approximately $985. The Meadowbank mine is expected to average 359,000 ounces of payable gold production per year between 2013 and 2015.
The Meadowbank mine experienced a number of start-up issues during its first two years. However, forecasted annual payable gold production has increased significantly as a result of improved operating performance achieved in 2012. The Company expects mill throughput of approximately 11,000 tonnes per day to be sustainable and has extended the expected Meadowbank mine life to 2018.
106 AGNICO-EAGLE MINES LIMITED
La India Mine Project
The Board approved the construction and development of the La India mine project in September 2012. The La India mine project is expected to commence operations in the second quarter of 2014. In 2014, payable gold production at the La India mine project is expected to be approximately 40,000 ounces. Annual average payable gold production at the La India mine project is expected to be approximately 90,000 ounces at total cash costs per ounce of gold produced of approximately $500 over a mine life of approximately nine years.
Growth Summary
With the achievement of commercial production of the Kittila, Lapa and Pinos Altos mines in 2009, the Meadowbank mine in March 2010, and the Creston Mascota deposit and LaRonde mine extension in 2011, Agnico-Eagle has transformed from a one mine operation to a five mine company over the last four years, resulting in record annual payable gold production of 1,043,811 ounces in 2012. As the Company continues its next growth phase from this expanded production platform, it expects to continue to deliver on its vision and strategy. Annual payable gold production is expected to increase to approximately 1,207,000 ounces in 2015, representing a 16% increase compared with 2012. The Company expects that the main contributors to targeted increases in payable gold production, gold reserves and gold resources will include:
- •
- Continued
conversion of Agnico-Eagle's current gold resources to reserves.
- •
- Increased
production from the higher grade orebody in the LaRonde mine extension.
- •
- The
commencement of operations at the Goldex mine project's M and E Zones and the La India mine project in 2014.
- •
- The commencement of operations from the Creston Mascota deposit phase two leach pad in 2013.
Financial Outlook
Mining Revenue and Production Costs
In 2013, the Company expects to continue to generate strong cash flow with payable gold production between 970,000 and 1,010,000 ounces, down from 1,043,811 ounces in 2012 due primarily to mine sequencing and the temporary suspension of heap leach operations at the Creston Mascota deposit at Pinos Altos effective October 1, 2012.
The table below details actual payable production in 2012 and estimated payable production in 2013.
| 2013 Estimate | 2012 Actual | ||||
| Gold (ounces) | 970,000 - 1,010,000 | 1,043,811 | |||
| Silver (thousands of ounces) | 4,300 | 4,646 | |||
| Zinc (tonnes) | 23,000 | 38,637 | |||
| Copper (tonnes) | 4,900 | 4,126 | |||
In 2013, the Company is expecting total cash costs per ounce at the LaRonde mine to be $650 compared with $569 in 2012. In calculating estimates of total cash costs per ounce of gold produced for the LaRonde mine, net silver, zinc and copper revenue are treated as a reduction to production costs. Therefore, production and price assumptions for byproduct metals play an important role in the LaRonde mine's total cash costs per ounce of gold produced estimate due to its large byproduct production relative to the Company's other mines. An increase in byproduct metal prices above forecast levels would result in improved total cash costs per ounce of gold produced for the LaRonde mine. In addition, the Pinos Altos mine contains a significant amount of silver byproduct.
In 2013, total cash costs per ounce of gold produced at the Lapa, Kittila, Pinos Altos (including the Creston Mascota deposit) and Meadowbank mines are expected to be $840, $660, $300 and $985, respectively. As production costs at the LaRonde, Lapa and Meadowbank mines are denominated primarily in Canadian dollars, production costs at the Kittila mine are denominated primarily in Euros and a portion of production costs at the Pinos Altos mine are denominated in Mexican pesos, the Canadian dollar/US dollar, Euro/US dollar and Mexican peso/US dollar exchange rates also impact the total cash costs per ounce of gold produced estimates.
2012 ANNUAL REPORT 107
The table below details the metal price assumptions and exchange rate assumptions used in deriving the estimated 2013 total cash costs per ounce of gold produced (production estimates for each metal are shown in the table above) as well as the market average closing prices for each variable for the period of January 1, 2013 through March 12, 2013.
| Cash Cost Assumptions |
Market Average |
||||||
| Silver (per ounce) | $ | 34.00 | $ | 30.43 | |||
| Zinc (per tonne) | $ | 2,000 | $ | 2,060 | |||
| Copper (per tonne) | $ | 7,500 | $ | 8,003 | |||
| C$/US$ exchange rate (C$) | $ | 1.00 | $ | 1.00 | |||
| Euro/US$ exchange rate (Euros) | € | 0.77 | € | 0.75 | |||
| Mexican peso/US$ exchange rate (Mexican pesos) | 13.00 | 12.70 | |||||
The table below details the estimated approximate sensitivity of the Company's 2013 estimated total cash costs per ounce of gold produced to a change in metal price and exchange rate assumptions:
| Change in variable(i) | Impact on Total Cash Costs per Ounce of Gold Produced |
|||
| $1 per ounce of Silver | $ | 4 | ||
| $100 per tonne of Zinc | $ | 2 | ||
| $200 per tonne of Copper | $ | 1 | ||
| 1% C$/US$ | $ | 7 | ||
| 1% Euro/US$ | $ | 1 | ||
| 1% Mexican peso/US$ | $ | 1 | ||
Note:
- (i)
- The sensitivities presented are based on the payable production, metal price and exchange rate assumptions detailed above. Operating costs are not impacted by fluctuations in byproduct metal prices. The Company may use derivative strategies to limit the downside risk associated with fluctuating byproduct metal prices and enters into forward contracts to lock in exchange rates based on projected Canadian dollar, Euro and Mexican peso operating and capital needs. Please see "Item 11 Quantitative and Qualitative Disclosures about Market Risk – Risk Profile – Metal Price and Foreign Currency" and "Risk Profile – Financial Instruments". Please see "– Results of Operations – Production Costs" above for disclosure regarding the use of the non-US GAAP financial measure total cash costs per ounce of gold produced.
108 AGNICO-EAGLE MINES LIMITED
Exploration and Corporate Development Expense
In 2013, Agnico-Eagle expects to incur expenditures of $92.0 million on minesite and advanced project exploration, greenfield exploration and corporate development. Approximately $21.0 million is expected to be spent on greenfield exploration outside of the Company's currently contemplated mining areas in Canada, Latin America, Finland and the United States. Exploration is success driven and thus these estimates could change materially based on the success of the various exploration programs. When it is determined that a mining property can be economically developed as a result of established proven and probable reserves, the costs of drilling and development to further delineate the ore body on such a property are capitalized. In 2013, the Company expects to capitalize $38.0 million on drilling and development related to further delineating ore bodies and converting resources into reserves.
Other Expenses
Cash general and administrative expenses are not expected to increase significantly in 2013. However, non-cash variances from budget may occur as a result of variances in the Black-Scholes pricing of stock options granted by the Company in 2013. Provincial capital tax expense is expected to be nil in 2013 due to the elimination of the Ontario provincial capital tax on July 1, 2010 and the elimination of the Quebec capital tax at the end of 2010. Amortization of property, plant and mine development is expected to increase to approximately $293.1 million in 2013 compared with $271.9 million in 2012. Interest expense is expected to decrease to approximately $55.1 million in 2013 compared with $57.9 million in 2012 due primarily to decreased amounts drawn under the Credit Facility, offset partially by amounts owing on the 2012 Notes. The Company's effective tax rate is expected to be approximately 34.6% in 2013 compared with an effective rate of 28.5% in 2012. The 2012 effective tax rate resulted from the factors detailed in "– Results of Operations – Income and Mining Taxes" above.
Capital Expenditures
Agnico-Eagle's gold growth program remains well funded. Capital expenditures, including construction and development costs, sustaining capital and capitalized exploration costs, are expected to total approximately $596.0 million in 2013. In 2013, the Company expects to generate internal cash flow from the sale of its gold production and the associated byproduct metals. Significant components of the expected 2013 capital expenditures program include the following:
- •
- $357.0 million
in capitalized development expenditures relating primarily to the La India mine project ($92.0 million), Goldex mine project
($63.0 million), Meliadine project ($59.0 million), Meadowbank mine ($39.0 million), Kittila mine ($34.0 million) and Pinos Altos mine ($33.0 million);
- •
- $201.0 million
in sustaining capital expenditures relating to the LaRonde mine ($61.0 million), Meadowbank mine ($40.0 million), Kittila mine
($39.0 million), Pinos Altos mine ($29.0 million), Lapa mine ($19.0 million) and Creston Mascota deposit at Pinos Altos ($13.0 million); and
- •
- $38.0 million in capitalized drilling expenditures;
The Company continues to examine other possible corporate development opportunities which may result in the acquisition of companies, assets with securities, cash or a combination thereof. If cash is used to fund acquisitions, Agnico-Eagle may be required to issue debt or securities to satisfy cash requirements.
Outstanding Securities
The following table details the maximum number of common shares that would be outstanding if all dilutive instruments outstanding at March 12, 2013 were exercised:
| Common shares outstanding at March 12, 2013 | 172,501,169 | ||
| Employee stock options | 11,750,991 | ||
| Warrants | 8,600,000 | ||
| 192,852,160 | |||
2012 ANNUAL REPORT 109
Critical Accounting Estimates
The preparation of the consolidated financial statements in accordance with US GAAP requires management to make estimates and judgments that affect the reported amounts of assets, liabilities, revenues and expenses. The Company evaluates the estimates periodically, including those relating to trade receivables, inventories, deferred tax assets and liabilities, mining properties, goodwill and asset retirement obligations. In making judgments about the carrying value of assets and liabilities, the Company uses estimates based on historical experience and various assumptions that are considered reasonable in the circumstances. Actual results may differ from these estimates.
The Company believes the following critical accounting policies relate to its more significant judgments and estimates used in the preparation of its consolidated financial statements. Management has discussed the development and selection of the following critical accounting policies with the Audit Committee which has reviewed the Company's disclosure in this Form 20-F.
Mining Properties, Plant and Equipment and Mine Development Costs
Significant payments related to the acquisition of land and mineral rights are capitalized as mining properties at cost. If a mineable ore body is discovered, such costs are amortized to income when production begins, using the unit-of-production method, based on estimated proven and probable reserves. If no mineable ore body is discovered, such costs are expensed in the period in which it is determined the property has no future economic value.
Expenditures for new facilities and improvements that can extend the useful lives of existing facilities are capitalized as plant and equipment at cost. Interest costs incurred for the construction of projects are capitalized.
Mine development costs incurred after the commencement of production are capitalized or deferred to the extent that these costs benefit the mining of the entire ore body. Costs incurred to access single ore blocks are expensed as incurred; otherwise, such vertical and horizontal development is classified as mine development costs.
Agnico-Eagle records amortization on both plant and equipment and mine development costs used in commercial production on a unit-of-production basis based on the estimated tonnage of proven and probable mineral reserves of the mine. The unit-of-production method defines the denominator as the total proven and probable tonnes of reserves.
Repairs and maintenance expenditures are charged to income as production costs. Assets under construction are not depreciated until the end of the construction period. Upon achievement of commercial production, the capitalized construction costs are transferred to the appropriate category of plant and equipment.
Mineral exploration costs are charged to income in the year in which they are incurred. When it is determined that a mining property can be economically developed as a result of established proven and probable reserves, the costs of drilling and development to further delineate the ore body on such property are capitalized. The establishment of proven and probable reserves is based on results of final feasibility studies, that indicate whether a property is economically feasible. Upon commencement of the commercial production of a development project, these costs are transferred to the appropriate asset category and are amortized to income using the unit-of-production method described above. Mine development costs, net of salvage values, relating to a property that is abandoned or considered uneconomic for the foreseeable future are written off.
The carrying values of mining properties, plant and equipment and mine development costs are periodically reviewed for possible impairment, when impairment factors exist, based on the future undiscounted net cash flows of the operating mine or development property. If it is determined that the estimated net recoverable amount is less than the carrying value, then a write down to the estimated fair value amount is made with a charge to income. Estimated future cash flows of an operating mine and development properties include estimates of recoverable ounces of gold based on the proven and probable mineral reserves. To the extent that economic value exists beyond the proven and probable mineral reserves of an operating mine or development property, this value is included as part of the estimated future cash flows. Estimated future cash flows also involve estimates regarding metal prices (considering current and historical prices, price trends and related factors), production levels, capital and reclamation costs, and related income and mining taxes, all based on detailed life-of-mine plans. Cash flows are subject to risks and uncertainties and changes in the estimates of the cash flows may affect the recoverability of long-lived assets.
110 AGNICO-EAGLE MINES LIMITED
Goodwill
Business combinations are accounted for using the purchase method whereby assets acquired and liabilities assumed are recorded at their fair values as of the date of acquisition and any excess of the purchase price over such fair values is recorded as goodwill. Goodwill is not amortized.
The Company performs goodwill impairment tests on an annual basis as well as when events and circumstances indicate that the carrying amounts may no longer be recoverable. In performing the impairment tests, the Company estimates the fair values of its reporting units that include goodwill and compares those fair values to the reporting units' carrying amounts. If a reporting unit's carrying amount exceeds its fair value, the Company compares the implied fair value of the reporting unit's goodwill to the carrying amount, and any excess of the carrying amount of goodwill over the implied fair value is charged to income.
At December 31, 2012, the Company concluded that it did not have any reporting units that were at risk of failing the Step 1 goodwill impairment test under ASC 350 – Intangibles – Goodwill and Other.
Revenue Recognition
Revenue is recognized when the following conditions are met:
- (a)
- persuasive
evidence of an arrangement to purchase exists;
- (b)
- the
price is determinable;
- (c)
- the
product has been delivered; and
- (d)
- collection of the sales price is reasonably assured.
Revenue from gold and silver in the form of dore bars is recorded when the refined gold and silver is sold and delivered to the customer. Generally, all the gold and silver in the form of dore bars recovered in the Company's milling process is sold in the period in which it is produced.
Under the terms of the Company's concentrate sales contracts with third-party smelters, final prices for the metals contained in the concentrate are determined based on the prevailing spot market metal prices on a specified future date, which is based on the date that the concentrate is delivered to the smelter. The Company records revenues under these contracts based on forward prices at the time of delivery, which is when transfer of legal title to concentrate passes to the third-party smelters. The terms of the contracts result in differences between the recorded estimated price at delivery and the final settlement price. These differences are adjusted through revenue at each subsequent financial statement date.
Revenues from mining operations consist of gold revenues, net of smelting, refining, transportation and other marketing charges. Revenues from byproduct metals sales are shown net of smelter charges as part of revenues from mining operations.
Reclamation Costs
On an annual basis, the Company assesses cost estimates and other assumptions used in the valuation of asset retirement obligations ("AROs") at each of its mineral properties to reflect events, changes in circumstances and new information available. Changes in these cost estimates and assumptions have a corresponding impact on the fair value of the AROs. For closed mines, any change in the fair value of AROs results in a corresponding charge or credit within other expense, whereas at operating mines the charge is recorded as an adjustment to the carrying amount of the corresponding asset.
AROs arise from the acquisition, development, construction and operation of mining properties and plant and equipment due to government controls and regulations that protect the environment on the closure and reclamation of mining properties. The major parts of the carrying amount of AROs relate to: tailings and heap leach pad closure and rehabilitation; demolition of buildings and mine facilities; ongoing water treatment; and ongoing care and maintenance of closed mines. The fair values of AROs are measured by discounting the expected cash flows using a discount factor that reflects the credit-adjusted risk-free rate of interest. The Company prepares estimates of the timing and amount of expected cash flows when an ARO is incurred. Expected cash flows are updated to reflect changes in facts and circumstances. The principal factors that can cause expected cash flows to change are: the construction of new processing facilities; changes in the quantities of material in reserves and a corresponding change in the life of mine plan; changing ore characteristics that impact required environmental protection measures and related costs; changes in water quality that impact the extent of water treatment required; and changes in laws and regulations governing the protection of the environment. When expected cash flows increase, the revised cash flows are discounted using a current discount
2012 ANNUAL REPORT 111
factor, whereas when expected cash flows decrease, the reduced cash flows are discounted using the historical discount factor used in the original estimation of the expected cash flows. In either case, any change in the fair value of the ARO is recorded. Agnico-Eagle records the fair value of an ARO when it is incurred. AROs are adjusted to reflect the passage of time (accretion), which is calculated by applying the discount factor implicit in the initial fair value measurement to the beginning-of-period carrying amount of the AROs. For producing mines, accretion expense is recorded in the cost of goods sold each period. Upon settlement of an ARO, Agnico-Eagle records a gain or loss if the actual cost differs from the carrying amount of the ARO. Settlement gains/losses are recorded in income.
Environmental remediation liabilities ("ERLs") are differentiated from AROs in that they do not arise from environmental contamination in the normal operation of a long-lived asset or from a legal obligation to treat environmental contamination resulting from the acquisition, construction or development of a long-lived asset.
The Company is required to recognize a liability for obligations associated with ERLs arising from past acts. ERL fair value is measured by discounting the expected related cash flows using a discount factor that reflects the credit-adjusted risk-free rate of interest. The Company prepares estimates of the timing and amount of expected cash flows when an ERL is incurred. On an annual basis, the Company assesses cost estimates and other assumptions used in the valuation of ERLs to reflect events, changes in circumstances and new information available. Changes in these cost estimates and assumptions have a corresponding impact on the fair value of the ERL. Any change in the fair value of ERLs results in a corresponding charge or credit to income. Upon settlement of an ERL, Agnico-Eagle records a gain or loss if the actual cost differs from the carrying amount of the ARO. Settlement gains/losses are recorded in income.
Other environmental remediation costs that are not AROs or environmental remediation liabilities as defined by ASC 410-20 – Asset Retirement Obligations and 410-30 – Environmental Obligations, respectively, are expensed as incurred.
Income and Mining Taxes
Agnico-Eagle follows the liability method of tax allocation for accounting for income taxes. Under this method of tax allocation, deferred income and mining tax bases of assets and liabilities are measured using the enacted tax rates and laws expected to be in effect when the differences are expected to reverse.
The Company's operations involve dealing with uncertainties and judgments in the application of complex tax regulations in multiple jurisdictions. The final taxes paid are dependent upon many factors, including negotiations with taxing authorities in various jurisdictions and resolution of disputes arising from federal, provincial, state and international tax audits. The Company recognizes the effect of uncertain tax positions and records tax liabilities for anticipated tax audit issues in Canada and other tax jurisdictions where it is more likely than not based on technical merits that the position would not be sustained. The Company recognizes the amount of any tax benefits that have greater than 50 percent likelihood of being ultimately realized upon settlement.
Changes in judgment related to the expected ultimate resolution of uncertain tax positions are recognized in the year of such change. Accrued interest and penalties related to unrecognized tax benefits are recorded in income tax expense in the current year. The Company adjusts these reserves in light of changing facts and circumstances; however, due to the complexity of some of these uncertainties, the ultimate resolution may result in a payment that is materially different from the Company's current estimate of the tax liabilities. If the Company's estimate of tax liabilities proves to be less than the ultimate assessment, an additional charge to expense would result. If the estimate of tax liabilities proves to be greater than the ultimate assessment, a tax benefit would result.
During the second quarter of 2010, the Company executed the newly enacted Quebec foreign currency election to commence using the U.S. dollar as its functional currency for Quebec income tax purposes. As the related tax legislation was enacted in the second quarter of 2010, this election applies to taxation years ended on or after December 31, 2008. This election resulted in a deferred tax benefit of $21.8 million for the year ended December 31, 2010.
Financial Instruments
Agnico-Eagle uses derivative financial instruments, primarily option and forward contracts, to manage exposure to fluctuations of byproduct metal prices, interest rates and foreign currency exchange rates and may use such means to manage exposure to certain input costs. Agnico-Eagle does not hold financial instruments or derivative financial instruments for trading purposes.
The Company recognizes all derivative financial instruments in the consolidated financial statements at fair value regardless of the purpose or intent for holding the instrument. Changes in the fair value of derivative financial instruments
112 AGNICO-EAGLE MINES LIMITED
are either recognized periodically in the consolidated statements of income (loss) and comprehensive income (loss) or in shareholders' equity as a component of accumulated other comprehensive loss, depending on the nature of the derivative financial instrument and whether it qualifies for hedge accounting. Financial instruments designated as hedges are tested for effectiveness on a quarterly basis. Gains and losses on those contracts that are proven to be effective are reported as a component of the related transaction.
Stock-Based Compensation
The Company's Stock Option Plan (the "Stock Option Plan") provides for the granting of options to directors, officers, employees and service providers to purchase common shares. Options have exercise prices equal to market price on the day prior to the date of grant. The fair value of these options is recognized in the consolidated statements of income (loss) and comprehensive income (loss) or in the consolidated balance sheets if capitalized as part of property, plant and mine development over the applicable vesting period as a compensation cost. Any consideration paid by employees on exercise of options or purchase of common shares is credited to share capital.
Fair value is determined using the Black-Scholes option valuation model which requires the Company to estimate the expected volatility of the Company's share price and the expected life of the stock options. Limitations with existing option valuation models and the inherent difficulties associated with estimating these variables create difficulties in determining a reliable single measure of the fair value of stock option grants. The dilutive impact of stock option grants is factored into the Company's reported diluted net income (loss) per share.
Commercial Production
The Company assesses each mine construction project to determine when a mine moves into the production stage. The criteria used to assess the start date are determined based on the nature of each mine construction project, such as the complexity of a plant and its location. The Company considers various relevant criteria to assess when the mine is substantially complete and ready for its intended use and moved into the production stage. The criteria considered include: (1) the completion of a reasonable period of testing of mine plant and equipment; (2) the ability to produce minerals in saleable form (within specifications); and (3) the ability to sustain ongoing production of minerals. When a mine construction project moves into the production stage, the capitalization of certain mine construction costs ceases and costs are either capitalized to inventories or expensed, except for sustaining capital costs related to mining properties, plant and equipment or mine development.
Stripping Costs
Pre-production stripping costs are capitalized until an "other than de minimis" level of mineral is produced, after which time such costs are either capitalized to inventory or expensed. The Company considers various relevant criteria to assess when an "other than de minimis" level of mineral is produced. The criteria considered include: (1) the number of ounces mined compared to total ounces in mineral reserves; (2) the quantity of ore mined compared to the total quantity of ore expected to be mined over the life of the mine; (3) the current stripping ratio compared to the expected stripping ratio over the life of the mine; and (4) the ore grade compared to the expected ore grade over the life of the mine. Please refer to notes (iii) and (iv) of the "Reconciliation of Production Costs to Total Cash Costs per Ounce of Gold Produced by Mine" section for a discussion of stripping costs with regards to "cash costs".
Recently Issued Accounting Pronouncements and Developments
Under SEC Staff Accounting Bulletin 74, the Company is required to disclose information related to new accounting standards that have not yet been adopted. Agnico-Eagle is currently evaluating the impact that the adoption of these statements will have on the Company's consolidated financial statements.
Disclosure about Offsetting Assets and Liabilities
In November 2011, ASC guidance was issued relating to disclosure on offsetting financial instrument and derivative financial instrument assets and liabilities. Under the updated guidance, entities are required to disclose gross information and net information about both instruments and transactions eligible for offset in the consolidated balance sheets and instruments and transactions subject to an agreement similar to a master netting arrangement. The update is effective for the Company's fiscal year beginning January 1, 2013. Agnico-Eagle is evaluating the potential impact of the adoption of this guidance may have on the Company's consolidated financial statements.
2012 ANNUAL REPORT 113
Disclosure of Payments by Resource Extraction Issuers
In August 2012, the SEC adopted new rules requiring resource extraction issuers to include in an annual report information relating to any payment, whether a single payment or a series of related payments, that equals or exceeds $100,000 during the most recent fiscal year, made by the issuer, a subsidiary of the issuer or an entity under the control of the issuer, to the United States federal government or a foreign government for the purpose of the commercial development of oil, natural gas, or minerals. Resource extraction issuers will be required to provide information about the type and total amount of such payments made for each project related to the commercial development of oil, natural gas, or minerals, and the type and total amount of payments made to each government. A resource extraction issuer must comply with the new rules and form for fiscal years ending after September 30, 2013, but may provide a partial year report if the issuer's fiscal year began before September 30, 2013. The Company is evaluating the potential impact of complying with these new rules in its 2013 annual disclosure.
Reporting of Amounts Reclassified Out of Accumulated Other Comprehensive Income
In February 2013, ASC guidance was issued relating to the reporting of amounts reclassified out of accumulated other comprehensive income. Under the updated guidance, entities are required to provide information about the amounts reclassified out of accumulated other comprehensive income by component and by consolidated statement of income (loss) line item, as required under US GAAP. The update is effective for the Company's fiscal year beginning on January 1, 2013. Agnico-Eagle is evaluating the potential impact of the adoption of this guidance on the Company's consolidated financial statements.
International Financial Reporting Standards
Based on recent guidance from the Canadian Securities Administrators and the SEC, as a Canadian issuer and existing US GAAP filer, the Company will continue to be permitted to use US GAAP as its principal basis of accounting. The SEC has not yet committed to a timeline which would require the Company to adopt International Financial Reporting Standards ("IFRS"). A decision to voluntarily adopt IFRS has not been made by the Company.
114 AGNICO-EAGLE MINES LIMITED
CONSOLIDATED FINANCIAL DATA
| Three Months Ended | ||||||||||||||||||
| March 31, 2012 |
June 30, 2012 |
September 30, 2012 |
December 31, 2012 |
Total 2012 |
||||||||||||||
| (thousands of United States dollars, except where noted) | ||||||||||||||||||
| Operating margin | ||||||||||||||||||
| Revenues from mining operations | $ | 472,934 | $ | 459,561 | $ | 535,836 | $ | 449,383 | $ | 1,917,714 | ||||||||
| Production costs | 215,035 | 219,906 | 220,408 | 242,363 | 897,712 | |||||||||||||
| Operating margin | 257,899 | 239,655 | 315,428 | 207,020 | 1,020,002 | |||||||||||||
| Operating margin by mine | ||||||||||||||||||
| LaRonde mine | 63,266 | 29,342 | 45,625 | 35,363 | 173,596 | |||||||||||||
| Lapa mine | 27,677 | 26,222 | 25,723 | 20,755 | 100,377 | |||||||||||||
| Kittila mine | 49,049 | 31,489 | 52,655 | 53,199 | 186,392 | |||||||||||||
| Pinos Altos mine(i) | 69,135 | 79,887 | 87,167 | 61,533 | 297,722 | |||||||||||||
| Meadowbank mine | 48,772 | 72,715 | 104,258 | 36,170 | 261,915 | |||||||||||||
| Operating margin | 257,899 | 239,655 | 315,428 | 207,020 | 1,020,002 | |||||||||||||
| Amortization of property, plant and mine development | 64,553 | 66,310 | 68,318 | 72,680 | 271,861 | |||||||||||||
| Corporate and other | 85,836 | 96,169 | 94,763 | 36,232 | 313,000 | |||||||||||||
| Income before income and mining taxes | 107,510 | 77,176 | 152,347 | 98,108 | 435,141 | |||||||||||||
| Income and mining taxes | 28,962 | 33,904 | 46,021 | 15,338 | 124,225 | |||||||||||||
| Net income for the period | $ | 78,548 | $ | 43,272 | $ | 106,326 | $ | 82,770 | $ | 310,916 | ||||||||
| Net income per share – basic | $ | 0.46 | $ | 0.25 | $ | 0.62 | $ | 0.48 | $ | 1.82 | ||||||||
| Net income per share – diluted | $ | 0.46 | $ | 0.25 | $ | 0.62 | $ | 0.48 | $ | 1.81 | ||||||||
| Cash flows | ||||||||||||||||||
| Cash provided by operating activities | $ | 196,497 | $ | 194,082 | $ | 199,464 | $ | f105,964 | $ | 696,007 | ||||||||
| Cash used in investing activities | $ | (88,908 | ) | $ | (68,619 | ) | $ | (121,837 | ) | $ | (96,792 | ) | $ | (376,156 | ) | |||
| Cash (used in) provided by financing activities | $ | (132,078 | ) | $ | (29,258 | ) | $ | (55,406 | ) | $ | 14,136 | $ | (202,606 | ) | ||||
| Realized prices | ||||||||||||||||||
| Gold (per ounce) | $ | 1,684 | $ | 1,602 | $ | 1,695 | $ | 1,684 | $ | 1,667 | ||||||||
| Silver (per ounce) | $ | 34 | $ | 26 | $ | 34 | $ | 31 | $ | 32 | ||||||||
| Zinc (per tonne) | $ | 2,125 | $ | 1,901 | $ | 1,836 | $ | 1,906 | $ | 1,955 | ||||||||
| Copper (per tonne) | $ | 9,006 | $ | 6,455 | $ | 9,046 | $ | 7,668 | $ | 8,083 | ||||||||
2012 ANNUAL REPORT 115
| Payable production:(ii) | ||||||||||||||||||
| Gold (ounces) | ||||||||||||||||||
| LaRonde mine | 43,281 | 40,206 | 40,477 | 36,911 | 160,875 | |||||||||||||
| Lapa mine | 28,499 | 28,157 | 24,914 | 24,621 | 106,191 | |||||||||||||
| Kittila mine | 46,758 | 35,228 | 48,619 | 45,273 | 175,878 | |||||||||||||
| Pinos Altos mine(i) | 57,016 | 63,356 | 61,973 | 52,492 | 234,837 | |||||||||||||
| Meadowbank mine | 79,401 | 98,403 | 110,988 | 77,238 | 366,030 | |||||||||||||
| 254,955 | 265,350 | 286,971 | 236,535 | 1,043,811 | ||||||||||||||
| Silver (thousands of ounces) | ||||||||||||||||||
| LaRonde mine | 690 | 532 | 475 | 547 | 2,244 | |||||||||||||
| Pinos Altos mine(i) | 507 | 537 | 639 | 628 | 2,311 | |||||||||||||
| Meadowbank mine | 18 | 26 | 26 | 21 | 91 | |||||||||||||
| 1,215 | 1,095 | 1,140 | 1,196 | 4,646 | ||||||||||||||
| Zinc (LaRonde mine) (tonnes) | 12,978 | 9,558 | 7,379 | 8,722 | 38,637 | |||||||||||||
| Copper (LaRonde mine) (tonnes) | 1,326 | 1,004 | 982 | 814 | 4,126 | |||||||||||||
| Payable metal sold: | ||||||||||||||||||
| Gold (ounces) | ||||||||||||||||||
| LaRonde mine | 43,745 | 39,886 | 37,466 | 37,726 | 158,823 | |||||||||||||
| Lapa mine | 27,897 | 27,793 | 24,772 | 24,309 | 104,771 | |||||||||||||
| Kittila mine | 44,227 | 34,476 | 45,155 | 46,620 | 170,478 | |||||||||||||
| Pinos Altos mine(i) | 52,145 | 66,373 | 61,265 | 50,201 | 229,984 | |||||||||||||
| Meadowbank mine | 74,614 | 93,299 | 116,341 | 79,752 | 364,006 | |||||||||||||
| 242,628 | 261,827 | 284,999 | 238,608 | 1,028,062 | ||||||||||||||
| Silver (thousands of ounces) | ||||||||||||||||||
| LaRonde mine | 718 | 482 | 467 | 566 | 2,233 | |||||||||||||
| Pinos Altos mine(i) | 493 | 525 | 635 | 583 | 2,236 | |||||||||||||
| Meadowbank mine | 18 | 24 | 26 | 19 | 87 | |||||||||||||
| 1,229 | 1,031 | 1,128 | 1,168 | 4,556 | ||||||||||||||
| Zinc (LaRonde mine) (tonnes) | 13,032 | 10,379 | 10,120 | 9,073 | 42,604 | |||||||||||||
| Copper (LaRonde mine) (tonnes) | 1,293 | 1,085 | 937 | 800 | 4,115 | |||||||||||||
Notes:
- (i)
- Includes
Creston Mascota deposit at Pinos Altos.
- (ii)
- Payable production is the quantity of mineral produced during a period contained in products that are or will be sold by the Company, whether such products are sold during the period or held as inventory at the end of the period.
116 AGNICO-EAGLE MINES LIMITED
CONSOLIDATED FINANCIAL DATA
| Three Months Ended | ||||||||||||||||||
| March 31, 2011 |
June 30, 2011 |
September 30, 2011 |
December 31, 2011 |
Total 2011 |
||||||||||||||
| (thousands of United States dollars, except where noted) | ||||||||||||||||||
| Operating margin | ||||||||||||||||||
| Revenues from mining operations | $ | 412,068 | $ | 433,691 | $ | 520,537 | $ | 455,503 | $ | 1,821,799 | ||||||||
| Production costs | 198,567 | 212,754 | 237,190 | 227,567 | 876,078 | |||||||||||||
| Operating margin | 213,501 | 220,937 | 283,347 | 227,936 | 945,721 | |||||||||||||
| Operating margin by mine | ||||||||||||||||||
| LaRonde mine | 48,983 | 46,017 | 59,081 | 34,581 | 188,662 | |||||||||||||
| Goldex mine | 40,333 | 46,739 | 48,974 | 24,677 | 160,723 | |||||||||||||
| Lapa mine | 19,178 | 27,737 | 28,286 | 23,736 | 98,937 | |||||||||||||
| Kittila mine | 27,831 | 18,934 | 34,751 | 33,619 | 115,135 | |||||||||||||
| Pinos Altos mine(i) | 47,259 | 52,568 | 65,777 | 67,111 | 232,715 | |||||||||||||
| Meadowbank mine | 29,917 | 28,942 | 46,478 | 44,212 | 149,549 | |||||||||||||
| Operating margin | 213,501 | 220,937 | 283,347 | 227,936 | 945,721 | |||||||||||||
| Amortization of property, plant and mine development | 61,929 | 59,235 | 67,104 | 73,513 | 261,781 | |||||||||||||
| Impairment Loss on Meadowbank mine | – | – | – | 907,681 | 907,681 | |||||||||||||
| Loss on Goldex mine | – | – | 298,183 | 4,710 | 302,893 | |||||||||||||
| Corporate and other | 74,210 | 56,936 | 28,644 | 92,204 | 251,994 | |||||||||||||
| Income (loss) before income and mining taxes | 77,362 | 104,766 | (110,584 | ) | (850,172 | ) | (778,628 | ) | ||||||||||
| Income and mining taxes | 32,098 | 35,941 | (28,970 | ) | (248,742 | ) | (209,673 | ) | ||||||||||
| Net income (loss) for the period | $ | 45,264 | $ | 68,825 | $ | (81,614 | ) | $ | (601,430 | ) | $ | (568,955 | ) | |||||
| Attributed to non-controlling interest | $ | – | $ | – | $ | – | $ | (60 | ) | $ | (60 | ) | ||||||
| Attributed to common shareholders | $ | 45,264 | $ | 68,825 | $ | (81,614 | ) | $ | (601,370 | ) | $ | (568,895 | ) | |||||
| Net income (loss) per share – basic | $ | 0.27 | $ | 0.41 | $ | (0.48 | ) | $ | (3.53 | ) | $ | (3.36 | ) | |||||
| Net income (loss) per share – diluted | $ | 0.26 | $ | 0.40 | $ | (0.48 | ) | $ | (3.53 | ) | $ | (3.36 | ) | |||||
| Cash flows | ||||||||||||||||||
| Cash provided by operating activities | $ | 174,766 | $ | 162,821 | $ | 197,570 | $ | 132,028 | $ | 667,185 | ||||||||
| Cash used in investing activities | $ | (89,956 | ) | $ | (116,173 | ) | $ | (247,772 | ) | $ | (306,583 | ) | $ | (760,484 | ) | |||
| Cash (used in) provided by financing activities | $ | (72,565 | ) | $ | (22,180 | ) | $ | 29,106 | $ | 244,461 | $ | 178,822 | ||||||
| Realized prices | ||||||||||||||||||
| Gold (per ounce) | $ | 1,400 | $ | 1,530 | $ | 1,717 | $ | 1,640 | $ | 1,573 | ||||||||
| Silver (per ounce) | $ | 36 | $ | 39 | $ | 37 | $ | 27 | $ | 34 | ||||||||
| Zinc (per tonne) | $ | 2,509 | $ | 2,257 | $ | 2,166 | $ | 2,188 | $ | 1,892 | ||||||||
| Copper (per tonne) | $ | 10,027 | $ | 8,565 | $ | 8,561 | $ | 8,510 | $ | 7,162 | ||||||||
2012 ANNUAL REPORT 117
| Payable production:(ii) | ||||||||||||||||||
| Gold (ounces) | ||||||||||||||||||
| LaRonde mine | 36,893 | 27,525 | 29,069 | 30,686 | 124,173 | |||||||||||||
| Goldex mine | 38,500 | 41,998 | 40,224 | 14,756 | 135,478 | |||||||||||||
| Lapa mine | 26,914 | 28,552 | 27,881 | 23,721 | 107,068 | |||||||||||||
| Kittila mine | 40,317 | 30,811 | 37,924 | 34,508 | 143,560 | |||||||||||||
| Pinos Altos mine(i) | 48,001 | 51,066 | 52,739 | 52,574 | 204,380 | |||||||||||||
| Meadowbank mine | 61,737 | 59,376 | 78,141 | 71,547 | 270,801 | |||||||||||||
| 252,362 | 239,328 | 265,978 | 227,792 | 985,460 | ||||||||||||||
| Silver (thousands of ounces) | ||||||||||||||||||
| LaRonde mine | 680 | 736 | 968 | 785 | 3,169 | |||||||||||||
| Pinos Altos mine(i) | 406 | 452 | 485 | 508 | 1,851 | |||||||||||||
| Meadowbank mine | 13 | 13 | 16 | 18 | 60 | |||||||||||||
| 1,099 | 1,201 | 1,469 | 1,311 | 5,080 | ||||||||||||||
| Zinc (LaRonde mine) (tonnes) | 11,941 | 14,678 | 15,684 | 12,591 | 54,894 | |||||||||||||
| Copper (LaRonde mine) (tonnes) | 817 | 666 | 731 | 1,002 | 3,216 | |||||||||||||
| Payable metal sold: | ||||||||||||||||||
| Gold (ounces) | ||||||||||||||||||
| LaRonde mine | 37,459 | 28,589 | 26,729 | 31,342 | 124,119 | |||||||||||||
| Goldex mine | 41,895 | 41,564 | 37,380 | 20,863 | 141,702 | |||||||||||||
| Lapa mine | 25,776 | 29,749 | 27,955 | 23,854 | 107,334 | |||||||||||||
| Kittila mine | 40,698 | 29,794 | 36,745 | 37,769 | 145,006 | |||||||||||||
| Pinos Altos mine(i) | 45,484 | 48,847 | 54,297 | 55,611 | 204,239 | |||||||||||||
| Meadowbank mine | 61,928 | 58,767 | 74,416 | 78,579 | 273,690 | |||||||||||||
| 253,240 | 237,310 | 257,522 | 248,018 | 996,090 | ||||||||||||||
| Silver (thousands of ounces) | ||||||||||||||||||
| LaRonde mine | 679 | 726 | 901 | 865 | 3,171 | |||||||||||||
| Pinos Altos mine(i) | 409 | 428 | 475 | 546 | 1,858 | |||||||||||||
| Meadowbank mine | 21 | 14 | 7 | 18 | 60 | |||||||||||||
| 1,109 | 1,168 | 1,383 | 1,429 | 5,089 | ||||||||||||||
| Zinc (LaRonde mine) (tonnes) | 8,302 | 16,649 | 18,032 | 11,516 | 54,499 | |||||||||||||
| Copper (LaRonde mine) (tonnes) | 820 | 658 | 738 | 978 | 3,194 | |||||||||||||
Notes:
- (i)
- Includes
Creston Mascota deposit at Pinos Altos.
- (ii)
- Payable production is the quantity of mineral produced during a period contained in products that are or will be sold by the Company, whether such products are sold during the period or held as inventory at the end of the period.
118 AGNICO-EAGLE MINES LIMITED
FIVE YEAR FINANCIAL AND OPERATING SUMMARY
FINANCIAL DATA
| Years Ended December 31, | |||||||||||||||||||
| 2012 | 2011 | 2010 | 2009 | 2008 | |||||||||||||||
| (thousands of United States dollars, except where noted) | |||||||||||||||||||
| Revenues from mining operations | $ | 1,917,714 | $ | 1,821,799 | $ | 1,422,521 | $ | 613,762 | $ | 368,938 | |||||||||
| Interest and sundry (expense) income and other | (6,207 | ) | (5,167 | ) | 94,879 | 26,314 | (37,465 | ) | |||||||||||
| 1,911,507 | 1,816,632 | 1,517,400 | 640,076 | 331,473 | |||||||||||||||
| Other costs and expenses | 1,476,366 | 2,595,260 | 1,082,197 | 532,038 | 235,482 | ||||||||||||||
| Income (loss) before income and mining taxes | 435,141 | (778,628 | ) | 435,203 | 108,038 | 95,991 | |||||||||||||
| Income and mining taxes | 124,225 | (209,673 | ) | 103,087 | 21,500 | 22,824 | |||||||||||||
| Net income (loss) for the year | $ | 310,916 | $ | (568,955 | ) | $ | 332,116 | $ | 86,538 | $ | 73,167 | ||||||||
| Attributed to non-controlling interest | $ | – | $ | (60 | ) | $ | – | $ | – | $ | – | ||||||||
| Attributed to common shareholders | $ | 310,916 | $ | (568,895 | ) | $ | 332,116 | $ | 86,538 | $ | 73,167 | ||||||||
| Net income (loss) per share – basic | $ | 1.82 | $ | (3.36 | ) | $ | 2.05 | $ | 0.55 | $ | 0.51 | ||||||||
| Net income (loss) per share – diluted | $ | 1.81 | $ | (3.36 | ) | $ | 2.00 | $ | 0.55 | $ | 0.50 | ||||||||
| Cash provided by operating activities | $ | 696,007 | $ | 667,185 | $ | 487,507 | $ | 118,139 | $ | 121,175 | |||||||||
| Cash used in investing activities | $ | 376,156 | $ | (760,484 | ) | $ | (523,306 | ) | $ | (587,611 | ) | $ | (917,549 | ) | |||||
| Cash (used in) provided by financing activities | $ | (202,606 | ) | $ | 178,822 | $ | (25,982 | ) | $ | 556,785 | $ | 558,072 | |||||||
| Cash dividends declared per common share | $ | 1.02 | $ | – | $ | 0.64 | $ | 0.18 | $ | 0.18 | |||||||||
| Capital expenditures | $ | 445,550 | $ | 482,831 | $ | 511,641 | $ | 657,175 | $ | 908,853 | |||||||||
| Average gold price realized ($ per ounce) | $ | 1,667 | $ | 1,573 | $ | 1,250 | $ | 1,024 | $ | 879 | |||||||||
| Average exchange rate (C$ per $) | C$ | 0.9994 | C$ | 0.9893 | C$ | 1.0301 | C$ | 1.1415 | C$ | 1.0669 | |||||||||
| Weighted average number of common shares outstanding – basic (thousands) | 171,250 | 169,353 | 162,343 | 155,942 | 144,741 | ||||||||||||||
| Working capital and Credit Facility drawdown availability | $ | 1,795,495 | $ | 1,472,300 | $ | 1,491,471 | $ | 598,581 | $ | 508,335 | |||||||||
| Total assets | $ | 5,255,842 | $ | 5,034,262 | $ | 5,500,351 | $ | 4,247,357 | $ | 3,378,824 | |||||||||
| Long-term debt | $ | 830,000 | $ | 920,095 | $ | 650,000 | $ | 715,000 | $ | 200,000 | |||||||||
| Shareholders' equity | $ | 3,410,212 | $ | 3,215,163 | $ | 3,665,450 | $ | 2,751,761 | $ | 2,517,756 | |||||||||
2012 ANNUAL REPORT 119
| Operating Summary | |||||||||||||||||||
| LaRonde mine | |||||||||||||||||||
| Revenues from mining operations | $ | 399,243 | $ | 398,609 | $ | 392,386 | $ | 352,221 | $ | 330,652 | |||||||||
| Production costs | 225,647 | 209,947 | 189,146 | 164,221 | 166,496 | ||||||||||||||
| Operating margin | 173,596 | 188,662 | 203,240 | 188,000 | 164,156 | ||||||||||||||
| Amortization of property, plant and mine development | 47,912 | 31,089 | 30,404 | 28,392 | 28,285 | ||||||||||||||
| Gross profit | $ | 125,684 | $ | 157,573 | $ | 172,836 | $ | 159,608 | $ | 135,871 | |||||||||
| Tonnes of ore milled | 2,358,499 | 2,406,342 | 2,592,252 | 2,545,831 | 2,638,691 | ||||||||||||||
| Gold (grams per tonne) | 2.36 | 1.79 | 2.17 | 2.75 | 2.84 | ||||||||||||||
| Gold production (ounces) | 160,875 | 124,173 | 162,806 | 203,494 | 216,208 | ||||||||||||||
| Silver production (thousands of ounces) | 2,244 | 3,169 | 3,581 | 3,919 | 4,079 | ||||||||||||||
| Zinc production (tonnes) | 38,637 | 54,894 | 62,544 | 56,186 | 65,755 | ||||||||||||||
| Copper production (tonnes) | 4,126 | 3,216 | 4,224 | 6,671 | 6,922 | ||||||||||||||
| Total cash costs per ounce of gold produced ($ per ounce basis): | |||||||||||||||||||
| Production costs | $ | 1,403 | $ | 1,691 | $ | 1,162 | $ | 807 | $ | 770 | |||||||||
| Adjustments: | |||||||||||||||||||
| Byproduct metal revenues, net of smelting, refining and marketing charges | (819 | ) | (1,562 | ) | (1,180 | ) | (699 | ) | (658 | ) | |||||||||
| Inventory and other adjustments(i) | 1 | (19 | ) | 19 | 1 | – | |||||||||||||
| Non-cash reclamation provision | (16 | ) | (33 | ) | (8 | ) | (6 | ) | (6 | ) | |||||||||
| Total cash costs per ounce of gold produced(ii) | $ | 569 | $ | 77 | $ | (7 | ) | $ | 103 | $ | 106 | ||||||||
| Minesite costs per tonne(ii) | C$ | 95 | C$ | 84 | C$ | 75 | C$ | 72 | C$ | 67 | |||||||||
120 AGNICO-EAGLE MINES LIMITED
| Years Ended December 31, | |||||||||||||||||||
| 2012 | 2011 | 2010 | 2009 | 2008 | |||||||||||||||
| Goldex mine | |||||||||||||||||||
| Revenues from mining operations | $ | – | $ | 217,662 | $ | 225,090 | $ | 142,493 | $ | 38,286 | |||||||||
| Production costs | – | 56,939 | 61,561 | 54,342 | 20,366 | ||||||||||||||
| Operating margin | – | 160,723 | 163,529 | 88,151 | 17,920 | ||||||||||||||
| Amortization of property, plant and mine development | – | 16,910 | 21,428 | 21,716 | 7,250 | ||||||||||||||
| Gross profit | $ | – | $ | 143,813 | $ | 142,101 | $ | 66,435 | $ | 10,670 | |||||||||
| Tonnes of ore milled | – | 2,476,515 | 2,781,564 | 2,614,645 | 1,118,543 | ||||||||||||||
| Gold (grams per tonne) | – | 1.79 | 2.21 | 1.98 | 1.86 | ||||||||||||||
| Gold production (ounces) | – | 135,478 | 184,386 | 148,849 | 57,436 | ||||||||||||||
| Total cash costs per ounce of gold produced ($ per ounce basis): | |||||||||||||||||||
| Production costs | $ | – | $ | 420 | $ | 333 | $ | 365 | $ | 430 | |||||||||
| Adjustments: | |||||||||||||||||||
| Byproduct metal revenues, net of smelting, refining and marketing charges | – | 3 | 4 | ||||||||||||||||
| Inventory and other adjustments(i) | – | (21 | ) | (1 | ) | 3 | (9 | ) | |||||||||||
| Non-cash reclamation provision | – | (1 | ) | (1 | ) | (1 | ) | (2 | ) | ||||||||||
| Total cash costs per ounce of gold produced(ii) | $ | – | $ | 401 | $ | 335 | $ | 367 | $ | 419 | |||||||||
| Minesite costs per tonne(ii) | C$ | – | C$ | 21 | C$ | 22 | C$ | 23 | C$ | 27 | |||||||||
2012 ANNUAL REPORT 121
| Lapa mine | |||||||||||||||||||
| Revenues from mining operations | $ | 173,753 | $ | 167,536 | $ | 150,917 | $ | 43,409 | $ | – | |||||||||
| Production costs | 73,376 | 68,599 | 66,199 | 33,472 | – | ||||||||||||||
| Operating margin | 100,377 | 98,937 | 84,718 | 9,937 | – | ||||||||||||||
| Amortization of property, plant and mine development | 42,216 | 37,954 | 31,986 | 9,906 | – | ||||||||||||||
| Gross profit | $ | 58,161 | $ | 60,983 | $ | 52,732 | $ | 31 | $ | – | |||||||||
| Tonnes of ore milled | 640,306 | 620,712 | 551,739 | 299,430 | – | ||||||||||||||
| Gold (grams per tonne) | 6.48 | 6.62 | 8.26 | 7.29 | – | ||||||||||||||
| Gold production (ounces) | 106,191 | 107,068 | 117,456 | 52,602 | – | ||||||||||||||
| Total cash costs per ounce of gold produced ($ per ounce basis): | |||||||||||||||||||
| Production costs | $ | 691 | $ | 641 | $ | 564 | $ | 636 | $ | – | |||||||||
| Adjustments: | |||||||||||||||||||
| Byproduct metal revenues, net of smelting, refining and marketing charges | 5 | 6 | 5 | – | – | ||||||||||||||
| Inventory and other adjustments(i) | (1 | ) | 6 | (40 | ) | 115 | – | ||||||||||||
| Non-cash reclamation provision | 2 | (3 | ) | – | – | – | |||||||||||||
| Total cash costs per ounce of gold produced(ii) | $ | 697 | $ | 650 | $ | 529 | $ | 751 | $ | – | |||||||||
| Minesite costs per tonne(ii) | C$ | 115 | C$ | 110 | C$ | 114 | C$ | 140 | C$ | – | |||||||||
122 AGNICO-EAGLE MINES LIMITED
| Kittila mine | |||||||||||||||||||
| Revenues from mining operations | $ | 284,429 | $ | 225,612 | $ | 160,140 | $ | 61,457 | $ | – | |||||||||
| Production costs | 98,037 | 110,477 | 87,740 | 42,464 | – | ||||||||||||||
| Operating margin | 186,392 | 115,135 | 72,400 | 18,993 | – | ||||||||||||||
| Amortization of property, plant and mine development | 30,091 | 26,574 | 31,488 | 10,909 | – | ||||||||||||||
| Gross profit | $ | 156,301 | $ | 88,561 | $ | 40,912 | $ | 8,084 | $ | – | |||||||||
| Tonnes of ore milled | 1,090,365 | 1,030,764 | 960,365 | 563,238 | – | ||||||||||||||
| Gold (grams per tonne) | 5.68 | 5.11 | 5.41 | 5.02 | – | ||||||||||||||
| Gold production (ounces) | 175,878 | 143,560 | 126,205 | 71,838 | – | ||||||||||||||
| Total cash costs per ounce of gold produced ($ per ounce basis): | |||||||||||||||||||
| Production costs | $ | 557 | $ | 770 | $ | 695 | $ | 648 | $ | – | |||||||||
| Adjustments: | |||||||||||||||||||
| Byproduct metal revenues, net of smelting, refining and marketing charges | 2 | 1 | 2 | – | – | ||||||||||||||
| Inventory and other adjustments(i) | 9 | (10 | ) | (38 | ) | 24 | – | ||||||||||||
| Non-cash reclamation provision | (3 | ) | (1 | ) | (2 | ) | (4 | ) | – | ||||||||||
| Stripping costs(iii) | – | (21 | ) | – | – | – | |||||||||||||
| Total cash costs per ounce of gold produced(ii) | $ | 565 | $ | 739 | $ | 657 | $ | 668 | $ | – | |||||||||
| Minesite costs per tonne(ii) | € | 69 | € | 75 | € | 66 | € | 54 | € | – | |||||||||
2012 ANNUAL REPORT 123
| Pinos Altos mine(iv) | |||||||||||||||||||
| Revenues from mining operations | $ | 450,664 | $ | 378,329 | $ | 175,637 | $ | 14,182 | $ | – | |||||||||
| Production costs | 152,942 | 145,614 | 90,293 | 11,819 | – | ||||||||||||||
| Operating margin | 297,722 | 232,715 | 85,344 | 2,363 | – | ||||||||||||||
| Amortization of property, plant and mine development | 36,830 | 36,989 | 21,577 | 1,524 | – | ||||||||||||||
| Gross profit | $ | 260,892 | $ | 195,726 | $ | 63,767 | $ | 839 | $ | – | |||||||||
| Tonnes of ore processed | 4,394,673 | 4,509,407 | 2,318,266 | 227,394 | – | ||||||||||||||
| Gold (grams per tonne) | 2.02 | 1.80 | 1.95 | 1.08 | – | ||||||||||||||
| Gold production (ounces) | 234,837 | 204,380 | 130,431 | 16,189 | – | ||||||||||||||
| Total cash costs per ounce of gold produced ($ per ounce basis): | |||||||||||||||||||
| Production costs | $ | 633 | $ | 712 | $ | 692 | $ | 1,227 | $ | – | |||||||||
| Adjustments: | |||||||||||||||||||
| Byproduct metal revenues, net of smelting, refining and marketing charges | (300 | ) | (297 | ) | (192 | ) | (65 | ) | – | ||||||||||
| Inventory and other adjustments(i) | 11 | 9 | 22 | (556 | ) | – | |||||||||||||
| Non-cash reclamation provision | (3 | ) | (6 | ) | (6 | ) | (10 | ) | – | ||||||||||
| Stripping Costs(iii) | (55 | ) | (119 | ) | (91 | ) | – | – | |||||||||||
| Total cash costs per ounce of gold produced(ii) | $ | 286 | $ | 299 | $ | 425 | $ | 596 | $ | – | |||||||||
| Minesite costs per tonne(ii) | $ | 31 | $ | 27 | $ | 35 | $ | 28 | $ | – | |||||||||
124 AGNICO-EAGLE MINES LIMITED
| Meadowbank mine | |||||||||||||||||||
| Revenues from mining operations | $ | 609,625 | $ | 434,051 | $ | 318,351 | $ | – | $ | – | |||||||||
| Production costs | 347,710 | 284,502 | 182,533 | – | – | ||||||||||||||
| Operating margin | 261,915 | 149,549 | 135,818 | – | – | ||||||||||||||
| Amortization of property, plant and mine development | 114,114 | 112,624 | 55,604 | – | – | ||||||||||||||
| Gross profit | $ | 147,801 | $ | 36,925 | $ | 80,214 | $ | – | $ | – | |||||||||
| Tonnes of ore milled | 3,820,911 | 2,977,722 | 2,000,792 | – | – | ||||||||||||||
| Gold (grams per tonne) | 3.17 | 3.02 | 4.34 | – | – | ||||||||||||||
| Gold production (ounces) | 366,030 | 270,801 | 265,659 | – | – | ||||||||||||||
| Total cash costs per ounce of gold produced ($ per ounce basis): | |||||||||||||||||||
| Production costs | $ | 950 | $ | 1,051 | $ | 690 | $ | – | $ | – | |||||||||
| Adjustments: | |||||||||||||||||||
| Byproduct metal revenues, net of smelting, refining and marketing charges | (5 | ) | (2 | ) | (2 | ) | – | – | |||||||||||
| Inventory and other adjustments(i) | 13 | (6 | ) | 26 | – | – | |||||||||||||
| Non-cash reclamation provision | (4 | ) | (7 | ) | (5 | ) | – | – | |||||||||||
| Stripping Costs(iii) | (41 | ) | (36 | ) | (16 | ) | – | – | |||||||||||
| Total cash costs per ounce of gold produced(ii) | $ | 913 | $ | 1,000 | $ | 693 | $ | – | $ | – | |||||||||
| Minesite costs per tonne(ii) | C$ | 88 | C$ | 91 | C$ | 95 | C$ | – | C$ | – | |||||||||
Notes:
- (i)
- Under
the Company's revenue recognition policy, revenue is recognized on concentrates when legal title passes. As total cash costs per ounce of gold produced are calculated on a
production basis, this inventory adjustment reflects the sales margin on the portion of concentrate production not yet recognized as revenue.
- (ii)
- Total
cash costs per ounce of gold produced and minesite costs per tonne are non-US GAAP measures that the Company uses to monitor the performance of its
operations. See "– Results of Operations – Production Costs" above for further detail.
- (iii)
- The
Company reports total cash costs per ounce of gold produced and minesite costs per tonne using a common industry practice of deferring certain stripping costs that can be
attributed to future production. The purpose of adjusting for these stripping costs is to enhance the comparability of total cash costs per ounce of gold produced and minesite costs per tonne to the
Company's peers within the mining industry.
- (iv)
- Includes the Creston Mascota deposit at Pinos Altos except for fourth quarter 2012 total cash costs per ounce of gold produced and minesite costs per tonne, as heap leach operations at the Creston Mascota deposit were suspended effective October 1, 2012.
2012 ANNUAL REPORT 125
ITEM 6 DIRECTORS, SENIOR MANAGEMENT AND EMPLOYEES
Directors and Senior Management
The articles of the Company provide for a minimum of five and a maximum of fifteen directors. By special resolution of the shareholders of the Company approved at the annual and special meeting of the Company held on June 27, 1996, the shareholders authorized the Board to determine the number of directors within the minimum and maximum.
The by-laws of Agnico-Eagle provide that directors will hold office for a term expiring at the next annual meeting of shareholders of Agnico-Eagle or until their successors are elected or appointed or the position is vacated. The Board annually appoints the officers of Agnico-Eagle, who are subject to removal by resolution of the Board at any time, with or without cause (in the absence of a written agreement to the contrary).
The following is a brief biography of each of Agnico-Eagle's directors:
Dr. Leanne M. Baker, of Sebastopol, California, is an independent director of Agnico-Eagle. Dr. Baker is the President and Chief Executive Officer and a director of Sutter Gold Mining Inc. ("Sutter"), a gold company that is developing its Lincoln Project in California's Mother Lode. Sutter's shares trade on the TSX Venture Exchange and the OTCQX. Previously, Dr. Baker was employed by Salomon Smith Barney where she was one of the top-ranked mining sector equity analysts in the United States. Dr. Baker is a graduate of the Colorado School of Mines (M.S. and Ph.D. in mineral economics). Dr. Baker has been a director of Agnico-Eagle since January 1, 2003, and is also a director of Reunion Gold Corporation (a mining exploration company traded on the TSX Venture Exchange), McEwen Mining Inc. and Kimber Resources Inc. (mining exploration companies traded on the NYSE Arca and the TSX). Area of expertise: Corporate Finance and Mineral Economics.
Douglas R. Beaumont, P.Eng., of Mississauga, Ontario, is an independent director of Agnico-Eagle. Mr. Beaumont, now retired, was most recently Senior Vice-President, Process Technology of SNC Lavalin. Prior to that, he was Executive Vice-President of Kilborn Engineering and Construction. Mr. Beaumont is a graduate of Queen's University (B.Sc.). Mr. Beaumont has been a director of Agnico-Eagle since February 25, 1997. Area of expertise: Mining and Metallurgy.
Sean Boyd, CA, of Toronto, Ontario, is the Vice-Chairman, President and Chief Executive Officer and a director of Agnico-Eagle. Mr. Boyd has been with Agnico-Eagle since 1985. Prior to his appointment as Vice-Chairman, President and Chief Executive Officer in February 2012, Mr. Boyd served as Vice-Chairman and Chief Executive Officer from 2005 to 2012 and as President and Chief Executive Officer from 1998 to 2005, Vice-President and Chief Financial Officer from 1996 to 1998, Treasurer and Chief Financial Officer from 1990 to 1996, Secretary Treasurer during a portion of 1990 and Comptroller from 1985 to 1990. Prior to joining Agnico-Eagle in 1985, he was a staff accountant with Clarkson Gordon (Ernst & Young). Mr. Boyd is a Chartered Accountant and a graduate of the University of Toronto (B.Comm.). Mr. Boyd has been a director of Agnico-Eagle since April 14, 1998. Area of expertise: Executive Management, Finance.
Martine A. Celej, of Toronto, Ontario, is an independent director of Agnico-Eagle. Ms. Celej is currently a Vice-President, Investment Advisor with RBC Dominion Securities and has been in the investment industry since 1989. She is a graduate of Victoria College at the University of Toronto (B.A. (Honours)). Ms. Celej became a director of Agnico-Eagle on February 14, 2011. Area of expertise: Investment Management.
Clifford J. Davis, of Kemble, Ontario, is an independent director of Agnico-Eagle. Mr. Davis is a mining industry veteran and formerly a member of the senior management teams of New Gold Inc., Gabriel Resources Ltd. and TVX Gold Inc. Mr. Davis is a graduate of the Royal School of Mines, Imperial College, London University (B.Sc., Mining Engineering). Mr. Davis has been a director of Agnico-Eagle since June 17, 2008 and is also a director and member of the Compensation Committee and the Nominating and Corporate Governance Committee of Zenyatta Ventures Ltd. Area of expertise: Mining.
Robert J. Gemmell, of Toronto, Ontario, is an independent director of Agnico-Eagle. Now retired, Mr. Gemmell spent 25 years as an investment banker in the United States and in Canada. Most recently, he was President and Chief Executive Officer of Citigroup Global Markets Canada and its predecessor companies (Salomon Brothers Canada and Salomon Smith Barney Canada) from 1996 to 2008. In addition, he was a member of the Global Operating Committee of Citigroup Global Markets from 2006 to 2008. Mr. Gemmell is a graduate of Cornell University (B.A.), Osgoode Hall Law School (LL.B.) and the Schulich School of Business (M.B.A.). Mr. Gemmell became a director of Agnico-Eagle on January 1, 2011. Area of expertise: Corporate Finance and Business Strategy.
Bernard Kraft, CA, of Toronto, Ontario, is an independent director of Agnico-Eagle. Mr. Kraft is a retired senior partner of the Toronto accounting firm Kraft, Berger LLP, Chartered Accountants and now serves as a consultant to that firm. He is also a principal in Kraft Yabrov Valuations Inc. Mr. Kraft is recognized as a Designated Specialist in Investigative and Forensic Accounting by the Canadian Institute of Chartered Accountants. Mr. Kraft is a member of the Canadian Institute of
126 AGNICO-EAGLE MINES LIMITED
Chartered Business Valuators, the Association of Certified Fraud Examiners and the American Society of Appraisers. Mr. Kraft has been a director of Agnico-Eagle since March 12, 1992, and is also a director and a member of the Audit Committee of Harte Gold Corp. Area of expertise: Audit and Accounting.
Mel Leiderman, CPA, CA, TEP, ICD.D, of Toronto, Ontario, is an independent director of Agnico-Eagle. Mr. Leiderman is the managing partner of the Toronto accounting firm Lipton LLP, Chartered Accountants. He is a graduate of the University of Windsor (B.A.) and is a certified director of the Institute of Corporate Directors (ICD.D). He has been a director of Agnico-Eagle since January 1, 2003 and is also a director and a member of the Audit Committee and Corporate Governance and Compensation Committee of Colossus Minerals Inc. and a director and a member of the Audit Committee of Morguard North American Residential REIT. Area of expertise: Audit and Accounting.
James D. Nasso, ICD.D, of Toronto, Ontario, is Chairman of the Board of Directors and an independent director of Agnico-Eagle. Mr. Nasso is now retired. Mr. Nasso is a graduate of St. Francis Xavier University (B.Comm.) and is a certified director of the Institute of Corporate Directors (ICD.D). Mr. Nasso has been a director of Agnico-Eagle since June 27, 1986. Area of expertise: Management and Business Strategy.
Dr. Sean Riley, of Antigonish, Nova Scotia, is an independent director of Agnico-Eagle. Dr. Riley has served as President of St. Francis Xavier University since 1996. Prior to 1996, his career was in finance and management, first in corporate banking and later in manufacturing. Dr. Riley is a graduate of St. Francis Xavier University (B.A. (Honours)) and of Oxford University (M. Phil, D. Phil, International Relations)). Dr. Riley became a director of Agnico-Eagle on January 1, 2011. Area of Expertise: Management and Business Strategy.
J. Merfyn Roberts, CA, of London, England, is an independent director of Agnico-Eagle. Mr. Roberts has been a fund manager and investment advisor for more than 25 years and has been closely associated with the mining industry. Mr. Roberts is a graduate of Liverpool University (B.Sc., Geology) and Oxford University (M.Sc., Geochemistry) and is a member of the Institute of Chartered Accountants in England and Wales. He has been a director of Agnico-Eagle since June 17, 2008, and is also a director and a member of the Audit Committee and of Eastern Platinum Limited, a director and a member of the Compensation and Corporate Governance Committee of Rambler Metals and Mining plc, a director and a member of the Remuneration Committee and Audit Committee of Mena Hydrocarbons Inc. and a director of Blackheath Resources Inc. Area of expertise: Investment Management.
Howard R. Stockford, P.Eng., of Toronto, Ontario, is an independent director of Agnico-Eagle. Mr. Stockford is a retired mining executive with 50 years of experience in the industry. Most recently, he was Executive Vice-President of Aur Resources Inc. ("Aur") and a director of Aur from 1984 until August 2007, when it was taken over by Teck Cominco Limited. Mr. Stockford has previously served as President of the Canadian Institute of Mining, Metallurgy and Petroleum and is a member of the Association of Professional Engineers of Ontario, the Prospectors and Developers Association of Canada and the Society of Economic Geologists. Mr. Stockford is a graduate of the Royal School of Mines, Imperial College, London University, U.K. (B.Sc., Mining Geology). Mr. Stockford has been a director of Agnico-Eagle since May 6, 2005, and is also a director and a member of the Audit Committee, Corporate Governance Committee and Technical Committee of Victory Nickel Inc. Area of expertise: Executive Management, Mining.
Pertti Voutilainen, M.Sc., M.Eng., of Espoo, Finland, is an independent director of Agnico-Eagle. Mr. Voutilainen is a mining industry veteran. Most recently, he was the Chairman of the board of directors of Riddarhyttan Resources AB. Previously, Mr. Voutilainen was the Chairman of the board of directors and Chief Executive Officer of Kansallis Banking Group and President after its merger with Union Bank of Finland until his retirement in 2000. He was also employed by Outokumpu Corp., Finland's largest mining and metals company, for 26 years, including as Chief Executive Officer for 11 years. Mr. Voutilainen holds the honorary title of Mining Counselor (Bergsrad), which was awarded to him by the President of the Republic of Finland in 2003. Mr. Voutilainen is a graduate of Helsinki University of Technology (M.Sc.), Helsinki University of Business Administration (M.Sc.) and Pennsylvania State University (M.Eng.). He has been a director of Agnico-Eagle since December 13, 2005. Area of expertise: Mining and Finance.
The following is a brief biography of each of Agnico-Eagle's senior officers:
Donald G. Allan, CA, of Toronto, Ontario, is Senior Vice-President, Corporate Development of Agnico-Eagle, a position he has held since December 14, 2006. Prior to that, Mr. Allan had been Vice-President, Corporate Development since May 6, 2002. Prior to that, Mr. Allan spent 16 years as an investment banker covering the mining and natural resources sectors with the firms Salomon Smith Barney and Merrill Lynch. Mr. Allan is a graduate of the Amos Tuck School, Dartmouth College (M.B.A.) and the University of Toronto (B.Comm.). Mr. Allan is also qualified as a Chartered Accountant.
Alain Blackburn, P.Eng., of Oakville, Ontario, is Senior Vice-President, Exploration of Agnico-Eagle, a position he has held since December 14, 2006. Prior to that, Mr. Blackburn had been Vice-President, Exploration since October 1, 2002. Prior
2012 ANNUAL REPORT 127
to that, Mr. Blackburn served as Agnico-Eagle's Manager, Corporate Development from January 1999 and Exploration Manager from September 1996 to January 1999. Mr. Blackburn joined Agnico-Eagle in 1988 as Chief Geologist at the LaRonde mine. Mr. Blackburn is a graduate of Université du Quebec de Chicoutimi (P.Eng.) and Université du Quebec en Abitibi-Temiscamingue (M.Sc.).
Picklu Datta, CA, of Toronto, Ontario is Senior Vice-President, Treasury and Finance of Agnico-Eagle. Mr. Datta was previously Vice-President, Treasurer and prior to that, he was Vice-President, Controller of Agnico-Eagle. Mr. Datta joined the Company in April 2005 and has worked in the mining industry for approximately ten years. Before joining the mining industry, Mr. Datta worked at Philip Morris Companies in New York City for approximately eight years and the technology industry for three years in various financial management roles. Mr. Datta obtained his Bachelor of Commerce degree from the University of Toronto and acquired his Chartered Accountancy designation by articling with Price Waterhouse Coopers.
Louise Grondin, Ing. P.Eng., of Toronto, Ontario, is Senior Vice-President, Environment and Sustainable Development of Agnico-Eagle, a position she has held since January 1, 2011. Prior to that, Ms. Grondin was Vice President, Environment and Sustainable Development and before that she was the Regional Environmental Manager and Environmental Manager, LaRonde Division. Prior to her employment with Agnico-Eagle, Ms. Grondin worked for Billiton Canada Ltd. as Manager Environment, Human Resources and Safety. Ms. Grondin is a graduate of the University of Ottawa (B.Sc.) and McGill University (M.Sc.).
Tim Haldane, P.Eng., of Tucson, Arizona, is Senior Vice-President, Latin America of Agnico-Eagle. Prior to joining Agnico-Eagle in May 2006, he was Vice President, Development for Glamis Gold Inc. where he participated in numerous acquisition and development activities in North America and Central America. Mr. Haldane is a graduate of the Montana School of Mines and Technology (B.S. Metallurgical Engineering) and has 30 years of experience in the precious metals and base metals industries.
R. Gregory Laing, B.A., LL.B., of Oakville, Ontario, is General Counsel, Senior Vice-President, Legal and Corporate Secretary of Agnico-Eagle, a position he has held since December 14, 2006, prior to which, Mr. Laing had been General Counsel, Vice-President, Legal and Corporate Secretary since September 19, 2005. Prior to that, he was Vice President, Legal of Goldcorp Inc. from October 2003 to June 2005 and General Counsel, Vice President, Legal and Corporate Secretary of TVX Gold Inc. from October 1995 to January 2003. He worked as a corporate securities lawyer for two prominent Toronto law firms prior to that. Mr. Laing is a director of West Red Lake Gold Mines Inc. (a mining exploration company), traded on the Canadian National Stock Exchange. Mr. Laing is a graduate of the University of Windsor (LL.B.) and Queen's University (B.A.).
Marc H. Legault, P.Eng, of Mississauga, Ontario, is Senior Vice-President, Project Evaluations of Agnico-Eagle, a position he has held since February 2012. Prior to that, he was Vice-President, Project Development since 2007. Mr. Legault has been with Agnico-Eagle since 1988, when he was hired as an exploration geologist in Val d'Or, Quebec. Since then, he has taken on successively increasing responsibilities in the Company's exploration, mine geology and project evaluation activities. Mr. Legault is a graduate of Carleton University (M.Sc. in geology in 1985) and Queen's University at Kingston (B.Sc.H. in Geological Engineering in 1982). Marc is a registered Professional Engineer. He is also a director of Golden Goliath Resources Ltd., a mining exploration company that trades on the TSX Venture Exchange.
Jean-Luk Pellerin, of Toronto, Ontario, is Senior Vice-President, Human Resources. Mr. Pellerin joined Agnico-Eagle in January 2012. Prior to that, he spent four years at Transat A.T. Inc. as Senior Vice-President, Human Resources and Chief Talent Officer. Before Transat, Mr. Pellerin spent six years in consulting at the helm of his own firm and as National Partner with Mercer Consulting. Prior to that, he held senior management and executive positions at Bombardier Inc., Domtar Corporation and General Electric. Mr. Pellerin has also taught in the MBA program at the H.E.C. Montreal in the Master's program in Organizational Development, as well as at American University and at the McGill International Executive Institute. Mr. Pellerin is a graduate of the University of Laval in Industrial Relations.
Jean Robitaille, of Oakville, Ontario, is Senior Vice-President, Technical Services and Project Development of Agnico-Eagle, a position he has held since June 2008. Prior to that, he served Agnico-Eagle in various capacities since 1988, most recently as Vice-President, Metallurgy & Marketing, General Manager, Metallurgy & Marketing and Mill Superintendent and Project Manager for the expansion of the LaRonde mill. Prior to joining Agnico-Eagle, Mr. Robitaille worked as a metallurgist with Teck Mining Group. Mr. Robitaille is a mining graduate of the College de l'Abitibi Témiscamingue with a specialty in mineral processing.
David Smith, P.Eng., of Toronto, Ontario, is Senior Vice-President, Finance and Chief Financial Officer of Agnico-Eagle, a position he has held since October 24, 2012. Prior to that, he was Senior Vice-President, Strategic Planning and Investor Relations, a position he held since January 1, 2011, and prior to that he was Senior Vice-President, Investor Relations and
128 AGNICO-EAGLE MINES LIMITED
prior to that he was Vice-President, Investor Relations. He started work in investor relations at Agnico-Eagle in February 2005. Prior to that, he was a mining analyst at Dominion Bond Rating Service for more than five years. Mr. Smith's professional experience also includes a variety of engineering positions in the mining industry, both in Canada and abroad. He is a graduate of Queen's University (B.Sc.) and the University of Arizona (M.Sc.). Mr. Smith is also a Professional Engineer.
Yvon Sylvestre, of Mississauga, Ontario, is Senior Vice-President, Operations, a position he has held since February 2012. Prior to that, he was Vice-President, Construction; Mine General Manager at the Goldex division of Agnico-Eagle and, previously, Mill Superintendent at the LaRonde division. Mr. Sylvestre is a Metallurgical Engineering Technology graduate from Cambrian College in Sudbury. Following graduation, he served as Metallurgist and Mill Superintendent at the Joutel division of Agnico-Eagle and also held the position of Mill Superintendent at the Trollus division of Inmet Mining Corporation.
There are no arrangements or understandings between any director or executive officer and any other person pursuant to which such director or executive officer was selected to serve, nor are there any family relationships between any such persons.
Compensation of Executive Officers
The senior officers of Agnico-Eagle are:
- •
- Sean
Boyd, Vice-Chairman, President and Chief Executive Officer
- •
- David
Smith, Senior Vice-President, Finance and Chief Financial Officer
- •
- Donald
G. Allan, Senior Vice-President, Corporate Development
- •
- Alain
Blackburn, Senior Vice-President, Exploration
- •
- Picklu
Datta, Senior Vice-President, Treasury and Finance
- •
- Louise
Grondin, Senior Vice-President, Environment and Sustainable Development
- •
- Tim
Haldane, Senior Vice-President, Latin America
- •
- R.
Gregory Laing, General Counsel, Senior Vice-President, Legal and Corporate Secretary
- •
- Marc
Legault, Senior Vice-President, Project Evaluations
- •
- Jean-Luk
Pellerin, Senior Vice-President, Human Resources
- •
- Jean
Robitaille, Senior Vice-President, Technical Services and Project Development
- •
- Yvon Sylvestre, Senior Vice-President, Operations
2012 ANNUAL REPORT 129
The following Summary Compensation Table sets out compensation during the fiscal year ended December 31, 2012 for the Vice-Chairman, President and Chief Executive Officer, the Senior Vice-President, Finance and Chief Financial Officer and the three other most highly compensated officers of the Company (the "Named Executive Officers") measured by total compensation earned during the fiscal years ended December 31, 2012, 2011 and 2010.
| Non-Equity Incentive Plan Compensation(1) |
|||||||||||||||||||||
| Name and Principal Position |
Year | Salary | Share- Based Awards (ESPP)(2) |
Share- Based Awards (RSUs)(3) |
Option- Based Awards(4) |
Annual Incentive Plans |
Long- Term Incentive Plans |
Pension Value |
All Other Compensation(5) |
Total Compensation(6) |
|||||||||||
| (C$) | (C$) | (C$) | (C$) | (C$) | (C$) | (C$) | (C$) | (C$) | |||||||||||||
| Sean Boyd | 2012 | 1,300,000 | 32,500 | 937,573 | 2,700,750 | 3,000,000 | n/a | 1,519,437 | 19,200 | 9,509,460 | |||||||||||
| Vice-Chairman and | 2011 | 1,260,000 | 52,000 | 4,120,800 | 1,197,000 | n/a | 257,642 | 95,005 | 6,982,447 | ||||||||||||
| Chief Executive Officer | 2010 | 1,200,000 | 46,250 | 4,893,000 | 1,656,000 | n/a | 320,034 | 19,200 | 8,134,484 | ||||||||||||
| David Smith(7) | 2012 | 465,962 | 16,500 | 468,787 | 623,250 | 495,000 | n/a | 144,144 | 29,910 | 2,243,553 | |||||||||||
| Senior Vice-President, Finance and | 2011 | 330,000 | 15,000 | 1,030,200 | 350,000 | n/a | 102,000 | 21,200 | 1,848,400 | ||||||||||||
| Chief Financial Officer | 2010 | 300,000 | 11,600 | 1,060,150 | 175,000 | n/a | 76,050 | 20,700 | 1,643,500 | ||||||||||||
| Ammar Al-Joundi(8) | 2012 | 298,269 | 12,250 | 468,787 | 831,000 | nil | n/a | 44,740 | nil | 1,655,046 | |||||||||||
| Senior Vice-President, Finance and | 2011 | 490,000 | 23,750 | 1,030,200 | 457,000 | n/a | 119,080 | 56,202 | 2,176,232 | ||||||||||||
| Chief Financial Officer | 2010 | 151,635 | 7,308 | 1,615,500 | (9) | 322,000 | n/a | nil | 5,908 | 2,102,351 | |||||||||||
| Alain Blackburn | 2012 | 460,000 | 21,900 | 468,787 | 623,250 | 393,000 | n/a | 127,950 | 26,883 | 2,121,770 | |||||||||||
| Senior Vice-President, | 2011 | 438,000 | 15,600 | 1,030,200 | 335,000 | n/a | 92,980 | 55,092 | 1,966,872 | ||||||||||||
| Exploration | 2010 | 425,000 | 15,600 | 1,631,000 | 344,000 | n/a | 25,350 | 19,200 | 2,460,150 | ||||||||||||
| Donald G. Allan | 2012 | 460,000 | 21,000 | 468,787 | 623,250 | 426,000 | n/a | 132,900 | 25,300 | 2,157,237 | |||||||||||
| Senior Vice-President, | 2011 | 420,000 | 16,900 | 1,030,200 | 378,000 | n/a | 96,730 | 57,216 | 1,999,046 | ||||||||||||
| Corporate Development | 2010 | 400,000 | 13,000 | 1,223,250 | 276,000 | n/a | 78,950 | 19,700 | 2,010,900 | ||||||||||||
| R. Gregory Laing | 2012 | 450,000 | 21,000 | 468,787 | 623,250 | 417,000 | n/a | 130,050 | 24,800 | 2,134,887 | |||||||||||
| General Counsel, | 2011 | 420,000 | 20,000 | 1,030,200 | 343,000 | n/a | 113,250 | 19,200 | 1,945,650 | ||||||||||||
| Senior Vice-President, Legal and | 2010 | 400,000 | 17,000 | 1,223,250 | 240,000 | n/a | 96,001 | 19,200 | 1,995,451 | ||||||||||||
| Corporate Secretary | |||||||||||||||||||||
Notes:
- (1)
- All
amounts earned on non-equity incentive plan compensation were paid during the financial year.
- (2)
- This
represents the Company's contribution to shares purchased by the Named Executive Officers pursuant to the Employee Share Purchase Plan.
- (3)
- These
amounts represent the fair value of the restricted share units of the Company ("RSUs") granted to the respective Named Executive Officers. These amounts were calculated by
multiplying the number of RSUs granted by the closing price of the Company's shares on the TSX on the day prior to the grant date. In 2012, RSU grants to the Named Executive Officers were based on a
dollar amount determined by the Compensation Committee, which was divided by the 20-day volume-weighted average price of the Company's common shares on the TSX in order to determine the
number of RSUs to be granted.
- (4)
- The
value of option-based awards, being C$8.31 per Option (2011 – C$17.17; 2010 – C$16.31), was determined
using the Black-Scholes option pricing model. The Black-Scholes option pricing model is a commonly used pricing model that assumes the valued option can only be exercised at expiration. All options to
purchase common shares of the Company ("Options") were granted at an exercise price of C$37.05 (2011 – C$76.60;
2010 – C$56.92), which was the closing price for the common shares of the Company on the TSX on the day prior to the date of grant. Key additional assumptions
used were: (i) the risk free interest rate, which was 1.22% (2011 – 1.96%; 2010 – 1.87%); (ii) current time to
expiration of the Option which was assumed to be 2.7 years (2011 – 2.5 years; 2010 – 2.5 years);
(iii) the volatility for the common shares of the Company on the TSX, which was 37.5% (2011 – 34.63%; 2010 – 44%);
and (iv) the dividend yield for the common shares of the Company, which was 2.16% (2011 – 0.88%; 2010 – 0.43%).
- (5)
- Consists
of premiums paid for term life and health insurance, automobile allowances, education and fitness benefits and, beginning in 2011, extended health coverage and
computer-related allowances for the Named Executive Officers.
- (6)
- The
total compensation was paid in Canadian dollars. The Company reports its financial statements in United States dollars. On December 31, 2012 the Noon Buying Rate was
C$1.00 equals US$1.0051
- (7)
- Mr. Smith
became Senior Vice-President, Finance and Chief Financial Officer on October 24, 2012; prior to that, he was the Senior Vice-President,
Strategic Planning and Investor Relations of the Company.
- (8)
- Mr. Al-Joundi
resigned as Senior Vice-President, Finance and Chief Financial Officer on July 9, 2012.
- (9)
- Mr. Al-Joundi joined the Company as Senior Vice-President, Finance and Chief Financial Officer on September 1, 2010 and received a grant of Options with a Black-Scholes value of C$14.46 on that date based an exercise price of C$69.44, a risk-free interest rate of 1.51%, a time to expiration of 5 years, a volatility of 31.4% and dividend yield of 0.24%.
130 AGNICO-EAGLE MINES LIMITED
RSU Plan
The Restricted Share Unit Plan (the "RSU Plan") was established by the Company to assist in the retention of the Company's employees, officers and directors by providing non-dilutive common shares to reward the individual performance of participants. Grants of RSUs are determined by the Compensation Committee (for directors and officers) or the Chief Executive Officer (for employees). RSUs vest in accordance with the vesting periods specified in the RSU Plan, which for officers and directors is on December 31 in the third year after the date of the grant of the RSU. Dividends declared on non-vested RSUs are used to purchase additional RSUs, which have the same vesting dates and expiry dates as the RSUs in respect of which such additional RSUs are added. Once vested, the common shares underlying the RSUs are transferred to a participant's vested RSU account and may be sold at the request of the participant.
If a participant's employment with the Company terminates as a result of a change of control or constructive termination within a six month period following a change of control, the participant's RSUs vest immediately. If a participant's employment is terminated for cause (as defined in the RSU Plan), the participant immediately forfeits all rights in respect of any non-vested RSUs. If a participant's employment is terminated without cause or if the participant retires or resigns from the service of the Company (including, for directors, resigning from the Board of Directors), dies while in the service of the Company or becomes disabled such that the participant receives benefits under the Company's long-term disability plan, the participant's non-vested RSUs vest immediately. The rights and obligations of the Company under the RSU Plan may be assigned by the Company to a successor in the business of the Company, to any corporation resulting from any amalgamation, reorganization, combination, merger or arrangement of the Company or to any corporation acquiring all or substantially all of the assets or business of the Company.
Stock Option Plan
Under the Stock Option Plan, Options to purchase common shares may be granted to directors, officers, employees and consultants of the Company. The exercise price of Options granted may be denominated in Canadian dollars or United States dollars, but generally may not be less than the closing market price for the common shares of the Company on the TSX (for Options with an exercise price denominated in Canadian dollars) or the NYSE (for Options with an exercise price denominated in United States dollars) on the trading day prior to the date of grant. The maximum term of Options granted under the Stock Option Plan is five years and the maximum number of Options that can be issued in any year is 2% of the Company's outstanding common shares. In addition, a maximum of 25% of the Options granted in an Option grant vest upon the date granted with the remaining Options vesting equally on the next three anniversaries of the Option grant. The value of Options granted to non-executive directors participating in the Stock Option Plan is limited to C$100,000 per year; however, in July 2011, the Board amended its director compensation program such that non-executive directors now receive RSUs instead of Options. The number of common shares which may be reserved for issuance to any one person pursuant to Options (under the Stock Option Plan or otherwise), warrants, share purchase plans or other compensation arrangements may not exceed 5% of the outstanding common shares. Additionally, the number of common shares which may be issuable to insiders of the Company pursuant to Options (under the Stock Option Plan or otherwise), warrants, share purchase plans or other compensation arrangements, at any time, cannot exceed 10% of outstanding common shares and the number of common shares issued to insiders of the Company pursuant to Options (under the Stock Option Plan or otherwise), warrants, share purchase plans or other compensation arrangements, within any one year period, cannot exceed 10% of the outstanding common shares.
The Stock Option Plan provides for the termination of an Option held by an Option holder in the following circumstances:
- •
- the
Option expires (no later than five years after the Option was granted);
- •
- 30 days
after the Option holder ceases to be an employee, officer, director of or consultant to the Company or any subsidiary of the Company;
- •
- twelve
months after the death of the Option holder; and
- •
- where such Option holder is a director, four years after the date he or she resigns or retires from the Board of Directors (provided that in no event will any Option expire later than five years after the Option was granted).
An Option granted under the Stock Option Plan may only be assigned to eligible assignees, including a spouse, a minor child, a minor grandchild, a trust governed by a registered retirement savings plan of such participant, a corporation controlled by such participant and of which all other shareholders are eligible assignees or a family trust of which such participant is a trustee and of which all beneficiaries are eligible assignees. Assignments must be approved by the Board of Directors and any stock exchange or other authority.
2012 ANNUAL REPORT 131
The Board of Directors may amend or revise the terms of the Stock Option Plan without the approval of shareholders as permitted by law and subject to any required approval by any stock exchange or other authority including amendments of a "housekeeping" nature, amendments necessary to comply with applicable law (including, without limitation, the rules, regulations and policies of the TSX), amendments respecting administration of the Stock Option Plan (provided such amendment does not entail an extension beyond the original expiry date), any amendment to the vesting provisions of the Stock Option Plan or any Option, any amendment to the early termination provisions of the Stock Option Plan or any Option, whether or not such Option is held by an insider (provided such amendment does not entail an extension beyond the original expiry date), the addition or modification of a cashless exercise feature, amendments necessary to suspend or terminate the Stock Option Plan and any other amendment, whether fundamental or otherwise, not requiring shareholder approval under applicable law (including, without limitation, the rules, regulations and policies of the TSX). No amendment or revision to the Stock Option Plan which adversely affects the rights of any Option holder under any Option granted under the Stock Option Plan can be made without the consent of the Option holder whose rights are being affected.
In addition, no amendments to the Stock Option Plan to increase the maximum number of common shares reserved for issuance, to reduce the exercise price for any Option, to extend the term of an Option, to increase any limit on grants of Options to insiders of the Company, to amend the designation of who is an eligible participant or eligible assignee, to change the participation limits in any given year for non-executive directors or to grant additional powers to the Board to amend the Stock Option Plan or entitlements can be made without first obtaining the approval of the Company's shareholders. In response to a TSX staff notice regarding amendments to security based compensation arrangements, the Stock Option Plan was amended in 2007 such that where the Company has imposed trading restrictions on directors and officers that fall within ten trading days of the expiry of an Option, such Option's expiry date shall be the tenth day following the termination of such restrictions. The Stock Option Plan does not expressly entitle participants to convert an Option into a stock appreciation right.
Under the Stock Option Plan, only eligible persons who are not directors or officers of the Company are entitled to receive loans (on a non-recourse or limited recourse basis or otherwise), guarantees or other support arrangements from the Company to facilitate Option exercises. During 2012, no loans, guarantees or other financial assistance were provided under the Stock Option Plan.
The number of common shares currently reserved for issuance under the Stock Option Plan is 14,099,411 common shares (comprised of 11,750,991 common shares relating to Options issued but unexercised and 2,348,420 common shares relating to Options available to be issued), representing 8.2% of the Company's 172,501,169 common shares issued and outstanding as at March 11, 2013.
In 2012, officers exercised Options to receive notional proceeds of, in aggregate, C$1,185,380.50 (7 people) (C$4,089,391 (7 people) in 2011); C$21,775,538 (17 people) in 2010). In 2012, the Company received proceeds from the exercise of Options in the amount of C$6,360,030 (C$3,822,087 in 2011 and C$76,129,773 in 2010).
The following table sets out the value vested during the most recently completed financial year of the Company of incentive plan awards granted to the Named Executive Officers.
Incentive Plan Awards Table – Value Vested or Earned During Fiscal Year 2012
| Name | Option-Based Awards – Value Vested During the Year |
Share-Based Awards – Value Vested During the Year |
Non-Equity Incentive Plan Compensation – Value Earned During the Year |
||||
| (C$) | (C$) | (C$) | |||||
| Sean Boyd | nil | n/a | 3,000,000 | ||||
| David Smith | nil | n/a | 495,000 | ||||
| Ammar Al-Joundi | nil | n/a | nil | ||||
| Alain Blackburn | nil | n/a | 393,000 | ||||
| Donald G. Allan | nil | n/a | 426,000 | ||||
| R. Gregory Laing | nil | n/a | 417,000 | ||||
132 AGNICO-EAGLE MINES LIMITED
The following table sets out the outstanding Option awards of the Named Executive Officers as at December 31, 2012.
Outstanding Incentive Plan Awards Table
| Option-Based Awards | Share-Based Awards | |||||||||||||
| Name | Number of Securities Underlying Unexercised Options |
Option Exercise Price |
Option Expiration Date |
Value of Unexercised In-The-Money Options(1) |
Number of Shares or Units of Shares that have not Vested |
Market or Payout Value of Share Based Awards that have not Vested(1) |
Market or Payout Value of Vested Share Based Awards not Paid Out or Distributed |
|||||||
| (#) | (C$) | (C$) | (#) | (C$) | (C$) | |||||||||
| Sean Boyd | 200,000 | 54.42 | 1/2/2013 | nil | 24,660 | 1,285,525.80 | nil | |||||||
| 250,000 | 62.77 | 1/2/2014 | nil | |||||||||||
| 300,000 | 56.92 | 1/4/2015 | nil | |||||||||||
| 240,000 | 76.60 | 1/4/2016 | nil | |||||||||||
| 325,000 | 37.05 | 1/3/2017 | 4,901,000 | |||||||||||
| David Smith | 15,000 | 54.42 | 1/2/2013 | nil | 12,330 | 642,762.90 | nil | |||||||
| 65,000 | 62.77 | 1/2/2014 | nil | |||||||||||
| 65,000 | 56.92 | 1/4/2015 | nil | |||||||||||
| 60,000 | 76.60 | 1/4/2016 | nil | |||||||||||
| 75,000 | 37.05 | 1/7/2017 | 1,131,000 | |||||||||||
| Ammar Al-Joundi | 75,000 | 69.44 | 9/1/2015 | nil | nil | nil | nil | |||||||
| 60,000 | 76.60 | 1/4/2016 | nil | |||||||||||
| Alain Blackburn | 39,750 | 54.42 | 1/2/2013 | nil | 12,330 | 642,762.90 | nil | |||||||
| 100,000 | 62.77 | 1/2/2014 | nil | |||||||||||
| 100,000 | 56.92 | 1/4/2015 | nil | |||||||||||
| 60,000 | 76.60 | 1/4/2016 | nil | |||||||||||
| 75,000 | 37.05 | 1/3/2017 | 1,131,000 | |||||||||||
| Donald G. Allan | 30,000 | 54.42 | 1/2/2013 | nil | 12,330 | 642,762.90 | nil | |||||||
| 75,000 | 62.77 | 1/2/2014 | nil | |||||||||||
| 75,000 | 56.92 | 1/4/2015 | nil | |||||||||||
| 60,000 | 76.60 | 1/4/2016 | nil | |||||||||||
| 56,250 | 37.05 | 1/3/2017 | 848,250 | |||||||||||
| R. Gregory Laing | 60,000 | 54.42 | 1/2/2013 | nil | 12,330 | 642,762.90 | nil | |||||||
| 75,000 | 62.77 | 1/2/2014 | nil | |||||||||||
| 75,000 | 56.92 | 1/4/2015 | nil | |||||||||||
| 60,000 | 76.60 | 1/4/2016 | nil | |||||||||||
| 75,000 | 37.05 | 1/3/2017 | 1,131,000 | |||||||||||
Note:
- (1)
- Based on a closing price of the Company's shares on the TSX of C$52.13 on December 31, 2012. On December 31, 2012, the Noon Buying Rate was C$1.00 equals US$1.0051.
2012 ANNUAL REPORT 133
The following table sets out, as at December 31, 2012, compensation plans under which equity securities of the Company are authorized for issuance from treasury. The information has been aggregated by plans approved by shareholders and plans not approved by shareholders (of which there are none).
Equity Compensation Plan Information
| Plan Category | Number of securities to be issued on exercise of outstanding options |
Weighted average exercise price of outstanding options |
Number of securities remaining available for future issuances under equity compensation plans |
||||
| Equity compensation plans approved by shareholders | 10,587,126 | C$56.60 | 3,717,785 | ||||
| Equity compensation plans not approved by shareholders | nil | nil | nil | ||||
Employee Share Purchase Plan
In 1997, the shareholders of the Company approved the Employee Share Purchase Plan to encourage directors, officers and full-time employees of the Company to purchase common shares of the Company. In 2009, the Employee Share Purchase Plan was amended to prohibit non-executive directors from participating in the plan. Full-time employees who have been continuously employed by the Company or its subsidiaries for at least twelve months are eligible at the beginning of each fiscal year to elect to participate in the Employee Share Purchase Plan. Eligible employees may contribute up to 10% of their basic annual salary through monthly payroll deductions or quarterly payments by cheque. The Company contributes an amount equal to 50% of the individual's contributions and issues common shares that have a market value equal to the total contributions (individual and Company) under the Employee Share Purchase Plan. In 2008, the shareholders of the Company approved an amendment to the Employee Share Purchase Plan to increase the number of shares available under such plan to 5,000,000 common shares. Of the 5,000,000 common shares approved, the Company has, as at March 11, 2013, 1,643,794 common shares remaining for issuance under the Employee Share Purchase Plan.
Pension Plan Benefits
The Company's basic defined contribution pension plan (the "Basic Plan") provides pension benefits to employees of the Company generally, including the Named Executive Officers. Under the Basic Plan, the Company contributes an amount equal to 15% of each designated executive's pensionable earnings (including salary and short-term bonus) to the Basic Plan. The Company's contributions cannot exceed the money purchase limit, as defined in the Income Tax Act (Canada). Upon termination, the Company's contribution to the Basic Plan ceases and the participant is entitled to a pension benefit in the amount of the vested account balance. All contributions to the Basic Plan are invested in a variety of funds offered by the plan administrator, at the direction of the participant.
In addition to the Basic Plan, effective January 1, 2008, in line with the Company's compensation policy that compensation must be competitive in order to help attract and retain the executives needed to lead and grow the Company's business and to address the weakness of the Company's retirement benefits when compared to its peers in the gold production industry, the Company adopted a supplemental defined contribution plan (the "Supplemental Plan") for designated executives at the level of Vice-President or above. On December 31 of each year, the Company credits each designated executive's account an amount equal to 15% of the designated executive's pensionable earnings for the year (including salary and short term bonus), less the Company's contribution to the Basic Plan. In addition, on December 31 of each year, the Company will credit each designated executive's account a notional investment return equal to the balance of such designated executive's account at the beginning of the year multiplied by the yield rate for Government of Canada marketable bonds with average yields over ten years. Upon retirement, after attaining the minimum age of 55, the designated executive's account will be paid out in either (a) five annual installments subsequent to the date of retirement, or (b) by way of lump sum payment, at the executive's option. If the designated executive's employment is terminated prior to reaching the age of 55, such designated executive will receive, by way of lump sum payment, the total amount credited to his or her account.
134 AGNICO-EAGLE MINES LIMITED
The individual Retirement Compensation Arrangement Plan (the "RCA Plan") for Mr. Boyd provides pension benefits which are generally equal (on an after-tax basis) to what the pension benefits would be if they were provided directly from a registered pension plan. There are no pension benefit limits under the RCA Plan. The RCA Plan provides an annual pension at age 60 equal to 2% of the executive's final three-year average pensionable earnings for each year of continuous service with the Company, less the annual pension payable under the Basic Plan. The pensionable earnings for the purposes of the RCA Plan consists of all basic remuneration and do not include benefits, bonuses, automobile or other allowances, or unusual payments. Payments under the RCA Plan are secured by a letter of credit from a Canadian chartered bank. Mr. Boyd may retire early, any time after reaching age 55, with a benefit based on service and final average earnings at the date of retirement, with no early retirement reduction. The Company does not have a policy to grant extra years of service under its pension plans.
The following table sets out the benefits to Mr. Boyd and the associated costs to the Company in excess of the costs under the Company's Basic Plan.
| Annual Benefits Accrued |
|||||||||||||||
| Name | Number of Years of Service(1) |
At Year End(1) |
At age 60 | Accrued Obligation at the Start of the Year(2) |
Compensatory Change(3) |
Non- Compensatory Change(4) |
Accrued Obligation at Year End(5) |
||||||||
| (#) | (C$) | (C$) | (C$) | (C$) | (C$) | (C$) | |||||||||
| Sean Boyd | 27 | 765,223 | 1,079,902 | 7,909,256 | 1,495,617 | 1,251,952 | 10,656,825 | ||||||||
Notes:
- (1)
- As
at December 31, 2012.
- (2)
- The
actuarial valuation methods and assumptions that the Company applied in quantifying the accrued obligation at the start of the year are the same as those set out in note 6
to the Company's annual audited consolidated financial statements for the year ended December 31, 2011.
- (3)
- Includes
the value of the pension earned during the year, the impact of any plan amendments and of any differences between actual and assumed compensation.
- (4)
- Includes
the impact of interest accruing on the beginning-of-year obligation and changes in the actuarial assumptions and other experience gains
and losses.
- (5)
- The actuarial valuation methods and assumptions that the Company applied in quantifying the accrued obligation at year end are the same as those set out in note 6 to the Company's annual audited consolidated financial statements for the year ended December 31, 2012.
The following tables set out summary information about the Basic Plan and the Supplemental Plan for each of the Named Executive Officers as at December 31, 2012.
Defined Contribution Plan Table – Basic Plan
| Name | Accumulated Value at Start of Year |
Compensatory(1) | Non- Compensatory(2) |
Accumulated Value at Year End |
|||||
| (C$) | (C$) | (C$) | (C$) | ||||||
| Sean Boyd | 392,972 | 23,820 | 34,110 | 450,902 | |||||
| David Smith | 114,126 | 23,820 | 10,187 | 148,133 | |||||
| Ammar Al-Joundi | 40,950 | 23,820 | 451 | 65,221 | |||||
| Alain Blackburn | 286,328 | 23,820 | 29,529 | 339,677 | |||||
| Donald G. Allan | 183,762 | 23,820 | 21,066 | 228,648 | |||||
| R. Gregory Laing | 121,840 | 23,820 | 11,742 | 157,402 | |||||
Notes:
- (1)
- Includes
the total amount contributed by the Company to the member's account during 2012.
- (2)
- Includes all investment income earned on the member's account balances during 2012.
2012 ANNUAL REPORT 135
Defined Contribution Plan Table – Supplemental Plan
| Name | Accumulated Value at Start of Year |
Compensatory(1) | Non- Compensatory(2) |
Accumulated Value at Year End |
|||||
| (C$) | (C$) | (C$) | (C$) | ||||||
| Sean Boyd(3) | nil | nil | nil | nil | |||||
| David Smith | 199,805 | 120,324 | 4,536 | 324,665 | |||||
| Ammar Al-Joundi | 119,080 | 20,920 | 1,441 | 141,441 | |||||
| Alain Blackburn | 315,664 | 104,130 | 7,166 | 426,960 | |||||
| Donald G. Allan | 288,962 | 109,080 | 6,559 | 404,601 | |||||
| R. Gregory Laing | 276,981 | 106,230 | 6,287 | 389,498 | |||||
Notes:
- (1)
- Includes
the total amount notionally credited by the Company to the member's account during 2012. There was no above market investment income credited under the
Supplemental Plan.
- (2)
- Includes
all investment income earned on the member's notional account balances during 2012.
- (3)
- Mr. Boyd does not participate in the Supplemental Plan.
In 2012, the Company's Human Resources department conducted an internal market analysis using publicly available information from the Company's peer group and surveys provided by different compensation firms, notably the PricewaterhouseCoopers LLP 2012 "Mining Industry Salary Survey – Corporate Report". The information was used by the Compensation Committee and the Board of Directors in recommending and approving the salary adjustments to market and the bonus targets for the Company's senior executives.
The Compensation Committee also retained Meridian Compensation Partners in 2012 to provide consulting services with respect to designing a structure to better align the Vice-Chairman, President and Chief Executive Officer's compensation with the interests of the Company's shareholders and the performance of the Company's common shares.
Executive Compensation-Related Fees
| Name of Firm | Year | Amount Paid for Compensation-Related Services |
|||
| (C$) | |||||
| Mercer (Canada) Limited | 2011 | 29,275 | |||
| Meridian Compensation Partners | 2012 | 16,419 | |||
Employment Contracts/Termination Arrangements
The Company has employment agreements with all of its executive officers that provide for an annual base salary, bonus and certain pension, health, dental and other insurance and automobile benefits. These amounts may be increased at the discretion of the Board of Directors upon the recommendation of the Compensation Committee. For the 2012 base salary for each Named Executive Officer, see "Summary Compensation Table" above. If the individual agreements are terminated other than for cause, death or disability, or upon their resignation following certain events, all of the Named Executive Officers would be entitled to a payment equal to two and one-half times their annual base salary at the date of termination plus an amount equal to two and one-half times their annual bonus (averaged over the preceding two years but not including Options) and a continuation of benefits for up to two and one-half years (or, at the election of the employee, the amount equal to the Company's cost in providing such benefits) or until the individual commences new employment. Certain events that would trigger a severance payment are:
- •
- termination
of employment without cause;
- •
- substantial alteration of responsibilities;
136 AGNICO-EAGLE MINES LIMITED
- •
- reduction
of base salary or benefits;
- •
- office
relocation of greater than 100 kilometres;
- •
- failure
to obtain a satisfactory agreement from any successor to assume the individual's employment agreement or provide the individual with a comparable position, duties,
salary and benefits; or
- •
- any change in control of the Company.
If a severance payment triggering event had occurred on December 31, 2012, the severance payments that would be payable to each of the Named Executive Officers, other than Mr. Al-Joundi, would be approximately as follows: Mr. Boyd – C$8,544,250; Mr. Smith – C$2,256,025; Mr. Blackburn – C$2,127,208; Mr. Allan – C$2,218,250; and Mr. Laing – C$2,137,000.
Other than Mr. Boyd, none of the directors of the Company are party to a service contract with the Company or any of its subsidiaries that provides for benefits payable to such director upon termination of employment.
Compensation of Directors and Other Information
Mr. Boyd, who is a director and the Vice-Chairman, President and Chief Executive Officer of the Company, does not receive any remuneration for his services as director of the Company.
The table below sets out the annual retainers (annual retainers for the Chairs of the Board of Directors and other Committees are in addition to the base annual retainer) paid to the directors during the year ended December 31, 2012. Directors do not receive meeting attendance fees.
| Compensation during the year ending December 31, 2012 |
||||
| Annual Board retainer (base) | C$ | 120,000 | ||
| Additional Annual retainer for Chairman of the Board | C$ | 120,000 | ||
| Additional Annual retainer for Chairman of the Audit Committee | C$ | 25,000 | ||
| Additional Annual retainer for Chairs of other Board Committees | C$ | 10,000 | ||
Effective as of July 1, 2011, director compensation was amended to more closely align the equity component of director compensation with shareholder interests by discontinuing the former practice of granting Options to non-executive directors and replacing such Option grants with grants of RSUs. As the value of RSUs tracks the value of the Company's common shares, the equity value of director compensation will now correspond directly with share price movements, thereby more closely aligning director and shareholder interests.
In January 2012 and 2013, each director was entitled to receive an annual grant of 3,000 RSUs (the Chairman of the Board was entitled to receive 4,000 RSUs in 2012 and 5,000 RSUs in 2013). However, if a director meets the minimum share ownership requirement (as described under "Director Shareholding Guidelines" below), he or she can elect to receive cash in lieu of a portion of the RSUs to be granted, subject to receipt of a minimum annual grant of 1,000 RSUs.
Director Shareholding Guidelines
To more closely align the interests of directors with those of shareholders, directors (other than Mr. Boyd) are required to own a minimum of 10,000 common shares of the Company and/or RSUs. Directors have a period of the later of: (i) two years from the date of adoption of this policy (that is, August 24, 2013) or (ii) five years from the date of joining the Board, to achieve this ownership level through open market purchases of common shares, grants of RSUs or the exercise of Options held.
As of March 11, 2013, all of the directors have satisfied the minimum share ownership requirement, other than Dr. Riley who has until January 1, 2016 and Ms. Celej who has until February 14, 2016 (five years from the date each became a director) to satisfy the minimum share ownership requirement.
2012 ANNUAL REPORT 137
The table below sets out the number and the value of common shares and RSUs held by each director of the Company.
| Aggregate common shares and RSUs owned by each director and aggregate value thereof as at March 11, 2013 |
|||||||||||
| Name | Aggregate Number of Common Shares |
Aggregate Value of Common Shares(1) |
Aggregate Number of RSUs |
Aggregate Value of RSUs(1) |
Deadline to meet Guideline |
||||||
| (#) | (C$) | (#) | (C$) | ||||||||
| Leanne M. Baker | 5,500 | 220,000 | 6,000 | 240,000 | Meets Guideline | ||||||
| Douglas R. Beaumont | 17,960 | 718,400 | 2,000 | 80,000 | Meets Guideline | ||||||
| Sean Boyd | 41,142 | 1,645,680 | 124,660 | 4,986,400 | Meets CEO Guideline(2) | ||||||
| Martine A. Celej | 2,000 | 80,000 | 6,000 | 240,000 | February 14, 2016 | ||||||
| Clifford J. Davis | 6,000 | 240,000 | 6,000 | 240,000 | Meets Guideline | ||||||
| Robert J. Gemmell | 10,000 | 400,000 | 6,000 | 240,000 | Meets Guideline | ||||||
| Bernard Kraft | 12,657 | 506,280 | 2,000 | 80,000 | Meets Guideline | ||||||
| Mel Leiderman | 6,000 | 240,000 | 6,000 | 240,000 | Meets Guideline | ||||||
| James D. Nasso | 18,289 | 731,560 | 5,000 | 200,000 | Meets Guideline | ||||||
| Sean Riley | 2,000 | 80,000 | 6,000 | 240,000 | January 1, 2016 | ||||||
| John Merfyn Roberts | 6,000 | 240,000 | 6,000 | 240,000 | Meets Guideline | ||||||
| Howard R. Stockford | 7,068 | 282,720 | 4,000 | 160,000 | Meets Guideline | ||||||
| Pertti Voutilainen | 14,800 | 592,000 | 2,000 | 80,000 | Meets Guideline | ||||||
Notes:
- (1)
- The
valuation is calculated based on the closing price of the Company's shares on the TSX of C$40.00 on March 11, 2013.
- (2)
- Mr. Boyd is subject to the Chief Executive Officer shareholding requirements set out under "– Share Ownership" below.
138 AGNICO-EAGLE MINES LIMITED
The following table sets out the compensation provided to the members of the Board of Directors, other than Mr. Boyd, for the Company's most recently completed financial year.
Director Compensation Table – 2012
| Name | Fees Earned |
Share- Based Awards(1) |
Option- Based Awards(2) |
Non-Equity Incentive Plan Compensation(3) |
Pension Value |
All Other Compensation |
Total(4) | ||||||||
| (C$) | (C$) | (C$) | (C$) | (C$) | (C$) | (C$) | |||||||||
| Leanne M. Baker | 145,000 | 114,060 | n/a | n/a | n/a | n/a | 259,060 | ||||||||
| Douglas R. Beaumont | 120,000 | 38,020 | n/a | 81,100 | n/a | n/a | 239,120 | ||||||||
| Martine A.Celej | 120,000 | 114,060 | n/a | n/a | n/a | n/a | 234,060 | ||||||||
| Clifford J. Davis | 130,000 | 114,060 | n/a | n/a | n/a | n/a | 244,060 | ||||||||
| Robert Gemmell | 130,000 | 114,060 | n/a | n/a | n/a | n/a | 244,060 | ||||||||
| Bernard Kraft | 120,000 | 38,020 | n/a | 81,100 | n/a | n/a | 239,120 | ||||||||
| Mel Leiderman | 120,000 | 114,060 | n/a | n/a | n/a | n/a | 234,060 | ||||||||
| James D. Nasso | 240,000 | 152,080 | n/a | n/a | n/a | n/a | 392,080 | ||||||||
| John Merfyn Roberts | 130,000 | 114,060 | n/a | n/a | n/a | n/a | 244,060 | ||||||||
| Sean Riley | 120,000 | 114,060 | n/a | n/a | n/a | n/a | 234,060 | ||||||||
| Howard R. Stockford | 120,000 | 114,060 | n/a | n/a | n/a | n/a | 234,060 | ||||||||
| Pertti Voutilainen | 120,000 | 38,020 | n/a | 81,100 | n/a | n/a | 239,120 | ||||||||
Notes:
- (1)
- The
valuation of the grants of RSUs was calculated based on the closing price of the Company's common shares on the TSX of C$38.02 on January 4, 2012, the day prior to the date
of the grant.
- (2)
- Option-based
awards are no longer granted to non-executive directors.
- (3)
- A
director who satisfies the minimum shareholding requirement may elect to receive cash in lieu of a portion of his or her grant of RSUs.
- (4)
- Set out in Canadian dollars. On December 31, 2012 the noon buying rate as reported by the Bank of Canada (the "Noon Buying Rate") was C$1.00 equals $1.0051.
2012 ANNUAL REPORT 139
The following table sets out the value vested during the most recently completed financial year of the Company of incentive plan awards granted to the directors of the Company, other than Mr. Boyd.
Incentive Plan Awards Table – Value Vested During Fiscal Year 2012
| Name | Option-Based Awards – Value Vested During the Year |
Share-Based Awards – Value Vested During the Year |
Non-Equity Incentive Plan Compensations – Value Earned During the Year |
||||
| (C$) | (C$) | (C$) | |||||
| Leanne M. Baker | 4,520 | nil | n/a | ||||
| Douglas R. Beaumont | nil | nil | n/a | ||||
| Martine A. Celej | nil | nil | n/a | ||||
| Clifford J. Davis | 143,064 | nil | n/a | ||||
| Robert Gemmell | nil | nil | n/a | ||||
| Bernard Kraft | nil | nil | n/a | ||||
| Mel Leiderman | nil | nil | n/a | ||||
| James D. Nasso | nil | nil | n/a | ||||
| Sean Riley | nil | nil | n/a | ||||
| John Merfyn Roberts | 143,064 | nil | n/a | ||||
| Howard R. Stockford | nil | nil | n/a | ||||
| Pertti Voutilainen | nil | nil | n/a | ||||
140 AGNICO-EAGLE MINES LIMITED
The following table sets out the outstanding Option awards and RSUs of the directors of the Company, other than Mr. Boyd, as at December 31, 2012.
Outstanding Incentive Plan Awards Table – 2012
| Option-Based Awards | Share-Based Awards | ||||||||||||
| Name | Number of Securities Underlying Unexercised Options |
Option Exercise Price |
Option Expiration Date |
Value of Unexercised In-The-Money Options(1) |
Number of Shares or Units of Shares that have not Vested |
Market or Payout Value of Share-Based Awards that have not Vested(1) |
|||||||
| (#) | (C$) | (C$) | (#) | (C$) | |||||||||
| Leanne M. Baker | 35,000 | 54.63 | (2) | 1/2/2013 | 4,520 | (2) | 3,000 | 156,390 (2) | |||||
| 4,000 | 51.33 | (2) | 1/4/2014 | ||||||||||
| 6,120 | 54.00 | (2) | 1/2/2015 | ||||||||||
| 5,824 | 76.70 | (2) | 1/4/2016 | ||||||||||
| Douglas R. Beaumont | 35,000 | 54.42 | 1/2/2013 | nil | 1,000 | 52,130 | |||||||
| 4,000 | 62.77 | 1/2/2014 | |||||||||||
| 6,120 | 56.92 | 1/2/2015 | |||||||||||
| 5,824 | 76.60 | 1/4/2016 | |||||||||||
| Martine A. Celej | 4,721 | 70.26 | 2/21/2016 | nil | 3,000 | 156,390 | |||||||
| Clifford J. Davis | 1,800 | 33.26 | 11/3/2013 | 143,064 | 3,000 | 156,390 | |||||||
| 4,000 | 62.77 | 1/2/2014 | |||||||||||
| 6,120 | 56.92 | 1/4/2015 | |||||||||||
| 5,824 | 76.60 | 1/4/2016 | |||||||||||
| Robert Gemmell | 5,824 | 76.60 | 1/4/2016 | nil | 3,000 | 156,390 | |||||||
| Bernard Kraft | 4,000 | 62.77 | 1/2/2014 | nil | 1,000 | 52,130 | |||||||
| 6,120 | 56.92 | 1/4/2015 | |||||||||||
| 5,824 | 76.60 | 1/4/2016 | |||||||||||
| Mel Leiderman | 7,500 | 54.42 | 1/2/2013 | nil | 3,000 | 156,390 | |||||||
| 4,000 | 62.77 | 1/2/2014 | |||||||||||
| 6,120 | 56.92 | 1/4/2015 | |||||||||||
| 5,824 | 76.60 | 1/4/2016 | |||||||||||
| James D. Nasso | 53,000 | 54.42 | 1/2/2013 | nil | 4,000 | 208,520 | |||||||
| 4,000 | 62.77 | 1/2/2014 | |||||||||||
| 6,120 | 56.92 | 1/4/2015 | |||||||||||
| 5,824 | 76.60 | 1/4/2016 | |||||||||||
| Sean Riley | 5,824 | 76.60 | 1/1/2016 | nil | 3,000 | 156,390 | |||||||
| John Merfyn Roberts | 7,200 | 33.26 | 11/3/2013 | 143,064 | 3,000 | 156,390 | |||||||
| 4,000 | 62.77 | 1/2/2014 | |||||||||||
| 6,120 | 56.92 | 1/4/2015 | |||||||||||
| 5,824 | 76.60 | 1/4/2016 | |||||||||||
| Howard R. Stockford | 4,000 | 62.77 | 1/2/2014 | nil | 3,000 | 156,390 | |||||||
| 6,120 | 56.92 | 1/4/2015 | |||||||||||
| 5,824 | 76.60 | 1/4/2016 | |||||||||||
| Pertti Voutilainen | 35,000 | 54.42 | 1/2/2013 | nil | 1,000 | 52,130 | |||||||
| 4,000 | 62.77 | 1/2/2014 | |||||||||||
| 6,120 | 56.92 | 1/4/2015 | |||||||||||
| 5,824 | 76.60 | 1/4/2016 | |||||||||||
Notes:
- (1)
- Based
on a closing price of the Company's shares on the TSX of C$52.13 on December 31, 2012.
- (2)
- The value of Dr. Baker's awards is in United States dollars and based on a closing price of the Company's shares on the NYSE of $52.46 on December 31, 2012.
2012 ANNUAL REPORT 141
In 2009, shareholders of the Company approved an amendment to the Employee Share Purchase Plan to prohibit participation by non-executive directors. During the year ended December 31, 2012, the Company issued a total of 1,830 common shares to Mr. Boyd (the only executive director) under its Employee Share Purchase Plan.
The following table sets out the attendance of each of the directors to the Board of Directors meetings and the Board Committee meetings held in 2012.
| Director | Board Meetings Attended |
Committee Meetings Attended |
|||
| Leanne M. Baker | 8 of 8 | 5 of 5 | |||
| Douglas R. Beaumont | 8 of 8 | 10 of 10 | |||
| Sean Boyd | 8 of 8 | N/A | |||
| Martine A. Celej | 8 of 8 | 5 of 5 | |||
| Clifford J. Davis | 8 of 8 | 5 of 5 | |||
| Robert Gemmell | 6 of 8 | 5 of 5 | |||
| Bernard Kraft | 7 of 8 | 9 of 9 | |||
| Mel Leiderman | 8 of 8 | 5 of 5 | |||
| James D. Nasso | 8 of 8 | 6 of 6 | |||
| John Merfyn Roberts | 8 of 8 | 4 of 4 | |||
| Sean Riley | 7 of 8 | 4 of 5 | |||
| Howard R. Stockford | 8 of 8 | 10 of 10 | |||
| Pertti Voutilainen | 8 of 8 | 4 of 4 | |||
Indebtedness of Directors, Executive Officers and Senior Officers
There is no outstanding indebtedness to the Company by any of its officers or directors. The Company's policy is not to make any loans to directors or officers.
Directors' and Officers' Liability Insurance
The Company has purchased, at its expense, directors' and officers' liability insurance policies to provide insurance against possible liabilities incurred by its directors and officers in their capacity as directors and officers of the Company. The premium for these policies for the period from December 31, 2012 to December 31, 2013 is C$1,059,359. The policies provide coverage of up to C$150 million per occurrence to a maximum of C$150 million per annum. There is no deductible for directors and officers and a C$2,500,000 deductible for each claim made by the Company (C$1 million deductible for securities claims). The insurance applies in circumstances where the Company may not indemnify its directors and officers for their acts or omissions.
Board Practices
The Board and management have been following the developments in corporate governance requirements and best practices standards in both Canada and the United States. As these requirements and practices have evolved, the Company has responded in a positive and proactive way by assessing its practices against these requirements and modifying, or targeting for modification, practices to bring them into compliance with these corporate governance requirements and best practices standards. The Company revises, from time to time, the Board Mandate and the charters for the Audit Committee, the Compensation Committee, the Corporate Governance Committee and the Health, Safety, Environment and Sustainable Development Committee (formerly the Health, Safety and Environment Committee) to reflect the new and evolving corporate governance requirements and what it believes to be best practices standards in Canada and the United States.
142 AGNICO-EAGLE MINES LIMITED
The Board believes that effective corporate governance contributes to improved corporate performance and enhanced shareholder value. The Company's governance practices reflect the Board's assessment of the governance structure and process which can best serve to realize these objectives in the Company's particular circumstance. The Company's governance practices are subject to review and evaluation through the Board's Corporate Governance Committee to ensure that, as the Company's business evolves, changes in structure and process necessary to ensure continued good governance are identified and implemented.
The Company is required under the rules of the CSA to disclose its corporate governance practices and provide a description of the Company's system of corporate governance. This Statement of Corporate Governance Practices has been prepared by the Board's Corporate Governance Committee and approved by the Board.
Director Independence
The Board consists of thirteen directors. The Board has made an affirmative determination that twelve of its thirteen current members are "independent" within the meaning of the CSA rules and the standards of the NYSE. With the exception of Mr. Boyd, all directors are independent of management and free from any interest or any business that could materially interfere with their ability to act as a director with a view to the best interests of the Company. In reaching this determination, the Board considered the circumstances and relationships with the Company and its affiliates of each of its directors. In determining that all directors except Mr. Boyd are independent, the Board took into consideration the facts that none of the remaining directors is an officer or employee of the Company or party to any material contract with the Company and that none receives remuneration from the Company other than directors' fees and Option grants for service on the Board. Mr. Boyd is considered related because he is an officer of the Company. All directors, other than Mr. Boyd, also meet the independence standard as set out in SOX.
The Board may meet independently of management at the request of any director or may excuse members of management from all or a portion of any meeting where a potential conflict of interest arises or where otherwise appropriate. The Board also meets without management before or after each Board meeting, including after each Board meeting held to consider interim and annual financial statements. In 2012, the Board met without management at each Board meeting, being eight separate occasions, including the four regularly scheduled quarterly meetings.
To promote the exercise of independent judgment by directors in considering transactions and agreements, any director or officer who has a material interest in the matter being considered may not be present for discussions relating to the matter and any such director may not participate in any vote on the matter.
Chairman
Mr. Nasso is the Chairman of the Board and Mr. Boyd is the Vice-Chairman, President and Chief Executive Officer of the Company. Mr. Nasso is not a member of management. The Board believes that the separation of the offices of Chairman and Chief Executive Officer enhances the ability of the Board to function independently of management and does not foresee that the offices of Chairman and Chief Executive Officer will be held by the same person.
The Board has adopted a position description for the Chairman of the Board. The Chairman's role is to provide leadership to directors in discharging their duties and obligations as set out in the mandate of the Board. The specific responsibilities of the Chairman include providing advice, counsel and mentorship to the Chief Executive Officer, appointing the Chair of each of the Board's committees and promoting the delivery of information to the members of the Board on a timely basis to keep them fully apprised of all matters which are material to them at all times. The Chairman's responsibilities also include scheduling, overseeing and presiding over meetings of the Board and presiding over meetings of the Company's shareholders.
Board Mandate
The Board's mandate is to provide stewardship of the Company, to oversee the management of the Company's business and affairs, to maintain its strength and integrity, to oversee the Company's strategic direction, its organization structure and succession planning of senior management and to perform any other duties required by law. The Board's strategic planning process consists of an annual review of the Company's future business plans and, from time to time (and at least annually), a meeting focused on strategic planning matters. As part of this process, the Board reviews and approves the corporate objectives proposed by the Chief Executive Officer and advises management on the development of a corporate strategy to achieve those objectives. The Board also reviews the principal risks inherent in the Company's business, including environmental, industrial and financial risks, and assesses the systems to manage these risks. The Board also
2012 ANNUAL REPORT 143
monitors the performance of senior management against the business plan through a periodic review process (at least every quarter) and reviews and approves promotion and succession matters.
The Board holds management responsible for the development of long-term strategies for the Company. The role of the Board is to review, question, validate and ultimately approve the strategies and policies proposed by management. The Board relies on management to perform the data gathering, analysis and reporting functions which are critical to the Board for effective corporate governance. In addition, the Vice-Chairman, President and Chief Executive Officer, the Senior Vice-President, Finance and Chief Financial Officer, the Senior Vice-President, Corporate Development, the Senior Vice-President, Exploration and the Senior Vice-President, Technical Services report to the Board at least every quarter on the Company's progress in the preceding quarter and on the strategic, operational and financial issues facing the Company.
Management is authorized to act, without Board approval, on all ordinary course matters relating to the Company's business. Management seeks the Board's prior approval for significant changes in the Company's affairs such as major capital expenditures, financing arrangements and significant acquisitions and divestitures. Board approval is required for any venture outside of the Company's existing businesses and for any change in senior management. Recommendations of committees of the Board require the approval of the full Board before being implemented. In addition, the Board oversees and reviews significant corporate plans and initiatives, including the annual three-year business plan and budget and significant matters of corporate strategy or policy. The Company's authorization policy and risk management policy ensure compliance with good corporate governance practices. Both policies formalize controls over the management or other employees of the Company by stipulating internal approval processes for transactions, investments, commitments and expenditures and, in the case of the risk management policy, establishing objectives and guidelines for metal price hedging, foreign exchange and short-term investment risk management and insurance. The Board, directly and through its Audit Committee, also assesses the integrity of the Company's internal control and management information systems.
The Board oversees the Company's approach to communications with shareholders and other stakeholders and approves specific communications initiatives from time to time. The Company conducts an active investor relations program. The program involves responding to shareholder inquiries, briefing analysts and fund managers with respect to reported financial results and other announcements by the Company and meeting with individual investors and other stakeholders. Senior management reports regularly to the Board on these matters. The Board reviews and approves the Company's major communications with shareholders and the public, including quarterly and annual financial results, the annual report and the management information circular. The Board has approved a Disclosure Policy which establishes standards and procedures relating to contacts with analysts and investors, news releases, conference calls, disclosure of material information, trading restrictions and blackout periods.
The Board's mandate is posted on the Company's website at www.agnico-eagle.com.
Position Descriptions
Chief Executive Officer
The Board has adopted a position description for the Chief Executive Officer, who has full responsibility for the day-to-day operation of the Company's business in accordance with the Company's strategic plan and current year operating and capital expenditure budgets as approved by the Board. In discharging his responsibility for the day-to-day operation of the Company's business, subject to the oversight by the Board, the Chief Executive Officer's specific responsibilities include:
- •
- providing
leadership and direction to the other members of the Company's senior management team;
- •
- fostering
a corporate culture that promotes ethical practices and encourages individual integrity;
- •
- maintaining
a positive and ethical work climate that is conducive to attracting, retaining and motivating top-quality employees at all levels;
- •
- working
with the Chairman in determining the matters and materials that should be presented to the Board;
- •
- together
with the Chairman, developing and recommending to the Board a long-term strategy and vision for the Company that leads to enhancement of shareholder
value;
- •
- developing
and recommending to the Board annual business plans and budgets that support the Company's long-term strategy;
- •
- ensuring that the day-to-day business affairs of the Company are appropriately managed;
144 AGNICO-EAGLE MINES LIMITED
- •
- consistently
striving to achieve the Company's financial and operating goals and objectives;
- •
- designing
or supervising the design and implementation of effective disclosure and internal controls;
- •
- maintaining
responsibility for the integrity of the financial reporting process;
- •
- seeking
to secure for the Company a satisfactory competitive position within its industry;
- •
- ensuring
that the Company has an effective management team below the level of the Chief Executive Officer and has an active plan for management development
and succession;
- •
- ensuring,
in cooperation with the Chairman and the Board, that there is an effective succession plan in place for the position of Chief Executive Officer; and
- •
- serving as the primary spokesperson for the Company.
The Chief Executive Officer is to consult with the Chairman on matters of strategic significance to the Company and alert the Chairman on a timely basis of any material changes or events that may impact upon the risk profile, financial affairs or performance of the Company.
Chairs of Board Committees
The Board has adopted written position descriptions for each of the Chairs of the Board's committees, which include the Audit Committee, the Corporate Governance Committee, the Compensation Committee and the Health, Safety, Environment and Sustainable Development Committee. The role of each of the Chairs is to ensure the effective functioning of his or her committee and provide leadership to its members in discharging the mandate as set out in the committee's charter. The responsibilities of each Chair include, among others:
- •
- establishing
procedures to govern his or her committee's work and ensure the full discharge of its duties;
- •
- chairing
every meeting of his or her committee and encouraging free and open discussion at such meetings;
- •
- reporting
to the Board on behalf of his or her committee; and
- •
- attending every meeting of shareholders and responding to such questions from shareholders as may be put to the Chair of his or her committee.
Each of the Chairs is also responsible for carrying out other duties as requested by the Board, depending on need and circumstances.
Orientation and Continuing Education
The Corporate Governance Committee is responsible for overseeing the development and implementation of orientation programs for new directors and continuing education for all directors.
The Company maintains a collection of director orientation materials, which include the Board Mandate, the charters of the Board's committees, a memorandum on the duties of a director of a public company and a glossary of mining and accounting terms. A copy of such materials is given to each director and updated annually.
The Company holds periodic educational sessions with its directors and legal counsel to review and assess the Board's corporate governance policies. This allows new directors to become familiar with the corporate governance policies of the Company as they relate to its business. In addition, the Company provides extensive reports on all operations to the directors at each quarterly Board meeting and conducts yearly site tours for the directors at a different mine site each year.
The Corporate Governance Committee conducts an annual assessment that addresses the performance of the Board, the Board's committees and the individual directors. These assessments help identify opportunities for continuing Board and director development. In addition, it is open to any director to take a continuing education course related to the skill and knowledge necessary to meet his or her obligations as a director at the expense of the Company.
Ethical Business Conduct
The Board has adopted a Code of Business Conduct and Ethics, which provides a framework for directors, officers and employees on the conduct and ethical decision making integral to their work. In addition, the Board has adopted a Code of Business Conduct and Ethics for Consultants and Contractors. The Audit Committee is responsible for monitoring
2012 ANNUAL REPORT 145
compliance with these codes of ethics and any waivers or amendments thereto can only be made by the Board or a Board committee. These codes are available on www.sedar.com.
The Board has also adopted a Confidential Anonymous Complaint Reporting Policy, which provides procedures for officers and employees who believe that a violation of the Code of Business Conduct and Ethics has occurred to report this violation on a confidential and anonymous basis. Complaints can be made internally to the General Counsel, Senior Vice-President, Legal and Corporate Secretary or the Senior Vice-President, Finance and Chief Financial Officer. Complaints can also be made anonymously by telephone, e-mail or postal letter through a hotline provided by an independent third party service provider. The General Counsel, Senior Vice-President, Legal and Corporate Secretary periodically prepares a written report to the Audit Committee regarding the complaints, if any, received through these procedures.
The Board believes that providing a procedure for employees and officers to raise concerns about ethical conduct on an anonymous and confidential basis fosters a culture of ethical conduct within the Company.
Nomination of Directors
The Corporate Governance Committee, which is comprised entirely of independent directors, is responsible for participating in the recruitment and recommendation of new nominees for appointment or election to the Board. When considering a potential candidate, the Corporate Governance Committee considers the qualities and skills that the Board, as a whole, should have and assesses the competencies and skills of the current members of the Board. Based on the talent already represented on the Board, the Corporate Governance Committee then identifies the specific skills, personal qualities or experiences that a candidate should possess in light of the opportunities and risks facing the Company. The Corporate Governance Committee may maintain a list of potential director candidates for its future consideration and may engage outside advisors to assist in identifying potential candidates. Potential candidates are screened to ensure that they possess the requisite qualities, including integrity, business judgment and experience, business or professional expertise, independence from management, international experience, financial literacy, excellent communications skills and the ability to work well in a team situation. The Corporate Governance Committee also considers the existing commitments of a potential candidate to ensure that such candidate will be able to fulfill his or her duties as a Board member.
Compensation
Remuneration is paid to the Company's directors based on several factors, including time commitments, risk, workload and responsibility demanded by their positions. The Compensation Committee periodically reviews and fixes the amount and composition of the compensation of directors. For a summary of remuneration paid to directors, please see "Compensation of Directors and Other Information" above and the description of the Compensation Committee below.
Board Committees
The Board has four Committees: the Audit Committee, the Compensation Committee, the Corporate Governance Committee and the Health, Safety, Environment and Sustainable Development Committee.
Audit Committee
The Audit Committee is composed entirely of directors who are unrelated to and independent from the Company (currently, Dr. Baker (Chair), Mr. Kraft, Mr. Leiderman and Dr. Riley), each of whom is financially literate, as the term is used in the CSA's Multilateral Instrument 52-110 – Audit Committees. In addition, Mr. Leiderman and Mr. Kraft are Chartered Accountants; Mr. Leiderman is currently in private practice and Mr. Kraft while retired, remains active in the profession and the Board has determined that both of them qualify as audit committee financial experts, as the term is defined in the rules of the SEC. The education and experience of each member of the Audit Committee is set out under "Directors and Senior Management" above. Fees paid to the Company's auditors, Ernst & Young LLP, are set out under "Item 16C Principal Accountant Fees and Services". The Audit Committee met five times in 2012.
The Audit Committee has two primary objectives. The first is to advise the Board of Directors in its oversight responsibilities regarding:
- •
- the
quality and integrity of the Company's financial reports and information;
- •
- the Company's compliance with legal and regulatory requirements;
146 AGNICO-EAGLE MINES LIMITED
- •
- the
effectiveness of the Company's internal controls for finance, accounting, internal audit, ethics and legal and regulatory compliance;
- •
- the
performance of the Company's auditing, accounting and financial reporting functions;
- •
- the
fairness of related party agreements and arrangements between the Company and related parties; and
- •
- the independent auditors' performance, qualifications and independence.
The second primary objective of the Audit Committee is to prepare the reports required to be included in management information circulars of the Company in accordance with applicable laws or the rules of applicable securities regulatory authorities.
The Board has adopted an Audit Committee charter, which provides that each member of the Audit Committee must be unrelated to and independent from the Company as determined by the Board in accordance with the applicable requirements of the laws governing the Company, the stock exchanges on which the Company's securities are listed and applicable securities regulatory authorities. In addition, each member must be financially literate and at least one member of the Audit Committee must be an audit committee financial expert, as the term is defined in the rules of the SEC. The Audit Committee must pre-approve all audit and permitted non-audit services to be provided by the external auditors to the Company.
The Audit Committee is responsible for reviewing all financial statements prior to approval by the Board, all other disclosure containing financial information and all management reports which accompany any financial statements. The Audit Committee is also responsible for all internal and external audit plans, any recommendation affecting the Company's internal controls, the results of internal and external audits and any changes in accounting practices or policies. The Audit Committee reviews any accruals, provisions, estimates or related party transactions that have a significant impact on the Company's financial statements and any litigation, claim or other contingency that could have a material effect upon the Company's financial statements. In addition, the Audit Committee is responsible for assessing management's programs and policies relating to the adequacy and effectiveness of internal controls over the Company's accounting and financial systems. The Audit Committee reviews and discusses with the Chief Executive Officer and Chief Financial Officer the procedures undertaken in connection with their certifications for annual filings in accordance with the requirements of applicable securities regulatory authorities. The Audit Committee is also responsible for recommending to the Board the external auditor to be nominated for shareholder approval who will be responsible for preparing audited financial statements and completing other audit, review or attest services. The Audit Committee also recommends to the Board the compensation to be paid to the external auditor and directly oversees its work. The Company's external auditor reports directly to the Audit Committee. The Audit Committee reports directly to the Board of Directors.
The Audit Committee is entitled to retain (at the Company's expense) and determine the compensation of any independent counsel, accountants or other advisors to assist the Audit Committee in its oversight responsibilities.
Compensation Committee
The Compensation Committee is composed entirely of directors who are unrelated to and independent from the Company (currently, Mr. Gemmell (Chair), Mr. Beaumont, Ms Celej and Mr. Stockford). The Compensation Committee met five times in 2012.
The Compensation Committee is responsible for, among other things:
- •
- recommending
to the Board policies relating to compensation of the Company's executive officers;
- •
- recommending
to the Board the amount and composition of annual compensation to be paid to the Company's executive officers;
- •
- matters
relating to pension, option and other incentive plans for the benefit of executive officers;
- •
- administering
the Stock Option Plan;
- •
- reviewing
and fixing the amount and composition of annual compensation to be paid to members of the Board and committees; and
- •
- reviewing and assessing the design and competitiveness of the Company's compensation and benefits programs generally.
2012 ANNUAL REPORT 147
The Compensation Committee reports directly to the Board. The charter of the Compensation Committee provides that each member of the Compensation Committee must be unrelated and independent.
The Board considers Messrs. Gemmell and Beaumont particularly well-qualified to serve on the Compensation Committee given the expertise they have accrued during their business careers: Mr. Gemmell as a senior manager of divisions of a major financial services company (where part of his duties included assessing personnel and setting compensation rates) and Mr. Beaumont as a founder and former senior executive of an international engineering services company (where part of his duties included oversight of the establishment of appropriate compensation structures for the organization).
Corporate Governance Committee
The Corporate Governance Committee is composed entirely of directors who are unrelated to and independent from the Company (currently, Mr. Roberts (Chair), Mr. Kraft, Mr. Nasso and Mr. Voutilainen). The Corporate Governance Committee met four times in 2012.
The Corporate Governance Committee is responsible for, among other things:
- •
- evaluating
the Company's governance practices;
- •
- developing
its response to the Company's Statement of Corporate Governance and recommending changes to the Company's governance structures or processes as it may from time
to time consider necessary or desirable;
- •
- reviewing
on an annual basis the charters of the Board and of each committee of the Board and recommending any changes;
- •
- assessing
annually the effectiveness of the Board as a whole and recommending any changes;
- •
- reviewing
on a periodic basis the composition of the Board to ensure that there remain an appropriate number of independent directors; and
- •
- participating in the recruitment and recommendation of new nominees for appointment or election to the Board.
The Corporate Governance Committee also provides a forum for a discussion of matters not readily discussed in a full Board meeting. The charter of the Corporate Governance Committee provides that each member of the Corporate Governance Committee must be independent, as such term is defined in the CSA rules.
Health, Safety, Environment and Sustainable Development Committee
The Health, Safety, Environment and Sustainable Development Committee (formerly the Health, Safety and Environment Committee) is comprised of four directors who are unrelated to and independent from the Company (currently Mr. Davis (Chair), Mr. Beaumont, Mr. Nasso and Mr. Stockford). The Health, Safety, Environment and Sustainable Development Committee met five times in 2012.
The Health, Safety, Environment and Sustainable Development Committee is responsible for, among other things:
- •
- monitoring
and reviewing sustainable development, health, safety and environmental policies, principles, practices and processes;
- •
- overseeing
sustainable development, health, safety and environmental performance; and
- •
- monitoring and reviewing current and future regulatory issues relating to sustainable development, health, safety and the environment.
The Health, Safety, Environment and Sustainable Development Committee reports directly to the Board and provides a forum to review sustainable development, health, safety and environmental issues in a more thorough and detailed manner than could be adopted by the full Board. The Health, Safety, Environment and Sustainable Development Committee charter provides that a majority of the members of the Committee be unrelated and independent.
Assessment of Directors
The Company's Corporate Governance Committee (see description of the Corporate Governance Committee above) is responsible for the assessment of the effectiveness of the Board as a whole and participates in the recruitment and recommendation of new nominees for appointment or election to the Board of Directors.
148 AGNICO-EAGLE MINES LIMITED
Each of the directors participates in a detailed annual assessment of the Board and Board committees. The assessment addresses performance of the Board, each Board committee and individual directors, including through a peer to peer evaluation. A broad range of topics is covered such as Board and Board committee structure and composition, succession planning, risk management, director competencies and Board processes and effectiveness. The assessment helps identify opportunities for continuing Board and director development and also forms the basis of continuing Board participation.
As of December 31, 2012, the Company had 5,723 employees comprised of 4,045 permanent employees, 1,448 contractors, 155 temporary employees and 75 students. Of the permanent employees, 819 were employed at the LaRonde mine, 213 at the Lapa mine, 163 at the Goldex mine project, 413 at the Kittila mine, 1,220 at the Pinos Altos mine, 108 at the La India mine project, 678 at the Meadowbank mine (with 672 at Baker Lake and Meadowbank and 6 in Quebec), 21 at the Meliadine project, 25 in the exploration group in Canada and the U.S., 221 at the regional technical office in Abitibi and 116 at the corporate head office in Toronto. The number of permanent employees of the Company at the end of 2012, 2011 and 2010 was 4,045, 3,600 and 3,243, respectively.
In order to align the interests of the Company and those of its officers and employees, the Company encourages ownership of common shares and facilitates this through its RSU Plan, Stock Option Plan and Employee Share Purchase Plan. The Company has also adopted executive share ownership policies: the Chief Executive Officer is required to own the equivalent of at least three years of his base salary in common shares or RSUs of the Company. Mr. Boyd, the current Chief Executive Officer of the Company, meets this share ownership value requirement. A new Chief Executive Officer would have three years after being appointed to that position to comply with this provision. Senior Vice-Presidents of the Company are required to have or own 30,000 common shares or RSUs of the Company and Vice-Presidents of the Company are required to have or own 15,000 common shares or RSUs of the Company. Senior Vice-Presidents and Vice-Presidents of the Company have the later of five years from the date of implementation of this policy (that is, October 24, 2017) or five years from the date of appointment, to meet this share ownership requirement.
As at March 11, 2013, the Named Executive Officers (other than Mr. Al-Joundi, who resigned as Senior Vice-President, Finance and Chief Financial Officer on July 9, 2012) and directors as a group (17 persons) beneficially owned or controlled (excluding Options to purchase 2,957,615 common shares) an aggregate of 454,897 common shares or approximately 0.26% of the 172,501,169 issued and outstanding common shares. See also "– Compensation of Executive Officers".
Security Ownership of Directors and Executive Officers
The following table sets out certain information concerning the direct and beneficial ownership by each director and Named Executive Officer of the Company (other than Mr. Al-Joundi, who resigned as Senior Vice-President, Finance and Chief Financial Officer on July 9, 2012) of common shares of the Company and Options to purchase common shares of the Company. Unless otherwise noted, exercise prices are in Canadian dollars.
| Share Ownership(1) |
Total Common Shares under Option(2) |
Common Shares under Option |
Exercise Price (C$, except as noted) |
Expiry Date | |||||||
| Leanne M. Baker Director |
11,500 | 15,944 | 5,824 6,120 4,000 |
US$76.70 US$54.00 US$51.33 |
1/4/2016 1/4/2015 1/2/2014 |
||||||
| Douglas R. Beaumont Director |
19,960 | 15,944 | 5,824 6,120 4,000 |
76.60 56.92 62.77 |
1/4/2016 1/4/2015 1/2/2014 |
||||||
2012 ANNUAL REPORT 149
| Sean Boyd Director, Vice Chairman, President and Chief Executive Officer |
165,802 | 952,500 | 162,500 240,000 300,000 250,000 |
37.05 76.60 56.92 62.77 |
1/3/2017 1/4/2016 1/4/2015 1/2/2014 |
||||||
| Martine A. Celej Director |
8,000 | 4,721 | 4,721 | 70.26 | 2/21/2016 | ||||||
| Clifford J. Davis Director |
12,000 | 17,744 | 5,824 6,120 4,000 1,800 |
76.60 56.92 62.77 33.26 |
1/4/2016 1/4/2015 1/2/2014 11/3/2013 |
||||||
| Robert J. Gemmell Director |
16,000 | 5,824 | 5,824 | 76.60 | 1/4/2016 | ||||||
| Bernard Kraft Director |
14,657 | 15,944 | 5,824 6,120 4,000 |
76.60 56.92 62.77 |
1/4/2016 1/4/2015 1/2/2014 |
||||||
| Mel Leiderman Director |
12,000 | 15,944 | 5,824 6,120 4,000 |
76.60 56.92 62.77 |
1/4/2016 1/4/2015 1/2/2014 |
||||||
| James D. Nasso Director and Chairman of the Board |
23,289 | 15,944 | 5,824 6,120 4,000 |
76.60 56.92 62.77 |
1/4/2016 1/4/2015 1/2/2014 |
||||||
| Sean Riley Director |
8,000 | 5,824 | 5,824 | 76.60 | 1/4/2016 | ||||||
| J. Merfyn Roberts Director |
12,000 | 23,144 | 5,824 6,120 4,000 7,200 |
76.60 56.92 62.77 33.26 |
1/4/2016 1/4/2015 1/2/2014 11/3/2013 |
||||||
| Howard R. Stockford Director |
11,068 | 15,944 | 5,824 6,120 4,000 |
76.60 56.92 62.77 |
1/4/2016 1/4/2015 1/2/2014 |
||||||
| Pertti Voutilainen Director |
16,800 | 15,944 | 5,824 6,120 4,000 |
76.60 56.92 62.77 |
1/4/2016 1/4/2015 1/2/2014 |
||||||
| David Smith(3) Senior Vice-President, Finance and Chief Financial Officer |
32,975 | 365,000 | 100,000 75,000 60,000 65,000 65,000 |
52.13 37.05 76.60 56.92 62.77 |
1/3/2018 1/3/2017 1/4/2016 1/4/2015 1/2/2014 |
||||||
150 AGNICO-EAGLE MINES LIMITED
| Alain Blackburn Senior Vice-President, Exploration |
24,449 | 410,000 | 75,000 75,000 60,000 100,000 100,000 |
52.13 37.05 76.60 56.92 62.77 |
1/3/2018 1/3/2017 1/4/2016 1/4/2015 1/2/2014 |
||||||
| Donald G. Allan Senior Vice-President, Corporate Development |
32,911 | 341,250 | 56,250 60,000 75,000 75,000 |
37.05 76.60 56.92 62.77 |
1/3/2017 1/2/2016 1/4/2015 1/2/2014 |
||||||
| R. Gregory Laing General Counsel, Senior Vice-President, Legal and Corporate Secretary |
33,486 | 360,000 | 75,000 75,000 60,000 75,000 75,000 |
52.13 37.05 76.60 56.92 62.77 |
1/3/2018 1/3/2017 1/4/2016 1/4/2015 1/2/2014 |
||||||
Notes:
- (1)
- As
at March 11, 2013. In each case, shareholdings (which includes common shares and RSUs) constitute less than one percent of the issued and outstanding common shares of the
Company. The total number of common shares and RSUs held by directors and named executive officers constitutes approximately 0.26% of the issued and outstanding common shares of the Company as at
March 11, 2013.
- (2)
- As
at March 11, 2013.
- (3)
- Mr. Smith became Senior Vice-President, Finance and Chief Financial Officer on October 24, 2012; prior to that, he was the Senior Vice-President, Investor Relations and Strategic Planning of the Company.
ITEM 7 MAJOR SHAREHOLDERS AND RELATED PARTY TRANSACTIONS
To the knowledge of the directors and senior officers of the Company, as at March 11, 2013, no person or corporation beneficially owns or exercises control or direction over common shares of the Company carrying more than 5% of the voting rights attached to all common shares of the Company other than as set out below:
| Major Shareholder | Number of common shares |
Percentage of outstanding common shares |
|||
| BlackRock, Inc.(1) | 20,005,396 | 11.63% | |||
| First Eagle Investment Management, LLC(2) | 10,609,234 | 6.17% | |||
| FMR LLC(3) | 10,934,362 | 6.36% | |||
| Van Eck Associates Corporation(4) | 11,253,461 | 6.59% | |||
Notes:
- (1)
- According
to reports filed with applicable securities regulators dated January 6, 2012, May 7, 2012, October 9, 2012 and January 9, 2013, the percentage
ownership of common shares of the Company held by BlackRock, Inc. has varied from 10.31% to 9.93% to 11.85% to 11.63%, respectively.
- (2)
- According
to a report filed with applicable securities regulators dated February 11, 2013.
- (3)
- According
to reports filed with applicable securities regulators dated February 13, 2012 and February 13, 2013, the percentage ownership of common shares of the Company
held by FMR LLC has varied from 4.18% to 6.36%, respectively.
- (4)
- According to a report filed with applicable securities regulators dated February 14, 2012.
2012 ANNUAL REPORT 151
None of the Company's major shareholders have different voting rights than other holders of the Company's common shares.
As at March 11, 2013, there were 3,668 holders of record of Agnico-Eagle's 172,501,169 outstanding common shares, of which 672 holders of record were in Canada and held 94,234,198 common shares or approximately 54.63% of the outstanding common shares.
The Company is not aware of any arrangements the operation of which may at a subsequent date result in a change in control of the Company. To the knowledge of the Company, it is not directly or indirectly owned or controlled by another corporation, by any government or by any natural or legal person severally or jointly.
The Company has not entered into any material related party transactions since January 1, 2012.
The consolidated financial statements furnished pursuant to Item 18 are presented in accordance with US GAAP.
During the period under review, inflation has not had a significant impact on the Company's operations.
The Company is not aware of any legal or arbitration proceedings which may have, or have had in the recent past, a significant effect on the Company's financial position or profitability.
The Company's current policy is to pay quarterly dividends on its common shares and, on December 12, 2012, the Company announced that it had declared a quarterly dividend of $0.22 per common share, payable on March 15, 2013. In 2012, the dividend paid was $0.80 per common share (quarterly payments of $0.20 per common share). In 2011, the dividend paid was $0.64 per common share (quarterly payments of $0.16 per common share). In each of 2010, 2009 and 2008, the dividend paid was $0.18 per common share. In 2007, the dividend paid was $0.12 per common share. From 2003 to 2006, the dividend paid was $0.03 per common share. Although the Company expects to continue paying a cash dividend, future dividends will be at the discretion of the Board and will be subject to factors such as the Company's earnings, financial condition and capital requirements. The Company's bank credit facility contains a covenant that restricts the Company's ability to declare or pay dividends if certain events of default under the bank credit facility have occurred and are continuing.
152 AGNICO-EAGLE MINES LIMITED
Common Shares
The Company's common shares are listed and traded in Canada on the TSX and in the United States on the NYSE.
The following table sets forth the high and low sale prices and the average daily trading volume for Agnico-Eagle's common shares on the TSX and the NYSE for each of the fiscal years in the five-year period ended December 31, 2012 and for each quarter during the fiscal years ended December 31, 2011 and 2012.
| TSX | NYSE | ||||||||||||
| High (C$) | Low (C$) | Average Daily Volume |
High ($) | Low ($) | Average Daily Volume |
||||||||
| 2008 | 82.80 | 26.60 | 1,184,654 | 83.45 | 20.87 | 3,842,836 | |||||||
| 2009 | 77.32 | 50.80 | 979,369 | 74.00 | 42.65 | 4,172,474 | |||||||
| 2010 | 88.52 | 53.16 | 750,312 | 88.20 | 49.64 | 2,508,059 | |||||||
| 2011 | 75.39 | 35.35 | 856,906 | 77.00 | 34.50 | 2,285,842 | |||||||
| 2012 | 56.99 | 31.50 | 831,029 | 57.35 | 31.42 | 2,027,502 | |||||||
| 2011 | |||||||||||||
| First Quarter | 75.39 | 62.93 | 781,613 | 77.00 | 63.53 | 2,534,857 | |||||||
| Second Quarter | 66.17 | 58.82 | 733,270 | 70.00 | 59.78 | 2,059,362 | |||||||
| Third Quarter | 72.51 | 53.05 | 952,868 | 73.09 | 54.19 | 2,297,630 | |||||||
| Fourth Quarter | 64.14 | 35.35 | 960,318 | 61.17 | 34.50 | 2,255,181 | |||||||
| 2012 | |||||||||||||
| First Quarter | 39.68 | 31.50 | 883,359 | 39.64 | 31.42 | 2,238,021 | |||||||
| Second Quarter | 43.98 | 31.91 | 1,003,353 | 43.22 | 31.92 | 2,474,042 | |||||||
| Third Quarter | 51.80 | 36.38 | 813,838 | 53.12 | 35.77 | 1,920,788 | |||||||
| Fourth Quarter | 56.99 | 49.25 | 623,292 | 57.35 | 49.81 | 1,471,676 | |||||||
2012 ANNUAL REPORT 153
The following table sets forth the high and low sale prices and the average daily trading volume for the Company's common shares on the TSX and the NYSE since January 1, 2012.
| TSX | NYSE | ||||||||||||
| High (C$) | Low (C$) | Average Daily Volume |
High ($) | Low ($) | Average Daily Volume |
||||||||
| 2012 | |||||||||||||
| January | 39.68 | 34.51 | 712,447 | 39.64 | 34.03 | 1,810,332 | |||||||
| February | 38.03 | 31.50 | 1,159,669 | 38.14 | 31.42 | 2,673,438 | |||||||
| March | 36.64 | 32.22 | 795,312 | 37.24 | 32.30 | 2,230,996 | |||||||
| April | 39.66 | 31.91 | 919,017 | 40.18 | 31.92 | 2,291,627 | |||||||
| May | 41.50 | 34.07 | 964,473 | 40.37 | 33.74 | 2,693,235 | |||||||
| June | 43.98 | 39.46 | 1,124,404 | 43.22 | 38.10 | 2,418,142 | |||||||
| July | 44.88 | 36.38 | 856,104 | 44.70 | 35.77 | 1,956,779 | |||||||
| August | 47.75 | 42.55 | 635,613 | 48.44 | 42.45 | 1,757,900 | |||||||
| September | 51.80 | 46.15 | 973,488 | 53.12 | 46.71 | 2,078,188 | |||||||
| October | 56.98 | 49.39 | 605,285 | 56.99 | 50.43 | 1,362,656 | |||||||
| November | 56.99 | 50.70 | 566,203 | 57.35 | 50.45 | 1,552,130 | |||||||
| December | 56.18 | 49.25 | 710,244 | 56.50 | 49.81 | 1,501,669 | |||||||
| 2013 | |||||||||||||
| January | 52.97 | 45.63 | 582,200 | 53.78 | 45.53 | 1,369,400 | |||||||
| February | 46.90 | 39.20 | 554,355 | 46.99 | 38.52 | 1,297,050 | |||||||
| March (to March 11) | 42.24 | 38.55 | 851,594 | 40.95 | 37.55 | 1,739,761 | |||||||
On March 11, 2013 the closing price of the common shares was C$40.00 on the TSX and $38.97 on the NYSE. The registrar and transfer agent for the common shares is Computershare Trust Company of Canada, Toronto, Ontario.
154 AGNICO-EAGLE MINES LIMITED
Warrants
The following table sets forth the high and low sale prices and the average daily trading volume for Agnico-Eagle's common share purchase warrants (the "Warrants") on the TSX for each of the fiscal years in the period beginning on April 30, 2009 (the date the Warrants were listed for trading on the TSX) and ended December 31, 2012 and for each quarter during the fiscal years ended December 31, 2011 and 2012.
| TSX | |||||||
| High ($) | Low ($) | Average Daily Volume |
|||||
| 2009 | 35.01 | 16.50 | 8,482 | ||||
| 2010 | 43.88 | 18.03 | 4,761 | ||||
| 2011 | 31.48 | 4.85 | 9,465 | ||||
| 2012 | 13.35 | 3.08 | 9,196 | ||||
| 2011 | |||||||
| First Quarter | 31.48 | 21.00 | 11,094 | ||||
| Second Quarter | 25.82 | 19.25 | 11,815 | ||||
| Third Quarter | 28.98 | 15.00 | 7,904 | ||||
| Fourth Quarter | 20.18 | 4.85 | 7,150 | ||||
| 2012 | |||||||
| First Quarter | 7.50 | 3.99 | 3,553 | ||||
| Second Quarter | 6.53 | 3.08 | 14,065 | ||||
| Third Quarter | 11.20 | 3.50 | 11,085 | ||||
| Fourth Quarter | 13.35 | 8.70 | 7,969 | ||||
2012 ANNUAL REPORT 155
The following table sets forth the high and low sale prices and average daily trading volume for the Warrants on the TSX since January 1, 2012.
| TSX | |||||||
| High ($) | Low ($) | Average Daily Volume |
|||||
| 2012 | |||||||
| January | 7.50 | 5.30 | 3,194 | ||||
| February | 6.60 | 4.90 | 5,750 | ||||
| March | 5.75 | 3.99 | 1,714 | ||||
| April | 5.95 | 3.08 | 19,089 | ||||
| May | 6.00 | 3.30 | 11,893 | ||||
| June | 6.53 | 4.50 | 12,035 | ||||
| July | 6.66 | 3.50 | 13,468 | ||||
| August | 8.77 | 6.00 | 6,970 | ||||
| September | 11.20 | 8.08 | 12,998 | ||||
| October | 13.00 | 9.50 | 5,482 | ||||
| November | 13.35 | 9.35 | 8,837 | ||||
| December | 12.87 | 8.70 | 10,114 | ||||
| 2013 | |||||||
| January | 8.00 | 7.63 | 6,489 | ||||
| February | 5.60 | 2.35 | 11,248 | ||||
| March (to March 11) | 2.90 | 2.15 | 4,854 | ||||
On March 11, 2013, the closing price of the Warrants was $2.45 on the TSX. The registrar and transfer agent for the Warrants is Computershare Trust Company of Canada, Toronto, Ontario.
ITEM 10 ADDITIONAL INFORMATION
Memorandum and Articles of Amalgamation
Articles of Amalgamation
The Company's articles of amalgamation do not place any restrictions on the Company's objects and purposes. For more information, see the articles of amalgamation of the Company filed as Exhibit 1.01 to this Form 20-F.
Certain Powers of Directors
The Business Corporations Act (Ontario) (the "OBCA") requires that every director who is a party to, or who is a director or officer of, or has a material interest in, any person who is a party to, a material contract or transaction or a proposed material contract or transaction with the Company, must disclose in writing to the Company or request to have entered in the minutes of the meetings of directors the nature and extent of his or her interest, and must refrain from attending any part of a meeting of directors during which the contract or transaction is discussed and from voting on any resolution to approve the contract or transaction unless the contract or transaction is: (a) one relating primarily to his or her remuneration as a director of the corporation or an affiliate; (b) one for indemnity of or insurance for directors as contemplated under the OBCA; or (c) one with an affiliate. However, a director who is prohibited by the OBCA from voting on a material contract or proposed material contract may be counted in determining whether a quorum is present for the
156 AGNICO-EAGLE MINES LIMITED
purpose of the resolution, if the director disclosed his or her interest in accordance with the OBCA and the contract or transaction was reasonable and fair to the corporation at the time it was approved.
The Company's by-laws provide that the Board will from time to time determine the remuneration to be paid to the directors, which may be in addition to the salary paid to any officer or employee of the Company who is also a director. The directors may also, by resolution, award special remuneration to any director for undertaking any special services on the Company's behalf, other than the normal work ordinarily required of a director of the Company. The by-laws provide that confirmation of any such resolution by the Company's shareholders is not required.
The Company's by-laws also provide that the directors may: (a) borrow money upon the credit of the Company; (b) issue, reissue, sell or pledge bonds, debentures, notes or other evidences of indebtedness or guarantee of the Company, whether secured or unsecured; (c) to the extent permitted by the OBCA, give directly or indirectly financial assistance to any person by means of a loan, a guarantee on behalf of the Company to secure performance of any present or future indebtedness, liability or other obligation of any person, or otherwise; and (d) mortgage, hypothecate, pledge or otherwise create a security interest in all or any currently owned or subsequently acquired real or personal, movable or immovable, tangible or intangible property of the Company to secure any such bonds, debentures, notes or other evidences of indebtedness or guarantee or any other present or future indebtedness, liability or other obligation of the Company.
The directors may, by resolution, amend or repeal any by-laws that regulate the business or affairs of the Company. The OBCA requires the directors to submit any such amendment or repeal to the Company's shareholders at the next meeting of shareholders, and the shareholders may confirm, reject or amend the amendment or repeal.
Retirement of Directors
The Board does not have a mandatory retirement policy for directors based solely on age. Due in part to the Board's practice of conducting annual Board, Committee and individual director evaluations, the Board approved and adopted a resignation policy primarily based on directors' performance, commitment, skills and experience. As set out in greater detail under "Item 6 Directors, Senior Management and Employees – Board Practices – Assessment of Directors", each director's performance is evaluated annually.
Directors' Share Ownership
To more closely align the interests of directors with those of shareholders, directors (other than Mr. Boyd) are required to own a minimum of 10,000 common shares of the Company and/or RSUs. Directors have a period of the later of: (i) two years from the date of adoption of this policy (that is, August 24, 2013) or (ii) five years from the date of joining the Board, to achieve this ownership level through open market purchases of common shares, grants of RSUs or the exercise of Options held.
Meetings of Shareholders
The OBCA requires the Company to call an annual shareholders' meeting not later than 15 months after holding the last preceding annual meeting and permits the Company to call a special shareholders' meeting at any time. In addition, in accordance with the OBCA, the holders of not less than 5% of the Company's shares carrying the right to vote at a meeting sought to be held may requisition the directors to call a special shareholders' meeting for the purposes stated in the requisition. The Company is required to mail a notice of meeting and management information circular to registered shareholders not less than 21 days and not more than 50 days prior to the date of any annual or special shareholders' meeting. These materials are also filed with Canadian securities regulatory authorities and furnished to the SEC. The Company's by-laws provide that a quorum of two shareholders in person or represented by proxy holding or representing by proxy at least 25% of the Company's issued shares carrying the right to vote at the meeting is required to transact business at a shareholders' meeting. Shareholders, and their duly appointed proxies and corporate representatives, as well as the Company's auditors, are entitled to be admitted to the Company's annual and special shareholders' meetings.
Authorized Capital
The Company's authorized capital consists of an unlimited number of shares of one class designated as common shares. All outstanding common shares of the Company are fully paid and non-assessable. The holders of the common shares are entitled to one vote per share at meetings of shareholders and to receive dividends if, as and when declared by the directors of the Company. In the event of voluntary or involuntary liquidation, dissolution or winding-up of the Company, after payment of all outstanding debts, the remaining assets of the Company available for distribution would be distributed rateably to the holders of the common shares. Holders of the common shares of the Company have no pre-emptive,
2012 ANNUAL REPORT 157
redemption, exchange or conversion rights. The Company may not create any class or series of shares or make any modification to the provisions attaching to the Company's common shares without the affirmative vote of two-thirds of the votes cast by the holders of the common shares.
Majority Voting Policy
As part of its ongoing review of corporate governance practices, on February 20, 2008 the Board of Directors adopted a policy providing that in an uncontested election of directors, any nominee who receives a greater number of votes "withheld" than votes "for" will tender his or her resignation to the Chairman of the Board of Directors promptly following the shareholders' meeting. The Corporate Governance Committee will consider the offer of resignation and will make a recommendation to the Board of Directors on whether to accept it. In considering whether or not to accept the resignation, the Corporate Governance Committee will consider all factors deemed relevant by the members of such Committee. The Corporate Governance Committee is expected to accept the resignation except in situations where the considerations would warrant the applicable director continuing to serve on the Board of Directors. The Board of Directors will make its final decision and announce it in a press release within 90 days following the shareholders' meeting. A director who tenders his or her resignation pursuant to this policy will not participate in any meeting of the Board of Directors or the Corporate Governance Committee at which the resignation is considered.
The Securities Act (Ontario) provides that a reporting insider must, within 10 days of becoming a reporting insider, file an insider report in the required form disclosing (a) any direct or indirect beneficial ownership of, or control or direction over, securities of the reporting issuer, and (b) any interest in, or right or obligation associated with, an agreement, arrangement or understanding to which the reporting insider is a party, the effect of which is to alter, directly or indirectly, the reporting insider's economic interest in a security of the reporting issuer or economic exposure to the reporting issuer (a "related financial instrument"). A reporting insider must also file an insider report within five days of any change to (a) its direct or indirect beneficial ownership of, or control or direction over, securities of the reporting issuer, or (b) its interest in, or right or obligation associated with, a related financial instrument. A reporting insider includes the directors and certain officers of a reporting issuer or a major subsidiary of a reporting issuer, and any person or company that has beneficial ownership of, or control or direction over, or a combination of beneficial ownership of, and control or direction over, securities of a reporting issuer, including securities issuable upon the exercise of conversion or purchase rights or obligations within 60 days pursuant to a single transaction or a series of linked transactions, carrying more than 10% of the voting rights attached to all the reporting issuer's outstanding voting securities, as well as the directors and certain officers of such a shareholder. The officers that are reporting insiders in respect of a reporting issuer are the following officers of the issuer, a major subsidiary of the issuer or a significant shareholder of the issuer: the chief executive officer, the chief financial officer, the chief operating officer (or persons that act in such roles or in similar capacities) and any other officer that in the ordinary course receives or has access to information as to material facts or material changes concerning the reporting issuer before the material facts or material changes are generally disclosed and directly or indirectly exercises significant power or influence over the business, operations, capital or development of the reporting issuer.
Additionally, the Securities Act (Ontario) provides that any person or company (an "acquiror") that acquires beneficial ownership of, or the power to exercise control or direction over, voting or equity securities of any class of a reporting issuer, including securities of that class issuable upon the exercise of conversion or purchase rights or obligations within 60 days pursuant to a single transaction or a series of linked transactions, that, when added to the person or company's securities of that class, constitute 10% or more of the outstanding securities of that class (together with any such securities held by any person or company acting jointly or in concert with the acquiror), must promptly issue and file a news release and, within two business days, file an early warning report, each containing certain prescribed information. The acquiror must also issue a news release and file a report each time (a) the acquiror, or any person or company that is acting jointly or in concert with the aquiror, acquires beneficial ownership of, or the power to exercise control or direction over, an additional 2% or more of the outstanding securities of the same class or (b) there is a change to any material fact in the disclosure set out in the report most recently filed.
The rules in the United States governing the ownership threshold above which shareholder ownership must be disclosed are more stringent than those discussed above. Section 13(d) of the Securities Exchange Act of 1934, as amended (the "Exchange Act"), imposes reporting requirements on persons who acquire beneficial ownership (as such term is defined in Rule 13d-3 under the Exchange Act) of more than 5% of a class of an equity security registered under Section 12 of the Exchange Act. In general, such persons must file, within ten days after such acquisition, a report of beneficial ownership with the SEC containing the information prescribed by the regulations under Section 13(d) of the
158 AGNICO-EAGLE MINES LIMITED
Exchange Act and promptly file an amendment to such report to disclose any material change to the information reported, including any acquisition or disposition of 1% or more of the outstanding securities of the registered class. Certain institutional investors that acquire shares in the ordinary course of business and not with the purpose or with the effect of changing or influencing the control of the issuer, are subject to lesser disclosure obligations.
The Company believes the following contracts constitute the only material contracts to which it is a party.
Credit Facility
The Company entered into the Credit Facility on August 4, 2011 with a group of financial institutions providing for a $1.2 billion unsecured revolving bank credit facility that replaced the Company's previous unsecured revolving bank credit facility. The Credit Facility was subsequently amended on July 20, 2012. The Credit Facility matures and all indebtedness thereunder is due and payable on June 22, 2017. The Company, with the consent of lenders representing at least 662/3% of the aggregate commitments under the Credit Facility, may extend the term of the Credit Facility for additional one-year terms. The Credit Facility is available in multiple currencies through prime rate and base rate advances, priced at the applicable rate plus a margin that ranges from 0.50% to 1.75% depending on certain financial ratios and through LIBOR advances, bankers' acceptances and letters of credit, priced at the applicable rate plus a margin that ranges from 1.50% to 2.75% depending on certain financial ratios. The lenders under the Credit Facility are each paid a standby fee at a rate that ranges from 0.3375% to 0.61875% of the undrawn portion of the facility, depending on certain financial ratios. Where credit exposure for all lenders is in the aggregate equal to or greater than 50% of the aggregate commitments, the standby fee and letter of credit fee shall be increased by 0.125%, provided that, if and so long as the Company has a credit rating by S&P of at least BBB, DBRS of at least BBB or Moody's of at least Baa2, such increase shall not apply. Payment and performance of the Company's obligations under the Credit Facility are guaranteed by each of its significant subsidiaries and certain of its other subsidiaries (the "Guarantors" and, together with the Company, each an "Obligor").
The Credit Facility contains covenants that limit, among other things, the ability of an Obligor to:
- •
- incur
additional indebtedness;
- •
- pay
or declare dividends or make other restricted distributions or payments in respect of the Company's equity securities if an event of default has occurred and
is continuing;
- •
- make
sales or other dispositions of material assets;
- •
- create
liens on its existing or future assets, other than permitted liens;
- •
- enter
into transactions with affiliates other than the Obligors, except on a commercially reasonable basis as if it were dealing with such person at arm's length;
- •
- make
any investment or loan other than: investments in or loans to businesses related to mining or a business ancillary or complementary to mining; investments in cash
equivalents; or certain inter-company investments or loans;
- •
- enter
into or maintain certain derivative instruments; and
- •
- amalgamate or otherwise transfer its assets.
The Company is also required to maintain a total net debt to EBITDA ratio below a specified maximum value as well as a minimum tangible net worth. Events of default under the Credit Facility include, among other things:
- •
- the
failure to pay principal when due and payable or interest, fees or other amounts payable within five business days of such amounts becoming due and payable;
- •
- the
breach by the Company of any financial covenant;
- •
- the
breach by any Obligor of any of its obligations or undertakings under the Credit Facility or related agreements or documents that is not cured within 30 days
after written notice of the breach has been given to the Company;
- •
- a
default under any other indebtedness of the Obligors if the effect of such default is to accelerate, or to permit the acceleration of, the due date of such indebtedness in
an aggregate amount of $50 million or more;
- •
- a change of control of the Company which is defined to occur upon (a) the acquisition, directly or indirectly, by any means whatsoever, by any person, or group of persons acting jointly or in concert, (collectively, an "offeror") of
2012 ANNUAL REPORT 159
- •
- various events relating to the bankruptcy or insolvency or winding-up, liquidation or dissolution or cessation of business of any Obligor.
beneficial ownership of, or the power to exercise control or direction over, or securities convertible or exchangeable into, any securities of the Company carrying in aggregate (assuming the exercise of all such conversion or exchange rights in favour of the offeror) more than 50% of the aggregate votes represented by the voting stock then issued and outstanding or otherwise entitling the offeror to elect a majority of the board of directors of the Company, or (b) the replacement by way of election or appointment at any time of one-half or more of the total number of the then incumbent members of the board of directors of the Company, or the election or appointment of new directors comprising one-half or more of the total number of members of the board of directors in office immediately following such election or appointment; unless, in any such case, the nomination of such directors for election or their appointment is approved by the board of directors of the Company in office immediately preceding such nomination or appointment in circumstances where such nomination or appointment is made other than as a result of a dissident public proxy solicitation, whether actual or threatened (a "Change of Control"); and
As at March 11, 2013, there was approximately $1.1 million in the aggregate drawn under the Credit Facility (reflecting outstanding letters of credit).
Letter of Credit Facility
On June 26, 2012, the Company entered into the Letter of Credit Facility with The Bank of Nova Scotia, as lender, providing for a C$150 million uncommitted letter of credit facility. Under the terms of the Letter of Credit Facility, the Company may request to be issued one or more letters of credit in a maximum aggregate amount outstanding at any time not exceeding C$150 million. The Letter of Credit Facility may be used by the Company to support (a) reclamation obligations of the Company or its subsidiaries or (b) non-financial or performance obligations of the Company or its subsidiaries that are not related to reclamation obligations. If the Company fails to pay any amount of a reimbursement obligation under the Letter of Credit Facility, including any interest thereon, on the date such amount is due, the overdue amount will bear interest at equal to 2% greater than the prime rate (as calculated under the Letter of Credit Facility). Payment and performance of the Company's obligations under the Letter of Credit Facility are guaranteed by the Guarantors.
Events of default under the Letter of Credit Facility include, among other things:
- •
- the
failure to pay any amount drawn under the Letter of Credit Facility within three business days of when notified or demanded by the lender;
- •
- the
breach by any Obligor of any obligation or undertaking under the Letter of Credit Facility or guarantee provided pursuant to the Letter of Credit Facility;
- •
- a
default under any other indebtedness of the Obligors if the effect of such default is to accelerate, or to permit the acceleration of, the due date of such indebtedness in
an aggregate amount of $50 million or more; and
- •
- a Change of Control.
The Letter of Credit Facility provides that upon an event of default, The Bank of Nova Scotia may declare immediately due and payable all amounts drawn under the Letter of Credit Facility.
As at March 11, 2013, there was approximately C$135 million in the aggregate drawn under the Letter of Credit Facility.
Note Purchase Agreements
On April 7, 2010, the Company entered into a note purchase agreement with certain institutional investors, providing for the issuance of the 2010 Notes consisting of $115 million 6.13% Series A senior notes due 2017, $360 million 6.67% Series B senior notes due 2020 and $125 million 6.77% Series C senior notes due 2022 (the "2010 Note Purchase Agreement"). On July 24, 2012, the Company entered into another note purchase agreement with certain institutional investors, providing for the issuance of the 2012 Notes consisting of $100 million 4.87% Series A senior notes due 2022 and $100 million 5.02% Series B senior notes due 2024 (together with the 2010 Note Purchase Agreement, the "Note Purchase Agreements"). Payment and performance of the Company's obligations under the Note Purchase Agreements, the notes issued pursuant thereto and the obligations of the Guarantors under the guarantees are guaranteed by the Guarantors.
160 AGNICO-EAGLE MINES LIMITED
The Note Purchase Agreements contain restrictive covenants that limit, among other things, the ability of an Obligor to:
- •
- enter
into transactions with affiliates other than the Obligors, except on a commercially reasonable basis upon terms no less favourable to the Obligor than would be
obtainable in a comparable arm's length transaction;
- •
- amalgamate
or otherwise transfer its assets;
- •
- carry
on business other than those related to mining or a business ancillary or complementary to mining;
- •
- engage
in any dealings or transactions with any person or entity identified under certain anti-terrorism regulations;
- •
- create
liens on its existing or future assets, other than permitted liens;
- •
- incur
subsidiary indebtedness where the Obligor is a subsidiary of the Company; and
- •
- make sales or other dispositions of material assets.
The Company is also required to maintain the same financial ratios and the same minimum tangible net worth under the Note Purchase Agreements as under the Credit Facility. Events of default under the Note Purchase Agreements include, among other things:
- •
- the
failure to pay principal or make whole amounts when due and payable or interest, fees or other amounts payable within five business days of such amounts becoming due
and payable;
- •
- the
breach by any Obligor of any other term or covenant that is not cured within 30 business days after the earlier of written notice of the breach having been given
to the Company or actual knowledge of the breach is obtained;
- •
- the
finding that any representation or warranty made by an Obligor was false or incorrect in any material respect on the date as of which it was made;
- •
- a
default under any other indebtedness of the Obligors if the effect of such default is to accelerate, or to permit the acceleration of, the due date of such indebtedness in
an aggregate amount of $50 million or more; and
- •
- various events relating to the bankruptcy or insolvency or winding-up, liquidation or dissolution or cessation of business of any Obligor.
The Note Purchase Agreements provide that, upon certain events of default, the notes automatically become due and payable without any further action. In addition, the Note Purchase Agreements contain a "Most Favored Lender" clause which acts to incorporate into the Note Purchase Agreements any grace periods upon an event of default that are shorter in the Credit Facility than in the Note Purchase Agreements.
Warrant Indenture
The Company issued common share purchase warrants (the "Warrants") as part of a private placement on December 3, 2008. Effective April 4, 2009, the Warrants were amended and are governed by a warrant indenture (the "Indenture") between the Company and Computershare Trust Company of Canada (the "Trustee").
Each whole Warrant entitles the holder to purchase one common share of the Company at a price of $47.25, subject to adjustment as summarized below. The Warrants are exercisable at any time prior to 4:30 p.m. (Eastern Standard Time) on December 2, 2013, after which the Warrants will expire and become void and of no effect. Warrants may be surrendered for exercise or transfer at the principal office of the Trustee in Toronto.
The Indenture provides for adjustment in the number of common shares issuable on the exercise of the Warrants and/or the exercise price per Warrant on the occurrence of certain events, including:
- (a)
- the
declaration of a dividend or making of a distribution on the common shares payable in common shares or securities exchangeable for or convertible into common shares without
payment of additional consideration to the holders of the common shares in proportion to their respective ownership of common shares;
- (b)
- the
subdivision, consolidation or change of the outstanding common shares into a different number of common shares;
- (c)
- the fixing of a record date for the issuance of rights, options or warrants to all or substantially all of the holders of the common shares under which such holders are entitled, during a period expiring not more than 45 days after such record date, to subscribe for or purchase common shares, or securities exchangeable for or convertible into common shares without payment of additional consideration at a price per share of less than 95% of the Current Market Price (as defined in the Indenture) on such record date; and
2012 ANNUAL REPORT 161
- (d)
- the fixing of a record date for the issuance or distribution to all or substantially all of the holders of the common shares of securities of the Company (including rights, options or warrants to purchase any securities of the Company), evidence of the Company's indebtedness or any property or assets (including cash or shares of any other corporation but excluding any dividends paid in accordance with a dividend policy established by the board of directors of the Company) and such issuance or distribution does not constitute an event listed in (a) to (c) above.
The Indenture also provides for adjustment in the class and/or number of securities issuable on the exercise of the Warrants and/or exercise price per security in the event of the following additional events: (i) a reorganization, reclassification or other change of the common shares into other securities; (ii) a consolidation, amalgamation, arrangement or merger of the Company with or into another entity (other than consolidations, amalgamations, arrangements or mergers which do not result in any reclassification of the common shares or a change of the common shares into other shares); (iii) an exchange of common shares for other shares or other securities or property, including cash, pursuant to the exercise of a statutory compulsory acquisition right; or (iv) a sale, conveyance or transfer (other than to a subsidiary of the Company) of the Company's undertakings or assets as an entirety or substantially as an entirety to another corporation or other entity or the completion of a take-over bid (as such term is defined under the Securities Act (Ontario)) resulting in the offeror, together with any persons acting jointly or in concert with the offeror, holding at least two-thirds of the then outstanding common shares in which the holders of common shares are entitled to receive shares, other securities or property, including cash.
No adjustment in the exercise price or the number of common shares purchasable on the exercise of the Warrants will be required to be made unless the cumulative effect of such adjustment or adjustments would change the exercise price by at least one percent or the number of common shares purchasable on exercise by at least one one-hundredth of a share; provided however, that any such adjustment that is not made will be carried forward and taken into account in any subsequent adjustment.
The Company covenanted in the Indenture that, during the period in which the Warrants are exercisable, it will give notice to holders of Warrants of any event that requires or may require an adjustment in any of the exercise rights pursuant to any of the Warrants at least ten days prior to the record date or effective date, as the case may be, of such event.
No fractional common shares will be issuable on the exercise of any Warrants. The Company will not pay cash or other consideration to the holder of a Warrant in lieu of fractional common shares. Except as expressly provided in the Indenture or in the Warrants, Holders of Warrants will not have any voting rights or any other rights that a holder of common shares would have (including, without limitation, the right to receive notice of or to attend meetings of shareholders or any right to receive dividends or other distributions). Holders of Warrants will have no pre-emptive rights to acquire securities of the Company.
From time to time, the Company and the Trustee, without the consent of the holders of Warrants, may amend or supplement the Indenture for certain purposes, including curing defects or inconsistencies or making any change that, in the opinion of the Trustee, does not prejudice the rights of the Trustee or the holders of the Warrants. Any amendment or supplement to the Indenture that prejudices the interests of the holders of the Warrants may only be made by "extraordinary resolution", which is defined in the Indenture as a resolution either (i) passed at a meeting of the holders of Warrants at which there are holders of Warrants present in person or represented by proxy representing at least 25% of the then outstanding Warrants (at least 50% for any amendment that would increase the exercise price per security, decrease the number of securities issuable upon the exercise of Warrants or shorten the term of the Warrants), or such lesser percentage constituting a quorum for this purpose under the Indenture, and passed by the affirmative vote of holders of Warrants representing not less than 662/3% of the then outstanding Warrants represented at the meeting and voted on the poll on such resolution; or (ii) adopted by an instrument in writing signed by the holders of Warrants representing not less than 662/3% of the then outstanding Warrants.
The Warrants may not be exercised by or on behalf of a U.S. person (a "U.S. Person"), as defined in Rule 902(k) of Regulation S under the United States Securities Act of 1933, as amended (the "U.S. Securities Act"), a person in the United States or for the account or benefit of a U.S. Person or a person in the United States (each a "Restricted Person") unless registered under the U.S. Securities Act and the securities laws of all applicable states of the United States or an exemption from such registration requirements is available. The Company does not intend to register the Warrants, or the common shares issuable upon exercise of the Warrants, in the United States. The Company and Trustee will not accept subscriptions for common shares pursuant to the exercise of Warrants from any holder of Warrants who does not certify that it is not a Restricted Person.
162 AGNICO-EAGLE MINES LIMITED
Notwithstanding the foregoing, a Warrant may be exercised by or on behalf of Restricted Person if:
- (a)
- the
Warrant is a U.S. Warrant (as defined in the Indenture) and is exercised by an Initial U.S. Holder (as defined in the Indenture);
- (b)
- the
Warrant is a U.S. Warrant and the holder delivers a letter in the form of Schedule B to the Indenture to the Trustee; or
- (c)
- the holder delivers to the Trustee a written opinion of United States counsel reasonably acceptable to the Company to the effect that either the Warrants and the common shares have been registered under the U.S. Securities Act or, that upon exercise of the Warrant, the common shares may be issued to the holder without registration under the U.S. Securities Act and any applicable securities laws of any state of the United States.
Warrants may not be sold or transferred except under circumstances that will not result in a violation of the U.S. Securities Act, any applicable U.S. state securities laws or any applicable Canadian securities laws. Warrants may only be sold or transferred:
- (a)
- to
the Company;
- (b)
- outside
the United States in accordance with Regulation S under the U.S. Securities Act;
- (c)
- in
the United States in compliance with the exemption from registration provided by Rule 144 under the U.S. Securities Act, if available, or in another
transaction that does not require registration under the U.S. Securities Act; or
- (d)
- pursuant to an effective registration statement under the U.S. Securities Act.
RSU Plan
The Company has an RSU Plan for directors, officers and employees of the Company. See "Item 6 Directors, Senior Management and Employees – Compensation of Executive Officers – RSU Plan". A copy of the RSU Plan is filed as Exhibit 4.05 to this Form 20-F.
Stock Option Plan
The Company has a Stock Option Plan for directors, officers, employees and service providers to the Company. See "Item 6 Directors, Senior Management and Employees – Compensation of Executive Officers – Stock Option Plan". A copy of the Stock Option Plan is filed as Exhibit 4.03 to this Form 20-F.
Employee Share Purchase Plan
The Company has an Employee Share Purchase Plan for officers and full-time employees of the Company. See "Item 6 Directors, Senior Management and Employees – Compensation of Executive Officers – Employee Share Purchase Plan". A copy of the Employee Share Purchase Plan is filed as Exhibit 4.04 to this Form 20-F.
Canada has no system of exchange controls. There are no Canadian restrictions on the repatriation of capital or earnings of a Canadian public company to non-resident investors. There are no laws in Canada or exchange restrictions affecting the remittance of dividends, profits, interest, royalties and other payments to non-resident holders of the Company's securities, except as discussed in "– Canadian Federal Income Tax Considerations" below.
Restrictions on Share Ownership by Non-Canadians
There are no limitations under the laws of Canada or in the constating documents of the Company on the right of foreigners to hold or vote securities of the Company, except that the Investment Canada Act may require review and approval by the Minister of Industry (Canada) of certain acquisitions of "control" of the Company by a "non-Canadian". An acquisition of control may occur if one-third or more of the voting shares of the Company are acquired. "Non-Canadian" generally means an individual who is not a Canadian citizen or a permanent resident of Canada, or a corporation, partnership, trust or joint venture that is ultimately controlled by non-Canadians.
Canadian Federal Income Tax Considerations
The following is a brief summary of some of the principal Canadian federal income tax consequences generally applicable to a holder of common shares of the Company (a "U.S. holder") who deals at arm's length with the Company, holds the
2012 ANNUAL REPORT 163
shares as capital property and who, for the purposes of the Income Tax Act (Canada) (the "Act") and the Canada- United States Income Tax Convention (1980) (the "Treaty"), is at all relevant times resident in the United States, is not and is not deemed to be resident in Canada and does not use or hold and is not deemed to use or hold the shares in carrying on a business in Canada. Special rules, which are not discussed below, may apply to a U.S. holder which is an insurer that carries on business in Canada and elsewhere. This summary is of a general nature only and is not, and should not be interpreted as, legal or tax advice to any particular U.S. holder and no representation is made with respect to the Canadian federal income tax consequences to any particular person. Accordingly, U.S. holders are advised to consult their own tax advisors with respect to their particular circumstances.
Under the Act and the Treaty, a U.S. holder of common shares (including an individual or estate) who is entitled to benefits under the Treaty will generally be subject to a 15% withholding tax on dividends paid or credited or deemed by the Act to have been paid or credited on such shares. The dividends may be exempt from such withholding in the case of some U.S. holders such as qualifying pension funds and charities. A U.S. holder who is not entitled to benefits under the Treaty (or to the benefits of the Dividends Article of the Treaty) will generally be subject to Canadian withholding tax at the rate of 25% on such dividends.
In general, a U.S. holder will not be subject to Canadian income tax on capital gains arising on the disposition of shares of the Company unless, at the time of disposition, the shares are "taxable Canadian property" (as defined in the Act) and such gains are not exempted from such income tax by virtue of the Treaty. Where the shares are listed on a designated stock exchange (which includes the TSX and the NYSE) at the time of disposition, the shares will not generally be taxable Canadian property, unless at any time in the 60-month period immediately preceding the disposition (i) 25% or more of the shares of any class or series of the capital stock of the Company was owned by or belonged to one or more of the U.S. holder and persons with whom the U.S. holder did not deal at arm's length, and (ii) more than 50% of the fair market value of the shares was derived directly or indirectly from one or more of real or immovable property situated in Canada, Canadian resource properties, timber resource properties or options in respect of the foregoing or interests therein. In certain circumstances, the shares may be deemed to be taxable Canadian property of a U.S. holder. A U.S. holder who is entitled to benefits under the Treaty will be so exempted under the Treaty where the value of the shares of the Company at the time of disposition is not derived principally from real property (as defined in the Treaty) situated in Canada. For this purpose, the Treaty defines real property situated in Canada to include rights to explore for or exploit mineral deposits and other natural resources situated in Canada, rights to amounts computed by reference to the amount or value of production from such resources and certain other rights in respect of natural resources situated in Canada.
To satisfy the withholding tax liabilities of U.S. holders that are registered shareholders, the Company withholds on dividend payments made to them. For U.S. holders that are beneficial shareholders, these withholding tax obligations are typically satisfied in the ordinary course through arrangements with their broker or other intermediary.
United States Federal Income Tax Considerations
The following is a brief summary of some of the principal U.S. federal income tax consequences to a holder of common shares of the Company, who deals at arm's length with the Company, holds the shares as a capital asset and who, for the purposes of the Internal Revenue Code of 1986, as amended (the "Code") and the Treaty, is at all relevant times a U.S. Stockholder (as defined below).
As used herein, the term "U.S. Stockholder" means a holder of common shares of the Company who (for United States federal income tax purposes): (a) is a citizen or resident of the United States; (b) is a corporation created or organized in or under the laws of the United States or of any state therein; (c) is an estate the income of which is subject to United States federal income taxation regardless of its source; or (d) is a trust that either (i) has validly elected to be treated as a U.S. person or (ii) is subject to both the primary supervision of a U.S. court and the control of one or more U.S. persons with respect to all substantial trust decisions.
This summary is based on the Code, final and temporary Treasury Regulations promulgated thereunder, United States court decisions, published rulings and administrative positions of the U.S. Internal Revenue Service (the "IRS") interpreting the Code, and the Treaty, as applicable and, in each case, as in effect and available as of the date of this Form 20-F. Any of the authorities on which this summary is based could be changed in a material and adverse manner at any time, and any such change could be applied on a retroactive basis and could affect the United States federal income tax consequences described in this summary. This summary does not discuss the potential effects, whether adverse or beneficial, of any proposed legislation that, if enacted, could be applied on a retroactive basis.
This summary does not describe United States federal estate and gift tax considerations, nor does it describe regional, state and local tax considerations within the United States. The following summary does not purport to be a
164 AGNICO-EAGLE MINES LIMITED
comprehensive description of all of the possible tax considerations that may be relevant to a decision to purchase, hold or dispose of the common shares. In particular, this summary only deals with a holder who will hold the common shares as a capital asset and who does not own, directly or indirectly, 10% or more of our voting shares or of any of our direct or indirect subsidiaries. This summary does not address all of the tax consequences that may be relevant to holders in light of their particular circumstances, including but not limited to application of alternative minimum tax or rules applicable to taxpayers in special circumstances. Special rules may apply, for instance, to tax-exempt entities, banks, insurance companies, S corporations, dealers in securities or currencies, persons who will hold common shares as a position in a "straddle", hedge, constructive sale or "conversion transaction" for U.S. tax purposes, persons who have a "functional currency" other than the U.S. dollar or persons subject to U.S. taxation as expatriates. Furthermore, in general, this discussion does not address the tax consequences applicable to holders that are treated as partnerships or other pass-through entities for United States federal income tax purposes.
This summary is of a general nature only and is not, and should not be interpreted as, legal or tax advice to any particular U.S. Stockholder and no representation is made with respect to the U.S. income tax consequences to any particular person. Accordingly, U.S. Stockholders are advised to consult their own tax advisors with respect to their particular circumstances.
Dividends
For United States federal income tax purposes, the gross amount of all distributions, if any, paid with respect to the common shares out of current or accumulated earnings and profits ("E&P") to a U.S. Stockholder generally will be treated as foreign source dividend income to such holder, even though the U.S. Stockholder generally receives only a portion of the gross amount (after giving effect to the Canadian withholding tax as potentially reduced by the Treaty). United States corporations that hold the common shares generally will not be entitled to the dividends received deduction that applies to dividends received from United States corporations. To the extent a distribution exceeds E&P, it will be treated first as a return of capital to the extent of the U.S. Stockholder's adjusted basis and then as gain from the sale of a capital asset.
In the case of certain non-corporate U.S. Stockholders, including individuals and certain estates and trusts, gains from the sale of a capital asset held for longer than 12 months are taxable at a maximum federal income tax rate of 20%, while gains from the sale of a capital asset that do not meet such holding period are taxable at the rates applicable to ordinary income. Certain dividends paid to certain non-corporate U.S. Stockholders, including individuals and certain estates and trusts, generally are also subject to the 20% maximum rate. The reduced tax rates generally are available only with respect to dividends received from U.S. corporations, and from non-U.S. corporations (a) that are eligible for the benefits of a comprehensive income tax treaty with the United States that the U.S. Treasury Department determines to be satisfactory and that contains an exchange of information program, or (b) whose stock is readily tradable on an established securities market in the United States. In addition, the reduced tax rates are not available with respect to dividends received from a foreign corporation that was a passive foreign investment company in either the taxable year of the distribution or the preceding taxable year. Special rules may apply, however, to cause such dividends to be taxable at the higher rates applicable to ordinary income. For example, the reduced tax rates are not available with respect to a dividend on shares where the U.S. Stockholder does not continuously own such shares for more than 60 days during the 120-day period beginning 60 days before the ex-dividend date. Many other complex and special rules may apply as a condition to, or as a result of, the application of the reduced tax rate on dividends. U.S. Stockholders are advised to consult their own tax advisors.
For United States federal income tax purposes, the amount of any dividend paid in Canadian dollars will be the United States dollar value of the Canadian dollars at the exchange rate in effect on the date the dividend is properly included in income, whether or not the Canadian dollars are converted into United States dollars at that time. Gain or loss recognized by a U.S. Stockholder on a sale or exchange of the Canadian dollars will generally be United States source ordinary income or loss.
The withholding tax imposed by Canada generally is a creditable foreign tax for United States federal income tax purposes. Therefore, a U.S. Stockholder generally will be entitled to include the amount withheld as a foreign tax paid in computing a foreign tax credit (or in computing a deduction for foreign income taxes paid, if the holder does not elect to use the foreign tax credit provisions of the Code). The Code, however, imposes a number of limitations on the use of foreign tax credits, based on the particular facts and circumstances of each taxpayer. Investors should consult their tax advisors regarding the availability of the foreign tax credit. U.S. Stockholders that do not elect to claim foreign tax credit for a taxable year may be eligible to deduct such withholding tax imposed by Canada.
2012 ANNUAL REPORT 165
Capital Gains
Subject to the discussion below under the heading "– Passive Foreign Investment Company Considerations", gain or loss recognized by a U.S. Stockholder on the sale or other disposition of the common shares will be subject to United States federal income taxation as capital gain or loss in an amount equal to the difference between such U.S. Stockholder's adjusted basis in the common shares and the amount realized upon its disposition.
Gain on the sale of common shares held for more than one year by certain non-corporate U.S. Stockholders, including individuals and certain estates and trusts, will be taxable at a maximum rate of 20%. A reduced rate does not apply to capital gains realized by a U.S. Stockholder that is a corporation. Capital losses are generally deductible only against capital gains and not against ordinary income. In the case of an individual, however, unused capital losses in excess of capital gains may offset up to $3,000 annually of ordinary income.
Capital gain or loss recognized by a U.S. Stockholder on the sale or other disposition of common shares will generally be sourced in the United States.
Medicare Tax
Certain U.S. Stockholders who are individuals, estates or trusts are required to pay an additional 3.8% tax on, among other things, dividends and capital gains from the sale or other disposition of shares, including the common shares of the Company.
Passive Foreign Investment Company Considerations
The Company will be classified as a passive foreign investment company (a "PFIC") for United States federal income tax purposes if either (i) 75% or more of its gross income is passive income or (ii) on average for the taxable year, 50% or more of its assets (by value) produce or are held for the production of passive income. Based on projections of the Company's income and assets and the manner in which the Company intends to manage its business, the Company expects that the Company will not be a PFIC. However, there can be no assurance that this will actually be the case.
If the Company were to be classified as a PFIC, the consequences to a U.S. Stockholder will depend in part on whether the U.S. Stockholder has made a "Mark-to-Market Election" or a "QEF Election" with respect to the Company. If the Company is a PFIC during a U.S. Stockholder's holding period and the U.S. Stockholder does not make a Mark-to-Market Election or a QEF Election, the U.S. Stockholder will generally be subject to special rules including interest charges.
If a U.S. Stockholder makes a Mark-to-Market Election, the U.S. Stockholder would generally be required to include in its income the excess of the fair market value of the common shares as of the close of each taxable year over the U.S. Stockholder's adjusted basis therein. If the U.S. Stockholder's adjusted basis in the common shares is greater than the fair market value of the common shares as of the close of the taxable year, the U.S. Stockholder may deduct such excess, but only up to the aggregate amount of ordinary income previously included as a result of the Mark-to-Market Election, reduced by any previous deduction taken. The U.S. Stockholder's adjusted basis in its common shares will be increased by the amount of income or reduced by the amount of deductions resulting from the Mark-to-Market Election.
A U.S. Stockholder who makes a QEF Election would generally be currently taxable on its pro rata share of the Company's ordinary earnings and net capital gain (at ordinary income and capital gains rates, respectively) for each taxable year that the Company is classified as a PFIC, even if no dividend distributions were received.
If for any year the Company determines that it is properly classified as a PFIC, it will comply with all reporting requirements necessary for a U.S. Stockholder to make a QEF Election and will, promptly following the end of such year and each year thereafter for which the Company is properly classified as a PFIC, provide to U.S. Stockholders the information required by the QEF Election.
Under current U.S. law, if the Company is a PFIC in any year, a U.S. Stockholder must file an annual return on IRS Form 8621, which describes the income received (or deemed to be received pursuant to a QEF Election) from the Company, any gain realized on a disposition of common shares and certain other information.
Information Reporting; Backup Withholding Tax
Dividends on and proceeds arising from a sale of common shares generally will be subject to information reporting and backup withholding tax, currently at the rate of 28%, if (a) a U.S. Stockholder fails to furnish the U.S. Stockholder's correct United States taxpayer identification number (generally on Form W-9), (b) the withholding agent is advised the U.S. Stockholder furnished an incorrect United States taxpayer identification number, (c) the withholding agent is notified by the IRS that the U.S. Stockholder has previously failed to properly report items subject to backup withholding tax, or
166 AGNICO-EAGLE MINES LIMITED
(d) the U.S. Stockholder fails to certify, under penalty of perjury, that the U.S. Stockholder has furnished its correct U.S. taxpayer identification number and that the IRS has not notified the U.S. Stockholder that it is subject to backup withholding tax. However, U.S. Stockholders that are corporations generally are excluded from these information reporting and backup withholding tax rules. Amounts withheld as backup withholding may be credited against a U.S. Stockholder's United States federal income tax liability, and a U.S. Stockholder may obtain a refund of any excess amounts withheld under the backup withholding rules by filing the appropriate claim for refund with the IRS and furnishing any required information.
Recently enacted legislation requires U.S. individuals to report an interest in any "specified foreign financial asset" if the aggregate value of such assets owned by the U.S. individual exceeds $50,000 (or such higher amount as the IRS may prescribe in future guidance). Stock issued by a foreign corporation is treated as a specified foreign financial asset for this purpose.
Cease Trade Orders, Bankruptcies, Penalties or Sanctions
No director or executive officer of the Company is, or within 10 years prior to the date hereof has been, a director, chief executive officer or chief financial officer of any company (including the Company) that: (i) was subject to a cease trade order, an order similar to a cease trade order or an order that denied the relevant company access to any exemption under securities legislation, that was in effect for a period of more than 30 consecutive days, that was issued while the director or executive officer was acting in the capacity as director, chief executive officer or chief financial officer; or (ii) was subject to a cease trade order, an order similar to a cease trade order or an order that denied the relevant company access to any exemption under securities legislation, that was in effect for a period of more than 30 consecutive days, that was issued after the director or executive officer ceased to be a director, chief executive officer or chief financial officer and which resulted from an event that occurred while that person was acting in the capacity as director, chief executive officer or chief financial officer.
No director or executive officer of the Company, or a shareholder holding a sufficient number of securities of the Company to affect materially the control of the Company: (i) is, or within 10 years prior to the date hereof has been, a director or executive officer of any company (including the Company) that, while that person was acting in that capacity, or within a year of that person ceasing to act in that capacity, became bankrupt, made a proposal under any legislation relating to bankruptcy or insolvency or was subject to or instituted any proceedings, arrangement or compromise with creditors or had a receiver, receiver manager or trustee appointed to hold its assets; or (ii) has, within 10 years prior to the date hereof, become bankrupt, made a proposal under any legislation relating to bankruptcy or insolvency, or become subject to or instituted any proceedings, arrangement or compromise with creditors, or had a receiver, receiver manager or trustee appointed to hold the assets of the director, executive officer or shareholder.
No director or executive officer of the Company, or a shareholder holding a sufficient number of securities of the Company to affect materially the control of the Company, has been subject to: (i) any penalties or sanctions imposed by a court relating to securities legislation or by a securities regulatory authority or has entered into a settlement agreement with a securities regulatory authority; or (ii) any other penalties or sanctions imposed by a court or regulatory body that would likely be considered important to a reasonable investor in making an investment decision.
The Company's filings with the SEC, including exhibits and schedules filed with this Form 20-F, may be reviewed and copied at prescribed rates at the SEC's public reference room located at 100 F Street, N.E., Washington, D.C. 20549. Further information on the public reference rooms may be obtained by calling the SEC at 1-800-SEC-0330. The SEC maintains a web site (www.sec.gov) that contains reports, proxy and information statements and other information regarding registrants that file electronically with the SEC. Agnico- Eagle began to file electronically with the SEC in August 2002.
Any reports, statements or other information that the Company files with the SEC may be read at the addresses indicated above and may also be accessed electronically at the web site set out above. These SEC filings are also available to the public from commercial document retrieval services.
The Company also files reports, statements and other information with the CSA and these can be accessed electronically on SEDAR at www.sedar.com.
The Company's filings with the SEC and CSA may also be accessed electronically from the Company's website at www.agnico-eagle.com.
2012 ANNUAL REPORT 167
ITEM 11 QUANTITATIVE AND QUALITATIVE DISCLOSURES ABOUT MARKET RISK
Metal Price and Foreign Currency
Agnico-Eagle's net income is most sensitive to metal prices and the Canadian dollar/US dollar,
Euro/US dollar and Mexican peso/US dollar exchange rates. For the purpose of the sensitivities detailed in the table below, Agnico-Eagle used the following metal price and exchange rate
assumptions:
- •
- Gold – $1,700
per ounce;
- •
- Silver – $34
per ounce;
- •
- Zinc – $2,000
per tonne;
- •
- Copper – $7,500
per tonne;
- •
- Canadian
dollar/US dollar – C$1.00 per $1.00;
- •
- Euro/US
dollar – €0.77 per $1.00; and
- •
- Mexican peso/US dollar – 13.00 Mexican pesos per $1.00.
Changes in the market price of gold can be attributed to numerous factors such as demand, global mine production levels, central bank purchases and sales and investor sentiment. Changes in the market prices of other metals can be attributed to factors such as demand and global mine production levels. Changes in exchange rates can be attributed to factors such as supply and demand for currencies and economic conditions in each country or currency area. In 2012, the ranges of metal prices and exchange rates were as follows:
- •
- Gold:
$1,527 – $1,796 per ounce, averaging $1,668 per ounce;
- •
- Silver:
$26 – $37 per ounce, averaging $31 per ounce;
- •
- Zinc:
$1,758 – $2,189 per tonne, averaging $1,947 per tonne;
- •
- Copper:
$7,251 – $8,737 per tonne, averaging $7,953 per tonne;
- •
- Canadian
dollar/US dollar: C$0.96 – C$1.04 per $1.00, averaging C$1.00 per $1.00;
- •
- Euro/US
dollar: €0.75 – €0.83 per $1.00, averaging €0.78 per $1.00; and
- •
- Mexican peso/US dollar: 12.55 – 14.60 Mexican pesos per $1.00, averaging 13.16 Mexican pesos per $1.00.
The following table details the estimated impact on 2013 total cash costs per ounce of gold produced of a 10% change in assumed metal prices and exchange rates. A 10% change in each variable was considered in isolation while holding all other assumptions constant. Based on historical market data and the 2012 price ranges shown above, a 10% change in assumed metal prices and exchange rates is reasonably likely in 2013.
| Changes in variable | Impact on Total Cash Costs per Ounce of Gold Produced |
|||
| 10% Silver | $ | 14 | ||
| 10% Zinc | $ | 5 | ||
| 10% Copper | $ | 4 | ||
| 10% Canadian dollar/US dollar | $ | 78 | ||
| 10% Euro/US dollar | $ | 11 | ||
| 10% Mexican peso/US dollar | $ | 14 | ||
In order to mitigate the impact of fluctuating byproduct metal prices, the Company occasionally enters into derivative transactions under its Metal Price Risk Management Policy, approved by the Board. The Company's policy and practice is not to sell forward its gold production. However, the policy does allow the Company to use other hedging strategies where appropriate to mitigate foreign exchange and byproduct metal pricing risks. The Company occasionally buys put options, enters into price collars and enters into forward contracts to protect minimum byproduct metal prices while maintaining
168 AGNICO-EAGLE MINES LIMITED
full exposure to the price of gold. The Risk Management Committee has approved the strategy of using short-term call options in an attempt to enhance the realized byproduct metal prices. The Company's policy does not allow speculative trading.
The Company receives payment for all of its metal sales in US dollars and pays most of its operating and capital costs in Canadian dollars, Euros or Mexican pesos. This gives rise to significant currency risk exposure. The Company enters into currency hedging transactions under the Company's Foreign Exchange Risk Management Policy, approved by the Board, to hedge part of its foreign currency exposure. The policy does not permit the hedging of translation exposure (that is, the gains and losses that arise from the accounting translation of Canadian dollar, Euro or Mexican peso denominated assets and liabilities into US dollars), as it does not give rise to cash exposure. The Company's foreign currency derivative strategy includes the use of purchased puts, sold calls, collars and forwards. The Company's policy does not allow speculative trading.
Cost Inputs
The Company also considers and may enter into risk management strategies to mitigate price risk on certain consumables including, but not limited to, diesel fuel. These strategies have largely been confined to longer term purchasing contracts but may include financial and derivative instruments.
Interest Rates
The Company's current exposure to market risk for changes in interest rates relates primarily to drawdowns on its Credit Facility and its investment portfolio. Drawdowns on the Credit Facility are used primarily to fund a portion of the capital expenditures related to the Company's development projects and working capital requirements. As at December 31, 2012, the Company had drawn down $30.0 million on the Credit Facility. In addition, the Company invests its cash in investments with short maturities or with frequent interest reset terms and a credit rating of R1-High or better. As a result, the Company's interest income fluctuates with short-term market conditions. As at December 31, 2012, short-term investments amounted to $8.5 million.
Amounts drawn under the Credit Facility are subject to floating interest rates based on benchmark rates available in the United States and Canada or on LIBOR. In the past, the Company has entered into derivative instruments to hedge against unfavorable changes in interest rates. The Company will continue to monitor its interest rate exposure and may enter into such agreements to manage its exposure to fluctuating interest rates. In 2012, the Company entered into an interest rate derivative instrument to mitigate interest rate risk relating to the 2012 Notes.
Financial Instruments
The Company enters into contracts to limit the risk associated with decreased byproduct metal prices, increased foreign currency costs (including capital expenditures) and input costs. The contracts act as economic hedges of underlying exposures and are not held for speculative purposes. Agnico-Eagle does not use complex derivative contracts to hedge exposures. The Company uses simple contracts, such as puts and calls, collars and forwards.
Using financial instruments creates various financial risks. Credit risk is the risk that the counterparties to financial contracts will fail to perform on an obligation to the Company. Credit risk is partially mitigated by dealing with high quality counterparties such as major banks. Market liquidity risk is the risk that a financial position cannot be liquidated quickly. The Company primarily mitigates market liquidity risk by spreading out the maturity of financial contracts over time, usually based on projected production levels for the specific metal being hedged, such that the relevant markets will be able to absorb the contracts. Mark-to-market risk is the risk that an adverse change in market prices for metals will affect financial condition. Because derivative contracts are primarily used as economic hedges, changes in mark-to-market value may impact income. For a description of the accounting treatment of derivative contracts, please see "Item 5 Operating and Financial Review and Prospects – Critical Accounting Estimates – Financial Instruments".
ITEM 12 DESCRIPTION OF SECURITIES OTHER THAN EQUITY SECURITIES
None/not applicable.
2012 ANNUAL REPORT 169
ITEM 13 DEFAULTS, DIVIDEND ARREARAGES AND DELINQUENCIES
None.
ITEM 14 MATERIAL MODIFICATIONS TO THE RIGHTS OF SECURITY HOLDERS AND USE OF PROCEEDS
None.
ITEM 15 CONTROLS AND PROCEDURES
Evaluation of disclosure controls and procedures
The Company's management, with the participation of the Company's Chief Executive Officer and Chief Financial Officer, evaluated the effectiveness of the Company's disclosure controls and procedures as of December 31, 2012 pursuant to Rule 13a-15 under the Exchange Act. In designing and evaluating the disclosure controls and procedures, management recognizes that any controls and procedures, no matter how well designed and operated, can provide only reasonable assurance of achieving the desired control objectives. In addition, the design of disclosure controls and procedures must reflect the fact that there are resource constraints and that management is required to apply its judgment in evaluating the benefits of possible controls and procedures relative to their costs.
Based on such evaluation, the Company's Chief Executive Officer and Chief Financial Officer concluded that, as of December 31, 2012, the Company's disclosure controls and procedures were designed at a reasonable assurance level and were effective to provide reasonable assurance that information the Company is required to disclose in reports that the Company files or submits under the Exchange Act is recorded, processed, summarized and reported within the time periods specified in SEC rules and forms, and that such information is accumulated and communicated to the Company's management, including the Company's Chief Executive Officer and Chief Financial Officer, as appropriate, to allow timely decisions regarding required disclosure.
Management's report on internal control over financial reporting
Management of the Company is responsible for establishing and maintaining adequate internal control over financial reporting. Internal control over financial reporting is a process designed by, or under the supervision of, the Company's Chief Executive Officer and Chief Financial Officer and effected by the Board, management and other personnel to provide reasonable assurance regarding the reliability of financial reporting and the preparation of financial statements for external purposes in accordance with generally accepted accounting principles. Because of its inherent limitations, internal control over financial reporting may not prevent or detect misstatements. Also, projections of any evaluation of effectiveness to future periods are subject to risk that controls may become inadequate because of changes in conditions, or that the degree of compliance with the policies or procedures may deteriorate.
The Company's management, including the Company's Chief Executive Officer and Chief Financial Officer, assessed the effectiveness of the Company's internal control over financial reporting as of December 31, 2012. In making this assessment, the Company's management used the criteria set out by the Committee of Sponsoring Organizations of the Treadway Commission in Internal Control – Integrated Framework. Based upon its assessment, management concluded that, as of December 31, 2012, the Company's internal control over financial reporting was effective.
The effectiveness of the Company's internal control over financial reporting as of December 31, 2012 has been audited by Ernst & Young LLP, an independent registered public accounting firm, as stated in their report which appears herein.
The Company will continue to periodically review its disclosure controls and procedures and internal control over financial reporting and may make modifications from time to time as considered necessary or desirable.
Attestation report of the registered public accounting firm
Please see "Item 18 Financial Statements – Report of Independent Registered Public Accounting Firm" included in the Company's Consolidated Financial Statements which, is incorporated by reference to this Item 15.
Changes in internal control over financial reporting
Management regularly reviews its system of internal control over financial reporting and makes changes to the Company's processes and systems to improve controls and increase efficiency, while ensuring that the Company maintains an
170 AGNICO-EAGLE MINES LIMITED
effective internal control environment. Changes may include such activities as implementing new, more efficient systems, consolidating activities, and migrating processes.
There was no change in the Company's internal control over financial reporting that occurred during the period covered by this Annual Report on Form 20-F that has materially affected, or is reasonably likely to materially affect, the Company's internal control over financial reporting.
ITEM 15T CONTROLS AND PROCEDURES
Not applicable.
ITEM 16A AUDIT COMMITTEE FINANCIAL EXPERT
The Board has determined that the Company shall have at least one "audit committee financial expert" (as defined in Item 16A of Form 20-F) and that Messrs. Bernard Kraft and Mel Leiderman are the Company's "audit committee financial experts" serving on the Audit Committee of the Board. Each of the Audit Committee financial experts is "independent" under applicable listing standards.
The Company has a "code of ethics" (as defined in Item 16B of Form 20-F) that applies to its Chief Executive Officer, Chief Financial Officer, principal accounting officer, controller and persons performing similar functions. In 2012, the Company amended its "code of ethics" to, among other things, (a) require that all employees use the information technology services provided to them by the Company in a professional, lawful and ethical manner and in accordance with the Company's information technology usage policy and (b) require the prior approval of the Company's Community Donations Committee for political donations made in the name of the Company and limit such donations to an aggregate annual limit of C$100,000, unless a greater aggregate amount has been approved by the Board. A copy of the Company's amended code of ethics has been filed as Exhibit 11.01 to this Form 20-F. The code of ethics is available on the Company's website at www.agnico-eagle.com or, without charge, upon request from the Corporate Secretary, Agnico-Eagle Mines Limited, Suite 400, 145 King Street East, Toronto, Ontario M5C 2Y7 (telephone 416-947-1212).
ITEM 16C PRINCIPAL ACCOUNTANT FEES AND SERVICES
The Audit Committee establishes the independent auditors' compensation. In 2003, the Audit Committee established a policy to pre-approve all services provided by the Company's independent public accountant, Ernst & Young LLP. The Audit Committee determines which non-audit services the independent auditors are prohibited from providing and authorizes permitted non-audit services to be performed by the independent auditors to the extent those services are permitted by SOX and other applicable legislation and regulations. All fees paid to Ernst & Young LLP in 2012 were pre-approved by the Audit Committee.
Ernst & Young LLP has served as the Company's independent public accountant for each of the fiscal years in the three-year period ended December 31, 2012 for which audited financial statements appear in this Annual Report on Form 20-F. Fees paid to Ernst & Young LLP in 2012 and 2011 are set out below.
| Year Ended December 31, | |||||
| 2012 | 2011 | ||||
| (C$ thousands) | |||||
| Audit fees | 2,466 | 2,655 | |||
| Audit-related fees | 23 | 21 | |||
| Tax fees | 400 | 72 | |||
| All other fees | 167 | 76 | |||
| Total | 3,056 | 2,824 | |||
Audit fees were paid for professional services rendered by the auditors for the audit of Agnico-Eagle's annual financial statements and related statutory and regulatory filings and for the quarterly review of Agnico-Eagle's interim financial
2012 ANNUAL REPORT 171
statements. Audit fees also include prospectus-related fees for professional services rendered by the auditors in connection with corporate financing activities. These services consisted of the audit or review, as required, of financial statements included in the prospectuses, the review of documents filed with securities regulatory authorities, correspondence with securities regulatory authorities and all other services required by regulatory authorities in connection with the filing of these documents.
Audit-related fees consist of fees paid for assurance and related services performed by the auditors that are reasonably related to the performance of the audit of the Company's financial statements. This includes consultation with respect to financial reporting, accounting standards and compliance with Section 404 of SOX.
Tax fees were paid for professional services relating to tax compliance, tax advice and tax planning. These services included the review of tax returns and tax planning and advisory services in connection with international and domestic taxation issues.
All other fees were paid for services other than the services described above and include fees for professional services rendered by the auditors in connection with the translation of securities regulatory filings required to comply with securities laws in certain Canadian jurisdictions.
No other fees were paid to auditors in the previous two years.
The Audit Committee has adopted a policy that requires the pre-approval of all fees paid to Ernst & Young LLP prior to the commencement of the specific engagement, and all fees referred to above were pre-approved in accordance with such policy.
ITEM 16D EXEMPTIONS FROM THE LISTING STANDARDS FOR AUDIT COMMITTEES
None.
ITEM 16E PURCHASES OF EQUITY SECURITIES BY THE ISSUER AND AFFILIATED PURCHASERS
None.
ITEM 16F CHANGES IN REGISTRANT'S CERTIFYING ACCOUNTANT
None.
The Company is subject to a variety of corporate governance guidelines and requirements enacted by the TSX, the CSA, the NYSE and the SEC. The Company believes that it meets and often exceeds not only corporate governance legal requirements in Canada and the United States, but also the best practices recommended by securities regulators. The Company is listed on the NYSE and, although the Company is not required to comply with most of the NYSE corporate governance requirements to which the Company would be subject if it were a U.S. corporation, the Company's governance practices differ from those required of U.S. domestic issuers in only the following respects. The NYSE rules for U.S. domestic issuers require shareholder approval of all equity compensation plans (as defined in the NYSE rules) regardless of whether new issuances, treasury shares or shares that the Company has purchased in the open market are used. The TSX rules require shareholder approval of share compensation arrangements involving new issuances of shares, and of certain amendments to such arrangements, but do not require such approval if the compensation arrangements involve only shares purchased in the open market. The NYSE rules for U.S. domestic issuers also require shareholder approval of certain transactions or series of related transactions that result in the issuance of common shares, or securities convertible into or exercisable for common shares, that have, or will have upon issuance, voting power equal to or in excess of 20% of the voting power outstanding prior to the transaction or if the issuance of common shares, or securities convertible into or exercisable for common shares, are, or will be upon issuance, equal to or in excess of 20% of the number of common shares outstanding prior to the transaction. The TSX rules require shareholder approval of acquisition transactions resulting in dilution in excess of 25%. The TSX also has broad general discretion to require shareholder approval in connection with any issuances of listed securities. The Company complies with the TSX rules described in this paragraph.
ITEM 16H MINE SAFETY DISCLOSURE
Not applicable.
172 AGNICO-EAGLE MINES LIMITED
Not applicable.
Pursuant to General Instruction E(c) of Form 20-F, the registrant has elected to provide the financial statements and related information specified in Item 18, as set out below.
| Page | ||
| Reports of Independent Registered Public Accounting Firm | 174, 176 | |
| Management Certification | 175 | |
| Summary of Significant Accounting Policies | 177 | |
| Consolidated Balance Sheets | 184 | |
| Consolidated Statements of Income (Loss) and Comprehensive Income (Loss) | 186 | |
| Consolidated Statements of Shareholders' Equity | 188 | |
| Consolidated Statements of Cash Flows | 190 | |
| Notes to Consolidated Financial Statements | 192 | |
2012 ANNUAL REPORT 173
REPORT OF INDEPENDENT REGISTERED PUBLIC ACCOUNTING FIRM
To the Board of Directors (the "Board") and Shareholders of Agnico-Eagle Mines Limited:
We have audited Agnico-Eagle Mines Limited's internal control over financial reporting as of December 31, 2012, based on criteria established in Internal Control – Integrated Framework issued by the Committee of Sponsoring Organizations of the Treadway Commission (the "COSO criteria"). Agnico-Eagle Mines Limited's management is responsible for maintaining effective internal control over financial reporting, and for its assessment of the effectiveness of internal control over financial reporting included in the accompanying management certification report on internal control over financial reporting. Our responsibility is to express an opinion on Agnico-Eagle Mines Limited's internal control over financial reporting based on our audit.
We conducted our audit in accordance with the standards of the Public Company Accounting Oversight Board (United States). Those standards require that we plan and perform the audit to obtain reasonable assurance about whether effective internal control over financial reporting was maintained in all material respects. Our audit included obtaining an understanding of internal control over financial reporting, assessing the risk that a material weakness exists, testing and evaluating the design and operating effectiveness of internal control based on the assessed risk, and performing such other procedures as we considered necessary in the circumstances. We believe that our audit provides a reasonable basis for our opinion.
A company's internal control over financial reporting is a process designed to provide reasonable assurance regarding the reliability of financial reporting and the preparation of financial statements for external purposes in accordance with generally accepted accounting principles. A company's internal control over financial reporting includes those policies and procedures that: (1) pertain to the maintenance of records that, in reasonable detail, accurately and fairly reflect the transactions and dispositions of the assets of the company; (2) provide reasonable assurance that transactions are recorded as necessary to permit preparation of financial statements in accordance with generally accepted accounting principles, and that revenues and expenditures of the company are being made only in accordance with authorizations of management and directors of the company; and (3) provide reasonable assurance regarding prevention or timely detection of unauthorized acquisition, use, or disposition of the company's assets that could have a material effect on the financial statements.
Because of its inherent limitations, internal control over financial reporting may not prevent or detect misstatements. Also, projections of any evaluation of effectiveness to future periods are subject to the risk that controls may become inadequate because of changes in conditions or that the degree of compliance with the policies or procedures may deteriorate.
In our opinion, Agnico-Eagle Mines Limited maintained, in all material respects, effective internal control over financial reporting as of December 31, 2012 based on the COSO criteria.
We have also audited, in accordance with the standards of the Public Company Accounting Oversight Board (United States), the consolidated balance sheets of Agnico-Eagle Mines Limited as of December 31, 2012 and December 31, 2011, and the consolidated statements of income (loss) and comprehensive income (loss), shareholders' equity and cash flows for each of the years in the three-year period ended December 31, 2012, and our report dated March 26, 2013 expressed an unqualified opinion thereon.
| Toronto, Canada March 26, 2013 |
/s/ ERNST & YOUNG LLP Chartered Accountants Licensed Public Accountants |
174 AGNICO-EAGLE MINES LIMITED
Management of Agnico-Eagle Mines Limited (the "Company") is responsible for establishing and maintaining adequate internal control over financial reporting. Internal control over financial reporting is a process designed by, or under the supervision of, the Company's Chief Executive Officer and Chief Financial Officer and effected by the Company's Board, management and other personnel, to provide reasonable assurance regarding the reliability of financial reporting and the preparation of financial statements for external purposes in accordance with generally accepted accounting principles. Because of its inherent limitations, internal control over financial reporting may not prevent or detect misstatements. Also, projections of any evaluation of effectiveness to future periods are subject to the risk that controls may become inadequate because of changes in conditions, or that the degree of compliance with the policies or procedures may deteriorate.
The Company's management, including the Company's Chief Executive Officer and Chief Financial Officer, assessed the effectiveness of the Company's internal control over financial reporting as of December 31, 2012. In making this assessment, the Company's management used the criteria outlined by the Committee of Sponsoring Organizations of the Treadway Commission in Internal Control – Integrated Framework. Based on its assessment, management concluded that, as of December 31, 2012, the Company's internal control over financial reporting was effective.
The effectiveness of the Company's internal control over financial reporting as of December 31, 2012 has been audited by Ernst & Young LLP, an independent registered public accounting firm, as stated in their report which appears herein.
| Toronto, Canada March 26, 2013 |
By: | /s/ SEAN BOYD Sean Boyd Vice Chairman, President and Chief Executive Officer |
|
By: |
/s/ DAVID SMITH David Smith Senior Vice-President, Finance and Chief Financial Officer |
2012 ANNUAL REPORT 175
REPORT OF INDEPENDENT REGISTERED PUBLIC ACCOUNTING FIRM
To the Board and Shareholders of Agnico-Eagle Mines Limited:
We have audited the accompanying consolidated balance sheets of Agnico-Eagle Mines Limited as of December 31, 2012 and December 31, 2011, and the related consolidated statements of income (loss) and comprehensive income (loss), shareholders' equity and cash flows for each of the years in the three-year period ended December 31, 2012. These financial statements are the responsibility of the Company's management. Our responsibility is to express an opinion on these financial statements based on our audits.
We conducted our audits in accordance with the standards of the Public Company Accounting Oversight Board (United States). Those standards require that we plan and perform the audit to obtain reasonable assurance about whether the financial statements are free of material misstatement. An audit includes examining, on a test basis, evidence supporting the amounts and disclosures in the financial statements. An audit also includes assessing the accounting principles used and significant estimates made by management, as well as evaluating the overall financial statement presentation. We believe that our audits provide a reasonable basis for our opinion.
In our opinion, the consolidated financial statements referred to above present fairly, in all material respects, the consolidated financial position of Agnico-Eagle Mines Limited at December 31, 2012 and December 31, 2011 and the consolidated results of its operations and its cash flows for each of the years in the three-year period ended December 31, 2012 in conformity with United States generally accepted accounting principles.
We have also audited, in accordance with the standards of the Public Company Accounting Oversight Board (United States), Agnico-Eagle Mines Limited's internal control over financial reporting as of December 31, 2012, based on criteria established in Internal Control – Integrated Framework issued by the Committee of Sponsoring Organizations of the Treadway Commission and our report dated March 26, 2013 expressed an unqualified opinion thereon.
| Toronto, Canada March 26, 2013 |
/s/ ERNST & YOUNG LLP Chartered Accountants Licensed Public Accountants |
176 AGNICO-EAGLE MINES LIMITED
SUMMARY OF SIGNIFICANT ACCOUNTING POLICIES
These consolidated financial statements of Agnico-Eagle Mines Limited ("Agnico-Eagle" or the "Company") are expressed in thousands of United States dollars ("US dollars", "US$" or "$"), except where noted, and have been prepared in accordance with United States generally accepted accounting principles ("US GAAP"). Certain information in the consolidated financial statements is presented in Canadian dollars ("C$"). As a precise determination of assets and liabilities depends on future events, the preparation of consolidated financial statements for a period necessarily involves the use of estimates and approximations. Actual results may differ from such estimates and approximations. The consolidated financial statements have, in management's opinion, been prepared within reasonable limits of materiality and within the framework of the significant accounting policies referred to below.
Basis of consolidation
These consolidated financial statements include the accounts of the Company and its wholly-owned subsidiaries and entities in which it has a controlling financial interest, after the elimination of intercompany accounts and transactions. The Company has a controlling financial interest if it owns a majority of the outstanding voting common stock or has significant control over an entity through contractual arrangements or economic interests of which the Company is the primary beneficiary.
Cash and cash equivalents
Cash and cash equivalents include cash on hand and short-term investments in money market instruments with remaining maturities of three months or less at the date of purchase. Short-term investments are designated as held to maturity for accounting purposes and are carried at amortized cost, which approximates market value given the short-term nature of these investments. Agnico-Eagle places its cash and cash equivalents and short-term investments in high quality securities issued by government agencies, financial institutions and major corporations and limits the amount of credit exposure by diversifying its holdings.
Inventories
Inventories consist of ore stockpiles, concentrates, dore bars and supplies. Inventory amounts are reduced based on average cost or in the case of supplies, the lower of average cost and replacement cost. The current portion of stockpiles, ore on leach pads and inventories are determined based on the expected amounts to be processed within the next 12 months. Stockpiles, ore on leach pads and inventories not expected to be processed or used within the next 12 months are classified as long term.
Ore Stockpiles
Stockpiles consist of coarse ore that has been mined and hoisted from underground or delivered from an open pit that is available for further processing and in-stope ore inventory in the form of drilled and blasted stopes ready to be mucked and hoisted to the surface. The stockpiles are measured by estimating the tonnage, contained ounces (based on assays) and recovery percentages (based on actual recovery rates for processing similar ore). Specific tonnages are verified and compared to original estimates once the stockpile is milled. Ore stockpiles are valued at the lower of net realizable value and mining costs incurred up to the point of stockpiling the ore. The net realizable value of stockpiled ore is calculated by subtracting the sum of the carrying value plus future processing and selling costs from the expected revenue from the ore, which is based on the estimated tonnage and grade of stockpiled ore.
Mining costs include all costs associated with mining operations and are allocated to each tonne of stockpiled ore. Costs fully absorbed into inventory values include direct and indirect materials and consumables, direct labour, utilities and amortization of mining assets incurred up to the point of stockpiling the ore. Royalty expenses and production taxes are included in production costs, but are not capitalized into inventory. Stockpiles are generally processed within twelve months of extraction, with the exception of certain portions of the Pinos Altos, Kittila and Meadowbank mines' ore stockpiles. Due to the structure of these ore bodies, a significant amount of drilling and blasting is undertaken in the early years of their mine life, which results in a long-term stockpile. The decision to process stockpiled ore is based on a net smelter return analysis. The Company processes its stockpiled ore if its estimated revenue, on a per tonne basis and net of estimated smelting and refining costs, is greater than the related mining and milling costs. The Company has never elected to not process stockpiled ore and does not anticipate departing from this practice in the future. Stockpiled ore on the surface is exposed to the elements, but the Company does not expect its condition to deteriorate significantly as a result.
2012 ANNUAL REPORT 177
Pre-production stripping costs are capitalized until an "other than de minimis" level of mineral is produced, after which time such costs are either capitalized to inventory or expensed. The Company considers various relevant criteria to assess when an "other than de minimis" level of mineral is produced. The criteria considered include: (1) the number of ounces mined compared to total ounces in mineral reserves; (2) the quantity of ore mined compared to the total quantity of ore expected to be mined over the life of the mine; (3) the current stripping ratio compared to the expected stripping ratio over the life of the mine; and (4) the ore grade compared to the expected ore grade over the life of the mine.
Concentrates and dore bars
Concentrates and dore bar inventories consist of concentrates and dore bars for which legal title has not yet passed to third-party smelters. Concentrates and dore bar inventories are measured based on assays of the processed concentrates and are valued based on the lower of net realizable value and the fully absorbed mining and milling costs associated with extracting and processing the ore.
Supplies
Supplies, consisting of mine stores inventory, are valued at the lower of average cost and replacement cost.
Mining properties, plant and equipment and mine development costs
Significant payments related to the acquisition of land and mineral rights are capitalized as mining properties at cost. If a mineable ore body is discovered, such costs are amortized to income when production begins, using the unit-of-production method, based on estimated proven and probable reserves. If no mineable ore body is discovered, such costs are expensed in the period in which it is determined that the property has no future economic value.
Expenditures for new facilities and improvements that can extend the useful lives of existing facilities are capitalized as plant and equipment at cost. Interest costs incurred for the construction of significant projects are capitalized.
Mine development costs incurred after the commencement of production are capitalized or deferred to the extent that these costs benefit the mining of the entire ore body. Costs incurred to access single ore blocks are expensed as incurred; otherwise, such vertical and horizontal development is classified as mine development costs.
Agnico-Eagle records amortization on both plant and equipment and mine development costs used in commercial production on a unit-of-production basis based on the estimated tonnage of proven and probable mineral reserves of the mine. The unit-of-production method defines the denominator as the total proven and probable tonnes of reserves.
Repairs and maintenance expenditures are charged to income as production costs. Assets under construction are not depreciated until the end of the construction period. Upon achieving commercial production, the capitalized construction costs are transferred to the appropriate category of plant and equipment.
Mineral exploration costs are charged to income in the year in which they are incurred. When it is determined that a mining property can be economically developed as a result of established proven and probable reserves, the costs of drilling and development to further delineate the ore body on such property are capitalized. The establishment of proven and probable reserves is based on results of final feasibility studies, that indicate whether a property is economically feasible. Upon commencement of the commercial production of a development project, these costs are transferred to the appropriate asset category and are amortized to income using the unit-of-production method described above. Mine development costs, net of salvage values, relating to a property that is abandoned or considered uneconomic for the foreseeable future are written off.
The carrying values of mining properties, plant and equipment and mine development costs are periodically reviewed for possible impairment, when impairment factors exist, based on the future undiscounted net cash flows of the operating mine or development property. If it is determined that the estimated net recoverable amount is less than the carrying value, then a write down to the estimated fair value amount is made with a charge to income. Estimated future cash flows of an operating mine and development properties include estimates of recoverable ounces of gold based on proven and probable mineral reserves. To the extent that economic value exists beyond the proven and probable mineral reserves of an operating mine or development property, this value is included as part of the estimated future cash flows. Estimated future cash flows also involve estimates regarding metal prices (considering current and historical prices, price trends and related factors), production levels, capital and reclamation costs, and related income and mining taxes, all based on detailed life-of-mine plans. Cash flows are subject to risks and uncertainties and changes in the estimates of the cash flows may affect the recoverability of long-lived assets.
178 AGNICO-EAGLE MINES LIMITED
Goodwill
Business combinations are accounted for using the purchase method whereby assets acquired and liabilities assumed are recorded at their fair values as of the date of acquisition and any excess of the purchase price over such fair values is recorded as goodwill. Goodwill is not amortized.
The Company performs goodwill impairment tests on an annual basis as well as when events and circumstances indicate that the carrying amounts may no longer be recoverable. In performing the impairment tests, the Company estimates the fair values of its reporting units that include goodwill and compares those fair values to the reporting units' carrying amounts. If a reporting unit's carrying amount exceeds its fair value, the Company compares the implied fair value of the reporting unit's goodwill to the carrying amount and any excess of the carrying amount of goodwill over the implied fair value is charged to income.
Financial instruments
Agnico-Eagle uses derivative financial instruments, primarily option and forward contracts, to manage exposure to fluctuations in byproduct metal prices, interest rates and foreign currency exchange rates and may use such means to manage exposure to certain input costs. Agnico-Eagle does not hold financial instruments or derivative financial instruments for trading purposes.
The Company recognizes all derivative financial instruments in the consolidated financial statements at fair value regardless of the purpose or intent for holding the instrument. Changes in the fair value of derivative financial instruments are either recognized periodically in the consolidated statements of income (loss) and comprehensive income (loss) or in shareholders' equity as a component of accumulated other comprehensive loss, depending on the nature of the derivative financial instrument and whether it qualifies for hedge accounting. Financial instruments designated as hedges are tested for effectiveness on a quarterly basis. Gains and losses on those contracts that are proven to be effective are reported as a component of the related transaction.
Revenue recognition
Revenue is recognized when the following conditions are met:
- (a)
- persuasive
evidence of an arrangement to purchase exists;
- (b)
- the
price is determinable;
- (c)
- the
product has been delivered; and
- (d)
- collection of the sales price is reasonably assured.
Revenue from gold and silver in the form of dore bars is recorded when the refined gold or silver is sold and delivered to the customer. Generally, all the gold and silver in the form of dore bars recovered in the Company's milling process is sold in the period in which it is produced.
Under the terms of the Company's concentrate sales contracts with third-party smelters, final prices for the metals contained in the concentrate are determined based on the prevailing spot market metal prices on a specified future date, which is based on the date that the concentrate is delivered to the smelter. The Company records revenues under these contracts based on forward prices at the time of delivery, which is when transfer of legal title to concentrate passes to the third-party smelters. The terms of the contracts result in differences between the recorded estimated price at delivery and the final settlement price. These differences are adjusted through revenue at each subsequent financial statement date.
Revenues from mining operations consist of gold revenues, net of smelting, refining, transportation and other marketing charges. Revenues from byproduct metals sales are shown, net of smelter charges, as part of revenues from mining operations.
Foreign currency translation
The functional currency for each of the Company's operations is the US dollar. Monetary assets and liabilities of Agnico-Eagle's operations denominated in a currency other than the US dollar are translated into US dollars using the exchange rate in effect at period end. Non-monetary assets and liabilities are translated at historical exchange rates, while revenues and expenses are translated at the average exchange rate during the period, with the exception of amortization, which is translated at historical exchange rates. Exchange gains and losses are included in income, except for gains and losses on
2012 ANNUAL REPORT 179
foreign currency contracts used to hedge specific future commitments in foreign currencies. Gains and losses on these contracts are accounted for as a component of the related hedge transactions.
Reclamation costs
On an annual basis, the Company assesses cost estimates and other assumptions used in the valuation of asset retirement obligations ("AROs") at each of its mineral properties to reflect events, changes in circumstances and new information available. Changes in these cost estimates and assumptions have a corresponding impact on the fair value of the AROs. For closed mines, any change in the fair value of AROs results in a corresponding charge or credit to income, whereas at operating mines the charge is recorded as an adjustment to the carrying amount of the corresponding asset.
AROs arise from the acquisition, development, construction and operation of mining properties and plant and equipment due to government controls and regulations that protect the environment on the closure and reclamation of mining properties. The major parts of the carrying amount of AROs relate to: tailings and heap leach pad closure and rehabilitation; demolition of buildings and mine facilities; ongoing water treatment; and ongoing care and maintenance of closed mines. The fair values of AROs are measured by discounting the expected cash flows using a discount factor that reflects the credit-adjusted risk-free rate of interest. The Company prepares estimates of the timing and amount of expected cash flows when an ARO is incurred. Expected cash flows are updated to reflect changes in facts and circumstances. The principal factors that can cause expected cash flows to change are: the construction of new processing facilities; changes in the quantities of material in reserves and a corresponding change in the life of mine plan; changing ore characteristics that impact required environmental protection measures and related costs; changes in water quality that impact the extent of water treatment required; and changes in laws and regulations governing the protection of the environment. When expected cash flows increase, the revised cash flows are discounted using a current discount factor, whereas when expected cash flows decrease, the reduced cash flows are discounted using the historical discount factor used in the original estimation of the expected cash flows. In either case, any change in the fair value of the ARO is recorded. Agnico-Eagle records the fair value of an ARO when it is incurred. AROs are adjusted to reflect the passage of time (accretion), which is calculated by applying the discount factor implicit in the initial fair value measurement to the beginning of period carrying amount of the AROs. For producing mines, accretion expense is recorded in the cost of goods sold each period. Upon settlement of an ARO, Agnico-Eagle records a gain or loss if the actual cost differs from the carrying amount of the ARO. Settlement gains/losses are recorded in income.
Environmental remediation liabilities ("ERLs") are differentiated from AROs in that they do not arise from environmental contamination in the normal operation of a long-lived asset or from a legal obligation to treat environmental contamination resulting from the acquisition, construction or development of a long-lived asset. The Company is required to recognize a liability for obligations associated with ERLs arising from past acts. ERL fair value is measured by discounting the expected related cash flows using a discount factor that reflects the credit-adjusted risk-free rate of interest. The Company prepares estimates of the timing and amount of expected cash flows when an ERL is incurred. On an annual basis, the Company assesses cost estimates and other assumptions used in the valuation of ERLs to reflect events, changes in circumstances and new information available. Changes in these cost estimates and assumptions have a corresponding impact on the fair value of the ERL. Any change in the fair value of ERLs results in a corresponding charge or credit to income. Upon settlement of an ERL, Agnico-Eagle records a gain or loss if the actual cost differs from the carrying amount of the ARO. Settlement gains/losses are recorded in income.
Other environmental remediation costs that are not AROs or ERLs as defined by the Financial Accounting Standards Board ("FASB") Accounting Standards Codification ("ASC") 410-20 – Asset Retirement Obligations and 410-30 – Environmental Obligations, respectively, are expensed as incurred.
Income and mining taxes
Agnico-Eagle follows the liability method of tax allocation in accounting for income taxes. Under this method of tax allocation, deferred income and mining tax bases of assets and liabilities are measured using the enacted tax rates and laws expected to be in effect when the differences are expected to reverse.
The Company's operations require dealing with uncertainties and judgments in the application of complex tax regulations in multiple jurisdictions. The final taxes paid are dependent upon many factors, including negotiations with taxation authorities in various jurisdictions and resolution of disputes arising from federal, provincial, state and international tax audits. The Company recognizes the effect of uncertain tax positions and records tax liabilities for anticipated tax audit issues in Canada and other tax jurisdictions where it is more likely than not based on technical merits that the position
180 AGNICO-EAGLE MINES LIMITED
would not be sustained. The Company recognizes the amount of any tax benefits that have a greater than 50 percent likelihood of being ultimately realized upon settlement.
Changes in judgment related to the expected ultimate resolution of uncertain tax positions are recognized in the year of such changes. Accrued interest and penalties related to unrecognized tax benefits are recorded in income tax expense when incurred. The Company adjusts these reserves in light of changing facts and circumstances; however, due to the complexity of some of these uncertainties, the ultimate resolution may result in a payment that is materially different from the Company's current estimate of the tax liabilities. If the Company's estimate of tax liabilities proves to be less than the ultimate assessment, an additional charge to expenses would result. If the estimate of tax liabilities proves to be greater than the ultimate assessment, a tax benefit would result.
Stock-based compensation
The Company's Employee Stock Option Plan provides for the granting of options to directors, officers, employees and service providers to purchase common shares. Options have exercise prices equal to the market price on the day prior to the date of grant. The fair value of these options is recognized in the consolidated statements of income (loss) and comprehensive income (loss) or in the consolidated balance sheets if capitalized as part of property, plant and mine development over the applicable vesting period as a compensation cost. Any consideration paid by employees on exercise of options or purchase of common shares is credited to share capital.
Fair value is determined using the Black-Scholes option valuation model which requires the Company to estimate the expected volatility of the Company's share price and the expected life of the stock options. Limitations with existing option valuation models and the inherent difficulties associated with estimating these variables create difficulties in determining a reliable single measure of the fair value of stock option grants. The dilutive impact of stock option grants is factored into the Company's reported diluted net income (loss) per share.
Net income (loss) per share
Basic net income (loss) per share is calculated on net income (loss) for the year using the weighted average number of common shares outstanding during the year. The weighted average number of common shares used to determine diluted net income (loss) per share includes an adjustment, using the treasury stock method, for stock options outstanding and warrants outstanding. Under the treasury stock method:
- •
- the
exercise of options or warrants is assumed to occur at the beginning of the period (or date of issuance, if later);
- •
- the
proceeds from the exercise of options or warrants, plus, in the case of options, the future period compensation expense on options granted on or after January 1,
2003, are assumed to be used to purchase common shares at the average market price during the period; and
- •
- the incremental number of common shares is (the difference between the number of shares assumed issued and the number of shares assumed purchased) is included in the denominator of the diluted net income (loss) per share calculation.
Pension costs and obligations and post-retirement benefits
In Canada, Agnico-Eagle maintains a defined contribution plan covering all of its employees (the "Basic Plan"). The Basic Plan is funded by Company contributions based on a percentage of income for services rendered by employees. In addition, the Company has a supplemental plan for designated executives at the level of Vice-President or above (the "Supplemental Plan"). Under the Supplemental Plan, an additional 10% of the designated executives' income is contributed by the Company. The Company does not offer any other post-retirement benefits to its employees.
Agnico-Eagle also provides a non-registered supplementary executive retirement defined benefit plan for certain senior officers (the "Executives Plan"). The Executives Plan benefits are generally based on the employee's years of service and level of compensation. Pension expense related to the Executives Plan is the net of the cost of benefits provided, the interest cost of projected benefits, return on plan assets and amortization of experience gains and losses. Pension fund assets are measured at current fair values. Actuarially determined plan surpluses or deficits, experience gains or losses and the cost of pension plan improvements are amortized on a straight-line basis over the expected average remaining service life of the employee group.
2012 ANNUAL REPORT 181
Commercial production
The Company assesses each mine construction project to determine when a mine moves into the production stage. The criteria used to assess the start date are determined based on the nature of each mine construction project, such as the complexity of a plant and its location. The Company considers various relevant criteria to assess when the mine is substantially complete and ready for its intended use and moved into the production stage. The criteria considered include: (1) the completion of a reasonable period of testing of mine plant and equipment; (2) the ability to produce minerals in saleable form (within specifications); and (3) the ability to sustain ongoing production of minerals. When a mine construction project moves into the production stage, the capitalization of certain mine construction costs ceases and costs are either capitalized to inventories or expensed, except for sustaining capital costs related to mining properties, plant and equipment or mine development.
Other accounting developments
Recently adopted accounting pronouncements
Fair Value Accounting
In May 2011, ASC guidance was issued related to disclosure around fair value accounting. The updated guidance clarifies different components of fair value accounting, including the application of the highest and best use and valuation premise concepts, measuring the fair value of an instrument classified under shareholders' equity and disclosing quantitative information about the unobservable inputs used in fair value measurements that are categorized in Level 3 of the fair value hierarchy. Adoption of this updated guidance, effective for Agnico-Eagle's fiscal year beginning January 1, 2012, had no impact on the Company's consolidated financial statements.
Comprehensive Income
In June 2011, ASC guidance was issued related to comprehensive income. Under the updated guidance, entities have the option to present total comprehensive income either in a single continuous statement of comprehensive income or in two separate but consecutive statements. In addition, the update requires certain disclosure when reporting other comprehensive income. The update does not change the items reported in other comprehensive income or when an item of other comprehensive income must be reclassified to income. In December 2011, updated guidance was issued to defer the effective date pertaining to reclassification adjustments out of accumulated other comprehensive income until the FASB is able to reconsider those paragraphs. The portion of the updated guidance effective for Agnico-Eagle's fiscal year beginning January 1, 2012 had no impact on the Company's consolidated financial statements.
Goodwill Impairment
In September 2011, ASC guidance was issued related to testing goodwill for impairment. Under the updated guidance, entities are permitted to first assess qualitative factors to determine whether it is more likely than not that the fair value of a reporting unit is less than its carrying amount as a basis for determining whether it is necessary to perform the two-step goodwill impairment test per ASC 350 – Intangibles – Goodwill and Other. Previous guidance required an entity to test goodwill for impairment, on at least an annual basis, by comparing the fair value of a reporting unit with its carrying amount, including goodwill. If the fair value of a reporting unit was less than its carrying amount, then the second step of the test would be performed to measure the amount of the impairment loss, if any. An entity is no longer required to calculate the fair value of a reporting unit unless the entity determines that it is more likely than not that its fair value is less than its carrying amount. Adoption of this updated guidance, effective for Agnico-Eagle's fiscal year beginning January 1, 2012, had no impact on the Company's consolidated financial statements.
Recently issued accounting pronouncements and developments
Under Securities and Exchange Commission ("SEC") Staff Accounting Bulletin 74, the Company is required to disclose information related to new accounting standards that have not yet been adopted. Agnico-Eagle is currently evaluating the impact that the adoption of these standards will have on the Company's consolidated financial statements.
Disclosure about Offsetting Assets and Liabilities
In November 2011, ASC guidance was issued relating to disclosure on offsetting financial instrument and derivative financial instrument assets and liabilities. Under the updated guidance, entities are required to disclose gross information and net information about both instruments and transactions eligible for offset in the consolidated balance sheets and
182 AGNICO-EAGLE MINES LIMITED
instruments and transactions subject to an agreement similar to a master netting arrangement. The update is effective for the Company's fiscal year beginning on January 1, 2013. Agnico-Eagle is evaluating the potential impact of the adoption of this guidance on the Company's consolidated financial statements.
Disclosure of Payments by Resource Extraction Issuers
In August 2012, the SEC adopted new rules requiring resource extraction issuers to include in an annual report information relating to any payment, whether a single payment or a series of related payments, that equals or exceeds $100,000 during the most recent fiscal year, made by the issuer, a subsidiary of the issuer or an entity under the control of the issuer, to the United States federal government or a foreign government for the purpose of the commercial development of oil, natural gas, or minerals. Resource extraction issuers will be required to provide information about the type and total amount of such payments made for each project related to the commercial development of oil, natural gas, or minerals, and the type and total amount of payments made to each government. A resource extraction issuer must comply with the new rules and form for fiscal years ending after September 30, 2013, but may provide a partial year report if the issuer's fiscal year began before September 30, 2013. The Company is evaluating the potential impact of complying with these new rules in its 2013 annual disclosure.
Reporting of Amounts Reclassified Out of Accumulated Other Comprehensive Income
In February 2013, ASC guidance was issued relating to the reporting of amounts reclassified out of accumulated other comprehensive income. Under the updated guidance, entities are required to provide information about the amounts reclassified out of accumulated other comprehensive income by component and by consolidated statement of income (loss) line item, as required under US GAAP. The update is effective for the Company's fiscal year beginning on January 1, 2013. Agnico-Eagle is evaluating the potential impact of the adoption of this guidance on the Company's consolidated financial statements.
International Financial Reporting Standards
Based on recent guidance from the Canadian Securities Administrators and the SEC, as a Canadian issuer and existing US GAAP filer, the Company will continue to be permitted to use US GAAP as its principal basis of accounting. The SEC has not yet committed to a timeline which would require the Company to adopt International Financial Reporting Standards ("IFRS"). A decision to voluntarily adopt IFRS has not been made by the Company.
Comparative figures
Certain figures in the comparative consolidated financial statements have been reclassified from statements previously presented to conform to the presentation of the 2012 consolidated financial statements.
2012 ANNUAL REPORT 183
AGNICO-EAGLE MINES LIMITED
CONSOLIDATED BALANCE SHEETS
(thousands of United States dollars, US GAAP basis)
| As at December 31, | |||||||||
| 2012 | 2011 | ||||||||
| ASSETS | |||||||||
| Current | |||||||||
| Cash and cash equivalents | $ | 298,068 | $ | 179,447 | |||||
| Short-term investments | 8,490 | 6,570 | |||||||
| Restricted cash (note 14) | 25,450 | 35,441 | |||||||
| Trade receivables (note 1) | 67,750 | 75,899 | |||||||
| Inventories: | |||||||||
| Ore stockpiles | 52,342 | 28,155 | |||||||
| Concentrates and dore bars | 69,695 | 57,528 | |||||||
| Supplies | 222,630 | 182,389 | |||||||
| Income taxes recoverable (note 9) | 19,313 | 371 | |||||||
| Available-for-sale securities (note 2(b)) | 44,719 | 145,411 | |||||||
| Fair value of derivative financial instruments (note 15) | 1,835 | – | |||||||
| Other current assets (note 2(a)) | 92,977 | 110,369 | |||||||
| Total current assets | 903,269 | 821,580 | |||||||
| Other assets (note 2(c)) | 55,838 | 88,048 | |||||||
| Goodwill (note 10) | 229,279 | 229,279 | |||||||
| Property, plant and mine development (note 3) | 4,067,456 | 3,895,355 | |||||||
| $ | 5,255,842 | $ | 5,034,262 | ||||||
184 AGNICO-EAGLE MINES LIMITED
AGNICO-EAGLE MINES LIMITED
CONSOLIDATED BALANCE SHEETS (Continued)
(thousands of United States dollars, US GAAP basis)
| As at December 31, | |||||||||
| 2012 | 2011 | ||||||||
| LIABILITIES AND SHAREHOLDERS' EQUITY | |||||||||
| Current | |||||||||
| Accounts payable and accrued liabilities (note 11) | $ | 185,329 | $ | 203,547 | |||||
| Reclamation provision (note 6(a)) | 16,816 | 26,069 | |||||||
| Dividends payable | 37,905 | – | |||||||
| Interest payable (note 5) | 13,602 | 9,356 | |||||||
| Income taxes payable (note 9) | 10,061 | – | |||||||
| Capital lease obligations (note 13(a)) | 12,955 | 11,068 | |||||||
| Fair value of derivative financial instruments (note 15) | – | 4,404 | |||||||
| Total current liabilities | 276,668 | 254,444 | |||||||
| Long-term debt (note 5) | 830,000 | 920,095 | |||||||
| Reclamation provision and other liabilities (note 6) | 127,735 | 145,988 | |||||||
| Deferred income and mining tax liabilities (note 9) | 611,227 | 498,572 | |||||||
| SHAREHOLDERS' EQUITY | |||||||||
| Common shares (notes 7(a), 7(b) and 7(c)): | |||||||||
| Outstanding – 172,296,610 common shares issued, less 193,740 shares held in trust | 3,241,922 | 3,181,381 | |||||||
| Stock options (note 8(a)) | 148,032 | 117,694 | |||||||
| Warrants (note 7(b)) | 24,858 | 24,858 | |||||||
| Contributed surplus | 15,665 | 15,166 | |||||||
| Retained earnings (deficit) | 7,046 | (129,021 | ) | ||||||
| Accumulated other comprehensive loss (note 7(d)) | (27,311 | ) | (7,106 | ) | |||||
| 3,410,212 | 3,202,972 | ||||||||
| Non-controlling interest | – | 12,191 | |||||||
| Total shareholders' equity | 3,410,212 | 3,215,163 | |||||||
| $ | 5,255,842 | $ | 5,034,262 | ||||||
| Contingencies and commitments (notes 6, 9, 12, 13(b) and 21) | |||||||||
On behalf of the Board:

|

|
|
Sean Boyd CPA, CA, Director |
Mel Leiderman CPA, CA, Director |
See accompanying notes
2012 ANNUAL REPORT 185
AGNICO-EAGLE MINES LIMITED
CONSOLIDATED STATEMENTS OF INCOME (LOSS) AND COMPREHENSIVE INCOME (LOSS)
(thousands of United States dollars, except per share amounts, US GAAP basis)
| Years Ended December 31, | |||||||||||
| 2012 | 2011 | 2010 | |||||||||
| REVENUES | |||||||||||
| Revenues from mining operations (note 1) | $ | 1,917,714 | $ | 1,821,799 | $ | 1,422,521 | |||||
| COSTS, EXPENSES AND OTHER INCOME | |||||||||||
| Production (exclusive of amortization shown seperately below) | 897,712 | 876,078 | 677,472 | ||||||||
| Exploration and corporate development | 109,500 | 75,721 | 54,958 | ||||||||
| Amortization of property, plant and mine development (note 3) | 271,861 | 261,781 | 192,486 | ||||||||
| General and administrative (note 16) | 119,085 | 107,926 | 94,327 | ||||||||
| Impairment loss on available-for-sale securities (note 2(b)) | 12,732 | 8,569 | – | ||||||||
| Provincial capital tax | 4,001 | 9,223 | (6,075 | ) | |||||||
| Interest expense (note 5) | 57,887 | 55,039 | 49,493 | ||||||||
| Interest and sundry expense (income) | 2,389 | 5,188 | (10,254 | ) | |||||||
| Loss (gain) on derivative financial instruments (note 15) | 819 | (3,683 | ) | (7,612 | ) | ||||||
| Gain on sale of available-for-sale securities (note 2(b)) | (9,733 | ) | (4,907 | ) | (19,487 | ) | |||||
| Impairment loss on Meadowbank mine (note 18) | – | 907,681 | – | ||||||||
| Loss on Goldex mine (note 17) | – | 302,893 | – | ||||||||
| Gain on acquisition of Comaplex Minerals Corp., net of transaction costs (note 10) | – | – | (57,526 | ) | |||||||
| Foreign currency translation loss (gain) | 16,320 | (1,082 | ) | 19,536 | |||||||
| Income (loss) before income and mining taxes | 435,141 | (778,628 | ) | 435,203 | |||||||
| Income and mining taxes (note 9) | 124,225 | (209,673 | ) | 103,087 | |||||||
| Net income (loss) for the year | $ | 310,916 | $ | (568,955 | ) | $ | 332,116 | ||||
| Attributed to non-controlling interest | $ | – | $ | (60 | ) | $ | – | ||||
| Attributed to common shareholders | $ | 310,916 | $ | (568,895 | ) | $ | 332,116 | ||||
| Net income (loss) per share – basic (note 7(e)) | $ | 1.82 | $ | (3.36 | ) | $ | 2.05 | ||||
| Net income (loss) per share – diluted (note 7(e)) | $ | 1.81 | $ | (3.36 | ) | $ | 2.00 | ||||
| Cash dividends declared per common share (note 7(a)) | $ | 1.02 | $ | – | $ | 0.64 | |||||
186 AGNICO-EAGLE MINES LIMITED
AGNICO-EAGLE MINES LIMITED
CONSOLIDATED STATEMENTS OF INCOME (LOSS) AND COMPREHENSIVE INCOME (LOSS) (Continued)
(thousands of United States dollars, except per share amounts, US GAAP basis)
| Years Ended December 31, | ||||||||||||
| 2012 | 2011 | 2010 | ||||||||||
| COMPREHENSIVE INCOME (LOSS) | ||||||||||||
| Net income (loss) for the year | $ | 310,916 | $ | (568,955 | ) | $ | 332,116 | |||||
| Other comprehensive income (loss): | ||||||||||||
| Unrealized gain (loss) on derivative financial instrument activities (note 15) | 6,902 | (5,863 | ) | – | ||||||||
| Adjustments for derivative financial instruments settled during the year (note 15) | (2,758 | ) | 1,459 | – | ||||||||
| Unrealized (loss) gain on available-for-sale securities (note 2(b)) | (27,004 | ) | (26,874 | ) | 64,649 | |||||||
| Adjustments for realized loss (gain) on available-for-sale securities due to dispositions and impairments during the year (note 2(b)) | 2,999 | (4,907 | ) | (19,487 | ) | |||||||
| Net amount reclassified to net income on acquisition of business (note 10) | – | – | (64,508 | ) | ||||||||
| Change in unrealized gain (loss) on pension benefits liability (note 6(b)) | 1,148 | (1,055 | ) | (4,093 | ) | |||||||
| Tax effect of other comprehensive (loss) income items | (1,492 | ) | 1,744 | 780 | ||||||||
| Other comprehensive loss for the year | (20,205 | ) | (35,496 | ) | (22,659 | ) | ||||||
| Comprehensive income (loss) for the year | $ | 290,711 | $ | (604,451 | ) | $ | 309,457 | |||||
| Attributed to non-controlling interest | $ | – | $ | (60 | ) | $ | – | |||||
| Attributed to common shareholders | $ | 290,711 | $ | (604,391 | ) | $ | 309,457 | |||||
See accompanying notes
2012 ANNUAL REPORT 187
AGNICO-EAGLE MINES LIMITED
CONSOLIDATED STATEMENTS OF SHAREHOLDERS' EQUITY
(thousands of United States dollars, US GAAP basis)
| Common Shares Outstanding |
|||||||||||||||||||||||||
| Shares | Amount | Stock Options | Warrants | Contributed Surplus |
Retained Earnings (Deficit) |
Accumulated Other Comprehensive Income (Loss) |
Non- Controlling Interest |
||||||||||||||||||
| Balance December 31, 2009 | 156,625,174 | $ | 2,378,759 | $ | 65,771 | $ | 24,858 | $ | 15,166 | $ | 216,158 | $ | 51,049 | $ | – | ||||||||||
| Shares issued under employee stock option plan (note 8(a)) | 1,627,766 | 104,111 | (29,447 | ) | – | – | – | – | – | ||||||||||||||||
| Stock options | – | – | 42,230 | – | – | – | – | – | |||||||||||||||||
| Shares issued under the incentive share purchase plan (note 8(b)) | 229,583 | 14,963 | – | – | – | – | – | – | |||||||||||||||||
| Shares issued under the Company's dividend reinvestment plan | 25,243 | 1,404 | – | – | – | – | – | – | |||||||||||||||||
| Shares issued for purchase of mining property (notes 7(b) and 7(c)) | 10,225,848 | 579,800 | – | – | – | – | – | – | |||||||||||||||||
| Net income for the year | – | – | – | – | – | 332,116 | – | – | |||||||||||||||||
| Dividends declared ($0.64 per share) (note 7(a)) | – | – | – | – | – | (108,009 | ) | – | – | ||||||||||||||||
| Other comprehensive loss for the year | – | – | – | – | – | – | (22,659 | ) | – | ||||||||||||||||
| Restricted share unit plan (note 8(c)) | (13,259 | ) | (820 | ) | – | – | – | – | – | – | |||||||||||||||
| Balance December 31, 2010 | 168,720,355 | $ | 3,078,217 | $ | 78,554 | $ | 24,858 | $ | 15,166 | $ | 440,265 | $ | 28,390 | $ | – | ||||||||||
| Shares issued under employee stock option plan (note 8(a)) | 308,688 | $ | 18,094 | $ | (4,396 | ) | $ | – | $ | – | $ | – | $ | – | $ | – | |||||||||
| Stock options | – | – | 43,536 | – | – | – | – | – | |||||||||||||||||
| Shares issued under the incentive share purchase plan (note 8(b)) | 360,833 | 19,229 | – | – | – | – | – | – | |||||||||||||||||
| Shares issued under the Company's dividend reinvestment plan | 176,110 | 10,130 | – | – | – | – | – | – | |||||||||||||||||
| Shares issued for purchase of mining property (note 7(c)) | 1,250,477 | 56,146 | – | – | – | – | – | – | |||||||||||||||||
| Non-controlling interest addition upon acquisition | – | – | – | – | – | – | – | 12,251 | |||||||||||||||||
| Net loss for the year attributed to common shareholders | – | – | – | – | – | (568,895 | ) | – | – | ||||||||||||||||
| Net loss for the year attributed to non-controlling interest | – | – | – | – | – | – | – | (60 | ) | ||||||||||||||||
| Dividends declared (nil per share) (note 7(a)) | – | – | – | – | – | (391 | ) | – | – | ||||||||||||||||
| Other comprehensive loss for the year | – | – | – | – | – | – | (35,496 | ) | – | ||||||||||||||||
| Restricted share unit plan (note 8(c)) | (2,727 | ) | (435 | ) | – | – | – | – | – | – | |||||||||||||||
| Balance December 31, 2011 | 170,813,736 | $ | 3,181,381 | $ | 117,694 | $ | 24,858 | $ | 15,166 | $ | (129,021 | ) | $ | (7,106 | ) | $ | 12,191 | ||||||||
188 AGNICO-EAGLE MINES LIMITED
AGNICO-EAGLE MINES LIMITED
CONSOLIDATED STATEMENTS OF SHAREHOLDERS' EQUITY (Continued)
(thousands of United States dollars, US GAAP basis)
| Common Shares Outstanding |
|||||||||||||||||||||||||
| Shares | Amount | Stock Options | Warrants | Contributed Surplus |
Retained Earnings (Deficit) |
Accumulated Other Comprehensive Income (Loss) |
Non- Controlling Interest |
||||||||||||||||||
| Shares issued under employee stock option plan (note 8(a)) | 416,275 | $ | 22,968 | $ | (4,759 | ) | $ | – | $ | – | $ | – | $ | – | $ | – | |||||||||
| Stock options | – | – | 35,097 | – | – | – | – | – | |||||||||||||||||
| Shares issued under the incentive share purchase plan (note 8(b)) | 507,235 | 21,671 | – | – | – | – | – | – | |||||||||||||||||
| Shares issued under the Company's dividend reinvestment plan | 444,555 | 18,907 | – | – | – | – | – | – | |||||||||||||||||
| Shares issued for purchase of mining property (note 7(c)) | 68,941 | 2,447 | – | – | 499 | – | – | – | |||||||||||||||||
| Non-controlling interest eliminated upon acquisition | – | – | – | – | – | – | – | (12,191 | ) | ||||||||||||||||
| Net income for the year | – | – | – | – | – | 310,916 | – | – | |||||||||||||||||
| Dividends declared ($1.02 per share) (note 7(a)) | – | – | – | – | – | (174,849 | ) | – | – | ||||||||||||||||
| Other comprehensive loss for the year | – | – | – | – | – | – | (20,205 | ) | – | ||||||||||||||||
| Restricted share unit plan (note 8(c)) | (147,872 | ) | (5,452 | ) | – | – | – | – | – | – | |||||||||||||||
| Balance December 31, 2012 | 172,102,870 | $ | 3,241,922 | $ | 148,032 | $ | 24,858 | $ | 15,665 | $ | 7,046 | $ | (27,311 | ) | $ | – | |||||||||
See accompanying notes
2012 ANNUAL REPORT 189
AGNICO-EAGLE MINES LIMITED
CONSOLIDATED STATEMENTS OF CASH FLOWS
(thousands of United States dollars, US GAAP basis)
| Years Ended December 31, | ||||||||||||
| 2012 | 2011 | 2010 | ||||||||||
| Operating activities | ||||||||||||
| Net income (loss) for the year | $ | 310,916 | $ | (568,955 | ) | $ | 332,116 | |||||
| Add (deduct) items not affecting cash: | ||||||||||||
| Amortization of property, plant and mine development (note 3) | 271,861 | 261,781 | 192,486 | |||||||||
| Deferred income and mining taxes (note 9) | 72,145 | (275,773 | ) | 66,928 | ||||||||
| Gain on sale of available-for-sale securities (note 2(b)) | (9,733 | ) | (4,907 | ) | (19,487 | ) | ||||||
| Stock-based compensation (note 8) | 47,632 | 51,873 | 45,672 | |||||||||
| Impairment loss on Meadowbank mine (note 18) | – | 907,681 | – | |||||||||
| Loss on Goldex mine (note 17) | – | 302,893 | – | |||||||||
| Gain on acquisition of Comaplex Minerals Corp. (note 10) | – | – | (64,508 | ) | ||||||||
| Foreign currency translation loss (gain) | 16,320 | (1,082 | ) | 19,536 | ||||||||
| Other | 28,780 | 31,561 | 13,015 | |||||||||
| Adjustment for settlement of environmental remediation | (21,449 | ) | (7,616 | ) | – | |||||||
| Changes in non-cash working capital balances: | ||||||||||||
| Trade receivables | 8,149 | 37,050 | (19,378 | ) | ||||||||
| Income taxes | 13,304 | (29,867 | ) | 9,949 | ||||||||
| Inventories | (44,145 | ) | (43,066 | ) | (91,306 | ) | ||||||
| Other current assets | 18,909 | (25,838 | ) | (28,729 | ) | |||||||
| Accounts payable and accrued liabilities | (20,928 | ) | 31,837 | 23,136 | ||||||||
| Interest payable | 4,246 | (387 | ) | 8,077 | ||||||||
| Cash provided by operating activities | 696,007 | 667,185 | 487,507 | |||||||||
Investing activities |
||||||||||||
| Additions to property, plant and mine development (note 3) | (445,550 | ) | (482,831 | ) | (511,641 | ) | ||||||
| Acquisition of Grayd Resource Corporation (note 10) | (9,322 | ) | (163,047 | ) | – | |||||||
| (Increase) decrease in short-term investments | (1,920 | ) | 5 | (3,262 | ) | |||||||
| Net proceeds from available-for-sale securities (note 2(b)) | 73,358 | 9,435 | 36,586 | |||||||||
| Purchase of available-for-sale securities (note 2(b)) | (2,713 | ) | (91,115 | ) | (42,479 | ) | ||||||
| Decrease (increase) in restricted cash (note 14) | 9,991 | (32,931 | ) | (2,510 | ) | |||||||
| Cash used in investing activities | (376,156 | ) | (760,484 | ) | (523,306 | ) | ||||||
190 AGNICO-EAGLE MINES LIMITED
AGNICO-EAGLE MINES LIMITED
CONSOLIDATED STATEMENTS OF CASH FLOWS (Continued)
(thousands of United States dollars, US GAAP basis)
| Years Ended December 31, | |||||||||||
| 2012 | 2011 | 2010 | |||||||||
| Financing activities | |||||||||||
| Dividends paid | $ | (118,121 | ) | $ | (98,354 | ) | $ | (26,830 | ) | ||
| Repayment of capital lease obligations (note 13(a)) | (12,063 | ) | (13,092 | ) | (16,019 | ) | |||||
| Sale-leaseback financing (note 13(a)) | – | – | 14,017 | ||||||||
| Proceeds from long-term debt (note 5) | 315,000 | 475,000 | 711,000 | ||||||||
| Repayment of long-term debt (note 5) | (605,000 | ) | (205,000 | ) | (1,376,000 | ) | |||||
| Notes issuance (note 5) | 200,000 | – | 600,000 | ||||||||
| Long-term debt financing costs (note 5) | (3,133 | ) | (2,545 | ) | (12,772 | ) | |||||
| Repurchase of common shares for restricted share unit plan (note 8(c)) | (12,031 | ) | (3,723 | ) | (4,037 | ) | |||||
| Common shares issued | 32,742 | 26,536 | 84,659 | ||||||||
| Cash (used in) provided by financing activities | (202,606 | ) | 178,822 | (25,982 | ) | ||||||
| Effect of exchange rate changes on cash and cash equivalents | 1,376 | (1,636 | ) | (2,939 | ) | ||||||
| Net increase (decrease) in cash and cash equivalents during the year | 118,621 | 83,887 | (64,720 | ) | |||||||
| Cash and cash equivalents, beginning of year | 179,447 | 95,560 | 160,280 | ||||||||
| Cash and cash equivalents, end of year | $ | 298,068 | $ | 179,447 | $ | 95,560 | |||||
Supplemental cash flow information |
|||||||||||
| Interest paid | $ | 52,213 | $ | 52,833 | $ | 41,429 | |||||
| Income and mining taxes paid | $ | 56,962 | $ | 110,889 | $ | 25,199 | |||||
See accompanying notes
2012 ANNUAL REPORT 191
AGNICO-EAGLE MINES LIMITED
NOTES TO CONSOLIDATED FINANCIAL STATEMENTS
(thousands of United States dollars, except per share amounts, unless otherwise indicated)
December 31, 2012
1. TRADE RECEIVABLES AND REVENUES FROM MINING OPERATIONS
Agnico-Eagle is a gold mining company with mining operations in Canada, Mexico and Finland. The Company earns a significant proportion of its revenues from the production and sale of gold in both dore bar and concentrate form. The remainder of revenue and cash flow is generated by the production and sale of byproduct metals. The revenue from byproduct metals is mainly generated by production at the LaRonde mine in Canada (silver, zinc, copper and lead) and the Pinos Altos mine in Mexico (silver).
Revenues are generated from operations in Canada, Mexico and Finland. The cash flow and profitability of the Company's operations are significantly affected by the market price of gold and, to a lesser extent, silver, zinc, copper and lead. The prices of these metals can fluctuate significantly and are affected by numerous factors beyond the Company's control.
As gold can be sold through numerous gold market traders worldwide, the Company is not economically dependent on a limited number of customers for the sale of its product.
Trade receivables are recognized once the transfer of ownership for the metals sold has occurred and reflect the amounts owing to the Company in respect of its sales of dore bars or concentrates to third parties prior to the satisfaction in full of the payment obligations of the third parties.
| Years Ended December 31, | |||||||
| 2012 | 2011 | 2010 | |||||
| Revenues from mining operations: | |||||||
| Gold | $1,712,665 | $1,563,760 | $1,216,249 | ||||
| Silver | 140,221 | 171,725 | 104,544 | ||||
| Zinc | 45,797 | 70,522 | 77,544 | ||||
| Copper | 19,019 | 14,451 | 22,219 | ||||
| Lead | 12 | 1,341 | 1,965 | ||||
| $1,917,714 | $1,821,799 | $1,422,521 | |||||
In 2012, precious metals (gold and silver) accounted for 97% of Agnico-Eagle's revenues from mining operations (2011 – 95%; 2010 – 93%). The remaining revenues from mining operations consisted of net byproduct metals revenues. In 2012, these net byproduct metals revenues as a percentage of total revenues from mining operations were 2% from zinc (2011 – 4%; 2010 – 5%) and 1% from copper (2011 – 1%; 2010 – 2%).
192 AGNICO-EAGLE MINES LIMITED
2. OTHER ASSETS
(a) Other current assets
| As at December 31, | ||||||
| 2012 | 2011 | |||||
| Federal, provincial and other sales taxes receivable | $36,400 | $ | 51,603 | |||
| Prepaid expenses | 36,119 | 25,540 | ||||
| Meadowbank insurance receivable | 6,553 | 8,765 | ||||
| Prepaid royalty(i) | – | 7,684 | ||||
| Employee loans receivable | 1,800 | 5,567 | ||||
| Retirement compensation arrangement plan refundable tax receivable | 4,044 | – | ||||
| Other | 8,061 | 11,210 | ||||
| $92,977 | $ | 110,369 | ||||
- (i)
- The prepaid royalty relates to the Pinos Altos mine in Mexico.
Note:
(b) Available-for-sale securities
In 2012, the Company received proceeds of $73.4 million (2011 – $9.4 million; 2010 – $36.6 million) and recognized a gain before income taxes of $9.7 million (2011 – $4.9 million; 2010 – $19.5 million) on the sale of certain available-for-sale securities.
Available-for-sale securities consist of equity securities whose cost basis is determined using the average cost method. Available-for-sale securities are carried at fair value and comprise the following:
| As at December 31, | ||||||
| 2012 | 2011 | |||||
| Available-for-sale securities in an unrealized gain position: | ||||||
| Cost (net of impairments) | $ 4,352 | $127,344 | ||||
| Unrealized gains in accumulated other comprehensive loss | 1,902 | 16,408 | ||||
| Estimated fair value | 6,254 | 143,752 | ||||
| Available-for-sale securities in an unrealized loss position: | ||||||
| Cost (net of impairments) | 48,047 | 1,717 | ||||
| Unrealized losses in accumulated other comprehensive loss | (9,582 | ) | (58 | ) | ||
| Estimated fair value | 38,465 | 1,659 | ||||
| Total estimated fair value of available-for-sale securities | $44,719 | $145,411 | ||||
2012 ANNUAL REPORT 193
The Company's investments in available-for-sale securities consist primarily of investments in common shares of entities in the mining industry. During the course of the year, certain available-for-sale securities fell into an unrealized loss position. In each case, the Company evaluated the near-term prospects of the issuers in relation to the severity and duration of the impairment. During the year ended December 31, 2012, the Company recorded a $12.7 million (2011 – $8.6 million) impairment loss on certain available-for-sale securities that were determined to be other-than-temporarily impaired.
At December 31, 2012, the fair value of available-for-sale securities in an unrealized loss position was $38.5 million (2011 – $1.7 million) with total unrealized losses in accumulated other comprehensive loss of $9.6 million (2011 – $0.1 million). Based on an evaluation of the severity and duration of the impairment of these available-for-sale securities (less than three months) and on the Company's intent to hold them for a period of time sufficient for a recovery of fair value, the Company does not consider these available-for-sale securities to be other-than-temporarily impaired as at December 31, 2012.
(c) Other assets
| As at December 31, | |||||
| 2012 | 2011 | ||||
| Deferred financing costs, less accumulated amortization of $8,888 (2011 – $5,809) | $15,836 | $15,777 | |||
| Long-term ore in stockpile(i) | 32,711 | 64,392 | |||
| Other | 7,291 | 7,879 | |||
| $55,838 | $88,048 | ||||
- (i)
- Due to the ore body structures at the Pinos Altos, Kittila and Meadowbank mines, a significant amount of drilling and blasting was undertaken early in their mine lives, resulting in long-term ore stockpiles. At December 31, 2012, long-term ore stockpiles were valued at $14.8 million (2011 – $7.1 million) at the Pinos Altos mine (including the Creston Mascota deposit at Pinos Altos), $7.7 million (2011 – $8.0 million) at the Kittila mine and $10.2 million (2011 – $49.3 million) at the Meadowbank mine.
Note:
194 AGNICO-EAGLE MINES LIMITED
3. PROPERTY, PLANT AND MINE DEVELOPMENT
| As at December 31, 2012 | As at December 31, 2011 | ||||||||||||
| Cost | Accumulated Amortization |
Net Book Value |
Cost | Accumulated Amortization |
Net Book Value |
||||||||
| Mining properties | $1,356,227 | $ 86,839 | $1,269,388 | $1,228,523 | $111,567 | $1,116,956 | |||||||
| Plant and equipment | 2,538,328 | 617,826 | 1,920,502 | 2,467,300 | 437,706 | 2,029,594 | |||||||
| Mine development costs | 918,482 | 237,967 | 680,515 | 869,746 | 190,399 | 679,347 | |||||||
| Construction in progress: | |||||||||||||
| Meliadine project | 133,840 | – | 133,840 | 69,458 | – | 69,458 | |||||||
| La India project | 32,553 | – | 32,553 | – | – | – | |||||||
| Goldex mine M and E Zones | 30,658 | – | 30,658 | – | – | – | |||||||
| $5,010,088 | $942,632 | $4,067,456 | $4,635,027 | $739,672 | $3,895,355 | ||||||||
Geographic Information:
| As at December 31, | |||||
| 2012 | 2011 | ||||
| Canada | $2,543,171 | $2,433,527 | |||
| Latin America | 809,556 | 776,892 | |||
| Europe | 704,031 | 674,258 | |||
| United States | 10,698 | 10,678 | |||
| Total | $4,067,456 | $3,895,355 | |||
In 2012, Agnico-Eagle capitalized $1.3 million of costs (2011 – $1.4 million) and recognized $1.2 million of amortization expense (2011 – $0.9 million) related to computer software. The unamortized capitalized cost for computer software at December 31, 2012 was $5.7 million (2011 – $5.6 million).
The unamortized capitalized cost for leasehold improvements at December 31, 2012 was $3.4 million (2011 – $3.2 million), which is being amortized on a straight-line basis over the life term of the lease plus one renewal period.
The amortization of assets recorded under capital leases is included in the amortization of property, plant and mine development line item of the consolidated statements of income (loss) and comprehensive income (loss).
2012 ANNUAL REPORT 195
4. FAIR VALUE MEASUREMENT
ASC 820 – Fair Value Measurement and Disclosure defines fair value, establishes a framework for measuring fair value under US GAAP, and requires expanded disclosures about fair value measurements including the following three fair value hierarchy levels:
Level 1 – Unadjusted quoted prices in active markets that are accessible at the measurement date for identical, unrestricted assets or liabilities;
Level 2 – Quoted prices in markets that are not active, or inputs that are observable, either directly or indirectly, for substantially the full term of the asset or liability; and
Level 3 – Prices or valuation techniques that require inputs that are both significant to the fair value measurement and unobservable (supported by little or no market activity).
Fair value is the value at which a financial instrument could be closed out or sold in a transaction with a willing and knowledgeable counterparty over a period of time consistent with the Company's investment strategy. Fair value is based on quoted market prices, where available. If market quotes are not available, fair value is based on internally developed models that use market-based or independent information as inputs. These models could produce a fair value that may not be reflective of future fair value.
The following table details the Company's financial assets and liabilities measured at fair value as at December 31, 2012 within the fair value hierarchy:
| Total | Level 1 | Level 2 | Level 3 | |||||||||
| Financial assets: | ||||||||||||
| Available-for-sale securities(i) | $ | 44,719 | $ | 44,719 | $ | – | $– | |||||
| Trade receivables(ii) | 67,750 | – | 67,750 | – | ||||||||
| Fair value of derivative financial instruments(iii) | 2,112 | – | 2,112 | – | ||||||||
| $ | 114,581 | $ | 44,719 | $ | 69,862 | $– | ||||||
| Financial liabilities: | ||||||||||||
| Fair value of derivative financial instruments(iii) | $ | 277 | $ | – | $ | 277 | $– | |||||
- (i)
- Available-for-sale
securities are recorded at fair value using quoted market prices (classified within Level 1 of the fair value hierarchy).
- (ii)
- Trade
receivables from provisional invoices for concentrate sales are valued using quoted forward rates derived from observable market data based on the month of expected settlement
(classified within Level 2 of the fair value hierarchy).
- (iii)
- Derivative financial instruments are recorded at fair value using external broker-dealer quotations (classified within Level 2 of the fair value hierarchy).
Notes:
In the event that a decline in the fair value of an investment in available-for-sale securities occurs and the decline in value is considered to be other-than-temporary, an impairment charge is recorded in the consolidated statements of income (loss) and comprehensive income (loss) and a new cost basis for the investment is established. The Company assesses whether a decline in value is considered to be other-than-temporary by considering available evidence, including changes in general market conditions, specific industry and individual company data, the length of time and the extent to which the fair value has been less than cost, the financial condition and the near-term prospects of the individual investment. New evidence could become available in future periods which would affect this assessment and thus could result in material impairment charges with respect to those investments in available-for-sale securities for which the cost basis exceeds its fair value.
196 AGNICO-EAGLE MINES LIMITED
5. LONG-TERM DEBT
Credit Facility
On June 22, 2010, the Company amended and restated its Credit Facility, increasing the amount available from $900.0 million to $1,200.0 million.
On July 20, 2012, the Company further amended the Credit Facility, extending the maturity date from June 22, 2016 to June 22, 2017 and updating pricing terms to reflect improved market conditions.
At December 31, 2012, the Credit Facility was drawn down by $30.0 million (2011 – $320.0 million). Amounts drawn down, together with related outstanding letters of credit, resulted in Credit Facility availability of $1,168.9 million at December 31, 2012.
2012 Notes
On July 24, 2012, the Company closed a private placement consisting of $200.0 million of guaranteed senior unsecured notes due in 2022 and 2024 (the "2012 Notes") with a weighted average maturity of 11.0 years and weighted average yield of 4.95%.
The following are the individual series' of the 2012 Notes:
| Principal | Interest Rate | Maturity Date | ||||||
| Series A | $ | 100,000 | 4.87% | 7/23/2022 | ||||
| Series B | 100,000 | 5.02% | 7/23/2024 | |||||
| $ | 200,000 | |||||||
2010 Notes
On April 7, 2010, the Company closed a private placement consisting of $600.0 million of guaranteed senior unsecured notes due in 2017, 2020 and 2022 (the "2010 Notes") with a weighted average maturity of 9.84 years and weighted average yield of 6.59%.
The following are the individual series' of the 2010 Notes:
| Principal | Interest Rate | Maturity Date | ||||||
| Series A | $ | 115,000 | 6.13% | 7/4/2017 | ||||
| Series B | 360,000 | 6.67% | 7/4/2020 | |||||
| Series C | 125,000 | 6.77% | 7/4/2022 | |||||
| $ | 600,000 | |||||||
Covenants
Payment and performance of Agnico-Eagle's obligations under the Credit Facility, 2012 Notes and 2010 Notes is guaranteed by each of its significant subsidiaries and certain of its other subsidiaries (the "Guarantors").
2012 ANNUAL REPORT 197
The Credit Facility contains covenants that limit, among other things, the ability of the Company to incur additional indebtedness, make distributions in certain circumstances, sell material assets and carry on a business other than one related to the mining business.
The 2012 Notes and 2010 Notes contain covenants that restrict, among other things, the ability of the Company to amalgamate or otherwise transfer its assets, sell material assets and carry on a business other than one related to mining and the ability of the Guarantors to incur indebtedness.
The Credit Facility, 2012 Notes and 2010 Notes also require the Company to maintain a total net debt to EBITDA ratio below a specified maximum value as well as a minimum tangible net worth.
The Company was in compliance with all covenants contained within the Credit Facility, 2012 Notes and 2010 Notes as at December 31, 2012.
Interest on long-term debt
For the year ended December 31, 2012, total interest expense was $57.9 million (2011 – $55.0 million; 2010 – $49.5 million) and total cash interest payments were $52.2 million (2011 – $52.8 million; 2010 – $41.4 million). In 2012, cash interest on the Credit Facility was $3.6 million (2011 – $1.7 million; 2010 – $12.3 million), cash standby fees on the Credit Facility were $4.2 million (2011 – $8.6 million; 2010 – $6.7 million), and cash interest on the 2010 Notes and 2012 Notes was $39.5 million (2011 – $39.5 million; 2010 – $19.8 million). In 2012, $1.5 million (2011 – $1.0 million; 2010 – $4.6 million) of the total interest expense was capitalized to construction in progress.
The Company's weighted average interest rate on all of its long-term debt as at December 31, 2012 was 6.02% (2011 – 5.02%; 2010 – 5.43%).
6. RECLAMATION PROVISION AND OTHER LIABILITIES
Reclamation provision and other liabilities consist of the following:
| As at December 31, | |||||
| 2012 | 2011 | ||||
| Reclamation provision (note 6(a)) | $101,753 | $105,443 | |||
| Long-term portion of capital lease obligations (note 13(a)) | 12,108 | 26,184 | |||
| Pension benefits (note 6(b)) | 13,734 | 13,991 | |||
| Other | 140 | 370 | |||
| Total | $127,735 | $145,988 | |||
198 AGNICO-EAGLE MINES LIMITED
(a) Reclamation provision
Agnico-Eagle's reclamation provision includes both asset retirement obligations and environmental remediation liabilities. Reclamation provision estimates are based on current legislation, third party estimates, management's estimates and feasibility study calculations.
The following table reconciles the beginning and ending carrying amounts of the Company's asset retirement obligations:
| 2012 | 2011 | |||||
| Asset retirement obligations, beginning of year | $86,386 | $91,641 | ||||
| Current year additions and changes in estimate, net | 1,495 | (8,398 | ) | |||
| Current year accretion | 5,068 | 4,953 | ||||
| Liabilities settled | (254 | ) | – | |||
| Foreign exchange revaluation | 1,655 | (1,810 | ) | |||
| Reclassification from long-term to current | (4,630 | ) | – | |||
| Asset retirement obligations – long-term, end of year | $89,720 | $86,386 | ||||
Due to the suspension of mining operations at the Goldex mine on October 19, 2011 (see note 17), Agnico-Eagle recognized an environmental remediation liability. The following table reconciles the beginning and ending carrying amounts of the Goldex mine's environmental remediation liability:
| 2012 | 2011 | |||||||
| Environmental remediation liability – long-term, beginning of year | $ | 19,057 | $ | – | ||||
| Environmental remediation liability – current, beginning of year | 26,069 | – | ||||||
| Current year change in estimate | (36 | ) | 51,736 | |||||
| Liabilities settled | (21,450 | ) | (7,616 | ) | ||||
| Foreign exchange revaluation | 579 | 1,006 | ||||||
| Reclassification from long-term to current | (12,186 | ) | (26,069 | ) | ||||
| Environmental remediation liability – long-term, end of year | $ | 12,033 | $ | 19,057 | ||||
2012 ANNUAL REPORT 199
(b) Pension benefits
Agnico-Eagle provides the Executives Plan for certain senior officers. The funded status of the Executives Plan is based on actuarial valuations performed as of July 1, 2012, projected to December 30, 2012 and covering the period through June 30, 2013.
The components of Agnico-Eagle's net pension benefits expense are as follows:
| Years Ended December 31, | ||||||||||
| 2012 | 2011 | 2010 | ||||||||
| Service cost – benefits earned during the year | $ | 650 | $ | 996 | $ | 981 | ||||
| Interest cost on projected benefit obligation | 489 | 663 | 613 | |||||||
| Amortization of net transition asset | 169 | 171 | 164 | |||||||
| Prior service cost | 26 | 26 | 25 | |||||||
| Loss due to settlement | 2,921 | – | – | |||||||
| Recognized net actuarial loss | 340 | 245 | – | |||||||
| Net pension benefits expense | $ | 4,595 | $ | 2,101 | $ | 1,783 | ||||
Assets for the Executives Plan consist of deposits on hand with regulatory authorities which are refundable when benefit payments are made or on the ultimate wind-up of the plan. The accumulated benefit obligation for the Executives Plan at December 31, 2012 was $9.7 million (2011 – $13.2 million).
200 AGNICO-EAGLE MINES LIMITED
The funded status of the Executives Plan for 2012 and 2011 is as follows:
| 2012 | 2011 | |||||||
| Reconciliation of the market value of plan assets: | ||||||||
| Fair value of plan assets, beginning of year | $ | 2,952 | $ | 2,443 | ||||
| Agnico-Eagle's contribution | 839 | 1,156 | ||||||
| Benefit payments | (520 | ) | (578 | ) | ||||
| Settlements | (961 | ) | – | |||||
| Effect of exchange rate changes | 63 | (69 | ) | |||||
| Fair value of plan assets, end of year | 2,373 | 2,952 | ||||||
| Reconciliation of projected benefit obligation: | ||||||||
| Projected benefit obligation, beginning of year | 14,370 | 12,041 | ||||||
| Service cost | 650 | 996 | ||||||
| Interest cost | 489 | 663 | ||||||
| Net actuarial loss | 675 | 1,704 | ||||||
| Benefit payments | (520 | ) | (696 | ) | ||||
| Settlements | (5,148 | ) | – | |||||
| Effect of exchange rate changes | 302 | (338 | ) | |||||
| Projected benefit obligation, end of year | 10,818 | 14,370 | ||||||
| Deficiency of plan assets compared with projected benefit obligation | $ | (8,445 | ) | $ | (11,418 | ) | ||
2012 ANNUAL REPORT 201
Comprised of the following net amounts recognized in the consolidated balance sheets:
| As at December 31, | ||||||||
| 2012 | 2011 | |||||||
| Accrued employee benefit liability | $ | 5,008 | $ | 7,292 | ||||
| Accumulated other comprehensive loss: | ||||||||
| Transition obligation | 341 | 500 | ||||||
| Prior service cost | 52 | 76 | ||||||
| Net actuarial loss | 3,044 | 3,550 | ||||||
| Net liability | $ | 8,445 | $ | 11,418 | ||||
| Assumptions: | ||||||||
| Weighted average discount rate – net periodic pension cost | 4.45% | 5.20% | ||||||
| Weighted average discount rate – projected benefit obligation | 4.00% | 4.45% | ||||||
| Weighted average rate of compensation increase | 3.00% | 3.00% | ||||||
| Estimated average remaining service life for the plan (in years)(i) | 6.0 | 3.0 | ||||||
- (i)
- Estimated average remaining service life for the Executives Plan was developed for individual senior officers.
Note:
Executives Plan components expected to be recognized in accumulated other comprehensive loss in 2013:
| Transition obligation | $170 | ||
| Prior service cost | 26 | ||
| Net actuarial loss | 327 | ||
| $523 | |||
202 AGNICO-EAGLE MINES LIMITED
Estimated benefit payments from the Executives Plan over the next ten years are presented below:
| Years ended December 31,: | Estimated Executives Plan Benefit Payments |
|||
| 2013 | $ | 117 | ||
| 2014 | $ | 116 | ||
| 2015 | $ | 115 | ||
| 2016 | $ | 114 | ||
| 2017 | $ | 113 | ||
| 2018 – 2022 | $ | 3,591 | ||
In addition to the Executives Plan, the Company maintains the Basic Plan and the Supplemental Plan. Under the Basic Plan, Agnico-Eagle contributes 5% of certain employees' base employment compensation to a defined contribution plan. In 2012, $11.9 million (2011 – $10.7 million; 2010 – $8.8 million) was contributed to the Basic Plan. Effective January 1, 2008, the Company adopted the Supplemental Plan for designated executives at the level of Vice-President or above. Under the Supplemental Plan, an additional 10% of the designated executive's earnings for the year (including salary and short-term bonus) is contributed by the Company. In 2012, $0.8 million (2011 – $0.9 million; 2010 – $1.1 million) was contributed to the Supplemental Plan. The Supplemental Plan is accounted for as a cash balance plan.
7. SHAREHOLDERS' EQUITY
(a) Common shares
The Company's authorized share capital includes an unlimited number of common shares with issued common shares of 172,296,610 (2011 – 170,859,604), less 193,740 common shares held by a trust in connection with the Company's restricted share unit ("RSU") plan (2011 – less 45,868 common shares). The trust is treated as a variable interest entity and, as a result, its holdings of shares are offset against the Company's issued shares in its consolidated financial statements (see note 8(c) for details).
In 2012, the Company declared dividends on its common shares of $1.02 per share (2011 – nil per share; 2010 – $0.64 per share).
(b) Private placements and warrants
On December 3, 2008, the Company closed a private placement of 9.2 million units, with each unit consisting of one common share and one-half of one common share purchase warrant. Each whole warrant entitles the holder to purchase one common share of the Company at a price of $47.25 per share at any time during the five-year term of the warrant. As consideration for the lead purchaser's commitment, the Company issued to the lead purchaser an additional 4 million warrants. The net proceeds of the private placement were approximately $281.0 million, after deducting share issue costs of $8.8 million. If all outstanding warrants were exercised, the Company would issue an additional 8.6 million common shares. No warrants had been exercised as of December 31, 2012.
On July 26, 2010, the Company issued 15,000 common shares with a market value of $0.8 million in connection with the purchase of a mining property.
2012 ANNUAL REPORT 203
(c) Public issuance of common shares
On July 6, 2010, the Company issued 10,210,848 common shares with a market value of $579.0 million in connection with the acquisition of Comaplex Minerals Corp. ("Comaplex") (see note 10 for details).
On November 18, 2011, the Company issued 1,250,477 common shares with a market value of $56.1 million in connection with the acquisition of 94.77% of the outstanding shares of Grayd Resource Corporation ("Grayd"). On January 23, 2012, the Company issued an additional 68,941 common shares with a market value of $2.4 million in connection with the compulsory acquisition of the remaining outstanding shares of Grayd it did not already own (see note 10 for details).
(d) Accumulated other comprehensive loss
The following table details the components of accumulated other comprehensive loss, net of related tax effects:
| As at December 31, | ||||||||
| 2012 | 2011 | |||||||
| Cumulative translation adjustment | $ | (16,206 | ) | $ | (16,206 | ) | ||
| Unrealized net (loss) gain on available-for-sale securities | (7,680 | ) | 16,350 | |||||
| Unrealized loss on derivative financial instruments | (260 | ) | (4,404 | ) | ||||
| Unrealized loss on pension benefits liability | (4,071 | ) | (5,219 | ) | ||||
| Tax effect of unrealized loss on derivative financial instruments | 397 | 1,491 | ||||||
| Tax effect of unrealized loss on pension benefits liability | 509 | 882 | ||||||
| Accumulated other comprehensive loss | $ | (27,311 | ) | $ | (7,106 | ) | ||
In 2012, a $9.7 million gain on sale of available-for-sale securities (2011 – $4.9 million gain; 2010 – $19.5 million gain) was reclassified from accumulated other comprehensive loss to the consolidated statements of income (loss) and comprehensive income (loss).
(e) Net income (loss) per share
The following table provides the weighted average number of common shares used in the calculation of basic and diluted net income (loss) per share:
| Years Ended December 31, | |||||||
| 2012 | 2011 | 2010 | |||||
| Weighted average number of common shares outstanding – basic | 171,250,179 | 169,352,896 | 162,342,686 | ||||
| Add: Dilutive impact of employee stock options | – | – | 1,192,530 | ||||
| Dilutive impact of warrants | – | – | 2,263,902 | ||||
| Dilutive impact of shares related to RSU plan | 235,436 | – | 43,141 | ||||
| Weighted average number of common shares outstanding – diluted | 171,485,615 | 169,352,896 | 165,842,259 | ||||
204 AGNICO-EAGLE MINES LIMITED
The calculation of diluted net income (loss) per share has been calculated using the treasury stock method. In applying the treasury stock method, employee stock options and warrants with an exercise price greater than the average quoted market price of the common shares, for the period outstanding, are not included in the calculation of diluted net income (loss) per share, as the impact is anti-dilutive. In 2010, a total of 58,750 employee stock options were excluded from the calculation of diluted net income (loss) per share as their impact would have been anti-dilutive. In 2011, the impact of any additional shares issued under the employee stock option plan, as a result of the conversion of warrants, or related to the RSU plan would have been anti-dilutive as a result of the net loss recorded for the year. Consequently, diluted net loss per share was calculated in the same manner as basic net loss per share in 2011. In 2012, 7,742,151 employee stock options and all warrants were excluded from the calculation of diluted net income (loss) per share as their impact would have been anti-dilutive.
8. STOCK-BASED COMPENSATION
(a) Employee Stock Option Plan ("ESOP")
The Company's ESOP provides for the granting of stock options to directors, officers, employees and service providers to purchase common shares. Under the ESOP, stock options are granted at the fair market value of the underlying shares on the day prior to the date of grant. The number of common shares that may be reserved for issuance to any one person pursuant to stock options (under the ESOP or otherwise), warrants, share purchase plans or other arrangements may not exceed 5% of the Company's common shares issued and outstanding at the date of grant.
On April 24, 2001, the Compensation Committee of the Board of Directors adopted a policy pursuant to which stock options granted after that date have a maximum term of five years. In 2010, the shareholders approved a resolution to increase the number of common shares reserved for issuance under the ESOP by 1,300,000 to 20,300,000. In 2011 and 2012 the shareholders approved a further 3,000,000 and 2,500,000 common shares for issuance under the ESOP, respectively.
Of the 3,257,000 stock options granted under the ESOP in 2012, 814,250 stock options vested immediately and expire in 2017. The remaining stock options expire in 2017 and vest in equal installments, on each anniversary date of the grant, over a three-year period. Of the 2,630,785 stock options granted under the ESOP in 2011, 657,696 stock options vested immediately and expire in 2016. The remaining stock options expire in 2016 and vest in equal installments, on each anniversary date of the grant, over a three-year period. Of the 2,926,080 stock options granted under the ESOP in 2010, 731,520 stock options vested immediately and expire in 2015. The remaining stock options expire in 2015 and vest in equal installments, on each anniversary date of the grant, over a three-year period. Upon the exercise of stock options under the ESOP, the Company issues new common shares to settle the obligation.
2012 ANNUAL REPORT 205
The following summary details activity with respect to Agnico-Eagle's outstanding stock options:
| 2012 | 2011 | 2010 | |||||||||||
| Number of Stock Options |
Weighted Average Exercise Price |
Number of Stock Options |
Weighted Average Exercise Price |
Number of Stock Options |
Weighted Average Exercise Price |
||||||||
| Outstanding, beginning of year | 8,959,051 | C$62.88 | 6,762,704 | C$56.94 | 5,707,940 | C$53.85 | |||||||
| Granted | 3,257,000 | 36.99 | 2,630,785 | 76.12 | 2,926,080 | 57.55 | |||||||
| Exercised | (416,275 | ) | 43.51 | (308,688 | ) | 43.62 | (1,627,766 | ) | 47.02 | ||||
| Forfeited | (731,000 | ) | 59.72 | (125,750 | ) | 67.47 | (243,550 | ) | 58.03 | ||||
| Expired | (481,650 | ) | 47.49 | – | – | – | – | ||||||
| Outstanding, end of year | 10,587,126 | C$56.60 | 8,959,051 | C$62.88 | 6,762,704 | C$56.94 | |||||||
| Options exercisable at end of year | 6,510,464 | 5,178,172 | 2,972,857 | ||||||||||
The following table details 2012 activity with respect to Agnico-Eagle's nonvested stock options:
| 2012 | ||||||
| Number of Stock Options |
Weighted Average Grant Date Fair Value |
|||||
| Nonvested, beginning of year | 3,780,879 | C$ | 17.79 | |||
| Granted | 3,257,000 | 8.29 | ||||
| Vested | (2,625,467 | ) | 15.63 | |||
| Forfeited (nonvested) | (335,750 | ) | 12.50 | |||
| Nonvested, end of year | 4,076,662 | C$ | 13.33 | |||
Cash received for stock options exercised in 2012 was $18.2 million (2011 – $13.6 million; 2010 – $74.7 million).
The total intrinsic value of stock options exercised in 2012 was C$3.6 million (2011 – C$8.0 million; 2010 – C$46.5 million).
The weighted average grant date fair value of stock options granted in 2012 was C$8.29 (2011 – C$17.05; 2010 – C$16.31). The total fair value of stock options vested during 2012 was $41.0 million (2011 – $46.7 million; 2010 – $36.7 million).
206 AGNICO-EAGLE MINES LIMITED
The following table summarizes information about Agnico-Eagle's stock options outstanding and exercisable at December 31, 2012:
| Stock Options Outstanding | Stock Options Exercisable | ||||||||||
| Range of Exercise Prices | Number Outstanding |
Weighted Average Remaining Contractual Life |
Weighted Average Exercise Price |
Number Exercisable |
Weighted Average Exercise Price |
||||||
| C$33.26 – C$59.71 | 6,378,941 | 2.50 years | C$47.45 | 3,485,921 | C$52.68 | ||||||
| C$60.72 – C$83.08 | 4,208,185 | 2.14 years | 70.46 | 3,024,543 | 68.18 | ||||||
| C$33.26 – C$83.08 | 10,587,126 | 2.36 years | C$56.60 | 6,510,464 | C$59.88 | ||||||
The weighted average remaining contractual term of stock options exercisable at December 31, 2012 was 1.7 years.
The Company has reserved for issuance 10,587,126 common shares in the event that these stock options are exercised.
The number of common shares available for the granting of stock options under the ESOP as at December 31, 2012, December 31, 2011 and December 31, 2010 was 3,717,785, 3,262,135 and 2,771,420, respectively.
Subsequent to the year ended December 31, 2012, on January 2, 2013, 2,803,000 stock options were granted under the ESOP, of which 700,750 stock options vested immediately and expire in the year 2018. The remaining stock options expire in 2018 and vest in equal installments on each anniversary date of the grant, over a three-year period.
Agnico-Eagle estimated the fair value of stock options under the Black-Scholes option pricing model using the following weighted average assumptions:
| 2012 | 2011 | 2010 | |||||
| Risk-free interest rate | 1.26% | 1.95% | 1.86% | ||||
| Expected life of stock options (in years) | 2.8 | 2.5 | 2.5 | ||||
| Expected volatility of Agnico-Eagle's share price | 37.5% | 34.70% | 43.80% | ||||
| Expected dividend yield | 2.14% | 0.89% | 0.42% | ||||
The Company uses historical volatility in estimating the expected volatility of Agnico-Eagle's share price. The expected term of stock options granted is derived from historical data on employee exercise and post-vesting employment termination experience.
The aggregate intrinsic value of stock options outstanding at December 31, 2012 was C$(47.3) million. The aggregate intrinsic value of stock options exercisable at December 31, 2012 was C$(50.5) million.
The total compensation expense for the ESOP recognized in the general and administrative line item of the consolidated statements of income (loss) and comprehensive income (loss) for 2012 was $33.8 million (2011 – $42.2 million; 2010 – $37.8 million). The total compensation cost related to nonvested stock options not yet
2012 ANNUAL REPORT 207
recognized is $24.5 million as at December 31, 2012 and the weighted average period over which it is expected to be recognized is 1.6 years. Of the total compensation cost for the ESOP, $1.3 million was capitalized as part of the property, plant and mine development line item of the consolidated balance sheets in 2012 (2011 – $1.4 million; 2010 – $1.3 million).
(b) Incentive Share Purchase Plan
On June 26, 1997, the Company's shareholders approved an incentive share purchase plan (the "Purchase Plan") to encourage directors, officers and employees ("Participants") to purchase Agnico-Eagle's common shares at market value. In 2009, the Purchase Plan was amended to remove non-executive directors as eligible Participants.
Under the Purchase Plan, Participants may contribute up to 10% of their basic annual salaries, and the Company contributes an amount equal to 50% of each Participant's contribution. All common shares subscribed for under the Purchase Plan are newly issued by the Company. The total compensation cost recognized in 2012 related to the Purchase Plan was $7.2 million (2011 – $6.4 million; 2010 – $5.0 million).
In 2012, 507,235 common shares were subscribed for under the Purchase Plan (2011 – 360,833; 2010 – 229,583) for a value of $21.7 million (2011 – $19.2 million; 2010 – $15.0 million). In May 2008, the Company's shareholders approved an increase in the maximum number of common shares reserved for issuance under the Purchase Plan to 5,000,000 from 2,500,000. As at December 31, 2012, Agnico-Eagle has reserved for issuance 1,642,853 common shares (2011 – 2,150,088; 2010 – 2,510,921) under the Purchase Plan.
(c) Restricted Share Unit Plan
In 2009, the Company implemented the RSU plan for certain employees. A deferred compensation balance was recorded for the total grant date value on the date of grant. The deferred compensation balance was recorded as a reduction of shareholders' equity and was amortized as compensation expense over the applicable vesting period of two years.
Effective January 1, 2012, the RSU plan was amended to include directors and senior executives of the Company. A deferred compensation balance was recorded for the total grant date value on the date of grant. The deferred compensation balance was recorded as a reduction of shareholders' equity and is to be amortized as compensation expense over the applicable vesting period of three years.
In 2012, the Company funded the RSU plan by transferring $12.0 million (2011 – $3.7 million; 2010 – $4.0 million) to an employee benefit trust (the "Trust") that then purchased shares of the Company in the open market. The Trust is funded once per year during the first quarter of each year. Compensation cost for the RSU plan incorporates an expected forfeiture rate. The forfeiture rate is estimated based on the Company's historical employee turnover rates and expectations of future forfeiture rates that incorporate various factors that include historical employee stock option plan forfeiture rates. For the years 2009 through 2012, the impact of forfeitures was not material. For accounting purposes, the Trust is treated as a variable interest entity and consolidated in the accounts of the Company. On consolidation, the dividends paid on the shares held by the Trust are eliminated. The common shares purchased and held by the Trust are treated as not outstanding for the basic earnings per share ("EPS") calculations. They are included in the basic EPS calculations once they have vested. All of the unvested common shares held by the Trust are included in the diluted EPS calculations.
Compensation cost related to the RSU plan was $6.6 million in 2012 (2011 – $3.3 million; 2010 – $3.0 million). Compensation cost related to the RSU plan is included as part of the production, general and administrative and exploration and corporate development line items of the consolidated statements of income (loss) and comprehensive income (loss), consistent with the classification of other elements of compensation expense for those employees who held RSUs. Of the total compensation cost for the RSU plan, nil was capitalized as part of the
208 AGNICO-EAGLE MINES LIMITED
property, plant and mine development line item of the consolidated balance sheets in 2012 (2011 – nil; 2010 – $0.1 million).
Subsequent to the year ended December 31, 2012, 422,553 RSUs were granted under the RSU plan. Of these, 131,846 RSUs vest in 2014, 277,944 RSUs vest in 2015 and 12,763 RSUs vest in 2016.
9. INCOME AND MINING TAXES
Income and mining taxes expense (recovery) is made up of the following geographic components:
| Years Ended December 31, | |||||||||||
| 2012 | 2011 | 2010 | |||||||||
| Current income and mining taxes: | |||||||||||
| Canada | $ | 8,750 | $ | 62,382 | $ | 34,217 | |||||
| Mexico | 33,531 | 3,496 | 1,942 | ||||||||
| Finland | 9,799 | 222 | – | ||||||||
| 52,080 | 66,100 | 36,159 | |||||||||
| Deferred income and mining taxes: | |||||||||||
| Canada | 26,041 | (341,038 | ) | 47,083 | |||||||
| Mexico | 25,284 | 54,996 | 18,759 | ||||||||
| Finland | 20,820 | 10,269 | 1,086 | ||||||||
| 72,145 | (275,773 | ) | 66,928 | ||||||||
| Income and mining taxes | $ | 124,225 | $ | (209,673 | ) | $ | 103,087 | ||||
Cash income and mining taxes paid in 2012 were $57.0 million (2011 – $110.9 million; 2010 – $25.2 million).
2012 ANNUAL REPORT 209
The income and mining taxes expense (recovery) is different from the amount that would have been calculated by applying the Canadian statutory income tax rate as a result of the following:
| 2012 | 2011 | 2010 | |||||
| Combined federal and composite provincial tax rates | 26.3% | 27.8% | 29.6% | ||||
| Increase (decrease) in tax rates resulting from: | |||||||
| Provincial mining duties | 3.6 | 5.9 | 6.8 | ||||
| Tax law changes | – | (2.7) | (5.1) | ||||
| Impact of foreign tax rates | (1.5) | (0.2) | (0.5) | ||||
| Permanent differences | 1.0 | (1.6) | (4.2) | ||||
| Valuation allowances | 1.2 | (0.3) | (0.2) | ||||
| Impact of changes in income tax rates | (2.1) | (2.0) | (2.7) | ||||
| Actual rate as a percentage of pre-tax income | 28.5% | 26.9% | 23.7% | ||||
The following table details the components of Agnico-Eagle's deferred income and mining tax liabilities:
| Liabilities (Assets) as at December 31, |
||||||
| 2012 | 2011 | |||||
| Mining properties | $761,508 | $704,379 | ||||
| Net operating and capital loss carryforwards | (102,005 | ) | (104,332 | ) | ||
| Mining duties | (36,158 | ) | (88,670 | ) | ||
| Reclamation provisions | (42,688 | ) | (51,926 | ) | ||
| Valuation allowance | 30,570 | 39,121 | ||||
| Deferred income and mining tax liabilities | $611,227 | $498,572 | ||||
All of Agnico-Eagle's deferred income and mining tax assets and liabilities were denominated in the local currency based on the jurisdiction in which the Company paid taxes, except for Canada, and were translated into US dollars using the exchange rate in effect at the applicable consolidated balance sheets dates. For Canadian income tax purposes, for December 31, 2008 and subsequent years, the Company elected to use the US dollar as its functional currency.
The Company operates in different jurisdictions and, accordingly, it is subject to income and other taxes under the various tax regimes in the countries in which it operates. The tax rules and regulations in many countries are highly complex and subject to interpretation. The Company may be subject in the future to a review of its historic income and other tax filings and in connection with such reviews, disputes can arise with the taxing authorities over the
210 AGNICO-EAGLE MINES LIMITED
interpretation or application of certain tax rules and regulations to the Company's business conducted within the country involved.
A reconciliation of the beginning and ending amounts of the unrecognized tax benefits is as follows:
| 2012 | 2011 | 2010 | ||||||||
| Unrecognized tax benefits, beginning of year | $ | 1,200 | $1,630 | $ | 5,608 | |||||
| Additions (reductions) | 9,667 | (430 | ) | (3,978 | ) | |||||
| Unrecognized tax benefit, end of year | $ | 10,867 | $1,200 | $ | 1,630 | |||||
The full amount of unrecognized tax benefits, if recognized, would reduce the Company's annual effective tax rate. The Company does not expect its unrecognized tax benefits to change significantly over the next year.
The Company is subject to taxes in Canada, Mexico and Finland, each with varying statutes of limitations. The 2007 through 2012 taxation years generally remain subject to examination.
10. ACQUISITIONS
Grayd Resource Corporation
In September 2011, Agnico-Eagle entered into an acquisition agreement with Grayd, a Canadian-based natural resource company listed on the TSX Venture Exchange, pursuant to which the Company agreed to make an offer to acquire all of the issued and outstanding common shares of Grayd. On October 13, 2011, the Company made the offer by way of a take-over bid circular, as amended and supplemented on October 21, 2011.
On November 18, 2011, Agnico-Eagle acquired 94.77% of the outstanding shares of Grayd, on a fully-diluted basis, by way of a take-over bid. The November 18, 2011 purchase price of $222.1 million was comprised of $166.0 million in cash and 1,250,477 newly issued Agnico-Eagle common shares.
The related transaction costs associated with the acquisition totalling $3.8 million were expensed through the interest and sundry expense (income) line item of the consolidated statements of income (loss) and comprehensive income (loss) during the fourth quarter of 2011. The Company has accounted for the purchase of Grayd as a business combination.
2012 ANNUAL REPORT 211
The following table details the allocation of the purchase price to assets acquired and liabilities assumed, based on management's estimates of fair value.
| Total purchase price: | ||||
| Cash paid for acquisition | $165,954 | |||
| Agnico-Eagle common shares issued for acquisition | 56,146 | |||
| Total purchase price to allocate | $222,100 | |||
| Fair value of assets acquired and liabilities assumed: | ||||
| Mining properties | $282,000 | |||
| Goodwill | 29,215 | |||
| Cash and cash equivalents | 2,907 | |||
| Trade receivables | 469 | |||
| Other current assets | 1,700 | |||
| Equipment | 56 | |||
| Accounts payable and accrued liabilities | (9,767 | ) | ||
| Deferred tax liability | (72,229 | ) | ||
| Non-controlling interest | (12,251 | ) | ||
| Net assets acquired | $222,100 | |||
The Company believes that goodwill for the Grayd acquisition arose principally because of the following factors: (1) the going concern value implicit in the Company's ability to sustain and/or grow its business by increasing reserves and resources through new discoveries; and (2) the requirement to record a deferred tax liability for the difference between the assigned values and the tax bases of assets acquired and liabilities assumed in a business combination at amounts that do not reflect fair value.
Pro forma results of operations for Agnico-Eagle assuming the acquisition of Grayd described above had occurred as of January 1, 2010 are detailed below. On a pro forma basis, there would have been no effect on Agnico-Eagle's consolidated revenues:
| Years Ended December 31, | |||||||
| 2011 | 2010 | ||||||
| Unaudited | |||||||
| Pro forma net income (loss) attributed to common shareholders | $ | (582,762 | ) | $ | 324,708 | ||
| Pro forma net income (loss) per share – basic | $ | (3.42 | ) | $ | 1.98 | ||
On January 23, 2012, the Company acquired the remaining outstanding shares of Grayd it did not already own, pursuant to a previously announced compulsory acquisition carried out under the provisions of the Business
212 AGNICO-EAGLE MINES LIMITED
Corporations Act (British Columbia). The January 23, 2011 purchase price of $11.8 million was comprised of $9.3 million in cash and 68,941 newly issued Agnico-Eagle common shares.
Summit Gold Project
On December 20, 2011, the Company completed the acquisition of 100% of the Summit Gold project from Columbus Gold Corporation, subject to a 2% net smelter returns mineral production royalty reserved by Cordilleran Exploration Company. The Nevada-based project's purchase price of $8.5 million, including transaction costs, was comprised entirely of cash. This transaction was accounted for as an asset acquisition.
Comaplex Minerals Corp.
On April 1, 2010, Agnico-Eagle and Comaplex jointly announced that they reached an agreement in principle whereby Agnico-Eagle would acquire all of the shares of Comaplex (the "Comaplex Shares") that it did not already own. The transaction was completed under a plan of arrangement under the Business Corporations Act (Alberta). Under the terms of the transaction, each shareholder of Comaplex, other than Agnico-Eagle, received 0.1576 of an Agnico-Eagle common share per Comaplex share. Additionally, at closing, each Comaplex shareholder, other than Agnico-Eagle and Perfora Investments S.a.r.l. ("Perfora"), received one common share of a newly formed, wholly-owned, subsidiary of Comaplex, Geomark Exploration Ltd. ("Geomark"), in respect of each Comaplex share and Comaplex transferred to Geomark all of the assets and related liabilities of Comaplex other than those relating to the Meliadine gold exploration properties in Nunavut, Canada. The Geomark assets included all of Comaplex's net working capital, the non-Meliadine mineral properties, all oil and gas properties and investments. Under the plan of arrangement, Comaplex changed its name to Meliadine Holdings Inc.
Prior to the announcement of the transaction, Perfora and Agnico-Eagle had entered into a support agreement pursuant to which Perfora agreed to, among other things, support the transaction and vote all of the shares it held in Comaplex in favour of the plan of arrangement. Perfora held approximately 17.3% and Agnico-Eagle held approximately 12.3%, on a fully diluted basis, of the outstanding shares of Comaplex prior to the announcement of the acquisition.
On July 6, 2010, the transactions relating to the plan of arrangement closed and Agnico-Eagle issued a total of 10,210,848 common shares to the shareholders of Comaplex, other than Agnico-Eagle, for a total value of $579.0 million. The related transaction costs associated with the acquisition totalling $7.0 million were expensed through the interest and sundry expense (income) line item of the consolidated statements of income (loss) and comprehensive income (loss) during the third quarter of 2010. The Company has accounted for the purchase of Comaplex as a business combination.
2012 ANNUAL REPORT 213
The following table details the allocation of the purchase price to assets acquired and liabilities assumed, based on management's estimates of fair value.
| Total purchase price: | |||||
| Comaplex shares previously purchased | $ | 88,683 | |||
| Agnico-Eagle common shares issued for acquisition | 578,955 | ||||
| Total purchase price to allocate | $ | 667,638 | |||
| Fair value of assets acquired and liabilities assumed: | |||||
| Property | $ | 642,610 | |||
| Goodwill | 200,064 | ||||
| Supplies | 542 | ||||
| Equipment | 2,381 | ||||
| Asset retirement obligation | (3,400 | ) | |||
| Deferred tax liability | (174,559 | ) | |||
| Net assets acquired | $ | 667,638 | |||
The Comaplex shares purchased prior to the April 1, 2010 announcement of the acquisition had a cost base of $24.1 million and a fair value at July 6, 2010 of $88.6 million. Upon the acquisition of Comaplex, the non-cash gain of $64.5 million on those shares within accumulated other comprehensive income was reversed into the consolidated statements of income (loss) and comprehensive income (loss) as a gain during the third quarter of 2010.
The Company believes that goodwill for the Comaplex acquisition arose principally because of the following factors: (1) the going concern value implicit in the Company's ability to sustain and/or grow its business by increasing reserves and resources through new discoveries; and (2) the requirement to record a deferred tax liability for the difference between the assigned values and the tax basis of assets acquired and liabilities assumed in a business combination at amounts that do not reflect fair value.
Pro forma results of operations for Agnico-Eagle assuming the acquisition of Comaplex described above had occurred as of January 1, 2009 are detailed below. On a pro forma basis, there would have been no effect on Agnico-Eagle's consolidated revenues:
| Years Ended December 31, | |||||||
| 2010 | 2009 | ||||||
| Unaudited | |||||||
| Pro forma net income attributed to common shareholders | $ | 331,516 | $ | 85,371 | |||
| Pro forma net income per share – basic | $ | 2.04 | $ | 0.55 | |||
214 AGNICO-EAGLE MINES LIMITED
11. ACCOUNTS PAYABLE AND ACCRUED LIABILITIES
| As at December 31, | |||||||
| 2012 | 2011 | ||||||
| Trade payables | $ | 89,289 | $ | 104,699 | |||
| Wages payable | 35,752 | 27,247 | |||||
| Accrued liabilities | 27,372 | 47,462 | |||||
| Goldex mine government grant | – | 1,452 | |||||
| Other liabilities | 32,916 | 22,687 | |||||
| $ | 185,329 | $ | 203,547 | ||||
In 2012 and 2011, the other liabilities balance mainly consisted of various employee payroll tax withholdings and other payroll taxes.
12. COMMITMENTS AND CONTINGENCIES
As part of its ongoing business and operations, the Company has been required to provide assurance in the form of letters of credit for environmental and site restoration costs, custom credits, government grants and other general corporate purposes. As at December 31, 2012, the total amount of these guarantees was $147.3 million.
Certain of the Company's properties are subject to royalty arrangements. The following are the most significant royalty arrangements:
The Company has a royalty agreement with the Finnish government relating to the Kittila mine. Starting 12 months after Kittila mine operations commenced, the Company is required to pay 2% on net smelter returns, defined as revenue less processing costs. The royalty is paid on a yearly basis the following year.
The Company is committed to pay a royalty on production from certain properties in the Abitibi area. The type of royalty agreements include, but are not limited to, net profits interest royalties and net smelter return royalties, with percentages ranging from 0.5% to 5%.
The Company is committed to pay a royalty on production from certain properties in the Pinos Altos mine area. The type of royalty agreements include, but are not limited to, net profits interest royalties and net smelter return royalties, with percentages ranging from 1.0% to 3.5%.
The Company regularly enters into various earn-in and shareholder agreements, often with commitments to pay net smelter return and other royalties.
2012 ANNUAL REPORT 215
The Company had the following purchase commitments as at December 31, 2012:
| Years ended December 31,: | Purchase Commitments |
|||
| 2013 | $ | 12,258 | ||
| 2014 | 12,428 | |||
| 2015 | 7,080 | |||
| 2016 | 5,071 | |||
| 2017 | 4,466 | |||
| Thereafter | 22,274 | |||
| Total | $ | 63,577 | ||
13. LEASES
(a) Capital leases
In each of 2010 and 2009, the Company entered into five sale-leaseback agreements with third parties for various fixed and mobile equipment within Canada. These arrangements represent sale-leaseback transactions in accordance with ASC 840-40 – Sale-Leaseback Transactions. The sale-leaseback agreements have an average effective annual interest rate of 6.18% and the average length of the contracts is 4.5 years.
All of the sale-leaseback agreements have end of lease clauses that qualify as bargain purchase options that the Company expects to execute. As at December 31, 2012, the total gross amount of assets recorded under sale-leaseback capital leases amounted to $33.9 million (2011 – $33.6 million).
The Company has agreements with third party providers of mobile equipment that are used at the Meadowbank and Kittila mines. These arrangements represent capital leases in accordance with the guidance in ASC 840-30 – Capital Leases. The leases for mobile equipment at the Kittila and Meadowbank mines are for five years. The effective annual interest rate on the lease for mobile equipment at the Meadowbank mine is 5.64%. The effective annual interest rate on the lease for mobile equipment at the Kittila mine is 4.99%.
216 AGNICO-EAGLE MINES LIMITED
The following is a schedule of future minimum lease payments under capital leases together with the present value of the net minimum lease payments as at December 31, 2012:
| Years ended December 31,: | Minimum Capital Lease Payments |
|||
| 2013 | $ | 14,052 | ||
| 2014 | 8,970 | |||
| 2015 | 3,646 | |||
| 2016 | – | |||
| 2017 | – | |||
| Thereafter | – | |||
| Total minimum lease payments | 26,668 | |||
| Less amount representing interest | 1,605 | |||
| Present value of net minimum lease payments | $ | 25,063 | ||
The Company's capital lease obligations are comprised of the following:
| As at December 31, | |||||
| 2012 | 2011 | ||||
| Total future lease payments | $26,668 | $40,630 | |||
| Less: interest | 1,605 | 3,378 | |||
| 25,063 | 37,252 | ||||
| Less: current portion | 12,955 | 11,068 | |||
| Long-term portion of capital lease obligations | $12,108 | $26,184 | |||
At December 31, 2012, the gross amount of assets recorded under capital leases, including sale-leaseback capital leases was $51.0 million (2011 – $56.9 million; 2010 – $56.9 million). The charge to income resulting from the amortization of assets recorded under capital leases is included in the amortization of property, plant and mine development line item of the consolidated statements of income (loss) and comprehensive income (loss).
(b) Operating leases
The Company has a number of operating lease agreements involving office space. Some of the leases for office facilities contain escalation clauses for increases in operating costs and property taxes. Future minimum lease
2012 ANNUAL REPORT 217
payments required to meet obligations that have initial or remaining non-cancellable lease terms in excess of one year as at December 31, 2012 are as follows:
| Years ended December 31,: | Minimum Operating Lease Payments |
|||
| 2013 | $ | 1,434 | ||
| 2014 | 1,013 | |||
| 2015 | 837 | |||
| 2016 | 822 | |||
| 2017 | 813 | |||
| Thereafter | 3,473 | |||
| Total | $ | 8,392 | ||
The portion of operating leases relating to rental expense was $1.1 million in 2012 (2011 – $0.9 million; 2010 – $4.1 million).
14. RESTRICTED CASH
As part of the Company's insurance programs fronted by a third party provider and reinsured through the Company's internal insurance program, the third party provider requires that cash of $4.7 million be restricted as at December 31, 2012 (2011 – $3.4 million).
As part of the Company's tax planning, $32.0 million was contributed to a qualified environmental trust ("QET") in December 2011 to fulfill the requirement of financial security for costs related to the environmental remediation of the Goldex mine. During the year ended December 31, 2012, $12.0 million was withdrawn from the QET to fund the environmental remediation expenditures. As at December 31, 2012, $20.7 million remained in the QET.
15. FINANCIAL INSTRUMENTS
Agnico-Eagle has entered into financial instruments with several financial institutions in order to hedge underlying cash flow and fair value exposures arising from changes in commodity prices, interest rates, equity prices or foreign currency exchange rates.
Currency risk management
In 2012 and 2011, financial instruments that subjected Agnico-Eagle to market risk and concentration of credit risk consisted primarily of cash and cash equivalents and short-term investments. Agnico-Eagle places its cash and cash equivalents and short-term investments in high quality securities issued by government agencies, financial institutions and major corporations and limits the amount of credit exposure by diversifying its holdings.
Agnico-Eagle generates almost all of its revenues in US dollars. The Company's Canadian operations, which include the LaRonde, Goldex, Lapa and Meadowbank mines and the Meliadine project have Canadian dollar requirements for capital, operating and exploration expenditures.
218 AGNICO-EAGLE MINES LIMITED
The Company utilizes foreign exchange hedges to reduce the variability in expected future cash flows arising from changes in foreign currency exchange. The hedged items represent a portion of the Canadian dollar denominated cash outflows arising from Canadian dollar denominated expenditures in 2012.
The forward contracts with a cash flow hedging relationship that did qualify for hedge accounting hedged $60 million of 2011 expenditures at an average rate of US$1.00 = C$0.99 and $300 million of 2012 expenditures at an average rate of US$1.00 = C$1.01. The hedges that expired during the year resulted in a realized gain of $2.8 million (2011 – $(1.5) million). As at December 31, 2012, the Company recognized a mark-to-market gain of nil (2011 – $(4.4) million) in accumulated other comprehensive loss. Amounts deferred in accumulated other comprehensive loss are reclassified to the production costs line item on the consolidated statements of income (loss) and comprehensive income (loss), as applicable, when the hedged transaction has occurred.
Mark-to-market gains (losses) related to foreign exchange derivative financial instruments are recorded at fair value based on broker-dealer quotations that utilize period end forward pricing of the currency hedged.
In 2011, the Company entered into foreign exchange forward contracts with an ineffective cash flow hedging relationship that did not qualify for hedge accounting. The risk hedged in 2011 was the variability in expected future cash flows arising from changes in foreign currency exchange. The hedged items represented a portion of the unhedged forecasted Canadian dollar denominated cash outflows arising from Canadian dollar denominated expenditures in 2011. The forward contracts hedged $150 million of 2011 expenditures and nil of 2012 expenditures at an average rate of US$1.00 = C$0.99. The hedges that expired in 2011 resulted in a realized loss of $1.4 million that was recognized in the loss (gain) on derivative financial instruments line item of the consolidated statements of income (loss) and comprehensive income (loss). As at December 31, 2011, all ineffective cash flow hedges had expired. There were no foreign exchange forward contracts with ineffective cash flow hedging relationships purchased or outstanding in 2012.
The Company's other foreign currency derivative strategies in 2012 consisted mainly of writing US dollar call options with short maturities to generate premiums that would, in essence, enhance the spot transaction rate received when exchanging US dollars to Canadian dollars. All of these derivative transactions expired prior to year end such that no derivatives were outstanding as at December 31, 2012. The Company's foreign currency derivative strategy generated $1.5 million in call option premiums for the year ended December 31, 2012 (2011 – $5.0 million) that were recognized in the loss (gain) on derivative financial instruments line item of the consolidated statements of income (loss) and comprehensive income (loss).
Commodity price risk management
In the first quarter of 2011, to mitigate the risks associated with fluctuating zinc prices, the Company entered into a zero-cost collar to hedge the price on a portion of zinc associated with the LaRonde mine's 2011 production. The purchase of zinc put options was financed through selling zinc call options at a higher level such that the net premium payable to the counterparty by the Company was nil. There were no zinc zero-cost collars purchased or outstanding in 2012.
A total of 20,000 metric tonnes of zinc call options were written at a strike price of $2,500 per metric tonne with 2,000 metric tonnes expiring each month beginning February 28, 2011. A total of 20,000 metric tonnes of zinc put options were purchased at a strike price of $2,200 per metric tonne with 2,000 metric tonnes expiring each month beginning February 28, 2011. While setting a minimum price, the zero-cost collar strategy also limits participation to zinc prices above $2,500 per metric tonne. These contracts did not qualify for hedge accounting under ASC 815 – Derivatives and Hedging. Gains or losses, along with mark-to-market adjustments, were recognized in the loss (gain) on derivative financial instruments line item of the consolidated statements of income (loss) and comprehensive income (loss). All options entered into during 2011 expired during the year resulting in a realized gain of $2.8 million.
2012 ANNUAL REPORT 219
The Company also uses intra-quarter zinc, copper and silver derivative financial instruments associated with the timing of sales of the related products during 2012 that were recognized in the loss (gain) on derivative financial instruments line item of the consolidated statements of income (loss) and comprehensive income (loss). There were no zinc, copper or silver intra-quarter derivative financial instruments outstanding at December 31, 2012 or December 31, 2011.
In the second quarter of 2012, to mitigate the risks associated with fluctuating diesel fuel prices, the Company entered into financial contracts to hedge the price on a portion of diesel fuel costs associated with the Meadowbank mine's diesel fuel exposure (as it relates to operating costs). The financial contracts that expired in 2012 totalled 9.5 million gallons of heating oil, representing approximately 55% of Meadowbank's expected 2012 diesel fuel exposure. In addition, the financial contracts expiring in 2013 total 0.5 million gallons of heating oil, representing approximately 3% of Meadowbank's expected 2013 diesel fuel exposure. The contracts that expired in 2012 did not qualify for hedge accounting and the related realized loss of $1.5 million was recognized in the loss (gain) on derivative financial instruments line item of the consolidated statements of income (loss) and comprehensive income (loss). The contracts expiring in 2013 qualify for hedge accounting and the related $0.1 million market-to-market gain as at December 31, 2012 was recognized in the accumulated other comprehensive loss ("AOCI") line item on the consolidated balance sheets. The Company was not a party to any similar heating oil derivative financial instruments in 2011. Amounts deferred in AOCI are reclassified to the production costs line item on the consolidated statements of income (loss) and comprehensive income (loss), as applicable, when the derivative financial instrument has settled. Mark-to-market gains (losses) related to heating oil derivative financial instruments are based on broker-dealer quotations that utilize period end forward pricing to calculate fair value.
The following table details the changes in the AOCI balances recorded in the consolidated financial statements pertaining to the foreign exchange and commodity hedging activities. The fair values, based on calculated mark-to-market valuations, of recorded derivative related assets and liabilities and their corresponding entries to AOCI reflect the netting of the fair values of individual derivative financial instruments.
| 2012 | 2011 | |||||||
| AOCI, beginning of year | $ | (4,404 | ) | $ | – | |||
| (Gain) loss reclassified from AOCI into production cost | (2,758 | ) | 1,459 | |||||
| Loss recognized in OCI – heating oil derivative financial instruments | (117 | ) | – | |||||
| Gain (loss) recognized in OCI – foreign exchange and other derivative financial instruments | 7,019 | (5,863 | ) | |||||
| AOCI, end of year | $ | (260 | ) | $ | (4,404 | ) | ||
As at December 31, 2012 and 2011, there were no metal derivative positions. The Company may from time to time utilize short-term (including intra-quarter) financial instruments as part of its strategy to minimize risks and optimize returns on its byproduct metal sales.
Other required derivative disclosures can be found in note 7(d), accumulated other comprehensive loss.
220 AGNICO-EAGLE MINES LIMITED
The following table provides a summary of the amounts recognized in the loss (gain) on derivative financial instruments line item of the consolidated statements of income (loss) and comprehensive income (loss):
| Years Ended December 31, | |||||||||||
| 2012 | 2011 | 2010 | |||||||||
| Premiums realized on written foreign exchange call options | $ | 1,505 | $ | 4,995 | $ | 4,845 | |||||
| Realized gain on foreign exchange extendible flat forward | – | – | 1,797 | ||||||||
| Realized loss on foreign exchange forwards | – | (1,407 | ) | – | |||||||
| Realized gain on foreign exchange collar | – | – | 711 | ||||||||
| Mark-to-market gain on foreign exchange extendible flat forward(i) | – | – | 142 | ||||||||
| Realized gain on zinc derivative financial instruments | 430 | 3,419 | 3,733 | ||||||||
| Realized gain (loss) on copper derivative financial instruments | 63 | 79 | (558 | ) | |||||||
| Realized loss on silver derivative financial instruments | – | (3,403 | ) | (3,058 | ) | ||||||
| Mark-to-market loss on warrants(i) | (1,294 | ) | – | – | |||||||
| Realized loss on heating oil derivative financial instruments | (1,523 | ) | – | – | |||||||
| (Loss) gain on derivative financial instruments | $ | (819 | ) | $ | 3,683 | $ | 7,612 | ||||
- (i)
- Mark-to-market gains and losses on financial instruments that did not qualify for hedge accounting are recognized through the loss (gain) on derivative financial instruments line item of the consolidated statements of income (loss) and comprehensive income (loss) and through the other line item of the consolidated statements of cash flow.
Note:
Agnico-Eagle's exposure to interest rate risk at December 31, 2012 relates to its cash and cash equivalents, short-term investments and restricted cash totalling $332.0 million (2011 – $221.5 million) and the Credit Facility. The Company's short-term investments and cash equivalents have a fixed weighted average interest rate of 0.47% (2011 – 0.61%).
The fair values of Agnico-Eagle's current financial assets and liabilities approximate their carrying values as at December 31, 2012.
16. GENERAL AND ADMINISTRATIVE
As a result of a kitchen fire at the Meadowbank mine in March 2011, the Company recognized a loss on disposal of the kitchen of $6.9 million, incurred related costs of $7.4 million and recognized an insurance receivable of $11.2 million. The difference of $3.1 million was recognized in the general and administrative line item of the consolidated statements of income (loss) and comprehensive income (loss) in the first quarter of 2011.
During the subsequent months of 2011, the Company received $2.4 million of insurance proceeds and had a remaining insurance receivable of $8.8 million recorded in the other current assets line item of the consolidated balance sheets as at December 31, 2011. During the year ended December 31, 2012, the Company received $2.2 million of insurance proceeds and had a remaining insurance receivable of $6.6 million as at December 31, 2012.
2012 ANNUAL REPORT 221
17. LOSS ON GOLDEX MINE
On October 19, 2011, the Company announced that it was suspending mining operations and gold production at the Goldex mine in Quebec, Canada, effective immediately. This decision followed the receipt of an opinion from a second rock mechanics consulting firm which recommended that underground mining operations be halted. It appeared that a weak volcanic rock unit in the hanging wall above the Goldex Extension Zone ("GEZ") of the Goldex mine deposit had failed. This rock failure was thought to extend between the top of the deposit and surface. As a result, this structure allowed an increase in ground water to flow into the mine.
As at September 30, 2011, Agnico-Eagle had written off its investment in the Goldex mine (net of expected residual value), written off the underground ore stockpile and recorded a provision for the anticipated costs of environmental remediation. Given the amount of uncertainty in estimating the fair value of the Goldex mine property, plant, and mine development, the Company determined that the fair value was equal to the residual value. All of the remaining 1.6 million ounces of proven and probable gold reserves at the Goldex mine, other than the ore stockpiled on surface, were reclassified as mineral resources effective September 30, 2011. The Goldex mine is part of the Canada segment as detailed in note 19.
The mill processed feed from the remaining surface stockpile at the Goldex mine in October 2011.
| Impairment loss on Goldex mine property, plant, and mine development | $237,110 | ||
| Loss on underground ore stockpile | 16,641 | ||
| Supplies inventory obsolescence provision | 1,915 | ||
| Increase in environmental remediation liability | 47,227 | ||
| Loss on Goldex mine (before income and mining taxes) for the year ended December 31, 2011 | $302,893 | ||
The environmental remediation liability for the anticipated costs of remediation associated with the suspension of operations at the Goldex mine has required management to make estimates and judgments that affect the reported amount. In making judgments in accordance with US GAAP, the Company uses estimates based on historical experience and various assumptions that are considered reasonable in the circumstances. Actual results may differ from these estimates.
In July 2012, the Company's Board approved the development of the M and E Zones at the Goldex mine. The operations in the GEZ remain suspended indefinitely.
18. IMPAIRMENT LOSS ON MEADOWBANK MINE
For the year ended December 31, 2011, the Company performed a full review of the Meadowbank mine operations and updated the related life of mine plan. This review considered the exploration potential of the area, the mineral reserves and resources, the projected operating costs in light of the persistently high operating costs experienced since commencement of commercial operations, metallurgical performance and gold price. These served as inputs into pit optimizations to determine which reserves and resources could be economically mined and be considered as mineable mineral reserves. As a result of these factors, an updated mine plan with a shorter mine life was developed and cash flows calculated, resulting in an impairment charge to the Meadowbank mine carrying value of $907.7 million for the year ended December 31, 2011. The Meadowbank mine had a property, plant and mine development book value of approximately $1.7 billion prior to recording this impairment charge.
Net estimated future cash flows from the Meadowbank mine were calculated as at December 31, 2011, on an undiscounted basis, based on best estimates of future gold production, which were based on long-term gold prices from $1,250 to $1,553 per ounce (in real terms), foreign exchange rates from US$0.92:C$1.00 to US$0.97:C$1.00,
222 AGNICO-EAGLE MINES LIMITED
increased cost estimates based on revised operating levels, average gold recovery of 92.9% and expected continuation of operations to 2017, including the processing of stockpiled ore. Future expected operating costs, capital expenditures, and asset retirement obligations were based on the updated life of mine plan. The fair value was calculated by discounting the estimated future net cash flows using a 5% interest rate (in real terms), commensurate with the estimated level of risk. Management's estimate of future cash flows is subject to risk and uncertainties. Therefore, it is reasonably possible that changes could occur which may affect the recoverability of the Company's long-lived assets and may have a material effect on the Company's consolidated financial statements. The Meadowbank mine is a part of the Canada segment as detailed in note 19.
19. SEGMENTED INFORMATION
Agnico-Eagle operates in a single industry, namely exploration for and production of gold. The Company's primary operations are in Canada, Mexico and Finland. The Company identifies its reportable segments as those operations whose operating results are reviewed by the Chief Executive Officer and that represent more than 10% of the combined revenue, profit or loss or total assets of all operating segments. The following are the reportable segments of the Company and reflect how the Company manages its business and how it classifies its operations for planning and measuring performance:
Canada: |
LaRonde mine, Lapa mine, Goldex mine, Meadowbank mine, Meliadine project and the Regional office |
|
Latin America: |
Pinos Altos mine, Creston Mascota deposit at Pinos Altos and the La India project |
|
Europe: |
Kittila mine |
|
Exploration: |
United States Exploration office, Europe Exploration office, Canada Exploration offices and the Latin America Exploration office |
The accounting policies of the reportable segments are the same as those described in the accounting policies note. There are no transactions between the reportable segments affecting revenue. Production costs for the reportable segments are net of intercompany transactions. Of the $229.3 million of goodwill reflected on the consolidated balance sheets at December 31, 2012, $200.1 million relates to the Meliadine project which is a component of the Canada segment and $29.2 million relates to the La India project which is a component of the Latin America segment.
2012 ANNUAL REPORT 223
Corporate head office assets are included in the Canada segment and specific corporate income and expense items are noted separately below.
The Meadowbank mine achieved commercial production on March 1, 2010. The Creston Mascota deposit at Pinos Altos achieved commercial production on March 1, 2011. The LaRonde mine extension achieved commercial production on December 1, 2011.
| Year ended December 31, 2012: |
Revenues from Mining Operations |
Production Costs |
Exploration and Corporate Development |
Amortization of Property, Plant and Mine Development |
Foreign Currency Translation (Loss) Gain |
Segment Income (Loss) |
||||||||||||
| Canada | $1,182,621 | $(646,733 | ) | $ | (37,627 | ) | $(204,243 | ) | $ | (6,294 | ) | $ | 287,724 | |||||
| Latin America | 450,664 | (152,942 | ) | – | (37,527 | ) | 3,305 | 263,500 | ||||||||||
| Europe | 284,429 | (98,037 | ) | – | (30,091 | ) | (18,726 | ) | 137,575 | |||||||||
| Exploration | – | – | (71,873 | ) | – | 5,395 | (66,478 | ) | ||||||||||
| $1,917,714 | $(897,712 | ) | $ | (109,500 | ) | $(271,861 | ) | $ | (16,320 | ) | $ | 622,321 | ||||||
| Segment income | $ | 622,321 | ||||||||||||||||
| Corporate and other: | ||||||||||||||||||
| Interest and sundry expense | (2,389 | ) | ||||||||||||||||
| Gain on sale of available-for-sale securities | 9,733 | |||||||||||||||||
| Loss on derivative financial instruments | (819 | ) | ||||||||||||||||
| General and administrative | (119,085 | ) | ||||||||||||||||
| Impairment loss on available-for-sale securities | (12,732 | ) | ||||||||||||||||
| Provincial capital tax | (4,001 | ) | ||||||||||||||||
| Interest expense | (57,887 | ) | ||||||||||||||||
| Income before income and mining taxes | $ | 435,141 | ||||||||||||||||
224 AGNICO-EAGLE MINES LIMITED
| Year ended December 31, 2011: |
Revenues from Mining Operations |
Production Costs |
Exploration and Corporate Development |
Amortization of Property, Plant and Mine Development |
Foreign Currency Translation (Loss) Gain |
Loss on Goldex Mine |
Impairment Loss on Meadowbank Mine |
Segment (Loss) Income |
|||||||||||||
| Canada | $1,217,858 | $(619,987 | ) | $ | – | $(198,219 | ) | $ | (2,825 | ) | $(302,893 | ) | $(907,681 | ) | $(813,747 | ) | |||||
| Latin America | 378,329 | (145,614 | ) | – | (36,988 | ) | 4,955 | – | – | 200,682 | |||||||||||
| Europe | 225,612 | (110,477 | ) | – | (26,574 | ) | (1,063 | ) | – | – | 87,498 | ||||||||||
| Exploration | – | – | (75,721 | ) | – | 15 | – | – | (75,706 | ) | |||||||||||
| $1,821,799 | $(876,078 | ) | $ | (75,721 | ) | $(261,781 | ) | $ | 1,082 | $(302,893 | ) | $(907,681 | ) | $(601,273 | ) | ||||||
| Segment loss | $(601,273 | ) | |||||||||||||||||||
| Corporate and other: | |||||||||||||||||||||
| Interest and sundry expense | (5,188 | ) | |||||||||||||||||||
| Gain on sale of available-for-sale securities | 4,907 | ||||||||||||||||||||
| Impairment loss on available-for-sale securities | (8,569 | ) | |||||||||||||||||||
| Gain on derivative financial instruments | 3,683 | ||||||||||||||||||||
| General and administrative | (107,926 | ) | |||||||||||||||||||
| Provincial capital tax | (9,223 | ) | |||||||||||||||||||
| Interest expense | (55,039 | ) | |||||||||||||||||||
| Loss before income and mining taxes | $(778,628 | ) | |||||||||||||||||||
2012 ANNUAL REPORT 225
| Year ended December 31, 2010: |
Revenues from Mining Operations |
Production Costs |
Exploration and Corporate Development |
Amortization of Property, Plant and Mine Development |
Foreign Currency Translation (Loss) Gain |
Segment Income (Loss) |
||||||||||
| Canada | $1,086,744 | $(499,621 | ) | $ | – | $(140,024 | ) | $(22,815 | ) | $424,284 | ||||||
| Latin America | 175,637 | (90,116 | ) | – | (21,134 | ) | 2,126 | 66,513 | ||||||||
| Europe | 160,140 | (87,735 | ) | – | (31,231 | ) | 2,780 | 43,954 | ||||||||
| Exploration | – | – | (54,958 | ) | (97 | ) | (1,627 | ) | (56,682 | ) | ||||||
| $1,422,521 | $(677,472 | ) | $ | (54,958 | ) | $(192,486 | ) | $(19,536 | ) | $478,069 | ||||||
| Segment income | $478,069 | |||||||||||||||
| Corporate and other: | ||||||||||||||||
| Interest and sundry income | 10,254 | |||||||||||||||
| Gain on acquisition of Comaplex Minerals Corp., net of transaction costs | 57,526 | |||||||||||||||
| Gain on sale of available-for-sale securities | 19,487 | |||||||||||||||
| Gain on derivative financial instruments | 7,612 | |||||||||||||||
| General and administrative | (94,327 | ) | ||||||||||||||
| Provincial capital tax | 6,075 | |||||||||||||||
| Interest expense | (49,493 | ) | ||||||||||||||
| Income before income and mining taxes | $435,203 | |||||||||||||||
| Total Assets as at December 31, | |||||
| 2012 | 2011 | ||||
| Canada | $3,279,881 | $3,205,158 | |||
| Latin America | 1,069,379 | 1,020,078 | |||
| Europe | 846,941 | 771,714 | |||
| Exploration | 59,641 | 37,312 | |||
| $5,255,842 | $5,034,262 | ||||
226 AGNICO-EAGLE MINES LIMITED
| Capital Expenditures Years Ended December 31, |
|||||||
| 2012 | 2011 | 2010 | |||||
| Canada | $316,234 | $347,790 | $335,198 | ||||
| Latin America | 69,225 | 39,966 | 104,475 | ||||
| Europe | 60,036 | 86,514 | 71,968 | ||||
| Exploration | 55 | 8,561 | – | ||||
| $445,550 | $482,831 | $511,641 | |||||
20. SUBSEQUENT EVENTS
On March 19, 2013, the Company entered into a subscription agreement for 9,600,000 units of ATAC Resources Ltd. ("ATC") at a private placement price of C$1.35 per unit for total consideration of C$13.0 million. Each unit is comprised of one common share of ATC and one-half of one common share purchase warrant, representing 8.48% of the issued and outstanding common shares of ATC. Each whole common share purchase warrant entitles the holder to acquire one common share of ATC at a price of C$2.10 for a period of 18 months from the March 22, 2013 closing date. If the closing price of ATC's common shares exceeds C$3.00 for a period of ten consecutive trading days subsequent to the expiry of the applicable four month hold period, ATC may provide notice that the common share purchase warrants will expire 30 days from the date of such notice.
21. SECURITIES CLASS ACTION LAWSUITS
On November 7, 2011 and November 22, 2011, the Company and certain current and former officers who also are, or were, directors were named as defendants in two putative class action lawsuits, styled Jerome Stone v. Agnico-Eagle Mines Ltd., et al., and Chris Hastings v. Agnico-Eagle Mines Limited, et al., respectively, which were filed in the United States District Court for the Southern District of New York. On February 6, 2012, the court entered an order consolidating the actions under the caption In re Agnico-Eagle Mines Ltd. Securities Litigation and appointed a lead plaintiff (not one of the plaintiffs who filed the original complaints). On April 6, 2012, the lead plaintiff served its Consolidated Complaint (the "Complaint"). The Complaint names the Company, its current Chief Executive Officer and its former President and Chief Operating Officer as defendants and purports to be brought on behalf of all persons and entities who purchased or otherwise acquired the Company's publicly traded securities in the United States or on a U.S. exchange during the period July 28, 2010 through October 19, 2011 (the "Class Period"). The Complaint alleges, among other things, that defendants violated U.S. securities laws by misrepresenting the Company's gold reserves and the status, ability to operate and projected production of its Goldex mine. The Complaint seeks, among other things, (i) a determination that the action is a proper class action and (ii) an award of unspecified damages, attorneys' fees and expenses. On June 6, 2012, the Company and the other defendants filed a motion, pursuant to the Private Securities Litigation Reform Act and Rules 9(b) and 12(b)(6) of the Federal Rules of Civil Procedure, to dismiss the Consolidated Complaint, for failure to state a claim upon which relief could be granted. On January 14, 2013, Judge Oetken granted the Company's motion to dismiss the Complaint and all claims therein and denied the plaintiffs' request for leave to amend the Complaint. On February 12, 2013, the plaintiffs filed a Notice of Appeal to the United States Court of Appeals for the Second Circuit. No date has been set for the appeal.
On March 8, 2012 and April 10, 2012, a Notice of Action and Statement of Claim (collectively, the "Ontario Claim") were issued by William Leslie, AFA Livforsakringsaktiebolag and certain other entities against the Company and
2012 ANNUAL REPORT 227
certain of its current and former officers and directors. On September 27, 2012, the plaintiffs issued a Fresh as Amended Statement of Claim. The Fresh as Amended Statement of Claim alleges that the Company's public disclosure concerning water flow issues at its Goldex mine was misleading. The Ontario Claim was issued by the plaintiffs on behalf of all persons and entities who acquired securities of the Company during the period March 26, 2010 to October 19, 2011, excluding persons resident or domiciled in the Province of Quebec at the time they purchased or acquired such securities. The plaintiffs seek, among other things, damages of C$250.0 million and to certify the Ontario Claim as a class action. The plaintiffs have brought motions for leave to commence an action under s. 138 of the Securities Act (Ontario) and to certify the action as a class action, which are scheduled to be argued April 16, 2013 to April 19, 2013. The Company intends to vigorously contest the motions and defend the Ontario Claim.
On April 12, 2012, two senior officers of the Company were served with a Motion for Leave to Institute a Class Action and for the Appointment of a Representative Plaintiff (the "Quebec Motion"). The action is on behalf of all persons and entities residing or domiciled in Quebec who acquired securities of the Company between March 26, 2010 and October 19, 2011. The proposed class action is for damages of C$100.0 million arising as a result of allegedly misleading disclosure by the Company concerning its operations at the Goldex mine. On October 15, 2012, the plaintiffs served an amended Quebec Motion seeking leave to commence an action under the Securities Act (Quebec) in addition to seeking authorization to institute a class action. No date has been set for the hearing to argue the Quebec Motion. The Company intends to vigorously contest the Quebec Motion and defend the claim.
228 AGNICO-EAGLE MINES LIMITED
Exhibits and Exhibit Index. The following Exhibits are filed as part of this Annual Report on Form 20-F and incorporated herein by reference to the extent applicable.
| Exhibit No. | Description | ||||
| 1.01 | Articles of Amalgamation of the Company. | * | |||
| 1.02 | By-Law No. 1 of the Company. | * | |||
| 4.01 | Second Amended and Restated Credit Agreement, dated as of August 4, 2011, between the Company, the guarantors party thereto, the lenders party thereto and The Bank of Nova Scotia (incorporated by reference to Exhibit 4.01 to the Company's Annual Report on Form 20-F (File No. 001-13422) for the fiscal year ended December 31, 2011, filed with the SEC on March 29, 2012). | * | |||
| 4.02 | Amendment No. 1 to the Second Amended and Restated Credit Agreement, dated as of July 20, 2012, between the Company, the guarantors party thereto, the lenders party thereto and The Bank of Nova Scotia. | * | |||
| 4.03 | Amended and Restated Stock Option Plan.** | * | |||
| 4.04 | Amended and Restated Incentive Share Purchase Plan.** | * | |||
| 4.05 | Restricted Share Unit Plan for Directors, Senior Executives and Employees of Agnico-Eagle Mines Limited, as amended.** | * | |||
| 4.06 | Warrant Indenture, dated as of April 4, 2009, between the Company and Computershare Trust Company of Canada (incorporated by reference to Exhibit 4.05 to the Company's Annual Report on Form 20-F (File No. 001-13422) for the fiscal year ended December 31, 2009, filed with the SEC on March 26, 2010). | * | |||
| 4.07 | Note Purchase Agreement, dated as of April 7, 2010, between the Company and the purchasers party thereto (incorporated by reference to Exhibit 4.05 to the Company's Annual Report on Form 20-F (File No. 001-13422) for the fiscal year ended December 31, 2010, filed with the SEC on March 28, 2011). | * | |||
| 4.08 | Note Purchase Agreement, dated as of July 24, 2012, between the Company and the purchasers party thereto. | * | |||
| 4.09 | Credit Agreement, dated as of June 26, 2012, between the Company, the guarantors party thereto and the Bank of Nova Scotia relating to a C$150 million uncommitted letter of credit facility. | * | |||
| 8.01 | List of subsidiaries of the Company. | * | |||
| 11.01 | Code of Business Conduct and Ethics of the Company. | * | |||
| 12.01 | Certification Pursuant to Section 302 of the Sarbanes-Oxley Act of 2002 (Subsections (A) and (B) of Section 1350, Chapter 63 of Title 18, United States Code) (Sean Boyd). | * | |||
| 12.02 | Certification Pursuant to Section 302 of the Sarbanes-Oxley Act of 2002 (Subsections (A) and (B) of Section 1350, Chapter 63 of Title 18, United States Code) (David Smith). | * | |||
| 13.01 | Certification pursuant to Title 18, United States Code, Section 1350 as adopted pursuant to Section 906 of the Sarbanes-Oxley Act of 2002 (Sean Boyd).*** | * | |||
| 13.02 | Certification pursuant to Title 18, United States Code, Section 1350 as adopted pursuant to Section 906 of the Sarbanes-Oxley Act of 2002 (David Smith).*** | * | |||
| 15.01 | Consent of Independent Registered Public Accounting Firm. | * | |||
| 15.02 | Audit Committee Charter (incorporated by reference to Exhibit 15.04 to the Company's Annual Report on Form 20-F (File No. 001-13422) for the fiscal year ended December 31, 2005 filed with the SEC on March 28, 2006). | * | |||
| 15.03 | Consent of Daniel Doucet. | * | |||
| 101 | The following financial information from Agnico-Eagle Mines Limited's Comparative Audited Consolidated Financial Statements, formatted in XBRL (Extensible Business Reporting Language) and furnished electronically herewith: (i) the Consolidated Statements of Income; (ii) the Consolidated Statements of Cash Flow; (iii) the Consolidated Balance Sheets; (iv) the Consolidated Statements of Shareholders' Equity; (v) the Consolidated Statements of Comprehensive Income; and (vi) the Notes to Consolidated Financial Statements, tagged as blocks of text. | ||||
- *
- Such
exhibits and other information filed by the Company with the SEC are available to shareholders upon request at the SEC's public reference section, may be inspected and copied at
prescribed rates at the public reference room maintained by the SEC located at 110 F Street, N.E., Room 1580, Washington, D.C. 20549, U.S.A. or may be accessed electronically at
the SEC's website (www.sec.gov).
- **
- Management
contracts or compensatory plan, contract or arrangements required to be filed and herein incorporated as an exhibit.
- ***
- Pursuant to the SEC Release No. 33-8212 and 34-47551, this certification will be treated as "accompanying" this Annual Report on Form 20-F and not "filed" as part of such report for purposes of Section 18 of the Exchange Act, or otherwise subject to the liability of Section 18 of the Exchange Act, and this certification will not be incorporated by reference into any filing under the U.S. Securities Act or the Exchange Act, except to the extent that the Company specifically incorporates it by reference.
2012 ANNUAL REPORT 229
The registrant hereby certifies that it meets all of the requirements for filing on Form 20-F and that it has duly caused and authorized the undersigned to sign this Annual Report on Form 20-F on its behalf.
| AGNICO-EAGLE MINES LIMITED | |||
| Toronto, Canada March 28, 2013 |
|||
| By: | /s/ DAVID SMITH David Smith Senior Vice-President, Finance and Chief Financial Officer |
||
230 AGNICO-EAGLE MINES LIMITED