UNITED STATES SECURITIES AND EXCHANGE COMMISSION
Washington, D.C. 20549
FORM 20-F
| REGISTRATION STATEMENT PURSUANT TO SECTION 12(b) OR (g) OF THE SECURITIES EXCHANGE ACT OF 1934 | ||||||||
| OR | ||||||||
ANNUAL REPORT PURSUANT TO SECTION 13 OR 15(d) OF THE SECURITIES EXCHANGE ACT OF 1934 FOR THE FISCAL YEAR ENDED ON | ||||||||
| OR | ||||||||
| TRANSITION REPORT PURSUANT TO SECTION 13 OR 15(d) OF THE SECURITIES EXCHANGE ACT OF 1934 | ||||||||
FOR THE TRANSITION PERIOD FROM TO ________________ | ||||||||
| OR | ||||||||
| SHELL COMPANY REPORT PURSUANT TO SECTION 13 OR 15(d) OF THE SECURITIES EXCHANGE ACT OF 1934 | ||||||||
| Date of event requiring this shell company report | ||||||||
COMMISSION FILE NUMBER: 001-35052
(Exact name of Registrant as specified in its charter)
N/A
(Translation of Registrant’s name into English)
(Jurisdiction of incorporation or organization)
Tel: +352.2644.9372
(Address of principal executive offices)
Email: manuela.lamellari@intertrustgroup.com
Tel: +352 .26449.494
(Name, Telephone, E-Mail and/or Facsimile number and Address of Company Contact Person)
Securities registered or to be registered pursuant to Section 12(b) of the Act:
| Title of Each Class | Trading Symbol | Name of Each Exchange on Which Registered | ||||||
Securities registered or to be registered pursuant to Section 12(g) of the Act:
None
Securities for which there is a reporting obligation pursuant to Section 15(d) of the Act:
None
The number of outstanding shares of each of the issuer’s classes of capital stock
as of December 31, 2022:
Indicate by check mark if the registrant is a well-known seasoned issuer, as defined in Rule 405 of the Securities Act
Yes ¨ No þ
If this report is an annual or transition report, indicate by check mark if the registrant is not required to file reports pursuant to Section 13 or 15(d) of the Securities Exchange Act of 1934.
Yes ¨ No þ
Indicate by check mark whether the Registrant (1) has filed all reports required to be filed by Section 13 or 15(d) of the Securities Exchange Act of 1934 during the preceding 12 months (or for such shorter period that the Registrant was required to file such reports) and (2) has been subject to such filing requirements for the past 90 days.
Indicate by check mark whether the registrant has submitted electronically every Interactive Data File required to be submitted pursuant to Rule 405 of Regulation S-T (§232.405 of this chapter) during the preceding 12 months (or for such shorter period that the registrant was required to submit and post such files).
Indicate by check mark whether the registrant is a large accelerated filer, an accelerated filer, a non-accelerated filer, or an emerging growth company. See definition of “large accelerated filer,” “accelerated filer,” and “emerging growth company” in Rule 12b-2 of the Exchange Act. (Check one):
Large accelerated filer ☐ | Non-accelerated filer ¨ | |||||||
Emerging growth company | ||||||||
If an emerging growth company that prepares its financial statements in accordance with U.S. GAAP, indicate by check mark if the registrant has elected not to use the extended transition period for complying with any new or revised financial accounting standards provided pursuant to Section 13(a) of the Exchange Act. ¨
Indicate by check mark whether the registrant has filed a report on and attestation to its management’s assessment of the effectiveness of its internal control over financial reporting under Section 404(b) of the Sarbanes-Oxley Act (15 U.S.C. 7262(b)) by the registered public accounting firm that prepared or issued its audit report.
If securities are registered pursuant to Section 12(b) of the Act, indicate by check mark whether the financial statements of the
registrant included in the filing reflect the correction of an error to previously issued financial statements.
Indicate by check mark whether any of those error corrections are restatements that required a recovery analysis of incentive-based compensation received by any of the registrant’s executive officers during the relevant recovery period pursuant to §240.10D-1(b).
Indicate by check mark which basis of accounting the registrant has used to prepare the financial statements included in this filing:
U.S. GAAP ¨ International Financial Reporting Standards as issued by the International Accounting Standards Board þ Other ¨
If “Other” has been checked in response to the previous question, indicate by check mark which financial statement item the Registrant has elected to follow:
Item 17 ¨ Item 18 ¨
If this is an annual report, indicate by check mark whether the registrant is a shell company (as defined in Rule 12b-2 of the Exchange Act). Yes ¨ No þ
TABLE OF CONTENTS
i
ii
iii
FORWARD-LOOKING STATEMENTS
This annual report contains forward-looking statements that are based on our current expectations, assumptions, estimates and projections about us and our industry. These forward-looking statements can be identified by words or phrases such as “anticipate,” “believe,” “continue,” “estimate,” “expect,” “intend,” “is/are likely to,” “may,” “plan,” “should,” “would,” or other similar expressions. The forward-looking statements included in this annual report relate to, among others:
•our business prospects and future results of operations;
•weather and other natural phenomena;
•the length and severity of the coronavirus (COVID-19) pandemic or any other pandemic outbreak;
•developments in, or changes to, the laws, regulations and governmental policies governing our business, including limitations on ownership of farmland by foreign entities in certain jurisdictions in which we operate, environmental laws and regulations;
•the implementation of our business strategy;
•our plans relating to acquisitions, joint ventures, strategic alliances or divestitures, and to consolidate our position in different businesses;
•the implementation of our financing strategy and capital expenditure plan;
•the maintenance of our relationships with customers;
•the competitive nature of the industries in which we operate;
•the cost and availability of financing;
•future demand for the commodities we produce;
•international prices for commodities;
•the condition of our land holdings;
•the development of the logistics and infrastructure for transportation of our products in the countries where we operate;
•the performance of the South American and world economies;
•the relative value of the Brazilian Real, the Argentine Peso and the Uruguayan Peso compared to other currencies; and
•the factors discussed under the section entitled “Risk Factors” in this annual report.
These forward-looking statements involve various risks and uncertainties. Although we believe that our expectations expressed in these forward-looking statements are reasonable, our expectations may turn out to be incorrect. Our actual results could be materially different from our expectations. In light of the risks and uncertainties described above, the estimates and forward-looking statements discussed in this annual report might not occur, and our future results and our performance may differ materially from those expressed in these forward-looking statements due to, including, but not limited to, the factors mentioned above. Because of these uncertainties, you should not make any investment decision based on these estimates and forward-looking statements.
The forward-looking statements made in this annual report relate only to events or information as of the date on which the statements are made. We undertake no obligation to update any forward-looking statements to reflect events or circumstances after the date on which the statements are made or to reflect the occurrence of unanticipated events.
iv
PRESENTATION OF FINANCIAL AND OTHER INFORMATION
Certain Defined Terms
In this annual report, unless otherwise specified or if the context so requires:
•References to the terms “Adecoagro S.A,” “Adecoagro,” “we,” “us,” “our,” “Company”; and “our company” refer to, Adecoagro S.A., a corporation organized under the form of a société anonyme under the laws of the Grand Duchy of Luxembourg, and its subsidiaries.
•References to “IFH” and “IFH LP” mean the former International Farmland Holdings, LP, a limited partnership, (previously IFH LP and International Farmland Holdings, LLC, or IFH LLC) which was merged into Adecoagro LP.
•References to “Adecoagro LP” mean Adecoagro, LP SCS, a limited partnership organized under the form of a société comandite simple under the laws of the Grand Duchy of Luxembourg (previously Adecoagro LP and Adecoagro, LLC).
•References to “$,” “US$,” “U.S. dollars” and “dollars” are to U.S. dollars.
•References to “Argentine Pesos,” “Pesos” or “Ps.” are to Argentine Pesos, the official currency of Argentina.
•References to “Brazilian Real,” “Real,” “Reais” or “R$” are to the Brazilian Real, the official currency of Brazil.
•References to “Uruguayan Pesos,” are to the Uruguayan Pesos, the official currency of Uruguay.
•Unless stated otherwise, references to “sales” are to the consolidated sales of goods and service rendered.
•References to “IFRS” are International Financial Reporting Standards issued by the International Accounting Standards Board and the interpretations of the International Financial Reporting Interpretations Committee, together “IFRS.”
Background
As part of a corporate reorganization (the “Reorganization”), Adecoagro, a Luxembourg corporation under the form of a société anonyme, was formed as a holding company for IFH for the purpose, among others, of facilitating the initial public offering (the “IPO”) of our common shares, completed on January 28, 2011. Before the IPO, Adecoagro had not engaged in any business or other activities except in connection with its formation and the Reorganization. For an additional discussion of the Reorganization, see “Item 4. Information on the Company—A. History and Development of the Company—History.”
During 2011, we contributed the net proceeds of the IPO to increase our interest in IFH from 98.0% to 98.64%. During 2012, we issued, in a series of transactions, 1,654,752 shares to certain limited partners of IFH in exchange for their residual interest in IFH, totaling 1.36%, thereby increasing our interest in IFH to approximately 100%. During 2015 IFH was merged into Adecoagro LP, our wholly-owned subsidiary. For further information see “Item 4. Information on the Company—A. History and Development of the Company—History”.
The Consolidated Financial Statements as of December 31, 2022 and 2021 and for the years ended December 31, 2022, 2021 and 2020 (hereinafter, the “Consolidated Financial Statements”) included in this annual report have been prepared in accordance with IFRS. All IFRS effective at the time of preparing the Consolidated Financial Statements have been applied.
Financial reporting in a hyperinflation economy
IAS 29 “Financial Reporting in Hyperinflationary Economies” requires that the financial statements of entities whose functional currency is that of a hyperinflationary economy to be adjusted for the effects of changes in a suitable general price index and to be expressed in terms of the current unit of measurement at the closing date of the reporting period. Accordingly, the inflation produced from the date of acquisition or from the revaluation date, as applicable, must be computed in the non-monetary items.
In order to conclude on whether an economy is categorized as hyperinflationary under the terms of IAS 29, the Standard details a series of factors to be considered, including the existence of a cumulative inflation rate in three years that approximates or exceeds 100 %.
Since 2018, when cumulative inflation rate in three years exceeded the 100% threshold, Argentina’s operations are considered to be under hyperinflationary economy for accounting purposes under the terms of IAS 29 and since then, it has been applied IAS 29 in the financial reporting of its subsidiaries and associates with Argentine peso as functional currency.
v
Non-IFRS Financial Measures
To supplement our Consolidated Financial Statements, which are prepared and presented in accordance with IFRS, we use the following non-IFRS financial measures in this annual report, which are based on the information that arose from the Consolidated Financial Statements:
•Adjusted Consolidated EBITDA;
•Adjusted Segment EBITDA;
•Adjusted Consolidated EBIT;
•Adjusted Segment EBIT;
•Adjusted Net Income;
•Adjusted Free Cash Flow;
•Adjusted Free Cash Flow from Operations;
•Net Debt; and
•Net Debt to Adjusted Consolidated EBITDA
In particular, Adjusted Consolidated EBITDA, Adjusted Segment EBITDA, Adjusted Consolidated EBIT and Adjusted
Segment EBIT arose from our segment information in the Consolidated Financial Statements. See Note 3 to our Consolidated
Financial Statements.
In this section, we provide an explanation and a reconciliation of each of our non-IFRS financial measures to the most directly comparable IFRS measures. The presentation of these financial measures is not intended to be considered in isolation or as a substitute for, or superior to, financial information prepared and presented in accordance with IFRS.
We use non-IFRS measures to internally evaluate and analyze financial results. We believe these non-IFRS financial measures provide investors with useful supplemental information about the liquidity and financial performance of our business, enable comparison of financial results between periods where certain items may vary independent of business performance, and enable comparison of our financial results with other public companies, many of which present similar non-IFRS financial measures.
There are limitations associated with the use of non-IFRS financial measures as an analytical tool. In particular, many of the adjustments to our IFRS financial measures reflect the exclusion of items, such as depreciation of property, plant and equipment and amortization of intangible assets, changes in fair value and the related income tax effects of the aforementioned exclusions, that are recurring and will be reflected in our financial results for the foreseeable future. In addition, these measures may be different from non-IFRS financial measures used by other companies, limiting their usefulness for comparison purposes.
Adjusted Consolidated EBITDA, Adjusted Segment EBITDA, Adjusted Consolidated EBIT and Adjusted Segment EBIT
We present Adjusted Consolidated EBITDA, Adjusted Segment EBITDA, Adjusted Consolidated EBIT and Adjusted Segment EBIT in this annual report as supplemental measures of performance of our company and of each operating segment, respectively, which are not required by, or presented in accordance with IFRS.
Adjusted Consolidated EBITDA equals the sum of our Adjusted Segment EBITDA for each of our operating segments. We define “Adjusted Consolidated EBITDA” as (i) consolidated net profit (loss) for the year, as applicable, before interest expense, income taxes, depreciation of property, plant and equipment and amortization of intangible assets, net gain from fair value adjustments of investment property land foreign exchange gains or losses, other net financial results and bargain purchase gain on acquisition (ii) adjusted by those items, that do not impact profit and loss, but are recorded directly in shareholders’ equity, including (a) the gains or losses from disposals of noncontrolling interests in subsidiaries whose main underlying asset is farmland, reflected under the line item: "Reserve from the sale of noncontrolling interests in subsidiaries” and (b) the net increase in value of sold farmland, which has been recognized in either revaluation surplus or retained earnings; and (iii) net of the combined effect of the application of IAS 29 and IAS 21 from the Argentine operations included in profit from operations.
vi
We define “Adjusted Segment EBITDA” for each of our operating segments as (i) the segment’s share of consolidated profit (loss) from operations per segment information for the year, as applicable, before depreciation of property, plant and equipment and amortization of intangible assets and bargain purchase gain on acquisition, (ii) adjusted by those items, that do not impact profit and loss, but are recorded directly in shareholders’ equity, including (a) the gains or losses from disposals of noncontrolling interests in subsidiaries whose main underlying asset is farmland, reflected under the line item “Reserve from the sale of noncontrolling interests in subsidiaries” and (b) the net increase in value of sold farmland, which has been recognized in either revaluation surplus or retained earnings, which is reflected in shareholder equity under the line item “Reverse of revaluation surplus derived from disposals of assets;” and (iii) net of the combined effect resulting from the application of IAS 29 and IAS 21 to our Argentine operations included in profit from operations.
We believe that Adjusted Consolidated EBITDA and Adjusted Segment EBITDA are important measures of operating performance for our company and each operating segment, respectively, because they allow investors to evaluate and compare our consolidated operating results and to evaluate and compare the operating performance of our segments, respectively, including our return on capital and operating efficiencies, from period to period by removing the impact of our capital structure (interest expense from our outstanding debt), asset base (depreciation and amortization), tax consequences (income taxes), bargain purchase gain, foreign exchange gains or losses and other financial results. In addition, by including the gains or losses from disposals of noncontrolling interests in subsidiaries whose main underlying asset is farmland, investors can also evaluate and compare the full value and returns generated by our land transformation activities. Other companies may calculate Adjusted Consolidated EBITDA and Adjusted Segment EBITDA differently, and therefore our Adjusted Consolidated EBITDA and Adjusted Segment EBITDA may not be comparable to similar measures used by other companies. Adjusted Consolidated EBITDA and Adjusted Segment EBITDA are not measures of financial performance under IFRS, and should not be considered in isolation or as an alternative to consolidated net profit (loss), cash flows from operating activities, segment’s profit from operations and other measures determined in accordance with IFRS. Items excluded from Adjusted Consolidated EBITDA and Adjusted Segment EBITDA are significant and necessary components to the operations of our business, and, therefore, Adjusted Consolidated EBITDA and Adjusted Segment EBITDA should only be used as a supplemental measure of our company’s operating performance, and of each of our operating segments, respectively. We also believe Adjusted Consolidated EBITDA and Adjusted Segment EBITDA are useful for securities analysts, investors and others to evaluate and compare the financial performance of our company and other companies in the agricultural industry. These non-IFRS measures should be considered in addition to, but not as a substitute for or superior to, the information contained in either our statements of income or segment information.
Our Adjusted Consolidated EBIT equals the sum of our Adjusted Segment EBITs for each of our operating segments. We define “Adjusted Consolidated EBIT” as (i) consolidated net profit (loss) for the year, as applicable, before interest expense, income taxes, foreign exchange gains or losses and other net financial results; (ii) adjusted by gains or losses from disposals of noncontrolling interests in subsidiaries whose main underlying asset farmland; (iii) the net increase in value of sold farmland, which has been recognized in either revaluation surplus or retained earnings; (iv) net gain/loss from fair value adjustments of investment property land; (v) bargain purchase gain on acquisition and (vi) net of the combined effect of the application of IAS 29 and IAS 21 to the Argentine operations included in profit from operations. We define “Adjusted Segment EBIT” for each of our operating segments as the segment’s share of (i) consolidated profit (loss) from operations before financing and taxation as per segment information for the year, as applicable; and (ii) net gain/loss from fair value adjustments of investment property land; (iii) bargain purchase gain on acquisition; and (iv) adjusted by those items, that do not impact profit and loss, but are recorded directly in shareholders’ equity, including (a) the gains or losses from disposals of noncontrolling interests in subsidiaries whose main underlying asset is farmland, reflected under the line item: "Reserve from the sale of noncontrolling interests in subsidiaries”; (b) the net increase in value of sold farmland, which has been recognized in either revaluation surplus of retained earnings.
We believe that Adjusted Consolidated EBIT and Adjusted Segment EBIT are important measures of operating performance, for our company and each operating segment, respectively, because they allow investors to evaluate and compare our consolidated operating results and to evaluate and compare the operating performance of our segments, from period to period by including the impact of depreciable fixed assets and removing the impact of our capital structure (interest expense from our outstanding debt), tax consequences (income taxes), foreign exchange gains or losses and other financial results. In addition, by including the gains or losses from disposals of noncontrolling interests in subsidiaries whose main underlying asset is farmland and also the sale of farmlands, investors can evaluate the full value and returns generated by our land transformation activities. Other companies may calculate Adjusted Consolidated EBIT and Adjusted Segment EBIT differently, and therefore our Adjusted Consolidated EBIT and Adjusted Segment EBIT may not be comparable to similar measures used by other companies. Adjusted Consolidated EBIT and Adjusted Segment EBIT are not measures of financial performance under IFRS, and should not be considered in isolation or as an alternative to consolidated net profit (loss), cash flows from operating activities, segment’s profit from operations and other measures determined in accordance with IFRS. Items excluded from Adjusted Consolidated EBIT and Adjusted Segment EBIT are significant and necessary components to the operations of our
vii
business, and, therefore, Adjusted Consolidated EBIT and Adjusted Segment EBIT should only be used as a supplemental measure of the operating performance of our company, and of each of our operating segments, respectively.
Adjusted Net Income
We define Adjusted Net Income as (i) profit / (loss) of the period/year before net gain / (losses) from fair value adjustments of investment property land and bargain purchase gain on acquisition; plus (ii) any non-cash finance costs resulting from foreign exchange gain/losses for such period, which are composed by both exchange differences and cash flow hedge transfer from equity, included in Financial Results, net, in our statement of income; net of the related income tax effects, plus (iii) gains or losses from disposals of non-controlling interests in subsidiaries whose main underlying asset is farmland, which are reflected in our shareholders’ equity under the line item “Reserve from the sale of non-controlling interests in subsidiaries” if any, plus (iv) the reversal of the aforementioned income tax effect, plus (v) inflation accounting effect; plus (vi) the net increase in value of sold farmland, which has been recognized in either revaluation surplus or retained earnings, if any.
We believe that Adjusted Net Income is an important measure of performance for our company allowing investors to properly assess the impact of the results of our operations in our equity. In fact, results arising from the revaluation effect of our net monetary position held in foreign currency in the countries where our functional currency is the local currency do not affect the equity of the Company, when measured in foreign / reporting currency. Conversely, the tax effect resulting from the aforementioned revaluation effect does impact the equity of the Company, since it reduces/increases the income tax to be paid in each country. Accordingly we have added back the income tax effect to Adjusted Net Income.
In addition, by including the gains or losses from disposals of non-controlling interests in subsidiaries whose main underlying asset is farmland, investors can also include the full value and returns generated by our land transformation activities.
Other companies may calculate Adjusted Net Income differently, and therefore our Adjusted Net Income may not be comparable to similar measures used by other companies. Adjusted Net Income is not a measure of financial performance under IFRS, and should not be considered in isolation or as an alternative to consolidated net profit (loss). This non-IFRS measure should be considered in addition to, but not as a substitute for or superior to, the information contained in our financial statements.
Adjusted Free Cash Flow and Adjusted Free Cash Flow from Operations
We define Adjusted Free Cash Flow as the aggregate of (i) net cash generated from operating activities net of the combined effect of the application of IAS 29 and IAS 21 to the Argentine operations, (ii) net cash used in investing activities net of the combined effect of the application of IAS 29 and IAS 21 to the Argentine operations, less (iii) interest paid net of the combined effect of the application of IAS 29 and IAS 21 to the Argentine operations, plus (iv) proceeds from the sale of non-controlling interest in farming subsidiaries; less (v) lease payments, less (vi) dividends paid to noncontrolling interest plus (vii) the net of acquisition/disposal of restricted short-term investments, namely US-Treasury Bills used as collateral of short term borrowings. We define Adjusted Free Cash Flow from Operations as (i) net cash generated from operating activities net of the combined effect of the application of IAS 29 and IAS 21 to the Argentine operations, less (ii) net cash used in investing activities net of the combined effect of the application of IAS 29 and IAS 21 to the Argentine Operations, less (iii) interest paid net of the combined effect of the application of IAS 29 and IAS 21 to the Argentine operations, plus (iv) proceeds from the sale of noncontrolling interest in subsidiaries; less (v) lease payments, less (vi) dividends paid to noncontrolling interest plus (vii) the net of acquisition/disposal of restricted short-term investments, namely US-Treasury Bills used as collateral of short term borrowings plus (viii) expansion capital expenditures.
We believe that the measures of Adjusted Free Cash Flow and Adjusted Free Cash Flow from Operations are important measures of liquidity that enable investors to draw important comparisons year to year of the amount of cash generated by the Company’s principal business and financing activities, which includes the cash generated from our land transformation activities, after paying for recurrent items, including interest, taxes and maintenance capital expenditures.
Expansion capital expenditures is defined as the required investment to expand current production capacity including organic growth, joint ventures and acquisitions. We define maintenance capital expenditures as the necessary investments in order to maintain the current level of productivity both at an agricultural and industrial level. Proceeds from the sale of noncontrolling interest in farming subsidiaries is a measure of the cash generated from our land transformation business that is included under cash from financing activities pursuant to IFRS.
viii
We believe Adjusted Free Cash Flow is an important liquidity measure for the Company because it allows investors and others to evaluate and compare the amount of cash generated by the Company business and financing activities to undertake growth investments, to fund acquisitions, to reduce outstanding financial debt, and to provide a return to shareholders in the form of dividends and/or share repurchases, among others.
We believe Adjusted Free Cash Flow from Operations is an additional important liquidity metric for the Company because it allows investors and others to evaluate and compare the total amount of cash generated by the Company’s business and financing activities after paying for recurrent items including interests, taxes and maintenance capital expenses. We believe this metric is relevant in evaluating the overall performance of our business.
Other companies may calculate Adjusted Free Cash Flow and Adjusted Free Cash Flow from Operations differently, and therefore, our formulation may not be comparable to similarly titled measures used by other companies. Adjusted Free Cash Flow and Adjusted Free Cash Flow from Operations are not measures of liquidity under IFRS, and should not be considered in isolation or as an alternative to consolidated, cash flows from operating activities, net increase, (decrease) in cash and cash equivalents and other measures determined in accordance with IFRS.
Net Debt and Net Debt to Adjusted Consolidated EBITDA
Net debt is defined as the sum of non-current and current borrowings less cash and cash equivalents and restricted short-term investments (namely US-Treasury Bills use as collateral of short-term borrowings). This measure is widely used by management.
Management is consistently tracking our leverage position and our ability to repay and service our debt obligations over time. We have therefore set a leverage ratio target that is measured by net debt divided by Adjusted Consolidated EBITDA.
We believe that the ratio net debt to Adjusted Consolidated EBITDA provides useful information to investors because management uses it to manage our debt-equity ratio in order to promote access to capital markets and our ability to meet scheduled debt service obligations.
Fiscal Year and Harvest Year
Our fiscal year begins on January 1 and ends on December 31 of each year. However, our production is based on the harvest year for each of our crops and rice. A harvest year varies according to the crop or rice and to the climate in which it is grown. Due to the geographic diversity of our farms, the planting period for a given crop or rice may start earlier on one farm than on another, causing differences in their respective harvesting periods. The presentation of production volume (tons) and product area (hectares) in this annual report, in respect of the harvest years for each of our crops and rice, starts with the first day of the planting period at the first farm to start planting on that harvest year and continues to the last day of the harvesting period of the respective crop or rice on the last farm to finish harvesting that harvest year, as shown in the table below.
ix
| Planting | Harvest | Storage, Processing & Selling | |||||||||||||||||||||||||||||||||||||||||||||||||||||||||||||||||||||||||||
| May | Jun | Jul | Aug | Sep | Oct | Nov | Dec | Jan | Feb | Mar | Apr | May | Jun | Jul | Aug | Sep | Oct | Nov | Dec | Jan | Feb | Mar | |||||||||||||||||||||||||||||||||||||||||||||||||||||||
| Humid Pampas and South West (Argentina) | Soybean | ||||||||||||||||||||||||||||||||||||||||||||||||||||||||||||||||||||||||||||
| Corn | |||||||||||||||||||||||||||||||||||||||||||||||||||||||||||||||||||||||||||||
| Wheat / Barley | |||||||||||||||||||||||||||||||||||||||||||||||||||||||||||||||||||||||||||||
| Soybean second harvest | |||||||||||||||||||||||||||||||||||||||||||||||||||||||||||||||||||||||||||||
| Corn second harvest | |||||||||||||||||||||||||||||||||||||||||||||||||||||||||||||||||||||||||||||
| Peanut | |||||||||||||||||||||||||||||||||||||||||||||||||||||||||||||||||||||||||||||
| Sunflower | |||||||||||||||||||||||||||||||||||||||||||||||||||||||||||||||||||||||||||||
| Northern Argentina | Soybean | ||||||||||||||||||||||||||||||||||||||||||||||||||||||||||||||||||||||||||||
| Corn / Sunflower | |||||||||||||||||||||||||||||||||||||||||||||||||||||||||||||||||||||||||||||
| Wheat / Barley | |||||||||||||||||||||||||||||||||||||||||||||||||||||||||||||||||||||||||||||
| Soybean / Corn second harvest | |||||||||||||||||||||||||||||||||||||||||||||||||||||||||||||||||||||||||||||
| Cotton | |||||||||||||||||||||||||||||||||||||||||||||||||||||||||||||||||||||||||||||
| Rice | |||||||||||||||||||||||||||||||||||||||||||||||||||||||||||||||||||||||||||||
| Uruguay | Soybean | ||||||||||||||||||||||||||||||||||||||||||||||||||||||||||||||||||||||||||||
| Corn | |||||||||||||||||||||||||||||||||||||||||||||||||||||||||||||||||||||||||||||
| Wheat / Barley | |||||||||||||||||||||||||||||||||||||||||||||||||||||||||||||||||||||||||||||
| Soybean / Corn second harvest | |||||||||||||||||||||||||||||||||||||||||||||||||||||||||||||||||||||||||||||
| Rice | |||||||||||||||||||||||||||||||||||||||||||||||||||||||||||||||||||||||||||||
Product area for cattle is presented on a harvest year basis given that land utilized for cattle operations is linked to our farming operations and use of farmland during a harvest year. Production volumes for dairy and cattle operations are presented on a fiscal year basis. On the other hand, production volumes and product area in our sugar, ethanol and energy business are presented on a fiscal year basis.
The financial results for all of our products are presented on a fiscal year basis.
Certain Weight Units and Measures in the Agricultural Business
Weight units and measures used in agriculture vary according to the crop and producing country. In order to permit comparability of our operating data with operating data from the international markets, the following table sets forth key weight units and measures used in the agriculture industry:
x
| Agricultural weight units and measures | ||||||||
| 1 metric ton | 1,000 kg | 1.102 U.S. (short) tons | ||||||
| 1 cubic meter | 1,000 liters | |||||||
| 1 kilogram (kg) | 2.20462 pounds | |||||||
| 1 pound | 0.45359 kg | |||||||
| 1 acre | 0.40469 hectares | |||||||
| 1 hectare (ha) | 2.47105 acres | |||||||
| Soybean and Wheat | ||||||||
| 1 bushel of soybean | 60 pounds | 27.2155 kg | ||||||
| 1 bag of soybean | 60 kg | 2.20462 bushels | ||||||
| 1 bushel/acre | 67.25 kg/ha | |||||||
| 1.00 U.S. dollar/bushel | 2.2046 U.S. dollar/bag | |||||||
| Corn | ||||||||
| 1 bushel of corn | 56 pounds | 25.4012 kg | ||||||
| 1 bag of corn | 60 kg | 2.36210 bushels | ||||||
| 1 bushel/acre | 62.77 kg/ha | |||||||
| 1.00 U.S. dollar/bushel | 2.3621 U.S. dollar/bag | |||||||
| Dairy | ||||||||
| 1 liter | 0.264 gallons | 2.273 pounds | ||||||
| 1 gallon | 3.785 liters | 8.604 pounds | ||||||
| 1 lbs | 0.440 liters | 0.116 gallons | ||||||
| 1.00 U.S. dollar/liter | 43.995 U.S. dollar/cwt | 3.785 U.S. dollar/gallon | ||||||
| 1.00 U.S. dollar/cwt | 0.023 U.S. dollar/liter | 0.086 U.S. dollar/gallon | ||||||
| 1.00 U.S. dollar/gallon | 0.264 U.S. dollar/liter | 11.622 U.S. dollar/cwt | ||||||
| Sugar and Ethanol | ||||||||
| 1 kg of TRS equivalent | 0.95 kg of VHP Sugar | 0.59 liters of Hydrated Ethanol | ||||||
| 1.00 US$ cents/pound | 22.04 U.S. dollar/ton | |||||||
Presentation of Information — Market Data and Forecasts
This annual report includes information provided by us and by third-party sources that we believe are reliable, including data related to the economic conditions in the markets in which we operate. Unless otherwise indicated, information in this annual report concerning economic conditions is based on publicly available information from third-party sources which we believe to be reasonable. The economic conditions in the markets in which we operate may deteriorate, and those economies may not grow at the rates projected by market data, or at all. The deterioration of the economic conditions in the markets in which we operate may have a material adverse effect on our business, results of operations and financial condition and the market price of our common shares.
Rounding
We have made rounding adjustments to reach some of the figures included in this annual report. Accordingly, numerical figures shown as totals in some tables may not be an arithmetic aggregation of the figures that preceded them.
xi
PART I
Item 1. Identity of Directors, Senior Management and Advisers
Not applicable.
Item 2. Offer Statistics and Expected Timetable
Not applicable.
Item 3. Key Information
A. [RESERVED]
B. CAPITALIZATION AND INDEBTEDNESS
Not Applicable.
C. REASONS FOR THE OFFER AND USE OF PROCEEDS
Not Applicable.
D. RISK FACTORS
Investing in our common shares involves a high degree of risk. Before making an investment decision, you should carefully consider the information contained in this annual report, particularly the risks described below, as well as in our Consolidated Financial Statements and accompanying notes. Our business activities, cash flow, financial condition and results of operations could be materially and adversely affected by any of the risks and uncertainties below. The market price of our common shares may decrease due to any of these risks or other factors, and you may lose all or part of your investment. The risks and uncertainties not presently known to us or that we currently deem immaterial may also affect our business operations.
For purposes of this section, the indication that a risk, uncertainty or problem may or will have a “material adverse effect on us” or that we may experience a “material adverse effect” means that the risk, uncertainty or problem could have a material adverse effect on our business, financial condition or results of operations and/or the market price of our common shares, except as otherwise indicated or as the context may otherwise require. Investors should view similar expressions in this section as having a similar meaning.
Summary of Risk Factors
The risks facing us and our business are many and varied. Set forth below is a summary of the risk factors more fully described herein.
The risks related to our business and industries include the following:
•Unpredictable weather conditions, including as a result of climate change, pest infestations and diseases may have an adverse impact on agricultural production.
•Fluctuations in market prices for our products could adversely affect our financial condition and results of operations.
•Ethanol prices are correlated to the price of sugar and are also closely correlated to the price of petroleum, so that a decline in the price of sugar or a decline in the price of petroleum will adversely affect our sugar and ethanol businesses.
•The expansion of our business through acquisitions poses risks that may reduce the benefits we anticipate from these transactions.
1
•A significant increase in the price of raw materials we use in our operations, or the shortage of such raw materials, could adversely affect our results of operations.
•We cannot guarantee that our suppliers will not engage in improper practices, including inappropriate labor or manufacturing practices.
•Increased fuel and energy prices and frequent interruptions of energy supply could adversely affect our business.
•Our business may be materially and adversely affected by the emergence of epidemics or pandemics, such as COVID-19.
•We depend on stable international trade and economic and other conditions in key export markets for our products.
•A worldwide economic downturn could weaken demand for our products or lower prices.
•Our business is seasonal, and our results may fluctuate significantly depending on the growing cycle of our crops.
•We face significant competition across our business segments, which could adversely affect our financial performance.
•Our current insurance coverage may not be sufficient to cover our potential losses.
•Governmental policies reducing the amount of ethanol required to be added to gasoline, or eliminating tax incentives for flex-fuel vehicles, may adversely affect our business.
•Growth in the sale and distribution of ethanol depends in part on infrastructure improvements, which may not occur on a timely basis, if at all.
•A substantial portion of our assets is farmland that is highly illiquid.
•We have entered into agriculture partnership agreements in respect of a significant portion of our sugarcane plantations.
•Our performance depends on favorable working relationships with our employees and compliance with labor laws. Any strain on these relationships or increased labor costs could adversely affect our business.
•We may not possess all permits and licenses required to operate our business, or we may fail to renew or maintain the licenses and permits we currently hold which could subject us to fines and other penalties.
•Our business is subject to significant governmental regulation, which may adversely affect our results of operations and financial condition.
•Climate change may impose increased costs on our operations.
•Some of the agricultural commodities and food products that we produce contain genetically modified organisms.
•We may face restrictions and penalties under consumer protection laws.
•IFRS accounting standards related to biological assets require us to make numerous estimates in the preparation of our financial statements and therefore limit the comparability of our financial statements to similar issuers using U.S. GAAP.
•Our indebtedness could impair our financial condition and impair our ability to receive or pay out dividends.
•The terms of our indebtedness and that of certain of our subsidiaries impose significant restrictions on our operating and financial flexibility.
•Fluctuations in interest rates could have a significant impact on our results of operations, indebtedness and cash flow.
•We may need additional capital and we may not be able to obtain it.
•There is a risk that we could be treated as a U.S. domestic corporation for U.S. federal income tax purposes, which could materially increase our U.S. federal income tax liability and subject any dividends we pay to U.S. federal withholding tax.
•We may be classified by the IRS as a “passive foreign investment company,” which may result in adverse tax consequences for U.S. investors in our common shares.
•We are subject to anticorruption, anti-bribery, anti-money laundering and other international trade laws and regulations.
•We may be adversely affected by the ongoing armed conflict between Russia and Ukraine.
•Technological advances or alternative products may affect demand for our products and services or require substantial capital investments to remain competitive.
2
•Security breaches and other disruptions could compromise our technology infrastructure and information and expose us to processes disruption and liability, which would cause our business and reputation to suffer.
•We depend on our information technology systems and any failure of these systems could adversely affect our business.
•Noncompliance with data protection laws could adversely affect our business.
•Our operations are subject to disruptions by third parties who interfere with the possession of our real estate or our means of production.
We also face risks associated with the countries in which we operate, primarily in Argentina and Brazil, which include the following:
•Our results of operations and financial condition are dependent upon economic conditions in the emerging countries in which we operate.
•Economic and political conditions in the countries in which we operate, and the perception of these conditions in international markets, may adversely impact our business, our access to the capital and debt markets, our results of operations and financial condition.
•The economies of the countries in which we operate may be adversely affected by the deterioration of other global markets.
•Governments have a high degree of influence in the economies in which we operate, which could adversely affect our results of operations or financial condition.
•Currency exchange rate fluctuations relative to the U.S. dollar in the countries in which we operate our businesses may adversely impact our results of operations and financial condition.
•Inflation in some of the countries in which we operate, along with governmental measures to curb inflation, may have a significant negative effect on the economies of those countries and, as a result, on our financial condition and results of operations.
•Disruption of transportation and logistics services, insufficient investment in public infrastructure or disruption to any aspect of the supply chain could adversely affect our operating results.
•The Argentine economy may be affected by its government’s limited access to financing from international markets and the result of failure to pay its debt obligations.
•Argentina’s current account and balance of payment imbalances could lead to a depreciation of the Argentine peso, and as a result, affect our results of operations, our capital expenditure program and our ability to service our foreign currency liabilities.
•Failure to adequately address actual and perceived risks of institutional corruption may adversely affect the economy and financial condition of the emerging markets in which we operate.
•Laws on the foreign ownership of rural properties may adversely affect our results of operations and future investments in rural properties.
•An increase in export and import duties and controls may have an adverse impact on our sales.
•Exchange controls restrict the inflow and outflow of funds and may substantially limit the ability of companies to retain or obtain foreign currency or make payments abroad.
•Changes in tax laws, incentives, benefits and regulations may have a material adverse impact on the taxes applicable to our business and may increase our tax burden.
•We receive certain tax benefits from Brazilian tax authorities, which we cannot assure will be maintained or renewed.
As a Luxembourg corporation (“société anonyme”) we and our common shares are also exposed to risks that include the following:
•The price of our common shares may be highly volatile.
•Our exemption as a “foreign private issuer” from certain rules under the U.S. securities laws will result in less information about us being available to investors than for U.S. companies, which may result in our common shares being less attractive to investors.
•We are a Luxembourg corporation (“société anonyme”) and it may be difficult for you to obtain or enforce judgments against us or our executive officers and directors in the United States.
3
•Our shareholders may have more difficulty protecting their interests than they would as shareholders of a U.S. corporation, which could adversely impact trading in our common shares and our ability to conduct equity financings.
•Luxembourg and European Union insolvency and bankruptcy laws and regulations are substantially different from U.S. insolvency laws and may offer our shareholders less protection than they would have under U.S. insolvency and bankruptcy laws.
•Our ability to pay dividends is subject to Luxembourg corporate law requirements and conditions.
•We are a holding company and depend on the ability of our subsidiaries to distribute funds to us in order to satisfy our financial obligations and to make dividend payments, which they may not be able to do.
Risks Related to Our Business and Industries
Unpredictable weather conditions, including as a result of climate change, pest infestations and diseases may have an adverse impact on agricultural production.
Severe weather or environmental conditions, in particular, droughts, hail, floods, frost or pestilence, are unpredictable and may have a significant adverse impact on agricultural production and the supply and price of agricultural commodities that we sell and use in our business. Moreover, adverse weather conditions may be exacerbated by the effects of climate change which impacts the entirety of our business and policies. See “—Climate change may impose increased costs on our operations.” Additionally, higher than average temperatures and rainfall can contribute to an increased pestilence, which may adversely impact our agricultural production.
Our sugar production depends on the volume and sucrose content of the sugarcane that we cultivate or that is supplied to us by growers located in the vicinity of our mills. Both sugarcane yields and sucrose content depend primarily on weather conditions such as rainfall and temperature, which can vary. Weather conditions have historically caused volatility in the ethanol and sugar industries. Future weather patterns may reduce the amount of sugarcane that we can harvest or purchase, or the sucrose content in such sugarcane, and, consequently, the amount of sugar and ethanol we can produce in any given harvest. Any reduction in production volumes could have a material adverse effect on our results of operations and financial condition.
In 2022, South America suffered a third consecutive year of drier weather during spring and summer times, commonly known as a “La Niña” year. Although we are diversified in terms of crops and geographical regions, we may have to adjust our planting calendar, production mix and area, due to lack of soil moisture given the drought, which may have a potential impact on yields achieved and our production.
Similarly, the occurrence and effects of disease and pestilence can be unpredictable and devastating to agricultural products, potentially rendering all or a substantial portion of the affected harvest unsuitable for sale. Our agricultural products are also susceptible to fungi and bacteria that are associated with excessively moist conditions. Our results of operations could be adversely affected in such cases where our production is materially affected and all or a substantial portion of the production costs have been incurred. We cannot assure you that such events in the future will not adversely affect our operating results and financial condition. Furthermore, if we fail to control pestilence or disease and our production is threatened, we may be unable to supply our main customers, which could affect our results of operations and financial condition.
In addition, disease among our dairy cattle herd, such as mastitis, tuberculosis, brucellosis and foot-and-mouth disease, can have an adverse effect on productivity. Outbreaks of cattle diseases may also result in the closure of certain important markets to our cattle-derived products. We cannot assure that future outbreaks will not occur. A future outbreak of diseases among our cattle herds could adversely affect our milk sales and operating results and financial condition. Furthermore, outbreaks, or fears of outbreaks, of any of these or other animal diseases may lead to the cancellation of orders by our customers, in particular if the disease has the potential to affect human health or create adverse publicity that may have a material adverse effect on consumer demand for our products. Moreover, outbreaks of animal disease may lead foreign governments to ban the import of some or all of our products, which may result in the destruction of some or all of these animals.
Fluctuations in market prices for our products could adversely affect our financial condition and results of operations.
Prices for agricultural products and by-products, including, among others, sugar, ethanol, grains and powder milk, have historically been cyclical and sensitive to domestic and international changes in supply and demand and can be expected to
4
fluctuate significantly. In addition, the agricultural products and by-products we produce are traded on commodities and futures exchanges and thus are subject to speculative trading, which may adversely affect us. The prices that we are able to obtain for our agricultural products and by-products depend on many factors beyond our control including:
•prevailing world commodity prices, which historically have been subject to significant fluctuations over relatively short periods of time, depending on worldwide demand and supply;
•changes in the agricultural subsidy levels of certain important producers (mainly the U.S. and the European Union, or the “E.U.,” and the adoption of other government policies affecting industry market conditions and prices;
•changes to trade barriers of certain important consumer markets (including China, India, the U.S. and the E.U.) and the adoption of other governmental policies affecting industry market conditions and prices;
•changes in government policies for biofuels;
•disruptions in commodity markets caused by global events, including the impact of the COVID-19 pandemic and the ongoing war between Russia and Ukraine;
•world inventory levels, i.e., the supply of commodities carried over from year to year;
•climatic conditions and natural disasters in areas where agricultural products are cultivated;
•the production capacity of our competitors; and
•demand for and supply of competing commodities and substitutes.
Further, because we may not hedge 100% of the price risk of our agricultural products, we are unable to have minimum price guarantees for all of our production and are, therefore, exposed to risks associated with the prices of agricultural products and their volatility. As a result, we are subject to fluctuations in prices of agricultural products that could result in our receiving lower prices for our agricultural products than our production costs.
For example, in 2022 sugar prices in US dollars increased 6.1% according to the International Exchange - New York, or “ICE NY”, anhydrous and hydrous ethanol prices in Brazilian Reais decreased 15.7% and 13.4%, respectively according to Luiz de Queiroz College of Agriculture of the University of São Paulo (Escola Superior de Agricultura Luiz de Queiroz). The increase of international sugar prices was influenced by steadily rising estimates of sugar production in India. However, they remained volatile after the conflict in Ukraine commenced.
Also, domestic prices of electricity exported to the grid, in particular, electricity produced by hydroelectric generators, are impacted by weather conditions. For example, according to the chamber of electric energy commercialization of Brazil (CCEE), the energy spot price (PLD) in Brazil is expected to average its regulatory minimum of 69.0 R$/MWh in 2023. In 2022, the average energy spot price (PLD) was 59.0 R$/MWh, 79% lower compared to 2021 (279.6 R$/MWh), and the forecasted energy price for 2023 is 69.0 R$/MWh, 75% lower than in 2021 and 17% higher than in 2022.
Moreover, there is a strong relationship between the value of our land holdings and market prices of the commodities we produce, which are affected by global economic conditions. A decline in the prices of grains, sugar, ethanol, or related by-products below their current levels for a sustained period of time could significantly reduce the value of our land holdings and materially and adversely affect our financial condition and results of operations.
Ethanol prices are correlated to the price of sugar and are also closely correlated to the price of petroleum, so that a decline in the price of sugar or a decline in the price of petroleum will adversely affect our sugar and ethanol businesses.
A vast majority of ethanol in Brazil is produced at sugarcane mills that produce both ethanol and sugar. Because sugarcane millers are able to alter their product mix in response to the relative prices of ethanol and sugar, the prices of both products are directly correlated, and the correlation between ethanol and sugar may increase over time. Sugar prices in Brazil are determined by prices in the world market, resulting in a correlation between Brazilian ethanol prices and world sugar prices. Accordingly, a decline in sugar prices would have an adverse effect on the financial performance of our ethanol and sugar businesses.
Moreover, because flex-fuel vehicles allow consumers to choose between gasoline and ethanol at the pump rather than at the showroom, ethanol prices are correlated to gasoline prices as well and, consequently, international oil prices. In Brazil, petroleum and petroleum derivatives have historically been subject to price controls. Currently there is no legislation or regulation in force giving the Brazilian government the power to set prices for petroleum, petroleum products, ethanol or
5
vehicular natural gas. However, given that Petróleo Brasileiro S.A. – Petrobras, the only supplier of oil-based fuels in Brazil, is a government-controlled company, prices of petroleum and petroleum products are subject to government influence, resulting in potential inconsistencies between international prices and internal oil derivative prices that affect our business and our financial results, which are not linked to international prices.
We believe that the correlation between petroleum, ethanol and sugar prices will increase over time. Accordingly, a decline in sugar prices will have an adverse effect on the financial performance of our ethanol and sugar businesses, and a decline in petroleum prices could make ethanol less competitive and reduce demand, despite increased sales of flex-fuel vehicles, affecting our results and financial condition, including cash flows. Finally, a decrease in gasoline prices could make ethanol less competitive and result in a reduction in demand even if demand for flex-fuel vehicles were to increase, which could adversely affect our financial condition and results of operations.
The expansion of our business through acquisitions poses risks that may reduce the benefits we anticipate from these transactions.
As part of our business strategy, we have grown through acquisitions. We plan to continue growing by acquiring other farms and production facilities throughout South America. We believe that the agricultural industry and agricultural activity in the region are highly fragmented and that our future consolidation opportunities will continue to be significant to our growth. However, our management is unable to predict whether or when any prospective acquisitions or strategic alliances will occur, or if such acquisitions or strategic alliances will be agreed upon on favorable terms and conditions. Our ability to continue to expand our business successfully through acquisitions and strategic alliances depends on many factors, including our ability to identify potential acquisitions, access financing sources, including through capital markets, at acceptable conditions, negotiate favorable transaction terms and successfully consummate and integrate any businesses we acquire.
To support the acquisitions we pursue, we may need to implement new or upgraded strategies, systems, procedures and controls for our operations and will face risks, including diversion of management time and focus and challenges associated with integrating new managers and employees. We may be unable to realize synergies and efficiency gains from acquisitions or to identify, negotiate or finance future acquisitions, particularly as part of our international growth strategy, successfully or at favorable valuations, or to effectively integrate these acquisitions or strategic alliances with our current businesses. Our failure to integrate new businesses or manage any new alliances successfully could adversely affect our business and financial performance.
Any future strategic alliances or acquisitions of businesses, technologies, services or products might require us to obtain additional equity or debt financing, which may not be available on favorable terms, or at all, and may result in unforeseen operating difficulties and expenditures, as well as strain on our organizational culture, especially if an acquisition is followed by a period of lower than projected prices for our products. Future acquisitions and joint ventures may be subject to antitrust and other regulatory approvals, which may not be obtained on a timely basis or at all.
Acquisitions also expose us to the risk of successor liability relating to actions involving an acquired company, its management or contingent liabilities incurred before the acquisition. The due diligence we conduct in connection with an acquisition, and any contractual guarantees or indemnities that we receive from the sellers of acquired companies, may not be sufficient to protect us from, or compensate us for, actual liabilities. Any material liability associated with an acquisition could adversely affect our reputation and results of operations and reduce the benefits of the acquisition.
Finally, we are unable to predict the effect that changes in Argentine or Brazilian legislation regarding foreign ownership of rural properties could have in our business. See “—Risks Related to the Countries in Which We Operate—Laws on the foreign ownership of rural properties may adversely affect our results of operations and future investments in rural properties.”
A significant increase in the price of raw materials we use in our operations, or the shortage of such raw materials, could adversely affect our results of operations.
Our production process requires various raw materials, in particular fertilizer, pesticides and seeds, which we acquire from local and international suppliers. We do not have long-term supply contracts for most of these raw materials. A significant increase in the cost of these raw materials, especially fertilizer and agrochemicals, a shortage of raw materials or the unavailability of these raw materials entirely could reduce our profit margin, reduce our production and/or interrupt the production of some of our products, in all cases adversely affecting the results of our operations and our financial condition.
6
For example, we rely on fertilizers and agrochemicals, many of which are petrochemical based. In our Farming business, fertilizers and agrochemicals represented approximately 15.9% of our total cost of production (including manufacturing and administrative expenses) for the 2022/2023 harvest year. In our Sugar, Ethanol and Energy business, fertilizers and agrochemicals represented 20.9% of our cost of production (including manufacturing and administrative expenses) for the 2021/2022 harvest and 19.6% for the 2022/2023 harvest. Worldwide production of agricultural products has increased significantly in recent years in response to increased demand for agrochemicals and fertilizers. However, shortages in its supply remain, which has been aggravated by the ongoing war between Russia and Ukraine. See “—We may be adversely affected by the ongoing armed conflict between Russia and Ukraine”.
We cannot guarantee that our suppliers will not engage in improper practices, including inappropriate labor or manufacturing practices.
We cannot guarantee that our suppliers’ business operations comply with all applicable laws and regulations relating to working conditions, sustainability, production chain assurance and appropriate safety conditions, or that they will not carry out improper practices relating to such matters to reduce the cost of the products they sell to us. In the event that our suppliers engage in such improper business practices, our customers’ perception of our business may be adversely affected, which may adversely affect our business, results of operations and our reputation.
Moreover, considering Brazilian law and judicial precedent, we may be involved in litigation concerning our suppliers’ inappropriate labor practices, as labor authorities may argue that we failed to adequately supervise our supply chain. This risk is particularly relevant if these suppliers are involved in sensitive labor issues, such as child labor and direct or indirect use of forced labor or modern slavery. Any such litigation could impact our customers’ perception of our business, and adverse decisions may compel us to disburse material amounts in connection therewith, which may adversely affect our business, results of operations and our reputation
Increased fuel and energy prices and frequent interruptions of energy supply could adversely affect our business.
We require substantial amounts of fuel oil and other resources for our harvest activities and transport of our agricultural products. During both the 2021/2022 and 2020/2021 harvest years, fuel represented 3.6% and 3.2% respectively, of the cost of production (including manufacturing and administrative expenses) of our Farming business. In our Sugar, Ethanol and Energy business, fuel represented 12.8%, 10.5% and 9.3% of our cost of production (including manufacturing and administrative expenses) in harvest years 2021/2022, 2020/2021 and 2019/2020, respectively.
We rely upon third parties for our supply of energy resources used in our operations. The prices for and availability of energy resources may be subject to change or curtailment, respectively, due to, among others, new laws or regulations, imposition of new taxes or tariffs, interruptions in production by suppliers, imposition of restrictions on energy supply by government, worldwide price levels and market conditions. In addition, our contracts for the purchase and sale of energy in the free market may contain flexibilities according to which counterparties may also reduce the amounts of contracted energy, within certain limits. Any of these events could affect our revenues if we are unable to sell the reduced volumes at the same price or due to the excess energy that we fail to sell. In addition, in the event of an energy shortage, the government may impose rationing obligations that could affect the volumes established in our contracts, consequently affecting our revenues.
Moreover, over the last few years, the Argentine government has taken certain measures in order to reduce the use of energy during peak months of the year by frequently cutting energy supply to industrial facilities and large consumers to ensure adequate supply for residential buildings. For example, certain of our industrial facilities have been subject to a quota system whereby electricity cuts occur on a work shift basis, resulting in our facilities being shut down during certain work shifts. Brazil has also been subject to electricity rationing measures as a result of droughts in recent years. We cannot assure you that we will be able to procure the required energy inputs at acceptable prices. If energy supply is cut for an extended period of time and we are unable to find replacement sources at comparable prices, or at all, our business and results of operations could be adversely affected.
Our business may be materially and adversely affected by the emergence of epidemics or pandemics, such as COVID-19.
Epidemics and pandemics caused by infectious agents, such as the COVID -19 pandemic, can impact the health of our workforce, our partners and suppliers, as well as demand the redesign of routines, procedures and organization of work in general, and may consequently affect the continuity of various activities and our productivity. In addition, such public health events may affect commodity prices and demand, which, consequently, may negatively impact our results and financial condition.
7
We depend on stable international trade and economic and other conditions in key export markets for our products.
Our operating results depend largely on economic conditions and regulatory policies for our products in major export markets. The ability of our products to compete effectively in these export markets may be adversely affected by a number of factors that are beyond our control, including the deterioration of macroeconomic conditions, volatility of exchange rates, the imposition of greater tariffs or protectionist policies or other trade barriers or other factors in those markets, such as regulations relating to chemical content of products and safety requirements. The EU, for example, limits the import of genetically modified organisms, or “GMOs.” See “—Some of the agricultural commodities and food products that we produce contain genetically modified organisms.”
Due to the growing participation in the worldwide agricultural commodities markets by commodities produced in South America, South American producers, including us, are increasingly affected by the measures taken by importing countries in order to protect their local producers. Measures such as the limitation on imports adopted in a particular country or region may affect the sector’s export volume significantly and, consequently, our operating results. Additionally, in the past, governments and other authorities have established certain restrictions on the freedom of movement and business operations, including travel bans, supply chain disruptions and border closures, including as a response to the COVID 19 pandemic. Other measures such as the restriction on imports or business closures of ports, airports or any locations of entry, or border closings may have a material adverse impact on our operations and financial results, and we cannot predict future pandemic outbreaks.
If the sale of our products into a particular importing country is adversely affected by trade barriers or by any of the factors mentioned above, the relocation of our products to other consumers on terms equally favorable could be impaired, and our business, financial condition and operating results may be adversely affected.
A worldwide economic downturn could weaken demand for our products or lower prices.
The demand for the products we sell may be affected by international, national and local economic conditions that are beyond our control. Adverse changes in the perceived or actual economic climate, such as higher fuel prices, higher interest rates, stock and real estate market declines and/or volatility, more restrictive credit markets, higher taxes, and changes in governmental policies could reduce the level of demand or prices of the products we produce. We cannot predict the duration or magnitude of a downturn or the timing or strength of economic recovery. If a downturn were to continue for an extended period of time or worsen, we could experience a prolonged period of decreased demand and prices. In addition, economic downturns have and may adversely impact our suppliers, which can result in disruptions in goods and services and financial losses. Finally, the deterioration of global economic conditions, particularly in relevant economies such as the United States and China, as a result of the war in Ukraine, supply chain challenges and other events may ultimately decrease the customer demand for our products and have a material adverse effect on our financial condition and results of operations.
In addition, we expect that a limited number of financial institutions will hold all or most of our cash, including some institutions located in the United States. Depending on our cash balance in any of our accounts at any given point in time, our balances may not be covered by government-backed deposit insurance programs in the event of default or failure of any bank with which we maintain a commercial relationship. While the U.S. Federal Deposit Insurance Corporation provides deposit insurance of $250,000 per depositor, per insured bank, the amounts that we have in deposits in U.S. banks far exceeds that insurance amount. Therefore, if the U.S. government does not impose measures to protect depositors in the event a bank in which our funds are held fails, we may lose all or a substantial portion of our deposits. The occurrence of any default or failure of any of the banks in which we have deposits could have a material adverse effect on our business, financial condition, results of operations and cash flows.
Our business is seasonal and our results may fluctuate significantly depending on the growing cycle of our crops.
As with any agricultural business enterprise, our business operations are predominantly seasonal in nature. The harvest of corn, soybean and rice generally occurs from January to May. Wheat is harvested from December to January. Cotton is harvested from June to August, but requires processing which takes approximately two to three months. Our operations and sales are affected by the growing cycle of our crops process and the timing of our harvest sales.
In addition, our Sugar, Ethanol and Energy business is subject to seasonal trends based on the sugarcane growing cycle in the center-south region of Brazil. The annual sugarcane harvesting period in the center-south region of Brazil begins in March/April and ends in November/December. This creates price fluctuations which result in fluctuations in our sugar and ethanol inventories, usually peaking in December to take advantage of higher prices during the traditional off-season (i.e., January through April), and a degree of seasonality in our gross profit. Seasonality could have a material adverse effect on our business and financial performance. In addition, our quarterly results may vary as a result of the effects of fluctuations in
8
commodities prices, production yields and costs. Therefore, our results of operations have varied significantly from period to period and are likely to continue to vary, due to seasonal factors.
We face significant competition across our business segments, which could adversely affect our financial performance.
In our Farming business, we face significant competition from other producers in the domestic markets and from foreign producers in our export markets. The market for commodities is highly fragmented. Small producers can also be important competitors, some of which operate in the informal economy and are able to offer lower prices by meeting lower quality standards. Competition from other producers is a barrier to expanding our sales in the domestic and foreign markets. With respect to exports, we compete with other large, vertically integrated producers that have the ability to produce quality products at low cost, as well as with foreign producers.
The Brazilian markets, in particular, are highly price-competitive and sensitive to product substitution. Customers may seek to diversify their sources of supply by purchasing a portion of the products they need from producers in other countries, as some of our customers in key export markets have begun to do. We expect that we will continue to face strong competition in all of our markets and anticipate that existing or new competitors may broaden their product lines and extend their geographic scope. Any failure by us to respond to product, pricing and other moves by competitors may negatively affect our results of operations and financial condition.
In our Sugar, Ethanol and Energy segment, ethanol competes in the biofuel market with other, established fuels such as biodiesel, as well as fuels that are still in the development phase, including methanol and butanol from biomass. Alternative fuels could become more successful than ethanol in the biofuels market over the medium or long term due to, for example, lower production costs, greater environmental benefits or other more favorable product characteristics. In addition, alternative fuels may also benefit from tax incentives or other more favorable governmental policies than those that apply to ethanol. Furthermore, our success depends on early identification of new developments relating to products and production methods and continuous improvement of existing expertise in order to ensure that our product range keeps pace with technological change. Competitors may gain an advantage over us by, for example, developing or using new products and production methods, introducing new products to the market sooner than we do, or securing exclusive rights to new technologies, thereby significantly harming our competitive position.
Our current insurance coverage may not be sufficient to cover our potential losses.
Our production is, in general, subject to different risks and hazards, including adverse weather conditions, fires, diseases and pest infestations, other natural phenomena, industrial accidents, labor disputes, changes in the applicable legal and regulatory framework applicable to us, environmental contingencies and other natural or artificial phenomena. Our insurance currently covers only part of the losses we may incur and does not cover losses on crops due to hail storms, fires or similar risks. Furthermore, certain types of risks may not be covered by the policies we have for our industrial facilities. Additionally, we cannot guarantee that the indemnification paid by the insurer due to the occurrence of a casualty covered by our policies will be sufficient to entirely compensate us for our loss or damages suffered. Moreover, we may not be able to maintain or obtain insurance of the type and amount desired at reasonable costs.
If we were to incur significant liability for which we were not fully insured, such liability could have a materially adverse effect on our business, financial condition and results of operations. We may further incur additional expenses to mitigate the loss, such as shifting production to another facility. These costs may not be fully covered by our insurance.
Governmental policies reducing the amount of ethanol required to be added to gasoline, or eliminating tax incentives for flex-fuel vehicles, may adversely affect our business.
Governmental authorities of several countries, including Brazil and the United States, currently require the use of a certain percentage of anhydrous ethanol in gasoline. Since 1997, the Brazilian Sugar and Alcohol Inter-ministerial Council (Conselho Interministerial do Açúcar e Álcool), or “CIMA,” has fixed the percentage of anhydrous ethanol that must be used as an additive to gasoline. According to CIMA Resolution No. 1, dated March 4, 2015, the current percentage of anhydrous alcohol for regular gasoline is 27%, and for additive/premium gasoline, is 25%. According to data from the National Agency of Petroleum, Natural Gas and Biofuels (Agência Nacional do Petróleo, Gás Natural e Biocombustível), or the “ANP,” approximately one-half of all fuel ethanol in Brazil is used to fuel automobiles that run on a blend of anhydrous ethanol and gasoline; the remainder is used in either flex-fuel vehicles or vehicles powered by hydrous ethanol alone.
Other countries have similar governmental policies requiring various blends of anhydrous ethanol and gasoline. The United States currently requires the addition of 10% of ethanol into gasoline. The European Union is targeting 14% of energy
9
used in the transportation sector to derive from renewable energy sources by 2030. Other countries such as Canada have 5%, Peru and Thailand have a 10% biofuel-blending mandate, Paraguay have 20%, while Argentina currently has a 12% ethanol blending. In March 2021, the British government announced that that by September 2021 it would require an increase from 5% to 10% in biofuel additives to petroleum products, and E10 became the standard grade of petrol in September 2021 . Moreover, India has established a target of achieving 20% ethanol blending with petroleum by 2025. Any reductions in the percentage of ethanol to be added to gasoline or changes in Brazilian government policies related to the taxation and use of ethanol, as well as growth in the demand for other alternative fuels to ethanol, such as natural gas, may cause us significant adverse effects.
In addition, flex-fuel and ethanol-powered vehicles in Brazil are entitled to a tax benefit in the form of a lower tax rate on manufactured products (imposto sobre produtos industrializados) and, therefore, are currently taxed at lower levels than gasoline-only vehicles. This incentive contributed to the increase in production and sale of flex-fuel vehicles, and many of these policies and incentives aim to mitigate the effects of climate change. If climate change policies were to change, the legal framework and incentive structure promoting the use of ethanol may also change, leading to a reduction in the demand for ethanol.
Growth in the sale and distribution of ethanol depends in part on infrastructure improvements, which may not occur on a timely basis, if at all.
In contrast to the well-established logistical operations and infrastructure supporting sugar exports, ethanol exports inherently demand much more complex preparation and means of distribution, including outlets from our facilities to ports and shipping to other countries. Substantial infrastructure development by persons and entities outside our control is required for our operations, and the ethanol industry generally, to grow. Areas requiring expansion include, but are not limited to, additional railroad capacity, additional storage facilities for ethanol, increases in truck fleets capable of transporting ethanol within localized markets, expansion of refining and blending facilities to handle ethanol, growth in service stations equipped to handle ethanol fuels, and growth in the fleet of flex-fuel vehicles. Specifically, with respect to ethanol exports, improvements in consumer markets abroad are needed in the number and capacity of ethanol blending industrial plants, the distribution channels of gasoline-ethanol blends and the chains of distribution stations capable of handling fuel ethanol as an additive to gasoline.
Substantial investments required for these infrastructure changes and expansions may not be made or they may not be made on a timely basis. Any delay or failure in making the changes in or expansion of infrastructure may hurt the demand for or prices of our products, prevent our products’ delivery, impose additional costs on us or otherwise have a serious adverse effect on our business, operating results or financial status. Our business relies on the continuing availability of infrastructure for ethanol production, storage and distribution, and any infrastructure disruptions may have a material adverse effect on our business, financial condition and operating results.
A substantial portion of our assets is farmland that is highly illiquid.
Ownership of a significant portion of the land we operate is a key part of our business model. However, agricultural real estate is generally an illiquid asset. Moreover, the adoption of laws and regulations that impose limitations on ownership of rural land by foreigners in the jurisdictions in which we operate may also limit the liquidity of our farmland holdings. See “—Risks Related to the Countries in Which We Operate—Laws on the foreign ownership of rural properties may adversely affect our results of operations and future investments in rural properties.” As a result, it is unlikely that we will be able to promptly adjust our agricultural real estate portfolio in response to changes in economic, business or regulatory conditions. A lack of liquidity in local market conditions may adversely affect our ability to complete dispositions, to receive proceeds generated from any such sales, or to repatriate any such proceeds.
We have entered into agriculture partnership agreements in respect of a significant portion of our sugarcane plantations.
As of December 31, 2022, approximately 93.3% of our sugarcane plantations were leased through agriculture partnership agreements, for periods of an average of six to 12 years. We cannot guarantee that these agriculture partnerships will be renewed after their respective terms end, or whether such renewals will be on terms and conditions satisfactory to us. Any failure to renew the agriculture partnerships or obtain land suitable for sugarcane planting in sufficient quantity and at reasonable prices to develop our activities could adversely affect our results of operations, increase our costs or force us to seek alternative properties, which may not be available or be available only at higher prices.
Our performance depends on favorable working relationships with our employees and compliance with labor laws. Any strain on these relationships or increased labor costs could adversely affect our business.
10
Approximately 91% of our employees are represented by unions or equivalent bodies and are covered by collective bargaining or similar agreements which are subject to periodic renegotiation. We may not successfully conclude our labor negotiations on satisfactory terms, which may result in a significant increase in the cost of labor or may result in work stoppages or labor disturbances that disrupt our operations. Cost increases, work stoppages or disturbances that result in substantial amounts of raw product not being processed could have a material and adverse effect on our business, results of operations and financial condition.
Furthermore, all benefits and obligations provided under collective agreements negotiated are binding upon all parties, and have legal and practical effects on employment agreements.
If we do not observe legal and conventional binding provisions, we may be susceptible to labor disputes filed by employees, class actions filed by labor prosecutors, and inspections by labor protection agencies, resulting in the payment of legal and/or administrative sanctions.
Further, the Argentine Ley de teletrabajo (the “Teleworking Law”), and its related regulation, entered into force in April 2021 and governs labor contracts in which employees work in part or in full outside the employer's premises on a regular basis, except for those who work in clients' offices. The law regulates several aspects applicable to this modality, such as the right to digital disconnection, the right to a working schedule that is compatible with care tasks, reversibility, compensation of expenses, provision of work tools, and transnational services, among others. The measure’s greatest impacts include the need to provide employees with working tools and to compensate for greater expenses arising from remote work. While many companies have already defined and applied measures to implement this law, many others are still in the planning stage, while some companies have chosen to implement a mixed on-site and remote work schedule (in which case the Teleworking Law applies proportionally).
We may not possess all permits and licenses required to operate our business, or we may fail to renew or maintain the licenses and permits we currently hold which could subject us to fines and other penalties.
We are required to hold a variety of permits and licenses to conduct our farming and industrial operations, including but not limited to permits and licenses concerning land development, agricultural and harvesting activities, seed production, industrial plants, labor standards, occupational health and safety, land use, water use and other matters. We may not possess all of the permits and licenses required for each of our business segments. In addition, the approvals, permits or licenses or renewals thereof required by governmental agencies may change without substantial advance notice, and we could fail to obtain the approvals, permits or licenses required to expand our business. If we fail to obtain or to maintain such permits or licenses, or if renewals are granted with onerous conditions, we could be subject to fines and other penalties and be limited in the number or the quality of the products that we could offer. As a result, our business, results of operations and financial condition could be adversely affected.
Our business is subject to significant governmental regulation, which may adversely affect our results of operations and financial condition.
Our activities are subject to a broad set of laws and regulations relating to the protection of the environment. Such laws include compulsory maintenance of certain preserved areas within our properties, management of pesticides and associated hazardous waste and the acquisition and renewals of permits for water use and effluents disposal. In addition, the storage and processing of our products may create hazardous conditions. We could be exposed to civil, criminal and administrative penalties in addition to the obligation to remedy the adverse effects of our operations on the environment and to indemnify third parties for damages.
In addition, pursuant to Brazilian environmental legislation, corporate entities can be disregarded (such that the owners of the company will be liable for their debts) if necessary to guarantee the payment of costs related to the recovery of environmental damages whenever the legal entity is deemed by a court to be an obstacle to reimbursement of damages caused to the quality of the environment. Moreover, the relevant public authority may prevent us from using the property as long as environmental damages persist, which can directly affect the rent revenue stream of the agriculture partnership agreements. Because of the possibility of unanticipated regulatory measures or other developments, particularly as environmental laws become more stringent, the amount and timing of future expenditures required to maintain compliance could increase from current levels and could adversely affect the availability of funds for capital expenditures and other purposes. Compliance with existing or new environmental laws and regulations, as well as obligations in agreements with public entities, could result in increased costs and expenses.
11
Environmental laws and their enforcement are becoming more stringent in Argentina and Brazil, increasing the risk of and penalties associated with violations, which could impair or suspend our operations or projects and expose us to potentially adverse environmental legislation and regulation. Failure to comply with past, present or future laws could result in the imposition of fines, third-party claims, and investigation by environmental and police authorities and the relevant public attorney office. For example, the perceived effects of climate change may result in additional legal and regulatory requirements to reduce or mitigate the effects of our industrial facilities’ emissions. Such requirements, if enacted, could increase our capital expenditures and expenses for environmental compliance in the future, which may have a material and adverse effect on our business, results of operations and financial condition. Moreover, the denial of any permit that we have requested, or the revocation of any of the permits that we have already obtained, may have an adverse effect on our results of operations.
Climate change may impose increased costs on our operations.
Climate change poses challenges and opportunities for our business. More stringent environmental regulations can result in the imposition of costs associated with greenhouse gas emissions, through requirements either by environmental agencies or through other measures of a regulatory nature, such as carbon taxation and the creation of market limitations on greenhouse gas emissions, which have the potential to increase our operating costs and reduce our production.
The risks associated with climate change can also include difficulties in accessing capital due to reputational problems with investors, changes in consumer profiles, reduced consumption of fossil fuels and energy transitions in the global economy toward a more low-carbon matrix, with the inclusion of substitute products for fossil fuels and the increased use of electricity for urban mobility. These factors may have a negative impact on the demand for our products and services and may burden or even render the implementation and operation of our projects unfeasible, thereby adversely impacting our results and financial condition and limiting some of our opportunities for growth.
Furthermore, the potential physical impacts of climate change are uncertain and may vary by region, which includes changes in rainfall patterns, water shortages, changing sea levels and changing temperature levels that could adversely impact our business operations, the location, costs and competitiveness of global agricultural production and related storage and processing facilities. Yields may also be affected by plagues, diseases or weed infections and related operational problems. See “Item 5. Operating and Financial Review and Prospects—A. Operating Results—Trends and Factors Affecting Our Results of Operations—Effects of Yield Fluctuations.”
Some of the agricultural commodities and food products that we produce contain genetically modified organisms.
Our soybean, corn and cotton products contain GMOs in varying proportions depending on the year and the country of production. The use of GMOs in food has been met with varying degrees of acceptance in the markets in which we operate. In certain countries, adverse publicity about genetically modified food has led to governmental regulation limiting sales of GMO products in some of the markets in which our customers sell our products, including the European Union. It is possible that new restrictions on GMO products will be imposed in major markets for some of our products or that our customers will decide to purchase fewer GMO products or not buy GMO products at all, which could have a material adverse effect on our business, results of operations, financial condition or prospects.
We may face restrictions and penalties under consumer protection laws.
Brazil has a series of strict consumer protection statutes, collectively known as the Consumer Protection Code (Código de Defesa do Consumidor), which are intended to safeguard consumer interests and that apply to all companies in Brazil that supply products or services to Brazilian consumers. The Consumer Protection Code may apply to business customers if they are considered the “end user” of the products provided. Regardless, courts may understand that the rules of the Consumer Protection Code should exceptionally apply to instances where the company acquiring the products as input to its supply chain are considered to be technically, legally and/or financially vulnerable towards us. In addition, the Consumer Protection Code provides for a series of contractual clauses that are held null and void by operation of law, whenever they reduce or limit its liability towards consumers; entail a waiver or disposal of rights; transfer liability to third parties; establish obligations considered inequitable or abusive that place the consumer at an unreasonable disadvantage; or that are incompatible with good faith or equitable practices, among others.
In Brazil, penalties are often levied by the Brazilian Consumer Protection Agencies (Fundação de Proteção e Defesa do Consumidor), or “PROCONs” and prosecutors, which oversee consumer issues on a district-by-district basis. Companies that operate across Brazil may face penalties from multiple PROCONs, as well as the National Secretariat for Consumers (Secretaria Nacional do Consumidor). Companies may settle claims made by consumers via PROCONs and the courts by paying compensation for violations directly to consumers and through a mechanism that allows them to adjust their conduct,
12
called a conduct adjustment agreement (Termo de Ajustamento de Conduta), or “TAC.” Brazilian Public Prosecutor Offices may also commence investigations related to consumer rights violations and this TAC mechanism is also available for them. Companies that violate TACs face potential automatic fines. Brazilian prosecutors may also file class actions against companies in violation of consumer rights, seeking strict observation to the consumer protection law provisions and compensation for the damages consumers may have suffered.
For instance, we may be subject to product liability claims, product recalls and restrictions on exports for contaminated products. The sale of food products for human consumption involves the risk of injury to consumers. These injuries may result from tampering by third parties, bioterrorism, product contamination or spoilage, including the presence of bacteria, pathogens, foreign objects, substances, chemicals, other agents, or residues introduced during the growing, storage, handling or transportation phases. We cannot be sure that consumption of our products will not cause a health-related illness in the future or that we will not be subject to claims or lawsuits relating to such matters. The negative publicity surrounding any assertion that our products caused illness or injury could adversely affect our reputation with existing and potential customers and our corporate and brand image, and we could also incur significant legal expenses and criminal charges. Moreover, claims or liabilities of this nature might not be covered by any rights of indemnity or contribution that we may have against others, which could have a material adverse effect on our business, results of operations or financial condition.
IFRS accounting standards related to biological assets require us to make numerous estimates in the preparation of our financial statements and therefore limit the comparability of our financial statements to similar issuers using U.S. GAAP.
IAS 41 “Biological Assets” requires that we measure our biological assets and agriculture produce at the point of harvest at fair value less costs to sell. Therefore, we are required to make assumptions and estimates relating to, among others, future agricultural commodity yields, prices, and production costs extrapolated through a discounted cash flow method. For example, the value of our biological assets generated initial recognition and changes in fair value of biological assets amounting to gains of $215.9 million, $227.7 million and $122.7 million in 2022, 2021 and 2020, respectively. The assumptions and estimates used to determine the fair value of biological assets, and any changes to such prior estimates, directly affect our reported results of operations. If actual market conditions differ from our estimates and assumptions, there could be material adjustments to our results of operations. In addition, the use of such discounted cash flow method utilizing these future estimated metrics differs from generally accepted accounting principles in the United States (“U.S. GAAP”). As a result, our financial statements and reported earnings are not directly comparable to those of similar companies in the United States.
Our indebtedness could impair our financial condition and impair our ability to receive or pay out dividends.
As of December 31, 2022, we had $679 million of net debt outstanding on a consolidated basis, including our $500 million Senior Notes due 2027. Certain of our subsidiaries in Argentina and Brazil have a substantial amount of debt, which requires significant principal and interest payments. Such indebtedness could affect our subsidiaries’ future operations, for example, by requiring a substantial portion of their cash flows from operations to be dedicated to the payment of principal and interest on indebtedness instead of funding working capital and capital improvements and other investments. The amount of debt incurred by us and our subsidiaries also imposes significant debt obligations, increasing our cost of borrowing to satisfy business needs and limiting our ability to obtain additional financing.
The substantial level of indebtedness borne by certain of our subsidiaries also affects the amount of cash available to them to pay as dividends, increasing our vulnerability to economic downturns or other adverse developments relative to competitors with less leverage, and limiting our ability to obtain additional financing for working capital, capital expenditures, acquisitions or other corporate purposes in the future. Moreover, our indebtedness places limits on our ability to make acquisitions or needed capital expenditures or to pay dividends to our shareholders.
The terms of our indebtedness and that of certain of our subsidiaries impose significant restrictions on our operating and financial flexibility.
The terms of our Senior Notes due 2027 and the debt instruments of some of our subsidiaries contain customary covenants including limitations on our ability to, among others, incur or guarantee additional indebtedness; make restricted payments, including dividends and prepaying indebtedness; create or permit liens; enter into business combinations and asset sale transactions; make investments, including capital expenditures; and enter into new businesses. Some of these debt instruments are also secured by various collateral including mortgages on farms, pledges of subsidiary stock and liens on certain facilities, equipment and accounts. Some of these debt instruments also contain cross-default provisions, where a default on one loan by one subsidiary could result in lenders of otherwise performing loans declaring a default. These restrictions could limit our ability to obtain future financing, withstand a future downturn in business or the economy in general, conduct operations or otherwise take advantage of business opportunities that may arise. Moreover, by reducing the level of dividends
13
we may receive, the terms of our subsidiaries’ indebtedness place limits on our ability to make acquisitions or needed capital expenditures or to pay dividends to our shareholders.
The financial ratio covenants we are currently required to meet, some of which are measured on a combined basis aggregating results of the borrowing subsidiaries and others which are measured on an individual debtor basis, include, among others, debt service coverage, minimum liquidity and leverage ratios.
The failure to maintain applicable financial ratios, in certain circumstances, would prevent us from borrowing additional amounts and could result in a default under such indebtedness. If we or our subsidiaries are unable to repay those amounts, the affected lenders could initiate bankruptcy-related proceedings or enforce their rights to the collateral securing such indebtedness, which would have a material and adverse effect on our business, results of operations and financial condition.
Fluctuations in interest rates could have a significant impact on our results of operations, indebtedness and cash flow.
As of December 31, 2022, approximately US$800.7 million of our total debt on a consolidated basis was subject to fixed interest rates, and US$207.0 million was subject to variable interest rates. As of December 31, 2022, borrowings incurred by our subsidiaries in Brazil were repayable at various dates between January 2023 and November 2027 and bear either fixed interest rates ranging from 2.00% to 13.23% per annum or variable or variable rates based on Brazilian Long-Term Interest Rate (Taxa de Juros de Longo Prazo), the Brazilian Broad Consumer Prices Index (Índice de Preços ao Consumidor Amplo), and the Brazilian interbank rate (taxa do certificado de depósito bancário), or the “CDI rate” plus spreads ranging from 8.5% to 16.3% per annum. Borrowings incurred by our subsidiaries in Argentina repayable at various dates between December 2022 and June 2028 and bear either fixed interest rates ranging from 0.0% to 9.2% per annum. Significant interest rate increases can have an adverse effect on our profitability, liquidity and financial position. If interest rates increase, whether because of an increase in market interest rates or an increase in our own cost of borrowing, our debt service obligations for our variable rate indebtedness would increase, and our net income could be adversely affected. We may be unable to adequately adjust our prices to offset any increased financing costs, which would have an adverse effect on our results of operations.
In addition, changes in the fair value of the derivative instruments can result in a non-cash charge or gain being recognized in our financial results for a period preceding the period or periods in which settlement occurs under the derivative instruments and interest payments are made. Changes or shifts in interest rates can significantly impact the valuation of our derivatives and therefore could expose us to substantial mark-to-market losses or gains if interest rates fluctuate materially from the time when the derivatives were entered into. Accordingly, fluctuations in interest rates may impact our financial position, results of operations, and cash flows. See Note 2 to our Consolidated Financial Statements.
We may need additional capital and we may not be able to obtain it.
We believe that our existing cash and cash equivalents, cash flows from operations and ability to raise financing are and will be sufficient to meet our anticipated cash needs for the foreseeable future. We may, however, require additional cash resources due to changed business conditions or other future developments, including any investments or acquisitions we may decide to pursue. If these resources are insufficient to satisfy our cash requirements, we may seek to sell additional equity or debt securities or obtain other sources of financing. The sale of additional equity securities could result in dilution to our shareholders. The incurrence of indebtedness could result in increased debt service obligations and could require us to agree to operating and financing covenants that would restrict our operations.
Our ability to obtain additional capital on acceptable terms is subject to a variety of uncertainties, including:
•conditions of the U.S. capital markets and other capital markets in which we may seek to raise funds;
•our future results of operations and financial condition;
•government regulation of foreign investment in the United States, Europe, and Latin America; and
•global economic, political, and other conditions in jurisdictions in which we do business.
Moreover, certain of our subsidiaries rely substantially on existing uncommitted credit lines to support their operations and business needs through the agricultural harvest cycle. If we are unable to renew these credit lines, or if we cannot replace such credit lines with other borrowing facilities, our financial condition and results of operations may be adversely affected.
14
There is a risk that we could be treated as a U.S. domestic corporation for U.S. federal income tax purposes, which could materially increase our U.S. federal income tax liability and subject any dividends we pay to U.S. federal withholding tax.
Immediately prior to our IPO, we acquired approximately 98% of IFH, a holding company, which was a partnership for U.S. federal income tax purposes organized under the laws of Delaware in exchange for our common shares. Under section
7874(b) of the U.S. Internal Revenue Code of 1986, as amended, or the “Code”, we would be treated as a U.S. domestic corporation if we were deemed to have acquired substantially all of the assets constituting the trade or business of a U.S. domestic partnership and former members of IFH were deemed to own at least 80% of our common shares by reason of the transfer of those trade or business assets (ignoring common shares issued in our IPO for purposes of the 80% threshold). The rules mentioned above are unclear in certain respects and there is limited guidance on the application of the rules to partnership acquisitions. Accordingly, we cannot assure you that the U.S. Internal Revenue Service will not seek to assert that we are a U.S. domestic corporation, which assertion if successful could materially increase our U.S. federal income tax liability and require us to withhold tax from any dividends we pay to holders of our common shares who are not United States persons within the meaning of section 7701(a) (30) of the Code. See “Item 10. Additional Information—E. Taxation—United States Federal Income Taxation of the Company.”
We may be classified by the IRS as a “passive foreign investment company,” which may result in adverse tax consequences for U.S. investors in our common shares.
Whether we will be a passive foreign investment company, or a “PFIC,” for U.S. federal income tax purposes for the current or future tax year will depend on our assets and income over the course of each such tax year and, as a result, cannot be predicted with certainty as of the date of this annual report. Under circumstances where our cash is not deployed for active purposes, our risk of becoming a PFIC may increase. Although the determination of whether a corporation is a PFIC is made annually, and thus may be subject to change, we do not believe that we were a PFIC for U.S. federal income tax purposes for our most recently completed taxable year. However, there can be no assurance that we will not be a PFIC for any taxable year. If we were treated as a PFIC for any taxable year during which a U.S. investor owned common shares, certain adverse tax consequences could apply to such U.S. investor. A U.S. taxpayer who owns stock in a foreign corporation during any year in which such corporation is a PFIC may be able to mitigate such negative tax consequences by making certain U.S. federal income tax elections, which are subject to numerous restrictions and limitations. Holders of the Company’s common shares are urged to consult their own tax advisors regarding the acquisition, ownership, and disposition of the Company’s common shares. See “Item 10. Additional Information—E. Taxation—Material U.S. Federal Income Tax Considerations for U.S. Holders—Passive Foreign Investment Company (“PFIC”) Rules.”
We are subject to anticorruption, anti-bribery, anti-money laundering and other international trade laws and regulations.
We are required to comply with the laws and regulations of Brazil and other jurisdictions where we conduct operations. In particular, we are subject to Law No 12,846/2013, to the U.S. Foreign Corrupt Practices Act of 1977, or the “FCPA,” to the United Kingdom Bribery Act of 2010, as well as economic sanction programs, including those administered by the United Nations, the European Union and the United States, including the U.S. Treasury Department’s Office of Foreign Assets Control.
Law No. 12,846/2013, or the “Brazilian Anticorruption Law,” imposes strict liability on companies, in the civil and administrative spheres, for acts contrary to the Brazilian federal public administration practiced by their directors, administrators, collaborators or third parties acting on their behalf or benefit. Among the sanctions applied are fines, loss of assets, rights and values illicitly obtained, suspension or partial interdiction of activities, prohibition on contracting with the government or receiving benefits or tax or credit incentives and confiscation of assets, which sanctions, if applied, could adversely affect our results. In Brazil, other laws that provide for violations related to corruption and unlawful acts against the Public Administration are also applicable to us, such as Law No. 8,492/1992 (as amended by Law No. 14,230, dated October 25, 2021), or the “Administrative Misconduct Law,” which also provides for penalties that include the prohibition to enter into contracts with the government for a period of up to 14 years. Our governance structure, internal control mechanisms, risk management and compliance may not be sufficient or capable of preventing or detecting (i) violations of the Anticorruption Law, the Administrative Misconduct Law or other rules related to combating corruption and fraud, (ii) occurrences of fraudulent or dishonest behavior on the part of our managers, employees, subsidiaries, controllers, affiliates or any contracted individuals and legal entities and other agents acting on our behalf or for our benefit or on behalf and for the benefit of such parties or (iii) other occurrences of behavior not in line with ethical principles, which may adversely affect our reputation, as well as our business, financial condition and results of operations, or the price of the securities issued by us.
Law No. 27,401/2017, or the “Argentinian Corporate Criminal Liability Law,” makes legal entities criminally liable for local or international bribery and influence peddling, negotiations that are incompatible with public office, illegal payments
15
made to public officials under the appearance of taxes or fees owed to the relevant government agency, illegal enrichment of public officers and employees, and producing aggravated false balance sheets and reports to cover up local or international bribery or influence peddling. Legal entities shall be liable when these crimes are committed, directly or indirectly, with their intervention or on their behalf, interest or Benefit and are only exempted from liability if the individual who committed the crime acted exclusively in his/her own benefit and without benefit for the entity. Legal entities may be convicted even if it is not possible to identify or convict the individual involved in the crime, provided that the circumstances of the case allow for establishing that the crime could not have been committed without tolerance of the authorities of the legal entity. Although previous drafts of the bill included sections making controlling entities liable for economic penalties imposed on their subsidiaries under this law, such articles were removed from the law as approved by Congress. Among the sanctions applied are fines, loss of assets, rights and values illicitly obtained, suspension or partial interdiction of activities, prohibition on contracting with the government or receiving benefits or tax or credit incentives and confiscation of assets, which sanctions, if applied, could adversely affect our results.
The FCPA prohibits providing anything of value to foreign officials for the purposes of obtaining or retaining business or securing any improper business advantage. As part of our business, we may deal with entities and employees which are considered foreign officials for purposes of the FCPA. In addition, economic sanctions programs restrict our dealings with certain sanctioned countries, individuals and entities. When issues arise, we attempt to act promptly to learn relevant facts, conduct appropriate due diligence, and take any appropriate remedial action to address the risk. There can be no assurance that our internal policies and procedures will be sufficient to prevent or detect all inappropriate practices, fraud or violations of law by our employees, directors, officers, partners, agents and service providers or that such persons will not take actions in violation of our policies and procedures (or otherwise in violation of the relevant anticorruption laws and sanctions regulations) for which we or they may be ultimately held responsible.
Violations of anti-bribery and anticorruption laws and sanctions regulations could have a material adverse effect on our business, reputation, results of operations and financial condition. In addition, we may be subject to one or more enforcement actions, investigations and proceedings by authorities for alleged infringements of these laws. These proceedings may result in penalties, fines, sanctions or other forms of liability and could have a material adverse effect on our reputation, business, financial condition and results of operations. We cannot predict whether future investigations, developments from current investigations or allegations involving us or involving any of our affiliates, officers, employees, shareholders or members of our Board of Directors or any third parties related to us in any way will arise. In the event of investigations, allegations or developments, our reputation, business, financial condition, results of operations, as well as the price of the securities issued by us, may be adversely affected.
We may be adversely affected by the ongoing armed conflict between Russia and Ukraine.
The ongoing war between Russia and Ukraine has disrupted supply chains and international trade generally. Following Russia’s invasion of Ukraine beginning on February 24, 2022, the United States, the United Kingdom, the E.U. and other countries announced broad economic sanctions against Russia, including financial measures such as freezing Russia’s central bank assets and limiting its ability to access its U.S. dollar reserves. The United States, the E.U. and the United Kingdom have also banned people and businesses from dealings with the Russian central bank, its finance ministry and its wealth fund. Selected Russian banks will also be removed from Swift messaging system, which enables the smooth transfer of money across borders. Other sanctions by the United Kingdom include major Russian banks being excluded from the United Kingdom financial system, stopping them from accessing sterling and clearing payments, major Russian companies and the state being stopped from raising finance or borrowing money on the United Kingdom markets, and the establishment of limits on deposits Russians can make at United Kingdom banks. The United States, the E.U. and the United Kingdom adopted personal measures, such as sanctions on individuals with close ties to Mr. Putin, and placed visa restrictions on several oligarchs, as well as their family members and close associates, and freezing of assets.
While the precise effect of the ongoing war and these sanctions on the Russian and global economies remains uncertain, they have already resulted in significant volatility in financial markets, depreciation of the Russian ruble and the Ukrainian hryvnia against the U.S. dollar and other major currencies, as well as an increase in energy and commodity prices globally. As a result, in particular, the availability and pricing of fertilizers for the 2022/2023 harvest is subject to significant uncertainty in Brazil and Argentina. From a supply point of view, Brazil and Argentina are highly dependent on fertilizer imports, and Russia and Belarus hold a significant market share in Brazilian and Argentine soil fertilizer imports (a share that is higher for potash-based products). In addition, fertilizer prices, which had already risen before the conflict, have continued to rise and have led producers to delay purchase negotiations. As a result of such supply risk and the slow pace of the market at present, we expect that there may be shortages of some types of fertilizers (mainly for potash-based products). We may also be unsuccessful in finding alternative direct imports from nonsanctioned regions or in increasing our prices to reflect increased
16
supply costs in the future. Failure to obtain fertilizer on favorable terms, sufficient quantities or at all could have a material adverse effect on our production capacity.
Finally, geopolitical tension in petroleum-producing countries can affect the global supply and lead prices to rally. The war in Ukraine led to oil prices reaching as high as US$139.0 per barrel, the highest price since 2008. Although this positively impacted ethanol demand and prices, we cannot assure you that such geopolitical tension will not come to adversely affect our results of operations and financial condition.
Technological advances or alternative products may affect demand for our products and services or require substantial capital investments to remain competitive.
Technological advances may affect demand for products or require substantial capital investments to remain competitive. The development and implementation of new technologies can result in a significant reduction in the costs of the products and services we distribute. We cannot predict when new technologies may become available or the effects of these events on our business. Advances in the development of alternatives to the products and services we currently distribute can significantly reduce demand or eliminate the need for them. Any advances in technology that require significant capital investments to ensure competitiveness, or that otherwise reduce demand for our services, will have a material adverse effect on our business and financial performance. In addition, any other alternative products or technological advances that reduce demand for our services could have a material adverse effect on our results of operations and financial condition.
Security breaches and other disruptions could compromise our technology infrastructure and information and expose us to processes disruption and liability, which would cause our business and reputation to suffer.
In the ordinary course of our business, we depend on technology to carry out our business. We also collect and store sensitive data, including intellectual property, our proprietary business information and that of our customers and suppliers, and personally identifiable information of our employees, in our data centers and on our networks. The secure processing, maintenance and transmission of this information is critical to our operations. In addition, these systems may require modifications or upgrades as a result of technological changes or growth in our business. Although we take actions to secure our systems and electronic information and have disaster recovery plans in case of incidents that could cause major disruptions to our business, these measures may not be enough.
Despite our security measures, our information technology and infrastructure may be vulnerable to attacks by hackers or breached due to employee error, malfeasance or other disruptions. Any such breach could compromise our networks, our systems, and eventually suffer from systems disruption and/or having the information stored there accessed, publicly disclosed, lost or stolen. Any such access, disclosure or other loss of information could result in legal claims or proceedings, fines from governmental authorities, disrupt our operations, damage our reputation, and cause over costs to remedy the harm suffered, which could adversely affect our business/operating margins, revenues and competitive position.
We depend on our information technology systems and any failure of these systems could adversely affect our business.
We depend on information technology systems for significant elements of our operations, including data storage and retrieval of critical business information. Our information technology systems are vulnerable to damage from a variety of sources, including network failures, malicious human acts and natural disasters. In addition, some of our servers are potentially vulnerable to physical or electronic break-ins, computer viruses and similar disruptive issues. Failures or significant disruptions to our information technology systems or those used by our third-party service providers may prevent us from conducting our general business operations. Any disruption or loss of information technology systems on which critical aspects of our operations depend could have an adverse effect on our business, results of operations and financial condition.
In addition, we store highly confidential information on our information technology systems, including information related to our products. If our servers or third-party servers on which our data is stored are attacked by a physical or electronic break-in, computer virus or any other malicious human action, our confidential information may be stolen, unlawfully disclosed or destroyed. Any security breach involving misappropriation, loss or unauthorized disclosure or use of confidential information of our suppliers, customers or others, whether by us or by third parties, could subject us to civil and criminal penalties, have a material negative impact on our brands and reputation, create relevant legal and financial exposure, result in loss of customer confidence, or decrease the use of our products and services, any of which results may have an adverse impact on our business, results of operations and reputation.
Our security measures may also be breached by human error, wrongdoing, system errors or vulnerabilities, or other irregularities. Our measures to monitor and develop information technology infrastructure and networks may not be effective in
17
protecting us against cyberattacks and other breaches related to our information technology systems. The techniques used to gain unauthorized, improper or illegal access to our systems, data or data from our customers, to disable or degrade services, or to sabotage systems are constantly evolving, can be difficult to detect quickly and often are not recognized until they are used against a target. Unauthorized parties may attempt to gain access to our systems or facilities by various means, including, but not limited to, hacking into our systems or those of our customers, partners or suppliers, or attempting to fraudulently induce our employees, customers, partners, suppliers or other users of our systems to disclose usernames, passwords, financial information or other confidential information, which in turn may be used to access our information technology systems. Certain third-party efforts to access information technology systems can be supported by significant financial and technological resources, making them even more sophisticated and difficult to detect.
Noncompliance with data protection laws could adversely affect our business.
Personal privacy, information security, and data protection are significant issues globally. The regulatory framework governing the collection, processing, storage, use and sharing of certain information, particularly financial and other personal data, is rapidly evolving and is likely to continue to be subject to uncertainty and varying interpretations. The occurrence of unanticipated events and the development of evolving technologies often rapidly drive the adoption of legislation or regulation affecting the use, collection or other processing of data and the manner in which we conduct our business. Any failure or perceived failure by us to comply with our privacy policies or any applicable privacy, security or data protection, information security or consumer-protection related laws, regulations, orders or industry standards in one or more jurisdictions could expose us to costly litigation, significant awards, fines or judgments, civil and criminal penalties or negative publicity, and could materially and adversely affect our business, financial condition and results of operations.
The Brazilian General Data Protection Law (Lei Geral de Proteção de Dados) or the “LGPD,” which came into force on September 18, 2020, is a comprehensive data protection law establishing general principles and obligations that apply across multiple economic sectors and contractual relationships. The LGPD applies to individuals or legal entities, private or government entities, who process personal data in Brazil or collect personal data in Brazil or, further, when the processing activities have the purpose of offering or supplying goods or services to data subjects located in Brazil. The LGPD establishes detailed rules for the collection, use, processing and storage of personal data (including personal data of clients, suppliers and employees), and affects all economic sectors, including the relationship between customers and suppliers of goods and services, employees and employers and other relationships in which personal data is collected, whether in a digital or physical environment. Specifically, the LGPD establishes, among others, personal data owners’ rights, the legal basis for personal data protection, requirements for obtaining consent from data owners, obligations and requirements related to security incidents, data leaks and data transfers, as well as the creation of the National Data Protection Authority (Autoridade Nacional de Proteção de Dados), or the “ANPD,” for the purposes of monitoring, implementing and supervising compliance with the LGPD in Brazil. In the event of noncompliance with the LGPD, we may be subject to penalties, including (1) warnings, with the impositions of a deadline for the adoption of corrective measures; (2) a one-time fine of up to 2% (subject to an upper limit of R$50,000,000) of our revenue; (3) a daily fine (subject to an upper limit of R$50,000,000); (4) public disclosure of the violation; (5) the restriction of access to the personal data to which the violation relates, until corrective measures are implemented; (6) deletion of the personal data to which the violation relates; (7) partial suspension of the databases to which the violation relates for up to 12 months, until corrective measures are implemented; (8) suspension of the personal data processing activities to which the violation relates for up to 12 months; and (9) partial or full prohibition on personal data processing activities. While we have put in place systems and processes to comply with the LGPD, we cannot assure you that our LGPD compliance efforts will be deemed appropriate or sufficient by regulatory authorities or by courts, such as the Brazilian Public Prosecution Office (Ministério Público). Moreover, as the LGPD requires further regulation from the ANPD regarding several aspects of the law, which are yet unknown, and we may have difficulty adapting our systems and processes to the new legislation due to the legislation’s complexity. The changes have impacted, and could further adversely impact, our business by increasing our operational and compliance costs.
In Argentina, Law No. 25,326 on the Protection of Personal Data, or the “LPPD,” regulates issues related to the protection of data stored in files, records, databases, or other technical means of data processing, whether these are public or private, to guarantee the right to honor and privacy of people, as well as access to the information that is recorded about them. The owner of personal data has the power to exercise the right of access to them free of charge at intervals of no less than six months, unless a legitimate interest is proven for this purpose in accordance with the LPPD. The Agency for Access to Public Information, in its capacity as enforcement authority of LPPD, has the power to deal with complaints and claims filed by those who are affected by their rights due to breach of current regulations on personal data protection.
Any additional privacy laws, rules or regulations enacted or approved in Brazil, Argentina or in other jurisdictions in which we operate could cause us to incur costs to correct the breaches or failures, expose us to uninsured liability, increase our risk of regulatory scrutiny, subject us to lawsuits and result in the imposition of material penalties and fines under state and
18
federal laws or regulations, which could seriously harm our business, financial condition or results of operations. Any failure, real or perceived, by us to comply with our privacy policies or with any regulatory requirements or orders or other local, state, federal or international privacy or consumer protection-related laws and regulations could cause customers to reduce their purchases of our agricultural products and services and could materially and adversely affect our business.
Our operations are subject to disruptions by third parties who interfere with the possession of our real estate or our means of production.
Our operations are subject to disruption by third parties, including through illegal burnings, the invasion or occupation of our real estate, and the blocking of roads and agricultural land by members of certain social movements, environmental protection movements, as well as indigenous peoples, all of which is common practice in, and affects, the industry. In certain regions, including those where we own property or lease land under agricultural partnership agreements, available remedies, such as police protection and litigation, may be inadequate or nonexistent. In these cases, our operations, image and reputation may be affected, and we may be subject to legal and administrative litigation that may result in criminal and administrative penalties, including, but not limited to, suspension, shutdowns, and a requirement to pay fines, which may also result in the need for additional investments. In addition, we may be subject to civil liabilities for environmental damage, which includes the obligation to redress any damages caused to the environment and/or public health. The demonstration of the cause-and-effect relationship between the damage caused and action or omission is sufficient to trigger the obligation to redress environmental damage.
Moreover, social movements are active in Brazil and advocate land reform and mandatory property redistribution by the Brazilian government. Land invasions and occupations of rural areas by a large number of individuals is common practice for these movements, and, in certain areas, including those in which we have invested or are likely to invest, police protection and effective eviction proceedings are not available to land owners. As a result, we cannot assure you that our properties will not be subject to invasion or occupation by these groups. A land invasion or occupation could materially impair the normal use of our lands or have a material adverse effect on our results of operations, financial condition or the value of our common shares. In addition, our land may be subject to expropriation by the Brazilian government. Under the Brazilian Federal Constitution, the Brazilian government may expropriate land that is not in compliance with mandated local “social functions.” A “social function” is defined as including: (i) the rational and adequate use of land; (ii) the adequate use of natural resources available and preservation of the environment; (iii) compliance with labor laws; and (iv) the use of land to promote welfare of owners and employees. If the Brazilian government decides to expropriate any of our properties, our results of operations may be adversely affected, to the extent that potential compensation to be paid by the Brazilian government may be less than the profit we could make from the sale or use of such land. Disputing the Brazilian government’s expropriation of land is usually time-consuming and the outcomes of such challenges are uncertain. In addition, we may be forced to accept public debt bonds, which have limited liquidity, as compensation for expropriated land instead of cash.
In addition, along with the expropriation rights, Brazilian law also confers to the government the power to create public easements over third-party property. Public easements are commonly used where infrastructure projects require the use of multiple plots of land, in particular in rural areas (e.g. transmission lines or oil and gas pipelines). Public easements require the payment of fair and prior indemnification, which authorizes the government to use such property for the public interest. The creation of a public easement must observe the same procedures applicable for the expropriation of real property. However, unlike expropriation, the public easement does not remove the property from the owners' estate, but only creates the right of using the property or part of it. The creation of a public easement on our land, including on our farmland, will mean we will be prevented from using the relevant piece of land, which could adversely affect our results of operations and financial condition.
Risks Related to the Countries in Which We Operate
Our results of operations and financial condition are dependent upon economic conditions in the emerging countries in which we operate.
All of our operations and/or development activities are in South America. As of December 31, 2022, based on total asset value, 44.5% of our assets were located in Argentina, 45.8% in Brazil and 3.8% in Uruguay. During the year ended December 31, 2022, 27.6% of our consolidated sales of goods and services rendered were attributable to our Argentine operations, 36.6% were attributable to our Brazilian operations and 35.0% were attributable to our Uruguayan operations. In the future, we expect to have additional operations in the South American countries in which we now operate or in other countries with similar political, economic and social conditions. Many of these countries have a history of economic instability or crises (such as inflation or recession), government deadlock, political instability, civil strife, changes in laws and regulations, expropriation or nationalization of property, and exchange controls which could adversely affect our business, financial condition and results of operations.
19
In particular, fluctuations in the economies of Argentina, Brazil and Uruguay, and actions adopted by the governments of those countries have had and may continue to have a significant impact on companies operating in those countries, including us. Specifically, we have been affected and may continue to be affected by high levels of inflation, increased interest rates, fluctuations in the value of the Argentine peso and the Brazilian Real against foreign currencies, wage controls, price and foreign exchange controls, regulatory policies, business and tax regulations, political and social tension, and in general by the political, social and economic scenarios in Argentina, Brazil and to a lesser extent, Uruguay.
The Argentine economy has experienced significant volatility in past decades, including numerous periods of low or negative growth and high and variable levels of inflation and currency devaluation. Inflation remains a challenge for Argentina given its persistent nature in recent years and also considering its high levels during 2021 and 2022. No assurances can be given that the rate of growth experienced over past years will be achieved in future years or that the national economy will not suffer a recession. If economic conditions in Argentina were to continue slowing down, or contract, if inflation were to accelerate further, or if the Argentine government's measures to attract or retain foreign investment and international financing in the future to incentivize domestic economy activity are unsuccessful, such developments could adversely affect Argentina's economic growth and in turn affect our financial health and results of operations.
Moreover, on November 14, 2021 the current Argentine presidential administration suffered a setback after losing a majority in the Argentine Congress following midterm legislative elections. The opposing party representing the former administration obtained five seats in the Senate, causing the current administration to lose quorum in the Senate. Furthermore, other political forces, including conservative and libertarian parties, and far-left parties, also obtained seats in Congress. The results of the midterm legislative elections have generated uncertainty with respect to the overall implementation of the current administration’s economic and political agenda (including the interventions described below). The lack of predictability of political and economic measures that may be adopted in the future could impact our financial projections, which may in turn affect our business, financial condition or results of operations.
Furthermore, presidential and congressional primary and general elections in Argentina will take place in August and October 2023, respectively. There is uncertainty as to who will be elected president in the October 2023 presidential election. Therefore, the continuation of the measures and policies adopted by the current administration or change to be adopted by a new administration and their impact on the economy and our business remain uncertain.
Additionally, in Brazil, the president has the power to enact policies and issue orders relating to the Brazilian economy, including in the sector in which we operate, through specific regulations or through their control over Petrobras, our sole supplier of gasoline, diesel and certain other oil by-products, which could affect our operations and financial performance in Brazil. Political and economic uncertainty and any new policies or changes in current policies could have a material adverse effect on our business, operating results, financial condition and prospects. And any difficulty by the Brazilian government in obtaining a majority in the national Congress could result in congressional stalemate, political unrest and massive demonstrations and/or strikes that could adversely affect our operations. Uncertainties in relation to the implementation, by the current government, of changes related to monetary, fiscal and social security policies, as well as to the pertinent legislation, can contribute to economic instability. These uncertainties and new measures may increase the volatility of the Brazilian securities market, and issues may be exacerbated by the post-election scenario following the presidential election held in October 2022, considering the transition to a new government and the policies that may be implemented by it, in addition to Brazil’s current political polarization.
Economic and political conditions in the countries in which we operate, and the perception of these conditions in international markets, may adversely impact our business, our access to the capital and debt markets, our results of operations and financial condition.
The Brazilian and Argentine economies have experienced extreme volatility in recent decades, with uneven periods of economic growth, periods of high inflation and devaluation of the Argentine peso and the Brazilian Real against the U.S. dollar. Our business and operations may be affected by the economic and political events that may affect the Brazilian and Argentine economies, such as price controls, foreign exchange controls, currency devaluations, high interest rates, increased public expenditures, tax increase or other regulatory initiatives.
The credibility of several Argentine economic indices during the Ms. Cristina Fernández de Kirchner administration (from 2004 through 2015) has been called into question. By previously understating inflation, INDEC overstated economic growth in real terms. The adjustments made by the Mr. Mauricio Macri administration to INDEC, beginning in 2016, led to a determination of real GDP growth of 48.6% between 2004 and 2015 rather than the officially reported 65% growth. Because of these reforms, on November 9, 2016, the Executive Board of the International Monetary Fund, or the “IMF,” lifted its censure on Argentina, noting that Argentina had resumed the publication of data in a manner consistent with its obligations under the
20
Articles of Agreement of the IMF. On June 29, 2017, INDEC also published revised GDP data for the years 2004 through 2015. According to INDEC, Argentina’s GDP grew by 2.9% in 2017, decreased by 2.5% in 2018, decreased by 2.2% in 2019, decreased by 10.0% in 2020, increased 11.9% in 2021 and grew cumulatively, for the third quarter of 2022, by 6.4%. According to the IMF, Argentina’s GDP is expected to increase by 2.0% in 2023. Moreover, since 2015, international commodity prices for Argentina’s primary commodity exports have fluctuated, which has had an adverse effect on Argentina’s economic growth. Relying on the export of certain commodities, such as soy, has made the Argentine economy more vulnerable to fluctuations in the prices of commodities. If international commodity prices decline, the Argentine economy could be adversely affected. In addition, adverse weather conditions can affect the production of commodities by the agricultural sector, which accounts for a significant portion of Argentina's export revenues.
In 2019, Mr. Alberto Fernandez and Ms. Fernández de Kirchner were elected president and vice-president, respectively. Markets reacted negatively to this result, and economic conditions in Argentina continued to deteriorate. Due to, among others, the rise of inflation, the continued demand for salary increases, the growth of the fiscal deficit, the required payments to be made on public debt, the reduction of industrial growth, the recession and the increase of the capital outflows from Argentina, the Macri administration reintroduced rigid restrictions and foreign exchange controls in September 1, 2019, which, among others, significantly curtailed access to the official foreign exchange market (the Mercado Libre de Cambios), or “FX Market” by individuals and entities. See “Item 10. Additional Information—D. Exchange Controls.” Throughout 2019, 2020, 2021 and early 2022, social and political tension and high levels of poverty and unemployment persisted while industrial activity and consumption diminished considerably. The deterioration of the economy significantly increased the social and political turmoil, including civil unrest, riots, looting, nationwide protests, strikes and street demonstrations. Due to the high levels of inflation and devaluation, employers both in the public and private sectors are experiencing significant pressure from organized labor unions and their employees to further increase salaries. On December 23, 2019, the “Ley de Solidaridad Social y Reactivación Productiva” or Social Solidarity Law was enacted. The Social Solidarity Law decreed a public emergency in economic, financial, fiscal, administrative, social security, tariff, energy, health and social matters. As a result of this measure, the Argentine President and Congress gained considerable powers to alter governmental policies and measures related to the Argentine economy. However, the decline in the GDP in Argentina, the deepening recession and the increase of the unemployment has led to an increase in poverty, which, according to INDEC, as of December 31, 2022 affected more than 39.2% of the population. We cannot now fully estimate the impact that the measures currently adopted by the government, or those that it may implement in the future, will have on the Argentine economy as a whole and on the business, equity and results of our operations. Continuing inflation, increase in unemployment, decline in GDP, peso depreciation, and/or other future economic, social and political developments in Argentina, over which we have no control, may adversely affect our financial condition or results of operations.
Moreover, a significant portion of our operations, properties and customers are located in Brazil. Accordingly, our financial condition and results of operations are substantially dependent on economic conditions in Brazil. Historically, Brazil’s political situation has influenced the performance of the Brazilian economy, and political crises have affected the confidence of investors and the general public, which has resulted in economic deceleration and heightened volatility in the securities issued abroad by Brazilian companies. Future developments in policies of the Brazilian government and/or the uncertainty of whether and when such policies and regulations may be implemented may adversely affect our results of operations and financial condition. The Brazilian economy has experienced significant volatility in recent decades, characterized by periods of low or negative growth, high and variable levels of inflation and currency devaluation. The Brazilian GDP decreased 3.3% in 2016, increased 1.3% in 2017, increased 1.3% in 2018, increased 1.1% in 2019, decreased 4.1% in 2020, increased 4.6% in 2021 and increased 2.9% in 2022. We cannot assure you that GDP will increase or remain stable in the future. Future developments in the Brazilian economy may affect Brazil’s growth rates and, consequently, the consumption of sugar, ethanol, and our other products. As a result, these developments could impair our business strategies, results of operations and financial condition.
Additionally, the effects of any new policies to be implemented by the recently-elected government of Mr. Luiz Inácio Lula da Silva on the economy and the confidence of foreign investors in Brazil are still unclear. Accordingly, we cannot determine the scope of potential impacts resulting from such events on the economy and our business at this stage.
The economies of the countries in which we operate may be adversely affected by the deterioration of other global markets.
Financial and securities markets in the countries in which we operate are influenced, to different degrees, by the economic and market conditions in other countries, including other South American and emerging market countries and other global markets. Investors’ reactions to developments in these other countries, such as the recent developments in the global financial markets, may substantially affect the capital flows into, and the market value of securities of issuers with operations in, the countries in which we operate. A significant deterioration in the economic growth of any of the main trading partners of Brazil, Argentina or Uruguay could have a material impact on the trade balance of those countries and could adversely affect their economic growth and that of other countries in the region. Furthermore, adverse economic conditions in any of these
21
countries could have a material adverse effect on our business, financial condition and results of operations. A crisis in global financial markets including other emerging country markets could dampen investor enthusiasm for securities of issuers with South American operations, including our common shares. The COVID-19 pandemic has negatively impacted global financial markets, ushering significant risk and volatility that may adversely affect the market price for our common shares, making it difficult for us to access capital markets and obtain financing for our operations in the future (on acceptable terms or at all).
Although economic conditions vary from country to country, investor reactions to events occurring in one country sometimes demonstrate a “contagion” effect in which an entire region or class of investment is disfavored by international investors. Furthermore, weak, flat or negative economic growth in any of Brazil’s or Argentina’s major trading partners, including each other, could adversely affect their balance of payments and, consequently, its economic growth.
The Argentine and Brazilian economies may also be affected by conditions in developed economies, such as the United States, that are significant trading partners of Brazil or Argentina or have influence over global economic cycles and over short-term evolution of commodity prices. If interest rates increase significantly in developed economies, including the United States, Argentina and its developing economy trading partners, such as Brazil, could find it more difficult and expensive to borrow capital and refinance existing debt, which could adversely affect economic growth in those countries. Decreased growth from Argentina’s trading partners could have a material adverse effect on the markets for Argentina’s exports and, in turn, adversely affect economic growth. Any of these potential risks to the Argentine economy could have a material adverse effect on our business, financial condition and results of operations.
In addition, Brazil and Argentina are highly dependent on the export of certain commodities, such as soy, which has made the Brazilian and Argentine economies more vulnerable to fluctuations in commodity prices. If international commodity prices decline, the Brazilian or Argentine economies could be adversely affected. In addition, adverse weather conditions can affect the production of commodities by the agricultural sector, which account for a significant portion of Brazil’s and Argentina's export revenues. All these circumstances could have a negative impact on the levels of government revenues, available foreign exchange and the government's ability to service its sovereign debt, and could either generate recessionary or inflationary pressures, depending on the government's reaction. Either of these results would adversely impact Brazil’s or Argentina's economic growth and, therefore, our financial condition and results of operations.
Governments have a high degree of influence in the economies in which we operate, which could adversely affect our results of operations or financial condition.
Governments in many of the markets in which we currently operate, or that we may operate in the future, frequently intervene in their respective economies and occasionally make significant changes in monetary, credit, industry and other policies and regulations. Governmental actions to control inflation and other policies and regulations have often involved, among other measures, price controls, currency devaluations, capital controls and limitations on imports. We have no control over, and cannot predict what measures or policies governments may take in the future. Our results of operations and financial condition may be adversely affected by changes in governmental policy or regulations in the jurisdictions in which we operate that impact different factors such as:
•labor laws and wage increases;
•changes in governmental economic or tax policies, and their effect on economic growth;
•abrupt currency fluctuations;
•high levels of inflation and the measures taken to combat it, such as price controls or price-fixing regulations;
•exchange and capital control policies;
•significant variation in interest rates;
•the lack of liquidity of domestic capital and lending markets;
•inconsistent fiscal and monetary policies;
•liquidity and solvency of their respective financial systems;
•restrictions on land acquisition or use or agricultural commodity production, including limitations on ownership of rural land by foreign persons or entities;
•developments in trade negotiations through the World Trade Organization or other international organizations, including as a result of import/export restrictions or other laws and policies affecting foreign trade and investment;
22
•environmental regulations;
•tax laws, including royalties and the effect of tax laws on distributions from our subsidiaries;
•restrictions on the repatriation of investments and on the transfer of funds abroad;
•expropriations or nationalizations;
•increased public expenses affecting the economy and fiscal deficits; and
•other political, social and economic developments, including political, social or economic instability, in or affecting the country where each business is based.
Uncertainty over whether governments will implement changes in policy or regulation affecting these or other factors in the future may contribute to economic uncertainty and heightened volatility in the securities markets, which may have a material and adverse effect on our business, results of operations and financial condition.
For instance, the Argentine government has in the past exercised substantial control over the Argentine economy by setting certain industry market conditions and prices, a trend which has continued since Mr. Alberto Fernández took office as president in December 2019. The Social Solidarity Law, enacted in December 2019, froze electricity and natural gas tariff rates until December 31, 2020 and instructed the relevant regulatory agencies to pursue a mandatory renegotiation of those rates, which is currently in process. On January 7, 2020, the government relaunched a voluntary price control to foster consumption and establish reference prices for household products. Initially, 310 products were included in this program and public officials stated that the prices of the products included within the program were to be reduced by 8% on the average (including two of the milk products we sell). On November 10, 2022, the Argentine government launched new voluntary price controls establishing references prices until June 30, 2023. Violation of price control measures may result in sanctions, including fines, which amount will be considered on a case-by-case basis at the time of issuing the relevant sanction by the enforcement authority. On April 4, 2020, the Argentine government issued Decree No. 351/2020, which authorized the intervention by local authorities to control maximum prices, which has resulted in the need to allocate additional economic and human resources for our Argentine subsidiaries to comply with governmental requirements and filings pursuant to these regulations. Additionally, the Argentine Government created an informative regime for the purpose of publishing standard maximum prices of a basic listing of consumer products for each province, and a public and free mechanism that allows the filing of claims and complaints by consumers and those included in the production, distribution and commercialization chain of the products included in the obligation to sell at maximum prices. This regulation impacted our processed rice and fluid milk products. Our facilities have been inspected to control compliance with this regulation. As long as this regulation is in place, we are restricted in our ability to increase prices for processed rice and fluid milk products. In addition, the Argentine Supermarkets’ Shelves Law, enacted on March 17, 2020, as implemented by Decree No. 991/2020, is applicable to our products. The purposes of this law are to ensure that the price of certain products remains clear and competitive for the benefit of consumers, to maintain harmony and balance between economic operators, to expand the supply of artisanal, regional and national products produced by micro, small and medium-sized enterprises, and to promote the offer of products manufactured by small producers. Although the law is targeted at supermarkets, it can impact our sales strategies, as it has resulted in the Argentine government imposing additional regulations on our Argentine subsidiaries, often generating further marketing and distribution costs for the purposes of complying with these regulations.
As of the date of this annual report, we cannot assure you whether the Argentine government will enact price control regulations. Interventions by the Argentine government similar to those described above can have an adverse impact on the level of foreign investment in Argentina, the access of Argentine companies to the international capital markets and Argentina's commercial and diplomatic relations with other countries and, consequently, could adversely affect our business, financial condition and results of operations. In the future, the degree of governmental intervention in the economy may continue to rise, which may adversely affect the Argentine economy and, in turn, our business, results of operations and financial condition.
Moreover, historically, the Brazilian government has frequently intervened in the Brazilian economy and has occasionally made significant changes in economic policies and regulations, including, among others, the imposition of a tax on foreign capital entering Brazil, changes in monetary, fiscal and tax policies, currency devaluations, capital controls and limits on imports. The administration is currently facing domestic pressure to retreat from the current macroeconomic policies in an attempt to achieve higher rates of economic growth. In addition, the Brazilian government has discussed the creation of a tax on financial transactions, including wire transfers, in order to improve the fiscal situation of the country or to increase taxation. We cannot predict which policies will be adopted by the Brazilian government and whether these policies will negatively affect the economy or our business or financial performance.
23
Currently, the Brazilian Congress is analyzing bills for the implementation of a tax reform. One of the proposals being discussed, includes the possibility of changing the consumption taxation system entirely, replacing three Brazilian federal taxes, the Tax over Industrial Products (Imposto sobre Produtos Industrializados, or “IPI”), (Social Contribution on Gross Revenues (Programa de Integração Social , or “PIS” and Contribuição para o Financiamento da Seguridade Social, or “COFINS”), the interstate and intermunicipal transportation tax over goods and services (Imposto sobre Operações relativas à Circulação de Mercadorias e sobre Prestações de Serviços de Transporte Interestadual e Intermunicipal e de Comunicação, or “ICMS”) and municipal tax, (Imposto Sobre Serviços, or ISS), with a single new Tax on Operations of Goods and Services (Imposto Sobre Bens e Serviços , or “IBS”) to be levied on consumption. Furthermore, the Brazilian Federal Government has recently submitted a new tax reform bill under No. 3,887/2020 for the creation of the Social Contribution on Operations, Goods and Services (Contribuição Social de Bens e Serviços, or “CBS”), replacing PIS and COFINS contributions, at a rate of 12.0%, with the possibility of taking credits under certain conditions. The effects of these tax reform bills and any other changes resulting from the enactment of additional tax reforms cannot be quantified, are unpredictable and may directly or indirectly affect the Company's business and results.
Furthermore, in March 2022, Brazilian federal tax rates on cooking gas and diesel were reset to zero by the Brazilian government. Later, in June 2022, this exemption was also extended to gasoline and ethanol. These suspensive measures were anticipated to last until the end of 2022. However in January 2023, President Luiz Inácio Lula da Silva extended the federal tax exemption for gasoline and ethanol until February 28, 2023. By the end of February 2023, the Federal Government partially raised federal taxes on gasoline and ethanol to R$0.47 per liter of gasoline and R$0.02 per liter for ethanol. The tax exemption on diesel was extended until December 31, 2023. We cannot predict the potential impact of the policies that will be adopted by the Brazilian government and whether these policies will negatively affect the economy and our business or financial performance.
Currency exchange rate fluctuations relative to the U.S. dollar in the countries in which we operate our businesses may adversely impact our results of operations and financial condition.
Our businesses may be impacted by significant fluctuations in foreign currency exchange rates. Our exposure to currency exchange rate fluctuations results from the currency translation adjustments required in connection with the preparation of our Consolidated Financial Statements. The currency exchange exposure stems from the generation of revenues and the incurrence of expenses in different currencies and the devaluation of local currency revenues impairing the value of investments in U.S. dollars. While the Consolidated Financial Statements presented herein are, and our future Consolidated Financial Statements will be, presented in U.S. dollars, the financial statements of our subsidiaries are prepared using the local currency as the functional currency and translated into U.S. dollars by applying: (i) a year-end exchange rate for assets and liabilities; and (ii) an average exchange rate for the year for income and expenses. Resulting exchange differences arising from the translation to our presentation currency are recognized as a separate component of equity. Currencies in Argentina and Brazil have fluctuated significantly against the U.S. dollar in the past. Accordingly, fluctuations in exchange rates relative to the U.S. dollar could impair the comparability of our results from period to period and have a material adverse effect on our results of operations and financial condition.
Argentina has a history of high volatility in its foreign exchange markets, including sharp and unanticipated devaluations, tight foreign exchange controls and severe restrictions on foreign trade. The devaluation of the peso may have a negative impact on the ability of certain Argentine businesses to service their foreign currency denominated debt. It could also lead to higher inflation rates, significantly reduce real wages and jeopardize our business. The Argentine peso depreciated against the U.S. dollar 72.5%, 22.1%, 40.5% and 58.9% in 2022, 2021, 2020 and 2019, respectively, based on the official exchange rates published by the Argentine Central Bank (Banco Central de la República Argentina), or the “BCRA.” In addition, for the first three months of 2023, the peso depreciated approximately 17.9% against the U.S. dollar. In the past, the Argentine government has imposed restrictions on the purchase of foreign currency, which gave rise to an unofficial market where the U.S. dollar traded at a different market value than reflected in the official Argentine peso-U.S. dollar exchange rate. In September 2019, following a foreign exchange crisis and the continued reduction of the BCRA’s foreign currency reserves, the Argentine government reinstated rigid exchange controls and transfer restrictions, substantially limiting the ability to obtain foreign currency or make certain payments or distributions out of Argentina. See “—Exchange controls restrict the inflow and outflow of funds and may substantially limit the ability of companies to retain or obtain foreign currency or make payments abroad.”
The Brazilian currency has also historically suffered frequent fluctuations. As a result of inflationary pressures, the Brazilian government has implemented various economic plans and adopted a number of exchange rate policies, including sudden devaluations, periodic mini-devaluations during which the frequency of adjustments has ranged from daily to monthly, floating exchange rate systems, exchange controls and dual exchange rate markets. Formally, the value of the real against foreign currencies is determined under a free-floating exchange rate regime, but, in practice, the Brazilian government currently
24
intervenes in markets through currency swaps and trading in the spot market, among other measures, every time the exchange rate is above or below the levels that the Brazilian government considers appropriate, taking into account inflation, growth, the performance of the real against the U.S. dollar in comparison with other currencies, and other economic factors. The Real appreciated 6.5% in 2022 and depreciated 7.4%, 28.9% and 4.0% in each of, 2021, 2020 and 2019, respectively.
Future fluctuations in the value of the local currencies relative to the U.S. dollar in the countries in which we operate may adversely affect our results of operations or financial condition.
Inflation in some of the countries in which we operate, along with governmental measures to curb inflation, may have a significant negative effect on the economies of those countries and, as a result, on our financial condition and results of operations.
Some of the countries in which we operate, particularly Argentina and Brazil, have experienced, or are currently experiencing, high rates of inflation, adversely affecting their economies and financial markets, and limiting the ability of their governments to create conditions that stimulate or maintain economic growth. Although inflation rates in some of these countries have been relatively curtailed in the recent past, we cannot assure you that this trend will continue. Measures taken by the governments of these countries to control inflation have often included maintaining a tight monetary policy with high interest rates, thereby restricting the availability of credit and impairing economic growth. Measures to combat inflation and public speculation about possible additional actions have also contributed significantly to economic uncertainty in many of these countries and to heightened volatility in their securities markets. Periods of higher inflation may also slow the growth rate of local economies. Inflation is also likely to increase some of our costs and expenses, and we may not be able to fully pass such increases on to our clients, which could adversely affect our operating margins and operating income. For instance, a portion of our operating costs in Argentina are denominated in Argentine Pesos and most of our operating costs in Brazil are denominated in Brazilian Reais. Inflation in Argentina or Brazil, without a corresponding peso or real devaluation, could result in an increase in our operating costs without a commensurate increase in our revenues, which could adversely affect our financial condition and our ability to pay our foreign currency denominated obligations.
Historically, inflation has materially undermined the Argentine economy and the government’s ability to create conditions that would permit long-term and stable growth. In recent years, Argentina has experienced high inflation rates. High inflation may also undermine Argentina’s foreign competitiveness in international markets and adversely affect economic activity and employment, as well as our business and results of operations. In particular, the profit margin on our services is impacted by the increase in our costs in providing those services, which is influenced by wage inflation in Argentina, as well as other factors. Since 2008, the Argentine economy has been subject to strong inflationary pressures which, according to private sector analysts, reached an average annual rate of 28.2% between 2010 and 2015. In 2007, INDEC was subject to a process of institutional and methodological reforms that led to controversies regarding the credibility of the information published by it, including the Consumer Price Index, or the “CPI.” On January 7, 2016, INDEC ceased publishing certain statistical data and, after implementing methodological reforms, resumed publications of the CPI on June 16, 2016. The CPI tallied annual rates of 94.8%, 51.4%, 36.1% and 53.8% in 2022, 2021, 2020 and 2019, respectively. If the Argentine government continues to fail to address Argentina’s structural inflationary imbalance, the current levels of inflation may continue to rise, which may have an adverse effect on Argentina’s economy.
Brazil, in turn, has historically experienced high rates of inflation. Inflation, as well as government efforts to curb inflation, have had significant negative effects on the Brazilian economy, particularly prior to 1995. Inflation was 7.2% in 2016, as measured by the General Market Price Index (Índice Geral de Preços – Mercado), compiled by the Getulio Vargas Foundation (Fundação Getúlio Vargas). However, in 2017 Brazil registered a deflation of 0.53% due to a decrease in the price of food products. Brazil then registered inflation of 7.3% and 7.5% in 2019 and 2018, respectively (due to the depreciation of the Brazilian Real against the U.S. dollar and the increase in prices of primary products), and 17.8% and 23.1% in 2021 and 2020, respectively (due to COVID-19, the depreciation of the Brazilian Real against the U.S. dollar and the increase in prices of primary products). A significant proportion of our cash costs and our operating expenses are denominated in Brazilian Reais and tend to increase with Brazilian inflation. The Brazilian government’s measures to control inflation have included and currently include maintaining a tight monetary policy with high interest rates, thereby restricting the availability of credit and reducing economic growth. This policy was abated between 2016 and January 2021, when the Special System for Settlement and Custody rate (Sistema Especial de Liquidação e Custódia), or the “SELIC” rate (the base Brazilian interest rate), which is set by the Monetary Policy Council (Comitê de Política Monetária), or the “COPOM,” was decreased from 14.25% to 2.00%. Subsequently, increased inflation and the intention to abate inflation rates led the Brazilian government to adopt other measures to control inflation, such as tax relief for several sectors of the economy and tax cuts for the products included in the basic food basket. These measures were not sufficient to control the inflation, which led the Brazilian government to reinstate a tighter monetary policy. As a result, interest rates have fluctuated significantly. The year-end SELIC rate in Brazil was 4.50%, 2.00%,
25
9.25% and 13.75% in 2019, 2020, 2021 and 2022, respectively. As of the date of this annual report, the SELIC rate is set at 13.75%
Argentina and/or Brazil may experience higher levels of inflation in the future, which may impact domestic demand for our products. Inflationary pressures may also weaken investor confidence in Argentina and/or Brazil, curtail our ability to access foreign financial markets and lead to further government intervention in the economy, including interest rate increases, restrictions on tariff adjustments to offset inflation, intervention in foreign exchange markets, and actions to adjust or fix currency values, which may trigger or exacerbate increases in inflation, and consequently have an adverse impact on us. In an inflationary environment, the value of uncollected accounts receivable, as well as of unpaid accounts payable, declines rapidly. If the countries in which we operate experience high levels of inflation in the future and price controls are imposed, we may not be able to adjust the rates we charge our customers to fully offset the impact of inflation on our cost structures, which could adversely affect our results of operations or financial condition.
Despite the positive effects the depreciation of the Argentine peso may have on the competitiveness of certain sectors of the Argentine economy, including our business, it also had a negative impact on the financial condition of many Argentine businesses and individuals. The devaluation of the Argentine peso affected or may affect the ability of certain Argentine businesses to honor their foreign currency-denominated debt, generates high levels of inflation, reduces real wages significantly, and has a negative impact on companies oriented to the domestic market, such as public services and the financial industry. Additional volatility, appreciation or depreciation of the peso, or reduction in the BCRA’s international reserves due to currency interventions could adversely affect the Argentine economy, which, in turn, may have an adverse effect on our financial condition and results of operations. Inflation has also contributed to a material increase in our costs of operation, in particular labor costs; it also enables a reduction in the purchasing power of the population, thus increasing the risk of a lower level of consumption from our customers in Argentina, which could negatively impact our financial condition and results of operations. Inflation rates could continue to grow in the future, and there is uncertainty regarding the effects that any measures adopted by the government could have to control inflation.
Inflation can also lead to an increase in Argentina's debt and have an adverse effect on Argentina's ability to service its debt, mainly in the medium and long term when most inflation-indexed debt matures. In addition, weaker fiscal results could have a material adverse effect on the Argentine government's ability to access long-term financing, which, in turn, could adversely affect Argentina's economy and financial condition and access to international or domestic capital markets. If the measures adopted by the Argentine government are not able to resolve the structural inflationary disruptions of Argentina, the current inflationary levels could rise and have a negative impact on the economic and financial conditions of Argentina, and, as such, adversely affect our operations and financial condition.
Depreciation of the peso or the real relative to the U.S. dollar or the euro may also create additional inflationary pressures in Argentina or Brazil that may negatively affect us. Depreciation generally curtails access to foreign financial markets and may prompt government intervention, including recessionary governmental policies. Depreciation also reduces the U.S. dollar or euro value of dividends and other distributions on our common shares and the U.S. dollar or euro equivalent of the market price of our common shares. Any of the foregoing might adversely affect our business, operating results and cash flow, as well as the market price of our common shares. Conversely, in the short term, a significant increase in the value of the peso or the real against the U.S. dollar would adversely affect the respective Argentine and/or Brazilian government’s income from exports. This could have a negative effect on gross domestic product, or “GDP” growth and employment, and could also reduce the public sector’s revenues in those countries by reducing tax collection in real terms, as a portion of public sector revenues are derived from the collection of export taxes.
Disruption of transportation and logistics services, insufficient investment in public infrastructure or disruption to any aspect of the supply chain could adversely affect our operating results.
One of the main disadvantages of the agricultural sector in the countries in which we operate is that key growing regions lie far from major ports. As a result, efficient access to transportation infrastructure and ports is critical to the growth of agriculture as a whole in the countries in which we operate and of our operations in particular. Improvements in transportation infrastructure are likely to be required to make more agricultural production accessible to export terminals at competitive prices. A substantial portion of agricultural production in the countries in which we operate is currently transported by truck, a means of transportation significantly more expensive than railroad transportation available to U.S. and other international producers. Our dependence on truck transportation may affect our position as a low-cost producer so that our ability to compete in the world markets may be impaired.
Substantial investments are required for road and rail improvement projects, which may not be completed on a timely basis, if at all. Any delay or failure in developing infrastructure systems could reduce the demand for our products, impede our
26
products’ delivery or impose additional costs on us. We currently outsource the transportation and logistics services necessary to operate our business. Any disruption in these services could result in supply problems at our farms and processing facilities and impair our ability to deliver our products to our customers in a timely manner.
In Brazil, a strike held by truckers in May 2018 resulted in completely halted road transportation throughout the country. As a result, the Brazilian government caused the enactment of Law No. 13,703/2018, which established a base price for road freight transportation and created a freight table, in which minimum and mandatory transportation cost values are set each six months by the Brazilian Land Transportation Agency (Agência Nacional de Transportes Terrestres), or the “ANTT.” These measures adversely affected many companies in the agribusiness sector through increased transportation costs.
In addition, we are exposed to the risk of disruption to any aspect of our supply chain, to suppliers’ operations or to distribution channels, and the deterioration in the financial condition of a trading partner. These may be caused by a cyber-event, global health crisis, major fire, violent weather conditions or other natural disasters that affect manufacturing or other facilities of our operating subsidiaries or those of their suppliers and distributors. In certain geographic areas where we operate, insurance coverage may not be obtainable on commercially reasonable terms, if at all. Coverage may be subject to limitations or we may be unable to recover damages from its insurers.
Disruption may also be caused by spread of infectious disease (such as COVID-19) or by a deterioration in labor or union relations, disputes or work stoppages or other labor-related developments affecting us or our suppliers and distributors. See “—Our business may be materially and adversely affected by the emergence of epidemics or pandemics, such as COVID-19.”
The Argentine economy may be affected by its government’s limited access to financing from international markets and the result of failure to pay its debt obligations.
Historically, the Argentine government and provinces have defaulted on debt payments, which has limited their access, as well as that of private companies, to the international financial markets, and has substantially increased their respective financing costs. The Argentine economy has been experiencing significant instability in the past decades, including devaluations, high inflation, and prolonged periods of reduced economic growth, which have led to payment defaults on Argentina’s foreign debt and multiple downgrades in Argentina’s foreign debt rating with attendant restrictions on Argentina’s ability to obtain financing in the international markets.
Argentina’s 2001 sovereign default and its failure to fully restructure its sovereign debt and negotiate with the holdout creditors has historically limited Argentina’s ability to access international financing. In 2005, Argentina completed the restructuring of a substantial portion of its indebtedness and settled all of its debt with the IMF. Additionally, in June 2010, Argentina completed the restructuring of a significant portion of the defaulted bonds that were not exchanged in the 2005 restructuring. Holdout bondholders that declined to participate in the restructuring filed lawsuits against Argentina in several countries, including the United States. Since late 2012, rulings from courts in the United States favorable to holdout bondholders aggravated investors’ concerns regarding investment in the country.
In February 2016, the Macri administration entered into settlement agreements with certain holdout bondholders to settle these claims, which were subject to the approval of the Argentine Congress. The Argentine government reached settlement agreements with holders of a significant portion of the defaulted bonds and has repaid the majority of the holdout creditors with the proceeds of a US$16.5 billion international offering of three-year, five-year, 10-year and 30-year bonds on April 22, 2016. Although the size of outstanding claims decreased significantly, litigation initiated by bondholders that did not accept Argentina’s settlement offer of 2016 continues in several jurisdictions.
Additionally, foreign shareholders of several Argentine companies have filed claims with the International Center for Settlement of Investment Disputes, or the “ICSID,” alleging that the emergency measures adopted by the Argentine government since the crisis in 2001 and 2002 differ from the just and equal treatment standards set forth in several bilateral investment treaties to which Argentina is a party. The ICSID has ruled against Argentina with respect to many of these claims. Litigation involving holdout creditors, claims with ICSID and other claims against the Argentine national government, resulted and may result in material judgments against the government, lead to attachments of, or injunctions relating to, Argentina’s assets, or could cause Argentina to default under its other obligations, and such events may prevent Argentina from obtaining favorable terms or interest rates when accessing international capital markets or from accessing international financing at all. Our ability to obtain U.S. dollar-denominated financing has been adversely impacted by these factors.
In June 2018, the IMF approved a financial support plan for Argentina in the form of a stand-by arrangement for US$50 billion, which was increased to US$57.1 billion in September 2018. As of the date of this annual report, the IMF
27
disbursed an aggregate of US$44.7 billion under this arrangement. The Argentine government negotiated an extension with the IMF for repayments under the stand-by arrangement that matured in 2022. On January 28, 2022, the IMF and the Argentine government reached an understanding, and the final agreement was approved by the IMF’s executive board on March 3, 2022. On March 17, 2022, the Argentine Congress approved the staff-level agreement to be entered into with the IMF. Further, on October 7, 2022, the IMF communicated that its executive board conducted a second review of the agreement with Argentina and approved a second immediate disbursement of approximately US$3.8 billion. Likewise, on December 22, 2022, the third review of the agreement was announced, approving a disbursement of approximately US$6.0 billion, bringing the total disbursements under the agreement to US$23.5 billion.
Moreover, during 2020 the Argentine government restructured its public debt in bonds denominated in foreign currency governed by foreign law as well as bonds denominated in foreign currency governed by Argentine law, by means of debt restructuring procedures implemented internationally and locally, respectively, within each group of creditors according to the type of sovereign debt. On February 12, 2020, the Argentine Congress approved the restructuring of the Argentine external public debt. Through Decree No. 250/2020, the Argentine administration authorized negotiations for the restructuring of US$68.9 billion of sovereign bonds issued in foreign currency and governed by foreign law. On April 17, 2020, Argentina announced an invitation to exchange its sovereign bonds governed by foreign law that were eligible for the restructuring for new bonds. After several extensions and improvements made within the initial offer, on August 31, 2020, Argentina announced the results of the invitation to exchange. Argentina obtained the majorities required under the collective action clauses to exchange 99.01% of the eligible bonds, as a result of obtaining a level of acceptance of 93.55% of the bondholders to its exchange proposal launched in April and improved in July and in August, after the agreement with three groups of bondholders. Within the context of the agreement with the groups of bondholders for the restructuring of sovereign debt governed by foreign law, Argentina also conducted a local exchange. Argentina launched an offer to exchange sovereign bonds denominated in U.S. dollars and “dollar-linked” issued under local law. The instruments subject to the local debt restructuring were affected by the deferral of payments of principal and interest until December 31, 2020, provided by Presidential Decree No. 346/20. In August 2020, Argentina launched an offer to exchange this universe of sovereign bonds denominated in U.S. dollars and ‘dollar-linked’ issued under Argentine law. As a result of this transaction, 99.4% of the bondholders of eligible instruments under this local exchange had accepted the offer. Resolution No. 540/2020 further provided the procedure to allow eligible instruments which did not enter into the debt restructuring under Argentine law carried out in August and September 2020 to be tendered. The resolution provided that holders who were unable to enter the exchange within the prior invitation term may do so in successive acceptance terms which will be extended until July 28, 2021 in the conditions set forth therein.
Through resolution No. 646/2021, the Ministry of Economy established a new procedure to be carried out in the local market for eligible securities of holders who did not adhere to the proposed exchange operation. In this regard, as of December 1, 2021, the securities subject to the local debt restructuring, which were not restructured (listed in Annex I of Resolution 381/2020), are deemed non-negotiable and their listings on the Electronic Open Market (MAE) and in the Argentine stock exchanges and markets were cancelled.
Furthermore, in March 2023, the Argentine government restructured its public debt by issuing bonds denominated Argentine Pesos. The restructure obtained 64.0% adhesion and extended the maturities of notes worth Ps.4.3 billion.
Lack of access to international or domestic financial markets could affect the projected capital expenditures for our operations in Argentina, which, in turn, may have an adverse effect on our financial condition or the results of our operations.
Argentina’s current account and balance of payment imbalances could lead to a depreciation of the Argentine peso, and as a result, affect our results of operations, our capital expenditure program and our ability to service our foreign currency liabilities.
In the past, Argentina has had severe macroeconomic imbalances, including frequent and extreme fiscal deficits. Since 1961, the Argentine government has had yearly fiscal deficits approximately 90% of the time, resulting in highly vulnerable macroeconomic conditions. The Argentine government has financed its fiscal deficit mainly in two ways: (i) by relying on external debt issuances, which has historically led to rapid increases in public debt levels; and (ii) by having the BCRA issue currency, which has led to high inflation and, in certain cases, hyperinflation. The fiscal deficit reached 8.5%, 4.5% and 2.4% of the GDP in 2020, 2021 and 2022, respectively. Failure to reduce fiscal deficits could lead to growing levels of uncertainty regarding Argentina’s macroeconomic conditions. In particular, it could lead to growing inflation rates and unanticipated foreign exchange depreciation and balance of payments crisis, higher local vulnerability to international credit crisis or geopolitical shocks, higher interest rates and erratic monetary policies, a reduction in real salaries and as a consequence, in private consumption, and a reduction in growth rates. This level of uncertainty, over which we have no control, may adversely affect our financial condition or results of operations.
28
Because foreign direct investment remains stagnant in Argentina, it may become impossible for Argentina and its provinces to meet their debt obligations in the future, since Argentina’s foreign currency needs would severely overcome its foreign currency sources. If this level of uncertainty prevails on international investors, Argentina may suffer a “sudden stop” event, where investors stop lending money to Argentine institutions. This, in turn, may result in large capital outflows that could not only force the Argentine government to default on its debt, but also generate a rapid and unanticipated depreciation of the Argentine peso, a hike in local interest rates and a probable banking system crisis if bank deposits are largely withdrawn following social unrest. If a balance of payments crisis were to occur, a large depreciation of the Argentine peso against the U.S. dollar could adversely affect our ability to meet our foreign currency obligations. Furthermore, the negative effect such a crisis could have on the growth rates of the Argentine economy and its consumption patterns could have a material adverse effect on our business, financial condition and result of operations.
Failure to adequately address actual and perceived risks of institutional corruption may adversely affect the economy and financial condition of the emerging markets in which we operate.
A lack of a solid and transparent institutional framework for contracts with the Argentine government and its agencies and corruption allegations have affected and continue to affect Argentina. Argentina ranked 94 of 180 in the Transparency International's 2022 Corruption Perceptions Index and 78 of 179 in the World Bank's Doing Business 2021 report. The Argentine government's ability to implement initiatives aimed at strengthening Argentina's institutions and reducing corruption is uncertain as it would be subject to independent review by the judicial branch, as well as legislative support from opposition parties. We cannot assure you that the implementation of these measures by the Argentine government will be successful in stopping institutional deterioration and corruption.
Moreover, in the past, members of the Brazilian government and of the Brazilian legislative branch have faced allegations of political corruption. As a result, a number of politicians, including senior federal officials and congressmen, resigned and/or have been arrested. For example, since 2014, several members of the Brazilian executive and legislative branches of government have been investigated as a result of allegations of unethical and illegal conduct identified by the Car Wash Operation (Operação Lava-Jato) by Brazilian federal prosecutors. Any political crisis could worsen the economic conditions in Brazil, which may adversely affect our results of operations and financial condition
Finally, under Brazilian law, real property ownership is normally transferred by means of a transfer deed, and subsequently registered at the appropriate real estate registry office under the corresponding real property record. There are uncertainties, corruption and fraud relating to title ownership of real estate in Brazil, mostly in rural areas. In certain cases, the real estate registry may register deeds with errors, including duplicate and/or fraudulent entries, and, therefore, deed challenges frequently occur, leading to judicial actions and police investigations. Property disputes over title ownership are frequent in Brazil, and, as a result, there is a risk that errors, fraud or challenges could adversely affect us.
Laws on the foreign ownership of rural properties may adversely affect our results of operations and future investments in rural properties.
In Argentina, Law No. 26,737/2011 and Decree No. 274/2012, as amended and supplemented by Decree No. 820/2016, impose limits on the ownership or possession of rural properties by foreign legal entities or certain foreign individuals. Under these rules, foreign ownership of rural land may not exceed 15% of the total amount of rural land in the Argentine territory and in the province, department or municipality where the relevant lands are located. Foreign ownership is defined as the ownership (whether by acquisition, transfer, assignment of rights or otherwise) of rural land by: (i) certain foreign individuals, regardless of whether they are Argentine residents; (ii) legal entities where foreign individuals or entities own, directly or indirectly, a number of votes sufficient to direct the entity’s decision-making process (which is presumed in the case of an equity interest greater or equal to 51%); (iii) companies that issue bonds (a) convertible in stock representing 25% or more of the company’s stock upon conversion and (b) whose holders are foreign individuals or entities; (iv) trusts whose beneficiaries are foreign individuals or entities holding an interest of at least 25%; (v) joint ventures in which foreign entities or individuals hold an interest greater than as set forth in the law; (vi) foreign, public law-governed legal entities; and (vii) associations or de facto corporations in which foreigners hold an interest greater than as set forth in the law or which are controlled by foreigners. A National Registry of Rural Land (Registro Nacional de Tierras Rurales), or the “RNTR,” was made in charge of enforcement of this framework.
In addition, foreign entities or individuals of a single nationality cannot own more than 4.5% of rural land in Argentina, and a single foreign entity or individual may not own more than 1,000 hectares in a certain “core area” or the “equivalent surface,” as set by the Interministerial Council of Rural Land (Consejo Interministerial de Tierras Rurales), in accordance with the provinces’ proposal, specifying districts, sub-regions or areas and taking into consideration the location of the land, the proportion of the land area in respect of the total territory of the relevant province, department or municipality and,
29
the quality of the land for use and exploitation. Moreover, foreign legal entities or individuals may not own rural land that contains or is located next to permanent and significant bodies of water. Any change to the capital stock of companies that own or possess rural land that results in a direct or indirect change of control must be reported to the RNTR within 30 days. As an exception, Decree No. 820/2016 provides that a foreign legal entity or individual may exceed the ownership thresholds for up to 90 days, provided they reduce ownership to the legal limit by (i) transferring or causing any of its controlled legal entities to transfer the amount of rural land that exceeds the legal limit, (ii) modifying or causing any of its controlled legal entities to modify the type of exploitation awarded to rural lands owned by such foreign legal entity, or (iii) transferring its interest to permitted legal entities under Law No. 26,737.
Law No. 26,737 initially provided that vested rights were not to be affected by its application. Decree No. 820 further clarified this and set that foreign entities or individuals who owned rural land in excess of the ownership threshold when the Law No. 26,737 came into effect (i) are not required to transfer such rural land in excess, and (ii) in the event of transfer of rural lands acquired before Law No. 26,737 came into force, can acquire the equivalent to such transferred rural land, provided that the legal limits established for its use and location were complied with at the time of such acquisition. As such, the application of these laws does not have an adverse effect on the current rural land owned by our Argentine subsidiaries. However, our Argentine subsidiaries may be prevented from acquiring additional rural land in Argentina, which may adversely affect our financial condition and results of operations.
In Brazil, Law No. 5,709/1971 set certain restrictions on the acquisition of rural property by foreigners. Foreign investors may only acquire rural properties in which agricultural, cattle-raising, industrial or colonization projects are going to be developed as approved by the relevant authorities. The total rural area to be acquired by a foreign investor cannot exceed one quarter of the surface of the municipality where it is located, and foreigners of a single nationality cannot cumulatively own more than 10% of the surface of the respective municipality. The acquisition or possession (or any in rem right) by a foreign person of rural property located in an area of national security (i.e. at or near the Brazilian border) must be previously approved by the General Office of the National Security Council (Secretaria-Geral do Conselho de Segurança Nacional). Moreover, under Law No. 8,629/1993, these restrictions are also applicable to rural lease agreements; however, agriculture partnerships agreements (parcerias agrícolas) are not subject to these restrictions. The acquisition or lease by a foreign person of rural property exceeding 100 indefinite use units (módulos de exploração indefinida), a unit of measurement set by the National Institute of Colonization and Land Reform (Instituto Nacional de Colonização e Reforma Agrária), or “INCRA,” must be previously approved by the Brazilian Congress.
Between June 7, 1994 and August 22, 2010, the prevailing view was that Law No. 5,709 did not apply to Brazilian companies directly or indirectly controlled by foreign investors. However, an August 23, 2010 opinion by the Brazilian Solicitor-General’s Office (Advocacia-Geral da União), which was ratified by the President of Brazil, modified this view to confirm that Brazilian entities controlled by foreigners should be subject to these restrictions. We believe, and it is now generally held, that the recorded acquisition of rural land by Brazilian companies directly or indirectly controlled by foreigners prior to August 23, 2010 is not affected by this change in position.
Any new rural land acquisitions by us are nonetheless subject to these restrictions, the waiver of which may be burdensome and time consuming. In order to obtain the authorization for the acquisition or lease of rural properties, foreign investors must present a project proposal to INCRA describing: (i) the relationship between the property and the envisioned project; (ii) the physical and financial schedule of the investment and implementation of the project; (iii) whether governmental funds will finance the project; (iv) the logistical viability of the project and proof of compatibility between the envisioned site and the geographic location of the land; and (v) proof of compatibility with the environmental zoning rules relating to the location of the property. While we conduct our operations in Brazil through local subsidiaries, we would be considered a foreign controlled entity within the meaning of these restrictions. Therefore, if we are unable to comply with these restrictions and obtain the required approvals in connection with future acquisitions or lease transactions, our business plan, contemplated expansion in Brazil and results of operations would be adversely affected. In addition, we cannot assure you that future legislation will not further restrict the acquisition of rural land by Brazilian companies controlled by foreign holders.
An increase in export and import duties and controls may have an adverse impact on our sales.
The Argentine government has historically imposed duties on the exports of various primary and manufactured products, including some of our products. Since then, such export taxes have undergone significant increases, and peaked at 35% in the case of soybean. Currently, soybean is taxed at a 33% export duty rate, export duties on soybean flour and soybean oil have been increased from 31% to 33%, and the government increased the export duty for biodiesel from 29% to 30%. Most other agricultural products, such as fresh fruit and vegetables, usually grown in specific regions, were set at a 0% export duty rate on January 2021. Most industrial and finished goods have had their export duty rates reduced throughout 2020, 2021 and 2022. The Social Solidarity Law established new caps for the Fernández administration to set the export duty rate of all goods
30
included in the tariff positions of the Common Mercosur Nomenclature. Even though most goods are capped to a maximum 12.0% ad valorem export duty rate, there are special lower caps for some agricultural products from specific regions and industrial goods. In November 2020, the Fernández administration also implemented, a compensation program for small-scale soybean producers. In 2022, the Argentine Congress failed to extend the authorization for the government to set export duty rates, thus maintaining current export duty rates until a new authorization is issued.
In October 2022, Argentina has also implemented the Argentina Import System (Sistema de Importaciones de la República Argentina) or “SIRA”, whereby importers are required to submit certain information electronically through the SIRA application which, once approved, will be valid for 90 calendar days.
In addition, the former administration had enacted an import licensing regime that includes automatic and non-automatic licensing for imports. Automatic import licensing provides that the importer is only required to submit information through the SIRA as well as provide other certification related to the imported goods. Non-automatic licensing provides that the authorities have a 30-day period to either approve or reasonably reject the import license requested based on its effect on local businesses, in addition to the other import requirements that the goods be subject to (SIRA, certifications, etc.). During 2022, many more tariff codes underwent non-automatic import licensing procedures to control the flow of imports of final goods and, specially, luxury goods. Since the implementation of the SIRA system, many importers have suffered delays and rejections of their import license applications, regardless of the automatic or non-automatic status of their import licenses.
We cannot assure you that there will not be further increases in the export taxes or that other new export taxes or quotas will not be imposed. The imposition of new export taxes or quotas or a significant increase in existing export taxes or the application of export quotas or the imposition of regimes that aim to restrict or control imports and exports could adversely affect our financial condition or results of operations.
Exchange controls restrict the inflow and outflow of funds and may substantially limit the ability of companies to retain or obtain foreign currency or make payments abroad.
In the past, the Brazilian economy has experienced balance of payment deficits and shortages in foreign exchange reserves, and the Brazilian government has responded by restricting the ability of Brazilian or foreign persons or entities to convert Reais into foreign currencies. The Brazilian government may institute a restrictive exchange control policy in the future. Any restrictive exchange control policy could prevent or restrict our Brazilian subsidiaries’ access to U.S. dollars, and consequently their ability to meet their U.S. dollar obligations and may adversely affect our financial condition and results of operations.
In turn, between 2011 and 2015, the Argentine government increased controls and restrictions on the sale of foreign currencies and the acquisition of foreign assets by Argentine residents, and limited the transfer of funds abroad. Through a combination of foreign exchange and tax regulations, the Fernández de Kirchner administration significantly curtailed access to the foreign exchange market by individuals and private-sector entities, and the BCRA exercised a de facto prior approval for certain foreign exchange transactions otherwise authorized to be carried out under the applicable regulations, such as dividend payments or repayment of principal of intercompany loans as well as the payments related to import of goods, by regulating the amount of foreign currency available to companies to conduct such transactions. These exchange controls gave rise to an unofficial U.S. dollar trading market, and the unofficial Argentine peso to U.S. dollar exchange rate in such market differed substantially from the official Argentine peso to U.S. dollar exchange rate. Due to the foreign exchange crisis generated in August 2019 and the continued reduction of the BCRA’s foreign currency reserves, the Argentine government reinstated, in 2019, rigid exchange controls and transfer restrictions, substantially limiting the ability to obtain foreign currency or make certain payments or distributions out of Argentina, which have been extended without time limitation by Decree No. 91/2019, and BCRA Communication “A” 6,862/2020. In response to these exchange restrictions, an unofficial U.S. dollar trading market developed once again. In addition, access to foreign currency and its transfer outside of Argentina can also be obtained and carried out through capital markets transactions denominated blue-chip swap, subject to certain restrictions, which is significantly more expensive than acquiring foreign currency in the FX Market.
Notwithstanding the measures adopted by the Argentine government recently, the government may impose additional exchange controls, transfer restrictions, restrictions on the free movement of capital, and may implement other measures in response to capital flight or a significant depreciation of the Argentine peso, which would adversely affect our financial condition and the results of our operations. In addition, other exchange controls could in the future further impair or prevent the conversion of anticipated dividends, distributions, or the proceeds from any sale of equity holdings in Argentina from Argentine Pesos into U.S. dollars and the remittance of the U.S. dollars abroad. These restrictions and controls could further interfere with the ability of our Argentine subsidiaries to make distributions in U.S. dollars to us and thus our ability to pay dividends in the future. Such measures could lead to renewed political and social tensions, and could undermine the Argentine government’s
31
public finances, which could adversely affect Argentina’s economy and prospects for economic growth and, consequently, adversely affect our business and results of operations, and could impair our ability to make dividend payments.
In an effort to contain the escalation of the currency exchange rate, the BCRA has been selling its reserves of U.S. dollars, which has resulted in a decrease in BCRA international reserves from US$65.7 billion as of December 2018 to US$38.7 billion as of February 2023. However, the actual net liquid international reserves of the BCRA is reported by private sources to be substantially lower. Moreover, the Argentine government has been financing all economic assistance related to the COVID-19 pandemic with a significant issuance of currency, which has also contributed to increased inflation, the demand for U.S. dollars and the devaluation of the peso.
See “Item 10. Additional Information—D. Exchange Controls.”
Changes in tax laws, incentives, benefits and regulations may have a material adverse impact on the taxes applicable to our business and may increase our tax burden.
Changes in tax laws, regulations, related interpretations and tax accounting standards in Brazil, Argentina, Uruguay, Luxembourg or the United States may result in a higher tax rate on our earnings, which may significantly reduce our profits and cash flows from operations.
The Brazilian government frequently implements changes to the Brazilian tax regime that may affect us and our clients. These changes include changes in prevailing tax rates and, occasionally, imposition of temporary taxes, the proceeds of which are earmarked for designated Brazilian government purposes. Some of these changes may result in increases in our tax payments, which could adversely affect industry profitability and increase the prices of our products, restrict our ability to do business in our existing and target markets and cause our financial results to suffer.
Recently, Brazilian government initiatives have proposed changes to the Brazilian tax regime that, if enacted, could impact our business. Bill No. 3,887/2020 would replace the PIS/COFINS tax (a social contribution on gross revenues) with a new Contribution on Goods and Services (CBS), and Bill No. 2,337/2021 would comprehensively reform income taxation rules primarily by revoking the income tax exemption on the distribution of dividends by Brazilian companies while also introducing new anti-avoidance provisions for a broad variety of transactions among related parties, ending the deductibility of interest on equity expenses, extending the minimum term for the amortization of intangibles, and changing the income tax rules related to Brazilian investment funds, among other changes. More specifically, ending the deductibility of interest on equity would impact the net amount to be received by our shareholders in the form of dividends. Although these laws have not yet been enacted and it is not possible to determine at this time the exact changes that will eventually pass into law, any such changes could have adverse effects on our results and operations. Further, Brazilian government authorities at the federal, state and local levels may consider changes in tax laws to cover budgetary shortfalls resulting from the recent economic downturn in Brazil, including the impact of COVID-19. If enacted, such changes may harm our profitability by increasing our tax burden, increasing our tax compliance costs or otherwise affecting our financial condition, results of operations and cash flows. The Brazilian government regularly enacts reforms to the tax and other assessment regimes to which we and our customers are subject. Such reforms include changes in tax rates and, occasionally, enactment of temporary levies, the proceeds of which are earmarked for designated governmental purposes. The effects of these changes and any other changes that result from the enactment of additional tax reforms cannot be quantified and there can be no assurance that any such reforms would not have an adverse effect upon our business. Furthermore, such changes may produce uncertainty in the financial system, increasing the cost of borrowing and contributing to an increase in our non-performing credit portfolio. The effects of these changes and any other change that could result from the enactment of additional legislation cannot be quantified. We cannot assure you that we will be able to maintain our projected cash flow and profitability following any increases in Brazilian taxes applicable to us and our operations.
We are also subject to review of the interpretation of certain laws by the Brazilian Judiciary, which may result in adverse tax consequences for us. For example, in February 2023, the Federal Supreme Court, by unanimous vote, concluded that favorable judicial decisions to taxpayers (res judicata) must be automatically voided if, after such decisions were issued, the Supreme Court reaches a different conclusion on the subject matter in question. That is, if a company obtained authorization from a court to stop withholding a specific tax in the past, such authorization will automatically expire upon confirmation by the Brazilian Supreme Court that the withholding of such tax is legitimate and due. Accordingly, if pro-taxpayer court decisions are reversed by the Brazilian Supreme Court, and we have benefited from any such decisions, our business, financial performance and operating results could be negatively affected.
Similarly, on December 29, 2017, the Argentine government enacted Law No. 27,430, or the “Tax Reform Law,” a comprehensive tax reform which became effective on January 1, 2018. The Tax Reform Law introduced several amendments in
32
connection with federal income tax, such as the progressive reduction of the tax rate on corporate level from 35% to a 30% applicable to the fiscal periods starting on January 1, 2018 until December 31, 2019; and to 25% applicable to the fiscal periods starting on January 1, 2020, and established that dividends or other profits distributed to Argentine resident individuals and foreign beneficiaries would be subject to taxation. Therefore, as of January 1, 2018, income tax on Argentine resident companies and branches of non-Argentine entities applies in two stages: (i) a first stage is charged at the corporate level (at a tax rate of 30% or 25%, depending on the fiscal period involved, as explained above); and (ii) a second stage is charged at the shareholder or owner level—in respect of an Argentine resident individual or a foreign beneficiary—at a tax rate of 7% or 13%, according to the fiscal period from which the distributed profit derived. Such tax treatment was amended by the Social Solidarity Law, which established: (i) the suspension of one fiscal year, beginning on January 1, 2021, of the 25% corporate income tax rate and of the 13% tax rate applicable on dividends; and that (ii) on such periods of suspension, the applicable rate on corporate income tax will be 30% and the applicable rate on dividends will be 7%. The Tax Reform Law further eliminated the equalization tax, which levied distributions made out of previously untaxed income. The sale, exchange or disposition of shares and other securities not trading in, or listed on, capital markets and securities exchanges by resident individuals and foreign beneficiaries in general is subject to tax at a rate of 15%. Non-residents can opt to be taxed at a rate of 15% on the net gain or 13.5% on the gross amount of the transaction, at the option of the seller.
On June 16, 2021, the Argentine government enacted Law No. 27,630 which amended the Argentine income tax law and replaced the fixed rate paid by Argentine companies on their corporate income from 30% to a progressive rate ranging from 25% to 35% for tax periods starting on January 1, 2021. Subject to net income amounts, companies will have to pay a fixed amount and a progressive rate over the surplus of the minimum base rate in their category. These amounts will be adjusted on a yearly basis starting January 1, 2022 based on the CPI variation. The applicable rate over profits and dividends paid to shareholders, whether they are individuals, or undivided estates residing in Argentina or foreign residents, will continue to be 7% in all cases, regardless of the tax rate paid by the company at the corporate level.
In 2018, Laws No. 27,430 and No. 27,468 reinstated the application of an integral inflation adjustment tax mechanism for corporate taxpayers, as a corrective mechanism to assess the real gain subject to tax, but only to the extent that the CPI exceeds 100% in the 36 previous months to the closing of each relevant fiscal year. For fiscal periods starting on or after January 1, 2019, 2020 and 2021, special rates were established.
In addition, the Social Solidarity Law amended the Tax Reform Law to govern employer contributions and the applicable rates for foreign goods and created an 8% tax rate for the acquisition of digital services and a 30% rate for the acquisition services abroad and passenger transport services destined outside the country. The Social Solidarity Law also introduced other amendments to the income tax, personal assets tax, excise tax on certain goods, tax on debits and credits in local bank accounts and social security rules. It also established a new tax on certain purchases of foreign currency, a new tax debt settlement plan for certain taxpayers, and established new rates on exports of goods and services. Argentine companies are required to pay personal assets tax corresponding to Argentine resident individuals, foreign individuals and foreign entities for holding equity interests in such companies as of December 31 of each year. Under the Social Solidarity Law, the tax rate applicable to shares or interests in the capital of companies governed by the Argentine corporate law was increased from 0.25% to 0.50% of the pro rata equity value. The tax is levied on the equity stated in the latest financial statements.
These and other changes in Brazilian and Argentine tax laws could adversely affect our operations, financial condition and cash flows.
We receive certain tax benefits from Brazilian tax authorities, which we cannot assure will be maintained or renewed.
We receive certain tax benefits by virtue of our production facilities and investment projects in underdeveloped regions in Brazil. These tax incentives reduce the amount of Brazilian sales tax ICMS, due in the state of Mato Grosso do Sul as a result of the Ivinhema and Angélica mills. These benefits were most recently renewed until 2032.
We cannot assure you that the tax incentives we currently benefit from will be maintained, renewed or that we will obtain new tax incentives on favorable terms. In the event we fail to comply with specific obligations to which we are subject in connection with the tax benefits described above, such benefits may be suspended or cancelled, or we may be required to pay the taxes due in full, plus penalties, which may adversely affect us. Additionally, we cannot assure you that we will be able to renew these tax benefits when they expire, or to obtain additional tax benefits under favorable conditions. State and federal governments frequently implement changes to the tax regimes, such as changes in tax rates, which may adversely affect us or our customers. If our current tax benefits are cancelled or not renewed, we may be materially adversely affected.
33
Risks Related to Our Common Shares
The price of our common shares may be highly volatile.
We cannot predict the extent to which investor interest in our common shares will create or be able to maintain an active trading market, or how liquid that market will be in the future. The market price of our common shares may be volatile and may be influenced by many factors, some of which are beyond our control, including:
•the failure of financial analysts to cover our common shares or changes in financial estimates by analysts;
•actual or anticipated variations in our operating results;
•changes in financial estimates by financial analysts, or any failure by us to meet or exceed any of these estimates, or changes in the recommendations of any financial analysts that elect to follow our common shares or the shares of our competitors;
•announcements by us or our competitors of significant contracts or acquisitions;
•future sales of our common shares; and
•investor perceptions of us and the industries in which we operate.
In addition, the equity markets in general have experienced substantial price and volume fluctuations that have often been unrelated or disproportionate to the operating performance of particular companies affected. These broad market and industry factors may materially harm the market price of our common shares, regardless of our operating performance. In the past, following periods of volatility in the market price of certain companies’ securities, securities class action litigation has been instituted against these companies. This litigation, if instituted against us, could adversely affect our financial condition or results of operations.
Our exemption as a “foreign private issuer” from certain rules under the U.S. securities laws will result in less information about us being available to investors than for U.S. companies, which may result in our common shares being less attractive to investors.
As a “foreign private issuer” in the United States, we are exempt from certain rules under the U.S. securities laws and are permitted to file less information with the SEC than U.S. companies. As a “foreign private issuer,” we are exempt from certain rules under the Exchange Act that impose certain disclosure obligations and procedural requirements for proxy solicitations under Section 14 of the Exchange Act. In addition, our officers, directors, and principal shareholders are exempt from the reporting and “short-swing” profit recovery provisions of Section 16 of the Exchange Act and the rules under the Exchange Act with respect to their purchases and sales of our common shares. Moreover, we are not required to file periodic reports and financial statements with the SEC as frequently or as promptly as companies that are not “foreign private issuers” whose securities are registered under the Exchange Act. In addition, we are not required to comply with Regulation FD promulgated by the SEC under the Exchange Act, which restricts the selective disclosure of material information. As a result, our shareholders may not have access to information they deem important, which may result in our common shares being less attractive to investors.
We are a Luxembourg corporation (“société anonyme”) and it may be difficult for you to obtain or enforce judgments against us or our executive officers and directors in the United States.
We are organized under the laws of the Grand Duchy of Luxembourg. Most of our assets are located outside the United States. Furthermore, most of our directors and officers and experts reside outside the United States, and most of their assets are located outside the United States. As a result, you may find it difficult to effect service of process within the United States upon these persons or to enforce judgments outside the United States obtained against us or these persons in U.S. courts, including judgments in actions predicated upon the civil liability provisions of the U.S. federal securities laws. Likewise, it may also be difficult for you to enforce in U.S. courts judgments obtained against us or these persons in courts located in jurisdictions outside the United States, including actions predicated upon the civil liability provisions of the U.S. federal securities laws. It may also be difficult for an investor to bring an action in a Luxembourg court predicated upon the civil liability provisions of the U.S. federal securities laws against us or these persons. Luxembourg law confers to shareholders the right to bring a derivative action on our behalf only in limited circumstances and, subject to certain conditions.
Service of process within Luxembourg upon the Company may be possible, provided that The Hague Convention on the Service Abroad of Judicial and Extrajudicial Documents in Civil or Commercial Matters of November 15, 1965 is complied
34
with. As there is no treaty in force on the reciprocal recognition and enforcement of judgments in civil and commercial matters between the United States and the Grand Duchy of Luxembourg, courts in Luxembourg will not automatically recognize and enforce a final judgment rendered by a U.S. court. The enforceability in Luxembourg courts of judgments entered by U.S. courts will be subject prior to any enforcement in Luxembourg to the procedure and the conditions set forth in particular in the Luxembourg civil procedure code and/or established by court interpretation, which conditions may include the following and which may evolve:
•the judgment of the U.S. court is final and duly enforceable (exécutoire) in the United States and has not been fully enforced in the United States and/or any other jurisdiction;
•the U.S. court had jurisdiction over the subject matter leading to the judgment (based on the verification of a characterized link of connection of the litigation to the judge of origin);
•the U.S. court has applied to the dispute the substantive law which would have been applied by Luxembourg courts;
•the judgment was granted following proceedings where the counterparty had the opportunity to appear, and if it appeared, to present a defense and other conditions for a fair trial have been complied with taking into account all facts and circumstances whether occurring before, during or after trial or issue and delivery of the judgment, and the judgment has not been obtained by reason of fraud;
•the judgment of the U.S. court does not contravene Luxembourg international public policy (as such term is interpreted under the laws of Luxembourg); and
•the absence of contradiction between such judgment and an already issued judgment of a Luxembourg court.
Under our articles of incorporation, we indemnify and hold our directors harmless against all claims and suits brought against them, subject to limited exceptions. Under our articles of incorporation, to the extent allowed or required by law, the rights and obligations among or between us, any of our current or former directors, officers and company employees and any current or former shareholder will be governed exclusively by the laws of Luxembourg and subject to the jurisdiction of the Luxembourg courts, unless such rights or obligations do not relate to or arise out of their capacities as such. Although there is doubt as to whether U.S. courts would enforce such provision in an action brought in the United States under U.S. securities laws, such provision could make the enforcement of judgments obtained outside Luxembourg more difficult as to the enforcement against our assets in Luxembourg or jurisdictions that would apply Luxembourg law.
Our shareholders may have more difficulty protecting their interests than they would as shareholders of a U.S. corporation, which could adversely impact trading in our common shares and our ability to conduct equity financings.
Our corporate affairs are governed by our articles of association and the laws of Luxembourg, including the laws governing public joint stock companies (sociétés anonymes). The rights of our shareholders and the responsibilities of our directors and officers under Luxembourg law are different from those applicable to a corporation incorporated in the United States. In addition, Luxembourg law governing the securities of Luxembourg companies may not be as extensive as those in effect in the United States, and Luxembourg law and regulations in respect of corporate governance matters may not be as protective of minority shareholders as state corporation laws in the United States. Therefore, our shareholders may have more difficulty in protecting their interests in connection with actions taken by our directors and officers or our principal shareholders than they would as shareholders of a corporation incorporated in the United States.
Neither our articles of association nor Luxembourg law provide for appraisal rights for dissenting shareholders in certain extraordinary corporate transactions that may otherwise be available to shareholders under certain U.S. state laws. As a result of these differences, our shareholders may have more difficulty protecting their interests than they would as shareholders of a U.S. issuer.
Luxembourg and European Union insolvency and bankruptcy laws and regulations are substantially different from U.S. insolvency laws and may offer our shareholders less protection than they would have under U.S. insolvency and bankruptcy laws.
As a company organized under the laws of the Grand Duchy of Luxembourg and with its registered office in Luxembourg, we are subject to Luxembourg and European Union insolvency and bankruptcy laws and regulations in the event any insolvency proceedings are initiated against us including, among others, Council and European Parliament Regulation (EU) 2015/848 of 20 May 2015 on insolvency proceedings (recast). Should courts in another European Union Member State determine that the insolvency and bankruptcy laws of that Member State apply to us (or to certain of our assets) in accordance
35
with and subject to such European Union regulations, the courts in that Member State could have jurisdiction over the insolvency proceedings initiated against us. Insolvency and bankruptcy laws in Luxembourg or the relevant other European Union Member State, if any, may offer our shareholders less protection than they would have under U.S. insolvency and bankruptcy laws and make it more difficult for them to recover the amount they could expect to recover in a liquidation under U.S. insolvency and bankruptcy laws.
Our ability to pay dividends is restricted under Luxembourg law.
Our articles of association and the Luxembourg law of August 10, 1915, on commercial companies as amended from time to time (loi du 10 août 1915 sur les sociétés commerciales telle que modifiée), require a general shareholders’ meeting to approve any dividend distribution, except as set forth below.
Our ability to declare dividends under Luxembourg corporate law is subject to the availability of distributable earnings or available reserves, including share premium. Moreover, we may not be able to declare and pay dividends more frequently than annually. As permitted by Luxembourg corporate law, our articles of association authorize the declaration of dividends more frequently than annually by the Board of Directors in the form of interim dividends so long as the amount of such interim dividends does not exceed total net profits made since the end of the last financial year for which the annual accounts have been approved, plus any profits carried forward and sums drawn from reserves available for this purpose, less the aggregate of the prior financial year’s accumulated losses, the amounts to be set aside for the reserves required by Luxembourg law or by our articles of association for the prior financial year.
We are a holding company and depend on the ability of our subsidiaries to distribute funds to us in order to satisfy our financial obligations and to make dividend payments, which they may not be able to do.
We are a holding company, and our subsidiaries conduct all of our operations. We own no material assets other than the equity interests in our subsidiaries. As a result, our ability to make dividend payments depends on our subsidiaries and their ability to distribute funds to us. If we are unable to obtain funds from our subsidiaries, we will be unable to distribute dividends. We do not intend to seek to obtain funds from other sources to pay dividends.
Item 4. Information on the Company
A. HISTORY AND DEVELOPMENT OF THE COMPANY
General Information
Adecoagro was organized in the Grand Duchy of Luxembourg on June 11, 2010 as a société anonyme (a joint stock company). The Company’s legal name is “Adecoagro S.A.” On January 28, 2011, Adecoagro completed the IPO of its shares listed on the New York Stock Exchange (“NYSE”). The shares are traded under the symbol “AGRO.” In a series of transactions during 2012, we transferred shares of Adecoagro to certain limited partners of IFH in exchange for their residual interest in IFH increasing our interest in IFH to approximately 100%.
On March 27, 2015, Adecoagro commenced a series of transactions for the purpose of transferring the domicile of its subsidiary, Adecoagro LP, to Luxembourg. In connection with the Adecoagro LP re-domiciliation, Adecoagro merged IFH into Adecoagro LP (Delaware) with Adecoagro LP (Delaware) as the surviving entity and on April 1, 2015 Adecoagro GP S.à r.l., a société à responsibilité limitée organized under the laws of Luxembourg, became the general partner of Adecoagro LP on April 1, 2015. Also on April 1, 2015, Adecoagro completed the re-domiciliation of Adecoagro LP (Delaware) out of Delaware to Luxembourg and Adecoagro LP without dissolution or liquidation, continued its corporate existence as Adecoagro LP S.C.S., a société comandite simple organized under Luxembourg law, effective April 2, 2015. For a detailed description of the Adecoagro LP redomiciliation see “—Corporate Development” below.
Adecoagro is registered with the Luxembourg Registry of Trade and Companies under number B153681. Adecoagro has its registered office at 6, Rue Eugène Ruppert, L-2453, Luxembourg, Grand Duchy of Luxembourg. Our telephone number is (+352) 264491, and our website is www.adecoagro.com. The SEC also maintains a website at http://www.sec.gov which
contains reports and other information regarding registrants that file electronically with the SEC.
36
History
In September 2002, we commenced our operations with the acquisition of 100% of the equity interests of Pecom Agropecuaria S.A., an Argentine corporation (sociedad anónima), and we rapidly became one of the largest agricultural companies in Argentina. Totaling more than 74,000 hectares of farmland, this acquisition represented one of the largest stock purchase transactions in South America in 2002. In connection with the acquisition, Pecom Agropecuaria S.A. changed its name to Adeco Agropecuaria S.A. (“Adeco Agropecuaria”). Adeco Agropecuaria was the platform from which we executed our expansion plans, including the acquisition of additional land and the diversification of our business activities.
In 2004, we began our regional expansion and acquired a farm in Uruguay (approximately 5,086 hectares) and three farms in Western Bahia, Brazil (20,419 hectares). In 2005, we continued the expansion of our crop business in Argentina with the acquisitions of La Agraria S.A. (approximately 4,857 hectares) and Establecimientos El Orden S.A. and Cavok S.A. (approximately 15,157 hectares) and Las Horquetas farm (2,086 hectares).
In 2005, we acquired our first sugar and ethanol mill, Usina Monte Alegre S.A. (“UMA”), with a crushing capacity at that time of 0.9 million tons of sugarcane per year at the time. UMA became our platform for expansion in the Brazilian sugar and ethanol sector.
In 2006 and 2007, we continued our land portfolio expansion and vertical integration through the acquisitions of Pilagá S.A. (formerly Pilagá S.R.L. and before that, Pilagá S.A.G.), one of the largest and oldest agriculture companies in Argentina, with more than 88,000 hectares and two rice processing facilities, and one additional farm of approximately 2,400 hectares in Argentina and two farms of approximately 4,000 hectares in Brazil for the production of crops. Also, in December 2007, we acquired Bañado del Salado S.A., Agro Invest S.A. and Forsalta S.A., with more than 43,000 hectares for crop production in Argentina, and one farm in Uruguay of approximately 3,177 hectares.
During 2007, we also began the expansion of our dairy business in Argentina. After five years of research, we began the construction of the first “free-stall” dairy facility with a capacity to milk 3,000 cows.
In Brazil, during 2007, we began the construction of a sugarcane cluster in Mato Grosso do Sul with a projected 10.0 million tons of sugarcane crushing capacity. Angelica was the first greenfield mill we built from inception, with a nominal crushing capacity of 4.9 million tons. We also bought approximately 13,000 hectares of farmland for the planting of sugarcane to supply the mill. Angelica began operating during August 2008, and reached full operational capacity during April 2010.
Additionally, in August 2010, we acquired Dinaluca S.A., an agricultural company consisting of a farm located in the province of Corrientes, Argentina, and with more than 14,000 hectares for crop production in Argentina. Further, between August and November 2011, we acquired: (i) Compañía Agroforestal de Servicios y Mandatos S.A., an agricultural Argentine company owning more than 4,900 hectares of land in the province of Santiago del Estero, (ii) Simoneta S.A., an agricultural Argentine company owning more than 4,600 hectares of land in the province of La Pampa, and (iii) 3,400 hectares of land for crop production in the province of San Luis, Argentina.
During 2012, we began the construction of our second free stall dairy facility in Argentina, with a capacity of 3,500 milking cows.
On February 26, 2013, Adecoagro formed a 50/50 joint venture, CHS Agro S.A., together with CHS de Argentina S.A., a leading farmer-owned energy, grains and foods company based in the United States. CHS Agro built a sunflower processing facility located in the city of Pehuajo, Province of Buenos Aires, Argentina. The facility processes black oil and confectionary sunflower into specialty products such as in-shell seeds and oil seeds, which are exported entirely. The joint venture grows confectionary sunflower on leased farms, while black oil sunflower is originated from third parties. On January 14, 2019 and after a restructuring of the joint venture, we purchased the remaining 50% of the capital stock of CHS Agro from CHS de Argentina S.A. Adecoagro currently owns 100% of CHS Agro S.A., which has since been renamed as Girasoles del Plata S.A. The consideration for this acquisition was nominal.
During March 2013, we began the construction of the second greenfield project in our sugarcane cluster in Mato Grosso do Sul, the Ivinhema mill, with 5.7 million tons of sugarcane crushing capacity and located 45 km south of Angelica. This mill allowed us to consolidate our cluster, generate important synergies and economies of scale, and improve operational margins and Adjusted Free Cash Flow. The Ivinhema mill was built in two phases: the first phase with 2.0 million tons of capacity was completed during April 2012, and the second phase with 3.0 million tons of crushing capacity was completed in mid-2015.
37
During October 2017, we completed the construction of our first bio-digester. The facility generates electricity by burning biogas extracted from the effluents produced in our dairy operations. On November 3, 2017, we began generating and delivering 1.4 MW of electricity to the local power grid. In addition to increasing revenues and securing our energy requirements, this facility enhances the sustainability of our free stall dairy operation by reducing greenhouse gas emissions, improving the effluent management and concentrating valuable nutrients, which are applied back to the fields.
On February 5, 2019 we acquired a peanut processing facility for $10 million. The facility is located in Dalmacio Vélez, Province of Cordoba, Argentina.
On February 8, 2019, we acquired two milk processing plants and two trademarks from SanCor Cooperativas Unidas Limitadas. One of the acquired facilities is located in the city of Chivilcoy, Province of Buenos Aires, and is primarily focused on fluid milk production for the domestic market in Argentina. The other acquired facility is located in the city of Morteros, Province of Cordoba, and produces dry milk and cheese for the export market. In addition, we acquired the intellectual property covering the brands “Las Tres Niñas” and “Angelita” and associated trademarks. Both brand names are well recognized in Argentina and represent strong brands to market our retail consumer dairy products. The total consideration for this operation was US$47 million.
On May 2, 2022 we acquired the rice production operations owned by certain subsidiaries of Viterra Limited (“Viterra”) in Uruguay and Argentina. These operations comprise four rice processing and storage plants in Uruguay and one in Argentina, and the assets acquired included all biological assets and inventories of processed and rough rice. The acquisition price amounted to approximately $18 million payable in three annual installments, and contemplated a financial debt for an approximate amount of $20 million. Uruguayan rice is internationally recognized as being of the highest quality standards. This transaction is aligned with the Company’s strategy to expand its vertically integrated rice business under the highest quality and sustainability standard. This expansion will not only increase the Company’s rice production and processing capacity, in addition to benefiting from synergies with existing operations, but it will also improve the Company’s global footprint, including access to new markets and clients who purchase Uruguayan rice. The acquisition is also expected to increase the Company’s competitiveness in logistics and transportation and consolidate its position in the rice business.
Corporate Development
On October 30, 2010, as part of a corporate reorganization, referred to herein as the Reorganization, AFI Ltd., a subsidiary of IFH LLC and the parent of Adecoagro LLC, distributed its interest in Adecoagro LLC to IFH LLC and commenced a process of dissolution, making IFH LLC the direct parent of Adecoagro LLC. Thereafter, our shareholders transferred pro rata 98% of their membership interests in IFH LLC to Adecoagro S.A. (a corporation organized under the laws of the Grand Duchy of Luxembourg with no prior holdings or operations, formed for the purpose, among others, of facilitating our IPO) in exchange for 100% of the common shares of Adecoagro.
In connection with the Reorganization, Adecoagro converted IFH LLC from a limited liability company into IFH LP, a Delaware limited partnership owned 2% by our shareholders and, approximately 98% by Adecoagro, in each case as limited partners, and the remainder by Ona Ltd., a newly formed Maltese corporation, as its general partner. Adecoagro LLC was also converted to Adecoagro LP, a Delaware limited partnership, owned approximately 100% by IFH LP as limited partner, and the remainder by Toba Ltd., a newly formed Maltese corporation, as its general partner.
On January 28, 2011, we successfully completed the initial public offering of our shares listed on the NYSE, and on February 2, 2011, we issued 28,405,925 shares, at a price of US$11.00 per share. The shares trade under the symbol “AGRO.”
On February 2, 2011, we also issued and sold to Al Gharrafa Investment Company (“Al Gharrafa”), a wholly owned subsidiary of Qatar Holding LLC and one of our shareholders, 7,377,598 common shares at a purchase price of $10.65 per share, which is equal to the price per common share paid by the underwriters of our initial public offering of the Company, pursuant to an agreement entered into on January 6, 2011. In addition, on February 11, 2011, we issued 4,285,714 shares when the over-allotment option was exercised by the underwriters in our IPO.
During 2012, the Company issued in a series of transactions 1,654,752 shares to certain limited partners of IFH in exchange for their residual interest in IFH increasing Adecoagro’s interest in IFH to approximately 100%.
On February 5, 2013, we completed an underwritten secondary offering of 13.9 million common shares of Adecoagro offered by our shareholder, HBK Master Fund LP at a price per share to the public of $8.00 pursuant to an effective shelf registration statement on Form F-3 filed with the SEC. On February 13, 2013, HBK Master Fund LP sold an additional 2.1
38
million common shares of Adecoagro pursuant to the overallotment option it granted to the underwriter in the secondary offering.
On March 27, 2015, Adecoagro commenced a series of transactions for the purpose of transferring the domicile of its subsidiary, Adecoagro LP to Luxembourg. In connection with the redomiciliation of Adecoagro LP, Adecoagro merged IFH LP into Adecoagro LP with Adecoagro LP (Delaware) as the surviving entity. In connection with this merger, all of the assets and liabilities of IFH L.P. vested in Adecoagro LP (Delaware), Ona Ltd became its general partner and Toba Ltd became a wholly-owned subsidiary of Adecoagro LP (Delaware). In connection with the transactions completed on March 27, 2015, Ona Ltd. assigned its general partnership interest in Adecoagro LP to Adecoagro GP S.à r.l., a société á responsibilité limitée organized under the laws of Luxembourg, on April 1, 2015. Also on April 1, 2015, Adecoagro completed the redomiciliation of Adecoagro LP (Delaware) out of Delaware to Luxembourg and Adecoagro LP, without dissolution or liquidation, continued its corporate existence as Adecoagro LP S.C.S., a société en comandite simple organized under Luxembourg law, effective April 2, 2015. Since that date the affairs of Adecoagro LP S.C.S. have been governed by its by-laws and Luxembourg law.
On March 21, 2016, we completed an underwritten secondary offering of 12.0 million shares of Adecoagro offered by our shareholders, Quantum Partner LP and Geosor Corporation, at a price per share to the public of $11.7 pursuant to an effective shelf registration statement on Form F-3 filed with the SEC. In connection with this offering, the selling shareholders granted the underwriter the right to purchase up to 1,800,000 additional common shares exercisable once at any time within 30 days after March 21,2016. On April 20, 2016, the underwriter elected to purchase an additional 350,000 common shares at a price of 11.40 per common share. In 2022, we withdrew the registration statement relating to the unsold secondary registered shares remaining under such shelf registration statement.
On September 21, 2017, the Company issued US$500 million principal amount of its 6.000% Senior Notes due 2027 (the “2027 Notes”). The 2027 Notes were issued pursuant to an Indenture dated as of September 21, 2017 (the “Indenture”), among us, as issuer, Adeco Agropecuaria S.A., Pilagá S.A., Adecoagro Brasil Participações S.A., Adecoagro Vale do Ivinhema S.A. and Usina Monte Alegre Ltda., as guarantors (the “Guarantors”) and The Bank of New York Mellon, as trustee, registrar, paying agent and transfer agent, and are guaranteed on a senior unsecured basis by each of the Guarantors.
On December 5, 2019, Adecoagro Vale do Ivinhema , a wholly owned subsidiary of the Company, placed R$400.0 million in Certificados de Recebíveis do Agronegócio (CRA), due in November 2027 and bearing interest at a rate of IPCA (Brazilian official inflation rate) + 3.80% per annum.
The following chart summarizes our corporate structure as of April 2023. The Restricted Subsidiaries and Unrestricted Subsidiaries shown on the chart refer to the terms "Restricted Subsidiary" and "Unrestricted Subsidiary", respectively, as defined in our Senior Notes Indenture attached hereto as Exhibit 4.43.
39

Principal Capital Expenditures
Capital expenditures totaled $229.1 million, $213.0 million and $166.7 million for the years ended December 31, 2022, 2021 and 2020, respectively.
B. BUSINESS OVERVIEW
Our Company
We are a leading agro-industrial company in South America, with operations in Argentina, Brazil and Uruguay. We are currently involved in a broad range of businesses, including farming crops and rice and other agricultural products, dairy operations, sugar, ethanol and energy production and land transformation. Our sustainable business model is focused on (i) a low-cost production model that leverages growing or producing each of our agricultural products in regions where we believe we have competitive advantages, (ii) reducing the volatility of our returns through product and geographic diversification and use of advanced technology, (iii) benefiting from vertical integration in key segments of the agro-industrial chain, (iv) acquiring and transforming land to improve its productivity and realizing land appreciation through strategic dispositions, and (v) implementing sustainable production practices and technologies focused on long-term profitability.
As of December 31, 2022, we owned a total of 219,850 hectares of land comprising 18 farms in Argentina, eight farms in Brazil and one farm in Uruguay. In addition we own and operate several processing and manufacturing facilities including four rice mills and one rice snack facility in Argentina, two rice mills in Uruguay, four dairy free-stall facilities with an average
40
of 14,415 milking cows, two milk processing facilities in Argentina, one peanut processing facility and one sunflower processing facility in Argentina, two grain handling and conditioning plants in Argentina, and three sugar and ethanol mills in Brazil with a sugarcane crushing capacity of 14.2 million tons.
We believe that we are:
•one of the largest owners of productive farmland in South America, with more than 184,000 owned and productive hectares as of December 31, 2022 (excluding legal land reserves pursuant to local regulations and other land reserves) located in Argentina, Brazil and Uruguay, producing a wide range of agricultural products;
•a leading producer of grains and oilseeds in South America. During the 2021/2022 harvest year, we harvested 230,986 hectares (including 124,887 leased hectares and 36,750 second crop hectares) and produced 769,524 tons of grains, including soybeans, corn, wheat, peanut, sunflower and cotton, among others;
•one of the largest fully integrated producers of rough (unprocessed) rice in the world, planting 60,857 hectares (including 17,844 leased hectares) and producing 416,735 tons during the 2021/2022 harvest year. We are also a large processor and exporter of white rice (processed) in Argentina and Uruguay;
•a leading dairy producer in South America in terms of cutting-edge technology, productivity per cow and grain conversion efficiencies, producing 185.6 million liters of raw milk during 2022, and adding value in our processing facilities. We are a leading retailer of dairy products, including three popular brands—Las Tres Niñas, Apóstoles and Angelita;
•a growing producer of sugar and ethanol in Brazil, where we currently own three sugar and ethanol mills, with an aggregate installed capacity of 14.2 million tons per year and full cogeneration capacity (i.e. the generation of electricity from sugarcane bagasse, the fiber portion of sugarcane that remains after the extraction of sugarcane juice) of 241 MW as of December 31, 2022. Our operation is highly integrated, meaning that 96% of the sugarcane crushed at our mills is supplied from our own plantations. As of December 31, 2022, our sugarcane plantation consisted of 192,987 hectares; and
•one of the leading companies in South America in the acquisition and transformation of undermanaged land to more productive uses, generating higher cash yields. Over the last 16 fiscal years, in aggregate, we have sold over 102,000 hectares generating capital gains of approximately US$250 million.
We are engaged in three main businesses:
Farming Business
As of December 31, 2022 we owned 206,896 hectares (excluding sugarcane farms) of farmland in Argentina and Uruguay. During the 2021/2022 harvest year we held leases or entered into agriculture partnerships for an additional 142,732 hectares of arable land. We own the facilities and have the resources to store and condition 100% of our crop and rice production. We do not depend on third parties to condition our production for sale. Our Farming business is subdivided into four main businesses:
•Crops: We produce a wide range of agricultural commodities, including soybean, corn, wheat, peanut, sunflower and cotton, among others. In Argentina, our farming activities are primarily conducted in the Argentine humid pampas region, where agro-ecological conditions are optimal for low-cost production. Since 2004, we have expanded our operations throughout the center-west region of Uruguay, as well as in the northern region of Argentina. During the 2021/2022 harvest year, we planted approximately 230,986 hectares of crops, including second harvests, and produced 769,524 tons of grains. We also planted an additional 10,206 hectares where we produced over 314,000 tons of forage used to feed cattle in our dairy operation. During the current 2022/2023 harvest year, we planted approximately 209,705 hectares of crops (including second harvest) and an additional 10,500 hectares of forage.
•Rice: We own a fully integrated rice operation. We produce irrigated rice in the northeast provinces of Argentina and in Uruguay, where the availability of water, sunlight, and fertile soil results in a coveted region for the low-cost production of rice. We believe that we are one of the largest producers of rough (unprocessed) rice in South America, producing 416,735 tons during the 2021/2022 harvest year. We own four rice mills and one rice snack facility in Argentina and two rice mills in Uruguay that process our own production, as well as rice purchased from third parties. We produce different types of white and brown rice sold both in the domestic Argentine retail market under our own brands and abroad. During the current 2022/2023 harvest year, we planted 55,648 hectares of rice.
41
•Dairy : We believe that we are a leading dairy producer in South America in terms of our utilization of cutting-edge technology and in our productivity per cow and grain conversion efficiency. Through the production of raw milk, we are able to transform forage and grains into value-added animal protein. Our free-stall dairies in Argentina allow us to optimize our use of resources (land, dairy feeding cattle and capital), increase our productivity and maximize the conversion of forage and grain into raw milk. We produced 185.6 million liters of raw milk in 2022, with a daily average of 14,415 milking cows, delivering an average of 35.3 liters of milk per cow per day. In October 2017, we completed the construction of our first biodigester with 1.4 MWh of installed capacity. The facility generates electricity by burning biogas extracted from effluents produced by our milking cows. In addition to increasing revenues and securing our energy requirements, this facility enhances the sustainability of our free-stall dairy operation by reducing greenhouse gas emissions, improving the management of effluents and concentrating valuable nutrients which are applied back to the fields. In 2019, we further acquired two milk processing facilities that produce UHT milk, milk powder, semi-hard cheese, yogurt and chocolate milk, among other products, with the flexibility to sell to both the domestic and export market based on relative profitability. In 2022, our facilities processed 359.4 million liters of milk, thereby producing 161 million liters of fluid milk, over 4,260 tons of semi-hard cheese, over 19,000 tons of milk powder and over 4.6 million liters of cream and cocoa flavored milk.
•All Other Segments: All other segments business primarily consists of leasing pasture to cattle farmers in Argentina. We lease over 16,919 hectares of pasture unsuitable for crop production to third-party cattle farmers.
Sugar, Ethanol and Energy Business
We cultivate and harvest sugarcane, which is then processed in our own mills to produce sugar, ethanol and energy. As of December 31, 2022, we had 192,987 hectares of sugarcane plantations in the Brazilian states of Mato Grosso do Sul and Minas Gerais, of which 12,951 hectares were planted on our own land and 180,036 hectares were planted on land leased by us under long-term agreements. We use different techniques to maximize sugarcane production. For example, we use meiosis to renew and expand harvestable areas by planting only a few rows of sugarcane, along with other products in the rest of the field. We harvest the sugarcane within six to nine months and use that production to plant sugarcane on the area where other products have been already harvested. By doing so, we maximize sugarcane plantation efficiency.
Further, we own and operate three sugar and ethanol mills—UMA, Angélica and Ivinhema—with a total crushing capacity of 14.2 million tons of sugarcane per year as of December 31, 2022 (assuming an average of 5,569 milling hours).
UMA is a small but efficient mill located in the state of Minas Gerais, with a sugarcane crushing capacity of 1.2 million tons per year (assuming an average of 4,800 milling hours), full cogeneration capacity and an associated sugar brand, Açúcar Monte Alegre, with a strong presence in the regional retail market. We plant and harvest 98.5% of the sugarcane milled at UMA, with the remaining 1.5% acquired from third parties. UMA is also engaged in the production of organic sugar and in 2020, it exported this product for the first time after having received the necessary certification to export organic sugar to the E.U. Angélica and Ivinhema are two modern mills, which we built in the state of Mato Grosso do Sul, with current sugarcane crushing capacities of 5.6 and 7.4 million tons per year, respectively (assuming an average of 5,333 and 5,920 milling hours, respectively). Both mills are located 45 kilometers apart, and form a cluster surrounded by one large sugarcane plantation. Angelica and Ivinhema are equipped with high-pressure steam boilers and turbo-generators with the capacity to use all sugarcane bagasse by-product to generate electricity. Approximately 31% of electricity generated is used to power the mill and the excess electricity is sold to the local power grid, which means our mills have full cogeneration capacity.
In the year ended December 31, 2022, we crushed 10.5 million tons of sugarcane. Our mills produce both sugar and ethanol, and accordingly, we have some flexibility to adjust our production (within certain capacity limits that generally vary between 40% and 80%) between sugar and ethanol, to take advantage of more favorable market demand and prices at given points in time. In the year ended December 31, 2022 we produced 481,919 tons of sugar and 540,231 cubic meters of ethanol.
Since 2020, we have been selling carbon credits or “CBios” under the RenovaBio program. The RenovaBio program was designed by the Brazilian government to cut carbon emissions by discouraging fossil fuel consumption while encouraging the production of renewable energy. Under this program, a carbon credit market is established in which sellers of fossil fuels have to acquire a mandatory quota of carbon credits set based on the amount of non-renewable fuels sold by them in the prior year. Issuers of CBios are biofuel producers whose mills have been certified by the ANP and awarded a score based on how “green” their mill operation is. This score acts as a multiplier for the amount of CBios the mill can issue for every cubic meter of ethanol it sells. CBios, in turn, are financial instruments traded on the B3. Prices are based on the supply of and demand for those credits. In 2022, we sold 550,796 CBios at an average unit price of R$89.1 (average net price of US$17.6).
42
In 2021, Adecoagro became the first company in Brazil to be authorized by the Totum Institute to issue Renewable Natural Gas Certificates, “gas-recs” as they are referred to in the market. These certificates attest to the production of renewable natural gas. Industries in Brazil can voluntarily purchase these certificates as evidence of the decarbonization of the gas consumed in their operations. In 2022, we became pioneers in the commercialization of gas-recs in Brazil through the sale of 25,000 certificates, as a result of our biogas production during 2021, at a unit price of R$1.80 per certificate.
Land Transformation Business
We acquire farmland that we believe is undeveloped or underutilized. By implementing cutting-edge production technology and agricultural best practices, we render this land suitable for more productive uses, enhance yields and increase its overall value. We promote sustainable land use through our land transformation activities, which seek to promote environmentally responsible agricultural production and a balance between production and ecosystem preservation. We do not operate in heavily wooded areas or wetland areas.
Moreover, from time to time, we seek to recycle our capital by selling a portion of our fully developed farms. This allows us to monetize capital gains generated by land transformation activities and allocate our capital to acquire land with higher transformation potential or to deploy it in other businesses, thereby enhancing return on invested capital. During the 20-year period since our inception, we have effectively put into production over 171,000 hectares of land that were previously undeveloped or undermanaged. We realize and capture land transformation value through the strategic disposition of assets that have reached full development potential. We believe that the rotation of our land portfolio allows us to efficiently reallocate capital and maximize our return on invested capital. Our current land portfolio consists of 219,850 hectares (net of minority interests) distributed throughout our operating regions as follows: 93% in Argentina, 6% in Brazil, and 1% in Uruguay. During the last 16 years, we sold 25 of our fully mature farms, generating capital gains of approximately US$250 million.
The following table sets forth, for the periods indicated, certain data relating to our land transformation business:
| Year Ended December 31, | ||||||||||||||||||||
| 2022 | 2021 | 2020 | ||||||||||||||||||
| Undeveloped/undermanaged land put into production (hectares) | — | — | 1,903 | |||||||||||||||||
| Ongoing transformation of arable land (hectares) | 123,313 | 123,313 | 123,313 | |||||||||||||||||
Number of farm sold (1) | — | — | 2 | |||||||||||||||||
Hectares sold (2) | — | — | 5,444 | |||||||||||||||||
Capital gains from the sale of land (in thousands of US$) (1) | — | — | 1,500 | |||||||||||||||||
(1) In 2020, we sold the Huelen farm (amounting to 4,633 hectares) and a 811 hectares plot of the Abolengo farm.
(2) Includes the sale of non-controlling interests in farmland companies.
Our Competitive Strengths
•Unique and strategic asset base. We own strategically located farmland and agro-industrial assets in Argentina, Brazil and Uruguay. We continuously improve our operations and practices, resulting in the reduction of operating costs and an increase in productivity and ultimately enhancing the value of our properties and generating capital gains. Our operations also benefit from strategically located industrial facilities throughout Argentina, Brazil and Uruguay, increasing operating efficiencies and reducing operating and logistic costs. We are vertically integrated where economics and returns are attractive, where the efficiency of our primary operation is significantly enhanced, or where lack of a competitive market results in the absence of a transparent price determination mechanism. Our diversified asset base creates valuable synergies and economies of scale, including (i) the ability to transfer the technologies and best practices that we have developed across our business lines, (ii) the ability to apply value-adding land transformation strategies to farmland in connection with our farming and sugarcane operations, and (iii) a greater ability to negotiate more favorable terms with our suppliers and customers.
Owning a portion of the land where we operate is a key element of our business model.
•Low-cost production leveraging agro-ecological competitive advantages. Each of the commodity products we grow is produced in regions where agro-ecological conditions provide competitive advantages and which, through the implementation of our efficient and sustainable production model, allow us to become one of the lowest cost producers.
43
▪Our grain and oilseed production is based in the Argentine humid pampas region, where soil fertility, regular rainfalls, temperate climate, the availability of land and the relative proximity to ports contribute to the reduced use of fertilizers and agrochemicals, high productivity and stable yields and efficient logistics, ultimately resulting in one of the lowest costs per ton of grain produced and delivered.
▪Our rice operation is located in the northeast provinces of Argentina and in Uruguay, which are one of the best rice farming regions in the world due to plentiful sunlight, the abundant availability of water for low-cost irrigation, and a large potential for expansion.
▪Our dairy operation is situated in the Argentine humid pampas region, where cow feed (grains, oilseeds and forage) is efficiently and abundantly produced at a low cost and climate and sanitary conditions are optimal for cow comfort, which enhances productivity, cow reproduction rates and milk quality.
▪We produce sugarcane in the states of Mato Grosso do Sul and Minas Gerais in Brazil, where the combination of soil and climate derive in high sugarcane productivity and quality, resulting in one of the lowest production costs in the world (significantly lower than other major sugar producing regions, including India, China, the United States, the United Kingdom, France and Germany).
•Standardized and scalable agribusiness model applying technological innovation. We have consistently used innovative production techniques to ensure that we are at the forefront of technological improvements and environmental sustainability standards in our industry. We are implementing an agribusiness model that consists on specializing our workforce and defining standard protocols to track crop development and control production variables, thereby enhancing management decision-making. We further optimize our agribusiness model through the effective implementation and constant adaptation of a portfolio of advanced agricultural and information technologies and best practices tailored to each region in which we operate and commodity we produce, allowing us to improve our crop yields, reduce operating costs and maximize margins in a sustainable manner.
▪In our Farming business, we use “no-till” technology as the cornerstone of production in our Crops segment and have been able to implement this technique in areas within our production regions where it was not previously used. Furthermore, we also utilize crop rotation, second harvests, integrated pest management, balanced fertilization, water management and mechanization. Additionally, we use the silo bag storage method, utilizing large polyethylene bags with a capacity of 180 to 200 tons which can be left on the field for 12 months, resulting in low-cost, scalable and flexible storage on the field during harvest, which we believe allows us to expand our crop storage capacity at a low cost, generate important logistic and freight savings by moving our production in the off-season when freight fares are lower, and time the entry of our production into the market at optimal price points. See “—Operations and Principal Activities—Farming Business—Storage and Conditioning for the Farming Business.”
▪In our Dairy segment, we believe that we were the first company in South America to implement the “free-stall” production system, resulting in more efficient conversion of feed to raw milk and higher production rates per cow compared to our peers in the region.
▪In our Sugar, Ethanol and Energy segment, our sugarcane cluster, composed of the Ivinhema and Angélica mills: (i) has a highly mechanized planting and harvesting operation, which has increased our sugarcane production, reduced our operating costs and contributed to environmental sustainability by eliminating the need to burn the sugarcane before harvest; (ii) has the capacity to use all the bagasse (the fiber portion of sugarcane that remains after the extraction of sugarcane juice), with almost no incremental cost, to cogenerate 225 MW of clean and renewable energy; (iii) can process 54,480 tons of sugarcane per day and (iv) can recycle by-products such as filter cake and vinasse, by using them as fertilizers in our sugarcane fields, as well as recycling water and other effluents, generating important savings in input costs and protecting the environment.
•Unique diversification model to mitigate cash flow volatility. We pursue a unique, multi-tier diversification strategy to reduce our exposure to production and market fluctuations that may impact our cash flow and operating results. We seek geographic diversification by spreading our portfolio of farmland and agro-industrial assets across different regions of Argentina, Brazil and Uruguay, thereby lowering our risk exposure to weather-related losses and contributing to stable cash flows. Additionally, we produce a variety of products including soybean, corn, wheat, peanut, sunflower, cotton, barley, sorghum, rice, raw milk and dairy products, sugar, ethanol and energy, among others, which lowers our risk exposure to potentially depressed market conditions of any specific product. Moreover, through vertical integration in the Rice, Dairy and the Sugar, Ethanol and Energy businesses, we process and transform a portion of our agricultural commodities into branded retail products, reducing our commodity price risk and our reliance on the standard market
44
distribution channels for unprocessed products. Finally, our commercial committee defines our commercial policies based on market fundamentals and logistical and production data to develop a customized sale/hedge risk management strategy for each product.
•Expertise in acquiring farmland with transformation and appreciation potential. Since our inception in 2002, we have executed transactions for the purchase and disposition of land for over US$780 million and sold over 100,000 hectares of developed land, generating capital gains of approximately US$250 million. We believe we have a superior track record and have positioned ourselves as a key player in the land business in South America. Our business development team has gained extensive expertise in evaluating and acquiring farmland throughout South America and has a solid understanding of the productivity potential of each region and of the potential for land transformation and appreciation. To date, we have analyzed over 11 million hectares of farmland spread throughout the regions in which we operate and other productive regions in the world. We have developed a methodology to assess farmland and to appraise its potential value with a high degree of accuracy and efficiency by using information generated through sophisticated technology, including satellite images, rain and temperature records, soil analysis, and topography and drainage maps. Our management team has gained extensive experience in transforming and maximizing the appreciation potential of our land portfolio through the implementation of our agribusiness techniques described above. We also have an extensive track record of rotating our asset portfolio to generate capital gains and monetize the transformation and appreciation generated through our land transformation activities and agricultural operations.
•Experienced management team and knowledgeable employees. Our personnel are our most important asset. We have an experienced senior management team with an average of more than 20 years of experience working in our sector and a solid track record of implementing and executing large-scale growth projects, such as land transformations, greenfield developments of industrial plants, and integrating acquisitions within our organization. Recruiting technically qualified employees at each of our farms and operating sites is a main focus of our senior management and a key to our success.
Our Business Strategy
We intend to maintain our position as a leading agricultural company in South America by expanding and consolidating each of our business lines, thus, creating value for our shareholders. The key elements of our business strategy are as follows:
•Expand our Farming business through organic growth, leasing and strategic acquisitions. We will continue to seek opportunities for organic growth, target attractive acquisition and leasing opportunities and strive to maximize operating synergies and achieve economies of scale in each of our three main Farming business areas (crops, rice and dairy). We believe that the execution risk associated with these projects will not be significant as we are investing in existing operations that are highly efficient. Moreover, our expected results do not rely exclusively on rising commodity prices, which we expect to remain flat.
▪Crops: In February 2019, we acquired a state-of-the-art peanut processing facility strategically located in Córdoba province, Argentina’s largest peanut production area. This plant is equipped with high-performance equipment and comprises a shelling plant, a blanching plant and a seed treatment plant. It has a shelling capacity of 80,000 tons per year, a blanching capacity of 36,000 tons per year, and a storage capacity of 67,000 tons of in-shell peanuts. Moreover, our finished products storage has a capacity of 10,000 tons (4,200 of which are under cold storage). The plant also has a drying capacity of 1,200 tons (at a 14% input moisture). The plant has been granted all necessary certifications and permits, which allow us to satisfy demand in selective global markets that pay a premium for Argentine peanut because of its superior quality. Our increased focus in the segment has allowed us to reduce costs by (i) saving in tolling and brokerage fees, (ii) consolidating and exporting our production from our on-site customs, (iii) reducing operational risks and (iv) having access to land at competitive prices by managing crop rotation ourselves, among others.
▪Rice: We completed investments in the segment that have enabled us to increase productivity at the farm level, improve our rice processing and distribution capabilities, and increase the value of main by-products. Some of our investments in this segment include: (i) the implementation of zero-level technology in over 39,000 hectares, which has considerably reduced water consumption at the farm, and increased yields by providing better germination, uniform irrigation and lower losses during harvest; (ii) the increased use of our own machinery for planting and harvesting activities, which has allowed us to seek optimal harvest timing; and (iii) the installation of an on-site dryer at our Oscuro farm, which added efficiency to our grain storage and handling and reduced
45
transportation and other costs. At the industrial level, we constructed a parboil plant that has allowed us to increase our processing volume and produce a higher-margin product.
Additionally, in May 2022, we acquired Viterra’s rice operations in Argentina and Uruguay, including two rice processing and storage plants in Uruguay and one in Argentina. This transaction contributed to our geographic diversification and hence to mitigate weather risk, in addition to providing further commercial and logistics advantages, such as the incorporation of Uruguayan branded rice, which is known for its high quality, and therefore granting us access to new markets.
▪Dairy: As of December 2022, we had four fully operative free-stall facilities with an occupancy of 14,461 cows. We continue with our strategy of growing and securing corn silage to feed additional cows. As for the biodigester, energy production is stabilized and generating attractive results.
Additionally, since February 2019 we are owners of two milk processing facilities acquired from SanCor Cooperativas Unidas Limitadas. Both plants are well equipped and strategically located. The facility located in the city of Morteros, Province of Córdoba, is at the center of Argentina’s largest dairy basin and has a processing capacity of 870 thousand liters per day aimed at producing powdered milk and cheese, mainly destined to the export market. The facility located in Chivilcoy, in the province of Buenos Aires, is halfway between our dairy free-stall facilities and the city of Buenos Aires, the largest fluid dairy market. The processing capacity of this facility is 555 thousand liters per day aimed at producing mostly fluid milk. These acquisitions are part of our long term growth strategy, consistent with our strategy for our crops, rice, sugar, ethanol, and energy businesses. We believe that being vertically integrated allows us to control the supply chain, which in turn enhances efficiencies and increases margins, and provides us with the flexibility to sell into the export and domestic markets, based on relative profitability with a view to generate attractive returns.
• Consolidate our sugar and ethanol cluster in Mato Grosso do Sul. Our main strategy for our sugar and ethanol business is to consolidate our cluster in the state of Mato Grosso do Sul in Brazil by ramping up production at our Ivinhema and Angelica mills, which have a nominal capacity of 13 million tons per year. See “ —Operations and Principal Activities—Sugar, Ethanol and Energy Business—Our Sugar Mills.” The consolidation of the cluster has generated important synergies, operating efficiencies and economies of scale such as (i) a reduction in the average distance from sugarcane fields to mills, generating important savings in sugarcane transportation expenses; (ii) a single centralized management team, reducing total administration cost per ton of sugarcane milled; and (iii) a large sugarcane plantation supplying two mills, which permits non-stop harvesting. Our sugarcane cluster in Mato Grosso do Sul has allowed us to become one of the most efficient and low cost producers of sugar, ethanol and energy in Brazil. Additionally, we plan to continue to monitor closely the Brazilian sugar and ethanol industries and may pursue selective acquisitions that provide opportunities to increase our economies of scale, operating synergies and profitability.
We remain focused on finding ways to continue maximizing efficiency and generating additional synergies and cost dilution. In this process, our operating teams identified certain bottlenecks in our industrial operations that were removed with minimal investments and allowed us to increase crushing volumes per hour and total capacity per year. In 2021, we inaugurated a molecular sieve at our Ivinhema mill, which increased our ethanol dehydration capacity by 50%. Prior to this investment, the only mill capable of producing anhydrous ethanol was the Angelica mill. This increase in our dehydration capacity serves as a commercial tool at the same time as it enhances the efficiency and sustainability of our operations and increases our production flexibility. Combined with our high ethanol storage capacity, it enables us to carry over stocks and places us in a solid position to benefit from higher expected prices both in the domestic and export markets.
Additionally, we continue developing and adopting technologies to become more efficient sugarcane producers and further reduce our carbon footprint. We developed a proprietary technology to produce biogas from vinasse, a subproduct of the ethanol production process, and we built a biogas unit in our Ivinhema mill. Biogas can be used in the production of renewable energy or converted into biomethane to replace diesel consumption. We use vinasse in a concentrated form as input in a biodigestor where microorganisms act on organic matter and produce biogas. Biogas, in turn, once cleaned and compressed is converted into biomethane which can be used as biofuel in adapted vehicles, such as trucks, lorries and cars. We are optimistic about this project, which enhances the sustainability of our operations, has the potential to create an additional revenue stream and will enable us to replace our diesel consumption. In 2021, we certified our biogas facility as the first renewable gas plant in Brazil, which allows us to issue and sell gas-recs. Concurrently, and independently from its use in biogas production, we also use concentrated vinasse as potassium biofertilizer in our sugarcane plantation.
• Further increase our operating efficiencies while maintaining a diversified portfolio. We intend to continue to focus on improving the efficiency of our operations and maintaining a low-cost structure to increase our profitability and
46
protect our cash flows from commodity price cycle risk. We seek to maintain our low-cost platform by (i) making additional investments in advanced technologies, including those related to agricultural, industrial and logistical processes and information technology, (ii) improving our economies of scale through organic growth, strategic acquisitions, and more efficient production methods, and (iii) fully utilizing our resources to increase our production margins. In addition, we intend to mitigate commodity price cycle risk and minimize our exposure to weather related losses by (a) maintaining a diversified product mix and vertically integrating production of certain commodities and (b) geographically diversifying the locations of our farms.
• Continue to implement our land transformation strategy. We plan to continue to enhance the value of our owned farmland and future land acquisitions by making them suitable for more profitable agricultural activities, thereby seeking to maximize the return on our invested capital in our land assets. In addition, we expect to continue rotating our land portfolio through strategic dispositions of certain properties in order to realize and monetize the transformation and appreciation value created by our land transformation activities. We also plan to leverage our knowledge and experience in land asset- management to identify superior buying and selling opportunities.
Operations and Principal Activities
Farming Business
Our Farming business is divided into three main reportable operating businesses: Crops, Rice and Dairy. We use our own land and land leased from third parties to conduct our operations. During the 2021/2022 harvest year, we used 291,843 hectares of land to conduct our Farming operations, out of which, we owned 112,361 hectares (excluding sugarcane farms), used 36,750 hectares as second harvest areas and leased 142,732 hectares. During the 2020/2021 harvest year, we conducted our Farming operations on 262,110 hectares of land; out of which, we owned 111,009 hectares (excluding sugarcane farms), used 41,924 as second harvest areas and leased 109,178 hectares. During the 2019/2020 harvest year, we used 237,806 hectares of land to conduct our Farming operations, out of which, we owned 105,883 hectares (excluding sugarcane farms), used 34,556 as second harvest areas, and leased 97,367 hectares.
The following tables sets forth our production volumes for each of our farming business lines.
| Harvest Year | ||||||||||||||||||||
| 2021/2022 | 2020/2021 | 2019/2020 | ||||||||||||||||||
| Production | (in tons) | |||||||||||||||||||
| Crops (tons) (1) | 769,524 | 733,334 | 720,059 | |||||||||||||||||
| Rice (tons) (2) | 416,735 | 346,685 | 278,348 | |||||||||||||||||
| Total | 1,186,259 | 1,080,019 | 998,407 | |||||||||||||||||
| Year Ended December 31, | ||||||||||||||||||||
| 2022 | 2021 | 2020 | ||||||||||||||||||
| Dairy (thousands of liters)(3) | 185,583 | 173,148 | 145,192 | |||||||||||||||||
________________________________________________________________________________________________
(1) Crop production does not include 314,000 tons, 300,782 tons, and 226,821 tons of forage produced in the 2021/2022, 2020/2021 and 2019/2020 harvest years, respectively. It also does not include the soybean planted in Brazil in 2021/2022 as cover crop during the implementation of the agricultural technique known as meiosis. Revenues corresponding to the sale of this product are booked in the Sugar, Ethanol and Energy segment.
(2) Expressed in tons of rough rice.
(3) Raw milk produced.
Crops Business (Grains, Oilseeds and Cotton)
Our agricultural production is mainly based on planting, growing and harvesting crops over our owned arable area. During the 2021/2022 harvest year, we planted and harvested crops and forage on approximately 241,192 hectares, including our owned land, leased land and second harvest areas. In mid-2022, we began planting crops pertaining to the 2022/2023 harvest year, which was concluded in the first quarter of 2023, with a total planted area of 220,205 hectares (including forage). Our main products include soybean, corn, wheat, peanut, sunflower and cotton. Other products, such as sorghum and barley, are sown occasionally and represent only a small percentage of total sown land.
47
Our crop production process is directly linked to the geo-climatic conditions of our farms and our crop cycles, which define the periods for planting and harvesting our various products. Our crop diversification and the location of our farms in various regions of South America enable us to implement an efficient planting and harvesting system throughout the year, which includes second harvests in many cases. Our production process begins with the planting of each crop. After harvesting, crops may go through a processing phase where the grains or seeds are cleaned and dried to reach the required market standards. For additional discussion on our harvest years and the presentation of production and product area information in this annual report, see "Presentation of Financial and Other Information—Fiscal Year and Harvest Year."
The following table sets forth, for the harvest years indicated, the planted areas for our main products:
| Harvest Year | ||||||||||||||||||||
| 2021/2022 | 2020/2021 | 2019/2020 | ||||||||||||||||||
| Planted Area | (in hectares) | |||||||||||||||||||
| Soybean (1) | 71,074 | 68,315 | 73,685 | |||||||||||||||||
| Corn (2) | 57,536 | 56,568 | 61,112 | |||||||||||||||||
| Wheat (3) | 46,509 | 44,392 | 32,799 | |||||||||||||||||
| Sunflower | 23,092 | 16,164 | 6,818 | |||||||||||||||||
| Cotton | 7,427 | 3,519 | 4,461 | |||||||||||||||||
| Peanut | 22,102 | 26,123 | 16,814 | |||||||||||||||||
| Forage (4) | 10,206 | 5,337 | 6,758 | |||||||||||||||||
| Others (5) | 3,246 | 2,747 | 574 | |||||||||||||||||
| Total | 241,192 | 223,165 | 203,020 | |||||||||||||||||
________________________________________________________________________________________________
(1) Includes soybean first crop and second crop planted area.
(2) Includes corn first crop and second crop planted area as well as sorghum.
(3) Includes barley crop.
(4) Forage includes corn silage, wheat silage and sorghum used for feeding cattle in our dairy operation.
(5) Includes beans, chia and sesame.
The following table sets forth, for the harvest years indicated, the production volumes for our main products:
| Harvest Year | ||||||||||||||||||||||||||
| 2022/2023 | 2021/2022 | 2020/2021 | 2019/2020 | |||||||||||||||||||||||
Production(1) | (in tons) | |||||||||||||||||||||||||
| Soybeans (2) (3) | 8,079 | 177,963 | 172,969 | 181,259 | ||||||||||||||||||||||
| Corn (2) | 14,178 | 342,621 | 327,164 | 364,176 | ||||||||||||||||||||||
| Wheat | 83,263 | 137,953 | 122,749 | 104,236 | ||||||||||||||||||||||
| Sunflower (2) | 30,241 | 39,054 | 28,436 | 12,652 | ||||||||||||||||||||||
| Cotton lint (2) | 108 | 4,262 | 1,772 | 1,490 | ||||||||||||||||||||||
| Peanut (2) | 964 | 62,433 | 77,891 | 55,630 | ||||||||||||||||||||||
| Others (2) | 591 | 5,238 | 2,353 | 616 | ||||||||||||||||||||||
| Total (2) | 137,424 | 769,524 | 733,334 | 720,059 | ||||||||||||||||||||||
________________________________________________________________________________________________
(1) Crop production does not include 314,000 tons, 300,782 tons and 226,821 tons of forage produced in the 2021/2022, 2020/2021 and 2019/2020 harvest years, respectively.
(2) As of the date of this annual report, the harvest of soybean, corn, peanut, sunflower and cotton pertaining to the 2022/2023 harvest year is ongoing. The only crop that has been fully harvested is wheat.
(3) Does not include the soybean planted in Brazil in 2022/2023, 2021/2022 and 2020/2021 as cover crop during the implementation of the agricultural technique known as meiosis. Revenues corresponding to the sale of this product are booked in the Sugar, Ethanol and Energy segment.
The following table below sets forth, for the years indicated, the sales volume for our main products:
48
| Year Ended December 31, | ||||||||||||||||||||
| 2022 | 2021 | 2020 | ||||||||||||||||||
| Sales | (In thousands of US$) | |||||||||||||||||||
| Soybeans (1) | 72,323 | 56,997 | 44,732 | |||||||||||||||||
| Corn (2) | 72,427 | 57,504 | 45,088 | |||||||||||||||||
Wheat (3) | 23,603 | 27,267 | 15,109 | |||||||||||||||||
| Sunflower | 25,076 | 16,618 | 10,925 | |||||||||||||||||
| Peanut | 63,087 | 60,422 | 46,983 | |||||||||||||||||
| Other crops (4) | 18,684 | 10,086 | 7,277 | |||||||||||||||||
| Adjustments (5) | (2,463) | 11,836 | (1,653) | |||||||||||||||||
| Total | 272,737 | 240,730 | 168,461 | |||||||||||||||||
________________________________________________________________________________________________
(1) Does not include revenue corresponding to the sale of soybean planted in Brazil in 2021/2022 and 2020/2021 as cover crop during the implementation of the agricultural technique known as meiosis. Revenues corresponding to the sale of this product are booked in the Sugar, Ethanol and Energy segment.
(2) Includes sorghum.
(3) Includes barley.
(4) Includes cotton, other crops and farming services.
(5) Refers to the accumulated adjustment of hyperinflation in the accounting translation for our Crops segment sales.
Soybeans
Soybeans are an annual legume widely grown due to their high content of protein (40%) and oil (20%). They have been grown for over 3,000 years in Asia and, more recently, have been successfully cultivated around the world. The world’s top producers of soybeans currently are the United States, Brazil, Argentina, China and India. Soybeans are one of the few plants that provide a complete protein supply as they contain all eight essential amino acids. About 85% of the world’s soybeans are processed, or “crushed,” annually into soybean meal and oil. Approximately, 98% of soybean meal is further processed into animal feed, with the balance used to make soy flour and proteins. Of the oil content, 85% is consumed as edible oil and the rest is used for industrial products such as fatty acids, soaps and biodiesel. We sell our soybeans mainly to crushing and processing industries, which produce soybean oil and soybean meal used in the food, animal feed and biofuel industries.
Soybeans comprised, 5.4%, 5.1% and 5.5% of our total consolidated sales in 2022, 2021 and 2020, respectively.
Corn
Corn is a cereal grown around the world and is one of the world’s most widely consumed foods. The main component of corn grain is starch (72% to 73% of grain weight), followed by proteins (8% to 11%). Corn grain is directly used for food and animal feed (beef, swine and poultry meat production and dairy). Corn is also processed to make food and feed ingredients (such as high fructose corn syrup, corn starch and lysine), or industrial products such as ethanol and polylactic acid (PLA). Oil, flour and sugar are also extracted from corn, with several uses in the food, medicine and cosmetic industries. Additionally, there are specific corn types used for direct human consumption such as popcorn and sweet corn.
Corn comprised 5.4%, 5.1% and 5.5% of our total consolidated sales in 2022, 2021 and 2020, respectively.
Wheat
Wheat is the world’s largest cereal-grass crop. Unlike other cereals, wheat grain contains a high amount of gluten, the protein that provides the elasticity necessary for excellent bread making. Although most wheat is grown for human consumption, other industries use small quantities to produce starch, paste, malt, dextrose, gluten, alcohol, and other products. Inferior and surplus wheat and various milling by products are used for livestock feed. We sell wheat to exporters and to local mills that produce flour for the food industry.
Wheat comprised 1.8%, 2.4% and 1.8% of our total consolidated sales in 2022, 2021 and 2020, respectively.
49
Sunflower
There are two types of sunflower, the most important in terms of volume being the oilseed sunflower, which is primarily grown for the oil extracted from the seed. Sunflower oil is considered one of the top three oils for human consumption, due to its high oil content (39-49%) and its oil composition (90% of oleic and linoleic oil). The other type of sunflower is the confectionary sunflower, which is used for direct human consumption. Sunflower seeds are an exceptional source of vitamin E, omega-6 fatty acids, dietary fiber and minerals. We grow both types of sunflower.
Sunflower comprised 1.9%, 1.5% and 1.3% of our total consolidated sales in 2022, 2021 and 2020, respectively.
Since early 2019, we operate a sunflower processing facility located in Buenos Aires province, Argentina. This enables us to control processing activities and develop direct and long term relationships with different customers around the world.
Peanut
Peanut is a summer legume that has its harvesting process divided in two stages: (1) digging, which implies loosening the plant, cutting the taproot and inverting the plant; and (2) combining, which means separating the pods from the vines. Planting activities begin in October and approximately 150 days after planting, digging activities take place. In Argentina, all peanuts grown are high oleic. Córdoba province is Argentina's largest peanut production area due to its optimal agro-climatic conditions, which have led many processing industries to install there.
Argentina is positioned among the most important players in the production and export of peanuts, with high technological levels both in terms of production as well as processing. Argentina exports more than 90% of the peanuts it produces and its main market is the E.U., followed by Latin America, north of Africa and Asia. Its main competitors are the United States, Brazil and China. We grow peanuts in the center region of Argentina.
Peanut comprised 4.7%, 5.4% and 5.7% of our total consolidated sales in 2022, 2021 and 2020, respectively.
Since early 2019, we own and operate a peanut processing facility equipped with cutting-edge technology. This vertical integration is in line with our strategy to grow our peanut business as it enables us to control processing activities and develop direct and long term relations with different customers around the world.
Forages
We are engaged in the production of forage in Argentina, including corn silage, wheat silage and sorghum silage. We use forage as cow feed in our dairy operation. During the 2021/2022 harvest year, we planted 10,206 hectares of forage and produced 314,000 tons of forage.
Rice Business
Rice is the main food staple for about half of the world’s population. Although it is cultivated in over 100 countries and on almost every continent, 90% of the world’s rice is grown and consumed in Asia. Globally, rice is the most important crop in terms of its contribution to human diets and production value. There are three main types of rice: short grain, medium grain and long grain rice. Each one has a different taste and texture. We produce long grain rice and Carolina double rice, a variety of medium grain rice.
We conduct our rice operation in the northeast of Argentina, which is one of the most efficient locations in the world for producing rice at a low cost. This is a result of optimum natural agronomic conditions, including plentiful sunlight, abundant availability of water for low cost irrigation and large quantities of land. The use of public water for artificial irrigation is governed by provincial regulations and is subject to the granting of governmental permits. We currently have permits for the use of water in our production of rice in the provinces of Corrientes and Santa Fe. Maintenance of our permits is subject to our compliance with applicable laws and regulations, which is supervised by the corresponding governmental authority (e.g., the Ministry of Water, Public Services and Environment - Ministerio de Agua, Servicios Publicos y Medio Ambiente), in the province of Santa Fe, and the Water Institute of the Province of Corrientes (Instituto Correntino del Agua).
In 2022, we expanded our rice footprint to Uruguay by acquiring the rice operations of certain subsidiaries of Viterra. Similar to Argentina, Uruguay also benefits from optimum natural agronomic conditions to produce rice. As a result, Uruguay is also considered one of the most efficient locations in the world for producing rice at a low cost. The production of rice in
50
Uruguay is mostly concentrated in the southeastern region of the country given its close distance to the Montevideo seaport. Industry participants source rice from third-party producers, with whom they have long-term relationships and who many times their activities. The price paid for paddy rice is annually set forth by agreements between farmers and industry participants. Those agreements establish fixed margins for the industry and take into account average export prices. Given that sales price plays a key role in determining the cost of paddy rice, participants agree on offering similar prices and achieve synergies in sharing freight costs.
The following table sets forth, for the harvest years indicated, the total number of rice-planted hectares we owned and leased, as well as the overall rough rice we produced:
| Harvest Year | ||||||||||||||||||||||||||
| Rice Product Area and Production | 2022/2023 | 2021/2022 (2) | 2020/2021 | 2019/2020 | ||||||||||||||||||||||
| Owned planted area (hectares) | 39,817 | 43,013 | 40,444 | 39,162 | ||||||||||||||||||||||
| Leased planted area (hectares) | 15,831 | 17,844 | 3,839 | 2,382 | ||||||||||||||||||||||
| Total rice planted (hectares) | 55,648 | 60,857 | 44,282 | 41,544 | ||||||||||||||||||||||
Rough rice production (tons) (1) | 331,289 | 416,735 | 346,685 | 278,348 | ||||||||||||||||||||||
(1) As of the date of this annual report, the harvest of rice pertaining to the 2022/2023 harvest year is ongoing.
(2) Figures differ from previously disclosed ones as it includes rice planted and harvested related to the acquisition of Viterra’s rice operations concluded in May 2022.
We grow rice in four farms owned by us, which are located in Argentina, whereas the rest is through leased farms located in Argentina and in Uruguay. In the ongoing 2022/2023 harvest year, we have planted approximately 55,648 hectares of rice, which have not been fully harvested as of the date of this annual report. In the 2021/2022 harvest year, we planted approximately 60,857 hectares and produced 416,735 tons of rice, which represented 20.0% of our total planted area and 35.0% of our total farming production. In the 2020/2021 harvest year, we planted approximately 44,282 hectares and produced 346,685 tons of rice, which represented 17.0% of our total planted area and 32.0% of our total farming production. In the 2019/2020 harvest year, we planted approximately 41,544 hectares and produced 278,348 tons of rice, which represented 17.0% of our total planted area and 28.0% of our total farming production .
Rice comprised 15.1%, 12.0% and 12.5% of our total consolidated sales in 2022, 2021 and 2020, respectively.
Rice Production Process
Rice production cycle lasts approximately five to six months, beginning in September of each year and ending in April of the following year. Rice planting continues until November, followed by treatment of the rice, which lasts approximately three months, until January. Our harvest begins in February and lasts until April. After harvesting, the rice is ready for processing.
We process rice in our four rice mills in Argentina and two rice mills in Uruguay, where we are able to process our entire rice crop and utilize our excess milling capacity to process rough rice we purchase from third party growers.
At the mill, we clean the rice to remove all impurities. We then put it through a dryer to remove excess moisture from the grains. Proper drying results in increased storage life, prevents deterioration in quality and leads to optimum milling. Once dried, the rice grain, now known as rough rice or paddy rice, is ready for storage. We store rice in elevators or in silo bags until milling. During the milling process, the rough rice goes through a dehusking machine that removes the husk from the kernel. The rice that is obtained after this process is known as brown rice and is ready for human consumption. Brown rice becomes white rice after it is polished to remove the excess bran.
The main objective of the milling process is to remove the husk and the bran, preserving the quality of the whole grain. Although the process is highly automated and uses advanced technology, some rice grains are broken in the process. The percentage of broken rice depends on a number of factors such as the crop development cycle at the farm, the variety of the grain, the handling and the industrial process. Average processing of rough rice results in 58.5% white rice, 13.0% broken rice, 20.0% rice husk and 8.5% bran rice, which is sold for use as cattle feed or floor bedding in the poultry business.
51
| Year Ended December 31, | ||||||||||||||||||||
| 2022 | 2021 | 2020 | ||||||||||||||||||
| Processed Rice Production | (in tons) | |||||||||||||||||||
| Rough rice processed — own | 375,688 | 306,602 | 263,637 | |||||||||||||||||
| Rough rice processed — third party | 20,993 | 12,130 | 26,393 | |||||||||||||||||
| Total rough rice processed | 396,681 | 318,732 | 290,030 | |||||||||||||||||
| Year Ended December 31, | ||||||||||||||||||||
| 2022 | 2021 | 2020 | ||||||||||||||||||
| Processed Rice Sales | (in thousands of $) | |||||||||||||||||||
| Total Sales | 203,489 | 134,869 | 101,862 | |||||||||||||||||
Rice comprised 15.1%, 12.0% and 12.5% of our total consolidated sales in 2022, 2021 and 2020, respectively.
Rice Seed Production
In our rice seed facility in Argentina, we are involved in the genetic development of new rice varieties adapted to local conditions to increase rice productivity and quality, to improve both farm production as well as the manufacturing process. In connection with these efforts, we have entered into agreements with selected research and development institutions such as the National Institute of Agriculture Technology (Instituto Nacional de Tecnología Agropecuaria, or “INTA”) in Argentina, the Instituto Riograndense do Arroz or “IRGA” in Brazil, the Híbridos de Arroz para América Latina or “HIAA” in Colombia, the Latin American Fund for Irrigated Rice (Fondo Latinoamericano para Arroz de Riego, or “FLAR”) in Colombia, the Santa Catarina State Agricultural Research and Rural Extension Agency (Empresa de pesquisa Agropecuária e Extensão Rural de Santa Catarina, or “EPAGRI”) in Brazil, Badische Anilin- und Soda-Fabrik (“BASF”) in Germany, Louisiana State University or ”LSU” in United States, Bioherius in Argentina, Transactiva in Italy and the Universidad Nacional del Nordeste or “UNNE” in Argentina. Our own technical team is continuously testing and developing new rice varieties. Our first rice seed variety, Ita Caabo 105, was released to the market in 2008. In 2011 we released our second variety Ita Caabo 110, and at the beginning of 2014 we released our third variety, Ita Caabo 107. Furthermore, we released two new varieties, Ita Caabo 111 FL and Ita Caabo 109 in 2021 and 2022, respectively. We are currently experimenting with a wide range of varieties to continue improving our productivity in addition to the development of a hybrid line. These seeds are both used at our farms and sold to rice farmers in Argentina, Brazil, Uruguay and Paraguay. We are also developing, alongside BASF, a herbicide-tolerant rice variety to assist in the control of harmful weeds.
Dairy Business
We conduct our dairy operation in our farms located in the Argentine humid pampas region. This region is one of the best places in the world for producing raw milk at a low cost, due to the availability of grains and forages produced efficiently and at low cost, and due to the favorable weather for cow comfort and productivity. Our dairy operation consists of four free-stall dairy facilities, operating at full capacity, with an occupancy of 14,461 milking cows as of December 2022. In addition, we own two facilities where we process our raw milk, as well as third parties’ milk and sell our products to the domestic and export markets.
The following table sets forth, for the periods indicated below, the total number of our dairy cows, average daily milk production per cow and our total milk production at the farm level:
| Year Ended December 31, | ||||||||||||||||||||
| Dairy Herd & Production | 2022 | 2021 | 2020 | |||||||||||||||||
Total dairy herd (head) (1) | 14,461 | 13,742 | 11,477 | |||||||||||||||||
Average milking cows (2) | 14,415 | 12,942 | 10,876 | |||||||||||||||||
Average daily production (liters per cow) (2) | 35.3 | 36.7 | 36.5 | |||||||||||||||||
| Total production (thousands of liters) | 185,583 | 173,148 | 145,192 | |||||||||||||||||
(1) As of December.
(2) Annual average.
52
| Year Ended December 31 | ||||||||||||||||||||
| Dairy Sales | 2022 | 2021 | 2020 | |||||||||||||||||
| (In thousands of $) | ||||||||||||||||||||
| Sales | 235,012 | 183,054 | 133,474 | |||||||||||||||||
Dairy comprised 17.4%, 16.3% and 16.3% of our total consolidated sales in 2022, 2021 and 2020, respectively.
Our four free-stall dairy facilities are fully ramped up and are delivering high productivity levels. In 2020, we began the construction of our fourth free-stall facility, which was finalized in February 2021 and increased our capacity to over 14,000 milking cows. We believe this investment was a unique opportunity to leverage Argentina’s competitive advantages in transforming vegetable protein into milk protein, our operational expertise, and the positive outlook for global and local milk prices.
We own two milk processing facilities acquired from SanCor Cooperativas Unidas Limitadas in February 2019, in addition to the Las Tres Niñas and Angelita trademarks, both of which are well-known in Argentina and represent a solid sales vehicle for retail and consumer dairy products. Our milk facilities produce UHT milk and cream, powdered milk, and semi-hard cheese, among others. Our facilities have a total installed reception capacity of 2.4 million liters per day and an installed processing capacity of over 1.4 million liters of raw milk per day. To account for the difference between total installed capacity and actual utilization, we must account for the efficiency rate of our machines, maintenance works, number of working days and number of personnel shifts, among other variables. In 2022, we processed 359.4 million liters of raw milk in aggregate.
Our Chivilcoy industrial facility is located in the city of Chivilcoy, in the province of Buenos Aires, and is primarily focused on fluid milk production for the domestic market. It has an installed processing capacity of 555,000 liters per day and an installed milk reception capacity of 1.2 million liters per day. The facility has an installed processing capacity of 510,000 liters of UHT milk and 45,000 liters of yogurt, cream and cocoa flavored milk. In 2022, we processed 121.3 million liters of raw milk at the Chivilcoy facility.
Our Morteros industrial facility is located in the city of Morteros, in the province of Córdoba, and produces powdered milk and semi-hard cheese primarily for the export market. Morteros plant has an installed processing capacity of 870,000 liters per day (550,000 liters for milk powdered and 320,000 liters for cheese), and it has an installed milk reception capacity of 1.2 million liters per day. In 2022, we processed 238.1 million liters of raw milk at the Morteros facility. Additionally, in 2022, we renewed our cheese production line by increasing its installed processing capacity from 290,000 liters to 320,000 liters. Hence, this will enhance our cheese production and contribute to accessing new markets and clients through the production of other types of semi-hard and hard cheeses, while simultaneously decreasing the amount of waste generated throughout the entire production process significantly.
Dairy Production Process
We wean calves during the 24 hours subsequent to birth and during the next 60 days raise them on pasteurized milk and high protein meal. Male calves are fed concentrates and hay for an additional three months in the farm before they are sent to our feedlot or to third party feedlots to be fattened for sale. Young heifers remain in open corrals during the next 13 months where they are fed with concentrates and forage until they are ready for breeding. Calving occurs nine months later. Heifers are subsequently milked for an average of 320 days. Dairy cows are once again inseminated during the 42 to 90-day period following calving. This process is repeated once a year for a period of three or four years. The pregnancy rate for our herd is between 85% and 90% per year.
Each cow in our dairy herd is mechanically milked three times a day. The milk obtained is cooled to less than four degrees centigrade in order to preserve its quality and is then stored in a tank, or directly loaded to trucks which derives in increased quality and lower costs. Milk is delivered mainly to our processing facilities and the balance is sold to large third party milk processing facilities on a daily basis by tank trucks. We feed our dairy cows mainly with corn and alfalfa silages, some grass and corn grain, supplemented as needed with soybean by-products, hay, vitamins and minerals.
We have invested in technology to improve the genetics of our cows, animal health and feeding in order to enhance our milk production. These investments include top quality imported semen from genetically improved North American Holstein bulls, agricultural machinery and devices, use of dietary supplements and modern equipment to control individual milk production and cooling. Our feeding program is focused on high conversion of feed into milk, while maintaining cows in good health and comfort. We have also invested in technology and know-how so as to increase our forage production and utilization.
53
Implementation of the free-stall system allows us to position ourselves as a key player in the dairy industry and boost our agricultural and industrial integration presence in the South American agricultural sector. By eliminating cow grazing, we reduced the amount of land utilized for milk production, which freed up more land for our agricultural and land development activities. Cow productivity (measured in liters of milk produced per day) using the free-stall system increases by up to 40% compared to traditional grazing systems. These productivity gains are because the free-stall system significantly improves the conversion rate of animal feed to milk, resulting in the production of 1.4 liters of milk for each kg of animal feed as compared to the average of one liter of milk for each kg of feed associated with the usual grazing model.
This increased productivity and conversion rate are primarily due to improved cow comfort and an enhanced diet quality. We assess cow comfort through the engagement of expert consultants, who recommended designing beds covered with sand. The sand plays a significant role in helping cows to rest comfortably. Additionally, we installed a cooling system to increase cow comfort as well. This system relies on water sprinklers and ventilation fans located all over the facility to create a controlled, cool atmosphere, which improves cow comfort as the Holstein herd is originally adapted to cold regions. Additionally, we manage diet quality by adapting our feeding regime based on the various feeding stages in the lifetime of each cow. The actual feeding is fully mechanized, and we carefully control the harvesting and storage of feed. The control of all productivity variables, such as reproduction, health and operations, supports efficiency gains through standardized processes. Finally, the physical concentration of the animals facilitates efficient overall management of the Dairy business as a whole. In terms of the environment, the free-stall model allows for a better effluent treatment, which includes a sand-manure separator stage, a decantation pool and an anaerobic lagoon. All these processes help to decrease the organic matter content of the effluent and deliver a cleaner output. The final treated effluent is used to fertigate crops adjacent to the dairy operation. Accordingly, we transform dairy waste into a high value-added by-product, which reduces fertilizer usage.
During October 2017, we completed the construction of our first biodigester. This facility enhances the sustainability of our free-stall dairy operation by reducing greenhouse gas emissions, improving the effluent management and concentrating valuable nutrients which are applied back to the fields. It generates electricity by burning biogas extracted from the effluents produced by our milking cows. On November 3, 2017, we began generating and delivering 1.4 MW of electricity to the local power grid. In 2022, we began the construction of our second biodigester, which will generate and deliver 2 MW of electricity to the local grid once completed. In addition to enhancing the sustainability of our diary operations, we expect our new biodigester to increase revenue and satisfy both our energy requirements as well as those of nearby communities.
All Other Segments
All Other Segments primarily encompass our cattle business. Our cattle segment consists of pasture land that is not suitable for crop production due to soil quality and is leased to third parties for cattle grazing activities.
We currently own 59,963 hectares of cattle grazing land located in the Argentine provinces of Corrientes, Santa Fe, Formosa and Santiago del Estero. In 2022, we entered into new lease agreements with third-party cattle farmers for a total area of 16,919 hectares.
Storage and Conditioning for the Farming Business
Our storage and conditioning facilities in the Farming business allow us to condition, store and deliver our products with no third-party involvement. All our crop storage facilities are located close to our farms, allowing us to (i) reduce storage and conditioning costs; (ii) reduce freight costs since we only commence moving the product once the final destination is determined, whether locally or to a port; (iii) capitalize on fluctuations in the prices of commodities; and (iv) improve commercial performance by mixing grains to avoid discounts due to substandard quality.
We own two conditioning and storage facilities for grains and oilseeds, with a total built storage capacity of 37,000 tons. One of our facilities has a capacity of 12,500 tons and is located in the province of Santa Fe, Argentina, in the town of Christophersen. It has a railway loading terminal, providing logistical flexibility and savings. Our other facility has a capacity of 24,500 tons and is located in Buenos Aires province close to Bahía Blanca’s deep water port, in an area where we produce 120,000 tons of grains. In addition, our peanut processing facility has the capacity to store 10,000 tons of finished product (and 67,000 of in-shell product), while our sunflower processing facility has the capacity to store 11,420 tons of sunflower, out of which 7,500 tons are stored in leased silo bags. We also own four rice mills in Argentina and two rice mills in Uruguay, which account for 239,500 tons of total storage capacity. Moreover, we have three additional conditioning facilities for rice handling, with a total storage capacity of 60,000 tons.
The table below sets forth our storage capacity as of December 31, 2022:
54
| Storage Capacity | Nominal | |||||||
| Crops (tons) (1) | 58,420 | |||||||
| Rice (tons) | 299,500 | |||||||
| Dairy (liters) (2) | 27,800,000 | |||||||
(1) Includes 37,000 tons corresponding to our two conditioning and storage facilities, 10,000 tons to our peanut facility and 11,420 tons to our sunflower facility.
(2) Morteros facility accounts for 24.3 million liters of fluid milk (equivalent to 2,500 tons of milk powder and 360 tons of cheese) while Chivilcoy accounts for 3.5 million liters of fluid milk.
In addition, we use silo bags to increase our storage capacity at a low cost. Silo bags are an efficient low-cost method for grain storage. As crops are harvested, they are placed inside large polyethylene bags that can be left in the fields for approximately 12 months without damaging the grain. Each silo bag can hold up to 180 to 200 tons of product, depending on the type of grain.
Silo bags offer important operational and logistic advantages, such as (i) low cost storage; (ii) flexible and scalable capacity that is adapted based on production and commercial strategy; (iii) harvest efficiencies since the bags are filled on the field allowing for a non-stop harvest operation regardless of any logistical setbacks; (iv) logistic efficiencies leading to lower freight since grains are transported during the off-season when truck fares are lower; (v) increased ability to monitor quality and identify different grain qualities, since grains are stored in relatively small amounts (200 tons) and easily monitored, maximizing our commercial performance; and (vi) better use of our drying capacity throughout the year. Silo bags are commercially accepted. Grains stored in silo bags can be sold in the market, and if such grains are to be delivered post-harvest, we charge storage costs. Additionally, we can store grains to be used as seed during the following season (soybeans, rice and wheat), achieving quality seed management. We have expanded the use of silo bags from Argentina to our operations in Brazil and Uruguay.
Grain conditioning facilities at our farms allow our trade desk to optimize commercialization costs and to achieve commercial quality standards and avoid price discounts. These facilities are operated to dry, clean, mix and separate different qualities of each grain in order to achieve commercial standards. By mixing different batches of a same grain type, differentiated by quality parameters such as moisture, percentage broken, and percentage damaged, among others, we can achieve commercial standards without having to discount a lower-quality stand-alone batch. Efficient management of these facilities results in a lower cost for grain conditioning and a better achievable price.
The table below sets forth our drying capacity as of December 31, 2022:
| Drying Capacity | Nominal | |||||||
| Crops (tons/day) (1) | 9,925 | |||||||
| Rice (tons/day) | 12,600 | |||||||
(1) Includes the drying capacity corresponding to our two grain conditioning and storage facilities, our peanut processing facility and our sunflower processing facility.
Some grains such as soybeans, wheat and rice, can be used for seed during the next planting season. We produce almost 78.5% of the seed used for planting these crops in our fields. The seed is stored in silo bags and/or grain facilities, where it can be processed, classified, and prepared for planting during next crop season. A deep survey and monitoring process is carried out in order to evaluate, control and deliver high quality seed to our farms.
The rest of our seed requirements are purchased from seed suppliers in order to incorporate new enhanced varieties into our planting plan.
Marketing, Sales and Distribution for the Farming Business
Crops
In Argentina, grain prices are based on the market prices quoted on Argentine grain exchanges, such as the Buenos Aires Grain Exchange (Bolsa de Cereales de Buenos Aires) and the Rosario Grain Exchange (Bolsa de Cereales de Rosario),
55
which use as a reference the prevailing prices in international grain exchanges (including CBOT and ICE-NY). In Uruguay, local prices are based on an export parity (during harvest) or import parity in the case of post-harvest sales, which, in each case, take into account the prices and costs associated with each market. In Brazil, the grain market includes the Brazilian Grain Exchange (Bolsa de Mercadorias e Futuros), which, as in Argentina, uses as a price reference the international grain exchanges (including CBOT and ICE-NY). Prices are quoted in relation to the month of delivery and the port in which the product is to be delivered. Different conditions in price, such as terms of storage and shipment, are negotiated between us and the end buyer. We negotiate sales with the top traders and industrial companies in our markets. We also engage in hedging positions by buying and selling futures and options in commodities exchanges, including the Chicago Board of Trade, the New York Board of Trade, the B3, and the Mercado a Término de Buenos Aires (MATBA).
Soybeans
Our soybean crop is sold to local companies and is ultimately exported or diverted to the crushing industry. Approximately 22% of the soybean crop was hedged pre-harvest, by forward sales and sales in the futures markets. Harvest and post-harvest sales are a function of the export market versus local premiums paid by crushers (oil, meal and biodiesel) and logistics considerations. Our six largest customers accounted for approximately 83% of our sales in the year ended December 31, 2022.
Corn
Our production is mainly destined to the export market. Our ten largest customers comprised approximately 83% of our sales in the year ended December 31, 2022.
Wheat
Our wheat production is mainly destined to export industry. Quality segregation allows us to negotiate premiums with the millers and export market. Brazil is the main importer of Argentine wheat. Our five largest customers comprised approximately 68% of our sales in the year ended December 31, 2022.
Sunflower
Our sunflower production from Argentina is sold to local companies. Our five largest customers comprised 87% of our sales in the year ended December 31, 2022.
Peanut
Approximately 95% of our peanut production is exported. Our 10 largest customers comprised approximately 65% of our sales in the year ended December 31, 2022, while the European Union was the destination for over 85% of our sales.
Cotton
We typically make pre-harvest sales of cotton fiber produced in Argentina into the export market. Sales for the textile industry are based on domestic demand and premiums. Our two largest customers comprised approximately 100% of our sales in the year ended December 31, 2022. Cotton seed is sold in the domestic market to meet feed demand.
Customers
We sell manufactured and agricultural products to a large base of customers. The type and class of customers may differ depending on our business segments, regions and some logistics issues that are very important in our decision making. In the year ended December 31, 2022, more than 90% of our sales of crops were sold to 15 well-known customers, both international and local. Of these customers, the first five cases represented almost 60% of our sales and the following five customers represented approximately 20% of our net sales in 2022.
Rice
Rough rice is available for sale commencing after the harvest of each year. White rice availability is based on our milling capacity. 84% of our total rice production is sold into the export market, with the remainder sold in Argentina in the retail market. We export approximately 43% of our exported volume to the European Union, 21% to Brazil, 10% to Mexico; and the balance to Chile, the Middle East and other Central American countries. We sell approximately 13% of our rice in the
56
Argentine retail market through three brands, which collectively have a 15.3% market share. Local rice prices are driven by regional supply demand and other world export prices. Our eight largest customers for rice in the retail market accounted for approximately 62% of our sales in the year ended December 31, 2022.
Dairy
In 2022, 70% of our raw milk production was destined to our processing facilities, while the majority of the balance was sold to a single dairy producer. We negotiate the price of raw milk on a monthly basis in accordance with domestic supply and demand. The price of the milk we sell is mainly based on the percentage of fat and protein that it contains and the temperature at which it is cooled. The price of milk also rises or falls based on the content of bacteria and somatic cells. We are one of the top 10 dairy processors in Argentina, considering our free-stall production of over 500,000 liters per day and the raw milk we source from 139 farmers (133 in Morteros and 6 in Chivilcoy).
Sugar, Ethanol and Energy Business
The following table sets forth a breakdown of our production volumes by product for the years indicated in our Sugar, Ethanol and Energy business:
| Year Ended December 31, | ||||||||||||||||||||
| 2022 | 2021 | 2020 | ||||||||||||||||||
Sugar (tons) (1) | 481,919 | 546,819 | 646,981 | |||||||||||||||||
| Ethanol (cubic meters) | 540,231 | 534,603 | 502,170 | |||||||||||||||||
| Energy (MWh exported) | 608,964 | 730,739 | 717,915 | |||||||||||||||||
(1) Includes 3,701 tons of organic sugar in 2022, 4,145 tons in 2021 and 8,659 tons in 2020.
The following table sets forth our sales for each of the sugarcane by-products we produce for the years indicated:
| Year Ended December 31, | ||||||||||||||||||||
| 2022 | 2021 | 2020 | ||||||||||||||||||
| (In thousands of $) | ||||||||||||||||||||
| Sugar | 188,769 | 208,365 | 171,102 | |||||||||||||||||
| Ethanol | 387,124 | 291,883 | 199,062 | |||||||||||||||||
| Energy | 33,060 | 48,017 | 41,169 | |||||||||||||||||
| Other | 21,807 | 13,745 | 126 | |||||||||||||||||
| Total | 630,760 | 562,010 | 411,459 | |||||||||||||||||
Sugarcane
Sugarcane is a tropical grass that grows best in locations with stable, warm temperatures and high humidity, although cold and dry winters are an important factor for the sucrose concentration of sugarcane. The climate and topography of the center-south region of Brazil is ideal for the cultivation of sugarcane and accounts for approximately 85% of Brazil's sugarcane production. Sugarcane is the most efficient agricultural raw material used in the production of sugar and ethanol. Ethanol produced from sugarcane is highly regarded as an environmentally friendly biofuel with the following characteristics.
Renewable: Sugarcane ethanol, unlike coal or oil, which can be depleted, is produced from sugarcane plants that grow back year after year, provided that they are replanted every five to seven years.
Sustainable: Sugarcane only needs to be replanted every five to seven years, as a semi-perennial crop. It can be harvested without uprooting the plant, and therefore its cultivation has less of an impact on the soil and the surrounding environment. The mechanization of the harvesting and planting process further improves sustainable agricultural management.
Energy Efficient: Sugarcane is highly efficient in converting sunlight, water and carbon dioxide into stored energy. The energy output of sugarcane is equal to nine times the energy input used in the production process, whereas the energy output of corn ethanol is only about 1.9 to 2.3 times the energy input used in its production process. Sugarcane produces seven times more energy compared to corn used for ethanol production.
57
Low Carbon Emissions: Compared to gasoline, sugarcane ethanol reduces greenhouse gases by more than 61.0%, which is the greatest reduction of any other liquid biofuel produced today in large quantities. Ethanol made from sugarcane is deemed an advanced biofuel by the United States EPA.
Synergies: The main raw material used in the production of electricity in sugar mills is bagasse, which is a by-product of the sugarcane milling process, allowing for a renewable source of co-generated electricity.
As of December 31, 2022, our sugarcane plantations consisted of 192,987 hectares of sugarcane planted in Minas Gerais and Mato Grosso do Sul in Brazil. Approximately 93.3% of our sugarcane is planted over land leased through agricultural partnerships. Under these agreements, our partners lease land to us for periods of between one and two sugarcane cycles, equivalent to periods of seven to 14 years, on which we cultivate the sugarcane. Lease payments are based on the market value of the sugarcane set forth by the regulations of the State of São Paulo Sugarcane, Sugar and Alcohol Growers Council (Conselho dos Produtores de Cana-de-Açúcar, Açúcar e Álcool do Estado de São Paulo) or “Consecana”. We planted and harvested approximately 96% of the total sugarcane we milled during 2022, with the remaining 4% purchased directly from third parties at prices also determined by the Consecana system, based on the sucrose content of the cane and the prices of sugar and ethanol. The following table sets forth a breakdown during the time periods indicated of the amount of sugarcane we milled that was grown on our owned and leased land or purchased from third parties:
| Year Ended December 31, | ||||||||||||||||||||
| 2022 | 2021 | 2020 | ||||||||||||||||||
| (In tons) | ||||||||||||||||||||
| Grown on our owned and leased land | 10,117,148 | 10,479,720 | 10,464,893 | |||||||||||||||||
| Purchased from third parties | 367,740 | 460,587 | 638,307 | |||||||||||||||||
| Total | 10,484,888 | 10,940,307 | 11,103,200 | |||||||||||||||||
Sugarcane Harvesting Cycle
The annual sugarcane harvesting period in the center-south region of Brazil begins in April and ends in November/December of each year. In Mato Grosso do Sul, where our cluster is located, the weather pattern is less seasonal than in Sao Paulo. Our wet season is dryer and our dry season is more humid than traditional sugarcane regions. As a consequence of this weather pattern, the sugar content, measured by the total recoverable sugar, or “TRS”, gap between the beginning and the end of the year compared to the peak of the harvest is much smaller than in São Paulo. This allows us to grow and harvest sugarcane year-round with a minimal impact on TRS.
Since the beginning of the 2016/2017 harvest year, we implemented a “non-stop” or “continuous” harvest. This means that we will harvest and crush sugarcane year-round, without stopping during the traditional off-season. This strategy allows us to increase annual sugarcane milling and sugar, ethanol and energy production by approximately 10%. Another benefit of the system is that we produce ethanol in the off-season, when market prices usually have a high premium to prices at harvest. In addition, cogeneration efficiency is related to harvested volumes and unrelated to TRS, enabling us to utilize our cogeneration potential during the whole year. Considering that approximately 87% of total costs are fixed, this model has resulted not only in higher revenues but also in the dilution of our fixed costs.
We plant several sugarcane varieties, depending on the quality of the soil, the local microclimate and the estimated date of harvest of such area. Once planted, sugarcane can be harvested, once a year, up to six to eight consecutive years. With each subsequent harvest, agricultural yields decrease. The plantations must be carefully managed and treated during the year in order to continue to attain sugar yields similar to a newly-planted crop.
We believe we own one of the most mechanized harvesting operations in Brazil. Our sugarcane harvesting process is currently 99.6% mechanized (100% at the Angélica and Ivinhema mills and 95.0% at the UMA mill) and the remaining 0.4% is harvested manually. Mechanized harvesting does not require burning prior to harvesting, significantly reducing environmental impact when compared to manual harvesting. In addition, the leaves that remain on the fields after the sugarcane has been harvested mechanically create a protective cover for the soil, reducing evaporation and protecting it from sunlight and erosion. This protective cover of leaves decomposes into organic material over time, which increases the fertility of the soil. Mechanized harvesting is more time efficient and has lower costs when compared to manual harvesting. Sugarcane is ready for harvesting when the crop’s sucrose content is at its highest level. Sucrose content and sugarcane yield (tons of cane per hectare) are important measures of productivity for our harvesting operations. Geographical factors, such as soil quality, topography and climate, as well as agricultural techniques that we implement, affect our productivity. Since most sugar mills produce both
58
sugar and ethanol in variable mixes, the industry has adopted a conversion index for measuring sugar and ethanol production capacity, the TRS index, which measures the amount of kilograms of sugar per ton of sugarcane.
During the 2022 harvest, our mills harvested sugarcane with an average TRS content of 131 kg/ton and an average yield of 67 tons of sugarcane per hectare, compared to 128 kg/ton and 69 tons per hectare in 2021, respectively.
Once sugarcane is harvested, it is transported to our mills for inspection and weighing. We utilize our own trucks and trailers for transportation purposes. The average transportation distance from the sugarcane fields to the mills is approximately 30 kilometers at the UMA mill and 33 kilometers at the Angélica and Ivinhema mills.
Our Sugar Mills
We currently own three sugar mills in Brazil—UMA, Angélica and Ivinhema. Our mills produce sugar, ethanol and energy, and have the flexibility to adjust the production mix between sugar and ethanol, to take advantage of more favorable market demand and prices at given points in time. As of December 31, 2022, our mills had a total installed crushing capacity of 14.2 million tons of sugarcane, of which 13.0 million tons correspond to our sugarcane cluster in Mato Grosso do Sul. As of December 31, 2022, we concluded the 2022 harvest crushing an aggregate volume of 10.5 million tons of sugarcane.
The UMA mill is located in the state of Minas Gerais, Brazil, and has a sugarcane crushing capacity of 1.2 million tons per year, full cogeneration capacity and an associated sugar brand with strong presence in the regional retail market (Açúcar Monte Alegre). UMA is also engaged in the production of organic sugar and, in 2020, it exported product for the first time, after having received the necessary certification to export organic sugar to the E.U. We plant and harvest 98.5% of the sugarcane milled at UMA, with the remaining 1.5% acquired from third parties. UMA concluded its harvest operations for the 2022 season crushing 783,239 tons of sugarcane.
Angélica is an advanced mill, completed in 2010 and located in the state of Mato Grosso do Sul, Brazil, with a total sugarcane crushing capacity of 5.6 million tons per year. The mill is equipped with two modern high pressure boilers and three turbo-generators with the capacity to generate approximately 105 MW of electricity through the use of sugarcane bagasse. The energy produced through this process is used to power the mill with an excess of 70 MW available for sale to the power grid. Angélica has the flexibility to vary production between ethanol and sugar from 60% to 40% for either product.
Our third mill, Ivinhema, is located in the state of Mato Grosso do Sul, approximately 45 kilometers south of the Angelica mill. Ivinhema has a total sugarcane crushing capacity of 7.4 million tons per year. The mill is equipped with state-of-the-art technology including full cogeneration capacity, flexibility to produce sugar and ethanol and fully mechanized agricultural operations. Ivinhema has capacity to produce up to 307,447 tons of sugar, 307,447 cubic meters of ethanol and 612,000 MWh of energy exports.
Our Main Products
Sugar
As of December 31, 2022, our sugar production capacity was approximately 3,550 tons per day, which, in a normal year of 13,865 hours of milling, results in an annual sugar maximum production capacity of over 723,145 tons of sugar.
We produce three types of sugar: organic sugar, very high polarization, or “VHP” sugar, standard raw sugar and white crystal sugar. VHP sugar, a raw sugar with a minimum polarization of 99.00 degrees and a maximum polarization of 99.49 degrees of sucrose content, is similar to the type of sugar traded in major commodities exchanges, including the standard NY11 contract. The main difference between VHP sugar and NY11 raw sugar is the sugar content of VHP sugar, and it therefore commands a price premium over NY11 raw sugar. Crystal sugar is a non-refined white sugar (color 150 ICUMSA) produced directly from sugarcane juice.
Sugar sales comprised 14.0%, 18.5% and 20.9% of our total consolidated sales in 2022, 2021 and 2020, respectively.
Sugar Production Process
There are essentially five steps in the sugar manufacturing process. First, we crush the sugarcane to extract the sugarcane juice. We then treat the juice to remove impurities. The residue is used to make an organic compost used as fertilizer
59
in our sugarcane fields. The juice is then boiled until the sugar crystallizes, and sugar is then separated from the molasses (glucose which does not crystallize) by centrifugation. The resulting sugar is dried and sent to storage and/or packaging. We use the molasses in our production of ethanol.
On average, one metric ton of sugarcane contains 140 kilograms of TRS. While a mill can produce either sugar or ethanol, the TRS input requirements differ between these two products. On average, 1.045 kilograms of TRS equivalent are required to produce 1.0 kilogram of sugar, while the amount of TRS required to produce one liter of ethanol is 1.691 kilograms.
Ethanol
As of December 2022, our ethanol production capacity was approximately 3,350 cubic meters per day which, in a normal year of 13,865 hours of milling, results in maximum annual production capacity of over 692,953 cubic meters of ethanol.
We produce and sell two different types of ethanol: hydrous ethanol and anhydrous ethanol, as further described in the section below.
Ethanol sales comprised 28.7%, 26.0% and 24.3% of our total consolidated sales in 2022, 2021 and 2020, respectively.
Since 2020, as part of the RenovaBio program, every time we sell ethanol we have the right to issue and sell carbon credits, which are traded on Brazil’s B3 platform. The number of carbon credits that are issued are determined by the score granted by the National Agency of Petroleum, Natural Gas & Biofuels (ANP) based on how “green” the mill operation is deemed to be. During 2022, we sold 550.8 thousand CBios at an average price of R$89.10 CBio (average net price of US$17.62 per CBio). Please see “Our Company- 2. Sugar, Ethanol and Energy Business” above.
Ethanol Production Process
Ethanol is produced through the fermentation of sugarcane juice or diluted molasses. Initially, we process the sugarcane used in ethanol production the same way that we process it for sugar production. The molasses resulting from this process is mixed with clear juice and then with yeast in fermentation vats, and the resulting wine has an ethanol content of approximately 8% to 10%. After the fermentation is complete, the yeast is separated for recycling in the ethanol production process. We distill the wine to obtain hydrous ethanol. In order to produce anhydrous ethanol, hydrous ethanol undergoes a dehydration process in a molecular sieve. The liquid remaining after these processes is called vinasse, which we further process to make liquid organic fertilizer that we use in our sugarcane plantations. Vinasse is also the input used in our biodigestor to produce biogas.
Cogeneration
We generate electricity from sugarcane bagasse (the fiber portion of sugarcane that remains after the extraction of sugarcane juice) in our three mills located in Brazil. As of December 31, 2022, total installed cogeneration capacity reached 241 MW. The ability to generate electricity from the by-product of the sugarcane crushing process on a large enough scale to fully power a mill with excess electricity being available is referred to as having full cogeneration capacity. Our three mills are duly licensed by the Brazilian Electricity Agency (Agência Nacional de Energia Elétrica, or “ANEEL”) to generate and sell electricity.
Cogeneration Production Process
Sugarcane is composed of water, fibers, sucrose and other sugars and minerals. When the sugarcane goes through the milling process, we separate the water, sugar and minerals from the fibers or sugarcane bagasse. Bagasse is an important subproduct of sugarcane, and it is used as fuel for the boilers in our mills. Sugarcane bagasse is burned in our state-of-the-art boilers to produce high pressure steam (68 atm) which is used in our high-efficiency turbo-generators to generate electricity to power our mills. The excess electricity, about 72% of production, is sold to the national power grid.
60
The following flow chart demonstrates the sugar, ethanol and cogeneration production process:
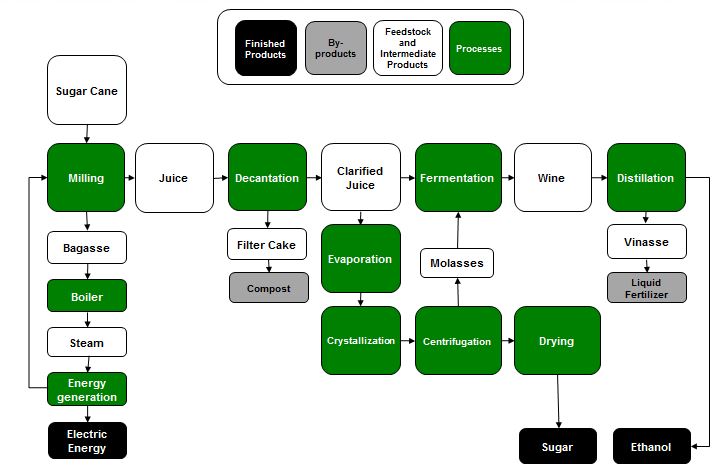
The main advantages of energy generated by sugarcane bagasse are:
•it is a clean and renewable energy;
•it complements hydropower, the main source of Brazilian energy, as it is generated during the sugarcane harvest period (April to December) when water reservoirs are at their lowest level;
•it requires a short period of time to start operations; and
•it requires only a small investment in transmission lines when plants are located close to consumer centers.
As of December 2022, our total installed cogeneration capacity at our cluster and UMA mill was 225 MW and 16 MW respectively, of which 155 MW and 12 MW are available to sell to the market.
We believe that there is a high potential for growth in the generation of electricity, and we are prepared to make investments to the extent economically viable.
Storage and Conditioning for the Sugar, Ethanol and Energy business
Our sugar and ethanol storage and conditioning facilities are located at our mill sites and enable us to deliver our products when they are ready to be commercialized with no third-party involvement. Having such facilities at mill sites allows us to (i) reduce storage and conditioning costs; (ii) reduce freight costs since we only commence moving the product once the final destination is determined, whether locally or to a port; and (iii) capitalize on fluctuations in the prices of sugar and ethanol.
| Nominal Storage Capacity | Cluster | UMA | Total | |||||||||||||||||
| Ethanol (cubic meters) | 240,000 | 28,035 | 268,035 | |||||||||||||||||
| Sugar (tons) | 110,000 | 28,000 | 138,000 | |||||||||||||||||
61
Marketing, Sales and Distribution for the Sugar, Ethanol and Energy business
Sugar. We sell sugar both in the domestic and the international markets. Domestic sales are processed by our own brand “Açúcar Monte Alegre,” which is based in the state of Minas Gerais, Brazil. Through this brand, we sell conventional and organic sugar, allowing us to have a competitive advantage amongst our peers. Prices for the sugar we export are set in accordance with international market prices, which are in turn determined in accordance with the ICE # 11 futures contracts. In the year ended December 31, 2022, our largest five customers in this segment accounted for approximately 95% of our total export sales, and the remaining 5% was dispersed among several customers.
Ethanol. We sell ethanol both to domestic and international markets. Our ethanol sales to the domestic Brazilian market accounted for approximately 76% and the remaining 24% were export sales. Approximately 34% of our domestic ethanol sales are made through formal agreements. The remainder is sold through daily sales orders through specialized brokerage firms and/or directly with distribution companies and the prices for these transactions are set using the CEPEA/ESALQ hydrous ethanol index as a reference. Our largest five customers by volume accounted for approximately 65% of our sales in the year ended December 31, 2022.
Cogeneration. We also sell electricity cogenerated at our sugar and ethanol mills to the grid. Sales are made to commercialization companies, in the spot market, to distributors and through government auctions in long-term contracts. Our largest six customers accounted for approximately 75% of our sales revenues in the year ended December 31, 2022.
ANEEL has organized yearly auctions for alternative energy and for renewable sources at favored rates. As a hedging strategy, we sell the electricity production of our mills through long-term contracts adjusted for inflation by reference to the “IPCA”.
In 2009, Angélica sold energy in a public auction carried out by the Brazilian Electricity Sales Chamber (Câmara de Comercialização de Energia Elétrica, or the “CCEE,”) and entered into a 15-year agreement with CCEE for the sale of 87,600 MWh per year at a rate of R$347.77 per MWh (for 2022). In August 2010, Angélica participated in a public auction, whereupon Angélica entered into a second 15-year agreement with CCEE starting in 2011 for the sale of 131,400 MWh per year at a rate of R$308.19 per MWh (for 2022). The delivery period is April to December for the first auction and March to November for the second auction. The rates under both agreements are adjusted annually for inflation by reference to the IPCA.
Land Transformation Business
Land transformation is an important element of our business model and a driver of value creation. Through land transformation, we optimize land use and increase the productive potential and value of our farmland. Our land transformation model consists of changing the use of underutilized or undermanaged agricultural land to more profitable cash-generating agricultural activities, such as turning low-cash-yielding cattle pasture land into high-cash-yielding arable land, allowing profitable agricultural activities, such as crop, rice and sugarcane production.
Since our inception, we have successfully identified multiple opportunities for the acquisition of undeveloped or undermanaged farmland with high potential for transformation. During the 20-year period since our inception, we have effectively put into production over 171,000 hectares that were previously undeveloped or inefficiently managed and are undergoing the transformation process.
The land transformation process begins by determining the productive potential of each plot of land. This will vary according to soil properties, climate, productive risks, and the available technology in each specific region. Before commencing the transformation process, we perform environmental impact studies to evaluate the potential impact on the local ecosystem, with the goal of promoting environmentally responsible agricultural production and ecosystem preservation, thereby supporting sustainable land use. We do not operate in heavily wooded areas or primarily wetland areas.
The transformation process for undeveloped and undermanaged land requires us to make initial investments during a period of one to up to three years, and the land reaches stable productive capability the third to seventh year following commencement of the land transformation activities.
We are engaged in three different categories of the land transformation process, which are defined by the previous use of the land:
62
•Undeveloped land (savannahs and natural grasslands): This is the most drastic transformation phase since it demands both physical and chemical transformation of the soil. First, the land is mechanically cleared to remove native vegetation. The soil is then mechanically leveled for agricultural operations: in the case of land being transformed for rice production, this process involves heavy land movements and systematization required for irrigation and drainage channels, roads and bridges. In the case of land destined for sugarcane plantations, land movements will also be necessary for the construction of terraces to prevent excess water runoff. Certain soils must be chemically treated and corrected by incorporating nutrients such as limestone, gypsum and phosphorous, as is the case of the Brazilian Cerrado Region. Soil correction is not required in Argentina or Uruguay due to the natural fertility of the soil. Pesticides and fertilizers are then applied to the soil in preparation for planting. In the case of land destined for crop production (grains and oilseeds), soybean, which is sometimes referred to as a colonizing crop, is usually planted during the first years due to its resistance to pests, weeds and extreme weather and soil conditions. Thereafter, the land will enter into a crop rotation scheme to reduce the incidence of plague and disease and to balance soil nutrients. In the case of rice and sugar cane, which are produced in a monoculture system, there is no colonizing crop or rotation involved. Intensive plague and weed controls and additional soil correction will take place during these first three to five years. Land productivity or yields, measured in tons of soybean or other crops per hectare, will be initially low and will gradually increase year by year. During the first five to seven years, the yields will increase at high and sustained rates. After the seventh year, we consider the land developed as yield volatility is reduced and growth is only achievable at marginal rates. Since our inception in 2002, we have put into production about 70,000 hectares of undeveloped land into productive arable land.
•Undermanaged or underutilized farmland (cultivated pastures and poorly managed agriculture): This transformation process is lighter than the one described above since it does not require the initial mechanical clearing of vegetation or land leveling. Only in the case of land being prepared for rice production will leveling be required for efficient flood-irrigation. The transformation of cattle pastures or poor agriculture in the Brazilian Cerrado region will begin with soil correction and soil tillage in preparation for planting of the first soybean or sugarcane crop. The process will then continue as described in the case above. Land productivity or crop yields will grow at high rates during the first three to five years of the transformation process and will then commence to stabilize and grow at marginal rates, at which point we consider the land developed. Since our inception in 2002, we have put into production over 100,000 hectares of undermanaged or underutilized farmland into arable land.
•Ongoing transformation of arable land: The application of efficient and sustainable crop production technologies and best practices such as “no-till,” crop rotations, integrated pest and weed management, and balanced fertilization, among others, incrementally increases soil quality and land productivity over time, maximizing return on invested capital and increasing the land value of our properties. Our entire farmland portfolio is constantly undergoing this phase of land transformation.
In each of these categories of transformation, the metric we use to track the level and analyze the progress of the transformation process is the level and tendency of crop yields and the number of years the land has been under crop production. Consequently, the process of land transformation is evidenced by the results of the activities within our other business segments, primarily our crops, rice and sugarcane segments. Accordingly the costs associated with the transformation process described above are allocated within these other business segments. As a result, there may be variations in our results from one season to the next according to the amount of farmland undergoing transformation and the amount of land sold and our ability to identify and acquire new farmland.
Our land transformation segment seeks not only to profit from crop and rice cultivation, but also from the opportunistic disposition of successfully transformed farmland. We strategically sell farms that have reached productive maturity with marginal potential for further productivity increases (years three to seven after commencing the land transformation process) to realize and monetize the capital gains arising from the land transformation process. Land transformation proceeds are in turn reinvested in the purchase of strategic farmland with potential for transformation and appreciation. The rotation of our land portfolio allows us to allocate capital efficiently. Since 2006 we have had a solid track record of selling farmland and achieving profitable returns. During the last 16 years, we have sold 25 farms, generating capital gains of approximately US$250 million.
These capital gains are generated by three main factors:
(i) the acquisition of land at opportunistic prices below the market value or fair value of the land;
63
(ii) the land transformation and ongoing land transformation process described above enhances the productivity and profitability of land, ultimately increasing the value of the land; and
(iii) general market appreciation of land driven by increase in commodity prices and supply and demand dynamics in the land market. The value of the farms we sold as well as our overall land portfolio, has mostly been positively impacted by this external factor.
We believe we are one of the most active players in the land business in South America. Since our inception in 2002, we have executed transactions for the purchase and sale of land for over US$780 million. Our business development team is responsible for analyzing, selecting, acquiring and selling land. The team has gained extensive expertise in evaluating and acquiring farmland throughout South America, and has a solid understanding of the productivity potential of each region and of the potential for land transformation and appreciation. Since 2002, the team has analyzed over 11 million hectares of farmland with a total value of approximately US$16 billion. We have developed a methodology to analyze investment opportunities, taking into account price, transformation potential, productive model, financial projections, and investment requirements, among others. Our analysis also employs advanced information technology, including the use of satellite images, rain and temperature records, soil analysis, and topography and drainage maps. From time to time, we may leverage our favorable position in and knowledge of the land market to engage in opportunistic buying and selling transactions.
The following table sets forth our acquisitions and divestitures since our inception:
| Acquisition | Divestitures | Total Land Holdings | ||||||||||||||||||
| Year Ended December 31, | (in hectares) | |||||||||||||||||||
| 2002 | 74,898 | — | 74,898 | |||||||||||||||||
| 2003 | — | — | 74,898 | |||||||||||||||||
| 2004 | 34,659 | — | 109,557 | |||||||||||||||||
| 2005 | 22,262 | — | 131,819 | |||||||||||||||||
| 2006 | 5,759 | 3,507 | 134,071 | |||||||||||||||||
| 2007 | 113,197 | 8,714 | 239,274 | |||||||||||||||||
| 2008 | 43,783 | 4,857 | 278,200 | |||||||||||||||||
| 2009 | — | 5,005 | 273,195 | |||||||||||||||||
| 2010 | 14,755 | 5,086 | 282,864 | |||||||||||||||||
| 2011 | 12,992 | 2,439 | 293,417 | |||||||||||||||||
| 2012 | — | 9,475 | 283,942 | |||||||||||||||||
| 2013 | — | 14,176 | 269,766 | |||||||||||||||||
| 2014 | — | 12,887 | 257,036 | |||||||||||||||||
| 2015 | — | 10,905 | 246,139 | |||||||||||||||||
| 2016 | — | — | 246,139 | |||||||||||||||||
| 2017 | — | — | 246,139 | |||||||||||||||||
| 2018 | — | 14,427 | 231,712 | |||||||||||||||||
| 2019 | — | 6,082 | 225,630 | |||||||||||||||||
| 2020 | — | 5,444 | 220,186 | |||||||||||||||||
| 2021 | — | 336(*) | 219,850 | |||||||||||||||||
| 2022 | — | — | 219,850 | |||||||||||||||||
(*) 336 hectares of industrial parks in Brazil were excluded from the calculation, although not technically divested.
Property, Plant and Equipment
Our Farms
The table below sets forth the name, location, size and current use of our owned farms:
64
| Farm | State, Country | Gross Size (Hectares) | Current Use | |||||||||||||||||
| El Meridiano | Buenos Aires, Argentina | 6,302 | Grains | |||||||||||||||||
| Las Horquetas | Buenos Aires, Argentina | 2,086 | Grains & Cattle | |||||||||||||||||
| San Carlos | Buenos Aires, Argentina | 4,215 | Grains | |||||||||||||||||
La Carolina(1) | Santa Fe, Argentina | 4,306 | Grains & Cattle | |||||||||||||||||
El Orden(1) | Santa Fe, Argentina | 3,506 | Grains & Cattle | |||||||||||||||||
| La Rosa | Santa Fe, Argentina | 4,087 | Grains & Cattle | |||||||||||||||||
| San Joaquín | Santa Fe, Argentina | 37,273 | Rice, Grains & Cattle | |||||||||||||||||
| Carmen | Santa Fe, Argentina | 10,021 | Grains | |||||||||||||||||
| Abolengo | Santa Fe, Argentina | 6,662 | Grains | |||||||||||||||||
| Santa Lucia | Santiago del Estero, Argentina | 17,495 | Grains & Cattle | |||||||||||||||||
| El Colorado | Santiago del Estero, Argentina | 4,960 | Grains | |||||||||||||||||
La Guarida (2) | Santiago del Estero, Argentina | 7,880 | Grains & Cattle | |||||||||||||||||
La Garrucha (2) | Salta, Argentina | 1,839 | Grains | |||||||||||||||||
Los Guayacanes (2) | Salta, Argentina | 3,693 | Grains | |||||||||||||||||
| Ombú | Formosa, Argentina | 18,321 | Grains & Cattle | |||||||||||||||||
| Oscuro | Corrientes, Argentina | 33,429 | Rice, Grains & Cattle | |||||||||||||||||
| Itá Caabó | Corrientes, Argentina | 22,888 | Rice, Grains & Cattle | |||||||||||||||||
| Bela Manhã | Mato Grosso do Sul, Brazil | 381 | Sugarcane | |||||||||||||||||
| Ouro Verde | Mato Grosso do Sul, Brazil | 679 | Sugarcane | |||||||||||||||||
| Don Fabrício | Mato Grosso do Sul, Brazil | 3,302 | Sugarcane | |||||||||||||||||
| Takuarê | Mato Grosso do Sul, Brazil | 298 | Sugarcane | |||||||||||||||||
| Agua Branca | Mato Grosso do Sul, Brazil | 1,614 | Sugarcane | |||||||||||||||||
| Nossa Senhora Aparecida | Mato Grosso do Sul, Brazil | 540 | Sugarcane | |||||||||||||||||
| Sapálio | Mato Grosso do Sul, Brazil | 6,140 | Sugarcane | |||||||||||||||||
| La Pecuaria | Duranzo, Uruguay | 3,177 | Grains | |||||||||||||||||
| Doña Marina | Corrientes, Argentina | 14,755 | Rice | |||||||||||||||||
| Total | 219,850 | |||||||||||||||||||
(1) In December 2015, we completed the sale of a 49% interest in Global Acamante S.L.U, Global Calidon S.L.U, Global Carelio S.L.U, and Global Mirabilis S.L.U, whose main underlying assets are El Orden and La Carolina farms.
(2) In June 2014, we completed the sale of a 49.0% interest in Global Anceo S.L.U and Global Hisingen S.L.U, two Spanish subsidiaries that owned the La Guarida, La Garrucha and Los Guayacanes farms.
A substantial portion of our assets consists of rural real estate. The agricultural real estate market in Brazil, Argentina and Uruguay is particularly characterized by volatility and illiquidity. As a result, we may experience difficulties in immediately adjusting our portfolio of rural properties in response to any alterations in the economic or business environments. The volatility of the local market could affect our ability to sell and receive the proceeds from such sales, which could give rise to a material adverse effect on our business, results of operations and financial condition. See “Item 3. Key Information—D. Risk Factors—Risks Related to Our Business and Industries—A substantial portion of our assets is farmland that is highly illiquid.”
Appraisal of Farms. In September 2022, to assess the market value of rural properties in Brazil, Argentina and Uruguay, we requested an appraisal by Cushman & Wakefield Argentina S.A., an independent real estate valuation firm with experience in the agriculture industry and the local real estate market. As part of these appraisals, the value of each of our properties was determined using the sales comparison approach taking into account current offerings and prices buyers had recently paid for comparable sites, adjusted for the differences between comparable properties and the subject property to arrive at an estimate of the value. The major elements of comparison used to value the properties included the property rights conveyed, the financial terms incorporated into the transaction, the conditions or motivations surrounding the sale, changes in market conditions since the sale, the location of the real estate and the physical characteristics of the property.
65
These valuations assumed good and marketable title to subject properties, which were assumed to be free and clear of all liens and encumbrances. The valuation did not include site measurements and no surveys of the subject properties were undertaken. In addition, the valuations also assumed (a) responsible ownership and competent management of the subject properties; (b) there were no hidden or unapparent conditions of the subject properties, subsoil or structures that render the subject properties more or less valuable; (c) full compliance with all applicable federal, state and local zoning and environmental regulations and laws and (d) all required licenses, certificates of occupancy and other governmental consents were or can be obtained and renewed for any use on which the value opinion contained in the appraisals is based. Unless otherwise stated in the appraisals, the existence of potentially hazardous or toxic materials that may have been used in the construction or maintenance of the improvements or may be located at or about the subject properties was not considered in arriving at the appraisal of value. These materials (such as formaldehyde foam insulation, asbestos insulation and other potentially hazardous materials) may adversely affect the value of the subject properties.
Cushman & Wakefield has informed us their assessment of the market value of our farmland as of September 30, 2022. According to Cushman & Wakefield, the market value of our farmland totaled US$778.4 million, out of which US$699.4 million correspond to the market value of our farmland in Argentina and Uruguay, and the remaining US$79.0 million correspond to the market value of our farmland in Brazil. Net of minority interests in certain Argentine farms, the market value of our farmland totaled US$727.5 million. These valuations are only intended to provide an indicative approximation of the market value of our farmland property as of September 30, 2022 based on then current market conditions. This information is subject to change based on a host of variables and market conditions.
Land Leasing and Agriculture Partnerships. We enter into operating lease agreements based on criteria regarding the quality and projected profitability of the property, as well as our production and yield objectives in the short or medium term. Generally, we become aware of farms available for lease directly through the owners of farms near our farms and in some cases through regional brokers.
We tend to be more open to leasing farmland for sugarcane production than for our Farming businesses, where we own the majority of the land that we farm. We lease land for our sugarcane production primarily because leases in this sector are long term, lasting between one or two sugarcane cycles (with each cycle generally lasting seven years), which allows us to implement and reap the productivity benefits of our land transformation strategies. Sugarcane lease payments are established depending on the productivity of the land in terms of tons per hectare and sucrose content per hectare and also on the distance from the land to the mill. Sugarcane prices are based on the market value of the sugarcane set forth by Consecana regulations. Given the strategic location of our mills in the region and the inherent inefficiency of growing crops other than sugarcane in this region, we expect to be able to renew our leases for the sugarcane farmland with minimal issues.
With respect to our Farming business, the initial duration of lease agreements is generally one harvest year. Leases of farmland for production of grains include agreements with both fixed and variable lease payments in local currency or U.S. dollars per hectare.
Land Management. We manage our land through an executive committee composed of a country manager, regional manager, farm manager and members of the Technology Adecoagro Group, or “TAG,” which meet on a monthly basis. We delegate individual farm management to farm managers, who are responsible for farm operations and receive advisory support from TAG to analyze and determine the most suitable and efficient technologies to be applied. Our executive committee establishes commercial and production rules based on sales, market expectations and risk allocation, and fulfilling production procedures and protocols.
Following an acquisition of property, we make investments in technology in order to improve productivity and to increase its value. Occasionally when we purchase property, a parcel of the property is subutilized or the infrastructure may be in need of improvement, including traditional fencing and electrical fencing, irrigation equipment and machinery, among others.
66
Industrial Facilities
In addition to our farmland, we also own the following principal industrial facilities:
| Facility | Province, Country | Relevant Operational Data | Current Use | |||||||||||||||||
| “Christophersen” | Santa Fe, Argentina | 12,500 tons of storage capacity. 2,880 tons per day of drying capacity | Seedbed and stockpiling plant (1) | |||||||||||||||||
| "Las Horquetas" | Buenos Aires, Argentina | 24,500 tons of storage capacity. 5,760 tons per day of drying capacity for grains | Storage, handling and conditioning | |||||||||||||||||
| “Semillero Itá Caabó” | Corrientes, Argentina | Processing capacity of 8,000 tons of rice seeds annually | Rice genetic improvement program | |||||||||||||||||
| “Molino Ala — Mercedes” | Corrientes, Argentina | Installed capacity of 6,516 tons of white rice monthly, and husk rice drying capacity of 2,250 tons per day | Rice processing and drying plant | |||||||||||||||||
| “Molino Ala — San Salvador” | Entre Ríos, Argentina | Installed capacity of 5,779 tons of white rice monthly, and husk rice drying capacity of 1,950 tons per day | Rice processing and drying plant | |||||||||||||||||
| Molino Franck | Santa Fe, Argentina | Processing capacity of 6,924 tons of white rice monthly, and husk rice drying capacity of 1,650 tons per day | Rice processing and drying plant | |||||||||||||||||
| Molino Paso de los Libres | Corrientes, Argentina | Processing capacity of 8,143 tons of white rice monthly, and husk rice drying capacity of 2,100 tons per day | Rice processing and drying plant | |||||||||||||||||
| Molino Paso Dragon | Durazno, Uruguay | Processing capacity of 5,500 tons of white rice monthly, and husk rice drying capacity of 1,100 tons per day | Rice processing and drying plant | |||||||||||||||||
| Molino Melo | Tacuarembó, Uruguay | Processing capacity of 6,924 tons of white rice monthly, and husk rice drying capacity of 1,200 tons per day | Rice processing and drying plant | |||||||||||||||||
| “Oscuro” | Corrientes, Argentina | Husk rice drying capacity of 1,000 tons per day | Rice conditioning facility | |||||||||||||||||
| “Ita Ibate” | Corrientes, Argentina | Husk rice drying capacity of 900 tons per day | Rice conditioning facility | |||||||||||||||||
| “Bonpland” | Corrientes, Argentina | Husk rice drying capacity of 450 tons per day | Rice conditioning facility | |||||||||||||||||
| Free-Stall I, II, III and IV | Santa Fe, Argentina | Production capacity of more than 180 million liters of raw milk 14,400 milking cows | Raw milk production | |||||||||||||||||
| Biodigester | Santa Fe, Argentina | 1.4 MW capacity | Energy generation | |||||||||||||||||
| Morteros Facility | Córdoba, Argentina | Production capacity of 870,000 liters per day Reception capacity of 1.2 million liters per day Storage capacity of 24.3 million liters | Milk processing facility producing milk powder and semi-hard cheese. Sells products to the export market. | |||||||||||||||||
| Chivilcoy Facility | Buenos Aires, Argentina | Production capacity of 555,000 liters per day Reception capacity of 1.2 million liters per day Storage capacity of 3.5 million liters of fluid milk | Milk processing facility, producing UHT milk, yogurt, cream and cocoa flavored milk. Sells products to the domestic market. | |||||||||||||||||
| "Maní del Plata" | Córdoba, Argentina | Shelling capacity of 80,000 tons, blanching capacity of 36,000 tons. Storage capacity of 67,000 tons of in-shell and 10,000 tons of finished product | Peanut processing facility producing raw and blanched peanuts. Sells mainly to the export market. | |||||||||||||||||
67
| "Girasoles del Plata" | Buenos Aires, Argentina | Processing capacity of 6 tons/hour of confectionary and 6 tons/hour of bakery. Storage capacity of 14,200 tons of confectionary. | Sunflower processing facility producing confectionary and bakery sunflower. Sells mainly to the export market. | |||||||||||||||||
| “Angélica Agroenergía” | Mato Grosso do Sul, Brazil | Installed milling capacity of 5.6 million tons of sugarcane per annum, 332,669 tons of sugar, 332,669 cubic meters of ethanol, and over 504,000 MWh of energy exported. | Sugar and ethanol mill producing hydrated ethanol, anhydrous ethanol and VHP sugar. Sells energy to local network. | |||||||||||||||||
| “Ivinhema Agroenergía” | Mato Grosso do Sul, Brazil | Installed milling capacity of 7.4 million tons of sugarcane per annum, 307,447 tons of sugar, 307,447 cubic meters of ethanol, and over 612,000 MWh of energy exported. | Sugar and ethanol mill producing hydrated ethanol, anhydrous ethanol and VHP sugar. Sells energy to local the network. | |||||||||||||||||
| “Monte Alegre” | Minas Gerais, Brazil | Installed milling capacity of 1.2 million tons of sugarcane per annum, 83,028 tons of sugar, 52,836 cubic meters of ethanol, and over 74,800 MWh of energy exported. | Sugar and ethanol mill producing hydrated ethanol, VHP sugar and organic sugar. Sells energy to local the network. | |||||||||||||||||
________________________________________________________________________________________________
(1)Classification of wheat and soybean seeds.
For information on environmental issues that may affect the use of our assets, see “-Environmental Aspects.”
For additional information regarding our property, plant and equipment, see Note 12 of the Consolidated Financial Statements.
Customers
We sell manufactured and agricultural products to a large base of customers. The type and class of customers may differ depending on our business segments, regions and some logistics issues that are very important in our decision-making. In the year ended December 31, 2022, more than 90% of our sales of crops were sold to 15 well-known customers, both international and local. Of these customers, the first five customers represented almost 60% of our sales, and the following five customers represented approximately 20% of our net sales in 2022.
In the Sugar, Ethanol and Energy segment, sales of ethanol were concentrated in five customers, which represented 95% of total sales of ethanol in the year ended December 31, 2022. Approximately 95% of our sales of sugar were concentrated in five customers in the year ended December 31, 2022; the remaining 5% was dispersed among several other customers. In 2022, 75% of our energy sales were concentrated in six major customers.
Competition
The farming sector is highly fragmented. Although we are one of South America’s leading producers, due to the atomized nature of the farming sector, our overall market share in some of the industries in which we participate is insubstantial. Our production volume, however, improves our ability to negotiate favorable supply, transportation and delivery logistics with our suppliers, third-party transporters, ports and other facilities, and customers. Although competition in agriculture varies considerably by product and sector, in general, there are a large number of producers, and each one of them controls only a small portion of the total production. Therefore, individual producers often have little influence on the market and cause little or no effect on market prices as a result of their individual strategies, explaining why producers are price takers and not price makers. In many cases, the price is established in international market exchanges. As the majority of agricultural products are commodities, which stifles product differentiation, the principal competition factors are cost of production and volume efficiency gains. In addition, agricultural producers face strong foreign competition, and with this competition the factors are often more difficult to identify.
The majority of farming producers in developed countries can rely on specific protectionist policies and subsidies from their governments in order to maintain their position in the market. In general, we have been able to obtain discounts for the acquisition of supplies and excess prices for our production in the farming sector. In this sector, we view SLC Agrícola S.A., BrasilAgro - Companhia Brasileira de Propriedades Agrícolas, Sollus Agrícola, Radar Propriedades Agrícolas, El Tejar S.A., Cresud SACIF y A, MSU S.A. and Los Grobo Agropecuaria, among others, as our competitors. We also compete in Argentina
68
with retailers of agricultural products, including other branded rice products, such as Molinos Río de la Plata S.A., Dos Hermanos S.H., Sagemüller S.A. and Cooperativa Arroceros Villa Elisa Ltda.
The sugar and ethanol industries are highly competitive. In Brazil, we compete with numerous small-and medium-sized sugar and ethanol producers. Despite increased consolidation, the Brazilian sugar and ethanol industries remain highly fragmented, with more than 424 sugar mills. Some of the largest industry players with whom we compete are Raizen, Biosev, Atvos, Tereos, São Martinho, Jalles Machado, Bunge, Santa Terezinha, Lincoln Junqueira and Coruripe. We also face competition from international sugar producers, such as those in the U.S. and the European Union, where local regulators have historically implemented tariffs, agriculture subsidies and/or other governmental incentive programs, of which some remain, to protect local sugar producers from foreign competition.
The following table describes the Brazilian competitive landscape:
| Brazil | |||||
| Number of Mills | 424 | ||||
| Sugarcane crushed (million tons) | 598.3 | ||||
| Ethanol Production (million cubic meters) | 26.6 | ||||
| Sugar Production (million tons) | 36.4 | ||||
________________________________________________________________________________________________
Source: Ministry of Agriculture and CONAB
With respect to farmland, there have historically been few companies competing to acquire and lease farmland for the purpose of benefiting from land appreciation and optimization of yields in different commercial activities. However, we believe that new companies, may become active players in the acquisition of farmland and the leasing of sown land, which would add competitors to the market in coming years.
Supplies and Suppliers
Our principal supplies for our Farming business are seeds, fertilizers, pesticides and fuel, which represented 7.1%, 6.9%, 12.0% and 4.1%, respectively, of our total direct costs (including leasing cost) in 2022. Further, these supplies represented 26.3% of our total cost of production (including manufacturing and administrative expenses) in 2022. As we use direct sowing in 99.0% of our planted area, without requiring soil preparation, fuel represents only 3.6% of the total cost of production for 2022.
Our principal supplies for our Sugar, Ethanol and Energy business are diesel, lubricants and fertilizers, which collectively represented 21.1% of our total cost of production (including manufacturing and administrative expenses) in 2022. We have an extensive network of suppliers for each of our business segments and for each required input within each segment, resulting in lower reliance on any particular supplier. Our 10 largest suppliers account for 31.6% of our total expenditures for supplies in 2022. While we value the relationships we have developed with each of our suppliers given the quality we have come to expect, we do not consider any single supplier to be key to our production.
We have been able to obtain lower prices particularly due to the volume that derives from our large-scale operations.
Seasonality
Our business activities are inherently seasonal. We generally harvest and sell most of our grains (corn, soybean, rice and sunflower) between February and August, with the exception of wheat, which is harvested from December to January. Peanut is harvested from April to May, and sales are executed with higher intensity during the third quarter of the year. Cotton is unique in that while it is typically harvested from June to August, it requires processing which takes about two to three months to complete. Sales in our Dairy business segment tend to be more stable. However, milk production is generally higher during the fourth quarter, when the weather is more suitable for production. In general terms, processing of rice and milk tend to be more stable during the year. Although our Sugar, Ethanol and Electricity cluster is currently operating under a “non-stop” or “continuous” harvest and without stopping during traditional off-season, the rest of the sector in Brazil is still primarily operating with large off-season periods from December/January to March/April. The result of large off-season periods is fluctuations in our sugar and ethanol sales and in our inventories, usually peaking in December to take advantage of higher prices during the traditional off-season period (i.e., January through April). As a result of the above factors, there may be significant variations in our financial results from one quarter to another. In addition, our quarterly results may vary as a result of the effects of fluctuations in commodities prices, production yields and costs on the determination of changes in fair value of biological assets and agricultural produce.
69
Sustainability
Our production model is based on sustainability standards that seek to produce food and renewable energy on a long-term basis. Those standards include best practices and certifications that promote development and health, customer satisfaction and stakeholders' interest, neighboring community welfare, food care and food safety, and environmental protection. Accordingly, our sustainable approach to farming requires that we take into account not only economic, but also social and environmental aspects specifically adapted to local circumstances. We believe we accomplish these goals through a team committed to our values: trust, transparency, efficiency, innovation, safety and sustainability.
In 2022, we continued to work towards integrating environmental, social, and governance criteria, or “ESG" criteria, into our business model. On this path towards the triple generation of value, we worked with our ESG committee holding monthly meetings. We were able to better evaluate the environmental and social performance of each of our businesses. The analysis of the impact of sustainability trends in our business is also part of our agenda.
In 2022, we managed to monitor the key environmental performance indicators by business that we had defined in 2021. These indicators are associated with our strategy of permanently thinking about people, including members of our value chain and communities, and with the conservation of our planet. Going forward, we will continue to innovate, be transparent, and report on our progress to accelerate our vision for a better and more inclusive future.
Personnel
The development, health and safety of our personnel is important to us. We also promote enhanced working conditions, while we support training and internal education programs to improve skills and educate with the newest technologies and business practices. We implement and constantly revise our health and safety programs in each of our businesses.
Standardized and Scalable Agribusiness Model
We have adopted an agribusiness model that allows us to engage in large-scale farming activities in an efficient and sustainable manner. Our agribusiness model consists of developing a specialized workforce and defining standard protocols to track crop development and control production variables, thereby enhancing efficient decision making and facilitating continuous improvement. This approach allows us to grow in scale, execute our expansion plan and efficiently manage various production units spread across different regions by effectively replicating our productive model. Process standardization also helps us assure compliance with local laws and regulations and reduce social and environmental risks.
We continue to develop and implement crop protocols. The purpose of these protocols is to coordinate and consolidate the knowledge on crop management for each area in order to standardize the implementation of these protocols. The protocols contain all the technical information for managing crops. This information is constantly reviewed by agricultural teams and their advisors, making it possible to preserve the technical knowledge of the company and at the same time improve agricultural production and make decisions pursuant to the company’s guidelines. Based on the results of the application of these protocols, we conduct an annual review of the techniques used and their results. This evaluation is done by means of crop campaign analysis, in which all teams review and discuss the last harvest year’s productive performance and the technological package for the new harvest year. When processes and protocols are defined, they can be audited and certified by qualified third parties. We previously certified our crop and rice production in Argentina under ISO 900, and re currently certifying our biodigester energy generation in Argentina under ISO 14001 and the Round Table on Responsible Soybeans standard, or “RTRS,” for some of our crop operating units. In addition to this, in 2021, we implemented our paddy rice production under the Sustainable Agriculture Initiative scheme.
In order to achieve efficient scales of production, we have redesigned our field sizes by removing useless cattle infrastructure such as fencing. Larger fields reduce the overlapping of farm works, enhancing operating efficiency, reducing the use of inputs and achieving agronomic timing (planting or harvesting on time). The goal is to reduce operative time and to improve efficiency in the use of inputs. Large-scale production also requires the implementation of advanced technology such as Global Positioning System, or “GPS,” Geographic Information System or "GIS", and modern machinery as well.
We are also adopting operational protocols and procedures in our industrial facilities to improve control of processing variables. Both of our milk processing facilities have been certified under the FSSC 22000 standard (Food Safety System Certification), and our Morteros facility has also obtained halal certification. In our rice mills, the FSSC 22000 standard is currently under implementation, we have been audited for the FSSC Global Market standard, and two of our mills have obtained kosher certification. In our Crops business, our peanut processing facility has been certified for kosher and halal, and BRC standard for food safety; while our sunflower processing facility has obtained the FSSC 22000 standard and kosher and halal certifications. Most of our industrial facilities are either implementing or have been audited by the Sedex Members Ethical
70
Trade Audit, which validates our compliance with health, safety and human rights practices, together with environmental applicable legislation. Similarly, in 2021, we were subjected to audits under specific standards of our clients at our Chivilcoy milk processing plant, which covered topics such as asset security and corporate social responsibility. We were successful in these audits, which enabled us to continue with the relevant commercial relationships.
When market conditions provide price premiums for certified grains or oilseeds, we evaluate the feasibility of implementing specific certifications. Some examples of this are RTRS and EPA certifications for sustainable soybeans in Argentina. In Brazil, we are certifying sugar-based products for EPA, Bonsucro and Organic Sugar certifications at our UMA mill.
Contractors
Contractors play a significant role in our Farming business model. If cost competitive, we seek to outsource most of the typical farm work, such as planting, spraying and harvesting. Outsourcing allows us to reduce our investments in heavy machinery and equipment such as tractors or harvesters, enhancing the efficient allocation of our capital in our core productive activities. Notwithstanding, we are reviewing the contractor model and comparing it with the use of own machinery in some of our crops and rice operations. We are willing to develop our own-equipment-based model where efficiencies could be enhanced.
The contractor model in the Argentine humid pampas region has existed for years and has developed into a highly competitive market. Contractors have gained extensive expertise and skill in the management of agricultural machinery and have access to modern advanced technology. When working with them, we seek to develop win-win relationships by considering them as part of our production team and providing constant technical training and support through the activities of the Adecoagro Technical Group (Grupo Técnico Adecoagro) or the “GTA”. We strive to have a number of contractors associated with each farm to generate competition and allow benchmarking to enhance operational efficiency and ensure high-quality service.
In regions where this model is not fully developed, we use a mixed system where we hire the most experienced contractors in the region and we also operate our own machinery. We promote the development of new contractors by providing training and selling them our used machinery. We also promote the movement of selected contractors from developed regions into new marginal regions by offering them an opportunity to grow their businesses. In other regions where there is no established contractor system or there is specific farm work (rice land leveling for instance), we own majority of the machinery. In our Sugar, Ethanol and Energy business, we own or lease and operate all the agricultural equipment and machinery needed for sugarcane planting and harvesting operations. The performance of such model has exceeded our expectations, and we are considering its implementation in our Farming businesses, where we have recently incorporated some additional planters and harvesters. Our main goal is to achieve high-quality farm works, both when selecting any contractor and when using our own machinery. In Brazil, we only employ the contractor model for specific tasks, such as land leveling, and aerial spraying, among others.
Adecoagro Technical Group
The GTA is an internal group formed by agronomists, farm managers, external advisors, contractors, trainees and suppliers, whose main goal is to excel in production management by providing constant technical education and analysis regarding production technologies. Although the GTA is focused on developing such knowledge under common criteria for the whole company, it also considers different production systems, such as crops, rice and dairy in Argentina and Uruguay, and sugarcane in Minas Gerais and Mato Grosso do Sul, Brazil. To achieve its goals, the GTA meets every 20 days to analyze and discuss technical aspects of the farming production processes.
The GTA participates in the design of the most efficient and productive land use strategies and the definition of the optimal crop production mix for each farm and region, and supervises and evaluates the implementation of the most profitable and sustainable technologies to be adapted and applied in each region. Additionally, the GTA promotes specific external training courses, facilitates participation in external technical groups, organizes technical farm tours, offers support in establishing the crop planting plan and delivers a full-season analysis for each crop annually. This analysis is essential in order to allow technical improvements to be implemented for the following crop season.
Since the GTA is involved in different regions, it plays a relevant role in spreading best practices among productive regions, including “no-till” in lesser-developed areas. In order to evaluate and adapt the proper technologies locally, a vast network of test plots in agrochemicals, seeds, and farm-works are being carried out under specific technical guidelines. Such development is performed to make the necessary technological adjustments in respect of fertilizer levels, the choice of the best product varieties for each crop, the determination of optimal planting periods, and the improvement in crop management and agricultural mechanization, resulting in higher yields coupled with reduced costs.
71
In order to continually improve our technical development, we participate in specialized industry groups, such as CREA and AAPRESID in Argentina, with which we share values and goals. “CREA” is a 50-year-old farmers’ association focused on developing and supporting technical excellence with local farmers. “AAPRESID” is a technical association of highly innovative farmers specializing in no-till development. We participate in certain CREA and AAPRESID discussion groups in which we share and evaluate common technical matters. We take advantage of their vast network of test plots and we constantly exchange technological knowledge for implementation in our farms.
In addition, the GTA is focusing its resources on pursuing improvements through implementing advanced techniques. Such techniques comprise variable inputs usage by type of soil based on precision agriculture technology, intensification techniques relating to soil occupation times and diversified crop rotations, adjusting “no-till” in rice production, developing sugarcane production technologies involving agricultural mechanization and minimum tillage, and developing cotton production technologies involving “no-till” and crop rotation, among others.
By implementing all these education programs and development activities, the GTA provides to the company a network that focuses on the fine-tuning and optimization of the efficiencies throughout all the production processes of each business line.
Technology and Best Practices
We have consistently used innovative production techniques to ensure we are at the forefront of technological improvements and standards in our industry, especially based on regenerative agriculture concepts. For example, we use the “no-till” technology and crop rotation to improve our crop yields. We also use second harvests or double cropping where conditions permit, which enables us to plant and harvest a second crop from the same farmland in the same harvest year. Our crop production model is based on balanced fertilization, integrated pest and weed management, and crop intensification. We use the innovative silo bag storage method in our rice and crops businesses, which enables us to time the entry of our rice production into the market at optimal price points. Additionally, we believe we were the first company in South America to implement the innovative free-stall infrastructure in dairy operations resulting in increased raw milk production compared to our peers. The free-stall method enables better control over production variables by confining dairy cows into large barns, which are equipped with state-of-the-art technology to enhance cow comfort, such as sand beds, water spray cooling system and fans. In addition, installations are equipped with indoor corrals and a mechanical advanced milking system on a rotary platform, which enables us to use production efficiencies and increase milk production volumes while maximizing our land use and resulting in significantly higher conversion rates of animal feed into milk.
Moreover, our sugarcane harvesting is 99.6% mechanized, which has significantly improved operating efficiency, therefore reducing operating costs. We have modern facilities in the sugar and ethanol business including advanced sugar and ethanol mills with high-pressure boilers, which achieve one of the highest ratios of energy produced per ton of cane milled, according to the Cane Technology Center Benchmark program. Our Angélica sugar plant was the first continuously operative facility in Brazil, requiring no production stoppages between sugar batches.
No-Till
“No-till” is the cornerstone of our crop production technology and the key to maintaining and even increasing the value and productivity of our land assets. “No-till”—often called zero tillage or direct sowing— is a technology developed more than 40 years ago to grow crops from year to year without disturbing the soil through tillage, and arose as an opposition to conventional tillage.
Conventional farming consists of using plows to turn and till the soil to remove weeds, mix in soil additives such as fertilizers, and prepare the surface for seeding. Soil tillage leads to unfavorable effects such as soil compaction, loss of organic matter, degradation of soil components, death or disruption of microorganisms, evaporation of soil humidity and soil erosion where topsoil is blown or washed away by wind or rain.
“No-till” farming avoids these negative effects by excluding the use of tillage. The “no-till” technology consists of leaving crop plant residues on the surface of the soil after harvesting a crop. These residues form a mulch or permanent cover protecting the soil from erosion risks caused by heavy rains and strong winds. This protective cover also helps natural precipitation and irrigation water infiltrate the soil effectively while decreasing water loss from evaporation. Absence of tillage helps prevent soil compaction, allowing the soil to absorb more water and roots to grow deeper into the soil. Furthermore, “no-till” reduces the emergence of weeds and enhances biological processes that positively impact soil properties, conserving and even improving the presence of organic matter and microorganisms and associated nutrients (nitrogen, phosphorous, etc.).
The combination of these advantages results in important cost reductions due to a lower use of inputs, mainly diesel, fertilizers and pesticides, and higher crop yields, thus increasing the profitability of our business. These benefits are achieved in
72
the medium to long term, resulting in a continuous increase of land productivity and thus its value. From an operational standpoint, “no-till” facilitates the conditions to perform most of the operations on time such as planting, spraying and harvesting, which enhances the development of large-scale operations and especially improves the probability of planting each crop at the optimum moment.
Crop Rotation
Crop rotation is the practice of growing a series of dissimilar types of crops in the same area in sequential seasons. Crop rotation allows us to better control the buildup of harmful weeds and reduces the incidence of plagues and diseases that often occur when the same commodity is continuously cropped. Crop rotation also allows us to balance the fertility demands of various crops to avoid the excessive depletion of soil nutrients, contributing to a more efficient use of fertilizers and a sustainable use of herbicides and pesticides. Crop rotation results in increased yields and reduced production costs, providing a high rate of return. Our crop rotation model is tailored to each of our farming regions based on climatic and soil conditions. For example, in Argentina’s Humid Pampas, our three-year crop rotation cycle involves the planting of a wheat crop followed by a soybean double-crop in the first year, a corn crop in the second year, and a soybean crop in the third year. In some areas of the Argentine humid pampas with adequate agro-climatic conditions, we enhance our crop rotation by introducing some industrial crops such as peanut and confectionary sunflower.
Second Harvest - Double Cropping
Second harvest, also known as double cropping, is the practice of consecutively producing two crops on the same land within the same growing year. Double cropping is possible only in regions with long growing seasons, which is determined mainly by climate conditions such as rain and temperature. Double cropping allows us to increase the profitability of our land, diversify our production and commercial risk and enhance operational efficiencies through a better utilization of machinery, freight, labor and other resources, resulting in a dilution of our fixed costs. Double cropping has important agronomical advantages as well, such as having crops on the land for a longer period of time, which, enhanced by “no-till” and crop rotation practices, results in the improvement of the physical and chemical properties of the soil in the long term. We implement and adapt different double cropping systems for each of our productive regions in Argentina and Uruguay, with the most frequent being wheat/soybean, wheat/corn, sunflower/soybean, corn/soybean and sunflower/corn.
Integrated Pest Management (IPM)
Integrated pest management, or “IPM,” involves a deep analysis of agronomical, economic and environmental aspects with the goal of determining the most efficient way to control the pests. It simultaneously achieves three main goals: (i) enhancing crop productivity, (ii) reducing use of pesticides and (iii) decreasing the risk of agrochemical contamination. The first stage of IPM is to train the people who will be involved in pesticide usage. The pesticide to be applied is selected considering local regulations (only locally approved pesticides are used) and the minimum resulting environmental risks due to its chemical classification. Additionally, when selecting biotechnologically developed crops, we evaluate the potential reduction of pesticide uses that may be achieved. The doses of pesticides are defined by vendor recommendations and adjusted through agronomical expertise (specific to a crop and a pest). We are assessing the environmental impact of such pesticides by implementing the use of the Environmental Impact Quotient developed by Cornell University. The timing of pesticide application is based on economic threshold that takes into account the crop situation (growing stage, climate conditions), the potential damage of the pest (type, population, growing stage), the presence of “beneficial” pests, and finally, the price relationship between grains and pesticides. We also use biological pest controls by breeding and releasing natural enemies of the relevant pest, as is the case with the borer plague in sugarcane. The relevance of the pest is measured by implementing specific scouting methodologies, which are adapted to large-scale farming. Scouting is carried out by trained employees who supervise all the fields on a weekly basis. The pesticide doses are applied by high-tech machinery, the majority of which is outsourced. IPM machinery is accurately calibrated to increase its application efficiency and to reduce any potential contamination risk. Climate conditions are taken into account, as well, in determining the optimal timing for spraying, to avoid drifting, evaporation and leakage risks.
Balanced Fertilization
Balanced fertilization consists of determining an optimum use of fertilizers at the proper grades and in the proper amounts to supply the correct ratio of nutrients and to ensure that the soil will sustain high crop yields over time, consequently decreasing contamination risks. At the beginning of each crop season, we perform extensive soil studies in each of our farms to monitor the amount of organic matter, nitrogen, phosphorus and potassium levels in each field. Based on this analysis and considering the potential yield for each field, the crop rotation, and relative prices between fertilizers and agricultural products, we determine the optimum amount of fertilizer to be applied in order to maximize the economic response of the crop.
73
Water Management
Since crops need sufficient water to achieve their potential yields, we are engaged in techniques aimed to increase the efficiency of water usage and at the same time decrease soil erosion risks. In that regard, “no-till” presents strong advantages since it improves rainfall infiltration and increases the soil’s water storage capacity. In areas that may be subject to excess water, we are developing terraces, soil leveling and other techniques intended to decrease runoff and erosion risks. In some of the jurisdictions in which we operate, the use of water for irrigation requires obtaining special permits. For certain irrigated crops such as rice, we focus on the design and operation of rainwater harvesting, which is collecting water from rain in semi-natural reservoirs destined for future irrigation. In addition, we have developed a water recycle system for each farm where excess of water (derived from drainage and rainfalls) can be reused, instead of being drained out of the farm. Channels to conduct the water and drain the fields are developed by experts in order to deliver water in the most efficient manner. We have a developed precision leveling system (with zero or controlled grade level) in most of our rice farms to increase productivity and reduce production costs. This technique involves a precise leveling of the land based on GPS and laser technology. When fields are accurately leveled, water irrigation requirements are reduced, thus lowering the cost of labor and energy. Efficient management of irrigation results in a positive impact on yields.
Additionally, as fields can be larger, there are some operational benefits that can be achieved by reducing machinery working times. For example, we have implemented Polypipe irrigation system in the most mountainous rice fields. This technology consists of deploying plastic pipes to conduct irrigation water from a big channel to the fields, thus reducing water consumption, alongside with a small reduction of area devoted to infrastructure. In addition, we are using drones to assess water levels during rice irrigation season. Through this high-precision surveillance method, we are enhancing water management, which improves potential yield, while reducing water consumption. Drones use different cameras to detect water levels even when dense canopies cover the fields. Other crops, such as corn and sunflower seed, are irrigated by highly efficient pivot spraying systems. This type of irrigation system allows us to distribute water uniformly throughout the field, improving the use of water in terms of total millimeters per year. We conduct soil moisture sampling to define the best moment and amount of water to be used for irrigation in each plot.
Mechanization
We incorporate all available mechanization technology into our business that is cost-effective. We believe that by employing mechanization technology we improve our operating efficiency and are better able to reach desired economies of scale in our operations. Mechanization also enables us to adopt new associated technologies faster and hastens our development efforts. In our Farming business, we are using cutting-edge mechanized technology for planting, spraying, harvesting and irrigating and for soil preparation and management. We also employ advanced mechanization technology in our logistics and product processing operations, including transportation, drying operations and grain sorting and storage. We have developed mechanization technology to benefit sugarcane planting and harvesting, which traditionally have not benefited from such mechanization.
Synergies
The technologies we employ are very closely linked, and the joint implementation of a number of them will result in positive synergies for our entire production system. For example, implementation of the “no-till” technology can be enhanced by crop rotations, due to the positive biological effects generated by the different types of roots from each crop in the soil. Benefits of integrated pest management are improved when combined with the “no-till” and crop rotation strategies, since the crop stubble that remains on the soil can be a barrier to some plagues, and because some other pests are specific to a particular crop and the crop rotation can be sufficient to control them. We consider these synergies when we develop our crop seeding schedule. In the case of the reuse of residues, we benefited from our experience in sugarcane, where almost everything is reused and no residues are generated. By transferring such conceptual ideas to our dairy operations, we ended up reusing the manure from the cows to generate renewable electricity.
Agtech (Agricultural, Digital-Based Technology)
Since inception, we have been introducing cutting-edge technologies to increase our production efficiency. As digital and information-based technologies are rapidly advancing, we are currently devoting time and effort to work closely with agtech startups that could bring solutions to our operational processes. We are monitoring both local and international startups, with the goal of adopting efficient digital technology in our operations.
Industrial Technology
In recent years, we have incorporated several industrial facilities to our portfolio and have been actively enhancing their performance using technology. In our dairy industry, we replaced LPG gas with natural gas as a source of energy in the
74
facility of Morteros, thereby reducing both the cost of production and the environmental impact. At Morteros, we also incorporated the technology to produce fat filled, a product that helps us enhance our operational efficiency while achieving new markets. At the Chivilcoy facility, have incorporated technologies to produce and package UHT cream, yogurt and milk with cacao. These advances help us enhance our milk-based product portfolio. All these new products are based on our own formula and are developed by our production and quality team.
Information Technology
We employ the Oracle eBusiness Suite ERP to standardize and integrate our processes throughout the company and improve controls and information accuracy and consolidation. The Oracle eBusiness Suite allows us to fulfill our local accounting and fiscal needs while facilitating operational coordination across our geographic areas and lines of business, reducing our operational costs and minimizing duplication and inefficiencies. It also provides our management with consolidated results in a timely manner.
Cybersecurity
In accordance with the growing risks in cybersecurity like ransomware, viruses, trojans, hackers and other type of attacks, we have adopted a series of security measures designed to mitigate these risks. We are constantly implementing new technologies and solutions to assist in the prevention of potential and attempted cyberattacks, as well as protective measures and contingency plans in the event of an existing attack. We analyze the risks we face on an ongoing basis and, accordingly, strengthen our information technology infrastructure, update our policies, and raise awareness among our employees, to enhance our ability to prevent and respond to such risks.
We have created a cybersecurity officer position and have contracted a third-party provider specialized in cybersecurity to help us validate and develop our short-, mid- and long-term plans. This provider is also our 24x7 security operation center (SOC), which receives and analyzes the alerts from our monitoring system. This has allowed us to steadily increase the security at our facilities, as part of our commitment and decision to continue reinforcing our security systems, and to improve our contingency plans.
Environmental Aspects
We are implementing a production model that reflects a strong commitment to the environment. Our responsibility to the environment begins with complying with local regulations. To become better stewards of the environment, we are implementing environmental management plans for our operations. Those plans involve different stages, which include educating our own and outsourced staff, monitoring ecological parameters, preventing negative effects, and correcting deviations. Natural resources such as land, water, air and biodiversity are taken into account when we evaluate the development and operation of new and ongoing production projects and operations. In that regard, we are constantly evaluating best practices in our operations. See “—Technology and Best Practices.” With land being one of the most relevant natural resource in our operations, we have developed a sustainable land use strategy that considers factors beyond the requirements of local laws and regulations. There are ecosystems that we do not consider appropriate for agricultural development, such as heavy forests and key wetlands. We evaluate development of other areas (e.g. savannahs, natural grasses, bush land, lowlands) only after carrying out an environmental impact assessment. In addition to such evaluations, we analyze the agricultural potential of the land in respect of the soil, the climate, crop productivity and available technology, among other factors. Through this approach, we make sure that we grow the most suitable crop in each region with the aim of being the lowest-cost producer of the sector. We then consolidate our analysis into a land transformation plan, which includes the best land use option and implements best practices based on regenerative agriculture such as “no-till” technology, crop rotations, integrated pest and weed management, balanced fertilization, responsible pesticide usage and water management. In addition, in 2022, we planted 49,380 hectares of cover crops. These help prevent water and wind erosion, function as biological fallows, reduce the need to apply phytosanitary products and provide roots that increase soil porosity. We sow these crops and adapt the species to the agro-ecological environmental condition.
These best practices aim to increase resource efficiency and to decrease the risk of contamination and waste production and are consolidated into an environmental management plan, which includes biodiversity management when applicable. We aim to properly implement our sustainable production model to enhance land productivity and therefore increase land value. With respect to pesticide contamination risks, we are implementing a responsible pesticide use program, which includes personnel training, personnel protection elements, application recommendations, pesticide selection criteria, pesticide handling and storage and after-use pesticide packages (which are specifically cleaned, collected and stored for recycling purposes under third-party programs). In 2021, we began to implement the "Environmental Impact Quotient" indicator, which allows us to assess the potential risk of the applications of phytosanitary products and the impact caused by them. Further, in 2022, we increased the area where we use selective spray equipment to 34,843 hectares to reduce the doses of phytosanitary products using a machine to detect weeds, which allows us to apply the product only where necessary. We achieved a 74% reduction of
75
the phytosanitary products applied in that area. In addition, periodically train our personnel on our rice fields to raise awareness about the responsible use of phytosanitary products.
Additionally, in some regions where biodiversity matters are relevant, we are implementing biodiversity management plans, which mainly consists of the GTA periodically monitoring flora and fauna, detecting significant variations of their populations, and proposing measures to reduce any potential threats to local species. As a result, we are implementing some practices such as prohibiting hunting on our farms and developing environmental private protection areas (where natural vegetation is protected by implementing sustainable production practices). As environmental matters require specific expertise and an understanding of complex relationships, we hire highly qualified consultants, and are entering into cooperative arrangements and agreements with educational institutions.
In Brazil, we have the Brazilian Forestry Code (Código Florestal Brasileiro) as the main source for our environmental policies. Accordingly, we analyze and identify all natural areas inside our own farms and inside leased areas, and make a development plan that defines actions for their preservation. Some examples of these activities are the reforestation of Permanent Preservation Areas (Áreas de Preservação Permanente) and Legal Reserve Areas (Áreas de Reserva Legal). Along with natural regeneration techniques, we have produced seedlings of more than 70 native species to reforest those areas. We are strongly committed to the preservation of forests, and we only develop areas for farming if they were previously used for agricultural purposes or for pasture. We do not operate in massive forests, large wetlands or areas with high biodiversity value. We concern ourselves with the protection of riverbanks and surrounding areas of streams and springs, as they are important for soil conservation and as refuges for native fauna. In that regard, we are implementing periodic monitoring of wildlife and native flora as well.
In respect to our industrial processing activities, we focus on energy-efficient processes that increase productivity with minimum waste disposal. At the same time, we seek to promote the reuse of any by-product or residue within industrial processes when feasible, or in the fields when the economic analysis is sensible. A successful example of this approach is the use of manure to produce electricity and the use of biofertilizers to grow crops in our dairy farms. Another success story is the use of all sugar and ethanol industrial by-products (vinasse, filter cake and composted ashes) as biofertilizers in our cane fields.
Since November 2017, we are producing renewable electricity from our biodigester built in our dairy farm. The biodigester transforms cow manure into biogas with high methane content, which then fuels a cogeneration facility that generates 1.4 MW of electricity. The electricity produced is sold to the grid under a long-term contract with an Argentine federal utility. Additionally, as this project allows us to reduce greenhouse gas emissions, we have registered the project under the Verified Carbon Standard to deliver carbon credits from the biodigester. In 2011, we received a grant from the Sustainable Energy and Climate Change Initiative of the Inter-American Development Bank in order to carry out the pre-feasibility assessment. We have also received a grant from the National Agency of Scientific and Technologic Promotion (Agencia Nacional de Promoción Científica y Tecnologica), an agency that promotes technological innovation, to partially fund the investment. In July 2016, we participated in Argentina’s “RenovAr” renewable energy auction and entered into a 20-year contract to supply up to 9,145 MWh per year at an average price of US$158.92 per MWh plus bonuses. In 2022, our biodigester generated a record 9,560 MWh of renewable energy.
At the UMA mill, we implemented a pilot plant that produces biogas from vinasse, developed in partnership with Efficiencia, a subsidiary of Companhia Energética de Minas Gerais — CEMIG. The technology developed during this project will allow us to generate additional energy from vinasse while maintaining the fertilizer recycling potential at UMA. We have replicated this project at commercial scale in our Mato Grosso do Sul cluster. Currently, we are producing renewable electricity with it and have begun to evaluate the possibility of using biomethane as a portable fuel for trucks, lorries and cars, in line with the Sustainable Development Goals published by the United Nations, which urge all countries to ensure access to affordable and clean energy, among other objectives. We continue to fine-tune our production process to enhance efficiency, and once the technology begins to work accordingly, we may expand the capacity to maximize the production of biogas in this cluster. These emission reduction projects will also improve our efficiency by decreasing the carbon emission. In 2021, we certified our biogas facility as the first renewable gas plant in Brazil, which allows us to issue and sell carbon credits (gas-recs).
Since 2020, we have issued CBios under the RenovaBio program, the first company in Brazil to do so in the local markets. In 2022, we sold more than 550,000 CBios and 503,500 CBios in 2021. The better the environmental performance of our operations, the greater the number of CBios we could use, which drives us to enhance our performance year by year.
Social Programs
In addition to complying with local labor regulations, we seek to promote the personal and professional development of our employees by offering them an adequate working environment with proper health and safety protections. We aim to develop a transparent relationship with local authorities. Finally, one of our main goals is to contribute positively to the social development of the communities in which we operate, creating new jobs, preserving the environment, providing training
76
opportunities through our internship program and assisting with social development. In order to implement our social development programs, we analyze the areas in which we operate and give special attention to education and poverty rates, possible alliances with other social actors, and potential synergies with local government programs. In addition to social development programs, we contribute to community organizations in each area where we operate, such as hospitals, schools, daycare centers and fire stations, among others. In Argentina, we also have a voluntary matching program where Adecoagro matches each donation from our employees at a 2:1 ratio. In 2022, 15 organizations participated as recipients of our Matching program and received monthly donations.
Education
Our main initiatives are aligned with Sustainable Development Goal 4 – Quality Education. Our operations have a significant economic impact in the communities where we are located, and we have developed a Social Action Program in the various municipalities. In 2005, we started a partnership with Cimientos, a non-profit organization that promotes equal educational opportunities for children and youth from low-income families in Argentina. In 2022, we participated in Cimientos’ “Futuros Egresados” program, granting scholarships to 50 high-school students in Mercedes and Ita Ibate (Corrientes). In 2016, we started another program together with Conciencia (a local non-governmental organization) in which we support our employees’ children to complete their education. In 2022, 21 high-school and higher-education students from San Salvador (Entre Ríos) and Las Lajitas (Salta) participated in this program.
In 2019, we made a new alliance with the Reciduca Foundation with the aim of providing scholarships for young people from the community of Pilar to finish their secondary studies, expand their employment opportunities and promote environmental care. We have supported the program since its inception, and in 2022, we decided to include the community of San Isidro as well, increasing the total number of scholarships granted to 20.
Additionally, in 2022, we continued participating in the Escola Nota 10 Project in the municipalities of Angélica, Ivinhema and Novo Horizonte do Sul, in Mato Grosso do Sul. Through the project, we provide didactic material for teachers and students and carried out trainings for teachers and educators in municipal public schools aiming to improve basic education (1st to 3rd year). In 2022, this program reached 125 teachers and 2095 students.
Moreover, we participated in the Territorio do Saber project with the objective of improving the quality of teaching and learning processes in schools by promoting reading. In 2022, we trained 35 early childhood teachers and delivered four libraries to the municipality of Areado in Minas Gerais, reaching 1,200 students.
Nutrition
In Argentina, we work in partnership with two main organizations: the Conin Foundation and the Argentine Food Bank Network. The Conin Foundation fights malnourishment in children, focusing its actions in three main aspects: education, assistance and research. The Argentine Food Bank Network is a nonprofit distribution enterprise that serves the community by acquiring donated food and making it available to people in need through a network of community agencies. These agencies include school feeding programs, food pantries, soup kitchens, hospices, substance abuse clinics, after-school programs and other nonprofit organizations. In 2022, we donated nearly 470 tons of rice and dairy products to more than 90 organizations, including 13 Conin centers and eight food banks.
In 2022, we also contributed to the Conin Foundation with a significant monetary donation for the construction of its new recovery center for children under precarious conditions, which is able to receive more than 30 children from all over the country. Additionally, we have been contributing food to Solidagro, an alliance between rural corporate institutions and civic organizations that seek to solve famine and malnutrition problems, since 2007. We also collaborate with Haciendo Camino, a non-governmental organization fighting malnourishment in children in Santiago del Estero. We have been supporting the organization for the last years, and continued with our contributions to finance the early childhood program in Los Juries.
Prevention of Violence
We seek to train leaders and teams on this topic to understand all aspects of workplace violence. Our “Proteger” program aims to prevent violence, as it seeks to guide and inform employees and the community about possible ways to report and prevent the sexual abuse, the exploitation of children and adolescents, rape culture, violence against women and sexual or workplace harassment, while mobilizing society to contribute to this effort.
This program reinforces the idea that we do not admit, under any circumstance, the practice of any type of child labor, including by third-party suppliers and others with whom we may interact. In 2022, we trained 3,880 employees and conducted several training sessions with approximately 80 health professionals, reaching and impacting 100% of our employees and more than 12,000 people in the communities where we operate.
77
In 2021, we received the Woman-Friendly Company Seal (from Mato Grosso do Sul government), in recognition of our practices to prevent and combat violence advocated within the scope of the Proteger program.
Internship and Young Talent Program
The purpose of our internship and young talent program is to promote the development of highly qualified professionals from the community by providing first-time work experience, good quality training and access to highly technology-oriented operations. We seek to facilitate interns’ future access to the job market while detecting potential key employees. The interns actively participate in the TAG training program, which includes monthly technical meetings, external training and farm tours. In order to accomplish these goals we promote institutional relationships with local and international universities and high schools. In 2022, 170 interns and 34 young talents participated in our program, 29 and 32 of which, respectively, were subsequently incorporated into our teams.
Adecoagro’s 20 years in the Community
In 2022, we celebrated our company’s 20-year anniversary with a strong social impact. The celebration included activities involving our team members and their families, local schools and communities, such as the gifting of national flags to schools in Argentina and Uruguay and specific infrastructure initiatives for the benefit of local Argentine and Brazilian communities.
Material Agreements
For a description of the material agreements relating to our indebtedness, please see “Item 5. Operating and Financial Review and Prospects-— B. Liquidity and Capital Resources—Indebtedness and Financial Instruments.”
Brazil
Sugar Sale Agreements
In 2022, our largest four customers in this segment comprised approximately 94% of our sugar sales agreements. Adecoagro Vale do Ivinhema S.A. (via Adecoagro Uruguay S.A.) entered into sugar sales agreements with Louis Dreyfus Commodities, Suisse S.A, Viterra B.V. (formerly known as Glencore Agriculture B.V.), pursuant to which Adecoagro Vale do Ivinhema S.A. agreed to supply approximately 427,000 metric tons of Brazilian VHP sugar. This specific amount of sugar was delivered during the 2022 harvest year in Paranaguá port, and the price was fixed in reference to the ICE Sugar #11 Futures.
Electric Energy Agreements
Adecoagro Vale do Ivinhema S.A. entered into an agreement for the sale of energy to CCEE. This agreement is a result of a public auction by the Brazilian federal government conducted in May 2008, carries a term of 15 years, and requires Adecoagro Vale do Ivinhema S.A. to supply CCEE with 87,600 MWh annually during the harvest periods each year (April to December), at a rate of R$347.77/MWh. The price of energy under the contract is adjusted annually according to inflation.
In August 2010, Adecoagro Vale do Ivinhema S.A. participated in a public auction by the Brazilian federal government. As a result of this auction, Adecoagro Vale do Ivinhema S.A. entered into second 15-year agreement with CCEE starting in 2011, for the sale of 131,400 MWh per year at a rate of R$308.19/MWh.
Intellectual Property
As of April 2022, our corporate group owned 49 trademarks registered with the Argentine National Intellectual Property Institute and had 5 trademarks in the process of registration. Also, Adeco Brasil and UMA owned 20 trademarks registered with the Brazilian National Industrial Property Institute (“INPI”), and had submitted 1 trademark registration requests, all of which are currently being challenged by third parties or were initially denied by INPI. In addition, Adeco Agropecuaria Brasil S.A. had submitted one trademark for registration. Agroglobal S.A. (now Adecoagro Uruguay S.A.) has one trademark registered in Uruguay.
In Argentina, we are required to renew our trademark registrations when they expire at the end of their respective terms. Under the Argentine Trade and Service Marks Law No. 22,362, the term of duration of a registered trademark is 10 years from its issue date, and a trademark may be indefinitely renewed for equal periods thereafter if, within the five-year period prior to each expiration, the trademark was used in the marketing of a product, in the rendering of a service or as the designation of an activity.
78
In Brazil, title to a trademark is acquired only once its valid registration has been issued by the INPI. During the registration process, the person requesting the trademark merely has an expectation of the right to use the trademark to identify its products or services. Under Law No. 9,279, of May 14, 1996 (the Brazilian Industrial Property Law), the holder of a trademark has the right to its exclusive use throughout Brazil. The term of duration of a registered trademark is 10 years from its issue date, and a trademark may be indefinitely renewed for equal periods thereafter. Within a five-year period from the issue date, the owner has an obligation to use the trademark in the marketing of a product, in the rendering of a service or as the designation of an activity. If the owner does not use the trademark within such five-year period, it may be subject to a forfeiture process, upon request of any third party with legitimate interest in the trademark. The same forfeiture process may occur if the owner fails to use the trademark for any five-year period, continuously. If the trademark is declared forfeited, the trademark rights are terminated.
Insurance
The type and level of insurance coverage we obtain is determined based on consultation with leading insurance brokers. We carry policies with leading U.S., European, and local insurance companies, and we are currently insured against a variety of risks, including losses and damages relating to our plants, equipment and buildings. We believe our level of insurance coverage is customary and appropriate for a company of our size and with respect to our activities. Our insurance currently covers only part of the losses we may incur and does not cover losses on crops due to hail storms, fires or similar risks.
Legal and Administrative Proceedings
In the ordinary course of business, we are subject to certain contingent liabilities with respect to existing or potential claims, lawsuits and other proceedings, including those involving tax, social security, labor lawsuits and other matters. We accrue liabilities when it is probable that future costs will be incurred and such costs can be reasonably estimated. See “Item 8. Financial Information —A. Consolidated Statements and Other Financial Information—Legal and Administrative Proceedings.”
Environmental Regulations and Compliance
Our businesses in the various emerging market countries in which we operate are subject to comprehensive national, state and municipal laws and regulations relating to the preservation and protection of the environment to which those businesses must adhere. These laws and regulations require some of our businesses to obtain permits or licenses that have to be renewed periodically in order to allow us to continue to operate. If such permits or licenses lapse or are not renewed or if we fail to obtain any required environmental licenses and permits, or if we do not comply with any other requirements or obligations established under the applicable environmental laws and regulations, we may be subject to environmental liability at administrative level (fines, partial or total suspension of operations and suspension or cancellation of environmental licenses and permits.), criminal and/or civil level (recovery of any damage caused). In addition, our businesses which hold debt from banks, and multilateral lenders in particular, are typically required to adhere to environmental standards that exceed those of the country in which the business operates (e.g., World Bank standards).
We are currently either in compliance with or are in the process of applying for permits that would put us in compliance with all applicable environmental laws and environmental licenses and permits. Specifically, the operational license of UMA is valid, having been issued on September 5, 2016, and is valid for eight years. On June 10, 2014, we applied for the renewal of the operational license for the Angélica mill, which has been issued on March 29, 2019, authorizing to mill up to 6.5 million tons of sugarcane per year, valid until March 28, 2023. On April 24, 2015, we obtained an installation license (licença de instalação) for the Ivinhema mill authorizing its installation. On July 23, 2015, we obtained the operational license (licença de operação) from IMASUL authorizing us to mill up to five million tons of sugarcane per year. The current operating license (licença de operação) of the Ivinhema mill was issued on July 27, 2021, and is valid for six years, authorizing us to mill up to 7.2 million tons of sugarcane per year. In addition to the installation and operational license, the Ivinhema mill also obtained other permits including licenses for water capture and gas station operation, among others. Failure to obtain the necessary environmental licenses may prevent us from operating the Ivinhema mill or may subject us to sanctions.
Our operating businesses have the required environmental monitoring, equipment and procedures, and we utilize third-party contractors to conduct regular environmental audits. Our environmental expenses relate to consultants we use to perform environmental impact studies for our development projects and control and monitoring procedures. However, as environmental regulations are expected to become more stringent in some of the countries where we operate, our environmental compliance costs are likely to increase due to the cost of compliance with any future environmental regulations. While we are not aware of any material environmental liabilities related to our ongoing operations, we may be subject to cleanup costs, which we do not expect to be material.
79
Regulation and Control of Agri-Food Production in Argentina
As of February 25, 2011, the National Office of Commercial Agropecuarian Control (“Oficina Nacional de Control Comercial Agropecuario” or “ONCCA”) was dissolved pursuant to Decree No. 192/2011. The powers previously held by the ONCCA were transferred to the Ministry of Agriculture, Livestock and Fishing (Ministerio de Agricultura, Ganadería y Pesca, or the “Ministry of Agriculture”) of Argentina and to the Internal Consumer Subsidy Coordination and Evaluation Unit (Unidad de Coordinación y Evaluación de Subsidios al Consumo Interno or “UCESCI,” after its acronym in Spanish), an entity created by means of Decree No. 193/2011. Such entity was then dissolved by means of Decree No. 444/2017, which transferred the powers granted to the UCESCI to the Ministry of Agriculture. As a result, the Ministry of Agriculture is the authority in charge of enforcing the decrees issued by the ONCCA. The Ministry of Agriculture is also charge of monitoring agricultural compliance with commercialization regulations. Moreover, the Ministry Agriculture is responsible for the administration, allocation and payment of subsidies for wheat, corn and soybean, and managing the registry for the export of cattle.
Under applicable regulations, all persons involved in the commercialization and manufacturing of grains and dairy products must be registered with the Registry of Operators of the Agro-industrial Chain (Registro Único de Operadores de la Cadena Agroindustrial or “RUCA” after its acronym in Spanish), which provides for the registration of any individual or company involved in the trade and industrialization of agri-food products in the markets for grains, livestock and dairy products and their by-products and derivatives, pursuant to Resolution No. 302/2012, as amended, issued by the Ministry of Agriculture. According to annex I of Resolution No. 21/2017, the RUCA has no expiration date, as long as the conditions and requirements established in connection with its granting and validity are met by the operator, and it complies with the obligations imposed by current and future regulations. Grain producers must stock grains at facilities and maintain a record of the grain stock stored at such facilities to be filed with the RUCA. Failure to register with the RUCA, or cancellation of such registration, may result in the ceasing of operating activities by the operator and closure its facilities.
On February 26, 2014, the Public Income Federal Administration (“Administración Federal de Ingresos Públicos” or “AFIP”) issued Resolution No. 3,593/14, which became effective on April 1, 2014. This resolution established a Systematic Registration of Movements and Grains Stocks Regime (Régimen de Registración Sistemática de Movimientos y Existencias de Granos), which requires all producers involved in the commercialization and manufacturing of grains and dairy products registered in the RUCA to report the stock and stock variations (including locations, transportation between the producer facilities, etc.) of all grains other agricultural products (other than those to be applied to sowing) held by them or on behalf of a third party.
Violations to any of the applicable regulations may result in the application of sanctions, including fines, suspensions and the cancellation of the registration, which may, in turn, result in an immediate cessation of activities and closure of facilities.
On April 15, 2021, the Ministry of Agriculture issued Resolution No. 60/2021, which was published in the Official Gazette on April 19, 2021. This resolution specifies that dairy and grain exporters who did not register an establishment in the RUCA must provide additional information. Pursuant to Decree No. 131/2022, the Argentine government, suspended export duty rates over certain products as a temporary and transitory measure in accordance with as set forth by Decree No. 790/2020 until December 31, 2022. As a result, export duty rates only remain applicable to products under the “Common Nomenclature of Mercosur” included in such decree. In addition, the Argentine government issued Decree No. 132/2022, ordering the creation of the Argentine Grain Stabilization Fund (Fondo Estabilizador del Trigo Argentino) to contribute to the mitigation of the increase in the price per ton of grain bought by Argentine windmills as a result of the conflict between Russia and Ukraine.
Recent Developments
“La Niña” weather event
“La Niña” is a weather phenomenon caused by the fluctuation of the ocean temperatures in the central and eastern equatorial Pacific due to changes in the atmosphere, which affects the climate of several regions worldwide. When the temperature of the ocean decreases by 0.5°C below the five-quarter average, a so called “La Niña” weather pattern begins. This whether phenomenon is characterized by below average precipitations during spring and summertime in South America. We have experienced this weather pattern in Argentina and Uruguay, where most of our Farming operations are based, throughout the last three consecutive years and it has extended its effects during the beginning of 2023 and continue affecting production as of today, resulting in a severe drought in almost all productive regions in Argentina and Uruguay. Our diversification in terms of geographic footprint and crops planted (soybean, peanut, corn, wheat, sunflower, among others), acts as a natural hedge against weather risk, and enables us to adopt defensive strategies such as delaying planting activities and switching between crops which are either more resilient to dry weather or have a later development stage. However, and despite our ability to partially mitigate this effect, this year, as a consequence of the La Niña weather event, we foresee that the yields of our different
80
crops will see a reduction ranging from 18% to 60%, depending on the crop, thus significantly affecting our results of operations.
C.ORGANIZATIONAL STRUCTURE
Corporate Structure
We are a corporation organized under the laws of the Grand Duchy of Luxembourg under the form of a société anonyme. As of April 25, 2023, we held approximately 100% of the interests in Adecoagro LP S.C.S., a société en commandite simple organized under Luxembourg law with a de minimis remaining interest owned by Adecoagro GP S.à r.l, a société à responsibilité limitée organized under Luxembourg law and our substantially wholly-owned subsidiary. Adecoagro LP S.C.S. is a holding company with operating subsidiaries owning farmland and facilities throughout Argentina, Brazil and Uruguay. For a diagram of our Organizational structure as of April 24, 2023, please see “Item 4. Information on the Company—A. History and Development of the Company—History.”
As of April 24, 2023 our principal shareholders were Al Gharrafa Investment Company, Stichting Pensioenfonds Zorg en Welzijn, Route One Investment Co LP, EMS Capital LP, Directors, Executive Officers and Company’s employees as a group and Grantham Mayo Van Otterloo & Co LL. See “Item 7. Major Shareholders and Related Party Transactions—A. Major Shareholders.”
D.PROPERTY, PLANTS AND EQUIPMENT
See “B. Business Overview—Land Transformation—Our Farms”; “—Property, Plant and Equipment.”
Item 4A. Unresolved Staff Comments
Not applicable.
Item 5. Operating and Financial Review and Prospects
Item 5 of this Annual Report on Form 20-F discusses the Company’s operating and financial review and prospects as of and for the fiscal years ended December 31, 2022 and 2021. For a discussion of the Company’s operating and financial review and prospects as of and for the fiscal years ended December 31, 2021 and 2020, see "Item 5 Operating and Financial Review and prospects—A. Operating and Financial Review and Prospects—Operating Results—Results of Operations—Year Ended December 31, 2021 Compared to Year Ended December 31, 2020,” —B. Liquidity and Capital Resources” and "—Cash Flows—Cash Flows for the Year Ended December 31, 2021 compared to Year Ended December 31, 2020” included in our Annual Report on Form 20-F for the fiscal year ended December 31, 2021 filed with the SEC on April 28, 2022 are incorporated herein by reference.
Overview
We are engaged in agricultural, manufacturing and land transformation activities. Our agricultural activities consist of harvesting certain agricultural products, including crops (soybeans, corn, wheat, peanuts, sunflower, etc.), rough rice, and sugarcane, for sale to third parties and for internal use as inputs in our various manufacturing processes, and producing fluid milk. Our manufacturing activities consist of (i) selling manufactured products, including processed peanuts, sunflower rice, sugar, ethanol and energy, among others, (ii) in our milk facilities we produce UHT and UP milk, powder milk and semi-hard cheese, among others; and (iii) providing services, such as grain warehousing and conditioning and handling and drying services, among others. Our land transformation activities consist of the acquisition of farmlands or businesses with underdeveloped or underutilized agricultural land and implementing production technology and agricultural best practices to enhance yields and increase the value of the land. See also “Item 3. Key Information—D. Risk Factors —Risks Related to the Countries in Which We Operate—Laws on the foreign ownership of rural properties may adversely affect our results of operations and future investments in rural properties.”
We are organized into three main lines of business: Farming; Land Transformation; and Sugar, Ethanol and Energy. These lines of business consist of six reportable operating segments, which are evaluated by the chief operating decision-maker based upon their economic characteristics, the nature of the products they offer, their production processes and their type and class of customers and distribution methods. Our Farming business is comprised of four reportable operating segments: Crops,
81
Rice, Dairy, and All Other Segments. Each of our Sugar, Ethanol and Energy and Land Transformation lines of business is also a reportable operating segment. See “—Operating Segments” for a discussion of our six operating reportable segments.
There are significant economic differences between our agricultural and manufacturing activities. In addition to our agricultural activities, we perform manufacturing activities in the Crops (including peanut and sunflower products), Dairy, Rice and Sugar, Ethanol and Energy segments. Our other agricultural activities including those within Crops and All Other Segments do not involve further manufacturing processes. The table below sets forth our agricultural and manufacturing activities by segment.
| Segment | Agricultural Product | Manufactured Product and Services Rendered | ||||||||||||
| Crops | Soybean, Corn, Wheat, Sunflower and Peanuts among others | Industrialized peanuts and sunflower, grain drying and conditioning | ||||||||||||
| Rice | Rough rice | White rice and brown rice and snacks | ||||||||||||
| Dairy | Fluid milk | UHT and UP milk, powder milk and semi-hard cheese, among others | ||||||||||||
| Sugar, Ethanol and Energy | Sugarcane | Sugar, Ethanol and Energy | ||||||||||||
Manufacturing Activities
The gross profit of our manufacturing activities is a function of our sales of manufactured products and services rendered and the related costs of manufacturing those products or delivering those services. We recognize an amount of revenue representing the actual dollar amount collected or to be collected from our customers. Our principal costs consist of raw materials, labor and social security expenses, maintenance and repairs, depreciation, lubricants and other fuels, among others. We obtain our raw materials principally from our own agricultural activities and, to a lesser extent, from third parties.
Agricultural Activities
Our agricultural activities involve the management of the biological transformation of biological assets into agricultural produce for sale to third parties, or into agricultural products that we use in our manufacturing activities. We measure our biological assets and agricultural produce in accordance with IAS 41 "Agriculture." IAS 41 requires biological assets to be measured on initial recognition and at each balance sheet date at their fair value less cost to sell, with changes in fair value recognized in the statement of income as they occur. As market prices are generally not available for biological assets while they are growing, we use the present value of expected net cash flows as a valuation technique to determine fair value, as further discussed below in Note 32 to our Audited Consolidated Financial Statements. In addition, agricultural produce at the point of harvest is measured at fair value less cost to sell, which is generally determined by reference to the quoted market price in the relevant market. Consequently, the gains and losses arising on initial recognition and changes in fair value of our biological assets and the initial recognition of our agricultural produce at the point of harvest are accounted for in the statement of income in the line item "Initial recognition and changes in fair value of biological assets and agricultural produce."
After agricultural produce is harvested, we may hold it in inventory at net realizable value up to the point of sale, which includes market selling price less direct selling expenses, with changes in net realizable value recognized in the statement of income when they occur. When we sell our inventory, we sell at the prevailing market price and we incur direct selling expenses.
We generally recognize the agricultural produce held in inventory at net realizable value with changes recognized in the statement of income as they occur. Therefore, changes in net realizable value represent the difference in value from the last measurement through the date of sale on an aggregated basis.
We consider gains and losses recorded in the line items of the statement of income "Initial recognition and changes in fair value of biological assets and agricultural produce" and "Changes in net realizable value of agricultural produce after harvest" to be realized only when the related produce or manufactured product is sold to third parties and, therefore, converted into cash or other financial assets. Therefore, "realized" gains or losses mean that the related produce or product has been sold and the proceeds are included in revenues for the year. See Note 32 to our Audited Consolidated Financial Statements.for a discussion of the accounting treatment, financial statement, presentation and disclosure related to our agricultural activities.
Land Transformation
The Land Transformation segment includes two types of operations. The first relates to the acquisition of farmlands or businesses with underdeveloped or underutilized agricultural land (land which we have identified as capable of being
82
transformed into more productive farmland by enhancing yields and increasing its future value). When we acquire a farmland business for an acquisition price below its estimated fair value, we recognize an immediate gain (a "purchase bargain gain"). The land acquired is recognized at its fair value at the acquisition date and is subsequently recorded under the revaluation model based on periodic, but at least annual, valuations prepared by an external independent expert.
The second type of operation undertaken within this segment relates to the realization of value through the strategic disposition of assets (i.e.,farmland) that may have reached full development potential. Once we believe certain land has reached full growth potential, we may decide to realize such incremental value through the disposition of the land.
The results of these two activities (purchase bargain gains as a result of opportunistic acquisitions of businesses with underdeveloped or underutilized land below fair market value, and gains on dispositions reflecting the ultimate realization of cash value on dispositions of transformed farmlands) are included separately in the Land Transformation segment.
Land transformation activities themselves are not reflected in this segment; rather, they are reflected in all of our other agricultural activities in other segments. The results of our land transformation strategy are realized as a separate activity upon disposition of transformed farmlands and other rural properties.
83
A. OPERATING RESULTS
Trends and Factors Affecting Our Results of Operations
Effects of Yield Fluctuations
The occurrence of severe adverse weather conditions, especially droughts, hail, floods or frost, are unpredictable and may have a potentially devastating impact on agricultural production and may otherwise adversely affect the supply and prices of the agricultural commodities that we sell and use in our business. The effects of severe adverse weather conditions may also reduce yields at our farms. Yields may also be affected by plague, disease or weed infection and operational problems. See Item—3. Key Information—D. Risk Factors—Risks Related to Our Business and Industries—Unpredictable weather conditions, including as a result of climate change, pest infestations and diseases may have an adverse impact on agricultural production.”
The following table sets forth our average crop, rice and sugarcane yields per hectare for the periods indicated:
| 2021/2022 | 2020/2021 | 2019/2020 | % Change | ||||||||||||||||||||||||||
| Harvest Year | Harvest Year | Harvest Year | 2021/2022 -2020/2021 | 2020/2021 -2019/2020 | |||||||||||||||||||||||||
| Corn (1) | 5.9 | 5.7 | 6.0 | 3.5 | % | (5.0) | % | ||||||||||||||||||||||
| Soybean | 2.5 | 2.5 | 2.5 | — | % | — | % | ||||||||||||||||||||||
| Wheat (2) | 3.0 | 2.8 | 3.2 | 7.1 | % | (12.5) | % | ||||||||||||||||||||||
| Peanut | 2.8 | 3.0 | 3.3 | (6.7) | % | (9.1) | % | ||||||||||||||||||||||
| Sunflower | 1.7 | 1.8 | 1.9 | (5.6) | % | (5.3) | % | ||||||||||||||||||||||
| Rice | 6.8 | 7.8 | 6.7 | (12.8) | % | 16.4 | % | ||||||||||||||||||||||
| Sugarcane (3) | 66.5 | 68.6 | 79.0 | (3.1) | % | (13.2) | % | ||||||||||||||||||||||
(1) Includes sorghum and chia.
(2) Includes barley, rye, oats, chickpea and black pea.
(3) Does not consider harvested area for planting activities.
Effects of Fluctuations in Production Costs
We experience fluctuations in our production costs due to the fluctuation in the costs of fertilizers, agrochemicals, seeds, fuel, farm leases and labor. The use of advanced technology, however, allows us to increase our efficiency, in large part mitigating the fluctuations in production costs. Some examples of how the implementation of production technology has allowed us to increase our efficiency and reduce our costs include the use of no-till technology (also known as “direct sowing,” which involves farming without the use of tillage, leaving plant residues on the soil to form a protective cover which positively impacts costs, yields and the soil), crop rotation, second harvest in one year, integrated pest management, and balanced fertilization techniques to increase the productive efficiency in our farmland. Increased mechanization of harvesting and planting operations in our sugarcane plantations and utilization of modern, high-pressure boilers in our sugar and ethanol mills has also yielded higher rates of energy production per ton of sugarcane milled. In addition, we reuse all the waste from our sugar cane processing, which together with the ashes from the boilers, and the filter cake, undergo a composting process and are used as organic fertilizer to grow sugarcane, allowing us to reduce chemical fertilizer consumption, while contributing to the environment. We also use manure in our dairy farms to generate electricity with biodigesters.
Effects of Fluctuations in Commodities Prices
Commodity prices have historically experienced substantial fluctuation. For example, between January 1 ,2022 and December 31, 2022, sugar prices increased by 6.1%, according to Intercontinental Exchange of New York (“ICE-NY”) data, and ethanol prices decreased by 13.4%, according to Escola Superior de Agricultura “Luiz de Queiroz” (“ESALQ”) data. Also, based on Chicago Board of Trade (“CBOT”) data, from January 1, 2022, and December 31, 2022, soybean prices increased 14.3% and corn prices increased by 14.4%. Commodity price fluctuations affect our consolidated statements of income, as they have an effect over:
•the initial recognition and changes in the fair value of biological assets and agricultural produce in respect of unharvested biological assets undergoing biological transformation;
84
•changes in net realizable value of agricultural produce for inventory carried at its net realizable value; and
•sales of manufactured products and agricultural produce to third parties.
The following graphs show the spot market price of some of our main products between December 31, 2016 and December 31, 2022, highlighting the period between January 1 and December 31, 2022:
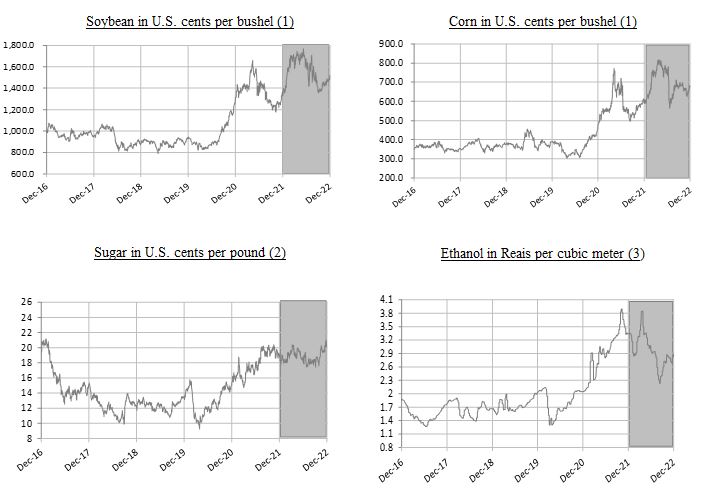
(1) Source: CBOT
(2) Source: ICE-NY
(3) Source: ESALQ
Fiscal Year and Harvest Year
Our fiscal year begins on January 1 and ends on December 31 of each year. However, our production is based on the harvest year for each of our crops and rice. A harvest year varies according to the crop or rice plant and to the climate in which it is grown. Due to the geographic diversity of our farms, the planting period for a given crop or rice may start earlier on one farm than on another, causing differences for their respective harvesting periods. The presentation of production volume (tons) and production area (hectares) in this report in respect of the harvest years for each of our crops and rice starts with the first day of the planting period at the first farm to start planting in that harvest year to the last day of the harvesting period of the crop or rice planting on the last farm to finish harvesting that harvest year.
On the other hand, production volumes for dairy, processed rice and production volume and production area for sugar, ethanol and energy business, along with the financial results in respect of our products are presented on a fiscal year basis.
85
Effects of Fluctuations of the Production Area
Our results of operations also depend on the size of the production area. The size of our own and leased area devoted to crop, rice and sugarcane production fluctuates from period to period in connection with the purchase and development of new farmland, the sale of developed farmland, the lease of new farmland and the termination of existing farmland lease agreements. Lease agreements are usually settled following the harvest season, from July to September for crops and rice, and from May to April for sugarcane. The length of the lease agreements is usually one year for crops, one to five years for rice and seven years for one-cycle sugarcane or 14 years for a two-cycle of sugarcane. Regarding crops, the production area can be planted and harvested once or twice per year. For example, wheat can be planted in July and harvested in December. Once harvested, soybean can be planted in the same area and harvested in April. As a result, planted and harvested areas can maximize their production in any given year. The production area for sugarcane can exceed the harvested area in one year. Grown sugarcane can be left in the fields and then harvested the following year.
The following table sets forth the production area for the periods indicated:
| Year ended December 31, | |||||||||||||||||||||||||||||
| 2022 | 2021 | 2020 | Chg (%) 2022-2021 | Chg (%) 2021-2020 | |||||||||||||||||||||||||
| Hectares | |||||||||||||||||||||||||||||
Crops (1) | 194,236 | 176,825 | 162,280 | 9.8 | % | 9.0 | % | ||||||||||||||||||||||
| Rice | 60,857 | 44,282 | 41,544 | 37.4 | % | 6.6 | % | ||||||||||||||||||||||
| Sugar, Ethanol and Energy | 192,987 | 185,806 | 176,651 | 3.9 | % | 5.2 | % | ||||||||||||||||||||||
(1) Does not include second crop and forage area.
The increase in the Crops production area in 2022 was mainly driven by the increase in leased area. The increase in the Rice production area was mainly driven by the acquisition of Viterra’s rice operation in Uruguay in May 2022.The increase in sugar, ethanol and energy production area in 2022 is explained by an increase in the leased space to ensure the sufficiency of our cane supply during the entire year in accordance with our long-term growth plan.
Effect of Acquisitions, Dispositions and Land transformation
Our business model also includes the identification, acquisition, development and selective disposition of farmlands or other rural properties that we deem to have the potential increase their market value after implementing agricultural best practices and increasing crop yields. As a part of this strategy, we purchase and sell farms and other rural properties from time to time, subject to the restrictions described in “Item 3. Key Information—Risk Factors—Risks Related to the Countries in Which We Operate—Laws on the foreign ownership of rural properties may adversely affect our results of operations and future investments in rural properties.”
The results included in the Land Transformation segment are related to the acquisition and disposition of farmland businesses and not to the physical transformation of the land. The decision to acquire and dispose of a farmland business depends on several market factors that vary from period to period, rendering the results of these activities in one financial period when an acquisition of disposition occurs not directly comparable to the results in other financial periods when no acquisitions or dispositions occurred.
Macroeconomic Developments in Emerging Markets
We generate nearly all of our revenue from the production of food and renewable energy in emerging markets. Therefore, our operating results and financial condition are directly impacted by macroeconomic and fiscal developments, including fluctuations in currency exchange rates, inflation and interest rate fluctuations, in those markets. The emerging markets where we conduct our business (including Argentina, Brazil and Uruguay) remain subject to such fluctuations. See “Item 3. Key Information—D. Risk Factors—Risks Related to the Countries in Which We Operate—Our results of operations and financial condition are dependent upon economic conditions in the emerging countries in which we operate” and “—Economic and political conditions in the countries in which we operate, and the perception of these conditions in international markets, may adversely impact our business, our access to the capital and debt markets, our results of operations and financial condition.”
Moreover, economic conditions of the countries in which we operate may be impacted by inflation over domestic prices, which may result in higher costs and affect our revenues. High inflation rates may undermine the conditions that allow
86
us to grow in those countries and induce to macroeconomic volatility, affecting overall competitiveness, increasing social and economic inequality, reducing employment, consumption and the level of economic activity and undermining confidence in banking system, which could further limit domestic and international credit availability. In 2022, inflation in local currency in Argentina, Brazil and Uruguay has been 94.8%, 5.9% and 8.29%, respectively. We present our result from operations adjusted by the effect of hyperinflation accounting policies and translation for our Argentine operations according to IAS 29 (see “Presentation of Financial and Other Information—Financial reporting in a hyperinflation economy). For further detail on the impact of inflation, see “Item 3. Key Information—D. Risk Factors—Risks Related to the Countries in Which We Operate—Inflation in some of the countries in which we operate, along with governmental measures to curb inflation, may have a significant negative effect on the economies of those countries and, as a result, on our financial condition and results of operations.”
In addition, government policies enacted in the countries where we operate may have a material impact, or could materially affect, the Company’s operations. See “Item 3. Key Information—D. Risk Factors—Risk related to Our Business and Industries—Governmental policies reducing the amount of ethanol required to be added to gasoline, or eliminating tax incentives for flex-fuel vehicles, may adversely affect our business” and “—Our business is subject to significant governmental regulation, which may adversely affect our results of operations and financial condition.” See also “Item 4—Information about the Company—B. Business Overview—Recent Developments,” for additional information concerning macroeconomic events, including the COVID-19 pandemic.
Effects of Export Taxes on Our Products
Since December 2019, after a change in the executive branch of the government in Argentina, export taxes were adjusted as per the following table:
| Product | Export tax | Cap per dollar exported | ||||||
| Soybean and derivatives | 33% | — | ||||||
| Corn | 12% | — | ||||||
| Wheat | 12% | — | ||||||
| Peanut | 7% | — | ||||||
| Sunflower | 5% | — | ||||||
| Cotton | 5% | — | ||||||
| Rice | 5% | — | ||||||
| UHT Milk | 12% | Ps. $3/U.S. dollar | ||||||
| Powder Milk | 9% | — | ||||||
| Cheese | 12% | Ps. $3/U.S. dollar | ||||||
As local prices are determined taking into consideration export parity reference, any increase or decrease in export taxes would affect our results of operations.
Effects of Foreign Currency Fluctuations
Each of our Argentine, Brazilian and Uruguayan subsidiaries use local currency as its functional currency. A significant portion of our operating costs in Argentina are denominated in Argentine Pesos and most of our operating costs in Brazil are denominated in Brazilian Reais. For each of our subsidiaries’ statements of income, foreign currency transactions are translated to local currency, as such subsidiaries’ functional currency, using the exchange rates prevailing as of the dates of the relevant specific transactions. Exchange differences resulting from the settlement of such transactions and from the translation at year-end exchange rates of monetary assets and liabilities denominated in foreign currencies are recognized in the statement of income under “finance income” or “finance costs,” as applicable. Our Consolidated Financial Statements are presented in U.S. dollars, and foreign exchange differences that arise in the translation process are disclosed in the consolidated statement of comprehensive income.
As of December 31, 2022, the Argentine Peso-U.S. dollar exchange rate was Ps. 177.1 per U.S. dollar as compared to Ps. 102.7 per U.S. dollar as of December 31, 2021. As of December 31, 2022, the Real-U.S. dollar exchange rate was R$5.28 per U.S. dollar as compared to R$5.57 per U.S. dollar as of December 31, 2021.
The following graph shows the Argentine Peso-U.S. dollar rate and the real-U.S. dollar rate of exchange between December 31, 2016 and December 31, 2022, highlighting the period between January 1 and December 31, 2022:
87
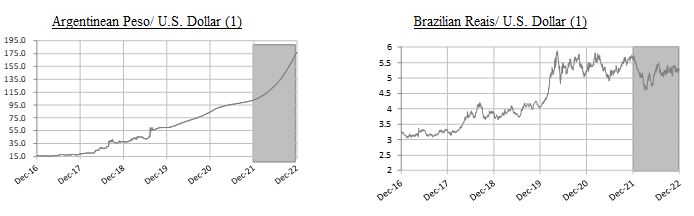
(1) Source: Bloomberg
Our principal foreign currency fluctuation risk involves changes in the value of the Brazilian Reais and the Argentine Peso relative to the U.S. dollar. Periodically, we evaluate our exposure and consider opportunities to mitigate the effects of currency fluctuations by entering into currency forward contracts and other hedging instruments.
Seasonality
Our business activities are inherently seasonal. We generally harvest and sell corn, soybean, rice, peanut and sunflower between February and August, and wheat from December to January. With the implementation of the "continuous harvest method,” sugarcane production is more stable during the year; however, the typical harvesting period in Brazil begins between April and May and ends between November and December. Sales of ethanol are generally concentrated during off-season to capture higher seasonal prices. Sales in other business segments, such as in our Dairy segment, tend to be more stable. However, milk sales are generally higher during the fourth quarter, when weather conditions are more favorable for production. As a result of the above factors, there may be significant variations in our results of operations from one quarter to another, since planting activities may be more concentrated in one quarter compared to another. In addition, our quarterly results may vary as a result of the effects of fluctuations in commodity prices and production yields and costs related to the “Initial recognition and changes in fair value of biological assets and agricultural produce” line item. See Note 32 to our Audited Consolidated Financial Statements.
Capital Expenditures and Other Investments
Capital expenditures totaled US$229.1 million, US$205.2 million and US$166.8 million for the years ended December 31, 2022, 2021 and 2020, respectively. Our capital expenditures during the last three years consisted mainly of expenses related to (i) transforming and increasing the productivity of our land, (ii) planting sugarcane and (iii) expanding and upgrading our production facilities.
Effects of Corporate Taxes on Our Income
We are subject to a variety of taxes on our results of operations. The following table shows the applicable income tax rates in effect for 2022:
| Tax Rate (%) | |||||
Argentina (1) | 35 | ||||
| Brazil | 34 | ||||
| Uruguay | 25 | ||||
| Spain | 25 | ||||
| Luxembourg | 24.94 | ||||
| Chile | 27 | ||||
________________________________________________________________________________________________
(1)Includes the Social Contribution on Net Profit (Contribuição Social Sobre o Lucro Líquido).
88
Operating Segments
IFRS 8 “Operating Segments” requires an entity to report financial and descriptive information about its reportable segments, which are operating segments or aggregations of operating segments that meet specified criteria. Operating segments are components of an entity about which separate financial information is available that is evaluated regularly by the chief operating decision maker (or the "CODM”) in deciding how to allocate resources and in assessing our performance. The CODM evaluates the business based on the differences in the nature of its operations, products and services. The amount reported for each segment item is the measure reported to the CODM for these purposes.
We operate in three major lines of business, namely: Farming, Sugar, Ethanol and Energy, and Land Transformation. In addition, we have a fourth set of Corporate activities.
•Our Farming business is further comprised of four reportable segments:
▪Crops: consists of the planting, harvesting and sale of grains, oilseeds and fibers (including wheat, corn, soybeans, peanuts and sunflowers, among others), and to a lesser extent the provision of grain warehousing/conditioning, handling and drying services to third parties and the purchase and sale of crops produced by third parties. Each underlying crop in this segment does not represent a separate operating segment. Management seeks to maximize the use of the land through the sowing of one or more type of crops. Types and surface amount of crops cultivated may vary from harvest year to harvest year depending on several factors, some of them out of our control. Management is focused on the long-term performance of productive land, and to that extent, our performance is assessed considering the aggregated combination, if any, of all crops planted in a piece of land. A single manager is responsible for the management of operating activities relating to all crops rather than for each individual crop;
▪Dairy: consists of the production and sale of raw milk and industrialized products, including UHT milk, cheese and powdered milk, and
▪Rice: consists of the planting, harvesting, processing and marketing of rice.
▪All Other Segments: consists of the aggregation of the remaining non-reportable operating segments, in our Farming business that do not meet the quantitative thresholds for disclosure and for which our management does not consider them to be of continuing significance, namely coffee and cattle.
•Our Sugar, Ethanol and Energy business consists of cultivating sugarcane which is processed in our own sugar mills, transformed into ethanol, sugar and electricity and then marketed.
•Our Land Transformation business consist of the identification and acquisition of underdeveloped and undermanaged farmland businesses, the realization of value through the strategic disposition of assets.
•Our Corporate activities comprise certain other activities of administrative nature not assignable to our segments.
To evaluate the economic performance of our businesses on a monthly basis, results of operations of our Argentine subsidiaries are based on monthly data adjusted for inflation and converted into the average exchange rate of the U.S. dollar for each month. These converted figures are not readjusted and reconverted subsequently. We also employ this methodology to translate the results of operations of our subsidiaries in countries without hyperinflationary economies, as it allows for a more accurate analysis of the integral economic performance of their businesses. When comparing years 2021 and 2022, results are also affected by the effect of the acquisition of Viterra’s rice operations in Uruguay, which resulted in a bargain purchase gain on acquisition.
Key Financial and Operating Data
The following tables present selected sales data solely for the periods indicated below:
89
| For the year ended December 31, | |||||||||||||||||||||||
| 2022 | 2021 | Chg (%) 2022-2021 | |||||||||||||||||||||
| Sales | (In thousands of $) | ||||||||||||||||||||||
| Farming Business | 716,964 | 562,342 | 27.5 | % | |||||||||||||||||||
| Crops | 272,737 | 240,730 | 13.3 | % | |||||||||||||||||||
| Soybean (1)(2) | 81,757 | 71,687 | 14.0 | % | |||||||||||||||||||
| Corn (3) | 71,188 | 59,803 | 19.0 | % | |||||||||||||||||||
| Wheat (4) | 19,915 | 27,349 | (27.2) | % | |||||||||||||||||||
| Peanut | 63,041 | 60,939 | 3.4 | % | |||||||||||||||||||
| Sunflower | 24,833 | 17,449 | 42.3 | % | |||||||||||||||||||
| Other crops (5) | 12,003 | 3,503 | 242.6 | % | |||||||||||||||||||
| Rice (6) | 203,489 | 134,869 | 50.9 | % | |||||||||||||||||||
| Dairy (7) | 235,012 | 183,054 | 28.4 | % | |||||||||||||||||||
| All other segments (8) | 5,726 | 3,689 | 55.2 | % | |||||||||||||||||||
| Sugar, Ethanol and Energy Business | 630,760 | 562,010 | 12.2 | % | |||||||||||||||||||
| Sugar | 188,769 | 208,365 | (9.4) | % | |||||||||||||||||||
| Ethanol | 387,124 | 291,883 | 32.6 | % | |||||||||||||||||||
| Energy | 34,919 | 50,321 | (30.6) | % | |||||||||||||||||||
| Other (9) | 19,948 | 11,441 | 74.4 | % | |||||||||||||||||||
| Total | 1,347,724 | 1,124,352 | 19.9 | % | |||||||||||||||||||
| Land Transformation (10) | 3,705 | 6,613 | (44.0) | % | |||||||||||||||||||
(1) Includes soybean, soybean oil and soybean meal.
(2) 2021/2022 does not include soybean planted in Brazil as cover crop during the implementation of the agricultural technique known as meiosis. Revenues corresponding to the sale of this product are booked in the Sugar, Ethanol and Energy business.
(3) Includes sorghum, chia and bean.
(4) Includes barley, rye, oats, chickpea and vetch.
(5) Includes seeds and farming services.
(6) Includes sales of processed rice including rough rice purchased from third parties and processed in our own facilities, rice seeds and services.
(7) Includes sales of energy from our bio digester, which produces biogas from effluents of our cows.
(8) All other segments include our cattle business which primarily consists of leasing land to a third party based on the price of beef. See “Item 4. Information on the Company—B. Business Overview—All Other Segments.”
(9) Includes operating leases and other services.
(10) Represents capital gains from the sale of land.
90
| 2021/2022 | 2020/2021 | 2019/2020 | ||||||||||||||||||||||||||||||
| Harvest | Harvest | Harvest | Chg (%) 2021/2022-2020/2021 | Chg (%) 2020/2021-2019/2020 | ||||||||||||||||||||||||||||
| Production | Year (1) | Year (1) | Year (1) | |||||||||||||||||||||||||||||
| Farming Business | ||||||||||||||||||||||||||||||||
| Crops (tons)(2) | 769,524 | 733,334 | 720,059 | 4.9 | % | 1.8 | % | |||||||||||||||||||||||||
| Soybean (tons) (3) | 177,963 | 172,969 | 181,259 | 2.9 | % | (4.6) | % | |||||||||||||||||||||||||
| Corn (tons) (4) | 342,621 | 327,164 | 364,176 | 4.7 | % | (10.2) | % | |||||||||||||||||||||||||
| Wheat (tons) (5) | 137,953 | 122,749 | 104,236 | 12.4 | % | 17.8 | % | |||||||||||||||||||||||||
| Peanut (tons) | 62,433 | 77,891 | 55,630 | (19.8) | % | 40 | % | |||||||||||||||||||||||||
| Sunflower (tons) | 39,054 | 28,436 | 12,652 | 37.3 | % | 124.8 | % | |||||||||||||||||||||||||
| Cotton Lint (tons) | 4,262 | 1,772 | 1,490 | 140.5 | % | 18.9 | % | |||||||||||||||||||||||||
| Others | 5,238 | 2,353 | 616 | 122.6 | % | 282.0 | % | |||||||||||||||||||||||||
| Rice (tons) (6) | 416,735 | 346,685 | 278,348 | 20.2 | % | 24.6 | % | |||||||||||||||||||||||||
(1) The table reflects the production in respect of harvest years as of December 31.
(2) Crop production does not include 314,000 tons and 300,782 tons of forage produced as of December 31, in the 2021/2022 and 2020/2021 harvest years, respectively.
(3) 2021/2022 does not include soybean planted in Brazil as cover crop during the implementation of the agricultural technique known as meiosis. Revenues corresponding to the sale of this product are booked in the Sugar, Ethanol and Energy business.
(4) Includes sorghum.
(5) Includes barley, rye, oats, chickpea and vetch.
(6) Expressed in tons of rough rice produced on owned and leased farms. The rough rice we produce, along with additional rough rice we purchase from third parties, is ultimately processed and constitutes the product sold in respect of the rice business.
| For the year ended December 31, | ||||||||||||||||||||||||||
| 2022 | 2021 | Chg (%) 2022-2021 | ||||||||||||||||||||||||
| Processed rice (1) (tons) | 396,681 | 318,732 | 24.5 | % | ||||||||||||||||||||||
| Dairy(2) (thousand liters) | 185,583 | 173,148 | 7.2 | % | ||||||||||||||||||||||
| Processed Milk (3) (thousand liters) | 359,435 | 352,532 | 2.0 | % | ||||||||||||||||||||||
| Sugar, Ethanol and Energy Business | ||||||||||||||||||||||||||
| Sugar (tons) | 481,919 | 546,819 | (11.9) | % | ||||||||||||||||||||||
| Ethanol (cubic meters) | 540,231 | 534,603 | 1.1 | % | ||||||||||||||||||||||
| Energy (4) (MWh) | 608,964 | 730,739 | (16.7) | % | ||||||||||||||||||||||
| Land Transformation Business (hectares traded) | — | — | ||||||||||||||||||||||||
(1) Includes rough rice purchased from third parties and processed in our own facilities. Expressed in tons of rough rice (1 ton of processed rice is approximately equivalent to 1.6 tons of rough rice).
(2) Raw milk produced at our dairy farms.
(3) Own and third parties raw milk processed in our industrial facilities of Morteros and Chivilcoy.
(4) Energy exported to grid.
91
| 2022/2023 | 2021/2022 (2) | 2020/2021 | Chg (%) 2022/2023-2021/2022 | Chg (%) 2021/2022-2020/2021 | |||||||||||||||||||||||||||||||
| Harvest | Harvest | Harvest | |||||||||||||||||||||||||||||||||
| Planted Area | Year (1) | Year | Year | ||||||||||||||||||||||||||||||||
| (Hectares) | |||||||||||||||||||||||||||||||||||
| Farming Business (3) | |||||||||||||||||||||||||||||||||||
| Crops | 220,206 | 244,034 | 223,165 | (9.8) | % | 9.4 | % | ||||||||||||||||||||||||||||
| Soybean (1) | 81,812 | 72,318 | 68,315 | 13.1 | % | 5.9 | % | ||||||||||||||||||||||||||||
| Corn (4) | 41,262 | 58,239 | 56,568 | (29.2) | % | 3.0 | % | ||||||||||||||||||||||||||||
| Wheat (5) | 35,789 | 46,509 | 44,392 | (23.0) | % | 4.8 | % | ||||||||||||||||||||||||||||
| Peanut | 19,813 | 23,664 | 26,123 | (16.3) | % | (9.4) | % | ||||||||||||||||||||||||||||
| Sunflower | 18,131 | 23,173 | 16,164 | (21.8) | % | 43.4 | % | ||||||||||||||||||||||||||||
| Cotton | 10,266 | 7,427 | 3,519 | 38.2 | % | 111.1 | % | ||||||||||||||||||||||||||||
| Others | 2,633 | 2,920 | 2,747 | (9.8) | % | 6.3 | % | ||||||||||||||||||||||||||||
| Forage | 10,500 | 9,784 | 5,337 | 7.3 | % | 83.3 | % | ||||||||||||||||||||||||||||
| Rice | 55,648 | 60,857 | 44,282 | (8.6) | % | 37.4 | % | ||||||||||||||||||||||||||||
| Total Planted Area | 275,854 | 304,891 | 267,447 | (9.5) | % | 14.0 | % | ||||||||||||||||||||||||||||
| Second Harvest Area | 32,763 | 39,967 | 41,924 | (18.0) | % | (4.7) | % | ||||||||||||||||||||||||||||
| Leased Area | 130,463 | 143,675 | 109,178 | (9.2) | % | 31.6 | % | ||||||||||||||||||||||||||||
| Owned Croppable Area (6) | 102,127 | 111,464 | 111,009 | (8.4) | % | 0.4 | % | ||||||||||||||||||||||||||||
(1) Represents the planting plan for the 2022/2023 campaign. As of December 31, 2022, 80% of the planting plan is seeded.
(2) Includes rice planted and harvested after the acquisition of Viterra’s rice operations.
(3) Includes hectares planted in the second harvest.
(4) Includes sorghum.
(5) Includes barley, rye, oats, chickpea and vetch.
(6) Does not include potential croppable areas being evaluated for transformation and does not include forage area.
| For the year ended December 31, | ||||||||||||||||||||||||||
| 2022 | 2021 | Chg (%) 2022-2021 | ||||||||||||||||||||||||
| Sugar, Ethanol and Energy Business | ||||||||||||||||||||||||||
| Sugarcane plantation | 192,987 | 185,806 | 3.9 | % | ||||||||||||||||||||||
| Owned land | 12,951 | 10,617 | 22.0 | % | ||||||||||||||||||||||
| Leased land | 180,036 | 175,189 | 2.8 | % | ||||||||||||||||||||||
92
For the year ended December 31, 2022, as compared to year ended December 31, 2021
The following table sets forth certain financial information with respect to our consolidated results of operations for the years indicated.
| 2022 | 2021 | Chg (%) 2022-2021 | |||||||||||||||
| (In thousands of $) | |||||||||||||||||
| Sales of goods and services rendered | 1,347,724 | 1,124,352 | 19.9 | % | |||||||||||||
| Cost of goods sold and services rendered | (1,075,747) | (854,965) | 25.8 | % | |||||||||||||
| Initial recognition and changes in fair value of biological assets and agricultural produce | 215,941 | 227,740 | (5.2) | % | |||||||||||||
| Changes in net realizable value of agricultural produce after harvest | (22,293) | (12,879) | 73.1 | % | |||||||||||||
| Margin on manufacturing and agricultural activities before operating expenses | 465,625 | 484,248 | (3.8) | % | |||||||||||||
| General and administrative expenses | (84,287) | (69,794) | 20.8 | % | |||||||||||||
| Selling expenses | (143,515) | (117,662) | 22.0 | % | |||||||||||||
| Other operating income / (expense), net | 1,870 | (18,768) | N/A | ||||||||||||||
| Bargain purchase gain on acquisition | 10,107 | — | N/A | ||||||||||||||
| Profit from operations | 249,800 | 278,024 | (10.2) | % | |||||||||||||
| Finance income | 25,308 | 36,670 | (31.0) | % | |||||||||||||
| Finance costs | (137,600) | (151,681) | (9.3) | % | |||||||||||||
| Other financial results - Net (loss) / gain of inflation effects on monetary items | (2,144) | 11,541 | (118.6) | % | |||||||||||||
| Financial results, net | (114,436) | (103,470) | 10.6 | % | |||||||||||||
| Profit before income tax | 135,364 | 174,554 | (22.5) | % | |||||||||||||
| Income tax (expense) | (26,758) | (43,837) | (39.0) | % | |||||||||||||
| Profit for the year | 108,606 | 130,717 | (16.9) | % | |||||||||||||
93
Sales of Goods and Services Rendered
| For the year ended December 31, | Crops | Rice | Dairy | All other segments | Sugar, Ethanol and Energy | Total | |||||||||||||||||||||||||||||
| (In thousands of $) | |||||||||||||||||||||||||||||||||||
| 2022 | 272,737 | 203,489 | 235,012 | 5,726 | 630,760 | 1,347,724 | |||||||||||||||||||||||||||||
| 2021 | 240,730 | 134,869 | 183,054 | 3,689 | 562,010 | 1,124,352 | |||||||||||||||||||||||||||||
Sales of goods and services rendered increased 20.5%, from $1.12 billion during the year ended December 31, 2021, to $1.35 billion during the same period in 2022, primarily as a result of:
•a $68.8 million increase in our Sugar, Ethanol and Energy segment, mainly due to: (i) a 10.5% increase in sugar price, from $387.6 per ton during the year ended December 31, 2021 to $428.4 per ton during the same period in 2022, (ii) a 13.9% increase in ethanol price, from $616.3 per cubic meter during the year ended December 31, 2021 to $702 per cubic meter during the same period in 2022 mainly due to higher a mix of anhydrous ethanol from 45.2% in 2021 to 65.8% over total ethanol sales in 2022, to further take advantage of parity price premium as per our availability to dehydrate during the whole year, (iii) a 2.1% increase in the volume of sugar and ethanol sold, measured in TRS equivalent, from 1.363 thousand tons of TRS during the year ended December 31, 2021 to 1.392 thousand tons of TRS during the same period in 2022. This was partially offset by (a) a 9.1% decrease in energy prices, from $51.5 per MWh during year ended December 31, 2021, to $46.8 per MWh during the same period in 2022; and (b) a 24.1% decrease in the volume of energy sold, from 931.1 thousand MWh during the year ended December 31, 2021 to 706.6 thousand MWh during the same period in 2022 driven by our commercial decision to use our bagasse to dehydrate ethanol.
The increase in volume of sugar sold measured in TRS was mainly due to an increase in inventories from 100.1 thousand tons measured in TRS during the year ended December 31, 2021, compared to an increase in inventories of 23.6 thousand tons measured in TRS in the same period in 2022 , partially offset by a 3.7% decrease in milling, from 10.9 million tons during the year ended December 2021 to 10.5 million tons during the same period in 2022 due to a delay in commencing crushing activities during 2022 as a consequence of the frost experienced in Mato Grosso do Sul which had an impact over our sugarcane plantation conditions in 2021 and the first half of 2022.
The following table sets forth the breakdown of sales of manufactured products for the years indicated.
| For the year ended December 31, | For the year ended December 31, | For the year ended December 31, | |||||||||||||||||||||||||||||||||||||||||||||||||||
| 2022 | 2021 | Chg % | 2022 | 2021 | Chg % | 2022 | 2021 | Chg % | |||||||||||||||||||||||||||||||||||||||||||||
| (in millions of $) | (in thousand units) | (in dollars per unit) | |||||||||||||||||||||||||||||||||||||||||||||||||||
| Ethanol (cubic meters) | 387.1 | 291.9 | 32.6 | % | 551.4 | 473.6 | 16.4 | % | 702.0 | 616.3 | 13.9 | % | |||||||||||||||||||||||||||||||||||||||||
| Sugar (tons) | 188.8 | 208.4 | (9.4) | % | 440.6 | 537.6 | (18.0) | % | 428.4 | 387.6 | 10.5 | % | |||||||||||||||||||||||||||||||||||||||||
| Energy (MWh) | 33.1 | 48.0 | (31.0) | % | 706.6 | 931.1 | (24.1) | % | 46.8 | 51.5 | (9.1) | % | |||||||||||||||||||||||||||||||||||||||||
| Others | 21.8 | 13.8 | 58.0 | % | |||||||||||||||||||||||||||||||||||||||||||||||||
| TOTAL | 630.8 | 562.1 | 12.2 | % | |||||||||||||||||||||||||||||||||||||||||||||||||
94
The following chart sets forth the variables that impact our Sugar and Ethanol sales:
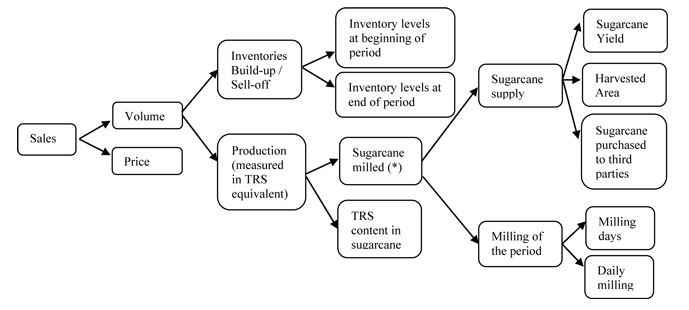
The following chart sets forth the variables that impact our Energy sales:
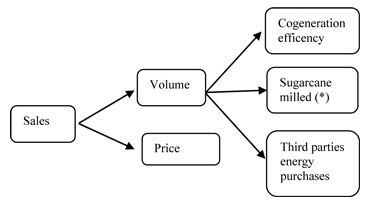
(*) On average, one metric ton of sugarcane contains 140 kilograms of TRS. While a mill can produce either sugar or ethanol, the TRS input requirements differ between these two products. On average, 1.045 kilograms of TRS are required to produce 1.0 kilogram of sugar, while 1.691 kilograms of TRS are required to produce one liter of ethanol.
•a $68.6 million increase in our Rice segment, mainly driven by a 63.9% increase in the volume of white rice sold, from 205 thousand tons during the year ended December 31, 2021, to 336 thousand tons during the same period in 2022 mainly due to the acquisition of Viterra’s Limited´s rice operations (closed in May 2022), partially offset by (i) a 3.2% decrease in the price of white rice sold, from $529.7 per ton during the year ended December 31, 2021 to $513.0 per ton during the same period in 2022, (ii) a decrease in inventories of 7.1 thousand tons during the year ended December 31, 2021, compared to an increase in inventories of 17.1 thousand tons in the same period in 2022, and (iii) a positive impact of $4.3 million due to the application of hyperinflation accounting and translation to our Argentine operations during the year ended December 31, 2021, compared to a negative impact of $0.2 million during the same period in 2022;
•a $52 million increase in our Dairy segment mainly due to (i) a 8.1% increase in volume of dairy products sold such as fluid milk, powder milk and cheese, measured in liters of fluid milk equivalent, from 380.6 million liters during the year ended December 31, 2021 to 411.6 million liters during the same period in 2022, which increase was in turn due to a 11.4% increase in the number of cows, from 12,942 average heads during the year ended December 31, 2021 to 14,415 average heads during the same period in 2022, (ii ) a 18.8% increase in average selling milk price, from $0.48 per liter during the year ended December 31, 2021 to $0.57 per liter during the same period in 2022, partially offset by a positive impact of $10.3 million due to the application of hyperinflation accounting and translation to our Argentine operations during the year ended December 31, 2021, compared to a negative impact of $1.2 million during the same period in 2022; and
95
•a $32.0 million increase in our Crops segment driven by (i) a general increase in crop prices, mainly driven by a 14.1% increase in soybean prices (from US$427.0 per ton in 2021 to US$487.3 per ton in 2022), which were positively impacted by a preferential exchange rate announced by the Argentine government (Programa de incremento exportador) to convert soybean earnings into local currency, and a 25.2% increase in wheat prices (from US$234.5 in 2021 to US$293.7 per ton in 2022) , (ii) a 7.4% increase in the volume of corn sold, from 274.9 thousand tons during the year ended December 31, 2021, to 295.3 thousand tons during the same period in 2022, and (iii) a 41.6% increase in the volume of sunflower seeds, from 23.1 thousand tons during the year ended December 31, 2021, to 32.7 thousand tons during the same period in 2022,
partially offset by (a) a 41.8% decrease in the volume of wheat sold from 116.4 thousand tons in the year ended December 31, 2021, to 67.8 thousand tons during the same period in 2022, and (b) a positive impact of $11.8 million due to the application of hyperinflation accounting and translation to our Argentine operations during the year ended December 31, 2021, compared to a negative impact of $2.5 million during the same period in 2022.
The following table sets forth the breakdown of sales for the years indicated.
| Year ended December 31, | Year ended December 31, | Year ended December 31, | |||||||||||||||||||||||||||||||||||||||||||||||||||
| 2022 | 2021 | % Chg | 2022 | 2021 | % Chg | 2022 | 2021 | % Chg | |||||||||||||||||||||||||||||||||||||||||||||
| (In millions of $) | (In thousands of tons) | (In $ per ton) | |||||||||||||||||||||||||||||||||||||||||||||||||||
| Soybean | 81.8 | 71.7 | 14.1 | % | 167.9 | 167.9 | — | % | 487.3 | 427.0 | 14.1 | % | |||||||||||||||||||||||||||||||||||||||||
| Corn (1) | 71.2 | 59.8 | 19.1 | % | 295.3 | 274.9 | 7.4 | % | 241.1 | 217.5 | 10.9 | % | |||||||||||||||||||||||||||||||||||||||||
| Wheat | 19.9 | 27.3 | (27.1) | % | 67.8 | 116.4 | (41.8) | % | 293.7 | 234.5 | 25.2 | % | |||||||||||||||||||||||||||||||||||||||||
| Peanut | 63.0 | 60.9 | 3.4 | % | 50.4 | 49.5 | 1.8 | % | 1,249.5 | 1,230.1 | 1.6 | % | |||||||||||||||||||||||||||||||||||||||||
| Sunflower | 24.8 | 17.4 | 42.5 | % | 32.7 | 23.1 | 41.6% | 758.3 | 755.0 | 0.4 | % | ||||||||||||||||||||||||||||||||||||||||||
| Others | 12.0 | 3.5 | 242.9 | % | |||||||||||||||||||||||||||||||||||||||||||||||||
| Total | 272.7 | 240.7 | 13.3 | % | |||||||||||||||||||||||||||||||||||||||||||||||||
(1)Includes sorghum and popcorn.
Cost of Goods Sold and Services Rendered
| For the year ended December 31, | Crops | Rice | Dairy | All other segments | Sugar, Ethanol and Energy | Total | |||||||||||||||||||||||||||||
| (In thousands of $) | |||||||||||||||||||||||||||||||||||
| 2022 | (250,662) | (160,320) | (203,885) | (5,039) | (455,841) | (1,075,747) | |||||||||||||||||||||||||||||
| 2021 | (213,231) | (112,045) | (158,077) | (3,111) | (368,501) | (854,965) | |||||||||||||||||||||||||||||
Agricultural produce sold to third parties (i.e., soybean, corn, wheat and fluid milk), the value of Cost of Goods Sold and Services Rendered is equal to the value of Sales and Services Rendered. The profit of these products is fully recognized under the line items “Initial recognition and changes in fair value of biological assets and agricultural produce” and “Changes in net realizable value of agricultural produce after harvest.” When the agricultural produce is sold to third parties, we do not record any additional profit as the gain or loss has already been recognized.
The profit of our manufactured products sold to third parties (i.e., sugar, ethanol, energy, white rice, processed milk and peanut) is recognized when products are sold. The Cost of Goods and Services Rendered of these products includes, among others, the cost of the agricultural produce (i.e., harvested sugarcane and rough rice), which is the raw material used in the industrial process and is transferred internally from the farm to the industry at fair market value.
Cost of manufactured products sold, and services rendered increased 25.8%, from $855 million during the 12-month period ended December 31, 2021, to $1.1 billion during the same period in 2022. This increase was primarily due to:
96
•a $87.3 million increase in our Sugar, Ethanol and Energy segment, mainly due to a 21.1% higher unitary cost in U.S. dollars mainly derived from the increase in sugarcane prices;
•a $48.3 million increase in our Rice segment, mainly driven by higher sales from 134.9 million during the year ended in December 31, 2021 to 203.5 million during the same period in 2022, coupled with higher rough rice prices partially offset by a negative impact of $2.3 million due to the application of hyperinflation accounting and translation to our Argentine operations during the year ended December 31, 2021, compared to a negative impact of $0.4 million during the same period in 2022;
•a $45.8 million increase in our Dairy segment, driven by higher sales coupled with higher raw milk prices from $0.33 per liter during the year ended December 31, 2021 to $0.40 per liter during the same period in 2022, partially offset by a negative impact of $8.3 million due to the application of hyperinflation accounting and translation to our Argentine operations during the year ended December 31, 2021, compared to a positive impact of $1.0 million during the same period in 2022; and
•a $37.4 million increase in our Crops segment, mainly due to higher sales, partially offset by a negative impact of $10.1 million due to the application of hyperinflation accounting and translation to our Argentine operations during the year ended December 31, 2021, compared to a positive impact of $2.2 million during the same period in 2022.
Initial Recognition and Changes in Fair Value of Biological Assets and Agricultural Produce
| Year ended December 31, | Crops | Rice | Dairy | All other segments | Sugar, Ethanol and Energy | Total | |||||||||||||||||||||||||||||
| (In thousands of $) | |||||||||||||||||||||||||||||||||||
| 2022 | 65,574 | 15,323 | 27,257 | (279) | 108,066 | 215,941 | |||||||||||||||||||||||||||||
| 2021 | 73,990 | 43,834 | 19,895 | 1,362 | 88,659 | 227,740 | |||||||||||||||||||||||||||||
Initial recognition and changes in fair value of biological assets and agricultural produce decreased 5.2%, from $227.7 million during the year ended December 31, 2021, to $215.9 million during the same period in 2022. This decrease was mainly due to:
•a $19.4 million increase in our Sugar, Ethanol and Energy segment from $88.7 million during the year ended December 31, 2021 ($16.3 million of which were unrealized losses) to a gain of $108.1 million during the same period in 2022 (including $35.2 million of unrealized gains). This increase was mainly due to:
a $50.7 million increase in the recognition at fair value of non-harvested sugarcane, as adjusted for sales costs, from a loss of $15.9 million during the year ended December 31, 2021, to a gain of $34.8 million in the same period in 2022, mainly derived from an increase in expected yields due to normalization of weather and recovery of sugarcane conditions, partially offset by: a $26.4 million decrease in the recognition at fair value of harvested sugarcane, as adjusted for sales costs, from a gain of $99.3 million during the year ended December 31, 2021, to a gain of $72.9 million during the same period in 2022, mainly due to higher costs of inputs such as fuels, lubricants and salaries;
a $50.7 million increase in the recognition at fair value of non-harvested sugarcane, as adjusted for sales costs, from a loss of $15.9 million during the year ended December 31, 2021, to a gain of $34.8 million in the same period in 2022, mainly derived from an increase in expected yields due to normalization of weather and recovery of sugarcane conditions, partially offset by: a $26.4 million decrease in the recognition at fair value of harvested sugarcane, as adjusted for sales costs, from a gain of $99.3 million during the year ended December 31, 2021, to a gain of $72.9 million during the same period in 2022, mainly due to higher costs of inputs such as fuels, lubricants and salaries;
•an $8.4 million decrease in our Crops segment from $74 million during the year ended December 31, 2021 ($51.3 million of which were realized gains) to $65.6 million during the same period in 2022 ($60.2 million of which were realized gains). This decrease was primarily due to:
- a positive impact of $8.3 million resulting from the application of hyperinflation accounting and translation to our Argentine operations during the year ended December 31, 2021, compared to a positive impact of $1.4 million during the same period in 2021, coupled with the recognition at fair value of harvested crops, as adjusted for sales costs, which decreased $1.3
97
million, from a gain of $63.4 million during the year ended December 31, 2021, to a gain of $62.1 million during the same period in 2022;
•a $28.5 million decrease in our Rice segment, from $43.8 million during the year ended December 31, 2021 ($33 million of which were realized gains) to $15.3 million during the same period in 2022 ($11.1 million of which were realized gains). This decrease was due to:
- a $23.5 million decrease in the recognition at fair value of harvested rice at the point of harvest, as adjusted for sales costs, from a gain of $36.6 million during the year ended December 31, 2021, to a gain of $13.1 million during the same period in 2022, mainly driven by a 5.9% decrease in yields and rice quality due to the heavy droughts experienced during the period throughout the regions where we operate, and a positive impact of $6.7 million due to hyperinflation accounting and translation for our Argentine operations during the year ended December 31, 2021, compared to a positive impact of $0.5 million during the same period in 2022;
•a $7.4 million increase in our Dairy segment, from $19.9 million during the year ended December 31, 2021 ($24.6 million of which were realized) to $27.3 million during the same period in 2022 ($29.8 million of which were realized), mainly due to an increase in our cow herd from 12,942 average heads during the year ended December 31, 2021, to 14,415 average heads during the same period in 2022, coupled with higher fluid milk prices from $0.33 per liter during the year ended December 31, 2021 to $0.40 per liter during the same period in 2022, partially offset by a positive impact of $1.6 million due to the application of hyperinflation accounting and translation to our Argentine operations during the year ended December 31, 2021, compared to a negative impact of $0.3 million in the same period in 2022.
Changes in Net Realizable Value of Agricultural Produce after Harvest
| Year ended December 31, | Crops | Rice | Dairy | All other segments | Sugar, Ethanol and Energy | Total | |||||||||||||||||||||||||||||
| (In thousands of $) | |||||||||||||||||||||||||||||||||||
| 2022 | (21,359) | — | — | — | (934) | (22,293) | |||||||||||||||||||||||||||||
| 2021 | (11,384) | — | — | — | (1,495) | (12,879) | |||||||||||||||||||||||||||||
Changes in net realizable value of agricultural produce after harvest is mainly comprised of: (i) profit or loss from commodity price fluctuations during the period the agricultural produce is in inventory, which has an impact over its fair value; (ii) profit or loss from the valuation of forwards contracts related to agricultural produce in inventory; and (iii) profit from direct exports.
Changes in net realizable value of agricultural produce after harvest decreased $9.4 million, from a loss of $12.9 million during the year ended December 31, 2021, to a loss of $22.3 million during the same period in 2022, as a result of a decrease in crop prices after harvest, which derived in a lower fair value of our crops held in inventories during year ended on December 31, 2022.
General and Administrative Expenses
| Year ended December 31, | Crops | Rice | Dairy | All other segments | Sugar, Ethanol and Energy | Corporate | Total | |||||||||||||||||||||||||||||||||||||
| (In thousands of $) | ||||||||||||||||||||||||||||||||||||||||||||
| 2022 | (13,170) | (15.235) | (10,197) | (219) | (21,917) | (23,549) | (84,287) | |||||||||||||||||||||||||||||||||||||
| 2021 | (11,100) | (9,760) | (5,256) | (187) | (19,464) | (24,027) | (69,794) | |||||||||||||||||||||||||||||||||||||
98
Our general and administrative expenses increased 20.8%, from $69.8 million during the year ended December 31, 2021, to $84.3 million during the same period in 2022. This increase is mainly driven by an increase in costs impacted by inflation which impacted our Crops, Rice and Dairy businesses.
Selling Expenses
| Year ended December 31, | Crops | Rice | Dairy | All other segments | Sugar, Ethanol and Energy | Corporate | Total | ||||||||||||||||||||||||||||||||||
| (In thousands of $) | |||||||||||||||||||||||||||||||||||||||||
| 2022 | (31,464) | (34,401) | (26,974) | (253) | (50,165) | (258) | (143,515) | ||||||||||||||||||||||||||||||||||
| 2021 | (23,419) | (18,108) | (22,572) | (290) | (52,946) | (327) | (117,662) | ||||||||||||||||||||||||||||||||||
Selling expenses increased 22%, from $117.7 million during the year ended December 31, 2021, to $143.5 million during the same period in 2022. This increase is driven by:
•a $16.3 million increase in the Rice segment, due to higher export selling volume related to our Uruguayan rice operation, which is less commoditized, and less volume in line with our long term strategy for this business;
•an $8 million increase in the Crops segment due to higher peanut international freight costs; and
•a $4.4 million increase in the Dairy segment, due to higher export selling volume.
Other Operating Income, Net
| For the year ended December 31, | Crops | Rice | Dairy | All other segments | Sugar, Ethanol and Energy | Land Transformation | Corporate | Total | |||||||||||||||||||||||||||||||||||||||
| (In thousands of $) | |||||||||||||||||||||||||||||||||||||||||||||||
| 2022 | (1,674) | 80 | (11) | (2,996) | 2,881 | 3,705 | (115) | 1,870 | |||||||||||||||||||||||||||||||||||||||
| 2021 | (3,723) | 285 | (170) | (4,465) | (17,390) | 6,613 | 82 | (18,768) | |||||||||||||||||||||||||||||||||||||||
Other operating income increased from a loss of $18.8 million during the year ended December 31, 2021, to a gain of $1.9 million during the same period in 2022, primarily due to:
•a $20.3 million increase in our Sugar, Ethanol and Energy segment mainly driven by a loss of $17.4 million during the year ended December 31, 2021, resulting from an increase in prices, which generated a negative effect in our sugar hedge positions, compared to a gain during the same period in 2022, driven by a decrease in prices which generated a positive effect in our sugar hedge positions;
•a $2 million increase in our Crops segment due to the mark-to-market effect of our soybean and corn hedge positions; and
•partially offset by a $1.47 million decrease in All Other Segments related to lower net gains from the fair value adjustment of Investment property, comprised of owned farms under lease agreements (i.e., beef cattle farms).
99
Bargain purchase gain
| For the year ended December 31, | Crops | Rice | Dairy | All Other Segments | Cattle | Sugar, Ethanol and Energy | Corporate | Total | |||||||||||||||||||||||||||||||||||||||
| (In thousands of $) | |||||||||||||||||||||||||||||||||||||||||||||||
| 2022 | — | 10,070 | — | — | — | — | — | 10,070 | |||||||||||||||||||||||||||||||||||||||
| 2021 | — | — | — | — | — | — | — | — | — | — | |||||||||||||||||||||||||||||||||||||
Bargain purchase gain is the result of our recent acquisition of Viterra’s rice operations. It represents the difference between the acquisition cost and the fair market value of net assets acquired, which generated a US$10.1 million gain during the year ended December 31, 2022.
Financial Results, Net
Our financial results, net decreased from a loss of $103.5 million during the year ended December 31, 2021, to a loss of $114.4 million during the same period in 2022. The line of Net gain of inflation effects on the monetary items decreases from a gain of $11.5 million during the year ended December 31, 2021, to a loss of $2.3 million during the same period in 2022. This reflects the results derived from the exposure of our net monetary position to inflation in Argentina. Monetary assets generate a loss when exposed to inflation while monetary liabilities generate a gain when inflation reduces their outstanding balances in real terms. The negative results are primarily driven by the impact of inflation on our accounts receivables. Inflation rates in Argentina stood at 94.8% and 50.9% in 2022 and 2021, respectively.
The following table sets forth the breakdown of financial results for the periods indicated.
| Year ended December 31, | |||||||||||||||||
| 2022 | 2021 | ||||||||||||||||
| (In $ thousand) | % Change | ||||||||||||||||
| Interest income | 5,781 | 4,081 | 41.7 | % | |||||||||||||
| Interest expense | (50,037) | (62,536) | (20.0) | % | |||||||||||||
| Finance Cost - Right-of-use Assets | (31,113) | (16,502) | 88.5 | % | |||||||||||||
| Foreign exchange gain/(losses), net | 19,278 | 18,939 | 1.8 | % | |||||||||||||
| Cash flow hedge – transfer from equity | (40,195) | (52,650) | (23.7) | % | |||||||||||||
| Gain from interest rate /foreign exchange rate derivative financial instruments | (2,384) | 512 | (565.6) | % | |||||||||||||
| Taxes | (4,862) | (7,073) | (31.3) | % | |||||||||||||
| Other Income | (8,760) | 218 | (4,118.3) | % | |||||||||||||
| Other financial results - Net gain of inflation effects on the monetary items | (2,144) | 11,541 | (118.6) | % | |||||||||||||
| Total Financial Results | (114,436) | (103,470) | 10.6 | % | |||||||||||||
Income Tax (expense)
Current income tax totaled an expense of $26.8 million in 2022, compared to $43.8 million in 2021.
In 2022, income tax calculated at the tax rates applicable in the countries where we operate amounted to an expense of $43.8 million. Income tax expense has been adjusted for (i) a $18.2 million loss related to the application of IAS 29 to the shareholders’ equity of our Argentine Subsidiaries; (ii) a $2.2 million loss due to changes in the statutory income tax in Argentina and (iii) a $1.9 million loss related to non-deductible items, partially offset by (a) the recognition of unused tax losses for $19.4 million, mainly by our Argentine subsidiaries resulting from Tax inflation adjustment (See Note 10 to our Consolidated Financial Statements), and (b) non-taxable income in the amount of $16.9 million related to a supplementary law in Brazil (Lei Complementar or the “Suplementary Law”) which provides for ICMS tax benefits granted by the Brazilian Government with the objective of subsidizing investments, by excluding such grants from the calculation of tax benefits.
In 2021, income tax calculated at the tax rates applicable in the countries where we operate amounted to an expense of $54.3 million. Income tax expense has been adjusted for (i) a $6.4 million related to the application of IAS 29 to shareholders’
100
equity of our Argentine Subsidiaries, (ii) a $32.0 million loss due to changes in the statutory income tax in Argentina and (iii) $3.5 million related to non-deductible items, and was partially offset by (a) the recognition of unused tax losses for $38.1 million, mainly in Argentine subsidiaries, which relates to the Tax inflation adjustment (See Note 10 to our Consolidated Financial Statements), and (b) non-taxable income in the amount of $13.6 million as a result of the application of the Supplementary Law.
Profit for the Year
As a result of the foregoing, our net income total in 2022 and 2021 increased $108.6 million and $130.7 million, respectively.
Year Ended December 31, 2021, as compared to year ended December 31, 2020
See “Item 5. Operating and Financial Review and Prospects” in our Annual Report on Form 20-F for the fiscal year ended December 31, 2021 for a comparative discussion for the years ended December 31, 2021 and 2020.
Reconciliation of non-IFRS measures:
Below are reconciliations of non-IFRS measures related to our income statements. See “Presentation of Financial And Other Information—Non-IFRS Financial Measures.”
The following tables show a reconciliation of Adjusted Segment EBITDA to our segments’ profit / (loss) from operations before financing and taxation, the most directly comparable IFRS financial measure, and a reconciliation of Adjusted Consolidated EBITDA to our net profit (loss) for the year, the most directly comparable IFRS financial measure.
101
| For the year ended December 31, 2022 | |||||||||||||||||||||||||||||||||||||||||||||||||||||
| Crops | Rice | Dairy | All other segments | Farming Subtotal | Sugar, Ethanol and Energy | Land Trans- formation | Corporate | Total | |||||||||||||||||||||||||||||||||||||||||||||
| (In thousands of $) | |||||||||||||||||||||||||||||||||||||||||||||||||||||
| Adjusted Segment EBITDA (unaudited) | |||||||||||||||||||||||||||||||||||||||||||||||||||||
| Profit/(Loss) from Operations as per Segment Information | 19,091 | 18,663 | 21,385 | (2,928) | 56,211 | 212,850 | 3,699 | (23,806) | 248,954 | ||||||||||||||||||||||||||||||||||||||||||||
| Bargain purchase gain on acquisition as per Segment Information | — | (10,070) | — | — | (10,070) | — | — | — | (10,070) | ||||||||||||||||||||||||||||||||||||||||||||
| Net loss from Fair value adjustment of investment property as per Segment Information | — | — | — | 2,764 | 2,764 | — | — | — | 2,764 | ||||||||||||||||||||||||||||||||||||||||||||
Adjusted Segment EBIT (unaudited)(1) | 19,091 | 8,593 | 21,385 | (164) | 48,905 | 212,850 | 3,699 | (23,806) | 241,648 | ||||||||||||||||||||||||||||||||||||||||||||
| Depreciation of Property, plant and equipment and amortization of Intangible Assets as per Segment Information | 7,908 | 12,112 | 10,075 | 212 | 30,307 | 160,920 | — | (22) | 191,205 | ||||||||||||||||||||||||||||||||||||||||||||
Adjusted Segment EBITDA (unaudited)(1) | 26,999 | 20,705 | 31,460 | 48 | 79,212 | 373,770 | 3,699 | (23,828) | 432,853 | ||||||||||||||||||||||||||||||||||||||||||||
| Reconciliation to Profit | |||||||||||||||||||||||||||||||||||||||||||||||||||||
| Profit for the year | 108,606 | ||||||||||||||||||||||||||||||||||||||||||||||||||||
| Income tax expense | 26,758 | ||||||||||||||||||||||||||||||||||||||||||||||||||||
| Interest expense, net | 44,256 | ||||||||||||||||||||||||||||||||||||||||||||||||||||
| Foreign exchange, net | (19,278) | ||||||||||||||||||||||||||||||||||||||||||||||||||||
| Other financial results - Net gain of inflation effects on the monetary items | 2,144 | ||||||||||||||||||||||||||||||||||||||||||||||||||||
| Other financial results, net | 87,314 | ||||||||||||||||||||||||||||||||||||||||||||||||||||
| Combined effects of IAS 29 and IAS 21 of the Argentine subsidiaries of Profit from operations | (846) | ||||||||||||||||||||||||||||||||||||||||||||||||||||
| Bargain purchase gain on acquisition as per Segment Information | (10,070) | ||||||||||||||||||||||||||||||||||||||||||||||||||||
| Net loss from Fair value adjustment of investment property as per Segment Information | 2,764 | ||||||||||||||||||||||||||||||||||||||||||||||||||||
Adjusted Consolidated EBIT (unaudited) (1) | 241,648 | ||||||||||||||||||||||||||||||||||||||||||||||||||||
| Depreciation of Property, Plant and Equipment and amortization of Intangible Assets as per Segment Information | 191,205 | ||||||||||||||||||||||||||||||||||||||||||||||||||||
Adjusted Consolidated EBITDA (unaudited)(1) | 432,853 | ||||||||||||||||||||||||||||||||||||||||||||||||||||
(1)See “Presentation of Financial and Other Information” for the definitions of “Adjusted Segment EBIT,” “Adjusted Consolidated EBIT,” “Adjusted Segment EBITDA” and “Adjusted Consolidated EBITDA.”
102
| For the year ended December 31, 2021 | |||||||||||||||||||||||||||||||||||||||||||||||||||||
| Crops | Rice | Dairy | All other segments | Farming Subtotal | Sugar, Ethanol and Energy | Land Trans- formation | Corporate | Total | |||||||||||||||||||||||||||||||||||||||||||||
| (In thousands of $) | |||||||||||||||||||||||||||||||||||||||||||||||||||||
| Adjusted Segment EBITDA (unaudited) | |||||||||||||||||||||||||||||||||||||||||||||||||||||
| Profit/(Loss) from Operations as per Segment Information | 45,551 | 32,666 | 15,757 | (2,537) | 91,437 | 190,873 | 6,613 | (22,322) | 266,601 | ||||||||||||||||||||||||||||||||||||||||||||
| Net (gain) from Fair value adjustment of investment property | — | — | — | 3,884 | 3,884 | — | — | — | 3,884 | ||||||||||||||||||||||||||||||||||||||||||||
Adjusted Segment EBIT (unaudited)(1) | 45,551 | 32,666 | 15,757 | 1,347 | 95,321 | 190,873 | 6,613 | (22,322) | 270,485 | ||||||||||||||||||||||||||||||||||||||||||||
| Depreciation and amortization | 6,501 | 8,080 | 7,144 | 175 | 21,900 | 143,981 | — | 738 | 166,619 | ||||||||||||||||||||||||||||||||||||||||||||
Adjusted Segment EBITDA (unaudited)(1) | 52,052 | 40,746 | 22,901 | 1,522 | 117,221 | 334,854 | 6,613 | (21,584) | 437,104 | ||||||||||||||||||||||||||||||||||||||||||||
| Reconciliation to Profit | |||||||||||||||||||||||||||||||||||||||||||||||||||||
| Profit for the year | 130,717 | ||||||||||||||||||||||||||||||||||||||||||||||||||||
| Income tax expense | 43,837 | ||||||||||||||||||||||||||||||||||||||||||||||||||||
Interest expense, net | 58,455 | ||||||||||||||||||||||||||||||||||||||||||||||||||||
Foreign exchange, net | (18,939) | ||||||||||||||||||||||||||||||||||||||||||||||||||||
Other financial results - Net (gain) of inflation effects on the monetary items | (11,541) | ||||||||||||||||||||||||||||||||||||||||||||||||||||
Other financial results, net | 75,495 | ||||||||||||||||||||||||||||||||||||||||||||||||||||
| Combined effects of IAS 29 and IAS 21 of the Argentine subsidiaries of Profit from operations | (11,423) | ||||||||||||||||||||||||||||||||||||||||||||||||||||
| Net loss from Fair value adjustment of investment property | 3,884 | ||||||||||||||||||||||||||||||||||||||||||||||||||||
Adjusted Consolidated EBIT (unaudited)(1) | 270,485 | ||||||||||||||||||||||||||||||||||||||||||||||||||||
| Depreciation and amortization | 166,619 | ||||||||||||||||||||||||||||||||||||||||||||||||||||
Adjusted Consolidated EBITDA (unaudited)(1) | 437,104 | ||||||||||||||||||||||||||||||||||||||||||||||||||||
(1)See “Presentation of Financial and Other Information” for the definitions of “Adjusted Segment EBIT,” “Adjusted Consolidated EBIT,” “Adjusted Segment EBITDA” and “Adjusted Consolidated EBITDA.”
103
| For the year ended December 31, 2020 | |||||||||||||||||||||||||||||||||||||||||||||||||||||
| Crops | Rice | Dairy | All other segments | Farming Subtotal | Sugar, Ethanol and Energy | Land Trans- formation | Corporate | Total | |||||||||||||||||||||||||||||||||||||||||||||
| (In thousands of $) | |||||||||||||||||||||||||||||||||||||||||||||||||||||
| Adjusted Segment EBITDA (unaudited) | |||||||||||||||||||||||||||||||||||||||||||||||||||||
| Profit/(Loss) from Operations as per Segment Information | 29,558 | 27,456 | 11,444 | 2,562 | 71,020 | 131,275 | 7,934 | (19,682) | 190,547 | ||||||||||||||||||||||||||||||||||||||||||||
| Net loss from fair value adjustment of investment property | — | — | — | (1,080) | (1,080) | — | — | — | (1,080) | ||||||||||||||||||||||||||||||||||||||||||||
| Reverse of revaluation surplus derived from the disposals of assets before taxes | — | — | — | — | — | — | 10,198 | — | 10,198 | ||||||||||||||||||||||||||||||||||||||||||||
Adjusted Segment EBIT (unaudited)(1) | 29,558 | 27,456 | 11,444 | 1,482 | 69,940 | 131,275 | 18,132 | (19,682) | 199,665 | ||||||||||||||||||||||||||||||||||||||||||||
| Depreciation and amortization | 5,397 | 6,652 | 6,709 | 138 | 18,896 | 122,516 | — | 876 | 142,288 | ||||||||||||||||||||||||||||||||||||||||||||
Adjusted Segment EBITDA (unaudited)(1) | 34,955 | 34,108 | 18,153 | 1,620 | 88,836 | 253,791 | 18,132 | (18,806) | 341,953 | ||||||||||||||||||||||||||||||||||||||||||||
| Reconciliation to Profit | |||||||||||||||||||||||||||||||||||||||||||||||||||||
| Loss for the year | 1,070 | ||||||||||||||||||||||||||||||||||||||||||||||||||||
| Income tax benefit | 12,325 | ||||||||||||||||||||||||||||||||||||||||||||||||||||
Interest expense, net | 54,198 | ||||||||||||||||||||||||||||||||||||||||||||||||||||
Foreign exchange, net | 109,266 | ||||||||||||||||||||||||||||||||||||||||||||||||||||
Other financial results - Net (gain) of inflation effects on the monetary items | (12,064) | ||||||||||||||||||||||||||||||||||||||||||||||||||||
Other financial results, net | 24,258 | ||||||||||||||||||||||||||||||||||||||||||||||||||||
| Combined effects of IAS 29 and IAS 21 of the Argentine subsidiaries of Profit from operations | 1,494 | ||||||||||||||||||||||||||||||||||||||||||||||||||||
| Net (gain) from fair value adjustment of investment property | (1,080) | ||||||||||||||||||||||||||||||||||||||||||||||||||||
| Reverse of revaluation surplus derived from the disposals of assets before taxes | 10,198 | ||||||||||||||||||||||||||||||||||||||||||||||||||||
Adjusted Consolidated EBIT (unaudited)(1) | 199,665 | ||||||||||||||||||||||||||||||||||||||||||||||||||||
| Depreciation and amortization | 142,288 | ||||||||||||||||||||||||||||||||||||||||||||||||||||
Adjusted Consolidated EBITDA (unaudited)(1) | 341,953 | ||||||||||||||||||||||||||||||||||||||||||||||||||||
(1)See “Presentation of Financial and Other Information” for the definitions of “Adjusted Segment EBIT,” “Adjusted Consolidated EBIT,” “Adjusted Segment EBITDA” and “Adjusted Consolidated EBITDA.”
| Adjusted Net Income | ||||||||||||||||||||
| 2022 | 2021 | 2020 | ||||||||||||||||||
| (In thousands of $) | ||||||||||||||||||||
| Profit for the year | 108,606 | 130,717 | 1,070 | |||||||||||||||||
| Foreign exchange (gains) / losses, net | (19,278) | (18,939) | 109,266 | |||||||||||||||||
| Cash flow hedge – transfer from equity | 40,195 | 52,650 | 24,363 | |||||||||||||||||
| Other financial results - Net loss / (gain) of inflation effects on monetary items | 2,144 | (11,541) | (12,064) | |||||||||||||||||
| Net loss / (gain) from fair value adjustment of investment property | 2,961 | 4,331 | (1,077) | |||||||||||||||||
| Bargain purchase gain on acquisition | (10,107) | — | — | |||||||||||||||||
| Revaluation surplus of farmland sold | — | — | 10,198 | |||||||||||||||||
| Adjusted Net income | 124,521 | 157,218 | 131,756 | |||||||||||||||||
104
| Adjusted Free Cash Flow | 2022 | 2021 | 2020 | ||||||||||||||
| (In thousands of $) | |||||||||||||||||
| Net cash generated from operating activities | 370,026 | 348,662 | 257,125 | ||||||||||||||
| Net cash used in investing activities | (299,264) | (175,221) | (121,916) | ||||||||||||||
| Interest paid | (44,788) | (53,587) | (60,026) | ||||||||||||||
| Lease payments | (91,175) | (62,273) | (40,336) | ||||||||||||||
| Dividends paid to non-controlling interest | (358) | (311) | (2,447) | ||||||||||||||
| Restricted short-term investments | 98,010 | — | — | ||||||||||||||
| Reversal of Expansion Capital expenditures (unaudited) | 70,786 | 58,030 | 56,719 | ||||||||||||||
| IAS 29 & IAS 21 effect for operating Activities | 38,043 | 30,666 | 14,956 | ||||||||||||||
| IAS 29 & IAS 21 effect for investing Activities | 83 | 4,694 | 429 | ||||||||||||||
| IAS 29 & IAS 21 effect for Interest Paid | (77) | 1,109 | 1,639 | ||||||||||||||
| Adjusted Free Cash Flow from Operations (unaudited) | 141,286 | 151,769 | 106,143 | ||||||||||||||
| Expansion Capital expenditures (unaudited) | (70,786) | (58,030) | (56,719) | ||||||||||||||
| Adjusted Free Cash Flow (unaudited) | 70,500 | 93,739 | 49,424 | ||||||||||||||
| Indebtedness | 2022 | 2021 | 2020 | ||||||||||||||
| (In thousands of $) | |||||||||||||||||
| Net Debt (unaudited) | 678,528 | 617,885 | 634,808 | ||||||||||||||
| Net Debt / Adjusted Consolidated EBITDA (unaudited) | 1.56 x | 1.41 x | 1.86 x | ||||||||||||||
| Reconciliation - Net Debt | 2022 | 2021 | 2020 | ||||||||||||||
| (In thousands of $) | |||||||||||||||||
| Total Borrowings | 1,007,752 | 817,651 | 971,090 | ||||||||||||||
| Cash and cash equivalents | (230,653) | (199,766) | (336,282) | ||||||||||||||
| Restricted short-term investments | (98,571) | — | — | ||||||||||||||
| Net Debt (unaudited) | 678,528 | 617,885 | 634,808 | ||||||||||||||
Reconciliation of Adjusted Free Cash Flow to Net increase/(decrease) in Cash and Cash Equivalents
| 2022 | 2021 | 2020 | |||||||||||||||
| (In thousands of $) | |||||||||||||||||
| Net increase/(decrease) in cash and cash equivalents | 47,189 | (129,692) | 81,290 | ||||||||||||||
| Interest Paid | (44,788) | (53,587) | (60,026) | ||||||||||||||
| Lease Payments | (91,175) | (62,273) | (40,336) | ||||||||||||||
| Dividends paid to non-controlling interest | (358) | (311) | (2,447) | ||||||||||||||
| Restricted short-term investment | 98,010 | — | — | ||||||||||||||
| Net cash used in financing activities | 23,573 | 303,133 | 53,919 | ||||||||||||||
| IAS 29 & IAS 21 effect for operating activities | 38,043 | 30,666 | 14,956 | ||||||||||||||
| IAS 29 & IAS 21 effect for investing activities | 83 | 4,694 | 429 | ||||||||||||||
| IAS 29 & IAS 21 effect for interest paid | (77) | 1,109 | 1,639 | ||||||||||||||
| Adjusted Free Cash Flow (unaudited) | 70,500 | 93,739 | 49,424 | ||||||||||||||
105
Reconciliation of Adjusted Free Cash Flow from operations to Net increase/(decrease) in Cash and Cash Equivalents
| 2022 | 2021 | 2020 | |||||||||||||||
| (In thousands of $) | |||||||||||||||||
| Net increase/(decrease) in cash and cash equivalents | 47,189 | (129,692) | 81,290 | ||||||||||||||
| Expansion Capital Expenditures (unaudited) | 70,786 | 58,030 | 56,719 | ||||||||||||||
| Interest Paid | (44,788) | (53,587) | (60,026) | ||||||||||||||
| Lease payments | (91,175) | (62,273) | (40,336) | ||||||||||||||
| Dividends paid to non-controlling interest | (358) | (311) | (2,447) | ||||||||||||||
| Restricted short-term investment | 98,010 | — | — | ||||||||||||||
| Net cash used in financing activities | 23,573 | 303,133 | 53,919 | ||||||||||||||
| IAS 29 & IAS 21 effect for operating activities | 38,043 | 30,666 | 14,956 | ||||||||||||||
| IAS 29 & IAS 21 effect for investing activities | 83 | 4,694 | 429 | ||||||||||||||
| IAS 29 & IAS 21 effect for interest paid | (77) | 1,109 | 1,639 | ||||||||||||||
| Adjusted Free Cash Flow from operations (unaudited) | 141,286 | 151,769 | 106,143 | ||||||||||||||
B.LIQUIDITY AND CAPITAL RESOURCES
Our liquidity and capital resources are and will be influenced by a variety of factors, including:
•our ability to generate cash flows from our operations;
•the level of our outstanding indebtedness and the interest that we are obligated to pay on such outstanding indebtedness;
•our capital expenditure requirements, which consist primarily of investments in new farmland, in our operations, in equipment and plant facilities and maintenance costs; and
•our working capital requirements.
Our principal sources of liquidity have traditionally consisted of shareholders’ contributions, short and long term borrowings and proceeds received from the disposition of transformed farmland or subsidiaries.
We believe that our working capital will be sufficient during the next 12 months to meet our liquidity requirements.
106
Years ended December 31, 2022 and 2021
The table below reflects our statements of Cash Flow for the fiscal years ended December 31, 2022 and 2021.
| Year ended December 31, | |||||||||||
| 2022 | 2021 | ||||||||||
| (in thousands of $) | |||||||||||
| Cash and cash equivalents at the beginning of the year | 199,766 | 336,282 | |||||||||
Net cash generated from operating activities (1) | 370,026 | 348,662 | |||||||||
Net cash used in investing activities (2) | (299,264) | (175,221) | |||||||||
Net cash used from financing activities (3) | (23,573) | (303,133) | |||||||||
Effect of exchange rate changes and inflation on cash and cash equivalents (4) | (16,302) | (6,824) | |||||||||
| Cash and cash equivalents at the end of the year | 230,653 | 199,766 | |||||||||
(1) Includes US$ thousands (38,043) and US$ thousands (30,666) of the combined effect of IAS 29 and IAS 21 of the Argentine subsidiaries for 2022 and 2021 , respectively.
(2) Includes US$ thousands (83) and US$ thousands (4,694) of the combined effect of IAS 29 and IAS 21 of the Argentine subsidiaries for 2022 and 2021, respectively.
(3) Includes US$ thousands 45,359 and US$ thousands 41,238 of the combined effect of IAS 29 and IAS 21 of the Argentine subsidiaries for 2022 and 2021, respectively.
(4) Includes US$ thousands (7,233) and US$ thousands (5,878) of the combined effect of IAS 29 and IAS 21 of the Argentine subsidiaries for 2022 and 2021, respectively.
Operating Activities
Year ended December 31, 2022
For the year ended December 31, 2022, net cash generated by operating activities was $370.0 million. During this year, we generated a net gain of $108.6 million that included non-cash charges relating primarily to depreciation of Property, plant and equipment and Right of use assets for $254.4 million, interest and other financial expenses, net of $83.1 million, $40.2 million loss as a result of the reclassification from Equity to Financial results, net in connection with the cash flow hedge accounting and losses for $13.7 million as a result of our derivative financial instruments position. All these effects were partially offset by an unrealized gain in initial recognition and changes in fair value of non-harvested biological assets of $44.9 million, foreign exchange gains of $19.3 million, and a $10.1 million gain resulting from bargain purchase gain on acquisitions.
In addition, other changes in operating asset and liability balances resulted in a net decrease in cash of $86.8 million, primarily due to an increase in trade and other receivables and a decrease in trade and other accounts payable. During 2022, income tax paid totaled $8.1 million.
The net cash generated by operating activities in 2022 includes a $38.0 million negative combined effect resulting from the application of IAS 29 and IAS 21 by our Argentine subsidiaries.
Year ended December 31, 2021
For the year ended December 31, 2021, net cash generated by operating activities was $348.7 million. During this year, we generated a net gain of $130.7 million that included non-cash charges relating primarily to depreciation of Property, plant and equipment and Right of use assets for $218.1 million, interest and other financial expenses, net of $75.6 million, $52.7 million loss as a result of the reclassification from Equity to Financial results, net in connection with the cash flow hedge accounting and losses for $17.3 million as a result of our derivative financial instruments position. All these effects were partially offset by an unrealized gain in initial recognition and changes in fair value of non-harvested biological assets of $11.3 million, foreign exchange gains of $18.9 million and a $11.5 million net gain resulting from inflation effects on the monetary items.
In addition, other changes in operating asset and liability balances resulted in a net decrease in cash of $161.8 million, primarily due to an increase in our inventories and trade and other receivables. During 2021 income tax paid totaled $2.2 million.
107
The net cash generated by operating activities in 2021 includes a $30.7 million negative combined effect resulting from the application of IAS 29 and IAS 21 by our Argentine subsidiaries.
Investing Activities
Year ended December 31, 2022
Net cash used in investing activities totaled $299.3 million in the year ended December 31, 2022, primarily due to an investment of $103.2 million related to the renewal and expansion of our sugarcane plantation, a $125.9 million investment for the purchase of agricultural and industrial equipment, as we strive to maintain and expand the crushing capacity of our Ivinhema and Angelica mills, capitalization of interharvest costs, the construction of our second biodigestor in our Dairy business and the investments in cheese equipment to enhance our product portfolio offering; and a $98 million investment in US-Treasury bills which are used as collateral of short-term borrowings. Net inflows from investing activities were related to proceeds from the sale of farmland and other assets for $22.6 million, and installments from the sale of subsidiaries and interest income of $5.2 million. In addition, cash and cash equivalents resulting from our acquisition of Viterra’s operations, net of the first installment of such acquisition, in turn, resulted in an inflow of $1.1 million.
Net cash used in investing activities in 2022 includes a $0.1 million negative combined effect resulting from the application of IAS 29 and IAS 21 by our Argentine subsidiaries.
Year ended December 31, 2021
Net cash used in investing activities totaled $175.2 million in the year ended December 31, 2021, primarily due to an investment of $78.5 million related to the renewal and expansion of our sugarcane plantation, a $134.5 million investment for the purchase of agricultural and industrial equipment, as we strive to maintain and expand the crushing capacity in Ivinhema and Angelica mills, the purchase of industrial equipment for our peanut processing facility coupled with renewal and expansion of our dairy herd for our new free stall and investments in cheese equipment to enhance our product portfolio offering. Net inflows from investing activities were related to proceeds from the sale of farmland and other assets for $21.1 million and installments from the sale of subsidiaries and interest income of $16.7 million.
Net cash used in investing activities in 2021 includes a $4.7 million negative combined effect resulting from the application of IAS 29 and IAS 21 by our Argentine subsidiaries.
Financing Activities
Year ended December 31, 2022
Net cash used in financing activities was $23.6 million in the year ended December 31, 2022, primarily derived from a new long-term loan for $41.1 million and a short-term loan of $347.9 million for our working capital expenditures. All these effects were partially offset by payments of long and short-term borrowings for $14.0 million and $192.6 million, respectively. These payments include an $8.0 million payment for the acquisition of certain subsidiaries of Viterra. During this year, interest paid totaled $44.8 million and the re-purchase of our own shares totaled $36.8 million.
Net cash used in financing activities includes a $45.4 million negative combined effect resulting from the application of IAS 29 and IAS 21 by our Argentine subsidiaries, $0.1 million of which is over interest paid.
Year ended December 31, 2021
Net cash used in financing activities was $303.1 million in the year ended December 31, 2021, primarily derived from a new long-term loan for $31.0 million and a short term loan of $286.1 million for our working capital expenditures. All these effects were partially offset by payments of long and short term borrowings for $108.4 million and $328.5 million, respectively. During this year, interest paid totaled $53.6 million and the re-purchase of our own shares totaled $66.5 million.
Net cash used in financing activities includes a $41.2 million negative-combined effect resulting from the application of IAS 29 and IAS 21 by our Argentine subsidiaries, $1.1 million of which is over interest paid.
108
Capital Expenditure Commitments
As of December 31, 2022, we had no material commitments for capital expenditures.
Cash and Cash Equivalents
Historically since our cash flows from operations were insufficient to fund our working capital needs and investment plans, we funded our operations with proceeds from short-term and long-term indebtedness and capital contributions from existing and new private investors. In 2011, we raised $421.8 million from an Initial Public Offering (“IPO”) and simultaneous private placement. As of December 31, 2022, our cash and cash equivalents amounted to $230.7 million.
However, we may need additional cash resources in the future to continue our investment plans. Also, we may need additional cash if we experience a change in business conditions or other developments. We also might need additional cash resources in the future if we find and wish to pursue opportunities for investment, acquisitions, strategic alliances or other similar investments. If we ever determine that our cash requirements exceed our amounts of cash and cash equivalents on hand, we might seek to issue debt or additional equity securities or obtain additional credit facilities or realize the disposition of transformed farmland and/or subsidiaries. Any issuance of equity securities could cause dilution for our shareholders. Any incurrence of additional indebtedness could increase our debt service obligations and cause us to become subject to additional restrictive operating and financial covenants, and could require that we pledge collateral to secure those borrowings, if permitted to do so. It is possible that, when we need additional cash resources, financing will not be available to us in amounts or on terms that would be acceptable to us or at all.
Indebtedness and Financial Instruments
For a description of our indebtedness and main financial instruments, see Note 26 to our Consolidated Financial Statements.
In addition, we maintain lines of credit with several banks in order to finance our working capital requirements. We believe that we will continue to be able to obtain additional credit to finance our working capital needs in the future based on our past track record and current market conditions.
109
C. RESEARCH AND DEVELOPMENT, PATENTS AND LICENSES, ETC.
In our Sugar, Ethanol and Energy segment, we have effectively implemented state-of-the-art technologies such as high-pressure boilers for high cogeneration capacity, full mechanization of agricultural operations with online GPS tracking systems on all vehicles (trucks, combines, planters), and concentrated vinasse system among others. To optimize the fertilization of sugarcane, we are currently enriching the vinasse with different nutrient concentrations, such as nitrogen, phosphorus, sulfur, boron and zinc. We are also using drones in our plantations to improve operational efficiencies such as planting quality, biological control, weed monitor and pesticide spraying, among others.
In recent years, we have been developing a seedling production method called “MPB” (Muda Pre Brotada or Pre-Sprout Seedling). This method consists of making the seedling sprout in a greenhouse and planting it directly on the fields, instead of the traditional planting of billets (sugarcane stalk pieces). Two main goals are pursued through this technique: the quick introduction of new promising and healthy varieties of seeds and the reduction of planting cost, by using much less volume of planting seedling per hectare. In addition, and because of this, more land can be used for sugarcane milling, instead of using sugarcane for seedling purposes. In 2022, we produced as much as 19.6 million of MPB inputs, enough to plant 1,600 hectares of sugarcane.
We are also developing vinasse-to-biogas technology in our cluster in Mato Grosso do Sul (for more detail, see “Item 4. Information of the Company—A. Business Overview—Operations and Principal Activities—Sugar, Ethanol and Energy Business”). In 2017, we obtained a patent to produce biogas from sugarcane vinasse, which is owned together with Methanum Engenharia Ambiental. In the industry, we have recently implemented artificial intelligence alongside automation process, which is based on real-time optimization. By assessing mass balance and measuring main key performance indicators every 10 seconds, the system helps us enhance our efficiency all along the industrial processes.
Regarding our Rice business in Argentina, we are involved in the breeding and development of new traits. We seek to improve all processes related to the selection of better rice materials. Our objective is to obtain superior cultivars with better yields, industrial performance, commercial quality, and culinary parameters as driven by the market demand. To that end, we engage in crossbreeding with multiple varieties to achieve new seeds with superior features. We do so for different types of rice, such as long-grain, short-grain and round-grain rice. At the field level, we seek to breed new varieties and rice hybrids adapted to local conditions and production parameters. At the lab level, we are working with molecular markers that help us identify specific DNA details and improve quality parameters of the seed, such as purity.
In connection with these efforts, we have entered into agreements with selected research and development institutions such as Instituto Nacional de Tecnología Agropecuaria in Argentina, Instituto Riograndense do Arroz in Brazil, Híbridos de Arroz para América Latina in Colombia, Fondo Latinoamericano para Arroz de Riego in Colombia, Empresa de pesquisa Agropecuária e Extensão Rural de Santa Catarina in Brazil, and BASF in Germany to develop hybrid rice seeds and expand the scale of hybrid seed production. In addition, we are working with the National University of the Northeast of Argentina to develop double-haploid seeds, which will help us to reduce the selection process from five years to one.
Since 2008, we have developed and released four new varieties of rice on the market. The SCS121 CL was developed in collaboration with BASF and includes Clearfield® technology which makes it tolerant to herbicides that control harmful weeds. In 2020, we registered a new variety, Ita Caabo 109, which is best suited for the center-south rice region in Argentina. Currently, we have an additional cultivar under registration with the relevant Argentine authorities and with respect to the intellectual property of our seeds, we operate under the standards of Argentine Association of Plant Variety Protection.
We use our seed varieties on our farms and sell them to rice producers in Argentina, Brazil, Uruguay and Paraguay.
We have also developed zero grade level technology in most of our farms, which helps us reduce water and energy consumption. For hilly farms, we are implementing a Polypipe irrigation system which also helps us save on water and energy. Additionally, for all of our farms, we are developing an irrigation surveillance using drones, water sensors connected through the internet-of-things and digital platforms, all of which are improving water management efficiencies and enhancing our rice yields.
In our Crops segment, we are also developing special digital features for each crop to enhance efficiencies in our operations. Currently, we are building precision agricultural solutions, such as crop yield estimation and soil quality classification, to improve our farming accuracy. Furthermore, we have created a new blanched peanut processing line, entirely made with local engineering and purchased a self-driving oven. Additionally, we have added laser technology to our peanut plant to perform the electronic selection and to continue optimizing the quality and safety of our products. We developed our own traceability app, through which peanut customers can scan a QR code on each bag of peanuts to access information regarding the traceability and data of our goods.
In addition, we are working on digital platforms for both our Rice and Crops businesses, to create data centers and visualize the information in real-time dashboards including indicators such as seeding, planting date, fertilizers, irrigation, farm
110
works, harvest, and monitoring of all grain stored in silo bags, among others. All this information is available online through computers and mobile phones. See “Item 4. Information of the Company—A. Business Overview—Technology and Best Practices."
In our Dairy segment in Argentina, we have successfully adapted and implemented a free-stall model, which places special emphasis on efficiency and animal welfare. We are currently building our second biodigester to produce renewable energy by transforming manure into electric energy. We are constantly testing new technologies to improve genetics, health and feeding techniques of our cows. We seek to improve animal welfare, milk quality and productivity. Currently, we are implementing sexed semen technology for all of our cows, obtaining positive results. The primary goal is to enhance the production of females from our own herd, allowing us to increase the speed-capacity of organic growth by 20% annually, and/or to intensify our cow-genetic selection process. This is critical four our current Dairy growth project and to improve our cow performance (productivity, health and fertility). Besides, we are assessing other technologies such as cow monitoring solutions and innovative health treatments. (See “Item 4. Information of the Company—A. Business Overview—Operations and Principal Activities—Dairy Business”).
In addition to traditional R&D activities, we are constantly fostering creativity and ongoing improvement across teams, businesses and regions. We seek to adopt and develop innovative solutions that we can introduce into our day-to-day operations, changing the way we perform our work and boosting both efficiencies and profitability. We have teams in Brazil and Argentina involved in the adoption of new technology, while we also engage other companies, start-ups and entrepreneurs to explore, run, test, enhance and jointly develop technologies. We constantly research and analyze all available technologies that could be applied to our operations. While we strive to select the best technologies and techniques, we are also strongly involved in their adoption process, and we provide feedback and suggestions to enhance such technologies.
There are also R&D initiatives to explore ideas, unlock value potential and develop new business units. Our internal research group is comprised of interdisciplinary teams (agronomists, veterinarians, industrial engineers, technicians and finance and commercial personnel). The group offers support to all business lines and through different levels, from the optimization of current operations, evaluation of new technologies, development of new products, to the assessment of a whole new production system.
In addition, we are actively involved in a network with start-ups, funds, research associations and other key players in the agtech (agricultural, digital-based technology) ecosystems to find, develop and engage in strategic opportunities. Particularly for startups, we identify high-potential companies that could provide alternative solutions for our operations and for the market as a whole, and evaluate potential investments if their business models fit our business. So far, we have invested in four startups focused on reducing chemical usage, improving labor productivity and enhancing logistics, among others. See “Item 4. Information of the Company—A. Business Overview—Technology and Best Practices.”
We do not own any registered patents, industrial models or designs, apart from those described in this section.
D.TREND INFORMATION
See “Item 5. Operating and Financial Review and Prospects—A. Operating Results—Trends and Factors Affecting Our Results of Operations.”
E CRITICAL ACCOUNTING POLICIES AND ESTIMATES
Our critical accounting policies and estimates are consistent with those described in note 32 to our Audited Consolidated Financial Statements.
111
Item 6. Directors, Senior Management and Employees
A.DIRECTORS AND SENIOR MANAGEMENT
Board of Directors
The following table sets forth information for our directors as of the date of this annual report:
| Name | Position (*) | Date of appointment | Age | Year term expires | ||||||||||
| Plínio Musetti | Chairman | 2023 | 69 | 2026 | ||||||||||
| Mariano Bosch | Director /CEO | 2023 | 53 | 2026 | ||||||||||
| Alan Leland Boyce | Director | 2022 | 63 | 2025 | ||||||||||
| Andrés Velasco Brañes | Director | 2022 | 62 | 2025 | ||||||||||
| Daniel González | Director | 2023 | 53 | 2026 | ||||||||||
| Guillaume Van der Linden | Director | 2021 | 63 | 2024 | ||||||||||
| Mark Schachter | Director | 2021 | 43 | 2024 | ||||||||||
| Ivo Andrés Sarjanovic | Director | 2021 | 57 | 2024 | ||||||||||
| Ana Cristina Russo | Director | 2022 | 56 | 2025 | ||||||||||
Plínio Musetti, Alan Leland Boyce, Guillaume van der Linden, Mark Schachter, Andrés Velasco Brañes, Daniel González , Ivo Andrés Sarjanovic and Ana Cristina Russo qualify as independent directors in accordance with NYSE standards.
A description of the main tasks currently performed by each director as well as a description of each director’s employment history and education follows:
Plínio Musetti. Mr. Musetti has been a member of the Company’s Board of Directors since 2011 and an observer since 2010. Mr. Musetti is a Managing Partner of Janos Holding, where he is responsible for long-term equity investments of family offices in Brazil, since June 2010. Previously, he was a partner at Pragma Gestão de Patrimonio. From 2008 to 2009, Mr. Musetti served as the Chief Executive Officer of Satipel Industrial S.A., leading the company’s initial public offering process and aiding its expansion plan and merger with Duratex S.A. From 2002 to 2008, Mr. Musetti served as a partner at JP Morgan Partners and Chief Executive Officer of Vitopel S.A. (JP Morgan Partners’ portfolio company), where he led its private equity investment department for Latin America. Mr. Musetti has also served as a Director of Diagnósticos de America S.A. from 2002 to 2009. From 1992 to 2002, Mr. Musetti served as the Chief Executive Officer of Elevadores Atlas, during which time he led the company’s operational restructuring, initial public offering process and the sale to the Schindler Group. In addition, Mr. Musetti currently serves as a Board member of Raia Drogasil S.A. and HAPVIDA. Mr. Musetti holds a degree in Civil Engineering and Business Administration from Mackenzie University and attended the Program for Management Development at Harvard Business School in 1989. Mr. Musetti is a Brazilian citizen.
Mariano Bosch. Mr. Bosch is a co-founder of Adecoagro and has been the Chief Executive Officer and a member of the Company’s Board of Directors since its inception in 2002. From 1995 to 2002, Mr. Bosch served as the founder and Chief Executive Officer of BLS Agribusiness, an agricultural consulting, technical management, and administration company. Mr. Bosch has over 25 years of experience in agribusiness development. He is involved in business organizations such as IDEA, AEA, YPO, AACREA, FPC and AAPRESID. In 2018, he received a Konex award. and in 2019, he received the Businessman of the Year Award by Endeavor. He holds a degree in Agricultural Engineering from the University of Buenos Aires. In 2018, he received a Konex award and in 2019, the Businessman of the Year Award, by Endeavor. Mr. Bosch is an Argentine citizen.
Alan Leland Boyce. Mr. Boyce has been a member of the Company’s Board of Directors since 2011. Mr. Boyce is Chairman of Materra LLC, a California-based farmland owner and operator with 15,000 acres of farmland where they grow pistachios, dates, citrus and organic vegetables. Since 1985, Mr. Boyce has served as the Chief Financial Officer of Boyce Land Co. Inc., a farmland management company that runs 10 farmland limited partnerships in the United States. Mr. Boyce is also the co-founder and CEO of Westlands Solar Farms, the only farmer-owned utility scale solarPV developer in California and recently co-founded Prairie Harvest, which is developing hemp processing technologies to efficiently separate CBD in the field. Mr. Boyce formerly served as the director of special situations at Soros Fund Management from 1999 to 2007, where he managed an asset portfolio of the Quantum Fund and had principal operational responsibilities for the fund’s investments in South America. Mr. Boyce also served as managing director at the Community Reinvestment Act at Bankers Trust from 1986 to 1999 where he was in charge of fixed-income arbitrage proprietary trading, the bank’s mortgage portfolio and compliance. In addition, Mr Boyce was senior managing director for investment strategy at Countrywide Financial from 2007 to 2008, and
112
worked at the U.S. Federal Reserve Board from 1982 to 1984. He holds a degree in Economics from Pomona College, and has a Master’s in Business Administration from Stanford University. Mr. Boyce is an American citizen.
Andres Velasco Brañes. Mr. Velasco has been a member of the Company’s Board of Directors since 2011. Mr. Velasco was the Minister of Finance of Chile between March 2006 and March 2010, and was also the president of the Latin American and Caribbean Economic Association from 2005 to 2007. Prior working for the government, Mr. Velasco was Sumitomo-FASID Professor of International Finance and Development at the Harvard Kennedy School, an appointment he had held since 2000. From 1993 to 2000, he was Assistant and then Associate Professor of Economics and the director of the Center for Latin American and Caribbean Studies at New York University. From 1988 to 1989, he was Assistant Professor at Columbia University. Currently Mr. Velasco serves as Dean of the School of Public Policy at the London School of Economics. Mr. Velasco holds a Ph.D. in economics from Columbia University and was a postdoctoral fellow in political economy at Harvard University and the Massachusetts Institute of Technology. He also received an B.A. in economics and philosophy and an M.A. in international relations from Yale University. Mr. Velasco is a Chilean citizen.
Daniel C. Gonzalez. Mr. Gonzalez has been a member of the Company’s Board of Directors since 2014. He served for 14 years at the investment banking division of Merrill Lynch & Co in Buenos Aires and New York, where he held the positions of Head of Mergers and Acquisitions for Latin America and President for the Southern Cone (Argentina, Chile, Peru and Uruguay), among others. While at Merrill Lynch, Mr. Gonzalez played a leading role in several of the most important investment banking transactions in the region and was an active member of the firm’s global fairness opinion committee. He remained as a consultant to Bank of America Merrill Lynch after his departure. Previously, Mr. Gonzalez was Head of Financial Planning and Investor Relations at Transportadora de Gas del Sur SA. In addition, Mr. Gonzalez was the Chief Executive Officer of YPF Sociedad Anónima, Argentina’s largest corporation, from 2018 to 2020, where he previously served as Chief Financial Officer from 2012 to 2018. Mr. Gonzalez is currently the Executive Director of IDEA (Instituto para el Desarrollo Empresarial Argentino), a not-for-profit business council in Argentina. Mr. González is an Argentine citizen. Mr. Gonzalez holds a degree in Business Administration from the Argentine Catholic University.
Guillaume van der Linden. Mr. van der Linden has been a member of the Company’s Board of Directors since 2011. Since 2007, Mr. van der Linden has also been a Senior Investment Manager at PGGM Vermogensbeheer B.V., where he is responsible for investments in emerging market debt. Previously, from 1993 to 2007, Mr. van der Linden worked for ING Bank in various roles, including in the risk management and derivatives trading department. From 1988 to 1993, Mr. van der Linden was employed as a management consultant by KPMG. From 1985 to 1988, he was a corporate finance analyst for Bank Mees & Hope. Mr. van der Linden holds Master’s degrees in Economics from Erasmus University Rotterdam and Business Administration from the University of Rochester. Mr. van der Linden is a Dutch citizen.
Mark Schachter. Mr. Schachter has been a member of the Company’s Board of Directors since 2011. Mr. Schachter has also been a Managing Director at Atalaya Capital Management since 2022, where he is responsible for corporate debt and equity investments. Previously, he was the Managing Partner of Elm Park Capital Management since 2010. From 2004 to 2010, he was a Portfolio Manager at HBK Capital Management, where he was responsible for the firm’s North American private credit activities. His responsibilities included corporate credit investments with a primary focus on middle-market lending and other special situation investment opportunities. From 2003 to 2004, Mr. Schachter worked for American Capital, a middle-market private equity and mezzanine firm. Previously, he worked in the investment banking division of Credit Suisse Group from 2001 to 2003. Mr. Schachter holds a degree in Business Administration from the Ivey Business School at the University of Western Ontario and completed the Program for Leadership Development at Harvard Business School. Mr. Schachter is a Canadian citizen and has permanent American residence.
Ivo Andrés Sarjanovic. Mr. Sarjanovic has been a member of the Company’s Board of Directors since 2018. Mr. Sarjanovic is also currently serving as non-executive Board member of Sucafina S.A. Further, Mr. Sarjanovic is a and lecturer at the University of Geneva’s Master in Commodities program and Universidad Di Tella’s Master of Finances program. Mr. Sarjanovic served as the Chief Executive Officer of Alvean until 2017, during which time he led the company to become the biggest sugar trader in the world. Previously, Mr. Sarjanovic served for more than 25 years at Cargill International, where he commenced his career as trader in the Grain and Oilseeds business. From 2011 to 2014 Mr. Sarjanovic held the position of Vice-president and World Manager of Cargill Sugar Operations, playing a leading role in the radical transformation of the organization that led to the strategic decision to spin-off the sugar business of Cargill in 2014, creating Alvean Sugar SL, a joint venture with Copersucar, Brazil. Between 2007 and 2011, he was also the Africa and Middle East General Manager of Agriculture at Cargill. While in Cargill he also held the position of Vice-president and Global Trading Manager of Oilseeds in Geneva between 2000 and 2011, coordinating worldwide trading and crushing activities. Mr. Sarjanovic holds a B.A. in Economic Sciences, with a major in Accounting, from the National University of Rosario, Argentina and a Master’s in Economics from Universidad Francisco Marroquin, in Spain. Additionally, he completed executive studies at IMD in Lausanne, Oxford University and Harvard Business School. Mr. Sarjanovic is an Argentine, Italian and Swiss citizen.
Ana Cristina Russo. Ms. Russo has been a member of the Company’s Board of Directors since 2022. Ms. Russo also serves as the Chief Financial Officer of Patria Investments since 2022, the leading alternative investment firm focused on LATAM. Since 1996, Mrs. Russo also built a highly successful career within the Philip Morris group, where she has served as
113
Treasurer, Comptroller, Director Financial Planning Easter Europe, Middle East & Africa, Finance Director Central America and Brasil, Chief Financial Officer for Latin America & Canada and Chief Corporate Auditor for different subsidiaries. Since 2017, she has also served as a Managing Director for Central America, Dominican Republic and the Caribbean within the group, being responsible for this cluster and having direct presence in nine countries and indirect presence in other 24 countries. In 1996, a Mrs. Russo joined Kraft’s financial planning and analysis unit. Before then, in 1994, she joined Remy Cointreau, where she was the Chief Financial Officer for Brazil early in her career, being responsible for the finance, HR, IT, legal, and export/import departments. Previously, in 1989, Mrs. Russo worked for Unilever as a trainee directly with brand and category managers, supporting them on the definition of strategic plans, marketing and sales programs. Mrs. Russo holds a degree in Business Administration from Fundação Getúlio Vargas, São Paulo, Brazil. Mrs. Russo is a Brazilian and Italian citizen.
Executive Officers
The following table shows certain information with respect to our senior management as of the date of this annual report:
| Name | Position | Year Designated | Age | |||||||||||||||||
| Mariano Bosch | Chief Executive Officer & Co-founder | 2002 | 52 | |||||||||||||||||
| Emilio F. Gnecco (*) | Chief Financial Officer | 2023 | 46 | |||||||||||||||||
| Renato Junqueira Santos Pereira | Director of Sugar and Ethanol Operations | 2014 | 45 | |||||||||||||||||
| Mario José Ramón Imbrosciano | Director of Business Development | 2003 | 52 | |||||||||||||||||
| Leonardo Berridi | Country Manager for Brazil | 2004 | 62 | |||||||||||||||||
| Ezequiel Garbers | Country Manager for ARG/URU & Co-founder | 2004 | 55 | |||||||||||||||||
(*) Appointed Chief Financial Officer of the Company on February 8, 2023, succeeding Mr. Carlos Alberto Boero Hughes.
Mariano Bosch. See “—Board of Directors.”
Emilio Federico Gnecco. Mr. Gnecco was appointed Chief Financial Officer for all operations in Argentina, Brazil and Uruguay on February 8, 2023, and has been a member of Company’s senior management since 2005. As our Chief Financial Officer, he is responsible of overseeing the finance and administrative departments of the Company. Before he became our Chief Financial Officer, he had been the Chief Legal Officer of the Company since its inception in 2002. As a Chief Legal Officer, he was responsible for all corporate and compliance matters, mergers and acquisitions and financing structures. Before joining us, he specialized in project financing, structured finance, corporate financing, private equity, joint ventures, mergers and acquisitions and corporate law and business contracts at Marval, O’Farrell & Mairal. Prior to that, he worked at the National Civil Court of Appeals of the City of Buenos Aires for four years. Mr. Gnecco holds a Law degree from the University of Buenos Aires, where he graduated with honors.
Renato Junqueira Santos Pereira. Renato Junqueira Santos Pereira is the VP of the Sugar, Ethanol and Energy business of the Company and has been a member of the senior management team since 2014. He joined the Company in 2010, as the Operations Manager for our Sugar, Ethanol and Energy business and has vast experience in the Brazilian sugarcane industry. Before joining Adecoagro, he served as the Chief Financial Officer of Moema Group, one of the largest sugarcane clusters in Brazil. His main responsibilities at Moema included designing an optimal capital structure to finance the construction of five greenfield mills, preparing the company for an IPO and coordinating the mergers & acquisitions process, which culminated in a $1.5 billion dollar sale to Bunge Ltda. Previously, Mr. Pereira was a Mill Director and Agricultural Manager at Moema’s mills. He holds a degree in Agricultural Engineer from Universidade de Sao Paulo and a Master’s in Business Administration from the University of California, Davis.
Mario José Ramón Imbrosciano. Mr. Imbrosciano is the head of our Business Development Department for all operations in Argentina, Brazil and Uruguay. He oversees all new business initiatives and has been a member of the Company’s senior management since 2003. He has over 27 years of experience in farm management and agriculture production. Prior to joining the Company, Mr. Imbrosciano was the Chief Operating Officer of Beraza Hnos. S.C., a farming company that owns farms in the humid pampas region of Argentina. He was in charge of the production, commercialization and logistics of a 60,000 hectare operation. Mr. Imbrosciano has also worked as a private consultant for various clients. Mr. Imbrosciano holds a degree in Agricultural Production Engineering from the Argentine Catholic University and holds a Master’s in Business Administration from the Instituto de Altos Estudios of the Universidad Austral.
Leonardo Raúl Berridi. Mr. Berridi is our VP of Business Development. He had been the Company’s Country Manager for Brazil since the beginning of its operations in Brazil and a member of our senior management since 2004. Mr. Berridi has over 37 years of international experience in agricultural businesses. Prior to joining us, Mr. Berridi was Vice President of Pago Viejo S.A., a company dedicated to agriculture production and dairy farming in Argentina. He also worked for Trans-Continental Tobacco Corporation as Chief Operating Officer and Exportadora de Productos Agrarios S.A., a
114
company dedicated to producing, processing and exporting tobacco in northern Argentina. In addition, we worked for World Wide Tobacco España S.A. in the Caceres and Zamora provinces of Spain. Mr. Berridi holds a degree in Forestry Engineering from the Universidad Nacional de La Plata.
Ezequiel Garbers. Mr. Garbers is our Country Manager for Argentina and Uruguay. He is a co-founder and a member of the Company’s senior management. He coordinates all of our production and human resource development activities in Argentina and Uruguay. Mr. Garbers has over 20 years of experience in integrated agroindustrial chains. Prior to joining the Company, he was the Chief Operating Officer of an agricultural consulting and investment company he co-founded, where he developed crop-production, cattle and dairy business projects both in Argentina and abroad. Mr. Garbers holds a degree in Agronomic Engineering from the University of Buenos Aires and a Master’s in Business Administration from the Instituto de Altos Estudios of the Austral University.
Our managers supervise our day-to-day operations so as to ensure that all of our general strategic objectives are carried out, and they report to our Board of Directors.
115
B.COMPENSATION
Compensation of Directors and Executive Officers
The compensation of the Company’s directors is approved annually at the ordinary general shareholders’ meeting. In 2022, the aggregate compensation earned by our directors amounted to total of 75,904 restricted stock shares and $500 thousand in cash. These figures do not include Mr. Mariano Bosch’s compensation in cash nor in restricted shares, which he declined. In 2023, the aggregate compensation approved to be earned by our directors amounted to a total of 49,080 restricted stock shares and $500 thousand in cash. These figures do not include Mr. Mariano Bosch’s compensation in cash nor in restricted shares, which he declined.
The aggregate compensation package of our executive officers for year 2022 amounted to $886,000 in cash and 187,972 restricted shares granted to our senior management. These grants were made under the Adecoagro Restricted Share and Restricted Stock Unit Plan, as amended. See “—E. Share Ownership—Share Options and Restricted Share and Restricted Stock Unit Plan.” Annual cash bonuses are designed to incentivize our named executive officers at a variable level of compensation based on the Company’s financial and operating performance and each executive’s individual performance. Annual executive cash bonuses and stock unit awards are based on seniority and individual executive performance. 80% of variable performance is related to achievement of financial targets consisting of Adjusted EBITDA, Adjusted Net Income, Adjusted Net Cash Flow from Operations, Adjusted Free Cash Flow and Return on Invested Capital. The remaining 20% is based on the long term share value, associated with the quote of AGRO’s share. Actual bonus amounts are determined shortly after fiscal year end. Our Chief Executive Officer presents the final calculation of the annual cash bonuses for our named executives to the Compensation Committee of the Board of Directors. The Compensation Committee then reviews and determines the amount payable.
We do not pay or set aside any amounts for pension, retirement or other similar benefits for our officers and directors.
C.BOARD PRACTICES
Pursuant to our articles of incorporation, the Board of Directors must be composed of between three and 11 members. The number of directors is determined and the directors are appointed at the general meeting of shareholders (except in case of a vacancy in the office of a director because of death, retirement, resignation, dismissal, removal or otherwise, the remaining directors may fill such vacancy and appoint a successor in accordance with applicable Luxembourg law).
Currently, the Board of Directors has 11 members. The directors are appointed by the general meeting of shareholders for a period of up to three years; provided, however, the directors shall be elected on a staggered basis, with one-third of the directors being elected each year and provided further that such three-year term may be exceeded by a period up to the annual general meeting held following the third anniversary of the appointment. Directors may be removed with or without cause (ad nutum) by the general meeting of shareholders by a simple majority of votes cast at a general meeting of shareholders. The directors are eligible for re-election indefinitely.
There are no agreements with majority shareholders, customers, suppliers or others governing the selection of any of the directors or members of senior management. None of our non-executive directors has a service contract with us that provides for benefits upon termination of employment.
The Board of Directors is empowered to manage Adecoagro and carry out our operations. The Board of Directors is vested with the broadest powers to manage the business of the Company and to authorize and/or perform all acts of disposal, management and administration falling within the purposes of Adecoagro and all powers not expressly reserved by Luxembourg law or by our articles of incorporation to the general meeting of shareholders is within the competence of the Board of Directors.
Accordingly, within the limitations established by Luxembourg law and in particular the Luxembourg law of August 10, 1915 on commercial companies (as amended) and our articles of incorporation, the Board of Directors can take any action (by resolution or otherwise) it deems necessary, appropriate, convenient or fit to implement the purpose of the Company, including without limitation:
a.execute any acts or contracts on our behalf aimed at fulfilling our corporate purpose, including those for which a special power of attorney is required;
b.carry out any transactions;
116
c.agree, establish, authorize and regulate our operations, services and expenses;
d.delegate special tasks to directors, regulate the formation and operation of committees and fix the remuneration and compensation of expenses of advisors and/or staff with special duties, with a charge to overhead;
e.appoint, suspend or remove agents or employees, establish their duties, remuneration, and bonuses and grant them the powers that it deems advisable;
f.grant signature authorization to directors and officers, grant general or special powers of attorney, including those to prosecute;
g.call regular and special shareholders’ meetings and establish agendas, submit for the shareholders’ approval our inventory, annual report, balance sheet, statement of income and exhibits, propose depreciation, amortization and reserves that it deems advisable, establish the amount of gains and losses, propose the distribution of earnings and submit all this to the shareholders’ meeting for consideration and resolution;
h.fix the date for the payment of dividends established by the shareholders’ meeting and make their payment; and
i.make decisions relating to the issuance, subscription or payment of shares pursuant to our articles of incorporation and decision of the regular or special shareholders’ meetings.
As of the date of this annual report, the chairman of the Board of Directors is Mr. Plínio Musetti. The Board of Directors has the following five committees and one sub-committee: Audit Committee, Talent Management & Compensation Committee, Risk and Commercial Committee, Strategy Committee and ESG Committee; and Nominating Sub-Committee of the Talent Management & Compensation Committee.
Audit Committee
The Company’s articles of incorporation provide that the Board of Directors may set up an audit committee. The Board of Directors has set up an Audit Committee comprised of independent directors and has appointed Mr. Andrés Velasco Brañes (Chairman), Mr. Mark Schachter and Mrs. Ana Cristina Russo as members of its audit committee, pursuant to board resolutions dated May 5, 2022.
The Company’s articles of incorporation provide that the audit committee shall (a) assist the Board of Directors in fulfilling its oversight responsibilities relating to the integrity of the Company’s financial statements, including periodically reporting to the Board of Directors on its activity and the adequacy of the Company’s systems of internal controls over financial reporting; (b) make recommendations for the appointment, compensation, retention and oversight of, and consider the independence of, the Company’s external auditors; (c) review material transactions (as defined in the articles) between the Company or its subsidiaries with related parties (other than transactions that were reviewed and approved by the independent members of the Board of Directors as defined in the articles of the Company) or other governing body of any subsidiary of the Company or through any other procedures as the Board of Directors may deem substantially equivalent to the foregoing) to determine whether their terms are consistent with market conditions or are otherwise fair to the Company and its subsidiaries; and (d) perform such other duties imposed on it by the laws and regulations of the regulated market(s) on which the shares of the Company are listed, applicable to the Company, as well as any other duties entrusted to it by the Board of Directors.
In addition, the charter of the audit committee sets forth, among others, the audit committee’s purpose and responsibilities.
The committee meets at least four times a year and as often as deemed necessary or appropriate in its judgment. During year 2022, the Audit Committee held meetings on March 4 and 10, May 4 and 9, August 3 and 5 and November 2 and 4.
Talent Management & Compensation Committee
The Company has a Talent Management & Compensation Committee (referred to indistinctively as Talent Management & Compensation Committee or Compensation Committee) that reviews and approves the compensation and benefits of the executive officers and other key employees, and makes recommendations to the Board of Directors regarding principles for compensation, performance evaluation, and retention strategies. It is responsible for administering our share
117
option plans and our restricted share and restricted stock unit plan for executive officers and other key employees. See “—E. Share Ownership—Share Options and Restricted Share and Restricted Stock Unit Plan.” The committee has the discretion to interpret and amend the Plan, and delegate to the Chief Executive Officer the right to award equity-based compensation to executive officers and other key employees.
The committee meets at least once a year and as needed on the initiative of the Chief Executive Officer or at the request of one of its members. The members of the Compensation Committee, appointed pursuant to board resolutions dated May 19, 2019, are Mr. Daniel González (Chairman), Mr. Guillaume van der Linden, and Mr. Plínio Musetti.
Nominating Sub-Committee
As part of the Talent Management & Compensation Committee, the Company has a Nominating Sub-Committee that selects and recommends to the board the best candidates to fill in vacant board seats, develops and recommends criteria for selecting qualified director candidates to the board, evaluates committee member qualifications, designations and removals, recommend the implementation of corporate governance guidelines, and oversees the evaluation of the board of directors and each committee.
The sub-committee meets at least once a year and as needed on the initiative of the Chief Executive Officer or at the request of one of its members. The members of the sub-committee, appointed pursuant to board resolutions dated March 11, 2022, are Mr. Guillaume van der Linden, Mr. Daniel González and Mr. Plínio Musetti.
Risk and Commercial Committee
The Company has a Risk and Commercial Committee (referred to in distinctively as Risk Committee or Risk and Commercial Committee) that has the duty to (i) make such inquiries as are necessary or advisable to understand and evaluate material business risks and risk management processes as they evolve from time to time; (ii) review with the Board of Directors and management the guidelines and policies to govern the process for assessing and managing risks; (iii) discuss and review with the Board of Directors management’s efforts to evaluate and manage the Company’s business from a risk perspective; (iv) request input from the Board of Directors, management and operating staff, as well as from outside resources, as it may deem necessary; (v) discuss with the Board of Directors and management which elements of enterprise risk are most significant, the prioritization of business risks, and make recommendations as to resource allocation for risk management and risk mitigation strategies and activities; (vi) oversee the development of plans for risk mitigation in any area which it deems to be a material risk to the Company; and (vii) monitor management’s implementation of such plans, and the effectiveness generally of its risk mitigation strategies and activities.
The committee meets at least four times a year and as often as deemed necessary or appropriate in its judgment. The members of the Risk Committee appointed by the board meeting held on May 5, 2022 are Mr. Ivo Andrés Sarjanovic (Chairman), Mr. Mark Schachter and Mrs. Ana Cristina Russo.
Strategy Committee
The Company’s Strategy Committee has the duty to: (i) discuss and review with the board management’s identification and setting of strategic goals; including potential acquisitions, joint ventures and strategic alliances and dispositions; (ii) make recommendations to the Board of Directors as to the means of pursuing strategic goals; and (iii) review with the board management’s progress in implementing its strategic decisions and suggest appropriate modifications to reflect changes in market and business conditions.
The committee meets at least four times a year and as often as deemed necessary or appropriate in its judgment. The members of Strategy Committee appointed by the board meetings held on May 5, 2022 are Mr. Plínio Musetti (Chairman), Mr. Alan Leland Boyce, Mr. Daniel Gonzalez and Mr. Ivo Andrés Sarjanovic.
ESG Committee
The Company has an ESG Committee created as part of the efforts to bring Environmental, Social and Governance ("ESG") to the forefront of its agenda and continue integrating these aspects into the overall strategy. The ESG Committee's main duties include (i) discussing and reviewing the company's operations in order to identify potential opportunities to improve our ESG performance; (ii) defining ESG strategies; and (iii) analyzing alternatives to enhance our ESG communication to stakeholders and expand our investor base.
118
The committee meets at least four times a year and as often as deemed necessary or appropriate in its judgment. The members of ESG Committee appointed by the board meetings held on May 5, 2022 are Mr. Guillaume van der Linden (Chairman), Mr. Alan Leland Boyce and Mr. Andres Velasco.
D.EMPLOYEES
Employees
As of December 31, 2022, we had 9,776 employees, 91% of whom were unionized. In addition, approximately 9% of our workforce is comprised of temporary workers. We strive to comply with all labor laws. Historically, we have had a positive relationship with labor unions.
The following table sets forth our number of employees by each of our business segments:
| As of December 31, | |||||||||||||||||
| 2022 | 2021 | 2020 | |||||||||||||||
| Farming and Land Transformation | 2,441 | 2,156 | 1,794 | ||||||||||||||
| Sugar, Ethanol and Energy | 6,229 | 5,930 | 6,093 | ||||||||||||||
| Administrative | 1,106 | 1,018 | 829 | ||||||||||||||
| Total | 9,776 | 9,104 | 8,716 | ||||||||||||||
The following table sets forth our number of employees by each country where we operate:
| As of December 31, | |||||||||||||||||
| 2022 | 2021 | 2020 | |||||||||||||||
| Argentina | 2,697 | 2,488 | 2,079 | ||||||||||||||
| Brazil | 6,914 | 23 | 16 | ||||||||||||||
| Uruguay | 165 | 6,593 | 6,621 | ||||||||||||||
| Total | 9,776 | 9,104 | 8,716 | ||||||||||||||
We do not have any severance agreements with our senior executive directors and managers.
Benefits
The benefits granted to our employees follow the market standard, including health plans and Spanish, English and Portuguese language lessons. In some cases, depending on the working location, we also provide meal, transportation, parking or financial aid for junior employees who are still in college. For senior management, we also provide vehicles.
E.SHARE OWNERSHIP
Share Ownership
The total number of shares of the Company beneficially owned by our directors, executive officers and employees as a group, as of the date of this annual report, was 6,988,112, which represents 6.5% of the total shares of the company. See “Item 7. Major Shareholders and Related Party Transactions—A. Major Shareholders” for information regarding share ownership by our directors and executive officers.
Share Options and Restricted Share and Restricted Stock Unit Plan
Adecoagro/IFH 2004 Stock Incentive Option Plan
The Company maintains the Adecoagro/IFH 2004 Incentive Option Plan (formerly, the International Farmland Holdings, LLC 2004 Incentive Option Plan, and referred to herein as the “2004 Plan”). Initially, the 2004 Plan provided for the
119
grant of options to purchase ordinary units of IFH. In connection with the Reorganization, the Option Plans were amended and restated to provide for the grant of options to purchase ordinary shares of the Company, and all then-outstanding options to purchase IFH ordinary units were converted into options to purchase the Company’s ordinary shares.
The number of ordinary shares reserved and available for issuance under the 2004 Plan are 1,634,220, respectively. Shares subject to awards that become forfeited, cancelled, expired, withheld upon exercise, reacquired by the Company prior to vesting or otherwise terminated will again be available for future awards under the Option Plans.
Administration and Eligibility
The Option Plans are administered by the Compensation Committee of the Company’s Board of Directors (the “Committee”). The Committee has general authority to, among others, select individuals for participation, determine the time and amount of grants, and interpret the plans and awards. The Committee determines the vesting requirements of the awards. The Option Plans require that the exercise price of any future grants shall be no less than the greater of the fair market value of our ordinary shares on the date of grant and the par value per ordinary share.
Individuals eligible to receive options under the 2004 Plan include officers and employees.
Amendment and Termination
The Board of Directors may amend or terminate the Option Plans in its discretion, and the Committee may amend any outstanding options in its discretion, except participant consent will be needed if a participant’s rights are adversely affected. If not previously terminated by the Board of Directors, the Option Plans will terminate on the 10th anniversary of its adoption. The 2004 Plan was amended to extend the term to the 20th anniversary of its adoption.
Granted Options
Under the 2004 Plan, options to purchase 2,402,228 ordinary shares were granted and the weighted average exercise price of all granted options was $6.67.
Outstanding options under the 2004 Plan vested in three equal installments on the first three anniversaries of the date of grant. Vesting under this Option Plans is generally subject to the participant’s continued service as of each applicable vesting date, and all options terminate 10 years from the date of grant. No further option under both plans will be granted.
Adecoagro S.A. Amended and Restated Restricted Share and Restricted Stock Unit Plan
On November 11, 2011, the Board of Directors of the Company approved the amendment and restatement of the Adecoagro S.A. Restricted Share Plan, now known as the Amended and Restated Restricted Share and Restricted Stock Unit Plan (as amended from time to time, the “Plan). On December 16, 2020, the Board of Directors of the Company amended the Plan to extend the expiration date to October 28, 2030.
The Plan provides for awards of restricted shares or restricted stock units to employees, officers, members of the Board of Directors and other service providers of the Company. The purpose of the Plan is to further align the interests of participants with those of the shareholders by providing participants with long-term incentive compensation opportunities tied to the performance of the Company’s ordinary shares.
On March 11, 2022 and March 7, 2023, the Plan was again amended by the Board of Directors to increase the number of common shares available for issuance with respect to which awards may be made by 1,406,565 and 543,800 common shares, respectively. Currently, the maximum number of common shares with respect to which awards may be made under the Plan is equal to 8,659,295 common shares inclusive of such Shares that are subject to outstanding grants of awards. To the extent any award under the Plan is canceled, expired, forfeited, surrendered settled in cash, or otherwise terminated without delivery of shares the shares retained by or returned to the Company will again be available for future awards under the Plan. The shares available for issuance as well as outstanding awards under the Plan are subject to adjustment in the event of a reorganization, stock split, merger or similar change. Under the Plan, as of the date of this annual report, 8,142,275 ordinary shares had been issued to directors, senior management and employees.
Administration and Eligibility
The Plan is administered by the Talent Management & Compensation Committee. This Committee has general authority to grant awards, determine the recipients of awards and prescribe the terms of awards, as well as authority to interpret
120
and apply the terms of the Plan and individual awards. The Committee determines the amount and the vesting requirements of the awards.
Terms of Awards
A grant of restricted shares represents ordinary shares that are issued subject to vesting requirements and transfer restrictions, as determined by the Committee in its discretion. The vesting requirements may be based on the continued employment or service of the participant for a specified time period or on the attainment of specified business performance goals established by the Committee. Subject to the transfer restrictions and vesting requirements of the award, the participant will have the rights of a stockholder of the Company, including voting rights and the right to receive dividends.
The number of restricted shares or restricted stock units awarded to individuals each year will be based on Company performance. Once awarded, the restricted shares or restricted stock units are subject to a service-based vesting schedule and vest in three equal annual installments on the first three anniversaries of the date of grant, subject only to the participant’s continued service to the Company as of each applicable vesting date. Restricted stock units are payable following the vesting of an award in shares.
Amendment and Termination
The Board of Directors may amend, modify, suspend or terminate the Plan in its discretion, except participant consent will be needed if participants’ rights are adversely affected. If not previously terminated by the Board of Directors, the Plan will terminate on the 20th anniversary of its adoption.
Share Options and Restricted Shares
The total number of ordinary and restricted shares to be issued upon exercise of the options to directors and executive officers as a group under our Option Plans is 1,634,220 in the aggregate. The range of exercise prices per ordinary shares under our 2004 Plan is $5.83 to $8.62 (1,492,890 options). Upon the exercise of all options the only employee that would exceed the 1% holding is Mariano Bosch, who would reach 1.03%.
Item 7. Major Shareholders and Related Party Transactions
A.MAJOR SHAREHOLDERS
The following table sets forth the beneficial ownership of our shares for each person known to us to own beneficially at least 5% of our common shares and our directors and executive officers, based on the information most recently available to the Company, as of April 21, 2023.
As of April 21, 2023, we had 107,642,805 outstanding shares. Beneficial ownership is determined in accordance with the rules and regulations of the SEC. In computing the number of shares beneficially owned by a person and the percentage ownership of that person, we have included shares that the person has the right to acquire within 60 days from April 21, 2023, including through the exercise of any option, warrant or other right or the conversion of any other security. These shares, however, are not included in the computation of the percentage ownership of any other person.
| Number | Percent | ||||||||||
| Principal Shareholders: | |||||||||||
| Al Gharrafa Investment Company (1) | 15,983,265 | 14.8 | % | ||||||||
| Stichting Pensioenfonds Zorg en Welzijn (2) | 15,381,385 | 14.3 | % | ||||||||
| Route One Investment LP (3) | 13,116,844 | 12.2 | % | ||||||||
| EMS Capital LP (4) | 11,883,961 | 11.0 | % | ||||||||
| Grantham Mayo Van Otterloo & Co LL (5) | 5,831,072 | 5.4 | % | ||||||||
| Directors, Executive Officers and Company's employees as a Group* | 6,988,112 | 6.5 | % | ||||||||
________________________________________________________________________________________________
* No single shareholder beneficially owns more than 1% based on the total number of outstanding shares, except for from Mariano Bosch and Alan Boyce, each of whom beneficially owns 1.3% and 1.1%, respectively.
(1)The address of Al Gharrafa Investment Company is C/O Intertrust Corporate Services (Cayman) Limited, 190 Elgin Street, George Town, Grand Cayman, KY1-9005, Cayman Islands.
(2)The address of Stichting Pensioenfonds Zorg en Welzijn is P.O. BOX 4001 NL-3700 KA Zeist The Netherlands.
121
(3)The address of Route One Investment LP is 1 Letterman Drive, Building D, Suite 200, San Francisco, CA 94129, United States.
(4)The address of EMS Capital LP is 767 Fifth Avenue 46th floor, New York, NY 10153.
(5)The address of Grantham Mayo Van Otterloo & Co LL is 40 Rowes Wharf, Boston, MA 02110.
As of April 21, 2023, 54,354,162 shares were held by United States record holders, representing 50.5% of our outstanding common shares.
B.RELATED PARTY TRANSACTIONS
Registration Rights Agreement
In connection with the Reorganization, we entered into a registration rights agreement providing holders of our issued and outstanding common shares on January 28, 2011 (such holders being hereinafter referred to as the “Existing Investors” and such common shares subject to the agreement being hereinafter referred to as the “Registrable Securities”) with certain rights to require us to register their shares for resale under the Securities Act of 1933, as amended (“Securities Act”). Pursuant to the agreement, if holders of a majority of the Registrable Securities notify us, no earlier than 180 days after the effective date of the registration statement previously filed by us on Form F-1, we are required, subject to certain limitations, to file a registration statement under the Securities Act in order to register the resale of the amount of ordinary shares requested by such holders. The underwriters in such an offering will have the right, subject to certain limitations, to limit the number of shares included in such registration. The Existing Investors have the right to require us to file one such registration. In addition, if we propose to register any of our securities under the Securities Act, Existing Investors are entitled to notice of such registration and are entitled to certain “piggyback” registration rights allowing such holders to include their common shares in such registration, subject to certain restrictions. Furthermore, Existing Investors may require us to register the resale of all or a portion of their shares on a registration statement on Form F-3 once we are eligible to use Form F-3. In an underwritten offering, the underwriters have the right, subject to certain restrictions, to limit the number of Registrable Securities Existing Investors may include.
To see a summary of the balances and transactions with related parties, please see Note 31 to our Consolidated Financial Statements.
C.INTERESTS OF EXPERTS AND COUNSEL
Not applicable.
122
Item 8. Financial Information
A.CONSOLIDATED STATEMENTS AND OTHER FINANCIAL INFORMATION.
See "Item 18. Financial Statements" and pages F-1 through F-89 for our Consolidated Financial Statements.
Legal and Administrative Proceedings
We are subject to several laws, regulations and business practices of the countries in which we operate. In the ordinary course of business, we are subject to certain contingent liabilities with respect to existing or potential claims, lawsuits and other proceedings, including those involving tax, social security, labor lawsuits and other matters. We accrue liabilities when it is probable that future costs will be incurred and such costs can be reasonably estimated. Currently, we are not engaged in any material litigation or arbitration and no material litigation or claims are known to us to be pending or threatened against us which, either alone or on a combined basis, may result in an adverse effect on our business, results of operations, or cash flows.
In Argentina and Brazil we are engaged in several legal proceedings, including tax, social security, labor, civil, environmental, administrative and other proceedings, for which we have established provisions in an aggregate amount of $3 million as of December 31, 2022. In addition, there are currently certain legal proceedings pending in which we are involved for which we have not established provisions. In the opinion of our management, the ultimate disposition of any threatened or pending matters, either individually or on a combined basis, will not have a material adverse effect on our combined financial condition, liquidity, or results of operations other than as described below.
The Brazilian government filed a tax enforcement action against UMA to demand excise taxes (IPI), or a federal value-added tax on industrial products, in the amount of approximately $3.7 million. We have obtained a favorable initial decision from the lower court, which accepted our argument on procedural grounds based on the Brazilian government’s loss of its procedural right to demand the IPI debts. Currently, the case is under review by an appellate court following the appeal filed by the Brazilian government. We have not made any provision for this claim based on legal counsel’s view that the risk of an unfavorable decision in this matter is remote. If this proceeding is decided adversely to us, our results of operations and financial condition may be materially adversely affected.
José Valter Laurindo de Castilhos, Companhia Rio de Janeiro Agropecuária Ltda. and other former owners of the Rio de Janeiro and Conquista Farms have filed suit against us for the payment of a supplementary amount of $12 million (approximately $48.5 million in updated value), as well as indemnity for moral and material damages, as a result of the alleged breach of the purchase agreement entered into by the parties. The lower court ruled in our favor, allowing us to keep possession of the Rio de Janeiro Farm. This decision has been appealed by Mr. Castilhos to the Superior Court of Justice (Superior Tribunal de Justiça). The Brazilian Superior Court of Justice dismissed the appeal. The merits of the case are pending judgment by the court of first instance. This decision can be appealed by Mr. Castilhos. We have not made any provision for this claim based on legal counsel’s view that the risk of an unfavorable decision in this matter is remote. If this proceeding is decided adversely to us, our results of operations and financial condition may be materially adversely affected.
Dividend Policy
The amount and payment of dividends will be determined by a simple majority vote at a general shareholders’ meeting, typically but not necessarily, based on the recommendation of our Board of Directors. All shares of our capital stock rank pari passu with respect to the payment of dividends. Pursuant to our articles of incorporation, the Board of Directors has the power to distribute interim dividends in accordance with applicable Luxembourg law. Dividends may be lawfully declared and paid if our net profits and distributable reserves are sufficient under Luxembourg law.
Under Luxembourg law, at least 5% of our net profits per year must be allocated to the creation of a legal reserve until such reserve has reached an amount equal to 10% of our issued share capital. If the legal reserve subsequently falls below the 10% threshold, at least 5% of the annual net profits again must be allocated toward the reserve. The legal reserve is not available for distribution.
On November 9, 2021, the Board of Directors approved the implementation of a distribution policy as of 2022 (the “Distribution Policy”) to distribute annually a minimum of 40% of the Adjusted Free Cash from Operations generated during the previous year, subject to the conditions set forth by Luxembourg law. The Distribution Policy consists of a cash dividend distribution in a minimum amount of US$30 million per year, and share repurchases under the existing program from time to time as deemed appropriate. Subject to the conditions set forth by Luxembourg law and notably subject to the Company having sufficient distributable reserves, any dividend distribution will be resolved upon either by the general meeting of the
123
shareholders of the Company or the Board of Directors (through a declaration of advances on dividends). Subject to the decision of the general meeting of the shareholders of the Company or the Board of Directors, dividend payments will be made twice a year, in or around May and November of each year.
On March 7, 2023 the Board of Directors proposed to the general meeting of the shareholders of the Company to declare a dividend of an amount of $35 million to be paid to the outstanding shares and out of the share premium account of the Company in two installments of $17.5 million each (in May 2023 and November 2023) and to delegate power to the Board of Directors to determine the record dates and the payment dates therefor.
On April 19, 2023 the annual general meeting of the shareholders of the Company declared a dividend in the amount of $35 million, to be distributed out of the share premium account of the Company in two installments (in May 2023 and November 2023) of $17.5 million to the holders of outstanding shares issued by the Company, and to delegate power to the Board of Directors to determine the record dates and the payment dates therefor. On April 19, 2023, the Board of Directors resolved that the record and payment dates for the payment of first installment will be May 2, 2023 and May 17, 2023, respectively, and that the record and payment dates for the payment of the second installment will be November 2, 2023 and November 17, 2023, respectively.
A Luxembourg withholding tax of 15% will be applied to the gross cash dividend amount.
Adecoagro is a holding company and has no material assets other than its ownership of partnership interests in Adecoagro LP SCS. As a result, it is a holding entity with no material assets other than its indirect ownership of shares in operating subsidiaries in foreign countries. If we were to distribute a dividend at some point in the future, we would cause the operating subsidiaries to make distributions to Adecoagro LP SCS, which in turn would make distributions to Adecoagro in an amount sufficient to cover any such dividends.
Our subsidiaries in Argentina and Brazil are subject to certain restrictions on their ability to declare or pay dividends. See “Item 5. Operating and Financial Review and Prospects—B. Liquidity and Capital Resources—Indebtedness and Financial Instruments” and “—Risks Related to our Business and Industries—The terms of our indebtedness and that of certain of our subsidiaries impose significant restrictions on our operating and financial flexibility.”
B.SIGNIFICANT CHANGES
Except as otherwise disclosed in this annual report, there has been no undisclosed significant change since the date of the annual Consolidated Financial Statements.
Item 9. The Offer and Listing
A.OFFER AND LISTING DETAILS
Our common shares have been listed on the NYSE under the symbol “AGRO” since January 28, 2011. As of the date of this report, our issued share capital amounts to $167.1 million, represented by 111,381,815 shares (of which 3,739,010 were treasury shares) with a nominal value of $1.50 each. All issued shares are fully paid up.
B.PLAN OF DISTRIBUTION
Not applicable.
C.MARKETS
Our common shares have been listed on the NYSE under the symbol “AGRO” since January 28, 2011. See “—A. Offer and Listing Details.”
D.SELLING SHAREHOLDERS
Not applicable.
E.DILUTION
124
Not applicable.
F.EXPENSES OF THE ISSUE
Not applicable.
Item 10. Additional Information
A.SHARE CAPITAL
Not applicable.
B.MEMORANDUM AND ARTICLES OF ASSOCIATION
The following is a summary of some of the terms of our common shares, based in particular on our articles of incorporation and the Luxembourg law of August 10, 1915 on commercial companies as amended.
Adecoagro’s shares are governed by Luxembourg law and its articles of incorporation. More information concerning shareholders’ rights can be found in the Luxembourg law on commercial companies dated August 10, 1915, as amended and the articles of incorporation.
The following is a summary of the rights of the holders of our shares that are material to an investment in our common shares. These rights are set out in our articles of association or are provided by applicable Luxembourg law, and may differ from those typically provided to shareholders of U.S. companies under the corporation laws of some states of the United States. This summary does not contain all information that may be important to you. For more complete information, you should read our updated articles of association, which are attached as an exhibit to this annual report.
General
Adecoagro is a Luxembourg société anonyme (a joint stock company). The Company’s legal name is “Adecoagro S.A.” Adecoagro was incorporated on June 11, 2010 and on October 26, 2010 all the outstanding shares of Adecoagro were acquired by IFH LLC.
On October 30, 2010, the members of IFH LLC transferred pro rata approximately 98% of their membership interests in IFH LLC to Adecoagro in exchange for common shares of Adecoagro. In a series of transactions during 2012, we transferred shares of Adecoagro to certain limited partners of IFH in exchange for their residual interest in IFH, increasing our interest in IFH to approximately 100%.
On January 28, 2011, Adecoagro completed the IPO of its shares on the NYSE. The shares are traded under the symbol “AGRO.”
On March 27, 2015, Adecoagro commenced a series of transactions for the purpose of transferring the domicile of Adecoagro LP to Luxembourg. In connection with the Adecoagro LP redomiciliation, Adecoagro merged IFH into Adecoagro LP with Adecoagro LP as the surviving entity and Adecoagro GP S.à r.l., a société à responsabilité limitée organized under the laws of Luxembourg, became the general partner of Adecoagro LP on April 1, 2015. Also on April 1, 2015, Adecoagro completed the redomiciliation of Adecoagro LP (Delaware) out of Delaware to Luxembourg and Adecoagro LP, without dissolution or liquidation, continued its corporate existence as Adecoagro LP S.C.S., a société en commandite simple organized under Luxembourg law, effective April 2, 2015. For a detailed description of the Adecoagro LP redomiciliation please see “Item 4. Information on the Company—A. History and Development of the Company—History. Since that date the affairs of Adecoagro LP S.C.S. have been governed by its articles of association and Luxembourg law.
Adecoagro is registered with the Luxembourg Registry of Trade and Companies under number B153681. Adecoagro has its registered office at 6 Rue Eugène Ruppert, L-2453, Luxembourg, Grand Duchy of Luxembourg.
The corporate purpose of Adecoagro, as stated in Article 4 of our articles of incorporation (Purpose Object), is the following: The object of Adecoagro is the holding of participations, in any form whatsoever, in Luxembourg and foreign companies, or other entities or enterprises, the acquisition by purchase, subscription, or in any other manner as well as the transfer by sale, exchange or otherwise of stock, bonds, debentures, notes and other securities or rights of any kind including interests in partnerships, and the holding, acquisition, disposal, investment in any manner (in), development, licensing or sub
125
licensing of, any patents or other intellectual property rights of any nature or origin as well as the ownership, administration, development and management of its portfolio. Adecoagro may carry out its business through branches in Luxembourg or abroad.
Adecoagro may borrow in any form and proceed to the issuance by private or public means of bonds, convertible bonds and debentures or any other securities or instruments it deems fit.
In a general fashion it may grant assistance (by way of loans, advances, guarantees or securities or otherwise) to companies or other enterprises in which Adecoagro has an interest or which form part of the group of companies to which Adecoagro, belongs or any entity as Adecoagro may deem fit (including upstream or cross stream), take any controlling, management, administrative and/or supervisory measures and carry out any operation which it may deem useful in the accomplishment and development of its purposes.
Finally, Adecoagro can perform all commercial, technical and financial or other operations, connected directly or indirectly in all areas in order to facilitate the accomplishment of its purpose.
Share Capital
On April 20, 2022, the extraordinary general meeting of the shareholders of the Company resolved to reduce the issued share capital of the Company by a nominal amount of $16.5 million by the cancellation of 11,000,000 shares with a nominal value of $1.50 each held in treasury by the Company so that, since April 20, 2022, our issued share capital amounts to $ 167,072,722.50, represented by 111,381,815 shares in issue (of which 285,043 are treasury shares) with a nominal value of $1.50 each.
As of December 31, 2022, our issued share capital amounted to $167,072,722.50, represented by 111,381,815 shares in issue (of which 2,183,965 were treasury shares) with a nominal value of $1.50 each. All issued shares are fully paid up. Consequently, there were 109,197,850 common shares outstanding.
We have an authorized share capital of $220,287,267, including the issued share capital as of December 31, 2022 of $167,072,722.50, and are authorized to issue up to 146,858,178 shares of a nominal value of $1.50 each out of such authorized share capital. Our authorized unissued share capital as of December 31, 2022 is $53,214,544.50.
Our articles of incorporation authorize the Board of Directors to issue shares within the limits of the authorized unissued share capital at such times and on such terms as the board or its delegates may decide for a period ending on April 15, 2025 (unless it is extended, amended or renewed and we currently intend to seek renewals and/or extensions as required from time to time). Accordingly, the board may issue shares within the limits of the authorized (unissued) share capital against contributions in cash, contributions in kind or by way of incorporation of available reserves at such times and on such terms and conditions, including the issue price, as the Board of Directors or its delegate(s) may in its or their discretion resolve while reserving a preemptive subscription right to existing shareholders for any issue of shares.
Our authorized share capital is determined (and may be increased, reduced or extended) by our articles of incorporation, as amended from time to time, by the decision of our shareholders at an extraordinary general shareholders’ meeting with the necessary quorum and majority provided for the amendment of our articles of incorporation. See “—Amendment to the Articles of Incorporation” and “—General Meeting of Shareholders”.
Under Luxembourg law, existing shareholders benefit from a preemptive subscription right on the issuance of shares for cash consideration (which may however be waived).
Form and Transfer of Shares
Our shares are issued in registered form only and are freely transferable. Luxembourg law does not impose any limitations on the rights of Luxembourg or non-Luxembourg residents to hold or vote our shares.
Under Luxembourg law, the ownership of registered shares is evidenced by the inscription of the name of the shareholder, the number of shares held by him or her in the register of shares of the Company. Each transfer of shares in the share register shall be effected by written declaration of transfer to be recorded in the register of shares, such declaration to be dated and signed by the transferor and the transferee, or by their duly appointed agents. We may accept and enter into the share
126
register any transfer effected pursuant to an agreement or agreements between the transferor and the transferee, true and complete copies of which have been delivered to us.
We may appoint registrars in different jurisdictions, each of whom may maintain a separate register for the shares entered in such register. We have appointed Computershare as our New York registrar and transfer agent. The holders of our shares may elect to be entered in one of the registers and to be transferred from time to time from one register to another register provided that our Board of Directors may however impose transfer restrictions for shares that are registered, listed, quoted, dealt in, or have been placed in certain jurisdictions in compliance with the requirements applicable therein. The transfer to the register kept at the Company’s registered office may always be requested by a shareholder.
In addition, our articles of incorporation provide that our shares may be held through a securities settlement system or a professional depository of securities. Shares held in such manner have the same rights and obligations as shares recorded in our shareholder register(s) (subject to complying with certain formalities). Shares held through a securities settlement system or a professional depository of securities may be transferred in accordance with customary procedures for the transfer of securities in book-entry form.
Issuance of Shares
Pursuant to Luxembourg law of August 10, 1915 on commercial companies as amended, the issuance of shares in Adecoagro requires the approval by the general meeting of shareholders at the quorum and majority provided for the amendment of our articles of incorporation. See “—Amendment to the Articles of Incorporation” and “—General Meeting of Shareholders." The general meeting of shareholders may however approve an authorized unissued share capital and authorize the Board of Directors to issue shares up to the maximum amount of such authorized unissued share capital for a maximum period of five years. The general meeting may amend, renew or extend such authorized share capital and authorization to the Board of Directors to issue shares.
We have currently an authorized unissued share capital of $220,287,267, including the issued share capital as of April 20, 2022 of $167,072,722.50, and are authorized to issue up to 146,858,178 shares of a nominal value of $1.50 each (taking into account currently issued shares) out of such authorized share capital. As of April 20, 2022 the authorized unissued share capital was $53,214,544.50. Our Board has been authorized to issue shares within the limits of the authorized share capital at such times and on such terms as the board or its delegates may decide for a period ending on April 15, 2025 (unless it is extended, amended or renewed and we currently intend to seek renewals and/or extensions as required from time to time).
On April 15, 2020 the extraordinary general meeting of shareholders adjusted the authorized share capital to $220,287,267 represented by 146,858,178 shares of a nominal value of $1.50 each (which includes the issued share capital) and extended the validity period for five more years; until April 15, 2025. The extraordinary general meeting of shareholders also resolved that the board may issue shares up to the total number of authorized unissued shares until the latter date against contributions in cash or by way of incorporation of available reserves at such times and on such terms and conditions, including the issue price, as the Board of Directors or its delegate(s) may in its or their discretion resolve while reserving a preemptive subscription right to existing shareholders for any issue of shares.
Our articles provide that no fractional shares may be issued.
Our shares have no conversion rights and there are no redemption or sinking fund provisions applicable to our common shares.
Preemptive Rights
Holders of our shares have a pro rata preemptive right to subscribe for any new shares issued for cash consideration or by way of incorporation of available reserves. Our articles provide that in the event of an increase of the issued share capital by the Board of Directors within the limits of the authorized unissued share capital preemptive rights shall always be reserved.
Repurchase of Shares
We cannot subscribe for our own shares.
We may, however, repurchase issued shares or have another person repurchase issued shares for our account, subject in particular to the following conditions except in limited circumstances set forth by law)
127
•the prior authorization of the general meeting of shareholders (at the quorum and majority for ordinary resolutions), which authorization sets forth the terms and conditions of the proposed repurchase and in particular the maximum number of shares to be repurchased, the duration of the period for which the authorization is given (which may not exceed five years) and, in the case of repurchase for consideration, the minimum and maximum consideration per share, must have been obtained;
•the repurchase may not reduce our net assets on a non-consolidated basis to a level below the aggregate of the issued share capital increased by the reserves that we must maintain pursuant to Luxembourg law or its articles of incorporation; and
•only fully paid up shares may be repurchased.
The general meeting of shareholders has authorized that the Company, and/or any wholly-owned subsidiary (and/or any person acting on their behalf), may purchase, acquire, receive or hold shares in the Company under article 430-15 of the Luxembourg law of August 10, 1915, as amended, from time to time up to 10% of the issued share capital, on the following terms and on such terms as referred to below and as shall further be determined by the Board of Directors of the Company, such authorization being valid (subject to renewal) for a period of five years from January 10, 2011. Such period was thereafter extended to end on April 21, 2026.
Additionally, on April 20, 2022, the general meeting of shareholders authorized the Company, and/or any wholly-owned subsidiary (and/or any person acting on their behalf), to purchase, acquire, receive or hold shares in the Company under article 430-15 of the Luxembourg law of August 10, 1915, as amended, from time to time, up to an additional 10% of the issued share capital, on such terms as determined by the Board of Directors of the Company. This authorization is valid for a period of five years from April 20, 2022.
Acquisitions may be made in any manner including without limitation, by tender or other offers, buyback programs, over the stock exchange or in privately negotiated transactions or in any other manner as determined by the Board of Directors (including derivative transactions or transactions having the same or similar economic effect than an acquisition).
In the case of acquisitions for value:
(i) in the case of acquisitions other than in the circumstances set forth under (ii), for a net purchase price being (x) no less than 50% of the lowest stock price and (y) no more than 50% above the highest stock price, in each case being the closing price, as reported by the New York City edition of the Wall Street Journal, or, if not reported therein, any other authoritative source to be selected by the Board of Directors of the Company (hereafter, the closing price), over the ten (10) trading days preceding the date of the purchase (or as the case may be the date of the commitment to the transaction);
(ii) in case of a tender offer (or if deemed appropriate by the Board of Directors, a buyback program),
a. in case of a formal offer being published, for a set net purchase price or a purchase price range, each time within the following parameters: no less than 50% of the lowest stock price and (y) no more than 50% above the highest stock price, in each case being the closing price over the ten (10) trading days preceding the publication date, provided however that if the stock exchange price during the offer period fluctuates by more than 10%, the Board of Directors may adjust the offer price or range to such fluctuations;
b. in case a public request for sell offers is made, a price range may be set (and revised by the Board of Directors as deemed appropriate) provided that acquisitions may be made at a price which is no less than 50% of the lowest stock price and (y) no more than 50% above the highest stock price, in each case being the closing price over a period determined by the Board of Directors provided that such period may not start more than five (5) trading days before the sell offer start date of the relevant offer and may not end after the last day of the relevant sell offer period.
In addition, pursuant to Luxembourg law the Board of Directors may repurchase shares without the prior approval of the general meeting of shareholders if necessary to prevent serious and imminent harm to us or if the acquisition of shares has been made in view of the distribution thereof to the employees.
A share repurchase program was approved by the Board of Directors of the Company on September 12, 2013 to acquire up to 5% of the total outstanding share capital of the Company to be held as treasury shares (the “Share Repurchase Program”). The Share Repurchase Program was implemented in compliance with the authorization granted by the general meeting of shareholders of the Company, any applicable law, rules or regulations described above and the following limits
128
approved by the Board of Directors of the Company. The Share Repurchase Program was approved for a period of 12 months from September 23, 2014 (the date of its announcement) or until reaching the maximum number of shares authorized under the Share Repurchase Program, whichever occurs first. In April 4, 2017, the Board of Directors amended the Share Repurchase Program to include repurchases under Open Market Transactions, in reliance on the “safe harbor” from liability for manipulation provided by Rule 10b-18 of the Securities Exchange Act of 1934 (the “Securities Exchange Act”) and in privately negotiated transactions. The Share Repurchase Program was renewed by decision of the Board of Directors on August 9, 2022 for an additional period of 12 months, ending on September 23, 2023 or until reaching the maximum number of shares authorized under the Program, whichever occurs first.
Capital Reduction
The articles of incorporation provide that the issued share capital may be reduced, subject to the approval by the general meeting of shareholders at the quorum and majority provided for the amendment of our articles of incorporation. See “—Amendment to the Articles of Incorporation” and “—General Meeting of Shareholders”.
General Meeting of Shareholders
In accordance with Luxembourg law and our articles of incorporation, any regularly constituted general meeting of shareholders of Adecoagro represents the entire body of shareholders of the Company. It shall have the broadest powers to order, carry out or ratify acts relating to the operations of the Company.
The annual general meeting of shareholders of Adecoagro as well as any other meetings of shareholders shall be held in the Grand Duchy of Luxembourg at such place and time as indicated in the notice of the meeting.
Each of our shares entitles the holder thereof to attend our general meeting of shareholders, either in person or by proxy, to address the general meeting of shareholders, and to exercise voting rights, subject to the provisions of our articles of incorporation. Each share entitles the holder to one vote at a general meeting of shareholders. There is no minimum shareholding required to be able to attend or vote at a general meeting of shareholders.
A shareholder may act at any general meeting of shareholders by appointing another person (who need not be a shareholder) as his proxy, which proxy shall be in writing and comply with such requirements as determined by our board with respect to the attendance to the general meeting, and proxy forms in order to enable shareholders to exercise their right to vote. All proxies must be received by us (or our agents) no later than the day preceding the fifth (5th) working day before the date of the general meeting except if our Board of Directors decides to change such time frame.
Our articles of incorporation provide that in the case of shares held through the operator of a securities settlement system or depository, a holder of such shares wishing to attend a general meeting of shareholders must receive from such operator or depository a certificate certifying the number of shares recorded in the relevant account on the blocking date and certifying that the shares in the account shall be blocked until the close of the general meeting. Such certificates should be submitted to us no later than the day preceding the fifth working day before the date of the general meeting unless our board fixes a different period.
Our Board of Directors may determine a date preceding a general meeting as the record date for admission to such general meeting. When convening a general meeting of shareholders, we will publish the convening notice (which must be published at least 15 days before the meeting) in the Recueil Électronique des Sociétés et Associations, and in a Luxembourg newspaper and in the case the shares of the Company are listed on a regulated market, in accordance with the publicity requirements of such regulated market applicable to the Company. If all of the shareholders are present or represented at a general meeting of shareholders, the general meeting may be held without prior notice or publication. These convening notices must contain the agenda of the meeting and set out the conditions for attendance and representation at the meeting.
All materials relating to a general meeting of shareholders (including the notice) will be available at the website of Adecoagro at www.adecoagro.com and will be filed with the SEC on Form 6-K. The information on our website is not incorporated by reference in, and does not constitute a part of, this annual report.
Luxembourg law provides that the Board of Directors is obliged to convene a general meeting of shareholders if shareholders representing, in the aggregate, 10% of the issued share capital so require in writing with an indication of the agenda. In such case, the general meeting of shareholders must be held within one month of the request. If the requested general meeting of shareholders is not held within one month, shareholders representing, in the aggregate, 10% of the issued share capital, may petition the competent president of the district court in Luxembourg to have a court appointee convene the
129
meeting. Luxembourg law provides that shareholders representing, in the aggregate, 10% of the issued share capital may request that additional items be added to the agenda of a general meeting of shareholders. That request must be made by registered mail sent to the registered office at least five days before the holding of the general meeting of shareholders.
Voting Rights
Each share of our shares entitles the holder thereof to one vote at a general meeting of shareholders.
Luxembourg law distinguishes between “ordinary” general meetings of shareholders and “extraordinary” general meetings of shareholders.
Extraordinary general meetings of shareholders are convened to resolve in particular upon an amendment to the articles of incorporation and certain other limited matters including those described below and are generally subject to the quorum and majority requirements described below. All other general meetings of shareholders are ordinary general meetings of shareholders.
Ordinary General Meetings of Shareholders. At an ordinary general meeting of shareholders there is no quorum requirement, and resolutions are adopted by a simple majority of the votes validly cast, irrespective of the number of shares represented. Abstentions are not considered “votes”.
Extraordinary General Meetings of Shareholders. An extraordinary general meeting of shareholders convened for the purpose of in particular (a) an increase or decrease of the authorized or issued share capital, (b) a limitation or exclusion of preemptive rights, (c) approving a legal merger or de-merger of Adecoagro, (d) dissolution of the Company or (e) an amendment of the articles of incorporation must generally have a quorum of at least 50% of our issued share capital except in limited circumstances provided for by Luxembourg law. If such quorum is not reached, the extraordinary general meeting of shareholders may be reconvened, pursuant to appropriate notification procedures, at a later date with no quorum requirement applying.
Irrespective of whether the proposed actions described in the preceding paragraph will be subject to a vote at the first or a subsequent extraordinary general meeting of shareholders, such actions are generally subject to the approval of at least two-thirds of the votes validly cast at such extraordinary general meeting of shareholders (except in limited circumstances provided for by Luxembourg law). Abstentions are not considered “votes”.
Appointment and Removal of Directors. Members of the Board of Directors may be elected by simple majority of the votes validly cast at any general meeting of shareholders. Under the articles of incorporation, all directors are elected for a period of up to three years with such possible extension as provided therein provided however the directors shall be elected on a staggered basis, with one third (1/3) of the directors being elected each year and provided further that such three year term may be exceeded by a period up to the annual general meeting held following the third anniversary of the appointment. Any director may be removed with or without cause by a simple majority vote at any general meeting of shareholders. The articles of incorporation provide that in case of a vacancy the Board of Directors may co-opt a director.
Neither Luxembourg law nor our articles of incorporation contain any restrictions as to the voting of our shares by non-Luxembourg residents.
Amendment to the Articles of Incorporation
Luxembourg law requires an extraordinary general meeting of shareholders to resolve upon an amendment to the articles of incorporation. The agenda of the extraordinary general meeting of shareholders must indicate the proposed amendments to the articles of incorporation.
An extraordinary general meeting of shareholders convened for the purpose of amending the articles of incorporation must generally have a quorum of at least 50% of our issued share capital. If such quorum is not reached, the extraordinary general meeting of shareholders may be reconvened at a later date with no quorum according to the appropriate notification procedures. Irrespective of whether the proposed amendment will be subject to a vote at the first or a subsequent extraordinary general meeting of shareholders, the amendment is generally subject to the approval of at least two-thirds of the votes cast at such extraordinary general meeting of shareholders.
Any resolutions to amend the articles of incorporation must be taken before a Luxembourg notary and such amendments must be published in accordance with Luxembourg law.
130
Merger and Division
A merger by absorption whereby a Luxembourg company, after its dissolution without liquidation transfers to another company all of its assets and liabilities in exchange for the issuance to the shareholders of the company being acquired of shares in the acquiring company, or a merger effected by transfer of assets to a newly incorporated company, must, in principle, be approved by an extraordinary general meeting of shareholders of the Luxembourg company to be held before a notary. Similarly the de-merger of a Luxembourg company is generally subject to the approval by an extraordinary general meeting of shareholders.
Liquidation
In the event of the liquidation, dissolution or winding-up of Adecoagro, the assets remaining after allowing for the payment of all liabilities will be paid out to the shareholders pro rata to their respective shareholdings. The decision to voluntarily liquidate, dissolve or wind-up require the approval by an extraordinary general meeting of shareholders of the Company to be held before a notary.
No Appraisal Rights
Neither Luxembourg law nor our articles of incorporation provide for any appraisal rights of dissenting shareholders.
Distributions
Subject to Luxembourg law, each share is entitled to participate equally in distributions if and when if declared by the general meeting of shareholders out of funds legally available for such purposes. Pursuant to the articles of incorporation, the general meeting of shareholders may approve distributions and the Board of Directors may declare interim distribution, to the extent permitted by Luxembourg law.
Declared and unpaid distributions held by us for the account of the shareholders shall not bear interest. Under Luxembourg law, claims for unpaid distributions will lapse in our favor five years after the date such distribution has been declared.
Annual Accounts
Each year the Board of Directors must prepare annual accounts, that is, an inventory of the assets and liabilities of Adecoagro together with a balance sheet and a profit and loss account. The Board of Directors must also prepare, each year, consolidated accounts and management reports on the annual accounts and consolidated accounts. The annual accounts, the consolidated accounts, the management report and the auditor’s reports must be available for inspection by shareholders at the registered office of Adecoagro at least eight calendar days prior to the date of the annual general meeting of shareholders.
The annual accounts and the consolidated accounts, after approval by the annual general meeting of shareholders, will need to be filed with the Luxembourg registry of trade and companies within one month after the approval and no more than seven months after the close of the financial year.
Information Rights
Luxembourg law gives shareholders limited rights to inspect certain corporate records eight calendar days prior to the date of the annual general meeting of shareholders, including the annual accounts with the list of directors and auditors, the notes to the annual accounts and the consolidated accounts, a list of shareholders whose shares are not fully paid-up, the management reports, the auditor’s report and in case of amendments to the articles, the text of the proposed amendments and the draft of the resulting consolidated articles.
Any registered shareholder is entitled to receive a copy of the annual accounts, the consolidated accounts, the auditor’s reports and the management reports free of charge eight calendar days prior to the date of the annual general meeting of shareholders upon request.
Under Luxembourg law, it is generally accepted that a shareholder has the right to receive responses to questions concerning items on the agenda for a general meeting of shareholders, if such responses are necessary or useful for a shareholder to make an informed decision concerning such agenda item, unless a response to such questions could be detrimental to our interests.
131
One or more shareholders representing at least 10% of the share capital or 10% of the votes attached to all existing securities may ask the Board of Directors written questions on one or more management operations (opérations de gestion) of the company and, as the case may be, of subsidiaries it controls. In the latter case, the request must be assessed in view of the interest of the companies included within the consolidation. In the absence of response within a period of one month, these shareholders may apply to the court for the appointment of experts instructed to submit a report on the management operations targeted in the question.
Board of Directors
The management of Adecoagro is vested in a Board of Directors. Our articles of incorporation provide that the board must comprise at least three members and no more than 11 members. The number of directors is determined and the directors are appointed at the general meeting of shareholders (except in case of a vacancy in the office of a director because of death, retirement, resignation, dismissal, removal or otherwise, the remaining directors may fill such vacancy and appoint a successor in accordance with applicable Luxembourg law).
The directors are appointed for a period of up to three years; provided however the directors shall be elected on a staggered basis, with one-third of the directors being elected each year and provided further that such three year term may be exceeded by a period up to the annual general meeting held following the third anniversary of the appointment. Directors may be removed with or without cause (ad nutum) by the general meeting of shareholders by a simple majority of votes cast at a general meeting of shareholders. The directors shall be eligible for re-election indefinitely. The general shareholders’ meeting may dismiss one or more directors at any time, with or without cause by a resolution passed by simple majority vote, irrespective of the number of shares present at such general shareholders’ meeting.
Currently our board has nine members (see “Item 6. Directors, Senior Management and Employees—A. Directors and Senior Management—Board of Directors”). The board meets as often as required by our interests.
A majority of the members of the board in office (and able to vote) present or represented at a board meeting constitutes a quorum, and resolutions are adopted by the simple majority vote of the board members present or represented (and able to vote). The board may also take decisions by means of resolutions in writing signed by all directors.
Our board may delegate the daily management of the business of Adecoagro, as well as the power to represent Adecoagro in its day-to-day business, to individual directors or other officers or agents of the Company (with power to sub-delegate). In addition, the Board of Directors may delegate the daily management of the business of Adecoagro, as well as the power to represent Adecoagro in its day-to-day business to an executive or other committee as it deems fit. The Board of Directors shall determine the conditions of appointment and dismissal as well as the remuneration and powers of any person or persons so appointed.
Currently the Board of Directors has appointed the officers listed under “Item 6. Directors, Senior Management and Employees—A. Directors and Senior Management.”
The Board of Directors may (but shall not be obliged to unless required by law) establish one or more committees (including without limitation an audit committee, a risk and commercial committee, a strategy committee and a compensation committee) and for which it shall, if one or more of such committees are set up, appoint the members (who may be but do not need to be board members), determine the purpose, powers and authorities as well as the procedures and such other rules as may be applicable thereto (subject as to the audit committee as set forth therein).
Currently our board has set up an audit committee. See “Item 6. Directors, Senior Management and Employees—C. Board Practices.” Our board has set up a compensation committee. See “Item 6. Directors, Senior Management and Employees—C. Board Practices.” Our board has set up a risk and commercial committee. See “Item 6. Directors, Senior Management and Employees—C. Board Practices.” Our board has set up a strategy committee. See “Item 6. Directors, Senior Management and Employees—C. Board Practices.”
No director or member of any committee shall, solely as a result of being a director, be prevented from contracting with us, either with regard to his tenure of any office or place of profit or as vendor, purchaser or in any other manner whatsoever, nor shall any contract in which any director or member of any committee is in any way interested be liable to be avoided, in account of his position as director or member of any committee nor shall any director or member of any committee who is so interested be liable to account for us or the shareholders for any remuneration, profit or other benefit realized by the contract by reason of the director or member of any committee holding that office or of the fiduciary relationship thereby established.
132
Any director or, as the case may be, member of any committee having a direct or indirect interest in a transaction conflicting with our interest, which has to be considered by the Board of Directors or the relevant committee, as the case may be, shall be obliged to advise the board or the committee thereof and to cause a record of his statement to be included in the minutes of the meeting. He may not take part in these deliberations nor in the vote of the resolution. At the next following general meeting or Board of Directors’ meeting, before any resolution is put to vote, a special report shall be made on any transactions in which any of the directors or members of any committee may have had an interest conflicting with our interest.
No shareholding qualification for directors is required.
Directors and other officers, past and present, are entitled to indemnification from us to the fullest extent permitted by law against liability and all expenses reasonably incurred by him in connection with any claim, action, suit or proceeding in which he is involved by virtue of his being or having been a director. We may purchase and maintain for any director or other officer insurance against any such liability.
No indemnification shall be provided to any Director or officer against any liability to us or our shareholders by reason of willful misfeasance, bad faith, gross negligence or reckless disregard of the duties involved in the conduct of his office. No indemnification will be provided in the event of a settlement (unless approved by a court of competent jurisdiction or the board), nor will indemnification be provided in proceedings in which that director or officer has been finally adjudicated to have acted in bad faith and not in the interest of the Company.
Transfer Agent and Registrar
The transfer agent and registrar for our common shares is Computershare. The holders of our shares may elect to be entered in one of the registers and to be transferred from time to time from one register to another register provided that our Board of Directors may however impose transfer restrictions for shares that are registered, listed, quoted, dealt in, or have been placed in certain jurisdictions in compliance with the requirements applicable therein. The transfer to the register kept in Luxembourg may always be requested by a shareholder.
C.MATERIAL CONTRACTS
See “Item 4. Information on the Company—B. Business Overview—Material Agreements.”
133
D.EXCHANGE CONTROLS
On March 28, 1991, Law No. 23,928 (“Ley de Convertibilidad” or the “Convertibility Law”), established a fixed exchange rate of Argentine Peso (“Peso”) 1 per US$ In December 2001, Argentina experienced a period of severe political, economic, and social crisis, and on January 6, 2002, the Argentine Congress enacted Law No. 25,561 (“Ley de Emergencia Pública” or the “Public Emergency Law”) after more than ten years of fixed Peso - US$ parity. After devaluating the Peso and setting the official exchange rate at Peso 1.40 per US$, on February 11, 2002, the Argentine government allowed the Peso to float. The shortage of U.S. dollars and their heightened demand caused the Peso to further devaluate significantly in the first half of 2002, reaching its lowest valuation on June 25, 2002, when the exchange rate was at Pesos 3.90 per US$. Due to the deterioration of the economic and financial situation in Argentina during 2001 and 2002, in addition to the abandonment of the Peso - US$ parity, the Argentine government established several monetary and currency exchange control measures, including a partial freeze on bank deposits, the suspension of the payments of its sovereign foreign debt, restrictions on the transfer of funds out of, or into, Argentina, and the creation of the Single Free Foreign Exchange Market (“Mercado Único y Libre de Cambios,” which now is called “Mercado Libre de Cambios”) through which FX Market all purchases and sales of foreign currency must be made. Although since 2003 these restrictions were progressively eased to some extent, as a consequence of the increase in the demand in Argentina for U.S. dollars and the capital flow out of Argentina, the Argentine government imposed during 2011 some additional restrictions on the transfer of funds from Argentina and reduced the time required to comply with the mandatory transfer of funds into Argentina. Most foreign exchange restrictions and the restrictions on the transfer of funds into and out of Argentina that had been enacted since 2011, were lifted by Macri’s administration in December 2015, reestablishing Argentine residents’ rights to purchase and remit outside of Argentina's foreign currency with no maximum amount and without specific allocation or prior approval.
Due to the foreign exchange crisis that occurred in Argentina after the primary elections in August 2019, on September 1, 2019, by means of Executive Decree No. 609/2019 (“Decreto de Control de Exportaciones” or the “Export Controls Decree”), the Argentine national government reinstated foreign exchange controls. As the regulatory authority in charge of administering the FX Market, on the same date, the BCRA issued Communication “A” 6770, through which it established, inter alia, the cases in which prior BCRA approval is required for the purchase of foreign currency in the FX Market and its transfer abroad. See “Risk Factors—Risks Related to the Countries in Which We Operate—Economic and political conditions in the countries in which we operate, and the perception of these conditions in international markets, may adversely impact our business, our access to the capital and debt markets, our results of operations and financial condition.”
Since the issuance of the Export Controls Decree, the BCRA has periodically issued several regulations to regulate the inflow and outflow of funds through the FX Market, which are all unified under the consolidated text of foreign exchange available at the BCRA’s website: http://www.bcra.gob.ar/Pdfs/Texord/t-excbio.pdf. The most recent and comprehensive communications issued by the BCRA are Communications “A” 6844, 7272, 7422 and 7516.
Current foreign exchange controls in Argentina affects the ability of both Argentine and non-Argentine residents to access the FX Market at the so-called official exchange rate to acquire and/or transfer foreign currency to and from Argentina. They affect all industries and cover a wide variety of matters, including, among others, trading activities, imports and exports of goods and services, financial indebtedness, payment of profits and dividends, and repatriation of investments of non-Argentine residents.
Main Features of the Argentine Foreign Exchange Controls Affecting Our Activities and Transactions
Exports of Goods
Proceeds from exports of goods (the countervalue (‘contravalor’) in foreign currency) must be transferred to Argentina and sold for Pesos in the FX Market at the official exchange rate within a maximum term ranging from 15 to 180 calendar days depending on the goods exported and the relationship with the importer. Regardless of the applicable maximum term, upon collection of the export, the proceeds thereof must be repatriated no later than five business days from the date of collection.
Amounts collected in foreign currency for insurance claims related to the exported goods must also be repatriated and settled in Pesos in the FX Market, up to the amount of the insured exported goods.
The exporter must appoint a financial entity to track each export transaction. The obligation of repatriation and settlement of foreign currency through the FX Market corresponding to a shipping permit will be considered satisfied when the entity designated for tracking purposes certifies that repatriation and settlement has taken place.
134
Imports of Goods
Argentine companies currently have access to the FX Market to acquire foreign currency to make payments abroad, provided that certain requirements are met, including, the registration of the import transaction under the so-called Importation payment follow-up (Seguimiento de pagos de importaciones).
Different requirements apply to goods with customs entry registration, including, among others, that: (i) there is proof of the customs registry of the entry into the country of the goods that originated the payment to be canceled; (ii) the importer has a copy of the commercial invoice issued abroad in the name of the company who made the purchase abroad; and (iii) the documentation presented allows the importer to establish the expiration date of the foreign obligation; and goods with pending customs entry registration must comply with other requirements, including, among others: (i) the documentation allowing to determine the existence of a purchase of goods abroad; (ii) a sworn statement is submitted undertaking to demonstrate the registration of the customs entry of the goods within the term that corresponds according to the type of good to be imported; (iii) elements are provided allowing to guarantee the reasonableness of the amounts to be paid considering the importing activity of the client in recent years and/or the business plans presented by the importer; and (iv) there are no delays in the regularization of payments with pending customs entry registration made as of September 2, 2019.
Recently, the BCRA strengthened those requirements for importers that intend to access the FX Market by requesting them to obtain an approved declaration submitted in the Argentine System of Imports (“SIRA” after its acronym in Spanish) from local authorities. If the SIRA declaration is approved, the local authorities will inform the importer the term in which access to the FX Market will be granted. Such date usually ranges from 60 to 270 calendar days. Foreign exchange regulations provides for certain alternatives that would allow the Argentine importer to access the FX Market in anticipation of the date stated in the SIRA. Those alternatives may involve financing granted by a financial institution. The declaration of the SIRA will be analyzed by the AFIP, which will assess each individual situation based on information available in the AFIP’s records and the financial and economic capacity of the importer through the Economic Financial Capacity System (CEF or Sistema de Capacidad Económica Financiera). See “—Imports of services.”
Exports of Services
Generally, all foreign currency proceeds must be transferred to Argentina and sold for Pesos in the FX Market at the official exchange rate within five business days of collection.
Imports of Services
It is publicly known that Argentine companies currently have limited access to the FX Market to acquire foreign currency to make payments abroad. The most relevant restriction is likely the limitation on the payment of imports of services. Prior approval of the BCRA is required to access the FX Market for prepayments and payment of services to foreign-related parties.
As of October 13, 2022, access to the FX Market for payments of services rendered by non-residents requires the presentation of a declaration made through the System of Imports of the Argentine Republic and Payments of Services Abroad (“SIRASE” after its acronym in Spanish), as approved by the Secretary of Commerce, when access to the FX Market is requested.
The purpose of the SIRASE is to determine whether importers willing to make payments of services abroad have complied with tax obligations and are capable of carrying out certain financial transactions. Once the SIRASE declaration is submitted, the AFIP will review the information provided and confirm the importer’s compliance with tax return filings and its financial economic capacity through the CEF regime.
On April 20, 2023, through Communication “A” 7746, the BCRA modified foreign exchange regulations regarding foreign currency outflows. This amendment had a strong impact, mainly in the access to the FX Market for the payment of services rendered by non-Argentine residents. The BCRA’s prior approval must be requested to access to FX Market prior to 60 calendar days from the date of approval of the SIRASE declaration for research, legal and accounting, advertising, and engineering services, among others. Such prior approval will not be required, for example, if using own funds in foreign currency. Also, payment to related parties abroad for freight and transportation services must be made 90 calendar days after the date that the service has been rendered.
135
General Requirements to Access the FX Market
Pursuant to foreign exchange regulations, in order to access the FX Market for any type of payment to non-Argentine residents, Argentine residents must submit an affidavit stating, among others, that (i) all their holdings of foreign currency in Argentina are deposited at a local financial institution, and (ii) does not hold “liquid external assets” and/or Argentine deposit certificates representative of foreign companies (“Certficados de Depositos Argentinos” or “CEDEARs”) exceeding US$100,000, subject to certain exceptions. “Liquid external assets” include, among others, demand deposits in foreign financial institutions and other investments which allow for immediate liquidity in foreign currency (such as investments in foreign government securities, funds in investment accounts held abroad, crypto-assets, funds in payment service providers, etc.).
Moreover, the Argentine resident that intents to execute payments through the FX Market must also submit and affidavit confirming that they have not executed any of the following excluding transactions (the “Excluding Transactions”) from the FX Market within the previous 180 calendar days, and committing to refrain from executing them in the subsequent 180 calendar days—only regarding securities transactions executed as of April 21, 2023: (i) sale of securities in Argentina settled in foreign currency, (ii) swaps of Argentine securities for foreign assets, (iii) transfer of securities to a foreign depositary, (iv) acquisition of foreign securities in the country with settlement in Pesos, (v) acquisition of CEDEARs, (vi) acquisition of private debt securities issued in foreign jurisdictions, (vii) delivery of funds in local currency or other local assets (excluding funds in foreign currency deposited in local financial institutions) to any individual or entity receiving as consideration, either directly or indirectly, or through a related, controlled or controlling entity, external assets, crypto assets or securities deposited abroad.
Further, pursuant to Communication “A” 7746, if the aforementioned Excluding Transactions involve securities issued under local law, the applicable term of this affidavit is reduced to the previous 90 days and the commitment to refrain from executing such Excluding Transactions with securities issued under foreign law is also extended to the subsequent 90 calendar days as of the payment through the FX Market.
Further, an Argentine resident must identify its direct controllers and submit an affidavit stating whether it has delivered any funds in local currency or other liquid assets to any of its direct controllers in Argentina within the previous 180 calendar days—only regarding securities transactions executed as of April 21, 2023, except for usual transactions involving the acquisition of goods or services between Argentine residents. If so, an additional affidavit must be submitted by such direct controllers stating that they have not executed any of the Excluding Transactions mentioned above in the previous 180 calendar days, and commit to refrain from executing them in the subsequent 180 calendar days. Such 180 calendar days is reduced to 90 calendar days if the transaction involves securities issued under local law.
Foreign Financial Indebtedness
Foreign currency proceeds disbursed by non-Argentine residents as of September 1, 2019, must be transferred to Argentina and sold for Pesos in the FX Market, as a requirement for an Argentine resident not to require prior BCRA approval to access the FX Market to pay principal and interest. In addition, the transaction must have been declared under the Reporting Foreign Assets and Liabilities Regime. See “—Reporting of Foreign Assets and Liabilities Regime.”
Prepayments of principal and interests within more than three business days prior to the scheduled maturity require prior approval by the BCRA, subject to certain exceptions.
Further, prior BCRA approval is currently required to access the FX Market to pay the principal of any foreign financial indebtedness involving related parties, subject to certain exceptions. The BCRA approval has been granted and extended until December 31, 2023. However, it may be further extended in the future. Likewise, as from Communication “A” 4776, BCRA’s prior approval will be required to access the FX Market until such date, for the payment of interest on commercial debts for imports and/or financial indebtedness between related parties.
Obligations between Argentine residents in foreign currency
Access to the FX Market is restricted for the purchase of foreign currency to pay debts and other obligations between Argentine residents originated (“concertadas”) as of September 1, 2019, excluding, among others, any obligations registered in public registries or deeds prior to August 30, 2019.
Mandatory Refinancing of Certain External Debts
Pursuant to Communication “A” 7106 issued by the BCRA, as amended a supplemented, Argentine residents that hold certain external indebtedness with unrelated parties (including debt securities denominated in foreign currency and issued in
136
Argentina) must submit a refinancing plan to the BCRA to access the FX Market to make payments of principal due on or before December 31, 2023.
Mandatory refinancing obligations imply refinancing at least 60% of the outstanding principal of a debt with a new financing having an average term of not less than two years.
There are certain exceptions to these obligations, including, among others, monthly payments of principal that do not exceed US$2 million.
Distribution of Profits and Dividends
Access to the FX Market for the payment of dividends to non-resident shareholders is subject to prior BCRA approval, unless the following requirements are complied with:
a.Dividends must be the result of closed and audited balance sheets.
b.The total amount paid to non-resident shareholders as dividends shall not exceed the corresponding amount denominated in Pesos, as determined by the shareholders’ meeting.
c.If applicable, the Reporting of Foreign Assets and Liabilities Regime shall have been complied with.
d.The company meets all of the conditions stipulated in each case, including, among others, recording direct investment contributions settled as of January 17, 2020. In this case, (i) the total amount of transfers made through the FX Market to pay dividends to non-resident shareholders may not exceed 30% of the total value of the capital contributions made in the relevant local company that entered and settled through the FX Market as of January 17, 2020; (ii) access will only be granted after a period of not less than thirty calendar days as of the date of the settlement of the last capital contribution that is considered for determining the aforementioned 30% cap has elapsed; and (iii) evidence of the definitive capitalization of capital contributions must be provided or, if not available, evidence of filing of the process of registration of the capital contribution before the public registry shall be provided within 365 calendar days from the date of such initial filing.
In any other event, prior approval from the BCRA is required to access the FX Market to exchange foreign currency for the distribution of profits and dividends.
Exports Increase Program
Pursuant to Decree No. 576/2022, the Argentine Executive Branch created an extraordinary and transitory export increase program (‘Programa de Incremento Exportador’) (the “Export Increase Program") to strengthen the reserves of the BCRA. This program is commonly known as “Dollar Soja.” As a general rule, the countervalue of the exported goods must be brought into the country in foreign currency or must be negotiated in the FX Market. In addition, as an incentive for settlement, the program allowed exporters to make their settlements at an exchange rate of Pesos 200 per US$, instead of the official foreign exchange, which on September 4, 2022, was of Pesos 140 per US$. The deadline to settle any foreign currency obtained from exports, including pre-financing and post-financing exports from abroad and settlement advances, made through the Export Increase Program was September 30, 2022.
Through Decree No. 787/2022, the Export Increase Program was reestablished, establishing as an incentive an exchange rate of Pesos 230 per US$, with a deadline on December 30, 2022.
Finally, pursuant to Decree 194/2023, the Exports Increase Program was reinstated, establishing an exchange rate of Pesos 300 per US$ for those export transactions carried out until May 31, 2023, as an incentive, including sale transactions with a price in Pesos to be determined after the sale transaction is executed. This decree sets forth that those who have exported any of the goods listed therein, including, among others, soybean, during an 18-month period immediately preceding the enactment of the decree can become beneficiaries under the Exports Increase Program.
Adherence to the Export Increase Program implies that the countervalue of exported soybean crops must be repatriated and settled in the FX Market on or before May 31, 2023. Additionally, exporters must register the Sworn Declarations of Sales Abroad (“Declaraciones Juradas de Ventas al Exterior"or “DJVE”) for goods covered by the program and their final export destinations for consumption under certain conditions.
137
Adherence to the Export Increase Program will be voluntary for those who comply with applicable requirements. Registration for the program must be made through the AFIP’s registry system. Moreover, the Export Increase Program will apply to the goods included in the Decree 194/23 (the “Expanded Goods”), which will have the same exchange benefits as soybean crops in addition to the ability to settle their flows in foreign currency until August 31, 2023.
The Expanded Goods include, among others, the following products:
a.Animal and plant-based products such as fats, oils and waxes, and products of the food industries such as beverages, alcoholic liquids, vinegar and tobacco;
b.From the chemical industry, such as perfumery, toilet or cosmetic preparations;
c.Wood, charcoal and wooden articles, such as corks; and
d.Certain textile materials and articles.
Pursuant to Communications “A” 7609 and “A” 7610, the BCRA established that those participating in the Export Increase Program will not be allowed to execute any Excluding Transactions (as define above).
Blue-Chip Swaps
Blue chip-swap transactions are capital markets transactions made at the so-called implied rate (tipo de cambio implícito). Currently, there is a significant spread between the US$-Peso official exchange rate (i.e., approximately, US$1-Peso 220) and the implicit exchange rate applicable to blue chip swap transactions (i.e., approximately, US$1- Peso 450). Blue chip swap transactions could be implemented in different ways, both for the inflow and outflow of funds. [The execution of outbound blue-chip swaps may have an impact on our ability to access the FX Market to conduct our daily operations for a certain period of time. These transactions are made through broker-dealers (“sociedades de bolsa”). Blue chip swaps are regulated by the Argentine Securities Commission (CNV) requiring certain transactions to comply with a minimum holding period of the securities, among others.
Access to the FX Market for Individual Purchases or Investments
Since December 21, 2019, the Argentine Congress has passed the Social Solidarity Law, which, among others, established a new 30% Tax for an Inclusive and Solidary Argentina (Impuesto para una Argentina Inclusiva y Solidaria, or the “PAIS Tax”) on the purchase by Argentine residents of foreign currency for portfolio purposes, the acquisition of goods and services with credit and debit cards and any payments in connection with international passenger transportation. Digital services rendered from outside Argentina (such as hosting, web services, software as a service, streaming services, etc.) are subject to a reduced tax rate of 8.0%.
On September 15, 2020, pursuant to General Resolution 4815, the AFIP established a 35% levy on transactions taxed with the PAIS Tax on account of income tax or personal property tax, depending on the tax status of the taxpayer.
Subsequently, the AFIP issued General Resolution 5272 on October 12, 2022 to amend General Resolution 4815, increasing the payment on account of income tax or personal property tax, from 35% to 45% for the purchase of foreign currency to acquire goods and services abroad, or in the country to be paid to individuals domiciled abroad, for a monthly amount that is less than US$300, and adding an additional collection of 25% when the monthly amount is equal to or greater than US$300. In such case, the total amount of the collection will be 75% of the amount in Pesos of the exchange transaction.
Reporting of Foreign Assets and Liabilities Regime
Argentine residents must report their foreign assets as well as their financial and commercial indebtedness to the BCRA pursuant to Communication “A” 6401, as amended, according to the timetables therein. Compliance with this information regime is a requirement that must be met to access the FX Market and make payments abroad.
Investment Promotion Regime for Exports
Executive Decree No. 234/2021 created the Investment Promotion Regime for Exports (“Régimen de Fomento de Inversión para las Exportaciones”) (the “Investment Promotion Regime”) to promote economic growth and development in the country. Pursuant to the decree, certain investments exceeding US$100 million destined to the initiation of new productive projects in forestry-industrial, mining, hydrocarbon, manufacturing and agro-industrial activities, as well as for the expansion of
138
existing business units that require investment in order to increase their production, will benefit from a freely applicable amount of up to 20% of any foreign currency obtained from exports related to the project, to the extent that certain conditions are met (for example, the benefit may not exceed an annual maximum amount equal to 25% of the gross amount of the foreign currency obtained through the FX Market to finance the development of the project, which benefit may only be applied after the first anniversary of the transfer of the foreign currency into Argentina), in order to pay principal and interest on commercial or financial liabilities abroad and profits and dividends corresponding to finalized and audited financial statements, or to repatriate non-resident direct investments. Pursuant to Executive Decree No. 836/2021, the Investment Promotion Regime introduced an additional incentive for investments exceeding US$500 million and US$1,000 million, which sets forth that for each calendar year that the benefit is not used, during the two consecutive years to follow, the beneficiary will enjoy a freely applicable amount of up to 40% or up to 60% for investments exceeding US$500 million and $1,000 million, respectively, of the foreign currency obtained from exports related to the project, to the extent that certain conditions are met (fore example, the benefit may not exceed annual maximum amounts equal to 40% and 60% for investments exceeding US$500 million and $1,000 million, respectively, of the gross amount of foreign currency obtained through the FX Market to finance the development of the project, and may be applied after the second anniversary of the first transfer of the foreign currency into Argentina), in order to pay principal and interest on commercial or financial liabilities abroad and profits and dividends that correspond to finalized and audited financial statements, or to repatriate non-resident direct investments.
Sanctions
The breach of foreign exchange rules is subject to sanctions under Law No. 19,359 (as restated by Decree No. 480/95 and as further amended) and supplementary regulations (the “Criminal Exchange Regime”). The Criminal Exchange Regime establishes that any act or omission that violates the exchange regulations shall be subject to sanctions under such regime. Sanctions include fines of up to ten times the amount of the infringing transaction, temporary suspensions, and disqualification, or criminal liability in the event of recidivism. However, fines under the Criminal Exchange Act may not exceed ten times the amount of the largest of the infringing transactions charged within the same summary proceeding. In addition, the Criminal Exchange Regime is applied not only to legal entities, but also to their legal representatives, directors, agents, managers and trustees.
For additional information regarding all current foreign exchange restrictions and exchange control regulations in Argentina, investors should consult their legal advisors and read the applicable rules mentioned herein, as well as any amendments and supplementary regulations, which are available at the Argentine Ministry of Treasury’s website: https://www.argentina.gob.ar/economia; and the BCRA’s website: www.bcra.gob.ar.
E.TAXATION
MATERIAL LUXEMBOURG TAX CONSIDERATIONS FOR HOLDERS OF COMMON SHARES
The following is a summary discussion of certain Luxembourg tax considerations of the acquisition, ownership and disposition of your shares that may be applicable to you if you acquire our shares. This does not purport to be a comprehensive description of all of the tax considerations that may be relevant to any of the Company’s common shares, and does not purport to include tax considerations that arise from rules of general application or that are generally assumed to be known to holders. This discussion is not a complete analysis or listing of all of the possible tax consequences of such transactions and does not address all tax considerations that might be relevant to particular holders in light of their personal circumstances or to persons that are subject to special tax rules.
It is not intended to be, nor should it be construed to be, legal or tax advice. This discussion is based on Luxembourg laws and regulations as they stand on the date of this annual report and is subject to any change in law or regulations or changes in interpretation or application thereof (and which may possibly have a retroactive effect). Prospective investors should therefore consult their own professional advisers as to the effects of state, local or foreign laws and regulations, including Luxembourg tax law and regulations, to which they may be subject.
As used herein, a “Luxembourg individual” means an individual resident in Luxembourg who is subject to personal income tax (impôt sur le revenu) on his or her worldwide income from Luxembourg or foreign sources, and a “Luxembourg corporate holder” means a company (that is, a fully taxable entity within the meaning of Article 159 of the Luxembourg Income Tax Law) resident in Luxembourg subject to corporate income tax (impôt sur le revenu des collectivités) on its worldwide income from Luxembourg or foreign sources. For purposes of this summary, Luxembourg individuals and Luxembourg
139
corporate holders are collectively referred to as “Luxembourg Holders." A “non-Luxembourg Holder” means any investor in shares of Adecoagro other than a Luxembourg Holder.
Tax regime applicable to realized capital gains
Luxembourg Holders
Luxembourg resident individual holders
Capital gains realized by Luxembourg resident individuals who do not hold their shares as part of a commercial or industrial business and who hold no more than 10% of the share capital of the Company will only be taxable if they are realized on a sale of shares that takes place before their acquisition or within the first six months following their acquisition.
Luxembourg resident corporate holders
Capital gains realized upon the disposal of shares by a fully taxable resident corporate holder will in principle be subject to corporate income tax and municipal business tax. The combined applicable rate (including an unemployment fund contribution) is 24.94% for the fiscal year ending 2023 for a corporate holder established in Luxembourg-City. An exemption from such taxes may be available to the holder pursuant to article 166 of the Luxembourg Income Tax Law subject to the fulfillment of the conditions set forth therein. The scope of the capital gains exemption can be limited in the cases provided by the Grand Ducal Decree of December 21, 2001.
Non-Luxembourg Holders
An individual who is a non-Luxembourg Holder of shares (and who does not have a permanent establishment, a permanent representative or a fixed place of business in Luxembourg) will only be subject to Luxembourg taxation on capital gains arising upon disposal of such shares if such holder has (together with his or her spouse and underage children) directly or indirectly held more than 10% of the capital of Adecoagro at any time during the past five years, and either (i) such holder has been a resident of Luxembourg for tax purposes for at least 15 years and has become a non-resident within the last five years preceding the realization of the gain, subject to any applicable tax treaty, or (ii) the disposal of shares occurs within six months from their acquisition (or prior to their actual acquisition), subject to any applicable tax treaty.
A corporate non-Luxembourg Holder (that is, an entity within the meaning of Article 159 of the Luxembourg Income Tax Law), which has a permanent establishment, a permanent representative or a fixed place of business in Luxembourg to which shares are attributable, will bear corporate income tax and municipal business tax on a gain realized on a disposal of such shares as set forth above for a Luxembourg corporate holder. However, gains realized on the sale of the shares may benefit from the full exemption provided for by Article 166 of the Luxembourg Income Tax Law and by the Grand Ducal Decree of December 21, 2001 subject in each case to fulfillment of the conditions set out therein.
A corporate non-Luxembourg Holder, which has no permanent establishment in Luxembourg to which the shares are attributable, will bear corporate income tax on a gain realized on a disposal of such shares under the same conditions applicable to an individual non-Luxembourg Holder, as set out above. In principle a corporate non-Luxembourg holders is only subject to taxation under (ii) above and not to taxation under (i) above. This result obtains from the provision that when a corporate Luxembourg holder migrates abroad and becomes a corporate non-Luxembourg holders, at that moment in time such holder is deemed liquidated for Luxembourg tax purposes and taxation applies at the moment in time.
Tax regime applicable to distributions
Withholding tax
Distributions imputed for tax purposes on newly accumulated profits are subject to a withholding tax of 15%. The rate of the withholding tax may be reduced pursuant to double tax avoidance treaty existing between Luxembourg and the country of residence of the relevant holder, subject to the fulfillment of the conditions set forth therein.
No withholding tax applies if the distribution is made to (i) a Luxembourg resident corporate holder (that is, a fully taxable entity within the meaning of Article 159 of the Luxembourg Income Tax Law), (ii) an undertaking of collective character which is resident of a Member State of the European Union and is referred to by article 2 of the Council Directive of 2011/96 concerning the common fiscal regime applicable to parent and subsidiary companies of different member states of November 20, 2011 (the "Parent Subsidiary Directive"), (iii) a corporation or a cooperative company resident in Norway,
140
Iceland or Liechtenstein and subject to a tax comparable to corporate income tax as provided by the Luxembourg Income Tax Law, (iv) an undertaking with a collective character subject to a tax comparable to corporate income tax as provided by the Luxembourg Income Tax Law which is resident in a country that has concluded a tax treaty with Luxembourg, (v) a Luxembourg permanent establishment of one of the aforementioned categories and (vi) a corporation company resident in Switzerland which is subject to corporate income tax in Switzerland without benefiting from an exemption, provided that at the date of payment, the holder holds or commits to hold directly or through a tax transparent vehicle, during an uninterrupted period of at least 12 months, shares representing at least 10% of the share capital of Adecoagro or acquired for an acquisition price of at least EUR 1,200,000, and provided that the dividend recipient is not excluded to benefit from the Parent Subsidiary Directive under its mandatory general anti-avoidance rule, as implemented in Luxembourg.
Luxembourg Holders
With the exception of a Luxembourg corporate holder benefiting from the exemption referred to above, Luxembourg individual holders, and Luxembourg corporate holders subject to Luxembourg corporation taxes, must include the distributions paid on the shares in their taxable income, 50% of the amount of such dividends being exempted from tax. The applicable withholding tax can, under certain conditions, entitle the relevant Luxembourg Holder to a tax credit.
Net wealth tax
Luxembourg Holders
Luxembourg net wealth tax will not be levied on a Luxembourg Holder with respect to the shares held unless (i) the Luxembourg Holder is a legal entity subject to net wealth tax in Luxembourg; or (ii) the shares are attributable to an enterprise or part thereof which is carried on through a permanent establishment, a fixed place of business or a permanent representative in Luxembourg.
Net wealth tax is levied annually at the rate depending on the amount the net wealth of enterprises resident in Luxembourg or, a reduced rate of 0.05% for the portion of the net wealth exceeding EUR 500 million, as determined for net wealth tax purposes (i.e. 0.5% on an amount up to EUR 500 million and 0.05% on the amount of taxable net wealth exceeding EUR 500 million). The shares may be exempt from net wealth tax subject to the conditions set forth by Paragraph 60 of the Law of October 16, 1934 on the valuation of assets (Bewertungsgesetz), as amended.
Non-Luxembourg Holders
Luxembourg net wealth tax will not be levied on a non-Luxembourg Holder with respect to the shares held unless the shares are attributable to an enterprise or part thereof which is carried on through a permanent establishment or a permanent representative in Luxembourg.
United States Federal Income Taxation of the Company
Our business assets and properties are located, and all of our employees and executives are based outside the United States. Our business is directly conducted through operating companies organized under the laws of countries other than the United States. These non-U.S. operating companies are indirectly owned by Adecoagro LP SCS, a holding company which is a société commandite simple organized under the laws of Luxembourg. As a partnership that is not engaged in a trade or business within the United States within the meaning of section 864 of the U.S. Internal Revenue Code of 1986, as amended (the “Code”), Adecoagro LP SCS is not itself subject to U.S. federal net income taxes. We acquired approximately 98 percent of Adecoagro LP SCS’s, predecessor company, IFH, prior to undertaking the IPO in exchange for our stock.
Under rules to prevent expatriation of and by U.S. corporations and certain U.S. partnerships under section 7874(b) of the Code, we would be treated as a U.S. domestic corporation if for this purpose (i) we were deemed to have acquired substantially all of the assets constituting the trade or business of a U.S. domestic partnership and (ii) former members of IFH were deemed to own at least 80% of our stock by reason of the transfer of those trade or business assets (ignoring stock issued in the IPO for purposes of the 80% threshold) and (iii) we were found not to conduct substantial business activities in Luxembourg. In that event, we would be subject to U.S. federal net income tax on our worldwide income and dividends we pay to non-U.S. shareholders would be subject to U.S. federal withholding tax at a 30% rate (subject to reduction, to the extent the beneficial owner of the dividend is entitled to claim a reduced rate of withholding under an applicable income tax treaty).
We believe that the restructuring transactions executed prior to or in connection with the IPO should not be subject to section 7874(b) of the Code. Accordingly, we do not believe that we will be subject to U.S. federal income tax on our
141
worldwide income nor do we anticipate paying dividends subject to U.S. federal withholding tax. However, the relevant rules are unclear in certain respects and there is limited guidance on the application of the rules to acquisitions of partnerships or partnership assets constituting a trade or business. Accordingly, we can provide no assurance that the U.S. Internal Revenue Service (the “IRS”) will not seek to assert that we are a U.S. domestic corporation, which assertion, if successful could materially increase our U.S. federal income tax liability. Holders of our common shares who are non-United States persons should also note that, in that event, we would generally be required to withhold tax from any dividends we pay to holders of our common shares who are not United States persons within the meaning of section 7701(a)(30) of the Code (subject to any applicable income tax treaties applicable to such holders).
Shareholders are urged to consult their own tax advisors about the possible application of section 7874 of the Code. The remainder of this discussion assumes that we are not treated as a U.S. corporation for U.S. federal income tax purposes.
Material U.S. Federal Income Tax Considerations for U.S. Holders
The following is a discussion of the material U.S. federal income tax considerations relating to the purchase, ownership and disposition of our common shares. This discussion applies only to beneficial owners of common shares that are “U.S. Holders” (as defined below), who have purchased our common shares in the open market and that hold our common shares as “capital assets” for U.S. federal income tax purposes (generally, property held for investment). This discussion is based on the Code, its legislative history, final, temporary and proposed Treasury regulations, administrative pronouncements, judicial decisions, and the income tax treaty between Luxembourg and the United States (the “Treaty”), all as of the date hereof, and all of which are subject to change and to differing interpretations (possibly with retroactive effect). No ruling has been sought from the IRS with respect to any U.S. federal income tax consequences described below, and there can be no assurance that the IRS or a court will not take a contrary position.
This discussion does not address all U.S. federal income tax considerations that may be relevant to a particular holder based on its particular circumstances with respect to the acquisition, ownership and disposition of our common shares, and holders are urged to consult their own tax advisors regarding their specific tax situations. For example, the discussion does not address the tax considerations that may be relevant to U.S. Holders in special tax situations, such as:
•insurance companies;
•tax-exempt entities, “individual retirement accounts” or “Roth IRAs”;
•brokers or dealers in securities or currencies and traders in securities that elect to mark-to- market;
•banks and financial institutions;
•partnerships or other pass-through entities (or a person holding our common shares through a partnership or other pass-through entity or arrangement treated as such);
•real estate investment trusts and regulated investment companies;
•companies that accumulate earnings to avoid U.S. federal income tax;
•persons who acquire common shares through the exercise of employee share options or other compensation: arrangements;
•persons liable for alternative minimum tax;
•S corporations;
•accrual-method taxpayers subject to special tax accounting rules under Section 451(b) of the Code;
•holders whose functional currency for U.S. federal income tax purposes is not the U.S. dollar;
•holders that hold shares through non-U.S. brokers of other non-U.S. intermediaries;
•certain former U.S. citizens or residents or U.S. expatriates;
•holders that hold our common shares as part of a hedge, straddle or conversion or other integrated transaction;
142
•holders that hold our common shares in connection with a trade or business conducted outside of the United States;
•holders that purchase or sell our common shares as part of a wash sale for U.S. federal income tax purposes; or
•holders that own, directly, indirectly, or constructively, 10% or more of the total combined voting power or value of our common shares.
If a partnership (or an entity or arrangement treated as a partnership for U.S. federal income tax purposes) owns our common shares, the tax treatment of a partner will generally depend upon the status of the partner and upon the activities of the partnership. A partnership that owns our common shares, and partners in such a partnership, should consult their own tax advisors regarding their specific tax situations.
This discussion does not address the alternative minimum tax consequences of owning common shares or the indirect consequences to holders of equity interests in partnerships or other entities that own our common shares. Moreover, this discussion does not address the state, local and foreign tax consequences of acquiring, owning, or disposing of our common shares, or any aspect of U.S. federal tax law (such as the estate, generation-skipping and gift tax) other than U.S. federal income taxation.
As used herein, a “U.S. Holder” is a person that is, for U.S. federal income tax purposes, a beneficial owner of our common shares and:
•an individual who is a citizen or resident of the United States;
•a corporation, or any other entity taxable as a corporation, created or organized in or under the laws of the United States or any State thereof, including the District of Columbia; or
•an estate or trust the income of which is subject to U.S. federal income taxation regardless of its source.
Taxation of Dividends
Subject to the passive foreign investment company (“PFIC”) rules discussed below, under the U.S. federal income tax laws distributions with respect to our common shares (other than certain pro rata distributions of common shares) made to U.S. Holders will, to the extent made from our current or accumulated earnings and profits, as determined under U.S. federal income tax principles, constitute dividends for U.S. federal income tax purposes that are taxable to the U.S. Holders. Distributions in excess of our current and accumulated earnings and profits, as determined under U.S. federal income tax principles, will be treated as a non-taxable return of capital to the extent of a U.S. Holder’s adjusted tax basis in the common shares and thereafter as capital gain from the sale or exchange of the common shares. We do not currently maintain calculations of our earnings and profits under U.S. federal income tax principles. Unless and until these calculations are made, distributions should be presumed to be taxable dividends for U.S. federal income tax purposes. As used below, the term “dividend” means a distribution that constitutes a dividend for U.S. federal income tax purposes.
Dividends (including amounts withheld on account of foreign taxes) paid with respect to our common shares generally will be includible in the gross income of a U.S. Holder as ordinary income on the day on which the dividends are actually or constructively received by the U.S. Holder. Dividends with respect to our common shares will not be eligible for the dividends received deduction allowed to U.S. corporations in respect of dividends received from other U.S. corporations or certain foreign corporations.
Subject to applicable limitations, dividends paid to certain non-corporate U.S. Holders may be eligible for taxation as “qualified dividend income” and therefore may be taxable at rates applicable to long-term capital gains, provided that our common shares are readily tradable on an established securities market in the United States. In order to qualify for qualified dividend income treatment, U.S. Holders must meet certain holding period requirements, and we must not be a PFIC for the taxable year in which the dividend is paid or the preceding year. The NYSE, on which our common shares are listed, is an established securities market in the United States, and we expect that our common shares should qualify as readily tradable, although there can be no assurances in this regard. U.S. Holders should consult their own tax advisors regarding the availability
143
of the preferential rates of taxation with respect to dividends in light of their own particular situations, including related restrictions and special rules. Corporate U.S. Holders are taxed on dividend income at the U.S. federal corporate income tax rate whether or not the dividend income is qualified dividend income.
The amount of any cash dividend paid in foreign currency will equal the U.S. dollar value of the dividend, calculated by reference to the exchange rate in effect on the date the distribution is includible in the gross income of the U.S. Holder, regardless of whether the payment is in fact converted to U.S. dollars at that time. A U.S. Holder should not recognize any foreign currency gain or loss in respect of such dividend distribution if such foreign currency is converted into U.S. dollars on the date the dividend distribution is includible in the U.S. Holder’s gross income. If the foreign currency is not converted into U.S. dollars on the date the dividend distribution is includible in the U.S. Holder’s gross income; however, gain or loss may be recognized upon a subsequent conversion of the foreign currency to U.S. dollars. Such foreign currency gain or loss, if any, generally will be U.S.-source ordinary income or loss and will not be eligible for the preferential tax rate applicable to qualified dividend income. The amount of any distribution of property other than cash will be the fair market value of such property on the date of distribution.
Dividends will be foreign-source and will include any amount withheld by us in respect of Luxembourg income taxes. Subject to applicable limitations, some of which vary depending upon the U.S. Holder’s particular circumstances, and the discussion below regarding certain Treasury regulations, non-refundable Luxembourg income taxes withheld from dividends (at a rate not exceeding any applicable rate provided by the Treaty in the case of U.S. Holders eligible for the Treaty) will be creditable against the U.S. Holder’s U.S. federal income tax liability. The rules governing foreign tax credits are complex. For example, under Treasury regulations, in the absence of an election to apply the benefits of an applicable income tax treaty, in order for foreign income taxes to be creditable, the relevant foreign income tax rules must be consistent with certain U.S. federal income tax principles, and we have not determined whether the Luxembourg income tax system meets these requirements. U.S. Holders should consult their tax advisers regarding the creditability of foreign taxes in their particular circumstances. In lieu of claiming a foreign tax credit, U.S. Holders may, at their election, deduct foreign taxes, including any Luxembourg income tax, in computing their taxable income, subject to generally applicable limitations under U.S. law. An election to deduct foreign taxes instead of claiming foreign tax credits applies to all foreign taxes paid or accrued in the taxable year.
Taxation of Capital Gains
Subject to the PFIC rules discussed below, gain or loss realized by a U.S. Holder on the sale, exchange or other taxable disposition of common shares will be subject to U.S. federal income taxation as capital gain or loss in an amount equal to the difference between the U.S. dollar value of the amount realized (including the gross amount of the proceeds before the deduction of any foreign tax) on the sale or other taxable disposition and such U.S. Holder’s adjusted tax basis, determined in U.S. dollars, in the common shares. Capital gains of non-corporate U.S. Holders derived with respect to capital assets held for more than one year generally are eligible for the preferential rates of taxation applicable to long-term capital gains. The deductibility of capital losses is subject to limitations under the Code.
Capital gain or loss, if any, realized by a U.S. Holder on the sale, exchange or other taxable disposition of a common share generally will be treated as U.S.-source income or loss for U.S. foreign tax credit purposes. U.S. Holders should consult their tax advisors regarding the creditability or deductibility of any Luxembourg taxes imposed on a sale, exchange or other taxable disposition of common shares.
Passive Foreign Investment Company (“PFIC”) Rules
U.S. Holders generally will be subject to a special, generally adverse tax regime that would differ in certain material respects from the tax treatment described above if we are, or were to become, a PFIC for U.S. federal income tax purposes.
In general, we will be a PFIC with respect to a U.S. Holder if, for any taxable year in which the U.S. Holder owns our common shares, either (i) at least 75% of our gross income for the taxable year is passive income or (ii) at least 50% of the value (generally determined on the basis of a quarterly average) of our assets during such taxable year is attributable to assets that produce or are held for the production of passive income. For this purpose, “passive income” generally includes, among other things and subject to certain exceptions, dividends, interest, royalties, rents, annuities, gains from securities transactions, net foreign currency gains and net gains from assets that produce passive income. If a foreign corporation owns at least 25% by value of the stock of another corporation, the foreign corporation is treated for purposes of the PFIC tests as owning its proportionate share of the assets of the other corporation, and as receiving directly its proportionate share of the other corporation’s income.
144
Whether we will be a PFIC for the current or future tax year will depend on our assets and income over the course of each such tax year and, as a result, cannot be predicted with certainty as of the date of this annual report. Under circumstances where our cash is not deployed for active purposes, our risk of becoming a PFIC may increase.Although the determination of whether a corporation is a PFIC is made annually, and thus may be subject to change, we do not believe that we were a PFIC for U.S. federal income tax purposes for our most recently completed taxable year. However, there can be no assurance that we will not be a PFIC for any taxable year.
If we are a PFIC for any taxable year during which a U.S. Holder owns our common shares, unless the U.S. Holder makes a timely “mark-to-market” election electing to be taxed annually on a mark-to-market basis with respect to such U.S. Holder’s common shares, or makes a timely “qualified electing fund” election electing to be taxed annually on the earnings and gains of the PFIC attributable to such U.S. Holder’s common shares (irrespective of distributions), gain recognized by such U.S. Holder on a sale or other disposition (including certain pledges) of its common shares would be allocated ratably over such U.S. Holder’s holding period in the common shares and would be taxed at the highest tax rate in effect for each such year to which the gain was allocated, together with an interest charge in respect of the tax attributable to each such year except for the current year. In addition, distributions that the U.S. Holder receives from us will not be eligible for the preferential tax rates applicable to qualified dividend income if we are treated as a PFIC with respect to such U.S. Holder either in the taxable year of the distribution or the preceding taxable year, but instead will be taxable at the tax rates applicable to ordinary income, and to the extent they are treated as “excess distributions” under the PFIC rules, they will also be subject to the PFIC interest charge described above. We do not intend to provide the information necessary to enable U.S. Holders to make a “qualified electing fund” election.
A U.S. Holder generally will be required to make an annual filing with the IRS if such holder owns common shares in any year in which we are a PFIC. With certain exceptions, our common shares will continue to be treated as stock in a PFIC with respect to a particular U.S. Holder if we are a PFIC at any time during such U.S. Holder’s holding period in our common shares even if we no longer meet the threshold requirements for PFIC status in a later year.
The U.S. federal income tax rules relating to PFICs are complex. U.S. Holders are urged to consult their own tax advisers with respect to the application of the PFIC rules to their investment in our common shares.
Information Reporting and Backup Withholding
In general, dividends on common shares, and payments of the proceeds of a sale, exchange or other taxable disposition of common shares, paid within the U.S. or through certain U.S. related financial intermediaries to a U.S. Holder are subject to information reporting and may be subject to backup withholding unless the holder is an exempt recipient or, in the case of backup withholding, provides an accurate taxpayer identification number and certifies under penalty of perjury that the holder is a U.S. person and is not subject to backup withholding.
Backup withholding is not an additional tax. Any amounts withheld under the backup withholding rules generally will be allowed as a refund or a credit against a U.S. Holder’s U.S. federal income tax liability, provided that the required information is timely furnished to the IRS.
Certain U.S. Holders who hold interests in “specified foreign financial assets” (as defined in section 6038D of the Code) are generally required to file an IRS Form 8938 as part of their U.S. federal income tax returns to report their ownership of such specified foreign financial assets, which may include our common shares, if the total value of those assets exceeds certain thresholds. Financial assets that are held through a U.S. financial institution are not subject to this reporting requirement. Investors who fail to report this required information could become subject to substantial penalties. In addition, in the event a U.S. Holder that is required to file IRS Form 8938 does not file such form, the statute of limitations on the assessment and collection of U.S. federal income taxes of such holder for the related tax year may not close until three years after the date that the required information is filed. U.S. Holders are encouraged to consult with their own tax advisors regarding their tax reporting obligations.
F.DIVIDENDS AND PAYING AGENTS
Not applicable.
G.STATEMENT BY EXPERTS
Not applicable.
145
H.DOCUMENTS ON DISPLAY
We are required to file annual and special reports and other information with the SEC. You may read and copy any documents filed by the Company at the SEC’s public reference room at 100 F Street, N.E., Room 1580, Washington, D.C. 20549. Please call the SEC at 1-800-SEC-0330 for further information on the public reference room. The SEC also maintains a website at http://www.sec.gov which contains reports and other information regarding registrants that file electronically with the SEC.
I.SUBSIDIARY INFORMATION
Not applicable.
J.ANNUAL REPORT TO SECURITY HOLDERS
If we are required to provide an annual report to security holders in response to the requirements of Form 6-K, we will submit the annual report to security holders in electronic format in accordance with the EDGAR Filer Manual.
Item 11. Quantitative and Qualitative Disclosures About Market Risk
In the normal course of business, we are exposed to commodity price and interest rate risks, primarily related to our crop production activities and changes in exchange rates and interest rates. We manage our exposure to these risks through the use of various financial instruments, none of which are entered into for trading purposes. We have established policies and procedures governing the use of financial instruments, specifically as they relate to the type and volume of such financial instruments. Our use of financial derivative instruments is associated with our core business and is regulated by internal control policies. For further information on our market risks, please see Note 2 to our Consolidated Financial Statements.
Item 12. Description of Securities Other than Equity Securities
A.DEBT SECURITIES
Not applicable.
B.WARRANTS AND RIGHTS
Not applicable.
C.OTHER SECURITIES
Not applicable.
D.AMERICAN DEPOSITORY SHARES
Not applicable.
146
PART II
Item 13. Defaults, Dividend Arrearages and Delinquencies
Not applicable.
Item 14. Material Modifications to the Rights of Security Holders and Use of Proceeds
Not applicable.
Item 15. Controls and Procedures
a) Disclosure Controls and Procedures
Our company’s management, with the participation of the Chief Executive Officer and Chief Financial Officer, conducted an evaluation pursuant to Rule 13a-15 promulgated under the Securities Exchange Act of 1934, of the effectiveness of our disclosure controls and procedures as of December 31, 2022. There are inherent limitations to the effectiveness of any system of disclosure controls and procedures, including the possibility of human error and the circumvention or overriding of the controls and procedures. Accordingly, even effective disclosure controls and procedures can only provide reasonable assurance of achieving their control objectives. Based on this evaluation, our company’s Chief Executive Officer and Chief Financial Officer concluded that such disclosure controls and procedures were effective as of December 31, 2022.
b) Management’s Annual Report on Internal Control over Financial Reporting
The Company’s Management is responsible for establishing and maintaining adequate internal control over financial reporting as defined in Rules 13a-15(f) and 15d-15(f) under the Securities Exchange Act of 1934. The Company’s internal control over financial reporting is a process designed under the supervision of the Company’s Chief Executive Officer and Chief Financial Officer that: (i) pertains to the maintenance of records that, in reasonable detail, accurately and fairly reflect the transactions and dispositions of the Company’s assets; (ii) provides reasonable assurance that transactions are recorded as necessary to permit preparation of financial statements for external reporting in accordance with IFRS, and that receipts and expenditures are being made only in accordance with authorization of the Company’s management and directors; and (iii) provides reasonable assurance regarding prevention or timely detection of unauthorized acquisition, use or disposition of the Company’s assets that could have a material effect on the financial statements.
Because of its inherent limitations, internal control over financial reporting may not prevent or detect misstatements. Also, projections of any evaluation of effectiveness to future periods are subject to the risk that controls may become inadequate because of changes in conditions, or that the degree of compliance with the policies or procedure may deteriorate. The Company, with the participation of its Chief Executive Officer and Chief Financial Officer, has assessed the effectiveness of the Company’s internal control over financial reporting as of December 31, 2022.
Our management has excluded Molinos Libres S.A. (Argentina), Viterra Uruguay S.A. (Uruguay) and Paso Dragón S.A. (Uruguay), which were acquired on May 3, 2022, from its assessment of internal control over financial reporting as of December 31, 2022. In aggregate, the aforementioned entities constitute 2.1% of our consolidated assets and 5.1% of consolidated revenues as of and for the year ended December 31, 2022.
We assessed the effectiveness of the Company’s internal controls over financial reporting as of December 31, 2022. In making this assessment, management used the criteria established in “Internal Control — Integrated Framework (2013)” issued by the Committee of Sponsoring Organizations of the Treadway Commission (“COSO”). As a result of this assessment, the Company’s management has determined that the Company’s internal control over financial reporting was effective as of December 31, 2022.
147
c) Attestation Report of the Registered Public Accounting Firm
The effectiveness of the Company’s internal control over financial reporting as of December 31, 2022 has been audited by Price Waterhouse & Co S.R.L, an independent registered public accounting firm, our independent auditor, as stated in their report which is included herein on pages F-2 to F-4 of our Consolidated Financial Statements.
d) Changes in internal control over financial reporting
As required by Rule 13a-15(d), under the Exchange Act, our management, including our Chief Executive Officer and Chief Financial Officer, conducted an evaluation of our internal control over financial reporting to determine whether any change occurred during the period covered since the last report that has materially affected, or is reasonably likely to materially affect, our internal control over financial reporting. Based on this evaluation, it has been determined that there has been no change during the period covered by this annual report that has materially affected, or is reasonably likely to materially affect, our internal control over financial reporting.
Item 16.
Item 16 A.Audit Committee Financial Expert
Our audit committee consists of three independent directors: Mr. Andrés Velasco Brañes, Mr. Mark Schachter and Mrs. Ana Cristina Russo. Our Board of Directors has determined that Mr. Mark Schachter has the attributes of an “audit committee financial expert” and is independent within the meaning of this Item 16A and satisfies the financial literacy requirements of the NYSE.
Item 16 B.Code of Ethics
We have adopted a code of ethics and business conduct that applies to our directors, executive officers and all employees. The text of our code of ethics is posted on our web site at: www.adecoagro.com.
Item 16 C.Principal Accountant Fees and Services
The following table sets forth the aggregate fees by categories specified below in connection with certain professional services rendered by Price Waterhouse & Co. S.R.L., an independent registered public accounting firm, for the periods indicated. Except as set forth below, we did not pay any other fees to our auditors during the periods indicated below.
| For the year ended December 31, | |||||||||||
| (in thousands of $) | |||||||||||
| 2022 | 2021 | ||||||||||
Audit Fees(1) | 1,386 | 1,275 | |||||||||
| Total | 1,386 | 1,275 | |||||||||
(1)“Audit fees” means the aggregate fees billed for professional services rendered by our principal auditors for the audit of our Consolidated Financial Statements and internal control over financial reporting of the Company, the statutory financial statements of the Company and its subsidiaries, and any other audit services required for the SEC or other regulatory filings.
During the fiscal year ended December 31, 2022 and 2021, no non-audit-related services were provided by our principal auditors.
Audit Committee Approval Policies and Procedures
The Audit Committee has adopted pre-approval policies and procedures requiring that all audit and non-audit services performed by our independent auditors must be pre-approved by the Audit Committee. The Audit Committee annually reviews and pre-approves the services that may be provided by the independent auditors without obtaining specific pre-approval from the Audit Committee. Any service proposals submitted by external auditors that are not pre-approved services need to be discussed and approved by the Audit Committee during its meetings. Once the proposed service is approved, we or our subsidiaries formalize the engagement of services.
148
The Audit Committee or its Chairman, or any member of the Audit Committee to whom such authority is delegated, may approve in advance any permitted audit or permitted non-audit services and fees up to a predetermined amount. The Audit Committee is authorized to establish other policies and procedures for the pre-approval of such services and fees. The Audit Committee approved all of the non-audit services described above and determined that the provision of such services is compatible with maintaining the independence of Price Waterhouse & Co. S.R.L.
Item 16 D.Exemptions from the Listing Standards for Audit Committees
Not applicable.
149
Item 16 E.Purchases of Equity Securities by the Issuer and Affiliated Purchasers
(a) Total Number of Shares Purchased (1) | (b) Average Price Paid per Share | (c) Total Number of Shares Purchased as Part of Publicly Announced Plans or Programs | (d) Maximum Number of Shares that may yet be Purchased Under the Plans or Programs | |||||||||||
| 09/1/2013-12/31/2013 | 654,454 | 7.71 | 654,454 | 5,861,397 | ||||||||||
| 1/1/2014-8/31/2014 | 1,692,139 | 7.81 | 1,692,139 | 4,591,949 | ||||||||||
| 9/1/2015-10/31/2015 | 37,500 | 7.96 | 37,500 | 6,025,916 | ||||||||||
| 9/1/2016-12/31/2016 | 456,732 | 10.67 | 456,732 | 5,929,278 | ||||||||||
| 1/1/2017-12/31/2017 | 3,849,445 | 10.29 | 3,849,445 | 5,010,777 | ||||||||||
| 1/1/2018-4/26/2018 | 1,613,584 | 9.07 | 1,613,584 | 1,658,228 | ||||||||||
| 1/1/2019-9/30/2019 | 297,732 | 5.83 | 297,732 | 5,530,053 | ||||||||||
| 10/1/2019-12/31/2019 | 398,466 | 6.31 | 398,466 | 5,475,760 | ||||||||||
| 1/1/2020-9/30/2020 | 772,615 | 5.06 | 772,615 | 4,703,145 | ||||||||||
| 12/1/2020-12/31/2020 | 66,716 | 6.60 | 66,716 | 5,800,224 | ||||||||||
| 1/1/2021-9/24/2021 | 5,773,260 | 9.26 | 5,773,260 | 26,964 | ||||||||||
| 9/24/2021-12/31/2021 | 1,635,742 | 7.87 | 1,635,742 | 3,998,776 | ||||||||||
| 1/1/2022-9/23/2022 | 3,088,816 | 8.05 | 3,088,816 | 909,960 | ||||||||||
| 9/23/2022-12/31/2022 | 1,493,811 | 7.95 | 1,493,811 | 3,978,648 | ||||||||||
| 1/1/2023-4/25/2023 | 1,087,322 | 7.90 | 1,087,322 | 2,891,326 | ||||||||||
| Total | 22,918,334 | 7.89 | 22,918,334 | |||||||||||
(1) The total number of shares purchased set forth above were purchased pursuant to the Company’s Repurchase Program adopted on September 12, 2013. See “Item 10—Additional Information—Repurchase of Shares”.
Item 16 F.Change in Registrant’s Certifying Accountant
Not applicable.
Item 16 G.Corporate Governance
Our corporate governance practices are governed by Luxembourg law (particularly the law of August 10th, 1915 on commercial companies) and our articles of association. As a Luxembourg company listed on the NYSE, we are not required to comply with all of the corporate governance listing standards of the NYSE. We, however, believe that our corporate governance practices meet or exceed, in all material respects, the corporate governance standards that are generally required for controlled companies by the NYSE. The following is a summary of the significant ways that our corporate governance practices differ from the corporate governance standards required for listed U.S. companies by the NYSE (provided that our corporate governance practices may differ in non-material ways from the standards required by the NYSE that are not detailed here):
Majority of Independent Directors
Under NYSE standards, U.S. listed companies must have a majority of independent directors. There is no legal obligation under Luxembourg law to have a majority of independent directors on the Board of Directors.
Non-management Directors’ Meetings
Under NYSE standards, non-management directors must meet at regularly scheduled executive sessions without management present and, if such group includes directors who are not independent, a meeting should be scheduled once per year including only independent directors. Neither Luxembourg law nor our Articles of Association require the holding of such meetings and we do not have a set policy for these meetings. Our Articles of Association provide, however, that the board shall meet as often as required by the best interest of the Company. For additional information, see “Item 6. Directors, Senior Management and Employees—A. Directors and Senior Management.”
150
Communication with Non-Management Directors
NYSE-listed companies are required to provide a method for interested parties to communicate directly with the non-management directors as a group. Shareholders may send communications to the Company’s non-management directors by writing to Mr. Plínio Musetti at Rua Amauri, 255 - 17th Floor, Jardim Europa, São Paulo, SP 01448-000, Brazil, telephone: (5511) 3035-1588. Communications will be referred to the Presiding Director for appropriate action. The status of all outstanding concerns addressed to the Presiding Director will be reported to the Board of Directors as appropriate.
Audit Committee
Under NYSE standards, listed U.S. companies are required to have an audit committee composed of independent directors that satisfies the requirements of Rule 10A-3 promulgated under the Exchange Act of 1934. Our Articles of Association provide that the Board of Directors may set up an audit committee. The Board of Directors has set up an Audit Committee and has appointed Mr. Andres Velasco Brañes, Mr. Mark Schachter and Mrs. Ana Cristina Russo as members of its audit committee. In accordance with NYSE standards, we have an audit committee entirely composed of independent directors. For additional information, see “Item 6. Directors, Senior Management and Employees—C. Board Practices.”
Under NYSE standards, all audit committee members of listed U.S. companies are required to be financially literate or must acquire such financial knowledge within a reasonable period and at least one of its members shall have experience in accounting or financial administration. In addition, if a member of the audit committee is simultaneously a member of the audit committee of more than three public companies, and the listed company does not limit the number of audit committees on which its members may serve, then in each case the board must determine whether the simultaneous service would prevent such member from effectively serving on the listed company’s audit committee and shall publicly disclose its decision. No comparable provisions on audit committee membership exist under Luxembourg law or our articles of association.
Standards for Evaluating Director Independence
Under NYSE standards, the board is required, on a case by case basis, to express an opinion with regard to the independence or lack of independence of each individual director. Neither Luxembourg law nor our Articles of Association require the board to express such an opinion. In addition, the definition of “independent” under the rules of the NYSE differs in some non-material respects from the definition contained in our Articles of Association.
Audit Committee Responsibilities
Pursuant to our Articles of Association, the audit committee shall assist the Board of Directors in fulfilling its oversight responsibilities relating to the integrity of the Company’s financial statements, including periodically reporting to the Board of Directors on its activity and the adequacy of the Company’s system of internal controls over financial reporting. As per the audit committee charter, as amended, the audit committee shall make recommendations for the appointment, compensation, retention and oversight of, and consider the independence of, the company’s external auditors. The audit committee is required to review material transactions (as defined by the Articles of Association) between us or our subsidiaries with related parties, perform such other duties imposed to it by laws and regulations of the regulated market(s) on which the shares of the Company are listed, and also perform the other duties entrusted to it by the board.
The NYSE requires certain matters to be set forth in the audit committee charter of U.S. listed companies. Our audit committee charter provides for many of the responsibilities that are expected from such bodies under the NYSE standard; however, due to our equity structure and holding company nature, the charter does not contain all such responsibilities, including provisions related to setting hiring policies for employees or former employees of independent auditors.
Nominating/Corporate Governance Committee
The NYSE requires that a listed U.S. company have a nominating/corporate governance committee of independent directors and a committee charter specifying the purpose, duties and evaluation procedures of the committee. We have a Nominating Sub-Committee, which is part of the Talent Management & Compensation Committee, which consists of three independent directors: Mr. Plínio Musetti, Mr. Daniel González and Mr. Guillaume van der Linden.
Shareholder Voting on Equity Compensation Plans
Under NYSE standards, shareholders of U.S. listed companies must be given the opportunity to vote on equity compensation plans and material revisions thereto, except for employment inducement awards, certain grants, plans and
151
amendments in the context of mergers and acquisitions, and certain specific types of plans. Neither Luxembourg corporate law nor our articles of incorporation require shareholder approval of equity based compensation plans. Luxembourg law only requires approval of the Board of Directors for the adoption of equity based compensation plans.
Disclosure of Corporate Governance Guidelines
NYSE-listed companies must adopt and disclose corporate governance guidelines. Neither Luxembourg law nor our Articles of Association require the adoption or disclosure of corporate governance guidelines. Our Board of Directors follows corporate governance guidelines consistent with our equity structure and holding company nature, but we have not codified them and therefore do not disclose them on our website.
Code of Business Conduct and Ethics
Under NYSE standards, listed companies must adopt and disclose a code of business conduct and ethics for directors, officers and employees, and promptly disclose any waivers of the code for directors or executive officers. Neither Luxembourg law nor our Articles of Association require the adoption or disclosure of such a code of conduct.
We have adopted a code of ethics and business conduct that applies to our directors, executive officers and all employees. The text of our code of ethics is posted on our web site at: www.adecoagro.com. And substantially complies with the NYSE’s requirements under the Code of Business Conduct and Ethics.
Chief Executive Officer Certification
A chief executive officer of a U.S. company listed on NYSE must annually certify that he or she is not aware of any violation by the company of NYSE corporate governance standards. In accordance with NYSE rules applicable to foreign private issuers, our chief executive officer is not required to provide NYSE with this annual compliance certification. However, in accordance with NYSE rules applicable to all listed companies, our chief executive officer must promptly notify NYSE in writing after any of our executive officers becomes aware of any noncompliance with any applicable provision of NYSE’s corporate governance standards. In addition, we must submit an executed written affirmation annually and an interim written affirmation each time a change occurs to the board or the audit committee.
Item 16 H.Mine Safety Disclosure
Not applicable.
Item 16 I.Disclosure Regarding Foreign Jurisdictions that Prevent Inspections.
Not applicable.
PART III
Item 17. Financial Statements
We have responded to Item 18 in lieu of responding to this item.
Item 18. Financial Statements.
See pages F-1 through F[88] of this annual report.
152
Item 19. Exhibits
| Exhibit Number | Description | |||||||
| 1.1* | ||||||||
| 2.1* | ||||||||
| 4.14 | ||||||||
| 4.16 | ||||||||
| 4.17 | ||||||||
| 4.18 | ||||||||
| 4.26 | ||||||||
| 4.28 | ||||||||
| 4.29 | ||||||||
| 4.30 | ||||||||
| 4.35 | ||||||||
| 4.39 | ||||||||
| 4.43 | ||||||||
| 8.1* | ||||||||
153
| 12.1* | ||||||||
| 12.2* | ||||||||
| 13.1* | ||||||||
| 13.2* | ||||||||
| 15.1* | ||||||||
| 15.2* | ||||||||
| 101.INS** | Inline XBRL Instance Document. | |||||||
| 101.SCH** | Inline XBRL Taxonomy Extension Schema Document. | |||||||
| 101.CAL** | Inline XBRL Taxonomy Extension Calculation Linkbase Document. | |||||||
| 101.DEF** | Inline Taxonomy Extension Definition Linkbase Document. | |||||||
| 101.LAB** | Inline XBRL Taxonomy Extension Label Linkbase Document. | |||||||
| 101.PRE** | Inline XBRL Taxonomy Extension Presentation Linkbase Document. | |||||||
| 104** | Cover Page Interactive Data File formatted as Inline XBRL with applicable taxonomy extension.31information contained in Exhibits 101) | |||||||
* Filed with this report
** In accordance with Rule 402 of Regulation S-T, the information in these exhibits shall not be deemed to be “filed” for
purposes of Section 18 of the Exchange Act, or otherwise subject to the liability of that section, and shall not be incorporated by
reference into any registration statement or other document filed under the Securities Act or the Exchange Act, except as shall
be expressly set forth by specific reference in such filing
154
SIGNATURES
The registrant hereby certifies that it meets all of the requirements for filing on Form 20-F and that it has duly caused and authorized the undersigned to sign this annual report on its behalf.
| Adecoagro S.A. | ||
| /s/ Mariano Bosch | ||
| Name: Mariano Bosch | ||
| Title: Chief Executive Officer | ||
Date: April 26, 2023
155
| Table of contents Financial Statements | |||||
156
Adecoagro S.A.
Consolidated Financial Statements as of December 31, 2022 and 2021 and for the years ended December 31, 2022, 2021 and 2020

Report of Independent Registered Public Accounting Firm
To the Board of Directors and Shareholders of Adecoagro S.A.
Opinions on the Financial Statements and Internal Control over Financial Reporting
We have audited the accompanying consolidated statements of financial position of Adecoagro S.A. and its subsidiaries (the “Company”) as of December 31, 2022 and 2021, and the related consolidated statements of income, comprehensive income, changes in shareholders’ equity and cash flows for each of the three years in the period ended December 31, 2022, including the related notes (collectively referred to as the “consolidated financial statements”). We also have audited the Company’s internal control over financial reporting as of December 31, 2022, based on criteria established in Internal Control - Integrated Framework (2013) issued by the Committee of Sponsoring Organizations of the Treadway Commission (COSO).
In our opinion, the consolidated financial statements referred to above present fairly, in all material respects, the financial position of the Company as of December 31, 2022 and 2021, and the results of its operations and its cash flows for each of the three years in the period ended December 31, 2022 in conformity with International Financial Reporting Standards as issued by the International Accounting Standards Board. Also in our opinion, the Company maintained, in all material respects, effective internal control over financial reporting as of December 31, 2022, based on criteria established in Internal Control - Integrated Framework (2013) issued by the COSO.
Basis for Opinions
The Company's management is responsible for these consolidated financial statements, for maintaining effective internal control over financial reporting, and for its assessment of the effectiveness of internal control over financial reporting, included in Management's Annual Report on Internal Control over Financial Reporting appearing under Item 15. Our responsibility is to express opinions on the Company’s consolidated financial statements and on the Company's internal control over financial reporting based on our audits. We are a public accounting firm registered with the Public Company Accounting Oversight Board (United States) ("PCAOB") and are required to be independent with respect to the Company in accordance with the U.S. federal securities laws and the applicable rules and regulations of the Securities and Exchange Commission and the PCAOB.
We conducted our audits in accordance with the standards of the PCAOB. Those standards require that we plan and perform the audits to obtain reasonable assurance about whether the consolidated financial statements are free of material misstatement, whether due to error or fraud, and whether effective internal control over financial reporting was maintained in all material respects.
Our audits of the consolidated financial statements included performing procedures to assess the risks of material misstatement of the consolidated financial statements, whether due to error or fraud, and performing procedures that respond to those risks. Such procedures included examining, on a test basis, evidence regarding the amounts and disclosures in the consolidated financial statements. Our audits also included evaluating the accounting principles used and significant estimates made by management, as well as evaluating the overall presentation of the consolidated financial statements. Our audit of internal control over financial reporting included obtaining an understanding of internal control over financial reporting, assessing the risk that a material weakness exists, and testing and evaluating the design and operating effectiveness of internal control based on the assessed risk. Our audits also included performing such other procedures as we considered necessary in the circumstances. We believe that our audits provide a reasonable basis for our opinions.
As described in Management’s Annual Report on Internal Control over Financial Reporting, management has excluded Molinos Libres S.A. (Argentina), Viterra Uruguay S.A. (Uruguay) and Paso Dragón S.A. (Uruguay) from its assessment of internal control over financial reporting as of December 31, 2022 because it was acquired by the Company in a purchase business combination during 2022. We have also excluded Molinos Libres S.A. (Argentina), Viterra Uruguay S.A. (Uruguay) and Paso Dragón S.A. (Uruguay) from our audit of internal control over financial reporting. Molinos Libres S.A. (Argentina), Viterra Uruguay S.A. (Uruguay) and Paso Dragón S.A. (Uruguay) are wholly-owned subsidiaries whose total assets and total revenues excluded from management’s assessment and our audit of internal control over financial reporting represent 2.1% and 5.1%, respectively, of the related consolidated financial statement amounts as of and for the year ended December 31, 2022.
F-2
Definition and Limitations of Internal Control over Financial Reporting
A company’s internal control over financial reporting is a process designed to provide reasonable assurance regarding the reliability of financial reporting and the preparation of financial statements for external purposes in accordance with generally accepted accounting principles. A company’s internal control over financial reporting includes those policies and procedures that (i) pertain to the maintenance of records that, in reasonable detail, accurately and fairly reflect the transactions and dispositions of the assets of the company; (ii) provide reasonable assurance that transactions are recorded as necessary to permit preparation of financial statements in accordance with generally accepted accounting principles, and that receipts and expenditures of the company are being made only in accordance with authorizations of management and directors of the company; and (iii) provide reasonable assurance regarding prevention or timely detection of unauthorized acquisition, use, or disposition of the company’s assets that could have a material effect on the financial statements.
Because of its inherent limitations, internal control over financial reporting may not prevent or detect misstatements. Also, projections of any evaluation of effectiveness to future periods are subject to the risk that controls may become inadequate because of changes in conditions, or that the degree of compliance with the policies or procedures may deteriorate.
Critical Audit Matters
The critical audit matters communicated below are matters arising from the current period audit of the consolidated financial statements that were communicated or required to be communicated to the audit committee and that (i) relate to accounts or disclosures that are material to the consolidated financial statements and (ii) involved our especially challenging, subjective, or complex judgments. The communication of critical audit matters does not alter in any way our opinion on the consolidated financial statements, taken as a whole, and we are not, by communicating the critical audit matters below, providing separate opinions on the critical audit matters or on the accounts or disclosures to which they relate.
Valuation of Level 3 Biological Assets
As described in Notes 16, 32 (b) and 33.11 to the consolidated financial statements, the total aggregated fair value of the Company’s level 3 biological assets related to sown land – crops, sown land – rice and sown land – sugarcane was US$ 228 million as of December 31, 2022. The fair value of these level 3 biological assets is determined by management using a discounted cash flow model which requires the input of highly subjective assumptions including significant unobservable inputs. The discounted cash flow model included significant judgements and assumptions relating to management’s cash flow projections including future market prices, estimated yields at the point of harvest, estimated production cycle, future costs of harvesting and other costs and estimated discount rate.
The principal considerations for our determination that performing procedures relating to the valuation of the level 3 biological assets related to sown land – crops, sown land – rice and sown land – sugarcane is a critical audit matter are (i) the significant judgment by management when developing the fair value measurement; (ii) a high degree of auditor judgement, subjectivity, and effort in performing procedures and evaluating management’s cash flow projections and significant assumptions related to future market prices, estimated yields at the point of harvest, estimated production cycle, future costs of harvesting and other costs and estimated discount rate; and (iii) the audit effort involved the use of professionals with specialized skill and knowledge.
Addressing the matter involved performing procedures and evaluating audit evidence in connection with forming our overall opinion on the consolidated financial statements. These procedures included testing the effectiveness of controls relating to the valuation of the level 3 biological assets related to sown land – crops, sown land – rice and sown land – sugarcane. These procedures also included, among others evaluating the significant assumptions and methods used by management in developing the fair value measurement including future market prices, estimated yields at the point of harvest, estimated production cycle, future costs of harvesting and other costs and estimated discount rate. Evaluating management’s assumptions involved evaluating whether these assumptions were reasonable considering the consistency with external information and past records and testing management’s sensitivity analysis of certain significant assumptions. Professionals with specialized skill and knowledge were used to assist in the evaluation of certain significant assumptions, including estimated yields at the point of harvest and estimated production cycle.
F-3
Property, Plant and Equipment and Goodwill Impairment Assessment- Cash Generating Units with Allocated Goodwill in Brazil
As described in Notes 12, 15, 32 (a) and 33.10 to the consolidated financial statements, the Company’s total consolidated property, plant and equipment and goodwill balances as of December 31, 2022 were US$ 1,565.3 million and US$ 18.5 million, respectively. The total property, plant and equipment and goodwill balances allocated to the cash generating units with allocated goodwill in Brazil were US$ 534 million and US$ 4.2 million, respectively. The Company conducts an impairment test as of September 30 of each year, or more frequently if events or changes in circumstances indicate that the carrying value of the asset or cash generating unit may not be recoverable. An impairment loss is recognized for the amount by which the carrying amount of the asset or cash generating unit exceeds its recoverable amount. The recoverable amounts are estimated for individual assets or, where an individual asset does not generate cash flows independently, the recoverable amount is estimated for the cash generating unit to which the asset belongs. The recoverable amount of the asset or the cash generating unit is the higher of the fair value less costs to sell and value in use. The recoverable amount of cash generating units with allocated goodwill in Brazil was determined based on value in use calculations. The determination of the value in use calculation required the use of significant estimates and assumptions related to management’s cash flow projections, including yield average growth rates, future pricing increases, future cost decreases, discount rates and perpetuity growth rate.
The principal considerations for our determination that performing procedures relating to the impairment assessment of property, plant and equipment and goodwill associated with the cash generating units with allocated goodwill in Brazil is a critical audit matter are (i) the significant judgment by management when developing the value in use calculation of these cash generating units; (ii) a high degree of auditor judgment, subjectivity, and effort in performing procedures and evaluating management’s cash flow projections and significant assumptions related to yield average growth rates, future pricing increases, future cost decrease, discount rates and perpetuity growth rate; and (iii) the audit effort involved the use of professionals with specialized skill and knowledge.
Addressing the matter involved performing procedures and evaluating audit evidence in connection with forming our overall opinion on the consolidated financial statements. These procedures included testing the effectiveness of controls relating to management’s impairment assessment of property, plant and equipment and goodwill associated with the cash generating units with allocated goodwill in Brazil, including controls over the valuation of the Company’s cash generating units. These procedures also included, among others (i) testing management’s process for developing the estimate; (ii) evaluating the appropriateness of the discounted cash flow model; (iii) testing the completeness and accuracy of underlying data used in the model; and (iv) evaluating the reasonableness of the significant assumptions used by management related to yield average growth rates, future pricing increases, future cost decrease, discount rates and perpetuity growth rate. Evaluating management’s assumptions related to yield average growth rates, future pricing increases, future cost decrease, discount rates and perpetuity growth rate involved evaluating whether the assumptions used by management were reasonable considering (i) the current and past performance of the cash generating units; (ii) the consistency with external market and industry data; and (iii) whether these assumptions were consistent with evidence obtained in other areas of the audit. Professionals with specialized skill and knowledge were used to assist in the evaluation of the Company’s discounted cash flow model and the discount rate assumptions.
/s/ PRICE WATERHOUSE & CO. S.R.L.
/s/ Eduardo Alfredo Loiácono (Partner)
Eduardo Alfredo Loiácono
April 26, 2023.
We have served as the Company’s auditor since 2008.
F-4
Legal information
Name as specified in charter: Adecoagro S.A.
Legal address: Vertigo Naos Building, 6, Rue Eugène Ruppert, L-2453, Luxembourg
Company activity: Agricultural and agro-industrial
Date of registration: June 11, 2010
Expiration of company charter: No term defined
Number of register (RCS Luxembourg): B153.681
Issued Capital Stock: 111,381,815 common shares
Outstanding Capital stock: 108,191,218 common shares
Treasury shares: 3,190,597 common shares
F-5
Adecoagro S.A.
Consolidated Statements of Income
for the years ended December 31, 2022, 2021 and 2020
(All amounts in US$ thousands, except shares and per share data and as otherwise indicated)
| Note | 2022 | 2021 | 2020 | |||||||||||||||||
| Sales of goods and services rendered | 4 | |||||||||||||||||||
| Cost of goods sold and services rendered | 5 | ( | ( | ( | ||||||||||||||||
| Initial recognition and changes in fair value of biological assets and agricultural produce | 16 | |||||||||||||||||||
| Changes in net realizable value of agricultural produce after harvest | ( | ( | ||||||||||||||||||
| Margin on manufacturing and agricultural activities before operating expenses | ||||||||||||||||||||
| General and administrative expenses | 6 | ( | ( | ( | ||||||||||||||||
| Selling expenses | 6 | ( | ( | ( | ||||||||||||||||
| Other operating income / (expense), net | 8 | ( | ||||||||||||||||||
| Bargain purchase gain on acquisition | 21 | |||||||||||||||||||
| Profit from operations | ||||||||||||||||||||
| Finance income | 9 | |||||||||||||||||||
| Finance costs | 9 | ( | ( | ( | ||||||||||||||||
| Other financial results - Net (loss) / gain of inflation effects on monetary items | 9 | ( | ||||||||||||||||||
| Financial results, net | 9 | ( | ( | ( | ||||||||||||||||
| Profit before income tax | ||||||||||||||||||||
| Income tax (expense) | 10 | ( | ( | ( | ||||||||||||||||
| Profit for the year | ||||||||||||||||||||
| Attributable to: | ||||||||||||||||||||
| Equity holders of the parent | ||||||||||||||||||||
| Non-controlling interest | ||||||||||||||||||||
| Earnings per share attributable to the equity holders of the parent during the year: | ||||||||||||||||||||
| Basic earnings per share | 11 | |||||||||||||||||||
| Diluted earnings per share | 11 | |||||||||||||||||||
The accompanying notes are an integral part of these consolidated financial statements.
F- 6
Adecoagro S.A.
Consolidated Statements of Comprehensive Income
for the years ended December 31, 2022, 2021 and 2020
(All amounts in US$ thousands, except shares and per share data and as otherwise indicated)
| 2022 | 2021 | 2020 | |||||||||||||||
| Profit for the year | |||||||||||||||||
| Other comprehensive income: | |||||||||||||||||
- Items that may be reclassified subsequently to profit or loss: | |||||||||||||||||
| Exchange differences on translation of foreign operations | ( | ||||||||||||||||
| Cash flow hedge, net of income tax | ( | ||||||||||||||||
- Items that will not be reclassified to profit or loss: | |||||||||||||||||
| Revaluation surplus net of income tax (Note 12) | ( | ( | |||||||||||||||
| Other comprehensive income / (loss) for the year | ( | ||||||||||||||||
| Total comprehensive income / (loss) for the year | ( | ||||||||||||||||
| Attributable to: | |||||||||||||||||
| Equity holders of the parent | ( | ||||||||||||||||
| Non-controlling interest | ( | ||||||||||||||||
The accompanying notes are an integral part of these consolidated financial statements.
F- 7
Adecoagro S.A.
Consolidated Statements of Financial Position
as of December 31, 2022 and 2021
(All amounts in US$ thousands, except shares and per share data and as otherwise indicated)
| Note | 2022 | 2021 | ||||||||||||
| ASSETS | ||||||||||||||
| Non-Current Assets | ||||||||||||||
| Property, plant and equipment, net | 12 | |||||||||||||
| Right of use assets | 13 | |||||||||||||
| Investment property | 14 | |||||||||||||
| Intangible assets, net | 15 | |||||||||||||
| Biological assets | 16 | |||||||||||||
| Deferred income tax assets | 10 | |||||||||||||
| Trade and other receivables, net | 18 | |||||||||||||
| Derivative financial instruments | 17 | |||||||||||||
| Other assets | ||||||||||||||
| Total Non-Current Assets | ||||||||||||||
| Current Assets | ||||||||||||||
| Biological assets | 16 | |||||||||||||
| Inventories | 19 | |||||||||||||
| Trade and other receivables, net | 18 | |||||||||||||
| Derivative financial instruments | 17 | |||||||||||||
| Other assets | ||||||||||||||
| Restricted short-term investment | 17 | |||||||||||||
| Cash and cash equivalents | 20 | |||||||||||||
| Total Current Assets | ||||||||||||||
| TOTAL ASSETS | ||||||||||||||
| SHAREHOLDERS EQUITY | ||||||||||||||
| Capital and reserves attributable to equity holders of the parent | ||||||||||||||
| Share capital | 22 | |||||||||||||
| Share premium | 22 | |||||||||||||
| Cumulative translation adjustment | ( | ( | ||||||||||||
| Equity-settled compensation | ||||||||||||||
| Cash flow hedge | 2 | ( | ( | |||||||||||
| Other reserves | ||||||||||||||
| Treasury shares | ( | ( | ||||||||||||
| Revaluation surplus | ||||||||||||||
| Reserve from the sale of non-controlling interests in subsidiaries | ||||||||||||||
| Retained earnings | ||||||||||||||
| Equity attributable to equity holders of the parent | ||||||||||||||
| Non-controlling interest | ||||||||||||||
| TOTAL SHAREHOLDERS EQUITY | ||||||||||||||
| LIABILITIES | ||||||||||||||
| Non-Current Liabilities | ||||||||||||||
| Trade and other payables | 25 | |||||||||||||
| Borrowings | 26 | |||||||||||||
| Lease liabilities | 27 | |||||||||||||
| Deferred income tax liabilities | 10 | |||||||||||||
| Payroll and social security liabilities | 28 | |||||||||||||
| Derivatives financial instruments | 18 | |||||||||||||
| Provisions for other liabilities | 29 | |||||||||||||
| Total Non-Current Liabilities | ||||||||||||||
| Current Liabilities | ||||||||||||||
| Trade and other payables | 25 | |||||||||||||
| Current income tax liabilities | ||||||||||||||
| Payroll and social security liabilities | 28 | |||||||||||||
| Borrowings | 26 | |||||||||||||
| Lease liabilities | 27 | |||||||||||||
| Derivative financial instruments | 17 | |||||||||||||
| Provisions for other liabilities | 29 | |||||||||||||
| Total Current Liabilities | ||||||||||||||
| TOTAL LIABILITIES | ||||||||||||||
| TOTAL SHAREHOLDERS EQUITY AND LIABILITIES | ||||||||||||||
The accompanying notes are an integral part of these consolidated financial statements.
F- 8
Adecoagro S.A.
Consolidated Statements of Changes in Shareholders’ Equity
for the years ended December 31, 2022, 2021 and 2020
(All amounts in US$ thousands, except shares and per share data and as otherwise indicated)
| Attributable to equity holders of the parent | |||||||||||||||||||||||||||||||||||||||||
| Share capital (Note 22) | Share premium (Note 22) | Cumulative translation adjustment | Equity-settled compensation | Cash flow hedge | Other Reserves | Treasury shares | Revaluation surplus | Reserve from the sale of non-controlling interests in subsidiaries | Retained earnings | Subtotal | Non- controlling interest | Total shareholders’ equity | |||||||||||||||||||||||||||||
| Balance at January 1, 2020 | ( | ( | ( | ||||||||||||||||||||||||||||||||||||||
| Profit for the year | — | — | — | — | — | — | — | — | — | ||||||||||||||||||||||||||||||||
| Other comprehensive income: | |||||||||||||||||||||||||||||||||||||||||
–Items that may be reclassified subsequently to profit or loss: | |||||||||||||||||||||||||||||||||||||||||
| Exchange differences on translating foreign operations | — | — | ( | — | — | — | — | ( | — | — | ( | ( | ( | ||||||||||||||||||||||||||||
| Cash flow hedge (*) | — | — | — | — | ( | — | — | — | — | — | ( | ( | |||||||||||||||||||||||||||||
–Items that will not be reclassified subsequently to profit or loss: | |||||||||||||||||||||||||||||||||||||||||
| Revaluation surplus (**) | — | — | — | — | — | — | — | — | — | ||||||||||||||||||||||||||||||||
| Reserve of the revaluation surplus derived from the disposals of assets (***) | — | — | — | — | — | — | — | ( | — | — | — | ||||||||||||||||||||||||||||||
| Other comprehensive income for the year | — | — | ( | — | ( | — | — | — | ( | ( | ( | ||||||||||||||||||||||||||||||
| Total comprehensive income for the year | — | — | ( | — | ( | — | — | — | ( | ( | |||||||||||||||||||||||||||||||
| Reserves for the benefit of government grants (1) | — | — | — | — | — | — | — | — | ( | — | — | ||||||||||||||||||||||||||||||
| Employee share options (Note 23) | |||||||||||||||||||||||||||||||||||||||||
| - Exercised | — | — | — | — | — | — | — | — | — | — | — | — | — | ||||||||||||||||||||||||||||
| - Forfeited | — | — | — | — | — | — | — | — | — | — | — | — | — | ||||||||||||||||||||||||||||
| Restricted shares (Note 23): | |||||||||||||||||||||||||||||||||||||||||
| - Value of employee services | — | — | — | — | — | — | — | — | — | — | |||||||||||||||||||||||||||||||
| - Vested | — | — | ( | — | — | — | — | — | |||||||||||||||||||||||||||||||||
- Forfeited | — | — | — | — | — | ( | — | — | — | — | — | ||||||||||||||||||||||||||||||
| - Granted (***) | — | — | — | — | — | ( | — | — | — | — | — | ||||||||||||||||||||||||||||||
| Purchase of own shares (Note 22) | — | ( | — | — | — | — | ( | — | — | — | ( | — | ( | ||||||||||||||||||||||||||||
| Dividends to non-controlling interest | — | — | — | — | — | — | — | — | — | — | — | ( | ( | ||||||||||||||||||||||||||||
| Balance at December 31, 2020 | ( | ( | ( | ||||||||||||||||||||||||||||||||||||||
(*) Net of $5,729 of income tax.
(**) Net of $11,790 of Income tax.
(***) Net of $3,458 of Income tax
(1) Correspond to the presumed credit of ICMS (Imposto sobre Circulação de Mercadorias e Prestação de Serviços) over the sale values in our Sugar, ethanol and energy business. (please see Note 24).
The accompanying notes are an integral part of these consolidated financial statements.
F- 9
Adecoagro S.A.
Consolidated Statements of Changes in Shareholders’ Equity
for the years ended December 31, 2022, 2021 and 2020
(All amounts in US$ thousands, except shares and per share data and as otherwise indicated)
| Attributable to equity holders of the parent | |||||||||||||||||||||||||||||||||||||||||
| Share capital (Note 22) | Share premium (Note 22) | Cumulative translation adjustment | Equity-settled compensation | Cash flow hedge | Other Reserves | Treasury shares | Revaluation surplus | Reserve from the sale of non-controlling interests in subsidiaries | Retained earnings | Subtotal | Non- controlling interest | Total shareholders’ equity | |||||||||||||||||||||||||||||
| Balance at January 1, 2021 | ( | ( | ( | ||||||||||||||||||||||||||||||||||||||
| Profit for the year | — | — | — | — | — | — | — | — | — | ||||||||||||||||||||||||||||||||
| Other comprehensive income: | |||||||||||||||||||||||||||||||||||||||||
–Items that may be reclassified subsequently to profit or loss: | |||||||||||||||||||||||||||||||||||||||||
| Exchange differences on translating foreign operations | — | — | — | — | — | — | — | — | |||||||||||||||||||||||||||||||||
| Cash flow hedge (*) | — | — | — | — | — | — | — | — | — | 1 | |||||||||||||||||||||||||||||||
–Items that will not be reclassified subsequently to profit or loss: | |||||||||||||||||||||||||||||||||||||||||
| Revaluation surplus (**) | — | — | — | — | — | — | — | ( | — | — | ( | ( | ( | ||||||||||||||||||||||||||||
| Reserve of the revaluation surplus derived from the disposals of assets (***) | — | — | — | — | — | — | — | — | — | — | |||||||||||||||||||||||||||||||
| Other comprehensive (loss) / income for the year | — | — | — | — | — | ( | — | ( | |||||||||||||||||||||||||||||||||
| Total comprehensive income for the year | — | — | — | — | — | ( | — | ( | |||||||||||||||||||||||||||||||||
| Reserves for the benefit of government grants (1) | — | — | — | — | — | — | — | — | ( | — | — | ||||||||||||||||||||||||||||||
| Employee share options (Note 23): | |||||||||||||||||||||||||||||||||||||||||
| - Forfeited | — | — | — | — | — | — | — | — | — | — | — | — | — | ||||||||||||||||||||||||||||
| Restricted shares and restricted units (Note 23): | |||||||||||||||||||||||||||||||||||||||||
| - Value of employee services | — | — | — | — | — | — | — | — | — | — | |||||||||||||||||||||||||||||||
| - Vested | — | — | ( | — | — | — | — | — | |||||||||||||||||||||||||||||||||
- Forfeited | — | — | — | — | — | ( | — | — | — | — | — | ||||||||||||||||||||||||||||||
| - Granted | — | — | — | — | — | ( | — | — | — | — | — | ||||||||||||||||||||||||||||||
| Purchase of own shares (Note 22) | — | ( | — | — | — | — | ( | — | — | — | ( | — | ( | ||||||||||||||||||||||||||||
| Dividends to non-controlling interest | — | — | — | — | — | — | — | — | — | — | — | ( | ( | ||||||||||||||||||||||||||||
| Balance at December 31, 2021 | ( | ( | ( | ||||||||||||||||||||||||||||||||||||||
(*) Net of $2,526 of Income tax .
(**) Net of $9,953 of Income tax.
(1) Correspond to the presumed credit of ICMS (Imposto sobre Circulação de Mercadorias e Prestação de Serviços) over the sale values in our Sugar, ethanol and energy business. (please see Note 24).
The accompanying notes are an integral part of these consolidated financial statements.
F- 10
Adecoagro S.A.
Consolidated Statements of Changes in Shareholders’ Equity
for the years ended December 31, 2022, 2021 and 2020
(All amounts in US$ thousands, except shares and per share data and as otherwise indicated)
| Attributable to equity holders of the parent | |||||||||||||||||||||||||||||||||||||||||
| Share capital (Note 22) | Share premium (Note 22) | Cumulative translation adjustment | Equity-settled compensation | Cash flow hedge | Other reserves | Treasury shares | Revaluation surplus | Reserve from the sale of non-controlling interests in subsidiaries | Retained earnings | Subtotal | Non- controlling interest | Total shareholders’ equity | |||||||||||||||||||||||||||||
| Balance at January 1, 2022 | ( | ( | ( | ||||||||||||||||||||||||||||||||||||||
| Profit for the year | — | — | — | — | — | — | — | — | — | ||||||||||||||||||||||||||||||||
| Other comprehensive income: | |||||||||||||||||||||||||||||||||||||||||
- Items that may be reclassified subsequently to profit or loss: | |||||||||||||||||||||||||||||||||||||||||
| Exchange differences on translating foreign operations | — | — | — | — | — | — | — | — | |||||||||||||||||||||||||||||||||
| Cash flow hedge (*) | — | — | — | — | — | — | — | — | — | ||||||||||||||||||||||||||||||||
- Items will not be reclassified to profit or loss: | |||||||||||||||||||||||||||||||||||||||||
| Revaluation surplus (**) | — | — | — | — | — | — | — | ( | — | — | ( | ( | ( | ||||||||||||||||||||||||||||
| Other comprehensive income/ (loss) for the year | — | — | — | — | — | ( | — | ||||||||||||||||||||||||||||||||||
| Total comprehensive income/ (loss) for the year | — | — | — | — | — | ( | — | ||||||||||||||||||||||||||||||||||
| Reduction of issued share capital of the company (Note 22): | ( | — | — | — | — | — | — | — | — | — | — | ||||||||||||||||||||||||||||||
| Reserves for the benefit of government grants (1) | — | — | — | — | — | — | — | — | ( | — | — | ||||||||||||||||||||||||||||||
| Employee share options (Note 23): | |||||||||||||||||||||||||||||||||||||||||
| - Exercised | — | — | ( | — | — | — | — | — | — | ||||||||||||||||||||||||||||||||
| Restricted shares (Note 23): | |||||||||||||||||||||||||||||||||||||||||
| - Value of employee services | — | — | — | — | — | — | — | — | — | — | |||||||||||||||||||||||||||||||
| - Vested | — | — | ( | — | — | — | — | — | |||||||||||||||||||||||||||||||||
| - Forfeited | — | — | — | — | — | ( | — | — | — | — | — | ||||||||||||||||||||||||||||||
| - Granted | — | — | — | — | — | ( | — | — | — | — | — | ||||||||||||||||||||||||||||||
| Purchase of own shares (Note 22) | — | ( | — | — | — | — | ( | — | — | — | ( | — | ( | ||||||||||||||||||||||||||||
| Dividends to shareholders (Note 22) | — | ( | — | — | — | — | — | — | — | — | ( | — | ( | ||||||||||||||||||||||||||||
| Dividends to non-controlling interest | — | — | — | — | — | — | — | — | — | — | — | ( | ( | ||||||||||||||||||||||||||||
| Balance at December 31, 2022 | ( | ( | ( | ||||||||||||||||||||||||||||||||||||||
(*) Net of $7,337 of Income tax.
(**) Net of $25,307 of Income tax.
(1) Correspond to the presumed credit of ICMS (Imposto sobre Circulação de Mercadorias e Prestação de Serviços) over the sale values in our Sugar, ethanol and energy business. (please see Note 24).
The accompanying notes are an integral part of these consolidated financial statements.
F- 11
Adecoagro S.A.
Consolidated Statements of Cash Flows
for the years ended December 31, 2022, 2021 and 2020
(All amounts in US$ thousands, except shares and per share data and as otherwise indicated)
| Note | 2022 | 2021 | 2020 | |||||||||||||||||
| Cash flows from operating activities: | ||||||||||||||||||||
| Profit for the year | ||||||||||||||||||||
| Adjustments for: | ||||||||||||||||||||
| Income tax expense | 10 | |||||||||||||||||||
| Depreciation | 12 | |||||||||||||||||||
| Amortization | 15 | |||||||||||||||||||
| Depreciation of right of use assets | 13 | |||||||||||||||||||
| (Gain) / loss from the disposal of other property items | 8 | ( | ( | |||||||||||||||||
| Gain from the sale of farmland and other assets | 8 | ( | ||||||||||||||||||
| (Gain) / loss from the sale of subsidiary | ( | |||||||||||||||||||
| Bargain purchase gain on acquisition | ( | |||||||||||||||||||
| Net loss/(gain)from the fair value adjustment of Investment properties | 8 | ( | ||||||||||||||||||
| Equity settled share-based compensation granted | 7 | |||||||||||||||||||
| Loss from derivative financial instruments and forwards | 8, 9 | |||||||||||||||||||
| Interest, finance cost related to lease liabilities and other financial expense, net | 9 | |||||||||||||||||||
| Initial recognition and changes in fair value of non-harvested biological assets (unrealized) | ( | ( | ( | |||||||||||||||||
| Changes in net realizable value of agricultural produce after harvest (unrealized) | ( | |||||||||||||||||||
| Provision and allowances | ||||||||||||||||||||
| Net loss / (gain) of inflation effects on the monetary items | 9 | ( | ( | |||||||||||||||||
| Foreign exchange (gains)/ losses, net | 9 | ( | ( | |||||||||||||||||
| Cash flow hedge – transfer from equity | 9 | |||||||||||||||||||
| Subtotal | ||||||||||||||||||||
| Changes in operating assets and liabilities: | ||||||||||||||||||||
| Increase in trade and other receivables | ( | ( | ( | |||||||||||||||||
| Decrease / (increase) in inventories | ( | ( | ||||||||||||||||||
| (Increase) / decrease in biological assets | ( | ( | ||||||||||||||||||
| Increase in other assets | ( | ( | ( | |||||||||||||||||
| (Increase) / Decrease in derivative financial instruments | ( | ( | ||||||||||||||||||
| (Decrease) / Increase in trade and other payables | ( | ( | ||||||||||||||||||
| Increase in payroll and social security liabilities | ||||||||||||||||||||
| (Decrease) / increase in provisions for other liabilities | ( | |||||||||||||||||||
| Net cash generated from operating activities before taxes paid | ||||||||||||||||||||
| Income tax paid | ( | ( | ( | |||||||||||||||||
| Net cash generated from operating activities | (a) | |||||||||||||||||||
The accompanying notes are an integral part of these consolidated financial statements.
F- 12
Adecoagro S.A.
Consolidated Statements of Cash Flows (Continued)
for the years ended December 31, 2022, 2021 and 2020
(All amounts in US$ thousands, except shares and per share data and as otherwise indicated)
| Note | 2022 | 2021 | 2020 | |||||||||||||||||
| Cash flows from investing activities: | ||||||||||||||||||||
| Acquisition of business, net of cash and cash equivalents acquired | 21 | |||||||||||||||||||
| Purchases of property, plant and equipment | 12 | ( | ( | ( | ||||||||||||||||
| Purchase of cattle and non-current biological assets | 16 | ( | ( | ( | ||||||||||||||||
| Purchases of intangible assets | 15 | ( | ( | ( | ||||||||||||||||
| Interest received and others | 9 | |||||||||||||||||||
| Proceeds from disposal of other property items | ||||||||||||||||||||
| Proceeds from the sale of farmland and other assets | 21 | |||||||||||||||||||
| Proceeds from the sale of subsidiary | 21 | |||||||||||||||||||
| Acquisition of short-term investment | 17 | ( | ||||||||||||||||||
| Net cash used in investing activities | (b) | ( | ( | ( | ||||||||||||||||
| Cash flows from financing activities: | ||||||||||||||||||||
| Proceeds from long-term borrowings | 26 | |||||||||||||||||||
| Payments of long-term borrowings | 26 | ( | ( | ( | ||||||||||||||||
| Proceeds from short-term borrowings | 26 | |||||||||||||||||||
| Payments of short-term borrowings | 26 | ( | ( | ( | ||||||||||||||||
| Interest paid | (c) | ( | ( | ( | ||||||||||||||||
| Borrowings prepayment related expenses | ( | |||||||||||||||||||
| Proceeds from exercise of employee share options | ||||||||||||||||||||
| Collections / (Payments) of derivatives financial instruments | ( | |||||||||||||||||||
| Lease payments | ( | ( | ( | |||||||||||||||||
| Purchase of own shares | ( | ( | ( | |||||||||||||||||
| Dividends paid to non-controlling interest | ( | ( | ( | |||||||||||||||||
| Dividends paid to shareholders | ( | |||||||||||||||||||
| Net cash used from financing activities | (d) | ( | ( | ( | ||||||||||||||||
| Net increase / (decrease) in cash and cash equivalents | ( | |||||||||||||||||||
| Cash and cash equivalents at beginning of year | 20 | |||||||||||||||||||
| Effect of exchange rate changes and inflation on cash and cash equivalents | (e) | ( | ( | ( | ||||||||||||||||
| Cash and cash equivalents at end of year | 20 | |||||||||||||||||||
(a) Includes (38,043 ), (30,666 ) and (14,956 ) of the combined effect of IAS 29 and IAS 21 of the Argentine subsidiaries for 2022, 2021 and 2020, respectively.
(b) Includes (83 ), (4,694 ) and (429 ) of the combined effect of IAS 29 and IAS 21 of the Argentine subsidiaries for 2022, 2021 and 2020, respectively.
(c) Includes 77 , (1,109 ) and (1,639 ) of the combined effect of IAS 29 and IAS 21 of the Argentine subsidiaries for 2022, 2021 and 2020, respectively.
(d) Includes 45,359 , 41,238 and 15,694 of the combined effect of IAS 29 and IAS 21 of the Argentine subsidiaries for 2022, 2021 and 2020, respectively.
(e) Includes (7,233 ), (5,878 ) and (309 ) of the combined effect of IAS 29 and IAS 21 of the Argentine subsidiaries for 2022, 2021 and 2020, respectively.
For non-cash transactions, see Note 13 for Right of Use Assets and related to acquisition of subsidiaries, see Note 21.
The accompanying notes are an integral part of these consolidated financial statements.
F- 13
Adecoagro S.A.
Notes to the Consolidated Financial Statements
(All amounts in US$ thousands, except shares and per share data and as otherwise indicated)
1. General information
Adecoagro S.A. (the "Company" or "Adecoagro") is the Group’s ultimate parent company and is a société anonyme (stock corporation) organized under the laws of the Grand Duchy of Luxembourg. Adecoagro is a holding company primarily engaged through its operating subsidiaries in agricultural and agro-industrial activities. The Company and its operating subsidiaries are collectively referred to hereinafter as the "Group." The Group’s activities are carried out through three major lines of business, namely, Farming; Sugar, Ethanol and Energy and Land Transformation. The Farming line of business is further comprised of three reportable segments, which are described in detail in Note 3 to these Consolidated Financial Statements.
Adecoagro is a Public Company listed in the New York Stock Exchange (NYSE) as a foreign registered company under the ticker symbol of AGRO.
These Consolidated Financial Statements have been approved for issue by the Board of Directors on April 26, 2023.
2. Financial risk management
Risk management principles and processes
The Group’s activities are exposed to a variety of financial risks. The Group’s overall risk management program focuses on the unpredictability of financial markets and seeks to minimize the Group’s capital costs by using suitable means of financing and to manage and control the Group’s financial risks effectively. The Group uses financial instruments to hedge certain risk exposures.
The Group’s approach to the identification, assessment and mitigation of risk is carried out by a Risk and Commercial Committee, which focuses on timely and appropriate risk management.
The principal financial risks are related to raw material price, end-product price, exchange rate, interest rate, liquidity and credit risk. This section provides a description of the principal risks and uncertainties that could have a material adverse effect on the Group’s strategy, performance, results of operations and financial condition. These risks do not appear in any particular order of materiality or probability of occurrence.
Argentina status:
Since the second half of 2019, the Argentine government instituted certain foreign currency exchange controls, which may restrict or partially restrict access to foreign currency, like the U.S. dollars, to make payments abroad, either for foreign debt or the importation of goods or services, dividend payments and others, without prior authorization. Other restrictions also comprise the deferral of payment of certain public debt instruments and fuel price controls. Those regulations have continued to evolve, sometimes making them more or less stringent depending on the Argentine government’s perception of availability of sufficient national foreign currency reserves. The above has led to the existence of an informal foreign currency market where foreign currencies quote at levels significantly higher than the official exchange rate. However, the only exchange rate available for external commerce is the official exchange rate, which as of December 31, 2022 was Pesos 177 per dollar.
•Exchange rate risk
The Group’s cash flows, statement of income and statement of financial position are presented in U.S. Dollars and may be affected by fluctuations in exchange rates. Currency risks, as defined by IFRS 7, arise on account of monetary assets and liabilities being denominated in a currency that is not the functional currency.
A significant majority of the Group’s business activities is conducted in the functional currencies of the respective subsidiaries (primarily the Brazilian Reais and the Argentine Peso). However, the Group may transact in currencies other than the respective functional currencies, mainly the U.S. Dollar. As such, these subsidiaries may hold U.S. Dollar denominated monetary balances at each year-end as indicated in the tables below.
F- 14
Adecoagro S.A.
Notes to the Consolidated Financial Statements (Continued)
(All amounts in US$ thousands, except shares and per share data and as otherwise indicated)
2. Financial risk management (continued)
The Group’s net financial position exposure to the U.S. Dollar is managed on a case-by-case basis, partly by hedging certain expected cash flows with foreign exchange derivative contracts.
The following tables show the net monetary position of the respective subsidiaries within the Group categorized by functional currency. Non-U.S. Dollar amounts are presented in U.S. Dollars for purpose of these tables.
| 2022 | |||||||||||||||||
| Subsidiaries’ functional currency | |||||||||||||||||
| Net monetary position (Liability)/ Asset | Argentine Peso | Brazilian Reais | Uruguayan Peso | U.S. Dollar | Total | ||||||||||||
| Argentine Peso | ( | — | — | — | ( | ||||||||||||
| Brazilian Reais | — | ( | — | — | ( | ||||||||||||
| U.S. Dollar | ( | ( | ( | ||||||||||||||
| Uruguayan Peso | — | — | ( | — | ( | ||||||||||||
| Total | ( | ( | ( | ||||||||||||||
| 2021 | |||||||||||||||||
| Subsidiaries’ functional currency | |||||||||||||||||
| Net monetary position (Liability)/ Asset | Argentine Peso | Brazilian Reais | Uruguayan Peso | U.S. Dollar | Total | ||||||||||||
| Argentine Peso | ( | — | — | — | ( | ||||||||||||
| Brazilian Reais | — | ( | — | — | ( | ||||||||||||
| U.S. Dollar | ( | ( | ( | ||||||||||||||
| Uruguayan Peso | — | — | ( | — | ( | ||||||||||||
| Total | ( | ( | ( | ||||||||||||||
The Group’s analysis shown on the tables below is carried out based on the exposure of each functional currency subsidiary against the U.S. Dollar. The Group estimated that, other factors being constant, a hypothetical 10
| Functional currency | |||||||||||||||||
| Net monetary position | Argentine Peso | Brazilian Reais | Uruguayan Peso | Total | |||||||||||||
| 2022 | U.S. Dollar | ( | ( | ( | |||||||||||||
| 2021 | U.S. Dollar | ( | ( | ( | |||||||||||||
The tables above only consider the effect of a hypothetical appreciation / depreciation of the U.S. Dollars on the Group’s net financial position. A hypothetical appreciation / depreciation of the U.S. Dollar against the functional currencies of the Group’s subsidiaries has historically had a positive / negative effect, respectively, on the fair value of the Group’s biological assets and the end prices of the Group’s agriculture produce, both of which are generally linked to the U.S. Dollar.
F- 15
Adecoagro S.A.
Notes to the Consolidated Financial Statements (Continued)
(All amounts in US$ thousands, except shares and per share data and as otherwise indicated)
2. Financial risk management (continued)
Hedge Accounting Cash Flow Hedge
The Group formally documents and designates cash flow hedging relationships to hedge the foreign exchange rate risk of a portion of its highly probable future sales in U.S. Dollars using a portion of its borrowings denominated in U.S. Dollars, currency forwards and foreign currency floating-to-fixed interest rate swaps, as needed.
Generally, the principal amounts of long-term borrowings (non-derivative financial instruments) and notional values of foreign currency forward contracts (derivative financial instruments) are designated as hedging instruments. These instruments are exposed to foreign currency risks, mainly Brazilian Reais/ U.S. Dollar related to operations in Brazil and Argentine Peso/U.S. Dollar in Argentina related to operations in Argentina. As of December 31, 2022, and 2021, approximately 10
The Group prepares formal documentation to support hedge designation, including an explanation of how the designation of the hedging relationship is aligned with the Group’s Risk Management Policy, identification of the hedging instrument, the hedged transactions, the nature of the risk being hedged and an analysis which demonstrates that the hedge is expected to be highly effective. The Group reassesses the prospective and retrospective effectiveness of the hedge on an ongoing basis comparing the foreign currency component of the carrying amount of the hedging instruments and of the highly probable future sales.
Under cash flow hedge accounting, the effect of changes in foreign currency exchange rates on derivative and non-derivative hedging instruments are not immediately recognized in profit or loss but are reclassified from equity to profit or loss in the periods when the future sales occur, thus allowing for a more appropriate presentation of the results for the period reflecting the strategy in the Group’s Risk Management Policy.
Currently, based on the Group’s plans, it is expected that the cash flows will occur and affect profit or loss between 2023 and 2027.
For the year ended December 31, 2022, a pre-tax loss of US$15,621 (US$10,565 pre-tax loss in 2021 and US$ 46,145 loss in 2020) was recognized in other comprehensive income and an amount of US$41,371 loss (US$54,650 loss in 2021 and US$26,031 loss in 2020) was reclassified from equity to profit or loss within “Financial results, net”.
•Raw material price risk
Inflation in the costs of raw materials and goods and services from industry suppliers and manufacturers presents risks to project economics. A significant portion of the Group’s cost structure includes the cost of raw materials primarily seeds, fertilizers and agrochemicals, among others. Prices for these raw materials may vary significantly.
•End-product price risk
Prices for commodity products have historically been cyclical, reflecting overall economic conditions and changes in capacity within the industry, which affect the profitability of entities engaged in the agribusiness industry. The Group combines different actions to minimize price risk. A percentage of crops are to be sold during and post-harvest period. The Group manages minimum and maximum prices for each commodity as well as gross margin per each crop as to decide when and how to sell. End-product price risks are hedged if economically viable and possible by entering into forward contracts with major trading houses or by using derivative financial instruments, consisting mainly of crops and sugar future contracts, but also includes occasionally put and call options. A movement in end-product futures prices would result in a change in the fair value of the end product hedging contracts. These fair value changes, after taxes, are recorded in the consolidated statement of income.
F- 16
Adecoagro S.A.
Notes to the Consolidated Financial Statements (Continued)
(All amounts in US$ thousands, except shares and per share data and as otherwise indicated)
2. Financial risk management (continued)
Contract positions are designed to ensure that the Group would receive a defined minimum price for certain quantities of its production. The counterparties to these instruments generally are major financial institutions. In entering into these contracts, the Group has assumed the risk that might arise from the possible inability of counterparties to meet the terms of their contracts. The Group does not expect any material losses as a result of counterparty defaults. The Group is also obliged to pay margin deposits and premiums for these instruments. These estimates represent only the sensitivity of the financial instruments to market risk and not the Group exposure to end product price risks as a whole, since the crops and cattle products sales are not financial instruments within the scope of IFRS 7 disclosure requirements.
Liquidity risk
The Group is exposed to liquidity risks, including risks associated with refinancing borrowings as they mature, and that borrowing facilities are not available to meet cash requirements. Failure to manage liquidity risks could have a material impact on the Group’s cash flow and statement of financial position.
Prudent liquidity risk management includes managing the profile of debt maturities and funding sources close oversight of cash flows projections, maintaining sufficient cash, and ensuring the availability of funding from an adequate amount of committed credit facilities and the ability to close out market positions. The Group's ability to fund its existing and prospective debt requirements is managed by maintaining diversified funding sources with adequate available funding lines from high quality lenders; and reaching to have long-term financial facilities.
As of December 31, 2022, cash and cash equivalents of the Group totaled US$230.7 million, which are available for use.
The tables below analyzes the Group’s non-derivative financial liabilities and derivative financial liabilities into relevant maturity groupings based on the remaining period at the statement of financial position to the contractual maturity date. The amounts disclosed in the table are the contractual undiscounted cash flows and as a result they do not reconcile to the amounts disclosed on the statement of financial position except for short-term payables where discounting is not applied.
| At December 31, 2022 | Less than 1 year | Between 1 and 2 years | Between 2 and 5 years | Over 5 Years | Total | ||||||||||||
| Trade and other payables | |||||||||||||||||
| Borrowings | |||||||||||||||||
| Leases Liabilities | |||||||||||||||||
| Derivative financial instruments | |||||||||||||||||
| Total | |||||||||||||||||
| At December 31, 2021 | Less than 1 year | Between 1 and 2 years | Between 2 and 5 years | Over 5 Years | Total | ||||||||||||
| Trade and other payables | |||||||||||||||||
| Borrowings | |||||||||||||||||
| Leases Liabilities | |||||||||||||||||
| Derivative financial instruments | |||||||||||||||||
| Total | |||||||||||||||||
•Interest rate risk
The Group’s interest rate risk arises from long-term borrowings at floating rates, which expose the Group to cash flow interest rate risk. Borrowings issued at fixed rates expose the Group to fair value interest rate risk. The interest rate profile of the Group's borrowings is set out in Note 26.
F- 17
Adecoagro S.A.
Notes to the Consolidated Financial Statements (Continued)
(All amounts in US$ thousands, except shares and per share data and as otherwise indicated)
2. Financial risk management (continued)
The Group occasionally manages its cash flow interest rate risk exposure by using floating-to-fixed interest rate swaps. Such interest rate swaps have the economic effect of converting borrowings from floating rates to fixed rates.
The following tables show a breakdown of the Group’s fixed-rate and floating-rate borrowings per currency denomination and functional currency of the subsidiary debt holder. These analyses are performed after giving effect to interest rate swaps.
The analysis for the year ended December 31, 2022 and 2021 is as follows:
| 2022 | |||||||||||||||||
| Subsidiaries’ functional currency | |||||||||||||||||
| Rate per currency denomination | Argentine Peso | Brazilian Reais | Uruguayan Peso | U.S. Dollar | Total | ||||||||||||
| Fixed rate: | |||||||||||||||||
| Argentine Peso | |||||||||||||||||
| Brazilian Reais | |||||||||||||||||
| U.S. Dollar | |||||||||||||||||
| Subtotal fixed-rate borrowings | |||||||||||||||||
| Variable rate: | |||||||||||||||||
| Brazilian Reais | |||||||||||||||||
| U.S. Dollar | |||||||||||||||||
| Subtotal variable-rate borrowings | |||||||||||||||||
| Total borrowings as per statement of financial position | |||||||||||||||||
| 2021 | |||||||||||||||||
| Subsidiaries’ functional currency | |||||||||||||||||
| Rate per currency denomination | Argentine Peso | Brazilian Reais | Uruguayan Peso | U.S. Dollar | Total | ||||||||||||
| Fixed rate: | |||||||||||||||||
| Argentine Peso | |||||||||||||||||
| Brazilian Reais | |||||||||||||||||
| U.S. Dollar | |||||||||||||||||
| Subtotal fixed-rate borrowings | |||||||||||||||||
| Variable rate: | |||||||||||||||||
| Brazilian Reais | |||||||||||||||||
| U.S. Dollar | |||||||||||||||||
| Subtotal variable-rate borrowings | |||||||||||||||||
| Total borrowings as per statement of financial position | |||||||||||||||||
For the years ended December 31, 2022 and 2021, if interest rates on floating-rate borrowings had been 1% higher with all other variables held constant, the Group’s Profit before income tax for the years would have decreased as shown below. A 1% decrease in interest rates would have an equal and opposite effect on the income statement.
F- 18
Adecoagro S.A.
Notes to the Consolidated Financial Statements (Continued)
(All amounts in US$ thousands, except shares and per share data and as otherwise indicated)
2. Financial risk management (continued)
| 2022 | |||||||||||||||||
| Subsidiaries’ functional currency | |||||||||||||||||
| Rate per currency denomination | Argentine Peso | Brazilian Reais | Uruguayan Peso | U.S. Dollar | Total | ||||||||||||
| Variable rate: | |||||||||||||||||
| Brazilian Reais | ( | ( | |||||||||||||||
| U.S. Dollar | ( | ( | ( | ||||||||||||||
| Total effects on profit before income tax | ( | ( | ( | ||||||||||||||
| 2021 | |||||||||||||||||
| Subsidiaries’ functional currency | |||||||||||||||||
| Rate per currency denomination | Argentine Peso | Brazilian Reias | Uruguayan Peso | U.S. Dollar | Total | ||||||||||||
| Variable rate: | |||||||||||||||||
| Brazilian Reais | ( | ( | |||||||||||||||
| U.S. Dollar | ( | ( | ( | ||||||||||||||
| Total effects on profit before income tax | ( | ( | ( | ||||||||||||||
The sensitivity analysis has been determined assuming that the change in interest rates had occurred at the date of the statement of financial position and had been applied to the exposure to interest rate risk for financial instruments in existence at that date. The 100 basis point increase or decrease represents management's assessment of a reasonable possible change in those interest rates, which have the most impact on the Group, specifically the United States and Brazilian rates over the period until the next annual statement of financial position date.
The Group is currently negotiating with its contractual counterparts a replacement of the LIBOR-related contracts. Although the negotiations are not finalized yet, the Group expects that it will obtain similar interest rates as replacements. However, there can be no assurance that all negotiations will be favorable to the Group.
•Credit risk
The Group’s exposure to credit risk mainly arise from the potential non-performance of contractual obligations by the parties, in relation to amounts owed for physical product sales, the use of derivative instruments, and the investment of surplus cash balances. The Group is also exposed to political and economic risk events, which may cause non-payment of foreign currency obligations to the Group.
The Group’s policy is to manage credit exposure to trading counterparties within defined trading limits. All of the Group’s significant counterparties are assigned internal credit limits.
The Group regularly sells to a large base of customers. The type and class of customers may differ depending on the Group’s business segments. For the years ended December 31, 2022 and 2021, more than 71 % and 73 %, respectively, of the Group’s sales of crops were sold to 34 and 27 well-known customers (both multinational and local) with a good credit history with the Group. In the rice segment 74 % and 68 % of sales were sold to 79 and 28 well-known customers for the years ended December 31, 2022 and 2021, respectively. In the Sugar, Ethanol and Energy segment, sales of ethanol were concentrated in 66 and 39 customers, which represented 100 100 % and 86 % of the Group’s sales of sugar were concentrated in 158 and 124 well-known traders for the years ended December 31, 2022 and 2021, respectively. For the years ended December 31, 2022 and 2021, 94 % and 95 % of energy sales were concentrated in 59 and 72 major customers, respectively. In the dairy segment, 62 % and 67 % of the sales were concentrated in 53 and 18 well-known customers for the years ended December 31, 2022 and 2021, respectively.
F- 19
Adecoagro S.A.
Notes to the Consolidated Financial Statements (Continued)
(All amounts in US$ thousands, except shares and per share data and as otherwise indicated)
2. Financial risk management (continued)
No credit limits were exceeded during the reporting periods and management does not expect any losses from non-performance by these counterparties. If any of the Group’s customers are independently rated, these ratings are used. Otherwise, the Group assesses the credit quality of the customer taking into account its financial position, past experience and other factors (see Note 17 for details). The Group may seek cash collateral, letter of credit or parent company guarantees, as considered appropriate. Sales to customers are primarily made by credit with customary payment terms. The maximum exposure to credit risk is represented by the carrying amount of each financial asset in the statement of financial position after deducting any impairment allowance. The Group’s exposure of credit risk arising from trade receivables is set out in Note 18.
The Group is exposed to counterparty credit risk on cash and cash equivalent balances. The Group holds cash on deposit with a number of financial institutions. The Group manages its credit risk exposure by limiting individual deposits to clearly defined limits. The Group only deposits with high quality banks and financial institutions. As of December 31, 2022 and 2021, the total amount of cash and cash equivalents mainly comprise cash in banks and short-term bank deposits. The Group is authorized to transact with banks rated “BBB+” or higher. As of both December 31, 2022 and 2021, 4 86 % and 81 %, respectively, of the total cash deposited. The remaining amount of cash and cash equivalents relates to cash in hand. Additionally, during the year ended December 31, 2022, the Group invested in fixed-term bank deposits with mainly two banks (FCI and ING), treasury bills and also entered into derivative contracts (currency forward). The Group’s exposure of credit risk arising from cash and cash equivalents is set out in Note 20.
The Group’s primary objective for holding derivative financial instruments is to manage currency exchange rate risk, interest rate risk and commodity price risk. The Group generally enters into derivative transactions with high-credit-quality counterparties and, by policy, limits the amount of credit exposure to any one counterparty based on an analysis of that counterparty's relative credit standing. The amounts subject to credit risk related to derivative instruments are generally limited to the amounts, if any, by which counterparty's obligations exceed the obligations with that counterparty.
The Group also entered into crop commodity futures traded in the established trading markets of Argentina and Brazil through well-rated brokers. Management does not expect any counterparty to fail to meet its obligations.
•Capital risk management
The Group’s objectives when managing capital are to safeguard the Group’s ability to continue as a going concern in order to provide returns for shareholders and benefits for other stakeholders and to maintain an optimal capital structure to reduce the cost of capital. In order to maintain or adjust the capital structure, it may adjust the amount of dividends paid to shareholders, return capital to shareholders, issue new shares or buy own shares or sell assets to reduce debt. Consistent with others in the industry, the Group monitors capital on the basis of the gearing ratio. This ratio is calculated as total debt (including current and non-current borrowings as shown in the consolidated statement of financial position, if applicable) divided by total capital. Total capital is calculated as equity, as shown in the consolidated statement of financial position, plus total borrowings. During the year ended December 31, 2022, the strategy was to maintain the gearing ratio within 0.40 to 0.60 , as follows:
| 2022 | 2021 | ||||||||||
| Total borrowings | |||||||||||
| Total equity | |||||||||||
| Total capital | |||||||||||
| Gearing ratio | |||||||||||
•Derivative financial instruments
As part of its business operations, the Group may uses a variety of derivative financial instruments to manage its exposure to the financial risks discussed above. As part of its strategy, the Group may enter into derivatives of (i) interest rate to manage the composition of floating and fixed rate debt; (ii) currency to manage exchange rate risk, and (iii) crop (future
F- 20
Adecoagro S.A.
Notes to the Consolidated Financial Statements (Continued)
(All amounts in US$ thousands, except shares and per share data and as otherwise indicated)
2. Financial risk management (continued)
contracts and put and call options) to manage its exposure to price volatility stemming from its integrated crop production activities. The Group’s policy is not to use derivatives for speculative purposes.
Derivative financial instruments involve, to a varying degree, elements of market and credit risk not recognized in the financial statements. The market risk associated with these instruments resulting from price movements is expected to offset the market risk of the underlying transactions, assets and liabilities, being hedged. The counterparties to the agreements relating to the Group’s contracts generally are large institutions with credit ratings equal to or higher than BBB+. The Group continually monitors the credit rating of such counterparties and seeks to limit its financial exposure to any one financial institution. While the contract or notional amounts of derivative financial instruments provide one measure of the volume of these transactions, they do not represent the amount of the Group’s exposure to credit risk. The amounts potentially subject to credit risk (arising from the possible inability of counterparties to meet the terms of their contracts) are generally limited to the amounts, if any, by which the counterparties’ obligations under the contracts exceed the Group’s obligations to the counterparties.
The following tables show the outstanding positions for each type of derivative contract as of the date of each statement of financial position:
▪ Futures / options
As of December 31, 2022:
| 2022 | ||||||||||||||||||||||||||
| Type of derivative contract | Quantities (thousands) (**) | Notional amount | Fair Value Asset/ (Liability) | (Loss)/Gain (*) | ||||||||||||||||||||||
| Futures: | ||||||||||||||||||||||||||
| Sale | ||||||||||||||||||||||||||
| Corn | ( | ( | ||||||||||||||||||||||||
| Soybean | ( | ( | ||||||||||||||||||||||||
| Wheat | ||||||||||||||||||||||||||
| Sugar | ( | ( | ||||||||||||||||||||||||
| Total | ( | ( | ||||||||||||||||||||||||
As of December 31, 2021:
| 2021 | ||||||||||||||||||||||||||
| Type of derivative contract | Quantities (thousands) (**) | Notional amount | Fair Value Asset/ (Liability) | (Loss)/Gain (*) | ||||||||||||||||||||||
| Futures: | ||||||||||||||||||||||||||
| Sale | ||||||||||||||||||||||||||
| Corn | ||||||||||||||||||||||||||
| Soybean | ( | ( | ||||||||||||||||||||||||
| Sugar | ||||||||||||||||||||||||||
| Total | ( | ( | ||||||||||||||||||||||||
(*) Included in the line item “(loss) / gain from commodity derivative financial instruments” of Note 8.
(**) All quantities expressed either in tons or cubic meters, as applicable.
Commodity future contract fair values are computed with reference to quoted market prices on future exchanges.
▪Floating-to-fixed interest rate swaps
F- 21
Adecoagro S.A.
Notes to the Consolidated Financial Statements (Continued)
(All amounts in US$ thousands, except shares and per share data and as otherwise indicated)
2. Financial risk management (continued)
In April 2022, one of the Group's subsidiaries in Brazil, Usina Monte Alegre (“UMA”) entered into a R$ 20 million loan with Itaú BBA. The loan bears interest at a fixed rate of 13.23 % p.a. Concurrently, UMA entered into a swap agreement, to effectively convert the fixed-interest-rate loan into a variable-interest-rate loan denominated in CDI (an interbank floating interest rate in Reais), plus a fixed rate of 1.29 %. The swap matures on March 24, 2024, mirroring the loan’s maturity date, and resulted in a recognition of a loss of US$ 90 thousand in 2022.
In December 2020, one of the Group's subsidiaries in Brazil, Adecoagro Vale do Ivinhema entered into an interest rate swap agreement with Itaú BBA for an aggregate amount of US$400 million. Pursuant to this agreement, Adecoagro Vale do Ivinhema receives IPCA (Extended National Consumer Price Index) plus 4.24 % per year and pays CDI (an interbank floating interest rate in Reais) plus 1.85 % per year. This swap agreement expires semiannually until December, 2026. This agreement resulted in a recognition of a loss of US$2.2 million in 2022 and a gain of US$2.1 million in 2021.
▪Currency forward
During the year ended December 31, 2022 the Group entered into several currency forward contracts with Brazilian banks, in order to hedge the fluctuation of the Brazilian Reais against the U.S. Dollar, for a total aggregate amount of US$ 4 million. It resulted in the recognition of non-significant gain or losses in 2022.
Also, the Group entered into several currency forward contracts to hedge the fluctuation of the U.S. Dollar against the Euro for a total notional amount of US$ 2.2 million. The currency forward contracts maturity date is March 2023. The outstanding contracts resulted in the recognition of a loss amounting to US$ 0.16 million in 2022. (2021:nil )
Gains and losses on currency forward contracts are included within “Financial results, net” in the statement of income.
3. Segment information
According to IFRS 8, operating segments are identified based on the ‘management approach’. Operating segments are components of an entity about which separate financial information is available that is evaluated regularly by the chief operating decision maker (“CODM”) in deciding how to allocate resources and in assessing performance. The Group’s CODM is the Management Committee. IFRS 8 stipulates external segment reporting based on the Group’s internal organizational and management structure and on internal financial reporting to the chief operating decision maker.
The Group operates in three major lines of business, namely, Farming; Sugar, Ethanol and Energy; and Land Transformation.
•The ‘Farming’ is further comprised of three reportable segments:
•‘Crops’ Segment which consists of planting, harvesting and sale of grains, oilseeds and fibers (including wheat, corn, soybeans, peanuts, cotton and sunflowers, among others), and to a lesser extent the provision of grain warehousing/conditioning and handling and drying services to third parties. Each underlying crop in this segment does not represent a separate operating segment. Management seeks to maximize the use of the land through the cultivation of one or more type of crops. Types and surface amount of crops cultivated may vary from harvest year to harvest year depending on several factors, some of them out of the Group’s control. Management is focused on the long-term performance of the productive land, and to that extent, the performance is assessed considering the aggregated combination, if any, of crops planted in the land. A single manager is responsible for the management of operating activity of all crops rather than for each individual crop.
•‘Rice’ Segment which consists of planting, harvesting, processing and marketing of rice.
•‘Dairy’ Segment which consists of the production and sale of raw milk and industrialized products, including UHT, cheese and powder milk among others.
F- 22
Adecoagro S.A.
Notes to the Consolidated Financial Statements (Continued)
(All amounts in US$ thousands, except shares and per share data and as otherwise indicated)
3. Segment information (continued)
•‘All Other Segments’ which consists of the aggregation of the remaining non-reportable operating segments, which do not meet the quantitative thresholds for disclosure, namely, Coffee and Cattle.
•‘Sugar, Ethanol and Energy’ Segment which consists of cultivating sugarcane which is processed in owned sugar mills, transformed into ethanol, sugar and electricity and then marketed;
•‘Land Transformation’ Segment comprises the (i) identification and acquisition of underdeveloped and undermanaged farmland businesses; and (ii) realization of value through the strategic disposition of assets (generating profits).
Total segment assets and liabilities are measured in a manner consistent with that of the Consolidated Financial Statements. These assets and liabilities are allocated based on the operations of the segment and the physical location of the asset.
Effective July 1, 2018, the Group applied IAS 29 “Financial Reporting in Hyperinflationary Economies” (“IAS 29”) to its operations in Argentina. IAS 29 “Financial Reporting in Hyperinflationary Economies” requires that the financial statements of entities whose functional currency is that of a hyperinflationary economy be adjusted for the effects of changes in the general price index and be expressed in terms of the current unit of measurement at the closing date of the reporting period (“inflation accounting”). In order to determine whether an economy is classified as hyperinflationary, IAS 29 sets forth a series of factors to be considered, including whether the amount of cumulative inflation nears or exceeds a threshold of 100 % accumulated in three years. Argentina has been classified as a hyperinflationary economy under the terms of IAS 29 from July 1, 2018. (Please see Note 33 - Basis of preparation and presentations).
According to IAS 29, all Argentine Peso-denominated non-monetary items in the statement of financial position are adjusted by applying a general price index from the date they were initially recognized to the end of the reporting period. Likewise, all Argentine Peso-denominated items in the statement of income should be expressed in terms of the measuring unit current at the end of the reporting period, consequently, income statement items are adjusted by applying a general price index on a monthly basis from the dates they were initially recognized in the financial statements to the end of the reporting period. This process is called “re-measurement”.
Once the re-measurement process is completed, all Argentine Peso denominated accounts are translated into U.S. Dollars, the Group’s reporting currency, applying the guidelines in IAS 21 “The Effects of Changes in Foreign Exchange Rates”(“IAS 21”). IAS 21 requires that amounts be translated at the closing rate at the date of the most recent statement of financial position. This process is called “translation”.
The re-measurement and translation processes are applied on a monthly basis until year-end. Due to these processes, the re-measured and translated results of operations for a given month are subject to change until year-end, affecting comparison and analysis.
Following the adoption of IAS 29 to the Argentine operations of the Group, management changed the information reviewed by the CODM. Accordingly, as from July 1, 2018, (commencement of hyper-inflation accounting in Argentina), the information provided to the CODM departs from the application of IAS 29 and IAS 21 re-measurement and translation processes as follows. For segment reporting purposes, the segment results of the Argentine operations for each reporting period were adjusted for inflation and translated into the Group’s reporting currency using the reporting period average exchange rate. The translated amounts were not subsequently re-measured and translated in accordance with the IAS 29 and IAS 21 procedures outlined above.
In order to evaluate the segment’s performance on a monthly basis, results of operations in Argentina are based on monthly data adjusted for inflation and converted into the average exchange rate of the U.S. Dollar each month. These already converted figures are subsequently not readjusted and reconverted as described above under IAS 29 and IAS 21. It should be noted that this translation methodology for evaluating segment information is the same that the Group uses to translate results of operation from its other subsidiaries from other countries that have not been designated hyperinflationary economies because it allows for a more accurate analysis of the economic performance of its business as a whole.
F- 23
Adecoagro S.A.
Notes to the Consolidated Financial Statements (Continued)
(All amounts in US$ thousands, except shares and per share data and as otherwise indicated)
3. Segment information (continued)
The Group’s CODM believes that the exclusion of the re-measurement and translation processes from the segment reporting structure allows for a more useful presentation and facilitates period-to-period comparison and performance analysis.
The following tables show a reconciliation of the reportable segments where the information reviewed by the CODM differs from the reportable segment information measured in accordance with IAS 29 and IAS 21 as per the Consolidated Financial Statements for all years presented. These tables do not include information for the Sugar, Ethanol and Energy reportable segment since this information is not affected by the application of IAS 29 and therefore there is no difference between the information reviewed by the CODM and the information included in the Consolidated Financial Statements:
F- 24
Adecoagro S.A.
Notes to the Consolidated Financial Statements (Continued)
(All amounts in US$ thousands, except shares and per share data and as otherwise indicated)
3. Segment information (continued)
Segment reconciliation for the year ended December 31, 2022:
| 2022 | |||||||||||||||||||||||||||||||||||||||||||||||||||||
| Crops | Rice | Dairy | |||||||||||||||||||||||||||||||||||||||||||||||||||
| Total segment reporting | Adjustment | Total as per statement of income | Total segment reporting | Adjustment | Total as per statement of income | Total segment reporting | Adjustment | Total as per statement of income | |||||||||||||||||||||||||||||||||||||||||||||
| Sales of goods sold and services rendered | ( | ( | ( | ||||||||||||||||||||||||||||||||||||||||||||||||||
| Cost of goods and services rendered | ( | ( | ( | ( | ( | ( | ( | ||||||||||||||||||||||||||||||||||||||||||||||
| Initial recognition and changes in fair value of biological assets and agricultural produce | ( | ||||||||||||||||||||||||||||||||||||||||||||||||||||
| Gain from changes in net realizable value of agricultural produce after harvest | ( | ( | |||||||||||||||||||||||||||||||||||||||||||||||||||
| Margin on Manufacturing and Agricultural Activities Before Operating Expenses | ( | ( | |||||||||||||||||||||||||||||||||||||||||||||||||||
| General and administrative expenses | ( | ( | ( | ( | ( | ( | |||||||||||||||||||||||||||||||||||||||||||||||
| Selling expenses | ( | ( | ( | ( | ( | ( | |||||||||||||||||||||||||||||||||||||||||||||||
| Other operating income, net | ( | ( | ( | ( | ( | ( | |||||||||||||||||||||||||||||||||||||||||||||||
| Bargain purchase gain on acquisition | |||||||||||||||||||||||||||||||||||||||||||||||||||||
| Profit from Operations | ( | ||||||||||||||||||||||||||||||||||||||||||||||||||||
| Depreciation and amortization | ( | ( | ( | ( | ( | ( | |||||||||||||||||||||||||||||||||||||||||||||||
| Net (loss) / gain from Fair value adjustment of investment property | |||||||||||||||||||||||||||||||||||||||||||||||||||||
| 2022 | |||||||||||||||||||||||||||||||||||||||||||||||||||||||||||||||||||||||
| All other segments | Land transformation | Corporate | Total | ||||||||||||||||||||||||||||||||||||||||||||||||||||||||||||||||||||
| Total segment reporting | Adjustment | Total as per statement of income | Total segment reporting | Adjustment | Total as per statement of income | Total segment reporting | Adjustment | Total as per statement of income | Total segment reporting | Adjustment | Total as per statement of income | ||||||||||||||||||||||||||||||||||||||||||||||||||||||||||||
| Sales of goods sold and services rendered | ( | ( | |||||||||||||||||||||||||||||||||||||||||||||||||||||||||||||||||||||
| Cost of goods and services rendered | ( | ( | ( | ( | |||||||||||||||||||||||||||||||||||||||||||||||||||||||||||||||||||
| Initial recognition and changes in fair value of biological assets and agricultural produce | ( | ( | |||||||||||||||||||||||||||||||||||||||||||||||||||||||||||||||||||||
| Gain from changes in net realizable value of agricultural produce after harvest | ( | ( | |||||||||||||||||||||||||||||||||||||||||||||||||||||||||||||||||||||
| Margin on Manufacturing and Agricultural Activities Before Operating Expenses | |||||||||||||||||||||||||||||||||||||||||||||||||||||||||||||||||||||||
| General and administrative expenses | ( | ( | ( | ( | ( | ( | ( | ||||||||||||||||||||||||||||||||||||||||||||||||||||||||||||||||
| Selling expenses | ( | ( | ( | ( | ( | ( | ( | ||||||||||||||||||||||||||||||||||||||||||||||||||||||||||||||||
| Other operating income, net | ( | ( | ( | ( | ( | ( | |||||||||||||||||||||||||||||||||||||||||||||||||||||||||||||||||
| Bargain purchase gain on acquisition | |||||||||||||||||||||||||||||||||||||||||||||||||||||||||||||||||||||||
| Profit from Operations | ( | ( | ( | ( | ( | ( | |||||||||||||||||||||||||||||||||||||||||||||||||||||||||||||||||
| Depreciation and amortization | ( | ( | ( | ( | ( | ( | |||||||||||||||||||||||||||||||||||||||||||||||||||||||||||||||||
| Net (loss) / gain from Fair value adjustment of investment property | ( | ( | ( | ( | ( | ( | |||||||||||||||||||||||||||||||||||||||||||||||||||||||||||||||||
F- 25
Adecoagro S.A.
Notes to the Consolidated Financial Statements (Continued)
(All amounts in US$ thousands, except shares and per share data and as otherwise indicated)
3. Segment information (continued)
Segment reconciliation for the year ended December 31, 2021:
| 2021 | |||||||||||||||||||||||||||||||||||||||||||||||||||||
| Crops | Rice | Dairy | |||||||||||||||||||||||||||||||||||||||||||||||||||
| Total segment reporting | Adjustment | Total as per statement of income | Total segment reporting | Adjustment | Total as per statement of income | Total segment reporting | Adjustment | Total as per statement of income | |||||||||||||||||||||||||||||||||||||||||||||
| Sales of goods sold and services rendered | |||||||||||||||||||||||||||||||||||||||||||||||||||||
| Cost of goods and services rendered | ( | ( | ( | ( | ( | ( | ( | ( | ( | ||||||||||||||||||||||||||||||||||||||||||||
| Initial recognition and changes in fair value of biological assets and agricultural produce | |||||||||||||||||||||||||||||||||||||||||||||||||||||
| Gain from changes in net realizable value of agricultural produce after harvest | ( | ( | ( | ||||||||||||||||||||||||||||||||||||||||||||||||||
| Margin on Manufacturing and Agricultural Activities Before Operating Expenses | |||||||||||||||||||||||||||||||||||||||||||||||||||||
| General and administrative expenses | ( | ( | ( | ( | ( | ( | ( | ( | ( | ||||||||||||||||||||||||||||||||||||||||||||
| Selling expenses | ( | ( | ( | ( | ( | ( | ( | ( | ( | ||||||||||||||||||||||||||||||||||||||||||||
| Other operating income, net | ( | ( | ( | ( | ( | ( | |||||||||||||||||||||||||||||||||||||||||||||||
| Profit from Operations | |||||||||||||||||||||||||||||||||||||||||||||||||||||
| Depreciation and amortization | ( | ( | ( | ( | ( | ( | ( | ( | ( | ||||||||||||||||||||||||||||||||||||||||||||
| Net (loss) / gain from Fair value adjustment of investment property | |||||||||||||||||||||||||||||||||||||||||||||||||||||
| 2021 | |||||||||||||||||||||||||||||||||||||||||||||||||||||||||||||||||||||||
| All other segments | Land transformation | Corporate | Total | ||||||||||||||||||||||||||||||||||||||||||||||||||||||||||||||||||||
| Total segment reporting | Adjustment | Total as per statement of income | Total segment reporting | Adjustment | Total as per statement of income | Total segment reporting | Adjustment | Total as per statement of income | Total segment reporting | Adjustment | Total as per statement of income | ||||||||||||||||||||||||||||||||||||||||||||||||||||||||||||
| Sales of goods sold and services rendered | |||||||||||||||||||||||||||||||||||||||||||||||||||||||||||||||||||||||
| Cost of goods and services rendered | ( | ( | ( | ( | ( | ( | |||||||||||||||||||||||||||||||||||||||||||||||||||||||||||||||||
| Initial recognition and changes in fair value of biological assets and agricultural produce | ( | ||||||||||||||||||||||||||||||||||||||||||||||||||||||||||||||||||||||
| Gain from changes in net realizable value of agricultural produce after harvest | ( | ( | ( | ||||||||||||||||||||||||||||||||||||||||||||||||||||||||||||||||||||
| Margin on Manufacturing and Agricultural Activities Before Operating Expenses | |||||||||||||||||||||||||||||||||||||||||||||||||||||||||||||||||||||||
| General and administrative expenses | ( | ( | ( | ( | ( | ( | ( | ( | ( | ||||||||||||||||||||||||||||||||||||||||||||||||||||||||||||||
| Selling expenses | ( | ( | ( | ( | ( | ( | ( | ( | ( | ||||||||||||||||||||||||||||||||||||||||||||||||||||||||||||||
| Other operating income, net | ( | ( | ( | ( | ( | ( | ( | ||||||||||||||||||||||||||||||||||||||||||||||||||||||||||||||||
| Profit from Operations | ( | ( | ( | ( | ( | ( | |||||||||||||||||||||||||||||||||||||||||||||||||||||||||||||||||
| Depreciation and amortization | ( | ( | ( | ( | ( | ( | ( | ( | ( | ||||||||||||||||||||||||||||||||||||||||||||||||||||||||||||||
| Net (loss) / gain from Fair value adjustment of investment property | ( | ( | ( | ( | ( | ( | |||||||||||||||||||||||||||||||||||||||||||||||||||||||||||||||||
F- 26
Adecoagro S.A.
Notes to the Consolidated Financial Statements (Continued)
(All amounts in US$ thousands, except shares and per share data and as otherwise indicated)
3. Segment information (continued)
Segment reconciliation for the year ended December 31, 2020:
| 2020 | |||||||||||||||||||||||||||||||||||||||||||||||||||||
| Crops | Rice | Dairy | |||||||||||||||||||||||||||||||||||||||||||||||||||
| Total segment reporting | Adjustment | Total as per statement of income | Total segment reporting | Adjustment | Total as per statement of income | Total segment reporting | Adjustment | Total as per statement of income | |||||||||||||||||||||||||||||||||||||||||||||
| Sales of goods sold and services rendered | ( | ( | ( | ||||||||||||||||||||||||||||||||||||||||||||||||||
| Cost of goods and services rendered | ( | ( | ( | ( | ( | ( | |||||||||||||||||||||||||||||||||||||||||||||||
| Initial recognition and changes in fair value of biological assets and agricultural produce | ( | ( | ( | ||||||||||||||||||||||||||||||||||||||||||||||||||
| Gain from changes in net realizable value of agricultural produce after harvest | ( | ( | ( | ||||||||||||||||||||||||||||||||||||||||||||||||||
| Margin on Manufacturing and Agricultural Activities Before Operating Expenses | ( | ( | ( | ||||||||||||||||||||||||||||||||||||||||||||||||||
| General and administrative expenses | ( | ( | ( | ( | ( | ( | |||||||||||||||||||||||||||||||||||||||||||||||
| Selling expenses | ( | ( | ( | ( | ( | ( | |||||||||||||||||||||||||||||||||||||||||||||||
| Other operating income, net | ( | ( | ( | ( | ( | ( | |||||||||||||||||||||||||||||||||||||||||||||||
| Profit from Operations | ( | ( | ( | ||||||||||||||||||||||||||||||||||||||||||||||||||
| Depreciation and amortization | ( | ( | ( | ( | ( | ( | |||||||||||||||||||||||||||||||||||||||||||||||
| Net (loss) / gain from Fair value adjustment of investment property | |||||||||||||||||||||||||||||||||||||||||||||||||||||
| 2020 | |||||||||||||||||||||||||||||||||||||||||||||||||||||
| All other segments | Corporate | Total | |||||||||||||||||||||||||||||||||||||||||||||||||||
| Total segment reporting | Adjustment | Total as per statement of income | Total segment reporting | Adjustment | Total as per statement of income | Total segment reporting | Adjustment | Total as per statement of income | |||||||||||||||||||||||||||||||||||||||||||||
| Sales of goods sold and services rendered | ( | ( | |||||||||||||||||||||||||||||||||||||||||||||||||||
| Cost of goods and services rendered | ( | ( | ( | ( | |||||||||||||||||||||||||||||||||||||||||||||||||
| Initial recognition and changes in fair value of biological assets and agricultural produce | ( | ( | |||||||||||||||||||||||||||||||||||||||||||||||||||
| Gain from changes in net realizable value of agricultural produce after harvest | ( | ||||||||||||||||||||||||||||||||||||||||||||||||||||
| Margin on Manufacturing and Agricultural Activities Before Operating Expenses | ( | ( | |||||||||||||||||||||||||||||||||||||||||||||||||||
| General and administrative expenses | ( | ( | ( | ( | ( | ( | |||||||||||||||||||||||||||||||||||||||||||||||
| Selling expenses | ( | ( | ( | ( | ( | ( | |||||||||||||||||||||||||||||||||||||||||||||||
| Other operating income, net | ( | ( | ( | ( | ( | ||||||||||||||||||||||||||||||||||||||||||||||||
| Profit from Operations | ( | ( | ( | ( | |||||||||||||||||||||||||||||||||||||||||||||||||
| Depreciation and amortization | ( | ( | ( | ( | ( | ( | |||||||||||||||||||||||||||||||||||||||||||||||
| Net (loss) / gain from Fair value adjustment of investment property | ( | ( | |||||||||||||||||||||||||||||||||||||||||||||||||||
F- 27
Adecoagro S.A.
Notes to the Consolidated Financial Statements (Continued)
(All amounts in US$ thousands, except shares and per share data and as otherwise indicated)
3. Segment information (continued)
The following table presents information with respect to the Group’s reportable segments. Certain other activities of a holding function nature not allocable to the segments are disclosed in the column ‘Corporate’.
Segment analysis for the year ended December 31, 2022:
| Farming | Sugar, Ethanol and Energy | Land Transformation | Corporate | Total | |||||||||||||||||||||||||||||||||||||||||||||||||
| Crops | Rice | Dairy | All other segments | Farming subtotal | |||||||||||||||||||||||||||||||||||||||||||||||||
| Sales of goods and services rendered | |||||||||||||||||||||||||||||||||||||||||||||||||||||
| Cost of goods sold and services rendered | ( | ( | ( | ( | ( | ( | ( | ||||||||||||||||||||||||||||||||||||||||||||||
| Initial recognition and changes in fair value of biological assets and agricultural produce | ( | ||||||||||||||||||||||||||||||||||||||||||||||||||||
| Changes in net realizable value of agricultural produce after harvest | ( | ( | ( | ( | |||||||||||||||||||||||||||||||||||||||||||||||||
| Margin on manufacturing and agricultural activities before operating expenses | |||||||||||||||||||||||||||||||||||||||||||||||||||||
| General and administrative expenses | ( | ( | ( | ( | ( | ( | ( | ( | |||||||||||||||||||||||||||||||||||||||||||||
| Selling expenses | ( | ( | ( | ( | ( | ( | ( | ( | |||||||||||||||||||||||||||||||||||||||||||||
| Other operating income, net | ( | ( | ( | ( | ( | ||||||||||||||||||||||||||||||||||||||||||||||||
| Bargain purchase gain on acquisition | |||||||||||||||||||||||||||||||||||||||||||||||||||||
| Profit / (loss) from operations | ( | ( | |||||||||||||||||||||||||||||||||||||||||||||||||||
| Depreciation and amortization | ( | ( | ( | ( | ( | ( | ( | ||||||||||||||||||||||||||||||||||||||||||||||
| Net (loss) / gain from Fair value adjustment of investment property | ( | ( | ( | ||||||||||||||||||||||||||||||||||||||||||||||||||
| Initial recognition and changes in fair value of biological assets and agricultural produce (unrealized) | ( | ( | |||||||||||||||||||||||||||||||||||||||||||||||||||
| Initial recognition and changes in fair value of biological assets and agricultural produce (realized) | |||||||||||||||||||||||||||||||||||||||||||||||||||||
| Changes in net realizable value of agricultural produce after harvest (unrealized) | |||||||||||||||||||||||||||||||||||||||||||||||||||||
| Changes in net realizable value of agricultural produce after harvest (realized) | ( | ( | ( | ( | |||||||||||||||||||||||||||||||||||||||||||||||||
| Farmlands and farmland improvements, net | |||||||||||||||||||||||||||||||||||||||||||||||||||||
| Machinery, equipment and other fixed assets, net | |||||||||||||||||||||||||||||||||||||||||||||||||||||
| Bearer plants, net | |||||||||||||||||||||||||||||||||||||||||||||||||||||
| Work in progress | |||||||||||||||||||||||||||||||||||||||||||||||||||||
| Right of use assest | |||||||||||||||||||||||||||||||||||||||||||||||||||||
| Investment property | |||||||||||||||||||||||||||||||||||||||||||||||||||||
| Goodwill | |||||||||||||||||||||||||||||||||||||||||||||||||||||
| Biological assets | |||||||||||||||||||||||||||||||||||||||||||||||||||||
| Finished goods | |||||||||||||||||||||||||||||||||||||||||||||||||||||
| Raw materials, stocks held by third parties and others | |||||||||||||||||||||||||||||||||||||||||||||||||||||
| Total segment assets | |||||||||||||||||||||||||||||||||||||||||||||||||||||
| Borrowings | |||||||||||||||||||||||||||||||||||||||||||||||||||||
| Lease liabilities | |||||||||||||||||||||||||||||||||||||||||||||||||||||
| Total segment liabilities | |||||||||||||||||||||||||||||||||||||||||||||||||||||
F- 28
Adecoagro S.A.
Notes to the Consolidated Financial Statements (Continued)
(All amounts in US$ thousands, except shares and per share data and as otherwise indicated)
3. Segment information (continued)
Segment analysis for the year ended December 31, 2021
| Farming | Sugar, Ethanol and Energy | Land Transformation | Corporate | Total | |||||||||||||||||||||||||||||||||||||||||||||||||
| Crops | Rice | Dairy | All other segments | Farming subtotal | |||||||||||||||||||||||||||||||||||||||||||||||||
| Sales of goods and services rendered | |||||||||||||||||||||||||||||||||||||||||||||||||||||
| Cost of goods sold and services rendered | ( | ( | ( | ( | ( | ( | ( | ||||||||||||||||||||||||||||||||||||||||||||||
| Initial recognition and changes in fair value of biological assets and agricultural produce | |||||||||||||||||||||||||||||||||||||||||||||||||||||
| Changes in net realizable value of agricultural produce after harvest | ( | ( | ( | ( | |||||||||||||||||||||||||||||||||||||||||||||||||
| Margin on manufacturing and agricultural activities before operating expenses | |||||||||||||||||||||||||||||||||||||||||||||||||||||
| General and administrative expenses | ( | ( | ( | ( | ( | ( | ( | ( | |||||||||||||||||||||||||||||||||||||||||||||
| Selling expenses | ( | ( | ( | ( | ( | ( | ( | ( | |||||||||||||||||||||||||||||||||||||||||||||
| Other operating income, net | ( | ( | ( | ( | ( | ( | |||||||||||||||||||||||||||||||||||||||||||||||
| Profit / (loss) from operations | ( | ( | |||||||||||||||||||||||||||||||||||||||||||||||||||
| Depreciation and amortization | ( | ( | ( | ( | ( | ( | ( | ( | |||||||||||||||||||||||||||||||||||||||||||||
| Net (loss) / gain from Fair value adjustment of investment property | ( | ( | ( | ||||||||||||||||||||||||||||||||||||||||||||||||||
| Initial recognition and changes in fair value of biological assets and agricultural produce (unrealized) | ( | ( | |||||||||||||||||||||||||||||||||||||||||||||||||||
| Initial recognition and changes in fair value of biological assets and agricultural produce (realized) | ( | ||||||||||||||||||||||||||||||||||||||||||||||||||||
| Changes in net realizable value of agricultural produce after harvest (unrealized) | ( | ( | ( | ||||||||||||||||||||||||||||||||||||||||||||||||||
| Changes in net realizable value of agricultural produce after harvest (realized) | ( | ( | ( | ( | |||||||||||||||||||||||||||||||||||||||||||||||||
| Farmlands and farmland improvements, net | |||||||||||||||||||||||||||||||||||||||||||||||||||||
| Machinery, equipment and other fixed assets, net | |||||||||||||||||||||||||||||||||||||||||||||||||||||
| Bearer plants, net | |||||||||||||||||||||||||||||||||||||||||||||||||||||
| Work in progress | |||||||||||||||||||||||||||||||||||||||||||||||||||||
| Right of use assets | |||||||||||||||||||||||||||||||||||||||||||||||||||||
| Investment property | |||||||||||||||||||||||||||||||||||||||||||||||||||||
| Goodwill | |||||||||||||||||||||||||||||||||||||||||||||||||||||
| Biological assets | |||||||||||||||||||||||||||||||||||||||||||||||||||||
| Finished goods | |||||||||||||||||||||||||||||||||||||||||||||||||||||
| Raw materials, stocks held by third parties and others | |||||||||||||||||||||||||||||||||||||||||||||||||||||
| Total segment assets | |||||||||||||||||||||||||||||||||||||||||||||||||||||
| Borrowings | |||||||||||||||||||||||||||||||||||||||||||||||||||||
| Lease liabilities | |||||||||||||||||||||||||||||||||||||||||||||||||||||
| Total segment liabilities | |||||||||||||||||||||||||||||||||||||||||||||||||||||
F- 29
Adecoagro S.A.
Notes to the Consolidated Financial Statements (Continued)
(All amounts in US$ thousands, except shares and per share data and as otherwise indicated)
3. Segment information (continued)
Segment analysis for the year ended December 31, 2020
| Farming | Sugar, Ethanol and Energy | Land Transformation | Corporate | Total | |||||||||||||||||||||||||||||||||||||||||||||||||
| Crops | Rice | Dairy | All other segments | Farming subtotal | |||||||||||||||||||||||||||||||||||||||||||||||||
| Sales of goods and services rendered | |||||||||||||||||||||||||||||||||||||||||||||||||||||
| Cost of goods sold and services rendered | ( | ( | ( | ( | ( | ( | ( | ||||||||||||||||||||||||||||||||||||||||||||||
| Initial recognition and changes in fair value of biological assets and agricultural produce | |||||||||||||||||||||||||||||||||||||||||||||||||||||
| Changes in net realizable value of agricultural produce after harvest | ( | ||||||||||||||||||||||||||||||||||||||||||||||||||||
| Margin on manufacturing and agricultural activities before operating expenses | |||||||||||||||||||||||||||||||||||||||||||||||||||||
| General and administrative expenses | ( | ( | ( | ( | ( | ( | ( | ( | |||||||||||||||||||||||||||||||||||||||||||||
| Selling expenses | ( | ( | ( | ( | ( | ( | ( | ( | |||||||||||||||||||||||||||||||||||||||||||||
| Other operating income, net | ( | ( | ( | ( | |||||||||||||||||||||||||||||||||||||||||||||||||
| Profit / (loss) from operations | ( | ||||||||||||||||||||||||||||||||||||||||||||||||||||
| Depreciation and amortization | ( | ( | ( | ( | ( | ( | ( | ( | |||||||||||||||||||||||||||||||||||||||||||||
| Net (loss) / gain from Fair value adjustment of investment property | |||||||||||||||||||||||||||||||||||||||||||||||||||||
| Initial recognition and changes in fair value of biological assets and agricultural produce (unrealized) | ( | ||||||||||||||||||||||||||||||||||||||||||||||||||||
| Initial recognition and changes in fair value of biological assets and agricultural produce (realized) | ( | ||||||||||||||||||||||||||||||||||||||||||||||||||||
| Changes in net realizable value of agricultural produce after harvest (unrealized) | ( | ( | ( | ||||||||||||||||||||||||||||||||||||||||||||||||||
| Changes in net realizable value of agricultural produce after harvest (realized) | ( | ||||||||||||||||||||||||||||||||||||||||||||||||||||
Total segment assets and liabilities are measured in a manner consistent with that of the Consolidated Financial Statements. These assets and liabilities are allocated based on the operations of the segment and the physical location of the asset.
F- 30
Adecoagro S.A.
Notes to the Consolidated Financial Statements (Continued)
(All amounts in US$ thousands, except shares and per share data and as otherwise indicated)
3. Segment information (continued)
Total reportable segments’ assets and liabilities are reconciled to total assets as per the statement of financial position as follows:
| 2022 | 2021 | ||||||||||
| Total reportable assets as per segment information | |||||||||||
| Intangible assets (excluding goodwill) | |||||||||||
| Deferred income tax assets | |||||||||||
| Trade and other receivables | |||||||||||
| Other assets | |||||||||||
| Derivative financial instruments | |||||||||||
| Restricted short-term investment | |||||||||||
| Cash and cash equivalents | |||||||||||
| Total assets as per the statement of financial position | |||||||||||
| 2022 | 2021 | ||||||||||
| Total reportable liabilities as per segment information | |||||||||||
| Trade and other payables | |||||||||||
| Deferred income tax liabilities | |||||||||||
| Payroll and social liabilities | |||||||||||
| Provisions for other liabilities | |||||||||||
| Current income tax liabilities | |||||||||||
| Derivative financial instruments | |||||||||||
| Total liabilities as per the statement of financial position | |||||||||||
Non-current assets and revenues and fair value gains and losses are shown by geographic region. These are the regions in which the Group is active: Argentina, Brazil, Uruguay and others.
As of and for the year ended December 31, 2022:
| Argentina | Brazil | Uruguay | Others (*) | Total | |||||||||||||||||||||||||
| Property, plant and equipment | |||||||||||||||||||||||||||||
| Investment property | |||||||||||||||||||||||||||||
| Goodwill | |||||||||||||||||||||||||||||
| Non-current portion of biological assets | |||||||||||||||||||||||||||||
| Sales of goods and services rendered | |||||||||||||||||||||||||||||
| Initial recognition and changes in fair value of biological assets and agricultural produce | |||||||||||||||||||||||||||||
| Changes in net realizable value of agricultural produce after harvest | ( | ( | ( | ( | |||||||||||||||||||||||||
F- 31
Adecoagro S.A.
Notes to the Consolidated Financial Statements (Continued)
(All amounts in US$ thousands, except shares and per share data and as otherwise indicated)
3. Segment information (continued)
As of and for the year ended December 31, 2021:
| Argentina | Brazil | Uruguay | Others (*) | Total | |||||||||||||||||||||||||
| Property, plant and equipment | |||||||||||||||||||||||||||||
| Investment property | |||||||||||||||||||||||||||||
| Goodwill | |||||||||||||||||||||||||||||
| Non-current portion of biological assets | |||||||||||||||||||||||||||||
| Sales of goods and services rendered | |||||||||||||||||||||||||||||
| Initial recognition and changes in fair value of biological assets and agricultural produce | |||||||||||||||||||||||||||||
| Changes in net realizable value of agricultural produce after harvest | ( | ( | ( | ( | |||||||||||||||||||||||||
(*) It includes the initial operations in Chile which are not disclosed separately on materiality grounds.
As of and for the year ended December 31, 2020:
| Argentina | Brazil | Uruguay | Total | ||||||||||||||||||||
| Sales of goods and services rendered | |||||||||||||||||||||||
| Initial recognition and changes in fair value of biological assets and agricultural produce | |||||||||||||||||||||||
| Changes in net realizable value of agricultural produce after harvest | ( | ||||||||||||||||||||||
F- 32
Adecoagro S.A.
Notes to the Consolidated Financial Statements (Continued)
(All amounts in US$ thousands, except shares and per share data and as otherwise indicated)
4. Sales
| 2022 | 2021 | 2020 | |||||||||||||||
| Manufactured products and services rendered: | |||||||||||||||||
| Ethanol | |||||||||||||||||
| Sugar | |||||||||||||||||
Energy (*) | |||||||||||||||||
| Peanut | |||||||||||||||||
| Sunflower | |||||||||||||||||
| Cotton | |||||||||||||||||
Rice (*) | |||||||||||||||||
| Fluid milk (UHT) | |||||||||||||||||
Powder milk (*) | |||||||||||||||||
| Other diary products | |||||||||||||||||
| Services | |||||||||||||||||
| Rental income | |||||||||||||||||
| Others | |||||||||||||||||
| Agricultural produce and biological assets: | |||||||||||||||||
| Soybean | |||||||||||||||||
| Corn | |||||||||||||||||
| Wheat | |||||||||||||||||
| Rice | |||||||||||||||||
| Sunflower | |||||||||||||||||
| Barley | |||||||||||||||||
| Seeds | |||||||||||||||||
| Raw milk | |||||||||||||||||
| Cattle | |||||||||||||||||
| Cattle for dairy | |||||||||||||||||
| Others | |||||||||||||||||
| Total sales | |||||||||||||||||
(*) Includes sales of energy, rice and powder milk produced by third parties for an amount of US$ 4.5 million. (sales of rice, energy and butter for an amount of US$ 11.5 million and US$ 13.9 million for the years 2021 and 2020 respectively).
Commitments to sell commodities at a future date
The Group entered into contracts to sell non-financial instruments, mainly sugar, soybean and corn through sales forward contracts. Those contracts are held for purposes of delivery of the non-financial instrument in accordance with the Group’s expected sales. Accordingly, as the own use exception criteria are met, those contracts are not recorded as derivatives.
The notional amount of these contracts is US$89.9 million as of December 31, 2022 (2021: US$75.9 million; 2020: US$42.2 million) and comprised primarily of 34,879 thousand tons of sugar (US$ 26.1 million), 34,905 thousand m3 of ethanol (US$21.5 million), 543,795 thousand mwh of energy (US$28.8 million), 5,498 thousand tons of soybean (US$2.0 million), 15,051 thousand tons of wheat (US$5.1 million), and 16,112 thousand tons of corn (US$3.5 million) which expire between January and December 2023.
F- 33
Adecoagro S.A.
Notes to the Consolidated Financial Statements (Continued)
(All amounts in US$ thousands, except shares and per share data and as otherwise indicated)
5. Cost of goods sold and services rendered
For the year ended December 31:
| 2022 | |||||||||||||||||||||||||||||||||||
| Crops | Rice | Dairy | All other segments | Sugar, Ethanol and Energy | Total | ||||||||||||||||||||||||||||||
| Finished goods at the beginning of year (Note 19) | |||||||||||||||||||||||||||||||||||
| Cost of production of manufactured products (Note 6) | |||||||||||||||||||||||||||||||||||
| Purchases | |||||||||||||||||||||||||||||||||||
| Acquisition of subsidiaries | |||||||||||||||||||||||||||||||||||
| Agricultural produce | |||||||||||||||||||||||||||||||||||
| Transfer to raw material | ( | ( | ( | ||||||||||||||||||||||||||||||||
| Direct agricultural selling expenses | |||||||||||||||||||||||||||||||||||
| Tax recoveries (i) | ( | ( | |||||||||||||||||||||||||||||||||
| Changes in net realizable value of agricultural produce after harvest | ( | ( | ( | ||||||||||||||||||||||||||||||||
| Loss of idle capacity | |||||||||||||||||||||||||||||||||||
| Finished goods at the end of the year (Note 19) | ( | ( | ( | ( | ( | ||||||||||||||||||||||||||||||
| Exchange differences | ( | ( | |||||||||||||||||||||||||||||||||
| Cost of goods sold and services rendered | |||||||||||||||||||||||||||||||||||
(i) Correspond to the presumed credit of ICMS (Imposto sobre Circulação de Mercadorias e Prestação de Serviços) over the sale values.
For the year ended December 31:
| 2021 | |||||||||||||||||||||||||||||||||||
| Crops | Rice | Dairy | All other segments | Sugar, Ethanol and Energy | Total | ||||||||||||||||||||||||||||||
| Finished goods at the beginning of year | |||||||||||||||||||||||||||||||||||
| Cost of production of manufactured products (Note 6) | |||||||||||||||||||||||||||||||||||
| Purchases | |||||||||||||||||||||||||||||||||||
| Agricultural produce | |||||||||||||||||||||||||||||||||||
| Transfer to raw material | ( | ( | ( | ||||||||||||||||||||||||||||||||
| Direct agricultural selling expenses | |||||||||||||||||||||||||||||||||||
| Tax recoveries (i) | ( | ( | |||||||||||||||||||||||||||||||||
| Changes in net realizable value of agricultural produce after harvest | ( | ( | ( | ||||||||||||||||||||||||||||||||
| Loss of idle capacity | |||||||||||||||||||||||||||||||||||
| Finished goods at the end of the year (Note 19) | ( | ( | ( | ( | ( | ||||||||||||||||||||||||||||||
| Exchange differences | ( | ( | ( | ( | ( | ||||||||||||||||||||||||||||||
| Cost of goods sold and services rendered | |||||||||||||||||||||||||||||||||||
(i) Correspond to the presumed credit of ICMS (Imposto sobre Circulação de Mercadorias e Prestação de Serviços) over the sale values.
F- 34
Adecoagro S.A.
Notes to the Consolidated Financial Statements (Continued)
(All amounts in US$ thousands, except shares and per share data and as otherwise indicated)
5. Cost of goods sold and services rendered (continued)
For the year ended December 31:
| 2020 | |||||||||||||||||||||||||||||||||||
| Crops | Rice | Dairy | All other segments | Sugar, Ethanol and Energy | Total | ||||||||||||||||||||||||||||||
| Finished goods at the beginning of year | |||||||||||||||||||||||||||||||||||
| Cost of production of manufactured products (Note 6) | |||||||||||||||||||||||||||||||||||
| Purchases | |||||||||||||||||||||||||||||||||||
| Agricultural produce | |||||||||||||||||||||||||||||||||||
| Transfer to raw material | ( | ( | ( | ||||||||||||||||||||||||||||||||
| Direct agricultural selling expenses | |||||||||||||||||||||||||||||||||||
| Tax recoveries (i) | ( | ( | |||||||||||||||||||||||||||||||||
| Changes in net realizable value of agricultural produce after harvest | ( | ||||||||||||||||||||||||||||||||||
| Finished goods at the end of the year (Note 19) | ( | ( | ( | ( | ( | ||||||||||||||||||||||||||||||
| Exchange differences | ( | ( | ( | ( | ( | ||||||||||||||||||||||||||||||
| Cost of goods sold and services rendered | |||||||||||||||||||||||||||||||||||
(i) Correspond to the presumed credit of ICMS (Imposto sobre Circulação de Mercadorias e Prestação de Serviços) over the sale values.
F- 35
Adecoagro S.A.
Notes to the Consolidated Financial Statements (Continued)
(All amounts in US$ thousands, except shares and per share data and as otherwise indicated)
6. Expenses by nature
The statement of income is presented under the function of expense method. Under this method, expenses are classified according to their function as “cost of goods sold and services rendered," “general and administrative expenses” and “selling expenses”.
The following table provides the additional disclosure required on the nature of expenses and their relationship to the function within the Group:
Expenses by nature for the year ended December 31, 2022:
| Cost of production of manufactured products (Note 5) | General and Administrative Expenses | Selling Expenses | Total | ||||||||||||||||||||||||||||||||||||||||||||
| Crops | Rice | Dairy | Sugar, Ethanol and Energy | Total | |||||||||||||||||||||||||||||||||||||||||||
| Salaries, social security expenses and employee benefits | |||||||||||||||||||||||||||||||||||||||||||||||
| Raw materials and consumables | |||||||||||||||||||||||||||||||||||||||||||||||
| Depreciation and amortization | |||||||||||||||||||||||||||||||||||||||||||||||
| Depreciation of right of use assets | |||||||||||||||||||||||||||||||||||||||||||||||
| Fuel, lubricants and others | |||||||||||||||||||||||||||||||||||||||||||||||
| Maintenance and repairs | |||||||||||||||||||||||||||||||||||||||||||||||
| Freights | |||||||||||||||||||||||||||||||||||||||||||||||
| Export taxes / selling taxes | |||||||||||||||||||||||||||||||||||||||||||||||
| Export expenses | |||||||||||||||||||||||||||||||||||||||||||||||
| Contractors and services | |||||||||||||||||||||||||||||||||||||||||||||||
| Energy transmission | |||||||||||||||||||||||||||||||||||||||||||||||
| Energy power | |||||||||||||||||||||||||||||||||||||||||||||||
| Professional fees | |||||||||||||||||||||||||||||||||||||||||||||||
| Other taxes | |||||||||||||||||||||||||||||||||||||||||||||||
| Contingencies | |||||||||||||||||||||||||||||||||||||||||||||||
| Lease expense and similar arrangements | |||||||||||||||||||||||||||||||||||||||||||||||
| Third parties raw materials | |||||||||||||||||||||||||||||||||||||||||||||||
| Tax recoveries | ( | ( | ( | ||||||||||||||||||||||||||||||||||||||||||||
| Others | |||||||||||||||||||||||||||||||||||||||||||||||
| Subtotal | |||||||||||||||||||||||||||||||||||||||||||||||
| Own agricultural produce consumed | |||||||||||||||||||||||||||||||||||||||||||||||
| Total | |||||||||||||||||||||||||||||||||||||||||||||||
F- 36
Adecoagro S.A.
Notes to the Consolidated Financial Statements (Continued)
(All amounts in US$ thousands, except shares and per share data and as otherwise indicated)
6. Expenses by nature (continued)
Expenses by nature for the year ended December 31, 2021:
| Cost of production of manufactured products (Note 5) | General and Administrative Expenses | Selling Expenses | Total | ||||||||||||||||||||||||||||||||||||||||||||
| Crops | Rice | Dairy | Sugar, Ethanol and Energy | Total | |||||||||||||||||||||||||||||||||||||||||||
| Salaries, social security expenses and employee benefits | |||||||||||||||||||||||||||||||||||||||||||||||
| Raw materials and consumables | |||||||||||||||||||||||||||||||||||||||||||||||
| Depreciation and amortization | |||||||||||||||||||||||||||||||||||||||||||||||
| Depreciation of right of use assets | |||||||||||||||||||||||||||||||||||||||||||||||
| Fuel, lubricants and others | |||||||||||||||||||||||||||||||||||||||||||||||
| Maintenance and repairs | |||||||||||||||||||||||||||||||||||||||||||||||
| Freights | |||||||||||||||||||||||||||||||||||||||||||||||
| Export taxes / selling taxes | |||||||||||||||||||||||||||||||||||||||||||||||
| Export expenses | |||||||||||||||||||||||||||||||||||||||||||||||
| Contractors and services | |||||||||||||||||||||||||||||||||||||||||||||||
| Energy transmission | |||||||||||||||||||||||||||||||||||||||||||||||
| Energy power | |||||||||||||||||||||||||||||||||||||||||||||||
| Professional fees | |||||||||||||||||||||||||||||||||||||||||||||||
| Other taxes | |||||||||||||||||||||||||||||||||||||||||||||||
| Contingencies | |||||||||||||||||||||||||||||||||||||||||||||||
| Lease expense and similar arrangements | |||||||||||||||||||||||||||||||||||||||||||||||
| Third parties raw materials | |||||||||||||||||||||||||||||||||||||||||||||||
| Tax recoveries | ( | ( | ( | ||||||||||||||||||||||||||||||||||||||||||||
| Others | |||||||||||||||||||||||||||||||||||||||||||||||
| Subtotal | |||||||||||||||||||||||||||||||||||||||||||||||
| Own agricultural produce consumed | |||||||||||||||||||||||||||||||||||||||||||||||
| Total | |||||||||||||||||||||||||||||||||||||||||||||||
F- 37
Adecoagro S.A.
Notes to the Consolidated Financial Statements (Continued)
(All amounts in US$ thousands, except shares and per share data and as otherwise indicated)
6. Expenses by nature (continued)
Expenses by nature for the year ended December 31, 2020:
| Cost of production of manufactured products (Note 5) | |||||||||||||||||||||||||||||||||||||||||||||||
| Crops | Rice | Dairy | Sugar, Ethanol and Energy | Total | General and Administrative Expenses | Selling Expenses | Total | ||||||||||||||||||||||||||||||||||||||||
| Salaries, social security expenses and employee benefits | |||||||||||||||||||||||||||||||||||||||||||||||
| Raw materials and consumables | |||||||||||||||||||||||||||||||||||||||||||||||
| Depreciation and amortization | |||||||||||||||||||||||||||||||||||||||||||||||
| Depreciation right-of-use and other leases | |||||||||||||||||||||||||||||||||||||||||||||||
| Fuel, lubricants and others | |||||||||||||||||||||||||||||||||||||||||||||||
| Maintenance and repairs | |||||||||||||||||||||||||||||||||||||||||||||||
| Freights | |||||||||||||||||||||||||||||||||||||||||||||||
| Export taxes / selling taxes | |||||||||||||||||||||||||||||||||||||||||||||||
| Export expenses | |||||||||||||||||||||||||||||||||||||||||||||||
| Contractors and services | |||||||||||||||||||||||||||||||||||||||||||||||
| Energy transmission | |||||||||||||||||||||||||||||||||||||||||||||||
| Energy power | |||||||||||||||||||||||||||||||||||||||||||||||
| Professional fees | |||||||||||||||||||||||||||||||||||||||||||||||
| Other taxes | |||||||||||||||||||||||||||||||||||||||||||||||
| Contingencies | |||||||||||||||||||||||||||||||||||||||||||||||
| Lease expense and similar arrangements | |||||||||||||||||||||||||||||||||||||||||||||||
| Third parties raw materials | |||||||||||||||||||||||||||||||||||||||||||||||
| Tax recoveries | ( | ( | ( | ||||||||||||||||||||||||||||||||||||||||||||
| Others | |||||||||||||||||||||||||||||||||||||||||||||||
| Subtotal | |||||||||||||||||||||||||||||||||||||||||||||||
| Own agricultural produce consumed | |||||||||||||||||||||||||||||||||||||||||||||||
| Total | |||||||||||||||||||||||||||||||||||||||||||||||
7. Salaries and social security expenses
| 2022 | 2021 | 2020 | |||||||||||||||
| Wages and salaries (i) | |||||||||||||||||
| Social security costs | |||||||||||||||||
| Equity-settled share-based compensation | |||||||||||||||||
(i)Includes US$30,014 , US$25,105 and US$32,714 , capitalized in Property, Plant and Equipment for the years 2022, 2021 and 2020, respectively.
F- 38
Adecoagro S.A.
Notes to the Consolidated Financial Statements (Continued)
(All amounts in US$ thousands, except shares and per share data and as otherwise indicated)
8. Other operating (expense) / income, net
| 2022 | 2021 | 2020 | |||||||||||||||
| Loss from commodity derivative financial instrument | ( | ( | ( | ||||||||||||||
| Gain / (loss) from disposal of other property items | ( | ||||||||||||||||
| Net (loss) / gain from fair value adjustment of investment property | ( | ( | |||||||||||||||
| Gain from disposal of farmland and other assets (Note 21) | |||||||||||||||||
| Gain / (loss) from the sale of subsidiaries (Note 21) | ( | ||||||||||||||||
| Others | |||||||||||||||||
| ( | |||||||||||||||||
9. Financial results, net
| 2022 | 2021 | 2020 | |||||||||||||||
| Finance income: | |||||||||||||||||
| - Interest income | |||||||||||||||||
| -Foreign exchange gains, net | |||||||||||||||||
| - Gain from interest rate/foreign exchange rate derivative financial instruments | |||||||||||||||||
| - Other income | |||||||||||||||||
| Finance income | |||||||||||||||||
| Finance costs: | |||||||||||||||||
| - Interest expense | ( | ( | ( | ||||||||||||||
| - Finance cost related to lease liabilities | ( | ( | ( | ||||||||||||||
| - Cash flow hedge – transfer from equity (Note 2) | ( | ( | ( | ||||||||||||||
| - Foreign exchange losses, net | ( | ||||||||||||||||
| - Taxes | ( | ( | ( | ||||||||||||||
| - Loss from interest rate/foreign exchange rate derivative financial instruments | ( | ||||||||||||||||
| - Borrowings prepayment related expenses (Brazilian subsidiaries) | ( | ||||||||||||||||
| -Finance discount | ( | ||||||||||||||||
| - Other expenses | ( | ( | ( | ||||||||||||||
| Finance costs | ( | ( | ( | ||||||||||||||
| Other financial results - Net (loss) / gain of inflation effects on monetary items | ( | ||||||||||||||||
| Total financial results, net | ( | ( | ( | ||||||||||||||
10. Taxation
Adecoagro is subject to the applicable general tax regulations in Luxembourg.
The Group’s income tax has been calculated on the estimated assessable taxable results for the year at the rates prevailing in the respective foreign tax jurisdictions. The subsidiaries of the Group are required to calculate their income taxes on a separate basis according to the rules and regulations of the jurisdictions where they operate. Therefore, the Group is not legally permitted to compensate subsidiaries’ losses against subsidiaries’ income. The details of the provision for the Group’s consolidated income tax are as follows:
F- 39
Adecoagro S.A.
Notes to the Consolidated Financial Statements (Continued)
(All amounts in US$ thousands, except shares and per share data and as otherwise indicated)
10. Taxation (continued)
| 2022 | 2021 | 2020 | |||||||||||||||
| Current income tax | ( | ( | ( | ||||||||||||||
| Deferred income tax | ( | ( | ( | ||||||||||||||
| Income tax expense | ( | ( | ( | ||||||||||||||
The statutory tax rate in the countries where the Group operates for all of the years presented are:
| Tax Jurisdiction | Income Tax Rate | |||||||
| Argentina (i) | % | |||||||
| Brazil | % | |||||||
| Uruguay | % | |||||||
| Spain | % | |||||||
| Luxembourg | % | |||||||
| Chile | % | |||||||
(i) In June 2021, the Argentine Government introduced changes to the income tax laws whereby it established an increasing rate scheme starting at 25% up to 35% for income tax gains over Pesos 76 million (0.4 million US$). The revised scheme was effective as from fiscal year 2021. It also established a 7% withholding tax for dividends.
Deferred tax assets and liabilities of the Group as of December 31, 2022 and 2021, without taking into consideration the offsetting of balances within the same tax jurisdiction, will be recovered or settled as follows:
| 2022 | 2021 | ||||||||||
| Deferred income tax asset to be recovered after more than 12 months | |||||||||||
| Deferred income tax asset to be recovered within 12 months | |||||||||||
| Deferred income tax assets | |||||||||||
| Deferred income tax liability to be settled after more than 12 months | ( | ( | |||||||||
| Deferred income tax liability to be settled within 12 months | ( | ( | |||||||||
| Deferred income tax liability | ( | ( | |||||||||
| Deferred income tax liability, net | ( | ( | |||||||||
The gross movement on the deferred income tax account is as follows:
| 2022 | 2021 | ||||||||||
| Beginning of year | ( | ( | |||||||||
| Exchange differences | ( | ( | |||||||||
| Changes of fair value valuation for farmlands | ( | ||||||||||
| Acquisition of subsidiary (Note 21) | ( | ||||||||||
| Others | ( | ( | |||||||||
| Tax credit relating to cash flow hedge (i) | ( | ( | |||||||||
| Income tax expense | ( | ( | |||||||||
| End of year | ( | ( | |||||||||
(i) Relates to the gain or loss before income tax of cash flow hedge recognized in other comprehensive income amounting to US$15,621 for the year ended December 31, 2022 (2021: US$46,145 ; 2020: US$75,822 ); net of the reclassification from Equity to the Income Statement of US$ 40,388 for the year ended December 31, 2022 (2021: US$ 26,031 ; 2020: US$32,305 ).
F- 40
Adecoagro S.A.
Notes to the Consolidated Financial Statements (Continued)
(All amounts in US$ thousands, except shares and per share data and as otherwise indicated)
10. Taxation (continued)
The movement in the deferred income tax assets and liabilities during the year, without taking into consideration the offsetting of balances within the same tax jurisdiction, is as follows:
| Deferred income tax liabilities | Property, plant and equipment | Investment property | Biological assets | Others | Total | |||||||||||||||||||||||||||
| At January 1, 2021 | ||||||||||||||||||||||||||||||||
| Charged / (credited) to the statement of income | ( | ( | ( | |||||||||||||||||||||||||||||
| Farmlands revaluation | ( | |||||||||||||||||||||||||||||||
| Exchange differences | ||||||||||||||||||||||||||||||||
| At December 31, 2021 | ||||||||||||||||||||||||||||||||
| Charged / (credited) to the statement of income | ( | |||||||||||||||||||||||||||||||
| Farmlands revaluation | ( | ( | ( | |||||||||||||||||||||||||||||
| Acquisition of subsidiaries | ||||||||||||||||||||||||||||||||
| Exchange differences | ||||||||||||||||||||||||||||||||
| At December 31, 2022 | ||||||||||||||||||||||||||||||||
| Deferred income tax assets | Provisions | Tax loss carry forwards | Equity-settled share-based compensation | Borrowings | Biological assets | Others | Total | |||||||||||||||||||||||||||||||||||||
| At January 1, 2021 | ||||||||||||||||||||||||||||||||||||||||||||
| Charged / (credited) to the statement of income | ( | ( | ||||||||||||||||||||||||||||||||||||||||||
| Tax charge relating to cash flow hedge | ( | ( | ||||||||||||||||||||||||||||||||||||||||||
| Exchange differences | ( | ( | ( | ( | ||||||||||||||||||||||||||||||||||||||||
| Others | ( | ( | ||||||||||||||||||||||||||||||||||||||||||
| At December 31, 2021 | ( | |||||||||||||||||||||||||||||||||||||||||||
| (Credited) / charged to the statement of income | ( | ( | ( | |||||||||||||||||||||||||||||||||||||||||
| Tax charge relating to cash flow hedge | ( | ( | ||||||||||||||||||||||||||||||||||||||||||
| Exchange differences | ||||||||||||||||||||||||||||||||||||||||||||
| Others | ( | ( | ||||||||||||||||||||||||||||||||||||||||||
| At December 31, 2022 | ( | |||||||||||||||||||||||||||||||||||||||||||
Tax loss carry forwards in Argentina and Uruguay generally expire within 5 30 %.
In order to fully realize the deferred tax asset, the Group will need to generate future taxable income in the countries where the tax loss carry forward were incurred. Based upon the level of historical taxable income and projections for future taxable income over the periods in which the deferred tax assets are deductible
.
F- 41
Adecoagro S.A.
Notes to the Consolidated Financial Statements (Continued)
(All amounts in US$ thousands, except shares and per share data and as otherwise indicated)
10. Taxation (continued)
As of December 31, 2022, the Group’s tax loss carry forwards and their corresponding jurisdictions are as follows:
| Jurisdiction | Tax loss carry forward | Expiration period | ||||||||||||
| Argentina (1) | ||||||||||||||
| Brazil | No expiration date. | |||||||||||||
| Uruguay | ||||||||||||||
| Luxembourg | No expiration date. | |||||||||||||
(1) As of December 31, 2022, the aging of the determination tax loss carry forward in Argentina is as follows:
| Year of generation | Amount | |||||||
| 2018 | ||||||||
| 2019 | ||||||||
| 2020 | ||||||||
| 2021 | ||||||||
| 2022 | ||||||||
The tax on the Group’s profit before income tax differs from the theoretical amount that would arise using the tax rates applicable to profits in the respective countries as follows:
| 2022 | 2021 | 2020 | |||||||||||||||
| Tax calculated at the tax rates applicable to profits in the respective countries | ( | ( | ( | ||||||||||||||
| Non-deductible items | ( | ( | ( | ||||||||||||||
| Effect of the changes in the statutory income tax rate in Argentina | ( | ( | |||||||||||||||
| Unused tax losses | ( | ||||||||||||||||
| Tax losses where no deferred tax asset was recognized | ( | ||||||||||||||||
| Non-taxable income | |||||||||||||||||
Previously unrecognized tax losses now recouped to reduce tax expenses (1) | |||||||||||||||||
| Effect of IAS 29 and tax adjustment per inflation in Argentina | ( | ( | ( | ||||||||||||||
| Others | |||||||||||||||||
| Income tax expense | ( | ( | ( | ||||||||||||||
(1) 2022 includes 16,044 of adjustment by inflation of tax loss carryforwards in Argentina (37,175 in 2021).
Tax Inflation Adjustment in Argentina
Laws 27,430, 27,468 and 27,541 introduced several amendments to the income tax inflation adjustments provided by t.he Income Tax Law. According to these provisions, and effective as from fiscal years beginning on or after January 1, 2018, the inflation adjustment procedure set out in Title VI of the Income Tax Law shall be applicable in fiscal years in which the variation of IPC price index, accumulated in the 36 months immediately preceding the end of the relevant fiscal year, is higher than 100%. As from its effectiveness, this procedure is applicable because the variation of the IPC reached the prescribed limits.
However, Section 39 of Law No. 24,073 suspended the application of the provisions of Title VI of the Income Tax Law relating to the income tax inflation adjustment since April 1, 1992 to certain items, such as, fixed assets, inventory, and tax loss carryforwards, among others.
F- 42
Adecoagro S.A.
Notes to the Consolidated Financial Statements (Continued)
(All amounts in US$ thousands, except shares and per share data and as otherwise indicated)
10. Taxation (continued)
After the economic crisis of 2002, many taxpayers began to question the legality of the provisions suspending the income tax inflation adjustment. Also, the Argentine Supreme Court of Justice issued its verdict in the "Candy" case July 3, 2009 in which it stated that particularly for fiscal year 2002 and considering the serious state of disturbance of that year, the taxpayer could demonstrate that not applying the income tax inflation adjustment resulted in confiscatory income tax rates.
More recently, the Argentine Supreme Court of Justice applied a similar criterion to the 2010, 2011, 2012 and 2014 fiscal years in the cases brought by “Distribuidora Gas del Centro” (10/14/14, 06/02/15, 10/04/16 and 06/25/19), among others, enabling the application of income tax inflation adjustment for periods not affected by a severe economic crisis such as 2002.
The Company believes that the lack of application of the income tax inflation adjustment is confiscatory. Accordingly, based on the precedents and the opinion of external and internal tax advisors, the Company has adjusted all items for inflation including those suspended by Section 39 of Law 24, 073 as described above. The net effect of the inflation adjustment resulted in a deferred tax asset of US$53.2 million as of December 31, 2022.
The application of local tax laws require interpretation, and accordingly involves the application of judgement and is open to challenge by the relevant tax authorities. This gives rise to a level of uncertainty. Provisions for uncertain tax positions are established in accordance with IFRIC 23 based on an assessment of the range of likely tax outcomes in open years and reflecting the strength of technical arguments. Amounts are provided for individual tax uncertainties based on management’s assessment of whether the most likely amount or an expected amount based on a probability weighted methodology is the more appropriate predicter of amounts that the Company is ultimately expected to settle. When making this assessment, the Company utilizes specialist in-house tax knowledge and experience and takes into consideration specialist tax advice from third party advisers on specific items. The Company has not provided any amount in this case based on its belief that it has solid arguments to support its position.
F- 43
Adecoagro S.A.
Notes to the Consolidated Financial Statements (Continued)
(All amounts in US$ thousands, except shares and per share data and as otherwise indicated)
11. Earnings per share
(a) Basic
Basic earnings per share is calculated by dividing the profit attributable to equity holders of the Group by the weighted average number of shares in issue during the period excluding ordinary shares held as treasury shares (Note 23).
| 2022 | 2021 | 2020 | |||||||||||||||
| Profit from operations attributable to equity holders of the Group | |||||||||||||||||
| Weighted average number of shares in issue (thousands) | |||||||||||||||||
| Basic earnings per share | |||||||||||||||||
(b) Diluted
Diluted earnings per share is calculated by adjusting the weighted average number of shares outstanding to assume conversion of all dilutive potential shares. The Group has two categories of dilutive potential shares: equity-settled share options and restricted units. For these instruments, a calculation is done to determine the number of shares that could have been acquired at fair value, based on the monetary value of the subscription rights attached to outstanding share options. The number of shares calculated as above is compared with the number of shares that would have been issued assuming the exercise of the equity-settled share options. During 2022, the share options outstanding average were 361 thousands (2021: 466 thousands; 2020: 261 thousands) share options outstanding.
| 2022 | 2021 | 2020 | |||||||||||||||
| Profit from operations attributable to equity holders of the Group | |||||||||||||||||
| Weighted average number of shares in issue (thousands) | |||||||||||||||||
| Adjustments for: | |||||||||||||||||
| - Employee share options and restricted units (thousands) | |||||||||||||||||
| Weighted average number of shares for diluted earnings per share (thousands) | |||||||||||||||||
| Diluted earnings per share | |||||||||||||||||
F- 44
Adecoagro S.A.
Notes to the Consolidated Financial Statements (Continued)
(All amounts in US$ thousands, except shares and per share data and as otherwise indicated)
12. Property, plant and equipment, net
Changes in the Group’s property, plant and equipment, net in 2022 and 2021 were as follows:
| Farmlands | Farmland improvements | Buildings and facilities | Machinery, equipment, furniture and fittings | Bearer plants | Others | Work in progress | Total | ||||||||||||||||||||||||||||||||||||||||
| At January 1, 2021 | |||||||||||||||||||||||||||||||||||||||||||||||
| Fair value for farmlands / Cost | |||||||||||||||||||||||||||||||||||||||||||||||
| Accumulated depreciation | ( | ( | ( | ( | ( | ( | |||||||||||||||||||||||||||||||||||||||||
| Net book amount | |||||||||||||||||||||||||||||||||||||||||||||||
| At December 31, 2021 | |||||||||||||||||||||||||||||||||||||||||||||||
| Opening net book amount | |||||||||||||||||||||||||||||||||||||||||||||||
| Exchange differences | ( | ( | |||||||||||||||||||||||||||||||||||||||||||||
| Additions | |||||||||||||||||||||||||||||||||||||||||||||||
| Revaluation surplus | ( | ( | |||||||||||||||||||||||||||||||||||||||||||||
| Reclassification from investment property | |||||||||||||||||||||||||||||||||||||||||||||||
| Transfers | ( | ( | |||||||||||||||||||||||||||||||||||||||||||||
| Disposals | ( | ( | ( | ( | ( | ( | |||||||||||||||||||||||||||||||||||||||||
| Reclassification to non-income tax credits (*) | ( | ( | |||||||||||||||||||||||||||||||||||||||||||||
| Depreciation | ( | ( | ( | ( | ( | ( | |||||||||||||||||||||||||||||||||||||||||
| Closing net book amount | |||||||||||||||||||||||||||||||||||||||||||||||
| Farmlands | Farmland improvements | Buildings and facilities | Machinery, equipment, furniture and fittings | Bearer plants | Others | Work in progress | Total | ||||||||||||||||||||||||||||||||||||||||
| At December 31, 2021 | |||||||||||||||||||||||||||||||||||||||||||||||
| Fair value for farmlands / Cost | |||||||||||||||||||||||||||||||||||||||||||||||
| Accumulated depreciation | ( | ( | ( | ( | ( | ( | |||||||||||||||||||||||||||||||||||||||||
| Net book amount | |||||||||||||||||||||||||||||||||||||||||||||||
| Year ended December 31, 2022 | |||||||||||||||||||||||||||||||||||||||||||||||
| Opening net book amount | |||||||||||||||||||||||||||||||||||||||||||||||
| Exchange differences | |||||||||||||||||||||||||||||||||||||||||||||||
| Additions | |||||||||||||||||||||||||||||||||||||||||||||||
| Revaluation surplus | ( | ( | |||||||||||||||||||||||||||||||||||||||||||||
| Acquisition of subsidiaries | |||||||||||||||||||||||||||||||||||||||||||||||
| Transfers | ( | ( | |||||||||||||||||||||||||||||||||||||||||||||
| Disposals | ( | ( | ( | ( | |||||||||||||||||||||||||||||||||||||||||||
| Reclassification to non-income tax credits (*) | ( | ( | |||||||||||||||||||||||||||||||||||||||||||||
| Depreciation | ( | ( | ( | ( | ( | ( | |||||||||||||||||||||||||||||||||||||||||
| Closing net book amount | |||||||||||||||||||||||||||||||||||||||||||||||
| At December 31, 2022 | |||||||||||||||||||||||||||||||||||||||||||||||
| Fair value for farmlands / Cost | |||||||||||||||||||||||||||||||||||||||||||||||
| Accumulated depreciation | ( | ( | ( | ( | ( | ( | |||||||||||||||||||||||||||||||||||||||||
| Net book amount | |||||||||||||||||||||||||||||||||||||||||||||||
(*) Brazilian federal tax law allows entities to take a percentage of the total cost of the assets purchased as a tax credit. As of December 31, 2022 and 2021, ICMS (Imposto sobre Circulação de Mercadorias e Prestação de Serviços) tax credits were reclassified to trade and other receivables.
F- 45
Adecoagro S.A.
Notes to the Consolidated Financial Statements (Continued)
(All amounts in US$ thousands, except shares and per share data and as otherwise indicated)
12. Property, plant and equipment, net (continued)
Depreciation is calculated using the straight-line method to allocate their cost over the estimated useful lives. Farmlands are not depreciated.
| Farmland improvements | |||||
| Buildings and facilities | |||||
| Furniture and fittings | |||||
| Computer equipment | |||||
| Machinery and equipment | |||||
| Vehicles | |||||
| Bearer plants | |||||
The assets’ residual values and useful lives are reviewed, and adjusted if appropriate, at each statement of financial position date. Farmlands are measured at fair value using a sales comparison approach. prepared by an independent expert. Sale prices of comparable properties are adjusted considering the specific aspects of each property, the most relevant assumption being the price per hectare (Level 3). The Group estimated that, other factors being constant, a 10 % reduction on the sales price for the year ended December 31, 2022 would have reduced the value of the farmlands on US$72.8 million (2021: US$71 million), which would impact, net of its tax effect on the "Revaluation surplus" item in the statement of Changes in Shareholders' Equity. Should farmlands be carried at historical cost, the net book value as of December 31, 2022 would have been US$294.8 million.
Depreciation charges are included in “Cost of production of Biological Assets," “Cost of production of manufactures products,”“General and administrative expenses,”“Selling expenses” and capitalized in “Property, plant and equipment” for the years ended December 31, 2022, 2021 and 2020.
During the year ended December 31, 2022, borrowing costs of US$3.3 million (2021:US$2.8 million) were capitalized as components of the cost of acquisition or construction for qualifying assets.
Certain of the Group’s assets have been pledged as collateral to secure the Group’s borrowings and other payables. The net book value of the pledged assets amounts to US$129.3 million as of December 31, 2022 (2021: US$124.6 million).
F- 46
Adecoagro S.A.
Notes to the Consolidated Financial Statements (Continued)
(All amounts in US$ thousands, except shares and per share data and as otherwise indicated)
13. Right of use assets, net
| Agricultural partnerships (*) | Others | Total | |||||||||||||||
| At January 1, 2021 | |||||||||||||||||
| Opening net book amount | |||||||||||||||||
| Exchange differences | ( | ( | ( | ||||||||||||||
| Additions and re-measurements | |||||||||||||||||
| Depreciation | ( | ( | ( | ||||||||||||||
| Closing net book amount | |||||||||||||||||
| At December 31, 2022 | |||||||||||||||||
| Opening net book amount | |||||||||||||||||
| Exchange differences | |||||||||||||||||
| Additions and re-measurements | |||||||||||||||||
| Depreciation | ( | ( | ( | ||||||||||||||
| Closing net book amount | |||||||||||||||||
Depreciation charges are included in “Cost of production of Biological Assets,”“Cost of production of manufactures products,”“General and administrative expenses,”“Selling expenses” and capitalized in “Property, plant and equipment” for the year ended December 31, 2022, 2021 and 2020.
14. Investment property
Changes in the Group’s investment property in 2022 and 2021 were as follows:
| 2022 | 2021 | ||||||||||
| Beginning of the year | |||||||||||
| Net loss from fair value adjustment (Note 8) | ( | ( | |||||||||
| Reclassification to property, plant and equipment (i) | ( | ||||||||||
| Exchange difference | |||||||||||
| End of the year | |||||||||||
| Fair value | |||||||||||
| Net book amount | |||||||||||
(i) Relates with the expiration of contracts with third parties.
F- 47
Adecoagro S.A.
Notes to the Consolidated Financial Statements (Continued)
(All amounts in US$ thousands, except shares and per share data and as otherwise indicated)
15. Intangible assets, net
Changes in the Group’s intangible assets, net in 2022 and 2021 were as follows:
| Goodwill | Software | Trademarks | Others | Total | |||||||||||||||||||||||||
| At January 1, 2021 | |||||||||||||||||||||||||||||
| Cost | |||||||||||||||||||||||||||||
| Accumulated amortization | ( | ( | ( | ( | |||||||||||||||||||||||||
| Net book amount | |||||||||||||||||||||||||||||
| Year ended December 31, 2021 | |||||||||||||||||||||||||||||
| Opening net book amount | |||||||||||||||||||||||||||||
| Exchange differences | ( | ||||||||||||||||||||||||||||
| Additions | |||||||||||||||||||||||||||||
| Amortization charge (i) | ( | ( | ( | ( | |||||||||||||||||||||||||
| Closing net book amount | |||||||||||||||||||||||||||||
| At December 31, 2021 | |||||||||||||||||||||||||||||
| Cost | |||||||||||||||||||||||||||||
| Accumulated amortization | ( | ( | ( | ( | |||||||||||||||||||||||||
| Net book amount | |||||||||||||||||||||||||||||
| Year ended December 31, 2022 | |||||||||||||||||||||||||||||
| Opening net book amount | |||||||||||||||||||||||||||||
| Exchange differences | |||||||||||||||||||||||||||||
| Additions | |||||||||||||||||||||||||||||
| Amortization charge (i) | ( | ( | ( | ( | |||||||||||||||||||||||||
| Closing net book amount | |||||||||||||||||||||||||||||
| At December 31, 2022 | |||||||||||||||||||||||||||||
| Cost | |||||||||||||||||||||||||||||
| Accumulated amortization | ( | ( | ( | ( | |||||||||||||||||||||||||
| Net book amount | |||||||||||||||||||||||||||||
(i)Amortization charges are included in “General and administrative expenses” and “Selling expenses” for the years ended December 31, 2022 and 2021, respectively. There were no impairment charges for any of the years presented (see Note 32 (a)).
The accompanying notes are an integral part of these consolidated financial statements.
F- 48
Adecoagro S.A.
Notes to the Consolidated Financial Statements (Continued)
(All amounts in US$ thousands, except shares and per share data and as otherwise indicated)
16. Biological assets
Changes in the Group’s biological assets in 2022 and 2021 were as follows:
| 2022 | |||||||||||||||||||||||||||||||||||
| Crops (ii) | Rice (ii) | Dairy | All other segments | Sugarcane (ii) | Total | ||||||||||||||||||||||||||||||
| Beginning of the year | |||||||||||||||||||||||||||||||||||
| Increase due to purchases | |||||||||||||||||||||||||||||||||||
| Acquisition of subsidiaries (Note 21) | |||||||||||||||||||||||||||||||||||
| Initial recognition and changes in fair value of biological assets (i) | ( | ||||||||||||||||||||||||||||||||||
| Decrease due to harvest / disposals | ( | ( | ( | ( | ( | ( | |||||||||||||||||||||||||||||
| Costs incurred during the year | |||||||||||||||||||||||||||||||||||
| Exchange differences | |||||||||||||||||||||||||||||||||||
| End of the year | |||||||||||||||||||||||||||||||||||
| 2021 | |||||||||||||||||||||||||||||||||||
| Crops (ii) | Rice (ii) | Dairy | All other segments | Sugarcane (ii) | Total | ||||||||||||||||||||||||||||||
| Beginning of the year | |||||||||||||||||||||||||||||||||||
| Increase due to purchases | |||||||||||||||||||||||||||||||||||
| Initial recognition and changes in fair value of biological assets (i) | |||||||||||||||||||||||||||||||||||
| Decrease due to harvest / disposals | ( | ( | ( | ( | ( | ( | |||||||||||||||||||||||||||||
| Costs incurred during the year | |||||||||||||||||||||||||||||||||||
| Exchange differences | ( | ||||||||||||||||||||||||||||||||||
| End of the year | |||||||||||||||||||||||||||||||||||
(i) Biological asset with a production cycle of more than one year (that is dairy and cattle) generated “Initial recognition and changes in fair value of biological assets” amounting to US$26,978 for the year ended December 31, 2022 (2021: US$21,527 ). In 2022, an amount of US$4,653 (2021: US$1,824 ) was attributable to price changes, and an amount of US$22,325 (2021: US$19,433 ) was attributable to physical changes.
(ii) Biological assets that are measured at fair value within level 3 of the hierarchy.
F- 49
Adecoagro S.A.
Notes to the Consolidated Financial Statements (Continued)
(All amounts in US$ thousands, except shares and per share data and as otherwise indicated)
16. Biological assets (continued)
Cost of production for the year ended December 31, 2022:
| Crops | Rice | Dairy | All other segments | Sugar, Ethanol and Energy | Total | ||||||||||||||||||||||||||||||
| Salaries, social security expenses and employee benefits | |||||||||||||||||||||||||||||||||||
| Depreciation and amortization | |||||||||||||||||||||||||||||||||||
| Depreciation of right of use assets | |||||||||||||||||||||||||||||||||||
| Fertilizers, agrochemicals and seeds | |||||||||||||||||||||||||||||||||||
| Fuel, lubricants and others | |||||||||||||||||||||||||||||||||||
| Maintenance and repairs | |||||||||||||||||||||||||||||||||||
| Freights | |||||||||||||||||||||||||||||||||||
| Contractors and services | |||||||||||||||||||||||||||||||||||
| Feeding expenses | |||||||||||||||||||||||||||||||||||
| Veterinary expenses | |||||||||||||||||||||||||||||||||||
| Energy power | |||||||||||||||||||||||||||||||||||
| Professional fees | |||||||||||||||||||||||||||||||||||
| Other taxes | |||||||||||||||||||||||||||||||||||
| Lease expense and similar arrangements | |||||||||||||||||||||||||||||||||||
| Others | |||||||||||||||||||||||||||||||||||
| Subtotal | |||||||||||||||||||||||||||||||||||
| Own agricultural produce consumed | |||||||||||||||||||||||||||||||||||
| Total | |||||||||||||||||||||||||||||||||||
F- 50
Adecoagro S.A.
Notes to the Consolidated Financial Statements (Continued)
(All amounts in US$ thousands, except shares and per share data and as otherwise indicated)
16. Biological assets (continued)
Cost of production for the year ended December 31, 2021:
| Crops | Rice | Dairy | All other segments | Sugar, Ethanol and Energy | Total | ||||||||||||||||||||||||||||||
| Salaries, social security expenses and employee benefits | |||||||||||||||||||||||||||||||||||
| Depreciation and amortization | |||||||||||||||||||||||||||||||||||
| Depreciation of right of use assets | |||||||||||||||||||||||||||||||||||
| Fertilizers, agrochemicals and seeds | |||||||||||||||||||||||||||||||||||
| Fuel, lubricants and others | |||||||||||||||||||||||||||||||||||
| Maintenance and repairs | |||||||||||||||||||||||||||||||||||
| Freights | |||||||||||||||||||||||||||||||||||
| Contractors and services | |||||||||||||||||||||||||||||||||||
| Feeding expenses | |||||||||||||||||||||||||||||||||||
| Veterinary expenses | |||||||||||||||||||||||||||||||||||
| Energy power | |||||||||||||||||||||||||||||||||||
| Professional fees | |||||||||||||||||||||||||||||||||||
| Other taxes | |||||||||||||||||||||||||||||||||||
| Lease expense and similar arrangements | |||||||||||||||||||||||||||||||||||
| Others | |||||||||||||||||||||||||||||||||||
| Subtotal | |||||||||||||||||||||||||||||||||||
| Own agricultural produce consumed | |||||||||||||||||||||||||||||||||||
| Total | |||||||||||||||||||||||||||||||||||
Biological assets in December 31, 2022 and 2021 were as follows:
| 2022 | 2021 | ||||||||||
| Non-current | |||||||||||
| Cattle for dairy production (i) | |||||||||||
| Breeding cattle (ii) | |||||||||||
| Other cattle (ii) | |||||||||||
| Current | |||||||||||
| Breeding cattle (iii) | |||||||||||
| Other cattle (iii) | |||||||||||
| Sown land – crops (ii) | |||||||||||
| Sown land – rice (ii) | |||||||||||
| Sown land – sugarcane (ii) (iv) | |||||||||||
| Total biological assets | |||||||||||
(i)Classified as bearer and mature biological assets.
(ii)Classified as consumable and immature biological assets.
(iii)Classified as consumable and mature biological assets.
F- 51
Adecoagro S.A.
Notes to the Consolidated Financial Statements (Continued)
(All amounts in US$ thousands, except shares and per share data and as otherwise indicated)
16. Biological assets (continued)
The fair value less estimated point of sale costs of agricultural produce at the point of harvest amounted to US$522,894 for the year ended December 31, 2022 (2021: US$532,480 ).
The following table presents the Group’s biological assets that are measured at fair value at December 31, 2022 and 2021 (See Note 17 for a the description of each fair value level):
| 2022 | 2021 | ||||||||||||||||||||||||||||||||||||||||||||||
| Level 1 | Level 2 | Level 3 | Total | Level 1 | Level 2 | Level 3 | Total | ||||||||||||||||||||||||||||||||||||||||
| Cattle for dairy production | |||||||||||||||||||||||||||||||||||||||||||||||
| Breeding cattle | |||||||||||||||||||||||||||||||||||||||||||||||
| Other cattle | |||||||||||||||||||||||||||||||||||||||||||||||
| Sown land – sugarcane | |||||||||||||||||||||||||||||||||||||||||||||||
| Sown land – crops | |||||||||||||||||||||||||||||||||||||||||||||||
| Sown land – rice | |||||||||||||||||||||||||||||||||||||||||||||||
There were no transfers between any levels during the year.
The following significant unobservable inputs were used to measure the Group’s biological assets using the discounted cash flow valuation technique:
| Description | Unobservable inputs | Range of unobservable inputs | Relationship of unobservable inputs to fair value | |||||||||||||||||||||||
| 2022 | 2021 | |||||||||||||||||||||||||
| Sown land – sugarcane | Sugarcane yield – tonnes per hectare; Sugarcane TRS (kg of sugar per ton of cane) Production Costs – US$ per hectare. (Include maintenance, harvest and leasing costs) | '-Sugarcane yield: | '-Sugarcane yield: | The higher the sugarcane yield, the higher the fair value. The higher the maintenance, harvest and leasing costs per hectare, the lower the fair value. The higher the TRS of sugarcane, the higher the fair value. | ||||||||||||||||||||||
| Sown land – crops | Crops yield – tonnes per hectare; Commercial Costs – US$ per hectare; Production Costs – US$ per hectare. | '- Crops yield: | '- Crops yield: - Commercial Costs: - Production Costs: | The higher the crops yield, the higher the fair value. The higher the commercial and direct costs per hectare, the lower the fair value. | ||||||||||||||||||||||
| Sown land – rice | Rice yield – tonnes per hectare; Commercial Costs – US$ per hectare; Production Costs – US$ per hectare. | '-Rice yield: | '-Rice yield: -Commercial Costs: -Production Costs: | The higher the rice yield, the higher the fair value. The higher the commercial and direct costs per hectare, the lower the fair value. | ||||||||||||||||||||||
F- 52
Adecoagro S.A.
Notes to the Consolidated Financial Statements (Continued)
(All amounts in US$ thousands, except shares and per share data and as otherwise indicated)
16. Biological assets (continued)
As of December 31, 2022, the impact of a reasonable 10 18.5 3.8 6.0
As of December 31, 2021, the impact of a reasonable 10 14.8 5.4 4.9
“La Niña” weather event
17. Financial instruments by category
The Group classified its financial assets in the following categories:
(a) Financial assets at fair value through profit or loss
Financial assets at fair value through profit or loss are financial assets held for trading. A financial asset is classified in this category if acquired principally for the purpose of selling in the short-term. Derivatives are also categorized as held for trading unless they are designated as hedges. For all years presented, the Group’s financial assets at fair value through profit or loss comprise mainly short-term investment and derivative financial instruments.
(b) Financial assets at amortized cost.
Financial assets at amortized cost, namely loans and receivables, are non-derivative financial assets with fixed or determinable payments that are not quoted in an active market. Loans and receivables comprise “trade and other receivables” and “cash and cash equivalents” in the statement of financial position.
F- 53
Adecoagro S.A.
Notes to the Consolidated Financial Statements (Continued)
(All amounts in US$ thousands, except shares and per share data and as otherwise indicated)
17. Financial instruments by category (continued)
| Financial assets at amortized cost | Financial assets at fair value through profit or loss | Subtotal financial assets | Non- financial assets | Total | |||||||||||||||||||||||||
| December 31, 2022 | |||||||||||||||||||||||||||||
| Assets as per statement of financial position | |||||||||||||||||||||||||||||
| Trade and other receivables | |||||||||||||||||||||||||||||
| Derivative financial instruments | |||||||||||||||||||||||||||||
| Restricted short term investment | |||||||||||||||||||||||||||||
| Cash and cash equivalents | |||||||||||||||||||||||||||||
| Total | |||||||||||||||||||||||||||||
| Financial liabilities at amortized cost | Liabilities at fair value through profit or loss | Subtotal financial liabilities | Non- financial liabilities | Total | |||||||||||||||||||||||||
| Liabilities as per statement of financial position | |||||||||||||||||||||||||||||
| Trade and other payables | |||||||||||||||||||||||||||||
| Borrowings (i) | |||||||||||||||||||||||||||||
| Leases Liabilities | |||||||||||||||||||||||||||||
| Derivative financial instruments (i) | |||||||||||||||||||||||||||||
| Total | |||||||||||||||||||||||||||||
| Financial assets at amortized cost | Financial assets at fair value through profit or loss | Subtotal financial assets | Non- financial assets | Total | |||||||||||||||||||||||||
| December 31, 2021 | |||||||||||||||||||||||||||||
| Assets as per statement of financial position | |||||||||||||||||||||||||||||
| Trade and other receivables | |||||||||||||||||||||||||||||
| Derivative financial instruments | |||||||||||||||||||||||||||||
| Cash and cash equivalents | |||||||||||||||||||||||||||||
| Total | |||||||||||||||||||||||||||||
| Financial liabilities at amortized cost | Liabilities at fair value through profit or loss | Subtotal financial liabilities | Non- financial liabilities | Total | |||||||||||||||||||||||||
| Liabilities as per statement of financial position | |||||||||||||||||||||||||||||
| Trade and other payables | |||||||||||||||||||||||||||||
| Borrowings (i) | |||||||||||||||||||||||||||||
| Leases Liabilities | |||||||||||||||||||||||||||||
| Derivative financial instruments (i) | |||||||||||||||||||||||||||||
| Total | |||||||||||||||||||||||||||||
F- 54
Adecoagro S.A.
Notes to the Consolidated Financial Statements (Continued)
(All amounts in US$ thousands, except shares and per share data and as otherwise indicated)
17. Financial instruments by category (continued)
Because of the short maturities of most trade accounts receivable and payable, other receivables and liabilities, and cash and cash equivalents, their carrying amounts at the closing date do not differ significantly from their respective fair values. The fair value of long-term borrowings is disclosed in Note 26.
Income, expense, gains and losses on financial instruments can be assigned to the following categories:
| Financial asset / liabilities at amortized cost | Assets/ liabilities at fair value through profit or loss | Total | ||||||||||||||||||
| December 31, 2022 | ||||||||||||||||||||
| Interest income (i) | ||||||||||||||||||||
| Interest expense (i) | ( | ( | ||||||||||||||||||
| Foreign exchange gain (i) | ||||||||||||||||||||
| Loss from derivative financial instruments (ii) | ( | ( | ( | |||||||||||||||||
| Finance cost related to lease liabilities | ( | ( | ||||||||||||||||||
| Financial assets / liabilities at amortized cost | Assets/ liabilities at fair value through profit or loss | Total | ||||||||||||||||||
| December 31, 2021 | ||||||||||||||||||||
| Interest income (i) | ||||||||||||||||||||
| Interest expense (i) | ( | ( | ||||||||||||||||||
| Foreign exchange gains losses (i) | ||||||||||||||||||||
| Loss from derivative financial instruments (ii) | ( | ( | ||||||||||||||||||
| Finance cost related to lease liabilities | ( | ( | ||||||||||||||||||
(i)Included in “Financial Results, net” in the consolidated statement of income.
(ii)Included in “Other operating income, net” and “Financial Results, net” in the consolidated statement of income.
Determining fair values
IFRS 13 defines fair value as the price that would be received to sell an asset or paid to transfer a liability in an orderly transaction between market participants at the measurement date. All financial instruments recognized at fair value are allocated to one of the valuation hierarchy levels of IFRS 13. This valuation hierarchy provides for three levels. The allocation reflects which of the fair values derive from transactions in the market and where valuation is based on models because market transactions are lacking. The level in the fair value hierarchy is categorized in its entirety is determined on the basis of the lowest level input that is significant to the fair value measurement in its entirety.
F- 55
Adecoagro S.A.
Notes to the Consolidated Financial Statements (Continued)
(All amounts in US$ thousands, except shares and per share data and as otherwise indicated)
17. Financial instruments by category (continued)
As of December 31, 2022 and 2021, the financial instruments recognized at fair value on the statement of financial position comprise derivative financial instruments.
In the case of Level 1, valuation is based on unadjusted quoted prices in active markets for identical financial assets that the Group can refer to at the date of the statement of financial position. The financial instruments the Group has allocated to this level mainly comprise crop futures and options traded on the stock market.
Derivatives not traded on the stock market allocated to Level 2 are valued using models based on observable market data. The financial instruments the Group has allocated to this level mainly comprise interest-rate swaps and foreign-currency interest-rate swaps.
In the case of Level 3, the Group uses valuation techniques not based on inputs observable in the market. This is only permissible insofar as no observable market data are available. The Group does not have financial instruments allocated to this level for any of the years presented.
The following tables present the Group’s financial assets and financial liabilities that are measured at fair value as of December 31, 2022 and 2021 and their allocation to the fair value hierarchy:
| Level 1 | Level 2 | Total | |||||||||||||||||||||
| Assets | |||||||||||||||||||||||
| Derivative financial instruments | 2022 | ||||||||||||||||||||||
Restricted short-term investment (1) | 2022 | ||||||||||||||||||||||
| Derivative financial instruments | 2021 | ||||||||||||||||||||||
| Liabilities | |||||||||||||||||||||||
| Derivative financial instruments | 2022 | ( | ( | ( | |||||||||||||||||||
| Derivative financial instruments | 2021 | ( | ( | ||||||||||||||||||||
(1) US-Treasury Bills with maturity from the date of acquisition longer than 90 days used as collateral for short-term borrowings. These investments are not available for use by other entities of the Group. See Note 26.
There were no transfers within level 1 and 2 during the years ended December 31, 2022 and 2021.
When no quoted prices in an active market are available, fair values (particularly with derivatives) are based on recognized valuation methods. The Group uses a range of valuation models for this purpose, details of which may be obtained from the following table:
| Class | Pricing Method | Parameters | Pricing Model | Level | Total | |||||||||||||||||||||||||||
| Futures | Quoted price | — | — | 1 | ( | |||||||||||||||||||||||||||
| Non derivable future (“NDF”) | Quoted price | Swap curve | Present value method | 2 | ( | |||||||||||||||||||||||||||
| NDF | Quoted price | Foreign-exchange curve | Present value method | 1 | ||||||||||||||||||||||||||||
| Interest-rate swaps | Theoretical price | Money market interest-rate curve | Present value method | 2 | ||||||||||||||||||||||||||||
| US-Treasury Bills | Quoted price | — | — | 1 | ||||||||||||||||||||||||||||
F- 56
Adecoagro S.A.
Notes to the Consolidated Financial Statements (Continued)
(All amounts in US$ thousands, except shares and per share data and as otherwise indicated)
18. Trade and other receivables, net
| 2022 | 2021 | ||||||||||
| Non-current | |||||||||||
| Advances to suppliers | |||||||||||
| Income tax credits | |||||||||||
| Non-income tax credits (i) | |||||||||||
| Judicial deposits | |||||||||||
| Receivable from disposal of subsidiary (Note 21) | |||||||||||
| Other receivables | |||||||||||
| Non-current portion | |||||||||||
| Current | |||||||||||
| Trade receivables | |||||||||||
| Less: Allowance for trade receivables | ( | ( | |||||||||
| Trade receivables – net | |||||||||||
| Prepaid expenses | |||||||||||
| Advances to suppliers | |||||||||||
| Income tax credits | |||||||||||
| Non-income tax credits (i) | |||||||||||
| Receivable from disposal of subsidiary (Note 21) | |||||||||||
| Cash collateral | |||||||||||
| Other receivables | |||||||||||
| Subtotal | |||||||||||
| Current portion | |||||||||||
| Total trade and other receivables, net | |||||||||||
(i) Includes US$158 (2021: US$303 ) reclassified from property, plant and equipment.
The fair values of current trade and other receivables approximate their respective carrying amounts due to their short-term nature. The fair values of non-current trade and other receivables approximate their carrying amount, as the impact of discounting is not significant.
The carrying amounts of the Group’s trade and other receivables are denominated in the following currencies (expressed in U.S. Dollars):
| 2022 | 2021 | ||||||||||
| Currency | |||||||||||
| U.S. Dollar | |||||||||||
| Argentine Peso | |||||||||||
| Uruguayan Peso | |||||||||||
| Brazilian Reais | |||||||||||
As of December 31, 2022 trade receivables of US$22,933 (2021: US$11,224 ) were past due but not impaired. The aging analysis of these receivables indicates that US$741 and US$717 are over 6 months in December 31, 2022 and 2021, respectively.
Effective January 1, 2018, for trade receivables, the Group applies the simplified approach permitted by IFRS 9, which requires expected lifetime losses to be recognized from initial recognition of the receivables.
F- 57
Adecoagro S.A.
Notes to the Consolidated Financial Statements (Continued)
(All amounts in US$ thousands, except shares and per share data and as otherwise indicated)
18. Trade and other receivables, net (continued)
Delinquency in payments is an indicator that a receivable may be impaired. However, management considers all available evidence in determining when a receivable is impaired. Generally, trade receivables, which are more than 180 days past due are fully provided for. However, certain receivables 180+ days overdue are not provided for based on a case-by-case analysis of credit quality analysis. Furthermore, receivables, which are not 180+ days overdue, may be provided for if specific analysis indicates a potential impairment.
Movements on the Group’s allowance for trade receivables are as follows:
| 2022 | 2021 | 2020 | |||||||||||||||
| At January 1 | |||||||||||||||||
| Charge of the year | |||||||||||||||||
| Unused amounts reversed | ( | ( | ( | ||||||||||||||
| Used during the year | ( | ( | ( | ||||||||||||||
| Exchange differences | ( | ( | ( | ||||||||||||||
| At December 31 | |||||||||||||||||
The creation and release of allowance for trade receivables have been included in “Selling expenses” in the statement of income. Amounts charged to the allowance account are generally written off, when there is no expectation of recovering additional cash.
The maximum exposure to credit risk at the reporting date is the carrying value of each class of receivable mentioned above.
As of December 31, 2022, approximately 72 % (2021: 53 %) of the outstanding unimpaired trade receivables (neither past due not impaired) relate to sales to 20 well-known multinational companies with good credit quality standing, including but not limited to CDA Alimentos S.A., Intersnack Procurement BV, YPF S.A., Taurus Distribuidora de Petroleo Ltda., Cargill S.A.C.I., Schettino hermanos S.R.L., among others. Most of these entities or their parent companies are externally credit-rated. The Group reviews these external ratings from credit agencies.
The remaining percentage as of December 31, 2022 and 2021 of the outstanding unimpaired trade receivables (neither past due nor impaired) relate to sales to a dispersed large quantity of customers for which external credit ratings may not be available. However, the total base of customers without an external credit rating is relatively stable.
New customers with less than six months of history with the Group are closely monitored. The Group has not experienced credit problems with these new customers to date. The majority of the customers for which an external credit rating is not available are existing customers with more than six months of history with the Group and with no defaults in the past. A minor percentage of customers may have experienced some non-significant defaults in the past but fully recovered.
19. Inventories
| 2022 | 2021 | ||||||||||
| Raw materials | |||||||||||
| Finished goods (Note 5) | |||||||||||
20. Cash and cash equivalents
| 2022 | 2021 | ||||||||||
| Cash at bank and on hand | |||||||||||
| Short-term bank deposits | |||||||||||
F- 58
21. Acquisitions and disposals
Acquisitions
Acquisition of subsidiaries of Viterra Group in Argentina and Uruguay
On May 3, 2022, (the “Closing Date”) the Group, through certain subsidiaries consummated the acquisition of the rice operations in Uruguay and Argentina of the Viterra Group, comprising a 100 % ownership of Molinos Libres S.A. (Argentina), Viterra Uruguay S.A. (Uruguay) and Paso Dragón S.A. (Uruguay). The transaction also included the acquisition of certain leasing agreements. All of the acquired subsidiaries form part of the Rice Business Segment.
The terms and conditions of the agreement contemplate the payment, subject to adjustments, of a purchase price of approximately US$ 17.8 million payable in three annual installments and the assumption of the existing financial debt for an amount of US$ 17.9 million. At Closing Date, the Group paid the first installments of US$ 2 million and US$ 8 million of the assumed debt.
In addition, the agreement provides for a cash contingent payment of US$ 1,215 , which will be payable only if certain conditions are met.
The Company has made an allocation of the estimated purchase price to the identifiable assets acquired and liabilities assumed based on their fair values at acquisition date. The Company has made significant assumptions and estimates in determining the purchase price, including the contingent payment and the allocation of the estimated purchase price in these consolidated financial statements.
As the fair value of the identifiable net assets acquired was greater than the total consideration paid, negative goodwill arises on the acquisition. The negative goodwill is recognized as “Bargain purchase gain on acquisition” in the income statement for the year end December 31, 2022 reflecting the opportunity to acquire the rice operations in Argentina and Uruguay from an outgoing market player.
The following table summarizes the purchase price:
Purchase consideration: | ||||||||
Amount paid in cash | ||||||||
Amounts to be paid in installments (*) | ||||||||
Total purchase consideration | ||||||||
Fair value of net assets acquired | ||||||||
Bargain purchase on acquisition over the total purchase consideration | ||||||||
During 2022, an amount of US$ 634 of the installments was paid.
(*) Amounts to be paid in installments were discounted at present value as of the date of acquisition at a 6.5 % discount rate.
F- 59
Adecoagro S.A.
Notes to the Consolidated Financial Statements (Continued)
(All amounts in US$ thousands, except shares and per share data and as otherwise indicated)
21. Acquisitions and disposals (continued)
The assets and liabilities at the date of acquisition are as follows:
Cash and cash equivalents | |||||
Trade and other receivables | |||||
| Inventories | |||||
| Biological assets | |||||
| Property, plant and equipment | |||||
Total Assets | |||||
Trade and other payables | ( | ||||
Payroll and other liabilities | ( | ||||
Borrowings | ( | ||||
Deferred income tax liabilities | ( | ||||
| Provision for other liabilities | ( | ||||
Total Liabilities | ( | ||||
Fair value of Net Assets Acquired | |||||
The Company used a replacement cost method or a market approach, as appropriate, to measure the fair value of property, plant and equipment.
All other net tangible assets were valued at their respective carrying amounts, as the Company believes that these amounts approximate their current fair values.
A decrease in the fair value of assets acquired, or an increase in the fair value of liabilities assumed, from those preliminary valuations would result in a dollar-for-dollar corresponding decrease in the “Bargain purchase on acquisition”.
Acquisition-related costs of US$ 193 are included in General and administrative expenses in the Consolidated Statement of Income.
The following table summarizes the sales of goods and services rendered and profit from operations of the subsidiaries acquired included in the consolidated financial statements of income for the year end December 31, 2022 as from the date of acquisition:
Period from the date of acquisition to December 31 2022 | ||||||||
Sales of goods and services rendered | ||||||||
Profit from operations | ||||||||
If the acquisition had occurred on January 1, 2022 consolidated pro-forma sales of goods and services rendered, profit from operations and profit for the year, for the year ended 31 December 2022 would have been US$ 1,369,462 , US$ 249,462 and US$ 106,950 .
Disposals
In December 2020, the Group completed the sale of its wholly owned subsidiaries Global Seward S.L.U. and Peak City S.L.U., which main underlying asset was the Huelen Farm at a sale price of US$30.1 million. The balance was fully collected by the end of 2022. This transaction resulted in a loss before tax of US$ 0.6 million included in the line item “Other operating income”, and also in the reclassification of Revaluation surplus to retained earnings of US$2.2 million.
F- 60
Adecoagro S.A.
Notes to the Consolidated Financial Statements (Continued)
(All amounts in US$ thousands, except shares and per share data and as otherwise indicated)
21. Acquisitions and disposals (continued)
22. Shareholders' contributions
The share capital of the Group is represented by common shares with a nominal value of US$1.5 per share and one vote each.
| Number of shares | Share capital and share premium | ||||||||||
| At January 1, 2020 | |||||||||||
| Restricted shares granted and units vested (Note 23) | — | ||||||||||
| Purchase of own shares | — | ( | |||||||||
| At December 31, 2020 | |||||||||||
| Restricted shares granted and units vested (Note 23) | — | ||||||||||
| Purchase of own shares | — | ( | |||||||||
| At December 31, 2021 | |||||||||||
| Reduction of issued share capital of the company | ( | ( | |||||||||
| Employee share options exercised (Note 22) (1) | — | ||||||||||
| Restricted shares granted (Note 23) | — | ||||||||||
| Purchase of own shares | — | ( | |||||||||
| Dividends paid to shareholders | — | ( | |||||||||
| At December 31, 2022 | |||||||||||
(1)Treasury shares were used to settle these options, units and grants.
Decision of the Extraordinary General Shareholders’ meeting
On April 20, 2022 the extraordinary general meeting of the shareholders of the Company resolved to reduce the issued share capital of the Company by an amount of $16,500,000 by the cancellation of 11,000,000 shares with a nominal value of $1.50 each held in treasury by the Company so that, as from April 20, 2022, the issued share capital amounts to $167,072,722.50 , represented by 111,381,815 shares in issue (of which 52,254 are treasury shares) with a nominal value of $1.50 each.
Share Repurchase Program
On September 24, 2013, the Board of Directors of the Company has authorized a share repurchase program for up to 5 % of its outstanding shares. The repurchase program has commenced on September 24, 2013 and is reviewed by the Board of Directors after each 12-month period. On August 9, 2022, the Board of Directors approved the extension of the program for an additional twelve-month period, ending September 23, 2023.
Repurchases of shares under the program are made from time to time in open market transactions in compliance with the trading conditions of Rule 10b-18 under the U.S. Securities Exchange Act of 1934, as amended, and applicable rules and regulations. The share repurchase program does not require Adecoagro to acquire any specific number or amount of shares and may be modified, suspended, reinstated or terminated at any time in the Company’s discretion and without prior notice.
F- 61
Adecoagro S.A.
Notes to the Consolidated Financial Statements (Continued)
(All amounts in US$ thousands, except shares and per share data and as otherwise indicated)
22. Shareholders' contributions (continued)
As of December 31, 2022, the Company repurchased 21,948,707 shares under this program, of which 7,862,922 have been applied to some exercise of the Company’s stock option plan and restricted stock units and the grant of restricted shares. In 2022, 2021 and 2020 the Company repurchased shares for an amount of US$36.8 million; US$66.5 million and US$4.4 million respectively. The outstanding treasury shares as of December 31, 2022 totaled 3,190,597 common shares.
Dividend distribution
On April 20, 2022 the general meeting of the shareholders of the Company resolved the payment of an annual dividend of US$ 35 million to be paid to outstanding shares in two installments in May and November. The first payment, of US$ 17.5 million (0.1572 per share) was made on May 17, 2022 and the second also US$ 17.5 million (0.1602 per share) installment was made on November 17, 2022.
Annual Dividend Proposal
On March 7, 2023 the Company’s Board of Directors proposed, for the approval of the Annual General Shareholders' meeting, the payment of an annual dividend of $35 million to be paid to outstanding shares in two installments in May and November of 2023. This proposal was approved by the Shareholders’ meeting held on April 19, 2023. These Consolidated Financial Statements do not reflect this dividend payable.
F- 62
Adecoagro S.A.
Notes to the Consolidated Financial Statements (Continued)
(All amounts in US$ thousands, except shares and per share data and as otherwise indicated)
23. Equity-settled share-based payments
The Group has set a “2004 Incentive Option Plan” (collectively referred to as “Option Schemes”) under which the Group granted equity-settled options to senior managers and selected employees of the Group's subsidiaries with a term of ten years . Additionally, in 2010 the Group has set a “Adecoagro Restricted Share and Restricted Stock Unit Plan” (referred to as “Restricted Share Plan”) under which the Group grants restricted stock units and restricted shares to senior and medium management and key employees of the Group’s subsidiaries.
(a)Option Schemes
The fair value of the options under the Option Schemes was measured at the date of grant using the Black-Scholes valuation technique.
As of the date of these financial statements all options has already been vested and expensed.
The Adecoagro/ IFH 2004 Stock Incentive Option Plan was effectively established in 2004 and is administered by the Compensation Committee of the Company. Options are exercisable over a ten-year period. In May 2014 this period was extended for another ten year -period.
Movements in the number of equity-settled options outstanding and their related weighted average exercise prices under the Adecoagro/ IFH 2004 Stock Incentive Option Plan are as follows:
| 2022 | 2021 | 2020 | |||||||||||||||||||||||||||||||||
| Average exercise price per share | Options (thousands) | Average exercise price per Share | Options (thousands) | Average exercise price per Share | Options (thousands) | ||||||||||||||||||||||||||||||
| At January 1 | |||||||||||||||||||||||||||||||||||
| Exercised | ( | ||||||||||||||||||||||||||||||||||
| At December 31 | |||||||||||||||||||||||||||||||||||
Options outstanding at year end under this Plan have the following expiry date and exercise prices:
| Exercise price per share | Shares (in thousands) | ||||||||||||||||||||||
| Expiry date (i): | 2022 | 2021 | 2020 | ||||||||||||||||||||
| May 1, 2024 | |||||||||||||||||||||||
| May 1, 2025 | |||||||||||||||||||||||
| January 1, 2026 | |||||||||||||||||||||||
| February 16, 2026 | |||||||||||||||||||||||
| October 1, 2026 | |||||||||||||||||||||||
(i) On May 2014, the Board of Directors decided to extend the expired date of the Plan.
F- 63
Adecoagro S.A.
Notes to the Consolidated Financial Statements (Continued)
(All amounts in US$ thousands, except shares and per share data and as otherwise indicated)
23. Equity-settled unit-based payments (continued)
(b)Restricted Share / Restricted Stock Unit Plan
The Restricted Share and Restricted Stock Unit Plan was effectively established in 2010 and amended in November 2011. It is administered by the Compensation Committee of the Company. Restricted shares or units under these Plan vest over a 3-year period from the date of grant at 33 % on each anniversary of the grant date. Participants are entitled to receive one common share of the Company for each restricted share or restricted unit granted. There are no performance requirements for the delivery of common shares, except that a participant’s employment with the Group must not have been terminated prior to the relevant vesting date. If the participant ceases to be an employee for any reason, any unvested restricted share or unit shall not be converted into common shares. The maximum number of ordinary shares with respect to which awards may be made under the Plan is 8,115,495 , of which 7,889,063 have already been vested. The maximum numbers of ordinary shares are revised annually.
At December 31, 2022, the Group recognized compensation expense US$10.9 million related to the restricted stock units granted under the Restricted Share Plan (2021: US$6.6 million and 2020: US$4.4 million).
The restricted shares under the Restricted Share Plan were measured at fair value at the date of grant.
Key grant-date fair value and other assumptions under the Restricted Share Plan are detailed below:
| Grant Date | Apr 1, 2020 | May 12, 2020 | Apr 1, 2021 | May 13, 2021 | Apr 1, 2022 | Apr 20, 2022 | |||||||||||||||||||||||||||||
| Fair value | |||||||||||||||||||||||||||||||||||
Movements in the number of restricted shares outstanding under the Restricted Share Plan are as follows:
| Restricted shares (thousand) | Restricted stock units (thousands) | |||||||||||||||||||||||||||||||
| 2022 | 2021 | 2020 | 2021 | 2020 | ||||||||||||||||||||||||||||
| At January 1 | ||||||||||||||||||||||||||||||||
| Granted (1) | ||||||||||||||||||||||||||||||||
| Forfeited | ( | ( | ( | ( | ||||||||||||||||||||||||||||
| Vested | ( | ( | ( | ( | ( | |||||||||||||||||||||||||||
| At December 31 | ||||||||||||||||||||||||||||||||
(1) Approved by the Board of Directors of March 11, 2022 and the Shareholders Meeting of April 20, 2022.
24. Legal and other reserves
According to the laws of certain of the countries in which the Group operates, a portion of the profit of the year (5%) is separated to constitute legal reserves until they reach legal capped amounts. These legal reserves are not available for dividend distribution and can only be released to absorb losses. The legal limit of these reserves has not been met.
Legal and other reserves amount to US$22,187 as of December 31, 2022 (2021: US$14,643 ) and are included within the balance of retained earnings in the statement of changes in shareholders’ equity.
The Company may make distributions in the form of dividends or otherwise to the extent that it has distributable retained earnings or available distributable reserves (including share premium) that result from the Stand Alone Financial Statements prepared in accordance with Luxembourg GAAP. No distributable retained earning result from the Stand Alone Financial Statements of the Company as of December 31, 2022, but the Company has distributable reserves in excess of US$824,114 .
F- 64
Adecoagro S.A.
Notes to the Consolidated Financial Statements (Continued)
(All amounts in US$ thousands, except shares and per share data and as otherwise indicated)
24. Legal and other reserves (continued)
25. Trade and other payables
| 2022 | 2021 | ||||||||||
| Non-current | |||||||||||
| Trade payables | |||||||||||
| Payable from acquisition of subsidiary (Note 21) | |||||||||||
| Other payables | |||||||||||
| Current | |||||||||||
| Trade payables | |||||||||||
| Advances from customers | |||||||||||
| Taxes payable | |||||||||||
| Payable from acquisition of subsidiary (Note 21) | |||||||||||
| Other payables | |||||||||||
| Total trade and other payables | |||||||||||
The fair values of current trade and other payables approximate their respective carrying amounts due to their short-term nature. The fair values of non-current trade and other payables approximate their carrying amounts, as the impact of discounting is not significant.
26. Borrowings
| 2022 | 2021 | ||||||||||
| Non-current | |||||||||||
| Senior Notes | |||||||||||
| Bank borrowings | |||||||||||
| Current | |||||||||||
| Senior Notes | |||||||||||
| Bank overdrafts | |||||||||||
| Bank borrowings | |||||||||||
| Total borrowings | |||||||||||
As of December 31, 2022, total bank borrowings include collateralized liabilities of US$188,058 (2021: US$70,221 ). These loans are mainly collateralized by property, plant and equipment, sugarcane plantations, sugar export contracts, shares of certain subsidiaries of the Group and US Treasury Bills.
F- 65
Adecoagro S.A.
Notes to the Consolidated Financial Statements (Continued)
(All amounts in US$ thousands, except shares and per share data and as otherwise indicated)
26. Borrowings (continued)
Notes 2027
On September 21, 2017, the Company issued senior notes (the “Notes”) for a total amount of US$500 million, at an annual fixed rate of 6 %. The Notes will mature on September 21, 2027. Interest on the Notes are payable semi-annually in arrears on March 21 and September 21 of each year. The total proceeds nets of expenses was US$495.7 million.
The Notes are fully and unconditionally guaranteed on a senior unsecured basis by certain of our current and future subsidiaries. As of December 31, 2022, Adeco Agropecuaria S.A., Adecoagro Brasil Participações S.A., Adecoagro Vale do Ivinhema S.A., Pilagá S.A. and Usina Monte Alegre Ltda. are the only Subsidiary Guarantors.
The Notes contain customary financial covenants and restrictions which require us to meet pre-defined financial ratios, among other restrictions. As of December 31, 2022 and 2021 the Group was in compliance with these financial covenants.
Debt maturity breakdown
The maturity of the Group's borrowings and the Group's exposure to fixed and variable interest rates is as follows:
| 2022 | 2021 | ||||||||||
| Fixed rate: | |||||||||||
| Less than 1 year | |||||||||||
| Between 1 and 2 years | |||||||||||
| Between 2 and 3 years | |||||||||||
| Between 3 and 4 years | |||||||||||
| More than 5 years | |||||||||||
| Variable rate: | |||||||||||
| Less than 1 year | |||||||||||
| Between 1 and 2 years | |||||||||||
| Between 2 and 3 years | |||||||||||
| Between 3 and 4 years | |||||||||||
| Between 4 and 5 years | |||||||||||
| More than 5 years | |||||||||||
Borrowings incurred by the Group’s subsidiaries in Brazil are repayable at various dates between January 2023 and November 2027 and bear either fixed interest rates ranging from 2.00 % to 13.23 % per annum or variable rates based on base-rates plus spreads ranging from 8.54 % to 16.29 % per annum. As of December 31, 2022 and 2021 there are no borrowings subject to LIBOR (six months).
Borrowings incurred by the Group’s subsidiaries in Argentina are repayable at various dates between December 2022 and June 2028 and bear either fixed interest rates ranging from 0.0 % and 9.2 % per annum or variable rates based on LIBOR or other specific base-rates plus spreads of 4.0 % for those borrowings denominated in U.S. Dollar, and a fixed interest rates ranging from 64.0 % to 71.15 % per annum for those borrowings denominated in Argentine pesos.
F- 66
Adecoagro S.A.
Notes to the Consolidated Financial Statements (Continued)
(All amounts in US$ thousands, except shares and per share data and as otherwise indicated)
26. Borrowings (continued)
Brazilian Subsidiaries
The main loans of the Group’s Brazilian Subsidiaries are:
| Bank | Grant date | Nominal amount | Capital outstanding as of December 31 | Maturity date | Annual interest rate | ||||||||||||||||||||||||
| 2022 | 2021 | ||||||||||||||||||||||||||||
| (In millions) | Millions of Reais | Millions of equivalent Dollars | Millions of equivalent Dollars | ||||||||||||||||||||||||||
| Banco do Brasil / Itaú BBA (FINEM) (1) | September 2013 | R$ | R$ | January 2023 | |||||||||||||||||||||||||
| Certificados Recebíveis do Agronegócio (CRA) | December 2019 | R$ | R$ | November 2027 | |||||||||||||||||||||||||
| Debênture | December 2020 | R$ | R$ | December 2026 | |||||||||||||||||||||||||
| Banco do Brasil (CCB) | December 2020 | R$ | R$ | January 2024 | CDI + | ||||||||||||||||||||||||
| Banco Itaú BBA (NCR) | April 2022 | R$ | R$ | March 2024 | |||||||||||||||||||||||||
(1)Collateralized by (i) liens over the Ivinhema mill and equipment; and (ii) power sales contracts.
In December 2019, Adecoagro Vale do Ivinhema placed R$400.0 million in Certificados de Recebíveis do Agronegócio (CRA) adjustable by the IPCA (Brazilian official inflation rate), maturing in November 2027 and bearing an interest 3.80 % per annum. This debt was issued with no guarantee.
The above mentioned loans, except the CRA, contain certain customary financial covenants and restrictions which require the Brazilian subsidiaries to meet pre-defined financial ratios, among other restrictions, as well as restrictions on the payment of dividends. These financial ratios are measured considering the statutory financial statements of the Brazilian Subsidiaries.
As of December 31, 2022 and 2021 the Group was in compliance with all financial covenants.
Argentinian Subsidiaries
The main loans of the Group’s Argentinian Subsidiaries are:
| Bank | Grant date | Nominal amount | Capital outstanding as of December 31 | Maturity date | Annual interest rate | |||||||||||||||
| 2022 | 2021 | |||||||||||||||||||
| (In millions) | (In millions) | (In millions) | ||||||||||||||||||
| Rabobank (1) | 2018 | US$ | June, 2024 | |||||||||||||||||
| IFC Tranche A (2) | 2020 | US$ | June, 2028 | |||||||||||||||||
| IFC Tranche B (2) | 2020 | US$ | June, 2028 | |||||||||||||||||
(1) Collateralized by the pledged of the shares of Dinaluca S.A., Compañía Agroforestal S.M.S.A. and Girasoles del Plata S.A.
(2) Collateralized by a US$241.8 million mortgage over Carmen, Abolengo, San Carlos, Las Horquetas, and La Rosa farms, which are property of Adeco Agropecuaria S.A. A US$35.7 million mortgage over El Meridiano farm, which is property of Pilaga S.A. and a US$44.3 million mortgage over Santa Lucia farm, which is property of Bañados del Salado S.A.
F- 67
Adecoagro S.A.
Notes to the Consolidated Financial Statements (Continued)
(All amounts in US$ thousands, except shares and per share data and as otherwise indicated)
26. Borrowings (continued)
Loan with International Finance Corporation (IFC)
In June 2020, our Argentine subsidiaries, Adeco Agropecuaria S.A., Pilagá S.A. and L3N S.A. entered into a US$100 million loan agreement with International Finance Corporation (IFC), member of the World Bank Group. The loan's tenor is eight years , including a two-year grace period, with a rate of LIBOR + 4 %. In October 2020, US$22 million has been received. In December 2021, we entered into an amendment reducing the total amount to US$ 60 million, that the group could request the withdrawal until June, 2022. If the Company withdraw the full amount, the rate would be reduced to LIBOR + 3 %.
The loan contains customary financial covenants and restrictions which require us to meet pre-defined financial ratios, among other restrictions. Publication of LIBOR would be ceased at the end of June 2023. During April 2023, it was agreed with IFC to use Secured Overnight Financing Rate (SOFR), replacing the LIBOR since July 1st, 2023. All the other provisions of the loan agreement continue in full force and effect.
The above mentioned loans contain certain customary financial covenants and restrictions which require us to meet pre-defined financial ratios, among other restrictions, as well as restrictions on the payment of dividends. These financial ratios are measured considering the statutory financial statements of the Argentinian Subsidiaries.
As of December 31, 2022 and 2021 the Group was in compliance with all financial covenants.
The carrying amount of short-term borrowings is approximate its fair value due to the short-term maturity. Long term borrowings subject to variable rate approximate their fair value.The fair value of long-term subject to fix rate do not significant differ from their fair value. The fair value (level 2) of the notes as of December 31, 2022 and 2021 equals US$474.3 million and US$517.5 million, 94.86 % and 103.49 % of the nominal amount, respectively.
The breakdown of the Group’s borrowing by currency is included in Note 2 - Interest rate risk.
Evolution of the Group's borrowings as December 31, 2022 and 2021 is as follow:
| 2022 | 2021 | ||||||||||
| Amount at the beginning of the year | |||||||||||
| Proceeds from long term borrowings | |||||||||||
| Payments of long term borrowings | ( | ( | |||||||||
| Proceeds from short term borrowings | |||||||||||
| Payments of short term borrowings | ( | ( | |||||||||
| Payments of interest (1) | ( | ( | |||||||||
| Accrued interest | |||||||||||
| Acquisition of subsidiaries (Note 21) | |||||||||||
| Exchange differences, inflation and translation, net | ( | ( | |||||||||
| Others | |||||||||||
| Amount at the end of the year | |||||||||||
(1) Excludes payment of interest related to trade and other payables.
27. Lease liabilities
| 2022 | 2021 | ||||||||||
| Lease liabilities | |||||||||||
| Non-current | |||||||||||
| Current | |||||||||||
F- 68
Adecoagro S.A.
Notes to the Consolidated Financial Statements (Continued)
(All amounts in US$ thousands, except shares and per share data and as otherwise indicated)
27. Lease liabilities (continued)
The maturity of the Group’s lease liabilities is as follows:
| 2022 | 2021 | ||||||||||
| Less than 1 year | |||||||||||
| Between 1 and 2 years | |||||||||||
| Between 2 and 3 years | |||||||||||
| Between 3 and 4 years | |||||||||||
| Between 4 and 5 years | |||||||||||
| More than 5 years | |||||||||||
Changes in the Group’s lease liabilities, net in 2022 and 2021 were as follows:
| Agricultural "partnerships" | Others | Total | |||||||||||||||
| Amount at the beginning of the year 2021 | |||||||||||||||||
| Exchange differences | ( | ( | |||||||||||||||
| Additions and re-measurement | |||||||||||||||||
| Payments | ( | ( | ( | ||||||||||||||
| Finance cost related to lease liabilities | |||||||||||||||||
| Closing net book amount | |||||||||||||||||
| Amount at the beginning of the year 2022 | |||||||||||||||||
| Exchange differences | |||||||||||||||||
| Additions and re-measurement | |||||||||||||||||
| Disposal | ( | ( | ( | ||||||||||||||
| Payments | ( | ( | ( | ||||||||||||||
| Finance cost related to lease liabilities | |||||||||||||||||
| Closing net book amount | |||||||||||||||||
F- 69
Adecoagro S.A.
Notes to the Consolidated Financial Statements (Continued)
(All amounts in US$ thousands, except shares and per share data and as otherwise indicated)
28. Payroll and social security liabilities
| 2022 | 2021 | ||||||||||
| Non-current | |||||||||||
| Social security payable | |||||||||||
| Current | |||||||||||
| Salaries payable | |||||||||||
| Social security payable | |||||||||||
| Provision for vacations | |||||||||||
| Provision for bonuses | |||||||||||
| Total payroll and social security liabilities | |||||||||||
29. Provisions for other liabilities
The Group is subject to several laws, regulations and business practices of the countries where it operates. In the ordinary course of business, the Group is subject to certain contingent liabilities with respect to existing or potential claims, lawsuits and other proceedings, including those involving tax, labor and social security, administrative and civil and other matters. The Group accrues liabilities when it is probable that future costs will be incurred and it can reasonably estimate them. The Group bases its accruals on up-to-date developments, estimates of the outcomes of the matters and legal counsel experience in contesting, litigating and settling matters. As the scope of the liabilities becomes better defined or more information is available, the Group may be required to change its estimates of future costs, which could have a material effect on its results of operations and financial condition or liquidity.
The table below shows the movements in the Group's provisions for other liabilities categorized by type of provision:
| Labor, legal and other claims | Others | Total | |||||||||||||||
| At January 1, 2021 | |||||||||||||||||
| Additions | |||||||||||||||||
| Used during year | ( | ( | ( | ||||||||||||||
| Exchange differences | ( | ( | ( | ||||||||||||||
| At December 31, 2021 | |||||||||||||||||
| Additions | |||||||||||||||||
| Acquisition of subsidiaries | |||||||||||||||||
| Used during year | ( | ( | ( | ||||||||||||||
| Exchange differences | ( | ||||||||||||||||
| At December 31, 2022 | |||||||||||||||||
Analysis of total provisions:
| 2022 | 2021 | ||||||||||
| Non current | |||||||||||
| Current | |||||||||||
The Group is engaged in several legal proceedings, including tax, labor, civil, administrative and other proceedings in Brazil, which qualified as contingent liabilities for an aggregate claimed nominal amount of US$78.5 million and US$72.1 million as of December 31, 2022 and 2021, respectively. These amounts refers to a claim of the tax authorities in Brazil of the
F- 70
Adecoagro S.A.
Notes to the Consolidated Financial Statements (Continued)
(All amounts in US$ thousands, except shares and per share data and as otherwise indicated)
29. Provisions for other liabilities (continued)
F- 71
Adecoagro S.A.
Notes to the Consolidated Financial Statements (Continued)
(All amounts in US$ thousands, except shares and per share data and as otherwise indicated)
30. Group companies
The following table details the subsidiaries that comprised the Group as of December 31, 2022 and 2021:
| 2022 | 2021 | ||||||||||||||||||||||
| Activities | Country of incorporation and operation | Ownership percentage held if not 100 % | Ownership percentage held if not 100 % | ||||||||||||||||||||
| Details of principal subsidiary undertakings: | |||||||||||||||||||||||
| Operating companies (unless otherwise stated): | |||||||||||||||||||||||
| Adeco Agropecuaria S.A. | (a) | Argentina | |||||||||||||||||||||
| Pilagá S.A. | (a) | Argentina | % | % | |||||||||||||||||||
| Cavok S.A. | (a) | Argentina | % | % | |||||||||||||||||||
| Establecimientos El Orden S.A. | (a) | Argentina | % | % | |||||||||||||||||||
| Bañado del Salado S.A. | (a) | Argentina | |||||||||||||||||||||
| Agro Invest S.A. | (a) | Argentina | % | % | |||||||||||||||||||
| Forsalta S.A. | (a) | Argentina | % | % | |||||||||||||||||||
| Dinaluca S.A. | (a) | Argentina | |||||||||||||||||||||
| Compañía Agroforestal S.M.S.A. | (a) | Argentina | |||||||||||||||||||||
| Energía Agro S.A.U. | (a) | Argentina | |||||||||||||||||||||
| L3N S.A. | (d) | Argentina | |||||||||||||||||||||
| Maní del Plata S.A. | (a) | Argentina | |||||||||||||||||||||
| Girasoles del Plata S.A. | (a) | Argentina | |||||||||||||||||||||
| Molinos Libres S.A.U. | (a) | Argentina | |||||||||||||||||||||
| Adeco Agropecuaria Brasil Ltda. | (b) | Brazil | |||||||||||||||||||||
| Adecoagro Vale do Ivinhema S.A. ("AVI") | (b) | Brazil | |||||||||||||||||||||
| Usina Monte Alegre Ltda. ("UMA") | (b) | Brazil | |||||||||||||||||||||
| Adecoagro GD LTDA. | (b) | Brazil | |||||||||||||||||||||
| Monte Alegre Combustiveis Ltda. | (b) | Brazil | |||||||||||||||||||||
| Adecoagro Energia Ltda. | (b) | Brazil | |||||||||||||||||||||
| Adecoagro Agricultura e Participação Ltda. | (b) | Brazil | |||||||||||||||||||||
| Methanum Engenharia Ambiental Ltda. | (b) | Brazil | |||||||||||||||||||||
| Angelica Energia Ltda. | (b) | Brazil | |||||||||||||||||||||
| Ivinhema Energia Ltda. | (b) | Brazil | |||||||||||||||||||||
| Kelizer S.A. | (a) | Uruguay | |||||||||||||||||||||
| Adecoagro Uruguay S.A. | (a) | Uruguay | |||||||||||||||||||||
| Arroz del Plata S.A. (ex Viterra Uruguay S.A.) | (a) | Uruguay | |||||||||||||||||||||
| Paso Dragón S.A. | (a) | Uruguay | |||||||||||||||||||||
| Adecoagro Chile S.P.A | (a) | Chile | |||||||||||||||||||||
| Holdings companies: | |||||||||||||||||||||||
| Adecoagro Brasil Participações S.A. | — | Brazil | |||||||||||||||||||||
| Adecoagro LP S.C.S. | — | Luxembourg | |||||||||||||||||||||
| Adecoagro GP S.a.r.l. | — | Luxembourg | |||||||||||||||||||||
| Ladelux S.A. | — | Uruguay | |||||||||||||||||||||
| Spain Holding Companies | (c) | Spain | |||||||||||||||||||||
(a) Mainly crops, rice, cattle and others.
(b) Mainly sugarcane, ethanol and energy.
(c) Comprised by (1) wholly owned subsidiaries: Kadesh Hispania S.L.U.; Leterton España S.L.U.; Global Asterion S.L.U.; Global Acasto S.L.U.; Global Laertes S.L.U.; Global Pindaro S.L.U.; Global Pileo S.L.U.; Peak Texas S.L.U.; Global Neimoidia S.L.U. and 51% controlled subsidiaries; Global Acamante S.L.U.; Global Carelio S.L.U.; Global Calidon S.L.U.; Global Mirabilis S.L.U. Global Anceo S.L.U.Global Hisingen S.L.U.
(d) Mainly dairy.
F- 72
Adecoagro S.A.
Notes to the Consolidated Financial Statements (Continued)
(All amounts in US$ thousands, except shares and per share data and as otherwise indicated)
30. Group companies (continued)
The percentage voting right for each principal subsidiary is the same as the percentage of capital stock held. Issued share capital represents only ordinary shares/ quotas, units or their equivalent. There are no preference shares or units issued in any subsidiary undertaking.
31. Related-party transactions
The following is a summary of the balances and transactions with related parties:
| Related party | Relationship | Description of transaction | Income (loss) included in the statement of income | Balance receivable (payable)/(equity) | ||||||||||||||||||||||||||||||||||||||||
| 2022 | 2021 | 2020 | 2022 | 2021 | ||||||||||||||||||||||||||||||||||||||||
| Management and selected employees | Employment | Compensation selected employees | ( | ( | ( | ( | ( | |||||||||||||||||||||||||||||||||||||
32. Critical accounting estimates and judgments
Critical accounting policies are those that are most important to the portrayal of the Group’s financial condition, results of operations and cash flows, and require management to make difficult, subjective or complex judgments and estimates about matters that are inherently uncertain. Management bases its estimates on historical experience and other assumptions that it believes are reasonable. The Group’s critical accounting policies are discussed below.
Actual results could differ from estimates used in employing the critical accounting policies and these could have a material impact on the Group’s results of operations. The Group also has other policies that are considered key accounting policies, such as the policy for revenue recognition. However, these other policies, which are discussed in the notes to the Group’s financial statements, do not meet the definition of critical accounting estimates, because they do not generally require estimates to be made or judgments that are difficult or subjective.
(a) Impairment of non-financial assets
At the date of each statement of financial position, the Group reviews the carrying amounts of its property, plant and equipment and finite lived intangible assets to determine whether there is any indication that those assets could have suffered an impairment loss. If any such indication exists, the recoverable amount of the asset is estimated in order to determine the extent, if any, of the impairment loss. Where the asset does not generate cash flows that are independent from other assets, the Group estimates the recoverable amount of the cash-generating unit to which the asset belongs. The Group’s property, plant and equipment items generally do not generate independent cash flows.
In the case of goodwill, any goodwill acquired is allocated to the cash-generating unit (‘CGU’) expected to benefit from the business combination. CGU to which goodwill is allocated is tested for impairment annually (every September), or more frequently if events or changes in circumstances indicate that the carrying amount of the CGU may be impaired. The carrying amount of the CGU is compared to its recoverable amount, which is the higher of fair value less costs to sell and the value in use. An impairment loss is recognized for the amount by which the carrying amount exceeds its recoverable amount. The impairment review requires management to undertake certain significant judgments, including estimating the recoverable value of the CGU to which goodwill is allocated, based on either fair value less costs-to-sell or the value-in-use, as appropriate, in order to reach a conclusion on whether it deems the goodwill is impaired or not.
For purposes of the impairment testing, each CGU represents the smallest identifiable group of assets that generate cash inflows that are largely independent of the cash inflows from other assets or group of assets.
F- 73
Adecoagro S.A.
Notes to the Consolidated Financial Statements (Continued)
(All amounts in US$ thousands, except shares and per share data and as otherwise indicated)
32. Critical accounting estimates and judgments (continued)
Farmlands may be used for different activities that may generate independent cash flows. For those farmlands that are used for more than one segment activity (i.e. crops and cattle or rental income), the farmland is further subdivided into two or more CGUs, as appropriate, for purposes of impairment testing. For its properties in Brazil, management identified a farmland together with its related mill as separate CGUs. Most of the farmlands in Argentina and Uruguay are treated as single CGUs.
Based on these criteria, management identified a total amount of 42 CGUs as of September 30, 2022 and 39 CGUs as of September 30, 2021.
As of September 30, 2022 and 2021, due to the fact that there were no impairment indicators, the Group only tested those CGUs with allocated goodwill in Argentina and Brazil.
CGUs tested based on a fair-value-less-costs-to-sell model at September 30, 2022 and 2021:
As of September 30, 2022, the Group identified 10 CGUs in Argentina (2021: 10 CGUs) to be tested based on this model (all CGUs with allocated goodwill). Estimating the fair value less costs-to-sell is based on the best information available, and refers to the amount at which the CGU could be bought or sold in a current transaction between willing parties. Management may be assisted by the work of independent experts. When using this model, the Group applies the “sales comparison approach” as its method of valuing most properties, which relies on results of sales of similar agricultural properties to estimate the value of the CGU. This approach is based on the theory that the fair value of a property is directly related to the selling prices of similar properties.
Fair values are determined by extensive analysis which includes current and potential soil productivity of the land (the ability to produce crops and maintain livestock) projected margins derived from soil use, rental value obtained for soil use, if applicable, and other factors such as climate and location. Farmland ratings are established by considering such factors as soil texture and quality, yields, topography, drainage and rain levels. Farmland may contain farm outbuildings. A farm outbuilding is any improvement or structure that is used for farming operations. Outbuildings are valued based on their size, age and design.
Based on the factors described above, each farm property is assigned different soil classifications for the purposes of establishing a value, Soil classifications quantify the factors that contribute to the agricultural capability of the soil. Soil classifications range from the most productive to the least productive.
The first step to establishing an assessment for a farm property is a sales investigation that identifies the valid farm sales in the area where the farm is located. A price per hectare is assigned for each soil class within each farm property. This price per hectare is determined based on the quantitative and qualitative analysis mainly described above.
The results are then tested against actual sales, if any, and current market conditions to ensure the values produced are accurate, consistent and fair.
F- 74
Adecoagro S.A.
Notes to the Consolidated Financial Statements (Continued)
(All amounts in US$ thousands, except shares and per share data and as otherwise indicated)
32. Critical accounting estimates and judgments (continued)
| CGU / Operating segment / Country | September 30, 2022 | September 30, 2021 | ||||||||||||
| La Carolina / Crops / Argentina | ||||||||||||||
| La Carolina / Cattle / Argentina | ||||||||||||||
| El Orden / Crops / Argentina | ||||||||||||||
| El Orden / Cattle / Argentina | ||||||||||||||
| La Guarida / Crops / Argentina | ||||||||||||||
| La Guarida / Cattle / Argentina | ||||||||||||||
| Los Guayacanes / Crops / Argentina | ||||||||||||||
| Doña Marina / Rice / Argentina | ||||||||||||||
| El Colorado / Crops / Argentina | ||||||||||||||
| El Colorado / Cattle / Argentina | ||||||||||||||
| Closing net book value of goodwill allocated to CGUs tested (Note 15) | ||||||||||||||
| Closing net book value of PPE items allocated to CGUs tested | ||||||||||||||
| Total assets allocated to CGUs tested | ||||||||||||||
Based on the testing above, the Group determined that none of the CGUs, with allocated goodwill, were impaired at September 30, 2022 and 2021.
CGUs tested based on a value-in-use model at September 30, 2022 and 2021:
As of September 30, 2022, the Group identified 2 CGUs (2021: 2 CGUs) in Brazil to be tested based on this model (all CGUs with allocated goodwill). The determination of the value-in-use calculation required the use of significant estimates and assumptions related to management’s cash flow projections. In performing the value-in-use calculation, the Group applied pre-tax rates to discount the future pre-tax cash flows. In each case, these key assumptions have been made by management reflecting past experience and are consistent with relevant external sources of information, such as appropriate market data. In calculating value-in-use, management may be assisted by the work of external advisors.
The key assumptions used by management in the value-in-use calculations which are considered to be most sensitive to the calculation are:
| Key Assumptions | September 30, 2022 | September 30, 2021 | ||||||||||||
| Financial projections | Covers | Covers | ||||||||||||
Covers | Covers | |||||||||||||
| Yield average growth rates | ||||||||||||||
| Future pricing increases | ||||||||||||||
| Future cost decrease | ||||||||||||||
| Discount rates | ||||||||||||||
| Perpetuity growth rate | ||||||||||||||
(*) UMA stands for Usina Monte Alegre LTDA.
(**) AVI stands for Adecoagro Vale Do Ivinhema S.A.
Discount rates are based on the risk-free rate for U. S. government bonds, adjusted for a risk premium to reflect the increased risk of investing in South America and Brazil in particular. The risk premium adjustment is assessed for factors specific to the respective CGUs and reflects the countries that the CGUs operate in.
F- 75
Adecoagro S.A.
Notes to the Consolidated Financial Statements (Continued)
(All amounts in US$ thousands, except shares and per share data and as otherwise indicated)
32. Critical accounting estimates and judgments (continued)
The following table shows only the 2 CGUs where goodwill was allocated at each period end and the corresponding amount of goodwill allocated to each one:
| CGU/ Operating segment | September 30, 2022 | September 30, 2021 | ||||||||||||
| AVI / Sugar, Ethanol and Energy | ||||||||||||||
| UMA / Sugar, Ethanol and Energy | ||||||||||||||
| Closing net book value of goodwill allocated to CGUs tested (Note 15) | ||||||||||||||
| Closing net book value of PPE items allocated to CGUs tested | ||||||||||||||
| Total assets allocated to 2 CGUs tested | ||||||||||||||
Based on the testing above, the Group determined that none of the CGUs, with allocated goodwill, were impaired at September 30, 2022 and 2021.
Management views these assumptions are conservative and does not believe that any reasonable change in the assumptions would cause the carrying value of these CGU’s to exceed the recoverable amount.
The Group’s goodwill and property, plant and equipment balances allocated to the cash generating units with allocated goodwill in Argentina were US$ 14.3 million and US$ 143.9 million, respectively, and goodwill and property, plant and equipment allocated to the cash generating units with allocated goodwill in Brazil were US$ 4.2 million and U$S 534 million, respectively as of December 31, 2022.
As of December 31, 2022, the Group determined that there are no indicators of impairment.
(b) Biological assets
The nature of the Group’s biological assets and the basis of determination of their fair value are explained under Note 33.11. The discounted cash flow model requires the input of highly subjective assumptions including observable and unobservable data. Generally the estimation of the fair value of biological assets is based on models or inputs that are not observable in the market and the use of such unobservable inputs is significant to the overall valuation of the assets. These inputs are determined based on the best information available, for example by reference to historical information of past practices and results, statistical and agronomic information, and other analytical techniques. The discounted cash flow model includes significant assumptions relating to the cash flow projections including future market prices, estimated yields at the point of harvest, estimated production cycle, future costs of harvesting and other costs, and estimated discount rate.
Market prices are generally determined by reference to observable data in the principal market for the agricultural produce. Harvesting costs and other costs are estimated based on historical and statistical data. Yields are estimated based on several factors including the location of the farmland and soil type, environmental conditions, infrastructure and other restrictions and growth at the time of measurement. Yields are subject to a high degree of uncertainty and may be affected by several factors out of the Group’s control including but not limited to extreme or unusual weather conditions, plagues and other crop diseases, among other factors.
The significant assumptions discussed above are highly sensitive. Reasonable shifts in assumptions including but not limited to increases or decreases in prices, costs and discount factors used would result in a significant increase or decrease to the fair value of biological assets. In addition, cash flows are projected over a number of years and based on estimated production. Estimates of production in themselves are dependent on various assumptions, in addition to those described above, including but not limited to several factors such as location, environmental conditions and other restrictions. Changes in these estimates could materially impact on estimated production, and could therefore affect estimates of future cash flows used in the assessment of fair value (see Note 16).
F- 76
Adecoagro S.A.
Notes to the Consolidated Financial Statements (Continued)
(All amounts in US$ thousands, except shares and per share data and as otherwise indicated)
32. Critical accounting estimates and judgments (continued)
(c) Income taxes
The Group is subject to income taxes in numerous jurisdictions. Significant judgment is required in determining the worldwide provision for income taxes. There are many transactions and calculations for which the ultimate tax determination is uncertain. The Group recognizes liabilities for anticipated tax audit issues based on estimates of whether additional taxes will be due. Where the final tax outcome of these matters is different from the amounts that were initially recorded, such differences will impact the current and deferred income tax assets and liabilities in the period in which such determination is made.
Deferred tax assets are reviewed each reporting date and reduced to the extent that it is no longer probable that sufficient taxable income will be available to allow all or part of the asset to be settled. Deferred tax assets and liabilities are not discounted. The ultimate realization of deferred tax assets is dependent upon the generation of future taxable income during the periods in which those temporary differences become deductible. Management considers the scheduled reversal of deferred tax liabilities, projected future taxable income and tax planning strategies in making this assessment (see Note 10).
(d) Fair value for farmlands and investment property
Property, plant and equipment
Farmlands are recognized at fair value based on periodic, but at least annual, valuations prepared by an external independent expert. A revaluation reserve is credited in shareholders’ equity. The valuation is determined using sales comparison approach. Sale prices of comparable properties are adjusted considering the specific aspects of each property, the most relevant premise being the price per hectare (Level 3) (see Note 12).
Investment property
Investment property consists of farmland for rental or for capital appreciation and not used in production or for sale in the ordinary course of business, and it is measured at fair value. The changes in the fair value, which is based on an independent external expert, impacts the profit and loss of the period, in the line item Other operating income, net (see Note 14).
(e) Purchase price allocation
The acquisition method of accounting is used to account for all acquisitions. Under this method, assets acquired and liabilities assumed of the Company are measured at fair value for financial reporting purposes. In estimating the fair value of an asset or a liability, the Company uses market-observable data to the extent it is available. Where Level 1 inputs are not available, the Company estimates the fair value of an asset or a liability by converting future amounts (e.g. cash flows or income and expenses) to a single current (i.e. discounted) amount.
Management applied judgement in estimating the fair value of certain identifiable assets acquired, which involved the use of estimates and assumptions, including the timing and amounts of cash flow projections and discount rates, as applicable.
F- 77
Adecoagro S.A.
Notes to the Consolidated Financial Statements (Continued)
(All amounts in US$ thousands, except shares and per share data and as otherwise indicated)
33. Summary of significant accounting policies
The principal accounting policies applied in the preparation of these Consolidated Financial Statements are set out below. These policies have been consistently applied to all the years presented, unless otherwise stated.
Financial reporting in a hyperinflation economy
IAS 29 “Financial Reporting in Hyperinflationary Economies” requires that the financial statements of entities whose functional currency is that of a hyperinflationary economy to be adjusted for the effects of changes in a suitable general price index and to be expressed in terms of the current unit of measurement at the closing date of the reporting period. Accordingly, the inflation produced from the date of acquisition or from the revaluation date, as applicable, must be computed in the non-monetary items.
In order to conclude on whether an economy is categorized as hyperinflationary under the terms of IAS 29, the Standard details a series of factors to be considered, including the existence of a cumulative inflation rate in three years that approximates or exceeds 100 %.
Since 2018, when cumulative inflation rate in three years exceeded the 100% threshold, Argentina’s operations are considered to be under hyperinflationary economy for accounting purposes under the terms of IAS 29 and since then, it has been applied IAS 29 in the financial reporting of its subsidiaries and associates with Argentine peso as functional currency.
Financial statements of a foreign entity with a functional currency of a country that has a highly inflationary economy, are restated to reflect changes in the general price level or index in that country before translation into U.S. Dollars. In adjusting for hyperinflation, a general price index is applied to all non-monetary items in the financial statements (including equity) and the resulting gain or loss, which is the gain or loss on the entity's net monetary position, is recognized in the income statement. Monetary items in the closing statement of financial position are not adjusted. The Group treated all Argentine subsidiaries as a hyperinflationary economy as all of them have argentine peso as functional currency. The results and financial position of all foreign entities with a functional currency of a country that has a highly inflationary economy are translated at closing rates after the restatement for changes in the general purchasing power argentine peso.
The inflation adjustment on the years 2022, 2021 and 2020 was calculated by means of conversion factor derived from the Argentine price indexes published by the National Institute of Statistics and the year-over-year change in the index was 1.9479; 1.509 and 1.361, respectively.
The main procedures for the above-mentioned adjustment are as follows:
•Monetary assets and liabilities which are carried at amounts current at the balance sheet date are not restated because they are already expressed in terms of the monetary unit current at the balance sheet date.
•Non-monetary assets and liabilities which are not carried at amounts current at the balance sheet date, and components of shareholders' equity are adjusted by applying the relevant conversion factors.
•All items in the income statement are restated by applying the relevant conversion factors.
•The effect of inflation on the Company’s net monetary position is included in the income statement, in "Other financial results" (Note 9).
•The ongoing application of the re-translation of comparative amounts to closing exchanges rates under IAS 21 and the hyperinflation adjustments required by IAS 29 will lead to a difference in addition to the difference arising on the application of hyperinflation accounting.
The comparative figures in these Consolidated Financial Statements presented in a stable currency are not adjusted for subsequent changes in the price level or exchange rates. This resulted in a difference between the closing equity of the previous year and the opening equity of the current year. The Company recognized this initial difference directly in equity.
F- 78
Adecoagro S.A.
Notes to the Consolidated Financial Statements (Continued)
(All amounts in US$ thousands, except shares and per share data and as otherwise indicated)
33.1 Basis of preparation and presentation
The Consolidated Financial Statements of the Group have been prepared in accordance with International Financial Reporting Standards (IFRS) of the International Accounting Standards Board (IASB) and the Interpretations of the International Financial Reporting Interpretations Committee (IFRIC). All IFRS issued by the IASB, effective at the time of preparing these Consolidated Financial Statements have been applied.
The Consolidated Financial Statements have been prepared under the historical cost convention as modified by financial assets and financial liabilities (including derivative instruments) at fair value through profit or loss, biological assets and agricultural produce at the point of harvest and farmlands measured at fair value.
The preparation of Consolidated Financial Statements in conformity with IFRS requires the use of certain critical accounting estimates. It also requires management to exercise its judgment in the process of applying the Group’s accounting policies. The areas involving a higher degree of judgment or complexity, or areas where assumptions and estimates are significant to the Consolidated Financial Statements are disclosed in Note 33.
New standards and interpretations not yet adopted
Certain new accounting standards and interpretations have been published that are not mandatory for 31 December 2021 reporting periods and have not been early adopted by the group. These standards are not expected to have a material impact on the entity in the current or future reporting periods and on foreseeable future transactions.
33.2 Scope of consolidation
The Consolidated Financial Statements include the results of the Company and all of its subsidiaries from the date that control commences to the date that control ceases. They also include the Group’s share of the net income of its jointly-controlled entities on an equity-accounted basis from the point at which joint control commences, to the date that it ceases.
(a) Subsidiaries
Subsidiaries are all entities over which the Group has control. The Group controls an entity when the Group is exposed to, or has rights to, variable returns from its involvement with the entity and has the ability to affect those returns through its power over the entity. Subsidiaries are fully consolidated from the date that control commences and deconsolidated from the date that control ceases.
The Group uses the acquisition method of accounting to account for business combinations. The consideration transferred for the acquisition of a subsidiary is the fair value of the assets transferred, the liabilities incurred and the equity interests issued by the Group. The consideration transferred includes the fair value of any asset or liability resulting from a contingent consideration arrangement. Acquisition-related costs are expensed as incurred. Identifiable assets acquired and liabilities and contingent liabilities assumed in a business combination are measured initially at their fair values at the acquisition date.
The Group recognizes any non-controlling interest in the acquiree on an acquisition-by-acquisition basis either at fair value or at the non-controlling interest’s proportionate share of the acquiree’s net assets.
The excess of the consideration transferred, the amount of any non-controlling interest in the acquiree and the acquisition-date fair value of any previous equity interest in the acquiree over the fair value of the identifiable net assets acquired is recorded as goodwill. The excess of consideration over the fair value of the Group’s share of the identifiable net assets acquired is recorded as goodwill. If the consideration is less than the fair value of the net assets of the subsidiary acquired, the difference is recognized directly in the statement of income under the line item “Bargain purchase gain on acquisition”.
Inter-company transactions, balances and unrealized gains on transactions between group companies are eliminated. Unrealized losses are also eliminated. Accounting policies of subsidiaries have been changed where necessary to ensure consistency with the policies adopted by the Group.
F- 79
Adecoagro S.A.
Notes to the Consolidated Financial Statements (Continued)
(All amounts in US$ thousands, except shares and per share data and as otherwise indicated)
33.2 Scope of consolidation (continued)
(b) Disposal of subsidiaries
When the Group ceases to have control any retained interest in the entity is re-measured to its fair value at the date when control is lost, with the change in carrying amount recognized in profit or loss. The fair value is the initial carrying amount for the purposes of subsequently accounting for the retained interest as an associate, joint venture or financial asset. In addition, any amount previously recognized in other comprehensive income in respect of that entity is accounted for as if the Group had directly disposed of the related assets or liabilities. This may mean that amounts previously recognized in other comprehensive income are reclassified to profit or loss, except for the related revaluation surplus which is reclassified to retained earnings.
33.3 Segment reporting
According to IFRS 8, operating segments are identified based on the ‘management approach’. This approach stipulates external segment reporting based on the Group’s internal organizational and management structure and on internal financial reporting to the chief operating decision maker (the Management Committee in the case of the Company)
33.4 Foreign currency translation
(a) Functional and presentation currency
Items included in the financial statements of each of the Group’s entities are measured using the currency of the primary economic environment in which the entity operates (‘the functional currency’). The Consolidated Financial Statements are presented in US dollars, which is the Group’s presentation currency.
Argentine currency status
Since the second half of 2019, the Argentine government instituted certain foreign currency exchange controls, which may restrict or partially restrict access to foreign currency, like the U.S. dollars, to make payments abroad, either for foreign debt or the importation of goods or services, dividend payments and others, without prior authorization. Those regulations have continued to evolve, sometimes making them more or less stringent depending on the Argentine government’s perception of availability of sufficient national foreign currency reserves. The above has led to the existence of an informal foreign currency market where foreign currencies quote at levels significantly higher than the official exchange rate. However, the only exchange rate available for external commerce is the official exchange rate, which as of December 31, 2022 was Pesos 177 per dollar.
We use Argentina’s official exchange rate to record the accounts of Argentine subsidiaries.
(b) Transactions and balances
Foreign currency transactions are translated into the functional currency using the exchange rates prevailing at the dates of the transactions or valuation where items are remeasured. Foreign exchange gains and losses resulting from the settlement of such transactions and from the translation at year-end exchange rates of monetary assets and liabilities denominated in foreign currencies are recognized in the statement of income, in the line Item “Finance income” or “Finance cost,”as appropriate.
(c) Group companies
The results and financial position of Group entities (except those that has the currency of a hyper-inflationary economy - Argentine subsidiaries) that have a functional currency different from the presentation currency are translated into the presentation currency as follows:
•assets and liabilities for each statement of financial position presented are translated at the closing rate at the date of that statement of financial position;
F- 80
Adecoagro S.A.
Notes to the Consolidated Financial Statements (Continued)
(All amounts in US$ thousands, except shares and per share data and as otherwise indicated)
33.4 Foreign currency translation (continued)
•income and expenses for each statement of income are translated at average exchange rates (unless this average is not a reasonable approximation of the cumulative effect of the rates prevailing on the transaction dates, in which case income and expenses are translated at the rate on the dates of the transactions); and
•all resulting exchange differences are recognized as a separate component of equity.
When a foreign operation is sold, exchange differences that were recorded in equity are recognized in the statement of income as part of the gain or loss on sale.
Goodwill and fair value adjustments arising on the acquisition of a foreign entity are treated as assets and liabilities of the foreign entity and translated at the closing rate.
33.5 Property, plant and equipment
Farmlands are initially recorded at fair value and subsequently under the revaluation model based on periodic, but at least annual, valuations prepared by an external independent expert. A revaluation reserve is credited in shareholders’ equity. All other property, plant and equipment is recorded at cost, less accumulated depreciation and impairment losses, if any. Historical cost comprises the purchase price and any costs directly attributable to the acquisition. Under the definition of Property plant and equipment is included the bearer plants, such as sugarcane and coffee trees.
Where individual components of an item of property, plant and equipment have different useful lives, they are accounted for as separate items, which are depreciated separately.
Subsequent costs are included in the asset’s carrying amount or recognized as a separate asset, as appropriate, only when it is probable that future economic benefits associated with the item will flow to the Group and the cost of the item can be measured reliably. The carrying amount of the replaced part is derecognized. All other repairs and maintenance are charged to the statement of income when they are incurred.
Gains and losses on disposals are determined by comparing the proceeds with the carrying amount and are recognized within “Other operating income, net” in the consolidated statement of income.
33.6 Investment property
Investment property consists of farmland for rental or for capital appreciation and not used in production or for sale in the ordinary course of business, and it is measured at fair value. Changes of the fair value, which is based on an independent external expert, impacts the profit and loss of the period, in the line item Other operating income, net.
33.7 Leases
Leases are recognized as a right-of-use asset and corresponding liability at the date of which the leased asset is available for use by the group. Each lease payment is allocated between the liability and finance cost. The finance cost is charged to profit or loss over the lease period so as to produce a constant periodic rate of interest on the remaining balance of the liability for each period. The right-of-use asset is depreciated over the shorter of the asset's useful life and the lease term on a straight-line basis.
In determining the lease term, the Company considers all facts and circumstances that create an economic incentive to exercise an extension option, or not exercise a termination option. Extension options (or periods after termination options) are only included in the lease term if the lease is reasonably certain to be extended (or not terminated).
Short term leases are recognized on a straight line basis as an expense in the income statement.
The accompanying notes are an integral part of these consolidated financial statements.
F- 81
Adecoagro S.A.
Notes to the Consolidated Financial Statements (Continued)
(All amounts in US$ thousands, except shares and per share data and as otherwise indicated)
33.7 Leases (continued)
Accounting as lessee
The Company recognizes a right-of-use asset and a lease liability at the commencement date of each lease contract that grants the right to control the use of an identified asset during a period of time. The commencement date is the date in which the lessor makes an underlying asset available for use by the lessee. The Company applied exemptions for leases with a duration lower than 12 months, with a value lower than thirty thousand dollars and/or with clauses related to variable payments. These leases have been considered as short-term leases and, accordingly, no right-of-use asset or lease liability have been recognized.
At initial recognition, the right-of-use asset is measured considering:
•The value of the initial measurement of the lease liability;
•Any lease payments made at or before the commencement date, less any lease incentives; and
•Any initial direct costs incurred by the lessee; and
After initial recognition, the right-of-use assets are measured at cost, less any accumulated depreciation and/or impairment losses, and adjusted for any re-measurement of the lease liability.
Depreciation of the right-of-use asset is calculated using the straight-line method over the estimated duration of the lease contract.
The lease liability is initially measured at the present value of the lease payments that are not paid at such date, including the following concepts:
•Variable lease payments that depend on an index or rate, initially measured using the index or rate as of the commencement date;
•Amounts expected to be payable by the lessee under residual value guarantees;
•The exercise price of a purchase option if the lessee is reasonably certain to exercise that option; and
•Payments of penalties for terminating the lease, if the lease term reflects the lessee exercising an option to terminate the lease;
•Fixed payments, less any lease incentives receivable;
After the commencement date, the Company measures the lease liability by:
•Increasing the carrying amount to reflect interest on the lease liability;
•Reducing the carrying amount to reflect lease payments made; and
•Re-measuring the carrying amount to reflect any reassessment or lease modifications.
The above mentioned inputs for the valuation of the right of use assets and lease liabilities including the determination of the contracts within the scope of the standard, the contract term ant interest rate used in the discounted cash flow involved a high degree of management’s estimations.
33.8 Goodwill
Goodwill represents future economic benefits arising from assets that are not capable of being individually identified and separately recognized by the Group on an acquisition. Goodwill on acquisition is initially measured at cost. being the excess of the consideration over the fair value of the Group’s share of net assets of the acquired subsidiary undertaking at the acquisition date. Following initial recognition, goodwill is measured at cost less any accumulated impairment losses. It is allocated to those cash generating units expected to benefit from the acquisition for the purpose of impairment testing. Goodwill ais included within “Intangible assets” on the statement of financial position. Goodwill arising on the acquisition of foreign entities is treated as an asset of the foreign entity denominated in the local currency and translated at the closing rate.
F- 82
Adecoagro S.A.
Notes to the Consolidated Financial Statements (Continued)
(All amounts in US$ thousands, except shares and per share data and as otherwise indicated)
33.9 Other intangible assets
Other intangible assets that are acquired by the Group, which have finite useful lives, are measured at cost less accumulated amortization and impairment losses, if any. These intangible assets comprise mainly trademarks and computer software and are amortized in the statement of income on a straight-line basis over their estimated useful lives estimated to be 10 to 20 years and 3 to 5 years, respectively.
33.10 Impairment of assets
Goodwill
The Company conducts an impairment test annually or more frequently if events or changes in circumstances indicate that the carrying amount may not be recoverable. An impairment loss is recognized for the amount by which the carrying amount exceeds its recoverable amount. For the purpose of impairment testing, assets are grouped at the lowest levels for which there are separately identifiable cash flows, known as cash-generating units. If the recoverable amount of the cash-generating unit is less than its carrying amount, the impairment loss is allocated first to reduce the carrying amount of any goodwill allocated to the cash generating unit and then to the other assets of the unit pro-rata on the basis of the carrying amount of each asset may in the unit. Impairment losses recognized for goodwill cannot be reversed in a subsequent period. Recoverable amount is the higher of the fair value less costs to sell and value in use. In determining the value in use, the estimated future cash flows are discounted to their present value using a pre-tax discount rate that reflects current market assessments of the time value of money and the risks specific to the asset for which the estimates of future cash flows have not been adjusted (see Note 33 (a) for details).
Property, plant and equipment and finite lived intangible assets
At each statement of financial position date, the Group reviews the carrying amounts of its property, plant and equipment and other intangible assets which have finite lives to determine whether there is any indication that those assets have suffered an impairment loss. If any such indication exists, the recoverable amount of the asset is estimated in order to determine the extent, if any, of the impairment loss. Where the asset does not generate cash flows that are independent from other assets, the Group estimates the recoverable amount of the cash-generating unit to which the asset belongs.
If the recoverable amount of an asset or cash-generating unit is estimated to be less than its carrying amount, that carrying amount is reduced to its recoverable amount. An impairment loss is recognized immediately in the statement of income.
Where an impairment loss subsequently reverses, the carrying amount of the asset or cash-generating unit is increased to the revised estimate of its recoverable amount, not to exceed the carrying amount that would have been determined had no impairment loss been recognized for the asset or cash-generating unit in prior years. A reversal of an impairment loss is recognized immediately in the statement of income.
33.11 Biological assets
Biological assets comprise growing crops (mainly corn, wheat, soybeans, sunflower peanuts and rice), sugarcane, coffee and livestock (growing herd and cattle for dairy production).
The Group distinguishes between consumable and bearer biological assets, and between mature and immature biological assets. “Consumable” biological assets are those assets that may be harvested as agriculture produce or sold as biological assets, for example livestock intended for dairy production. “Bearer” biological assets are those assets capable of producing more than one harvest, for example sugarcane or livestock from which raw milk is produced. “Mature” biological assets are those that have attained harvestable specifications (for consumable biological assets) or are able to sustain regular harvests (for bearer biological assets). “Immature” biological assets are those assets other than mature biological assets.
F- 83
Adecoagro S.A.
Notes to the Consolidated Financial Statements (Continued)
(All amounts in US$ thousands, except shares and per share data and as otherwise indicated)
33.11 Biological assets (continued)
Costs are capitalized as biological assets if, and only if, (a) it is probable that future economic benefits will flow to the entity, and (b) the cost can be measured reliably. The Group capitalizes costs such as: planting, harvesting, weeding, seedlings, irrigation, agrochemicals, fertilizers and a systematic allocation of fixed and variable production overheads that are directly attributable to the management of biological assets, among others. Costs that are expensed as incurred include administration and other general overhead and unallocated production overhead, among others.
Biological assets, both at initial recognition and at each subsequent reporting date, are measured at fair value less costs to sell, except where fair value cannot be reliably measured. Cost approximates fair value when little biological transformation has taken place since the costs were originally incurred or the impact of biological transformation on price is not expected to be material.
Gains and losses that arise on measuring biological assets at fair value less costs to sell and measuring agricultural produce at the point of harvest at fair value less costs to sell are recognized in the statement of income in the period in which they arise in the line item “Initial recognition and changes in fair value of biological assets and agricultural produce”.
Where there is an active market for a biological asset or agricultural produce, quoted market prices in the most relevant market are used as a basis to determine the fair value. Otherwise, when there is no active market or market-determined prices are not available, fair value of biological assets is determined through the use of valuation techniques.
Therefore, the fair value of biological assets is generally derived from the expected discounted cash flows of the related agricultural produce. The fair value of the agricultural produce at the point of harvest is generally derived from market determined prices.
A general description of the determination of fair values based on the Company’s business segments follow:
•Growing crops including rice:
Growing crops, for which biological growth is not significant, are measured at cost, which approximates fair value. Expenditure on growing crops includes land preparation expenses and other direct expenses incurred during the sowing period including labor, seedlings, agrochemicals and fertilizers among others.
Otherwise, biological assets are measured at fair value less estimated point-of-sale costs at initial recognition and at any subsequent period. Point-of-sale costs include all costs that would be necessary to sell the assets
The fair value of growing crops including rice is measured based on a formula, which takes into consideration the estimate of crop yields, estimated market prices and costs, and discount rates. Estimated yields are determined based on several factors including location of farmland, environmental conditions and other restrictions and growth at the time of measurement. Yields are multiplied by sown hectares to determine the estimated tons of crops including rice to be obtained. The tons are then multiplied by a net cash flow determined at the future crop prices less the direct costs to be incurred. This amount is discounted at a discount rate, which reflects current market assessments of the assets involved and the time value of money.
•Growing herd and cattle:
Livestock are measured at fair value less estimated point-of-sale costs, with any changes therein recognized in the statement of income, on initial recognition as well as subsequently at each reporting period. The fair value of livestock is determined based on the actual selling prices less estimated point-of-sale costs in the markets where the Group operates.
•Sugarcane:
Sugarcane planting costs form part of Property plant and equipment. The agricultural produce growing on sugarcane is classified as biological assets and are measured at fair value less cost to sell. The fair value of agricultural produce growing on sugarcane depends on the variety, location and maturity of the plantation.
Agricultural produce growing in the Sugarcane, for which biological growth is not significant, is valued at cost, which approximates fair value. Expenditure on the agricultural produce growing in the sugarcane consists mainly of labor,
F- 84
Adecoagro S.A.
Notes to the Consolidated Financial Statements (Continued)
(All amounts in US$ thousands, except shares and per share data and as otherwise indicated)
33.11 Biological assets (continued)
33.12 Inventories
Inventories comprise of raw materials, finished goods (including harvested agricultural produce and manufactured goods) and others.
Harvested agricultural produce (except for rice and milk) are measured at net realizable value until the point of sale because there is an active market in the produce, there is a negligible risk that the produce will not be sold and there is a well-established practice in the industry carrying the inventories at net realizable value. Changes in net realizable value are recognized in the statement of income in the period in which they arise under the line item “Changes in net realizable value of agricultural produce after harvest”.
All other inventories (including rice and milk) are measured at the lower of cost and net realizable value. Cost is determined using the weighted average method.
33.13 Financial assets
Financial assets are classified in the following categories: at fair value through profit or loss and at amortized cost, namely loans and receivables. The classification depends on the purpose for which the financial assets were acquired. Management determines the classification of its financial assets at initial recognition (see Note 17).
(a) Recognition and measurement
Regular purchases and sales of financial assets are recognized on the trade-date – the date on which the Group commits to purchase or sell the asset. Financial assets not carried at fair value through profit or loss are initially recognized at fair value plus transaction costs. Financial assets carried at fair value through profit or loss are initially recognized at fair value and transaction costs are expensed in the statement of income. Financial assets are derecognized when the rights to receive cash flows from the investments have expired or have been transferred and the Group has transferred substantially all risks and rewards of ownership. Financial assets at fair value through profit or loss are subsequently carried at fair value. Loans and receivables are subsequently carried at amortized cost using the effective interest method.
Gains or losses arising from changes in the fair value of the “financial assets at fair value through profit or loss” category are presented in the statement of income within “Other operating income, net” in the period in which they arise.
If the market for a financial asset is not active (and for unlisted securities), the Group establishes fair value by using valuation techniques. These include the use of recent arm’s length transactions, reference to other instruments that are substantially the same, discounted cash flow analysis, and option pricing models, making maximum use of market inputs and relying as little as possible on entity-specific inputs.
The Group assesses at each statement of financial position date whether there is objective evidence that a financial asset or a group of financial assets is impaired. Impairment testing of trade receivables is described in Note 33.15.
(b) Offsetting financial instruments
Financial assets and liabilities are offset and the net amount reported in the statement of financial position when there is a legally enforceable right to offset the recognized amounts and there is an intention to settle on a net basis, or realize the asset and settle the liability simultaneously. This right must not be contingent on future events and must be enforceable in any case.
F- 85
Adecoagro S.A.
Notes to the Consolidated Financial Statements (Continued)
(All amounts in US$ thousands, except shares and per share data and as otherwise indicated)
33.14 Derivative financial instruments and hedging activities
Derivatives are initially recognized at fair value on the date a derivative contract is entered into and are subsequently remeasured at their fair value. Commodity future contract fair values are computed with reference to quoted market prices on future exchanges markets. The fair values of commodity options are calculated using year-end market rates together with common option pricing models. The fair value of interest rate swaps has been calculated using a discounted cash flow analysis.
The Group manages exposures to financial and commodity risks using hedging instruments that provide the appropriate economic outcome. The principal hedging instruments used may include commodity future contracts, put and call options, foreign exchange forward contracts and interest rate swaps. The Group does not use derivative financial instruments for speculative purposes.
The Group’s policy is to apply hedge accounting to hedging relationships where it is both permissible under IFRS 9, practical to do so and its application reduces volatility, but transactions that may be effective hedges in economic terms may not always qualify for hedge accounting under IFRS 9. Any derivatives that the Group holds to hedge these exposures are classified as “held for trading” and are shown in a separate line on the face of the statement of financial position. The method of recognizing gains or losses on derivatives depends on whether the derivative is designated as a hedging instrument, and if so, the nature of the item being hedged. Gains and losses on commodity derivatives are classified within “Other operating income, net”. Gains and losses on interest rate and foreign exchange rate derivatives are classified within ‘Financial results, net’. The Group designates certain derivatives as hedges of the foreign currency risk associated with highly probable forecast transactions (cash flow hedge).
The Group documents at the inception of the transaction the relationship between hedging instruments and hedged items, as well as its risk management objectives and strategy for undertaking various hedging transactions. The Group also documents its assessment, both at hedge inception and on an ongoing basis, of whether the instruments that are used in hedging transactions are highly effective in offsetting changes in fair value or cash flows of hedged items.
Cash flow hedge
The effective portion of the gain or loss on the instruments that are designated and qualify as cash flow hedges is recognized in other comprehensive income. The gain or loss relating to the ineffective portion is recognized immediately in the statement of income within "Finance income” or “Finance cost,”as appropriate.
Amounts accumulated in equity are reclassified to profit or loss in the periods when the hedged item affects profit or loss. The gain or loss relating to the effective portion is recognized in the statement of income within "Finance income” or “Finance cost”, as appropriate.
When a hedging instrument expires or is sold, or when a hedge no longer meets the criteria for hedge accounting, any cumulative gain or loss existing in equity at that time remains in equity and is recognized when the forecast transaction is ultimately recognized in the statement of income. When a forecast transaction is no longer expected to occur, the cumulative gain or loss that was reported in equity is immediately transferred to the statement of income.
33.15 Trade and other receivables and trade and other payables
Trade receivables are recognized initially at fair value and subsequently measured at amortized cost using the effective interest method. In the case of receivables, less allowance for trade receivables.
33.16 Short-term investment
Financial assets at fair value through profit or loss are valued at the initial recognition and subsequently at fair value and recognizing the variation in the Statement of income in the line Financial results.
F- 86
Adecoagro S.A.
Notes to the Consolidated Financial Statements (Continued)
(All amounts in US$ thousands, except shares and per share data and as otherwise indicated)
33.17 Cash and cash equivalents
Cash and cash equivalents includes cash in hand, deposits held at call with banks and other short-term highly liquid investments with original maturities of three months or less. In the statements of cash flows, interest paid is presented within financing cash flows and interest received is presented within investing activities.
33.18 Borrowings
Borrowings are initially recognized at fair value, net of transaction costs incurred. Borrowings are subsequently measured at amortized cost using the effective interest method. Borrowing costs are capitalized during the period of time that is required to complete and prepare the asset for its intended use.
33.19 Provisions
Provisions are recognized when (i) the Group has a present legal or constructive obligation as a result of past events; (ii) it is probable that an outflow of resources will be required to settle the obligation; and (iii) a reliable estimate of the amount of the obligation can be made. Provisions are measured at the present value of the expenditures expected to be required to settle the obligation using a pre-tax rate that reflects current market assessments of the time value of money and the risks specific to the obligation.
33.20 Onerous contracts
33.21 Current and deferred income tax
The Group’s tax benefit or expense for each year comprises the charge for current tax payable and deferred taxation attributable to the Group’s operating subsidiaries. Tax is recognized in the statement of income, except to the extent that it relates to items recognized directly in equity. In this case, the tax is also recognized in equity.
The current income tax charge is calculated on the basis of the tax laws enacted at the date of the statement of financial position in the countries where the Group’s subsidiaries operate and generate taxable income. Management periodically evaluates positions taken in tax returns with respect to situations in which applicable tax regulation is subject to interpretation and considers whether it is probable that a taxation authority will accept an uncertain tax treatment. The Group measures its tax balances either based on the most likely amount or the expected value, depending on which method provides a better prediction of the resolution of the uncertainty. It establishes provisions where appropriate on the basis of amounts expected to be paid to the tax authorities.
Deferred income tax is recognized, using the liability method, on temporary differences arising between the tax bases of assets and liabilities and their carrying amounts in the Consolidated Financial Statements. However, the deferred income tax is not accounted for if it arises from initial recognition of an asset or liability in a transaction other than a business combination that at the time of the transaction affects neither accounting nor taxable profit or loss. Deferred income tax is determined using tax rates (and laws) effective in the countries where the Group’s subsidiaries operate and generate taxable income.
Deferred income tax assets are recognized only to the extent that it is probable that future taxable profit will be available against which the temporary differences can be utilized.
F- 87
Adecoagro S.A.
Notes to the Consolidated Financial Statements (Continued)
(All amounts in US$ thousands, except shares and per share data and as otherwise indicated)
33.21 Current and deferred income tax (continued)
Deferred income tax is provided on temporary differences arising on investments in subsidiaries, except where the timing of the reversal of the temporary difference is controlled by the Group and it is probable that the temporary difference will not reverse in the foreseeable future.
The Group is able to control the timing of dividends from its subsidiaries and hence does not expect to remit overseas earnings in the foreseeable future in a way that would result in a charge to taxable profit. Hence deferred tax is recognized in respect of the retained earnings of overseas subsidiaries only to the extent that, at the date of the statement of financial position, dividends have been accrued as receivable or a binding agreement to distribute past earnings in future has been entered into by the subsidiary.
33.22 Revenue Recognition
The Group’s primary activities comprise agricultural and agro-industrial activities.
The Group’s agricultural activities comprise growing and selling agricultural produce. In accordance with IAS 41 “Agriculture”, cattle are measured at fair value with changes therein recognized in the statement of income as they arise. Agricultural produce is measured at net realizable value with changes therein recognized in the statement of income as they arise. Therefore, sales of agricultural produce and cattle generally do not generate any separate gains or losses in the statement of income.
The Group’s agro-industrial activities comprise the selling of manufactured products (i.e. industrialized rice, milk-related products, ethanol, sugar, energy, among others). These sales are measured at the fair value of the consideration received or receivable, net of returns and allowances, trade and other discounts, and sales taxes, as applicable.
Revenue is recognized when the full control have been transferred to the buyer, recovery of the consideration is probable, the associated costs and possible return of goods can be estimated reliably, and there is no continuing management involvement with the goods. Transfers of control vary depending on the individual terms of the contract of sale. Revenues are recognised when control of the products has transferred, being when the products are delivered to the customer, having this full discretion over the channel and price to sell the products, and there is no unfulfilled obligation that could affect the customer’s acceptance of the products.
The Group also provides certain agricultural-related services such as grain warehousing/conditioning and other services, e.g. handling and drying services. Revenue from services is recognized as services are provided.
The Group leases owned farmland property to third parties under operating lease agreements. Rental income is recognized on a straight-line basis over the period of the lease.
The Group is a party to a 25 -year power agreement for the sale of electricity which expires in 2042. The delivery period starts in April and ends in November of each year. The Group is also a party to two 15 two agreements will expire in 2024 and 2025, respectively. Prices under all the agreements are adjusted annually for inflation. Revenue related to the sale of electricity under these two agreements is recorded based upon output delivered.
33.23 Farmlands sales
The Group’s strategy is to profit from land appreciation value generated through the transformation of its productive capabilities. Therefore, the Group may seek to realize value from the sale of farmland assets and businesses.
Farmland sales are not recognized until (i) the sale is completed, (ii) the Group has determined that it is probable the buyer will pay, (iii) the amount of revenue can be measured reliably, and (iv) the Group has transferred to the buyer the risk of ownership, and does not have a continuing involvement. Gains from “farmland sales” are included in the statement of income under the line item “Other operating income, net”.
F- 88
Adecoagro S.A.
Notes to the Consolidated Financial Statements (Continued)
(All amounts in US$ thousands, except shares and per share data and as otherwise indicated)
33.24 Assets held for sale and discontinued operations
When the Group intends to dispose of, or classify as held for sale, a business component that represents a separate major line of business or geographical area of operations, or a subsidiary acquired exclusively with a view to resale, it classifies such operations as discontinued. The post tax profit or loss of the discontinued operations is shown as a single amount on the face of the statement of income, separate from the other results of the Group. Assets and liabilities classified as held for sale are measured at the lower of carrying value and fair value less costs to sell.
Non-current assets and disposal groups are classified as held for sale if their carrying amount will be recovered through a disposal rather than through continuing use. This condition is regarded as met only when management is committed to the sale (disposal), the sale (disposal) is highly probable and expected to be completed within one year from classification and the asset is available for immediate sale (disposal) in its present condition. The statements of income for the comparative periods are represented to show the discontinued operations separate from the continuing operations.
33.25 Earnings per share
Basic earnings per share is calculated by dividing the net income for the year attributable to equity holders of the parent by the weighted average number of ordinary shares outstanding during the year. Diluted net earnings per share is computed by dividing the net income for the period by the weighted average number of ordinary shares outstanding, and when dilutive, adjusted for the effect of all potentially dilutive shares, including share options, on an as-if converted basis.
33.26 Equity-settled share-based payments
The Group issues equity settled share-based payments to certain directors, senior management and employees. Options under the awards were measured at fair value at the date of grant. An expense is recognized to spread the fair value of each award over the vesting period on a straight-line basis, after allowing for an estimate of the awards that will eventually vest. The estimate of the level of vesting is reviewed at least annually, with any impact on the cumulative charge being recognized immediately.
33.27 Research and development
Research phase expenditure is expensed as incurred. Development expenditure is capitalized as an internally generated intangible asset only if it meets strict criteria, relating in particular to technical feasibility and generation of future economic benefits. Research expenses have been immaterial to date. The Group has not capitalized any development expenses to date.
34. Information related to COVID-19 pandemic
F- 89