UNITED STATES
SECURITIES AND EXCHANGE COMMISSION
Washington, D.C. 20549
FORM
ANNUAL REPORT UNDER SECTION 13 OR 15(d) OF THE SECURITIES EXCHANGE ACT OF 1934. |
For the Fiscal Year Ended
or
TRANSITION REPORT PURSUANT TO SECTION 13 OR 15(d) OF THE SECURITIES EXCHANGE ACT OF 1934. |
For the transition period from to
Commission File Number

(Exact Name of Registrant as Specified in its Charter)
| ||
(State or Other Jurisdiction of Incorporation or Organization) |
| (IRS Employer Identification No.) |
| ||
(Address of Principal Executive Offices) |
| (Zip Code) |
(
(Issuer’s Telephone Number, Including Area Code)
Securities registered under Section 12(b) of the Exchange Act:
Title of Each Class | Trading Symbol | Name of Each Exchange on Which Registered | ||
The New York Stock Exchange (“ |
Securities registered under Section 12(g) of the Securities Exchange Act of 1934 (the “Exchange Act”): None
Indicate by check mark if the Registrant is a well-known seasoned issuer, as defined in Rule 405 of the Securities Act of 1933. Yes ☐
Indicate by check mark if the Registrant is not required to file reports pursuant to Section 13 or 15(d) of the Exchange Act.
Indicate by check mark whether the Registrant (1) has filed all reports required to be filed by Section 13 or 15(d) of the Exchange Act during the preceding 12 months (or for such shorter period that the Registrant was required to file such reports), and (2) has been subject to such filing requirements for the past 90 days.
Indicate by check mark whether the Registrant has submitted electronically every Interactive Data File required to be submitted pursuant to Rule 405 of Regulation S-T during the preceding 12 months (or for such shorter period that the Registrant was required to submit such files).
Indicate by check mark whether the Registrant is a large accelerated filer, an accelerated filer, a non-accelerated filer, smaller reporting company or an emerging growth company. See the definitions of “large accelerated filer,” “accelerated filer”, “smaller reporting company” and “emerging growth company” in Rule 12b-2 of the Exchange Act.
Large accelerated filer ◻ |
|
| Non-accelerated filer ◻ |
| Smaller reporting company | Emerging growth company |
If an emerging growth company, indicate by check mark if the Registrant has elected not to use the extended transition period for complying with any new or revised financial accounting standards provided pursuant to Section 13(a) of the Exchange Act. ☐
Indicate by check mark whether the Registrant has filed a report on and attestation to its management’s assessment of the effectiveness of its internal control over financial reporting under Section 404(b) of the Sarbanes-Oxley Act (15 U.S.C. 7262(b)) by the registered public accounting firm that prepared or issued its audit report. Yes
If securities are registered pursuant to Section 12(b) of the Act, indicate by check mark whether the financial statements of the registrant included in the filing reflect the correction of an error to previously issued financial statements.
Indicate by check mark whether any of those error corrections are restatements that required a recovery analysis of incentive-based compensation received by any of the registrant’s executive officers during the relevant recovery period pursuant to §240.10D-1(b). ☐
Indicate by check mark whether the Registrant is a shell company (as defined in Rule 12b-2 of the Exchange Act). Yes
The aggregate market value of the common stock held by non-affiliates of the Registrant was approximately $
Number of shares of common stock outstanding as of April 5, 2024:
DOCUMENTS INCORPORATED BY REFERENCE
Portions of the Registrant’s Proxy Statement for the 2024 Annual Meeting of Stockholders to be held on June 20, 2024 are incorporated by reference in Part III.
ARGAN, INC. AND SUBSIDIARIES
2024 ANNUAL REPORT ON FORM 10-K
TABLE OF CONTENTS
|
| PAGE | |
- 3 - | |||
- 11 - | |||
- 24 - | |||
- 24 - | |||
- 25 - | |||
- 26 - | |||
- 26 - | |||
- 27 - | |||
- 29 - | |||
MANAGEMENT’S DISCUSSION AND ANALYSIS OF FINANCIAL CONDITION AND RESULTS OF OPERATIONS | - 29 - | ||
- 48 - | |||
- 49 - | |||
CHANGES IN AND DISAGREEMENTS WITH ACCOUNTANTS ON ACCOUNTING AND FINANCIAL DISCLOSURE | - 49 - | ||
- 49 - | |||
- 50 - | |||
DISCLOSURE REGARDING FOREIGN JURISDICTIONS THAT PREVENT INSPECTIONS | - 50 - | ||
- 51 - | |||
- 51 - | |||
SECURITY OWNERSHIP OF CERTAIN BENEFICIAL OWNERS AND MANAGEMENT, AND RELATED STOCKHOLDER MATTERS | - 51 - | ||
CERTAIN RELATIONSHIPS AND RELATED TRANSACTIONS, AND DIRECTOR INDEPENDENCE | - 51 - | ||
- 51 - | |||
- 52 - | |||
- 53 - | |||
- 54 - | |||
- 2 -
PART I
FORWARD-LOOKING STATEMENTS
The Private Securities Litigation Reform Act of 1995 provides a “safe harbor” for certain forward-looking statements. We have made statements in this Annual Report on Form 10-K for the fiscal year ended January 31, 2024 (the “2024 Annual Report”) that may constitute “forward-looking statements.” The words “believe,” “expect,” “anticipate,” “plan,” “intend,” “estimate,” “foresee,” “should,” “would,” “could,” or other similar expressions are intended to identify forward-looking statements. Our forward-looking statements, financial position and results of operations, are based on our current expectations and beliefs concerning future developments and their potential effects on us. There can be no assurance that future developments affecting us will be those that we anticipate. All comments concerning our expectations for future revenues and operating results are based on our forecasts for existing operations and do not include the potential impact of any future acquisitions.
Our forward-looking statements, by their nature, involve significant risks and uncertainties (some of which are beyond our control) and assumptions. They are subject to change based upon various factors including, but not limited to, the risks and uncertainties described in Item 1A of this 2024 Annual Report. Should one or more of these risks or uncertainties materialize, or should any of our assumptions prove to be incorrect, actual results may vary in material respects from those projected in the forward-looking statements. We undertake no obligation to publicly update or revise any forward-looking statements, whether as a result of new information, future events or otherwise.
ITEM 1. BUSINESS.
Argan, Inc. (“Argan”) is primarily a construction firm that conducts operations through its wholly-owned subsidiaries, Gemma Power Systems, LLC and affiliates (“GPS”), Atlantic Projects Company Limited and affiliates (“APC”), The Roberts Company, Inc. (“TRC”) and Southern Maryland Cable, Inc. (“SMC”) (together referred to as the “Company,” “we,” “us,” or “our”). GPS and APC constitute our power industry services reportable segment, delivering a comprehensive suite of engineering, procurement, construction, commissioning, maintenance, project development and technical consulting services to the power generation market, including the renewable energy sector. The customers include primarily independent power project owners, public utilities, power plant heavy equipment suppliers and other commercial firms with significant power requirements with customer projects located in the United States (the “U.S.”), the Republic of Ireland (“Ireland”) and the United Kingdom (the “U.K.”). Through TRC, the industrial construction services reportable segment provides field services and project management that support new plant construction and additions, maintenance turnarounds, shutdowns and emergency mobilizations for industrial plants primarily located in the Southeast region of the U.S. and that may include the fabrication, delivery and installation of steel components such as piping systems and pressure vessels. Through SMC, doing business as SMC Infrastructure Solutions, the telecommunications infrastructure services segment provides project management, construction, installation and maintenance services to commercial, local government and federal government customers primarily in the Mid-Atlantic region of the U.S. Together, these subsidiaries enable us to serve a wide range of client needs across power generation, industrial construction, and telecommunications infrastructure, establishing its presence as a diversified provider in the construction and engineering sectors.
Holding Company Structure
Argan was organized as a Delaware corporation in May 1961. Argan operates as a holding company that may make opportunistic acquisitions and/or investments by identifying companies with significant potential for profitable growth and realizable synergies with one or more of our existing businesses. However, we may have more than one industrial focus depending on the opportunity and/or needs of our customers. Each of our wholly-owned subsidiaries is operated as an independent business with strategic oversight provided by Argan to allow each to react to its own market conditions independently. Significant acquired companies will be operated in a manner that we believe will best provide long-term and enduring value for our stockholders.
Power Industry Services
GPS, which we acquired in 2006, historically provides the most significant percentage of our power industry services. As a full-service engineering, procurement and construction (“EPC”) services firm, GPS has the proven abilities of designing, building and commissioning large-scale energy projects primarily in the U.S. The extensive design, construction, project
- 3 -
management, start-up and operating experience of GPS has grown with installed capacity exceeding 18 gigawatts of mostly domestic power-generating capacity. These projects have included base-load combined-cycle facilities, simple-cycle peaking plants and boiler plant construction and renovation efforts. GPS also has experience in the renewable energy sector providing EPC contracting and other services to owners of alternative energy facilities, including biomass plants, solar fields and wind farms. Typically, the scope of work for GPS includes complete plant engineering and design, the procurement of power generation and balance of plant equipment, and the full turnkey construction effort from site development through electrical interconnection and plant performance testing. The durations of these projects typically range between one to three years, with the length of certain significant construction projects exceeding three years.
This reportable business segment also includes APC, a company formed in Ireland almost 50 years ago, and its affiliated companies, which we acquired in May 2015. Historically, APC primarily provided turbine, boiler and large rotating equipment engineering, procurement, installation, commissioning and outage services to power plants in Ireland. Since its acquisition in 2015, APC has expanded operations to the U.K. APC currently focuses on the performance of engineering and construction services for the major electric utility in Ireland, independent power plant owners, major data center operators and original equipment manufacturers. APC’s business in Ireland and the U.K. represent this segment’s primary international operations.
The revenues of our power industry services business segment were $416.3 million, $346.0 million and $398.1 million for the fiscal years ended January 31, 2024 (“Fiscal 2024”), 2023 (“Fiscal 2023”) and 2022 (“Fiscal 2022”), respectively, or 73%, 76% and 78% of our consolidated revenues for the corresponding periods, respectively. The substantial portions of the revenues of this reportable segment reported for these three years were derived from the performance of activities by GPS and APC under EPC services and other construction contracts with the owners of power plant projects.
Project Backlog
At January 31, 2024, the project backlog for this reporting segment was approximately $0.6 billion. The comparable backlog amount as of January 31, 2023 was approximately $0.7 billion. Our reported amount of project backlog at a point in time represents the total value of projects awarded to us that we consider to be firm as of that date less the amounts of revenues recognized to date on the corresponding projects.
Typically, we include the total value of EPC services and other major construction contracts in project backlog upon receiving a notice to proceed from the project owner. When provided with only the limited notice to proceed (“LNTP”), we do not add the value of the full contract to project backlog until we receive the full notice to proceed. Nevertheless, the inclusion of contract values in project backlog requires management judgement based on the facts and circumstances.
The significant currently active projects of our power industry services segment include the construction of facilities which together represent approximately 4.1 gigawatts of potential electrical power and require the significant engagements of our technical, project support and project management teams. Please see “Item 7. Management’s Discussion and Analysis of Financial Condition and Results of Operations” for a discussion of currently active major projects for this reporting segment.
At times, we may be awarded contracts for which commencement of project activities are delayed or cancelled. We have maintained that the delays in the construction starts of these projects and the awards of new business awards relate to a variety of factors, especially in the northeastern and Mid-Atlantic regions of the U.S. where the largest electricity grid is run by PJM Interconnection LLC (“PJM”). Certain projects in development are confronting difficulties in obtaining the necessary permits for construction and operation, in securing the delivery of fuel to the power plant site and in establishing the necessary power connection to the electricity grid. Currently, we also believe that the ability of owners of fully developed gas-fired power plant projects to close on equity and permanent debt financing is challenged by uncertainty in capital markets caused by multiple factors including delayed capacity auctions, public and political opposition to fossil-fuel energy projects, stranded asset concerns and high interest rates.
Along with our commitment to the construction of state-of-the-art, natural gas-fired power plants that will serve as important elements of our country’s electricity-generation mix in the future, our experience also encompasses the development of utility-scale renewable energy projects. We continue to target certain business development efforts to win projects for the erection of utility-scale solar fields, wind farms and battery facilities as well as hydrogen-based energy plants and carbon capture and storage projects.
- 4 -
Labor and Materials
We perform work on job sites in different states and countries. The skilled craft labor pool is unique in each region due to a variety of factors, including different employment environments, competing infrastructure projects located near our sites that utilize the same labor pool, and decreased and aging labor pools resulting from demographic trends. As such, we take a carefully considered and tailored approach at each job site to acquire and retain the required personnel resources when we need them, especially craft labor, and to maintain optimum productivity on each of our projects. Depending on the project, we may utilize direct hires, subcontractors, existing internal personnel, or a combination of the three. To date, we generally have managed to successfully staff each of our jobs effectively, but going forward we may be challenged by labor shortages in the construction industry due to rising wages, demographic trends and other factors. The competition for labor may also include employers outside the construction industry, which can offer the opportunity to work remotely.
According to employment data released by the U.S. Bureau of Labor Statistics, employee headcount in the domestic construction industry is at the highest level in the last decade. The industry’s unemployment rate was 7.0% for February 2024 after having dropped to 3.5% this past summer when seasonal demand peaked. However, the number of unemployed job seekers with construction experience has remained low, nominally increasing by 0.4% over the last year. Rising employment has been accompanied by rising wages that have increased by approximately 4.7%, 5.6% and 5.2% during Fiscal 2024, Fiscal 2023 and Fiscal 2022, respectively.
In connection with the engineering and construction of traditional power plants, biodiesel plants and other renewable energy systems, we procure materials for installation on our various projects. We are not dependent upon any one source for major equipment components, such as heat recovery steam generation units, steam turbines and air-cooled condensers, solar panels or any other construction materials we use to complete a particular power project. With our assistance, project owners frequently procure and supply certain major components of the power plants such as state-of-the-art natural gas turbines. We have significant experience in delivering EPC projects with the latest turbine technology and working with all three major gas-fired turbine manufacturers to meet each project owner’s specific power plant requirements. EPC project requirements may vary considerably. Additionally, we have protections in our contracts with major customers that provide certain relief that helps to mitigate certain financial risks, but these protections could be limited depending on the underlying issues and the financial challenges of our customers.
In the past, we have had to navigate supply chain disruptions and other sourcing issues that have or could have impacted our projects. As we go forward, there may be unscheduled delays in the delivery of materials, machinery and equipment ordered by us or a project owner or other unanticipated challenges to our ability to complete major job tasks when planned, among other impacts. We actively attempt to manage these risks during periods of uncertainty. Supply chain uncertainties may impact project owners’ confidence in commencing new work which may adversely affect our expected levels of revenues until supply chain disruptions substantially dissipate.
The costs of materials needed for the completion of our projects may fluctuate from time to time. For example, in January 2024, inflation rose by 0.3% for the month and 3.1 % over the prior year, down from 6.4% over the same period in the prior year, according to the consumer price index data released by the U.S. Bureau of Labor Statistics. In times of increased volatility, we take steps to reduce our risks. For example, we may hold quotes related to materials in our industrial construction services segment for short periods of time. For major fixed price contracts in our power industry services segment, we may mitigate material cost risks by procuring the majority of the equipment and construction supplies during the early phases of a project. During recent fiscal years, we believe in general that we effectively confronted the economic challenges to our active jobs represented by the inflationary surge in prices.
Competition
GPS and APC compete with large and well capitalized private and public firms in the construction and engineering services industry including firms that have global businesses. These competitors may be multi-billion-dollar companies that have thousands of employees. We also may compete with regional construction services companies in the markets where planned projects might be located. Typically, a condition for award is that the contractor perform on a fixed-price or lump-sum contract basis; smaller elements of a contract may be billable on an allowance or cost-reimbursable basis. As explained below, there are risks of unrecovered costs, among other aspects, associated with these types of contracts.
- 5 -
To compete with these firms, we emphasize our proven track record as a value-add choice for the design, build and commissioning of natural gas-fired and alternative energy power systems. Our successful experience includes the efficient completion and maintenance of natural gas-fired combined cycle and simple cycle power plants, biomass plants, waste-to-energy facilities, solar fields, wind farms and biofuel processing facilities, most performed on an EPC services contract basis. Through the power industry services segment, we provide a full range of competitively priced development, consulting, engineering, procurement, construction, commissioning and maintenance services to project owners. We are able to react quickly to their requirements while bringing a strong, experienced team to help navigate through difficult technical, scheduling and construction issues. We believe that the cultures of GPS and APC encourage motivated, creative, high energy and customer-focused teams that deliver results. Our projects are directed by dedicated field project management teams and our project owner customers have direct access to our senior management at these companies.
Our competition for domestic renewable energy projects like solar energy fields and land-based wind energy farms is more diverse and may include firms that are smaller than us.
The competitive landscape in the EPC services market for natural gas-fired power plant construction has changed significantly over the last seven years. While the market remains dynamic, we are in an era where there are fewer competitors for new domestic gas-fired power plant EPC services project opportunities. Several major competitors have either exited the market, been acquired, or announced intentions to avoid fixed-price contracts for various reasons.
Competition led to aggressive bidding on projects while certain contractors accepted greater risks associated with the inability to anticipate unforeseen issues and the failure to include adequate contingencies to cover lower-than expected labor productivity, unfavorable execution challenges and unusual weather events, for example. As a result, construction and engineering companies, including some of the largest firms in the country, incurred losses related to performance on fixed-price contracts. Despite these challenges, sustained competition has supported the continuation of fixed-price contracting in the U.S., maintaining the typical volume of projects completed under these terms. The firms that remain in our market are very effective competitors.
We are not immune to the risks of losses on major projects. Nonetheless, we try to be particularly selective in pursuing new project opportunities and are reluctant to enter into fixed-price contracts with perceived high-risk profiles that are unacceptable. The track record of GPS has proven that fixed-price contracts can provide opportunities for higher margins if the corresponding projects are completed at lower-than-planned costs. We are confident that our project management teams have gained the experience necessary for successful execution on these types of contracts as we go forward although we are aware of the risks involved.
Over the past few years, GPS has provided top management guidance and project management expertise to APC as it successfully completed certain projects and won the awards of projects to build new thermal power plants in Ireland and the U.K. In turn, APC has provided specialist resources to GPS on several of its EPC services contracts. These experiences have demonstrated that the two companies can combine resources effectively. GPS and APC currently are working as a team on the Shannonbridge Power Project, an emergency gas-fired power plant in the central region of Ireland.
Customers
For Fiscal 2024, our most significant customer relationships included three power industry services customers, which accounted for approximately 19%, 16% and 15% of consolidated revenues. For Fiscal 2023, our most significant customer relationships included two power industry services customers, which accounted for 38% and 12% of consolidated revenues. For Fiscal 2022, our most significant customer relationship included one power industry services customer, which accounted for 57% of consolidated revenues.
No other customer of this reportable segment represented greater than 10% of consolidated revenues for Fiscal 2024, Fiscal 2023 or Fiscal 2022.
Regulation
Our power industry services operations are subject to various federal, state, local and foreign laws and regulations including: licensing for contractors; building codes; permitting and inspection requirements applicable to construction projects; regulations relating to worker safety and environmental protection; and special bidding, procurement and employee compensation requirements. Many state and local regulations governing construction require permits and
- 6 -
licenses to be held by individuals who have passed an examination or met other requirements. We believe that we have the licenses required to conduct our current operations and that we are in substantial compliance with applicable regulatory requirements.
The power plants that we build, and other energy facilities including the pipelines required to supply natural gas fuel to them, are also subject to a myriad of federal and state laws and regulations governing environmental protection, air quality, water quality and noise and height restrictions. The growing preference for renewable energy sources and the elimination of fossil-fueled power plants by the governments of the U.S., Ireland and the U.K. may result in such restrictions becoming more severe in the future. The consequences may result in fewer gas-fired power plants being constructed in the future than are currently forecast offset by an increased number of renewable power facility opportunities.
Development Financing
We selectively participate in power plant project development and related financing activities 1) to maintain a proprietary pipeline for future EPC services contract opportunities, 2) to secure exclusive rights to EPC contracts, and 3) to generate profits through interest income and project development success fees. EPC contractors in our industry also periodically execute certain contracts jointly with third parties through joint ventures, limited partnerships and limited liability companies for the purpose of completing a project or program for a project owner. These special purpose entities are generally dissolved upon completion of the corresponding project or program.
For example, through variable interest entities, we have entered into support arrangements with independent parties in the past that resulted in the successful development and our construction of three separate gas-fired power plants in Pennsylvania. We were paid project development fees for each project and our loans to the development entities were repaid in full plus interest. To complete two of these construction projects, we entered into joint venture arrangements in order to secure greater bonding capacity. These arrangements were dissolved upon the successful completion of the corresponding EPC service contracts.
However, not all such business development endeavors are successful. In January 2018, we determined that we were the primary beneficiary of a variable interest entity (“VIE”) that was performing the project development activities related to the construction of the Chickahominy Power Station. GPS provided financing to the entity for the development efforts pursuant to promissory notes. Ultimately, the project owner was unable to obtain the necessary equity financing for the project, and GPS ceased providing project development funding. During Fiscal 2022, we recorded an impairment loss related to all of the capitalized project development costs in the amount of $7.9 million, of which $2.5 million was attributed to the non-controlling interest (see Note 15 to the accompanying consolidated financial statements).
As of January 31, 2024, we did not have any outstanding power plant project development financing arrangements.
Industrial Construction Services
TRC was founded in 1977 and its fabrication facility and offices are located near Greenville, North Carolina. TRC is an industrial construction and field services firm with steel pipe and vessel fabrication capabilities serving industrial organizations primarily in the Southeast region of the U.S.
During Fiscal 2023, TRC consolidated its metal fabrication plants and support structures into one industrial fabrication and warehouse facility that totals over 90,000 square feet. The consolidation reduced fixed costs and notably streamlined the business, which has permitted TRC to focus primarily on its industrial field service opportunities, which includes construction projects. TRC operates within its own reportable business segment, industrial construction services. Such services typically represent the majority of TRC’s annual revenues with the remaining revenues contributed by projects consisting primarily of metal fabrication. The project backlog of TRC has grown by over 175% since January 31, 2022 to approximately $127.5 million as of January 31, 2024, reflecting a business development emphasis on the award of larger field service construction projects. The emphasis on these opportunities influenced the strategic decision to consolidate the pipe and vessel fabrication facilities to reduce fixed costs, streamline operations and better support a growing and scalable business model.
Recent and current major customers of TRC include Nutrien Ltd., the global fertilizer company; Jacobs Solutions Inc., an international engineering and construction firm that is building a significant biotechnology manufacturing facility in the research triangle area of North Carolina; and North America’s largest forest products companies such as Weyerhaeuser
- 7 -
Company, International Paper and Domtar Corporation; and various other industrial companies. These relationships demonstrate that TRC is a trusted industrial services provider to blue chip customers from around North America, and from countries like France, Germany, Denmark, Japan, Belgium and Australia, that are expanding or locating new production facilities in TRC’s geographic region. For Fiscal 2024, Fiscal 2023 and Fiscal 2022, TRC reported revenues of $142.8 million, $92.8 million and $97.9 million, respectively, or approximately 25%, 20% and 19% of consolidated revenues for the corresponding years, respectively.
Telecommunications Infrastructure Services
SMC represents our telecommunications infrastructure services reportable business segment and conducts business as SMC Infrastructure Solutions, which provides utility construction services and comprehensive technology wiring solutions to customers primarily in the Mid-Atlantic region of the U.S. SMC performs both outside and inside plant cable installation services.
Services provided to our outside premises customers include trenchless directional boring and excavation for underground communication and power networks, aerial cabling services, and the installation of buried cable, high and low voltage electric lines, and private area outdoor lighting systems. Inside premises wiring services provided to SMC’s customers include structured cabling, terminations and connectivity that provide the physical transport for high-speed data, voice, video and security networks.
Consistently, a major portion of SMC’s revenue-producing activity each year is performed pursuant to task or work orders issued under master agreements with SMC’s major customers such as Southern Maryland Electric Cooperative, the local electricity cooperative. Over the last three years, other major customers have included counties and municipalities located in Maryland; certain state government agencies in Maryland; and technology-oriented government contracting firms in the Washington, D.C. metropolitan area.
The revenues of SMC were $14.3 million, $16.2 million and $13.4 million for Fiscal 2024, Fiscal 2023 and Fiscal 2022, respectively, or approximately 2%, 4% and 3% of our consolidated revenues for the corresponding years, respectively.
In Fiscal 2022, SMC acquired the business of Lee Telecommunications, Inc. (“LTI”) for $0.6 million in cash, which expanded the business footprint of SMC into the Tidewater area of Virginia. LTI provides a suite of inside premises, communications infrastructure services similar to those provided by SMC. The largest customer of LTI is Newport News Shipbuilding, a division of Huntington Ingalls Industries, to which it has been providing services since 1995.
The combined operations of SMC operate in the fragmented and competitive telecommunication and infrastructure services industry. We compete with providers ranging from regional companies to larger firms servicing multiple regions, as well as large national and multi-national contractors. We believe that we compete favorably with the other companies in our market space by emphasizing our high-quality reputation, outstanding customer base, security-cleared personnel and highly motivated work force in competing for larger and more diverse contracts.
Employees
The total number of personnel employed by us is subject to the volume of construction in progress and the relative amount of work performed by subcontractors. We had 1,214 employees at January 31, 2024, substantially all of whom were full-time. We believe that our employee relations are generally good.
Financing Arrangements
During April 2021, we amended our Amended and Restated Replacement Credit Agreement (the “Credit Agreement”) with Bank of America, N.A. (the “Bank”), which extended the expiration date of the Credit Agreement to May 31, 2024 and reduced the borrowing rate. On March 6, 2023, we entered into the Second Amendment (the “Second Amendment”) to the Credit Agreement. The Second Amendment modified the Credit Amendment primarily to replace the interest pricing with the Secured Overnight Financing Rate (“SOFR”) plus 1.6% and to add SOFR successor rate language. The Credit Agreement, as amended, includes the following features, among others: a lending commitment of $50.0 million including a revolving loan and an accordion feature which allows for an additional commitment amount of $10.0 million, subject to certain conditions. We may also use the borrowing ability to cover other credit instruments issued by the Bank for our use in the ordinary course of business as defined in the Credit Agreement. We are working with the Bank on the completion of new credit arrangements that we expect to complete prior to the expiration date of our current Credit Agreement.
- 8 -
At January 31, 2024, we did not have any borrowings outstanding under the Credit Agreement. However, the Bank has issued a letter of credit in the total outstanding amount of $9.3 million at January 31, 2024, in support of the activities of APC under existing customer contracts.
We have pledged the majority of our assets to secure the financing arrangements. The Bank’s consent is not required for acquisitions, divestitures, cash dividends or significant investments as long as certain conditions are met. The Bank requires that we comply with certain financial covenants at its fiscal year-end and at each of its fiscal quarter-ends. The Credit Agreement, as amended, includes other terms, covenants and events of default that are customary for a credit facility of its size and nature, including a requirement to achieve positive adjusted earnings before interest, taxes, depreciation and amortization, as defined, over each rolling twelve-month measurement period. As of January 31, 2024, we were in compliance with the covenants of the Credit Agreement, as amended.
Safety, Risk Management, Insurance and Performance Bonds
We are committed to ensuring that the employees of each of our businesses perform their work in a safe environment. We regularly communicate with our employees to promote safety and to instill safe work habits. GPS, APC, TRC and SMC each has an experienced full-time safety director committed to ensuring a safe work place, as well as compliance with applicable permits, insurance and laws. Our OSHA reportable incident rates, weighted by hours worked for all of our subsidiaries, were 0.43, 0.60, 0.48, 0.55 and 0.40 for calendar years 2023, 2022, 2021, 2020 and 2019, respectively; our rates were significantly better than the national average rates in our industry (NAICS – 2379) for those years.
In January 2024, we added a senior vice president of legal to our headquarters staff. Among other duties, he will contribute to and enhance our ongoing process of standardizing and minimizing the amount of commercial risk that our different operations accept in their customer contracts. His legal and operations experiences in the construction industry represent solid qualifications for this effort.
We retain qualified insurance brokerage assistance in the regular evaluation of the adequacy of insurance coverage amounts and the annual negotiation of premium amounts in the areas of property and casualty insurance, general liability, umbrella coverage, director and officer insurance, cybersecurity insurance and other specialty coverages. In Fiscal 2023, we purchased specialty insurance related to the full recovery of the research and development tax credits we claimed in our amended federal income tax returns for Fiscal 2022 and 2021 (see Note 12 to the accompanying consolidated financial statements). We believe that our insurance coverage amounts are adequate, but not excessive, and provide the proper amounts of coverage where we believe insurable risks may exist.
Contracts with customers in each of our reportable business segments may require performance bonds, payment bonds, or other means of financial assurance to secure contractual performance. We maintain material amounts of cash, cash equivalents and short-term investments, and, as indicated above, we have the commitment of the Bank to issue irrevocable standby letters of credit up to an aggregate amount of $50.0 million.
As of January 31, 2024, the estimated amount of our unsatisfied bonded performance obligations, covering all of its subsidiaries, was approximately $0.5 billion. As of January 31, 2024, the outstanding amount of bonds covering other risks, including warranty obligations related to completed activities, was not material. Not all of our projects require bonding.
Responsible Business
Our on-going commitment to environmental, health and safety, corporate social responsibility, corporate governance, sustainability, and other public policy matters relevant to us is being supported by the responsible business committee of our board of directors, which was formed initially as a subcommittee in Fiscal 2021 and was elevated to full committee status in Fiscal 2023. Its charter requires it to assist our senior management in: (a) setting our general strategy relating to responsible business matters, as well as developing, implementing, and monitoring initiatives and policies for us based on that strategy; (b) overseeing communications with employees, investors, and other stakeholders with respect to responsible business matters; and (c) anticipating and monitoring developments relating to, and improving management’s understanding of, responsible business matters.
- 9 -
A summary of our responsible business accomplishments in various areas over the past three years follows:
| ● | We made investments in solar energy funds to secure portions of the available investment tax credits and tax depreciation, which facilitated the construction and deployment of multiple solar array facilities; |
| ● | We made lighting and other energy efficiency upgrades at the office building that we own while our employees continue to participate in available recycling programs at all of our facilities; |
| ● | We executed an agreement to build a solar carport at our Glastonbury, Connecticut office, which broke ground in Fiscal 2024; |
| ● | We commenced a solicitation of recommendations from our employees by a cross-subsidiary working group in order to identify additional actionable items including coordinated community service projects. As a result, employees from all levels of our Company have participated in projects such as Habitat for Humanity, Toys for Tots, Coats for Kids, school supply drives, clothing drives, food bank donation programs and Company-sponsored youth programs, while supporting meaningful apprenticeships and internships within our companies; and |
| ● | We provided training and issued periodic newsletters focused on diversity, equality and inclusion. |
More information about our sustainability accomplishments can be found in the sustainability section we recently added to our website.
As an important element of our business development strategy, we are targeting a number of contract awards that will expand the amount of our renewable energy project work. During Fiscal 2024, we completed the Maple Hill Solar project, which is among the largest solar-powered energy plants in Pennsylvania, and we commenced activities on the Midwest Solar and Battery Projects in Illinois. For Fiscal 2024, Fiscal 2023 and Fiscal 2022, the amounts of revenues earned by us and associated with renewable energy projects were 6.9%, 9.6% and 13.4%, respectively, of corresponding revenues for the power industry services segment. Based on our current project backlog of renewable projects in the amount of $175 million as of January 31, 2024 and subsequent contract awards, we expect that revenues associated with the performance of renewable energy projects will grow meaningfully and will represent significant portions of our power industry services segment and consolidated revenues over the coming years.
Meanwhile, we believe that our gas-fired power plant construction business is valuable to the achievement of the net carbon emission reduction goals of the U.S., Ireland and the U.K. as we are recognized as an accomplished, dependable and cost-effective provider of construction services to gas-fired power plant owners.
Like the U.S., Ireland and the U.K. are committed to the increase in energy consumption sourced from the sun and the wind on the pathway to net zero emissions. Other technologies will be required to support these power sources and to provide electricity when power demands exceed the amount of electricity supplied by renewable energy sources. The existence of the necessary power reserve during the long transition period to zero emissions will require supporting conventional power generation sources, often natural gas-fired power plants.
For example, the Irish government’s current policy related to the security of the electricity supply in Ireland confirms the requirement for the development of new support technologies to deliver on its commitment to have 80% of the country’s electricity generated from renewables by 2030. The policy emphasizes that this will require a combination of conventional generation (typically powered by natural gas), interconnection to other jurisdictions, demand flexibility and other technologies such as energy storage (i.e., batteries) and generation from renewable gases (i.e., biomethane and/or hydrogen produced from renewable sources). The Irish government has announced that the development of new conventional generation (including gas-fired generation) is a national priority and should be permitted and supported in order to ensure the security of electricity supply while supporting the growth of renewable electricity generation.
In the U.S., the Energy Information Administration illustrates that carbon emissions from the electric power sector declined by approximately 36% during the period 2005 through 2022. The primary reason for this decline was the replacement of coal-fired power plants with efficient gas-fired power plants. Natural gas is relatively clean burning, cost-effective, reliable and abundant. Finally, we note that the natural-gas fired plants that we build are not sprawling facilities and can be constructed closer to where power is being consumed, resulting in fewer transmission lines and line losses. They are constructed on relatively small sites and, upon completion, do not typically disturb the surrounding areas that are often green.
- 10 -
Materials Filed with the Securities and Exchange Commission (the “SEC”)
The public may read any materials that we file with the SEC at its public reference room at 100 F Street, NE, Washington, D.C. 20549. The public may obtain information on the operation of the public reference room by calling the SEC at 1-800-SEC-0330. The SEC maintains an Internet site that contains reports, proxy and information statements and other information regarding issuers that file electronically with the SEC, including us, at http://www.sec.gov.
We maintain a website on the Internet at www.arganinc.com that includes access to financial data. Information on our website is not incorporated by reference into this 2024 Annual Report. Copies of our Annual Reports on Form 10-K, our Quarterly Reports on Form 10-Q, our Current Reports on Form 8-K and amendments to those reports filed or furnished pursuant to Section 13(a) or 15(d) of the Exchange Act, as well as our Proxy Statements, are available, as soon as reasonably practicable, after we electronically file such materials with, or furnish them to, the SEC, without charge and upon written request provided to our Corporate Secretary at Argan, Inc., One Church Street, Suite 201, Rockville, Maryland 20850.
ITEM 1A. RISK FACTORS.
Our business is challenged by a changing environment that involves many known and unknown risks and uncertainties. The risks described below discuss factors that have affected and/or could affect us in the future. There may be others. We may be affected by risks that are currently unknown to us or are immaterial at this time. If any such events did occur, our business, financial condition and results of operations could be adversely affected in a material manner. Our future results may also be impacted by other risk factors listed from time to time in our future filings with the SEC, including, but not limited to, our Annual Reports on Form 10-K and our Quarterly Reports on Form 10-Q. As the most significant portion of our consolidated entity is represented by the power industry services reportable business segment, the risk factor discussions included below are focused on that business. However, as a large number of these same risks exist for our other reportable segments, (1) industrial construction services, and (2) telecommunications infrastructure services, a review and assessment of the following risk factors should be performed with that in mind.
This section of our 2024 Annual Report may include projections, assumptions and beliefs that are intended to be “forward-looking statements.” They should be read in light of our cautionary statement regarding “forward-looking statements” presented at the beginning of this 2024 Annual Report.
Risks Related to Our Business
Demand for our services may decrease during economic downturns or unpredictable economic cycles, which would most likely affect our businesses adversely.
Substantial portions of the revenues and profits earned by our reportable business segments are generated from construction-type projects, the awarding and/or funding of which we do not directly control. The engineering and construction industry is prone to cyclical fluctuations influenced by factors such as economic recessions, downturns in project owners’ business cycles, material shortages, subcontractor price hikes, interest rate changes, regulatory and political change, and other external economic factors.
When the general level of economic activity deteriorates, uncertainty about future business prospects increases, prompting clients to potentially delay or cancel projects. This includes new construction projections, maintenance on major power plant components, repairs to damaged or worn equipment or other plant outage work. The adverse financial condition of the industry could diminish our customers’ ability and willingness to fund capital expenditures or pursue significant projects in the future. Furthermore, specific economic, regulatory and market conditions affecting our clients may lead to a decrease in demand for our services, causing delays, reductions, or cancellations of projects essential to our future business forecasts.
Future revenues are dependent on the awards of utility-scale natural gas-fired and renewable energy EPC projects to us, the receipt of corresponding full notices-to-proceed and our ability to successfully complete the projects that we start.
The majority of our consolidated revenues relate to performance by the power industry services segment which represented 73%, 76% and 78% of consolidated revenues for Fiscal 2024, Fiscal 2023 and Fiscal 2022, respectively. GPS, the major business component of this segment, earns the substantial portion of its revenues from execution on long-term natural gas-fired EPC services contracts with project owners. For Fiscal 2024, a majority portion of consolidated revenues related to
- 11 -
EPC services provided to three power industry services customers. During Fiscal 2023 and Fiscal 2022, a majority portion of consolidated revenues related to EPC services provided to a single power industry services customer on a project that achieved substantial completion during the early part of Fiscal 2024.
At times, we may be awarded contracts for which commencement of project activities are delayed or cancelled. Our ability to sustain revenues depends on many factors including the ability of the power industry services business to not only win the awards of significant new EPC projects, but to obtain the corresponding full notices-to-proceed and to complete its projects successfully.
We are directing a meaningful portion of our business development efforts to winning projects for the construction of renewable energy projects. We have successfully built utility-scale solar and wind farms, biomass-fueled power plants and biodiesel energy facilities in the past, and we have renewed the pursuit of renewable energy projects that will complement our natural gas-fired EPC services projects, which will remain the core business development focus going forward. Failure to obtain future awards for the construction of utility-scale energy facilities and the corresponding notices to proceed with contract activities, as well as any failure to successfully complete such projects, would have adverse effects on our future revenues, profits and cash flows.
Our dependence on large construction contracts may result in uneven financial results.
Our power industry services activities in any one fiscal reporting period are concentrated on a limited number of large construction projects for which we recognize revenues over time as we transfer control of the project asset to the customer. To a substantial extent, our contract revenues are based on the amounts of costs incurred. As the timing of equipment purchases, subcontractor services and other contract events may not be evenly distributed over the terms of our contracts, the amount of total contract costs may vary from quarter to quarter, creating uneven amounts of quarterly and/or annual consolidated revenues. In addition, the timing of contract commencements and completions may exacerbate the uneven pattern. As a result of the foregoing, future reported amounts of consolidated revenues, cash flow from operations, net income and earnings per share may vary in uneven patterns and may not be indicative of the operating results expected for any other fiscal period, thus rendering consecutive quarter comparisons of our consolidated operating results a less meaningful way to assess the growth of our business.
Actual results could differ from the assumptions and estimates used to prepare our consolidated financial statements.
To prepare consolidated financial statements in conformity with accounting principles generally accepted in the U.S., we are required to make estimates, assumptions and judgments as of the date of such financial statements, which affect the reported values of assets and liabilities, revenues and expenses, and disclosures of contingent assets and liabilities. For each of our fixed price customer contracts, we recognize revenues over the life of the contract as performance obligations are completed by us based on the proportion of costs incurred to date compared with the total costs estimated to be incurred for the entire project, and by using the resulting percentage to update the recorded amounts of project-to-date revenues. We review and make necessary revisions to the amounts of estimated future costs on a monthly basis. In addition, contract results may be impacted by our estimates of the amounts of change orders that we expect to receive and our assessment of any contract disputes that may arise.
The effects on revenues of changes to the amounts of contract values and estimated costs are recorded as catch-up adjustments when the amounts are known and can be reasonably estimated. These revisions can occur at any time and could be material. Given the uncertainties associated with the types of customer contracts that we are awarded, it is possible for contract values and actual costs to vary from estimates previously made, which may result in reductions or reversals of previously recorded revenues and profits. Our disclosures of Critical Accounting Policies and Estimates (see Item 7. Management’s Discussion and Analysis of Financial Condition and Results of Operations) include an expanded discussion of the estimates, judgements and assumptions that our revenue recognition accounting may require.
Among the other areas that could require significant estimates by our management are the following:
| ● | the assessment of the value of goodwill and recoverability of other intangible assets; |
| ● | the determination of provisions for income taxes, the accounting for uncertain income tax positions and the establishment of valuation allowances associated with deferred income tax assets; |
| ● | the determination of the fair value of stock-based incentive awards; and |
| ● | accruals for estimated liabilities, including any losses related to legal matters. |
- 12 -
Our actual business and financial results could differ from our estimates, which may impact future profits.
Project backlog amounts may be uncertain indicators of future revenues as project realization may be subject to unexpected adjustments, delays and cancellations.
At January 31, 2024, the total value of our project backlog for all of our business units was $0.8 billion. Project cancellations or scope modifications may occur that could reduce the amount of our project backlog and the associated revenues and profits that we actually earn. Our projects generally provide our customers the right to terminate the existing contract unilaterally at their convenience as long as they compensate us for work already completed and the additional costs incurred by us to terminate corresponding subcontract and equipment orders, demobilize and vacate construction sites. These costs would most likely be meaningful. Projects that were awarded to us in the past remained in our backlog for extended periods of time as customers experienced project delays.
Should any unexpected delay, suspension or termination of the work under such projects occur, our results of operations may be materially and adversely affected. Although we believe that the customer commitments represented by project backlog are firm, we cannot guarantee that revenues projected by us based on our project backlog will be recognized or will result in profitable operating results.
Unsuccessful efforts to develop energy plant projects could result in write-offs and the loss of future business.
The development of a power plant construction project is expensive with a total cost that could approximate or exceed $10 million. The developers of power projects may form single purpose entities, such as limited liability companies, limited partnerships or joint ventures, to perform the development activities, which are often funded by outside sources. Periodically, we provide financial support to new projects during their development phase. This aims to enhance the success of the phase and increase our chances of ultimately securing the EPC contract to build the plant.
In the past, we have provided funding to special-purpose entities for gas-fired power plant projects during the development phase, leading to the return of our initial investment, the awarding of EPC contracts with authorization to start construction, and the receipt of success fees. While some of these initiatives have yielded positive results, others have not, resulting in the write-off of loan and interest balances and the loss of potential construction projects. As of January 31, 2024, we do not have any financial statement exposure related to outstanding power plant project development financing arrangements.
Future bonding requirements may adversely affect our ability to compete for new energy plant construction projects.
Our construction contracts frequently require that we obtain payment and/or performance bonds from surety companies on behalf of project owners as a condition to the contract award. Historically, we have had a strong bonding capacity. Under standard terms, surety companies issue bonds on a project-by-project basis and can decline to issue bonds at any time or require the posting of additional collateral as a condition to issuing any bonds. Not all of our projects require bonding. As of January 31, 2024, the estimated value of future work covered by outstanding performance bonds was approximately $0.5 billion.
Market conditions, changes in our performance or financial position, changes in our surety’s assessment of its own operating and financial risk, or larger future projects could cause our surety company to decline to issue, or substantially reduce, the amount of bonding available for our work and/or could increase our bonding costs. These actions can be taken on short notice. If our surety company were to limit or eliminate our access to new bonds, our alternatives would include seeking bonding capacity from other surety companies, joint venturing with other construction firms, increasing business with clients that do not require bonds or posting other forms of collateral for project performance, such as letters of credit or cash. We may be unable to make alternative arrangements in a timely manner, on acceptable terms, or at all. Accordingly, if we were to experience an interruption, reduction or other alteration in the availability of bonding capacity, we may be unable to compete for or work on certain projects.
Our results could be adversely affected by natural disasters, human-made disasters or other catastrophic events.
Natural disasters, such as hurricanes, tornadoes, blizzards, floods and other adverse weather conditions; or other catastrophic events such as public health crises, geopolitical conflicts, terrorism and civil disturbances could disrupt our operations or the operations of one or more of our vendors or customers. In particular, these types of events could shut down our construction job sites or fabrication facility for indefinite periods of time, disrupt our product supply chain or
- 13 -
could cause our customers to delay or cancel projects. To the extent any of these events occur, our operations and financial results could be adversely affected.
The adverse effects of the war in Ukraine have spread globally. The prolonged disruption by Russia of the supply and prices of oil and natural gas provided to Western European nations adversely affected the economies of those countries. Western European nations in search of alternative supplies of oil and natural gas may find them at higher prices or through more complicated transit routes, further disrupting global supply chains. More recently, activities conducted by terrorists based in the country of Yemen have endangered the key shipping route between the Red Sea and the Indian Ocean. Also the recent bridge collapse in Baltimore has closed temporarily ship access to its major port facilities. Such unfavorable effects may adversely impact our business going forward by altering materials and equipment delivery schedules.
We have protections in our contracts with major customers that provide certain relief that helps to mitigate certain financial risks. However, the effectiveness of these protections may be limited by factors including the financial strength of the customer. The extent to which natural disasters, human-made disasters or other catastrophic events could harm us depends on the impact on our customers, supply chains, labor forces and numerous other evolving factors.
Continuing disruptions to capacity auctions and corresponding prices could reduce the demand for power plants in our primary business region.
Most of our recently completed and awarded EPC service contracts relate to the construction of natural gas-fired power plants located within the Mid-Atlantic geographic footprint of the electric power system operated by PJM, which includes all or part of thirteen states and the District of Columbia. This entity operates a capacity market which is a process to ensure long-term grid reliability by securing the appropriate amount of power supply resources needed to meet predicted future energy demands. Capacity payments represent meaningful portions of the revenue streams of qualifying power plants. Annual capacity auctions since 2021 have suffered delays that, once held, resulted in lower prices than previous auctions. In June 2023, the Federal Energy Regulatory Commission (“FERC”) issued an order accepting delays in future capacity auctions so that market design rule changes proposed by stakeholders might be implemented for all future auctions. In January 2024, FERC approved only one component of PJM’s two-part proposal for its capacity auction reform.
Uncertainty in this market, including the difficulties experienced by PJM in implementing a capacity auction design that all of its stakeholders consider to be fair, the repeated capacity auction delays, and the shrinking annual capacity auction prices, may discourage potential power plant owners from commencing the development of new power plants in this area thereby reducing potential new business opportunities for us.
Risks Related to Our Market
If the price of natural gas increases, the demand for our construction services could decline.
The growth of our power business has been substantially based on the number of combined cycle gas-fired power plants built by us, as many coal-fired plants have been shut down. In 2010, coal-fired power plants accounted for about 45% of total electricity generation in the U.S. For 2023, coal accounted for approximately 17% of net electricity generation. On the other hand, natural-gas fired power plants provided approximately 42% of the electricity generated by utility-scale power plants in the U.S. in 2023, representing an increase of 70% in the amount of electrical power generated by natural gas-fired power plants, which provided approximately 24% of net electricity generation for 2010.
The use of coal as a power source has been adversely affected significantly by the plentiful supply of inexpensive natural gas that is available through the combined use of fracturing and horizontal drilling. However, the share of electricity generation provided by natural gas is particularly reactive in the short term to changing natural gas prices. Even though current natural gas prices are extremely low, higher than expected natural gas prices in the future, even for just the short term, could have adverse effects on the ability of independent power producers to obtain construction and permanent financing for new natural gas-fired power plants.
Soft demand for electrical power may cause deterioration in our financial outlook.
The most recent Annual Energy Outlook published by the Energy Information Administration (“EIA”) in March 2023 projected steady increases to utility-scale electricity generation through 2050. However, future softness in the demand for electrical power in the U.S. could result in the delay, curtailment or cancellation of future gas-fired power plant projects,
- 14 -
thus decreasing the overall demand for our EPC services and adversely impacting the financial outlook for our power industry services business.
Intense global competition for engineering, procurement and construction contracts could reduce our market share.
The competitive landscape in the EPC services market for natural gas-fired power plants was altered several years ago as several significant competitors announced their exit from the market for a variety of reasons. Others have announced intentions to avoid entering into fixed-price contracts citing the disproportionate financial risks borne by contractors. However, the market remains dynamic, and remaining competitors include committed multi-billion-dollar companies with thousands of employees. Competing effectively in our market requires substantial financial resources, the availability of skilled personnel and equipment when needed and the effective use of technology. Meaningful competition is expected to continue in the domestic market, and could increase in the Irish and U.K markets, presenting us with significant challenges to our achieving strong growth rates and acceptable profit margins. If we are unable to meet these competitive challenges and to win the awards of new projects that provide desirable margins, we could lose market share to our competitors, experience overall reductions in future revenues and profits or incur losses.
The continuous rise in renewables could possibly reduce the number of future gas-fired power plant projects.
The net amount of electricity generation in the U.S. provided by utility-scale solar and wind facilities continues to rise. Together, such power facilities provided approximately 12%, 13%, and 15% of the net amount of electricity generated by utility-scale power facilities in 2021, 2022 and 2023 respectively. In the reference case of the EIA Energy Outlook for 2023, net electricity generation from all renewable power sources is expected to represent approximately 63% of such generation by 2050. Impetus for this growth has been provided by various factors including laws and regulations that discourage new fossil-fuel burning power plants, federal support for new carbon-reduction technologies, environmental activism, income tax advantages that promote the growth of solar and wind power, the decline in the costs of renewable power plant components and power storage, and the increase in the scale of energy storage capacity. The reference case in the 2023 Energy Outlook report projected that the share of natural gas-fired electricity generation will decrease from 42% in 2023 to approximately 22% in 2050. Should the pace of development for renewable energy facilities, including solar and wind power plants, accelerate at faster rates than projected or drive a faster migration from base load to peak load power plants, the number and/or value of future natural gas-fired construction project opportunities for us may fall, which could adversely affect our future revenues, profits and cash flows.
Unexpected and adverse changes in the foreign countries in which we operate could result in project disruptions, increased costs and potential losses.
Our business is subject to overseas economic and political conditions that change for reasons which are beyond our control (i.e., “Brexit”). Such changes may have unfavorable consequences for us. Operating in the European marketplace, which for us exists primarily in Ireland and the U.K., may expose us to a number of risks including:
| • | abrupt changes in domestic and/or foreign government policies, laws, treaties (including those impacting trade), regulations or leadership; |
| • | embargoes or other trade restrictions, including sanctions; |
| • | restrictions on currency movement; |
| • | tax or tariff increases; |
| • | currency exchange rate fluctuations; |
| • | changes in labor conditions and difficulties in staffing and managing overseas operations; and |
| • | other social, political and economic instability. |
Our level of exposure to these risks will vary on each significant project we perform overseas, depending on the location and the particular stage of the project. To the extent that our international business is affected by unexpected and adverse foreign economic changes, including trade retaliation from certain countries, we may experience project disruptions and losses which could significantly reduce our consolidated revenues and profits, or could cause losses reflected at the consolidated level.
- 15 -
Risks Related to the Regulatory Environment
We are required to comply with environmental laws and regulations that may add unforeseen costs to our businesses.
Our operations are subject to compliance with federal, state and local environmental laws and regulations, including those relating to discharges to air, water and land, the handling and disposal of solid and hazardous waste, and the cleanup of properties affected by hazardous substances. Certain environmental laws impose substantial penalties for non-compliance and others, such as the federal Comprehensive Environmental Response, Compensation and Liability Act, impose strict, retroactive, and joint and several liability upon persons responsible for releases of hazardous substances. We continually evaluate whether we must take additional steps to ensure compliance with environmental laws, however, there can be no assurance that these requirements will not change and that compliance will not add costs to our projects that could adversely affect our operating results in the future.
Furthermore, we expect increased regulations related to greenhouse gas emissions disclosures and other ESG reporting matters whose compliance efforts may vary based on the jurisdiction. For example, the European Union adopted the Corporate Sustainability Reporting Directive (“CSRD”) at the end of 2022 that requires comprehensive disclosures on a broad spectrum of topics, and in October 2023, the governor of California signed into law emissions and climate risks bills that provide different and extensive reporting requirements. Additionally, the SEC’s new regulations adopted in March 2024 mandate public companies to integrate extensive climate risk disclosures in their annual reports and registration statements, where certain disclosures will be subject to phased-in assurance requirements. At this time, it is uncertain whether the SEC’s new climate disclosure rules will withstand pending and future legal challenges. Notably, in April 2024, the SEC issued an order staying implementation of the new disclosure regulations pending the resolution of certain challenges. Nonetheless, we may incur additional expenses implementing and maintaining compliance with such regulations and may divert management’s attention from other important operational or financial matters.
Expectations of customers and investors may change with respect to sustainability practices, which may impose costs or impact our ability to obtain financing.
Customer and investor standards, which are ever-evolving, have become increasingly focused on environmental, social and governance practices of the companies with which they work or in which they invest. Customers may require that we meet their standards before granting us projects, which may create additional costs to us. If our sustainability practices do not ultimately meet customer expectations, we may not win projects. Investors, who may become wary of funding power services ventures with sustainability practices unacceptable to them, may decide to reallocate capital to other enterprises. Investors and lenders may be generally unwilling to provide capital for energy projects to increase the domestic production and transmission of oil and natural gas.
The Biden Administration poses additional regulatory hurdles for fossil-fuel energy facilities.
The Biden Administration’s approach to environmental regulation poses significant risks to the development and operation of fossil-fuel energy facilities. Central to the administration’s energy policy is the ambitious goal to achieve a carbon-free electricity sector by 2035 and to position the U.S. to reach net-zero carbon emissions by 2050.
Since taking office, President Biden has taken several actions that underscore his commitment to these goals. He led the U.S. to re-enter the Paris Climate Agreement. Additionally, the administration revoked the Keystone Pipeline permit, effectively halting its construction, and temporarily suspended new oil and gas leasing on federal lands, despite legal challenges. Although oil and gas leasing on federal lands has resumed, there is a notable reduction in the scale of these activities compared to previous administrations. The Environmental Protection Agency (“EPA”) has proposed rules that would require coal and gas-fired power plants to limit greenhouse gas emissions by processes that may include the potential installation of carbon capture technology or co-firing with hydrogen to meet the standards.
The administration’s actions and policy goals reflect a shift away from fossil fuel energy. This shift increases the regulatory and operational hurdles for companies involved in the development and management of fossil-fuel energy facilities. Developers may face challenges in obtaining necessary permits, meeting new environmental standards, and adapting to a rapidly evolving regulatory landscape. These factors could significantly impact the feasibility, costs, and timelines of new fossil-fuel projects, affecting our future operations and financial condition.
- 16 -
Future construction projects may depend on the continuing acceptability of the hydraulic fracturing process in certain states.
The viability of the gas-fired power plants that we build is based substantially on the availability of inexpensive natural gas supplies provided through the use of fracking combined with horizontal drilling techniques. The new supplies of natural gas generally lowered the price of natural gas in the U.S. and reduced its volatility. However, the process of fracking is controversial due to concerns about the disposal of the waste water, the possible contamination of nearby water supplies and the risk of potential seismic events. Should future evidence confirm the concerns, the use of fracking may be suspended, limited, or curtailed by additional state and/or federal authorities. As a result, the supply of inexpensive natural gas may not be available in the future and the economic viability of gas-fired power plants that we build may be jeopardized.
The inability of power project developers to receive or to avoid delay in receiving the applicable regulatory approvals relating to energy projects, including new natural gas pipelines, may result in lost or postponed revenues for us.
The commencement and/or execution of the types of projects performed by our power industry services reporting segment are subject to numerous regulatory permitting processes. Applications for the variety of clean air, water purity and construction permits may be opposed by individuals or environmental groups, resulting in delays and possible denial of the permits. There are no assurances that our project owner customers will obtain the necessary permits for these projects, or that the necessary permits will be obtained in order to allow construction work to proceed as scheduled. More importantly, a project may confront difficulties in securing an interconnection service commitment from a transmission organization establishing a connection to the electricity grid. Without such a commitment, the project might be delayed or even terminated.
The viability of new natural gas-fired power plants depends on the availability of nearby sources of natural gas for fuel which may require the construction of new pipelines for the delivery of natural gas to a power plant location. Approval delays and public opposition to new oil and gas pipelines have become major potential hurdles for the developers of gas-fired power plants and other fossil-fuel facilities. In particular, pipeline projects may be delayed by onsite protest demonstrations, indecision by local officials and lawsuits.
Failure to commence or complete construction work as anticipated by fossil-fuel project owners could have material adverse impacts on our future revenues, profits and cash flows.
Work stoppages, union negotiations and other labor problems could adversely affect us.
The performance of certain large-scale construction contracts results in the hiring of employees in the U.S. and overseas who are represented by labor unions. We make sincere efforts to maintain favorable relationships and conduct good-faith negotiations with union officials. However, there can be no assurances that such efforts will eliminate the possibilities of unfavorable conflicts in the future. A lengthy strike or the occurrence of other work disputes, slowdowns or stoppages at any of our current or future construction project sites could have an adverse effect on us, resulting in cost overruns, schedule delays or even lawsuits that could be significant. In addition, labor incidents could result in negative publicity for us thereby damaging our business reputation and perhaps harming our prospects for the receipt of future construction contract awards in certain locales.
Risks Related to Our Operational Execution
We may experience reduced profits or incur losses under fixed price contracts if costs increase above estimates.
Primarily, our business is performed under long-term, fixed price contracts at prices that reflect our estimates of corresponding costs and schedules. Inaccuracies in these estimates may lead to cost overruns that may not be paid by our project owner customers. If we fail to accurately estimate the resources required and time necessary to complete these types of contracts, or if we fail to complete these contracts within the costs and timeframes to which we have agreed, there could be material adverse impacts on our actual financial results, the accuracy of forecasted future results, as well as our business reputation.
- 17 -
Factors not specifically discussed in these risk factors that could result in contract cost overruns, project delays or other problems for us may include:
| ● | the impacts of inflation on fixed-price contracts; |
| ● | delays in the scheduled deliveries of machinery and equipment ordered by us or a project owner; |
| ● | unanticipated technical problems, including design or engineering issues; |
| ● | inadequate project execution tools for recording, tracking, forecasting and controlling future costs and schedules; |
| ● | unforeseen increases in the costs of labor, warranties, raw materials, components or equipment, or our failure or inability to obtain resources when needed; |
| ● | reliance on historical cost and/or execution data for estimation purposes that is not representative of current conditions; |
| ● | delays or productivity issues caused by weather conditions, or other forces majeure; |
| ● | satisfying the requirements of the Inflation Reduction Act of 2022 (the “IRA”) for our customers in order to maximize its potential benefits; |
| ● | incorrect assumptions related to labor productivity, scheduling estimates or future economic conditions; |
| ● | workmanship deficiencies resulting in delays and costs associated with the performance by us of unanticipated rework; and |
| ● | modifications to projects that create unanticipated costs or delays. |
These risks tend to be exacerbated for longer-term contracts because there is increased risk that the circumstances under which we based our original cost estimates or project schedules will change with a resulting increase in costs or delays in achieving scheduled milestones. In such events, our financial condition and results of operations could be negatively impacted.
We try to mitigate these risks by reflecting in our overall cost estimates the reasonable possibility that a number of different and potentially unfavorable outcomes might occur. There are no assurances that our estimates will be sufficient. If not, our misjudgments may lead to decreased profits or losses. In some cases, as certain risk scenarios are eliminated or our concerns regarding certain potential cost and/or schedule issues diminish, we may estimate that the likelihood of an unforeseen cost overrun has reduced and, accordingly, we may increase the estimated gross margin on the project by decreasing the remaining overall cost estimate.
If we guarantee the timely completion or the performance of a project, we could incur additional costs to fulfill such obligations.
In certain of our fixed price long-term contracts, we guarantee that we will complete a project by a scheduled date. We sometimes provide that the project, when completed, will also achieve certain performance standards. Subsequently, we may fail to complete the project on time or equipment that we install may not meet guaranteed performance standards. In those cases, we may be held responsible for costs incurred by the customer resulting from any delay or any modification to the plant made in order to achieve the performance standards, generally in the form of contractually agreed-upon liquidated damages or obligations to re-perform substandard work. If we are required to pay such costs, the total costs of the project would likely exceed our original estimate, and we could experience reduced profits or a loss related to the applicable project.
We may be involved in litigation, liability claims and contract disputes which could reduce our profits and cash flows.
We build large and complex energy plants where design, construction or systems failures can result in substantial injury or damage to third parties. In addition, the nature of our business results in project owners, subcontractors and vendors occasionally presenting claims against us for recovery of costs for which they believe they are not contractually liable. In other cases, project owners may withhold retention and/or contract payments they believe they do not contractually owe us, or they believe offset amounts owed to them by us. They may even terminate the contract. We have been, and may be in the future, named as a defendant in legal proceedings where parties may allege breach of contract and seek recovery for damages or other remedies with respect to our projects or other matters (see Legal Proceedings in Item 3). These legal matters generally arise in the normal course of our business. In addition, from time to time, we and/or certain of our current or former directors, officers or employees could be named as parties to other types of lawsuits.
- 18 -
Litigation can involve complex factual and legal questions, and proceedings may occur over several years. Any claim that is successfully asserted against us could result in our payment of significant sums for damages and other losses. Even if we were to prevail, any litigation may be costly and time-consuming, and would likely divert the attention of our management and key personnel from our business operations over multi-year periods. Either outcome may result in adverse effects on our financial condition, results of operations, cash flows and our reputation.
In accordance with customary industry practices, we maintain insurance coverage against some, but not all, potential losses in order to protect against the risks we face. When it is determined that we have liability, we may not be covered by insurance or, if covered, the dollar amount of any liability may exceed our policy limits or self-insurance reserves.
Further, we may elect not to carry insurance related to particular risks if our management believes that the cost of available insurance is excessive relative to the risks presented. In addition, we cannot insure fully against pollution and environmental risks. Our management liability insurance policies are on a “claims-made” basis covering only claims actually made during the policy period currently in effect. In addition, even where insurance is maintained for such exposures, the policies have deductibles resulting in our assuming exposure for a layer of coverage with respect to any such claims. Any liability not covered by our insurance, in excess of our insurance limits and self-insurance reserves or, if covered by insurance but subject to a high deductible, could result in a significant loss for us, which claims may reduce our future profits and cash available for operations.
Our failure to recover adequately on contract variations submitted to project owners could have a material effect on our financial results.
We may submit contract variations to project owners for additional costs exceeding the contract price or for amounts not included in the original contract price. Variations occur due to matters such as owner-caused delays or changes from the initial project scope, both of which may result in additional costs. At times, contract variation submissions can be the subject of lengthy arbitration or litigation proceedings, and it is difficult to accurately predict when these differences will be fully resolved. When these types of events occur and unresolved matters are pending, we have used existing liquidity to cover cost overruns pending their resolution. The aggregate amounts of contract variations included in the transaction prices that were still pending customer acceptance at January 31, 2024 and 2023 were $8.4 million and $11.6 million, respectively. A failure to promptly recover on these types of customer submissions could have a negative impact on our revenues, liquidity and profitability in the future.
The shortage of skilled craft labor may negatively impact our ability to execute on our long-term construction contracts.
Increased infrastructure spending and general economic expansion may increase the demand for employees with the types of skills needed for the completion of our projects. There is a risk that our construction project schedules become unachievable or that labor expenses will increase unexpectedly as a result of a shortage in the supply of skilled personnel available to us. Increased labor costs may influence our customers’ decisions regarding the feasibility or scheduling of specific projects, potentially leading to delays or cancellations that could materially affect our business adversely. Labor shortages, productivity decreases or increased labor costs could impair our ability to maintain our business or grow our revenues. The inability to hire and retain qualified skilled employees in the future, including workers in the construction crafts, could negatively impact our ability to complete our long-term construction contracts successfully.
Our dependence upon third parties to complete many of our contracts may adversely affect our performance under current and future construction contracts.
Certain of the work performed under our energy plant construction contracts is actually performed by third-party subcontractors we hire. We also rely on third-party manufacturers or suppliers to provide much of the equipment and most of the materials (such as copper, concrete and steel) needed to complete our construction projects. If we are unable to hire qualified subcontractors or to find qualified equipment manufacturers or suppliers, our ability to successfully complete a project could be adversely impacted. If the price we are required to pay for subcontractors or equipment and supplies exceeds the corresponding amount that we have estimated, we may suffer a reduction in the anticipated amount of gross profit or even a loss on the contract. If a supplier, manufacturer or subcontractor fails to provide supplies, equipment or services as required under a negotiated contract for any reason, we may be required to self-perform unexpected work or obtain these supplies, equipment or services on an expedited basis or at a higher price than anticipated from a substitute source, which could impact contract profitability in an adverse manner. Unresolved disputes with a subcontractor or supplier regarding the scope of work or performance may escalate, resulting in arbitration proceedings or legal actions.
- 19 -
Unfavorable outcomes of such disputes may also impact contract profitability in an adverse manner. In addition, if a subcontractor fails to pay its subcontractors, suppliers or employees, liens may be placed on our project requiring us to incur the costs of reimbursing such parties in order to have the liens removed or to commence litigation.
Failure to maintain safe work sites could result in significant losses as we work on projects that are inherently dangerous.
Our project sites can place our employees and others near large and/or mechanized equipment, high voltage electrical equipment, moving vehicles, dangerous processes or highly regulated materials, and in challenging environments. Safety is a primary focus of our business and is critical to our reputation. Many of our customers require that we meet certain safety criteria to be eligible to bid on contracts. Further, regulatory changes implemented by OSHA or similar government agencies could impose additional costs on us. We maintain programs with the primary purpose of implementing effective health, safety and environmental procedures throughout our Company. If we fail to implement appropriate safety procedures and/or if our procedures fail, our employees or others may suffer injuries or illness. The failure to comply with such procedures, client contracts or applicable regulations could subject us to losses and liability, and adversely impact our ability to complete awarded projects as planned or to obtain projects in the future. Our OSHA reportable incident rates, weighted by hours worked for all of our subsidiaries, were 0.43, 0.60, 0.48, 0.55 and 0.40 for the calendar years 2023, 2022, 2021, 2020 and 2019, respectively. Our actual rates were significantly better than the national average rates in our industry (NAICS – 2379) for those years.
Future acquisitions and/or investments may not occur which could limit the growth of our business, and the integration of acquired companies may not be successful.
We may make additional opportunistic acquisitions and/or investments by identifying companies with significant potential for profitable growth and realizable synergies with one or more of our existing businesses. However, we may have more than one industrial focus depending on the opportunity and/or needs of our customers. Companies meeting our criteria and that provide products and/or services in growth industries and that are available for purchase at attractive prices are difficult to find. Discussions with the principal(s) of potential acquisition targets may be protracted and ultimately terminated for a variety of reasons. Further, due diligence investigations of attractive target companies may uncover unfavorable data, and the negotiation and consummation of acquisition agreements may not be successful.
We cannot readily predict the timing or size of any future acquisitions or the capital we will need for these transactions. However, it is likely that any potential future acquisition or strategic investment transaction would require the use of cash and/or shares of our common stock. Using cash for acquisitions may limit our financial flexibility and make us more likely to seek additional capital through future debt or equity financings. Our ability to obtain such additional financing in the future may depend upon prevailing capital market conditions, the strength of our future operating results and financial condition as well as conditions in our business, and the amount of outside financing sought by us. These factors may affect our efforts to arrange additional financing on terms that are acceptable to us. Our ability to use shares of our common stock as future acquisition consideration may be limited by a variety of factors, including the future market price of shares of our common stock and a potential seller’s assessment of the liquidity of our common stock. If adequate funds or the use of our common stock are not available to us, or are not available on acceptable terms, we may not be able to take advantage of desirable acquisitions or other investment opportunities that would benefit our business. Even if we do complete acquisitions in the future, acquired companies may fail to achieve the results we anticipate including the expected gross profit percentages.
In general, we keep each of our subsidiary operations in a self-sustaining mode. However, we do attempt to integrate certain aspects to drive synergies and cost reductions, as well as to share best practices, processes and procedures. In the future, we may not be able to successfully integrate such acquired companies with our other operations without substantial costs, delays or other operational or financial problems including:
| ● | the diversion of management’s attention from other important operational or financial matters; |
| ● | the inability to retain or maintain the focus of key personnel of acquired companies; |
| ● | the discovery of previously unidentified project costs or other liabilities; |
| ● | unforeseen difficulties encountered in the maintenance of uniform standards, controls, procedures and policies, including an effective system of internal control over financial reporting; and |
| ● | impairment losses related to acquired goodwill and other intangible assets. |
- 20 -
Future acquisitions could result in issuances of equity securities that would reduce our stockholders’ ownership interests, the issuance of sizable amounts of debt and the incurrence of contingent liabilities. Further, we may conclude that the divestiture of a troubled or unrelated business will satisfy the best interests of our stockholders. There is risk that we would be unable to complete such a transaction with terms and timing that are acceptable for us, or at all. Any divesting transaction could also result in a material loss for us.
In summary, integrating acquired companies may involve unique and significant risks. Our failure to overcome such risks could materially and adversely affect our business, financial condition and future results of operations, and could cause damage to our Company’s reputation.
Our failure to protect our management information systems against security breaches could adversely affect our business and results of operations.
Our information systems face the threat of unauthorized access, computer hackers, viruses, malicious code, cyberattacks, phishing and other security incursions and system disruptions, including attempts to improperly access our confidential and proprietary information as well as the confidential and proprietary information of our customers and other business partners. Techniques used to attempt to obtain unauthorized access to information systems change frequently, and the rapid development of artificial intelligence poses new cybersecurity risks that we may not timely anticipate. A party who circumvents our security measures, or those of our clients, contractors or other vendors, could misappropriate confidential or proprietary information, improperly manipulate data, or cause damage or interruptions to systems.
Furthermore, we are heavily reliant on computer, information and communications technology and related systems, some of which are hosted by third party providers. We may experience system availability disruptions. Unplanned interruptions could delay or prevent necessary operations. While we believe that our reasonable safeguards will protect us from serious disruptions in the availability of our information technology assets, these safeguards may not be sufficient. We may also be required to expend significant resources to protect against or alleviate damage caused by systems interruptions and delays.
Various privacy and security laws in the U.S. and abroad, including the General Data Protection Regulation (“GDPR”) in the European Union, require us to protect sensitive and confidential information and data from disclosure and we are bound by our client and other contracts, as well as our own business practices, to protect confidential and proprietary information and data from unauthorized disclosure. We believe that we have deployed industry-accepted security measures and technologies to securely maintain confidential and proprietary information retained within our information systems, including compliance with GDPR specifically at APC. However, these measures and technologies may not adequately prevent unanticipated security breaches. There can be no assurance that our efforts will prevent these threats. Further, as these security threats continue to evolve, we may be required to devote additional resources to protect, prevent, detect and respond against such threats. We believe that our business represents a low value target for cyberextortionists as we are not a company in the high technology space and we do not maintain large files of sensitive or confidential personal information. However, we are a company with large balances of cash that could encourage bad actors to attempt to breach the security of our systems, possibly by using social engineering schemes. We do maintain a cybersecurity insurance policy to help protect ourselves from various types of losses relating to computer security breaches.
As previously disclosed, we were targeted by a complex criminal scheme in March 2023, which resulted in fraudulently-induced outbound wire transfers to a third-party account (see Note 18 to the accompanying consolidated financial statements). As a result of the fraud loss, net of funds recovered, and professional fees incurred related to an independent forensic investigation and efforts to recover the funds, we recognized $2.7 million of loss. We are unaware of any other significant security breaches at any of our business locations. That does not suggest that we may not be victimized by an additional breach in the future. Any significant future breach of our information security could damage our reputation, result in litigation and/or regulatory fines and penalties, or have other material adverse effects on our business, financial condition, results of operations or cash flows.
We may be subject to increased corporate taxes in the future.
We are subject to income taxes in the U.S. and foreign jurisdictions. A change in tax laws, treaties or regulations, or their interpretation, in any country where we operate could result in a higher tax burden or could increase our cost of tax compliance.
- 21 -
Higher corporate taxes for us could result from the Global Minimum Tax, a global agreement to ensure that certain large corporations pay income tax at a minimum rate of 15% that many countries have begun to incorporate into law. Under this scheme, governments could still set whatever corporate tax rate they want, but if companies pay lower rates in a particular country, their home governments could “top-off” their taxes to the 15% minimum. Although the rules for the Global Minimum Tax provide a framework for its application, countries may incorporate the rules into their laws differently.
We may continue to be impacted in varying degrees by the Global Intangible Low Tax Income (“GILTI”) provision based on the results of our foreign operations. GILTI is a federal tax calculation that determines the amount of the current earnings of foreign subsidiaries that are included in the computation of the corporate tax of U.S. parent companies. GILTI is an unfavorable permanent component of our federal taxable income in the U.S. when our foreign operations are profitable, and it may become more meaningfully unfavorable to us if our operations in Ireland and the U.K. increase their profitability in the future.
Certain of our tax positions may be successfully challenged by tax authorities which could result in additional income tax expense.
Significant judgment is required in order to determine our worldwide provision for income taxes for each quarterly and annual reporting period. In the ordinary course of our business, there are many transactions and calculations where the ultimate tax determination is uncertain. Our tax estimates and tax positions could be materially affected by many factors including the final outcome of tax audits and related appeals, the introduction of new tax accounting standards, legislation, regulations and related interpretations, our global mix of earnings, the realization of deferred tax assets, changes in uncertain tax positions and changes in our tax strategies.
The results of current or future income tax return examinations could result in unfavorable adjustments to the amounts of income taxes previously recorded and/or paid. Any such future event or determination related to income taxes could have a material impact on our net earnings and cash flows from operations. See Note 12 to the accompanying consolidated financial statements for discussion of our current income tax return examinations.
We could be adversely affected by violations of the Foreign Corrupt Practices Act and similar anti-bribery laws.
The U.S. Foreign Corrupt Practices Act, the U.K. Bribery Act of 2010 and similar anti-bribery laws in other jurisdictions generally prohibit companies and their intermediaries from making improper payments to officials or others for the purpose of obtaining or retaining business. While we believe that our policies and oversight in this area are comprehensive and effective, we cannot provide assurances that our internal controls and procedures always will protect us from the possible reckless or criminal acts committed by our employees or others. If we are found to be liable for anti-bribery law violations (either due to our own acts or our inadvertence, or due to the acts or inadvertence of others including our partners, subcontractors or suppliers), we could suffer from criminal or civil penalties or other sanctions, including contract cancellations or debarment, and damage to our reputation, any of which could have a material adverse effect on our business. Litigation or investigations relating to alleged or suspected violations of anti-bribery laws, even if such litigation or investigations demonstrate ultimately that we did not violate anti-bribery laws, could be costly and could divert management’s attention away from other aspects of our business.
Our continued success requires us to retain and hire talented personnel.
Undoubtedly, unforeseen future changes in our management will occur. Therefore, we cannot be certain that any key executive or manager will continue in such capacity while performing at a high level for any particular period of time, nor can we be certain that events will permit us to complete smooth management transitions should they occur. Our ability to operate productively and profitably, particularly in the power industry, is dependent on our ability to attract, employ, retain and train skilled personnel necessary to meet our future requirements. We cannot be certain that we will be able to maintain experienced management teams and adequately skilled groups of employees necessary to execute our long-term construction contracts successfully and to support our future growth strategy. The loss of key personnel, the inability to complete management transitions without significant loss of effectiveness, or the inability to hire and retain qualified employees in the future could negatively impact our ability to manage our business in the future.
- 22 -
Risks Related to an Investment in Our Securities
Our acquisition strategy may result in dilution to our stockholders.
We may make future acquisitions of other businesses that require the use of cash and issuances of common stock. To the extent that we intend to use cash for any acquisition, we may be required to raise additional equity and/or obtain debt financing. Stock issuances and financing, if obtained, may not be on terms favorable to us and could result in substantial dilution to our stockholders at the time(s) of these transactions.
Future stock option exercises and restricted stock issuances will dilute the ownership of the Company’s current stockholders.
We award stock options, time-based restricted stock units, market-based restricted stock units and performance-based restricted stock units to executives and other key employees (see Note 11 to the accompanying consolidated financial statements). Future exercises of options to purchase shares of common stock at prices below prevailing market prices will result in ownership dilution for current stockholders. Additionally, the number of shares of our common stock that will ultimately be issued in connection with the restricted stock unit awards is not known. Any issuance will result in the dilution of the stock ownership of current stockholders.
Our officers, directors and certain unaffiliated stockholders have substantial control over the Company.
As of January 31, 2024, our executive officers and directors as a group directly owned approximately 7.3% of our voting shares. In addition, four other stockholders owned approximately 30.6% of our shares in total as of December 31, 2023. These groups of stockholders may have significant influence over corporate actions such as the election of directors, amendments to our certificate of incorporation, the consummation of any merger, the sale of all or substantially all of our assets or other actions requiring stockholder approval.
We may not pay cash dividends in the future.
Our board of directors evaluates our ongoing operational and financial performance in order to determine what role strategically aligned dividends should play in creating shareholder value. We have paid regular and special cash dividends in the past. Since Fiscal 2019, we paid a regular quarterly cash dividend of $0.25 per share of common stock, which was increased to $0.30 per share of common stock for October 2023. There can be no assurance that the evaluations of our board of directors will result in the payment of regular or special cash dividends in the future.
We may discontinue the repurchase of our common stock in the future.
Under our share repurchase program, our board of directors has authorized us to repurchase shares of our common stock in the open market or through investment banking institutions, privately-negotiated transactions, or direct purchases. We began to repurchase shares of our common stock in November 2021, and we have repurchased shares of our common stock during each fiscal year since. Subsequent to January 31, 2024, we have continued to make open market purchases pursuant to the approvals of our board of directors.
The timing and amount of stock repurchase transactions depend on market and business conditions, applicable legal and credit requirements and other corporate considerations. We have no obligation to repurchase any amount of our common stock under the share repurchase program. The share repurchase program may be suspended, modified or discontinued at any time, and we cannot guarantee that we will continue to make common stock repurchases up to the authorized amount.
Provisions of our certificate of incorporation and Delaware law could deter takeover attempts.
Provisions of our certificate of incorporation and Delaware law could delay, prevent, or make more difficult a merger, tender offer or proxy contest involving us. Among other things, our board of directors may issue up to 500,000 shares of our preferred stock and may determine the price, rights, preferences, privileges and restrictions, including voting and conversion rights, of these shares. The issuance of preferred stock by us could adversely affect the rights of holders of common stock by, among other factors, establishing dividend rights, liquidation rights and voting rights that are superior to the rights of the holders of the common stock. In addition, Delaware law limits transactions between us and persons that acquire significant amounts of our stock without approval of our board of directors.
- 23 -
ITEM 1B. UNRESOLVED STAFF COMMENTS.
None.
ITEM 1C. CYBERSECURITY
Our approach to managing cybersecurity risk involves a comprehensive program established at each subsidiary. This strategy intends to pinpoint subsidiary-specific risks associated with both our digital and physical assets with the objective of employing effective measures that ensure the security of our infrastructure, systems, data, business partners, customers, and financial information against potential cyber incidents. Corporate management of the holding company oversees the cybersecurity risk program at each of the subsidiaries to ensure the collective cohesively responds to organization-wide risks.
Administered by security, information technology, and compliance professionals and managed by senior management at each of our subsidiaries, our cybersecurity program integrates into our broader enterprise risk management framework and aligns with recognized frameworks and industry standards, as applicable, and complies with various legal and regulatory requirements.
The audit committee of our board of directors oversees cybersecurity risk and ensures timely reporting and management of these threats.
Risk Management and Strategy
As our business objectives and operational needs change, our cybersecurity professionals continuously evaluate and refine the measures taken to address our identified risks. Our technical measures include firewalls, intrusion detection and prevention systems, anti-malware tools, and access and configuration controls, to shield our information systems from cybersecurity incidents.
Acknowledging the dynamic and complex landscape of cybersecurity threats, we engage with various external specialists to evaluate and strengthen our cybersecurity risk management practices. Such engagements differ across our subsidiaries, as they are tailored to the specific risk profile of each subsidiary, ensuring that each entity works with experts most suited to their specific cybersecurity needs. These engagements, which may encompass regular audits, threat assessments, vulnerability testing, and consultations on security enhancements, help us tap into specialized knowledge and stay aligned with industry best practices. Significant results of these assessments are reported to the audit committee and, when necessary, the board of directors, leading to adjustments in our cybersecurity approach based on their findings to ensure our defenses remain robust and effective.
Recognizing the importance of human factors in cybersecurity, we provide regular employee training that emphasizes common threats, such as phishing, social engineering, sensitive data exposure, and insider risks. In addition to regular training sessions, we perform phishing simulations, post security bulletins, and provide dedicated means for employees to report attempted threats.
To mitigate cybersecurity risks linked to our engagement with third-party service providers, we perform security screening and review for prospective vendors that require access to our information systems. Additionally, to further protect our operations and enhance our cybersecurity risk management process, we maintain cybersecurity risk insurance obtained from industry leading underwriters.
Our strategy for responding to cybersecurity incidents involves a well-defined plan at each subsidiary that prescribes dedicated cross-functional personnel to each response team, ensuring a coordinated and premeditated response. These plans, which undergo regular review, assert the ability of system recovery processes and provide response frameworks for escalating issues. The plans are designed to minimize the impact to our operations and stakeholders, initiate appropriate communications both within and outside of the organization, and identify recommendations for improvement.
Governance and Oversight
While our management team is tasked with the day-to-day handling of risks facing our organization, the audit committee, as delegated by the board of directors and documented in the committee’s charter, specifically oversees cybersecurity risk and governance. Management provides the audit committee regular updates covering information security issues, recent
- 24 -
organizational developments and IT initiatives, vulnerability assessments, third-party evaluations, and emerging best practices. The audit committee also engages with our internal audit firm and other external specialists about organizational risks related to cybersecurity, as well as the policies and controls designed to mitigate these risks. In January 2024, our board of directors participated in a cybersecurity training session provided by our internal audit firm. Our audit committee or the board of directors is actively involved in strategic cybersecurity decisions, providing guidance and concurrence for significant or pervasive projects. This ensures that cybersecurity is seamlessly integrated into our strategic planning, aligning with our broader organizational goals.
Additionally, we have established a cross-organizational IT steering committee, comprising senior and executive leadership, enterprise risk management representatives, and IT management, many of whom have over 15 years of experience and hold professional certifications in their respective fields. In an effort to build a comprehensive cybersecurity strategy across the organization, this committee convenes several times each year to discuss ongoing cybersecurity initiatives, emerging regulatory requirements and industry standards, and results of risk assessments.
Cybersecurity incidents are regularly reported to cross-functional teams at each subsidiary through the dedicated means we have in place, and events deemed critical are reported to the Chief Executive Officer and Chief Financial Officer. Moreover, the audit committee and the board of directors are promptly informed of any significant cybersecurity incident, along with continuous updates until resolution.
Cybersecurity Risks, Threats and Material Incidents
Despite our endeavors to safeguard the security and integrity of our networks, systems, and the sensitive information they contain or transmit, including the adoption of numerous cybersecurity policies and protocols aimed at mitigating the risk of cybersecurity breaches or disruptions as previously outlined, it is impossible to guarantee the complete effectiveness of these measures. There remains a possibility that efforts to thwart cybersecurity threats may not be entirely successful, potentially resulting in successful breaches or disruptions that could be harmful. Refer to “Our failure to protect our management information systems against security breaches could adversely affect our business and results of operations” in Item 1A. Risk Factors.
As previously disclosed, we were targeted by a complex criminal scheme in March 2023, which resulted in fraudulently-induced outbound wire transfers to a third-party account (see Note 18 to the accompanying consolidated financial statements). The Company self-discovered the fraudulent activity and promptly contacted the remitting bank, receiving bank, dispute resolution experts, and federal and local law enforcement authorities. Moreover, we quickly informed the audit committee and regularly provided them with updates during investigation and recovery efforts. As a result of the fraud loss, net with funds recovered, and professional fees incurred related to an independent forensic investigation and efforts to recover the funds, we recognized $2.7 million of loss. We are unaware of any other significant security breaches at any of our business locations.
ITEM 2. PROPERTIES.
We occupy our corporate headquarters in Rockville, Maryland, under a lease covering 2,521 square feet of office space.
GPS owns and occupies a three-story office building (23,380 square feet) and the underlying land (1.75 acres), located in Glastonbury, Connecticut, that serves as its headquarters.
TRC owns and occupies a one-story industrial fabrication and warehouse facility (90,000 square feet), containing approximately 5,400 square feet of office space, and the underlying land (12.16 acres), located in Winterville, North Carolina. TRC also leases two offices (2,200 and 1,800 square feet) that are located close to one another in Winterville, North Carolina.
APC owns the top two floors (3,500 square feet) and leases an additional floor (2,000 square feet) of an office building located in Limerick, Ireland, that serves as its headquarters. In addition, APC owns an operations support facility in Nenagh, Ireland, that includes approximately 10,663 square feet of warehouse and a small amount of office space. APC also leases office space in Derby, England, and warehouse space in Billingham, England.
SMC is primarily located in Tracys Landing, Maryland, and leases facilities that include approximately five acres of land, a 2,400 square foot maintenance facility and approximately 3,900 square feet of office space. SMC also leases office space (3,570 square feet) and warehouse space (11,460 square feet) in Hampton, Virginia.
- 25 -
We consider the Company’s owned and leased properties to be sufficient for continuation of our operations for the foreseeable future. Our operations in the field may require us to occupy additional facilities for project support, staging or on customer premises or job sites. Accordingly, we may rent local office space, construction offices on or near job sites, storage yards for equipment and materials and temporary housing units; all under arrangements that are temporary or short-term in nature. These costs are expensed as incurred and are included substantially in the cost of revenues.
ITEM 3. LEGAL PROCEEDINGS.
Note 10 to the accompanying consolidated financial statements included in Item 8 of Part II of this 2024 Annual Report presents a discussion of our legal matters. In the normal course of business, we may have other pending claims and legal proceedings. It is our opinion, based on information available at this time, that any other current claim or proceeding will not have a material effect on our consolidated financial statements.
ITEM 4. MINE SAFETY DISCLOSURES.
Not applicable.
- 26 -
PART II
ITEM 5. MARKET FOR REGISTRANT’S COMMON EQUITY, RELATED STOCKHOLDER MATTERS AND ISSUER PURCHASES OF EQUITY SECURITIES.
Shares of our common stock trade under the symbol AGX on the New York Stock Exchange (the “NYSE”). As of April 6, 2024, we had approximately 52 stockholders of record. This number does not include shareholders for whom shares were held in “street name.”
Dividends
In September 2023, our board of directors increased our regular quarterly cash dividend by 20% from $0.25 to $0.30 per share of common stock for the cash dividend that was paid in October 2023. Prior to that increase and since Fiscal 2019, our board of directors declared and we paid regular quarterly cash dividends of $0.25 per share, totaling $1.00 per share for each year. During Fiscal 2021, our board of directors also declared and we paid two special cash dividends of $1.00 per share each.
Each quarter, our board of directors evaluates the Company’s ongoing operational and financial performance in determining the amount of the regular dividend and any special dividend. There can be no assurance that these evaluations will result in the payments of cash dividends in the future.
Share Repurchase Program
During Fiscal 2023, our board of directors authorized an increase in our share repurchase program from $100 million to $125 million. The repurchases may occur in the open market or through investment banking institutions, privately-negotiated transactions, or direct purchases. The timing and amount of stock repurchase transactions will depend on market and business conditions, applicable legal and credit requirements and other corporate considerations. In accordance with the SEC’s Rule 10b5-1, and pursuant to our share repurchase plan, we have allowed, and may in the future allow, the repurchase of common stock during trading blackout periods by an investment banking firm or other institution agent acting on our behalf pursuant to predetermined parameters.
In our reports on Form 10-Q for the first three quarterly periods of Fiscal 2024, we disclosed the number of shares repurchased during each month of the applicable quarter and information related to the costs of the repurchase transactions. Information related to our share repurchases for the fourth quarter of Fiscal 2024 follows:
Approximate Dollar | ||||||||||
Total Number of | Value of Shares That May Yet | |||||||||
Shares Purchased as Part | Be Purchased under the | |||||||||
Total Number of | Average Price per | of Publicly Announced | Plans or Programs | |||||||
Period |
| Shares Repurchased |
| Share Paid |
| Plans or Programs |
| (Dollars in Thousands) | ||
November 1 - 30, 2023 | 4,881 | $ | 44.40 | 4,881 | $ | 27,758 | ||||
December 1 - 31, 2023 | 7,721 | $ | 43.60 | 7,721 | $ | 27,422 | ||||
January 1 - 31, 2024 | 80,125 | $ | 43.67 | 78,117 | $ | 24,018 | ||||
Total |
| 92,727 |
| 90,719 | ||||||
In January 2024, we accepted 2,008 shares of our common stock at the average price per share of $47.61 for the exercise price and/or tax withholding in connection with stock option exercises and/or restricted stock unit settlements that occurred during the month. Also during the month ended January 31, 2024, we repurchased 73,000 shares of common stock in a direct purchase from a director of the Company for an aggregate price of approximately $3.2 million, or $43.50 per share.
- 27 -
Common Stock Price Performance Graph
The graph presented below compares the percentage change in the cumulative total stockholder return on our common stock for the last five years with the S&P 500, a broad market index, and the Dow Jones US Heavy Construction TSM Index, a group index of companies where their focus is limited primarily to heavy civil construction. The returns are calculated assuming that an investment with a value of $100 was made in our common stock and in each index at January 31, 2019, and that all dividends were reinvested in additional shares of common stock. The graph lines merely connect the measuring dates and do not reflect fluctuations between those dates. The stock performance shown on the graph is not intended to be indicative of future stock performance.
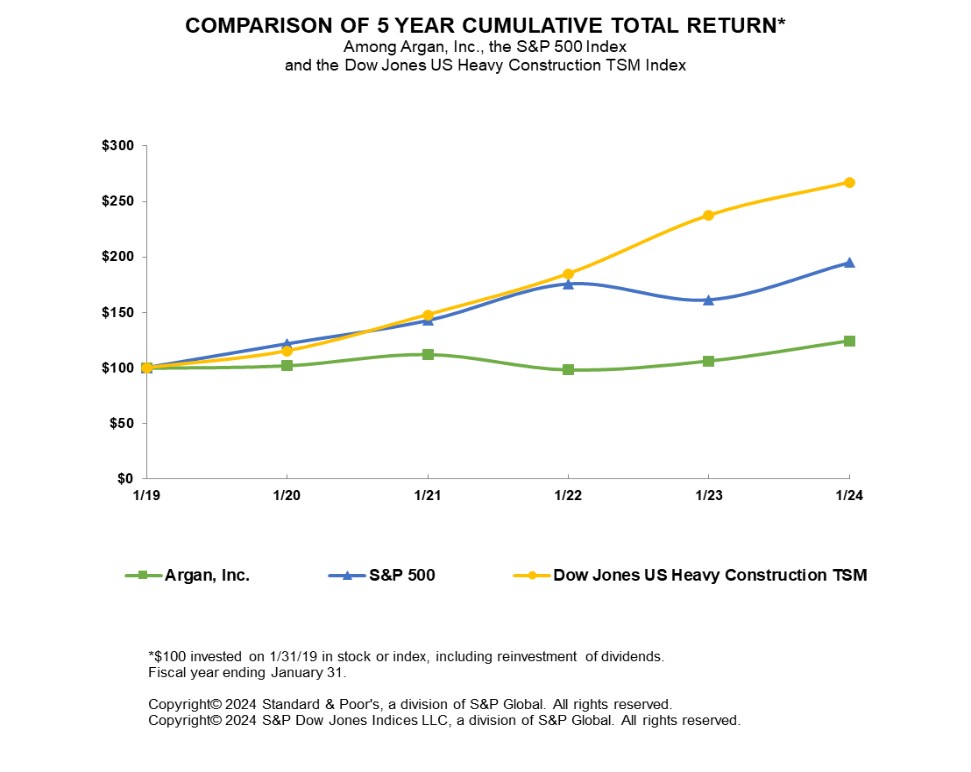
Years Ended January 31, | ||||||||||||
| 2019 |
| 2020 |
| 2021 |
| 2022 |
| 2023 |
| 2024 | |
Argan, Inc. |
| $ 100.00 |
| $ 102.10 |
| $ 112.11 |
| $ 98.53 |
| $ 106.37 |
| $ 124.16 |
S&P 500 |
| 100.00 |
| 121.68 |
| 142.67 |
| 175.90 |
| 161.45 |
| 195.06 |
Dow Jones US Heavy Construction TSM |
| 100.00 |
| 115.28 |
| 147.95 |
| 184.87 |
| 237.63 |
| 267.42 |
Unregistered Sales of Equity Securities and Use of Proceeds
None.
- 28 -
ITEM 6. [RESERVED]
ITEM 7. MANAGEMENT’S DISCUSSION AND ANALYSIS OF FINANCIAL CONDITION AND RESULTS OF OPERATIONS.
This section of our 2024 Annual Report may include projections, assumptions and beliefs that are intended to be “forward-looking statements.” They should be read in light of our cautionary statement regarding “forward-looking statements” presented at the beginning of this 2024 Annual Report. The following discussion summarizes the financial position of Argan, Inc. and its subsidiaries as of January 31, 2024, and the results of their operations for Fiscal 2024 and Fiscal 2023, and should be read in conjunction with the consolidated financial statements and notes thereto included elsewhere in Item 8 of this 2024 Annual Report.
Please see “Item 7. Management’s Discussion and Analysis of Financial Condition and Results of Operations,” in the Company’s Annual Report on Form 10-K for the year ended January 31, 2023, that was filed with the SEC on April 17, 2023, for a discussion of financial trends, variance drivers and other significant matters for Fiscal 2023 as compared with Fiscal 2022.
Business Description
The Company is primarily a construction firm that conducts operations through its wholly-owned subsidiaries, GPS, APC, TRC and SMC. Through GPS and APC we provide a full range of engineering, procurement, construction, commissioning, maintenance, project development and technical consulting services to the power generation market, including the renewable energy sector, for a wide range of customers, including independent power project owners, public utilities, power plant heavy equipment suppliers and other commercial firms with significant power requirements in the U.S., Ireland and the U.K. GPS and APC represent our power industry services reportable segment. Through TRC, the industrial construction services reportable segment provides primarily field services that support new plant construction and additions, maintenance turnarounds, shutdowns and emergency mobilizations for industrial plants primarily located in the Southeast region of the U.S. and that may include the fabrication, delivery and installation of steel components such as piping systems and pressure vessels. Through SMC, which conducts business as SMC Infrastructure Solutions, the telecommunications infrastructure services segment provides project management, construction, installation and maintenance services to commercial, local government and federal government customers primarily in the Mid-Atlantic region of the U.S.
We may make additional opportunistic acquisitions and/or investments by identifying companies with significant potential for profitable growth and realizable synergies with one or more of our existing businesses. However, we may have more than one industrial focus depending on the opportunity and/or needs of our customers. Significant acquired companies will be operated in a manner that we believe will best provide long-term and enduring value for our stockholders.
Overview
Operating Results
Consolidated revenues for Fiscal 2024 were $573.3 million, which represented an increase of $118.3 million, or 26.0%, from consolidated revenues of $455.0 million reported for Fiscal 2023.
The revenues of the power industry services segment increased by $70.3 million to $416.3 million for Fiscal 2024 from $346.0 million reported for Fiscal 2023, representing an increase of 20.3%. The revenues of this reportable segment represented 72.6% of consolidated revenues for Fiscal 2024. For Fiscal 2023, the percentage share of consolidated revenues represented by this reportable segment was 76.0%. The industrial construction services business reported revenues of $142.8 million for Fiscal 2024. This amount represented an increase of $50.0 million, or 53.9%, from revenues of $92.8 million reported for Fiscal 2023. Revenues provided by this reportable business segment represented 24.9% and 20.4% of corresponding consolidated revenues for Fiscal 2024 and Fiscal 2023, respectively. Revenues of the telecommunications infrastructure services business decreased to $14.3 million for Fiscal 2024 from revenues of $16.2 million for Fiscal 2023. Revenues provided by this reportable segment represented 2.5% and 3.6% of corresponding consolidated revenues for Fiscal 2024 and Fiscal 2023, respectively.
Consolidated gross profit declined by $5.5 million, or 6.4%, to $80.8 million for Fiscal 2024, or 14.1% of the corresponding consolidated revenues. The amount of consolidated gross profit reported for Fiscal 2023 was $86.4 million, or 19.0% of
- 29 -
the corresponding consolidated revenues. The reduction in the overall gross profit amount and percentage for the current fiscal year was primarily due to the recorded loss of $13.6 million related to APC’s construction contract in Northern Ireland. The effect of the contract loss on the gross profit amount for Fiscal 2024 was meaningfully offset by the profits earned on the performance of other projects by each of our four operating companies, including APC.
Selling, general and administrative expenses for Fiscal 2024 and Fiscal 2023 were $44.4 million, or 7.7% of corresponding consolidated revenues, and $44.7 million, or 9.8% of corresponding consolidated revenues, respectively. The net amount of other income increased significantly for Fiscal 2024 to $12.5 million from $4.3 million reported for Fiscal 2023 due primarily to increased investment income.
Due primarily to the consolidated pre-tax book income reported for Fiscal 2024 in the amount of $48.9 million, we reported income tax expense in the amount of $16.6 million for the year. For Fiscal 2023, we reported consolidated pre-tax book income of $46.0 million and recorded income tax expense in the amount of $11.3 million.
For Fiscal 2024, our overall operating performance resulted in net income attributable to our stockholders in the amount of $32.4 million, or $2.39 per diluted share. For Fiscal 2023, our overall operating performance resulted in net income attributable to our stockholders in the amount of $33.1 million, or $2.33 per diluted share.
Project Backlog
At January 31, 2024 and 2023, our consolidated project backlog amount of $0.8 billion consisted substantially of the projects of the power industry services reporting segment. Our reported amount of project backlog at a point in time represents the total value of projects awarded to us that we consider to be firm as of that date less the amounts of revenues recognized to date on the corresponding projects.
Typically, we include the total value of EPC services and other major construction contracts in project backlog upon receiving a notice to proceed from the project owner. When provided with LNTP, we usually record only the value of the contract related to the LNTP initially. Nevertheless, the inclusion of contract values in project backlog may require management judgement based on the facts and circumstances.
We are committed to the construction of state-of-the-art, natural gas-fired power plants, as important elements of our country’s electricity-generation mix now and in the future. This represents our core business. In addition, we have been directing meaningful business development efforts to winning projects for the erection of utility-scale solar fields and wind farms and for the construction of hydrogen-based energy and other industrial projects in order to diversify the sources of revenues. We have successfully completed alternative energy projects in the past and we have renewed efforts to obtain new work in other sectors of the power market that will complement our natural gas-fired EPC services projects going forward.
It is important to note that the start of new projects is primarily controlled by project owners and that delays may occur that are beyond our control. However, we continue to pursue natural gas-fired power plant, renewable energy plant and industrial construction opportunities in the U.S., Ireland and the U.K. Our vision is to safely contribute to the construction of the energy infrastructure and state-of-the-art industrial facilities that are essential to future economic prosperity in the areas where we operate. We intend to realize this vision with motivated, creative, high-energy and customer-driven teams that are committed to delivering the best possible project results each and every time.
Trumbull Energy Center
In October 2022, GPS added to project backlog the EPC services contract value of the Trumbull Energy Center, a 950 MW natural gas-fired power plant now under construction in Lordstown, Ohio (the “Trumbull Energy Center”). We received the full notice to proceed from the project owner, Clean Energy Future-Trumbull, LLC, in November 2022. This combined cycle power station will consist of two Siemens Energy SGT6-8000H gas-fired, high efficiency, combustion turbines with two heat recovery steam generators and a single steam turbine. Project completion is scheduled for early in the year ending January 31, 2027.
Guernsey Power Station
In January 2019, GPS entered into an EPC services contract to construct an 1,875 MW natural gas-fired power plant in Guernsey County, Ohio (the “Guernsey Power Station”). Caithness Energy, L.L.C. (“Caithness”) led the development of
- 30 -
this project. Using state-of-the-art combined cycle technology and an air-cooling system, the Guernsey Power Station will be a cost-efficient, fuel-efficient, electricity generating power plant that protects air quality and conserves water with the capability to satisfy the electricity needs of approximately one million homes.
The combined cycle design of this plant utilizes three power trains, with each one including a gas-fired turbine, a heat recovery steam generator and a steam turbine, that will enable this plant to generate significantly more power from the equivalent amount of fuel than a traditional gas-fired power plant. The Guernsey Power Station also uses dry cooling technology to reduce water usage by as much as 95% compared with a water-cooled power plant. Because of its advanced design, the power plant will achieve extremely low emission levels from a gas-fired power plant of its type.
After receiving a full notice-to-proceed, GPS commenced substantial activities for this project in August 2019, which remains the largest, single-phase, gas-fired, power plant construction project in the U.S. Completion of construction activities on this project occurred during Fiscal 2024, and as of January 31, 2024, a nominal amount related to this effort remains in project backlog.
It should be noted that this major project, the largest in the history of GPS, was substantially executed during the worst phases of the COVID-19 epidemic and the most severe global impacts of the recent overall supply chain disruptions. Yet, the completed plant was delivered successfully to the project owner.
Midwest Solar and Battery Projects
In August 2023, GPS executed LNTPs with a customer for three solar and battery projects in Illinois (the “Midwest Solar and Battery Projects”). Under the LNTPs, GPS commenced early engineering and design activities as well as procurement of major equipment for construction of state-of-the-art solar energy and battery energy storage facilities. In January 2024, GPS received full notices to proceed on two of the solar and battery projects. The three projects will cumulatively represent 160 MW of electrical power and 22 MW of energy storage.
Maple Hill Solar Facility
In May 2021, we announced that GPS entered into an EPC services contract with CPV Maple Hill Solar, LLC, an affiliate of Competitive Power Ventures, Inc. (“CPV”), to construct the Maple Hill Solar facility, which is among the largest solar-powered energy plants in Pennsylvania. The unique Maple Hill Solar project, which is located in Cambria County, includes over 235,000 photovoltaic modules for the generation of up to approximately 100 MW of electrical power. Final completion of the project and site demobilization occurred near the end of Fiscal 2024, and as of January 31, 2024, no amount related to Maple Hill remained in project backlog.
Shannonbridge Power Project
APC entered into an EPC services contract with GE Vernova for the construction and commissioning of an open-cycle thermal power facility in County Offaly, Ireland, that will have the capacity to generate approximately 264 MW of temporary emergency electrical power (the “Shannonbridge Power Project”). The Shannonbridge Power Project, an initiative of EirGrid and the Electricity Supply Board of Ireland (the “ESB”), aims to enhance the region’s power infrastructure and to ensure a reliable electricity supply during critical situations and emergencies. GPS is teaming with APC in performance of this contract. Work on this project commenced early in Fiscal 2024 pursuant to the receipt of a series of LNTPs. In August 2023, APC received the full notice to proceed on this project. Project completion is expected in the first half of the fiscal year ending January 31, 2025 (“Fiscal 2025”).
ESB FlexGen Peaker Plants
In May 2022, APC entered into engineering and construction services contracts with the ESB to construct three 65 MW aero-derivative gas turbine flexible generation power plants in and around the city of Dublin, Ireland (“ESB FlexGen Peaker Plants”). Two of the power plants, the Poolbeg and Ringsend FlexGen Power Plants, are located on the Poolbeg Peninsula, and the Corduff FlexGen Power Plant is located in nearby Goddamendy. All three projects cleared the applicable capacity auction in Fiscal 2023 and are expected to operate intermittently during peak periods of electricity demand and as back-up supply options when renewable electricity generation is limited. The completion of each power facility is expected to occur in early Fiscal 2025.
- 31 -
Kilroot Power Station
In October 2021, APC was contracted to construct a 2 x 330 MW natural gas-fired power plant in Carrickfergus that is near Belfast, Northern Ireland, in an existing structure that was initially designed to enclose coal-fired units (the “Kilroot Power Station” or the “Kilroot” project). See “The Kilroot Project Loss” below for discussion of the challenges related to this project and the loss recorded in Fiscal 2024 related to this project.
TRC Project Backlog
As of January 31, 2024, TRC’s project backlog was approximately $127.5 million, slightly up from $123.5 million on January 31, 2023, demonstrating the ability to maintain and increase project backlog despite converting a significant amount of previous project backlog into revenues, which increased by approximately 53.9% in Fiscal 2024 as compared to Fiscal 2023. This consistency is a result of targeted efforts to win larger industrial field service construction projects from both new and recurring clients. Following this strategic direction, TRC has streamlined by consolidating its pipe and vessel fabrication facilities, aiming to lower fixed costs and enhance operations for a scalable business model amidst growing construction demands.
Project Backlog Subsequent to Year-end
Since January 31, 2024, we have added to our project backlog as a result of GPS and TRC entering into several contract agreements, including certain LNTPs with several customers that support large solar and battery facilities and a planned natural gas-fired power plant, and service agreements for other power and industrial facilities.
The Kilroot Project Loss
There have been a number of challenges related to the Kilroot project that have adversely impacted our ability to execute as expected, including supply chain delays, material changes to the project, the COVID-19 omicron outbreak, the war in Ukraine and extreme weather. In addition, unresolved variances and claims have disrupted the execution of the project and harmed the cash flow of this project. Unresolved project-related matters continue to meaningfully impact the contract, our costs and the project schedule negatively. During the third quarter of Fiscal 2024, APC’s estimates of the unfavorable financial impacts due to difficulties on the Kilroot project escalated substantially. APC conducted an updated and comprehensive review of the costs of the efforts to complete the remaining contract work and recorded a contract loss. Our accounting reflects that the estimated costs of APC at the completion of the Kilroot project will exceed projected revenues by $10.0 million. The amount of this loss, plus the unfavorable adjustment of estimated gross profit of approximately $3.6 million recognized in the prior fiscal year in connection with the project, was reflected in our operating results for Fiscal 2024.
The project owner has provided notice to us asserting that it is entitled to schedule liquidated damages (the “LDs”). We do not agree with the project owner, who has continued to deny any of our entitlements to an extension of time related to owner delays, force majeure and other events, and we have not recorded any liability related to the LDs. We have identified and/or submitted claims, in excess of the amount of our recorded contract loss and the LDs, that we have not included in contract value at January 31, 2024. APC is continuing all efforts to resolve open variations, claims and an appropriate extension of time to mitigate these losses and improve the final results of the project. APC shall vigorously pursue all of its rights under the contract including through legal means if necessary.
APC has substantially completed the scope of its work and has turned over one of two power units to the owner, with the second power unit expected to be turned over imminently. First fire was achieved for one of the units in March 2024. APC continues to support commissioning efforts and is completing final works and punch list items, which is expected to be finished during the first half of Fiscal 2025. The determination of the amount of the loss identified above includes management’s estimates of the level of effort, and the associated costs, required for APC to complete the project. There can be no assurance that future unanticipated problems on this project will not result in APC incurring costs, that may be meaningful, in excess of those currently estimated for the completion of the contracted work or suffering unfavorable contract variations.
Operating Result Trends
The loss recorded for the Kilroot project in Fiscal 2024 obscured the otherwise strong operating performances of GPS, TRC, SMC and the Irish operations of APC. Consolidated revenues did increase by approximately 26% for Fiscal 2024.
- 32 -
Consolidated gross profit of $80.8 million for Fiscal 2024, however, was directly impacted by the $13.6 million loss recorded for the Kilroot project. As we continue to grow, the mix of our revenues may become more diversified with the addition of lower risk, lower margin projects that would result in lower overall gross margin percentages. However, our gross profit amounts will continue to grow as we reduce the overall risk profile of our project portfolio.
Market Outlook
Natural Gas Power
The overall growth of our power business has been substantially based on the number of combined cycle gas-fired power plants built by us, as many coal-fired plants have been shut down in the U.S. In 2010, coal-fired power plants accounted for about 45% of net electricity generation in the U.S. For 2023, coal fueled approximately 17% of net electricity generation. It has been reported that the average age of the active plants in the coal-fired fleet approximates 45 years old with an average life span of 50 years; the last coal-fired power plant built in the U.S. was constructed in 2015. On the other hand, natural-gas fired power plants provided approximately 42% of the electricity generated by utility-scale power plants in the U.S. in 2023, representing an increase of 70% in the amount of electrical power generated by natural gas-fired power plants, which provided approximately 24% of net electricity generation for 2010.
In the reference case of its most recently published Annual Energy Outlook released in March 2023, the EIA projects that economic growth paired with increasing electrification in end-user sectors will result in notable growth of electricity demand in the U.S. through 2050. Declining capital costs for solar panels, wind turbines and battery storage, as well as government subsidies like those included in the Inflation Reduction Act of 2022 (the “IRA”), will result in renewables becoming increasingly cost effective compared with the alternatives when the costs of building new power capacity are considered. Renewables are increasingly meeting power demand through 2050 as they become more competitive with natural gas, coal and nuclear power. As a result of the renewables growth, U.S. coal-fired generation capacity is forecasted to decline sharply to represent approximately 8% of net electricity generation for 2030, with a gradual decline thereafter.
The historic decline in the use of coal as a power source in the U.S. was caused, to a significant extent, by the plentiful supply of domestic and generally inexpensive natural gas which made it the fuel of choice for power plant developers over this period. The pace of the historic increase in the preference for natural gas as an electricity generating fuel source also was energized, in part, by environmental activism and restrictive regulations targeting coal-fired power plants.
However, the headwinds confronting a significant resurgence in the pace of planning new developments of gas-fired power plants are strong. The environmentalist opposition against coal-fired power generation expanded meaningfully to target all fossil fuel energy projects, including both power plants and pipelines, and evolved into powerful support for renewable energy sources. Various cities, counties and states have adopted clean energy and carbon-free goals or objectives with achievement expected by a certain future date, typically 10 to 30 years out. These aspirational goals may increase the risk of a new power plant becoming a stranded asset long before the end of its otherwise useful economic life, a risk that potential equity capital providers may be unwilling to take. The difficulty in obtaining project equity financing and the other factors identified above, may be adversely impacting the planning and initial phases for the construction of new natural gas-fired power plants. Lenders, who have become more wary of funding fossil-fuel ventures as environmental, social and governance ideals influence financing decisions, may be generally unwilling to provide capital for energy projects to increase the domestic production and transmission of oil and natural gas. In addition, insurance underwriters may require oil and gas industry clients to implement plans to reduce methane emissions, that are among the most severe greenhouse gases, and will not provide insurance coverage for oil and gas projects in government-protected conservation areas that do not allow for sustainable use.
Solar and Wind Power
The net amount of electricity generation in the U.S. provided by utility-scale solar photovoltaic and wind facilities continues to rise. Together, such power facilities provided approximately 12%, 13% and 15% of the net amount of electricity generated by utility-scale power facilities in 2021, 2022 and 2023, respectively. EIA projects that new wind and photovoltaic solar capacity will continue to be added to the utility-scale power fleet in the U.S. at a brisk pace substantially attributable to declines in the amount of renewable power plant component and power storage costs, an increase in the scale of energy storage capacity (i.e., battery farms and other energy storage technologies), the availability of valuable tax credits and the overall political commitment to renewable energy.
- 33 -
The surge in renewable energy is propelled by significant factors, including a nearly 90% reduction in solar power costs and a two-thirds decrease in onshore wind costs between 2009 and 2023. These cost reductions, driven by technological advancements, have led to widespread global adoption. The EIA indicated that for 2024, of the approximately 62.8 gigawatts of new utility-scale electric-generating capacity that is planned to be added to U.S. power grids, approximately 71% will come from solar and wind facilities. However, challenges persist, notably in offshore wind sectors facing cost overruns and supply chain issues, resulting in major offshore wind projects being delayed or cancelled.
The Power Grid Transition
Throughout the U.S., the risk of electricity shortages grows as the retirement of traditional power plants outpaces their replacement by renewable energy and battery storage. The strain on power grids mounts as the U.S. makes the historic transition from conventional power plants fueled by coal and natural gas to renewable forms of energy such as solar and wind power. Electric-grid operators are warning that power-generating capacity is struggling to keep up with demand, a gap that could lead to additional rolling blackouts during heat waves or other peak power periods.
The challenge is that solar and wind farms do not produce electricity at all times and they need large batteries to store their output for later use. While large battery storage capacity is under development, regional grid operators have warned that the pace may not be fast enough to offset the closures of traditional power plants that can work around the clock.
PJM published a study in February 2023 that supported the growing concern that the reliability of power grids is being eroded by the rush to renewable power. Its research highlighted three trends that present increasing reliability risks during the transition due to a potential timing mismatch between load growth, resource retirements and the pace of new electricity generating plant additions. The study indicates that the growth rate of electricity demand in the PJM footprint is likely to increase from electrification (i.e., shifts to electric-powered automobiles, electric appliances, etc.) coupled with the proliferation of high-demand data centers in the region. Coal-fired and old gas-fired power generation facilities are being retired at a rapid pace, possibly creating the risk that such retirements may outpace the construction of new power-generating facilities as PJM’s interconnection queue includes primarily intermittent and limited-duration renewable energy resources. Given the operating characteristics of these types of facilities, PJM will need multiple megawatts of renewable power and accompanying battery storage, and improvements in the transmission network, to replace a single megawatt of thermal generation.
Accelerating the build-out of renewable energy sources and batteries has become an especially difficult proposition amid supply-chain challenges and inflation. For example, during Fiscal 2023, the highly publicized probe by the U.S. Commerce Department into whether Chinese solar manufacturers were circumventing trade tariffs on solar panels had the effect of halting imports of key components needed to build new solar farms. As a result of this probe, the U.S. determined that certain Chinese solar manufacturers were dodging U.S. tariffs by finishing their products in Cambodia, Malaysia, Thailand and Vietnam, countries that accounted for approximately 80% of solar panel supplies. In August 2023, the U.S. Commerce Department imposed tariffs on solar imports from Southeast Asia. Critics of this action claim that the tariffs will scramble supply chains, delay projects and reduce profits for solar farm developers.
Additionally, solar and wind energy plant developers continue to confront the problems caused by grid congestion, often unsuccessfully. Many of these projects have been canceled because renewable plants need to be sited where the resources are optimal, often in remote locations where the transmission systems are not robust as power is consumed substantially in urban areas. The costs associated with the necessary grid upgrades may be prohibitive.
U.S. offshore wind projects progress inconsistently, facing challenges in the areas of environmental and fishery impacts, grid connection complexities, transmission planning, federal permitting processes and rising interest rates. Further, U.S. projects are confronted by shipping regulations that may limit the ability of developers to replicate successful European erection models. Commitments to sell power at a fixed price in an environment of rising inflation and interest rates have challenged the finances of many offshore wind projects, and as a result several prominent projects have been delayed or cancelled. Proponents of clean energy also face political challenges from constituencies who oppose the impacts to wildlife and the environment that may be caused by clean energy infrastructure projects.
Nuclear Power
Electricity generation from commercial nuclear power plants in the U.S. began in 1958. Over the last several decades, the number of operating nuclear reactors has declined. At the end of August 2023, the U.S. had 93 operating commercial
- 34 -
nuclear reactors at 54 nuclear power plants in 28 states. The average age of these nuclear reactors is approximately 42 years old with most plants authorized to operate for another 20 years. Few nuclear reactors have been constructed in the U.S. over the last several decades. Construction of the Vogtle Units 3 and 4 located in Georgia began in 2009. After lengthy construction delays and billions of dollars of cost overruns, Vogtle Unit 3 commenced commercial operation in August 2023, which marks the first nuclear reactor commissioned in the U.S. since the Tennessee Valley Authority’s Watts Bar 2 in 2016, which was twenty years after the previous one began operation.
Renewed interest in nuclear power could result in the construction of carbon-free, electricity generation stations in the U.S. that would use smaller and more economical nuclear reactors. The deployment of small modular reactors could mean lower construction and electricity costs through the use of simpler power plant designs, standardized components and passive safety measures. Such plants could be built in less time than larger plants, utilize less space and represent a viable choice for reliable power to offset the intermittencies of renewable power sources. The increase by the U.S. in its use of nuclear power for electricity generation could have unfavorable effects on the demand for new natural gas-fired and additional renewable energy facilities in the future, but could provide balance-of-plant construction opportunities for GPS.
Hydrogen Power
It is important to note that the plans for certain natural gas-fired power plant projects include the integration of hydrogen-burning capabilities. While the plants will initially burn natural gas alone, it is planned by the respective project owners that the plants will eventually burn a mixture of natural gas and green hydrogen, thereby establishing power-generation flexibility for these plants. Operational testing of gas turbines fueled with renewable hydrogen have been successful. We believe this pairing is a winning combination that provides inexpensive and efficient power, enhances grid reliability and addresses clean-air concerns. The building of state-of-the-art power plants with flex-fuel capability replaces coal-fired power plants in the short term with relatively clean gas-fired electricity generation. Further, such additions to the power generation fleet provide the potential for the plants to burn 100% green hydrogen gas, which would provide both base load power and long duration back-up power, when the sun is not shining or the wind is not blowing, for extended periods of time and without certain harmful air emissions.
The Regulatory Landscape
We believe that significant uncertainty relates to the policies of the current U.S. presidential administration. President Biden proposes to make the electricity production in the U.S. carbon free by 2035 and to put the country on the path to achieve net zero carbon emissions by 2050.
In August 2022, President Biden signed the IRA, a climate and healthcare bill that funds hundreds of billions of dollars in tax subsidies intended to combat climate change among other measures. According to certain commentary, the legislation will cause investment in technologies needed for leaner production and the use of fuel types, including hydrogen, nuclear, renewables and fossil fuels. However, it appears that receipt of the majority of the tax subsidies will be conditioned on the extent that taxpayers “buy American” and/or pay prevailing wages, among other requirements. Existing supply chains and skilled labor pools may lack the capacity to meet the demand that the incentives are intended to create. Therefore, the subsidies may not provide the intended economic incentives to renewable and other energy project owners.
In May 2023, the Biden administration proposed new rules for the Environmental Protection Agency (the “EPA”) that are intended to drastically reduce greenhouse gases from coal- and gas-fired power plants that officials admit will cost such plants billions of dollars to comply fully by 2042. The proposed rules would give owners of energy plants flexibility in choosing the means to achieve the emission targets. Alternatives could include the installation of carbon-capture systems or the blending of cleaner fuels such as hydrogen. Opponents to the rules posit that the technology needed to meet such emissions targets, particularly for carbon capture and storage as well as hydrogen blending, is not yet commercially available, and as a result, makes compliance uncertain. Additionally, environmental groups and landowners have challenged plans to erect pipelines intended to transfer carbon emissions to storage locations. In March 2024, the EPA signaled it will narrow the scope of the rules by excluding existing natural gas power plants. Final rules are expected in 2024.
In June 2023, President Biden signed the debt ceiling bill which included reforms for certain elements of the permitting process for energy projects. The bill imposes certain timelines for federal agencies to review and to approve elements of major energy projects and includes provisions designating a single agency to take the lead on the environmental review
- 35 -
process. Such streamlining of the current permitting process for energy generating facilities could ease certain constraints on the power industry.
Capacity Auctions
Most of our recently completed and awarded EPC service contracts relate to the construction of natural gas-fired power plants located within the Mid-Atlantic geographic footprint of PJM, which operates a capacity market to ensure long-term grid reliability by securing the appropriate amount of power supply resources needed to meet predicted future energy demands in its region. Capacity payments represent meaningful portions of the revenue streams of qualifying power plants. Annual capacity auctions since 2021 have suffered delays that, once held, resulted in lower prices than previous auctions. In June 2023, FERC issued an order accepting delays in future capacity auctions so that market design rule changes proposed by stakeholders might be implemented for all future auctions. In January 2024, FERC approved only one component of PJM’s two-part proposal for its capacity auction reform.
Uncertainty in this market, including the difficulties experienced by PJM in implementing a capacity auction design that all of its stakeholders consider to be fair, the repeated capacity auction delays, and the shrinking annual capacity auction prices, may discourage potential power plant owners from commencing the development of new power plants in this area thereby reducing potential new business opportunities for us.
Outlook for Natural Gas-Fired Power Plants
Despite the headwinds, we believe that the lower operating costs of natural gas-fired power plants, the higher energy generating efficiencies of modern gas turbines, and the requirements for grid resiliency should sustain the demand for modern combined cycle and simple cycle gas-fired power plants in the future. Natural gas is relatively clean burning, generally cost-effective, dependable and abundant. New gas-fired power plants incorporate major advances in gas-fired turbine technologies that have provided increased power plant efficiencies while providing the quick starting capabilities and the reliability that are necessary to balance the inherent intermittencies of solar and wind power plants.
We believe that the benefits of natural gas as a source of power are compelling, especially as a complement to the deployment of solar and wind powered energy sources, and that the future long-term prospects for natural gas-fired power plant construction remain generally favorable as natural gas continues to be the primary source for power generation in our country. The future availability of less carbon-intense, higher efficiency and inexpensive natural gas in the U.S. should be a significant factor in the economic assessment of future power generation capacity additions, although the pace of new opportunities emerging may be restrained and the starts of awarded EPC projects may be delayed or cancelled due to the challenges described above.
It has been stated that the scramble for electricity, regardless of source, caused by the Russian invasion of Ukraine clarified that the 100% transition to renewable energy is in the distant future and has prompted, in part, renewed interest in not only carbon capture techniques, but carbon removal technologies as well. Carbon capture processes grab carbon from smokestacks and other sources of dense greenhouse gases, thereby reducing harmful emissions. Carbon-removal technologies are more demanding as they remove carbon out of the more diffuse open air in order to store it for centuries. Governments, including the U.S., are taking initial steps to boost this industry. The success of this industry could reduce the climate-change fear associated with natural gas-fired power plants. We intend to execute an “all-of-the-above” approach in pursuing the construction of future facilities that support the energy transition, which we see as a continuation of our historical commitment to building cleaner energy plants.
International Power Markets
The foregoing discussion in this “Market Outlook” has focused on the state of the domestic power market as the EPC services business of GPS historically provides the predominant portion of our revenues. However, overseas power markets provide important new power construction opportunities for APC especially across Ireland and the U.K.
While both of these countries are committed to the increase in energy consumption sourced from the sun and wind on the pathway to net zero emissions, there is a recognition that these sources of electrical power are inherently variable. Other technologies will be required to support these power sources and to provide electricity when power demands exceed the amount of electricity supplied by these renewables. The existence of the necessary power reserve will require conventional generation sources, typically natural gas-fired power plants in Ireland but including nuclear power in the U.K.
- 36 -
The Irish government has issued a policy statement on the security of the electricity supply in Ireland which confirms the requirement for the development of new support technologies to deliver on its commitment to have 80% of the country’s electricity generated from renewables by 2030. The report emphasizes that this will require a combination of conventional generation (typically powered by natural gas), interconnection to other jurisdictions, demand flexibility and other technologies such as battery storage and generation from renewable gases. The Irish government has approved that the development of new conventional generation (including gas-fired and gasoil distillate-fired generation) is a national priority and should be permitted and supported in order to ensure the security of electricity supply while supporting the growth of renewable electricity generation.
Further, the Irish government recognizes that the successful development of data centers in the country is a key aspect in promoting Ireland as a digital economy hot-spot in Europe. The stewards of the electricity supply in Ireland acknowledge that the large increase in electricity demand presented by the growth of the data center industry represents an evolving, significant risk to the security of the supply. During Fiscal 2023, APC completed a project to install natural gas-fired power generation for a major data center in the Dublin area.
Recently, the government of the U.K. expressed support for new gas-fired power plants to offset the remaining coal-fired plant retirement, the retirement of aging gas plants, and the intermittency of renewable energy plants. Prime Minister Rishi Sunak stated that he would not gamble with energy security despite U.K. plans to decarbonize the power system by 2035. His secretary of state for energy security echoed these sentiments with a speech in which she stated that she expected to warn of blackouts unless there is sufficient gas-fired capacity to provide back-up for intermittent renewables. Her comments also expressed hope that new gas plants will be accompanied with the potential ability to burn 100% hydrogen or be fitted with carbon capture and storage technologies. Of course, the recency of these pronouncements means that it is too soon to expect energy policy shifts or the announcement of plans for specific new gas-fired power plants in the U.K. Further, the outlook for Mr. Sunak’s government is shaky and the opposition party is much more bullish on decarbonization.
Nonetheless, APC is actively pursuing other new business opportunities in both the renewable and support sectors of power generation with its existing and new clients in both countries. Over the last three years, APC has increased its activities and currently has multiple projects under execution. GPS has been providing top management guidance and project management expertise to APC during this period. APC has also provided experienced resources to GPS on several of its EPC services contracts in the U.S. These recent experiences have demonstrated that the two companies can combine and share resources effectively to leverage capacity and opportunities. We believe that GPS and APC working together is a competitive advantage as we pursue emerging new business opportunities in Ireland and the U.K. GPS is teaming with APC in the performance of the Shannonbridge Power Project.
The EPC Competitive Landscape
We are committed to the rational pursuit of new construction projects, including those with overseas locations and unique deployments of power-generation turbines, and the future growth of our revenues. This may result in additional decisions to make investments in the development and/or ownership of new projects. Because we believe in the strength of our balance sheet, we are willing to consider certain opportunities that include reasonable and manageable risks in order to assure the award of the related EPC or equipment installation services contracts to us.
The competitive landscape for our core EPC services business related to natural gas-fired power plants in the U.S. remains dynamic, although there are fewer competitors for new gas-fired power plant EPC services project opportunities. Several major competitors have exited the market for a variety of reasons or have been acquired. Others have announced intentions to avoid entering into fixed-price contracts. Nonetheless, the competition for new utility-scale gas-fired power plant construction opportunities is fierce and still includes multiple global firms. We believe that the Company has a reputation as an accomplished, dependable and cost-effective provider of EPC and other large project construction contracting services. With the proven ability to deliver completed power facilities, particularly combined cycle, natural gas-fired power plants, we are focused on expanding our position in the power markets of the U.S., Ireland and the U.K. where we expect investments to be made based on forecasts of electricity demand covering decades into the future. We believe that our expectations are valid and that our plans for the future continue to be based on reasonable assumptions.
- 37 -
Industrial Construction Services Outlook
TRC was founded in 1977, initially focused on the fabrication of piping systems and pressure vessels. Prior to our acquisition of TRC in 2015, it expanded its business to include industrial field services with a concentration on turnarounds, outage support, renovations, repairs and maintenance projects. Since the acquisition, TRC has narrowed the focus of its field services to emphasize industrial construction projects. During Fiscal 2023, TRC consolidated its metal fabrication plants and support structures into one industrial fabrication and warehouse facility near Greenville, North Carolina, which is centrally located within its primary geographic market. The consolidation reduced fixed costs and notably streamlined the business, which has permitted TRC to primarily focus on its field service construction opportunities.
Industrial field services typically represent the majority of TRC’s annual revenues with the remaining revenues contributed by projects consisting solely of metal fabrication. Recent and current major customers of TRC include Nutrien Ltd., the global fertilizer company; Jacobs Solutions Inc., an international engineering and construction firm that is building a significant biotechnology manufacturing facility in the research triangle area of North Carolina; and North America’s largest forest products companies such as Weyerhaeuser Company, International Paper and Domtar Corporation; and various other industrial companies. These relationships demonstrate that TRC is a trusted industrial services provider to blue chip customers from around North America, and from countries like France, Germany, Denmark, Japan, Belgium and Australia, that are expanding or locating new production facilities in TRC’s geographic region.
As stated above, the business footprint for TRC encompasses the Southeast region of the U.S. where there are many local and state governments that welcome industrial production facilities with ideal locations and with serious economic development programs and incentives. The national focus on infrastructure improvements, biotechnology advancements, energy storage and clean water have resulted in firms that are focused on these trends recently choosing TRC to participate in major construction projects in the region. Other important factors and trends include low corporate state tax rates, favorable labor migration patterns, the surface transportation infrastructure and the ready access to modern seaports.
Economic data supports our belief that TRC is ideally located in a leading manufacturing growth area of the U.S., which should continue to provide it with project opportunities going forward that will expand its business and industrial construction capabilities. The Dodge Construction Starts report for 2024 forecasts that total construction in the U.S. will increase by 7% in 2024, with a 16% increase in the manufacturing category. The FMI Construction Put-in-Place Forecast for 2024 predicts that construction activity in the manufacturing sector will increase by over 15% in 2024. This data suggests that manufacturing construction will be a robust market as the economy moves into 2024. Despite headwinds such as material price volatility and rising labor costs, skilled labor shortages, high interest rates and tighter lending standards, it is likely that 2024 will see a boost to construction associated with manufacturing, as well as the transportation and clean energy infrastructures, as funds from three key pieces of national legislation passed in 2021 and 2022 are expected to flow into the industry. These bills include the Infrastructure and Jobs Act, the IRA and the Creating Helpful Incentives to Produce Semiconductors Act, and appear to be sustaining high construction industry confidence for 2024 and the future beyond.
For Fiscal 2024, the revenues of TRC increased by approximately 54% to $142.8 million and the project backlog of TRC has grown by over 175% since January 31, 2022 to approximately $127.5 million as of January 31, 2024.
Comparison of the Results of Operations for the Years Ended January 31, 2024 and 2023
We reported net income attributable to our stockholders of $32.4 million, or $2.39 per diluted share, for Fiscal 2024. For the prior fiscal year, we reported net income attributable to our stockholders of $33.1 million, or $2.33 per diluted share. The following schedule compares our operating results for Fiscal 2024 and Fiscal 2023 (dollars in thousands):
- 38 -
Years Ended January 31, | ||||||||||||
2024 |
| 2023 |
| $ Change |
| % Change | ||||||
REVENUES |
|
|
|
|
|
|
| |||||
Power industry services | $ | 416,281 | $ | 346,033 | $ | 70,248 |
| 20.3 | % | |||
Industrial construction services |
| 142,801 |
| 92,774 |
| 50,027 |
| 53.9 | ||||
Telecommunications infrastructure services |
| 14,251 |
| 16,233 |
| (1,982) |
| (12.2) | ||||
Revenues |
| 573,333 |
| 455,040 |
| 118,293 |
| 26.0 | ||||
COST OF REVENUES |
|
|
|
|
|
|
|
| ||||
Power industry services |
| 357,705 |
| 277,402 |
| 80,303 |
| 28.9 | ||||
Industrial construction services |
| 124,321 |
| 78,034 |
| 46,287 |
| 59.3 | ||||
Telecommunications infrastructure services |
| 10,473 |
| 13,243 |
| (2,770) |
| (20.9) | ||||
Cost of revenues |
| 492,499 |
| 368,679 |
| 123,820 |
| 33.6 | ||||
GROSS PROFIT |
| 80,834 |
| 86,361 |
| (5,527) |
| (6.4) | ||||
Selling, general and administrative expenses |
| 44,376 |
| 44,692 |
| (316) |
| (0.7) | ||||
INCOME FROM OPERATIONS |
| 36,458 |
| 41,669 |
| (5,211) |
| (12.5) | ||||
Other income, net |
| 12,475 |
| 4,331 |
| 8,144 |
| 188.0 | ||||
INCOME BEFORE INCOME TAXES |
| 48,933 |
| 46,000 |
| 2,933 |
| 6.4 | ||||
Income tax expense |
| 16,575 |
| 11,296 |
| 5,279 |
| 46.7 | ||||
NET INCOME |
| 32,358 |
| 34,704 |
| (2,346) |
| (6.8) | ||||
Net income attributable to non-controlling interest |
| — |
| 1,606 |
| (1,606) |
| (100.0) | ||||
NET INCOME ATTRIBUTABLE TO THE STOCKHOLDERS OF ARGAN, INC. | $ | 32,358 | $ | 33,098 | $ | (740) |
| (2.2) | % | |||
Revenues
Power Industry Services
The revenues of the power industry services business increased by 20.3%, or $70.3 million, to $416.3 million for Fiscal 2024 compared with revenues of $346.0 million for Fiscal 2023, as the current year construction activities increased for the Trumbull Energy Center, the Shannonbridge Power Project, the ESB FlexGen Peaker Plants and the Midwest Solar and Battery Projects. The increase in revenues between years was partially offset by decreased construction activities associated with the Guernsey Power Station project, the Maple Hill Solar Facility and the Equinix data center project, as those projects are generally near or at completion. The revenues of this business represented approximately 72.6% of consolidated revenues for Fiscal 2024 and 76.0% of consolidated revenues for the prior year. The project backlog amounts for the power industry services reportable segment as of January 31, 2024 and 2023 were $0.6 billion and $0.7 billion, respectively.
Industrial Construction Services
The revenues of industrial construction services increased by $50.0 million, or 53.9%, to $142.8 million for Fiscal 2024 compared with revenues of $92.8 million for Fiscal 2023. The revenues of this business represented approximately 24.9% of consolidated revenues for Fiscal 2024 and 20.4% of consolidated revenues for the prior fiscal year. The strategy to focus on larger field projects, coupled with the consolidation of the two fabrication facilities during Fiscal 2023, enhanced leadership and a positive regional business environment has resulted in increased revenues and the ability to maintain project backlog at $127.5 million as of January 31, 2024 as compared to $123.5 million as of January 31, 2023.
Telecommunications Infrastructure Services
The revenues of telecommunications infrastructure services were $14.3 million for Fiscal 2024 compared with revenues of $16.2 million for Fiscal 2023.
Cost of Revenues
Due primarily to the increase in consolidated revenues for Fiscal 2024 compared with revenues for Fiscal 2023, consolidated cost of revenues also increased. These costs were $492.5 million and $368.7 million for Fiscal 2024 and Fiscal 2023, respectively.
- 39 -
For Fiscal 2024, we reported a consolidated gross profit of approximately $80.8 million, which represented a gross profit percentage of approximately 14.1% of corresponding consolidated revenues. Consolidated gross profit was adversely impacted by the $13.6 million loss recorded for the Kilroot Power Station project in the current fiscal year. However, the effect of the contract loss was meaningfully offset by the profits earned on the performance of other projects by each of our four operating companies, including APC.
The gross profit for the period reflected primarily the profit contributions of efficient construction activities related to the major projects of the power industry services reporting segment, which was adversely impacted by the loss recorded in Fiscal 2024 related to the Kilroot Power Station. The gross profit percentages of corresponding revenues for the power industry services, industrial construction services and telecommunications infrastructure services segments for Fiscal 2024 were 14.1%, 12.9% and 26.5%, respectively.
For Fiscal 2023, we reported a consolidated gross profit of approximately $86.4 million, which represented a gross profit percentage of approximately 19.0% of corresponding consolidated revenues. The gross profit percentages of corresponding revenues for the power industry services, industrial construction services and telecommunications infrastructure services segments for Fiscal 2023 were 19.8%, 15.9% and 18.4%, respectively.
Selling, General and Administrative Expenses
Selling, general and administrative expenses were $44.4 million and $44.7 million for Fiscal 2024 and Fiscal 2023, respectively, representing 7.7% and 9.8% of consolidated revenues for the corresponding periods, respectively.
Other Income, Net
For Fiscal 2024 and Fiscal 2023, the net amounts of other income were $12.5 million and $4.3 million, respectively, which represented an increase of 188.0% between the comparable periods. For Fiscal 2024 and Fiscal 2023, this line item included income in the amounts of $14.1 million and $3.4 million, respectively, earned on invested funds, as investment yields and average balances of invested funds have increased meaningfully between periods. Offsetting the increase of other income between periods is the wire-transfer fraud loss of $3.0 million that occurred in the first quarter of Fiscal 2024, of which $0.5 million in funds were recovered through legal efforts and insurance proceeds (see Note 18 to the accompanying consolidated financial statements). This line item also includes our share of the net income reported from our solar tax credit investments in the amount of $1.1 million for Fiscal 2023, with the corresponding amount for Fiscal 2024 being insignificant (see Note 12 to the accompanying consolidated financial statements).
Income Tax Expense
We recorded income tax expense for Fiscal 2024 in the net amount of approximately $16.6 million primarily due to our reporting pre-tax income for financial reporting purposes in the amount of $48.9 million for the year. Our annual effective income tax rate for Fiscal 2024 was 33.9%. This tax rate differed from the statutory federal tax rate of 21% due to various factors with unfavorable income tax effects. Most significantly, the net operating loss of APC’s subsidiary in the U.K., where the loss on the Kilroot Power Station project was recorded, was not tax effected with benefit. In addition, the actual effective tax rate reflected the effect of state income taxes, and the unfavorable effects of several nondeductible expense amounts, including certain executive compensation, meals, and other travel expenses, and an unfavorable adjustment to deferred taxes by APC. Partially offsetting these unfavorable effects were the foreign tax rate differential, which lowered the overall effective tax rate and the investment tax credit effect recorded in Fiscal 2024 related to our solar fund investments.
We recorded income tax expense for Fiscal 2023 in the net amount of approximately $11.3 million primarily due to our reporting pre-tax income for financial reporting purposes in the amount of $46.0 million for the year. Our annual effective income tax rate for Fiscal 2023 was 24.6%. This tax rate differed from the statutory federal tax rate of 21% due primarily to the effects of state income taxes, nondeductible executive compensation and the unfavorable effects of our settlement with the IRS related to research and development credits at an amount lower than we had previously recorded, partially offset by the favorable recognition of tax benefits related to research and development tax credits recognized in the current year and favorable deferred tax adjustments. See Note 12 to the accompanying consolidated financial statements.
- 40 -
Net Income Attributable to Non-Controlling Interest
As discussed above, we recorded a gain of $1.6 million related to the VIE settling on amounts owed for certain previously impaired development costs during Fiscal 2023, which was attributed to non-controlling interest. See Note 15 to the accompanying consolidated financial statements.
Liquidity and Capital Resources as of January 31, 2024
At January 31, 2024 and 2023, our balances of cash and cash equivalents were $197.0 million and $173.9 million, respectively, which represented an increase of $23.1 million between years.
The net amount of cash provided by operating activities for Fiscal 2024 was $116.9 million. Our net income for Fiscal 2024, adjusted favorably by the net amount of non-cash income and expense items, represented a source of cash in the total amount of $38.9 million. The increase in the balance of contract liabilities in the amount of $84.8 million represented a source of cash during the year as net billings were received in advance of the satisfaction of performance obligations on certain of our contracts. These favorable balance sheet account changes primarily related to the increases in contract liabilities for the Trumbull Energy Center and the Shannonbridge Power Project, partially offset by decreases in contract liabilities related to the Kilroot Power Station and the ESB FlexGen Peaker Plants. Additionally, the increase in the combined level of accounts payable and accrued expenses in the amount of $14.8 million represented a source of cash for the year. The decrease in accounts receivable in the amount of $2.8 million also represented a source of cash for the year. The increases in the balances of contract assets and prepaid expenses and other assets in the amounts of $23.4 million and $1.0 million, respectively, represented uses of cash during the year.
During Fiscal 2024, our primary source of cash from investing activities was the net maturities of CDs issued by the Bank, in the amount of $44.8 million. We used $104.5 million to invest in available-for-sale securities, consisting of U.S. Treasury notes and a U.S. corporate debt security. We also used $2.8 million to make capital expenditures, and we made a cash investment of $5.1 million in a solar tax credit entity during the year.
We used $26.1 million cash in financing activities during Fiscal 2024, including $12.5 million used to repurchase shares of common stock pursuant to our Share Repurchase Plan and $14.7 million used for the payment of regular cash dividends. Lastly, during Fiscal 2024, we received net $1.1 million of proceeds from the settlement of share-based awards. As of January 31, 2024, there were no restrictions with respect to intercompany payments between GPS, TRC, APC, SMC and the holding company.
During Fiscal 2023, our balance of cash and cash equivalents declined by a net amount of $176.6 million.
The net amount of cash used in operating activities for Fiscal 2023 was $30.1 million. However, our net income for Fiscal 2023, adjusted favorably by the net amount of non-cash income and expense items, represented a source of cash in the total amount of $39.0 million. The increases in accounts receivable, contract assets and other assets in the amounts of $23.2 million, $19.9 million and $3.3 million, respectively, represented uses of cash during Fiscal 2023. Additionally, the reduction in the balance of contract liabilities in the amount of $31.6 million represented a use of cash during Fiscal 2023 to fund, on a net basis, the satisfaction of performance obligations on certain of our contracts. These unfavorable balance sheet account changes primarily related to the decline in the construction activity of the Guernsey Power Station project, partially offset by increases in contract liabilities related to the Trumbull Energy Center and several APC projects. The increase in the combined level of accounts payable and accrued expenses in the amount of $9.1 million, represented a source of cash for Fiscal 2023.
Non-operating activities during Fiscal 2023 used cash to increase the level of our short-term investments, which consisted entirely of CDs issued by the Bank, by $59.8 million and to make capital expenditures in the amount of $3.4 million. We also used $82.8 million cash in financing activities during Fiscal 2023, including $68.2 million used to repurchase shares of common stock pursuant to our Share Repurchase Plan, and $14.0 million used for the payment of regular cash dividends.
At January 31, 2024, a portion of our balance of cash and cash equivalents was invested in a money market fund with most of its net assets invested in cash, U.S. Treasury obligations, other obligations issued by U.S. Government agencies and sponsored enterprises, and repurchase agreements secured by U.S. government obligations. The major portion of our domestic operating bank account balances are maintained with the Bank. We do maintain certain Euro-based bank accounts in Ireland and certain pound sterling-based bank accounts in the U.K. in support of the operations of APC.
- 41 -
In order to monitor the actual and necessary levels of liquidity for our business, we focus on working capital, or net liquidity, in addition to our cash balances. Our net liquidity increased by $8.7 million to $244.9 million as of January 31, 2024 from $236.2 million as of January 31, 2023, due primarily to our net income for the fiscal year, partially offset by common stock repurchases and the payment of cash dividends. As we have no debt service, as our fixed asset acquisitions in a reporting period are typically low, and as our net liquidity includes our short-term investments and available-for-sale investments, our levels of working capital are not subjected to the volatility that affects our levels of cash and cash equivalents.
During April 2021, we amended our Credit Agreement with the Bank which extended its expiration date to May 31, 2024 and reduced the borrowing rate. On March 6, 2023, we entered into the Second Amendment to the Credit Agreement. The Second Amendment modified the Credit Agreement primarily to replace the interest pricing with a rate of SOFR plus 1.6% and add SOFR successor rate language. The Credit Agreement, as amended, includes the following features, among others: a lending commitment of $50.0 million including a revolving loan and an accordion feature which allows for an additional commitment amount of $10.0 million, subject to certain conditions. Additionally, the Credit Agreement, as amended, continues to include customary terms, covenants and events of default for a credit facility of its size and nature. Prior to the expiration of the current term of the Credit Agreement, we expect to reach agreement with the Bank to amend and extend it.
We may also use the borrowing ability to cover other credit instruments issued by the Bank for our use in the ordinary course of business as defined by the Bank. At January 31, 2024, we had no outstanding borrowings, but the Bank has issued a letter of credit in the total outstanding amount of $9.3 million related to the Kilroot project of APC discussed above.
We have pledged the majority of our assets to secure the financing arrangements. The Bank’s consent is not required for acquisitions, divestitures, cash dividends or significant investments as long as certain conditions are met. The Credit Agreement, as amended, requires that we comply with certain financial covenants at our fiscal year-end and at each fiscal quarter-end, and includes other terms, covenants and events of default that are customary for a credit facility of its size and nature, including a requirement to achieve positive adjusted earnings before interest, taxes, depreciation and amortization, as defined, over each rolling twelve-month measurement period. At January 31, 2024, we were compliant with the covenants of the Credit Agreement, as amended.
In the normal course of business and for certain major projects, we may be required to obtain surety or performance bonding, to provide parent company guarantees, or to cause the issuance of letters of credit (or some combination thereof) in order to provide performance assurances to clients on behalf of one of our subsidiaries.
If our services under a guaranteed project would not be completed or would be determined to have resulted in a material defect or other material deficiency, then we could be responsible for monetary damages or other legal remedies. As is typically required by any surety bond, we would be obligated to reimburse the issuer of any surety bond provided on behalf of a subsidiary for any cash payments made thereunder. The commitments under performance bonds generally end concurrently with the expiration of the related contractual obligation. Not all of our projects require bonding.
As of January 31, 2024 and 2023, the estimated amounts of our unsatisfied bonded performance obligations, covering all of its subsidiaries, were approximately $0.5 billion and $0.6 billion, respectively. In addition, as of January 31, 2024 and 2023, the outstanding amounts of bonds covering other risks, including warranty obligations related to completed activities, were not material.
We have also provided a financial guarantee up to $3.6 million to support certain project developmental efforts. Any estimated loss related to this guarantee was recorded during Fiscal 2022.
When sufficient information about claims related to performance on projects would be available and monetary damages or other costs or losses would be determined to be probable, we would record such losses. As our subsidiaries are wholly-owned, any actual liability related to contract performance is ordinarily reflected in the financial statement account balances determined pursuant to the Company’s accounting for contracts with customers. Any amounts that we may be required to pay in excess of the estimated costs to complete contracts in progress as of January 31, 2024 are not estimable.
In prior years, we made investments in limited liability companies that make equity investments in solar energy projects that are eligible to receive energy tax credits, for which we have received substantially all of the income tax benefits
- 42 -
associated with those investments. In Fiscal 2024, we made an investment of approximately $5.1 million cash in a solar tax credit entity, and as of January 31, 2024, we have $3.3 million remaining of cash investment commitments related to this solar fund, which we expect to make during Fiscal 2025. It is likely that we will evaluate opportunities to make other solar energy investments of this type in the future.
We believe that cash on hand, our cash equivalents, cash that will be provided from the maturities of short-term investments and other debt securities and cash generated from our future operations, with or without funds available under our Credit Agreement, will be adequate to meet our general business needs in the foreseeable future. In general, we maintain significant liquid capital in our consolidated balance sheet to ensure the maintenance of our bonding capacity and to provide parent company performance guarantees for EPC and other construction projects.
However, any significant future acquisition, investment or other unplanned cost or cash requirement, may require us to raise additional funds through the issuance of debt and/or equity securities. There can be no assurance that such financing will be available on terms acceptable to us, or at all.
Contractual Obligations
During Fiscal 2024, there was no significant change in the nature or amounts of our contractual obligations. We estimate that the balance of such contractual obligations as of January 31, 2024 was less than $20.0 million. The two largest items in this estimate, operating leases and deferred compensation, are amounts included as liabilities in our consolidated balance sheet. The remainder of such obligations relate primarily to open service arrangements. Outstanding commitments represented by open purchase orders and subcontracts related to our construction contracts have not been included in the estimated amounts of contractual obligations as such amounts are expected to be funded through contract billings to customers. We do not have any significant obligations for materials or subcontracted services beyond those required to complete construction contracts awarded to us.
Special Purpose Entities
As is common in our industry, EPC contractors and third parties form joint ventures, limited partnerships and limited liability companies for purposes of executing a project or program for a project owner. These teaming arrangements are typically dissolved upon completion of the project or program.
In addition, we may obtain interests in VIEs formed by its owners for a specific purpose. The evaluation of whether such interests represent our financial control of a VIE requires analysis and judgement. In January 2018, we concluded that we were the primary beneficiary of a VIE formed by an independent firm for the purpose of developing a natural gas-fired power plant in Virginia. As a result, the VIE was included in our consolidated financial statements until the fourth quarter of Fiscal 2023, when we determined that we were no longer the primary beneficiary and we deconsolidated the entity. During Fiscal 2022, as described in Note 15 to the accompanying consolidated financial statements, we recorded an impairment loss related to the development costs associated with the project in the amount of $7.9 million, of which $2.5 million was attributed to the non-controlling interest. In Fiscal 2023, prior to deconsolidation, the VIE settled on amounts owed for certain impaired development costs and recognized a gain of $1.6 million, all of which was attributed to the non-controlling interest.
We have entered into similar support arrangements with other independent parties in the past that resulted in the successful development and our construction of three separate gas-fired power plant projects. We were paid project development fees for each project and our loans to the development entities were repaid in full plus interest. In each of these cases, we deconsolidated the corresponding VIE when we were no longer the primary beneficiary.
We may enter into other support arrangements in the future in connection with power plant development opportunities when they arise and when we are confident that providing early financial support for the projects will lead to the award of the corresponding EPC contracts to us.
Earnings before Interest, Taxes, Depreciation and Amortization (“EBITDA”)
We believe that EBITDA is a meaningful presentation that enables us to assess and compare our operating performance on a consistent basis by removing from our operating results the impacts of our capital structure, the effects of the accounting methods used to compute depreciation and amortization and the effects of operating in different income tax jurisdictions. Further, we believe that EBITDA is widely used by investors and analysts as a measure of performance.
- 43 -
However, as EBITDA is not a measure of performance calculated in accordance with U.S. GAAP, we do not believe that this measure should be considered in isolation from, or as a substitute for, the results of our operations presented in accordance with U.S. GAAP that are included in our consolidated financial statements. In addition, our EBITDA does not necessarily represent funds available for discretionary use and is not necessarily a measure of our ability to fund our cash needs.
The following table presents the determinations of EBITDA for Fiscal 2024 and Fiscal 2023, respectively (amounts in thousands).
2024 |
| 2023 | ||||
Net income, as reported | $ | 32,358 | $ | 34,704 | ||
Income tax expense |
| 16,575 |
| 11,296 | ||
Depreciation |
| 2,013 |
| 2,983 | ||
Amortization of intangible assets |
| 392 |
| 732 | ||
EBITDA | 51,338 | 49,715 | ||||
EBITDA of non-controlling interest | — | 1,606 | ||||
EBITDA attributable to the stockholders of Argan, Inc. | $ | 51,338 | $ | 48,109 | ||
Critical Accounting Policies
Critical accounting policies are those related to the areas where we have made what we consider to be particularly subjective or complex judgments in arriving at estimates and where these estimates can significantly impact our financial results under different assumptions and conditions.
These estimates, judgments, and assumptions affect the reported amounts of assets, liabilities and equity, the disclosure of contingent assets and liabilities at the date of financial statements and the reported amounts of revenues and expenses during the reporting periods. We base our estimates on historical experience and various other assumptions that we believe are reasonable under the circumstances, the results of which form the basis for making judgments about the carrying value of assets, liabilities and equity that are not readily apparent from other sources. Actual results and outcomes could differ from these estimates and assumptions. We do periodically review these critical accounting policies and estimates with the audit committee of our board of directors.
We consider the accounting policies related to revenue recognition on long-term construction contracts and income tax reporting to be most critical to the understanding of our financial position and results of operations.
Revenue Recognition
Our revenues are primarily derived from construction contracts that can span several quarters or years. We enter into EPC and other long-term construction contracts principally on the basis of competitive bids or in conjunction with our support of the development of power plant projects. The types of contracts may vary. However, the EPC contracts of our power industry services reporting segment, and most other large contracts awarded to our other companies, are fixed-price contracts. Revenues are recognized primarily over time as performance obligations are satisfied due to the continuous transfer of control to the project owner or other customer. The accuracy of our revenues and profit recognition in a given period depends on the accuracy of our estimates of the forecasted contract value, or transaction price, and the cost to complete the work for each project.
Central to accounting for revenues from contracts with customers is a five-step revenue recognition model that requires reporting entities to:
| 1. | Identify the contract, |
| 2. | Identify the performance obligations of the contract, |
| 3. | Determine the transaction price of the contract, |
| 4. | Allocate the transaction price to the performance obligations, and |
| 5. | Recognize revenue. |
The guidance focuses on the transfer of the control of the goods and/or services to the customer, as opposed to the transfer of risk and rewards. Major provisions cover the determination of which goods and services are distinct and represent
- 44 -
separate performance obligations, the appropriate treatment of variable consideration, and the evaluation of whether revenues should be recognized at a point in time or over time. In general, application of the rules requires us to make important judgements and meaningful estimates that may have significant impact on the amounts of revenues recognized by us for any reporting period.
Revenues from fixed price contracts, including portions of estimated gross profit, are recognized as services are provided, based on costs incurred and estimated total contract costs using the cost-to-cost approach. The cost and profit estimates are re-forecasted monthly for all significant contracts pursuant to a detailed determination and review process. The results of the process are subjected to reviews by senior management with the applicable project management personnel at each subsidiary. The intensity of the reviews may vary between projects depending on the percentage-of-completion for the projects, among other factors. The cost-to-cost method measures the ratio of costs incurred and accrued to date for each contract to the estimated, or forecasted, total cost for each contract at completion. This requires us to prepare on-going estimates of the forecasted cost to complete each contract as the project progresses. In preparing these estimates, we make significant judgments and assumptions about our significant costs, including materials, labor and equipment, and we evaluate contingencies based on possible schedule variances, major equipment delivery delays, construction delays, weather or other productivity factors.
Actual costs may vary from the costs we estimate. Variations from estimated contract costs, along with other risks inherent in fixed-price contracts, may result in actual revenues and gross profits differing from those we estimate and could result in losses on projects or other significant unfavorable impacts on our operating results for any fiscal quarter or year. If a current estimate of total contract cost indicates a loss on a contract, the projected loss is recognized in full when determined, without regard to the percentage of completion. There are a number of factors that can contribute to changes in estimated contract costs, revenues and profitability. The most significant of these are identified in the first item included in the Risks Related to our Operational Execution section of Part I, Item 1A. of this Annual Report entitled Risk Factors.
Crucial to the compliance with the accounting standard covering the recognition of revenues on contracts with customers is the identification of the promises made to the customer by us that are included in the contract. If a promise is distinct, as that concept is defined in the accounting standard, it represents a separate performance obligation. Contracts may have multiple promises. The amounts of revenue associated with each promise are recognized when, or as, the performance obligations are satisfied. However, complex contracts may include only one performance obligation if the multiple promises are not distinct within the context of the contract. For example, if the promises that could be considered distinct are interrelated or require us to perform integration so that the customer receives a complete product, the contract is considered to include only one performance obligation. Most of our long-term contracts have a single performance obligation as the promises to transfer individual goods or services are not separately identifiable from other promises within the context of the contract. Our EPC contracts require us to deliver a complete and functioning power plant, not just functioning components.
The transaction price of a contract represents the value used to determine the amount of revenues recognized as of the balance sheet date. It may reflect amounts of variable consideration, which could be either increases or decreases to the transaction price. These adjustments can be made from time-to-time during the period of contract performance as circumstances evolve related to such items as variations in the scope and price of contracts, claims, incentives and liquidated damages.
We may include an estimated amount of variable consideration in the transaction price to the extent it is probable that a significant reversal of cumulative revenues recognized on the particular contract will not occur when the uncertainty associated with the variable consideration is resolved. The Company’s determination of the amount of variable consideration to be included in the transaction price of a particular contract is based largely on an assessment of the Company’s anticipated performance and all information (historical, current and forecasted) that is reasonably available. The effect of any revisions to the transaction price on the amount of previously recognized revenues that is due to the addition or reduction of variable consideration is recorded currently as an adjustment to revenues on a cumulative catch-up basis. In the event that any amounts of variable consideration that are reflected in the transaction price of a contract are not resolved in the Company’s favor, there could be reductions in, or reversals of, previously recognized revenues. In most significant instances, modifications to our contracts do not represent the addition of new performance obligations.
Contract results may be impacted by estimates of the amounts of contract variations that we expect to receive. The effects of any resulting revisions to revenues and estimated costs can be determined at any time and they could be material. As of
- 45 -
January 31, 2024 and 2023, the aggregate amounts of contract variations reflected in estimated transaction prices that were pending customer approval were $8.4 million and $11.6 million, respectively.
Substantially all of our customer contracts include the right for customers to terminate contracts for convenience as disclosed in Note 2 to the consolidated financial statements. The value of future work that companies are contractually obligated to perform pursuant to active customer contracts should not be included in the disclosure of remaining unsatisfied performance obligations when the corresponding contracts include termination for convenience clauses without substantial penalties accruing to the customers upon such terminations. In the application of this guidance, we assess whether the nature of the work being performed under contract is largely service-based and repetitive and should be considered a succession of one-month contracts for the duration of the identified term of the contract. Predominantly, our customers contract with us to construct assets, to fabricate materials or to perform emergency maintenance or outage services where we believe a substantial penalty or cost would be incurred upon a termination for convenience. We believe that in substantially all cases, there would be substantial costs incurred by a customer if it terminated a contract with us for convenience including the costs of terminating subcontracts, canceling purchase orders and returning or otherwise disposing of delivered materials and equipment. Further, to the best of management’s knowledge, the Company has never had a customer terminate a material contract with us for convenience. Therefore, our disclosure in Note 2 of the value of remaining unsatisfied performance obligations on active customer contracts represents an amount based on contracts or orders received from customers that the Company believes are firm and where the parties are acting in accordance with their respective obligations.
Our long-term contracts typically have schedule dates and other performance obligations that, if not achieved, could subject us to liquidated damages. These contract requirements generally relate to specified activities that must be completed by an established date or by achievement of a specified level of output or efficiency. Each contract defines the conditions under which a project owner may make a claim for liquidated damages. The amounts of liquidated damages owed to a project owner pursuant to the terms of a contract would represent reductions of the transaction price of the corresponding contract.
At the outset of each of the Company’s contracts, the potential amounts of liquidated damages typically are not subtracted, from the transaction price as the Company believes that it has included activities in its contract plan, and has reflected the associated costs in its forecasts of completed contract costs, that will be effective in preventing such damages. Of course, circumstances may change as the Company executes the corresponding contract. The transaction price is reduced by an applicable amount when the Company no longer considers it probable that a future reversal of revenues will not occur when the matter is resolved. In general, we consider potential liquidated damages, the costs of other related items and potential mitigating factors in determining the estimates of forecasted revenues and the adequacy of our estimates of the cost to complete contracts.
Uncertain Income Tax Positions
As we have disclosed in the “Research and Development Tax Credits” section of Note 12 to the accompanying consolidated financial statements, during Fiscal 2019, we completed a detailed review of the activities of our engineering staff on major EPC services projects in order to identify and quantify the amounts of research and development credits available to reduce prior year income taxes. This extensive study focused on the costs incurred on specific projects during the three-year period ended January 31, 2018. Based on the results of the study, we identified and estimated significant amounts of income tax benefits that were not previously recognized in our financial results for any prior year reporting period.
Under current professional accounting guidance, income tax positions must meet a more-likely-than-not recognition threshold to be recognized. Income tax positions that previously failed to meet the more-likely-than-not threshold are recognized in the first subsequent financial reporting period in which that threshold is met. Fiscal 2019 was the initial reporting period in which we had sufficient data on which to make an evaluation and to reach a conclusion on the amount of income tax credit benefits related to prior year project costs that, more likely than not, qualified as research and development costs under the Internal Revenue Code and the rules and regulations of certain states. The net amount of the credits that we recognized in income taxes during Fiscal 2019 was $16.2 million, as subsequently reduced by $0.4 million. Based on our judgement, the amount of income tax benefits related to identified research and development income tax credits that we assessed as not meeting the threshold criteria for recognition was $5.0 million.
- 46 -
The research and development credits were included in amendments to our consolidated federal income tax returns for Fiscal 2016 and Fiscal 2017, that were filed in January 2019, and our consolidated federal income tax return for Fiscal 2018, that was filed in November 2018. In January 2021, the IRS issued its final revenue agents reports that disagreed with our treatment of a substantial amount of the costs that supported our claims. In March 2021, we submitted a formal protest of the findings of the IRS examiner and requested an appeal hearing.
At the conclusion of the hearing that occurred in May 2022, we agreed to accept a settlement offer from the IRS in the amount of approximately $7.9 million, before interest, which was approximately 42% of the total of our claims. As a result, we made an unfavorable adjustment to income tax expense for Fiscal 2023 in the amount of $6.2 million.
In a manner similar to the process described above, we completed a detailed review of the activities of our engineering staff on major EPC services projects in order to identify and quantify the amounts of research and development tax credits that may have been available to reduce federal income taxes for Fiscal 2022 and Fiscal 2021. As a result, we filed amended federal income tax returns for those years, including research and development tax credits in the total amount of $5.8 million. With the application of current accounting guidance, we have recognized approximately 59% of this benefit. In Fiscal 2024, we obtained an insurance policy covering our tax position in the event that we would suffer a loss related to our research and development claims.
Deferred Tax Assets and Liabilities
Our consolidated balance sheet as of January 31, 2024 includes net deferred tax assets in the amount of approximately $2.3 million. The components of our deferred taxes are presented in Note 12 to the accompanying consolidated financial statements. These amounts reflect differences in the periods in which certain transactions are recognized for financial and income tax reporting purposes.
We consider whether it is more likely than not that some portion or all of the deferred tax assets will not be realized on a jurisdiction-by-jurisdiction basis. Our ability to realize our deferred tax assets, including those related to the past NOLs incurred in the U.K. (that applicable income tax rules will allow us to use in order to offset future amounts of applicable taxable income), depends primarily upon the generation of sufficient future taxable income to allow for the realization of our deductible temporary differences. If such estimates and assumptions regarding income amounts change in the future, we may be required to record additional valuation allowances against some or all of the deferred tax assets resulting in additional income tax expense in our consolidated statement of earnings. During Fiscal 2020, a valuation allowance in the amount of $7.1 million was established against the deferred tax asset amount created by the NOL of APC’s subsidiary in the U.K. (“APC UK”). During Fiscal 2023, APC UK continued a turnaround of its operating results such that we believed it had a stable earnings history upon which APC UK could reliably forecast future profitable operations. Based on the forecast, which rested on the belief that meaningful investments would be made in the power infrastructure of the U.K. for the foreseeable future, we believed that it was more likely than not that a certain portion of the deferred tax asset would be realized. Accordingly, we reversed a portion of the corresponding allowance during Fiscal 2023 in the amount of $2.6 million. However, the unexpected difficulties with one construction project and the loss that was recorded by APC UK related to it caused management to reconsider the amount of work expected to be performed in the U.K. in the future. Accordingly, the estimate of the amount of future net earnings of APC UK available to offset its net operating loss carryforwards was reduced causing us to increase the amount of the allowance by $2.1 million in Fiscal 2024.
A deferred tax asset in the amount of $8.3 million was recorded as of January 31, 2020 associated with the income tax benefit of our domestic NOL for Fiscal 2020 without any corresponding valuation allowance. Among other changes, the CARES Act re-established a carryback period for certain losses to five years. The NOLs eligible for carryback under the CARES Act include our domestic loss for Fiscal 2020, which was approximately $39.5 million. The carryback provided a favorable rate benefit for us as the loss, which was incurred in a year where the statutory federal tax rate was 21%, has been carried back to tax years where the tax rate was higher. The net amount of this additional income tax benefit, which we recorded in Fiscal 2021, was $4.4 million. We have made the appropriate filings with the IRS requesting carryback refunds of income taxes paid in prior years. With the enactment of the CARES Act, the asset amount, which totals $12.7 million, was moved to income taxes receivable. The IRS has not completed the examination of our refund request.
At this time, we believe that the historically strong earnings performance of our power industry services segment will provide sufficient income during the years when most of our other deferred tax assets become deductible in the U.S. in order for us to realize the applicable temporary income tax differences. Accordingly, we believe that it is more likely than not that we will realize the benefit of significantly all of our net deferred tax assets.
- 47 -
Recently Issued Accounting Pronouncements
See Note 1 to the accompanying consolidated financial statement for discussion of recently issued accounting pronouncements.
ITEM 7A. QUANTITATIVE AND QUALITATIVE DISCLOSURES ABOUT MARKET RISK.
In the normal course of business, our results of operations may be subject to risks related to fluctuations in interest rates. As of January 31, 2024, we had no outstanding borrowings under our financing arrangements with the Bank (see Note 8 to the accompanying consolidated financial statements), which provide a revolving loan with a maximum borrowing amount of $50.0 million that is available until May 31, 2024 with interest at SOFR plus 1.6%.
During Fiscal 2024, Fiscal 2023 and Fiscal 2022, we did not enter into any material derivative financial instruments for trading, speculation or other purposes that would expose us to market risk.
We maintain a substantial amount of our temporarily investable cash in certificates of deposit, a money market fund, U.S. Treasury notes and a U.S. corporate debt security (see Note 3 of the accompanying consolidated financial statements). As of January 31, 2024, the weighted average number of days remaining until maturity for the certificates of deposit, U.S. Treasury notes and U.S. corporate debt security was 393 days. The weighted average annual interest rate of our certificates of deposit of $105.0 million, the money market fund balance of $126.6 million, the U.S. Treasury notes face value of $95.0 million and the U.S. corporate debt security face value of $9.2 million was 5.1%. To illustrate the potential impact of changes in the overall interest rate associated with our investable cash balance at January 31, 2024 on our annual results of operations, we present the following hypothetical analysis. It assumes that our consolidated balance sheet as of January 31, 2024 remains constant, and no further actions are taken to alter our existing interest rate sensitivity, including reinvestments (dollars in thousands).
Increase (Decrease) in | Increase (Decrease) in | Net Increase (Decrease) in | |||||||
Basis Point Change |
| Interest Income |
| Interest Expense |
| Income (Pre-Tax) | |||
Up 300 basis points | $ | 10,565 | $ | — | $ | 10,565 | |||
Up 200 basis points | 7,043 | — | 7,043 | ||||||
Up 100 basis points |
| 3,522 |
| — |
| 3,522 | |||
Down 100 basis points | (3,522) | — | (3,522) | ||||||
Down 200 basis points | (7,043) | — | (7,043) | ||||||
Down 300 basis points |
| (10,565) |
| — |
| (10,565) | |||
With the consolidation of APC, we are subject to the effects of translating the financial statements of APC from its functional currency (Euros) into our reporting currency (U.S. dollars). The effects of translation are recognized in accumulated other comprehensive loss, which is net of tax when applicable. APC remeasures transactions and subsidiary financial statements denominated in local currencies to Euros. Gains and losses on the remeasurements are recorded in the other income line of our consolidated statement of earnings.
In the “Risk Factors” section of this 2024 Annual Report (see Item 1A), we have included discussion of the risks to our fixed price contracts if actual contract costs rise above the estimated amounts of such costs that support corresponding contract prices. Identified as factors that could cause contract cost overruns, project delays or other unfavorable effects on our contracts, among other circumstances and events, are delays in the scheduled deliveries of machinery and equipment ordered by us or project owners, unforeseen increases in the costs of labor, warranties, raw materials, components or equipment or the failure or inability to obtain resources when needed.
We are subject to fluctuations in prices for commodities including steel products, copper, concrete and fuel. Although we attempt to secure firm quotes from our suppliers, we generally do not hedge against increases in prices for these commodities. Commodity price risks may have an impact on our results of operations due to the fixed-price nature of many of our contracts. We attempt to include the anticipated amounts of price increases or decreases in the costs of our bids. In times of increased supply cost volatility, we may take other steps to reduce our risks. For example, we may hold quotes related to materials in our industrial construction services segment for very short periods. For major fixed price contracts in our power industry services segment, we may mitigate material cost risks by procuring the majority of the equipment and construction supplies during the early phases of a project. The profitability of our active jobs has not suffered meaningfully from the periodic global surges in non-residential construction material costs.
- 48 -
Our operations have been challenged by the well-publicized global supply chain disruptions. While management of the risks associated with the inability to obtain machinery, equipment and other materials when needed continues to require our best efforts, we are concerned that the supply chain uncertainties may impact project owners’ confidence in commencing new work which may adversely affect our expected levels of revenues until the supply chain disruptions substantially dissipate.
ITEM 8. FINANCIAL STATEMENTS AND SUPPLEMENTARY DATA.
See the Index to the Consolidated Financial Statements on page 55 of this 2024 Annual Report.
ITEM 9. CHANGES IN AND DISAGREEMENTS WITH ACCOUNTANTS ON ACCOUNTING AND FINANCIAL DISCLOSURE.
None.
ITEM 9A. CONTROLS AND PROCEDURES.
Attached as exhibits to this 2024 Annual Report are certifications of our Chief Executive Officer (“CEO”) and Chief Financial Officer (“CFO”), which are required in accordance with Rule 13a-14 of the Exchange Act. This “Controls and Procedures” section includes information concerning the controls and controls evaluation referred to in the certifications and a reference to the report of Grant Thornton LLP, our independent registered public accounting firm, regarding its audit of our internal control over financial reporting. This section should be read in conjunction with the certifications and the report of Grant Thornton LLP for a more complete understanding of the topics presented.
Evaluation of Disclosure Controls and Procedures
We conducted an evaluation of the effectiveness of the design and operation of our disclosure controls and procedures (“Disclosure Controls”) as of the end of the year covered by this 2024 Annual Report. The controls evaluation was conducted under the supervision and with the participation of management, including our CEO and CFO. Disclosure Controls are controls and procedures designed to reasonably assure that information required to be disclosed in our reports filed under the Exchange Act, such as this 2024 Annual Report, is recorded, processed, summarized, and reported within the time periods specified in the SEC’s rules and forms. Disclosure Controls are also designed to reasonably assure that such information is accumulated and communicated to our management, including the CEO and CFO, as appropriate to allow timely decisions regarding required disclosure. Our quarterly evaluation of Disclosure Controls includes an evaluation of some components of our internal control over financial reporting, which is separately evaluated on an annual basis for purposes of providing the management report that is set forth below.
Based on the controls evaluation, our CEO and CFO have concluded that, as of the end of the year covered by this 2024 Annual Report, our Disclosure Controls were effective to provide reasonable assurance that information required to be disclosed in our Exchange Act reports is recorded, processed, summarized, and reported within the time periods specified by the SEC, and the material information related to Argan and its consolidated subsidiaries is made known to management, including the CEO and CFO, particularly during the period when our periodic reports are being prepared.
Management’s Report on Internal Control over Financial Reporting
Our management is responsible for establishing and maintaining adequate internal control over financial reporting to provide reasonable assurance regarding the reliability of our financial reporting and the preparation of financial statements for external purposes in accordance with U.S. GAAP. Internal control over financial reporting includes those policies and procedures that (i) pertain to the maintenance of records that in reasonable detail accurately and fairly reflect the transactions and dispositions of the assets of the Company; (ii) provide reasonable assurance that transactions are recorded as necessary to permit preparation of financial statements in accordance with authorizations of management and directors of the Company; and (iii) provide reasonable assurance regarding prevention or timely detection of unauthorized acquisition, use, or disposition of the Company’s assets that could have a material effect on the consolidated financial statements.
- 49 -
Management assessed our internal control over financial reporting as of January 31, 2024, the end of the fiscal year, based on assessment criteria established in the 2013 Internal Control—Integrated Framework issued by the Committee of Sponsoring Organizations of the Treadway Commission. Management’s assessment included evaluation of elements such as the design and operating effectiveness of key financial reporting controls, process documentation, accounting policies, and our overall control environment.
Based on its assessment, management has concluded that our internal control over financial reporting was effective as of the end of the fiscal year to provide reasonable assurance regarding the reliability of financial reporting and the preparation of financial statements for external reporting purposes in accordance with U.S. GAAP. We reviewed the results of management’s assessment with the audit committee of our board of directors. In addition, on a quarterly basis, we will evaluate any changes to our internal control over financial reporting to determine if material change occurred.
Attestation Report of the Independent Registered Public Accounting Firm
The effectiveness of our internal control over financial reporting as of January 31, 2024 has been audited by Grant Thornton LLP, our independent registered public accounting firm, who also audited our consolidated financial statements included in this 2024 Annual Report, as stated in their reports which appear with our accompanying consolidated financial statements.
Changes in Internal Controls
No change in our internal control over financial reporting (as defined in Rules 13a-15(f) and 15d-15(f) under the Exchange Act) occurred during the fiscal quarter ended January 31, 2024 that has materially affected, or is reasonably likely to materially affect, our internal control over financial reporting.
Inherent Limitations on Effectiveness of Controls
The Company’s management, including the CEO and CFO, does not expect that our Disclosure Controls or our internal control over financial reporting will prevent or detect all errors and all fraud. A control system, no matter how well designed and operated, can provide only reasonable, not absolute, assurance that the control system’s objectives will be met. The design of a control system must reflect the fact that there are resource constraints, and the benefits of controls must be considered relative to their costs. Further, because of the inherent limitations in all control systems, no evaluation of controls can provide absolute assurance that misstatements due to error or fraud will not occur or that all control issues and instances of fraud, if any, within the Company have been detected. These inherent limitations include the realities that judgments in decision-making can be faulty and that breakdowns can occur because of simple error or mistake. Controls can also be circumvented by the individual acts of some persons, by collusion of two or more people, or by management override of the controls.
The design of any system of controls is based in part on certain assumptions about the likelihood of future events, and there can be no assurance that any design will succeed in achieving its stated goals under all potential future conditions. Projections of any evaluation of controls effectiveness to future periods are subject to risks. Over time, controls may become inadequate because of changes in conditions or deterioration in the degree of compliance with policies or procedures.
ITEM 9B. OTHER INFORMATION.
During the quarter ended January 31, 2024, no director or officer of the Company (as defined in Rule 16a-1(f) under the Exchange Act)
ITEM 9C. DISCLOSURE REGARDING FOREIGN JURISDICTIONS THAT PREVENT INSPECTIONS.
Not applicable.
- 50 -
PART III
ITEM 10. DIRECTORS, EXECUTIVE OFFICERS AND CORPORATE GOVERNANCE.
Information required by this item will be incorporated by reference to our 2024 Proxy Statement, which is expected to be filed by us pursuant to Regulation 14A, within 120 days after the close of our fiscal year.
ITEM 11. EXECUTIVE COMPENSATION.
Information required by this item will be included in our 2024 Proxy Statement and is incorporated herein by reference.
ITEM 12. SECURITY OWNERSHIP OF CERTAIN BENEFICIAL OWNERS AND MANAGEMENT, AND RELATED STOCKHOLDER MATTERS.
Equity Compensation Plan Information
The following table sets forth certain information, as of January 31, 2024, concerning securities authorized for issuance under options to purchase our common stock.
Number of Securities | Weighted Average Exercise | Number of Securities | |||||
Issuable under Outstanding | Price of Outstanding | Remaining Available for | |||||
| Options |
| Options |
| Future Awards (1) | ||
Equity Compensation Plans Approved by the Stockholders (2) |
| 1,364,668 | $ | 44.95 |
| 543,087 | |
Equity Compensation Plans Not Approved by the Stockholders |
| — |
| — |
| — | |
Totals |
| 1,364,668 | $ | 44.95 |
| 543,087 | |
| (1) | Represents the number of shares of common stock reserved for future stock awards, including restricted stock unit awards. |
| (2) | Approved plans include the Company’s Stock Plans. |
The number of issuable shares of our common stock under outstanding stock options presented in the chart above does not include an estimated 348,307 shares of our common stock covered by outstanding restricted stock units awarded pursuant to the terms of the Stock Plans. See Note 11 to the accompanying consolidated financial statements included in Item 8 of Part II of this 2023 Annual Report for a description of the restricted stock units including the various vesting terms related to the awards.
ITEM 13. CERTAIN RELATIONSHIPS AND RELATED TRANSACTIONS, AND DIRECTOR INDEPENDENCE.
Information required by this item will be included in our 2024 Proxy Statement and is incorporated herein by reference.
ITEM 14. PRINCIPAL ACCOUNTANT FEES AND SERVICES.
Information required by this item will be included in our 2024 Proxy Statement and is incorporated herein by reference.
- 51 -
PART IV
ITEM 15. EXHIBITS AND FINANCIAL STATEMENTS.
| (a) | Financial Statements: Our consolidated financial statements together with the reports of our independent registered public accounting firm on those consolidated financial statements and our system of internal control over financial reporting are filed as part of this 2024 Annual Report. |
| (b) | Financial Statement Schedules: We have omitted all financial statement schedules because they are not applicable or not in amounts sufficient to require submission or because we have included the necessary information in our consolidated financial statements or related notes. |
| (c) | Exhibits: The following exhibits are filed as part of this 2024 Annual Report: |
|
| Description |
|---|---|---|
3.1 | ||
3.2 | ||
4 | ||
10.1 | ||
10.2 | ||
10.3 | ||
10.4 | ||
10.5 | ||
10.6 | ||
10.7 | ||
10.8 | ||
- 52 -
|
| Description |
|---|---|---|
10.9 | ||
10.10 | ||
10.11 | ||
10.12 | ||
14.1 | ||
14.2 | ||
21 | ||
23.1 | Consent of Grant Thornton LLP, Independent Registered Public Accounting Firm. (a) | |
31.1 | Certification of CEO required by Section 302 of the Sarbanes-Oxley Act of 2002. (a) | |
31.2 | Certification of CFO required by Section 302 of the Sarbanes-Oxley Act of 2002. (a) | |
32.1 | Certification of CEO required by Section 906 of the Sarbanes-Oxley Act of 2002. (a) | |
32.2 | Certification of CFO required by Section 906 of the Sarbanes-Oxley Act of 2002. (a) | |
97.1 | Policy Regarding Repayment or Forfeiture of Certain Compensation (“Clawback Policy”) (a) (b) | |
101.INS | XBRL Instance Document – the instance document does not appear in the Interactive Data File because its XBRL tags are embedded within the Inline XBRL document. | |
101.SCH | Inline XBRL Taxonomy Extension Schema. | |
101.CAL | Inline XBRL Taxonomy Extension Calculation Linkbase. | |
101.LAB | Inline XBRL Taxonomy Label Linkbase. | |
101.PRE | Inline XBRL Taxonomy Presentation Linkbase. | |
101.DEF | Inline XBRLTaxonomy Extension Definition Document. | |
104 | Cover Page Interactive Data File (formatted as Inline XBRL with applicable taxonomy extension information contained in Exhibits 101). |
(a) Filed herewith.
(b) Management contract or compensatory plan, contract or arrangement.
ITEM 16. FORM 10-K SUMMARY.
None.
- 53 -
SIGNATURES
In accordance with Section 13 or 15(d) of the Securities Exchange Act of 1934, the Registrant has duly caused this report to be signed on its behalf by the undersigned, thereunto duly authorized.
ARGAN, INC. | |||
April 11, 2024 | By: | /s/ Richard H. Deily | |
Richard H. Deily | |||
Senior Vice President, Chief Financial Officer, Treasurer and Corporate Secretary | |||
(Principal Accounting and Financial Officer) | |||
Pursuant to the requirements of the Securities Exchange Act of 1934, this report has been signed below by the following persons on behalf of the Registrant and in the capacities and on the dates indicated.
Name |
| Title |
| Date |
/s/ David H. Watson | President and Chief Executive Officer, Director | April 11, 2024 | ||
David H. Watson | (Principal Executive Officer) | |||
/s/ William F. Leimkuhler | Chairman of the Board of Directors | April 11, 2024 | ||
William F. Leimkuhler | ||||
/s/ Rainer H. Bosselmann | Director | April 11, 2024 | ||
Rainer H. Bosselmann | ||||
/s/ Cynthia A. Flanders | Director | April 11, 2024 | ||
Cynthia A. Flanders | ||||
/s/ Peter W. Getsinger | Director | April 11, 2024 | ||
Peter W. Getsinger | ||||
/s/ William F. Griffin | Director | April 11, 2024 | ||
William F. Griffin | ||||
/s/ John R. Jeffrey | Director | April 11, 2024 | ||
John R. Jeffrey | ||||
/s/ Mano Koilpillai | Director | April 11, 2024 | ||
Mano Koilpillai | ||||
/s/ W. G. Champion Mitchell | Director | April 11, 2024 | ||
W. G. Champion Mitchell | ||||
/s/ James W. Quinn | Director | April 11, 2024 | ||
James W. Quinn |
- 54 -
ARGAN, INC. AND SUBSIDIARIES
INDEX TO CONSOLIDATED FINANCIAL STATEMENTS
JANUARY 31, 2024
The following financial statements (including the notes thereto and the Reports of Independent Registered Public Accounting Firm with respect thereto), are filed as part of this 2024 Annual Report.
- 55 -
REPORT OF INDEPENDENT REGISTERED PUBLIC ACCOUNTING FIRM
Board of Directors and Stockholders
Argan, Inc.
Opinion on the financial statements
We have audited the accompanying consolidated balance sheets of Argan, Inc. (a Delaware corporation) and subsidiaries (the “Company”) as of January 31, 2024 and 2023, the related consolidated statements of earnings, stockholders’ equity, and cash flows for each of the three years in the period ended January 31, 2024, and the related notes (collectively referred to as the “financial statements”). In our opinion, the financial statements present fairly, in all material respects, the financial position of the Company as of January 31, 2024 and 2023, and the results of its operations and its cash flows for each of the three years in the period ended January 31, 2024, in conformity with accounting principles generally accepted in the United States of America.
We also have audited, in accordance with the standards of the Public Company Accounting Oversight Board (United States) (“PCAOB”), the Company’s internal control over financial reporting as of January 31, 2024, based on criteria established in the 2013 Internal Control—Integrated Framework issued by the Committee of Sponsoring Organizations of the Treadway Commission (“COSO”), and our report dated April 11, 2024 expressed an unqualified opinion.
Basis for opinion
These financial statements are the responsibility of the Company’s management. Our responsibility is to express an opinion on the Company’s financial statements based on our audits. We are a public accounting firm registered with the PCAOB and are required to be independent with respect to the Company in accordance with the U.S. federal securities laws and the applicable rules and regulations of the Securities and Exchange Commission and the PCAOB.
We conducted our audits in accordance with the standards of the PCAOB. Those standards require that we plan and perform the audit to obtain reasonable assurance about whether the financial statements are free of material misstatement, whether due to error or fraud. Our audits included performing procedures to assess the risks of material misstatement of the financial statements, whether due to error or fraud, and performing procedures that respond to those risks. Such procedures included examining, on a test basis, evidence regarding the amounts and disclosures in the financial statements. Our audits also included evaluating the accounting principles used and significant estimates made by management, as well as evaluating the overall presentation of the financial statements. We believe that our audits provide a reasonable basis for our opinion.
Critical audit matter
The critical audit matter communicated below is a matter arising from the current period audit of the financial statements that was communicated or required to be communicated to the audit committee and that: (1) relates to accounts or disclosures that are material to the financial statements and (2) involved our especially challenging, subjective, or complex judgments. The communication of critical audit matters does not alter in any way our opinion on the financial statements, taken as a whole, and we are not, by communicating the critical audit matter below, providing a separate opinion on the critical audit matter or on the accounts or disclosures to which it relates.
Revenue recognition for certain fixed-price contracts
As described in Notes 1 and 2 to the consolidated financial statements, the Company recognizes revenues for fixed-price contracts over time using a cost-to-cost input method in which the extent of progress is measured based on the ratio of costs incurred to date to the total estimated costs at completion. In addition, the revenue recognition process requires the Company to determine the transaction price representing the amount of consideration to which the Company expects to be entitled, which can require estimation of variable consideration related to matters surrounding change orders, claims, bonuses and penalties.
The principal consideration for our determination that revenue recognition for certain fixed-price contracts is a critical audit matter is that the estimation of total costs at completion and/or of the total transaction price is subject to considerable management judgment which can be challenging, subjective and complex to audit. In addition, future results related to such estimates may vary significantly from past estimates due to changes in facts and circumstances.
- 56 -
Our audit procedures related to the auditing of certain fixed-price contract revenues included, among others:
| ● | We evaluated the design and tested the operating effectiveness of internal controls over the estimation process that affects estimates of variable consideration and costs to complete utilized in the estimation process in determining revenue on certain fixed-price contracts. |
| ● | We tested a sample of revenue recognized on certain fixed-price contracts and inspected contract agreements, related amendments, and change orders. We also tested underlying contractual and financial data for completeness and accuracy. In addition, we tested estimates to complete by evaluating significant assumptions, taking into account the stage of the Company’s progress towards completion of the subject project. |
| ● | We agreed a sample of costs allocated to contracts to supporting documentation and recalculated revenues recognized based on the percentage of completion. We also attended a sample of monthly project review meetings and, where applicable, obtained relevant supporting documentation for significant assumptions impacting the estimate to complete and/or the transaction price for fixed-price contracts. |
| ● | We performed retrospective audit procedures for a sample of revenue contracts to compare management’s estimated margins in prior year to the current year margins in order to assess management’s ability to estimate the transaction price and costs to complete. |
/s/ GRANT THORNTON LLP | |
We have served as the Company’s auditor since 2006. | |
April 11, 2024 |
- 57 -
REPORT OF INDEPENDENT REGISTERED PUBLIC ACCOUNTING FIRM
Board of Directors and Stockholders
Argan, Inc.
Opinion on internal control over financial reporting
We have audited the internal control over financial reporting of Argan, Inc. (a Delaware corporation) and subsidiaries (the “Company”) as of January 31, 2024, based on criteria established in the 2013 Internal Control—Integrated Framework issued by the Committee of Sponsoring Organizations of the Treadway Commission (“COSO”). In our opinion, the Company maintained, in all material respects, effective internal control over financial reporting as of January 31, 2024, based on criteria established in the 2013 Internal Control—Integrated Framework issued by COSO.
We also have audited, in accordance with the standards of the Public Company Accounting Oversight Board (United States) (“PCAOB”), the consolidated financial statements of the Company as of and for the year ended January 31, 2024, and our report dated April 11, 2024 expressed an unqualified opinion on those financial statements.
Basis for opinion
The Company’s management is responsible for maintaining effective internal control over financial reporting and for its assessment of the effectiveness of internal control over financial reporting, included in the accompanying Management’s Report on Internal Control over Financial Reporting. Our responsibility is to express an opinion on the Company’s internal control over financial reporting based on our audit. We are a public accounting firm registered with the PCAOB and are required to be independent with respect to the Company in accordance with the U.S. federal securities laws and the applicable rules and regulations of the Securities and Exchange Commission and the PCAOB.
We conducted our audit in accordance with the standards of the PCAOB. Those standards require that we plan and perform the audit to obtain reasonable assurance about whether effective internal control over financial reporting was maintained in all material respects. Our audit included obtaining an understanding of internal control over financial reporting, assessing the risk that a material weakness exists, testing and evaluating the design and operating effectiveness of internal control based on the assessed risk, and performing such other procedures as we considered necessary in the circumstances. We believe that our audit provides a reasonable basis for our opinion.
Definition and limitations of internal control over financial reporting
A company’s internal control over financial reporting is a process designed to provide reasonable assurance regarding the reliability of financial reporting and the preparation of financial statements for external purposes in accordance with generally accepted accounting principles. A company’s internal control over financial reporting includes those policies and procedures that (1) pertain to the maintenance of records that, in reasonable detail, accurately and fairly reflect the transactions and dispositions of the assets of the company; (2) provide reasonable assurance that transactions are recorded as necessary to permit preparation of financial statements in accordance with generally accepted accounting principles, and that receipts and expenditures of the company are being made only in accordance with authorizations of management and directors of the company; and (3) provide reasonable assurance regarding prevention or timely detection of unauthorized acquisition, use, or disposition of the company’s assets that could have a material effect on the financial statements.
Because of its inherent limitations, internal control over financial reporting may not prevent or detect misstatements. Also, projections of any evaluation of effectiveness to future periods are subject to the risk that controls may become inadequate because of changes in conditions, or that the degree of compliance with the policies or procedures may deteriorate.
/s/ | |
Arlington, Virginia | |
April 11, 2024 |
- 58 -
ARGAN, INC. AND SUBSIDIARIES
CONSOLIDATED STATEMENTS OF EARNINGS
FOR THE YEARS ENDED JANUARY 31,
(In thousands, except per share data)
2024 |
| 2023 |
| 2022 | |||||
REVENUES | $ | | $ | | $ | | |||
Cost of revenues |
| |
| |
| | |||
GROSS PROFIT |
| |
| |
| | |||
Selling, general and administrative expenses |
| |
| |
| | |||
Impairment loss | — | — | | ||||||
INCOME FROM OPERATIONS |
| |
| |
| | |||
Other income, net |
| |
| |
| | |||
INCOME BEFORE INCOME TAXES |
| |
| |
| | |||
Income tax expense |
| |
| |
| | |||
NET INCOME |
| |
| |
| | |||
Net income (loss) attributable to non-controlling interest | — | | ( | ||||||
NET INCOME ATTRIBUTABLE TO THE STOCKHOLDERS OF ARGAN, INC. | | | | ||||||
Foreign currency translation adjustments | ( | ( | ( | ||||||
Net unrealized gains on available-for-sale securities | | — | — | ||||||
COMPREHENSIVE INCOME ATTRIBUTABLE TO THE STOCKHOLDERS OF ARGAN, INC. | $ | | $ | | $ | | |||
NET INCOME PER SHARE ATTRIBUTABLE TO THE STOCKHOLDERS OF ARGAN, INC. | |||||||||
Basic | $ | | $ | | $ | | |||
Diluted | $ | | $ | | $ | | |||
WEIGHTED AVERAGE NUMBER OF SHARES OUTSTANDING | |||||||||
Basic |
| |
| |
| | |||
Diluted |
| |
| |
| | |||
CASH DIVIDENDS PER SHARE | $ | | $ | | $ | | |||
The accompanying notes are an integral part of these consolidated financial statements.
- 59 -
ARGAN, INC. AND SUBSIDIARIES
CONSOLIDATED BALANCE SHEETS
JANUARY 31,
(Dollars in thousands, except per share data)
| 2024 |
| 2023 | |||
ASSETS | ||||||
CURRENT ASSETS | ||||||
Cash and cash equivalents | $ | | $ | | ||
Investments | | | ||||
Accounts receivable, net |
| |
| | ||
Contract assets |
| |
| | ||
Other current assets |
| |
| | ||
TOTAL CURRENT ASSETS |
| |
| | ||
Property, plant and equipment, net |
| |
| | ||
Goodwill |
| |
| | ||
Intangible assets, net | | | ||||
Deferred taxes, net | | | ||||
Right-of-use and other assets | | | ||||
TOTAL ASSETS | $ | | $ | | ||
LIABILITIES AND STOCKHOLDERS' EQUITY | ||||||
CURRENT LIABILITIES | ||||||
Accounts payable | $ | | $ | | ||
Accrued expenses |
| |
| | ||
Contract liabilities |
| |
| | ||
TOTAL CURRENT LIABILITIES |
| |
| | ||
Noncurrent liabilities | | | ||||
TOTAL LIABILITIES |
| |
| | ||
COMMITMENTS AND CONTINGENCIES (see Notes 9 and 10) | ||||||
STOCKHOLDERS’ EQUITY | ||||||
Preferred stock, par value $ |
|
| ||||
Common stock, par value $ |
| |
| | ||
Additional paid-in capital |
| |
| | ||
Retained earnings |
| |
| | ||
Less treasury stock, at cost – | ( | ( | ||||
Accumulated other comprehensive loss | ( | ( | ||||
TOTAL STOCKHOLDERS’ EQUITY |
| |
| | ||
TOTAL LIABILITIES AND STOCKHOLDERS’ EQUITY | $ | | $ | | ||
The accompanying notes are an integral part of these consolidated financial statements.
- 60 -
ARGAN, INC. AND SUBSIDIARIES
CONSOLIDATED STATEMENTS OF STOCKHOLDERS’ EQUITY
FOR THE YEARS ENDED JANUARY 31, 2024, 2023 AND 2022
(Dollars in thousands)
Common Stock | Additional | Accumulated | |||||||||||||||||||||
| Outstanding |
| Par |
| Paid-in |
| Retained |
| Treasury |
| Other Comprehensive |
| Non-controlling |
| Total | ||||||||
Shares | Value | Capital | Earnings | Stock | Loss | Interest | Equity | ||||||||||||||||
Balances, February 1, 2021 |
| | $ | | $ | | $ | | $ | ( | $ | ( | $ | | $ | | |||||||
Net income (loss) | — | — | — | | — | — | ( | | |||||||||||||||
Foreign currency translation loss | — | — | — | — | — | ( | — | ( | |||||||||||||||
Stock compensation expense | — | — | | — | — | — | — | | |||||||||||||||
Stock option exercises | | | | — | — | — | — | | |||||||||||||||
Common stock repurchases | ( | — | — | — | ( | — | ( | ||||||||||||||||
Cash dividends | — | — | — | ( | — | — | — | ( | |||||||||||||||
Balances, January 31, 2022 |
| | | | | ( | ( | ( | | ||||||||||||||
Net income | — | — | — | | — | — | | | |||||||||||||||
Foreign currency translation loss | — | — | — | — | — | ( | — | ( | |||||||||||||||
Stock compensation expense | — | — | | — | — | — | — | | |||||||||||||||
Stock option exercises and other share-based award settlements | | | | — | — | — | — | | |||||||||||||||
Common stock repurchases | ( | — | — | — | ( | — | — | ( | |||||||||||||||
Cash dividends | — | — | — | ( | — | — | — | ( | |||||||||||||||
Distribution to non-controlling interest | — | — | — | — | — | — | ( | ( | |||||||||||||||
Deconsolidation of VIE | — | — | — | — | — | — | ( | ( | |||||||||||||||
Balances, January 31, 2023 | | | | | ( | ( | — | | |||||||||||||||
Net income | — | — | — | | — | — | — | | |||||||||||||||
Foreign currency translation loss | — | — | — | — | — | ( | — | ( | |||||||||||||||
Net unrealized gains on available-for-sale securities | — | — | — | — | — | | — | | |||||||||||||||
Stock compensation expense | — | — | | — | — | — | — | | |||||||||||||||
Stock option exercises and restricted stock unit settlements, net of shares withheld for exercise price and withholding taxes | | — | ( | — | | — | — | | |||||||||||||||
Common stock repurchases | ( | — | — | — | ( | — | — | ( | |||||||||||||||
Cash dividends | — | — | — | ( | — | — | — | ( | |||||||||||||||
Balances, January 31, 2024 | | $ | | $ | | $ | | $ | ( | $ | ( | $ | — | $ | | ||||||||
The accompanying notes are an integral part of these consolidated financial statements.
- 61 -
ARGAN, INC. AND SUBSIDIARIES
CONSOLIDATED STATEMENTS OF CASH FLOWS
FOR THE YEARS ENDED JANUARY 31,
(Dollars in thousands)
2024 |
| 2023 |
| 2022 | |||||
CASH FLOWS FROM OPERATING ACTIVITIES | |||||||||
Net income | $ | | $ | | $ | | |||
Adjustments to reconcile net income to net cash provided by (used in) operating activities | |||||||||
Stock compensation expense | | | | ||||||
Changes in accrued interest on investments | ( | ( | | ||||||
Depreciation | | | | ||||||
Lease expense |
| |
| |
| | |||
Deferred income tax expense (benefit) | | ( | ( | ||||||
Amortization of intangible assets |
| |
| |
| | |||
Equity in loss (income) of solar energy investments | | ( | | ||||||
Provisions for credit losses | — | | | ||||||
Impairment loss |
| — |
| — |
| | |||
Other |
| |
| |
| ( | |||
Changes in operating assets and liabilities | |||||||||
Accounts receivable |
| |
| ( |
| ( | |||
Contract assets | ( | ( | | ||||||
Other assets |
| ( |
| ( |
| ( | |||
Accounts payable and accrued expenses |
| |
| |
| ( | |||
Contract liabilities | | ( | ( | ||||||
Net cash provided by (used in) operating activities |
| |
| ( |
| | |||
CASH FLOWS FROM INVESTING ACTIVITIES | |||||||||
Purchases of short-term investments | ( | ( | ( | ||||||
Maturities of short-term investments | | | | ||||||
Purchases of available-for-sale securities | ( | — | — | ||||||
Purchases of property, plant and equipment |
| ( |
| ( |
| ( | |||
Investments in solar energy projects |
| ( |
| — |
| ( | |||
Acquisition of Lee Telecom, Inc. | — | — | ( | ||||||
Net cash used in investing activities |
| ( |
| ( |
| ( | |||
CASH FLOWS FROM FINANCING ACTIVITIES | |||||||||
Common stock repurchases | ( | ( | ( | ||||||
Payments of cash dividends |
| ( |
| ( |
| ( | |||
Distribution to non-controlling interest |
| — |
| ( |
| — | |||
Proceeds from share-based award settlements |
| |
| |
| | |||
Net cash used in financing activities |
| ( |
| ( |
| ( | |||
EFFECTS OF EXCHANGE RATE CHANGES ON CASH | ( | ( | ( | ||||||
NET INCREASE (DECREASE) IN CASH AND CASH EQUIVALENTS |
| |
| ( |
| ( | |||
CASH AND CASH EQUIVALENTS, BEGINNING OF PERIOD | | | | ||||||
CASH AND CASH EQUIVALENTS, END OF PERIOD | $ | | $ | | $ | | |||
NON-CASH INVESTING AND FINANCING ACTIVITIES | |||||||||
Investments in solar energy projects not yet paid | $ | | $ | — | $ | — | |||
Right-of-use assets obtained in exchange for lease obligations | $ | | $ | | $ | | |||
SUPPLEMENTAL CASH FLOW INFORMATION | |||||||||
Cash paid for income taxes, net of refunds | $ | | $ | | $ | | |||
Cash paid for operating leases | $ | | $ | | $ | | |||
The accompanying notes are an integral part of these consolidated financial statements.
- 62 -
ARGAN, INC. AND SUBSIDIARIES
NOTES TO CONSOLIDATED FINANCIAL STATEMENTS
JANUARY 31, 2024, 2023 AND 2022
(Tabular amounts in thousands, except per share data)
NOTE 1 – DESCRIPTION OF THE BUSINESS AND BASIS OF PRESENTATION
Description of the Business
Argan, Inc. (“Argan”) conducts operations through its wholly owned subsidiaries, Gemma Power Systems, LLC and affiliates (“GPS”); The Roberts Company, Inc. (“TRC”); Atlantic Projects Company Limited and affiliates (“APC”) and Southern Maryland Cable, Inc. (“SMC”). Argan and these consolidated subsidiaries are hereinafter collectively referred to as the “Company.”
Through GPS and APC, the Company provides a full range of engineering, procurement, construction, commissioning, maintenance, project development and technical consulting services to the power generation market. The customers include primarily independent power producers, public utilities, power plant equipment suppliers and other commercial firms with significant power requirements with customer projects located in the United States (the “U.S.”), the Republic of Ireland (“Ireland”) and the United Kingdom (the “U.K.”). GPS and APC represent the Company’s power industry services reportable segment. Through TRC, the industrial construction services reportable segment provides field services that support new plant construction and additions, maintenance turnarounds, shutdowns and emergency mobilizations for industrial operations primarily located in the Southeast region of the U.S. and that may include the fabrication, delivery and installation of steel components such as piping systems and pressure vessels. Through SMC, which conducts business as SMC Infrastructure Solutions, the telecommunications infrastructure services segment provides project management, construction, installation and maintenance services to commercial, local government and federal government customers primarily in the Mid-Atlantic region of the U.S.
Basis of Presentation and Significant Accounting Policies
The Company’s fiscal year ends on January 31 of each year. The consolidated financial statements include the accounts of Argan, its wholly owned subsidiaries, a variable interest entity (“VIE”) prior to its deconsolidation in the fourth quarter of the year ended January 31, 2023 (see Note 15). All significant intercompany balances and transactions have been eliminated in consolidation. In Note 17, the Company has provided certain financial information relating to the operating results and assets of its reportable segments based on the manner in which management disaggregates the Company’s financial reporting for purposes of making internal operating decisions.
Use of Estimates – The preparation of consolidated financial statements in conformity with accounting principles generally accepted in the United States of America (“U.S. GAAP”) requires management to make estimates and assumptions that affect the reported amounts of assets and liabilities, revenues, expenses, and certain financial statement disclosures. Management believes that the estimates, judgments and assumptions upon which it relies are reasonable based upon information available to it at the time that these estimates, judgments and assumptions are made. Estimates are used for, but are not limited to, the Company’s accounting for revenues, the valuation of assets with long and indefinite lives including goodwill, the valuation of restricted stock units and options to purchase shares of the Company’s common stock, the evaluation of uncertain income tax return positions, the valuation of deferred taxes, and the determination of the allowance for doubtful accounts. Actual results could differ from these estimates.
Revenue Recognition – The Company’s accounting for revenues on contracts with customers is based on a single comprehensive five-step model that requires reporting entities to:
| 1. | Identify the contract, |
| 2. | Identify the performance obligations of the contract, |
| 3. | Determine the transaction price of the contract, |
| 4. | Allocate the transaction price to the performance obligations, and |
| 5. | Recognize revenue. |
The Company focuses on the transfer of the contractor’s control of the goods and/or services to the customer. When a performance obligation is satisfied over time, the related revenues are recognized over time. The Company’s revenues are
- 63 -
recognized primarily under various types of long-term construction contracts, including those for which revenues are based on either a fixed-price or a time-and-materials basis, and primarily over time as performance obligations are satisfied due to the continuous transfer of control to the project owner or other customer.
Revenues from fixed-price contracts, including portions of estimated gross profit, are recognized as services are provided, based on costs incurred and estimated total contract costs using the cost-to-cost approach. If, at any time, the estimate of contract profitability indicates an anticipated loss on a contract, the Company will recognize the total loss in the reporting period in which it is identified and the loss amount becomes estimable. Revenues from time-and-materials contracts are recognized when the related services are provided to the customer. For its time-and-materials contracts, the Company is generally able to elect the right-to-invoice practical expedient. This practical expedient permits the Company to recognize revenue equal to the value of the performance completed to date, provided that the Company has a right to invoice the customer.
Predominantly all of the Company’s fixed-price contracts are considered to have a single performance obligation. Although multiple promises to transfer individual goods or services may exist, they are not typically distinct within the context of such contracts because contract promises included therein are interrelated or the contracts require the Company to perform critical integration so that the customer receives a completed project. Warranties provided under the Company’s contracts with customers are assurance-type primarily and are recorded as the corresponding contract work is performed.
The transaction price for a customer contract represents the value of the contract awarded to the Company that is used to determine the amount of revenues recognized as of the balance sheet date. It may reflect amounts of variable consideration which could be either increases or decreases to the transaction price. These adjustments can be made from time-to-time during the period of contract performance as circumstances evolve related to such items as changes in the scope and price of contracts, claims, incentives and liquidated damages.
Variable Consideration
Amounts for unapproved change orders for which the Company has project-owner directive for additional work or other scope change, but not for the price associated with the corresponding additional effort, are included in the transaction price when it is considered probable that the applicable costs will be recovered through a modification to the contract price. The effects of any revision to a transaction price can be determined at any time and they could be material. The Company also includes in the corresponding transaction price an estimate of the amount that it expects to receive from a claim based on management’s judgment regarding all reasonably available information. Once a final amount has been determined, the transaction price may be revised again to reflect the final resolution.
Variations related to the Company’s contracts typically represent modifications to the existing contracts and performance obligations and do not represent new performance obligations. Actual costs related to any changes in the scope of the corresponding contract are expensed as they are incurred. Changes to total estimated contract costs and losses, if any, are reflected in operating results for the period in which they are determined.
The Company’s long-term contracts typically have schedule dates and other performance objectives that if not achieved could subject the Company to liquidated damages. These contract requirements generally relate to specified activities that must be completed by an established date or by the achievement of a specified level of output or efficiency. Each applicable contract defines the conditions under which a project owner may be entitled to any liquidated damages. At the outset of each of the Company’s contracts, the potential amounts of liquidated damages typically are not subtracted from the transaction price as the Company believes that it has included activities in its contract plan, and the associated forecasted contract costs, that will be effective in preventing such damages. Of course, circumstances may change as the Company executes the corresponding contract. The transaction price is reduced by an applicable amount when the Company no longer considers it probable that a future reversal of revenues will not occur when the matter is resolved. The Company considers potential liquidated damages, the costs of other related items and potential mitigating factors in determining the adequacy of its regularly updated estimates of the amounts of gross profit expected to be earned on active projects.
In other cases, the Company may have the grounds to assert liquidated damages against subcontractors, suppliers, project owners or other parties related to a project. Such circumstances may arise when the Company’s activities and progress are adversely affected by delayed or damaged materials, challenges with equipment performance or other events out of the Company’s control where the Company has rights to recourse, typically in the form of liquidated damages. In general, the
- 64 -
Company does not adjust the corresponding contract accounting until it is probable that the favorable cost relief will be realized. Such adjustments have been and could be material.
The Company records adjustments to revenues and profits on contracts, including those associated with contract variations and estimated cost changes, using a cumulative catch-up method. Under this method, the impact of an adjustment to the amount of revenues recognized to date is recorded in the period that the adjustment is identified. Estimated variable consideration amounts are determined by the Company based primarily on the single most likely amount in the range of possible consideration amounts. Revenues and profits in future periods of contract performance are recognized using the adjusted amounts of transaction price and estimated contract costs.
Contract Assets and Liabilities
The Company’s timing of revenue recognition may not be consistent with its rights to bill and collect cash from project owners and other customers. Most contracts require payments as the corresponding work progresses that are determined in the manner described therein. Those rights are generally dependent upon advance billing terms, milestone billings based on the completion of certain phases of work or when services are performed. On most of our large contracts, milestone billings that occur early in the corresponding contract terms typically are made in advance of certain significant and related costs being incurred. This results in typically larger contract liability balances early in contract lives that decline over the terms of the corresponding contracts.
The balances of the Company’s accounts receivable represent amounts billed to customers that have yet to be collected and represent an unconditional right to cash from its customers. Contract assets include amounts that represent the rights to receive payment for goods or services that have been transferred to the customer, with the rights conditional upon something other than the passage of time. Contract liabilities include amounts that reflect obligations to provide goods or services for which payment has been received.
Contract retentions are billed amounts which, pursuant to the terms of the applicable contract, are not paid by customers until a defined phase of a contract or project has been completed and accepted. These retained amounts are reflected in contract assets or contract liabilities depending on the net contract position of the particular contract. Retention amounts and the length of retention periods may vary. Retainage amounts related to active contracts are considered current regardless of the term of the applicable contract; such amounts are generally collected by the completion of the applicable contract.
Remaining Unsatisfied Performance Obligations
Substantially all of the Company’s customer contracts include the right for customers to terminate contracts for convenience. The value of future work that the Company is contractually obligated to perform pursuant to active customer contracts should not be included in remaining unsatisfied performance obligations (“RUPO”) when the corresponding contracts include termination for convenience clauses without substantial penalties accruing to the customers upon such terminations. Management assesses whether the nature of the work being performed under contract is largely service-based and repetitive and should be considered a succession of one-month contracts for the duration of the identified term of the contract. These types of arrangements do not qualify as RUPO. Predominantly, the Company’s customers contract with the Company to construct assets, to fabricate materials or to perform emergency maintenance or outage services where management believes substantial penalties or costs would be incurred upon a termination for convenience, including the costs of terminating subcontracts, canceling purchase orders and returning or otherwise disposing of delivered materials and equipment. The value of RUPO on customer contracts represents amounts based on contracts or orders received from customers that the Company believes are firm and where the parties are acting in accordance with their respective obligations. The cancellation or termination of contracts for the convenience of customers has not had a material adverse effect on the consolidated financial statements.
Cash Equivalents – The Company considers all liquid investments with original maturities of three months or less at the time of purchase to be cash equivalents.
- 65 -
Available-For-Sale Securities – At each balance sheet date, available-for-sale (“AFS”) securities are stated at fair value with unrealized gains and losses, net of income taxes, presented as a component of accumulated other comprehensive loss. Interest income, accretion of discounts, amortization of premiums, and realized gains and losses are included in other income, net, in the Company’s consolidated statements of earnings. The Company determines the cost of securities sold based on the specific identification method. The Company determines the appropriate classification of AFS securities based on whether they represent the investment of cash available for current operations, as defined in Accounting Standards Codification (“ASC”) 210-10-45-1 and ASC 210-10-45-2. The classification of the AFS securities is reevaluated at each balance sheet date.
The Company evaluates whether a decline in the fair value of AFS securities below amortized cost basis is credit-related or due to other factors. If the Company intends to sell the AFS security or it is more likely than not that the Company would be required to sell the AFS security before recovery, impairment is recognized in earnings with a corresponding adjustment to the security’s amortized cost basis. If a portion of the unrealized loss is credit-related, the impairment is recorded as an allowance on the balance sheet with a corresponding adjustment to earnings. Credit recovery is recorded as an adjustment to the allowance and earnings in the period in which credit conditions improve.
Property, Plant and Equipment – Property, plant and equipment are stated at cost less accumulated depreciation. Such assets acquired in a business combination are initially included in the Company’s consolidated balance sheet at fair values. The Company capitalizes power plant project development costs incurred by consolidated variable interest entities. Depreciation amounts are determined using the straight-line method over the estimated useful lives of the assets, other than land, which are generally from to
Goodwill – On November 1 of each year, the Company reviews the carrying value of goodwill amounts for impairment. The Company also evaluates amounts of goodwill for impairment at any time when events or changes in circumstances indicate that goodwill value may be impaired.
The Company identifies a potential impairment loss by comparing the fair value of a reporting unit with the reporting unit’s carrying amount, including goodwill. In the quantitative approach, the fair value of the reporting unit is estimated using various market-based and income-based valuation techniques as applicable in the particular circumstances. If the fair value of the reporting unit exceeds the related carrying amount, goodwill of the reporting unit is not deemed to be impaired. If the carrying amount of the reporting unit exceeds its fair value, a goodwill impairment loss is recorded in an amount equal to the excess of the unit’s carrying value over its fair value, not to exceed the amount of goodwill allocated to the reporting unit.
An alternative method allows the Company to first assess qualitative factors to decide whether it is necessary to perform the quantitative goodwill impairment test. It is not required to calculate the fair value of a reporting unit unless management concludes, based on a qualitative assessment, that it is more likely than not that its fair value may be less than the corresponding carrying amount. The professional guidance for this evaluation identifies the types of factors which the Company should consider in conducting the qualitative assessment including macroeconomic, industry, market and entity-specific factors.
Long-Lived Assets – Long-lived assets (other than goodwill), consisting primarily of intangible assets with definite lives, right-of-use assets, and property, plant and equipment, are subject to review for impairment whenever events or changes in circumstances indicate that a carrying amount should be assessed. In such circumstances, the Company would compare the carrying value of the long-lived asset to the undiscounted future cash flows expected to result from the use of the asset. In the event that the Company would determine that the carrying value of the asset is not recoverable, a loss would be recognized based on the amount by which the carrying value exceeds the fair value of the asset. Fair value would be determined by using quoted market prices or valuation techniques such as the present value of expected future cash flows, appraisals, or other pricing models as appropriate. The Company’s intangible assets with definite lives are amortized over their estimated useful lives using the straight-line method.
- 66 -
Leases – The Company determines whether a contract is a lease at the inception of the contract based on whether the contract provides the Company the right to control the use of a physically distinct asset or substantially all of the capacity of an asset. Operating lease right-of-use assets and associated lease liabilities are recorded in the balance sheet at the lease commencement date based on the present value of future minimum lease payments to be made over the expected lease term. As the implicit rate is not determinable in most of the Company’s leases, management uses the Company’s incremental borrowing rate at the commencement date in determining the present value of future payments. The expected lease term includes any
The Company classifies as short-term leases any lease with an initial noncancellable term of twelve months or less that does not include an option to purchase the underlying asset that the Company is reasonably certain to exercise. Right-of-use assets and lease liabilities related to short-term leases are excluded from the consolidated balance sheets.
Under certain leases, the Company is obligated to pay property taxes, insurance, and maintenance costs. For leases that contain both lease and non-lease components, fixed and variable payments are allocated to each component relative to observable or estimated standalone prices.
Income Taxes – Deferred taxes are recognized using enacted tax rates for the effects of temporary differences between the book and tax bases of assets and liabilities. If management believes that it is more likely than not that some portion or all of a deferred tax asset will not be realized, the carrying value will be reduced by a valuation allowance.
The Company accounts for uncertain tax positions in accordance with current accounting guidance which prescribes a recognition threshold and measurement attribute for financial statement disclosure of tax positions taken, or expected to be taken, on the income tax returns of the Company. Management evaluates and the Company records the effect of any uncertain tax position based on the amount that management deems is more likely than not (i.e., greater than a 50% probability) to be sustained upon examination and ultimate settlement with the tax authorities in the applicable tax jurisdiction.
Interest incurred related to overdue income taxes is included in income tax expense; franchise taxes and income tax penalties are included in selling, general and administrative expenses.
Share-Based Payments – The Company measures and recognizes compensation expense for all stock-based awards granted to employees and directors based upon estimates of fair value determined at the grant date of the award. Forfeitures are recognized when they occur. Share-based compensation expense is included in selling, general and administrative expenses.
The Company estimates the weighted average fair value of stock options on the date of award using a Black-Scholes option pricing model. The Company believes that its past stock option exercise activity is sufficient to provide it with a reasonable basis upon which to estimate the expected life of newly awarded stock options. Risk-free interest rates are determined by blending the rates for -to-
The fair value amounts for total stock return performance-based restricted stock units (“PRSUs”) are determined by using the per share market price of the common stock on the dates of award and by assigning equal probabilities to the thirteen possible payout outcomes at the end of each
For earnings per share performance-based stock units (“ERSUs”) and renewable energy performance-based restricted stock units (“RRSUs”), the fair value of each award equals the aggregate market price for the number of shares that, as of the award date, are probable of vesting based on the performance conditions. For these stock-based awards with
- 67 -
performance conditions, compensation expense is recognized using the graded attribution method over the requisite service period when it is probable that the performance conditions will be satisfied.
For time-based restricted stock units (“TRSUs”), the fair value of each award equals the aggregate market price for the number of shares covered by each award on the date of award. TRSUs awarded by the Company are generally subject to a service-based vesting condition, which is generally three years. For these stock-based awards subject to service-based vesting conditions, the fair value amounts are recorded in stock compensation expense over the three-year contractual lapsing periods for the corresponding restrictions.
For each exercise of a stock option or each vesting of a restricted stock unit, the Company determines whether the difference between the deduction for income tax reporting purposes created at that time and the related compensation expense previously recorded for financial reporting purposes results in either an excess income tax benefit or an income tax deficiency which is recognized, accordingly, as income tax benefit or expense in the corresponding consolidated statement of earnings.
Fair Value of Financial Instruments – ASC Topic 820, Fair Value Measurement, establishes a fair value hierarchy that requires an entity to maximize the use of observable inputs and to minimize the use of unobservable inputs when measuring fair value. Fair value is the price that would be received to sell an asset or paid to transfer a liability in the principal or most advantageous market for the asset or liability in an orderly transaction between market participants at the measurement date. The fair value hierarchy prioritizes the inputs into three levels that may be used to measure fair value:
Level 1 – Inputs are unadjusted quoted prices in active markets for identical assets or liabilities.
Level 2 – Inputs are quoted prices for similar assets or liabilities in active markets; or quoted prices for identical or similar assets or liabilities in markets that are not active; or other inputs that are observable or can be corroborated by observable market data.
Level 3 – Inputs are unobservable inputs based on a company’s own assumptions.
The carrying values presented in the consolidated balance sheets for the Company’s cash, certificates of deposit (“CD’s”), accounts receivable and contract assets, and the Company’s current liabilities are reasonable estimates of their fair values due to the short-term nature of these instruments.
Foreign Currency Translation – The accompanying consolidated financial statements are presented in the currency of the United States (“U.S. Dollars”). The effects of translating the financial statements of APC from its functional currency (Euros) into the Company’s reporting currency (U.S. Dollars) are recognized as translation adjustments in accumulated other comprehensive loss. There are no applicable income taxes. The translation of assets and liabilities to U.S. Dollars is made at the exchange rate in effect at the consolidated balance sheet date, while equity accounts are translated at historical rates. The translation of the statement of earnings amounts is made monthly based generally on the average currency exchange rate for the month.
Foreign currency transactions are remeasured at current exchange rates, with adjustments recorded as foreign currency gains or losses. Net foreign currency gains and losses are included in other income, net, in the consolidated statements of earnings. For the years ended January 31, 2024 (“Fiscal 2024”), 2023 (“Fiscal 2023”) and 2022 (“Fiscal 2022”), such amounts were not material.
Treasury Stock – Treasury Stock is recorded using the cost method. Incremental direct costs to purchase treasury stock, including excise tax, are included in the cost of the shares acquired. The Company uses the average cost method to account for treasury stock. For shares of treasury stock provided for settlements or sold at a price higher than its cost, the gain is recorded to additional paid-in capital. For shares of treasury stock provided for settlements or sold at a price lower than its cost, the loss is recorded to additional paid-in capital to the extent there are previous net gains included in the account. Any losses in excess of that amount are recorded to retained earnings.
Net Income Per Share – Basic net income per share is computed by dividing net income by the weighted average number of shares of common stock outstanding during the period. Diluted net income per share is computed similarly, however, the denominator is adjusted for the number of common stock equivalents that would have a dilutive effect using the treasury stock method. If a common stock equivalent is considered antidilutive, it is not included. Potentially dilutive common stock equivalents include stock options and restricted stock units.
- 68 -
RECENTLY ISSUED ACCOUNTING PRONOUNCEMENTS
In March 2023, the Financial Accounting Standards Board (the “FASB”) issued Accounting Standards Update (“ASU”) 2023-02, Investments—Equity Method and Joint Ventures (Topic 323): Accounting for Investments in Tax Credit Structures Using the Proportional Amortization Method, which provides an election to account for tax equity investments using the proportional amortization method if certain conditions are met. Under the proportional amortization method, the initial cost of an investment is amortized in proportion to the amount of the tax credits and other tax benefits received and presented net as a component of income tax expense. The amendments in this update are effective for fiscal years beginning after December 15, 2023, and interim periods within those fiscal years. Early adoption is permitted. The Company adopted this guidance using the modified retrospective approach on the first day of Fiscal 2024. As the Company’s investments in solar tax credit structures entered into prior to Fiscal 2024 do not qualify for the proportional amortization method permitted under this guidance, the Company’s financial statements were not impacted at the time of adoption. During Fiscal 2024, the Company made an equity investment in a solar tax credit structure that is eligible for the proportional amortization method (see Note 12).
In November 2023, the FASB issued ASU 2023-07, Segment Reporting (Topic 280): Improvements to Reportable Segment Disclosures introducing key amendments to enhance disclosures in public entities’ reportable segments. Notable changes include the mandatory disclosure of significant segment expenses regularly provided to the chief operating decision maker (“CODM”), disclosure of other segment items, and requirements for consistency in reporting measures used by the CODM. The amendments in this update are effective for fiscal years beginning after December 15, 2023, and interim periods within fiscal years beginning after December 15, 2024. The Company is currently evaluating the effects, if any, that the adoption ASU 2023-07 may have on its financial position, results of operations, cash flows, or disclosures.
In December 2023, the FASB issued ASU 2023-09, Income Taxes (Topic 740): Improvements to Income Tax Disclosures, which introduces more detailed requirements for annual disclosures for income taxes. The ASU requires public business entities to present specific categories in the income tax rate reconciliation and provide additional information for reconciling items that meet a quantitative threshold. ASU 2023-09 also requires all entities to disclose the amount of income taxes paid, net of refunds received, disaggregated by federal, state, and foreign jurisdiction. The ASU is effective for fiscal years beginning after December 15, 2024. The Company is currently evaluating the effects, if any, that the adoption of ASU 2023-09 may have on its financial position, results of operations, cash flows, or disclosures.
There are no other recently issued accounting pronouncements that have not yet been adopted that the Company considers material to its consolidated financial statements.
NOTE 2 – REVENUES FROM CONTRACTS WITH CUSTOMERS
Disaggregation of Revenues
The following table presents consolidated revenues for Fiscal 2024, Fiscal 2023 and Fiscal 2022, disaggregated by the geographic area where the corresponding projects were located:
2024 |
| 2023 |
| 2022 | |||||
United States | $ | | $ | | $ | | |||
Republic of Ireland | | | | ||||||
United Kingdom |
| |
| |
| | |||
Other |
| — |
| — |
| | |||
Consolidated Revenues | $ | | $ | | $ | | |||
Revenues for projects located in Ireland and the U.K. are attributed to the power industry services segment. The major portions of the Company’s consolidated revenues are recognized pursuant to fixed-price contracts with most of the remaining portions earned pursuant to time-and-material contracts. Consolidated revenues are disaggregated by reportable segment in Note 17 to the consolidated financial statements.
- 69 -
Contract Loss
For a project being performed by APC to construct a gas-fired power facility in Northern Ireland, an estimated loss at completion of the project of approximately $
Contract Assets and Liabilities
The Company’s timing of revenue recognition may not be consistent with its rights to bill and collect cash from project owners and other customers. Most contracts require payments as the corresponding work progresses that are determined in the manner described therein. This results in typically larger contract liability balances early in contract lives that decline over the terms of the corresponding contracts. During the fiscal year ended January 31, 2024, there were no material unusual or one-time adjustments to contract liabilities. The amounts of revenues recognized during Fiscal 2024 and Fiscal 2023 that were included in the balances of contract liabilities as of January 31, 2023 and 2022, were approximately $
Contract retentions are billed amounts which, pursuant to the terms of the applicable contract, are not paid by customers until a defined phase of a contract or project has been completed and accepted. These retained amounts are reflected in contract assets or contract liabilities depending on the net contract position of the particular contract. The amounts retained by project owners and other customers under construction contracts at January 31, 2024, and 2023 were $
Variable Consideration
Amounts for unapproved change orders for which the Company has project-owner directive for additional work or other scope change, but not for the price associated with the corresponding additional effort, are included in the transaction price when it is considered probable that the applicable costs will be recovered through a modification to the contract price. The Company also includes in the corresponding transaction price an estimate of the amount that it expects to receive from a claim based on management’s judgment regarding all reasonably available information. At January 31, 2024 and 2023, the aggregate amounts of such contract variations that were included in the transaction prices and that were still pending customer approval were $
Remaining Unsatisfied Performance Obligations
At January 31, 2024, the Company had RUPO of $
It is important to note that estimates may be changed in the future and that cancellations, deferrals or scope adjustments may occur related to work included in the amount of RUPO at January 31, 2024. Accordingly, RUPO may be adjusted to reflect project delays and cancellations, revisions to project scope and cost and foreign currency exchange fluctuations, or to revise estimates, as effects become known. Such adjustments to RUPO may materially reduce future revenues below Company estimates.
NOTE 3 – CASH, CASH EQUIVALENTS AND INVESTMENTS
At January 31, 2024 and 2023, certain amounts of cash equivalents were invested in a money market fund with net assets invested in high-quality money market instruments, including U.S. Treasury obligations; obligations of U.S. government agencies, authorities, instrumentalities or sponsored enterprises; and repurchase agreements secured by such obligations. Dividend income related to money market investments is recorded when earned. The balances of accrued dividends at January 31, 2024 and 2023 were $
- 70 -
Investments
The Company’s investments consisted of the following as of January 31, 2024 and 2023:
2024 |
| 2023 | ||||
Short-term investments | $ | | $ | | ||
Available-for-sale securities | | — | ||||
Total investments | $ | | $ | | ||
Short-Term Investments
Short-term investments as of January 31, 2024 and 2023 consisted solely of certificates of deposit (“CDs”) with initial maturities of
Available-For-Sale Securities
AFS securities as of January 31, 2024 consisted of U.S. Treasury notes and a U.S. corporate debt security with original maturities of or
January 31, 2024 | |||||||||||||||
Allowance for | Gross | Gross | Estimated | ||||||||||||
Amortized | Credit | Unrealized | Unrealized | Fair | |||||||||||
| Cost |
| Losses |
| Gains |
| Losses |
| Value | ||||||
U.S. Treasury notes: | |||||||||||||||
Due in one to two years | $ | | $ | — | $ | | $ | | $ | | |||||
Due in two to three years | | — | | | | ||||||||||
U.S. corporate debt security: | |||||||||||||||
Due in two to three years | | — | — | | | ||||||||||
Totals | $ | | $ | — | $ | | $ | | $ | | |||||
As of January 31, 2024, interest receivable in the amount of $
Earnings on Invested Funds
Earnings on invested funds for Fiscal 2024, Fiscal 2023 and Fiscal 2022 were $
Concentration Risk
The Company has a substantial portion of its cash on deposit in the U.S. with the Bank or invested in CDs purchased from the Bank. In addition, the Company has cash invested in a money market fund at a separate institution. The Company also maintains certain Euro-based bank accounts in Ireland and certain pound sterling-based bank accounts in the U.K. in support of the operations of APC. As of January 31, 2024, approximately 12% of the Company’s cash and cash equivalents were held by local financial institutions in Ireland and the U.K. Management does not believe that the combined amount
- 71 -
of the CDs and the cash deposited with the Bank, cash invested in the money market fund, and cash balances maintained at financial institutions in Ireland and the U.K., in excess of government-insured levels, represent material risks.
NOTE 4 – FAIR VALUE MEASUREMENTS
The following table presents the Company’s financial instruments as of January 31, 2024 and 2023 that are measured and recorded at fair value on a recurring basis:
January 31, 2024 | January 31, 2023 | |||||||||||||||||
Level 1 | Level 2 | Level 3 | Level 1 | Level 2 | Level 3 | |||||||||||||
| Inputs |
| Inputs | Inputs |
| Inputs | Inputs |
| Inputs | |||||||||
Cash equivalents: | ||||||||||||||||||
Money market fund | $ | | $ | — | $ | — | $ | | $ | — | $ | — | ||||||
Available-for-sale securities: | ||||||||||||||||||
U.S. Treasury notes | — | | — | — | — | — | ||||||||||||
U.S. corporate debt security | — | | — | — | — | — | ||||||||||||
Totals | $ | | $ | | $ | — | $ | | $ | — | $ | — | ||||||
NOTE 5 – ACCOUNTS RECEIVABLE
The Company generally extends credit to a customer based on an evaluation of the customer’s financial condition without requiring tangible collateral. Customer payments on construction service contracts are generally due within 30 to 60 days of billing, depending on the negotiated terms of the corresponding contract. Exposure to losses on accounts receivable may differ due to the varying financial condition of each customer. The Company monitors its exposure to credit losses and may establish an allowance for credit losses based on management’s estimate of the loss that is expected to occur over the remaining life of the particular financial asset. The amounts of the provision for credit losses for Fiscal 2024 and Fiscal 2023 were insignificant. For Fiscal 2022, the amount of the provision for credit losses was $
NOTE 6 – INTANGIBLE ASSETS
Goodwill
The Company used a qualitative approach to assess the goodwill of the GPS reporting unit, which is included in the power industry services segment, as of November 1, 2023 and 2022. At each date, the Company concluded that it was more likely than not that the fair value of the reporting unit exceeded the corresponding carrying value. Therefore, completion of the quantitative impairment assessment was considered to be unnecessary in each case.
Similarly, the Company used a qualitative approach to assess the goodwill of the TRC reporting unit, which represents the industrial construction services segment, as of November 1, 2023 and 2022 and concluded that it was more likely than not that the fair value of the reporting unit exceeded the corresponding carrying value. Therefore, the completion of the quantitative impairment assessment was considered to be unnecessary.
During Fiscal 2022, the Company completed the acquisition of Lee Telecom, Inc. (“LTI”), which is located in Hampton, Virginia. The results of operations of LTI are included in the Company’s telecommunications infrastructure services segment. The acquisition represented a purchase of the assets of LTI, for which the Company paid $
- 72 -
The changes in the balances of the Company’s goodwill by reportable segment for Fiscal 2024 and Fiscal 2023 were as follows:
| Power | Industrial | Telecom | |||||||||
Services |
| Services |
| Services |
| Totals | ||||||
Goodwill as of February 1, 2022 | $ | | $ | | $ | | $ | | ||||
Impairment losses | — | — | — | — | ||||||||
Goodwill as of January 31, 2023 | | | | | ||||||||
Impairment losses | — | — | — | — | ||||||||
Goodwill as of January 31, 2024 | $ | | $ | | $ | | $ | | ||||
Balances, January 31, 2024: | ||||||||||||
Goodwill | $ | | $ | | $ | | $ | | ||||
Accumulated impairment losses |
| ( |
| ( |
| — |
| ( | ||||
Goodwill as of January 31, 2024 | $ | | $ | | $ | | $ | | ||||
As of January 31, 2024, the accumulated impairment losses for the power industry services segment relate solely to the APC reporting unit.
For income tax reporting purposes, the straight-line amortization of goodwill related to acquisitions in the approximate amount of $
Other Intangible Assets
The Company’s intangible assets, other than goodwill, relate primarily to the industrial construction services segment and consisted of the following as of January 31, 2024 and 2023:
January 31, 2024 | January 31, 2023 | |||||||||||||||||||
Estimated | Gross | Accumulated | Net | Gross | Accumulated | Net | ||||||||||||||
| Useful Life |
| Amounts |
| Amortization |
| Amounts |
| Amounts |
| Amortization |
| Amounts | |||||||
Trade name | $ | | $ | | $ | | $ | | $ | | $ | | ||||||||
Customer relationships | | | | | | | ||||||||||||||
Totals | $ | | $ | | $ | | $ | | $ | | $ | | ||||||||
The amounts related to the trade name that became fully amortized during Fiscal 2023 were removed from the table. The Company believes that the useful life of the remaining trade name represents the remaining number of years that such intangible asset is expected to contribute to future cash flows. There were
The future amounts of amortization related to intangibles are presented below for the years ending January 31:
2025 |
| $ | |
2026 |
| | |
2027 |
| | |
2028 |
| | |
2029 | | ||
Thereafter |
| | |
Total | $ | |
- 73 -
NOTE 7 – PROPERTY, PLANT AND EQUIPMENT, NET
Property, plant and equipment consisted of the following at January 31, 2024 and 2023:
| 2024 |
| 2023 | ||||
Land and improvements | $ | | $ | | |||
Building and improvements |
| |
| | |||
Furniture, machinery and equipment |
| |
| | |||
Trucks, trailers and other vehicles |
| |
| | |||
| |
| | ||||
Less - accumulated depreciation |
| |
| | |||
Property, plant and equipment, net | $ | | $ | | |||
The following table presents property, plant and equipment, net, disaggregated by geographic area as of January 31, 2024 and 2023:
| 2024 |
| 2023 | |||
United States | $ | | $ | | ||
Republic of Ireland |
| |
| | ||
United Kingdom |
| |
| | ||
Property, plant and equipment, net | $ | | $ | | ||
Depreciation expense for property, plant and equipment was $
NOTE 8 – FINANCING ARRANGEMENTS
During April 2021, the Company amended its Amended and Restated Replacement Credit Agreement with the Bank (the “Credit Agreement”) which extended the expiration date of the Credit Agreement to May 31, 2024 and reduced the borrowing rate. On March 6, 2023, the Company entered into the Second Amendment (the “Second Amendment”) to the Credit Agreement. The Second Amendment modified the Credit Amendment, primarily, to replace the interest pricing with the Secured Overnight Financing Rate (“SOFR”) plus
At January 31, 2024 and 2023, the Company did not have any borrowings outstanding under the Credit Agreement. However, the Bank has issued a letter of credit in the total outstanding amount of $
The Company has pledged the majority of its assets to secure its financing arrangements. The Bank’s consent is not required for acquisitions, divestitures, cash dividends or significant investments as long as certain conditions are met. The Credit Agreement requires that the Company comply with certain financial covenants at its fiscal year-end and at each fiscal quarter-end. The Credit Agreement, as amended, includes other terms, covenants and events of default that are customary for a credit facility of its size and nature, including a requirement to achieve positive adjusted earnings before interest, taxes, depreciation and amortization, as defined, over each rolling twelve-month measurement period. As of January 31, 2024 and 2023, the Company was in compliance with the covenants of the Credit Agreement, as amended.
- 74 -
NOTE 9 – COMMITMENTS
Leases
The Company’s leases are primarily operating leases that cover office space, expiring on various dates through December 2031, and certain equipment used by the Company in the performance of its construction services contracts. Some of these equipment leases may be embedded in broader agreements with subcontractors or construction equipment suppliers. The Company has no material finance leases. None of the operating leases includes significant amounts for incentives, rent holidays or price escalations.
At January 31, 2024 and 2023, right-of-use assets were $
The following is a schedule of future minimum lease payments for the operating leases that were recognized in the consolidated balance sheet as of January 31, 2024 for the years ending January 31:
2025 |
| $ | |
2026 | | ||
2027 | | ||
2028 | | ||
2029 | | ||
Thereafter | | ||
Total lease payments | | ||
Less imputed interest | | ||
Present value of lease payments | | ||
| |||
$ | |
The following table presents summary information for the Company’s lease terms and discount rates for its operating leases at January 31, 2024 and 2023:
2024 |
| 2023 |
| ||||
Weighted average remaining lease term | |||||||
Weighted average discount rate | | % | | % | |||
The Company also uses equipment and occupies other facilities under short-term rental agreements. Rent expense amounts incurred under short-term rentals were $
Performance Bonds and Guarantees
In the normal course of business and for certain major projects, the Company may be required to obtain surety or performance bonding, to cause the issuance of letters of credit, or to provide parent company guarantees (or some combination thereof) in order to provide performance assurances to clients on behalf of its contractor subsidiaries. As these subsidiaries are wholly-owned, any actual liability is ordinarily reflected in the financial statement account balances determined pursuant to the Company’s accounting for contracts with customers. When sufficient information about claims on guaranteed or bonded projects would be available and monetary damages or other costs or losses would be determined to be probable, the Company would record such losses. Any such amounts that may be required to be paid in excess of the estimated costs to complete contracts in progress as of January 31, 2024 are not estimable.
As of January 31, 2024, the estimated amount of the Company’s unsatisfied bonded performance obligations, covering all of its subsidiaries, was approximately $
- 75 -
The Company also provided a financial guarantee, subject to certain terms and conditions, up to $
Warranties
The Company generally provides assurance-type warranties for work performed under its construction contracts. The warranties cover defects in equipment, materials, design or workmanship, and most warranty periods typically run from to
Employee Benefit Plans
The Company maintains 401(k) savings plans pursuant to which the Company makes discretionary contributions for the eligible and participating employees. The Company’s expense amounts related to these defined contribution plans were approximately $
NOTE 10 – LEGAL CONTINGENCIES
In the normal course of business, the Company may have pending claims and legal proceedings. In the opinion of management, based on information available at this time, there are no current claims and proceedings that are expected to have a material adverse effect on the consolidated financial statements as of January 31, 2024.
In January 2019, GPS filed a lawsuit against Exelon West Medway II, LLC and Exelon Generation Company, LLC (together referred to as “Exelon”) in the U.S. District Court for the Southern District of New York for Exelon’s breach of contract and failure to remedy various conditions which negatively impacted the schedule and the costs associated with the construction by GPS of a gas-fired power plant for Exelon in Massachusetts. In September 2021, GPS reached a final settlement of all outstanding claims between the parties resulting in Exelon making a payment to GPS in the amount of $
NOTE 11 – STOCK-BASED COMPENSATION
On June 23, 2020, the Company’s stockholders approved the adoption of the 2020 Stock Plan (the “2020 Plan”), and the allocation of
The features of the 2020 Plan are similar to those included in the 2011 Plan. Awards may include nonqualified stock options, incentive stock options, and restricted or unrestricted stock. The specific provisions for each award are documented in a written agreement between the Company and the awardee. All stock options awarded under the Stock Plans have exercise prices per share at least equal to the market value per share of the Company’s common stock on the date of grant. Stock options have a maximum term of
As of January 31, 2024, there were
- 76 -
Expense amounts related to stock awards were $
Stock Options
A summary of stock option activity under the Stock Plans for Fiscal 2024 is presented below (shares in thousands):
Weighted- | ||||||||||
Average | Weighted- | |||||||||
Weighted- | Remaining | Average | ||||||||
Average Exercise | Contractual | Grant-Date | ||||||||
| Shares |
| Price |
| Term (years) |
| Fair Value | |||
Outstanding, January 31, 2023 |
| | $ | |
| $ | | |||
Granted | | $ | | |||||||
Exercised | ( | $ | | |||||||
Forfeited | ( | $ | | |||||||
Outstanding, January 31, 2024 | | $ | |
| $ | | ||||
Exercisable, January 31, 2024 | | $ | |
| $ | | ||||
Vested or expected to vest, January 31, 2024 |
| | $ | |
| $ | | |||
A summary of the changes in the number of non-vested options to purchase shares of common stock for Fiscal 2024 is presented below (shares in thousands):
| Weighted- | ||||
Average | |||||
Grant-Date | |||||
Shares |
| Fair Value | |||
Non-vested, January 31, 2023 |
| | $ | | |
Granted |
| | $ | | |
Vested |
| ( | $ | | |
Forfeited | ( | $ | | ||
Non-vested, January 31, 2024 |
| | $ | | |
During Fiscal 2023 and 2022, respectively,
Restricted Stock Units
The Company awards restricted stock units to senior executives, certain other key employees and members of the Company’s board of directors. Awardees earn the right to receive shares of common stock as certain performance goals are achieved and/or service periods are satisfied. Each restricted stock unit expires on the
During Fiscal 2024, the Company awarded PRSUs covering a target of
- 77 -
The changes in the maximum number of shares of common stock issuable pursuant to outstanding restricted stock units for Fiscal 2024 are presented below (shares in thousands):
| Weighted- | ||||
Average | |||||
Grant-Date | |||||
Shares | Fair Value | ||||
Outstanding, January 31, 2023 | | $ | | ||
Awarded | | $ | | ||
Issued | ( | $ | | ||
Forfeited | ( | $ | | ||
Outstanding, January 31, 2024 | | $ | | ||
During Fiscal 2023 and 2022, restricted stock units covering a maximum of
NOTE 12 – INCOME TAXES
Income Tax Expense Reconciliations
The components of the amounts of income tax expense for Fiscal 2024, Fiscal 2023 and Fiscal 2022 are presented below:
| 2024 |
| 2023 |
| 2022 | ||||
Current: | |||||||||
Federal | $ | | $ | | $ | | |||
State |
| |
| |
| | |||
Foreign | | | — | ||||||
| |
| |
| | ||||
Deferred: | |||||||||
Federal |
| ( |
| ( |
| ( | |||
State |
| |
| |
| | |||
Foreign | | ( | — | ||||||
| |
| ( |
| ( | ||||
Income tax expense | $ | | $ | | $ | | |||
The amounts of interest and penalties related to income taxes that were incurred by the Company during Fiscal 2024, Fiscal 2023 and Fiscal 2022 were not material.
- 78 -
The Company’s income tax expense amounts differed from corresponding amounts computed by applying the federal corporate income tax rate of
2024 |
| 2023 |
| 2022 | |||||
Computed expected income tax expense | $ | | $ | | $ | | |||
Difference resulting from: | |||||||||
Unrecognized tax loss benefit | | — | — | ||||||
Foreign tax rate differential | ( | ( | ( | ||||||
State income taxes, net of federal tax effect |
| |
| |
| | |||
Excess executive compensation | | | | ||||||
Adjustment to valuation for foreign NOLs | | ( | — | ||||||
Net benefit related to Solar Tax Credit investments | ( | — | — | ||||||
Meals and entertainment expense | | | | ||||||
Research and development tax credits adjustment | — | | — | ||||||
Recognition of research and development tax credit benefits | — | ( | — | ||||||
Other permanent differences and adjustments, net | ( | ( |
| ( | |||||
Income tax expense | $ | | $ | | $ | | |||
Net Operating Loss (“NOL”) Carryback
In March 2020, the Coronavirus, Aid, Relief, and Economic Security Act (the “CARES Act”) was signed into law. The tax changes of the CARES Act included a temporary suspension of the limitations on the future utilization of certain NOLs and re-established a carryback period for certain losses to
Research and Development Tax Credit Adjustments
During Fiscal 2019, the Company completed a detailed review of the activities of its engineering staff on major EPC services projects in order to identify and quantify the amounts of research and development tax credits that may have been available to reduce prior year income taxes. This study focused on project costs incurred during the
During Fiscal 2021, the IRS concluded examinations of the Company’s consolidated federal income tax returns for the years ending January 31, 2018, 2017 and 2016, with its focus on the research and development tax credits included therein. The final revenue agents reports disagreed with the Company’s treatment of a substantial amount of the costs that supported the Company’s claims. The Company submitted a formal protest of the findings of the IRS examiner and requested an appeal hearing. At the conclusion of the hearing, the Company accepted a settlement offer from the IRS in the amount of approximately $
The Company has also formally protested the conclusions reached by two states, where the Company filed tax returns reflecting the benefits of certain research and development credits, that the credits are not allowable.
- 79 -
Research and Development Credits
During Fiscal 2022, in a manner similar to the process described above, the Company completed a detailed review of the activities of its engineering staff on major EPC services projects in order to identify and quantify the amounts of research and development tax credits that may have been available to reduce federal income taxes for Fiscal 2022 and Fiscal 2021. As a result, the Company filed amended federal income tax returns for those years including research and development tax credits in the total amount of $
Unrecognized Income Tax Benefits
Changes in the balances of contra-asset established for uncertain income tax positions for Fiscal 2024, Fiscal 2023 and Fiscal 2022 are presented below:
| 2024 |
| 2023 |
| 2022 | ||||
Unrecognized income tax benefits, beginning of fiscal year | $ | | $ | | $ | | |||
Increases related to prior period income tax positions |
| |
| — |
| | |||
Increases related to current period income tax positions | — |
| |
| — | ||||
Expirations of statutes of limitations |
| ( |
| — |
| — | |||
Settlements |
| — |
| ( |
| — | |||
Unrecognized income tax benefits, end of fiscal year | $ | | $ | | $ | | |||
Gross unrecognized income tax benefits totaled $
Recognition of Foreign NOL Income Tax Benefits
The Company has deferred tax assets in a total amount of approximately $
Income Tax Refunds
As of January 31, 2024 and 2023, the balances of other current assets in the consolidated balance sheet included income tax refunds receivable and prepaid income taxes in the total amounts of approximately $
- 80 -
Deferred Taxes
The tax effects of temporary differences that are reflected in deferred taxes as of January 31, 2024 and 2023 included the following:
| 2024 |
| 2023 | |||
Assets: | ||||||
Net operating loss carryforwards | $ | | $ | | ||
Stock awards | | | ||||
Accrued expenses | | | ||||
Lease liabilities | | | ||||
Research and development costs deferral | | | ||||
Research and development credit carryforwards | — | | ||||
Other |
| |
| | ||
| |
| | |||
Liabilities: | ||||||
Intangibles | ( | ( | ||||
Property and equipment |
| ( |
| ( | ||
Construction contracts |
| ( |
| ( | ||
Right-of-use assets | ( | ( | ||||
Other | ( | ( | ||||
| ( |
| ( | |||
Valuation allowances | ( | ( | ||||
Deferred tax assets, net | $ | | $ | | ||
Taxpayers are now required to capitalize and amortize research and experimental expenses over five or 15 years for tax years beginning in 2022 or later. Accordingly, for Fiscal 2024 and 2023, the Company did estimate an amount of such expenses which resulted in the deferred tax asset balances presented in the table above.
The Company acquired unused NOLs for federal income tax reporting purposes from TRC that are subject to limitations imposed by Section 382 of the Internal Revenue Code of 1986, as amended. These losses are subject to annual limits that reduce the aggregate amount of NOLs available to the Company in the future to approximately $
The Company’s ability to realize deferred tax assets, including those related to the NOLs discussed above, depends primarily upon the generation of sufficient future taxable income to allow for the Company’s use of temporarily deferred deductions and tax planning strategies. If such estimates and assumptions change in the future, the Company may be required to record additional valuation allowances against some or all of its deferred tax assets resulting in additional income tax expense in the future. At this time, based substantially on the strong earnings performance of the Company’s power industry services reporting segment, management believes that it is more likely than not that the Company will realize the benefit of significantly all of its deferred tax assets, net of valuation allowances.
Income Tax Returns
The Company is subject to federal and state income taxes in the U.S., and income taxes in Ireland and the U.K. Tax treatments within each jurisdiction are subject to the interpretation of the related tax laws and regulations which require the application of significant judgment. The Company is no longer subject to income tax examinations by authorities for its fiscal years ended on or before January 31, 2020, except for several notable exceptions including Ireland, the U.K. and several states where the open periods are one year longer.
Solar Energy Projects
The Company holds equity investments in Solar Tax Credit (“STC”) investments. Primarily, the STC investments are structured as limited liability companies that invest in solar energy projects that are eligible to receive energy tax credits.
- 81 -
During Fiscal 2024 and Fiscal 2022, the Company made investments of approximately $
The Company has elected to use the proportional amortization method (“PAM”) for STC investments that qualify. Under PAM, an investment is amortized in proportion to the allocation of tax benefits received in each period, and the investment amortization and tax benefit amounts are presented net within income tax expense in the Company’s consolidated statements of earnings. Only the Company’s STC investment made in Fiscal 2024 qualifies for PAM. During Fiscal 2024, the Company recognized $
Not all of the Company’s STC investments qualify for PAM. For STC investments that do not qualify for PAM, the Company accounts for the investment using the equity method of accounting and includes income and losses related to the investment in other income in the Company’s consolidated statements of earnings. Tax credits, when recognized, are recorded as a reduction of the corresponding investment balance with an offsetting reduction to accrued taxes payable in accordance with the deferral method. For these STC investments that do not qualify for PAM, income tax credits in the approximate amount of $
NOTE 13 – NET INCOME PER SHARE
Basic and diluted net income per share attributable to the stockholders of Argan, Inc. for Fiscal 2024, Fiscal 2023 and Fiscal 2022 are computed as follows (shares in thousands except in note (1) below the chart):
2024 |
| 2023 |
| 2022 | |||||
Net income | $ | | $ | | $ | | |||
Weighted average number of shares outstanding – basic | | | | ||||||
Effect of stock awards (1) | | | | ||||||
Weighted average number of shares outstanding – diluted | | | | ||||||
Net income per share attributable to the stockholders of Argan, Inc. | |||||||||
Basic | $ | | $ | | $ | | |||
Diluted | $ | | $ | | $ | | |||
| (1) | For Fiscal 2024, 2023 and 2022, the weighted average numbers of shares determined on a dilutive basis exclude the effects of antidilutive stock options and restricted stock units covering an aggregate of |
NOTE 14 – CASH DIVIDENDS AND COMMON STOCK REPURCHASES
On September 19, 2023, Argan’s board of directors increased the Company’s quarterly cash dividend by
Pursuant to its established program and authorizations provided by Argan’s board of directors, the Company began to repurchase shares of its common stock in November 2021. During Fiscal 2024, the Company repurchased
- 82 -
for an aggregate price of approximately $
During Fiscal 2023, the Company repurchased
In August 2022, the Inflation Reduction Act was signed into law, which introduced a 1% excise tax on shares repurchased after December 31, 2022. For Fiscal 2024 and Fiscal 2023, the excise tax was not material.
NOTE 15 – VARIABLE INTEREST ENTITY
In January 2018, the Company was deemed to be the primary beneficiary of a VIE that was performing the project development activities related to the planned construction of a new natural gas-fired power plant. Consideration for the Company’s engineering and financial support provided to the project included the right to build the power plant pursuant to a turnkey EPC services contract that was negotiated and announced. In Fiscal 2023, the Company was deemed to no longer be the primary beneficiary of the VIE, and accordingly it was deconsolidated. Prior to deconsolidation, the account balances of the VIE had been included in the Company’s consolidated financial statements, including capitalized development costs that were included in property, plant and equipment.
During Fiscal 2022, the project owner was unable to obtain the necessary equity financing for the project, and the Company recorded an impairment loss related to the capitalized development costs of this project in the amount of $
NOTE 16 – CUSTOMER CONCENTRATIONS
The majority of the Company’s consolidated revenues relate to performance by the power industry services segment which provided
For Fiscal 2024, the Company’s most significant customer relationships included
The accounts receivable balances from
NOTE 17 – SEGMENT REPORTING
Segments represent components of an enterprise for which discrete financial information is available that is evaluated regularly by the Company’s chief executive officer, who is the chief operating decision maker, in determining how to allocate resources and in assessing performance. The Company’s reportable segments recognize revenues and incur expenses, are organized in separate business units with different management teams, customers, talents and services, and may include more than
- 83 -
Intersegment revenues and the related cost of revenues, are netted against the corresponding amounts of the segment receiving the intersegment services. For Fiscal 2024, intersegment revenues were
Summarized below are certain operating results and financial position data of the Company’s reportable business segments for Fiscal 2024, Fiscal 2023 and Fiscal 2022. The “Other” column in each summary includes the Company’s corporate expenses.
Year Ended | Power | Industrial | Telecom | ||||||||||||
January 31, 2024 |
| Services |
| Services |
| Services |
| Other |
| Totals | |||||
Revenues | $ | | $ | | $ | | $ | — | $ | | |||||
Cost of revenues |
| |
| |
| |
| — |
| | |||||
Gross profit |
| |
| |
| |
| — |
| | |||||
Selling, general and administrative expenses |
| | | | | | |||||||||
Income (loss) from operations | | | | ( | | ||||||||||
Other income (loss), net |
| |
| — |
| ( |
| ( |
| | |||||
Income (loss) before income taxes | $ | | $ | | $ | | $ | ( |
| | |||||
Income tax expense |
| | |||||||||||||
Net income | $ | | |||||||||||||
Amortization of intangibles | $ | — | $ | | $ | — | $ | — | $ | | |||||
Depreciation | | | | | | ||||||||||
Property, plant and equipment additions | | | | | | ||||||||||
Current assets | $ | | $ | | $ | | $ | | $ | | |||||
Current liabilities | | | | | | ||||||||||
Goodwill | | | | — | | ||||||||||
Total assets | | | | | | ||||||||||
Year Ended | Power | Industrial | Telecom | ||||||||||||
January 31, 2023 |
| Services |
| Services |
| Services |
| Other |
| Totals | |||||
Revenues | $ | | $ | | $ | | $ | — | $ | | |||||
Cost of revenues |
| |
| |
| |
| — |
| | |||||
Gross profit |
| |
| |
| |
| — |
| | |||||
Selling, general and administrative expenses |
| | | | | | |||||||||
Income (loss) from operations | | | ( | ( | | ||||||||||
Other income, net |
| |
| — |
| |
| |
| | |||||
Income (loss) before income taxes | $ | | $ | | $ | ( | $ | ( |
| | |||||
Income tax expense |
| | |||||||||||||
Net income | $ | | |||||||||||||
Amortization of intangibles | $ | — | $ | | $ | | $ | — | $ | | |||||
Depreciation | | | | | | ||||||||||
Property, plant and equipment additions | | | | | | ||||||||||
Current assets | $ | | $ | | $ | | $ | | $ | | |||||
Current liabilities | | | | | | ||||||||||
Goodwill | | | | — | | ||||||||||
Total assets | | | | | | ||||||||||
- 84 -
Year Ended | Power | Industrial | Telecom | ||||||||||||
January 31, 2022 |
| Services |
| Services |
| Services |
| Other |
| Totals | |||||
Revenues | $ | | $ | | $ | | $ | — | $ | | |||||
Cost of revenues |
| |
| |
| |
| — |
| | |||||
Gross profit |
| |
| |
| |
| — |
| | |||||
Selling, general and administrative expenses |
| | | | |
| | ||||||||
Impairment losses | | — | — | — | | ||||||||||
Income (loss) from operations |
| | | | ( | | |||||||||
Other income, net |
| |
| — |
| — |
| |
| | |||||
Income (loss) before income taxes | $ | | $ | | $ | | $ | ( |
| | |||||
Income tax expense |
| | |||||||||||||
Net income | $ | | |||||||||||||
Amortization of intangibles | $ | | $ | | $ | — | $ | — | $ | | |||||
Depreciation | | | | | | ||||||||||
Property, plant and equipment additions | | | | | | ||||||||||
Current assets | $ | | $ | | $ | | $ | | $ | | |||||
Current liabilities | | | | | | ||||||||||
Goodwill | | | | — | | ||||||||||
Total assets | | | | | | ||||||||||
NOTE 18 – SUPPLEMENTAL FINANCIAL STATEMENT INFORMATION
Balance Sheet
Other current assets consisted of the following at January 31, 2024 and 2023:
2024 |
| 2023 | ||||
Income tax refunds receivable and prepaid income taxes | $ | | $ | | ||
Raw materials inventory | | | ||||
Prepaid expenses |
| |
| | ||
Other | | | ||||
Total other current assets | $ | | $ | | ||
Inventories consist of raw materials held for use in the ordinary course of business and is valued at the lower of cost or net realizable value.
Accrued expenses consisted of the following at January 31, 2024 and 2023:
2024 |
| 2023 | ||||
Accrued project costs | $ | | $ | | ||
Accrued compensation | | | ||||
Lease liabilities | | | ||||
Other | | | ||||
Total accrued expenses | $ | | $ | | ||
Other Loss
On March 7, 2023, the Company determined that it had been a victim of a complex criminal scheme, which resulted in fraudulently-induced outbound wire transfers to a third-party account. The Company retained specialized legal counsel and a cybersecurity services firm to assist in an independent forensic investigation of the incident and the efforts to recover the funds. The total amount of the fraud loss and the professional fees, net with funds recovered, of approximately $
- 85 -
NOTE 19 – SUBSEQUENT EVENTS
Subsequent to January 31, 2024, the Company continued to repurchase shares of its common stock pursuant to the Share Repurchase Plan. As of April 11, 2024, the date of the last subsequent transaction, the Company had repurchased
On April 10, 2024, the Company’s Board of Directors declared a regular quarterly cash dividend in the amount of $
- 86 -