UNITED STATES
SECURITIES AND EXCHANGE COMMISSION
Washington, D.C. 20549
FORM 10-K
| ANNUAL REPORT PURSUANT TO SECTION 13 OR 15(d) OF THE SECURITIES EXCHANGE ACT OF 1934 | |||||
For the fiscal year ended December 31 , 2023
OR
TRANSITION REPORT PURSUANT TO SECTION 13 OR 15(d) OF THE SECURITIES EXCHANGE ACT OF 1934 FOR THE TRANSITION PERIOD FROM TO | |||||
Commission File Number 001-37449
(Exact name of Registrant as specified in its Charter)
| (State or other jurisdiction of incorporation or organization) | (I.R.S. Employer Identification No.) | |||||||
| (Address of principal executive offices) | (Zip Code) | |||||||
Registrant’s telephone number, including area code: (206 ) 788-4545
Securities registered pursuant to Section 12(b) of the Act:
| Title of each class | Trading Symbol | Name of each exchange on which registered | ||||||
Securities registered pursuant to Section 12(g) of the Act: None
Indicate by check mark if the registrant is a well-known seasoned issuer, as defined in Rule 405 of the Securities Act. Yes ☒ No ☐
Indicate by check mark if the registrant is not required to file reports pursuant to Section 13 or 15(d) of the Act. Yes ☐ No ☒
Indicate by check mark whether the registrant: (1) has filed all reports required to be filed by Section 13 or 15(d) of the Securities Exchange Act of 1934 during the preceding 12 months (or for such shorter period that the registrant was required to file such reports), and (2) has been subject to such filing requirements for the past 90 days. Yes ☒ No ☐
Indicate by check mark whether the registrant has submitted electronically every Interactive Data File required to be submitted pursuant to Rule 405 of Regulation S-T (§232.405 of this chapter) during the preceding 12 months (or for such shorter period that the registrant was required to submit such files). Yes ☒ No ☐
Indicate by check mark whether the registrant is a large accelerated filer, an accelerated filer, a non-accelerated filer, smaller reporting company, or an emerging growth company. See the definitions of “large accelerated filer,” “accelerated filer,” “smaller reporting company,” and “emerging growth company” in Rule 12b-2 of the Exchange Act.
| Large Accelerated Filer | ☐ | Accelerated Filer | ☐ | |||||||||||||||||
☒ | Smaller Reporting Company | |||||||||||||||||||
| Emerging Growth Company | ||||||||||||||||||||
If an emerging growth company, indicate by check mark if the registrant has elected not to use the extended transition period for complying with any new or revised financial accounting standards provided pursuant to Section 13(a) of the Exchange Act. ☐
Indicate by check mark whether the registrant has filed a report on and attestation to its management’s assessment of the effectiveness of its internal control over financial reporting under Section 404(b) of the Sarbanes-Oxley Act (15 U.S.C. 7262(b)) by the registered public accounting firm that prepared or issued its audit report.☐
If securities are registered pursuant to Section 12(b) of the Act, indicate by check mark whether the financial statements of the registrant included in the filing reflect the correction of an error to previously issued financial statements. ☐
Indicate by check mark whether any of those error corrections are restatements that required a recovery analysis of incentive-based compensation received by any of the registrant’s executive officers during the relevant recovery period pursuant to §240.10D-1(b). ☐
Indicate by check mark whether the registrant is a shell company (as defined in Rule 12b-2 of the Exchange Act). Yes ☐ No ☒
The aggregate market value of the voting and non-voting common equity held by non-affiliates of the registrant, based on the closing price of the shares of common stock on the Nasdaq Stock Market on June 30, 2023, was approximately $349.1 million. Shares of common stock held by each executive officer and director and by each other person who may be deemed to be an affiliate of the registrant, have been excluded from this computation. The determination of affiliate status for this purpose is not necessarily a conclusive determination for other purposes.
The number of shares of the registrant’s common stock outstanding as of March 7, 2024 was 65,546,136 .
DOCUMENTS INCORPORATED BY REFERENCE
Table of Contents
| Page | ||||||||
In this report, unless otherwise stated or as the context otherwise requires, references to “Alpine,” “the Company,” “we,” “us,” “our” and similar references refer to Alpine Immune Sciences, Inc. and its subsidiaries. “VIGD,” “SIP” and “TIP” are registered trademarks and “DENALI,” “NEON-1,” “NEON-2,” “RAINIER,” “RUBY,” “SYNERGY” and the Company logo are trademarks of Alpine Immune Sciences, Inc. All rights reserved. This report also contains registered marks, trademarks, and trade names of other companies. All other trademarks, registered marks, and trade names appearing in this report are the property of their respective holders.
i
SUMMARY RISK FACTORS
Our business is subject to numerous risks and uncertainties, including those highlighted in the section of this report captioned “Risk Factors.” The following is a summary of the principal risks we face:
•Our approach to the discovery and development of innovative therapeutic treatments based on our technology is unproven and may not result in marketable products.
•Our therapeutic candidates are in early stages of development and may fail in development or suffer delays that materially and adversely affect their commercial viability.
•Product development involves a lengthy and expensive process with an uncertain outcome, and results of earlier preclinical and clinical trials may not be predictive of future clinical trial results.
•If we encounter delays or difficulties enrolling patients in our clinical trials and/or retention of patients in clinical trials, our clinical development activities could be delayed or otherwise adversely affected.
•We face competition from entities that have developed or may develop therapeutic candidates for our target disease indications, including companies developing novel treatments and technology platforms based on modalities and technology similar to ours.
•To date, our revenue has been primarily derived from our collaboration agreements, and our success will be dependent, in part, on our collaborators’ efforts to develop our therapeutic candidates.
•If third parties on which we depend to conduct our clinical or preclinical studies, or any future clinical trials, do not perform as expected, fail to satisfy regulatory or legal requirements, or miss expected deadlines, our development program could be delayed, which may result in materially adverse effects on our business, financial condition, results of operations, and prospects.
•We may not successfully engage in strategic transactions, including any additional collaborations we seek, which could adversely affect our ability to develop and commercialize therapeutic candidates, impact our cash position, increase our expenses, and present significant distractions to our management.
•If any of our therapeutic candidates are approved for marketing and commercialization and we are unable to develop sales, marketing and distribution capabilities on our own or enter into agreements with third parties to perform these functions on acceptable terms, we may be unable to successfully commercialize any such future products.
•We will need to raise substantial additional funds to advance development of our therapeutic candidates, and we cannot guarantee we will have sufficient funds available in the future to develop and commercialize our current or future therapeutic candidates.
•We are an early-stage biopharmaceutical company with a history of losses, we expect to continue to incur significant losses for the foreseeable future, we may never achieve or maintain profitability, and we have a limited operating history that may make it difficult for investors to evaluate the potential success of our business.
•Our computer systems, or those of any of our contract research organizations, manufacturers, other contractors or consultants or potential future collaborators, may fail or suffer security or data privacy breaches or incidents or other unauthorized or improper access to, use of, or destruction of our proprietary or confidential data, employee data, or personal data, which could result in additional costs, loss of revenue, significant liabilities, harm to our brand and material disruption of our operations.
•If we are not able to obtain and enforce patent protection for our technology, including therapeutic candidates, therapeutic products, and platform technology, development of our therapeutic candidates and platform, and commercialization of our therapeutic products may be materially and adversely affected.
•We may license patent rights from third-party owners or licensors. If such owners or licensors do not properly or successfully obtain, maintain or enforce the patents underlying such licenses, or if they retain or license to others any competing rights, our competitive position and business prospects may be materially and adversely affected.
•We or our licensors, collaborators, or any future strategic partners may become subject to third-party claims or litigation alleging infringement of patents or other proprietary rights or seeking to invalidate patents or other proprietary rights, and we may need to resort to litigation to protect or enforce our patents or other proprietary rights, all of which could be costly, time consuming, delay or prevent the development of our therapeutic candidates and commercialization of our therapeutic products, or put our patents and other proprietary rights at risk.
1
•If we fail to comply with our obligations under any license, collaboration, or other agreements, we may be required to pay damages and could lose intellectual property rights necessary for developing and protecting our technology, including our platform technology, therapeutic candidates, and therapeutic products, or we could lose certain rights to grant sublicenses, either of which could have a material adverse effect on our results of operations and business prospects.
•We may be unable to obtain U.S. or foreign regulatory approval and, as a result, may be unable to commercialize our therapeutic candidates.
•The healthcare industry is heavily regulated in the U.S. at the federal, state, and local levels and in other jurisdictions in which we may conduct trials or other activities, and our failure to comply with applicable requirements may subject us to penalties and negatively affect our financial condition.
•Our stock price may be volatile, and an active, liquid, and orderly trading market may not be maintained for our common stock. As a result, stockholders may not be able to resell shares at or above their purchase price.
•Our officers and directors, and their respective affiliates, have significant influence over our business affairs and may make business decisions with which stockholders disagree and which may adversely affect the value of their investment.
Our Risk Factors are not guarantees that no such conditions exist as of the date of this report and should not be interpreted as an affirmative statement that such risks or conditions have not materialized, in whole or in part.
2
Forward-Looking Statements
This Annual Report on Form 10-K contains forward-looking statements and information within the meaning of Section 27A of the Securities Act of 1933, as amended, and Section 21E of the Securities Exchange Act of 1934, as amended, which are subject to the “safe harbor” created by those sections. Forward-looking statements may be identified by words such as “believe,” “may,” “will,” “seek,” “estimate,” “continue,” “anticipate,” “intend,” “could,” “would,” “project,” “plan,” “expect,” or similar expressions, or the negative or plural of these words or expressions. You should read these statements carefully because they discuss future expectations, contain projections of future results of operations or financial condition, or state other “forward-looking” information. These statements relate to our future plans, objectives, expectations, intentions and financial performance and the assumptions that underlie these statements. These forward-looking statements include, but are not limited to:
•our ability to identify, develop and commercialize additional products or product candidates;
•our estimates regarding our expenses, revenues, anticipated capital requirements and our needs for additional financing;
•our ability to obtain funding for our operations;
•the implementation of our business model and strategic plans for our business and technology;
•the timing of the commencement, progress and receipt of data from any of our preclinical and clinical trials;
•the expected results of any preclinical or clinical trial and the impact on the likelihood or timing of any regulatory approval;
•our ability to gain regulatory approval and advance povetacicept directly into a pivotal trial in IgAN in the second half of 2024;
•the scope of protection we are able to establish and maintain for intellectual property rights covering our technology and product candidates;
•the anticipated impact of pandemics and other health epidemics on our business, research and clinical development plans and timelines and results of operations;
•the timing or likelihood of regulatory filings and approvals;
•the therapeutic benefits, effectiveness and safety of our product candidates;
•the rate and degree of market acceptance and clinical utility of any future products;
•our ability to maintain and establish collaborations;
•our ability to achieve milestones in our current and any future collaborations;
•our expectations regarding market risk, including interest rate changes and general macroeconomic conditions;
•our expectations regarding the sufficiency of our cash, cash equivalents, and investments to fund operations for at least the next 12 months;
•developments relating to our competitors and our industry; and
•our expectations regarding licensing, acquisitions and strategic operations.
These forward-looking statements are subject to certain risks and uncertainties that could cause actual results to differ materially from those anticipated in the forward-looking statements. Factors that might cause such a difference include, but are not limited to, those discussed in this report in Part I, Item 1A. Risk Factors, and elsewhere in this report. Forward-looking statements are based on our management’s beliefs and assumptions and on information currently available to our management. These statements, like all statements in this report, speak only as of their date, and we undertake no obligation to update or revise any forward-looking statements in light of future developments, except as required by law.
In addition, statements that include “we believe” and similar statements reflect our beliefs and opinions on the relevant subject. These statements are based upon information available to us as of the date of this report, and while we believe such information forms a reasonable basis for such statements, such information may be limited or incomplete, and our
3
statements should not be read to indicate that we have conducted an exhaustive inquiry into, or review of, all potentially available relevant information. These statements are inherently uncertain and investors are cautioned not to unduly rely upon these statements.
4
PART I
Item 1. Business
Overview
We are a clinical-stage biopharmaceutical company dedicated to discovering and developing innovative, protein-based immunotherapies to treat autoimmune and inflammatory diseases. Our approach includes a proprietary scientific platform that converts native immune system proteins into differentiated, multi-targeted therapeutics. We are seeking to create first- or best-in-class multifunctional immunotherapies via our unique protein engineering technologies to improve outcomes in patients with serious diseases.
Autoimmune and Inflammatory Diseases
ALPN-303, or povetacicept, is a dual antagonist of the B cell activating factor, or BAFF, and a proliferation inducing ligand, or APRIL, cytokines, which play key roles in the pathogenesis of multiple autoimmune diseases via their contribution to the activation, differentiation and/or survival of B cells, particularly antibody-secreting cells, as well as T cells and innate immune cells. Based upon an engineered transmembrane activator and CAML interactor, or TACI, domain, povetacicept has exhibited greater potency in preclinical studies versus wild-type TACI-based comparators, as well as other inhibitors of BAFF and/or APRIL alone and B cell depletion. In addition, povetacicept has been well-tolerated in preclinical models and exhibited superior pharmacokinetics and pharmacodynamics over wild-type TACI-Fc counterparts, including superior serum exposure, suppression of T-dependent antibody production, and/or serum immunoglobulins in mice and/or cynomolgus monkeys. In a randomized, placebo-controlled, first-in-human, Phase 1 study in adult healthy volunteers (NCT05034484), povetacicept was well tolerated at doses up to 960 mg, with dose dependent pharmacokinetics and reductions in circulating immunoglobulins and antibody-secreting cells, which we believe supports the use of a convenient once every four-weeks dose regimen for subsequent studies and enables a broad development plan across multiple autoimmune diseases, including IgA nephropathy, or IgAN, and other autoimmune kidney diseases, systemic lupus erythematosus, or SLE, and autoimmune cytopenias.
We believe povetacicept has the potential to become a development pipeline within a single product candidate, with significant market opportunity across multiple therapeutic areas including, but not limited to, nephrology, connective tissue diseases, such as lupus, hematology, neurology, and dermatology. Based on our encouraging clinical and nonclinical data, we have initiated a broad development plan with multiple clinical studies, including RUBY-3, an open-label, dose-ranging basket study in autoimmune glomerulonephritis including IgAN, lupus nephritis, and primary membranous nephropathy; and RUBY-4, an open-label basket study in autoimmune cytopenias including immune thrombocytopenia, warm autoimmune hemolytic anemia, and cold agglutinin disease. Each of the indications in these basket studies has strong scientific rationale for povetacicept based on the importance of specific autoantibodies in disease pathogenesis, as well as high medical need.
Initial clinical data from RUBY-3 presented in a late-breaking poster session at the American Society of Nephrology, or ASN, Kidney Week 2023 demonstrate that low-dose povetacicept at 80 mg administered once every four-weeks has been well tolerated and in IgAN demonstrates highly encouraging improvements in urine protein-creatinine ratio, or UPCR, and disease biomarkers, with early evidence suggesting potential for disease remission, as defined as UPCR < 0.5 g/g, and ≥ 50% reduction in UPCR from baseline with stable renal function (≤ 25% reduction in estimated glomerular filtration rate, or eGFR, from baseline). Based on these data, we intend to engage with the Food and Drug Administration, or FDA, to seek to begin RAINIER, a pivotal phase 3 IgAN study in the second half of 2024. In addition, we plan to initiate DENALI, a phase 2 study of povetacicept in SLE. We anticipate initial RUBY-3 data from our 240 mg cohort (administered once every four-weeks) and longer-term follow-up data from our 80 mg cohort in the first half of 2024.
ALPN-101, or acazicolcept, is a dual Inducible T cell Costimulator, or ICOS, and CD28 antagonist intended for the treatment of autoimmune and inflammatory diseases. Preclinical studies with acazicolcept have demonstrated efficacy in models of SLE, Sjögren’s syndrome, or SjS, arthritis, inflammatory bowel disease, or IBD, multiple sclerosis, or MS, type 1 diabetes, uveitis, and graft versus host disease, or GVHD. We have evaluated acazicolcept in a Phase 1 healthy volunteer study and are currently evaluating acazicolcept in Synergy, a global, randomized, double-blind, placebo-controlled Phase 2 study of acazicolcept in adults with moderate-to-severe SLE. In June 2020, we entered into an option and license agreement, or, as amended, the AbbVie Agreement, with AbbVie Ireland Unlimited Company, or AbbVie, which grants AbbVie an exclusive option to take an exclusive license to acazicolcept. Through December 31, 2023, we have received $105.0 million in upfront and pre-option exercise development milestones as part of the AbbVie Agreement. In December 2023, we and AbbVie amended the AbbVie Agreement, or the AbbVie Amendment, to stop enrollment in the Synergy study to allow for an early assessment of the study’s clinical trial data. In connection with the AbbVie Amendment, the fee to license acazicolcept was reduced to $10.0 million, and other potential payments under the AbbVie Agreement related to future development, commercial
5
and sales-based milestones, as well as sales-based royalties were reduced by 25%. The final analysis, after the last patient enrolled in Synergy completes their study protocol, is expected to occur by the end of 2024. AbbVie retains an exclusive option to obtain an exclusive worldwide license to acazicolcept which is exercisable by AbbVie at any time and will expire 90 days from delivery of an agreed upon data package by Alpine to AbbVie. For additional information regarding the AbbVie Agreement, please refer to the section of this report titled “Business — Partnerships.”
In December 2021, we entered into an exclusive license and collaboration agreement with Horizon Therapeutics Ireland DAC, (acquired by Amgen Inc., or Amgen, in October 2023), or the Amgen Agreement, which grants Amgen an exclusive license for the development, manufacture and commercialization of one of our existing preclinical biologic therapeutic programs, or the Existing Program, and up to three additional autoimmune and inflammatory disease programs for other designated biological targets, or the Research Programs, generated from our libraries of proteins and molecules for research, discovery and identification of additional compounds. As of December 31, 2023, we have completed our activities under the Existing Program. We continue to support activities related to the First Research Program. In January 2024, we received a termination notification from Amgen for the non-exclusive license to use the Second Research Program. A Third Research Program was not selected by the respective option deadline. Under the terms of the Amgen Agreement, Amgen made an upfront payment to us of $25.0 million as well as an equity investment for which they paid $15.0 million, a 25% premium to the 30-day volume-weighted average share price as of December 9, 2021. In addition, we are eligible to receive up to $381.0 million per program, or a total of approximately $762.0 million for the remaining programs, in future success-based payments related to development, regulatory and commercial milestones as well as tiered royalties on global net sales.
Scientific Platform
Our scientific platform has also generated immune modulatory proteins with the potential of improving engineered cell therapies such as chimeric antigen receptor T cells, T cell receptor-engineered T cells, and tumor infiltrating lymphocytes. In May 2019, we signed a collaboration and license agreement with Adaptimmune Therapeutics plc, or Adaptimmune, to develop next-generation SPEAR™ T cell products which incorporate our secreted and transmembrane immunomodulatory protein (termed SIP and TIP) technologies. We intend to continue to leverage our existing pipeline and platform for internal development opportunities and to actively explore and evaluate potential value-creating partnering opportunities.
Our Strategy
Our goal is to discover and develop modern therapies to treat patients with serious autoimmune and inflammatory diseases. To achieve our goals, we intend to:
•aggressively continue to advance our lead wholly-owned program, povetacicept, in clinical studies for the treatment of multiple B cell and/or autoantibody-related diseases;
•complete our obligations under the amended AbbVie Agreement for acazicolcept, including the delivery of an agreed upon data package to AbbVie.; and
•maximize the value of our pipeline and platform through creation of internal development opportunities and evaluation of potential partnering activities.
6
Product Pipeline
Our wholly-owned pipeline is focused on advancing povetacicept into multiple therapeutic areas, as shown in Figure 1 below.
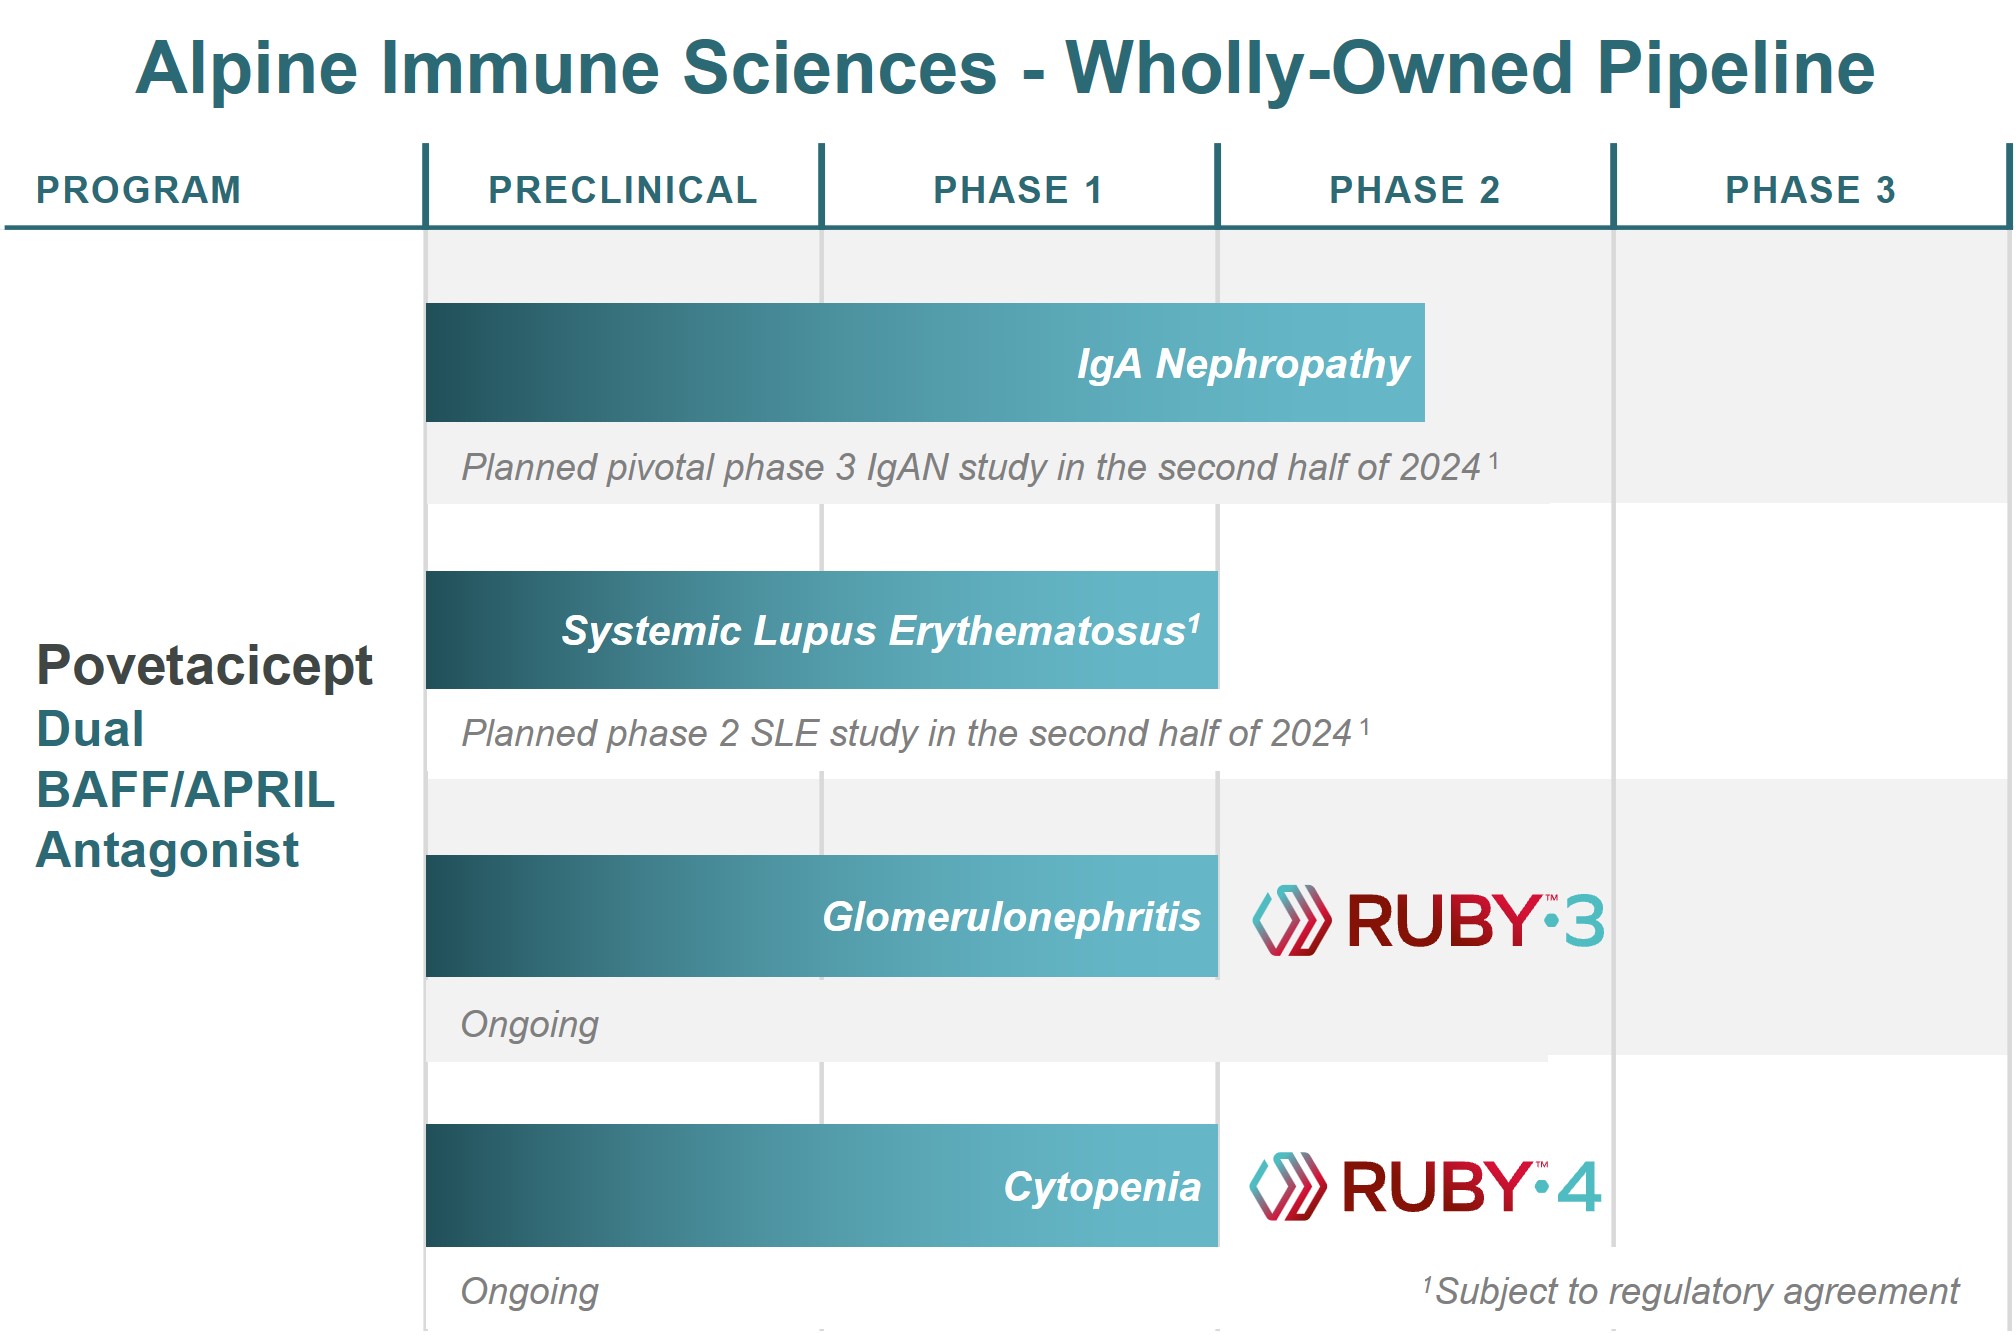
Figure 1
Our Scientific Platform
The human immune system is a complex network of biological processes and structures evolved to protect humans from external infections and harmful changes of internal cells. Within the immune system, proteins play a key role in a variety of essential functions, including recognition of foreign and self-antigens, cell adhesion and trafficking, and modulation of cellular activity through costimulatory or inhibitory signaling. Our scientific platform seeks to develop novel therapeutics by engineering native, or so-called “wild-type,” proteins with unique properties that may benefit patients with autoimmune and inflammatory diseases. We have focused our efforts to-date on two major protein superfamilies that play critical roles in the regulation of immune cell signaling and activity: the immunoglobulin superfamily, or IgSF, and the tumor necrosis factor (receptor) superfamily, or TNFSF/TNFRSF.
The IgSF is the largest family of adhesion, costimulatory (activating), and inhibitory (blocking) proteins found on the surface of immunological, neurological, and other human cell types. These cell surface and soluble molecules are broadly involved with recognition of antigens, assisting in the formation of the immune synapse, and performing costimulatory, coinhibitory, and cytokine receptor signaling functions. This family includes many well-known targets, such as those seen in
7
Figure 2. We believe the IgSF protein family members may be particularly valuable because many IgSF proteins naturally bind multiple binding partners, also referred to as “counterstructures.” Acazicolcept is derived from ICOS-L, a member of the IgSF.

Figure 2
TNFSF/TNFRSF proteins are expressed broadly in the immune system and play a critical role in immune cell signaling and proliferation. TNFSF/TNFRSF members are composed of 48 unique proteins that are structurally similar and are characterized by their ability to bind to trimeric family members (Figure 3). Members of the TNFSF/TNFRSF include many clinically relevant targets with applications in many autoimmune diseases (e.g., CD40, TACI, BCMA, 4-1BB, TNFα). Povetacicept is derived from TACI, a member of the TNFSF/TNFRSF.
The TNF Superfamily
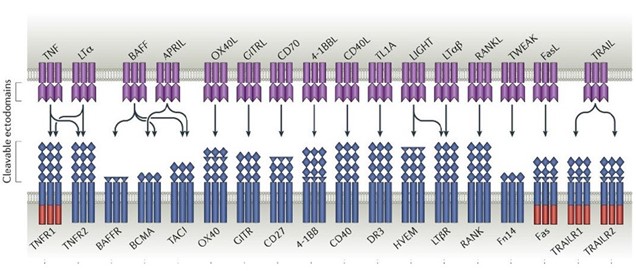
Figure 3
Our scientists create engineered proteins from IgSF members (variant immunoglobulin domains, or vIgDs) and TNFSF/TNFRSF members (variant TNF domains, or vTDs). We use directed evolution, which is an iterative scientific engineering process purposefully conducted to modify an IgSF or TNFSF/TNFRSF protein for a desired therapeutic function.
8
Figure 4 illustrates the process of directed evolution in our scientific platform. Our scientists utilize yeast display protein library strategies to identify variants of wild-type proteins with desired binding characteristics. We start with a wild-type IgSF or TNFSF/TNFRSF protein and then enter a cycle of library generation and yeast display. Flow cytometry or other methods are used to select specific clones displaying variants with desired binding characteristics. Biologic and biophysical assays of purified proteins assess biological function and manufacturing characteristics. The end product is an optimized vIgD or vTD. Additional cycles can be carried out by building next generation libraries from the output of prior libraries to result in further optimization.
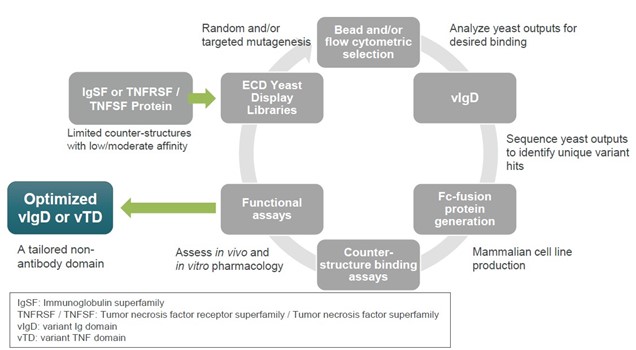
Figure 4
Our scientific platform is generally able to improve upon native IgSF or TNFSF/TNFRSF activity regardless of whether natural binding affinity is weak or strong. When starting affinity is very weak, techniques employed by our scientists have accomplished several thousand-fold increases in binding affinity with sometimes as few as two library generation cycles. Even when starting affinity is very high, our scientific platform can still improve binding affinities. The same general strategy can be used when the desired therapeutic profile requires reduced affinity compared to the wild-type protein. We have applied our scientific platform to several IgSF and TNFSF/TNFRSF protein targets.
9
We believe our vIgDs and vTDs are highly flexible. In many cases, a single affinity-maturation campaign can result in multiple domains suitable for use in the formats such as those illustrated in Figure 5 and further described below.

Figure 5
vIgD-Fc or vTD-Fc
A vIgD- or vTD-Fc fusion protein is the simplest format. Acazicolcept and povetacicept are examples of vIgD-Fc and vTD-Fc formats, respectively. The engineered vIgD or vTD protein is fused to an Fc backbone. Combining vIgDs or vTDs with antibody Fc domains to make Fc fusion proteins potentially allows for better expression, facilitates purification, and improves pharmacokinetic (dosing) properties. Fc fusion proteins are a standard format in the industry, with examples such as etanercept, abatacept, and belatacept. A vIgD- or vTD-Fc could potentially be administered intravenously, subcutaneously, topically, or via other methods of delivery.
Cell Therapy Enhancement
Our scientific platform has also generated immune modulatory proteins with the potential of improving engineered cellular therapies, such as CAR-Ts, TCR-Ts, or TILs.
10
Povetacicept, a Dual B Cell Cytokine Antagonist for B Cell-Mediated Autoimmune and Inflammatory Diseases
Overview
Povetacicept is an Fc fusion of an engineered variant TACI domain, structurally distinct from wild-type TACI-Ig and designed to more potently inhibit the pleiotropic cytokines B cell activating factor, or BAFF, BLyS, and a proliferation inducing ligand, or APRIL (Figure 6). Developed internally using our proprietary directed evolution platform, we have been issued composition of matter intellectual property that covers povetacicept through at least 2041.
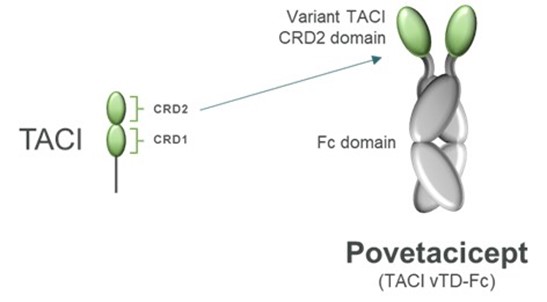
Figure 6
BAFF and APRIL play complementary and partially overlapping roles in B cell development, activation, and survival. Early in B cell development, BAFF plays a dominant role related to BAFF-R expression, while later stages of B cell development are APRIL and/or BAFF-dependent, related to TACI and BCMA expression (Figure 7). Importantly, plasmablasts and plasma cells, which are a dominant source of the pathogenic autoantibodies in lupus and other related diseases, retain responsiveness to APRIL and BAFF. Co-neutralization of APRIL and BAFF dramatically reduces B cell survival and function, including antibody production, whereas inhibition of either BAFF or APRIL alone mediates only modest effects. Povetacicept, with enhanced inhibitory activity against BAFF & APRIL, could further improve clinical outcomes in B cell mediated autoimmune and inflammatory diseases.
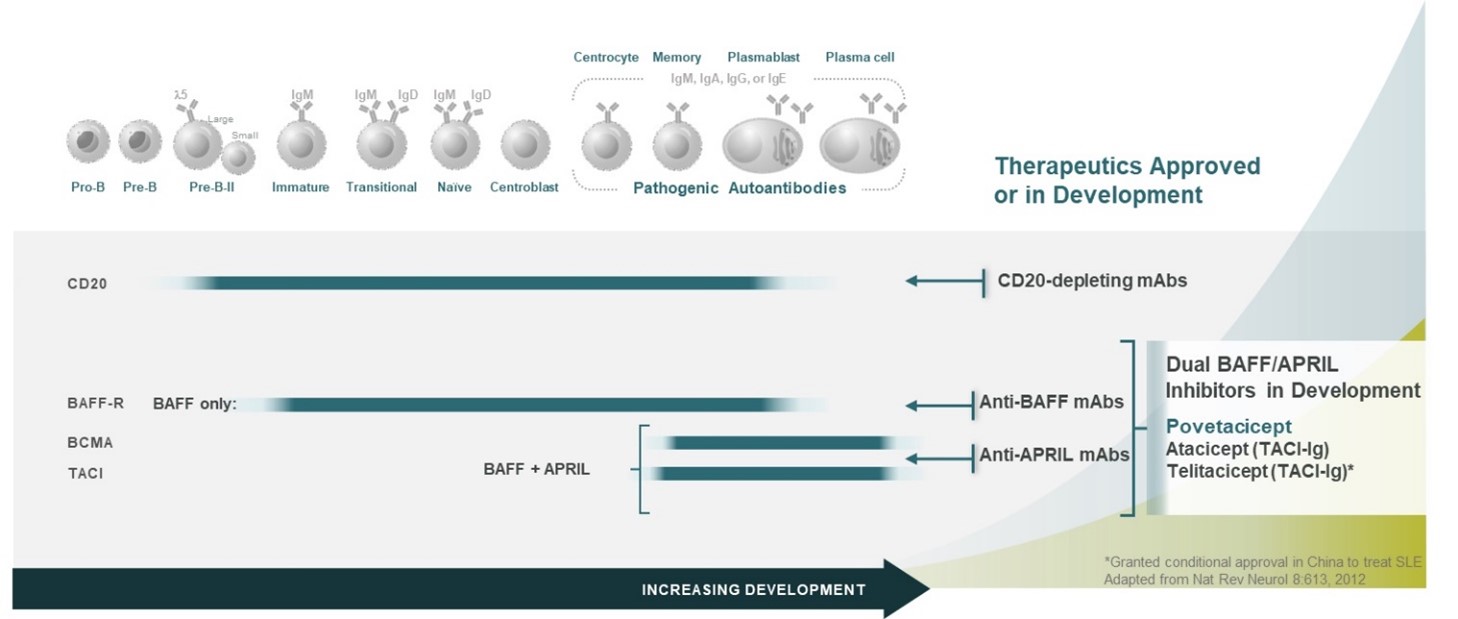
Figure 7
Povetacicept Nonclinical Development
The engineering of the active domain used in povetacicept was focused on increasing the affinity of wild-type TACI against both BAFF and APRIL, with APRIL of particular interest. Data we published in the peer-reviewed journal Arthritis & Rheumatology demonstrated that relative to wild-type TACI, povetacicept had improved affinity against BAFF eight to ten-fold, and dramatically improved affinity against APRIL suggesting that povetacicept may be the first truly dual, potent inhibitor
11
of these two cytokines (Arthritis Rheumatol. 2023 Jul;75(7):1187-1202). In Figure 8, WT TACI-Fc binds APRIL poorly by surface plasmon resonance, or SPR, with APRIL binding significantly improved by povetacicept.
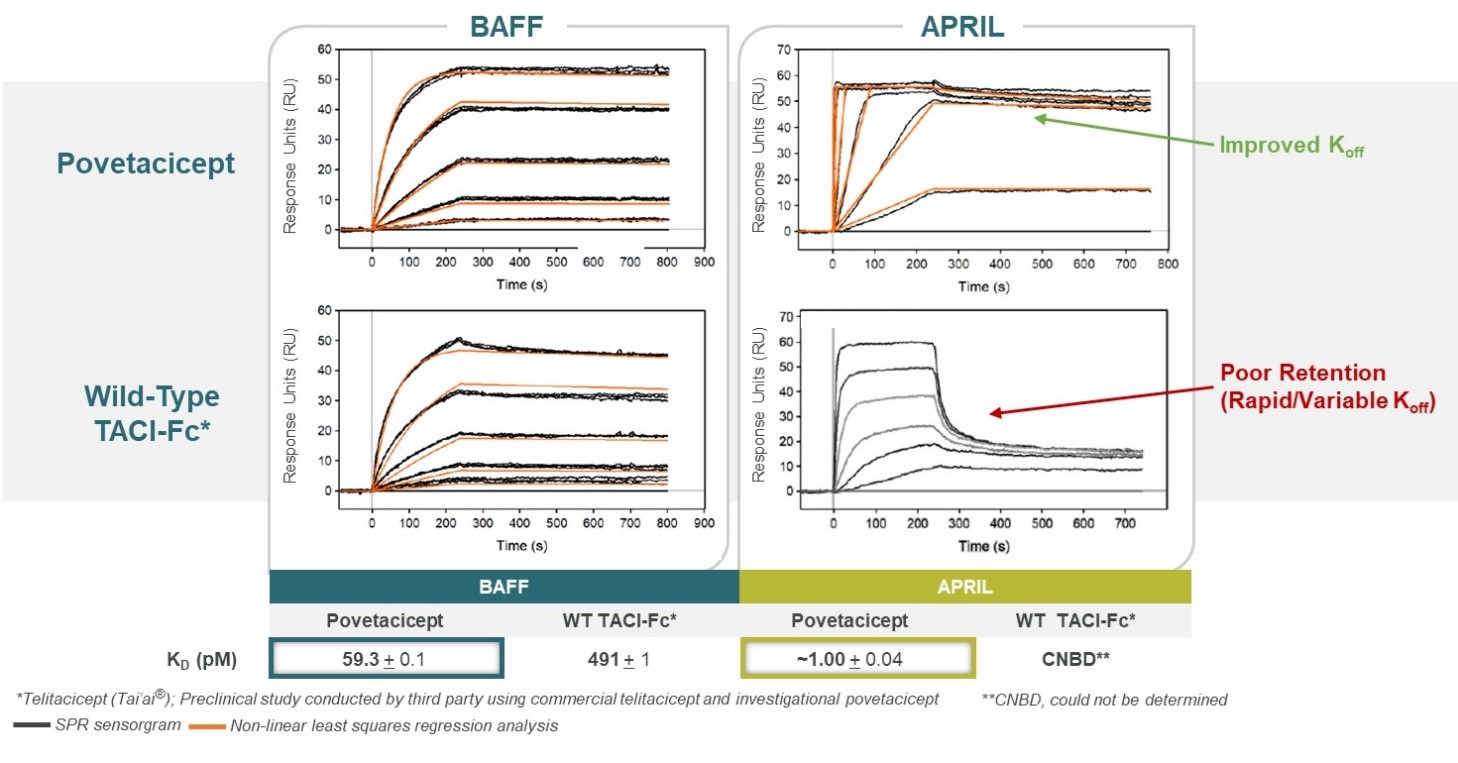
Figure 8
Povetacicept’s ability to inhibit the activity of APRIL and BAFF alone or in combination was evaluated in a TACI/Jurkat/NF-kB in vitro reporter assay, in comparison to wild-type TACI-Fc’s, belimumab, anti-APRIL mAbs, or the combination of anti-APRIL mAb plus belimumab. Based upon IC50, povetacicept more effectively inhibited APRIL activity than either of the two anti-APRIL mAbs evaluated, and inhibited BAFF activity > 3-fold more potently than belimumab (Figure 9). In addition, povetacicept most potently inhibited the combined activity of APRIL and BAFF, with a >50-fold better IC50 relative to telitacicept, and a > 3-fold better IC50 relative to the combination of anti-APRIL mAb plus belimumab.

Figure 9
The improved affinity of povetacicept for both BAFF and APRIL correlates with significantly improved efficacy in multiple preclinical models. For example, in a sheep red blood cell challenge model, povetacicept resulted in the most potent
12
reduction of antibody responses and plasma cell formation – compared to wild-type TACI, single inhibitors of BAFF or APRIL, or the combination of the two BAFF- and APRIL-specific biologics (Figure 10).

Figure 10
Povetacicept has demonstrated promising activity in a number of preclinical disease models, including murine models of lupus, glomerulonephritis, autoimmune hemolytic anemia, and myasthenia gravis. In Figure 10, dual BAFF/APRIL inhibition with povetacicept was superior in reducing renal lesions and increasing hemoglobin in a mouse model of lupus, which includes autoimmune hemolytic anemia, as compared to WT-TACI-Fc (telitacicept) or anti-CD20. In a model of murine experimental autoimmune myasthenia gravis, povetacicept was more effective in reducing clinical scores of disease as compared to treatment with a neonatal Fc receptor blocker (efgartigimod) or an anti-CD20. (Figure 11).
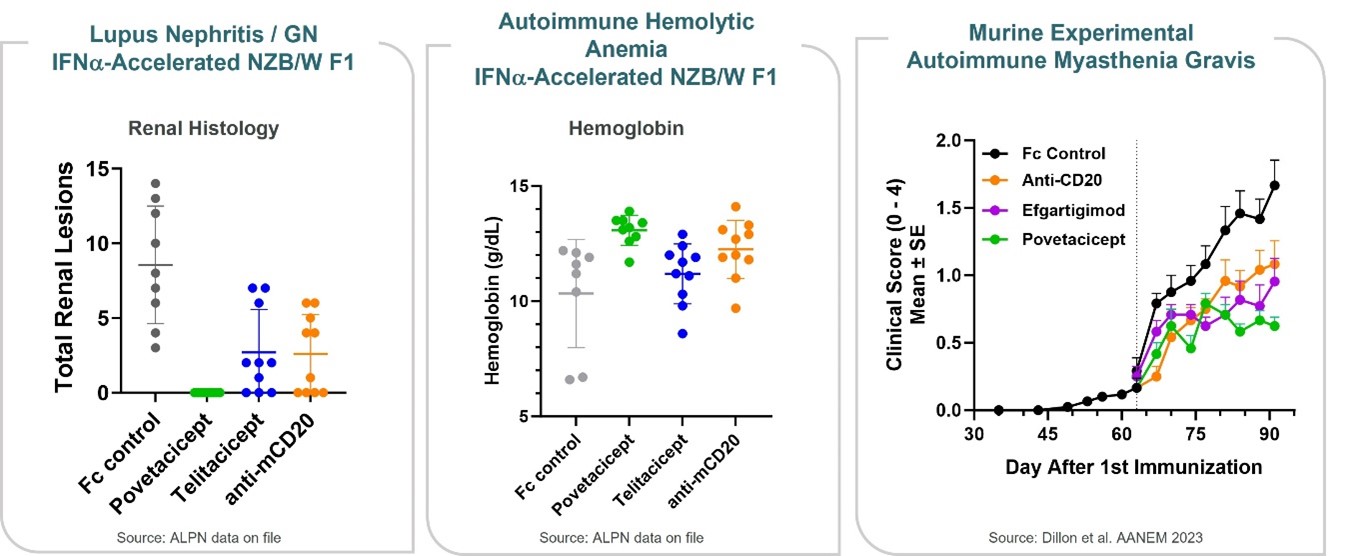
Figure 11
13
In addition to enhanced potency against BAFF and APRIL, another advantage of our vTD engineering is the potential for reduced clinical immunogenicity. In preclinical studies, povetacicept demonstrates significantly reduced immunogenicity vs. WT TACI-Ig as assessed by the incidence and titer of anti-drug antibodies -- for instance when assessed during a KLH immunization model in mice (Figure 12).
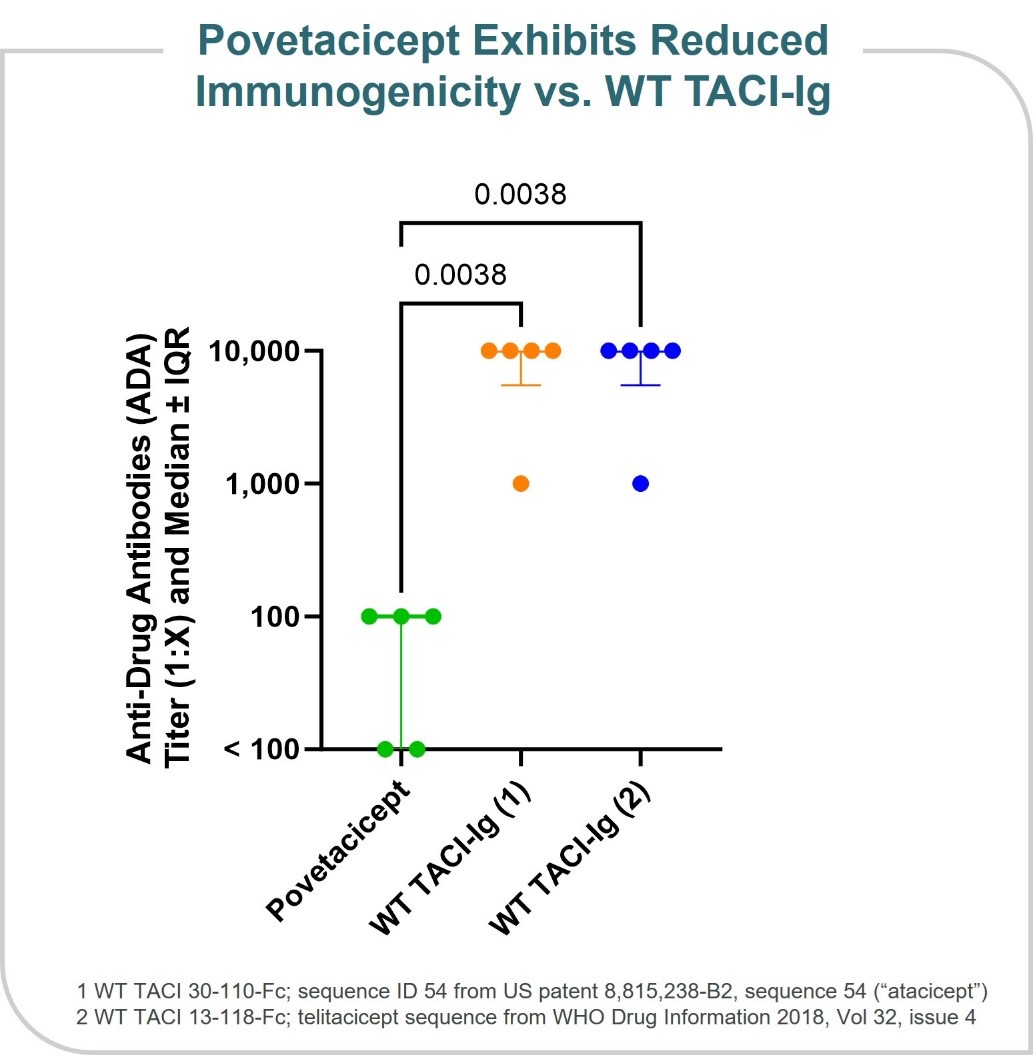
Figure 12
In cynomolgus monkeys, povetacicept exhibited pharmacokinetics and pharmacodynamics superior to wild-type TACI-Fc counterparts, including superior serum exposure and pharmacodynamic reduction of serum immunoglobulins (Figure 13). It has been well-tolerated in definitive (Good Laboratory Practice, or GLP) nonclinical toxicology studies, including up to six months in cynomolgus monkeys, without evidence of cytokine release or local intolerance. Based on these nonclinical data,
14
we believe that povetacicept represents an attractive development candidate for the treatment of multiple B cell mediated autoimmune and inflammatory diseases.
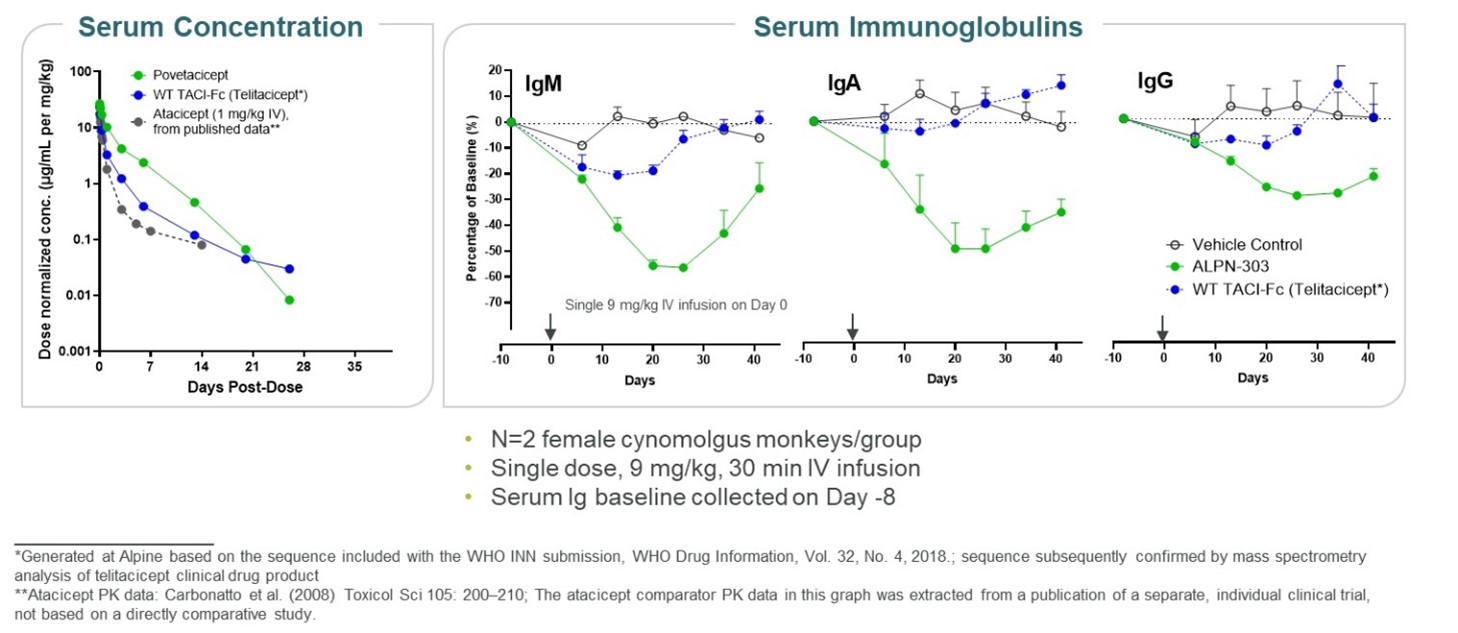
Figure 13
Summary of Povetacicept Program Preclinical Data
Our scientists and collaborators have demonstrated within in vivo preclinical studies that povetacicept:
•most potently inhibited the activity of APRIL and BAFF alone or in combination in a Jurkat/NF-kB in vitro reporter assay relative to wild-type TACI-Fc molecules and single inhibitors of BAFF or APRIL;
•showed the most potent reduction of antibody responses and plasma cell formation in a sheep red blood cell challenge model compared to wild-type TACI, single inhibitors of BAFF or APRIL, or the combination of the two BAFF- and APRIL-specific biologics;
•provided superior efficacy in preclinical translational models of murine lupus, glomerulonephritis, and autoimmune hemolytic anemia compared to wild-type TACI (telitacicept) or anti-CD20, and in a murine model of autoimmune myasthenia gravis compared to anti-CD20 and neonatal Fc receptor blocker (efgartigimod); and
•is well tolerated in definitive repeat-dose nonclinical toxicology studies, including up to 6 months in cynomolgus monkeys.
Povetacicept Clinical Development
We are currently evaluating povetacicept in our RUBY-3 and RUBY-4 studies. RUBY-3 is a multiple ascending dose, multi-cohort, open label, phase 1b/2a study of povetacicept in autoimmune glomerulonephritis, including IgA nephropathy, primary membranous nephropathy, lupus nephritis, and renal ANCA-associated vasculitis, where povetacicept is being administered subcutaneously once every four-weeks for up to 104 weeks. Key endpoints include proteinuria, eGFR, renal response, and disease-related autoantibodies. RUBY-4 is a multi-cohort, open label phase 1b/2a study of povetacicept in immune thrombocytopenia, autoimmune hemolytic anemia, and cold agglutinin disease, where povetacicept is being administered subcutaneously once every four-weeks for up to 48 weeks. Key endpoints include respective blood cell counts, including durable responses, as well as disease-related autoantibodies. We anticipate initial data from RUBY-4 during the first half of 2024.
Initial clinical data from RUBY-3 presented in a late-breaking poster session at the ASN Kidney Week 2023 demonstrate that low-dose povetacicept at 80 mg administered once every four-weeks has been well tolerated and in IgAN demonstrates highly encouraging improvements in UPCR, and disease biomarkers, with early evidence suggesting potential for disease remission, as defined as UPCR < 0.5 g/g, and ≥ 50% reduction in UPCR from baseline with stable renal function (≤ 25% reduction in eGFR from baseline). Based on these data, we intend to engage with the FDA, to seek to begin RAINIER, a pivotal phase 3 IgAN study in the second half of 2024. In addition, we plan to initiate DENALI, a phase 2 study of povetacicept in SLE also in the second half of 2024. Importantly, we plan to administer povetacicept as a convenient, once every four-week
15
subcutaneous dosing regimen for both our planned IgAN phase 3 and SLE phase 2 studies. Based on our PK/PD modeling efforts, less frequent dosing regimens may be explored in the future.
Phase 1 Study of Povetacicept in Adult Healthy Volunteers
Preliminary findings from RUBY-1, a randomized, placebo-controlled, first-in-human, Phase 1 study of povetacicept in adult healthy volunteers (NCT05034484) were presented at our inaugural R&D Day in September 2022 and at subsequent scientific conferences, including the 2023 World Congress of Nephrology, 2023 European Alliance of Associations for Rheumatology, 2023 European Renal Association Annual Meeting, 2023 European Hematology Associate Meeting, and International Symposium on IgA Nephropathy (IIgANN) 2023.
Overall, povetacicept was well tolerated as single intravenous, or IV, or subcutaneous, or SC, doses of up to 960 mg in adult healthy volunteers (Figure 14).
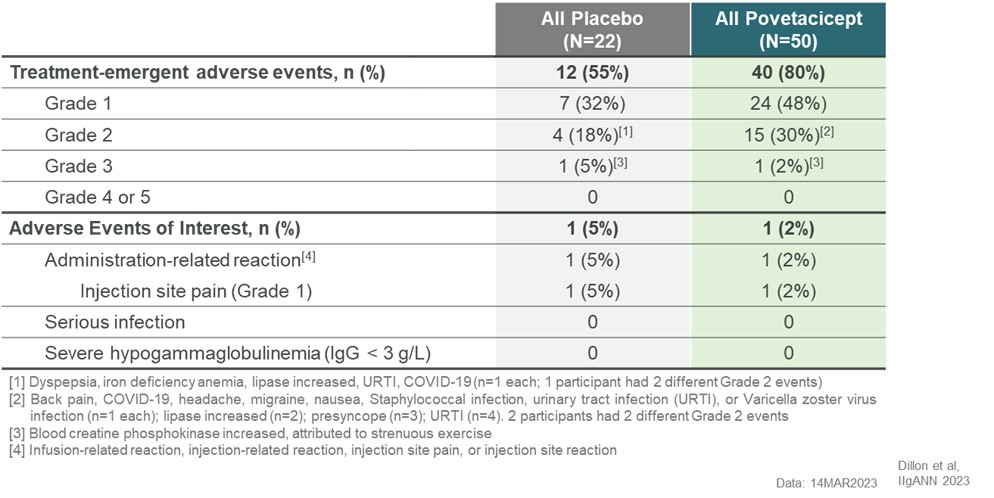
Figure 14
16
Povetacicept exhibited dose-related pharmacokinetic and on-target pharmacodynamic effects, including target coverage of free APRIL for 2-3 and ≥4 weeks with 80 and 240 mg, respectively and dose-dependent reduction in antibody-secreting cells (ASCs) (Figure 15).
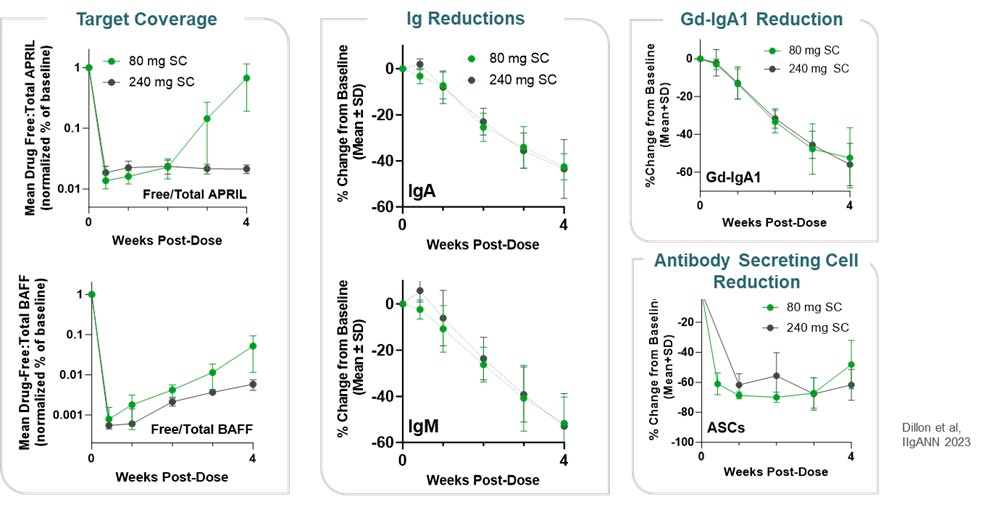
Figure 15
Development of Povetacicept in Glomerulonephritis, including IgAN
IgAN is the most common primary glomerulonephritis worldwide, with a prevalence of ~125,000 in the United States and ~265,000 in the Group of 8 Nations, or G8, according to our market research. With limited effective, disease-modifying treatment options, up to 50% of IgAN patients will progress to end-stage renal disease, or ESRD, within 10 years (Clin J Am Soc Nephrol 18(6), 727–738 (2023); Huijian et al., ASN Kidney Week (2023)), causing significant morbidity and impacts to overall healthcare system costs. Given the high rate of progression to ESRD and typical onset of disease before 40 years of age, there is an urgent need for the development of disease-modifying therapies for IgAN.
IgAN may be triggered by multiple immunogenic factors (e.g., genetic risk factors, diet, microbes) which then cause dysregulation of the immune system, excessive aberrant glycosylation of IgA1 (resulting in galactose-deficient IgA1, or Gd-IgA1), and activation of pathogenic antibody-forming B cells which produce autoantibodies against Gd-IgA1. Immune complexes subsequently form and deposit in the mesangium of the kidney, leading to inflammation, damage, and potentially kidney failure.
Role of BAFF and APRIL in IgAN and Rationale for Development of Povetacicept
B cell activating factor, or BAFF, sometimes also called BLyS, and a proliferation inducing ligand, or APRIL, are pleiotropic cytokines that play key roles in the pathogenesis of multiple autoimmune diseases via their roles in the activation, differentiation and/or survival of B cells, particularly antibody-secreting cells, as well as T cells and innate immune cells. BAFF and APRIL are elevated in many glomerulonephritis diseases, including IgAN, and inhibitors of BAFF and/or APRIL have demonstrated promising activity in IgAN. In IgAN, the survival and differentiation of pathogenic antibody-forming B cells against Gd-IgA1 is mediated by BAFF and APRIL, thought to be produced primarily by myeloid cells.
Povetacicept is an Fc fusion of an engineered variant TACI domain, structurally distinct from wild-type TACI-Ig and designed to more potently inhibit BAFF and APRIL. By blocking BAFF and APRIL, povetacicept may reduce the formation and activity of antibody-secreting cells, stopping the subsequent formation of immune complexes and downstream inflammation in the glomeruli of the kidney and thus improving outcomes for patients with IgAN (Figure 16). Through its
17
potent inhibition of BAFF and APRIL upstream in the progression of disease, we believe povetacicept has the potential to be a disease-modifying therapy in IgAN and multiple other autoimmune diseases.
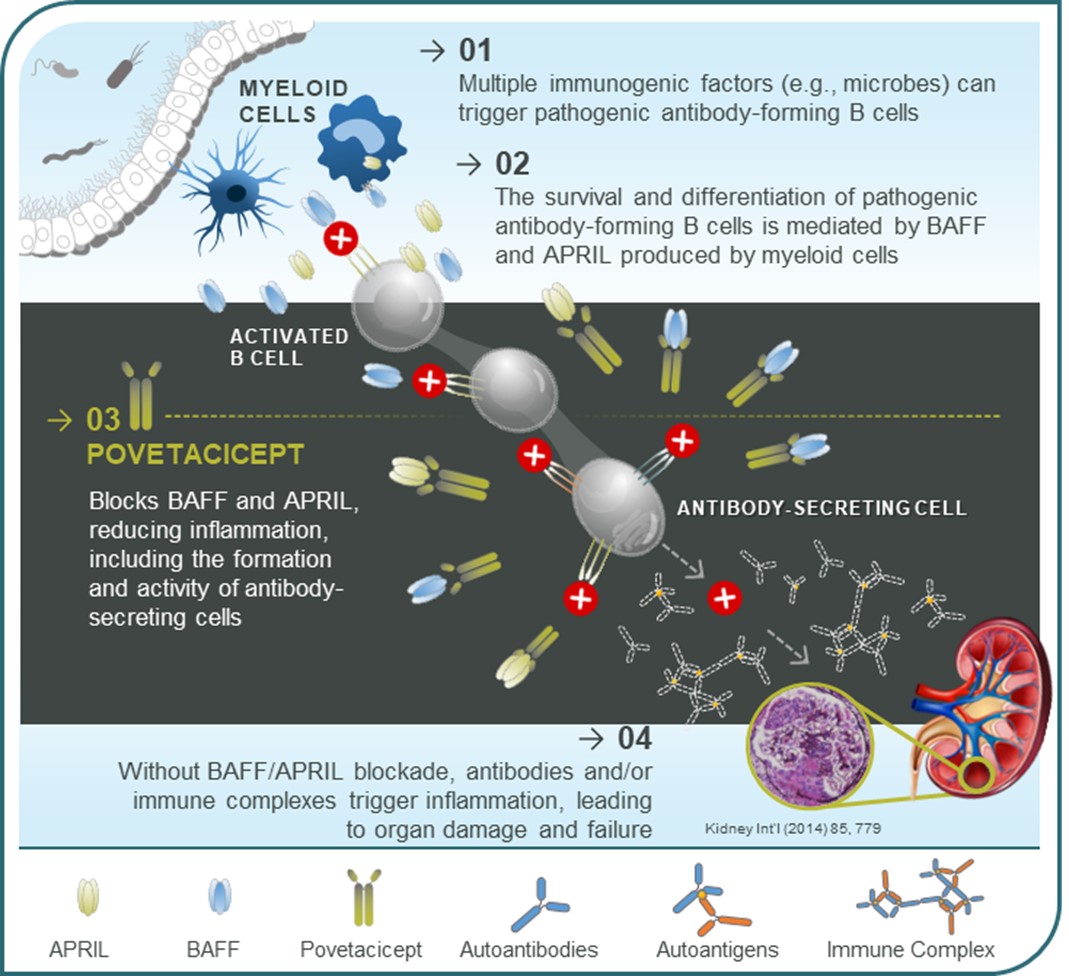
Figure 16
Phase 1b/2a Study of Povetacicept in Glomerulonephritis, including IgAN
RUBY-3, our Phase 1b/2a glomerulonephritis basket study of povetacicept dosed once every four-weeks, is designed as a multiple ascending dose, multi-cohort open label study in subjects with active IgAN, lupus nephritis, primary membranous
18
nephropathy, or renal ANCA-associated vasculitis in disease- and dose-specific cohorts for up to 104 weeks. Endpoints include changes in disease-specific autoantibodies as well as proteinuria, eGFR and various definitions of renal response (Figure 17).
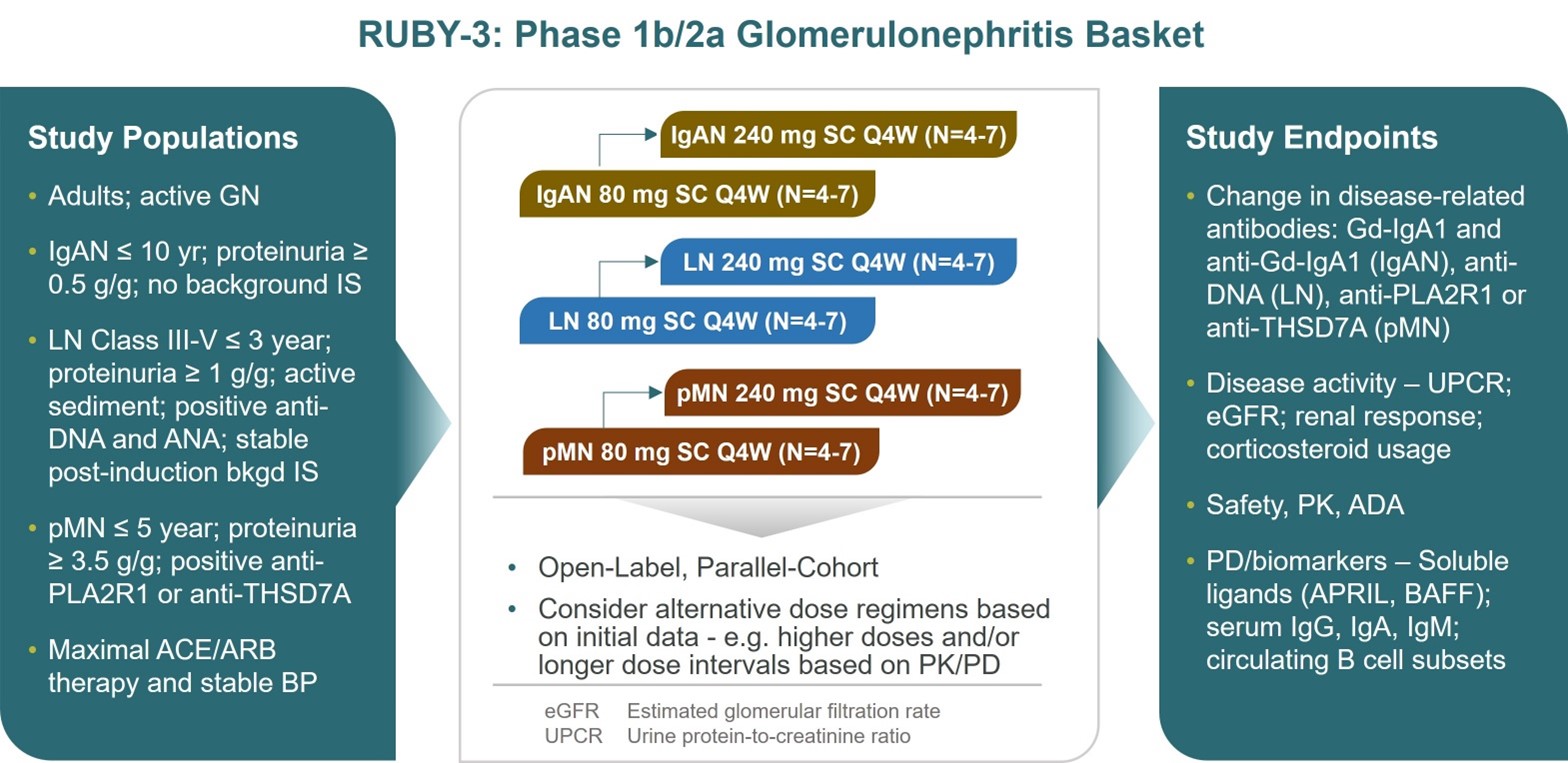
Figure 17
Clinical data in glomerulonephritis, including IgAN (RUBY-3)
Overall, multiple doses of 80 mg povetacicept administered once every four-weeks has been well tolerated through the date of this report. Of note, no injection site reactions, no severe hypogammaglobulinemia as defined as IgG of less than 3 g/L, and no severe infections have been reported through the date of this report (Figure 18).
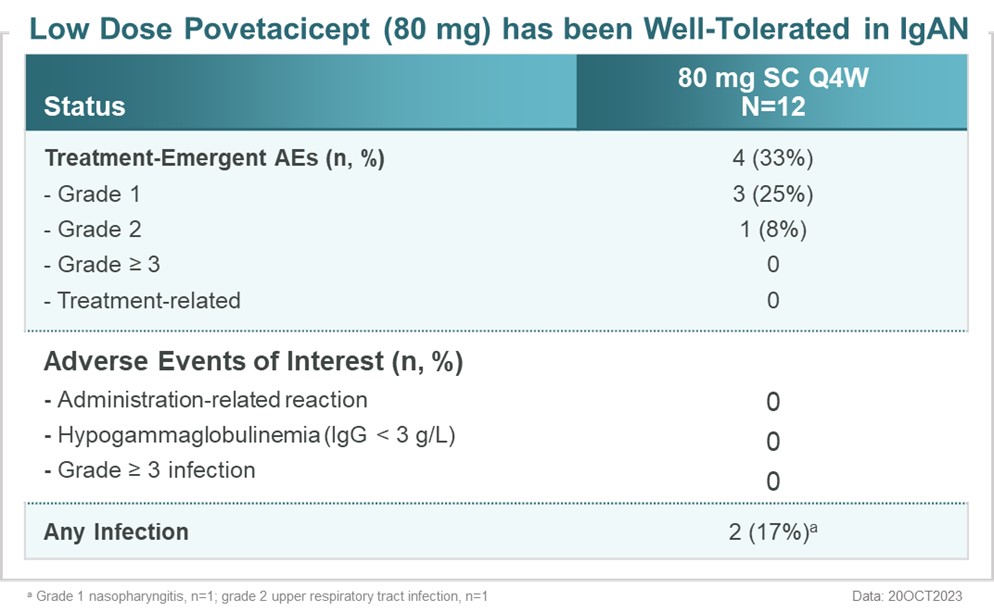
Figure 18
19
Povetacicept exhibited marked improvement in disease activity in IgAN, with a reduction in proteinuria as measured by UPCR of 53.5% by 24 weeks (Figure 19). This is a clinically meaningful reduction proteinuria, since a 30% reduction in UPCR is accepted as predictive of improvements in eGFR in this disease and deeper UPCR reductions have been shown to correlate with improved eGFR outcomes (Am J Kidney Dis 78:340 (2021); Clin J Am Soc Nephrol. 2023 Jun 1;18(6):727-738)).
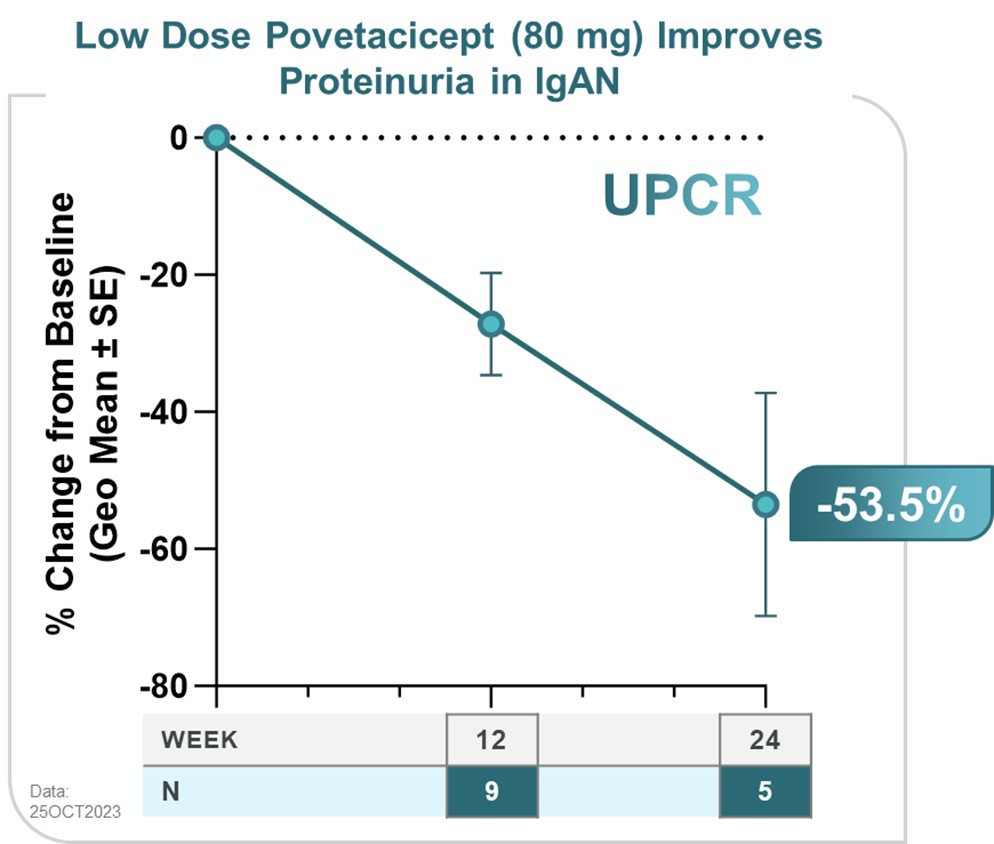
Figure 19
Importantly, these improvements in proteinuria are associated with a rapid reduction of the IgAN disease-relevant biomarker Gd-IgA1, which was reduced by over 40% within the first month and achieved greater than 60% reduction after three months. Total circulating immunoglobulins were also reduced, in a proportion similar to that observed in the phase 1 study in healthy adults.
In addition to a reduction in proteinuria, renal function, as assessed by eGFR, appeared to be stable in this cohort of IgAN patients over the first 24 weeks (Figure 20).
20
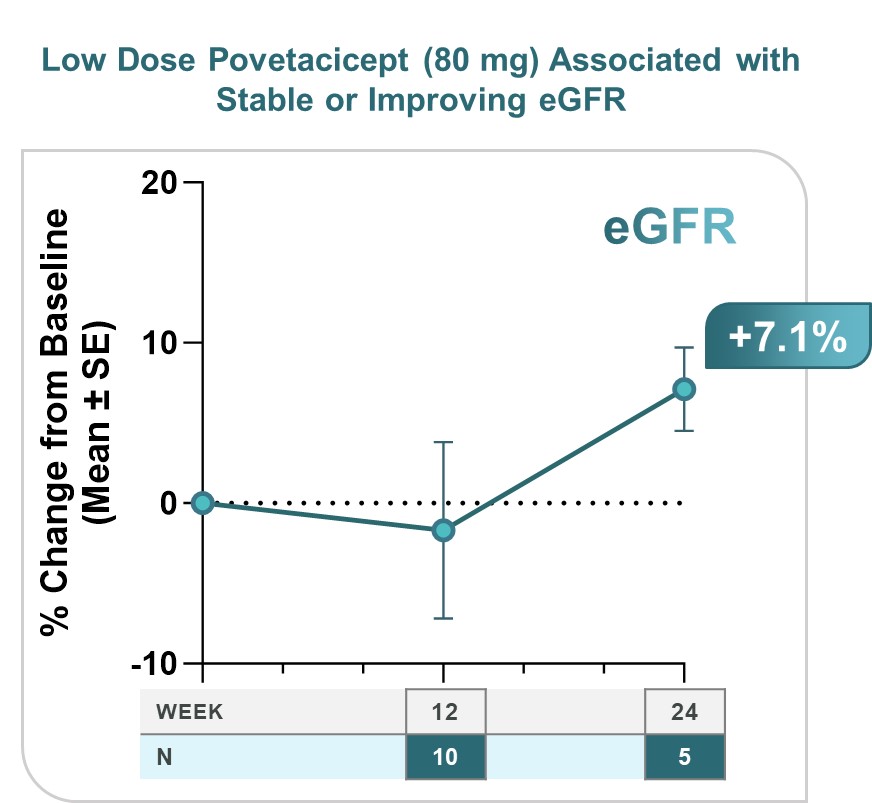
Figure 20
The deep and clinically meaningful reductions in proteinuria observed with povetacicept suggest the possibility of clinical remission, even at this early stage of our experience with povetacicept. In assessing clinical remission in IgAN, we used published remission criteria (Kidney Int Rep 6:1661 (2021)):
•UPCR < 0.5 g/g;
•An improvement of UPCR from baseline of at least 50%; and
•stable renal function as assessed by eGFR.
Using these criteria, 4/5 or 80% of the participants at 24 weeks were in remission. These findings are highly encouraging and suggest that povetacicept may in fact be a disease-modifying treatment for IgAN.
Outside of IgAN, we have experience with povetacicept in a case study of a single participant with primary membranous nephropathy, one of the most common causes of nephrotic syndrome in adults without diabetes. During the participant’s course of treatment with povetacicept, the participant achieved immunological remission of the participant’s disease, meaning that the participant’s levels of anti-PLA2R1 antibodies, which are highly correlated with disease activity, were reduced to below the limit of detection of the assay.
Based on these data, we intend to engage with the FDA, to seek to begin RAINIER, a pivotal phase 3 IgAN study in the second half of 2024. In addition, we anticipate providing further updates from our RUBY-3 basket study in 2024.
21
Development of Povetacicept in Systemic Lupus Erythematosus (SLE)
SLE is a chronic, inflammatory autoimmune disorder characterized by the formation of autoantibodies and immune complexes that can lead to damage across multiple organs including the skin, joints, and kidneys. With a prevalence of ~300,000 in the United States and ~500,000 in the G8, SLE disproportionately affects women more than men (9:1 female to male ratio), has a higher prevalence among African American, Asian, African Caribbean and Hispanic individuals, and typically onsets in the third or fourth decade of life. Prognosis varies by severity of disease and organ involvement, with renal, cardiovascular, and neurological manifestations presenting with potentially severe and life threatening disease. SLE is a leading cause of death in young women in the United States Only two new therapies have been approved for SLE in the last sixty years, both with modest efficacy, leaving a significant unmet need for more effective and well tolerated treatments.
Role of BAFF and APRIL in SLE
B cells play a pivotal role in SLE through the generation of autoantibodies and the production of critical cell signaling cytokines. In particular, the cytokines BAFF and APRIL have complementary and partially overlapping functions in B cell development and both BAFF and APRIL have been found to be overexpressed in patients with autoimmune diseases, including SLE. Early in development, BAFF plays a dominant role in transitional and mature B cells related to BAFF-R expression and promotes class switching of pathogenic autoreactive B cells. Later stages of B cell development are APRIL and/or BAFF dependent, related to TACI and BCMA expression, including the formation of memory B cells and plasma cells. Importantly, APRIL and BAFF responsiveness continues into the B cell stages that produce antibodies, in particular plasmablasts and plasma cells which are often considered the dominant source of the pathogenic autoantibodies in SLE and other related diseases.
The rationale for targeting BAFF and APRIL in SLE is strongly supported by clinical experience with precedent drug candidates. Belimumab, a BAFF-specific antibody, was first approved in 2011 for the treatment of SLE despite its relatively modest efficacy (~10% improvement in response rate vs. placebo). Since then, two Fc fusion proteins of wild-type TACI, atacicept and telitacicept, which bind both BAFF and APRIL, have demonstrated highly encouraging results also in SLE, with telitacicept receiving approval in China in 2023 for the treatment of patients with SLE.
Rationale for Development of Povetacicept in SLE
Povetacicept is an Fc fusion protein of an engineered TACI variant vTD with enhanced affinity for APRIL and BAFF, which demonstrates more potent inhibitory activity than WT TACI-Fc or BAFF- or APRIL-specific antibodies. Povetacicept may therefore significantly improve clinical outcomes in SLE and other B cell-related diseases. At the 2023 annual meeting of the ACR, we published data demonstrating that povetacicept target-related genes (i.e., BAFF, APRIL, TACI, and BCMA) are increased in myeloid lineage cells and B cells in SLE patients compared to healthy adults and that povetacicept, as compared to single BAFF or APRIL pathway inhibitors, more potently downregulates genes associated with activation in B cells (Figure 21). In addition, povetacicept significantly reduces nephritis, proteinuria, and sialadenitis in the IFNα-accelerated NZB/W mouse model of lupus, more effectively than WT TACI-Fc (telitacicept) or conventional B cell depletion (anti-CD20 mAb) (Figure 22). We plan to initiate DENALI, a phase 2 study of povetacicept in SLE, in the second half of 2024.
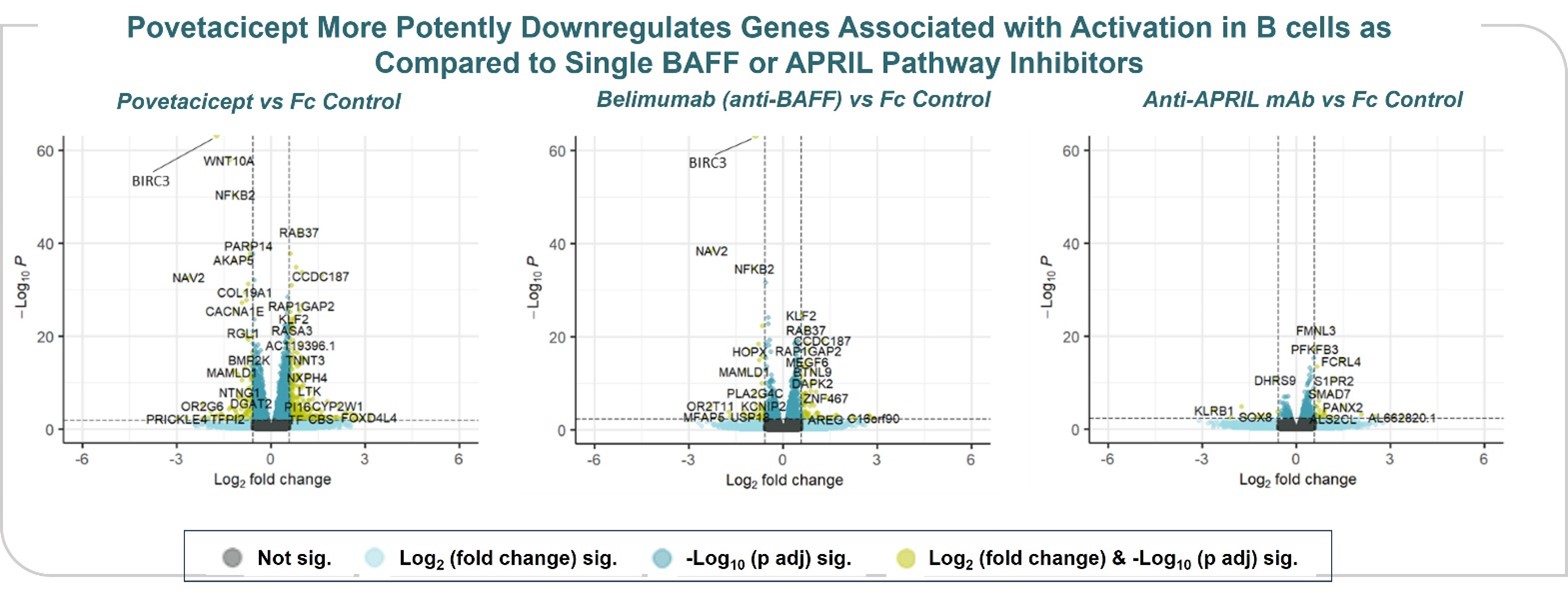
Figure 21
22
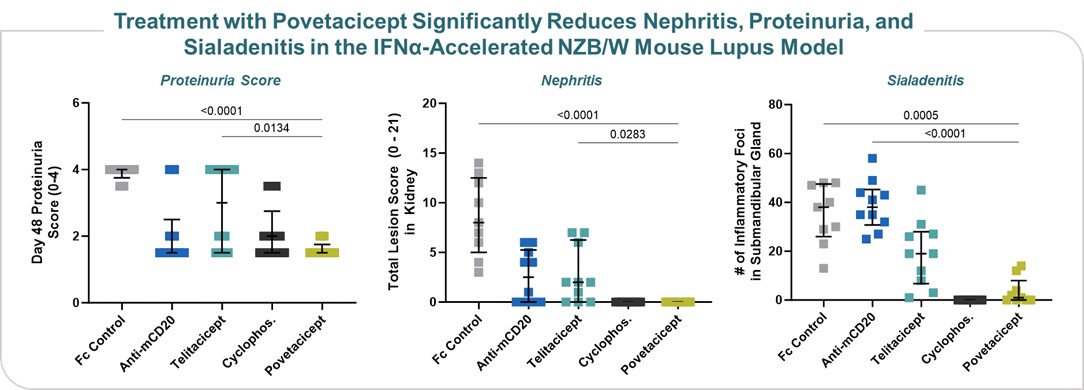
Figure 22
Development of Povetacicept in Autoimmune Cytopenias
There is strong rationale for development of povetacicept in cytopenias including autoimmune hemolytic anemia, or AIHA, and immune thrombocytopenic purpura, or ITP, which are diseases characterized by autoantibodies directed against red blood cells and platelets, respectively. AIHA includes both warm AIHA, the most common form of AIHA, and cold AIHA, often referred to as cold agglutinin disease, or CAD. Significantly higher levels of both BAFF and APRIL have been observed in the serum of patients with AIHA and ITP compared to healthy subjects, and polymorphisms in BAFF and TACI have been associated with ITP. Povetacicept has demonstrated promising activity in multiple preclinical models of autoimmune hemolytic anemia.
RUBY-4: Phase 1b/2 Autoimmune Cytopenia Basket Study
RUBY-4, our autoimmune cytopenia basket study, is designed as a parallel-arm, multi-cohort open label study that seeks to enroll subjects with immune thrombocytopenia, warm autoimmune hemolytic anemia or cold agglutinin disease in disease-specific cohorts, using a 2-stage Fleming design for up to 48 weeks. Subjects must have active cytopenia and endpoints will include standard definitions of response, such as durable responses. Changes in anti-platelet or anti-red blood cell autoantibodies will also be followed (Figure 23). Initial updates from our RUBY-4 basket study are anticipated in the first half of 2024.
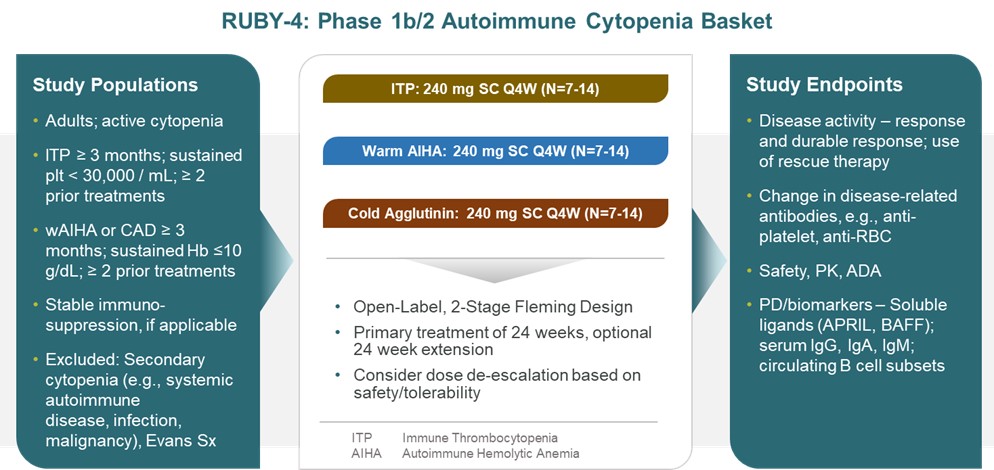
Figure 23
23
Acazicolcept, a Dual ICOS/CD28 Antagonist for Autoimmune and Inflammatory Diseases
Acazicolcept is an Fc fusion protein of a human inducible T cell costimulator ligand, or ICOSL, vIgD designed to inhibit simultaneously the CD28 and ICOS T cell costimulatory pathways (Figure 24). This vIgD is fused to an “effectorless” Fc backbone and is intended for the potential treatment of autoimmune and inflammatory diseases. Notably, acazicolcept is not a bispecific antibody construct. A traditional bispecific might be constructed of one domain binding ICOS and one domain binding CD28. Instead, acazicolcept makes use of a novel single vIgD domain capable of binding both ICOS and CD28 engineered by our scientists using our proprietary scientific platform.
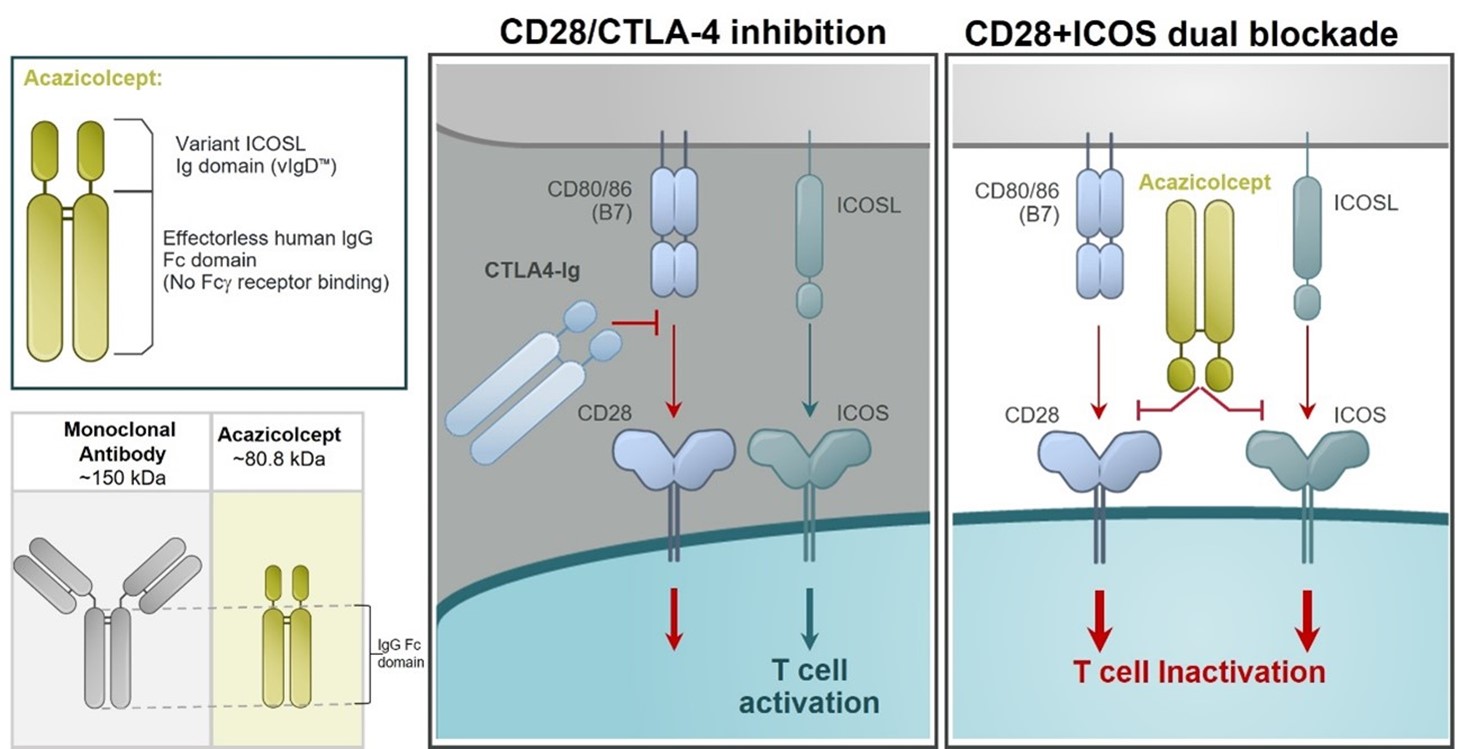
Figure 24
CD28 has been long recognized to be required for naïve T cell activation. The therapeutic inhibitors of the CD28 pathway (e.g., abatacept, CTLA4-Ig; and belatacept, a second generation CTLA4-Ig) have proven valuable for the treatment of some inflammatory arthritis conditions (e.g., rheumatoid arthritis, juvenile idiopathic arthritis, psoriatic arthritis) and for the prevention of renal allograft rejection or GVHD. However, therapeutic blockade of the CD28 pathway, primarily as studied with abatacept, has not been successful in several other inflammatory diseases (e.g., Crohn’s disease, lupus nephritis, MS) despite extensive evidence implicating T cells in disease pathogenesis and evidence of clinical biological activity. This suggests an additional pathogenic costimulatory pathway(s) remains unaddressed.
ICOS is part of the CD28 costimulatory family of molecules, including PD-1, CD28, and CTLA-4. ICOS is the most closely related family member to CD28, but, in contrast, is poorly expressed in naïve T cells. ICOS is, however, rapidly induced upon T cell activation. It appears to be a dominant costimulatory pathway in at least some effector or pathogenic T cells, such as potentially in the absence of CD28. Elevated levels of ICOS‑expressing T cells have been described in an increasing number of autoimmune and inflammatory diseases, correlating with disease activity. At the same time, inhibition of ICOS is effective in several preclinical inflammatory disease models. The ICOS pathway may therefore represent a major costimulatory pathway, nonredundant with CD28, and highly relevant to autoimmune and inflammatory diseases.
We have performed a number of preclinical experiments demonstrating acazicolcept is active in both in vitro and in vivo models, several of which are described below.
A potent immunomodulator of diseased cells
Acazicolcept inhibits cytokine production from human peripheral blood mononuclear cells in vitro more potently than single CD28 (abatacept, or CTLA4-Ig) or ICOS (prezalumab, or anti-ICOSL mAb) pathway inhibitors alone or in combination (Figure 25).
24
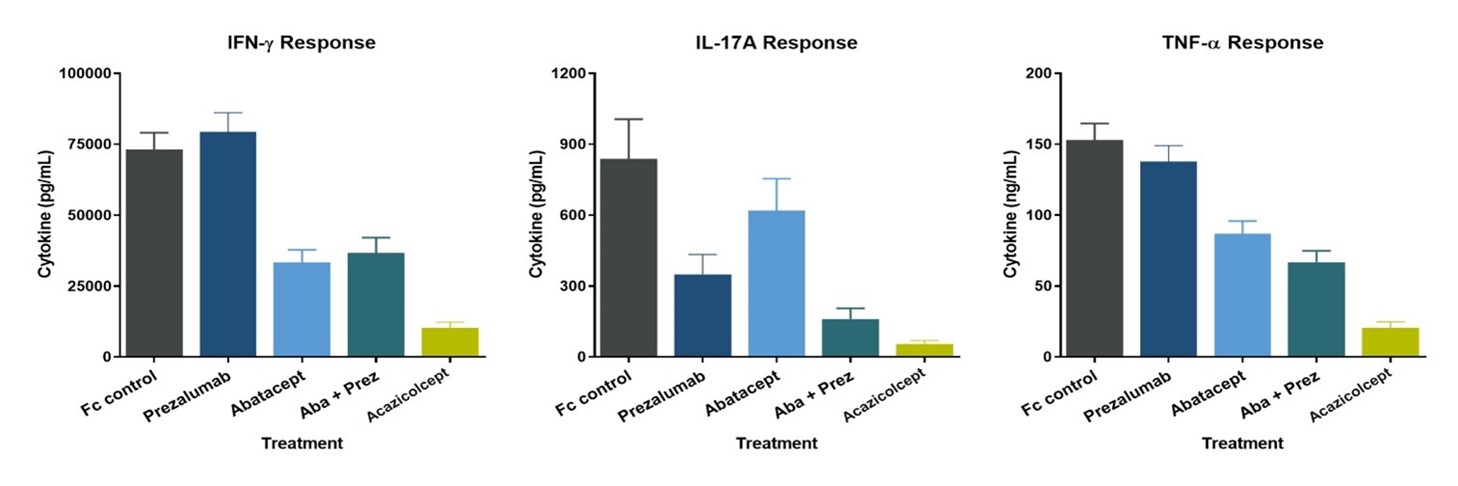
Figure 25
Sjögren’s Syndrome Model
Sjögren’s syndrome is an autoimmune disease in which immune cells attack the glands that produce saliva and tears, as well as other internal organs. In an animal model of salivary gland inflammation (sialoadenitis), a key organ manifestation of Sjögren’s syndrome, acazicolcept appeared more efficacious in reducing the incidence and severity of sialadenitis as compared to abatacept or wild-type ICOSL-Fc alone or in combination. These data were presented at the 2019 annual meeting of the ACR. (Figure 26)
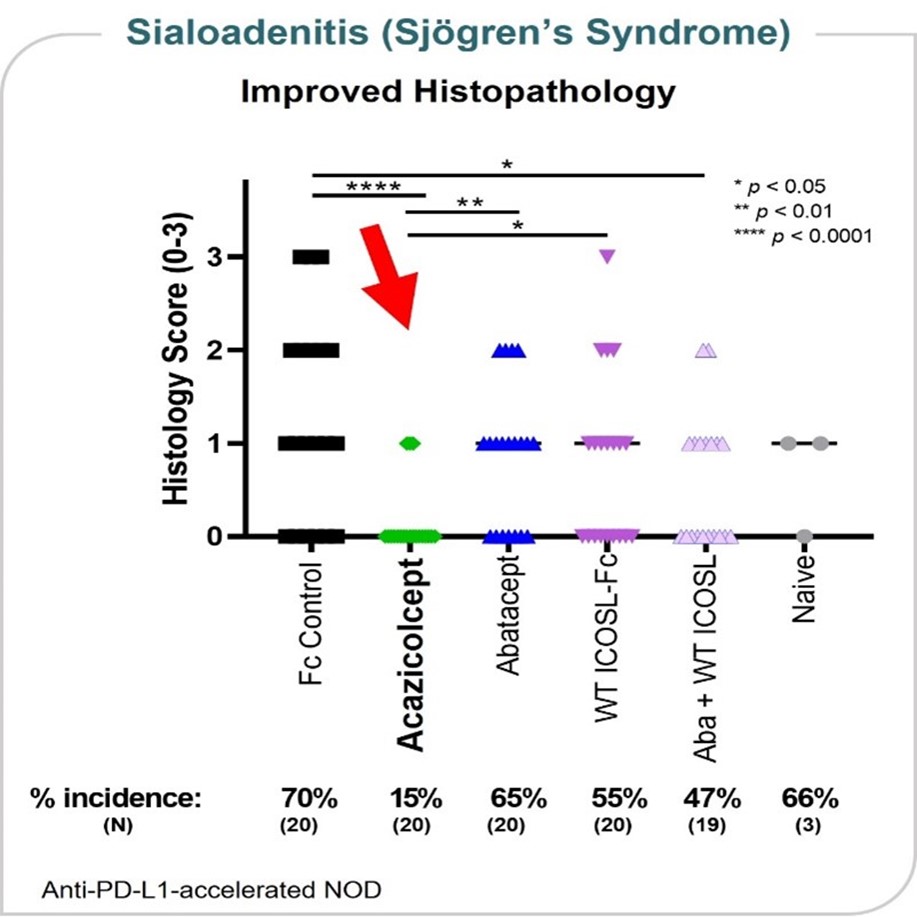
Figure 26
25
Systemic Lupus Erythematosus Model
SLE is an autoimmune disease characterized by the dysregulation of T and B cell activation. At the 2023 annual meeting of the ACR, we published data demonstrating that acazicolcept target-related genes (ICOS, CD80, CD86) are upregulated in the T and B cells of SLE patients compared to healthy adults and that acazicolcept suppresses expression of genes associated with T cell activation and/or implicated in the pathogenesis of SLE more potently than inhibitors of the CD28 or ICOS pathways alone (Figure 27). In addition, acazicolcept has demonstrated efficacy in a preclinical bm12 inducible model of SLE where treatment with acazicolcept reduced serum titers of anti-dsDNA autoantibodies throughout the study compared to Fc control treatment (Figure 28). We evaluated acazicolcept in a Phase 1 healthy volunteer study and in the second quarter of 2021 initiated patient dosing in Synergy, a global, randomized, double-blind, placebo-controlled Phase 2 study of acazicolcept in adults with moderate-to-severe SLE.
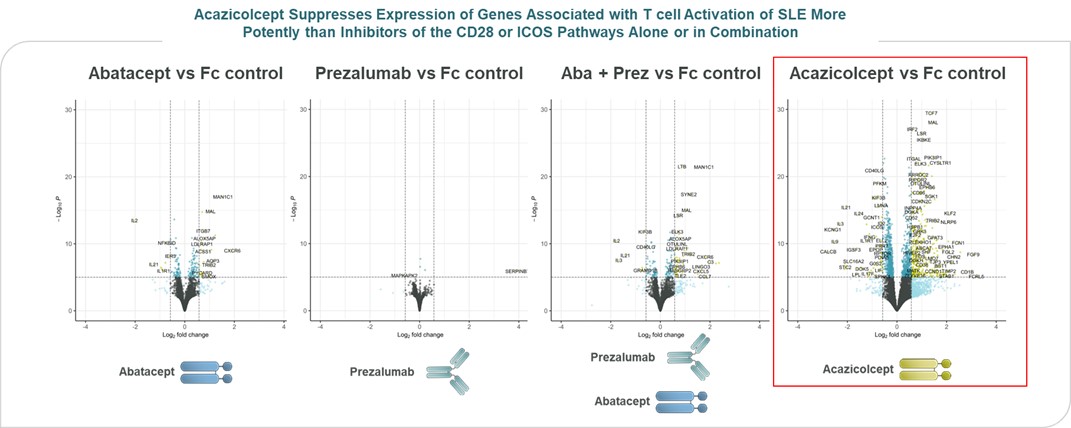
Figure 27
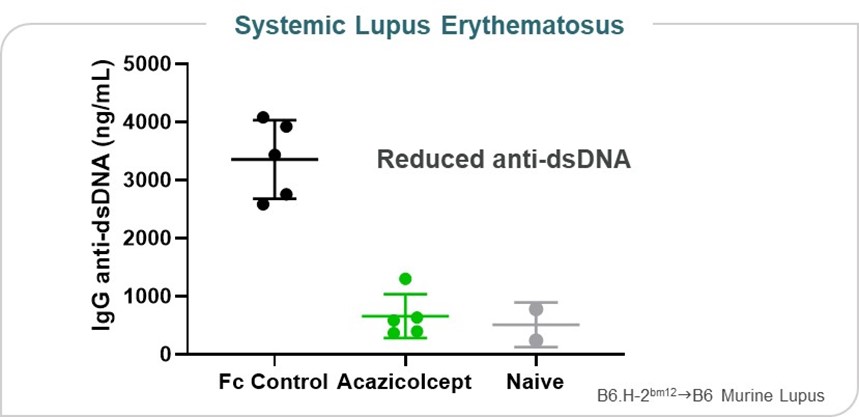
Figure 28
Arthritis Model
Figure 29 shows data from an in vivo collagen-induced arthritis model. This model is designed to test a drug’s ability to reduce inflammatory signals thought to play a role in rheumatoid arthritis, psoriatic arthritis, and other types of inflammatory arthritis conditions. In the data published in the peer reviewed journal Arthritis & Rheumatology, acazicolcept was superior to
26
abatacept, a drug approved by the FDA to treat rheumatoid, psoriatic, and juvenile idiopathic arthritis (Arthritis Rheumatol. 2023 Aug;75(8):1344-1356).
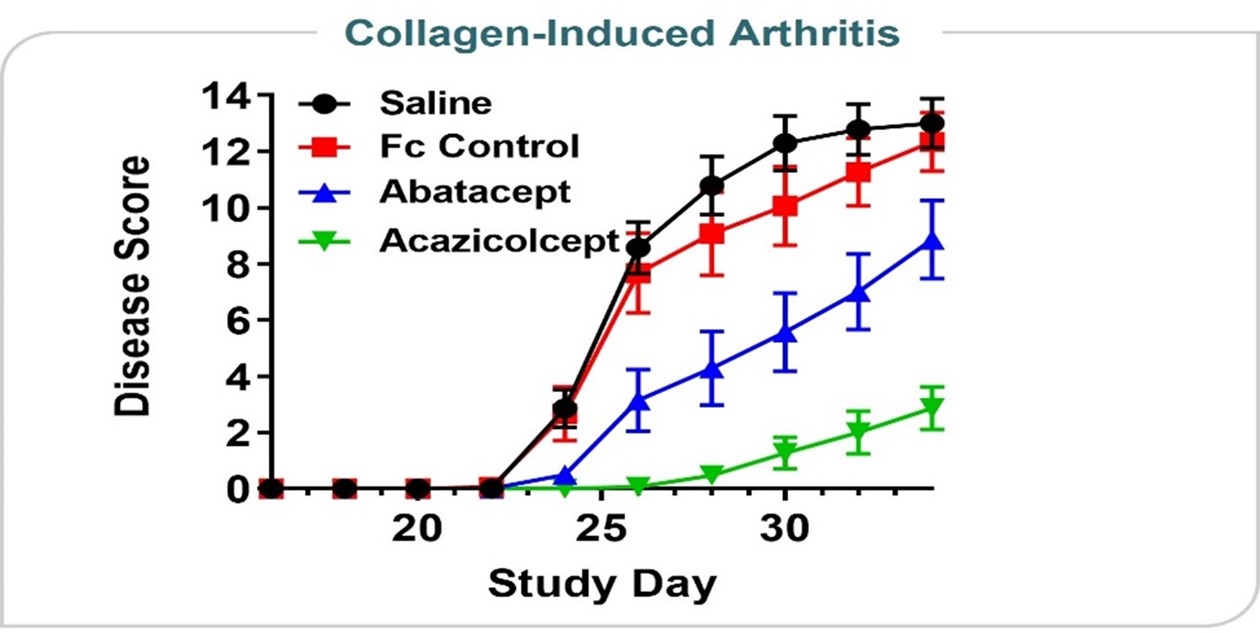
Figure 29
Human Xenograft GVHD Model
Acazicolcept has been studied in an in vivo mouse model of GVHD, a damaging and potentially fatal inflammatory disease frequently observed following allogeneic stem cell and/or bone marrow transplant treatments for cancer or other serious diseases. The results published in the peer-reviewed journal Science and Translational Medicine and represented in Figure 30 show acazicolcept had superior survival when dosed three times per week for four-weeks compared to belatacept (an FDA-approved drug for prevention of renal allograft rejection - a type of inflammation-related rejection process analogous to GVHD. Belatacept is a more potent variant of abatacept, which is FDA-approved for the prevention of GVHD) (Sci Transl Med. 2020 Oct 7;12(564):eaay4799). In fact, 100% of acazicolcept multi-dose treated animals across three different dose levels survived. Animals given only a single dose of acazicolcept performed comparably to animals treated with belatacept dosed 3x/week for four weeks, demonstrating the potency and efficacy of acazicolcept in this disease model.
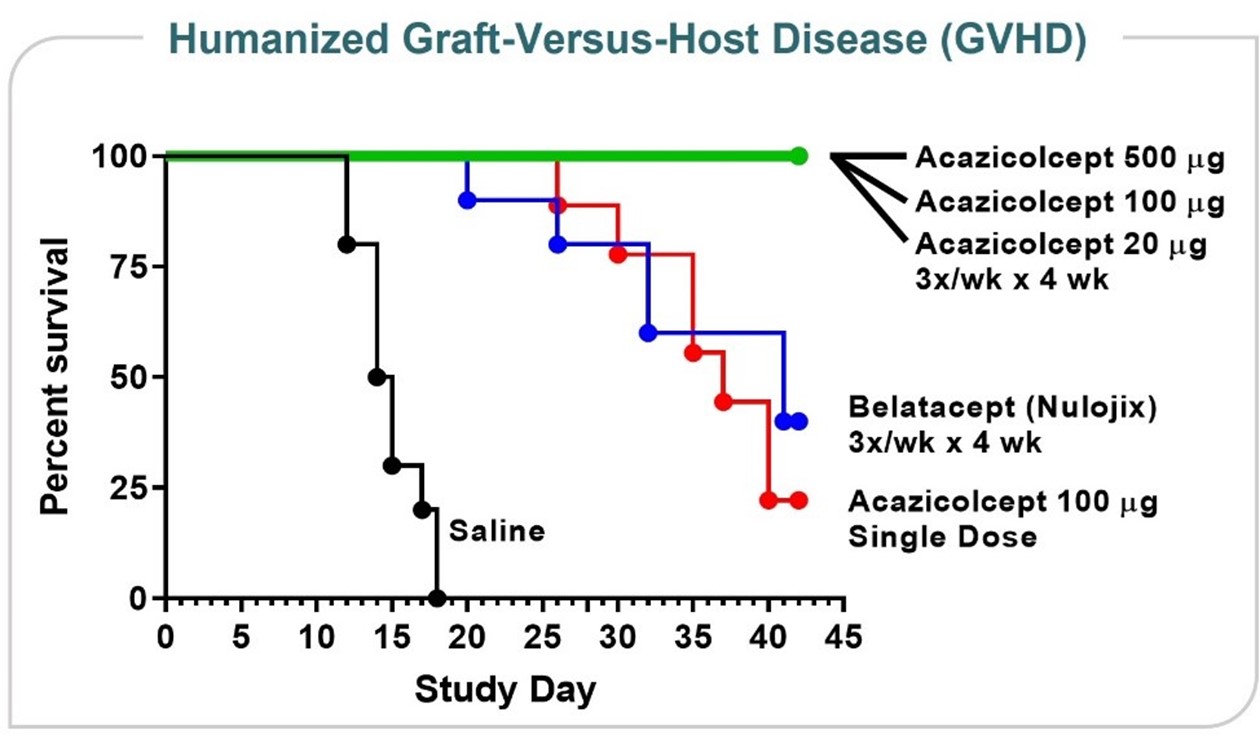
Figure 30
27
Summary of Acazicolcept Program Preclinical Data
Our scientists and collaborators have demonstrated in in vivo preclinical studies that acazicolcept:
•suppresses expression of genes associated with T cell activation and/or implicated in the pathogenesis of SLE more potently than inhibitors of the CD28 or ICOS pathways alone;
•demonstrates a lower incidence and severity of sialadenitis, a model of Sjögren’s syndrome, as compared to abatacept or wild-type ICOSL-Fc alone or in combination;
•reduces levels of pathogenic anti-dsDNA autoantibodies compared to an Fc control in an animal model of SLE;
•reduces disease severity and delays disease onset time relative to control in an in vivo arthritis model with activity superior to abatacept, an FDA-approved drug for rheumatoid, psoriatic, and juvenile idiopathic arthritis;
•improves survival compared to belatacept in a humanized in vivo mouse GVHD model;
•demonstrates control of colitis in an animal model of IBD; and
•shows improved disease scores in an animal model of MS, compared to abatacept.
Acazicolcept Clinical Development
We have completed a Phase 1 study of acazicolcept in healthy volunteers (NCT03748836). This study was designed to evaluate the safety and tolerability of single and multiple ascending intravenous and/or subcutaneous doses of acazicolcept. In addition, pharmacokinetics, pharmacodynamics and exploratory biomarkers were evaluated to help determine acazicolcept’s potential for the treatment of autoimmune and inflammatory diseases. Results of the study were presented at the 2020 European Alliance of Associations for Rheumatology (EULAR) E-Congress and published in the peer-reviewed journal Clinical Translational Science (doi:10.1111/cts.12983). The first-in-human study randomized 96 healthy adults to receive single or multiple, intravenous or subcutaneous, placebo or acazicolcept at doses ranging from 1 μg/kg to 10 mg/kg. At all dose levels, acazicolcept was well-tolerated, with no severe adverse events, clinically-significant immunogenicity events, or evidence of cytokine release. Pharmacokinetics and pharmacodynamics (Figure 31) exhibited desirable dose dependence, with increasing doses corresponding to increasing duration of complete, or near-complete target saturation, as well as inhibition of antibody responses to keyhole limpet hemocyanin, or KLH, immunization.
28
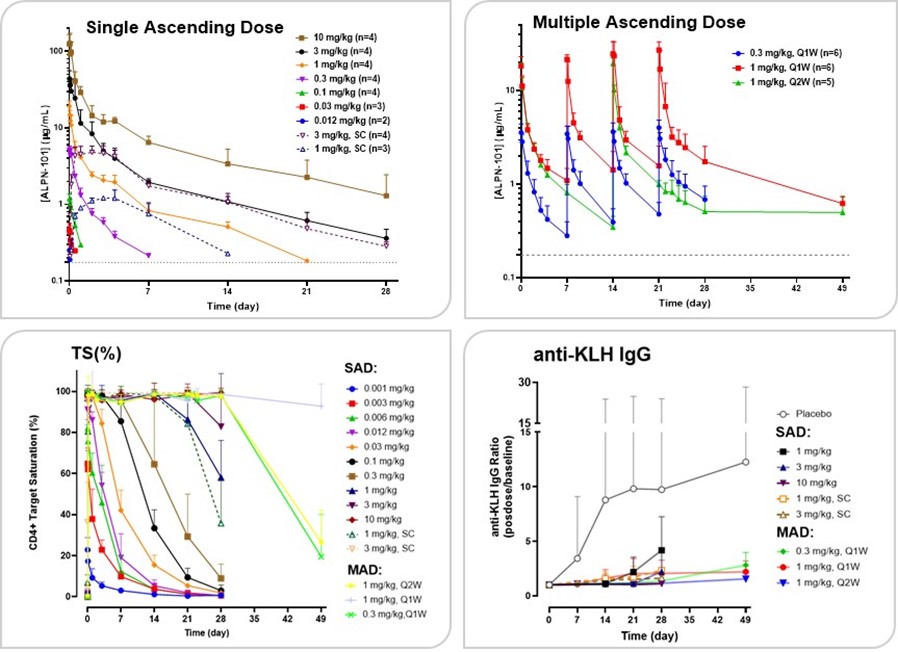
Figure 31
Supported by these results, and as part of the AbbVie Agreement, we initiated Synergy, an international, double-blind placebo-controlled Phase 2 study of acazicolcept in patients with SLE in mid-2021. In December 2023, per the terms of the AbbVie Amendment, we stopped enrollment in the Synergy study to allow for an early assessment of the study’s clinical trial data. In connection with the AbbVie Amendment, the fee to license acazicolcept was reduced to $10 million, and other potential payments under the AbbVie Agreement related to future development, commercial and sales-based milestones, as well as sales-based royalties were reduced by 25%. The final analysis, after the last patient enrolled in Synergy completes their study protocol, is expected to occur by the end of 2024. For additional information regarding the AbbVie Agreement, please refer to the section of this report titled “Business — Partnerships.”
Other Research Programs
In addition to our acazicolcept and povetacicept programs, we have a number of other research efforts underway to address autoimmune and inflammatory diseases that we intend to continue to develop either internally or together with a partner.
Partnerships
In addition to advancing programs internally, we continue to seek partners who can bring therapeutic area experience, development expertise, commercialization capabilities, and funding to maximize the potential of our existing programs and scientific platform.
Collaboration with Amgen (December 2021)
In December 2021, we entered into the Amgen Agreement, pursuant to which we granted to Amgen rights to our Existing Program and agreed to collaborate with Amgen in the discovery, research and preclinical development of up to three Research Programs, and products arising from the Existing Program and the Research Programs, or the Agreement Products.
29
Existing Program
We granted to Amgen an exclusive, worldwide, royalty-bearing, sublicensable license under our intellectual property rights for the development, manufacture and commercialization of Agreement Products associated with the Existing Program, or the Existing Program Products, for all applications; however, Amgen has agreed not to pursue the Existing Program Products for oncology. In addition, we granted to Amgen a non-exclusive license to access our libraries of proteins and molecules for research, discovery and identification of additional compounds meeting the agreed criteria (subject to certain exceptions, including compounds reserved by us from the libraries, as set forth in the Amgen Agreement) which would be included in Amgen’s license (Research Programs). In addition, Amgen will pay us for the costs and expenses of conducting such activities under the deliverables plans.
Research Programs
Under the Amgen Agreement, during a limited research term, we will conduct, together with Amgen, up to three Research Programs for specified biological targets selected by Amgen (subject to certain exceptions, including targets reserved by us) to discover proteins and molecules with specified attributes and biological functions, pursuant to a mutually agreed research plan for each such Research Program. Each party has the right to reserve certain targets and to replace such reserved targets or reserve more targets (up to a fixed number) through a gatekeeper mechanism. We will deliver certain compounds meeting the agreed criteria for each Research Program as mutually agreed upon by the parties. Amgen will pay us for the costs and expenses for conducting its activities under the Research Programs. As agreed between the parties, Amgen will own the inventions and intellectual property developed from the Research Programs or otherwise associated with the Agreement Products arising therefrom.
Governance
The parties will establish a joint research committee composed of an equal number of representatives from each of Alpine and Amgen, which will, among other responsibilities, oversee and govern the Existing Program and the Research Programs and review and approve research plans. The parties will also form a joint patent committee comprised of one or two representatives of each party to discuss strategy and facilitate communication and coordination for prosecution and maintenance of the relevant patents under the Amgen Agreement.
Development, Manufacture, Regulatory and Commercialization.
Amgen will have the sole right and responsibility for development, manufacturing, regulatory activities and commercialization of all the Agreement Products. We will provide Amgen reasonable assistance and cooperation. In addition, we have agreed during the term of the Amgen Agreement not to conduct or enable any third party to conduct the development, manufacture or commercialization of certain competing products as set forth therein.
Financial Terms
In connection with the transaction, Amgen made an upfront payment to us of $25.0 million as well as an equity investment for which they paid $15.0 million, a 25% premium to the 30-day volume-weighted average share price as of December 9, 2021.
As of December 31, 2023, we have completed our activities under the Existing Program. We continue to support activities related to the First Research Program. In January 2024, we received a termination notification from Amgen for the non-exclusive license to use the Second Research Program. A Third Research Program was not selected by the respective option deadline. In addition to the upfront payment and equity consideration, Amgen has agreed to future success-based payments related to development, regulators and commercial milestones, up to an aggregate amount of $381.0 million per program, or approximately $762.0 million in total, for the remaining programs.
Amgen has further agreed to pay us royalties based on future net sales of the Agreement Products. For the Existing Program, such royalty percentages range from a mid-single digit percentage to a low double-digit percentage of net sales, with the specific royalty rate depending on the aggregate net sales. For each Research Program, such royalty percentages are in a range of mid-single digit percentages of net sales, with the specific royalty rate depending on the aggregate net sales. Amgen’s obligations to pay royalties with respect to an Agreement Product and country will expire after specific criteria for such Agreement Product in such country including it no longer being covered by valid claims of applicable patent rights in such country, or the Royalty Term. Royalty payments are subject to reduction in specified circumstances, including expiration of patent rights, biosimilar competition, or Amgen is required to make payments to a third party with respect to an Agreement Product.
30
Term and Termination
Unless earlier terminated, the Amgen Agreement remains in effect until the expiration of the Royalty Term for all Agreement Products. The Amgen Agreement is subject to customary termination provisions including termination by a party for the other party’s uncured, material breach. Additionally, Amgen may terminate the Amgen Agreement with specified prior notice in its entirety or on a Program-by-Program basis, for any or no reason.
In the event of certain terminations of the Amgen Agreement, at our request, the parties will negotiate one or more licenses for us to develop, manufacture and commercialize terminated Agreement Products.
The Amgen Agreement includes certain other customary terms and conditions, including mutual representations and warranties, indemnification and confidentiality provisions.
Collaboration with AbbVie (June 2020)
In June 2020, we entered into the AbbVie Agreement, which grants to AbbVie an exclusive option to take an exclusive license to acazicolcept, or the License Option. In December 2023, per the terms of the AbbVie Amendment, we agreed to stop enrollment in our Synergy study to allow for an early assessment of the study’s clinical trial data. Currently enrolled patients will be allowed to complete their study treatment protocol. Amended payment terms are discussed below.
Under the terms of the AbbVie Agreement we granted to AbbVie an exclusive option to obtain an exclusive, royalty-bearing, sublicensable license to certain intellectual property rights for the research, development and commercialization of acazicolcept and any other molecule owned or controlled by us that binds to or directly modulates or targets ICOS at certain agreed-upon levels, or the Compounds, on a worldwide basis for all human and non-human diagnostic, prophylactic and therapeutic uses, subject to certain exceptions set forth in the AbbVie Agreement. Under the AbbVie Amendment, the License Option is immediately exercisable and will expire 90 days following our delivery of an agreed-upon data package described below to AbbVie, subject to certain exceptions, including clearance under the Hart-Scott-Rodino Antitrust Improvements Act of 1976, or the HSR Act, if required.
Financial Terms
In connection with the execution of the AbbVie Agreement in June 2020, AbbVie paid us a nonrefundable upfront payment of $60.0 million in cash. Per the terms of the AbbVie Amendment, if AbbVie exercises its License Option, they will pay a one-time cash payment of $10.0 million.
In addition to the upfront payment and License Option payment, AbbVie has agreed to make cash payments upon our achievement of certain development milestones, the Alpine Development Milestones, prior to the exercise of the License Option as set forth in a written development plan, up to an aggregate amount of $75.0 million, of which $45.0 million was achieved in 2021, and the remaining $30.0 million was removed under the AbbVie Amendment. Under the AbbVie Amendment, following the exercise of the License Option, AbbVie has agreed to make cash payments of up to$153.8 million upon AbbVie’s achievement of certain development and commercial milestones and additional cash payments of up to $337.5 million upon AbbVie’s achievement of certain sales-based cash milestones. AbbVie has further agreed to pay mid-single-digit percentage royalties on worldwide net sales of any pharmaceutical product that contains a Compound, or a Licensed Product, with the specific royalty rate depending on the aggregate net sales. AbbVie’s obligations to pay royalties with respect to a Licensed Product and country will expire upon the latest of the expiration of the last to expire valid patent claim applicable to such Licensed Product in such country, 10 years from the first commercial sale of the Licensed Product in such country, and the expiration of regulatory exclusivity for such Licensed Product in such country. Royalty payments are subject to reduction in specified circumstances, including expiration of patent rights, if average net sales decrease by a certain percentage after the introduction of a generic product, or if AbbVie is required to pay amounts to a third party in order commercialize a Licensed Product in a particular country.
Development Activities
Prior to the exercise of the License Option, we will conduct research and development services, including conducting our Phase 2 study in SLE, based on an agreed-upon development plan, or the Development Plan, which provides for, among other things, the generation of a data package in order for AbbVie to evaluate exercising the License Option and an itemized budget for such activities, including all activities reasonably necessary to conduct a Phase 2 clinical study of acazicolcept for the treatment of SLE; all non-clinical activities; and all CMC activities agreed to under the Development Plan. We will be fully responsible for all costs incurred to conduct our activities, provided that, AbbVie may be responsible for increased costs under the Development Plan in connection with certain material amendments agreed upon with AbbVie.
31
Prior to the exercise of the License Option, we will be solely responsible, at our sole cost and expense, for preparing, filing and maintaining regulatory documentation, which AbbVie will be entitled to access and review. We will also be responsible for any and all correspondence with the applicable regulatory authorities and for maintaining all data related to acazicolcept. We will be solely responsible, at our sole cost and expense, for manufacturing the compounds necessary to complete the development activities consistent with the Development Plan.
Governance
The parties will establish a joint governance committee, or JGC, composed of an equal number of representatives from each of Alpine and AbbVie, which will, among other responsibilities, coordinate and oversee the development activities, approve amendments to the Development Plan and discuss interactions with regulatory authorities. The chairperson of the JGC will be appointed by AbbVie. AbbVie may disband the JGC, at its sole discretion, following the exercise of the License Option.
Commercialization
Upon AbbVie’s exercise of the License Option, AbbVie and its affiliates will be solely responsible, at AbbVie’s sole cost and expense, for the development, manufacture, commercialization, and regulatory compliance of any Licensed Product. Following exercise of the License Option, AbbVie shall use commercially reasonable efforts to develop and seek regulatory approval for one of the compounds in one indication in each of the United States and one of the United Kingdom, Germany, France, Spain, or Italy, or the Major Markets, and, following receipt of any such regulatory approval, commercialize the compound in such country.
Changes in Control
We will notify AbbVie immediately upon the closing of any change in control (as defined in the AbbVie Agreement) during the term of the AbbVie Agreement. Following the delivery of such notice, AbbVie may, in its sole and absolute discretion, elect to continue the AbbVie Agreement subject to certain modifications as set forth in the AbbVie Agreement, including the assumption by AbbVie of responsibility to perform certain activities previously assigned to us.
Term and Termination
Unless earlier terminated, the AbbVie Agreement shall terminate either: (i) in the event that the License Option is not exercised by AbbVie, the first day following the last day of the License Option exercise period; or (ii) in the event that the License Option is exercised by AbbVie, the date of the expiration of the last Royalty Term for the last Licensed Product.
Both us and AbbVie may terminate the AbbVie Agreement upon written notice in the event of a material breach by the other party that has not been cured within a 90-day cure period. However, if the uncured material breach is with respect to AbbVie’s obligation to use commercially reasonable efforts to obtain regulatory approval for and commercialize a Licensed Product with respect to any Major Market (but not all Major Markets), then we will only be entitled to terminate the AbbVie Agreement with respect to such Major Market(s). Both AbbVie and us may also terminate the AbbVie Agreement upon written notice if the other party voluntarily or involuntarily files for bankruptcy or insolvency, makes an assignment for the benefit of creditors, has a receiver or trustee appointed over substantially all of such other party’s property, proposes or is party to any dissolution or liquidation, or admits in writing its inability generally to meet such other party’s obligations as they fall due in the general course.
AbbVie may terminate the AbbVie Agreement in its entirety or on a country-by-country basis, for any or no reason, by providing at least 90 days’ prior written notice to us. AbbVie may also terminate the AbbVie Agreement upon notice to us if (i) either we or AbbVie receives a second request for additional information under the HSR Act, provided AbbVie’s notice of termination is delivered within ten business days after AbbVie becomes aware of such request or receives notice from us regarding such request or (ii) the License Option has not been exercised or clearance under the HSR Act, if required, has not occurred within 180 days of submission of the parties’ request for such clearance, provided AbbVie’s notice of termination is delivered within ten business days after the end of such 180-day period.
Upon the termination of the AbbVie Agreement in its entirety for any reason, all licenses and other rights granted (i) to AbbVie by us and (ii) to us by AbbVie shall terminate. Upon termination in certain circumstances, AbbVie has agreed to grant to us licenses to certain intellectual property that is reasonably necessary, and that was actually used by AbbVie for the development, manufacturing or commercialization of the terminated products, to research, develop and commercialize the terminated products in the terminated countries.
In lieu of terminating the AbbVie Agreement in connection with an uncured material breach or the bankruptcy or insolvency of the Company, AbbVie may alternatively elect to continue the AbbVie Agreement subject to certain modifications, including that AbbVie will be entitled to conduct activities allocated to us under the Development Plan, subject
32
to reimbursement by us for AbbVie’s out-of-pocket expenses in connection with such activities. If AbbVie’s right to terminate in connection with an uncured material breach or the bankruptcy or insolvency of the Company arises before exercise of the License Option, then the License Option exercise payment amount will be reduced by half and the amount of any then-unearned milestone payments will be reduced by half. If AbbVie’s right to terminate arises after exercise of the License Option, then the amount of any then-unearned milestone payments will be reduced by 25%.
The AbbVie Agreement includes certain other customary terms and conditions, including mutual representations and warranties, indemnification and confidentiality provisions.
Collaboration with Adaptimmune (May 2019)
In May 2019, we entered into a collaboration and licensing agreement with Adaptimmune, or the Adaptimmune Agreement, to develop next-generation SPEAR™ T cell products. Under the Adaptimmune Agreement, we performed certain research services and granted Adaptimmune a worldwide exclusive license to programs from our secreted immunomodulatory protein, or SIP, and transmembrane immunomodulatory protein, or TIP, technologies, in exchange for which Adaptimmune provided an upfront payment and research funding for ongoing programs. In addition, if respective pre-specified milestones for each of the two active research programs are achieved, we are eligible for downstream development and commercialization milestones of up to an aggregate amount of $105.0 million, and we are also eligible to receive low-single digit percentage royalties on worldwide net sales of the applicable products.
Manufacturing
We have established in-house non-current good manufacturing practices (non-cGMP), recombinant protein generation capabilities enabling our scientific platform, including validation of new scientific discoveries in vitro and in vivo. Having protein production capabilities in-house allows more rapid progression for vIgDs and vTDs generated by our scientific platform.
We have chosen U.S.-based contract drug substance and U.S., Australian, and German drug product manufacturers for our current good manufacturing practices, or cGMP, clinical trial supplies of acazicolcept and povetacicept. We believe these contract manufacturers’ particular expertise in protein production, analytical development and fill/finish provide us with the capability to meet rapid timelines encompassing the development of production cell-lines to manufacturing of clinical trial quantities of the biopharmaceutical product.
We have successfully completed two cGMP manufacturing drug substance campaigns for acazicolcept and two cGMP drug substance campaigns for povetacicept and believe we have produced sufficient quantities to execute our current Synergy and RUBY clinical trials. We have established a commercial scale manufacturing process for povetacicept and plan for our manufacturers to supply pivotal material to support our late-phase clinical studies.
Competition
We participate in the highly competitive sector of biotechnology and pharmaceuticals and in the subsector of immune modulation. This subsector has undergone tremendous technological advancement over the last decade due to advancements in understanding the role of the immune system across multiple therapeutic areas, including autoimmune and inflammatory disease. While we believe our novel technology platform, discovery programs, knowledge, experience, and scientific resources offer competitive advantages, we face competition from major pharmaceutical and biotechnology companies, academic institutions, governmental agencies, public and private research institutions, and others.
Any products we successfully develop and commercialize will face competition from currently approved therapies and new therapies potentially available in the future.
The availability of reimbursement from government and other third-party payors will also significantly affect the pricing and competitiveness of our products. Our competitors also may obtain FDA or other regulatory approval for their products more rapidly than we may obtain approval for our products, which could result in our competitors establishing a strong market position before we are able to enter the market.
Many of the companies we compete against may have significantly greater financial resources and expertise in research and development, manufacturing, preclinical testing, conducting clinical trials, obtaining regulatory approvals, and marketing approved products. Smaller or early-stage companies may also prove to be significant competitors, particularly through collaborative arrangements with large and established companies. These competitors also compete with us in recruiting
33
and retaining qualified scientific and management personnel and establishing clinical trial sites and patient registration for clinical trials, as well as in acquiring technologies complementary to, or necessary for, our programs.
Specifically, our competitors include companies developing therapies with the same target(s) as acazicolcept and povetacicept, as well as companies building novel platforms to generate immunomodulatory multi-specific antibody or non-antibody-based targeting proteins, particularly in the area of autoimmunity.
See the risk factor “We face competition from entities that have developed or may develop therapeutic candidates for our target disease indications, including companies developing novel treatments and technology platforms based on modalities and technology similar to ours.” in Part I, Item 1A of this report for more discussion of the effects of competition and competitors on our business.
Acazicolcept Program Competitors (ICOSL/CD28)
To our knowledge, there are currently no competitors with a single molecule targeting ICOS and CD28 simultaneously. The competitors listed below have programs targeting either ICOS or CD28 (or one of their ligands) for autoimmune and inflammatory diseases:
•an anti-CD28 monoclonal antibody fragment being developed by OSE ImmunoTherapeutics SA and Veloxis Pharmaceuticals Inc., a subsidiary of Asahi Kasei (FR104);
•an anti-CD28 peptide being developed by AtoxBio, Inc. (reltecimod (AB-103));
•CTLA-4-Fc fusion proteins targeting CD80 and CD86 being marketed Bristol Myers Squibb (abatacept and belatacept); and
•an anti-IL-17A and BAFF bispecific antibody being developed by Zura Bio (tibulizumab (ZB-106)).
Povetacicept Program Competitors
The competitors listed below have programs targeting either the TACI, BCMA, or BAFF pathway for autoimmune disease.
•Anti-BAFF antibody marketed by GSK plc (belimumab);
•TACI-Fc being developed by Vera Therapeutics (atacicept);
•TACI-Fc being developed by RemeGen Ltd. (telitacicept (RC18));
•Anti-BAFF-R IgG1 being developed by Novartis AG (Ianalumab (VAY736));
•Anti-APRIL antibody being developed by Visterra, Inc., a subsidiary of Otsuka Pharmaceutical Co., Ltd. (sibeprenlimab (VIS649));
•Anti-BAFF, anti-ICOSL bispecific antibody being developed by Amgen Inc. (rozibafusp alfa (AMG570/MEDI0700)); and
•Anti-APRIL antibody being developed by Novartis AG (zigakibart).
Novel Platform Competitors
Multifunctional therapeutic protein platforms potentially competitive with our platform include:
•Amgen Inc. (BiTE®): fusion proteins consisting of two single-chain variable fragments to link T cells to tumors;
•Macrogenics, Inc. (DART®): Dual-Affinity Re-Targeting and Trident technology platforms bind multiple targets with a single molecule;
•Xencor, Inc. (XmAb Bispecific): Optimized Fc domains for improved potency, half-life and stability;
•Zymeworks, Inc. (Azymetric™): Proprietary amino acid modifications to facilitate interaction of distinct heavy chains;
•Pieris Pharmaceuticals, Inc. (Anticalin®): Engineered proteins derived from natural lipocalins found in blood plasma;
34
•Compass Therapeutics, LLC (Targeted Immunomodulation™, StitchMabs™): Antibody discovery targeting the tumor-immune synapse;
•Harpoon Therapeutics, Inc., purchased by Merck & Co., Inc: TriTAC™ (Tri-specific T cell Activating Construct) contain CD3 binding domain, half-life extension domain, and antigen-binding domain;
•Shattuck Labs, Inc.: Agonist Redirected Antibody platform claimed to bind tumor-necrosis factor (TNF) and checkpoint targets;
•Ablynx NV (Nanobody®), purchased by Sanofi Pharma, Inc.: Platform technology of single-domain, heavy-chain antibody fragments derived from camelidae (e.g., camels and llamas);
•Regeneron, Inc.: VEGF Trap and VelociSuite® antibody technology platforms;
•Five Prime Therapeutics, Inc., purchased by Amgen Inc.: Proprietary protein library and rapid protein production and testing platform; and
•Merus N.V. (Merus Multiclonics® including Biclonics® and Triclonics®): Discovery, screening, and identification platform for bispecific and trispecific antibodies.
Intellectual Property
Our scientific platform and substantially all our intellectual property have been developed internally. As of December 31, 2023, our patent portfolio consists of over 100 granted and registered patents, and over 230 pending patent applications. Our existing patents and any patents that may issue from the pending applications are expected to expire between 2036 and 2043, not including any patent term extensions that may be afforded under the Federal Food, Drug, and Cosmetic Act, or FFDCA, (and the equivalent provisions in foreign jurisdictions) for any delays incurred during the regulatory approval process relating to human drug products (or processes for making or using human drug products) or any other type of patent term extensions that may be available. Patent applications in our portfolio are directed to various target domains, and research programs under development. Each of these patent applications is solely owned by us. As we continue the development of our scientific platform and target vIgDs and vTDs, we intend to continue pursuing intellectual property protection for these technologies.
We have in-licensed some intellectual property and trade secret materials on a non-exclusive basis. To date, such non-exclusive in-licenses are solely related to commercially-available cell lines involved in the manufacturing of our programs. To date, no other intellectual property related to our scientific platform has been in-licensed. We have out-licensed two programs under our TIP and SIP technologies to Adaptimmune on an exclusive basis. Additionally, pursuant to the AbbVie Agreement, we have granted AbbVie an exclusive option to purchase an exclusive worldwide license to acazicolcept. If AbbVie exercises the License Option, AbbVie will take over the future development and commercialization. Finally, pursuant to the Amgen Agreement, we have granted Amgen an exclusive license of certain intellectual property and have entered into a collaboration for the development and commercialization of up to four preclinical candidates generated from Alpine’s unique discovery platform. These candidates include previously undisclosed multi-specific fusion protein-based therapeutic candidates for autoimmune and inflammatory diseases. Of these candidates, two remain active as of December 31, 2023, and no other out-licenses have been made.
Although we do not believe our technology infringes any intellectual property rights owned by third parties, we are aware of one or more patents and patent applications that may relate to our technology. Third parties may assert claims against us alleging infringement of their intellectual property rights regardless of whether their allegations have merit. Allegations of infringement could harm our reputation, may result in the expenditure of significant resources to defend and resolve such allegations, and could require us to pay monetary damages if we are found to have infringed any third-party intellectual property rights.
35
Government Regulation
The FDA and comparable regulatory authorities in state and local jurisdictions and in other countries impose substantial and burdensome requirements on the clinical development, manufacture, marketing, and distribution of therapeutic candidates. These agencies and other federal, state, and local entities regulate research and development activities and the testing, manufacture, quality control, safety, effectiveness, labeling, storage, record keeping, approval, advertising and promotion, and export and import of therapeutic candidates and products.
In the U.S., the FDA regulates drugs, medical devices, and biologic products under the FFDCA, which is the implementing regulation of the FDA, and under other laws, including, in the case of biologics, the Public Health Service Act, or PHSA. Our potential therapeutic candidates and products will be subject to regulation by the FDA as biologics. Biologics require the submission of a Biologics License Application, or BLA, and approval by the FDA before being marketed in the U.S. None of our therapeutic candidates have been approved by the FDA for marketing in the U.S., and we currently have no BLAs pending. If we fail to comply with applicable FDA or other requirements at any time during the product development process, clinical testing, the approval process, or after approval, we may become subject to administrative or judicial sanctions. These sanctions could include the FDA’s refusal to approve pending applications, license suspension or revocation, withdrawal of an approval, warning letters, product recalls, product seizures, total or partial suspension of production or distribution, injunctions, fines, civil penalties, or criminal prosecution. Any FDA enforcement action could have a material adverse effect on us. The process required by the FDA before biologic therapeutic candidates may be marketed in the U.S. generally involves the following:
•completion of extensive preclinical laboratory tests, preclinical animal studies, and formulation studies all performed in accordance with the FDA’s current good laboratory practice, or cGLP, regulations;
•submission to the FDA of an Investigational New Drug, or IND, application which must become effective before human clinical trials in the U.S. may begin;
•performance of adequate and well-controlled human clinical trials to establish the safety and efficacy of the drug candidate for each proposed indication;
•submission to the FDA of a BLA;
•satisfactory completion of an FDA inspection of the manufacturing facility or facilities at which the product is produced to assess compliance with cGMP regulations; and
•FDA review and approval of the BLA prior to any commercial marketing, sale, or shipment of the therapeutic product.
The testing and approval process requires substantial time, effort, and financial resources, and we cannot be certain any approvals for our therapeutic candidates will be granted on a timely basis, if at all.
Once a therapeutic candidate is identified for development, it enters the preclinical testing stage. Preclinical studies include laboratory evaluations of protein chemistry, formulation, and stability, as well as studies to evaluate toxicity in animals. The results of the preclinical studies, together with manufacturing information and analytical data, are submitted to the FDA as part of an IND application. Currently, the IND automatically becomes effective 30 days after receipt by the FDA, unless the FDA, within the 30-day period, raises concerns or questions about the conduct of the clinical trial, including concerns that human research subjects will be exposed to unreasonable health risks. In such a case, the IND sponsor and the FDA must resolve any outstanding concerns before the clinical trial can begin. Submission of an IND may result in the FDA not allowing the clinical trials to commence or not allowing the clinical trials to commence on the terms originally specified in the IND. A separate submission to an existing IND must also be made for each successive clinical trial conducted during drug development, and the FDA must grant permission, either explicitly or implicitly by not objecting, before each clinical trial can begin.
Clinical trials involve the administration of the therapeutic candidate to human subjects under the supervision of qualified investigators. Clinical trials are conducted under protocols detailing, among other things, the objectives of the clinical trial, the parameters to be used in monitoring safety, and the effectiveness criteria to be used. Each protocol must be submitted to the FDA as part of the IND. For each medical center proposing to conduct a clinical trial, an institutional review board, or IRB, must also review and approve a plan for any clinical trial before it can begin at that center and the IRB must monitor the clinical trial until it is completed. The FDA, an IRB, or the sponsor may suspend or discontinue a clinical trial at any time on various grounds, including a finding that the subjects are being exposed to an unacceptable health risk. Clinical testing also must satisfy extensive Good Clinical Practice, or GCP, requirements, including the requirements for informed consent.
36
All clinical research performed in the U.S. in support of a BLA must be authorized in advance by the FDA under the IND regulations and procedures described above. However, a sponsor who wishes to conduct a clinical trial outside the U.S. may, but need not, obtain FDA authorization to conduct the clinical trial under an IND. If a foreign clinical trial is not conducted under an IND, the sponsor may submit data from the clinical trial to the FDA in support of a BLA so long as the clinical trial is conducted in compliance with an international guideline for the ethical conduct of clinical research known as the Declaration of Helsinki and/or the laws and regulations of the country or countries in which the clinical trial is performed, whichever provides the greater protection to the participants in the clinical trial.
Clinical Trials
For purposes of BLA submission and approval, clinical trials are typically conducted in three sequential phases, which may overlap or be combined.
•Phase 1 clinical trials are initially conducted in a limited population of subjects to test the therapeutic candidate for safety, dose tolerance, absorption, metabolism, distribution, and excretion in healthy humans or, on occasion, in patients with severe problems or life-threatening diseases to gain an early indication of its effectiveness.
•Phase 2 clinical trials are generally conducted in a limited patient population to evaluate preliminary efficacy of the therapeutic candidate for specific targeted indications in patients with the disease or condition under study, evaluate dosage tolerance and appropriate dosage, determine a dosage schedule, and identify possible adverse effects and safety risks.
•Phase 3, or pivotal clinical trials are commonly definitive efficacy studies of the experimental medication. Phase 3 trials are typically conducted when Phase 2 clinical trials demonstrate a dose range of the therapeutic candidate is effective and has an acceptable safety profile. Phase 3 clinical trials are generally undertaken with large numbers of patients, such as groups of several hundred to several thousand, to provide substantial evidence of clinical efficacy and to further test for safety in an expanded patient population at multiple, geographically-dispersed clinical trial sites.
In some cases, the FDA may condition approval of a BLA on the sponsor’s agreement to conduct additional post-approval clinical trials to further assess the biologic’s safety and effectiveness after BLA approval. Such post-approval clinical trials are typically referred to as Phase 4 clinical trials.
Concurrent with clinical trials, companies usually complete additional animal trials and must also develop additional information about the chemistry and physical characteristics of the biologic and finalize a process for manufacturing the biologic in commercial quantities in accordance with cGMP requirements. The manufacturing process must be capable of consistently producing quality batches of the therapeutic candidate and, among other things, the manufacturer must develop methods for testing the identity, strength, quality, and purity of the final biologic product. Additionally, appropriate packaging must be selected and tested, and stability studies must be conducted to demonstrate the therapeutic candidate does not undergo unacceptable deterioration over its shelf life. Further, clinical trial policies and regulations are subject to change by regulatory authorities, including in response to public health emergencies that may impact the safety of trial participants.
Biologics License Applications
The results of preclinical studies and of the clinical trials, together with other detailed information, including extensive manufacturing information and information on the chemistry, pharmacology, clinical pharmacology, and the clinical effects of the biologic, are submitted to the FDA in the form of a BLA requesting approval to market the biologic for one or more specified indications. The FDA reviews a BLA to determine, among other things, whether a biologic is safe, pure, and potent and whether the facility in which the biological product is manufactured, processed, packed, or held meets standards designed to assure the biological product continues to be safe, pure, and potent.
Once a BLA has been accepted for filing, by law the FDA will review the application and respond to the applicant, but the review process may be significantly delayed by FDA’s requests for additional information or clarification. Under the Prescription Drug User Fee Act, the FDA evaluates a standard original BLA submission within the first 60 days of its receipt to determine if it is sufficiently complete to conduct a full review, and the FDA has a goal of responding to the submission within ten months of the 60-day filing date, but this timeframe is often extended. The FDA may refer the application to an advisory committee for review, evaluation, and/or recommendation as to whether the application should be approved. The FDA is not bound by the recommendation of an advisory committee, but it generally follows such recommendations. The FDA may deny approval of a BLA if the applicable statutory and regulatory criteria are not satisfied, or for any reason, or it may require additional clinical data. Even if such data are submitted, the FDA may ultimately decide the BLA does not satisfy the criteria for approval. Data from clinical trials are not always conclusive and the FDA may interpret data differently than we interpret data. Once the FDA approves a BLA, or supplement thereto, the FDA may withdraw the approval if ongoing regulatory
37
requirements are not met or if safety problems are identified after the biologic reaches the market. Where a withdrawal may not be appropriate, the FDA still may seize existing inventory of such biologic or require a recall of any biologic already on the market. In addition, the FDA may require testing, including Phase 4 clinical trials and surveillance programs to monitor the effect of approved biologics which have been commercialized. The FDA has the authority to prevent or limit further marketing of a biologic based on the results of these post-marketing programs.
A sponsor may also seek approval of its therapeutic candidates under programs designed to accelerate FDA review and approval of BLAs. For instance, a sponsor may seek FDA designation of a therapeutic candidate as a “fast track product.” Fast track products are those products intended for the treatment of a serious or life-threatening disease or condition and which demonstrate the potential to address unmet medical needs for such diseases or conditions. If fast track designation is obtained, the FDA may initiate review of sections of a BLA before the application is complete. This “rolling review” is available if the applicant provides, and the FDA approves, a schedule for the remaining information. In some cases, a fast track product may be approved on the basis of either a surrogate endpoint that is reasonably likely to predict clinical benefit, or on a clinical endpoint that can be measured earlier than irreversible morbidity or mortality, that is reasonably likely to predict an effect on irreversible morbidity or mortality or other clinical benefit, taking into account the severity, rarity, or prevalence of the condition and the availability or lack of alternative treatments, under the FDA’s accelerated approval program. Approvals of this kind typically include requirements for appropriate post-approval confirmatory clinical trials to validate the surrogate endpoint or otherwise confirm the effect of the clinical endpoint. The Food and Drug Omnibus Reform Act made several changes to the FDA’s authorities and its regulatory framework, including, among other changes, reforms to the accelerated approval pathway, such as requiring the FDA to specify conditions for post-approval study requirements and setting forth procedures for the FDA to withdraw a product on an expedited basis for non-compliance with post-approval requirements.
In addition, the Food and Drug Administration Safety and Innovation Act, or FDASIA, which was enacted and signed into law in 2012, established a new category of drugs referred to as “breakthrough therapies” that may be subject to accelerated approval. A sponsor may seek FDA designation of a drug candidate as a “breakthrough therapy” if the drug is intended, alone or in combination with one or more other drugs, to treat a serious or life-threatening disease or condition and preliminary clinical evidence indicates the drug may demonstrate substantial improvement over existing therapies on one or more clinically significant endpoints, such as substantial treatment effects observed early in clinical development.
Therapeutic candidates may also be eligible for “priority review,” or review within a six-month timeframe from the 60-day filing date, if a sponsor provides sufficient clinical data demonstrating its therapeutic candidate provides a significant improvement compared to marketed products. Even if a therapeutic candidate qualifies for one or more of these programs, the FDA may later decide the therapeutic candidate no longer meets the conditions for qualification or that the period for FDA review or approval will be lengthened. When appropriate, we intend to seek fast track designation and/or accelerated approval for our biologics. We cannot predict whether any of our therapeutic candidates will obtain a fast track and/or accelerated approval designation and, if so, whether such designation will be maintained or rescinded by FDA, or the ultimate impact, if any, of the fast track or the accelerated approval process on the timing or likelihood of FDA approval of any of our proposed biologics.
Biologics may be marketed only for the FDA-approved indications and in accordance with the provisions of the approved labeling. Further, if there are any modifications to the biologic, including changes in indications, labeling, or manufacturing processes, equipment, or facilities, the applicant may be required to submit and obtain FDA approval of a new BLA or BLA supplement, which may require us to develop additional data or conduct additional preclinical studies and clinical trials.
Before approving an application, the FDA will inspect the facility or the facilities at which the biologic product is manufactured and will not approve the product unless cGMP compliance is satisfactory. The FDA may also inspect the sites at which the clinical trials were conducted to assess their compliance and will not approve the biologic unless compliance with GCP requirements is satisfactory.
The testing and approval processes require substantial time, effort, and financial resources, and each may take several years to complete. The FDA may not grant approval on a timely basis, or at all. Even if we believe a clinical trial has demonstrated safety and efficacy of one of our therapeutic candidates for the treatment of a disease, the results may not be satisfactory to the FDA. Preclinical and clinical data may be interpreted by the FDA in different ways, which could delay, limit, or prevent regulatory approval. We may encounter difficulties or unanticipated costs in our efforts to secure necessary governmental approvals which could delay or preclude us from marketing our therapeutic candidates. The FDA may limit the indications for use or place other conditions on any approvals restricting the commercial application of the products. After approval, certain changes to the approved biologic, such as adding new indications, change in personnel, manufacturing changes, or additional labeling claims, are subject to further FDA review and approval. Depending on the nature of the change proposed, a BLA supplement which may require additional studies to evaluate the effect of such change on the identity,
38
strength, quality, purity, or potency of the product as they may relate to the safety or effectiveness of the product—must be filed and approved before the change may be implemented. As with new BLAs, the review process for BLA supplements may be delayed by the FDA through requests for additional information or clarification.
We believe any of our therapeutic products approved as a biological product under a BLA might qualify for a 12-year period of exclusivity currently permitted by the Biologics Price Competition and Innovation Act of 2009, or BPCIA. Specifically, the BPCIA established an abbreviated pathway for the approval of biosimilar and interchangeable biological products. The new abbreviated regulatory pathway establishes legal authority for the FDA to review and approve biosimilar biologics, including the possible designation of a biosimilar as “interchangeable” based on its similarity to an existing brand product. Under the BPCIA, an application for a biosimilar product cannot be submitted by an applicant until four years after the date the reference product was first licensed and cannot be approved by the FDA until 12 years after the original branded product was first licensed under a BLA. There is a risk the U.S. Congress could amend the BPCIA to significantly shorten this exclusivity period or the FDA will not consider our therapeutic candidates to be reference products for competing products, potentially creating the opportunity for competition sooner than anticipated. Moreover, the extent to which a biosimilar, once approved, will be substituted for any one of our reference products in a way similar to traditional generic substitution for non-biological products is not yet clear, and will depend on a number of marketplace and regulatory factors that are still developing. The BPCIA is complex and is only beginning to be interpreted and implemented by the FDA and the courts. As a result, its ultimate impact, implementation, and meaning are subject to uncertainty. While it is uncertain when any such processes may be fully adopted by the FDA, any such processes operating to limit the scope or length of exclusivity afforded by the BPCIA could have a material adverse effect on the future commercial prospects for our biological products. In addition, foreign regulatory authorities may also provide for exclusivity periods for approved biological products or for abbreviated pathways for follow on biological products. For example, biological products in Europe may be eligible for a 10-year period of exclusivity.
Under the Orphan Drug Act, the FDA may grant orphan drug designation to therapeutic candidates intended to treat a rare disease or condition, which is generally a disease or condition affecting fewer than 200,000 individuals in the U.S. or more than 200,000 individuals in the U.S. and for which there is no reasonable expectation the cost of developing and making available in the U.S. a therapeutic candidate for this type of disease or condition will be recovered from sales in the U.S. for that therapeutic candidate. Orphan drug designation must be requested before submitting a marketing application for the therapeutic for that particular rare disease or condition. After the FDA grants orphan drug designation, the identity of the therapeutic agent and its potential orphan use are disclosed publicly by the FDA. Orphan drug designation does not convey any advantage in, or shorten the duration of, the regulatory review and approval process. The FDA may revoke orphan drug designation, and if it does, it will publicize the drug is no longer designated as an orphan drug. If a therapeutic candidate with orphan drug designation subsequently receives the first FDA approval for the disease for which it has such designation, the therapeutic candidate is entitled to orphan product exclusivity, which means the FDA may not approve any other applications to market the same therapeutic candidate for the same indication, except in very limited circumstances, for seven years. Orphan drug exclusivity, however, could also block the approval of one of our therapeutic candidates for seven years if a competitor obtains approval of the same therapeutic candidate as defined by the FDA or if our therapeutic candidate is determined to be contained within the competitor’s therapeutic candidate for the same indication or disease. In response to the court decision in Catalyst Pharms., Inc. v. Becerra, 14 F.4th 1299 (11th Cir. 2021), the FDA published a notice in the Federal Register in January 2023 to clarify that while the agency complies with the court’s order in Catalyst, FDA intends to continue to apply its longstanding interpretation of the regulations to matters outside of the scope of the Catalyst order – that is, the agency will continue tying the scope of orphan-drug exclusivity to the uses or indications for which a drug is approved, which permits other sponsors to obtain approval of a drug for new uses or indications within the same orphan designated disease or condition that have not yet been approved. It is unclear how future litigation, legislation, agency decisions, and administrative actions will impact the scope of the orphan drug exclusivity.
Under the Best Pharmaceuticals for Children Act, certain therapeutic candidates may obtain an additional six months of exclusivity if the sponsor submits information requested in writing by the FDA, referred to as a “Written Request,” relating to the use of the active moiety of the therapeutic candidate in children. The FDA may not issue a Written Request for studies on unapproved or approved indications where it determines information relating to the use of a therapeutic candidate in a pediatric population, or part of the pediatric population, may not produce health benefits in that population. In addition, the Pediatric Research Equity Act, or PREA, requires a sponsor to conduct pediatric studies for most therapeutic candidates and biologics, for a new active ingredient, new indication, new dosage form, new dosing regimen, or new route of administration. Under PREA, original or New Drug Applications, or NDAs, BLAs and supplements thereto must contain a pediatric assessment unless the sponsor has received a deferral or waiver. The required assessment must assess the safety and effectiveness of the therapeutic candidate for the claimed indications in all relevant pediatric subpopulations and support dosing and administration for each pediatric subpopulation for which the therapeutic candidate is safe and effective. The sponsor or the FDA may request a deferral of pediatric studies for some or all of the pediatric subpopulations. A deferral may be granted for several reasons, including a finding that the drug or biologic is ready for approval for use in adults before pediatric studies are complete or
39
additional safety or effectiveness data needs to be collected before the pediatric studies begin. The FDA must send a noncompliance letter to any sponsor that fails to submit the required assessment, keep a deferral current, or fails to submit a request for approval of a pediatric formulation.
Other Regulatory Requirements
Any biologics manufactured or distributed by us or our collaborators pursuant to FDA approvals would be subject to continuing regulation by the FDA, including recordkeeping requirements and reporting of adverse experiences associated with the product. Manufacturers and their subcontractors are required to register their establishments with the FDA and certain state agencies and are subject to periodic unannounced inspections by the FDA and certain state agencies for compliance with ongoing regulatory requirements, including cGMPs, which impose certain procedural and documentation requirements upon us and third-party manufacturers. Failure to comply with the statutory and regulatory requirements can subject a manufacturer to possible legal or regulatory action, such as warning letters, suspension of manufacturing, seizure of product, injunctive action or possible civil penalties. Our company cannot be certain it or its present or future third-party manufacturers or suppliers will be able to comply with the cGMP regulations and other ongoing FDA regulatory requirements. If our company or its present or future third-party manufacturers or suppliers are not able to comply with these requirements, the FDA may halt our clinical trials, require us to recall a drug from distribution, or withdraw approval of the BLA for the therapeutic product.
The FDA closely regulates the post-approval marketing and promotion of biologics, including standards and regulations for direct-to-consumer advertising, off-label promotion, industry-sponsored scientific and educational activities, and promotional activities involving the Internet. A company can make only those claims relating to safety and efficacy approved by the FDA. Failure to comply with these requirements can result in adverse publicity, warning letters, corrective advertising, and potential civil and criminal penalties. Physicians may prescribe legally available biologics for uses not described in the product’s labeling and different from those tested by us and approved by the FDA. Such off-label uses are common across medical specialties. Physicians may believe such off-label uses are the best treatment for many patients in varied circumstances. The FDA does not regulate the behavior of physicians in their choice of treatments. The FDA does, however, impose stringent restrictions on manufacturers’ communications regarding off-label use.
Healthcare Reform
In 2010, Congress passed the Patient Protection and Affordable Care Act, as amended by the Health Care and Education Reconciliation Act, which we refer to as the ACA, a sweeping law intended to broaden access to health insurance, reduce or constrain the growth of health spending, enhance remedies against fraud and abuse, add new transparency requirements for the healthcare and health insurance industries, impose new taxes and fees on the health industry, and impose additional policy reforms. The ACA contains a number of provisions, including those governing enrollment in federal healthcare programs, reimbursement changes, and fraud and abuse, impacting existing government healthcare programs and resulting in the development of new programs, including Medicare payment for performance initiatives, and improvements to the physician quality reporting system and feedback program. The ACA also does, among other things, the following:
•Increases pharmaceutical manufacturer rebate liability under the Medicaid Drug Rebate Program due to an increase in the minimum basic Medicaid rebate on most branded prescription drugs, and the application of Medicaid rebate liability to drugs used in risk-based Medicaid managed care plans.
•Expands the 340B Drug Pricing Program to require discounts for “covered outpatient drugs” sold to certain children’s hospitals, critical access hospitals, freestanding cancer hospitals, rural referral centers, and sole community hospital.
•Requires pharmaceutical companies to offer discounts on brand-name drugs to patients who fall within the Medicare Part D coverage gap, commonly referred to as the “Donut Hole.”
•Requires pharmaceutical companies to pay an annual non-tax-deductible fee to the federal government based on each company’s market share of prior year total sales of branded drugs to certain federal healthcare programs, such as Medicare, Medicaid, Department of Veterans Affairs, and Department of Defense.
•Establishes the Patient-Centered Outcomes Research Institute to identify priorities in, and conduct comparative clinical effectiveness research, along with funding for such research. The research conducted by the Patient-Centered Outcomes Research Institute may affect the market for certain pharmaceutical products.
•Establishes the Center for Medicare and Medicaid Innovation within the Centers for Medicare and Medicaid Services, or CMS to test innovative payment and service delivery models to lower Medicare and Medicaid spending, potentially including prescription drug spending.
40
From time to time, legislation is drafted, introduced, and passed in Congress that could significantly change the statutory provisions governing the sale, marketing, coverage, and reimbursement of products regulated by the CMS or other government agencies. In addition to new legislation, CMS regulations and policies are often revised or interpreted by the agency in ways significantly affecting our business and our products.
Since its enactment, there have been judicial and Congressional challenges to certain aspects of the ACA, and we expect there will be additional challenges and amendments to the ACA in the future. For example, in June 2021, the United States Supreme Court held that Texas and other challengers had no legal standing to challenge the ACA, dismissing the case without specifically ruling on the constitutionality of the ACA. Accordingly, the ACA remains in effect in its current form. It is unclear how this Supreme Court decision, future litigation, or healthcare measures promulgated by the Biden administration will impact our business, financial condition and results of operations. Complying with any new legislation or changes in healthcare regulation could be time-intensive and expensive, resulting in material adverse effect on our business.
Additionally, under the American Rescue Plan Act of 2021, the statutory cap on Medicaid Drug Rebate Program rebates that manufacturers pay to state Medicaid programs was eliminated. Elimination of this cap may require pharmaceutical manufacturers to pay more in rebates than it receives on the sale of products, which could have a material impact on our business. Additionally, in July 2021, the Biden administration released an executive order, “Promoting Competition in the American Economy,” with multiple provisions aimed at prescription drugs. In response to Biden’s executive order, on September 9, 2021, the Department of Health and Human Services, or HHS, released a Comprehensive Plan for Addressing High Drug Prices that outlines principles for drug pricing reform and sets out a variety of potential legislative policies that Congress could pursue as well as potential administrative actions HHS can take to advance these principles. In August 2022, Congress passed the Inflation Reduction Act of 2022, or IRA, which includes prescription drug provisions that have significant implications for the pharmaceutical industry and Medicare beneficiaries, including allowing the federal government to negotiate a maximum fair price for certain high-priced single source Medicare drugs, imposing penalties and excise tax for manufacturers that fail to comply with the drug price negotiation requirements, requiring inflation rebates for all Medicare Part B and Part D drugs, with limited exceptions, if their drug prices increase faster than inflation, and redesigning Medicare Part D to reduce out-of-pocket prescription drug costs for beneficiaries, among other changes. Various industry stakeholders, including pharmaceutical companies and the Pharmaceutical Research and Manufacturers of America, have initiated lawsuits against the federal government asserting that the price negotiation provisions of the IRA are unconstitutional. The impact of these judicial challenges, legislative, executive, and administrative actions and any future healthcare measures and agency rules implemented by the Biden administration on us and the pharmaceutical industry as a whole is unclear. The implementation of cost containment measures or other healthcare reforms may prevent us from being able to generate revenue, attain profitability, or commercialize our product candidates if approved. Complying with any new legislation and regulatory changes could be time-intensive and expensive, resulting in a material adverse effect on our business.
Further, many states have proposed or enacted legislation that seeks to indirectly or directly regulate pharmaceutical drug pricing, such as by requiring biopharmaceutical manufacturers to publicly report proprietary pricing information or to place a maximum price ceiling on pharmaceutical products purchased by state agencies. For example, a number of states are considering or have recently enacted state drug price transparency and reporting laws that could substantially increase our compliance burdens and expose us to greater liability under such state laws once we begin commercialization after obtaining regulatory approval for any of our products candidates. The FDA recently authorized the state of Florida to import certain prescription drugs from Canada for a period of two years to help reduce drug costs, provided that Florida’s Agency for Health Care Administration meets the requirements set forth by the FDA. Other states may follow Florida. We cannot be sure to what extent these and future legislative and regulatory efforts, whether FDA regulations, guidance or interpretations will be changed, or what the impact of such changes on the marketing approvals of our product candidates, if any, may be. In addition, increased scrutiny by Congress of the FDA’s approval process may significantly delay or prevent marketing approval, as well as subject us to more stringent product labeling and post-marketing testing and other requirements. These measures could reduce the ultimate demand for our products, once approved, or put pressure on our product pricing. We expect that additional state and federal healthcare reform measures will be adopted in the future, any of which could limit the amounts that federal and state governments will pay for healthcare products and services, which could affect the prices we may obtain for any of our product candidates for which we may obtain regulatory approval or the frequency with which any such product candidate, if approved, is prescribed or used.
Furthermore, political, economic, and regulatory influences are subjecting the health care industry in the U.S. to fundamental change. Initiatives to reduce the federal budget and debt and to reform health care coverage are increasing cost-containment efforts. We anticipate federal agencies, Congress, state legislatures, and the private sector will continue to review and assess alternative health care benefits, controls on health care spending, and other fundamental changes to the healthcare delivery system. Any proposed or actual changes could limit coverage for, or the amounts federal and state governments will pay for, health care products and services, which could also result in reduced demand for our products or additional pricing pressures, and limit or eliminate our spending on development projects and affect our ultimate profitability.
41
Third-Party Payor Coverage and Reimbursement
Significant uncertainty exists as to the coverage and reimbursement status of any products for which we may obtain regulatory approval. In the U.S., sales of any products for which we may receive regulatory approval for commercial sale will depend in part on the availability of coverage and reimbursement from third-party payors. Third-party payors include government authorities such as Medicare, Medicaid, TRICARE, and the Veterans Administration, managed care providers, private health insurers and other organizations.
The Medicaid Drug Rebate Program, which is part of the federal Medicaid program, a program for financially needy patients, among others, requires pharmaceutical manufacturers to enter into and have in effect a national rebate agreement with the Secretary of the Department of Health and Human Services as a condition for states to receive federal matching funds for the manufacturer’s outpatient drugs furnished to Medicaid patients.
In order for a pharmaceutical product to receive federal reimbursement under Medicare Part B, part of the federal Medicare program covering outpatient items and services for the aged and disabled, and Medicaid programs or to be sold directly to U.S. government agencies, the manufacturer must extend discounts to entities eligible to participate in the 340B drug pricing program, a federal program requiring manufacturers to provide discounts to certain safety-net providers. The required 340B discount on a given product is calculated based upon certain Medicaid Drug Rebate Program metrics reported by the manufacturer.
The process for determining whether a payor will provide coverage for a product is typically separate from the process for setting the reimbursement rate a payor will pay for the product. Third-party payors may limit coverage to specific products on an approved list or formulary which might not include all of the FDA-approved products for a particular indication. Also, third-party payors may refuse to include a particular branded product on their formularies or otherwise restrict patient access to a branded drug when a less costly generic equivalent or other alternative is available. However, under Medicare Part D - Medicare’s outpatient prescription drug benefit - there are protections in place to ensure coverage and reimbursement for oncology products and all Part D prescription drug plans are required to cover substantially all anti-cancer agents. Furthermore, a payor’s decision to provide coverage for a product does not imply an adequate reimbursement rate will be available. Adequate third-party reimbursement may not be available to enable us to maintain price levels sufficient to realize an appropriate return on our investment in product development.
Third-party payors are increasingly challenging the price and examining the medical necessity and cost-effectiveness of medical products and services, in addition to their safety and efficacy. In order to obtain coverage and reimbursement for any product approved for sale, we may need to pursue compendia listings or conduct expensive pharmacoeconomic studies in order to demonstrate the medical necessity and cost-effectiveness of any products, in addition to the costs required to obtain regulatory approvals. Our drug candidates may not be considered medically necessary or cost-effective. If third-party payors do not consider a product to be cost-effective compared to other available therapies, they may not cover an approved product as a benefit under their plans or, if they do, the level of payment may not be sufficient to allow a company to sell its products at a profit.
Other Healthcare Laws and Regulations
In the United States, the research, manufacturing, distribution, sale and promotion of drug products are subject to regulation by various federal, state and local authorities in addition to the FDA, including the Centers for Medicare & Medicaid Services, other divisions of the U.S. Department of Health and Human Services (e.g., the Office of Inspector General), the U.S. Department of Justice, state attorneys general, and other state and local government agencies.
If we obtain regulatory approval of our products, we may be subject to various federal and state laws targeting fraud and abuse in the healthcare industry. These laws may impact, among other things, our proposed sales and marketing strategies. In addition, we may be subject to patient privacy regulation by both the federal government and the states in which we conduct our business. The laws affecting our ability to operate include, but are not limited to:
•the federal Anti-Kickback Statute, which prohibits, among other things, persons from knowingly and willfully soliciting, receiving, offering, or paying remuneration (a term interpreted broadly to include anything of value, including, for example, gifts, discounts, and credits), directly or indirectly, in cash or in kind, to induce or reward, or in return for, either the referral of an individual for, or the purchase, order, or recommendation of, an item or service reimbursable under a federal health care program, such as the Medicare and Medicaid programs;
•federal civil and criminal false claims laws and civil monetary penalty laws, which prohibit, among other things, individuals or entities from knowingly presenting, or causing to be presented, claims for payment to Medicare, Medicaid, or other third-party payors that are false or fraudulent, or making a false statement or record material to
42
payment of a false claim or avoiding, decreasing, or concealing an obligation to pay money owed to the federal government;
•provisions of the U.S. federal Health Insurance Portability and Accountability Act, or HIPAA, prohibiting knowingly and willfully executing a scheme to defraud any health care benefit program and making false statements relating to health care matters;
•provisions of HIPAA, as amended by the Health Information Technology for Economic and Clinical Health Act, or HITECH, and its implementing regulations, which imposes certain requirements relating to the privacy, security, and transmission of individually identifiable health information;
•the federal transparency laws, including the federal Physician Payment Sunshine Act, which was part of the ACA, requiring applicable manufacturers of certain drugs and biologics, among other covered medical products for which payment is available under Medicare, Medicaid or the Children’s Health Insurance Program, with certain exceptions, to track and report annually certain payments and other transfers of value they make to covered recipients, including U.S. physicians (defined to include doctors, dentists, optometrists, podiatrists and chiropractors), other health care professionals (such as nurse practitioners and physician assistants, among others) and teaching hospitals, as defined by law, as well as physicians’ and physicians’ immediate family members’ ownership and investment interests in the applicable manufacturer, which are subsequently made publicly available in a searchable format on the CMS Open Payments website; and
•state law equivalents of each of the above federal laws, such as anti-kickback and false claims laws which may apply to items or services reimbursed by any third-party payor, including commercial insurers, state transparency reporting and compliance laws, and state and foreign laws governing the privacy and security of health information in certain circumstances, many of which differ from each other in significant ways and may not have the same effect, thus complicating compliance efforts.
The ACA broadened the reach of the fraud and abuse laws by, among other things, amending the intent requirement of the federal Anti-Kickback Statute and the applicable criminal healthcare fraud statutes contained within 42 U.S.C. § 1320a-7b. Pursuant to the statutory amendment, a person or entity no longer needs to have actual knowledge of this statute or specific intent to violate it in order to have committed a violation. In addition, the ACA provides the government may assert a claim including items or services resulting from a violation of the federal Anti-Kickback Statute constitutes a false or fraudulent claim for purposes of the civil False Claims Act or the civil monetary penalties statute. Many states have adopted laws similar to the federal Anti-Kickback Statute, some of which apply to the referral of patients for healthcare items or services reimbursed by any source, not only the Medicare and Medicaid programs.
If our operations are found to be in violation of any of the U.S. federal and state laws described above or any other governmental regulations that apply to us, we may be subject to penalties, including criminal and significant civil monetary penalties, damages, fines, disgorgement, imprisonment, exclusion from participation in government healthcare programs, injunctions, recall or seizure of products, total or partial suspension of production, denial or withdrawal of pre-marketing product approvals, private qui tam actions brought by individual whistleblowers in the name of the government or refusal to allow us to enter into supply contracts, including government contracts, and the curtailment or restructuring of our operations, any of which could adversely affect our ability to operate our business and our results of operations. We may also be subject to additional reporting requirements and oversight if we become subject to a corporate integrity agreement or similar agreement with a governmental entity to resolve allegations that we have violated these laws. To the extent that any of our product candidates, once approved, are sold in a foreign country, we may be subject to similar foreign laws and regulations, which may include, for instance, applicable post-approval requirements, including safety surveillance, anti-fraud and abuse laws, and implementation of corporate compliance programs and reporting of payments or transfers of value to healthcare professionals.
Human Capital
Our employees share a passion for meaningful work and are committed to solving the most complex problems in creating immunotherapies to treat autoimmune and inflammatory diseases. Our culture is guided by our core values of innovative thinking, collaboration, flexibility, bias for action, and healthy debate. As of December 31, 2023, we had 142 employees, of which 113 are engaged in research and development activities and 29 in general and administrative. None of our employees are represented by labor unions or covered by collective bargaining agreements. We consider our relationship with our employees to be good.
43
We believe that we provide competitive compensation and benefits for our personnel and that our compensation and benefit packages are designed to attract and retain highly qualified personnel essential to our business. In addition to salary compensation, our compensation includes new equity grants, a 401(k) retirement plan, healthcare and insurance benefits and a flexible paid time off policy.
We are committed to diversity, equity and inclusion. We recruit the best qualified employees regardless of gender, ethnicity or other protected traits and it is our policy to comply with all applicable laws related to discrimination in the workplace.
Corporate Information
On July 24, 2017, Alpine Immune Sciences, Inc., completed its business combination with Nivalis Therapeutics, Inc., or Nivalis, a publicly held company. In connection with the merger, Nivalis changed its name to Alpine Immune Sciences, Inc. Nivalis was incorporated in Delaware in March 2007. Alpine Immune Sciences, Inc. (prior to its business combination with Nivalis) was incorporated in Delaware on December 30, 2014.
Our principal executive office is located at 188 East Blaine Street, Suite 200, Seattle WA, 98102. Our telephone number is (206) 788-4545. Our website is www.alpineimmunesciences.com. Information contained in, or that can be accessed through, our website is not a part of, and is not incorporated into, this report.
44
Item 1A. Risk Factors
You should carefully consider the following risk factors, in addition to the other information contained in this Annual Report on Form 10-K, including Management’s Discussion and Analysis of Financial Condition and Results of Operations included in Part II, Item 7, and our consolidated financial statements and related notes. If any of the events described in the following risk factors and the risks described elsewhere in this report occurs, our business, operating results and financial condition could be seriously harmed. Our Risk Factors are not guarantees that no such conditions exist as of the date of this report and should not be interpreted as an affirmative statement that such risks or conditions have not materialized, in whole or in part. This report on Form 10-K also contains forward-looking statements that involve risks and uncertainties. Our actual results could differ materially from those anticipated in the forward-looking statements as a result of factors that are described below and elsewhere in this report.
Risks Related to Our Pipeline and Product Development
Our approach to the discovery and development of innovative therapeutic treatments based on our technology is unproven and may not result in marketable products.
We plan to develop novel protein-based immunotherapies in part via our proprietary directed evolution platform for the treatment of autoimmune and inflammatory diseases. The potential to create therapies capable of working within and/or modulating an immune synapse, forcing a synapse to occur, or preventing a synapse from occurring is an important, novel attribute of the majority of our approaches. However, the scientific research underlying our efforts to develop therapeutic candidates based on our platform is relatively new. Further, the scientific evidence to support the feasibility of developing therapeutic treatments based on our platform is both preliminary and limited.
Relatively few therapeutic candidates based on IgSF domains or TNFRSF domains have been tested in humans. We may discover the therapeutic candidates developed using our scientific platform do not possess certain properties required for the therapeutic candidate to be effective. We currently have only limited data to suggest we can introduce these necessary therapeutic properties into vIgD- or vTD- based therapeutic candidates. In addition, vIgDs or vTDs may demonstrate different chemical and pharmacological properties in human subjects or patients than they do in laboratory studies. Even if our programs have successful results in animal studies, they may not demonstrate the same chemical and pharmacological properties in humans and may interact with human biological systems in unforeseen, ineffective, or harmful ways. While we continue to evaluate our vIgDs and vTDs preclinically and clinically, their risk profiles in humans are still being fully assessed. Undesirable side effects that may be caused by our therapeutic candidates could cause us or regulatory authorities to interrupt, delay or halt clinical trials and could result in a more restrictive label or the delay or denial of regulatory approval by the FDA or other comparable foreign authorities. Such side effects could also affect patient recruitment or the ability of enrolled patients to complete clinical trials or result in potential product liability claims. For example, we voluntarily terminated enrollment in both clinical studies involving davoceticept, including the NEON-1 study of davoceticept as monotherapy and the NEON-2 study of davoceticept in combination with pembrolizumab. The decision to terminate enrollment in the davoceticept studies was made following notification of a second Grade 5 serious adverse event (death) in the NEON-2 study. Occurrences like these may harm our business, financial condition and prospects significantly. As a result, we may never succeed in developing a marketable therapeutic, we may not become profitable, and the value of our common stock may decline.
Further, we believe that the FDA has little prior experience with vIgDs or vTDs, which may increase the complexity, uncertainty, and length of the regulatory approval process for our therapeutic candidates. Our company and our current collaborators, or any future collaborators, may never receive approval to market and commercialize any therapeutic candidate. Even if our company or a collaborator obtains regulatory approval, the approval may be for disease indications or patient populations not as broad as we intended or desired or may require labeling, including significant use or distribution restrictions or safety warnings. Our company or a collaborator may be required to perform additional or unanticipated clinical trials to obtain approval or be subject to post-marketing testing requirements to maintain regulatory approval. If therapeutic candidates we develop using our scientific platform prove to be ineffective, unsafe, or commercially unviable, our entire platform and pipeline would have little, if any, value, which could have a material adverse effect on our business, financial condition, results of operations, and prospects.
The market may not be receptive to our therapeutic products based on a novel therapeutic modality, and we may not generate any future revenue from the sale or licensing of therapeutic products.
Even if approval is obtained for a therapeutic candidate, we may not generate or sustain revenue from sales of the therapeutic product due to factors such as whether the therapeutic product can be sold at a competitive price and otherwise
45
accepted in the market. Therefore, any revenue from sales of the therapeutic product may not offset the costs of development. The therapeutic candidates we are developing are based on new technologies and therapeutic approaches. Market participants with significant influence over acceptance of new treatments, such as physicians and third-party payors, may not adopt a treatment based on our therapeutic products, and we may not be able to convince the medical community and third-party payors to accept and use, or to provide favorable coverage or reimbursement for, any therapeutic products developed by our company, our existing collaborators, or any future collaborators. Market acceptance of our therapeutic products will depend on, among other factors:
•the timing of any marketing and commercialization approvals;
•the geographies, terms and scope of any approvals;
•the safety and efficacy of our therapeutic products;
•the prevalence and severity of any adverse side effects associated with our therapeutic products and other therapeutics of the same type or class as our therapeutic products;
•limitations or warnings contained in any labeling approved by the FDA or other regulatory authorities;
•relative convenience and ease of administration of our therapeutic products;
•the willingness of patients to accept, and the willingness of physicians to prescribe, any new methods of administration;
•the success of our physician education programs;
•the availability of adequate government and third-party payor coverage and reimbursement;
•the willingness of patients to pay out-of-pocket in the absence of coverage by government and third-party payors;
•the pricing of our products, particularly as compared to alternative treatments;
•our ability to compliantly and effectively market and sell our products;
•the timing of market introduction of our therapeutic products as well as alternative treatments; and
•availability of alternative effective treatments for the disease indications our therapeutic products are intended to treat and the relative risks, benefits, and costs of those treatments.
With our development focus, these risks may increase to the extent this field becomes more competitive or less favored in the commercial marketplace. Additional risks apply in relation to any disease indications we pursue which are classified as rare diseases and allow for orphan drug designation by regulatory agencies in major commercial markets, such as the United States, the European Union, and Japan. Because of the small patient population for a rare disease, if pricing is not approved or accepted in the market at an appropriate level for an approved therapeutic product with orphan drug designation, such therapeutic product may not generate enough revenue to offset costs of development, manufacturing, marketing, and commercialization despite any benefits received from the orphan drug designation, such as market exclusivity, assistance in clinical trial design, or a reduction in user fees or tax credits related to development expense. Market size is also a variable in disease indications classified as rare. Our estimates regarding potential market size for any rare indication may be materially different from what we discover to exist at the time we commence commercialization, if any, for a therapeutic product, which could result in significant changes in our business plan and have a material adverse effect on our business, financial condition, results of operations, and prospects.
If a therapeutic product with orphan drug designation subsequently receives the first FDA approval for the indication for which it has such designation, such therapeutic product is entitled to orphan product exclusivity, which means the FDA may not approve any other applications to market the same therapeutic product for the same indication, except in very limited circumstances, for seven years. Orphan drug exclusivity, however, could also block the approval of one of our therapeutic products for seven years if a competitor obtains approval of the same therapeutic product as defined by the FDA or if our therapeutic product is determined to be within the same class as the competitor’s therapeutic product for the same indication or disease. In response to the court decision in Catalyst Pharms., Inc. v. Becerra, 14 F.4th 1299 (11th Cir. 2021), on January 24, 2023, the FDA published a notice in the Federal Register to clarify that while the agency complies with the court’s order in Catalyst, FDA intends to continue to apply its longstanding interpretation of the regulations to matters outside of the scope of the Catalyst order – that is, the agency will continue tying the scope of orphan-drug exclusivity to the uses or indications for which a drug is approved, which permits other sponsors to obtain approval of a drug for new uses or indications within the same orphan designated disease or condition that have not yet been approved. It is unclear how future litigation, legislation, agency decisions, and administrative actions will impact the scope of the orphan drug exclusivity.
46
As in the United States, we may apply for designation of a therapeutic product as an orphan drug for the treatment of a specific indication in the European Union before the application for marketing authorization is made. Sponsors of orphan drugs in the European Union can enjoy economic and marketing benefits, including up to ten years of market exclusivity for the approved indication unless another applicant can show its therapeutic product is safer, more effective, or otherwise clinically superior to the orphan-designated therapeutic product. The respective orphan designation and exclusivity frameworks in the United States and in the European Union are subject to change, and any such changes may affect our ability to obtain EU or U.S. orphan drug designations in the future.
Our therapeutic candidates are in early stages of development and may fail in development or suffer delays that materially and adversely affect their commercial viability.
We have no products on the market and all of our therapeutic candidates are in early stages of development. Our ability to achieve and sustain profitability depends on obtaining regulatory approval and IRB approval to conduct clinical trials at particular sites, obtaining regulatory approvals to market our therapeutic candidates and successfully commercializing our therapeutic candidates, either alone or with third parties, such as our collaborators. Before obtaining regulatory approval for the commercial distribution of our therapeutic candidates, we or a collaborator must conduct extensive preclinical tests and clinical trials to demonstrate the safety and efficacy in humans of our therapeutic candidates. Preclinical testing and clinical trials are expensive, difficult to design and implement, can take many years to complete, and are uncertain as to outcome. For example, in October 2022, we announced the termination of enrollment of our clinical studies with davoceticept (NEON-1 and NEON-2) after we were notified of a second death in the NEON-2 study, which investigated davoceticept in combination with pembrolizumab. We are currently focused on advancing the development of povetacicept and acazicolcept; however, even with the significant investment of time and funding to advance these product candidates, we cannot guarantee that our clinical and preclinical development efforts will be successful. The start or end of a clinical study is often delayed or halted due to delays in or failure to obtain regulatory approval to commence the study, delays in or failure to reach agreement on acceptable terms with prospective contract research organizations, or CROs, or clinical trial sites, delays in or failure to obtain IRB approval at each site, changing regulatory requirements, manufacturing challenges, clinical sites or CROs deviating from the trial protocol or failing to comply with regulatory requirements or meet contractual obligations, slower than anticipated patient enrollment, changing standards of care, availability or prevalence of use of a comparative therapeutic or required prior therapy, clinical outcomes, failure of patients to complete the trial or return for post-treatment follow-up, or financial constraints. For instance, delays or difficulties in patient enrollment or difficulties in retaining trial participants can result in increased costs, longer development times, requirements to manufacture additional drug supply, or termination of a clinical trial. Clinical trials of a new therapeutic candidate require the enrollment of a sufficient number of patients, which may include patients who are suffering from the disease the therapeutic candidate is intended to treat and who meet other eligibility criteria. Rates of patient enrollment are affected by many factors, including the size of the patient population, the eligibility criteria for the clinical trial, the age and condition of the patients, the stage and severity of disease, the nature of the protocol, the proximity of patients to clinical sites, and the availability of effective treatments or competing academic and other clinical trials for the relevant disease.
A therapeutic candidate can unexpectedly fail at any stage of preclinical and clinical development. The historical failure rate for therapeutic candidates is high due to scientific feasibility, safety, efficacy, changing standards of medical care, and other variables. The novelty of our platform may mean our failure rates are higher than historical norms. The results from preclinical testing or early clinical trials of a therapeutic candidate may not predict the outcome of later phase clinical trials of the therapeutic candidate, particularly in autoimmune and inflammatory disorders. For example, in November 2023, we released initial clinical data from our RUBY-3 clinical trial of povetacicept in adult patients with autoimmune glomerulonephritis. Even though the initial clinical data from our RUBY-3 clinical trial were positive, there can be no assurance that our ongoing povetacicept program will demonstrate adequate efficacy and safety results and that we will be able to obtain regulatory approval of povetacicept. We will have to conduct additional trials in our proposed indications to verify the results obtained to date in our preclinical and clinical studies and to support any future regulatory submissions. A number of companies in the biopharmaceutical industry have suffered significant setbacks in advanced clinical trials due to lack of efficacy or adverse safety profiles despite promising results in earlier, smaller clinical trials. Moreover, clinical data are often susceptible to varying interpretations and analyses. We do not know whether our clinical trials will demonstrate consistent or adequate efficacy and safety with respect to the proposed indication for use sufficient to receive regulatory approval or market our therapeutic candidates. To the extent that the results of the clinical trials are not satisfactory to the FDA or foreign regulatory authorities for supporting a marketing application, we may be required to expend significant resources, which may not be available to us, to conduct additional clinical trials in support of potential approval of our product candidates.
We, the FDA, an IRB, an independent ethics committee, or other applicable regulatory authorities may suspend clinical trials of a therapeutic candidate at any time for various reasons, including a belief that subjects participating in such trials are being exposed to unacceptable health risks or adverse side effects. Similarly, an IRB or ethics committee may suspend a clinical trial at a particular trial site. We may not have the financial resources to continue development of, or to enter into
47
collaborations for, a therapeutic candidate if we experience any problems or other unforeseen events delaying or preventing clinical development or regulatory approval of, or our ability to commercialize, therapeutic candidates, including:
•negative or inconclusive results from our clinical trials, or the clinical trials of others for therapeutic candidates similar to ours, leading to a decision or requirement to conduct additional preclinical testing or clinical trials or abandon a program;
•serious and unexpected drug-related side effects experienced by participants in our clinical trials or by individuals using therapeutics similar to our therapeutic candidates;
•serious drug-related side effects experienced in the past by individuals using therapeutics similar to our therapeutic candidates;
•delays in submitting IND applications or clinical trial applications, or comparable foreign applications, or delays or failure in obtaining the necessary approvals from regulators or IRBs to commence a clinical trial, or a suspension or termination of a clinical trial once commenced;
•conditions imposed by the FDA or comparable foreign authorities, such as the European Medicines Agency, or EMA, regarding the scope or design of our clinical trials;
•delays in enrolling research subjects in clinical trials;
•high drop-out rates of research subjects;
•inadequate supply or quality of therapeutic candidate or therapeutic candidate components, or materials or other supplies necessary for the conduct of our clinical trials, including those owned, manufactured, or provided by companies other than ours;
•greater than anticipated clinical trial costs, including the cost of any approved drugs used in combination with our therapeutic candidates;
•poor effectiveness of our therapeutic candidates during clinical trials;
•unfavorable FDA or other regulatory agency inspection and review of a clinical trial site;
•failure of our third-party contractors or investigators to comply with regulatory requirements or otherwise meet their contractual obligations in a timely manner, or at all;
•delays and changes in regulatory requirements, policies, and guidelines, including the imposition of additional regulatory oversight around clinical testing generally or with respect to our technology in particular; or
•varying interpretations of data by the FDA and similar foreign regulatory agencies.
Because we have limited financial and operational resources, we must prioritize our research programs and will need to focus our discovery and development on select product candidates and indications. Correctly prioritizing our research and development activities is particularly important for us due to the breadth of potential product candidates and indications that we intend to utilize with our clinical development strategy. As a result, we may forgo or delay pursuit of opportunities with other product candidates or for other indications that later prove to have greater commercial potential. Our resource allocation decisions may cause us to fail to capitalize on viable commercial products or profitable market opportunities. Our spending on current and future research and development programs and product candidates for specific indications may not yield any commercially viable products. If we do not accurately evaluate the commercial potential or target market for a particular product candidate, we may also relinquish valuable rights to that product candidate through collaboration, licensing or other royalty arrangements in cases in which it would have been more advantageous for us to retain sole development and commercialization rights to such product candidate.
Product development involves a lengthy and expensive process with an uncertain outcome, and results of earlier preclinical and clinical trials may not be predictive of future clinical trial results.
Clinical testing is expensive and generally takes many years to complete, and the outcome is inherently uncertain. Failure can occur at any time during the clinical trial process. The results of preclinical trials and early clinical trials of our product candidates may not be predictive of the results of larger, later-stage controlled clinical trials. Product candidates showing promising results in early-stage clinical trials may still suffer significant setbacks in subsequent clinical trials. We have evaluated acazicolcept in a Phase 1 healthy volunteer trial and previously initiated a Phase 1b/2 study of acazicolcept in patients with steroid-resistant or steroid-refractory active acute graft-versus-host disease, or SR-aGVHD. We terminated this Phase 1b/2 SR-aGVHD study in June 2020. Our Phase 2 study in SLE has materially increased our research and development spending, and such expenditures have exceeded our expectations. SLE is a challenging indication and a number of trials conducted by
48
other companies have failed after significant investment of time and funding. We cannot predict whether our efforts in this indication will be successful. If we are unsuccessful, it is unlikely that AbbVie would exercise its option for acazicolcept pursuant to the AbbVie Agreement and, as a result, we would not receive the option payment pursuant to this agreement and we would not be eligible for future milestones and royalties. In addition, we had initiated our Phase 1 studies of davoceticept, but terminated enrollment in these studies in October 2022 following notification of a second Grade 5 serious adverse event (death) in the NEON-2 study. We will have to conduct additional preclinical studies and human trials in our proposed indications of povetacicept and acazicolcept to verify the results obtained to date and to support any regulatory submissions for further clinical development. A number of companies in the biopharmaceutical industry have suffered significant setbacks in advanced clinical trials due to lack of efficacy or adverse safety profiles despite promising results in earlier, smaller clinical trials. Moreover, clinical data are often susceptible to varying interpretations and analyses. We do not know whether Phase 1, Phase 2, Phase 3, or other clinical trials we may conduct will demonstrate consistent or adequate efficacy and safety with respect to the proposed indication for use sufficient to receive regulatory approval or market our therapeutic candidates. For example, in November 2023, we released initial clinical data from our RUBY-3 clinical trial of povetacicept in adult patients with autoimmune glomerulonephritis. Even though the initial clinical data from our RUBY-3 clinical trial were positive, there can be no assurance that our ongoing povetacicept program will demonstrate adequate efficacy and safety results and that we will be able to obtain regulatory approval of povetacicept. Any of the foregoing outcomes would materially and adversely impact our business, product candidate pipeline and future prospects.
If we encounter delays or difficulties enrolling patients in our clinical trials and/or retention of patients in clinical trials, our clinical development activities could be delayed or otherwise adversely affected.
We may experience difficulties in patient enrollment in our clinical trials for a variety of reasons, including supply chain disruptions, staffing shortages and other business and economic disruptions resulting from geopolitical actions, including war and terrorism, natural disasters, including earthquakes, typhoons, floods and fires, as well as other disruptions resulting from the impact of public health factors, including pandemics or other health crises, business disruptions of our strategic partners, third-party manufacturers, suppliers and other third parties upon which we rely. The timely completion of clinical trials in accordance with their protocols depends, among other things, on our ability to enroll a sufficient number of patients who remain in the trial until completion of treatment and adequate follow-up. The enrollment of patients depends on many factors, including:
•inability to enroll, or delay in enrollment of, patients due to infectious disease outbreaks and public health crises;
•the patient eligibility criteria defined in the protocol;
•the perceived risks and benefits of the product candidate being studied;
•the size of the patient population required for analysis of the trial’s primary endpoints;
•the proximity of patients to trial sites;
•the design of the trial;
•our ability to recruit clinical trial investigators with the appropriate competencies and experience;
•our ability to obtain and maintain patient consent;
•geopolitical events in countries where we have or seek to have clinical trial sites;
•reporting of the preliminary results of any of our clinical trials; and
•the risk that patients enrolled in clinical trials will drop out of the trials before completion of treatment and adequate follow-up.
In addition, our clinical trials will compete with other clinical trials for product candidates that are in the same therapeutic areas as our product candidates, and this competition will reduce the number and types of patients available to us because some patients who might have opted to enroll in our trials may instead opt to enroll in a trial being conducted by one of our competitors. Since the number of qualified clinical investigation sites is limited, we expect to conduct some of our clinical trials at the same clinical trial sites that some of our competitors use, which will reduce the number of patients who are available for our clinical trials at such clinical trial sites. Geopolitical events in countries where we have or seek to have clinical trial sites can also negatively impact our ability to enroll patients in our trials. For example, we had intended to open trial sites in Russia for both our ongoing Synergy trial and our planned Phase 2 trial in SLE with povetacicept. Following the start of the Russia-Ukraine conflict, we abandoned our plans to open these sites. Although no sites in Russia had been opened, we had to revise our plans and locate alternative trial sites to enable us to achieve our targeted enrollment numbers and enrollment rates for these trials. These delays or delays in any other trials we conduct may also affect the timing or outcome of our ongoing and planned
49
clinical trials, which could prevent completion or commencement of these trials and adversely affect our ability to advance the development of our product candidates.
Our product candidates may cause undesirable side effects or have other properties that could halt their clinical development, prevent their regulatory approval, require expansion of the trial size, limit their commercial potential, or result in significant negative consequences.
Clinical trials that involve patients with significant co-morbidities are associated with increased risks as such participants may be particularly susceptible to safety and toxicity risks. In addition, these side effects may not be appropriately recognized or managed by the treating medical staff, as safety and toxicity monitoring may be complicated and difficult to manage, which could result in patient death or other significant issues. Additionally, it can be difficult to determine if the serious adverse or unexpected side effects were caused by the product candidate or another factor, especially in subjects who may suffer from other medical conditions and take other medications. Such risks are increased in clinical trials that allow combinations of therapies.
If serious adverse events or undesirable side effects arise, we could be required to suspend, delay, or halt our clinical trials. For example in October 2022, we voluntarily terminated enrollment in both clinical studies involving davoceticept following a second Grade 5 serious adverse event (patient death) in the NEON-2 trial. Additionally, serious adverse events or undesirable side effects could cause regulatory authorities to deny approval or require us to limit development of that product candidate to certain uses or subpopulations in which the undesirable side effects or other characteristics are less prevalent, less severe or more acceptable from a risk-benefit perspective. Undesirable side effects could also result in an expansion in the size of our clinical trials, increasing the expected costs and timeline of our clinical trials. Side effects that are observed during the trial, whether treatment related or not, could also affect patient recruitment for future trials or the ability of enrolled patients to complete the trial or result in potential product liability claims. For example, adverse events in our RUBY-3 clinical trial were generally mild or moderate in severity, however, there can be no guarantee that we will observe a similar adverse event profile of povetacicept in our ongoing or other future clinical trials. Many compounds that initially show promise in clinical or earlier-stage testing are later found to cause undesirable or unexpected side effects that prevent further development of the compound.
Further, if serious adverse events or undesirable side effects are identified during development or after approval and are determined to be attributed to any of our product candidates, we may be required to develop Risk Evaluation and Mitigation Strategies, or REMS, to ensure that the benefits of treatment with such product candidate outweigh the risks for each potential patient, which may include, among other things, a communication plan to health care practitioners, patient education, extensive patient monitoring or distribution systems and processes that are highly controlled, restrictive and more costly than what is typical for the industry.
Any of these occurrences may harm our business, financial condition and prospects significantly.
We face competition from entities that have developed or may develop therapeutic candidates for our target disease indications, including companies developing novel treatments and technology platforms based on modalities and technology similar to ours.
We participate in the highly competitive sector of biotechnology and pharmaceuticals and in the subsector of immune modulation. This subsector has undergone tremendous technological advancement over the last decade due to advancements in understanding the role of the immune system across multiple therapeutic areas, including autoimmune and inflammatory disease. While we believe our novel technology platform, discovery programs, knowledge, experience, and scientific resources offer competitive advantages, we face competition from major pharmaceutical and biotechnology companies, academic institutions, governmental agencies, public and private research institutions, and others.
Any products we successfully develop and commercialize will face competition from currently approved therapies and new therapies potentially available in the future.
The availability of reimbursement from government and other third-party payors will also significantly affect the pricing and competitiveness of our products. Our competitors also may obtain FDA or other regulatory approval for their products more rapidly than we may obtain approval for our products, which could result in our competitors establishing a strong market position before we are able to enter the market.
Many of our competitors may have significantly greater financial resources and expertise in research and development, manufacturing, preclinical testing, conducting clinical trials, obtaining regulatory approvals, and marketing approved products. Smaller or early-stage companies may also prove to be significant competitors, particularly through collaborative arrangements with large and established companies. These competitors also compete with us in recruiting and retaining qualified scientific
50
and management personnel and establishing clinical trial sites and patient registration for clinical trials, as well as in acquiring technologies complementary to, or necessary for, our programs. If these companies develop technologies or therapeutic candidates more rapidly than we do, or their technologies, including delivery technologies, are more effective, our ability to develop and successfully commercialize therapeutic candidates may be adversely affected. For additional information regarding our competitors and the competitive landscape, please refer to the section of this report titled “Business — Competition.”
Many of our competitors have significantly greater financial, technical, manufacturing, marketing, sales, and supply resources or experience than we have. If we successfully obtain approval for any therapeutic candidate, we will face competition based on many different factors, including safety and effectiveness, ease with which our products can be administered and the extent to which patients accept relatively new routes of administration, timing and scope of regulatory approvals, availability and cost of manufacturing, marketing and sales capabilities, price, reimbursement coverage, and patent position of our products. Competing products could present superior treatment alternatives, including by being more effective, safer, less expensive, or marketed and sold more effectively than any products we may develop. Competitive products may make any products we develop obsolete or noncompetitive before we recover the expense of developing and commercializing our therapeutic candidates. Competitors could also recruit our employees, which could negatively impact our ability to execute our business plan.
We believe our development programs and platform have a particular mechanism of action, but this mechanism of action has not been proven conclusively.
Our scientific platform is novel, and the underlying science is not exhaustively understood nor conclusively proven. In particular, the interaction of vIgDs with the immune synapse, the ability of vIgDs to slow, stop, restart, or accelerate immune responses, and the ability of vIgD domains to interact with multiple counter structures is still largely theoretical. Graphical representations of proposed mechanisms of action of our therapies, the size, actual or relative, of our therapeutics, and how our therapeutics might interface with other cells within the human body, inside the immune synapse, or inside the disease and/or the tumor microenvironment are similarly theoretical and not yet conclusively proven. The lack of a proven mechanism of action may adversely affect our ability to raise sufficient capital, complete preclinical studies, adequately manufacture drug product, obtain regulatory clearance for clinical trials, gain marketing approval, or conclude collaborations, or interfere with our ability to market our product to patients and physicians or achieve reimbursement from payors.
Development of product candidates in combination with other therapies could expose us to additional risks.
Development of any of our product candidates in combination with one or more other therapies that have either been approved or not yet been approved for marketing by the FDA, EMA or comparable foreign regulatory authorities could expose us to additional risks, as combination therapies may increase the rate of serious or unexpected adverse events, which could result in a clinical hold as well as pre-approval and post-approval restrictions by the FDA or other regulatory authorities on the proposed combination therapy, including narrowing of the indication, warnings, additional safety data collection and monitoring procedures, and REMS, even if the cause of such serious or unexpected adverse events are not directly attributed to our product candidate. Any of these events or restrictions could have a material adverse effect on our business, development of our product candidates, delay our regulatory approval, and decrease the market acceptance and profitability of our product candidate if approved for a combination therapy. For example, as discussed in the risk factor above, our NEON-2 trial evaluating davoceticept in combination with Merck’s pembrolizumab in adults with advanced malignancies was placed on partial clinical hold by the FDA between March 2022 and May 2022, during which time we were unable to enroll any additional participants in the clinical trial, and was later voluntarily terminated in October 2022 due to safety concerns.
We will not be able to market and sell any product candidate in combination with any unapproved therapies that do not ultimately obtain marketing approval. If the FDA, EMA or other comparable foreign regulatory authorities do not approve or revoke their approval of other therapies used in combination therapies, or if safety, efficacy, commercial adoption, manufacturing or supply issues arise with the therapies we choose to evaluate in combination with any of our product candidate, we may be unable to obtain approval of or successfully market any one or all of the product candidates we develop.
Even if any of our product candidates were to receive marketing approval or be commercialized for use in combination with other existing approved therapies, we would continue to be subject to the risks that the FDA, EMA or other comparable foreign regulatory authorities could revoke approval of the other therapy used in combination with any of our product candidates, or safety, efficacy, manufacturing or supply issues could arise with these existing therapies. In addition, it is possible that existing therapies with which our product candidates are approved for use could themselves fall out of favor or be relegated to later lines of treatment. This could result in the need to identify other combination therapies for our product candidates or our own products being removed from the market or being less successful commercially.
51
Additionally, if the third-party providers of therapies or therapies in development used in combination with our product candidates are unable to produce sufficient quantities for clinical trials or for commercialization of our product candidates, or if the cost of combination therapies is prohibitive, our development and commercialization efforts would be impaired, which would have an adverse effect on our business, financial condition, results of operations and growth prospects.
We face risks related to pandemics, other health epidemics and outbreaks, which could significantly disrupt our operations and/or business, including our clinical trials.
We face risks related to pandemics, other health epidemics and outbreaks, which could significantly disrupt our operations and/or business, including our clinical trials. For example, the COVID-19 pandemic broadly affected the global economy across many industries and resulted in significant government measures being implemented to control the spread of the virus, including quarantines, travel restrictions and business shutdowns, as well as significant volatility in global financial markets. Our business could be adversely impacted by the effects of future pandemics, other health epidemics or outbreaks.
For example, we have experienced in the past and may experience in the future disruptions that could severely impact our business and clinical trials, including:
•delays or difficulties in enrolling patients in our clinical trials;
•delays or difficulties in clinical site initiation, including difficulties in recruiting clinical site investigators and clinical site staff;
•diversion of healthcare resources away from the conduct of clinical trials, including the diversion of hospitals serving as our clinical trial sites and hospital staff supporting the conduct of our clinical trials;
•interruption of key clinical trial activities, such as clinical trial site monitoring, due to limitations on travel imposed or recommended by federal or state governments, employers and others;
•limitations in employee resources that would otherwise be focused on the conduct of our clinical trials, including because of sickness of employees or their families or the desire of employees to avoid contact with large groups of people;
•delays in receiving approval from local regulatory authorities and ethics committees to initiate our planned clinical trials;
•delays in clinical sites receiving the supplies and materials needed to conduct our clinical trials;
•interruption in global shipping that may affect the transport of clinical trial materials, such as investigational drug product used in our clinical trials;
•changes in local regulations as part of a response to a pandemic, other health epidemic or outbreak which may require us to change the ways in which our clinical trials are conducted, which may result in unexpected costs, or to discontinue the clinical trials altogether;
•delays in necessary interactions with local regulators, ethics committees and other important agencies and contractors due to limitations in employee resources or forced furlough of government employees; and
•refusal of the FDA to accept data from clinical trials whose conduct has been affected by a pandemic, other health epidemic or outbreak, such as due to missing data.
Further, we may be required to develop and implement additional clinical trial policies and procedures designed to help protect subjects from any future pandemic, other health epidemic or outbreak. For example, during the COVID-19 pandemic, FDA issued a number of COVID-19 related guidance documents for manufacturers and clinical trial sponsors, many of which have expired or were withdrawn with the termination of the COVID-19 public health emergency declaration in May 2023, although some COVID-19 related guidance documents continue in effect.
Additionally, certain of our research and development efforts are also conducted globally. For example, the povetacicept healthy volunteer study includes investigative sites in Australia, and our Synergy trial includes investigative sites in Korea and Poland. A health epidemic or other infectious disease outbreak may materially and adversely affect our business, financial condition and results of operations. Our supply chain for raw materials, drug substance or drug product is also worldwide and, accordingly, could be subject to disruption. There may be restrictions on the export or shipment of raw materials, drug substance or drug product that could materially delay our business or clinical trials.
The extent to which pandemics, other health epidemics, or outbreaks may impact our business and clinical trials will depend on future developments, which are highly uncertain and cannot be predicted with confidence. In addition, another
52
pandemic or epidemic, or other infectious diseases could disrupt the global financial markets, reducing our ability to access capital, which could negatively affect our liquidity. The emergence of another pandemic or epidemic, or the emergence of other infectious diseases were to occur, the volatility of the financial market may be heightened, which could adversely impact the value of our common stock.
Any inability to present our data in scientific journals or at scientific conferences could adversely impact our business and stock price.
We may from time to time submit data related to our research and development activities in peer-reviewed scientific publications or apply to present data related to our research and development activities at scientific or other conferences. We have no control over whether these submissions or applications are accepted. Even if accepted for a conference, we have no control over whether presentations at scientific conferences will be accepted for oral presentation, poster presentation, or abstract publication only. Even when accepted for publication, we have no control over the timing of the release of the publication. Rejection by publications, delays in publication, rejection for presentation, or a less-preferred format for a presentation may adversely impact our stock price, ability to raise capital, and business.
Our business may be affected by adverse scientific publications or editorial or discussant opinions.
We may from time to time publish data related to our research and development activities in peer-reviewed scientific publications or present data related to our research and development activities at scientific or other conferences. Editorials or discussants unrelated to us may provide opinions on our presented data unfavorable to us. In addition, scientific publications or presentations may be made which are critical of our science or research or the field of immunotherapy in general. This may adversely affect our ability to raise necessary capital, complete clinical and preclinical studies, adequately manufacture drug product, obtain regulatory clearance for clinical trials, or approval for marketing, or interfere with our ability to market our product to patients and physicians or achieve reimbursement from payors.
Risks Related to Our Relationships with Third Parties
To date, our revenue has been primarily derived from our collaboration agreements, and our success will be dependent, in part, on our collaborators’ efforts to develop our therapeutic candidates.
Our success is dependent, in part, on our collaborators’ efforts to develop our therapeutic candidates and, historically, our revenue has been primarily derived from our agreements with collaborators. For example, in June 2020, we entered into the AbbVie Agreement for the development of acazicolcept, which was amended in December 2023; and in December 2021, we entered into the Amgen Agreement pursuant to which we granted to Amgen rights to our Existing Program and we and Amgen agreed to collaborate in the discovery, research and preclinical development of up to three Research Programs for other designated biological targets. As of December 31, 2023, we have completed our activities under the Existing Program. We continue to support activities related to the First Research Program.
Pursuant to the terms of the AbbVie Agreement, we received an upfront payment of $60.0 million in cash. Prior to the exercise of the License Option, AbbVie also agreed to make aggregate payments of up to $75.0 million in development milestones, of which $45.0 million was achieved in the second quarter of 2021, and the remaining $30.0 million was removed under the AbbVie Amendment. Also under the AbbVie Amendment, we are eligible to receive $10.0 million if AbbVie exercises the License Option, and up to an aggregate of $491.3 million for certain development, commercial and sales-based milestones, and royalties on any future net sales. Through December 31, 2023, we have received $105.0 million in upfront and pre-option exercise development milestones as part of the AbbVie Agreement.
Pursuant to the AbbVie Agreement, as amended by the AbbVie Amendment, we have stopped enrollment of our Phase 2 study of acazicolcept in SLE, the Synergy study, and, once the last patient enrolled in the Synergy study has completed the study protocol, we will generate a data package in order for AbbVie to evaluate exercising its exclusive option, including all activities reasonably necessary to complete our obligations under the Synergy study. There can be no assurance that AbbVie will exercise its option, which would make achievement of future milestones and receipt of future royalties unattainable. If AbbVie exercises its option, our realization of additional milestones and royalty payments will depend upon the efforts of AbbVie. If AbbVie fails to develop, obtain regulatory approval for, or ultimately commercialize acazicolcept or if AbbVie terminates the collaboration, our business, financial condition, results of operations, and prospects could be materially and adversely affected. For additional information regarding the AbbVie Agreement, please refer to the section of this report titled “Business — Partnerships.”
53
Pursuant to the terms of the Amgen Agreement, we received an upfront payment of $25.0 million as well as an equity investment for which they paid $15.0 million. We are also eligible to receive milestone payments upon our achievement of certain preclinical, clinical and regulatory and commercialization milestones, up to an aggregate amount of $381.0 million per program, or a total of approximately $762.0 million for the remaining programs, if all milestones are met, as well as royalties on future product sales. Pursuant to the Amgen Agreement, we will conduct certain research activities under a research program; however, even though we have completed our activities under two programs under the Amgen Agreement, and even if we successfully perform our obligations under the remaining programs under the Amgen Agreement, there is no certainty that Amgen will continue the development of any of the programs, or, if development is continued, if such programs will ultimately succeed and receive regulatory approval. Amgen will have discretion in determining and directing its efforts and resources for future development activities and, if approval is obtained, commercialization and marketing of the approved drug. For example, Amgen declined to select one program by the respective option deadline and in January 2024 we received a termination notification from Amgen related to a completed fourth program. As a result, there can be no assurances that we will achieve additional milestones pursuant to the Amgen Agreement. For additional information regarding the Amgen Agreement, please refer to the section of this report titled “Business — Partnerships.”
Our collaborations may also result in reduced royalty revenues if we are unable to obtain and maintain patent protection, as well as if we are unable to obtain patent term extension, for therapeutic candidates or products developed under our agreements with collaborators. In the event of expiration or invalidation of patents covering a therapeutic candidate or product, for example, our collaborators may be entitled to a significant decrease in royalty revenues owed to us under the agreements. Invalidation of patents and failure to obtain patent term extension for one or more patents in our portfolio may occur as a result of factors beyond our control due to the complex legal and factual questions surrounding pharmaceutical and biotechnology patents. If we are unable to obtain and maintain patent protection, or if we unable to obtain patent term extension for therapeutic candidates or products developed under our agreements with collaborators, our revenue derived from our collaborators may be less than the full amount anticipated, and our business, financial condition, results of operations, and growth prospects could be materially harmed.
Continued advancement of our other product candidates and other development efforts depends, in part, upon the efforts of AbbVie, Amgen, Adaptimmune and other future collaborators. If our collaborators do not dedicate sufficient resources to the development of product candidates that are the subject of our agreements, such product candidates may never be successful and we may be ineligible to receive additional milestone payments or royalties pursuant to the terms of our arrangements, which could have a material adverse impact on our financial results and operations. Even if we and our collaborators dedicate sufficient resources to our collaboration agreements, neither we nor our collaborators may be effective in obtaining approvals for any therapeutic candidates or, if approved, the successful commercialization of any approved products. Collaborators may change their strategic focus or pursue alternative technologies after entering into a collaboration agreement with us, which could result in reduced, delayed or no revenue to us. Disputes regarding collaboration agreements, including disputes pertaining to ownership of intellectual property, may also arise and if we and our collaborators are unable to resolve such disputes, litigation proceedings may occur, which could further delay development programs, create uncertainty as to ownership of intellectual property rights, distract management from other business activities and generate substantial expenses, any of which could materially and negatively impact our business.
If third parties on which we depend to conduct our clinical or preclinical studies, or any future clinical trials, do not perform as expected, fail to satisfy regulatory or legal requirements, or miss expected deadlines, our development program could be delayed, which may result in materially adverse effects on our business, financial condition, results of operations, and prospects.
We rely, in part, on third-party clinical investigators, CROs, clinical data management organizations, and consultants to design, conduct, supervise, and monitor clinical trials and preclinical studies of our therapeutic candidates and may do the same for future clinical trials. Because we rely on third parties to conduct preclinical studies or clinical trials, we have less control over the timing, quality, compliance, and other aspects of preclinical studies and clinical trials than we would if we conducted all preclinical studies and clinical trials on our own. These investigators, CROs, and consultants are not our employees and we have limited control over the amount of time and resources they dedicate to our programs. These third parties may have contractual relationships with other entities, some of which may be our competitors, which may draw their time and resources away from our programs. The third parties with which we contract might not be diligent, careful, compliant, or timely in conducting our preclinical studies or clinical trials, resulting in the preclinical studies or clinical trials being delayed or unsuccessful. Further, if any of our relationships with third-party CROs terminate, we may not be able to enter into arrangements with alternative CROs or to do so on commercially reasonable terms.
If we cannot contract with acceptable third parties on commercially reasonable terms, or at all, or if these third parties do not carry out their expected duties, satisfy legal and regulatory requirements for the conduct of preclinical studies or clinical
54
trials, or meet expected deadlines, our clinical development programs could be delayed and otherwise adversely affected. In all events, we are responsible for ensuring each of our preclinical studies and clinical trials is conducted in accordance with the general investigational plan and protocols for the trial and with legal, regulatory and scientific standards. The FDA and certain foreign regulatory authorities, such as the EMA, require preclinical studies to be conducted in accordance with applicable GLPs and clinical trials to be conducted in accordance with applicable FDA regulations and GCPs, including requirements for conducting, recording, and reporting the results of preclinical studies and clinical trials to assure data and reported results are credible and accurate and the rights, integrity, and confidentiality of clinical trial participants are protected. Our reliance on third parties we do not control does not relieve us of these responsibilities and requirements. If we or any of our CROs fail to comply with applicable GCPs, the clinical data generated in our clinical trials may be deemed unreliable and the FDA, the EMA or comparable foreign regulatory authorities may require us to perform additional clinical trials before approving our marketing applications. We cannot assure you that upon inspection by a given regulatory authority, such regulatory authority will determine that any of our clinical trials comply with GCP regulations. In addition, our clinical trials must be conducted with product produced under cGMP regulations. Our failure to comply with these regulations may require us to repeat clinical trials, which would delay the regulatory approval process. Any such event could have a material adverse effect on our business, financial condition, results of operations, and prospects.
In addition, switching or adding additional CROs involves additional cost and requires management time and focus. There is also a natural transition period when a new CRO commences work. As a result, delays may occur, which could materially impact our ability to meet our desired clinical development timelines. There can be no assurance that we will not encounter such challenges or delays in the future or that these delays or challenges will not have a material adverse impact on our business, financial condition and prospects.
Because we rely on third-party manufacturing and supply partners, our supply of clinical trial materials may become limited or interrupted or may not be of satisfactory quantity or quality, and our dependence on these third parties may impair the advancement of our research and development programs.
We have established in-house recombinant protein generation capabilities for producing sufficient protein materials to enable a portion of our current preclinical studies. We rely on third-party supply and manufacturing partners to supply the materials, components, and manufacturing services for a portion of preclinical studies and also rely on such third parties for all our clinical trial drug supplies. We do not own manufacturing facilities or supply sources for such components and materials for clinical trial supplies and our current manufacturing facilities are insufficient to supply such components and materials for all of our preclinical studies. Certain raw materials necessary for the manufacture of our therapeutic products, such as cell lines, are available from a single or limited number of source suppliers on a purchase order basis. There can be no assurance our supply of research and development, preclinical study, and clinical trial drugs and other materials will not be limited, interrupted, restricted in certain geographic regions, of satisfactory quality or quantity, or continue to be available at acceptable prices. In particular, any replacement of our therapeutic substance manufacturer for povetacicept or acazicolcept could require significant effort and expertise and could result in significant delay of our preclinical or clinical activities because there may be a limited number of qualified replacements. While we are actively working to onboard additional therapeutic substance manufacturers for our product candidates, this process can take many months and even if an additional manufacturer is identified and engaged, such manufacturers may fail to produce therapeutic substance that satisfies specifications for our clinical trials. Even if we have sufficient quantities of drug product for planned or ongoing clinical trials, delays in trial initiation, patient enrollment or other extensions of trial timelines may result in the expiration of such drug product prior to its use in such trials and necessitate additional production runs and/or fill/finish work, which in turn could extend trial timelines. In addition, disruptions to ports and other shipping infrastructure, due, for example, to the impacts of a pandemic, may result in shortages or delays impacting the availability of materials and other supplies, which could negatively impact our manufacturers, suppliers and other third parties on whom we rely. While we have not yet suffered any direct, material negative impacts from supply chain disruptions, we cannot be certain that we will not be impacted, which could increase our costs or negatively impact our development timelines.
The manufacturing process for a therapeutic candidate is subject to FDA and foreign regulatory authority review, and the facilities used by our contract manufacturers to manufacture our therapeutic candidates must be approved by the FDA pursuant to inspections that will be conducted after we submit our marketing application(s) to the FDA. Suppliers and manufacturers must meet applicable manufacturing requirements and undergo rigorous facility and process validation tests required by regulatory authorities in order to comply with cGMP regulations or other regulatory standards. In the event any of our suppliers or manufacturers fails to comply with such requirements or to perform its obligations to us in relation to quality, timing, or otherwise, or if our supply of components or other materials becomes limited or interrupted for other reasons, we may experience shortages resulting in delayed shipments, supply constraints, and/or stock-outs of our products, be forced to manufacture the materials alone, for which we currently do not have the capabilities or resources, or enter into an agreement with another third party, which we may not be able to do on reasonable terms, if at all. We may also become involved in
55
disputes with our suppliers and manufacturers as a result of any inability on their part to comply with our manufacturing requirements. In some cases, the technical skills or technology required to manufacture our therapeutic candidates may be unique or proprietary to the original manufacturer and we may have difficulty, or there may be contractual and intellectual property restrictions prohibiting us from, transferring such skills or technology to another third party and a feasible alternative may not exist. These factors may increase our reliance on such manufacturer or require us to obtain a license from such manufacturer in order to have another third party manufacture our therapeutic candidates. If we are required to change manufacturers for any reason, we will be required to verify the new manufacturer maintains facilities and procedures complying with quality standards and with all applicable regulations. The delays associated with the verification of a new manufacturer could negatively affect our ability to develop therapeutic candidates in a timely manner, within budget, or at all.
We expect to continue to rely on third-party manufacturers if we receive regulatory approval for any therapeutic candidate. To the extent we have existing, or enter into future, manufacturing arrangements with third parties, we will depend on these third parties to perform their obligations in a timely manner consistent with contractual and regulatory requirements, including those related to quality control and assurance. If we are unable to obtain or maintain third-party manufacturing for therapeutic candidates, or to do so on commercially reasonable terms, we may not be able to develop and commercialize our therapeutic candidates successfully. Our, or a third party’s, failure to execute on our manufacturing requirements could adversely affect our business in a number of ways, including as a result of:
•an inability to initiate or continue preclinical studies or clinical trials of therapeutic candidates under development;
•delay in submitting regulatory applications, or receiving regulatory approvals, for therapeutic candidates;
•the loss of the cooperation of a collaborator;
•subjecting manufacturing facilities of our therapeutic candidates to additional inspections by regulatory authorities;
•requirements to cease distribution or to recall batches of our therapeutic candidates; and
•in the event of approval to market and commercialize a therapeutic candidate, an inability to meet commercial demands for our products.
As product candidates progress from preclinical studies to late-stage clinical trials to marketing approval and commercialization, it is common that various aspects of the development program, such as manufacturing methods, materials and processes, are altered along the way in an effort to optimize yield, manufacturing batch size, minimize costs and achieve consistent purity, identity, potency, quality and results. Such changes carry the risk that they will not achieve these intended objectives. Any of these changes could cause our product candidates to perform differently and could affect planned or other clinical trials conducted with product candidates produced using the modified manufacturing methods, materials, and processes. This could delay completion of clinical trials and could require non-clinical or clinical bridging and comparability studies, which could increase costs, delay approval of our product candidates and jeopardize our ability to commercialize our product candidates, if approved.
We may not successfully engage in strategic transactions, including any additional collaborations we seek, which could adversely affect our ability to develop and commercialize therapeutic candidates, impact our cash position, increase our expenses, and present significant distractions to our management.
From time to time, we consider strategic transactions, such as collaborations, acquisitions of companies, asset purchases or divestitures, and out- or in-licensing of therapeutic candidates or technologies. In particular, we intend to evaluate and, if strategically attractive, seek to enter into additional collaborations, including with major biotechnology or pharmaceutical companies. The competition for collaborative partners is intense, and the negotiation process is time-consuming and complex. Any new collaboration may be on suboptimal terms for us, and ultimately may not maximize value for our stockholders. In addition, we may be unable to maintain any new or existing collaboration if, for example, development or approval of a therapeutic candidate is delayed, sales of an approved therapeutic product do not meet expectations, or the collaborator terminates the collaboration. Any such collaboration, or other strategic transaction, may require us to incur non-recurring or other charges, increase our near- and long-term expenditures and pose significant integration or implementation challenges or disrupt our management or business.
These transactions would entail numerous operational and financial risks, including:
•exposure to unknown liabilities;
•disruption of our business and diversion of our management’s time and attention in order to manage a collaboration or develop acquired therapeutic candidates, or technologies;
56
•incurrence of substantial debt or dilutive issuances of equity securities to pay transaction consideration or costs;
•higher than expected collaboration, acquisition, or integration costs;
•write-downs of assets, or incurring impairment charges or increased amortization expenses; and
•difficulty and cost in facilitating the collaboration or combining the operations and personnel of any acquired business or impairment of relationships with key suppliers, manufacturers, or customers of any acquired business due to changes in management and ownership and the inability to retain key employees of any acquired business.
Accordingly, although there can be no assurance we will undertake or successfully complete any transactions of the nature described above, any transactions we do complete may be subject to the foregoing or other risks and have a material adverse effect on our business, results of operations, financial condition, and prospects. Conversely, any failure to enter any collaboration or other strategic transaction beneficial to us could delay the development and potential commercialization of our therapeutic candidates and have a negative impact on the competitiveness of any therapeutic candidate reaching market.
Risks Related to Our Ability to Commercialize Product Candidates
If any of our therapeutic candidates are approved for marketing and commercialization and we are unable to develop sales, marketing and distribution capabilities on our own or enter into agreements with third parties to perform these functions on acceptable terms, we may be unable to successfully commercialize any such future products.
We currently have no sales, marketing, or distribution capabilities or experience. If any of our therapeutic candidates are approved, we will need to develop internal sales, marketing, and distribution capabilities to commercialize such products, which may be expensive and time-consuming, or enter into collaborations with third parties to perform these services. If we decide to market our products directly, we will need to commit significant financial, legal, and managerial resources to develop a marketing and sales force with technical expertise and supporting distribution, administration, and compliance capabilities. If we rely on third parties with such capabilities to market our approved products, or decide to co-promote products with collaborators, we will need to establish and maintain marketing and distribution arrangements with third parties, and there can be no assurance we will be able to enter into such arrangements on acceptable, compliant terms or at all. In entering into third-party marketing or distribution arrangements, any revenue we receive will depend upon the efforts of the third parties and there can be no assurance such third parties will establish adequate sales and distribution capabilities or be successful in gaining market acceptance of any approved therapeutic. If we are not successful in commercializing any therapeutic approved in the future, either on our own or through third parties, our business, financial condition, results of operations, and prospects could be materially and adversely affected.
If we fail to comply with U.S. and foreign regulatory requirements, regulatory authorities could limit or withdraw any marketing or commercialization approvals we may receive and subject us to other penalties that could materially harm our business.
Our company, our therapeutic candidates, our suppliers, and our contract manufacturers, distributors, and contract testing laboratories are subject to extensive regulation by governmental authorities in the European Union, the United States, and other jurisdictions, with regulations differing from country to country.
Even if we receive marketing and commercialization approval of a therapeutic candidate, we and our third-party service providers will be subject to continuing regulatory requirements, including a broad array of regulations related to establishment registration and product listing, manufacturing processes, risk management measures, quality and pharmacovigilance systems, post-approval clinical studies, labeling and packaging, advertising and promotional activities, record keeping, distribution, adverse event reporting, import and export of pharmaceutical products, pricing, sales, and marketing, and fraud and abuse requirements.
Furthermore, the FDA strictly regulates manufacturers’ promotional claims of drug products. In particular, a drug product may not be promoted by manufacturers for uses that are not approved by the FDA, as reflected in the FDA-approved labeling, although healthcare professionals are permitted to use drug products for off-label uses. The FDA, the Department of Justice, the Inspector General of the Department of Health and Human Services, among other government agencies, actively enforce the laws and regulations prohibiting manufacturers’ promotion of off-label uses, and a company that is found to have improperly promoted off-label uses may be subject to significant liability, including large civil and criminal fines, penalties, and enforcement actions. The FDA has also imposed consent decrees or permanent injunctions under which specified promotional conduct is changed or curtailed for companies that engaged in such prohibited activities. If we cannot successfully manage the
57
promotion of our approved product candidates, we could become subject to significant liability, which would materially adversely affect our business and financial condition.
We are required to submit safety and other post market information and reports, and are subject to continuing regulatory review, including in relation to adverse patient experiences with the product and clinical results reported after a product is made commercially available, both in the United States and in any foreign jurisdiction in which we seek regulatory approval. The FDA and certain foreign regulatory authorities, such as the EMA, have significant post-market authority, including the authority to require labeling changes based on new safety information and to require post-market studies or clinical trials to evaluate safety risks related to the use of a product or to require withdrawal of the product from the market.
The FDA also has the authority to require a REMS plan either before or after approval, which may impose further requirements or restrictions on the distribution or use of an approved therapeutic. The EMA now routinely requires risk management plans, or RMPs, as part of the marketing authorization application process, and such plans must be continually modified and updated throughout the lifetime of the product as new information becomes available. In addition, the relevant governmental authority of any EU member state can request an RMP whenever there is a concern about the risk/benefit balance of the product.
The manufacturers and manufacturing facilities we use to make a future product, if any, will also be subject to periodic review and inspection by the FDA and other regulatory agencies, including for continued compliance with cGMP requirements. The discovery of any new or previously unknown problems with our third-party manufacturers, manufacturing processes or facilities may result in restrictions on the product, manufacturers or facilities, including withdrawal of the product from the market. If we rely on third-party manufacturers, we will have limited control over compliance with applicable rules and regulations by such manufacturers.
If we or our collaborators, manufacturers, or service providers fail to comply with applicable continuing regulatory requirements in the U.S. or foreign jurisdictions in which we seek to market our products, we may be subject to, among other things, fines, warning and untitled letters, clinical holds, a requirement to conduct additional clinical trials, delay or refusal by the FDA or foreign regulatory authorities to approve pending applications or supplements to approved applications, suspension, refusal to renew or withdrawal of regulatory approval, product recalls, seizures, or administrative detention of products, refusal to permit the import or export of products, operating restrictions, inability to participate in government programs including Medicare and Medicaid, and total or partial suspension of production or distribution, injunction, restitution, disgorgement, debarment, civil penalties, and criminal prosecution.
In addition, the FDA and other regulatory authorities may change their policies, issue additional regulations or revise existing regulations, or take other actions, which may prevent or delay approval of our future products under development on a timely basis. Such policy or regulatory changes could impose additional requirements upon us that could delay our ability to obtain approvals, increase the costs of compliance or restrict our ability to maintain any marketing authorizations we may have obtained. Additionally, if the U.S. Supreme Court reverses or curtails the Chevron doctrine, which provides for judicial deference to regulatory agencies’ interpretation of federal statutes, more companies may bring lawsuits against the FDA to challenge longstanding decisions and policies of the FDA, which could undermine the FDA’s authority, lead to uncertainties in the industry, and disrupt the FDA’s normal operations, which could delay the FDA’s review of our marketing applications.
Imposed price controls may adversely affect our future profitability.
In most countries, the pricing of prescription drugs is subject to governmental control. In these countries, pricing negotiations with governmental authorities can take considerable time after receipt of marketing approval for a product. In addition, there can be considerable pressure by governments and other stakeholders on prices and reimbursement levels, including as part of cost containment measures. Political, economic, and regulatory developments may further complicate pricing and reimbursement negotiations, and pricing negotiations may continue after reimbursement has been obtained.
Reference pricing used by various EU member states and parallel distribution, or arbitrage between low-priced and high-priced member states, can further reduce prices. In some countries, we or our collaborators may be required to conduct a clinical trial or other studies comparing the cost-effectiveness of our therapeutic candidates to other available therapies in order to obtain or maintain reimbursement or pricing approval. Publication of discounts by third-party payors or authorities may lead to further pressure on the prices or reimbursement levels within the country of publication and other countries. If reimbursement of any product candidate approved for marketing is unavailable or limited in scope or amount, or if pricing is set at unsatisfactory levels, our business, financial condition, results of operations, or prospects could be adversely affected.
58
Our business may become subject to economic, political, regulatory and other risks associated with international operations.
Our business is subject to risks associated with conducting business internationally, including our use of foreign clinical trial sites. Some of our suppliers, collaborators and clinical trial relationships are located outside the United States. Accordingly, our future results could be harmed by a variety of factors, including:
•economic instability or weakness, including inflation, reduced growth, diminished credit availability, weakened consumer confidence or increased unemployment;
•sociopolitical instability in particular foreign economies and markets;
•difficulties in compliance with non-U.S. laws and regulations;
•changes in non-U.S. regulations and customs, tariffs and trade barriers, including any changes that China may impose as a result of political tensions between the United States and China;
•changes in non-U.S. currency exchange rates and currency controls;
•trade protection measures, import or export licensing requirements or other restrictive actions by U.S. or non-U.S. governments;
•workforce uncertainty in countries where labor unrest is more common than in the United States;
•production shortages resulting from any events affecting raw material supply or manufacturing capabilities outside the United States;
•ongoing ramifications of the United Kingdom’s withdrawal from the European Union;
•business interruptions resulting directly or indirectly from geopolitical actions, including current wars in Israel and in the Ukraine, other regional conflicts, war and terrorism, or natural disasters including earthquakes, typhoons, floods and fires; and
•changes in regulatory requirements and policies that apply to our business, including changes in the regulatory approval process, clinical trial requirements, data standards, and export regulations and controls.
In particular, there is currently significant uncertainty about the future relationship between the United States and various other countries, most significantly China, with respect to trade policies, treaties, tariffs, taxes, and other limitations on cross-border operations. The U.S. government has made and continues to make significant additional changes in U.S. trade policy and may continue to take future actions that could negatively impact U.S. trade. For example, legislation has been introduced in Congress to limit certain U.S. biotechnology companies from using equipment or services produced or provided by select Chinese biotechnology companies, and others in Congress have advocated for the use of existing executive branch authorities to limit those Chinese service providers’ ability to engage in business in the U.S. We cannot predict what actions may ultimately be taken with respect to trade relations between the United States and China or other countries, what products and services may be subject to such actions or what actions may be taken by the other countries in retaliation. If we are unable to obtain or use services from existing service providers or become unable to export or sell our products to any of our customers or service providers, our business, liquidity, financial condition, and/or results of operations would be materially and adversely affected.
Risks Related to Our Personnel and Operations
We will need to raise substantial additional funds to advance development of our therapeutic candidates, and we cannot guarantee we will have sufficient funds available in the future to develop and commercialize our current or future therapeutic candidates.
We will need to raise substantial additional funds to expand our development, regulatory, manufacturing, marketing, and sales capabilities or contract with other organizations to provide these capabilities to us. We have used substantial funds to develop our therapeutic candidates and will require significant funds to conduct further research and development, preclinical testing, and clinical trials of our therapeutic candidates, to seek regulatory approvals for our therapeutic candidates, and to manufacture and market products, if any are approved for commercial sale. We have historically dedicated a significant portion of our resources to research and development, and we expect such expenses to continue to increase as we pursue the clinical development of povetacicept. Our research and development expenses could increase significantly in future periods, especially if we initiate a potential pivotal trial of povetacicept in IgAN and a phase 2 study in SLE in the second half of 2024 (subject to engagement with and approval from the FDA). As of December 31, 2023, we had $368.2 million in cash and cash equivalents, restricted cash, and investments, Based on our current operating plan, we believe our available cash and cash equivalents and
59
investments will be sufficient to fund our planned level of operations, including anticipated capital expenditures, for at least the next 12 months. Our future capital requirements and the period for which we expect our existing resources to support our operations may vary significantly from what we expect. Our monthly spending levels vary based on new and ongoing development and corporate activities. Because the length of time and activities associated with successful development of our therapeutic candidates are highly uncertain, we are unable to estimate the actual funds we will require for development and any approved marketing and commercialization activities, or the rate at which we will require such funds. We may expend our capital resources faster than we anticipate. To execute our business plan, we will need, among other things:
•to obtain the human and financial resources necessary to develop, test, obtain regulatory approval for, manufacture, and market our therapeutic candidates;
•to build and maintain a strong intellectual property portfolio and avoid infringing intellectual property of third parties;
•to establish and maintain successful licenses, collaborations, and alliances;
•to satisfy the requirements of clinical trial protocols, including patient enrollment;
•to establish and demonstrate the clinical efficacy and safety of our therapeutic candidates;
•to obtain regulatory approvals;
•to manage our spending as costs and expenses increase due to preclinical studies, clinical trials, regulatory approvals, manufacturing scale-up, and commercialization;
•to obtain additional capital to support and expand our operations; and
•to market our products to achieve acceptance and use by the medical community in general.
If we are unable to obtain necessary funding on a timely basis or on acceptable terms, we may have to delay, reduce, or terminate our research and development programs, preclinical studies, or clinical trials, if any, limit strategic opportunities, or undergo reductions in our workforce or other corporate restructuring activities. We also could be required to seek funds through arrangements with collaborators or others requiring us to relinquish rights to some of our technologies or therapeutic candidates we would otherwise pursue on our own. We do not expect to realize revenue from product sales, or royalties in the foreseeable future, if at all. Our revenue sources are, and will remain, extremely limited unless and until our therapeutic candidates are clinically tested, approved for commercialization, and successfully marketed.
To date, we have financed our operations primarily through the sale of equity securities, debt, and payments received under our collaboration agreements. We will be required to seek additional funding in the future and may do so through a combination of public or private equity offerings, debt financings, credit and loan facilities, research collaborations, and license agreements, including pursuant to our Sales Agreement with Cowen and Company LLC, or TD Cowen, for the sale of our common stock, from time to time, through an “at-the-market” equity offering for up to $100.0 million in aggregate gross proceeds. As of December 31, 2023, we have sold 919,413 shares of common stock under the Sales Agreement for a price of $10.93 per share and have received gross proceeds of $10.0 million. Our ability to raise additional funds from these or other sources will depend on financial, economic, and other factors, many of which are beyond our control. Additional funds may not be available to us on acceptable terms or at all. If we raise additional funds by issuing equity securities, our stockholders will suffer dilution, and the terms of any financing may adversely affect the rights of our stockholders.
In addition, as a condition to providing additional funds to us, future investors may demand, and may be granted, rights superior to those of existing stockholders. Debt financing, if available, may involve restrictive covenants limiting our flexibility in conducting future business activities, and, in the event of a liquidation or insolvency, debt holders would be repaid before holders of equity securities receive any distribution of corporate assets. Our failure to raise capital or enter into such other arrangements within a reasonable timeframe would have a negative impact on our financial condition, and we may have to delay, reduce, or terminate our research and development programs, preclinical or clinical trials, or undergo reductions in our workforce or other corporate restructuring activities.
We are an early stage biopharmaceutical company with a history of losses, we expect to continue to incur significant losses for the foreseeable future, we may never achieve or maintain profitability, and we have a limited operating history that may make it difficult for investors to evaluate the potential success of our business.
We are a clinical-stage biopharmaceutical company, with a limited operating history, focused on developing treatments for autoimmune and inflammatory diseases. Since inception, we have devoted our resources to developing novel protein-based immunotherapies primarily using our proprietary directed evolution platform, which converts native immune system proteins into potential differentiated, multi-targeted therapeutics designed to modulate the immune system. We have had
60
significant operating losses since inception. For the year ended December 31, 2023, our net loss was $32.2 million. Substantially all of our losses have resulted from expenses incurred in connection with our research programs and from general and administrative costs associated with our operations. In addition, inflationary pressure could adversely impact our financial results. Our operating costs have increased, and may continue to increase, due to the continued inflationary environment. Our technologies and therapeutic candidates are in early stages of development, and we are subject to the risks of failure inherent in the development of therapeutic candidates based on novel technologies.
We have historically generated revenue primarily from the receipt of research funding and upfront and other payments under our collaboration agreements. We have not generated, and do not expect to generate, any revenue from product sales for the foreseeable future, and we expect to continue to incur significant operating losses for the foreseeable future due to the cost of research and development, preclinical studies, clinical trials, and the regulatory approval process for therapeutic candidates. The amount of future losses is uncertain. Our ability to achieve profitability, if ever, will depend on, among other things, our or our existing collaborators, or any future collaborators, successfully developing therapeutic candidates, obtaining regulatory approvals to market and commercialize therapeutic candidates, manufacturing any approved products on commercially reasonable terms, establishing a sales and marketing organization or suitable third-party alternatives for any approved product, and raising sufficient funds to finance business activities. If we or our existing collaborators, or any future collaborators, are unable to develop and commercialize one or more of our therapeutic candidates or if sales revenue from any therapeutic candidate receiving approval is insufficient, we will not achieve profitability, which could have a material adverse effect on our business, financial condition, results of operations, and prospects.
Interim, preliminary, or topline data from our clinical trials that we announce or publish from time to time may change as more patient data become available and are subject to audit and verification procedures that could result in material changes in the final data.
From time to time, we may publish interim, preliminary or topline data from clinical trials. Interim data from clinical trials that we may complete are subject to the risk that one or more of the clinical outcomes may materially change as patient enrollment continues and more patient data become available. Interim or preliminary data from clinical trials that we may conduct may not be indicative of the final results of the trial and are subject to the risk that one or more of the clinical outcomes may materially change as patient enrollment continues and more patient data becomes available. Interim or preliminary data also remains subject to audit and verification procedures that may result in the final data being materially different from the interim or preliminary data. As a result, interim or preliminary data should be viewed with caution until the final data are available. Adverse differences between interim, preliminary or topline data and final data could significantly harm our reputation and business prospects. We do not know whether any clinical trials we may conduct will demonstrate consistent or adequate efficacy and safety sufficient to obtain marketing approval to market our product candidates. For example, in November 2023, we released initial clinical data from our RUBY-3 clinical trial of povetacicept in adult patients with autoimmune glomerulonephritis. Even though the initial clinical data from our RUBY-3 clinical trial were positive, there can be no assurance that our ongoing povetacicept program will demonstrate adequate efficacy and safety results and that we will be able to obtain regulatory approval of povetacicept.
Moreover, preliminary, interim and topline data are subject to the risk that one or more of the clinical outcomes may materially change as more patient data become available when patients mature on study, patient enrollment continues or as other ongoing or future clinical trials with a product candidate further develop. Past results of clinical trials may not be predictive of future results. In addition, the information we choose to publicly disclose regarding a particular study or clinical trial is based on what is typically more extensive information, and you or others may not agree with what we determine is the material or otherwise appropriate information to include in our disclosure. Any information we determine not to disclose may ultimately be deemed significant with respect to future decisions, conclusions, views, activities or otherwise regarding a particular product candidate or our business. Similarly, even if we are able to complete our planned and ongoing preclinical studies and clinical trials of our product candidates according to our current development timeline, the positive results from such preclinical studies and clinical trials of our product candidates may not be replicated in subsequent preclinical studies or clinical trial results. Moreover, preclinical, nonclinical and clinical data are often susceptible to varying interpretations and analyses, and many companies that believed their product candidates performed satisfactorily in preclinical studies and clinical trials nonetheless failed to obtain FDA or other regulatory approval.
61
Any inability to attract and retain qualified key management and technical personnel would impair our ability to implement our business plan.
Our success largely depends on the continued service of key management and other specialized personnel, including Mitchell H. Gold, M.D., our Executive Chairman and Chief Executive Officer, Stanford Peng, M.D., Ph.D., our President and Head of Research and Development, Paul Rickey, our Senior Vice President and Chief Financial Officer, and Remy Durand, Ph.D., our Chief Business Officer.
The loss of one or more members of our management team or other key employees or advisors could delay our research and development programs and materially harm our business, financial condition, results of operations, and prospects. The relationships our key managers have cultivated within our industry make us particularly dependent upon their continued employment with us. We are dependent on the continued service of our technical personnel because of the highly technical nature of our therapeutic candidates and technologies, and the specialized nature of the regulatory approval process. Because our management team and key employees are not obligated to provide us with continued service, they could terminate their employment with us at any time without penalty. We do not maintain key person life insurance policies on any of our management team members or key employees. Our future success will depend in large part on our continued ability to attract and retain other highly qualified scientific, technical, and management personnel, as well as personnel with expertise in clinical testing, manufacturing, governmental regulation, and commercialization. We face competition for personnel from other companies, universities, public and private research institutions, government entities, and other organizations, including significant competition in the Seattle employment market.
As our therapeutic candidates advance into clinical trials, we may experience difficulties in managing our growth and expanding our operations.
We have limited experience in therapeutic development and very limited experience with clinical trials of therapeutic candidates. As our therapeutic candidates enter and advance through preclinical studies and clinical trials, we will need to expand our development, regulatory, and manufacturing capabilities or contract with other organizations to provide these capabilities for us. For example, as we continue with the development of our product candidates, including povetacicept, we will need to hire additional personnel in clinical operations. We also must manage relationships with collaborators or partners, suppliers, and other organizations. Our ability to manage our operations and future growth will require us to continue to improve our operational, financial, and management controls, reporting systems, and procedures. We may not be able to implement improvements to our management information and control systems in an efficient or timely manner and may discover deficiencies in existing systems and controls.
Our business entails a significant risk of product liability and our inability to obtain sufficient insurance coverage could harm our business, financial condition, results of operations, or prospects.
Our business exposes us to significant product liability risks inherent in the development, testing, manufacturing, and marketing of therapeutic treatments. Product liability claims could delay or prevent completion of our development programs. If we succeed in marketing products, such claims could result in an investigation by certain regulatory authorities, such as FDA or foreign regulatory authorities, of the safety and effectiveness of our products, our manufacturing processes and facilities, or our marketing programs and potentially a recall of our products or more serious enforcement action, limitations on the approved indications for which they may be used, or suspension or withdrawal of approvals. Regardless of the merits or eventual outcome, liability claims may also result in decreased demand for our products, injury to our reputation, costs to defend the related litigation, a diversion of management’s time and our resources, substantial monetary awards to trial participants or patients, and a decline in our valuation. We currently have product liability insurance we believe is appropriate for our stage of development and may need to obtain higher levels of product liability insurance prior to marketing any therapeutic candidates. Any insurance we have or may obtain may not provide sufficient coverage against potential liabilities. Furthermore, clinical trial and product liability insurance is becoming increasingly expensive. As a result, we may be unable to obtain sufficient insurance at a reasonable cost to protect us against losses caused by product liability claims with a potentially material adverse effect on our business.
Our employees may engage in misconduct or other improper activities, including noncompliance with regulatory standards and requirements, which could have a material adverse effect on our business.
We are exposed to the risk of employee fraud or other misconduct. Misconduct by employees could include, but is not limited to:
62
•intentional failures to comply with FDA or U.S. health care laws and regulations, or applicable laws, regulations, guidance, or codes of conduct set by foreign governmental authorities or self-regulatory industry organizations;
•a provision of inaccurate information to any governmental authorities such as FDA;
•noncompliance with manufacturing standards we may establish;
•noncompliance with federal and state healthcare fraud and abuse laws and regulations;
•noncompliance with the U.S. Foreign Corrupt Practices Act, or the FCPA, and similar anti-bribery or anti-corruption laws, regulations or rules of other countries in which we operate; and
•a failure to report financial information or data accurately or a failure to disclose unauthorized activities to us.
In particular, sales, marketing and business arrangements in the healthcare industry are subject to extensive laws, regulations, guidance and codes of conduct intended to prevent fraud, kickbacks, self-dealing and other abusive practices. These laws, regulations, guidance statements, and codes of conduct may restrict or prohibit a wide range of pricing, discounting, marketing and promotion, sales commission, customer incentive program, health care professional, and other business arrangements. As our business is heavily regulated, it involves significant interaction with government officials, including potentially officials of non-U.S. governments. Additionally, in many countries, healthcare providers are employed by the government, and the purchasers of biopharmaceuticals are government entities. As a result, our dealings with are subject to regulation and such healthcare providers and employees of such purchasers may be considered “foreign officials” as defined in the FCPA. Recently, the Securities and Exchange Commission, or the SEC, and Department of Justice have increased their FCPA enforcement activities with respect to biotechnology companies. We also may be subject to U.S. and foreign export controls, trade sanctions and import laws and regulations and if we fail to comply with these laws and regulations, we may face significant penalties, finds and/or denial of certain export privileges.
Employee misconduct could also involve the improper use of information obtained in the course of clinical trials, which could result in regulatory sanctions, including debarment or disqualification of those employees from participation in FDA regulated activities and serious harm to our reputation. This could include violations of provisions of HIPAA, as amended by HITECH, other U.S. federal and state law, and requirements of non-U.S. jurisdictions, including the European Union General Data Protection Regulation.
It is not always possible to identify and deter employee misconduct, and the precautions we take to detect and prevent this activity may not be effective in controlling unknown or unmanaged risks or losses or in protecting us from governmental investigations or other actions or lawsuits stemming from a failure to be in compliance with such laws, regulations, guidance or codes of conduct. Furthermore, we may be held liable under the FCPA and similar laws in other jurisdictions for the corrupt or other illegal activities of our employees, our third-party business partners, representatives and agents, even if we do not explicitly authorize such activities. If any such governmental investigations or other actions or lawsuits are instituted against us, and we are not successful in defending such actions or asserting our rights, those actions could have a significant impact on our business, including the imposition of significant fines, exclusion from government programs, or other sanctions.
Our business involves the use of hazardous materials and we and our third-party manufacturers must comply with environmental laws and regulations, which may be expensive and restrict how we conduct business.
Our third-party manufacturers’ activities and our own activities involve the controlled storage, use and disposal of hazardous and flammable materials, including the components of our pharmaceutical product candidates, test samples and reagents, biological materials and other hazardous compounds. We and our manufacturers are subject to federal, state, local, and foreign laws and regulations governing the use, generation, manufacture, storage, handling, and disposal of these hazardous materials. Although we believe our safety procedures for handling and disposing of these materials and waste products comply with the standards prescribed by these laws and regulations, we cannot eliminate the risk of accidental injury or contamination from the use, storage, handling, or disposal of hazardous materials. In the event of an accident, state, or federal or other applicable authorities may curtail our use of these materials and/or interrupt our business operations. In addition, if an accident or environmental discharge occurs, or if we discover contamination caused by prior operations, including by prior owners and operators of properties we acquire, we could be liable for cleanup obligations, damages, and fines. If such unexpected costs are substantial, this could significantly harm our financial condition and results of operations.
63
Compliance with governmental regulations regarding the treatment of animals used in research could increase our operating costs, which would adversely affect the commercialization of our technology.
The Animal Welfare Act, or AWA, governs the treatment of certain animals used in research. Currently, the AWA imposes a wide variety of specific regulations governing the humane handling, care, treatment, and transportation of certain animals by producers and users of research animals, most notably relating to personnel, facilities, sanitation, cage size and feeding, watering, and shipping conditions. Third parties with whom we contract are subject to registration, inspections, and reporting requirements under the AWA. Furthermore, some states have their own regulations, including general anti-cruelty legislation, which establish certain standards in handling animals. Comparable rules, regulations, and or obligations exist in many foreign jurisdictions. If we or our contractors fail to comply with regulations concerning the treatment of animals used in research, we may be subject to fines and penalties and adverse publicity, and our operations could be adversely affected.
Our current operations are concentrated in one location and any events affecting this location may have material adverse consequences.
Our current operations are primarily situated in Seattle, Washington. Any unplanned event, such as flood, fire, explosion, earthquake, extreme weather condition, medical epidemics, power shortage, power outage, telecommunication failure, or other natural or man-made accidents or incidents resulting in our company being unable to fully utilize the facilities, may have a material adverse effect on our ability to operate our business, particularly on a daily basis, and have significant negative consequences on our financial and operating conditions. Loss of access to these facilities may result in increased costs, delays in the development of our therapeutic candidates, or interruption of our business operations. As part of our risk management policy, we maintain insurance coverage at levels we believe are appropriate for our business. However, in the event of an accident or incident at these facilities, we cannot assure you the amounts of insurance will be sufficient to satisfy any damages and losses or that the insurance covers all risks. If our facilities are unable to operate because of an accident or incident or for any other reason, even for a short period of time, any or all of our research and development programs may be harmed. Any business interruption may have a material adverse effect on our business, financial position, results of operations, and prospects.
Our business may be affected by litigation and government investigations.
From time to time, we receive inquiries and other types of information requests from government authorities as well as correspondence from other third parties regarding various disputes and allegations. For example, we have received letters from Vera Therapeutics, Inc., which is developing a therapeutic candidate, atacicept, in the IgAN space competitive with povetacicept, alleging, among other things, that we made false statements related to atacicept. We believe we have a reasonable basis for our past statements. The letter also alleges potential patent infringement relating to our creation of Vera’s patented molecule for the purpose of generating comparison studies. We believe our activities fall within a statutory safe harbor. It is possible that Vera will commence litigation, which could materially and adversely impact our business. We cannot predict whether any such inquiries or correspondence may ultimately subject us to claims and other actions related to our business activities. While the ultimate outcome of investigations, inquiries, information requests, disputes, and legal proceedings is difficult to predict, responding to such investigations, inquiries and information requests or defending such claims can be expensive, time-consuming and distracting, and adverse resolutions or settlements of those matters may result in, among other things, modification of our business practices, costs, and significant payments, any of which could have a material adverse effect on our business, financial condition, results of operations, and prospects.
Risks Related to Our Financial Position and Capital Needs
The investment of our cash and cash equivalents in fixed income and other investments is subject to risks which may cause losses and affect the liquidity of these investments.
As of December 31, 2023, we had $368.2 million in cash and cash equivalents, restricted cash, and investments; our investments primarily include highly liquid funds with a contractual maturity of each security of less than two years. We expect to continue to invest our excess cash in fixed income and other investments. These investments are subject to general credit, liquidity, market and interest rate risks. We may realize losses in the fair value of these investments, an inability to access cash in these investments for a potentially meaningful period, or a complete loss of these investments, which would have a negative effect on our financial statements.
64
Adverse events or perceptions affecting the financial services industry could adversely affect our operating results, financial condition and prospects.
Limited liquidity, defaults, non-performance or other adverse developments affecting financial institutions or parties with which we do business, or perceptions regarding these or similar risks, have in the past and may in the future lead to market-wide liquidity problems. For example, in March 2023, Silicon Valley Bank, or SVB, was closed and placed in receivership and, subsequently, additional financial institutions have been placed into receivership. We have a banking relationship with SVB and, prior to paying off the remaining balance outstanding in May 2023, were also party to an Amended and Restated Loan and Security Agreement with SVB. While we do not believe our exposure to a potential loss of cash, cash equivalents and investments as a result of SVB’s receivership was material compared to our total cash, cash equivalents and investments, we faced:
•delayed access to deposits or other financial assets, and potential uninsured loss of deposits or other financial assets;
•the inability to access, roll over or extend the maturity of, or enter into new credit facilities or raise other working capital resources;
•potential breach of obligations, including U.S. federal and state wage laws and contracts that require us to maintain letters of credit or other credit support arrangements; and
•termination of cash management arrangements or delays in accessing funds subject to cash management arrangements.
As a result of the U.S. government intervention, we subsequently regained access to our accounts, including the uninsured portion of our deposit accounts. However, there is no guarantee that the U.S. government will intervene to provide access to uninsured funds in the future in the event of the failure of other financial institutions, or that they would do so in a timely fashion. In such an event, we and our counterparties to commercial agreements may be unable to satisfy our respective obligations or enter into new commercial arrangements and may face liquidity issues.
Concerns regarding the U.S. or international financial systems could impact the availability and cost of financing, thereby making it more difficult for us to acquire financing on acceptable terms or at all.
Any of these risks could materially impact our results of operations, liquidity, financial condition and prospects.
Our business may be materially affected by changes to fiscal and tax policies. Negative or unexpected tax consequences could adversely affect our results of operations.
New tax laws, statutes, rules, regulations or ordinances could be enacted at any time, which could adversely affect our business operations, and our business and financial performance. Further, existing tax laws, statutes, rules, regulations or ordinances could be interpreted, changed, modified or applied adversely to us. For example, the Tax Cuts and Jobs Act of 2017, or TCJA, enacted in December 2017, as modified by the Coronavirus Aid, Relief, and Economic Security Act, enacted in April 2020, significantly changed the U.S. Internal Revenue Code, or IRC. Such changes include a reduction in the corporate tax rate and limitations on certain corporate deductions and credits, among other changes. In addition, beginning in 2022, the TCJA eliminated the option to deduct research and development expenditures currently and requires taxpayers to capitalize and amortize them over five or fifteen years pursuant to IRC Section 174. Although Congress is considering legislation that would repeal or defer this capitalization and amortization requirement, it is not certain that this provision will be repealed or otherwise modified. If the requirement to capitalize Section 174 expenditures is not modified, it may increase our effective tax rate and our cash tax liability.
We have generally accounted for changes related to the TCJA in accordance with our understanding of the legislation and guidance available as of the date of this filing as described in more detail in our financial statements and will continue to monitor and assess the impact of the federal legislation on our business and the extent to which various states conform to federal tax law. As another example, on August 16, 2022, the IRA was signed into law, with tax provisions primarily focused on implementing a 15% minimum tax on global adjusted financial statement income, effective for tax years beginning after December 31, 2022, and a 1% excise tax on share repurchases occurring after December 31, 2022. It is unclear at this time what, if any, impact the IRA will have on our company's tax rate and financial results. We will continue to evaluate the IRA’s impact (if any) as further information becomes available. In addition, adverse changes in the financial outlook of our operations or further changes in tax laws or regulations could lead to changes in our valuation allowances against deferred tax assets on our accompanying Consolidated Balance Sheets, which could materially affect our results of operations.
65
Our net operating loss carryforwards and certain other tax attributes may be subject to limitations.
In general, under IRC Section 382 and 383, a corporation that undergoes an “ownership change” is subject to limitations on its ability to utilize its pre-change net operating loss carryforwards, or NOL carryforwards, to offset future taxable income. In general, an ownership change occurs if the aggregate stock ownership of certain stockholders, generally stockholders beneficially owning five percent or more of a corporation’s common stock (for tax purposes), applying certain look-through and aggregation rules, increases by more than 50 percentage points (by value) over such stockholders’ lowest percentage ownership during the testing period, generally three years. We have determined that we have experienced several ownership changes in the past and, as a result, a portion of our NOL carryforwards and certain other tax attributes are subject to limitations with respect to the amounts which can be utilized annually. It is also possible that our NOL carryforwards and certain other tax attributes may be subject to additional limitations as a result of ownership changes in the future because of, among other things, shifts in our stock ownership, many of which are outside our control. Consequently, even if we achieve profitability, we may not be able to utilize a material portion of our NOL carryforwards and certain other tax attributes, which could have a material adverse effect on cash flow and results of operations.
We have commissioned Section 382 studies, focused on our wholly owned operating company and subsidiary, AIS Operating Co., Inc., evaluating changes in ownership for periods from inception through December 31, 2023 and have concluded that we experienced ownership changes in 2016 and 2021, and as a result, our ability to use research and development tax credit and NOL carryforwards created prior to September 17, 2021 has been limited. We have incorporated the resulting limitations into our provision for income taxes for the years ended December 31, 2023 and 2022. Though limited in the amount which can be utilized for the year ended December 31, 2023, and annually thereafter, the restrictions do not definitively prevent the impacted research and development tax credit carryforwards from utilization in future years and before expiration. As such, we have not reduced our research and development tax credit carryforwards as of December 31, 2023.
Under IRC Section 382 and 383, the 2017 merger with Nivalis Therapeutics Inc., or Nivalis, is likely considered an ownership change with respect to the potential limitation of the Nivalis federal tax credits and NOLs. As such, it is likely that any future utilization of Nivalis federal tax credits and NOLs is substantially limited. Therefore, as of December 31, 2018, all Nivalis tax credit and NOL carryforwards have been reduced to zero.
Provisions of debt instruments may restrict our ability to pursue our business strategies.
Our term loan agreements required us, and any debt financing we may obtain in the future may require us, to comply with various covenants that limit our ability to, among other things:
•dispose of assets;
•complete mergers or acquisitions;
•incur indebtedness;
•encumber assets;
•pay dividends or make other distributions to holders of our capital stock;
•use institutions other than our lender for certain banking services;
•make specified investments;
•engage in any new line or business; and
•engagement in certain transactions with our affiliates.
If we enter into future debt financing arrangements similar to our recently repaid term loan facility, such debt financing arrangements may include similar restrictions. If we do pursue such debt financing with such restrictions, these restrictions could inhibit our ability to pursue our business strategies. In addition, if we are required to use our lender for certain banking services, we could be exposed to the risks discussed in “Adverse events or perceptions affecting the financial services industry could adversely affect our operating results, financial condition and prospects.” If we default under future debt financing arrangements, including a material adverse change in our business, operations or condition (financial or otherwise), and such event of default is not cured or waived, the lenders could terminate commitments to lend and cause all amounts outstanding with respect to the debt to be due and payable immediately, which in turn could result in cross defaults under other debt instruments, if any. Our assets and cash flow may not be sufficient to fully repay borrowings under any outstanding debt instruments if some or all of these instruments are accelerated upon a default. We may incur additional indebtedness in the future. The debt instruments governing such indebtedness could contain provisions that are as, or more, restrictive than our previous debt instruments. If we are unable to repay, refinance or restructure any future indebtedness when payment is due, the
66
lenders could proceed against the collateral granted to them to secure such indebtedness or force us into bankruptcy or liquidation.
Risks Related to Cybersecurity
Our computer systems, or those of any of our CROs, manufacturers, other contractors or consultants or potential future collaborators, may fail or suffer security or data privacy breaches or incidents or other unauthorized or improper access to, use of, or destruction of our proprietary or confidential data, employee data, or personal data, which could result in additional costs, loss of revenue, significant liabilities, harm to our brand and material disruption of our operations.
Despite the implementation of security measures in an effort to protect systems that store our information, given their size and complexity and the increasing amounts of information maintained on our internal information technology systems, and those of our third-party CROs, other contractors (including sites performing clinical trials) and consultants, these systems are potentially vulnerable to breakdown or other damage or interruption from service interruptions, system malfunction, natural disasters, terrorism, war and telecommunication and electrical failures, as well as security breaches and incidents from inadvertent or intentional actions by our employees, contractors, consultants, business partners, and/or other third parties, or from cyber-attacks by malicious third parties (including supply chain cyber-attacks or the deployment of harmful malware, ransomware, denial-of-service attacks, social engineering and other means to affect service reliability and threaten the confidentiality, integrity and availability of information), which may compromise our system infrastructure or lead to the loss, destruction, alteration, prevention of access to, disclosure, or dissemination of, or damage or unauthorized access to, our data (including trade secrets or other confidential information, intellectual property, proprietary business information, and personal information) or data that is processed or maintained on our behalf, or other assets, which could result in financial, legal, business and reputational harm to us. The increase in remote working in recent years has increased certain security threats, and phishing and social engineering attacks have increased in recent years. Additionally, cybersecurity researchers have warned of heightened risks of cyberattacks in connection with geopolitical events such as the war in Israel and Russia’s conflict in Ukraine. Any disruption or security incident that were to result in any loss, destruction, unavailability, alteration, disclosure, or dissemination of, or damage or unauthorized access to, our applications, any other data processed or maintained on our behalf or other assets, or any belief or reporting that any of these has occurred, could cause us to incur liability, financial harm and reputational damage and could lead to delays in the development and commercialization of our product candidates. We cannot assure you that our data protection efforts and our investment in information technology, or the efforts or investments of CROs, consultants or other third parties, will prevent significant breakdowns or breaches in systems or other cyber incidents that cause loss, destruction, unavailability, alteration or dissemination of, or damage or unauthorized access to, our data and other data processed or maintained on our behalf or other assets that could have a material adverse effect upon our reputation, business, operations or financial condition. We and certain of our contractors and consultants are, from time to time, subject to cyberattacks and security incidents. While we do not believe that we have experienced any significant system failure, accident or security breach to date, if any system failure, accident, or other disruption, or any security breach or incident, impacting us or any of our third-party CROs or other contractors or consultants, were to occur and cause interruptions in our operations, it could result in a material disruption of our programs and the development of our product candidates could be delayed. In addition, the loss, corruption, or unavailability of clinical trial data for our product candidates could result in delays in our marketing approval efforts and significantly increase our costs to recover or reproduce the data. Further, any such event that leads to loss, damage, or unauthorized access to, or use, alteration, or disclosure, dissemination, unavailability or other processing of, personal information, including personal information regarding our clinical trial subjects or employees, could harm our reputation directly, compel us to comply with federal and/or state breach notification laws and foreign law equivalents, subject us to mandatory corrective action, and otherwise subject us to liability under laws and regulations that protect the privacy and security of personal information, which could result in significant legal and financial exposure and reputational damages that could potentially have an adverse effect on our business.
Notifications and follow-up actions related to a security breach or incident could impact our reputation and cause us to incur significant costs, including legal expenses and remediation costs. For example, the loss of clinical trial data from completed or future clinical trials could result in delays in our regulatory approval efforts and significantly increase our costs to recover or reproduce the lost data. We expect to incur significant costs in an effort to detect and prevent security breaches and incidents, and we may face increased costs and requirements to expend substantial resources in the event of an actual or perceived security breach or incident. We also rely on third parties to manufacture our product candidates, and similar events relating to their computer systems could also have a material adverse effect on our business. Any disruption or security breach or incident resulting in any loss, destruction, or alteration of, unavailability of, or damage or unauthorized access to, our data or other information that is processed or maintained on our behalf, or inappropriate disclosure of or dissemination of any such information, or if any of these were perceived or reported to have occurred, could expose us to litigation and governmental
67
investigations, delays in further development and commercialization of our product candidates, and significant fines, penalties, or other liabilities.
Our insurance policies may not be adequate to compensate us for the potential losses arising from any such disruption in or, failure or security breach or incident of or impacting our systems or third-party systems where information important to our business operations or commercial development is stored. In addition, such insurance may not be available to us in the future on economically reasonable terms, or at all. Further, our insurance may not cover all claims made against us and could have high deductibles in any event, and defending a suit, regardless of its merit, could be costly and divert management attention.
Our information technology systems could face serious disruptions adversely affecting our business.
Our information technology and other internal infrastructure systems, including corporate firewalls, servers, leased lines, and connection to the Internet, face the risk of systemic failure potentially disruptive to our operations. A significant disruption in the availability of our information technology and other internal infrastructure systems, or those of third parties that perform services or supply materials to us, could cause interruptions in our collaborations with our partners and delays in our research and development work.
Our facility is located in Seattle, Washington. We have not undertaken a systematic analysis of the potential consequences to our business and financial results from a major flood, blizzard, fire, earthquake, power loss, terrorist activity, pandemics or other disasters and do not have a recovery plan for such disasters. Also, our contract development and manufacturing organizations’ and suppliers’ facilities are located in multiple locations where other natural disasters or similar events which could severely disrupt our operations, could expose us to liability and could have a material adverse effect on our business. The occurrence of any of these business disruptions could seriously harm our operations and financial condition and increase our costs and expenses.
Risks Related to Our Intellectual Property
If we are not able to obtain and enforce patent protection for our technology, including therapeutic candidates, therapeutic products, and platform technology, development of our therapeutic candidates and platform, and commercialization of our therapeutic products may be materially and adversely affected.
Our success depends in part on our ability to obtain and maintain patents and other forms of intellectual property rights, including in-licenses of intellectual property rights of others, for our technology, including platform technology and therapeutic candidates and products, methods used to manufacture our therapeutic candidates and products, and methods for treating patients using our therapeutic candidates and products, as well as our ability to preserve our trade secrets, to prevent third parties from infringing upon our proprietary rights, and to operate without infringing upon the proprietary rights of others. Our scientific platform and substantially all of our intellectual property have been developed internally. As of December 31, 2023, our patent portfolio consists of over 100 granted and registered patents, and over 230 pending patent applications. We may not be able to apply for patents on certain aspects of our technology, including therapeutic candidates and products, in a timely fashion or at all. Any future patents we obtain may not be sufficiently broad to prevent others from using our technology or from developing competing therapeutics and technology. There is no guarantee that any of our pending patent applications will result in issued or granted patents, any of our issued or granted patents will not later be found to be invalid or unenforceable, or any issued or granted patents will include claims sufficiently broad to cover our technology, including platform technology and therapeutic candidates and products, or to provide meaningful protection from our competitors. Moreover, the patent position of pharmaceutical and biotechnology companies can be highly uncertain because it involves complex legal and factual questions. We will be able to protect our proprietary rights from unauthorized use by third parties only to the extent our current and future technology, including platform technology and therapeutic candidates and products, are covered by valid and enforceable patents or are effectively maintained as trade secrets. If third parties disclose or misappropriate our proprietary rights, it may materially and adversely impact our competitive position in the market.
The U.S. Patent and Trademark Office, or USPTO, and various foreign governmental patent agencies require compliance with a number of procedural, documentary, fee payment, and other provisions during the patent process. There are situations in which noncompliance can result in abandonment or lapse of a patent or patent application, resulting in partial or complete loss of patent rights in the relevant jurisdiction. Patent offices may be affected by COVID-19 or other health epidemic or government-initiated shut-downs, resulting in, for example, non-essential administrative tasks being delayed or eliminated. This could affect patent rights, including the partial or complete loss of patent rights in jurisdictions such as the USPTO and international patent offices. In such an event, competitors might be able to enter the market earlier than would otherwise have
68
been the case. Further, the standards applied by the USPTO and foreign patent offices in granting patents are not always applied uniformly or predictably. For example, there is no uniform worldwide policy regarding patentable subject matter or the scope of claims allowable in biotechnology and pharmaceutical patents. As such, we do not know the degree of future protection we will have on our technology, including platform technology and therapeutic candidates and products. While we will endeavor to try to protect our technology, including platform technology and therapeutic candidates and products, with intellectual property rights such as patents, as appropriate, the process of obtaining patents is time-consuming, expensive, and sometimes unpredictable, and we can provide no assurances our technology, including our platform technology, therapeutic candidates and products, will be adequately protected in the future against unauthorized uses or competing claims by third parties.
In addition, recent and future changes to the patent laws and to the rules of the USPTO and foreign patent offices may have a significant impact on our ability to protect our technology, including therapeutic candidates and products, and enforce our intellectual property rights. For example, the Leahy-Smith America Invents Act enacted in 2011 involves significant changes in patent legislation. In addition, we cannot assure that court rulings or interpretations of any court decision will not adversely impact our patents or patent applications. In addition to increasing uncertainty with regard to our ability to obtain patents in the future, there also may be uncertainty with respect to the value of patents, once obtained. Depending on decisions by the U.S. Congress, the federal courts, the USPTO, or made in foreign jurisdictions, the laws and regulations governing patents could change in unpredictable ways that would weaken our ability to obtain new patents or to enforce our existing patents and patents we might obtain in the future.
The EU Patent Package was implemented on June 1, 2023 with the goal of providing a single pan-European Unitary Patent, or UP, having a unitary effect across all participating countries, and a new European Unified Patent Court, or the UPC, for litigation involving European patents in member states that have acceded and ratified the EU Patent Package. As a result, the default for all European patents, including those granted prior to ratification of the EU Patent Package, is to automatically fall under the jurisdiction of the UPC. For recently granted European patents, an applicant may request UP status no later than one month after grant. It is uncertain how the UPC will impact granted European patents in the biotechnology and pharmaceutical industries. During the first seven years of the UPC’s existence, the UPC legislation allows a patent owner to opt its European patents out of the jurisdiction of the UPC. We may decide to opt out from the UP and the UPC with our future European patents, but doing so may preclude us from realizing the benefits of the UP and UPC. However, if we do not meet all of the formalities and requirements for opting out under the UPC, our future European patents could remain under the jurisdiction of the UPC as European Unitary Patents. If and when our European patent applications are granted as a European Unitary Patent, the UPC provides our competitors with a new forum to centrally revoke our European Unitary Patents in a single judicial forum. Moreover, the UPC allows a competitor the possibility of obtaining an injunction throughout the EU member states who have acceded to the EU Patent Package against our commercial products. Such a loss of patent protection, and the ability to enjoin our commercial products in a single UPC proceeding, could have a material adverse impact on our business and our ability to commercialize our technology and product candidates and, resultantly, on our business, financial condition, prospects and results of operations.
The issuance of a patent is not conclusive as to its inventorship, scope, validity, or enforceability. Once granted, patents may remain open to opposition, interference, re-examination, post-grant review, inter partes review, revocation, nullification, or derivation action in court or before patent offices or similar proceedings before or after allowance or grant, during which time third parties can raise objections against such initial grant. In the course of such proceedings, which may continue for a protracted period of time, the patent owner may be compelled to limit the scope of the pending, allowed or granted claims thus attacked or may lose the allowed or granted claims altogether. Our patent risks include that:
•others may, or may be able to, make, use, offer to sell, or sell compounds that are the same as or similar to our therapeutic candidates and products but that are not covered by the claims of the patents we own or license;
•we or our licensors, collaborators, or any future collaborators may not be the first to file patent applications covering certain aspects of our technology, including our platform technology, therapeutic candidates and products;
•others may independently develop similar or alternative technology or duplicate any of our technology without infringing our intellectual property rights;
•a third party may challenge our patents and, if challenged, a court may not hold that our patents are valid, enforceable, or that a third party is infringing;
•a third party may challenge our patents in various patent offices and, if challenged, we may be compelled to limit the scope of our pending, allowed or granted claims or lose the allowed or granted claims altogether;
•any issued patents we own or have licensed may not provide us with any competitive advantages, or may be challenged by third parties;
69
•we may not develop additional proprietary technologies that are patentable;
•the patents of others could harm our business; and
•our competitors could conduct research and development activities in countries where we do not or will not have enforceable patent rights and then use the information learned from such activities to develop competitive products for sale in major commercial markets where we do not or will not have enforceable patent rights.
We may license patent rights from third-party owners or licensors. If such owners or licensors do not properly or successfully obtain, maintain or enforce the patents underlying such licenses, or if they retain or license to others any competing rights, our competitive position and business prospects may be materially and adversely affected.
We may rely upon intellectual property rights licensed from third parties to protect our technology, including platform technology and therapeutic candidates and products. To date, we have in-licensed some intellectual property, including on a non-exclusive basis intellectual property relating to commercially-available cell lines involved in the manufacture of our therapeutic candidates and products; however, we may also license additional third-party intellectual property in the future, to protect our technology, including intellectual property relating to our platform technology and therapeutic candidates and products. Our success will depend in part on the ability of our licensors to obtain, maintain, and enforce patent protection for our licensed intellectual property, in particular those patents to which we have secured exclusive rights. Our licensors may elect not to prosecute, or may be unsuccessful in prosecuting, any patent applications licensed to us. Even if patents issue or are granted, our licensors may fail to maintain these patents, may determine not to pursue litigation against other companies infringing these patents, or may pursue litigation less aggressively than we would. Further, any additional licenses we enter into may be non-exclusive and we may not be able to obtain exclusive rights, which would potentially allow third parties to develop competing products or technology. Without protection for, or exclusive right to, any intellectual property we may license, other companies might be able to offer substantially identical or similar product(s) for sale, which could adversely affect our competitive business position and harm our business prospects. In addition, we may need to sublicense any rights we have under third-party licenses to current or future collaborators or any future strategic partners. Any impairment of these sublicensed rights could result in reduced revenue under or result in termination of an agreement by one or more of our collaborators or any future strategic partners.
Patent terms may be inadequate to protect our competitive position on our platform technology and therapeutic candidates and products for an adequate amount of time.
Patents have a limited lifespan. In the United States and abroad, if all maintenance fees and annuity fees are timely paid, the natural expiration of a patent is generally 20 years from its earliest non-provisional filing date. The protection a patent affords is limited. Even if patents covering our products are obtained, once the patent life has expired, we may be open to competition from competitive products. Given the amount of time required for the development, testing and regulatory review of new products, patents protecting such products might expire before or shortly after such products are approved and commercialized. As a result, our owned and licensed patent portfolio may not provide us with sufficient rights to exclude others from commercializing products similar or identical to ours.
We may be unable to protect our patent intellectual property rights throughout the world.
Obtaining a valid and enforceable issued or granted patent covering our technology, including therapeutic candidates and products, in the United States and worldwide can be extremely costly. In jurisdictions where we have not obtained patent protection, competitors may use our technology, including our platform technology and therapeutic candidates and products, to develop their own products, and further, may commercialize such products in those jurisdictions and export otherwise infringing products to territories where we have not obtained patent protection. In certain instances, a competitor may be able to export otherwise infringing products in territories where we will obtain patent protection. In jurisdictions outside the United States where we will obtain patent protection, it may be more difficult to enforce a patent as compared to the United States. Competitor products may compete with our future products in jurisdictions where we do not or will not have issued or granted patents or where our issued or granted patent claims or other intellectual property rights are not sufficient to prevent competitor activities in these jurisdictions. The legal systems of certain countries, particularly certain developing countries, make it difficult to enforce patents and such countries may not recognize other types of intellectual property protection, particularly relating to biopharmaceuticals. Geo-political actions in the United States and in foreign countries could increase the uncertainties and costs surrounding the prosecution or maintenance of our patent applications or those of any current or future licensors and the maintenance, enforcement or defense of our issued patents or those of any current or future licensors. This could make it difficult for us to prevent the infringement of our patents or marketing of competing products in violation of our proprietary rights generally in certain jurisdictions. Proceedings to enforce our patent rights in foreign jurisdictions could result
70
in substantial cost and divert our efforts and attention from other aspects of our business. For example, the United States and foreign government actions related to Russia’s conflict in Ukraine may limit or prevent filing, prosecution, and maintenance of patent applications in Russia, including patents obtained through the Eurasian Patent Organization. Government actions may also prevent maintenance of issued patents in Russia. These actions could result in abandonment or lapse of our patents or patent applications, resulting in partial or complete loss of patent rights in Russia. If such an event were to occur, it could have a material adverse effect on our business. In addition, a decree was adopted by the Russian government in March 2022, allowing Russian companies and individuals to exploit inventions owned by patentees from the United States without consent or compensation. Consequently, we would not be able to prevent third parties from exploiting our inventions in Russia or from selling or importing products made using our inventions in and into Russia. Accordingly, our competitive position may be impaired, and our business, financial condition, results of operations and prospects may be adversely affected in Russia.
We generally file a provisional patent application first (a priority filing) at the USPTO. An international application under the Patent Cooperation Treaty, or PCT, is usually filed within twelve months after the priority filing, at times with a United States filing. Based on the PCT filing, national and regional patent applications may be filed in various international jurisdictions, such as in Europe, Japan, Australia, Canada, and the United States. We have so far not filed for patent protection in all national and regional jurisdictions where such protection may be available. In addition, we may decide to abandon national and regional patent applications before they are granted. Finally, the grant proceeding of each national or regional patent is an independent proceeding which may lead to situations in which applications might in some jurisdictions be refused by the relevant registration authorities, while granted by others. It is also quite common that, depending on the country, various scopes of patent protection may be granted on the same therapeutic candidate, product, or technology. The laws of some jurisdictions do not protect intellectual property rights to the same extent as the laws in the United States, and many companies have encountered significant difficulties in protecting and defending such rights in such jurisdictions. If we or our licensors encounter difficulties in protecting, or are otherwise precluded from effectively protecting, the intellectual property rights important for our business in such jurisdictions, the value of these rights may be diminished, and we may face additional competition from others in those jurisdictions. Many countries have compulsory licensing laws under which a patent owner may be compelled to grant licenses to third parties. In addition, many countries limit the enforceability of patents against government agencies or government contractors. In these countries, the patent owner may have limited remedies, which could materially diminish the value of such patent. If we or any of our licensors are forced to grant a license to third parties with respect to any patents relevant to our business, our competitive position in the relevant jurisdiction may be impaired and our business and results of operations may be adversely affected.
We or our licensors, collaborators, or any future strategic partners may become subject to third-party claims or litigation alleging infringement of patents or other proprietary rights or seeking to invalidate patents or other proprietary rights, and we may need to resort to litigation to protect or enforce our patents or other proprietary rights, all of which could be costly, time consuming, delay or prevent the development of our therapeutic candidates and commercialization of our therapeutic products, or put our patents and other proprietary rights at risk.
We or our licensors, licensees, collaborators, or any future strategic partners may be subject to third-party claims for infringement or misappropriation of patent or other proprietary rights. We are generally obligated under our license or collaboration agreements to indemnify and hold harmless our licensors, licensees, or collaborators for damages arising from intellectual property infringement by us. If we or our licensors, licensees, collaborators, or any future strategic partners are found to infringe a third-party patent or other intellectual property rights, we could be required to pay damages, potentially including treble damages, if we are found to have willfully infringed. In addition, we or our licensors, licensees, collaborators, or any future strategic partners may choose to seek, or be required to seek, a license from a third party, which may not be available on acceptable terms, if at all. Even if a license can be obtained on acceptable terms, the rights may be non-exclusive, which could give our competitors access to the same technology or intellectual property rights licensed to or from us. If we fail to obtain a required license, we or our licensee or collaborator, or any future licensee or collaborator, may be unable to effectively market therapeutic products based on our technology, which could limit our ability to generate revenue or achieve profitability and possibly prevent us from generating revenue sufficient to sustain our operations. In addition, we may find it necessary to pursue claims or initiate lawsuits to protect or enforce our patent or other intellectual property rights. The cost to us in defending or initiating any litigation or other proceeding relating to patent or other proprietary rights, even if resolved in our favor, could be substantial, and litigation would divert our management’s attention. Some of our competitors may be able to sustain the costs of complex patent litigation more effectively than we can because they have substantially greater resources. Uncertainties resulting from the initiation and continuation of patent litigation or other proceedings could delay our research and development efforts and limit our ability to continue our operations.
Although we do not believe our technology infringes the intellectual property rights of others, we are aware of one or more patents or patent applications that may relate to our technology, and third parties may assert against our products alleging infringement of their intellectual property rights regardless of whether their claims have merit. Infringement claims could harm
71
our reputation, may result in the expenditure of significant resources to defend and resolve such claims, and could require us to pay monetary damages if we are found to have infringed the intellectual property rights of others.
If we were to initiate legal proceedings against a third party to enforce a patent covering our technology, including therapeutic candidates and products, the defendant could counterclaim that our patent is invalid or unenforceable. In patent litigation in the United States, defendant counterclaims alleging invalidity or unenforceability are commonplace. Grounds for a validity challenge could be an alleged failure to meet any of several statutory requirements, including for example, patent ineligibility, lack of novelty, lack of written description, obviousness, or non-enablement. Recent cases, including the recent U.S. Supreme Court decision in Amgen Inc. v. Sanofi, may impact the claim scope of biological therapeutic products, including certain of our therapeutic candidates and products. Grounds for an unenforceability assertion could be an allegation someone connected with prosecution of the patent withheld relevant information from the USPTO, or made a misleading statement, during prosecution. The outcome following legal assertions of invalidity and unenforceability during patent litigation is unpredictable. With respect to the validity question, for example, we cannot be certain there is no invalidating prior art, of which we and the patent examiner were unaware during prosecution. If a defendant were to prevail on a legal assertion of invalidity or unenforceability, we would lose at least part, and perhaps all, of the patent protection on our technology, including our platform technology and therapeutic candidates and products. Such a loss of patent protection could have a material adverse impact on our business. Patents and other intellectual property rights also will not protect our technology, including our platform technology and therapeutic candidates and products, if competitors design around our protected technology, including our platform technology and therapeutic candidates and products, without legally infringing our patents or other intellectual property rights.
It is also possible we have failed to identify relevant third-party patents or applications. For example, patent applications in the United States and elsewhere are published approximately 18 months after the earliest filing for which priority is claimed, with such earliest filing date being commonly referred to as the priority date. Therefore, patent applications covering our technology, including our platform technology and therapeutic candidates and products, could have been filed by others without our knowledge. Additionally, pending patent applications which have been published can, subject to certain limitations, be later amended in a manner that could cover our technology, including our platform technology and therapeutic candidates and products. Third-party intellectual property rights holders may also actively bring infringement claims against us. We cannot guarantee we will be able to successfully settle or otherwise resolve such infringement claims. If we are unable to successfully settle future claims on terms acceptable to us, we may be required to engage in or continue costly, unpredictable, and time-consuming litigation and may be prevented from, or experience substantial delays in, marketing our technology, including therapeutic candidates and products. If we fail in any such dispute, in addition to being forced to pay damages, we may be temporarily or permanently prohibited from commercializing our technology, including a therapeutic product, held to be infringing. We might, if possible, also be forced to redesign therapeutic candidates or products so we no longer infringe the third-party intellectual property rights. Any of these events, even if we were ultimately to prevail, could require us to divert substantial financial and management resources we would otherwise be able to devote to our business.
If we do not obtain patent term extension and data exclusivity for any therapeutic candidate or product we may develop, our business may be materially harmed.
Depending upon the timing, duration, and specifics of any FDA marketing approval of any therapeutic candidate or product we may develop, one or more of our or in-licensed U.S. patents may be eligible for limited patent term extension under the Drug Price Competition and Patent Term Restoration Act of 1984, or the Hatch-Waxman Act. The Hatch-Waxman Act permits a patent term extension of up to five years as compensation for patent term lost during the FDA regulatory review process. A patent term extension cannot extend the remaining term of a patent beyond a total of 14 years from the date of product approval, only one patent may be extended and only those claims covering the approved drug, a method for using it, or a method for manufacturing it may be extended. Similar extensions as compensation for patent term lost during regulatory review processes are also available in certain foreign countries and territories, such as in Europe under a Supplementary Patent Certificate. However, we may not be granted an extension in the United States and/or foreign countries and territories because of, for example, failing to exercise due diligence during the testing phase or regulatory review process, failing to apply within applicable deadlines, failing to apply prior to expiration of relevant patents, or otherwise failing to satisfy applicable requirements. Moreover, the applicable time period or the scope of patent protection afforded could be less than we request. If we are unable to obtain patent term extension or the term of any such extension is shorter than what we request, our competitors may obtain approval of competing products following our patent expiration, and our business, financial condition, results of operations, and growth prospects could be materially harmed.
72
If we are unable to protect the confidentiality of our trade secrets, our business and competitive position would be harmed.
In addition to seeking patent protection for certain aspects of our technology, including platform technology and therapeutic candidates and products, we also consider trade secrets, including confidential and unpatented know-how, important to the maintenance of our competitive position. We protect trade secrets and confidential and unpatented know-how, in part, by entering into non-disclosure and confidentiality agreements with parties who have access to such knowledge, such as our employees, corporate collaborators, outside scientific collaborators, CROs, contract manufacturers, consultants, advisors, and other third parties. We also enter into confidentiality and invention or patent assignment agreements with our employees and consultants obligating them to maintain confidentiality and assign their inventions to us. Despite these efforts, any of these parties may breach the agreements and disclose our proprietary information, including our trade secrets, and we may not be able to obtain adequate remedies for such breaches. We also cannot guarantee that we have entered into such agreements with each party that may have or has had access to our trade secrets or proprietary technology and processes. Enforcing a claim in the event of a party illegally disclosing or misappropriating a trade secret is difficult, expensive, and time-consuming, and the outcome is unpredictable. In addition, some courts in the United States and certain foreign jurisdictions are less willing or unwilling to protect trade secrets. If any of our trade secrets were to be lawfully obtained or independently developed by a competitor, we would have no right to prevent them from using that technology or information to compete with us. If any of our trade secrets were to be disclosed to or independently developed by a competitor, our competitive position would be harmed.
We are also subject both in the United States and outside the United States to various regulatory schemes regarding requests for the information we provide to regulatory authorities, which may include, in whole or in part, trade secrets or confidential commercial information. While we are likely to be notified in advance of any disclosure of such information and would likely object to such disclosure, there can be no assurance our challenge to the request would be successful.
We may be in the future subject to claims we or our employees or consultants have wrongfully used or disclosed alleged trade secrets of our employees’ or consultants’ former employers or their clients. These claims may be costly to defend and if we do not successfully do so, we may be required to pay monetary damages, may be prohibited from using some of our research and development and may lose valuable intellectual property rights or personnel.
Many of our employees were previously employed at universities or biotechnology or pharmaceutical companies, including our current and potential competitors. We may receive correspondence from other companies alleging the improper use or disclosure, and have received, and may in the future receive, correspondence from other companies regarding the use or disclosure, by certain of our employees who have previously been employed elsewhere in our industry, including with our competitors, of their former employer’s trade secrets or other proprietary information. Responding to these allegations can be costly and disruptive to our business, even when the allegations are without merit, and can be a distraction to management. We may be subject to claims in the future that our employees have, or we have, inadvertently or otherwise used or disclosed trade secrets or other proprietary information of their former employers. Litigation may be necessary to defend against these claims. If we fail in defending current or future claims, in addition to paying monetary damages, we may lose valuable intellectual property rights, personnel, or the ability to use some of our research and development. A loss of intellectual property, key research personnel, or their work product could hamper our ability to commercialize, or prevent us from commercializing, our therapeutic candidates, which could severely harm our business. Even if we are successful in defending against these claims, litigation could result in substantial costs and be a distraction to management.
If our trademarks and trade names are not adequately protected, then we may not be able to build name recognition in our markets of interest and our business may be materially and adversely affected.
Our trademarks or trade names may be challenged, infringed, circumvented, or declared generic or determined to be infringing on other marks. Any trademark litigation could be expensive. We may not be able to protect our rights to these trademarks and trade names or may be forced to stop using these names, which we need for name recognition by potential partners or customers in our markets of interest. If we are unable to establish name recognition based on our trademarks and trade names, we may not be able to compete effectively, and our business may be materially and adversely affected.
Third parties may independently develop similar or superior technology.
There can be no assurance others will not independently develop, or have not already developed, similar or more advanced technologies than our technology or that others will not design around, or have not already designed around, aspects of our technology or our trade secrets developed therefrom. If third parties develop technology similar or superior to our
73
technology, or they successfully design around our current or future technology, our competitive position, business prospects, and results of operations could be materially and adversely affected.
If we fail to comply with our obligations under any license, collaboration, or other agreements, we may be required to pay damages and could lose intellectual property rights necessary for developing and protecting our technology, including our platform technology, therapeutic candidates, and therapeutic products, or we could lose certain rights to grant sublicenses, either of which could have a material adverse effect on our results of operations and business prospects.
Any material future licenses we enter into are likely to impose, various development, commercialization, funding, milestone, royalty, diligence, sublicensing, insurance, patent prosecution and enforcement, and other obligations on us. If we breach any of these obligations, or use the intellectual property licensed to us in an unauthorized manner, we may be required to pay damages and the licensor may have the right to terminate the license, which could result in us being unable to develop, manufacture, and sell or offer to sell products covered by the licensed technology or enable a competitor to gain access to the licensed technology. Moreover, our licensors may own or control intellectual property that has not been licensed to us and, as a result, we may be subject to claims, regardless of their merit, that we are infringing or otherwise violating the licensor’s rights. In addition, while we cannot currently determine the amount of the royalty obligations we may be required to pay on any future sales of licensed products, if any, the amounts may be significant. The amount of our future royalty obligations will depend on the technology and intellectual property we use in therapeutic products we successfully develop and commercialize, if any. Therefore, even if we successfully develop and commercialize therapeutic products, we may be unable to achieve or maintain profitability.
Breaches of our internal computer systems, or those of our contractors, vendors, or consultants, may place our patents or proprietary rights at risk.
The loss of clinical or preclinical data or data from any future clinical trial involving our technology, including therapeutic candidates and products, could result in delays in our development and regulatory filing efforts and significantly increase our costs. In addition, theft or other exposure of data may interfere with our ability to protect our intellectual property, including trade secrets, and other information critical to our operations. We have experienced in the past, and may experience in the future, unauthorized intrusions into our internal computer systems, including portions of our internal computer systems storing information related to our platform technology, therapeutic candidates and products, and we can provide no assurances that certain sensitive and proprietary information relating to one or more of our therapeutic candidates or products has not been, or will not in the future be, compromised. Although we have invested significant resources to enhance the security of our computer systems, there can be no assurances we will not experience additional unauthorized intrusions into our computer systems, or those of our CROs, vendors, contractors, and consultants, that we will successfully detect future unauthorized intrusions in a timely manner, or that future unauthorized intrusions will not result in material adverse effects on our financial condition, reputation, or business prospects. Payments related to the elimination of ransomware may materially affect our financial condition and results of operations.
Certain data breaches must also be reported to affected individuals and the government under applicable data protection laws, and financial penalties may also apply.
Risks Related to Government Regulation
We may be unable to obtain U.S. or foreign regulatory approval and, as a result, may be unable to commercialize our therapeutic candidates.
Our therapeutic candidates are subject to extensive governmental regulations relating to, among other things, research, development, testing, manufacture, quality control, approval, labeling, packaging, promotion, storage, record-keeping, advertising, distribution, sampling, pricing, sales and marketing, safety, post-approval monitoring and reporting, and export and import of drugs. Rigorous preclinical testing and clinical trials and an extensive regulatory approval process are required to be completed successfully in the United States and in many foreign jurisdictions before a new therapeutic can be marketed. Satisfaction of these and other regulatory requirements is costly, time consuming, uncertain, and subject to unanticipated delays. We have not obtained regulatory approval for any therapeutic candidates, and it is possible none of the therapeutic candidates we may develop will obtain the regulatory approvals necessary for us or our collaborators to begin selling them.
We have very limited experience in conducting and managing the clinical trials necessary to obtain regulatory approvals, including approval by the FDA as well as foreign regulatory authorities, such as the EMA. The time required to obtain FDA and foreign regulatory approvals is unpredictable but typically takes many years following the commencement of clinical trials, depending upon the type, complexity, and novelty of the therapeutic candidate, and at the substantial discretion of
74
the regulatory authorities. The standards the FDA and its foreign counterparts use when regulating us are not always applied predictably or uniformly and can change. Any analysis we perform of data from preclinical and clinical activities is subject to confirmation and interpretation by regulatory authorities, who could delay, limit, or prevent regulatory approval. We may also encounter unexpected delays or increased costs due to new government regulations, future legislation or administrative action, or from changes in the policy of FDA or foreign regulatory authorities during the period of product development, clinical trials, and regulatory review by the FDA or foreign regulatory authorities. It is impossible to predict whether legislative changes will be enacted, or whether FDA or foreign, regulations, guidance, or interpretations will be changed, or what the impact of such changes, if any, may be.
Our therapeutic candidates could fail to receive regulatory approval for many reasons, including the following:
•the FDA or comparable foreign regulatory authorities may disagree with the design or implementation of our clinical trials;
•we may be unable to demonstrate to the satisfaction of the FDA or comparable foreign regulatory authorities that a therapeutic candidate is safe and effective for its proposed indication;
•the results of clinical trials may not meet the level of statistical significance required by the FDA or comparable foreign regulatory authorities for approval;
•we may be unable to demonstrate that a therapeutic candidate’s clinical and other benefits outweigh its safety risks;
•the FDA or comparable foreign regulatory authorities may disagree with our interpretation of data from preclinical studies or clinical trials;
•the FDA may change its requirements for the approval of a product candidate even after reviewing and providing comments or advice on a protocol for a pivotal clinical trial that, if successful, would potentially form the basis for an application for approval;
•the data collected from clinical trials of our therapeutic candidates may not be sufficient to support the submission of a BLA or other submission or to obtain regulatory approval in the United States, the European Union or elsewhere;
•the FDA or comparable foreign regulatory authorities may fail to approve the manufacturing processes or facilities of third-party manufacturers with which we contract for clinical and commercial supplies; and
•the approval policies or regulations of the FDA or comparable foreign regulatory authorities may significantly change in a manner rendering our clinical data insufficient for approval.
Any delay or failure in obtaining required approvals could have a material adverse effect on our ability to generate revenues from the particular therapeutic candidate for which we are seeking approval. The FDA, the EMA and other regulatory authorities have substantial discretion in the approval process, and in determining when or whether regulatory approval will be obtained for any of our therapeutic candidates. Even if we believe the data collected from preclinical and clinical trials of our therapeutic candidates are promising, such data may not be sufficient to support approval by the FDA, the EMA or any other regulatory authority. For example, in light of the positive data we announced in November 2023 from our RUBY-3 clinical trial of povetacicept in adult patients with autoimmune glomerulonephritis, we intend to engage with the FDA in order to advance povetacicept into a pivotal study in IgAN in the second half of 2024. However, we cannot be certain that the FDA will be receptive to a proposal to advance povetacicept directly to a pivotal study. Even if the FDA is supportive of advancing povetacicept directly to a pivotal study, we cannot be certain that such study would ultimately provide the support needed to obtain regulatory approval.
Furthermore, any regulatory approval to market a product may be subject to limitations on the approved uses for which we may market the product or in the product labeling or be subject to other restrictions. Regulatory authorities also may impose requirements for costly post-marketing studies or clinical trials and surveillance to monitor the safety or efficacy of the therapeutic. In addition, the FDA has the authority to require a REMS plan as part of the approval of a BLA or NDA, or after approval, which may impose further requirements or restrictions on the distribution or use of an approved drug or biologic, such as limiting prescribing to certain physicians or medical centers that have undergone specialized training, limiting treatment to patients who meet certain safe-use criteria, and requiring treated patients to enroll in a registry. These limitations and restrictions may limit the size of the market for the therapeutic and affect coverage and reimbursement by third-party payors.
We are also subject to numerous foreign regulatory requirements governing, among other things, the conduct of clinical trials, manufacturing, marketing authorization, pricing, and third-party reimbursement. The foreign regulatory approval process varies among countries and may include all of the risks associated with FDA approval described above as well as risks
75
attributable to the satisfaction of local regulations in foreign jurisdictions. We are subject to regulation by foreign regulatory authorities, ethics committees, and other governmental entities with respect to the clinical trials we conduct or sponsor outside of the U.S. For example, the EU Clinical Trials Regulation, or CTR, became applicable on January 31, 2022, repealing the EU Clinical Trials Directive. The implementation of the CTR includes the implementation of the Clinical Trials Information System, a new clinical trial portal and database that will be maintained by the EMA in collaboration with the European Commission and the EU Member States. Complying with changes in regulatory requirements can incur additional costs, delay our clinical development plans, or expose us to greater liability if we are slow or unable to adapt to changes in existing requirements or new requirements or policies governing our business operations, including our clinical trials. Moreover, the time required to obtain approval may differ from that required to obtain FDA approval. Approval by the FDA does not ensure approval by regulatory authorities outside the U.S. and vice versa.
If we fail to obtain orphan drug designation or obtain or maintain orphan drug exclusivity for certain of our products, our competitors may sell products to treat the same conditions and our revenue may be reduced.
Under the Orphan Drug Act, the FDA may designate a product as an orphan drug if it is intended to treat a rare disease or condition, defined as a patient population of fewer than 200,000 in the United States, or a patient population greater than 200,000 in the United States where there is no reasonable expectation that the cost of developing the drug will be recovered from sales in the United States. In the United States, orphan drug designation entitles a party to financial incentives such as opportunities for grant funding towards clinical trial costs, tax advantages and user-fee waivers. In addition, if a therapeutic product with orphan drug designation subsequently receives the first FDA approval for the indication for which it has such designation, the therapeutic product is entitled to orphan product exclusivity, which means the FDA may not approve any other applications to market the same therapeutic product for the same indication for seven years, except in limited circumstances such as a showing of clinical superiority over the product with orphan exclusivity or where the manufacturer is unable to assure sufficient product quantity.
As discussed above, in response to the court decision in Catalyst Pharms., Inc. v. Becerra, 14 F.4th 1299 (11th Cir. 2021), the FDA has clarified that while the agency complies with the court’s order in Catalyst, FDA intends to continue to apply its longstanding interpretation of the regulations to matters outside of the scope of the Catalyst order – that is, the agency will continue tying the scope of orphan-drug exclusivity to the uses or indications for which a drug is approved, which permits other sponsors to obtain approval of a drug for new uses or indications within the same orphan designated disease or condition that have not yet been approved. It is unclear how future litigation, legislation, agency decisions, and administrative actions will impact the scope of the orphan drug exclusivity.
As in the United States, we may apply for designation of a therapeutic candidate as an orphan drug for the treatment of a specific indication in the European Union before the application for marketing authorization is made. In the European Union, the EMA’s Committee for Orphan Medicinal Products, grants orphan drug designation to promote the development of products that are intended for the diagnosis, prevention or treatment of a life-threatening or chronically debilitating condition affecting not more than five in 10,000 persons in the European Union. Additionally, designation is granted for products intended for the diagnosis, prevention or treatment of a life-threatening, seriously debilitating or serious and chronic condition when, without incentives, it is unlikely that sales of the drug in the European Union would be sufficient to justify the necessary investment in developing the drug or biological product or where there is no satisfactory method of diagnosis, prevention or treatment, or, if such a method exists, the medicine must be of significant benefit to those affected by the condition. Sponsors of orphan drugs in the European Union can enjoy economic and marketing benefits, including reduction of fees or fee waivers and up to ten years of market exclusivity for the approved indication unless another applicant can show its therapeutic product is safer, more effective, or otherwise clinically superior to the orphan-designated therapeutic product. This period may be reduced to six years if the orphan drug designation criteria are no longer met, including where it is shown that the product is sufficiently profitable not to justify maintenance of market exclusivity.
We may seek orphan drug designation from the FDA and the EMA for certain of our product candidates. However, we may never receive such designation. Even if we are able to obtain orphan designation, we may not be the first to obtain marketing approval for any particular orphan indication due to the uncertainties associated with developing pharmaceutical products. In addition, exclusive marketing rights in the United States may be limited if we seek approval for an indication broader than the orphan-designated indication or may be lost if the FDA later determines that the request for designation was materially defective or if the manufacturer is unable to assure sufficient quantities of the product to meet the needs of patients with the rare disease or condition. Further, even if we obtain orphan drug exclusivity for a product, that exclusivity may not effectively protect the product from competition because different drugs with different active moieties can be approved for the same condition. Even after an orphan drug is approved, regulatory authorities may subsequently approve the same drug with the same active moiety for the same condition if they conclude that the later drug is safer, more effective, or makes a major contribution to patient care. Orphan drug designation neither shortens the development time or regulatory review time of a
76
product candidate nor gives the product candidate any advantage in the regulatory review or approval process. In addition, orphan drug exclusivity could block the approval of one of our therapeutic candidates if a competitor obtains approval of the same therapeutic product as defined by the FDA before we do, or if our therapeutic candidate is determined to be within the same class as the competitor’s therapeutic product for the same indication or disease.
The respective orphan designation and exclusivity frameworks in the United States and in the European Union are subject to change, and any such changes may affect our ability to obtain EU or U.S. orphan designations in the future.
If we or our existing or future collaborators, manufacturers, or service providers fail to comply with healthcare laws and regulations, we or such other parties could be subject to enforcement actions, which could adversely affect our ability to develop, market, and sell our therapeutics and may harm our reputation.
Although we do not currently have any products on the market, once we begin commercializing our therapeutic candidates, if approved, we will be subject to additional healthcare statutory and regulatory requirements and enforcement by the federal, state, and foreign governments of the jurisdictions in which we conduct our business. Healthcare providers, physicians, and third-party payors play a primary role in the recommendation and prescription of any therapeutic candidates for which we obtain marketing approval. Our future arrangements with third-party payors and customers may expose us to broadly applicable fraud, abuse, and other healthcare laws and regulations constraining the business or financial arrangements and relationships through which we market, sell, and distribute the therapeutic candidates for which we obtain marketing approval. Restrictions under applicable federal and state healthcare laws and regulations include the following:
•the U.S. federal Anti-Kickback Statute, which prohibits, among other things, persons from soliciting, receiving, offering, or providing remuneration, directly or indirectly, to induce either the referral of an individual for a healthcare item or service, or the purchasing or ordering of an item or service, for which payment may be made, in whole or in part, under a federal healthcare program such as Medicare or Medicaid;
•the U.S. federal False Claims Act, which imposes criminal and civil penalties, including through civil whistleblower or qui tam actions, against individuals or entities for knowingly presenting, or causing to be presented, to the federal government, false or fraudulent claims for payment or making a false statement to avoid, decrease, or conceal an obligation to pay money to the federal government. In addition, the government may assert a claim including items and services resulting from a violation of the federal Anti-Kickback Statute constitutes a false or fraudulent claim for purposes of the False Claims Act;
•the criminal healthcare fraud provisions of HIPAA, which impose criminal and civil liability for executing a scheme to defraud any healthcare benefit program, or knowingly and willfully falsifying, concealing, or covering up a material fact or making any materially false statement in connection with the delivery of or payment for healthcare benefits, items or services; similar to the federal Anti-Kickback Statute, a person or entity does not need to have actual knowledge of the statute or specific intent to violate it in order to have committed a violation;
•HIPAA, HITECH, and their implementing regulations, which impose obligations on certain covered entity healthcare providers, health plans, and healthcare clearinghouses as well as their business associates performing certain services involving the use or disclosure of individually identifiable health information, including mandatory contractual terms, with respect to safeguarding the privacy, security, and transmission of individually identifiable health information, and require notification to affected individuals and regulatory authorities of certain breaches of security of individually identifiable health information;
•the federal Physician Payment Sunshine Act and its implementing regulations, also referred to as “Open Payments,” require applicable manufacturers of pharmaceutical and biological drugs, among other covered medical products, reimbursable under Medicare, Medicaid, or Children’s Health Insurance Programs to track and report to the CMS certain payments and transfers of value made in the previous year, including but not limited to, consulting fees, travel reimbursements, and research grants made to cover recipients, including physicians (defined to include doctors, dentists, optometrists, podiatrists and chiropractors), certain non-physician healthcare professionals (such as physician assistants and nurse practitioners, among others), and teaching hospitals, as well as information regarding physicians’ and their immediate family members’ ownership and investment interests in the applicable manufacturer, with limited exceptions; and
•analogous and similar state and foreign laws and regulations, such as, state anti-kickback and false claims laws potentially applicable to sales or marketing arrangements and claims involving healthcare items or services reimbursed by non-governmental third-party payors, including private insurers; and some state laws require pharmaceutical companies to comply with the pharmaceutical industry’s voluntary compliance guidelines and the relevant compliance guidance promulgated by the federal government in addition to requiring drug manufacturers to report information related to payments to physicians and other healthcare providers or marketing expenditures.
77
Ensuring our future business arrangements with third parties comply with applicable healthcare laws and regulations could involve substantial costs. If our operations are found to be in violation of any such requirements, we may be subject to penalties, including civil or criminal penalties, monetary damages, the curtailment or restructuring of our operations, or exclusion from participation in government contracting, healthcare reimbursement, or other government programs, including Medicare and Medicaid, any of which could adversely affect our financial results. Although effective compliance programs can mitigate the risk of investigation and prosecution for violations of these laws, these risks cannot be entirely eliminated. Any action against us for an alleged or suspected violation could cause our company to incur significant legal expenses and could divert our management’s attention from the operation of our business, even if our defense is successful. In addition, achieving and sustaining compliance with applicable laws and regulations may be costly to us in terms of money, time, and resources.
If we or our current or future collaborators, manufacturers, or service providers fail to comply with applicable federal, state, or foreign laws or regulations, we could be subject to enforcement actions, which could affect our ability to develop, market, and sell our therapeutics successfully and could harm our reputation and lead to reduced acceptance of our therapeutics by the market. These enforcement actions include, among others:
•adverse regulatory inspection findings;
•warning or untitled letters;
•voluntary product recalls with public notification or medical product safety alerts to healthcare professionals;
•restrictions on, or prohibitions against, marketing our therapeutics;
•restrictions on, or prohibitions against, importation or exportation of our therapeutics;
•suspension of review or refusal to approve pending applications or supplements to approved applications;
•exclusion from participation in government-funded healthcare programs;
•exclusion from eligibility for the award of government contracts for our therapeutics;
•FDA debarment;
•suspension or withdrawal of therapeutic approvals;
•seizures or administrative detention of therapeutics;
•injunctions; and
•restitution, disgorgement of profits, or civil and criminal penalties and fines.
Enacted and future legislation may increase the difficulty and cost for us to obtain or maintain marketing approval of our therapeutic candidates.
The policies of the FDA or similar regulatory authorities may change, and additional government regulations may be enacted that could prevent, limit or delay regulatory approval of our product candidates. For example, in 2016, the 21st Century Cures Act, or Cures Act, was signed into law. The Cures Act, among other things, is intended to modernize the regulation of drugs and biologics and spur innovation, but it is still being implemented and its ultimate implementation is unclear. If we or our collaborators are slow or unable to adapt to changes in existing requirements or the adoption of new requirements or policies, or if we or our collaborators are not able to maintain regulatory compliance, our therapeutic candidates may not obtain or maintain regulatory approval, and we may not achieve or sustain profitability, which would adversely affect our business.
We cannot predict the likelihood, nature or extent of government regulation that may arise from future legislation or executive or administrative action, either in the United States or abroad. The FDA’s and other regulatory authorities’ policies may change, and additional government regulations may be enacted that could prevent, limit or delay regulatory approval of our product candidates. If we are slow or unable to adapt to changes in existing requirements or the adoption of new requirements or policies, or if we are not able to maintain regulatory compliance, we may lose any marketing approval that we may have obtained, and we may not achieve or sustain profitability. For example, the Food and Drug Omnibus Reform Act made several changes to the FDA’s authorities and its regulatory framework, including, among other changes, reforms to the accelerated approval pathway, such as requiring the FDA to specify conditions for post-approval study requirements and setting forth procedures for the FDA to withdraw a product on an expedited basis for non-compliance with post-approval requirements. Further, if the Supreme Court reverses or curtails the Chevron doctrine, which gives deference to regulatory agencies in litigation against FDA and other agencies, more companies may bring lawsuits against FDA to challenge longstanding decisions and policies of FDA, which could undermine FDA’s authority, lead to uncertainties in the industry, and disrupt FDA’s normal operations, which could delay FDA’s review of our marketing applications. It is difficult to predict how current
78
and future legislation, executive actions, and litigation, including the executive orders, will be implemented, and the extent to which they will impact our business, our clinical development, and the FDA’s and other agencies’ ability to exercise their regulatory authority, including FDA’s pre-approval inspections and timely review of any regulatory filings or applications we submit to the FDA. To the extent any legislative or executive actions impose constraints on FDA’s ability to engage in oversight and implementation activities in the normal course, our business may be negatively impacted.
Any therapeutics we develop may become subject to unfavorable pricing regulations, third-party coverage and reimbursement practices, or healthcare reform initiatives, thereby harming our business.
The regulations governing marketing approvals, pricing, coverage, and reimbursement for new drugs and biologics vary widely from country to country. Many countries require approval of the sale price of a drug before it can be marketed. In many countries, the pricing review period begins after marketing or product licensing approval is granted. In some foreign markets, prescription pharmaceutical pricing remains subject to continuing governmental control even after initial approval is granted. Although we intend to monitor these regulations, our programs are currently in the early stages of development and we will not be able to assess the impact of price regulations for a number of years. As a result, we might obtain regulatory approval for a product in a particular country but then be subject to price regulations delaying our commercial launch of the product and negatively impacting the revenues we are able to generate from the sale of the product in that country.
Our ability to commercialize any therapeutics successfully also will depend in part on the extent to which coverage and reimbursement for these products and related treatments will be available from government health administration authorities, private health insurers, and other organizations. However, there may be significant delays in obtaining coverage for newly-approved therapeutics. Moreover, eligibility for coverage does not necessarily signify a therapeutic will be reimbursed in all cases or at a rate covering our costs, including research, development, manufacture, sale, and distribution costs. Also, interim payments for new therapeutics, if applicable, may be insufficient to cover our costs and may not be made permanent. Thus, even if we succeed in bringing one or more therapeutics to the market, these products may not be considered cost-effective, and the amount reimbursed for any of them may be insufficient to allow us to sell them on a competitive basis. Because our programs are in the early stages of development, we are unable at this time to determine their cost effectiveness, coverage prospects, potential compendia listings, or the likely level or method of reimbursement, if covered. It is equally difficult for us to predict how Medicare coverage and reimbursement policies will be applied to our products in the future, and coverage and reimbursement under different federal healthcare programs are not always consistent. Medicare reimbursement rates may also reflect budgetary constraints placed on the Medicare program.
Third-party payors often rely upon Medicare coverage policies and payment limitations in setting their own reimbursement rates. These coverage policies and limitations may rely, in part, on compendia listings for approved therapeutics. Our inability to promptly obtain relevant compendia listings, coverage, and adequate reimbursement from both government-funded and private payors for new therapeutics we develop and for which we obtain regulatory approval could have a material adverse effect on our operating results, our ability to raise capital needed to commercialize products, and our financial condition.
We believe the efforts of governments and third-party payors to contain or reduce the cost of healthcare, and legislative and regulatory proposals to broaden the availability of healthcare, will continue to affect the business and financial condition of pharmaceutical and biopharmaceutical companies. A number of legislative and regulatory changes in the healthcare system in the United States and other major healthcare markets have been proposed or enacted, and such efforts have expanded substantially in recent years. These developments could, directly or indirectly, affect our ability to sell our products, if approved, at a favorable price. In addition, third-party payors who reimburse patients or healthcare providers, such as government and private insurance plans, are seeking greater upfront discounts, additional rebates, and other concessions to reduce the prices for therapeutics. If the price we are able to charge for any therapeutics we develop, or the reimbursement provided for such products, is inadequate, our return on investment could be adversely affected.
Pursuant to health reform legislation and related initiatives, the CMS are working with various healthcare providers to develop, refine, and implement Accountable Care Organizations, or ACOs, and other innovative models of care for Medicare and Medicaid beneficiaries, including the Bundled Payments for Care Improvement Initiative, the Comprehensive Primary Care Initiative, the Duals Demonstration, and other models. The continued development and expansion of ACOs and other innovative models of care will have an uncertain impact on any future reimbursement we may receive for approved therapeutics administered by such organizations.
In addition, in recent years, the U.S. Congress has enacted various laws seeking to reduce the federal debt level and contain healthcare expenditures. For example, as a result of the Budget Control Act of 2011 and the Bipartisan Budget Act of 2015, reductions to Medicare payments took effect in 2013 and will remain in effect through 2032, unless Congress takes additional action.
79
There has been increasing legislative and enforcement interest in the United States with respect to specialty drug pricing practices. Specifically, there have been several recent U.S. Congressional inquiries and proposed federal and state legislation designed to, among other things, bring more transparency to drug pricing, reduce the cost of prescription drugs under Medicare, review the relationship between pricing and manufacturer patient programs, and reform government program reimbursement methodologies for drugs. For example, under the American Rescue Plan Act of 2021 the statutory cap on Medicaid Drug Rebate Program rebates that manufacturers pay to state Medicaid programs was eliminated. Elimination of this cap may require pharmaceutical manufacturers to pay more in rebates than it receives on the sale of products, which could have a material impact on our business. In July 2021, the Biden administration released an executive order, “Promoting Competition in the American Economy,” with multiple provisions aimed at increasing competition for prescription drugs. In August 2022, Congress passed the IRA, which includes prescription drug provisions that have significant implications for the pharmaceutical industry and Medicare beneficiaries, including allowing the federal government to negotiate a maximum fair price for certain high-priced single source Medicare drugs, imposing penalties and excise tax for manufacturers that fail to comply with the drug price negotiation requirements, requiring inflation rebates for all Medicare Part B and Part D drugs, with limited exceptions, if their drug prices increase faster than inflation, and redesigning Medicare Part D to reduce out-of-pocket prescription drug costs for beneficiaries, among other changes. The HHS has and will continue to issue and update guidance as these programs are implemented. On August 29, 2023, HHS announced the list of the first ten drugs that will be subject to price negotiations. Various industry stakeholders, including pharmaceutical companies, the U.S. Chamber of Commerce, the National Infusion Center Association, the Global Colon Cancer Association, and the Pharmaceutical Research and Manufacturers of America, have initiated lawsuits against the federal government asserting that the price negotiation provisions of the IRA are unconstitutional. The impact of these judicial challenges, legislative, executive, and administrative actions and any future healthcare measures and agency rules implemented by the government on us and the pharmaceutical industry as a whole is unclear. In addition, in response to the Biden administration’s October 2022 executive order, on February 14, 2023, HHS released a report outlining three new models for testing by the Centers for Medicare and Medicaid Services Innovation Center, which will be evaluated on their ability to lower the cost of drugs, promote accessibility, and improve quality of care. It is unclear whether the models will be used in any health reform measures in the future. Any reduction in reimbursement from Medicare or other government programs may result in a reduction in payments from private payors. Additionally, a number of states are considering or have recently enacted state drug price transparency and reporting laws that could substantially increase our compliance burdens and expose us to greater liability under such state laws once we begin commercialization after obtaining regulatory approval for any of our products. Further, FDA recently authorized the state of Florida to import certain prescription drugs from Canada for a period of two years to help reduce drug costs, provided that Florida’s Agency for Health Care Administration meets the requirements set forth by the FDA. Other states may follow Florida.
The implementation of cost containment measures or other healthcare reforms may prevent us from being able to generate revenue, attain profitability or commercialize our product candidates. The impact of legislative, executive, and administrative actions of the Biden administration on us and the biopharmaceutical industry as a whole is unclear. We expect that additional state and federal healthcare reform measures will be adopted in the future, any of which could limit the amounts that federal and state governments will pay for healthcare products and services, which could result in reduced demand for our product candidates or additional pricing pressures.
The healthcare industry is heavily regulated in the U.S. at the federal, state, and local levels and in other jurisdictions in which we may conduct trials or other activities, and our failure to comply with applicable requirements may subject us to penalties and negatively affect our financial condition.
As a healthcare company, our operations, clinical trial activities, and interactions with healthcare providers will be subject to extensive regulation in the United States, particularly if we receive FDA approval for any of our products in the future, and we may be subject to laws and regulations in other jurisdictions as we conduct clinical trials or engage in other activities in foreign jurisdictions. For example, if we receive FDA approval for a therapeutic for which reimbursement is available under a federal healthcare program, it would be subject to a variety of federal laws and regulations, including those prohibiting the filing of false or improper claims for payment by federal healthcare programs, prohibiting unlawful inducements for the referral of business reimbursable by federal healthcare programs, and requiring disclosure of certain payments and other transfers of value made to covered recipients in the previous year, including U.S.-licensed physicians (defined to include doctors, dentists, optometrists, podiatrists and chiropractors), certain non-physician healthcare professionals (such as physician assistants and nurse practitioners, among others), and teaching hospitals, as well as information regarding certain physicians’ and their immediate family members’ ownership and investment interests in the applicable manufacturer with limited exceptions. If our past or present operations, or those of our contractors or agents who conduct business on our behalf, are found to be in violation of any of these laws, we could be subject to enforcement action, government investigation, civil and criminal penalties, which could hurt our business, operations, and financial condition. It is not always possible to identify and deter misconduct by parties we may contract with, including employees, contractors, collaborators, CROs, and suppliers, and the precautions we take to detect and prevent misconduct may not be effective in controlling unknown or unmanaged risks or
80
losses or in protecting us from governmental investigations or other actions or lawsuits stemming from a failure to comply with these laws or regulations. If any such actions are instituted against us, and we are not successful in defending ourselves or asserting our rights, those actions could have a significant impact on our business, including the imposition of significant penalties, including civil, criminal and administrative penalties, damages, fines, disgorgement, imprisonment, exclusion from participation in government funded healthcare programs, such as Medicare and Medicaid, integrity oversight and reporting obligations, contractual damages, reputational harm, diminished profits and future earnings and the curtailment or restructuring of our operations.
Similarly, some state laws prohibit, among other offenses, knowingly and willfully executing a scheme to defraud any health care benefit program, including private payors, or falsifying, concealing, or covering up a material fact or making any materially false, fictitious, or fraudulent statement in connection with the delivery of or payment for items or services under a health care benefit program. We may also be subject to the privacy and security provisions of HIPAA, as amended by HITECH, which restricts the use and disclosure of patient-identifiable health information, mandates the adoption of standards relating to the privacy and security of patient-identifiable health information, and requires the reporting of certain security breaches to healthcare provider customers with respect to such information. Additionally, many states have enacted similar laws imposing more stringent requirements on entities like us or otherwise providing for obligations in connection with the collection, use, and other processing of patient-identifiable health information, such as Washington’s My Health, My Data Act and similar laws in Nevada and Connecticut. Failure to comply with applicable laws and regulations could result in substantial penalties and adversely affect our financial condition and results of operations. Complying with new regulatory requirements and changes in the laws and regulations will increase our compliance cost and exposure to potential liability.
Additionally, the collection and use of health data in the EU is governed by the General Data Protection Regulation, or GDPR, which extends the geographical scope of EU data protection law to non-EU entities under certain conditions and imposes substantial obligations upon companies and new rights for individuals. Further, state and foreign laws may apply generally to the privacy and security of information we maintain, and may differ from each other in significant ways, thus complicating compliance efforts, as discussed in the risk factor below titled, “Data collection is governed by restrictive regulations governing the use, processing and cross-border transfer of personal information, and actual or perceived failures to comply with applicable data protection, privacy and security laws, regulations, standards and other requirements could adversely affect our business, results of operations and financial condition.”
Data collection is governed by restrictive regulations governing the use, processing and cross-border transfer of personal information, and actual or perceived failures to comply with applicable data protection, privacy and security laws, regulations, standards and other requirements could adversely affect our business, results of operations and financial condition.
The global data protection landscape is rapidly evolving, and we are or may become subject to numerous state, federal and foreign laws, regulations, and other actual and asserted obligations governing the collection, use, disclosure, retention, and security of personal information, such as information collected or otherwise processed in connection with clinical trials in the U.S. and abroad. Implementation standards and enforcement practices are likely to remain uncertain for the foreseeable future, and we cannot yet determine the impact future laws, regulations, standards, or other actual or asserted obligations, or any perception of their requirements may have on our business. This evolution may create uncertainty in our business, affect our ability to operate in certain jurisdictions or to collect, store, transfer use and share personal information, necessitate the acceptance of more onerous obligations in our contracts, result in liability or impose additional costs on us. The cost of compliance with these laws, regulations, standards, and obligations is high and is likely to increase in the future. Any failure or perceived failure by us to comply with federal, state or foreign laws or regulations, our internal policies and procedures, our contractual obligations governing our processing of personal information, or any other standards or other actual or asserted obligations, could result in negative publicity, government investigations and enforcement actions, claims by third parties and damage to our reputation, any of which could have a material adverse effect on our business, results of operation, and financial condition.
In conducting and/or enrolling patients in our current or future clinical trials, we are subject to restrictions relating to privacy, data protection and data security and may be subject to additional restrictions as our clinical operations expand. For example, the collection, use, storage, disclosure, transfer, or other processing of personal data regarding individuals in the European Economic Area, or EEA, including personal health data, is subject to the GDPR. The GDPR is wide-ranging in scope and imposes numerous requirements on companies that process personal data, including requirements relating to processing health and other sensitive data, obtaining consent of the individuals to whom the personal data relates, providing information to individuals regarding data processing activities, implementing safeguards to protect the security and confidentiality of personal data, providing notification of data breaches (initially to supervisory authorities and, if the breach is serious enough, to individuals), and taking certain measures when engaging third-party processors. The GDPR also imposes strict rules on the
81
transfer of personal data to countries outside the EEA, including the United States, and permits data protection authorities to impose large penalties for violations of the GDPR, including potential fines of up to €20 million or 4% of annual global revenues, whichever is greater, for the most serious of violations. The GDPR also confers a private right of action on data subjects and consumer associations to lodge complaints with supervisory authorities, seek judicial remedies, and obtain compensation for damages resulting from violations of the GDPR. In addition, the GDPR includes restrictions on cross-border data transfers. Certain aspects of cross-border data transfers under the GDPR are uncertain as the result of legal proceedings in the EU. Case law from the Court of Justice of the European Union, or CJEU, states that reliance on the standard contractual clauses, or EU SCCs, a standard form of contract approved by the European Commission as an adequate personal data transfer mechanism, alone may not be sufficient in all circumstances and that transfers must be assessed on a case-by-case basis. On October 7, 2022, President Biden signed an Executive Order on “Enhancing Safeguards for United States Intelligence Activities” that introduced new redress mechanisms and binding safeguards to address the concerns raised by the CJEU in relation to data transfers from the EEA to the U.S. and which formed the basis of the EU-U.S. Data Privacy Framework, or DPF, as released on December 13, 2022. The European Commission adopted an adequacy decision regarding the DPF on July 10, 2023, rendering the DPF effective as a GDPR transfer mechanism to U.S. entities self-certified under the DPF. We currently rely on the EU SCCs and the UK Addendum to the EU SCCs to transfer personal data outside the EEA and the UK, including to the U.S., with respect to both intragroup and third party transfers. We expect legal complexity and uncertainty regarding international personal data transfers to continue. In particular, we expect the DPF’s adequacy decision to be challenged and international transfers to the U.S. and to other jurisdictions to continue to be subject to enhanced scrutiny by regulators. The GDPR increased our responsibility and liability in relation to personal data that we process where such processing is subject to the GDPR, and we may be required to put in place additional mechanisms to ensure compliance with the GDPR, including as implemented by individual countries.
In the UK the Data Protection Act of 2018 is effective along with a version of the GDPR referred to as the UK GDPR. Collectively, the Data Protection Act of 2018 and the UK GDPR authorize significant fines, up to the greater of £17.5 million or 4% of global turnover, and expose us to two parallel regimes and other potentially divergent enforcement actions for certain violations. Further, aspects of data protection in the UK remain uncertain. On June 28, 2021, the European Commission issued an adequacy decision under the GDPR and the Law Enforcement Directive, pursuant to which personal data generally may be transferred from the EU to the UK without restriction; however, this adequacy decision is subject to a four-year “sunset” period, after which the European Commission’s adequacy decision may be renewed, and this decision may be revoked or modified in the interim. Additionally, on February 2, 2022, the UK’s Information Commissioner’s Office issued new standard contractual clauses to support personal data transfers out of the UK, or the UK SCCs. The UK SCCs became effective March 21, 2022 and, similar to the EU SCCs, are required to be implemented. On October 12, 2023, the UK Extension to the DPF came into effect as a UK GDPR data transfer mechanism to U.S. entities self-certified under the UK Extension to the DPF. We may, in addition to other impacts, experience additional costs associated with increased compliance burdens and be required to engage in new contract negotiations with third parties that aid in processing personal data on our behalf or localize certain personal data.
Other jurisdictions also increasingly maintain laws and regulations addressing privacy, data protection, and information security. We may incur liabilities, expenses, costs, and other operational losses under GDPR and local laws of applicable EU member states, Switzerland, the UK, and other regions in connection with any measures we take to comply with them. Working to comply with the GDPR and other laws and regulations to which we are subject in Europe and other regions outside the United States relating to privacy, data protection, and information security will be a rigorous and time-intensive process that may increase our cost of doing business or require us to change our business practices, and despite those efforts, there is a risk that we may be subject to fines and penalties, litigation, and reputational harm in connection with our activities in those regions.
In addition, in California, the California Consumer Privacy Act, or CCPA, creates new individual privacy rights for California consumers (as defined in the law) and places increased privacy and security obligations on entities handling personal data of consumers or households. The CCPA requires covered companies to provide new disclosure to consumers about such companies’ data collection, use and sharing practices, provide such consumers new ways to opt-out of certain sales or transfers of personal information, and provide consumers with additional causes of action in data breach situations. The CCPA went into effect on January 1, 2020, and the California Attorney General commenced enforcement actions for violations on July 1, 2020. Moreover, the California Privacy Rights Act, or CPRA, was approved by California voters in the November 3, 2020 election. The CPRA significantly modified the CCPA and became effective January 1, 2023. The CPRA creates further uncertainty and may require us to incur additional costs and expenses. The CCPA and CPRA could mark the beginning of a trend toward more stringent privacy legislation in the United States. The CCPA has prompted a number of proposals for federal and state privacy legislation. For example, Colorado, Utah, Virginia and Connecticut all have enacted general privacy legislation that has become, or will become, effective in 2023, Florida, Montana, Oregon, and Texas have enacted general privacy legislation that becomes effective in 2024; Delaware, Iowa, New Jersey and Tennessee have enacted similar legislation that becomes effective in 2025; and Indiana has enacted similar legislation that becomes effective in 2026. The U.S. federal government also is
82
contemplating federal privacy legislation. Several states have enacted laws that provide additional protection to consumer health data, including Washington, which enacted the My Health, My Data Act, which, among other things, provides for a private right of action, and Nevada and Connecticut, which have enacted similar laws. While certain of these laws exempt some data regulated by HIPAA and certain clinical trial data, they may increase our compliance costs and potential liability. These and other new laws that may be proposed or enacted could require us to modify our policies and practices and may increase our potential liability and adversely affect our business.
Compliance with U.S. and international data protection laws and regulations could require us to take on more onerous obligations in our contracts, restrict our ability to collect, use and disclose data, or in some cases, impact our ability to operate in certain jurisdictions. Any actual or alleged failure to comply with U.S. or international laws and regulations relating to privacy, data protection, and data security could result in governmental investigations, proceedings and enforcement actions (which could include civil or criminal penalties), private litigation or adverse publicity, harm to our reputation, and could negatively affect our operating results and business. Moreover, clinical trial subjects about whom we or our potential collaborators obtain information, as well as the providers who share this information with us, may contractually limit our ability to use and disclose the information or impose other obligations or restrictions in connection with our use, retention and other processing of information, and we may otherwise face contractual restrictions applicable to our use, retention, and other processing of information. Claims that we have violated individuals’ privacy rights, failed to comply with data protection laws, or breached our contractual obligations, even if we are not found liable, could be expensive and time-consuming to defend and could result in adverse publicity that could harm our business.
Our ability to obtain services, reimbursement, or funding from the federal government may be impacted by possible reductions in federal spending.
The U.S. federal budget remains in flux and could, among other things, cut Medicare payments to providers. The Medicare program is frequently mentioned as a target for spending cuts. The full impact on our business of any future cuts in Medicare or other programs is uncertain. We cannot predict the extent of legislative, executive, and administrative actions of the Biden administration will have on us and the biopharmaceutical industry as a whole. If federal spending is reduced, anticipated budgetary shortfalls may also impact the ability of relevant agencies such as the FDA or the National Institutes of Health to continue to function at current levels. Amounts allocated to federal grants and contracts may be reduced or eliminated. These reductions may also impact the ability of relevant agencies to timely review and approve drug research and development, manufacturing, and marketing activities, which may delay our ability to develop, market, and sell any therapeutics we may develop.
Disruptions at the FDA, the SEC and other government agencies caused by funding shortages or global health concerns could hinder their ability to hire and retain key leadership and other personnel, or otherwise prevent new or modified products from being developed, approved or commercialized in a timely manner or at all, or otherwise prevent those agencies from performing normal business functions on which the operation of our business may rely, which could negatively impact our business.
The ability of the FDA to review and approve new products can be affected by a variety of factors, including government budget and funding levels, ability to hire and retain key personnel and accept the payment of user fees, and statutory, regulatory, and policy changes, and other events that may otherwise affect the FDA’s ability to perform routine functions. Average review times at the agency have fluctuated in recent years as a result. In addition, government funding of the SEC and other government agencies on which our operations may rely, including those that fund research and development activities is subject to the political process, which is inherently fluid and unpredictable.
Disruptions at the FDA and other agencies may also slow the time necessary for new drugs to be reviewed or approved by necessary government agencies, which would adversely affect our business. For example, in 2018 and 2019, the U.S. government shut down several times and certain regulatory agencies, such as the FDA and the SEC, had to furlough critical employees and stop critical activities. If a prolonged government shutdown or other disruption occurs, or if global health or other concerns continue to prevent the FDA or other regulatory authorities from conducting their regular inspections, reviews, or other regulatory activities in a timely manner, it could significantly impact the ability of the FDA to timely review and process our regulatory submissions, which could have a material adverse effect on our business. Further, future government shutdowns or delays could impact our ability to access the public markets and obtain necessary capital in order to properly capitalize and continue our operations.
83
If any of our therapeutic candidates receives marketing approval and we or others later identify undesirable side effects caused by the therapeutic product, our ability to market and derive revenue from the therapeutic products could be compromised.
In the event any of our therapeutic candidates receive regulatory approval and we or others identify undesirable side effects, adverse events, or other problems caused by one of our therapeutics, any of the following adverse events could occur, which could result in the loss of significant revenue to us and materially and adversely affect our results of operations and business:
•regulatory authorities may withdraw their approval of the product and require us to take the product off the market or seize the product;
•we may need to recall the therapeutic or change the way the therapeutic is administered to patients;
•additional restrictions may be imposed on the marketing and promotion of the particular therapeutic or the manufacturing processes for the therapeutic or any component thereof;
•we may not be able to secure or maintain adequate coverage and reimbursement for our proprietary therapeutic products from government (including U.S. federal health care programs) and private payors;
•we may lose or see adverse alterations to compendia listings or treatment protocols specified by accountable care organizations;
•we may be subject to fines, restitution, or disgorgement of profits or revenues, injunctions, or the imposition of civil penalties or criminal prosecution;
•regulatory authorities may require the addition of labeling statements, such as a “black box” warning, or equivalent, or a contraindication;
•regulatory authorities may require us to implement a REMS plan, or to conduct post-marketing studies or clinical trials and surveillance to monitor the safety or efficacy of the product;
•we may be required to create a Medication Guide outlining the risks of such side effects for distribution to patients;
•we could be sued and held liable for harm caused to patients;
•the therapeutic may become less competitive; and
•our reputation may suffer.
Our therapeutic candidates for which we intend to seek approval as biologic products may face competition sooner than anticipated.
The Patient Protection and ACA, signed into law in 2010, includes a subtitle called the BPCIA, which created an abbreviated approval pathway for biological products that are biosimilar to or interchangeable with an FDA-licensed reference biological product. Under the BPCIA, an application for a biosimilar product may not be submitted to the FDA until four years following the date that the reference product was first licensed by the FDA. In addition, the approval of a biosimilar product may not be made effective by the FDA until 12 years from the date on which the reference product was first licensed. During this 12-year period of exclusivity, another company may still market a competing version of the reference product if the FDA approves a full BLA for the competing product containing the sponsor’s own preclinical data and data from adequate and well-controlled clinical trials to demonstrate the safety, purity and potency of their product. The law is complex and is still being interpreted and implemented by the FDA. As a result, its ultimate impact, implementation, and meaning are subject to uncertainty. While it is uncertain when such processes intended to implement BPCIA may be fully adopted by the FDA, any such processes could have a material adverse effect on the future commercial prospects for our biological products.
We believe that any of our therapeutic candidates approved as a biological product under a BLA should qualify for the 12-year period of exclusivity. However, there is a risk that this exclusivity could be shortened due to congressional action or otherwise, or that the FDA will not consider our therapeutic candidates to be reference products for competing products, potentially creating the opportunity for generic competition sooner than anticipated. Other aspects of the BPCIA, some of which may impact the BPCIA exclusivity provisions, have also been the subject of recent litigation. Moreover, the extent to which a biosimilar, once approved, will be substituted for any one of our reference products in a way that is similar to traditional generic substitution for non-biological products is not yet clear, and will depend on a number of marketplace and regulatory factors that are still developing.
84
Risks Related to Ownership of Our Common Stock
Our stock price may be volatile, and an active, liquid, and orderly trading market may not be maintained for our common stock. As a result, stockholders may not be able to resell shares at or above their purchase price.
Although our common stock is listed on the Nasdaq Global Market, an active trading market for our common stock may not be sustained. The lack of an active market may impair the ability of our stockholders to sell their shares at the time they wish to sell them or at a price that they consider reasonable, which may reduce the fair market value of their shares. Further, an inactive market may also impair our ability to raise capital by selling our common stock should we determine additional funding is required.
The market price of our common stock could be subject to significant fluctuations. Market prices for securities of early-stage pharmaceutical, biotechnology, and other life sciences companies have historically been particularly volatile. Some of the factors that may cause the market price of our common stock to fluctuate include:
•our and our collaborators’ ability to obtain regulatory approvals for product candidates, and delays or failures to obtain such approvals;
•the failure of any of our product candidates, if approved, to achieve commercial success;
•issues in manufacturing our approved products, if any, or product candidates;
•the results of current, and any future, preclinical or clinical trials of our product candidates;
•our ability to achieve development milestones and receive associated milestone payments pursuant to the terms of our collaboration agreements;
•the entry into, or termination of, key agreements, including key licensing, collaboration or acquisition agreements;
•the initiation of, or material developments in, or conclusion of litigation to enforce or defend any of our intellectual property rights or defend against the intellectual property rights of others;
•announcements by commercial partners or competitors of new commercial products, clinical progress (or the lack thereof), significant contracts, commercial relationships, or capital commitments;
•adverse publicity relating to our markets, including with respect to other products and potential products in such markets;
•adverse publicity about our company, employees, therapeutic candidates, and/or therapeutic products in the media or on social media;
•the impact of pandemics, other health epidemics and outbreaks on our company or the economy generally;
•the introduction of technological innovations or new therapies competing with our potential products;
•the loss of key employees;
•changes in estimates or recommendations by securities analysts, if any, who cover our common stock;
•general and industry-specific economic conditions potentially affecting our research and development expenditures;
•changes in the structure of health care payment systems;
•unanticipated serious safety concerns related to the use of any of our product candidates;
•failure to meet or exceed financial and development projections we may provide to the public;
•failure to meet or exceed the financial and development projections of the investment community;
•the perception of the pharmaceutical industry by the public, legislators, regulators, and the investment community;
•adverse regulatory decisions;
•disputes or other developments relating to proprietary rights, including patents, litigation matters, and our ability to obtain patent protection for our technologies;
•threats of, commencement of, or our involvement in, litigation;
•sales of our common stock by us or our stockholders in the future;
85
•trading volume of our common stock;
•additional instability in the domestic or global banking system;
•period-to-period fluctuations in our financial results; and
Moreover, the stock markets in general have experienced substantial volatility that has often been unrelated to the operating performance of individual companies or the biotechnology sector. These broad market fluctuations may also adversely affect the trading price of our common stock.
In the past, following periods of volatility in the market price of a company’s securities, stockholders have often instituted class action securities litigation against those companies. Such litigation, if instituted, could result in substantial costs and diversion of management attention and resources, which could significantly harm our business and reputation.
Our officers and directors, and their respective affiliates, have significant influence over our business affairs and may make business decisions with which stockholders disagree and which may adversely affect the value of their investment.
Our executive officers and directors together with their respective affiliates, beneficially own approximately 34% of our common stock as of December 31, 2023. As a result, if some of these persons or entities act together, they will have the ability to exercise significant influence over matters submitted to the stockholders for approval, including the election of directors, amendments to the certificate of incorporation and bylaws and the approval of any strategic transaction requiring the approval of the stockholders. These actions may be taken even if they are opposed by other stockholders. This concentration of ownership may also have the effect of delaying or preventing a change of control of our company or discouraging others from making tender offers for our shares, which could prevent our stockholders from receiving a premium for their shares. Some of these persons or entities who make up our principal stockholders may have interests different from other stockholders. The significant concentration of stock ownership may adversely affect the trading price of our common stock due to investors’ perception that conflicts of interest may exist or arise.
Future sales, or the perception of future sales, of a substantial amount of our common stock could depress the trading price of our common stock.
Our stock price could decline as a result of sales of a large number of shares of our common stock or the perception that these sales could occur. These sales, or the possibility that these sales may occur, also might make it more difficult for us to sell equity securities in the future at a time and at a price that we deem appropriate.
For example, in connection with our September 2021 private placement, we entered into a registration rights agreement with the private placement investors that required us to prepare and file a resale registration statement, which was declared effective by the SEC on November 19, 2021 and permits the resale by the private placement investors of approximately 6.5 million shares of our common stock as well as approximately 3.2 million shares of common stock issuable upon the exercise of prefunded warrants issued in the September 2021 private placement. We have in the past and may again in the future sell shares of our common stock to strategic partners in connection with collaboration agreements, as we did in December 2021 in connection with our agreement with Amgen. The shares subject to outstanding options and warrants and the shares reserved for future issuance under our equity incentive plans will become available for sale immediately upon the exercise of such options and warrants. As of December 31, 2023, we had exercisable options and warrants (including prefunded warrants) to purchase 4.5 million shares and 8.5 million shares, respectively. Between December 31, 2023 and the date of this report, warrants to purchase 5.5 million shares were exercised and, as of the date of this report, warrants to purchase 2.9 million shares remain outstanding, which are predominantly prefunded warrants.
We also register the offer and sale of all shares of common stock that we may issue under our equity incentive plans. Once we register the offer and sale of shares for the holders of registration rights and option holders, they can be freely sold in the public market upon issuance, subject to any related lock-up agreements or applicable securities laws. Our equity incentive plan also includes an evergreen provision, pursuant to which the share reserve used to make equity grants under such plan automatically increases on the first day of each calendar year unless our board of directors takes action to prevent the increase prior to such date. We believe this evergreen provision is an important feature of our equity incentive plan as it enables us to hire and retain key contributors to our business. If we continue to expand the size of our organization to advance the development of our product candidates, our existing share reserve and evergreen provision under our current equity incentive plan may be insufficient to support our growth plans and we may need to consider amendments to such equity incentive plan to provide additional flexibility for our hiring and retention plans. Any increase to the share reserve in the future would further dilute existing stockholders.
86
Certain of our executive officers and directors have already entered into Rule 10b5-1 trading plans and our executive officers and directors may enter into new or additional Rule 10b5-1 trading plans in the future. Under a Rule 10b5-1 trading plan, a broker executes trades pursuant to parameters established by the employee, director, or officer when entering into the plan, without further direction from the employee, officer, or director.
In addition, in the future, we may issue additional shares of common stock or other equity or debt securities convertible into common stock in connection with a financing, acquisition, litigation settlement, employee arrangements or otherwise. Any such future issuance, including any additional issuances pursuant to our “at-the-market” equity offering sales agreement with TD Cowen, could result in substantial dilution to our existing stockholders and could cause our stock price to decline.
We have broad discretion over the use of the proceeds to us from our financing activities and may apply the proceeds to uses that do not improve our operating results or the value of your securities.
We have broad discretion over the use of proceeds to us from our financing activities and our stockholders rely solely on the judgment of our board of directors and management regarding the application of these proceeds. Our use of proceeds may not improve our operating results or increase the value of our common stock. Any failure to apply these proceeds effectively could have a material adverse effect on our business, delay the development of our product candidates and cause the market price of our common stock to decline.
Anti-takeover provisions in our charter documents and under Delaware or Washington law could discourage, delay or prevent a change in control of our company, limit attempts by our stockholders to replace or remove our current management and may affect the trading price of our common stock.
Our corporate documents contain provisions that may delay or discourage transactions involving an actual or potential change in our control or change in our management, including transactions in which stockholders might otherwise receive a premium for their shares, or transactions that our stockholders might otherwise deem to be in their best interests. Therefore, these provisions could adversely affect the price of our stock. Among other things, our certificate of incorporation and bylaws:
•stagger the terms of our board of directors and require 66 and 2/3% stockholder voting to remove directors, who may only be removed for cause;
•provide that the authorized number of directors may be changed only by resolution of the board of directors;
•provide that all vacancies, including newly-created directorships, may, except as otherwise required by law, be filled by the affirmative vote of a majority of directors then in office, even if less than a quorum;
•authorize our board of directors to issue “blank check” preferred stock and to determine the rights and preferences of those shares, which may be senior to our common stock, without prior stockholder approval;
•establish advance notice requirements for nominating directors and proposing matters to be voted on by stockholders at stockholders’ meetings;
•prohibit our stockholders from calling a special meeting and prohibit stockholders from acting by written consent;
•require 66 and 2/3% stockholder voting to effect certain amendments to our certificate of incorporation and bylaws; and
•prohibit cumulative voting in the election of directors, which limits the ability of minority stockholders to elect director candidates.
In addition, because we are incorporated in Delaware, we are governed by the provisions of Section 203 of the Delaware General Corporation Law, or DGCL, which generally prohibits a Delaware corporation from engaging in any of a broad range of business combinations with any “interested” stockholder for a period of three years following the date on which the stockholder became an “interested” stockholder. Likewise, because our principal executive offices are located in Washington, the anti-takeover provisions of the Washington Business Corporation Act may apply to us under certain circumstances now or in the future. These provisions prohibit a “target corporation” from engaging in any of a broad range of business combinations with any stockholder constituting an “acquiring person” for a period of five years following the date on which the stockholder became an “acquiring person.” These provisions could discourage, delay or prevent a transaction involving a change in control of our company. These provisions could also discourage proxy contests and make it more difficult for stockholders to elect directors of their choosing and cause us to take other corporate actions our stockholders desire.
87
Claims for indemnification by our directors and officers may reduce our available funds to satisfy successful third-party claims against us and may reduce the amount of available cash.
Our amended and restated certificate of incorporation provides that we will indemnify our directors and officers to the fullest extent permitted by Delaware law.
In addition, as permitted by Section 145 of the DGCL, our amended and restated bylaws and our indemnification agreements that we have entered into with our directors and officers provide that:
•We will indemnify our directors and officers for serving us in those capacities or for serving other business enterprises at our request, to the fullest extent permitted by Delaware law. Delaware law provides that a corporation may indemnify such person if such person acted in good faith and in a manner such person reasonably believed to be in or not opposed to the best interests of the corporation and, with respect to any criminal proceeding, had no reasonable cause to believe such person’s conduct was unlawful.
•We may, in our discretion, indemnify other employees and agents in those circumstances where indemnification is permitted by applicable law.
•We are required to advance expenses, as incurred, to our directors and officers in connection with defending a proceeding, unless the proceeding is excluded pursuant to the amended and restated bylaws, except that such directors or officers shall undertake to repay such advances if it is ultimately determined that such person is not entitled to indemnification.
•We will not be obligated pursuant to our amended and restated bylaws to indemnify any director or officer in connection with any proceeding (or part thereof) (a) for which payment has actually been made to such person, (b) for an accounting or disgorgement of profits pursuant to Section 16(b) of the Exchange Act, (c) for any reimbursement of the Company by such person of any bonus or other incentive-based or equity-based compensation, (d) initiated by such person unless the proceeding was authorized in the specific case by our board of directors or such indemnification is required to be made pursuant to our amended and restated bylaws or applicable law, nor (e) if prohibited by applicable law.
•The rights conferred in our amended and restated bylaws are not exclusive, and we are authorized to enter into indemnification agreements with our directors, officers, employees and agents and to obtain insurance to indemnify such persons.
•We may not retroactively amend our amended and restated bylaw provisions to reduce our indemnification obligations to our directors or officers.
As a result, if we are required to indemnify one or more of our directors or officers, it may reduce our available funds to satisfy successful third-party claims against us, may reduce the amount of available cash and may have a material adverse effect on our business and financial condition.
Our amended and restated certificate of incorporation and our amended and restated bylaws designate the Court of Chancery of the State of Delaware as the sole and exclusive forum for certain types of actions and proceedings that may be initiated by our stockholders, which could limit our stockholders’ ability to obtain a favorable judicial forum for disputes with us or our directors, officers, employees or agents.
Our amended and restated certificate of incorporation and/or our amended and restated bylaws provide that, unless we consent in writing to an alternative forum, the Court of Chancery of the State of Delaware will be the sole and exclusive forum for any derivative action or proceeding brought on our behalf, any action asserting a claim of breach of a fiduciary duty owed by any of our directors, officers, stockholders, employees or agents to us or our stockholders, any action asserting a claim arising pursuant to any provision of the DGCL, our amended and restated certificate of incorporation or our amended and restated bylaws or any action asserting a claim that is governed by the internal affairs doctrine, in each case subject to the Court of Chancery having personal jurisdiction over the indispensable parties named as defendants therein and the claim not being one which is vested in the exclusive jurisdiction of a court or forum other than the Court of Chancery or for which the Court of Chancery does not have subject matter jurisdiction. Any person purchasing or otherwise acquiring any interest in any shares of our common stock shall be deemed to have notice of and to have consented to this provision of our amended and restated certificate of incorporation. In addition, our amended and restated bylaws provide that the U.S. federal district courts will be the exclusive forum for resolving any complaint asserting a cause of action arising under the Securities Act.
These choice of forum provision may limit our stockholders’ ability to bring a claim in a judicial forum that it finds favorable for disputes with us or our directors, officers, employees or agents, which may discourage such lawsuits against us
88
and our directors, officers, employees and agents even though an action, if successful, might benefit our stockholders. Stockholders who do bring a claim in the Court of Chancery could face additional litigation costs in pursuing any such claim, particularly if they do not reside in or near Delaware. The Court of Chancery may also reach different judgments or results than would other courts, including courts where a stockholder considering an action may be located or would otherwise choose to bring the action, and such judgments or results may be more favorable to us than to our stockholders. Alternatively, if a court were to find these choice of forum provisions in our amended and restated certificate of incorporation and amended and restated bylaws inapplicable to, or unenforceable in respect of, one or more of the specified types of actions or proceedings, we may incur additional costs associated with resolving such matters in other jurisdictions, which could have a material adverse effect on our business, financial condition or results of operations.
We do not expect to pay any dividends on our common stock for the foreseeable future.
We currently expect to retain all future earnings, if any, for future operations and expansion, and have no current plans to pay any cash dividends to holders of our common stock for the foreseeable future. Any decision to declare and pay dividends in the future will be made at the discretion of our board of directors and will depend on, among other things, our results of operations, financial condition, cash requirements, contractual restrictions and other factors that our board of directors may deem relevant. As a result, stockholders may not receive any return on an investment in our common stock unless stockholders sell our common stock for a price greater than that which they paid for it.
The Nasdaq Global Market may delist our common stock from its exchange, which could limit investors’ ability to make transactions in our securities and subject us to additional trading restrictions.
Our shares of common stock are listed on the Nasdaq Global Market under the trading symbol “ALPN.” Our securities may fail to meet the continued listing requirements to be listed on the Nasdaq Global Market. If Nasdaq delists our shares of common stock from trading on its exchange, we could face significant material adverse consequences, including:
•significant impairment of the liquidity for our common stock, which may substantially decrease the market price of our common stock;
•a limited availability of market quotations for our securities;
•a determination that our common stock qualifies as a “penny stock” which will require brokers trading in our common stock to adhere to more stringent rules and possibly resulting in a reduced level of trading activity in the secondary trading market for our common stock;
•a limited amount of news and analyst coverage for our company; and
•a decreased ability to issue additional securities or obtain additional financing in the future.
Risks Related to Our Financial Reporting and Disclosure
We are a smaller reporting company, and any decision on our part to comply only with reduced reporting and disclosure requirements applicable to such companies could make our common stock less attractive to investors.
We are a “smaller reporting company,” as defined in the Securities Exchange Act of 1934, as amended, or the Exchange Act. For as long as we continue to be a smaller reporting company, we may choose to take advantage of exemptions from various reporting requirements applicable to other public companies that are not smaller reporting companies, including, but not limited to, reduced disclosure obligations regarding executive compensation in our periodic reports and proxy statements.
We will remain a smaller reporting company so long as, as of June 30 of the preceding year, (i) the market value of our shares of common stock held by non-affiliates, or our public float, is less than $250 million; or (ii) we have annual revenues less than $100 million and either we have no public float or our public float is less than $700 million. We anticipate that we may lose our smaller reporting company status at the end of 2024.
If we take advantage of some or all of the reduced disclosure requirements available to smaller reporting companies, investors may find our common stock less attractive, which may result in a less active trading market for our common stock and greater stock price volatility. For so long as we are a smaller reporting company and not classified as an “accelerated filer” or “large accelerated filer” pursuant to SEC rules, we will continue to be exempt from the auditor attestation requirements of Section 404(b) of Sarbanes-Oxley.
89
If we fail to maintain proper and effective internal controls, our ability to produce accurate financial statements on a timely basis could be impaired.
We are subject to the reporting requirements of the Exchange Act, the Sarbanes-Oxley Act and the rules and regulations of The Nasdaq Stock Market LLC. The Sarbanes-Oxley Act requires, among other things, that we maintain effective disclosure controls and procedures and internal control over financial reporting. We must perform system and process evaluation and testing of our internal control over financial reporting to allow management to report on the effectiveness of our internal controls over financial reporting in our Annual Report on Form 10-K filing for that year, as required by Section 404 of the Sarbanes-Oxley Act.
We may discover weaknesses in our system of internal financial and accounting controls and procedures that could result in a material misstatement of our financial statements. Our internal control over financial reporting will not prevent or detect all errors and all fraud. An internal control system, no matter how well designed and operated, can provide only reasonable, not absolute, assurance that the internal control system’s objectives will be met. Because of the inherent limitations in all internal control systems, no evaluation of internal controls can provide absolute assurance that misstatements due to error or fraud will not occur or that all internal control issues and instances of fraud will be detected.
If we are not able to comply with the requirements of Section 404 of the Sarbanes-Oxley Act, or if we are unable to maintain proper and effective internal controls, we may not be able to produce timely and accurate financial statements. If that were to happen, the market price of our common stock could decline and we could be subject to sanctions or investigations by The Nasdaq Stock Market LLC, the SEC, or other regulatory authorities.
Our disclosure controls and procedures may not prevent or detect all errors or acts of fraud.
Our disclosure controls and procedures are designed to reasonably ensure that information required to be disclosed by us in reports we file or submits under the Exchange Act is accumulated and communicated to management and recorded, processed, summarized and reported within the time periods specified in the rules and forms of the SEC. We believe that any disclosure controls and procedures as well as internal controls and procedures, no matter how well-conceived and operated, can provide only reasonable, not absolute, assurance that the objectives of the control system are and will be met. These inherent limitations include the realities that judgments in decision-making can be faulty and that breakdowns can occur because of simple error or mistake. Additionally, controls can be circumvented by the individual acts of some persons, by collusion of two or more people or by an unauthorized override of the controls. Accordingly, because of the inherent limitations in our control system, misstatements due to error or fraud may occur and not be detected.
We will continue to incur costs and demands upon management as a result of complying with the laws and regulations affecting public companies.
We will incur significant legal, accounting, and other expenses associated with public company reporting requirements. We will also incur costs associated with corporate governance requirements, including requirements under the Sarbanes-Oxley Act, as well as new rules implemented by the SEC and The Nasdaq Stock Market LLC. Although our status as a smaller reporting company may for a limited period of time somewhat lessen the cost of complying with these additional regulatory and other requirements, we nonetheless expect that these rules and regulations will increase our legal and financial compliance costs and to make some activities more time-consuming and costlier. Once we cease to be a smaller reporting company, our costs are likely to increase further. Our executive officers and other personnel will need to devote substantial time to oversee our operations as a public company and compliance with applicable laws and regulations. These rules and regulations may also make it difficult and expensive for us to obtain directors and officer’s liability insurance. As a result, it may be more difficult for us to attract and retain qualified individuals to serve on our board of directors or as executive officers of our company, which may adversely affect investor confidence in us and could cause our business or stock price to suffer.
General Risk Factors
Changes in accounting rules and regulations, or interpretations thereof, could result in unfavorable accounting charges or require us to change our compensation policies.
Accounting methods and policies for biopharmaceutical companies, including policies governing revenue recognition, research and development and related expenses, and accounting for stock-based compensation, are subject to review, interpretation, and guidance from our auditors and relevant accounting authorities, including the SEC. Changes to accounting
90
methods or policies, or interpretations thereof, may require us to reclassify, restate, or otherwise change or revise our financial statements.
Environmental, social and governance matters may impact our business and reputation.
Companies are increasingly being judged by their performance on a variety of environmental, social and governance, or ESG, matters, which are considered to contribute to the long-term sustainability of companies’ performance.
A variety of organizations measure the performance of companies on such ESG topics, and the results of these assessments are widely publicized. In addition, investment in funds that specialize in companies that perform well in such assessments are increasingly popular, and major institutional investors have publicly emphasized the importance of such ESG measures to their investment decisions. Topics considered in such assessments include, among others, the role of the company’s board of directors in supervising various ESG issues and board diversity.
In light of investors’ increased focus on ESG matters, there can be no certainty that we will manage such issues successfully, or that we will successfully meet expectations as to our proper role. Any failure or perceived failure by us in this regard could have a material adverse effect on our reputation and on our business, share price, financial condition, or results of operations, including the sustainability of our business over time.
If equity research analysts do not publish research or reports, or publish unfavorable research or reports, about us, our business or our market, our stock price and trading volume could decline.
The trading market for our common stock will be influenced by the research and reports that equity research analysts publish about us and our business. Equity research analysts may elect not to provide research coverage of our common stock or discontinue existing research coverage, and such lack of research coverage may adversely affect the market price of our common stock. We do not have any control over the analysts, or the content and opinions included in their reports. The price of our common stock could decline if one or more equity research analysts downgrade our stock or issue other unfavorable commentary or research. If one or more equity research analysts ceases coverage of us or fails to publish reports regularly, demand for our common stock could decrease, which in turn could cause our stock price or trading volume to decline.
Item 1B. Unresolved Staff Comments.
None.
Item 1C. Cybersecurity.
Cybersecurity Risk Management Strategy
We have developed and implemented processes and policies for identifying, assessing, and managing material risks from cybersecurity threats. We have established a cybersecurity risk management program intended to protect the confidentiality, integrity, and availability of our critical systems and information. Our cybersecurity risk management strategy is informed by the National Institute of Standards and Technology, or NIST, Cybersecurity Framework, or CSF, and the NIST Risk Management Framework. Our cybersecurity processes have been integrated into our overall business risk management process.
Both internally and through third-party experts, we routinely assess our information technology, or IT, environment with reference to the NIST CSF. We also assess risks related to third-party vendors, suppliers and contractors. Our risk assessments include identifying reasonably foreseeable potential internal and external risks, the likelihood of occurrence and any potential damage that could result from such risks, and the sufficiency of existing policies, procedures, systems, controls, and other safeguards in place to manage such risks. Following these risk assessments, we evaluate whether and how to design, implement, and maintain reasonable safeguards to minimize the identified risks; reasonably address any identified gaps in existing safeguards; update existing safeguards as necessary; and monitor the effectiveness of our safeguards. We provide regular training to our employees regarding cybersecurity threats and best practices, and we have established policies for the responsible use of our IT and information resources. We also maintain a cyber insurance policy to mitigate and cover cybersecurity risks.
As of the date of this report, we have not experienced cybersecurity incidents or are aware of any risks from cybersecurity threats that have materially affected or are reasonably likely to materially affect us, including our business
91
strategy, results of operations, or financial condition. For additional information about our cybersecurity risks, please see the section of this report titled “Risk Factors.”
Cybersecurity Governance
Our board of directors administers its cybersecurity risk oversight function directly through the audit committee. Through its regular meetings with management, including the finance, legal, and risk management functions, the audit committee reviews and discusses all significant areas of our business, including cybersecurity risks, and summarizes for the board of directors all areas of risk and the appropriate mitigating factors. The audit committee is responsible for the oversight of cybersecurity risk monitoring and assessment, and the officers and information technology personnel who oversee monitoring and assessing strategic risk exposure and the day-to-day management of material risks.
The Information Technology Risk Management Committee, or ITRMC, was established to assist in identifying, assessing, and managing risks across various domains to protect our interests, assets, reputation, and enhance its resilience. The ITRMC consists of members with diverse backgrounds, expertise, and experience relevant to risk management, including the CFO and Head of IT. The ITRMC is informed about our cybersecurity risks, including risks from cybersecurity incidents, through information obtained directly from and through working with our internal security team and outside experts. The ITRMC provides oversight, guidance, and recommendations on risk management strategies, policies, procedures, and practices to the executive management team and the audit committee. The ITRMC, as needed with assistance from external experts, provides regular reports to executive management and the audit committee, covering items such as risk management activities, significant risk exposures, mitigation efforts, and audits.
Item 2. Properties.
In March 2019, we entered into a lease for 27,164 square feet of office and laboratory space located at 188 East Blaine Street, Seattle, Washington. The term of the lease is 10.8 years with one option to extend the term by 5.0 years. The lease term commenced in June 2019. We believe that our existing facility is adequate for our current needs.
Item 3. Legal Proceedings.
We are not engaged in any material legal proceedings. From time to time, we may become involved in litigation relating to claims arising from the ordinary course of business. We believe that there are no claims or actions pending against us currently, the ultimate disposition of which would have a material adverse effect on our consolidated results of operation, financial condition or cash flows.
Item 4. Mine Safety Disclosures.
Not applicable.
92
PART II
Item 5. Market for Registrant’s Common Equity, Related Stockholder Matters and Issuer Purchases of Equity Securities.
Market Information
From June 17, 2015 through July 24, 2017, our common stock was traded under the symbol “NVLS.” On July 24, 2017, in connection with the business combination of Nivalis and Alpine Immune Sciences, Inc., we completed a 1-for-4 reverse stock split. Commencing on July 25, 2017, our common stock began trading on The Nasdaq Global Market under the symbol “ALPN.” As of March 7, 2024, we have approximately 24 stockholders of record for our common stock, which excludes stockholders whose shares were held in nominee or street name accounts through brokers.
Dividends
We have never declared or paid cash dividends on our capital stock. We currently intend to retain any future earnings for use in the operation of our business and do not intend to declare or pay any cash dividends in the foreseeable future. Any further determination to pay dividends on our capital stock will be at the discretion of our board of directors, subject to applicable laws, and will depend on our financial condition, results of operations, capital requirements, general business conditions and other factors that our board of directors considers relevant.
Stock Performance Graph
As a “smaller reporting company,” as defined by Rule 12b-2 of the Exchange Act, and pursuant to Instruction 6 to Item 201(e) of Regulation S-K we are not required to provide the stock performance graph.
Recent Sales of Unregistered Securities
Other than as previously reported on our Forms 10-Q filed with the SEC on May 11, 2023, August 14, 2023, and November 14, 2023, and on our Current Report on Form 8-K filed with the SEC on February 7, 2024, there have been no unregistered sales of our equity securities during the year ended December 31, 2023.
Item 6. [Reserved]
93
Item 7. Management’s Discussion and Analysis of Financial Condition and Results of Operations.
You should read the following Management’s Discussion and Analysis of Financial Condition and Results of Operations together with our consolidated financial statements and the related notes appearing elsewhere in this Annual Report on Form 10-K. In addition to historical information, some of the information contained in this discussion and analysis or set forth elsewhere in this report, including information with respect to our plans and strategy for our business, future financial performance, expense levels and liquidity sources, includes forward-looking statements that involve risks and uncertainties. You should read Risk Factors in Part I, Item 1A of this report for a discussion of important factors that could cause actual results to differ materially from the results described in or implied by the forward-looking statements contained in the following discussion and analysis. The discussion regarding our financial condition and results of operations for fiscal 2022 as compared to fiscal 2021 has been omitted from this Annual Report on Form 10-K and is incorporated by reference from our Annual Report on Form 10-K for the fiscal year ended December 31, 2022, filed with the SEC on March 23, 2023, under the section titled “Part II, Item 7. Management's Discussion and Analysis of Financial Condition and Results of Operations.”
Overview
We are a clinical-stage biopharmaceutical company dedicated to discovering and developing innovative, protein-based immunotherapies to treat autoimmune and inflammatory diseases. Our approach includes a proprietary scientific platform that converts native immune system proteins into differentiated, multi-targeted therapeutics. We are seeking to create first- or best-in-class multifunctional immunotherapies via our unique protein engineering technologies to improve outcomes in patients with serious diseases.
Autoimmune and Inflammatory Diseases
Povetacicept is a dual antagonist of BAFF and APRIL cytokines, which play key roles in the pathogenesis of multiple autoimmune diseases via their contribution to the activation, differentiation and/or survival of B cells, particularly antibody-secreting cells, as well as T cells and innate immune cells. Based upon an engineered TACI domain, povetacicept has exhibited greater potency in preclinical studies versus wild-type TACI-based comparators, as well as other inhibitors of BAFF and/or APRIL alone and B cell depletion. In addition, povetacicept has been well-tolerated in preclinical models and exhibited superior pharmacokinetics and pharmacodynamics over wild-type TACI-Fc counterparts, including superior serum exposure, suppression of T-dependent antibody production, and/or serum immunoglobulins in mice and/or cynomolgus monkeys. In a randomized, placebo-controlled, first-in-human, Phase 1 study in adult healthy volunteers (NCT05034484), povetacicept was well tolerated at doses up to 960 mg, with dose dependent pharmacokinetics and reductions in circulating immunoglobulins and antibody-secreting cells, which we believe supports the use of a convenient once every four-weeks dose regimen for subsequent studies and enables a broad development plan across multiple autoimmune diseases, including IgAN, and other autoimmune kidney diseases, SLE, and autoimmune cytopenias.
We believe povetacicept has the potential to become a development pipeline within a single product candidate, with significant market opportunity across multiple therapeutic areas including, but not limited to, nephrology, connective tissue diseases, such as lupus, hematology, neurology, and dermatology. Based on our encouraging clinical and nonclinical data, we have initiated a broad development plan with multiple clinical studies, including RUBY-3, an open-label, dose-ranging basket study in autoimmune glomerulonephritis including IgAN, lupus nephritis, and primary membranous nephropathy; and RUBY-4, an open-label basket study in autoimmune cytopenias including immune thrombocytopenia, warm autoimmune hemolytic anemia, and cold agglutinin disease. Each of the indications in these basket studies has strong scientific rationale for povetacicept based on the importance of specific autoantibodies in disease pathogenesis, as well as high medical need.
Initial clinical data from RUBY-3 presented in a late-breaking poster session at the ASN Kidney Week 2023 demonstrate that low-dose povetacicept at 80 mg administered once every four-weeks has been well tolerated and in IgAN demonstrates highly encouraging improvements in UPCR and disease biomarkers, with early evidence suggesting potential for disease remission, as defined as UPCR < 0.5 g/g, and ≥ 50% reduction in UPCR from baseline with stable renal function (≤ 25% reduction in eGFR from baseline). Based on these data, we intend to engage with the Food and Drug Administration, or FDA, to seek to begin RAINIER, a pivotal phase 3 IgAN study in the second half of 2024. In addition, we plan to initiate DENALI, a phase 2 study of povetacicept in SLE. We anticipate initial RUBY-3 data from our 240 mg cohort (administered once every four-weeks) and longer-term follow-up data from our 80 mg cohort in the first half of 2024.
Acazicolcept is a dual ICOS and CD28 antagonist intended for the treatment of autoimmune and inflammatory diseases. Preclinical studies with acazicolcept have demonstrated efficacy in models of SLE, SjS, arthritis, inflammatory bowel disease, MS, type 1 diabetes, uveitis, and GVHD. We have evaluated acazicolcept in a Phase 1 healthy volunteer study and are currently evaluating acazicolcept in Synergy, a global, randomized, double-blind, placebo-controlled Phase 2 study of
94
acazicolcept in adults with moderate-to-severe SLE. In June 2020, we entered into the AbbVie Agreement, which grants AbbVie an exclusive option to take an exclusive license to acazicolcept, or the License Option. In December 2023, we and AbbVie amended the AbbVie Agreement, or the AbbVie Amendment, to stop enrollment in the Synergy study to allow for an early assessment of the study’s clinical trial data. In connection with the AbbVie Amendment, the License Option fee was reduced to $10.0 million, and other potential payments under the AbbVie Agreement related to future development, commercial and sales-based milestones, as well as sales-based royalties were reduced by 25%. The final analysis, after the last patient enrolled in Synergy completes their study protocol, is expected to occur by the end of 2024. Through December 31, 2023, we have received $105.0 million in non-refundable upfront and pre-option exercise development milestones as part of the AbbVie Agreement. For additional information regarding the AbbVie Agreement, please refer to the section of this report titled “Business — Partnerships.”
In December 2021, we entered into an exclusive license and collaboration agreement with Amgen which grants Amgen an exclusive license for the development, manufacture and commercialization of one Existing Program and up to three additional Research Programs generated from our libraries of proteins and molecules for research, discovery, and identification of additional compounds. As of December 31, 2023, we have completed our activities under the Existing Program. We continue to support activities related to the First Research Program. In January 2024, we received a termination notification from Amgen for the non-exclusive license to use the Second Research Program. A Third Research Program was not selected by the respective option deadline. Under the terms of the Amgen Agreement, Amgen made an upfront payment to us of $25.0 million as well as an equity investment for which they paid $15.0 million, a 25% premium to the 30-day volume-weighted average share price as of December 9, 2021. In addition, we are eligible to receive up to $381.0 million per program, or a total of approximately $762.0 million for the remaining programs, in future success-based payments related to development, regulatory and commercial milestones as well as tiered royalties on global net sales.
Immuno-oncology
Davoceticept is a conditional CD28 costimulator and dual checkpoint inhibitor intended for the treatment of cancer. In October 2022, we announced the voluntary termination of enrollment of davoceticept clinical studies, including the NEON-1 study of davoceticept as monotherapy and the NEON-2 study of davoceticept in combination with pembrolizumab. The decision to terminate enrollment in the davoceticept studies was made following notification of a second Grade 5 serious adverse event (death) in the NEON-2 study.
Scientific Platform
Our scientific platform has also generated immune modulatory proteins with the potential of improving engineered cell therapies such as chimeric antigen receptor T cells, T cell receptor-engineered T cells, and tumor infiltrating lymphocytes. In May 2019, we signed a collaboration and license agreement with Adaptimmune Therapeutics plc, or Adaptimmune, to develop next-generation SPEAR™ T cell products which incorporate our SIP and TIP technologies. We intend to continue to leverage our existing pipeline and platform for internal development opportunities and to actively explore and evaluate potential value-creating partnering opportunities.
Our Strategy
Our goal is to discover and develop modern therapies to treat patients with serious autoimmune and inflammatory diseases. To achieve our goals, we intend to:
•aggressively continue to advance our lead wholly-owned program, povetacicept, in clinical studies for the treatment of multiple B cell and/or autoantibody-related diseases;
•complete our obligations under the amended AbbVie Agreement for acazicolcept, including the delivery of an agreed upon data package to AbbVie; and
•maximize the value of our pipeline and platform through creation of internal development opportunities and evaluation of potential partnering activities.
Our operations to date have been limited to business planning, raising capital, developing our platform technology, identifying potential immunotherapy candidates, clinical studies, and other research and development activities. To date, we have financed operations primarily through public offerings of common stock and warrants, private placements of common stock, warrants and convertible preferred stock, funds received from license and research agreements, debt financing, and assets acquired upon the close of our merger with Nivalis. We do not have any products approved for sale and have not generated any product sales. Since inception and through December 31, 2023, excluding amounts borrowed through debt financing, we have raised an aggregate of approximately $690.1 million to fund operations, of which $454.2 million was from the sale of common stock and warrants, $142.6 million was through our license and collaboration agreements, $49.2 million was from the sale of
95
convertible preferred stock, and $44.1 million in cash, cash equivalents, and investments acquired through the merger with Nivalis. As of December 31, 2023, we had cash, cash equivalents, restricted cash, and investments totaling $368.2 million.
Our net loss was $32.2 million, and $57.8 million, for the years ended December 31, 2023 and 2022, respectively. We expect to continue incurring significant expenses and operating losses for at least the next several years as we:
•initiate and complete nonclinical studies and clinical trials for our product candidates, including povetacicept, a dual antagonist of the BAFF and APRIL cytokines in development for multiple autoimmune diseases, and acazicolcept, a dual inhibitor of the CD28 and ICOS T-cell costimulatory pathways being developed for treatment of systemic lupus erythematosus;
•contract to manufacture and perform additional process development for our product candidates;
•continue research and development efforts to build our pipeline beyond the current product candidates;
•maintain, expand, and protect our intellectual property portfolio;
•hire additional clinical, quality control, scientific, and management personnel; and
•add operational and financial personnel to support our product development efforts and operational capabilities applicable to operating as a public company.
We do not expect to generate product revenue unless and until we successfully complete development of, obtain marketing approval for, and commercialize our product candidates, either alone or in collaboration with third parties. We expect these activities will take a number of years and our success in these efforts is subject to significant uncertainty. Accordingly, we will need to raise additional capital prior to the regulatory approval and commercialization of any of our product candidates. Until such time, if ever, as we can generate substantial product revenues, we expect to finance our operating activities through equity or debt financings, collaborations or licenses, capital lease transactions, or other available financing transactions. However, additional capital may not be available on reasonable terms, if at all, and if we raise additional funds through the issuance of additional equity or debt securities, it could result in dilution to our existing stockholders and increased fixed payment obligations.
Financial Overview
Collaboration Revenue
We derive our collaboration revenue primarily from our collaboration and licensing agreements. We may generate revenue in the future from milestone payments received pursuant to our collaboration and licensing agreements with AbbVie, Amgen, Adaptimmune, or from payments from future license or collaboration agreements, product sales, or government contracts and grants. We expect revenue we generate, if any, will fluctuate from quarter to quarter.
AbbVie
In June 2020, we entered into the AbbVie Agreement for the development of acazicolcept. In December 2023, per the AbbVie Amendment, we stopped enrollment in our Synergy study to allow for an early assessment of the study’s clinical trial data. Currently enrolled patients will be allowed to complete their study treatment protocol. Amended payment terms are discussed below.
The License Option available under the AbbVie Agreement is exercisable by AbbVie at any time and will expire 90 days from the delivery of an agreed-upon data package by us to AbbVie. If AbbVie exercises the License Option, AbbVie will take over the future development and commercialization. Prior to the exercise of the License Option, we will perform research and development services, including completing our remaining deliverables under the Synergy study, based on an agreed-upon Development Plan. We are fully responsible for all costs incurred to conduct the activities under the Development Plan, provided that, AbbVie may be responsible for increased costs under the Development Plan in connection with certain material amendments, if proposed by AbbVie. We are also responsible, at our sole cost and expense, for manufacturing and regulatory filings for acazicolcept necessary to complete activities under the Development Plan.
In June 2020, in connection with the execution of the AbbVie Agreement, AbbVie paid us a nonrefundable upfront payment of $60.0 million. Prior to the exercise of the License Option, AbbVie also agreed to make cash payments upon our achievement of the Alpine Development Milestones, up to an aggregate amount of $75.0 million, of which $45.0 million was achieved in 2021, and the remaining $30.0 million was removed under the AbbVie Amendment. If AbbVie exercises the License Option, they will pay a one-time cash payment of $10.0 million under the AbbVie Amendment (reduced from $75.0
96
million under the original AbbVie Agreement). Following the exercise of the License Option, AbbVie has furthermore agreed to make aggregate cash payments of up to $153.8 million upon AbbVie’s achievement of certain development and commercial milestones and additional aggregate cash payments of up to $337.5 million upon AbbVie’s achievement of certain sales-based milestones, collectively referred to as the AbbVie Milestones. Lastly, subsequent to commercialization, we are also eligible to receive mid-single-digit percentage royalties on worldwide net sales of licensed products.
For revenue recognition purposes, we determined that our contractual promises in the AbbVie Agreement are not distinct and are interdependent with our performance obligation to provide research and development services under the Development Plan. Thus, all contractual promises related to the upfront payment and Alpine’s Development Milestones were combined into a single performance obligation. We determined the Alpine Development Milestone payments are probable of significant revenue reversal as the achievement is highly dependent on factors outside our control. Therefore, these milestone payments were fully constrained and were not initially included in the transaction price. In June 2021, we re-evaluated and updated the transaction price to include the achieved portion of the Alpine Development Milestones. We will continue to re-evaluate the transaction price each reporting period and update as uncertain events are resolved or other changes in circumstances occur.
The License Option and the AbbVie Milestones were determined not to be performance obligations at the inception of the contract as they did not represent material rights. If exercised, the License Option and AbbVie Milestones will be accounted for as a separate contract and will be recognized as revenue if and when triggered. Any consideration related to sales-based royalties and profit-sharing payments will be recognized when the related sales occur.
We use a cost-based input method to measure progress toward completion of the performance obligation and to calculate the corresponding revenue to recognize each period. In applying the cost-based input, we use actual costs incurred relative to budgeted costs for the combined performance obligation. These costs consist primarily of internal personnel efforts and third-party contract costs relative to the level of patient enrollment in the study. Revenue will be recognized based on the level of costs incurred relative to the total budgeted costs for the performance obligation. A cost-based input method of revenue recognition requires management to make estimates of costs to complete our performance obligation. In making such estimates, significant judgment is required to evaluate assumptions related to cost estimates. The cumulative effect of revisions to estimated costs to complete our performance obligation will be recorded in the period in which changes are identified and amounts can be reasonably estimated. A significant change in these assumptions and estimates could have a material impact on the timing and amount of revenue recognized in future periods.
Amgen
In December 2021, we entered into the Amgen Agreement, which grants Amgen an exclusive license for the development, manufacture and commercialization of one Existing Program and up to three additional Research Programs generated from our libraries of proteins and molecules for research, discovery and identification of additional compounds.
As of December 31, 2023, we have completed our activities under the Existing Program. We continue to support activities related to the First Research Program. In January 2024, we received a termination notification from Amgen for the non-exclusive license to use the Second Research Program. A Third Research Program was not selected by the respective option deadline.
Under the terms of the agreement, Amgen made an upfront payment to us of $25.0 million as well as an equity investment for which they paid $15.0 million, a 25% premium to the 30-day volume-weighted average share price as of December 9, 2021. In addition, we are eligible to receive up to $381.0 million per program, or a total of approximately $762.0 million for the remaining programs, in future success-based payments related to development, regulatory and commercial milestones as well as tiered royalties on global net sales. In addition, Amgen will pay us for the costs and expenses of conducting such activities under the deliverables plans. Amgen will then assume responsibility for development and commercialization activities and costs.
For revenue recognition purposes, we determined that the Existing Program and each Research Program are distinct performance obligations. We allocated revenue to each performance obligation based on its relative stand-alone selling price. The future success-based payments related to development and regulatory milestones are probable of significant revenue reversal as the achievement is highly dependent on factors outside our control. Therefore, these milestone payments are fully constrained and are not initially included in the transaction price. We will continue to re-evaluate the transaction price each reporting period and update as uncertain events are resolved or other changes in circumstances occur. Any consideration related to commercial milestones and royalties will be recognized when the related sales occur.
97
Adaptimmune
In May 2019, we entered into the Adaptimmune Agreement to develop next-generation SPEAR T cell products. Under the Adaptimmune Agreement, we are to perform certain research services and grant Adaptimmune an exclusive license to programs from our SIP and TIP technologies.
Through December 31, 2023, we have recorded a total of $3.0 million in license payments under the terms of the Adaptimmune Agreement consisting of a $2.0 million upfront license payment received in June 2019 and an additional $1.0 million license fee upon Adaptimmune’s selection of an additional research program in June 2022. Furthermore, through December 31, 2023, we have recorded $2.1 million in research support payments received in connection with research services completed by us. If respective pre-specified milestones for each of the two active research programs are achieved, we are eligible for downstream development and commercialization milestones of up to an aggregate amount of $105.0 million, and we are also eligible to receive low-single digit percentage royalties on worldwide net sales of the applicable products.
For revenue recognition purposes, licensing and research support fees billed under the agreement were recorded as deferred revenue and recognized to revenue based on employee hours contributed to each performance obligation.
Research and Development Expenses
We focus our resources on research and development activities, including the conduct of preclinical studies, product development, regulatory support, and clinical trials for our product candidates. We recognize research and development expenses as they are incurred. Our research and development expenses consist of:
•employee-related expenses, including salaries, benefits, taxes, travel, and stock-based compensation expense for personnel in research and development functions;
•expenses related to process development and production of product candidates paid to contract manufacturing organizations;
•costs associated with preclinical activities and regulatory operations, including the cost of acquiring, developing, and manufacturing research material;
•clinical trials and activities related to regulatory filings for our product candidates; and
•allocation of facilities, overhead, depreciation, and amortization of laboratory equipment and other expenses.
We expect our direct and indirect research and development expenses to increase significantly for the foreseeable future as we continue to develop our platform and product candidates. We remain focused on using our resources to further advance povetacicept’s broad development plan.
The successful development of our platform and product candidates is highly uncertain. At this time, we cannot reasonably estimate the nature, timing, or costs of the efforts necessary to finish developing any of our product candidates or the period in which material net cash, if any, from these product candidates may commence. This is due to the numerous risks and uncertainties associated with developing therapeutics, including the uncertainty of:
•the scope, rate of progress, expense, and results of clinical trials;
•the scope, rate of progress, and expense of process development and manufacturing;
•preclinical and other research activities; and
•the timing of regulatory approvals.
General and Administrative Expenses
General and administrative expenses consist primarily of salaries and related costs for employees in executive, business development, finance, legal, and administrative functions. Other significant general and administrative expenses include professional fees for accounting and legal services, expenses associated with obtaining and maintaining patents and other intellectual property, and allocation of facility and overhead costs.
We expect general and administrative expenses to increase as we expand infrastructure, headcount, and continue to prosecute our patents and other intellectual property. Other increases could potentially include increased costs for insurance, costs related to the hiring of additional personnel, and increased fees for directors, outside consultants, lawyers, and
98
accountants. We expect to incur significant costs to comply with corporate governance, internal controls, and similar requirements applicable to public companies.
Results of Operations
Comparison of Years Ended December 31, 2023 and 2022
The following table summarizes our results of operations (in thousands):
| Years Ended December 31, | ||||||||||||||||||||||||||
| 2023 | 2022 | $ Change | % Change | |||||||||||||||||||||||
| Collaboration revenue | $ | 58,876 | $ | 30,064 | $ | 28,812 | 96 | % | ||||||||||||||||||
| Operating expenses: | ||||||||||||||||||||||||||
| Research and development | 80,904 | 70,243 | 10,661 | 15 | % | |||||||||||||||||||||
| General and administrative | 22,222 | 17,968 | 4,254 | 24 | % | |||||||||||||||||||||
| Total operating expenses | 103,126 | 88,211 | 14,915 | 17 | % | |||||||||||||||||||||
| Loss from operations | (44,250) | (58,147) | 13,897 | (24) | % | |||||||||||||||||||||
| Other income (expense): | ||||||||||||||||||||||||||
| Interest income | 11,852 | 3,288 | 8,564 | 260 | % | |||||||||||||||||||||
| Interest expense | (98) | (476) | 378 | (79) | % | |||||||||||||||||||||
| Other, net | 415 | (97) | 512 | (528) | % | |||||||||||||||||||||
| Loss before taxes | (32,081) | (55,432) | 23,351 | (42) | % | |||||||||||||||||||||
Income tax expense | (103) | (2,330) | 2,227 | (96) | % | |||||||||||||||||||||
| Net loss | $ | (32,184) | $ | (57,762) | $ | 25,578 | (44) | % | ||||||||||||||||||
Collaboration Revenue
The following table summarizes our collaboration revenue by partner (in thousands):
| Years Ended December 31, | |||||||||||||||||||||||
| 2023 | 2022 | $ Change | % Change | ||||||||||||||||||||
| AbbVie | $ | 41,925 | $ | 17,064 | $ | 24,861 | 146 | % | |||||||||||||||
| Amgen | 16,487 | 11,964 | 4,523 | 38 | % | ||||||||||||||||||
| Adaptimmune | 464 | 1,036 | (572) | (55) | % | ||||||||||||||||||
| Total collaboration revenue | $ | 58,876 | $ | 30,064 | $ | 28,812 | 96 | % | |||||||||||||||
The $28.8 million, or 96%, increase in collaboration revenue relates primarily to a $24.9 million increase in revenue recognized from our AbbVie Agreement, which includes a $20.4 million cumulative catch-up adjustment related to the completion of enrollment in our Synergy study under the AbbVie Amendment, and the resulting downward revisions to the projected program duration and corresponding estimated total costs to complete the program. In addition, collaboration revenue increased by $4.5 million related to deliverables completed in connection with the Amgen Agreement, which in 2023 includes $6.7 million related to expiration of Amgen’s option to select a Third Research Program. Revenue from our Adaptimmune collaboration decreased by $0.6 million as we completed the final deliverables in June 2023.
Research and Development Expenses
Our direct research and development expenses consist primarily of expenses incurred pursuant to agreements with third-party manufacturing organizations for our product candidates, CROs, clinical trial sites, collaborators, and consultants. Other direct costs included direct research and development costs incurred before a selected product candidate begins clinical trials.
99
We use our employee and infrastructure resources across multiple research and development programs that we are advancing in parallel, and therefore do not allocate salaries, stock-based compensation, employee benefit expenses or other indirect costs related to our research and development to specific product candidates. These expenses are included in indirect research and development expense by type in the table below. Our research and development expenses are summarized as follows (in thousands):
| Years Ended December 31, | ||||||||||||||||||||||||||
| 2023 | 2022 | $ Change | % Change | |||||||||||||||||||||||
| Direct research and development expense by program: | ||||||||||||||||||||||||||
| Povetacicept | $ | 20,777 | $ | 12,561 | $ | 8,216 | 65 | % | ||||||||||||||||||
| Acazicolcept | 13,549 | 12,282 | 1,267 | 10 | % | |||||||||||||||||||||
| Davoceticept | 2,632 | 10,035 | (7,403) | (74) | % | |||||||||||||||||||||
| Other | 892 | 1,070 | (178) | (17) | % | |||||||||||||||||||||
| Total direct research and development expense | 37,850 | 35,948 | 1,902 | 5 | % | |||||||||||||||||||||
| Indirect research and development expense by type: | ||||||||||||||||||||||||||
| Personnel-related costs | 35,942 | 28,239 | 7,703 | 27 | % | |||||||||||||||||||||
| Research and development supplies and services | 3,290 | 2,825 | 465 | 16 | % | |||||||||||||||||||||
| Allocated facility, equipment and other expenses | 3,822 | 3,231 | 591 | 18 | % | |||||||||||||||||||||
| Total indirect research and development expense | 43,054 | 34,295 | 8,759 | 26 | % | |||||||||||||||||||||
| Total research and development expense | $ | 80,904 | $ | 70,243 | $ | 10,661 | 15 | % | ||||||||||||||||||
Total research and development expense increased by $10.7 million, or 15%, year over year, primarily due to higher indirect expenses.
Direct research and development expense increased by $1.9 million, or 5%, year over year, primarily due to $8.2 million higher povetacicept costs. The increase in povetacicept costs was primarily due to higher clinical trial costs, process development, and manufacturing. Additionally, acazicolcept costs increased by $1.3 million related to process development and manufacturing costs, partially offset by decreased spending on our Synergy study. These increases were substantially offset by a $7.4 million decrease in davoceticept costs resulting from the termination and close out of our NEON-1 and NEON-2 clinical studies. Other direct research and development expenses decreased by $0.2 million, and were incurred in support of our research pipeline.
Indirect research and development expense increased by $8.8 million, or 26%, which largely relates to a $7.7 million increase in personnel-related expenses. The rise in personnel costs, which includes an increase of $0.5 million in non-cash stock-based compensation expense, was primarily due to increased headcount to support clinical trial activities.
General and Administrative Expenses
The $4.3 million, or 24%, increase in general and administrative expenses was primarily attributable to increases of $3.0 million in personnel related expenses, which includes a $0.4 million increase in non-cash stock-based compensation expense, primarily due to higher headcount; and $1.5 million related to professional services.
Interest Income
The $8.6 million increase in interest income was primarily attributable to rising yields on cash equivalents and investments, and a higher average investments balance during 2023.
Interest Expense
The $0.4 million decrease in interest expense was due to a lower average outstanding principle balance on our term loans with SVB, which we voluntarily terminated and paid off in May 2023.
100
Other, net
For the year ended December 31, 2023, other, net consists primarily of a $0.4 million research and development tax credit received by our wholly-owned Australian subsidiary. For the year ended December 31, 2022, other expense consists primarily of the loss on the sale of equipment.
Income Tax Expense
Income tax expense for 2023 primarily relates to foreign income tax expense related to our Australian subsidiary. The $2.3 million income tax expense for 2022 relates to a $1.3 million cumulative change to our foreign income tax provision and $1.0 million in income tax expense as a result of the mandatory capitalization of research and development expenses as required under IRC Section 174, pursuant to the TCJA, which took effect in 2022.
Liquidity and Capital Resources
Sources of Liquidity
To date, we have financed our operations primarily through the sale of equity securities, payments received under our collaboration agreements, debt, and funds acquired upon the close of our merger with Nivalis. As of December 31, 2023, we had cash, cash equivalents, restricted cash, and investments totaling $368.2 million. Except for any obligations of our collaborators to make milestone payments under our agreements with them, we do not have any committed external sources of capital. Until such time as we can generate substantial product revenue, if ever, we expect to finance our cash needs through a combination of collaboration agreements and equity or debt financings.
Equity Financing Agreements
In November 2023, we entered into an underwriting agreement with Morgan Stanley & Co. LLC, Cowen and Company, LLC and Leerink Partners LLC, acting as representatives of the several underwriters named therein, or, collectively, the 2023 Underwriters, pursuant to which we sold an aggregate of 9,791,832 shares of our common stock, or the 2023 Shares, and prefunded warrants to purchase 3,200,000 shares of common stock, or the 2023 Prefunded Warrants, in an underwritten public offering and subsequent partial exercise of the 2023 Underwriters’ over-allotment option, or the 2023 Public Offering, pursuant to our effective shelf registration statement on Form S-3 (File No. 333-271517). The purchase price for each 2023 Share and 2023 Prefunded Warrant was $12.50 and $12.499 per share, respectively, for an aggregate purchase price of $162.4 million. The 2023 Prefunded Warrants became fully exercisable upon the closing date and have an exercise price of $0.001 per share. In connection with this offering, we received net proceeds of $152.2 million after deducting underwriting discounts, commissions and $0.4 million in offering expenses.
In April 2023, we entered into a sales agreement, or the 2023 Sales Agreement, with Cowen and Company, LLC, or TD Cowen, to sell shares of our common stock through an “at-the-market” equity offering for aggregate gross sales proceeds of up to $100.0 million. TD Cowen will act as the sales agent and will be entitled to compensation for services of up to 3.0% of the gross sales price per share of all shares sold through TD Cowen under the 2023 Sales Agreement. The shares will be issued pursuant to our shelf registration statement on Form S-3 (File No. 333-271517), which was filed with the SEC on April 28, 2023 and declared effective on May 9, 2023. On May 11, 2023, we filed a final prospectus supplement with the SEC relating to the offer and sale of the shares pursuant to the 2023 Sales Agreement. As of December 31, 2023, we have sold 919,413 shares of common stock under the 2023 Sales Agreement for a price of $10.93 per share and received $10.0 million in gross proceeds. Offering costs of $0.4 million incurred in connection with this equity offering were netted against the gross proceeds within additional-paid-in-capital on our accompanying Consolidated Balance Sheets.
In September 2022, we entered into an underwriting agreement with Morgan Stanley & Co. LLC, SVB Securities LLC and Cowen and Company, LLC, acting as representatives of the several underwriters named therein, or, collectively, the 2022 Underwriters, pursuant to which we sold 15,509,282 shares of our common stock in an underwritten public offering, including the subsequent partial exercise of the 2022 Underwriters’ over-allotment option in October 2022, pursuant to our effective shelf registration statement on Form S-3 (File No. 333-256107). The net proceeds of the public offering were approximately $106.7 million, after deducting underwriting discounts, commissions and offering expenses.
101
In December 2021, in connection with the execution of the Amgen Agreement, we entered into a Stock Purchase Agreement with Amgen, or the Purchase Agreement, in which Amgen made an equity investment in Alpine of 951,980 shares of our common stock for approximately $15.76 per share, for an aggregate purchase price of $15.0 million. The purchase price represents a 25% premium to the volume-weighted average share price of our common stock for the 30-day period ended December 9, 2021. The shares were recorded at the fair value of our common stock on the effective date of the Amgen Agreement, with the excess of the proceeds recorded to deferred revenue.
In September 2021, we entered into a securities purchase agreement, or the 2021 Securities Purchase Agreement, for a private placement with a select group of institutional investors, pursuant to which we sold 6,489,357 shares of our common stock, or the 2021 Shares, and prefunded warrants to purchase 3,191,487 Shares, or the 2021 Prefunded Warrants. The purchase price for each 2021 Share and for each 2021 Prefunded Warrant was $9.40 per share, for an aggregate purchase price of approximately $91.0 million. The Prefunded Warrants became fully exercisable upon the closing date and have an exercise price of $0.001 per share. In connection with the 2021 Securities Purchase Agreement, approximately 3.7 million of the Shares issued and approximately 2.3 million of the Prefunded Warrants issued, for gross proceeds of approximately $57.0 million, were issued to certain stockholders whose beneficial ownership exceeded 5% prior to completion of the 2021 Securities Purchases Agreement.
In July 2021, we entered into a sales agreement, or the 2021 Sales Agreement, with Cowen and Company, LLC, or Cowen, pursuant to which we may sell shares of our common stock from time to time through an “at-the-market” equity offering for up to $75.0 million in gross cash proceeds. Cowen will act as the sales agent and will be entitled to compensation for services of up to 3.0% of the gross sales price per share of all shares sold through Cowen under the 2021 Sales Agreement. The shares would be issued pursuant to our effective shelf registration statement on Form S-3 (File No. 333-256107). We filed a prospectus supplement, dated July 2, 2021, with the SEC in connection with the offer and sale of the shares pursuant to the 2021 Sales Agreement. In connection with our September 2022 public offering, we and Cowen mutually terminated the 2021 Sales Agreement, and, as a result, we wrote off $0.5 million in deferred offering costs to expense, which were previously included within prepaid expenses and other current assets on our accompanying Consolidated Balance Sheets. No shares of common stock were sold under the 2021 Sales Agreement prior to its termination.
In January 2019, we entered into a securities purchase agreement, or the 2019 Securities Purchase Agreement, for a private placement with a limited number of accredited investors, pursuant to which we sold 4,706,700 shares of common and common stock warrants to purchase 1,835,610 million shares of common stock, for an aggregate purchase price of $25.3 million. In December 2023 and January 2024, we received cash proceeds of $1.9 million and $17.6 million in connection with the exercise of 219,692 and 1,597,762 common stock warrants, respectively, issued under the 2019 Securities Purchase Agreement.
Debt Financing Agreements
In August 2019, we entered into an Amended and Restated Loan and Security Agreement, or the Loan Agreement, with SVB pursuant to which SVB agreed to extend term loans to us with an aggregate principal amount of up to $15.0 million, or the Term Loans. Borrowings under the Loan Agreement consisted of up to three separate tranches. The initial tranche of $5.0 million was funded in August 2019; the second tranche of $5.0 million was funded in March 2020; and we did not draw down the final tranche of $5.0 million, which expired in July 2020.
In May 2023, we voluntarily repaid in full the remaining outstanding carrying value of $1.4 million under our Term Loans, which consisted of $0.8 million in principal and final payments of $0.6 million, plus prorated accrued interest. As of December 31, 2023, we had no remaining balance outstanding under our Loan Agreement with SVB. See Note 8 for further discussion of our term loans.
Cash Flows
The following is a summary of our cash flows (in thousands):
| Years Ended December 31, | ||||||||||||||
| 2023 | 2022 | |||||||||||||
| Net cash used in operating activities | $ | (79,012) | $ | (43,754) | ||||||||||
| Net cash used in investing activities | (55,559) | (113,348) | ||||||||||||
| Net cash provided by financing activities | 165,122 | 102,689 | ||||||||||||
102
Net cash used in operating activities:
Net cash used in operating activities was $79.0 million for the year ended December 31, 2023 and primarily consisted of our net loss of $32.2 million, and a net change of $50.2 million in our operating assets and liabilities, which was primarily attributable to collaboration revenue recognized on upfront payments received in prior periods. This was partially offset by $3.3 million in net non-cash adjustments, which primarily relate to stock-based compensation, amortization of premiums and discounts on our investments, and depreciation.
Net cash used in operating activities was $43.8 million for the year ended December 31, 2022 and consisted of our net loss of $57.8 million, which was partially offset by a net change of $4.1 million in our operating assets and liabilities and $9.9 million in net non-cash adjustments, which primarily relate to stock-based compensation, amortization of premiums and discounts on our investments, and depreciation.
Net cash used in investing activities:
Cash flows from investing activities primarily reflect cash used to purchase investments and proceeds from the maturities and sales of investments, thus causing a shift between our cash and cash equivalents and investment balances. We manage our cash usage with respect to our total cash, cash equivalents and investments.
Net cash used in investing activities was $55.6 million and $113.3 million for the years ended December 31, 2023 and 2022, respectively, and consisted primarily of our purchases and maturities of investments, and purchases of property and equipment, primarily lab equipment, to support our research and development efforts.
Net cash provided by financing activities:
Net cash provided by financing activities was $165.1 million for the year ended December 31, 2023, primarily consisting of $152.2 million in net proceeds from the sale of approximately 9.8 million shares of common stock and 3.2 million prefunded warrants in our 2023 Public Offering. In addition, we raised net proceeds of $9.7 million from the sale of approximately 0.9 million shares of common stock under our Sales Agreement with TD Cowen, $5.1 million from the exercise of stock options, and $1.9 million from the exercise of warrants. These cash inflows were partially offset by $3.4 million in cash used in the repayment of all outstanding principal and final fees on our Term Loans, and $0.3 million in cash used to pay taxes on vested restricted stock units, or RSUs.
Net cash provided by financing activities was $102.7 million for the year ended December 31, 2022 and consisted of the net proceeds of $106.7 million related to the sale of approximately 15.5 million shares of common stock in our underwritten public offering, and $0.8 million in proceeds from the exercise of stock options, partially offset by $4.8 million in principal payments on our Term Loans.
Funding Requirements
We have incurred operating losses since inception. We expect to continue to incur significant expenses and operating losses for the foreseeable future as we continue our research and preclinical and clinical development of our product candidates; expand the scope of our current studies for our product candidates; initiate additional preclinical, clinical or other studies for our product candidates, including under any collaboration agreements; change or add additional manufacturers or suppliers; seek regulatory and marketing approvals for any of our product candidates that successfully complete clinical studies; seek to identify, evaluate and validate additional product candidates; acquire or in-license other product candidates and technologies; maintain, protect and expand our intellectual property portfolio; attract and retain skilled personnel; and experience any delays or encounter issues with any of the above. Additionally, we have ongoing obligations with respect to our operating lease and certain contingencies, as described below.
Until such time as we can generate substantial product revenue, if ever, we expect to finance our cash needs through a combination of equity or debt financings and collaboration agreements. To the extent that we raise additional capital through the future sale of equity or debt, the ownership interest of our stockholders will be diluted, and the terms of these securities may include liquidation or other preferences that adversely affect the rights of our existing common stockholders. If we raise additional funds through collaboration agreements in the future, we may have to relinquish valuable rights to our technologies, future revenue streams or product candidates or grant licenses on terms that may not be favorable to us. If we are unable to raise additional funds through equity or debt financings when needed, we may be required to delay, limit, reduce or terminate our product development or future commercialization efforts or grant rights to develop and market product candidates that we would otherwise prefer to develop and market ourselves.
103
Our future capital requirements are difficult to forecast and will depend on many factors, including:
•the number and characteristics of the future product candidates we pursue either from our internal research efforts or through acquiring or in-licensing other product candidates or technologies;
•the scope, progress, results and costs of independently researching and developing any of our future product candidates, including conducting preclinical research and clinical trials;
•whether our existing collaborations generate substantial milestone payments and, ultimately, royalties on future approved products for us;
•the timing of, and the costs involved in, obtaining regulatory approvals for any future product candidates we develop independently;
•the cost of future commercialization activities, if any;
•the cost of manufacturing our future product candidates and products, if any;
•our ability to maintain our existing collaborations and to establish new collaborations, licensing or other arrangements and the financial terms of such arrangements;
•the costs of preparing, filing, prosecuting, maintaining, defending and enforcing patents, including litigation costs and the outcome of such litigation; and
•the timing, receipt and amount of sales of, or royalties on, our current or future collaborators’ product candidates, and our future products, if any.
We have considered that our long-term operations anticipate continuing net losses and the need for potential equity or debt financing. We have also considered that new collaborations or selectively partnering our technology or programs may provide other sources of capital. However, there can be no assurances that additional funding or other sources of capital will be available on terms acceptable to us, or at all. Based on our current operating plan, we believe our available cash and cash equivalents and investments, will be sufficient to fund our planned level of operations for at least the next 12 months. We have based this estimate on assumptions that may prove to be wrong, and we could use our capital resources sooner than we expect. Additionally, the process of testing drug candidates in preclinical and clinical studies is costly, and the timing of progress in these studies remains uncertain. Further, inflation may affect our use of capital resources by increasing our cost of labor and clinical trial expenses. Our long-term funding requirements will consist of operational, capital, and manufacturing expenditures, including those contractual commitments described above. Because of the inherent risks and uncertainties associated with the development and commercialization of our product candidates, we are unable to estimate the amounts of capital outflows and operating expenditures associated with our long-term anticipated preclinical studies and clinical trials.
Operating Lease
In March 2019, we entered into a lease with ARE-Seattle No. 28, LLC, or the Landlord, for 27,164 square feet of office and laboratory space located at 188 East Blaine Street, Seattle, Washington. The term of the lease is 10.8 years with one option to extend the term by 5 years. The lease term commenced in June 2019. The “Rent Commencement Date” began in March 2020, nine months after the commencement date. We were not required to pay base rent from the Rent Commencement Date through November 2020, the last day of the ninth month following the Rent Commencement Date. The annual base rent under the lease is $1.7 million for the first year and will increase by 3.0% each year thereafter. We received a tenant improvement allowance of $5.4 million, which is included in our base rent, and a maximum additional tenant improvement allowance of $1.8 million, which resulted in additional rent amortized over the term of the lease at an annual rate of 8.0%. The lease also requires us to pay additional amounts for operating and maintenance expenses. In March 2019, in connection with the lease, we provided a $254,000 letter of credit as a security deposit, which is recorded as noncurrent restricted cash in our accompanying Consolidated Balance Sheets. See further discussion of our operating lease in Note 9.
Contingencies
Certain credits received related to our research and development expenditures, which were previously recorded within other income within our Consolidated Statements of Operations and Comprehensive Income (Loss), were subject to review by foreign taxing authorities. In 2022, we reached constructive agreement with the Australian Taxation Office (the “ATO”) and recorded an estimated current foreign income tax provision of $1.3 million for the expected repayments, of which we paid $590,000 and $543,000 during the years December 31, 2023, and 2022, respectively. In 2023, the remaining balance of
104
$136,000 was fully offset by research and development tax credits by the ATO, which were recorded within other income in our Consolidated Statements of Operations and Comprehensive Income (Loss). As of December 31, 2023, we have no further liabilities associated with the ATO.
Critical Accounting Policies and Estimates
Our management’s discussion and analysis of our financial condition and results of operations is based on our consolidated financial statements, which we have prepared in accordance with generally accepted accounting principles in the United States, or GAAP. The preparation of these consolidated financial statements requires us to make estimates and assumptions that affect the reported amounts of assets and liabilities and the disclosure of contingent assets and liabilities at the date of the consolidated financial statements, as well as the reported revenues and expenses during the reporting periods. We evaluate these estimates and judgments on an ongoing basis. We base our estimates on historical experience and on various other factors that we believe are reasonable under the circumstances, the results of which form the basis for making judgments about the carrying value of assets and liabilities that are not readily apparent from other sources. Our actual results may differ from these estimates under different assumptions or conditions.
While our significant accounting policies are more fully described in Note 2 to our consolidated financial statements, we believe that the following accounting policies are the most critical to fully understanding and evaluating our financial condition and results of operations.
Accrued Liabilities
As part of the process of preparing our consolidated financial statements, we are required to estimate accruals for professional services and research and development expenses. This process involves reviewing contracts and vendor agreements and communicating with applicable personnel to identify services that have been performed on our behalf. We estimate the level of service performed and the associated cost incurred for the service when we have not yet been invoiced or otherwise notified of the actual cost. We estimate accrued liabilities as of each balance sheet date based on known facts and circumstances.
Although we do not expect our estimates to be materially different from amounts actually incurred, if our estimates of the status and timing of services performed differ from the actual status and timing of services performed, we may report amounts that are too high or too low in any particular period. To date, we have not experienced any significant adjustments to our estimates.
Revenue Recognition
Revenue recognition is a critical accounting estimate due to the magnitude and nature of the upfront cash and milestone payments we receive. Our primary source of revenue is derived from our collaboration and licensing agreements.
Revenue is recognized when control of the promised goods or services is transferred to our customers, in an amount that reflects the consideration we expect to be entitled to in exchange for those goods or services. Our steps for recognizing revenue consist of: (1) identifying the contract; (2) identifying the performance obligations as either distinct or bundled goods and services; (3) determining the transaction price associated with each performance obligation for which we expect to be entitled in exchange for transferring such goods and services; (4) allocating the transaction price to the performance obligations in the contract; and (5) recognizing revenue upon satisfaction of performance obligations.
Our collaboration agreements principally contain multiple performance obligations, which may include (1) grants of, or options to obtain, intellectual property licenses; (2) research and development services; and/or (3) manufacturing or supply services. Payments received under these arrangements typically include one or more of the following: non-refundable upfront license fees, option exercise fees, payment for research and/or development efforts, amounts due upon the achievement of specified objectives, and/or royalties on future product sales. Our revenue is primarily derived from our collaboration agreements with Adaptimmune, AbbVie, and Amgen. See further discussion of our collaboration agreements in Note 10.
We allocate revenue to each performance obligation based on its relative stand-alone selling price. We generally determine stand-alone selling prices at the inception of the contract based on our best estimate of what the selling price would be if the deliverable was regularly sold by us on a stand-alone basis. Payments received prior to satisfying the relevant revenue recognition criteria are recorded as deferred revenue in the accompanying Consolidated Balance Sheets and recognized as revenue when the related revenue recognition criteria are met. We recognize revenue under our collaboration agreements by
105
using a cost-based input method to measure progress toward completion of the performance obligation, including employee hours contributed to each performance obligation, and to calculate the corresponding revenue to recognize each period.
Our collaboration agreements provide for non-refundable milestone payments. We recognize revenue that is contingent upon the achievement of a substantive milestone in its entirety in the period in which the milestone is achieved. A milestone is considered substantive when the consideration payable to us for such milestone (1) is consistent with our performance necessary to achieve the milestone or the increase in value to the collaboration resulting from our performance; (2) relates solely to our past performance; and (3) is reasonable relative to all of the other deliverables and payments within the arrangement. In making this assessment, we consider all facts and circumstances relevant to the arrangement, including factors such as the scientific, regulatory, commercial, and other risks that must be overcome to achieve the milestone, the level of effort and investment required to achieve the milestone and whether any portion of the milestone consideration is related to future performance or deliverables.
We review the contributed employee hours and progress towards completion for each performance obligation under our collaboration agreements and adjust the revenue recognized to reflect changes in assumptions relating to the estimated satisfaction of the performance obligation. Revenue recognition may be accelerated in the event of early termination of programs or if our expectations change. Alternatively, revenue recognition may be decelerated if programs are extended or delayed. While such changes to our estimates have no impact on our reported cash flows, the timing of revenue recorded in future periods could be materially impacted.
Stock-based Compensation
Stock-based compensation is recognized for all share-based payments based on the estimated fair value as of the date of grant. The fair value of our stock options is calculated using the Black-Scholes option pricing model, which requires us to apply our judgment regarding certain key assumptions including risk-free interest rate, expected term, volatility and dividend yield. For risk-free interest rate, we use the zero-coupon U.S. Treasury instruments security rate with a term equal to the expected life of the option. We use the “simplified method” for options to determine the expected term of stock options. Under this approach, the weighted-average expected life is presumed to be the average of the vesting term and the contractual term of the option. For volatility, we analyze the stock price volatility of companies at a similar stage of development to estimate expected volatility of our stock price. Our assumed dividend yield is zero as we have never paid cash dividends and have no present intention to pay cash dividends. The fair value of RSUs is based on the closing price of our common stock on the award date. Stock-based compensation expense is recognized over the requisite service period of the awards, usually the vesting period, on a straight-line basis. For performance-based awards where the vesting of the options may be accelerated upon the achievement of certain milestones, the related stock-based compensation is recognized as expense when it is probable the milestone will be met. We recognize forfeitures of awards as they occur rather than estimating the expected forfeiture rate.
If factors change and we employ different assumptions for estimating stock-based compensation expense in future periods, or if we decide to use a different valuation model, the stock-based compensation expense we recognize in future periods may differ significantly from what we have recorded in the current period and could materially affect our financial statements.
Income Taxes
Income taxes are accounted for using an asset and liability approach that requires the recognition of deferred tax assets and liabilities for the expected future tax consequences of temporary differences between the consolidated financial statement and tax bases of assets and liabilities at the applicable enacted tax rates. We establish a valuation allowance for deferred tax assets if it is more likely than not that these items will expire before we are able to realize their benefits or that future deductibility is uncertain.
We recognize the tax benefit from uncertain tax positions only if it is more likely than not that the tax position will be sustained on examination by the tax authorities, based on the technical merits of the position. The tax position is measured based on the largest benefit that has a greater than 50% likelihood of being realized upon ultimate settlement. We recognize interest and penalties related to income tax matters in income tax expense, if incurred.
Recently Issued Accounting Pronouncements
In December 2023, the Financial Accounting Standards Board, or FASB, issued Accounting Standards Update, or ASU, 2023-09, Income Taxes (Topic 740): Improvements to Income Tax Disclosures, which requires public entities to disclose disaggregated information about their effective tax rate reconciliation as well as expanded information on income taxes paid by jurisdiction. The disclosure requirements will be applied on a prospective basis, with the option to apply them retrospectively.
106
The standard is effective for annual periods beginning after December 15, 2024, with early adoption permitted. We plan to adopt this guidance for the fiscal year ending December 31, 2025. We are currently evaluating the impact of this new guidance on our disclosure requirements related to the new standard, but do not expect it to have a material impact on our financial condition, results of operations, or cash flows.
In November 2023, the FASB issued ASU 2023-07, Segment Reporting (Topic 280): Improvements to Reportable Segment Disclosures, which requires enhanced segment disclosures. Public entities with a single reporting segment are required to provide all disclosures required by Topic 280. This standard is effective for fiscal years beginning after December 15, 2023, and interim periods within fiscal years beginning after December 15, 2024, with early adoption permitted. The enhanced disclosures are required to be applied retrospectively to all prior periods presented in the financial statements. We plan to adopt this guidance for the fiscal year ending December 31, 2024. We are currently evaluating the impact of this new guidance on our disclosure requirements related to the new standard, but do not expect it to have a material impact on our financial condition, results of operations, or cash flows.
Item 7A. Quantitative and Qualitative Disclosures About Market Risk.
As a “smaller reporting company,” as defined by Rule 12b-2 of the Exchange Act, and pursuant to Item 305 of Regulation S-K, we are not required to provide quantitative and qualitative disclosures about market risk.
Item 8. Financial Statements and Supplementary Data.
For information regarding our financial statements and supplementary data, please refer to the Notes to Consolidated Financial Statements included elsewhere in this report.
As a “smaller reporting company,” as defined by Rule 12b-2 of the Exchange Act and pursuant to Article 8, Regulation X and Item 302 of Regulation S-K, we are permitted to provide scaled Item 8 disclosure.
Item 9. Changes in and Disagreements with Accountants on Accounting and Financial Disclosure.
None.
Item 9A. Controls and Procedures.
Evaluation of Disclosure Controls and Procedures
Our management, with the participation of our Chief Executive Officer and Chief Financial Officer, evaluated the effectiveness of our disclosure controls and procedures as of December 31, 2023. The term “disclosure controls and procedures,” as defined in Rules 13a-15(e) and 15d-15(e) under the Securities Exchange Act of 1934, or the Exchange Act, means controls and other procedures of a company that are designed to ensure that information required to be disclosed by a company in the reports that it files or submits under the Exchange Act is recorded, processed, summarized and reported, within the time periods specified in the SEC’s rules and forms. Disclosure controls and procedures include, without limitation, controls and procedures designed to ensure that information required to be disclosed by a company in the reports that it files or submits under the Exchange Act is accumulated and communicated to the company’s management, including its principal executive and principal financial officers, as appropriate to allow timely decisions regarding required disclosure. Our management recognizes that any controls and procedures, no matter how well designed and operated, can provide only reasonable assurance of achieving their objectives and our management necessarily applies its judgment in evaluating the cost-benefit relationship of possible controls and procedures. Based on the evaluation of our disclosure controls and procedures as of December 31, 2023, our Chief Executive Officer and Chief Financial Officer concluded that, as of such date, our disclosure controls and procedures were effective at the reasonable assurance level.
107
Management’s Annual Report on Internal Control Over Financial Reporting
Our management is responsible for establishing and maintaining adequate internal control over financial reporting as defined in Rule 13a-15(f) and Rule 15d-15(f) of the Exchange Act. Our internal control over financial reporting is a process to provide reasonable assurance regarding the reliability of financial reporting and the preparation of financial statements for external purposes in accordance with generally accepted accounting principles. Our internal control over financial reporting includes those policies and procedures that:
(i)pertain to the maintenance of records that, in reasonable detail, accurately and fairly reflect the transactions and dispositions of our assets;
(ii)provide reasonable assurance that transactions are recorded as necessary to permit preparation of financial statements in accordance with generally accepted accounting principles, and that our receipts and expenditures are being made only in accordance with authorizations of our management and directors; and
(iii)provide reasonable assurance regarding prevention or timely detection of unauthorized acquisition, use or disposition of our assets that could have a material effect on the financial statements.
The effectiveness of any system of internal control over financial reporting, including ours, is subject to inherent limitations, including the exercise of judgment in designing, implementing, operating, and evaluating the controls and procedures, and the inability to eliminate misconduct completely. Accordingly, any system of internal control over financial reporting, including ours, no matter how well designed and operated, can only provide reasonable, not absolute, assurances. Also, projections of any evaluation of effectiveness to future periods are subject to the risk that controls may become inadequate because of changes in conditions or that the degree of compliance with the policies or procedures may deteriorate. Our management assessed the effectiveness of our internal control over financial reporting as of December 31, 2023. In making this assessment, our management used the criteria set forth by the Committee of Sponsoring Organizations of the Treadway Commission, or COSO, Internal Control-Integrated Framework (2013). Based on our assessment using those criteria, our management has concluded that, as of December 31, 2023, our internal control over financial reporting was effective at the reasonable assurance level.
Changes in Internal Control Over Financial Reporting
No significant changes in our internal control over financial reporting occurred during the fiscal quarter ended December 31, 2023, that has materially affected, or is reasonably likely to materially affect, our internal control over financial reporting.
Auditor Attestation
We ceased to be an “emerging growth company” under the JOBS Act effective December 31, 2020. However, for so long as we are not classified as an “accelerated filer” or “large accelerated filer” pursuant to SEC rules, we will continue to be exempt from the auditor attestation requirements of Section 404(b) of Sarbanes-Oxley.
Item 9B. Other Information
On December 28, 2023 , Mitchell H. Gold, M.D ., our Chief Executive Officer, terminated a Rule 10b5-1 trading arrangement providing for the sale from time to time of an aggregate of 438,000 shares of our common stock. The trading arrangement was adopted on March 30, 2023 and was intended to satisfy the affirmative defense in Rule 10b5-1(c). The duration of the trading arrangement was from June 30, 2023 until June 30, 2024, or earlier if all transactions under the trading arrangement were completed. Dr. Gold sold 213,302 shares under the trading arrangement prior to the date of termination.
Item 9C. Disclosure Regarding Foreign Jurisdictions that Prevent Inspections.
Not applicable.
108
PART III
Item 10. Directors, Executive Officers and Corporate Governance.
The information required by Item 10 of Form 10-K is incorporated by reference to our Proxy Statement for the 2024 Annual Meeting of Stockholders to be filed with the SEC within 120 days after the end of the fiscal year ended December 31, 2023.
We have a written code of conduct and ethics that applies to all of our directors, officers and employees. A copy of the most up-to-date version of our code of conduct is available on our company website located at https://ir.alpineimmunesciences.com/governance. We intend to satisfy the disclosure requirement under Item 5.05 of Form 8-K regarding amendments and waivers of our code of conduct and ethics that apply to our principal executive officer, principal financial officer, principal accounting officer or controller, or persons performing similar functions by posting that information on our website address specified above.
Item 11. Executive Compensation.
The information required by Item 11 of Form 10-K is incorporated by reference to our Proxy Statement for the 2024 Annual Meeting of Stockholders to be filed with the SEC within 120 days after the end of the fiscal year ended December 31, 2023.
Item 12. Security Ownership of Certain Beneficial Owners and Management and Related Stockholder Matters.
The information required by Item 12 of Form 10-K is incorporated by reference to our Proxy Statement for the 2024 Annual Meeting of Stockholders to be filed with the SEC within 120 days after the end of the fiscal year ended December 31, 2023.
Item 13. Certain Relationships and Related Transactions, and Director Independence.
The information required by Item 13 of Form 10-K is incorporated by reference to our Proxy Statement for the 2024 Annual Meeting of Stockholders to be filed with the SEC within 120 days after the end of the fiscal year ended December 31, 2023.
Item 14. Principal Accounting Fees and Services.
The information required by Item 14 of Form 10-K is incorporated by reference to our Proxy Statement for the 2024 Annual Meeting of Stockholders to be filed with the SEC within 120 days after the end of the fiscal year ended December 31, 2023.
109
PART IV
Item 15. Exhibits, Financial Statement Schedules.
(a)The financial statements, schedules and exhibits filed as a part of this Annual Report on Form 10-K are as follows:
(1)Financial statements – The financial statements included in Item 8 are filed as part of this Annual Report on Form 10-K.
(2)Financial Statement Schedules – All schedules have been omitted because they are not applicable or required, or the information required to be set forth therein is included in the consolidated financial statements or notes thereto included in Item 8 of this Annual Report on Form 10-K.
(3)Exhibits – The exhibits required to be filed as part of this report are listed in the Exhibit List attached hereto and are incorporated herein by reference.
INDEX TO EXHIBITS
| Incorporated by Reference | ||||||||||||||||||||||||||||||||
| Exhibit Number | Description | Form | File No. | Exhibit | Filing Date | |||||||||||||||||||||||||||
| 3.1 | 8-K | 001-37449 | 3.1 | June 14, 2023 | ||||||||||||||||||||||||||||
| 3.2 | 8-K | 001-37449 | 3.1 | January 26, 2023 | ||||||||||||||||||||||||||||
| 4.1 | 10-K | 001-37449 | 4.1 | March 28, 2018 | ||||||||||||||||||||||||||||
| 4.2 | 10-K | 001-37449 | 4.5 | March 28, 2018 | ||||||||||||||||||||||||||||
4.3 | 8-K | 001-37449 | 4.1 | August 28, 2019 | ||||||||||||||||||||||||||||
4.4+ | ||||||||||||||||||||||||||||||||
4.5 | 8-K | 001-37449 | 10.3 | September 15, 2021 | ||||||||||||||||||||||||||||
| 10.1* | S-8 | 333-205220 | 4.4 | June 25, 2015 | ||||||||||||||||||||||||||||
| 10.2* | S-8 | 333-205220 | 4.5 | June 25, 2015 | ||||||||||||||||||||||||||||
| 10.3* | S-8 | 333-205220 | 4.6 | June 25, 2015 | ||||||||||||||||||||||||||||
| 10.4* | S-8 | 333-205220 | 4.7 | June 25, 2015 | ||||||||||||||||||||||||||||
| 10.5* | S-1 | 333-204127 | 10.18 | May 13, 2015 | ||||||||||||||||||||||||||||
10.6*+ | ||||||||||||||||||||||||||||||||
| 10.7* | 8-K | 001-37449 | 10.1 | January 5, 2024 | ||||||||||||||||||||||||||||
| 10.8* | 10-K | 001-37449 | 10.33 | March 28, 2018 | ||||||||||||||||||||||||||||
| 10.9* | 10-K | 001-37449 | 10.35 | March 28, 2018 | ||||||||||||||||||||||||||||
| 10.10* | 10-K | 001-37449 | 10.37 | March 28, 2018 | ||||||||||||||||||||||||||||
10.11* | 10-Q | 001-37449 | 10.1 | November 14, 2022 | ||||||||||||||||||||||||||||
110
| Incorporated by Reference | ||||||||||||||||||||||||||||||||
| Exhibit Number | Description | Form | File No. | Exhibit | Filing Date | |||||||||||||||||||||||||||
10.12* | 10-Q | 001-37449 | 10.2 | May 11, 2023 | ||||||||||||||||||||||||||||
10.13* | 10-Q | 001-37449 | 10.1 | November 14, 2023 | ||||||||||||||||||||||||||||
10.14* | 10-Q | 001-37449 | 10.2 | November 14, 2023 | ||||||||||||||||||||||||||||
10.15* | 10-Q | 001-37449 | 10.3 | November 14, 2023 | ||||||||||||||||||||||||||||
10.16* | S-8 POS | 333-218134 | 4.1 | September 11, 2017 | ||||||||||||||||||||||||||||
10.17* | S-8 POS | 333-218134 | 4.2 | September 11, 2017 | ||||||||||||||||||||||||||||
10.18* | 8-K | 001-37449 | 10.1 | June 17, 2020 | ||||||||||||||||||||||||||||
10.19* | 8-K | 001-37449 | 10.2 | June 14, 2018 | ||||||||||||||||||||||||||||
10.20* | 8-K | 001-37449 | 10.1 | January 27, 2020 | ||||||||||||||||||||||||||||
10.21 | 8-K | 001-37449 | 10.1 | January 16, 2019 | ||||||||||||||||||||||||||||
10.22* | 8-K | 001-37449 | 10.1 | April 1, 2019 | ||||||||||||||||||||||||||||
10.23 | 10-Q | 001-37449 | 10.6 | May 9, 2019 | ||||||||||||||||||||||||||||
10.24** | 10-Q | 001-37449 | 10.2 | August 11, 2020 | ||||||||||||||||||||||||||||
10.25** | Letter Agreement, dated April 12, 2022, between Alpine Immune Sciences Inc. and AbbVie Global Enterprises Ltd. amending the Option and License Agreement, dated June 17, 2020, by and between Alpine Immune Sciences Inc. and AbbVie Global Enterprises Ltd. (as assignee of AbbVie Ireland Unlimited Company) | 10-Q | 001-37449 | 10.2 | August 11, 2022 | |||||||||||||||||||||||||||
10.26**+ | Letter Agreement, dated December 20, 2023, between Alpine Immune Sciences Inc. and AbbVie Global Enterprises Ltd. amending the Option and License Agreement, dated June 17, 2020, as amended on April 12, 2022, by and between Alpine Immune Sciences Inc. and AbbVie Global Enterprises Ltd. (as assignee of AbbVie Ireland Unlimited Company) | |||||||||||||||||||||||||||||||
10.27 | 8-K | 001-37449 | 10.1 | September 15, 2021 | ||||||||||||||||||||||||||||
10.28 | 8-K | 001-37449 | 10.2 | September 15, 2021 | ||||||||||||||||||||||||||||
10.29 | 8-K | 001-37449 | 10.4 | September 15, 2021 | ||||||||||||||||||||||||||||
10.30** | 10-K | 001-37449 | 10.30 | March 17, 2022 | ||||||||||||||||||||||||||||
111
| Incorporated by Reference | ||||||||||||||||||||||||||||||||
| Exhibit Number | Description | Form | File No. | Exhibit | Filing Date | |||||||||||||||||||||||||||
10.31 | 10-K | 001-37449 | 10.31 | March 17, 2022 | ||||||||||||||||||||||||||||
| 10.32 | S-3 | 333-271517 | 1.2 | April 28, 2023 | ||||||||||||||||||||||||||||
21.1 | 10-K | 001-37449 | 21.1 | March 23, 2023 | ||||||||||||||||||||||||||||
| 23.1+ | ||||||||||||||||||||||||||||||||
| 24.1+ | ||||||||||||||||||||||||||||||||
| 31.1+ | ||||||||||||||||||||||||||||||||
| 31.2+ | ||||||||||||||||||||||||||||||||
| 32.1+ | ||||||||||||||||||||||||||||||||
| 32.2+ | ||||||||||||||||||||||||||||||||
97+ | ||||||||||||||||||||||||||||||||
| 101.INS+ | Inline XBRL Instance Document | |||||||||||||||||||||||||||||||
| 101.SCH+ | Inline XBRL Taxonomy Extension Schema Document | |||||||||||||||||||||||||||||||
| 101.CAL+ | Inline XBRL Taxonomy Extension Calculation Linkbase Document | |||||||||||||||||||||||||||||||
| 101.LAB+ | Inline XBRL Taxonomy Extension Label Linkbase Document | |||||||||||||||||||||||||||||||
| 101.PRE+ | Inline XBRL Taxonomy Extension Presentation Linkbase Document | |||||||||||||||||||||||||||||||
| 101.DEF+ | Inline XBRL Taxonomy Extension Definition Linkbase Document | |||||||||||||||||||||||||||||||
| 104 | Cover page formatted as Inline XBRL and contained in Exhibit 101 | |||||||||||||||||||||||||||||||
| * | Indicates a management contract or a compensatory plan, contract or arrangement. | ||||
| + | Filed herewith. | ||||
| ** | Portions of this exhibit have been omitted in accordance with Item 601(b)(10) of Regulation S-K because they are private, confidential and not material. | ||||
Item 16. Form 10-K Summary.
Not Applicable
112
SIGNATURES
Pursuant to the requirements of Section 13 or 15(d) of the Securities Exchange Act of 1934, as amended, the Registrant has duly caused this Report to be signed on its behalf by the undersigned, thereunto duly authorized.
| ALPINE IMMUNE SCIENCES, INC. | ||||||||||||||
| Date: | March 19, 2024 | By: | /s/ Mitchell H. Gold, M.D. | |||||||||||
| Name: | Mitchell H. Gold, M.D. | |||||||||||||
| Title | Executive Chairman and Chief Executive Officer | |||||||||||||
| ALPINE IMMUNE SCIENCES, INC. | ||||||||||||||
| Date: | March 19, 2024 | By: | /s/ Paul Rickey | |||||||||||
| Name: | Paul Rickey | |||||||||||||
| Title: | Senior Vice President and Chief Financial Officer | |||||||||||||
POWER OF ATTORNEY
KNOW ALL PERSONS BY THESE PRESENTS, that each person whose signature appears below constitutes and appoints Mitchell H. Gold, M.D. and Paul Rickey, and each of them, with full power of substitution and resubstitution and full power to act without the other, as his or her true and lawful attorney-in-fact and agent to act in his or her name, place and stead and to execute in the name and on behalf of each person, individually and in each capacity stated below, and to file, any and all documents in connection therewith, with the Securities and Exchange Commission, granting unto said attorneys-in-fact and agents, and each of them, full power and authority to do and perform each and every act and thing, ratifying and confirming all that said attorneys-in-fact and agents or any of them or their and his or her substitute or substitutes, may lawfully do or cause to be done by virtue thereof.
Pursuant to the requirements of the Securities Exchange Act of 1934, as amended, this Report has been signed below by the following persons on behalf of the Registrant in the capacities and on the dates indicated.
113
| Name | Title | Date | ||||||||||||
/s/ Mitchell H. Gold, M.D. | Chief Executive Officer and Executive Chairman of the Board of Directors (Principal Executive Officer) | March 19, 2024 | ||||||||||||
| Mitchell H. Gold, M.D. | ||||||||||||||
/s/ Paul Rickey | Senior Vice President and Chief Financial Officer (Principal Accounting and Financial Officer) | March 19, 2024 | ||||||||||||
| Paul Rickey | ||||||||||||||
/s/ Peter Thomson, M.D. | Director | March 19, 2024 | ||||||||||||
| Peter Thompson, M.D. | ||||||||||||||
/s/ James N. Topper, M.D., Ph.D. | Director | March 19, 2024 | ||||||||||||
| James N. Topper, M.D., Ph.D. | ||||||||||||||
/s/ Robert Conway | Director | March 19, 2024 | ||||||||||||
| Robert Conway | ||||||||||||||
/s/ Natasha Hernday | Director | March 19, 2024 | ||||||||||||
| Natasha Hernday | ||||||||||||||
/s/ Christopher Peetz | Director | March 19, 2024 | ||||||||||||
| Christopher Peetz | ||||||||||||||
/s/ Xiangmin Cui, Ph.D. | Director | March 19, 2024 | ||||||||||||
| Xiangmin Cui, Ph.D. | ||||||||||||||
/s/ Jörn Drappa, M.D., Ph.D. | Director | March 19, 2024 | ||||||||||||
| Jörn Drappa, M.D., Ph.D. | ||||||||||||||
114
INDEX TO CONSOLIDATED FINANCIAL STATEMENTS
F-1
Report of Independent Registered Public Accounting Firm
To the Stockholders and the Board of Directors of Alpine Immune Sciences, Inc.
Opinion on the Financial Statements
We have audited the accompanying consolidated balance sheets of Alpine Immune Sciences, Inc. (the Company) as of December 31, 2023, and 2022, the related consolidated statements of operations and comprehensive income (loss), stockholder’s equity and cash flows for each of the three years in the period ended December 31, 2023, and the related notes (collectively referred to as the “consolidated financial statements”). In our opinion, the consolidated financial statements present fairly, in all material respects, the financial position of the Company at December 31, 2023, and 2022, and the results of its operations and its cash flows for each of the three years in the period ended December 31, 2023, in conformity with U.S. generally accepted accounting principles.
Basis for Opinion
These financial statements are the responsibility of the Company's management. Our responsibility is to express an opinion on the Company’s financial statements based on our audits. We are a public accounting firm registered with the Public Company Accounting Oversight Board (United States) (PCAOB) and are required to be independent with respect to the Company in accordance with the U.S. federal securities laws and the applicable rules and regulations of the Securities and Exchange Commission and the PCAOB.
We conducted our audits in accordance with the standards of the PCAOB. Those standards require that we plan and perform the audit to obtain reasonable assurance about whether the financial statements are free of material misstatement, whether due to error or fraud. The Company is not required to have, nor were we engaged to perform, an audit of its internal control over financial reporting. As part of our audits, we are required to obtain an understanding of internal control over financial reporting but not for the purpose of expressing an opinion on the effectiveness of the Company's internal control over financial reporting. Accordingly, we express no such opinion.
Our audits included performing procedures to assess the risks of material misstatement of the financial statements, whether due to error or fraud, and performing procedures that respond to those risks. Such procedures included examining, on a test basis, evidence regarding the amounts and disclosures in the financial statements. Our audits also included evaluating the accounting principles used and significant estimates made by management, as well as evaluating the overall presentation of the financial statements. We believe that our audits provide a reasonable basis for our opinion.
Critical Audit Matter
The critical audit matter communicated below is a matter arising from the current period audit of the financial statements that was communicated or required to be communicated to the audit committee and that: (1) relates to accounts or disclosures that are material to the financial statements and (2) involved our especially challenging, subjective or complex judgments. The communication of the critical audit matter does not alter in any way our opinion on the consolidated financial statements, taken as a whole, and we are not, by communicating the critical audit matter below, providing a separate opinion on the critical audit matter or on the account or disclosure to which it relates.
F-2
Accounting for Revenue under the AbbVie and Amgen Collaboration Agreements | |||||
| Description of the Matter | As discussed in Note 10 to the consolidated financial statements, the Company entered into license and collaboration agreements with AbbVie Ireland Unlimited Company and Amgen Inc. in June 2020 and December 2021, respectively. In December 2023, the AbbVie agreement was amended to stop future enrollment. Collaboration revenue recognized from these agreements was $58.4 million for the year ended December 31, 2023. The Company recognized revenue under both agreements by using a cost-based input method to measure progress toward completion of the performance obligation and to calculate the corresponding revenue to recognize each period. Auditing the Company’s estimated measure of progress toward completion of the performance obligation is complex. A cost-based input method of revenue recognition requires management to make estimates of total expected costs to complete the performance obligation. In making such estimates, significant judgment is required to evaluate key assumptions related to cost estimates, including internal personnel efforts and third-party contract costs. | ||||
| How We Addressed the Matter in Our Audit | To test revenue recognized, we performed audit procedures that included, among others, gaining an understanding and testing the Company’s estimates of total expected costs including testing the completeness and accuracy of the underlying data, inspecting evidence of actual costs incurred and comparing with previous estimates. We evaluated any changes in the total expected costs, inspected communications between the Company and the collaborators regarding updates to estimated budgeted costs as well as any significant changes in its development plans, compared estimates to actual incurred costs for the same or similar activities, and performed trend analysis to evaluate the reasonableness of the expected costs. We discussed the basis for key assumptions with the Company's research and development personnel to assess management's key assumptions used in the Company's estimates of total expected costs. | ||||
/s/ Ernst & Young LLP
We have served as the Company’s auditor since 2015.
March 19, 2024
F-3
ALPINE IMMUNE SCIENCES, INC.
CONSOLIDATED BALANCE SHEETS
(in thousands, except share and per share amounts)
| December 31, | ||||||||||||||
| 2023 | 2022 | |||||||||||||
| Assets | ||||||||||||||
| Current assets: | ||||||||||||||
| Cash and cash equivalents | $ | $ | ||||||||||||
| Short-term investments | ||||||||||||||
| Accounts receivable | ||||||||||||||
| Prepaid expenses and other current assets | ||||||||||||||
| Total current assets | ||||||||||||||
| Restricted cash, noncurrent | ||||||||||||||
| Property and equipment, net | ||||||||||||||
| Operating lease, right-of-use asset | ||||||||||||||
| Long-term investments | ||||||||||||||
| Deferred tax asset | ||||||||||||||
| Total assets | $ | $ | ||||||||||||
| Liabilities and stockholders’ equity | ||||||||||||||
| Current liabilities: | ||||||||||||||
| Accounts payable | $ | $ | ||||||||||||
| Accrued liabilities | ||||||||||||||
| Deferred revenue, current | ||||||||||||||
| Operating lease liability, current | ||||||||||||||
| Current portion of long-term debt | ||||||||||||||
| Total current liabilities | ||||||||||||||
| Deferred revenue, noncurrent | ||||||||||||||
| Operating lease liability, noncurrent | ||||||||||||||
| Total liabilities | ||||||||||||||
| Commitments and contingencies | ||||||||||||||
| Stockholders’ equity: | ||||||||||||||
Preferred stock, $ | ||||||||||||||
Common stock, $ | ||||||||||||||
Treasury stock, at cost; | ||||||||||||||
| Additional paid-in capital | ||||||||||||||
| Accumulated other comprehensive gain (loss) | ( | |||||||||||||
| Accumulated deficit | ( | ( | ||||||||||||
| Total stockholders’ equity | ||||||||||||||
| Total liabilities and stockholders’ equity | $ | $ | ||||||||||||
The accompanying notes are an integral part of these consolidated financial statements.
F-4
ALPINE IMMUNE SCIENCES, INC.
CONSOLIDATED STATEMENTS OF OPERATIONS AND COMPREHENSIVE INCOME (LOSS)
(in thousands, except share and per share amounts)
| Years Ended December 31, | |||||||||||||||||
| 2023 | 2022 | 2021 | |||||||||||||||
| $ | $ | $ | |||||||||||||||
| Operating expenses: | |||||||||||||||||
| Research and development | |||||||||||||||||
| General and administrative | |||||||||||||||||
| Total operating expenses | |||||||||||||||||
| Loss from operations | ( | ( | ( | ||||||||||||||
| Other income (expense): | |||||||||||||||||
| Interest income | |||||||||||||||||
| Interest expense | ( | ( | ( | ||||||||||||||
| Other, net | ( | ( | |||||||||||||||
| Loss before taxes | ( | ( | ( | ||||||||||||||
| Income tax (expense) benefit | ( | ( | |||||||||||||||
| Net loss | $ | ( | $ | ( | $ | ( | |||||||||||
| Comprehensive income (loss): | |||||||||||||||||
| Unrealized gain (loss) on investments | ( | ( | |||||||||||||||
| Unrealized gain (loss) on foreign currency translation | ( | ||||||||||||||||
| Comprehensive loss | $ | ( | $ | ( | $ | ( | |||||||||||
| Weighted-average shares used to compute basic and diluted net loss per share | |||||||||||||||||
| Basic and diluted net loss per share | $ | ( | $ | ( | $ | ( | |||||||||||
The accompanying notes are an integral part of these consolidated financial statements.
F-5
ALPINE IMMUNE SCIENCES, INC.
CONSOLIDATED STATEMENT OF STOCKHOLDERS’ EQUITY
(in thousands, except shares)
| Shares | Common Stock, Par Value | Additional Paid-in Capital | Accumulated Other Comprehensive Gain (Loss) | Accumulated Deficit | Total Stockholders’ Equity | |||||||||||||||||||||||||||||||||||||||
| Common | Treasury | |||||||||||||||||||||||||||||||||||||||||||
| Balance, December 31, 2020 | $ | $ | $ | $ | ( | $ | ||||||||||||||||||||||||||||||||||||||
| Issuance of common stock in Private Placement, net of offering costs | — | — | — | |||||||||||||||||||||||||||||||||||||||||
| Issuance of common stock to Amgen | — | — | — | |||||||||||||||||||||||||||||||||||||||||
| Exchange of common stock for prefunded warrants | ( | ( | — | — | ||||||||||||||||||||||||||||||||||||||||
| Issuance of common stock under equity incentive plans | — | — | — | — | ||||||||||||||||||||||||||||||||||||||||
| Stock-based compensation | — | — | — | — | — | |||||||||||||||||||||||||||||||||||||||
| Unrealized loss on investments | — | — | — | — | ( | — | ( | |||||||||||||||||||||||||||||||||||||
| Unrealized loss on foreign currency translation | — | — | — | — | ( | — | ( | |||||||||||||||||||||||||||||||||||||
| Net loss | — | — | — | — | — | ( | ( | |||||||||||||||||||||||||||||||||||||
| Balance, December 31, 2021 | ( | $ | ( | |||||||||||||||||||||||||||||||||||||||||
| Issuance of common stock in public offering, net of offering costs | — | — | — | |||||||||||||||||||||||||||||||||||||||||
| Issuance of common stock under equity incentive plans | — | — | — | — | ||||||||||||||||||||||||||||||||||||||||
| Stock-based compensation | — | — | — | — | — | |||||||||||||||||||||||||||||||||||||||
| Unrealized loss on investments | — | — | — | — | ( | — | ( | |||||||||||||||||||||||||||||||||||||
| Unrealized gain on foreign currency translation | — | — | — | — | — | |||||||||||||||||||||||||||||||||||||||
| Net loss | — | — | — | — | — | ( | ( | |||||||||||||||||||||||||||||||||||||
| Balance, December 31, 2022 | ( | ( | ||||||||||||||||||||||||||||||||||||||||||
| Issuance of common stock in public offering, net of offering costs | — | — | — | |||||||||||||||||||||||||||||||||||||||||
| Issuance of common stock under at-the-market offering, net of offering costs | — | — | — | |||||||||||||||||||||||||||||||||||||||||
| Issuance of common stock under equity incentive plans, net of tax withholdings | — | — | — | |||||||||||||||||||||||||||||||||||||||||
| Exercise of warrants, net of shares withheld | — | — | — | |||||||||||||||||||||||||||||||||||||||||
| Stock-based compensation | — | — | — | — | — | |||||||||||||||||||||||||||||||||||||||
| Retirement of treasury stock | — | ( | — | — | — | — | — | |||||||||||||||||||||||||||||||||||||
| Unrealized gain on investments | — | — | — | — | — | |||||||||||||||||||||||||||||||||||||||
| Unrealized gain on foreign currency translation | — | — | — | — | — | |||||||||||||||||||||||||||||||||||||||
| Net loss | — | — | — | — | — | ( | ( | |||||||||||||||||||||||||||||||||||||
| Balance, December 31, 2023 | $ | $ | $ | $ | ( | $ | ||||||||||||||||||||||||||||||||||||||
The accompanying notes are an integral part of these consolidated financial statements.
F-6
ALPINE IMMUNE SCIENCES, INC.
CONSOLIDATED STATEMENTS OF CASH FLOWS
(in thousands)
| Years Ended December 31, | |||||||||||||||||
| 2023 | 2022 | 2021 | |||||||||||||||
| Operating activities | |||||||||||||||||
| Net loss | $ | ( | $ | ( | $ | ( | |||||||||||
| Adjustments to reconcile net loss to net cash used in operating activities: | |||||||||||||||||
| Stock-based compensation expense | |||||||||||||||||
| Amortization of premium/discount on investments | ( | ( | |||||||||||||||
| Depreciation expense | |||||||||||||||||
| Non-cash interest expense | |||||||||||||||||
| Realized gain on investments | ( | ||||||||||||||||
| Loss on sale of property and equipment | |||||||||||||||||
| Deferred income tax | ( | ||||||||||||||||
| Changes in operating assets and liabilities: | |||||||||||||||||
| Accounts receivable | |||||||||||||||||
| Prepaid expenses and other current assets | ( | ||||||||||||||||
| Operating lease, right-of-use asset | |||||||||||||||||
| Accounts payable and accrued liabilities | |||||||||||||||||
| Deferred revenue | ( | ( | |||||||||||||||
| Operating lease liability | ( | ( | ( | ||||||||||||||
| Net cash used in operating activities | ( | ( | ( | ||||||||||||||
| Investing activities | |||||||||||||||||
| Purchases of property and equipment | ( | ( | ( | ||||||||||||||
| Purchase of investments | ( | ( | ( | ||||||||||||||
| Maturities of investments | |||||||||||||||||
| Net cash used in investing activities | ( | ( | ( | ||||||||||||||
| Financing activities | |||||||||||||||||
| Proceeds from sale of common stock and warrants, net of offering costs | |||||||||||||||||
| Proceeds from issuance of common stock to Amgen | |||||||||||||||||
| Proceeds from exercise of stock options, net of taxes paid on vested RSUs | |||||||||||||||||
| Proceeds from exercise of warrants | |||||||||||||||||
| Repayment of debt | ( | ( | ( | ||||||||||||||
| Net cash provided by financing activities | |||||||||||||||||
| Effect of exchange rate on cash and cash equivalents | ( | ( | |||||||||||||||
| Net increase (decrease) in cash and cash equivalents and restricted cash | ( | ||||||||||||||||
| Cash and cash equivalents and restricted cash, beginning of period | |||||||||||||||||
| Cash and cash equivalents and restricted cash, end of period | $ | $ | $ | ||||||||||||||
| Supplemental Information | |||||||||||||||||
| Cash paid for income taxes | $ | $ | $ | ||||||||||||||
| Cash paid for interest | $ | $ | $ | ||||||||||||||
The accompanying notes are an integral part of these consolidated financial statements.
F-7
ALPINE IMMUNE SCIENCES, INC.
NOTES TO CONSOLIDATED FINANCIAL STATEMENTS
1. Description of Business
2. Summary of Significant Accounting Policies
Basis of Presentation and Use of Estimates
The accompanying consolidated financial statements have been prepared in accordance with the rules and regulations of the Securities and Exchange Commission (“SEC”) and generally accepted accounting principles in the United States of America (“GAAP”). The preparation of financial statements in conformity with GAAP requires management to make judgments, estimates and assumptions that affect the amounts reported in the consolidated financial statements and accompanying notes. Significant estimates inherent in the preparation of the accompanying consolidated financial statements include those used for revenue recognition, accruals for clinical trial activities and other accruals, the potential outcome of uncertain tax positions that have been recognized in our consolidated financial statements or tax returns, and the estimated fair value of equity-based awards. We base our estimates and assumptions on historical experience when available and on various factors we believe to be reasonable under the circumstances. Actual results could differ materially from those estimates.
Principles of Consolidation
Our consolidated financial statements include the financial position and results of operations of Alpine Immune Sciences, Inc. and our wholly owned operating company and subsidiary, AIS Operating Co., Inc., and our wholly owned subsidiary, Alpine Immune Sciences Australia PTY LTD. All inter-company balances and transactions have been eliminated in consolidation.
Segments
We operate as one operating segment and use cash flow as the primary financial measure to manage our business.
Cash and Cash Equivalents and Restricted Cash
We consider all highly liquid investments with an original maturity of 90 days or less at the time of purchase to be cash equivalents. Cash and cash equivalents consist of deposits with commercial banks in checking and interest-bearing accounts, highly liquid money market funds, and U.S. Treasury bills.
Restricted cash represents cash reserved under our letter of credit, which serves as a security deposit for our operating lease to rent office and laboratory space in Seattle, Washington.
Periodically, we maintain deposits in financial institutions in excess of government insured limits. We believe we are not exposed to significant credit risk as our deposits, which are held at financial institutions, are high credit quality securities such as money market funds, U.S. Treasury bills, and commercial paper. To date, we have not realized any losses on these deposits.
Investments
Our investments include funds invested in highly liquid money market funds, U.S. Treasury bills, U.S. agency securities, non-U.S. government securities, and corporate debt securities and commercial paper with contractual maturities of less than two years . These investments are classified as available-for-sale debt securities, which are recorded at fair value based on quoted prices in active markets for Level 1 assets, and based on market pricing and other observable market inputs for similar securities for Level 2 assets. We classify our investments maturing within one year of the reporting date as short-term investments.
If the estimated fair value of a debt security is below its amortized cost basis, we evaluate whether it is more likely than not that we will sell the security before its anticipated recovery in market value and whether credit losses exist for the related securities. A credit loss exists if the present value of expected cash flows is less than the amortized cost basis of the
F-8
ALPINE IMMUNE SCIENCES, INC.
NOTES TO CONSOLIDATED FINANCIAL STATEMENTS (CONTINUED)
security. Credit-related losses are recognized as an allowance for credit losses on the balance sheet with a corresponding adjustment to earnings. Unrealized gains and losses that are unrelated to credit deterioration are reported in other comprehensive income (loss). Purchase premiums and discounts are recognized within interest income using the interest method over the terms of the securities. Realized gains and losses and declines in fair value for these investments deemed to be expected credit losses are reflected in our Consolidated Statements of Operations and Comprehensive Income (Loss) using the specific-identification method.
Property and Equipment
Property and equipment are stated at cost, net of accumulated depreciation. Depreciation is recorded using the straight-line method over the estimated useful lives of the assets, generally to five years , while leasehold improvements are amortized over the shorter of their estimated useful lives or the related lease term. Upon retirement or sale, the cost of assets disposed of and the related accumulated depreciation are removed from the accounts and any resulting gain or loss is reflected in other income (expense) at the time of disposition. Maintenance and repairs are expensed as incurred. Major improvements are capitalized as additions to property and equipment.
Impairment of Long-lived Assets
We evaluate our long-lived tangible assets for impairment whenever events or changes in circumstances indicate that the carrying amount of such assets may not be fully recoverable. When such events occur, we assess recoverability by comparing the asset's carrying value to the total undiscounted future cash flows the asset is expected to generate. If the carrying value exceeds the amount of undiscounted cash flows, we then measure impairment by reducing the carrying value to the assets estimated fair value. We did not record any impairments in the years ended December 31, 2023, 2022 or 2021.
Accrued Liabilities
As part of the process of preparing our consolidated financial statements, we are required to estimate accruals for professional services and research and development expenses. This process involves reviewing contracts and vendor agreements and communicating with applicable personnel to identify services that have been performed on our behalf. We estimate the level of service performed and the associated cost incurred for the service when we have not yet been invoiced or otherwise notified of the actual cost. We estimate accrued liabilities as of each balance sheet date based on known facts and circumstances.
Although we do not expect our estimates to be materially different from amounts actually incurred, if our estimates of the status and timing of services performed differ from the actual status and timing of services performed, we may report amounts that are too high or too low in any particular period. To date, we have not experienced any significant adjustments to our estimates.
Leases
Derivative Financial Instruments
We evaluate all of our financial instruments, including prefunded warrants and warrants to purchase common stock, to determine if such instruments are derivatives or contain features qualifying as embedded derivatives. For derivative financial instruments accounted for as liabilities, the derivative instrument is initially recorded at its fair value and is then re-valued at each reporting date, with changes in the fair value reported in the Consolidated Statements of Operations and Comprehensive Income (Loss). We use the Black-Scholes option-pricing model to value the derivative instruments at inception and subsequent valuation dates. The classification of derivative instruments, including whether such instruments should be recorded as
F-9
ALPINE IMMUNE SCIENCES, INC.
NOTES TO CONSOLIDATED FINANCIAL STATEMENTS (CONTINUED)
liabilities or as equity, is reassessed at the end of each reporting period. We do not use derivative instruments to hedge exposures to cash flow, market or foreign currency risks.
Revenue Recognition
Revenue is recognized when control of the promised goods or services is transferred to our customers, in an amount that reflects the consideration we expect to be entitled to in exchange for those goods or services. Our steps for recognizing revenue consist of (1) identifying the contract; (2) identifying the performance obligations as either distinct or bundled goods and services; (3) determining the transaction price associated with each performance obligation for which we expect to be entitled in exchange for transferring such goods and services; (4) allocating the transaction price to the performance obligations in the contract; and (5) recognizing revenue upon satisfaction of performance obligations.
Our collaboration agreements principally contain multiple performance obligations, which may include (1) grants of, or options to obtain, intellectual property licenses; (2) research and development services; and/or (3) manufacturing or supply services. Payments received under these arrangements typically include one or more of the following: non-refundable upfront license fees, option exercise fees, payment for research and/or development efforts, amounts due upon the achievement of specified objectives, and/or royalties on future product sales. Our revenue is primarily derived from our collaboration agreements with Adaptimmune Therapeutics plc (“Adaptimmune”), AbbVie Ireland Unlimited Company (“AbbVie”), and Horizon Therapeutics Ireland DAC (acquired by Amgen Inc., or “Amgen,” in October 2023). See further discussion of our collaboration agreements in Note 10.
We allocate revenue to each performance obligation based on its relative stand-alone selling price. We generally determine stand-alone selling prices at the inception of the contract based on our best estimate of what the selling price would be if the deliverable was regularly sold by us on a stand-alone basis. Payments received prior to satisfying the relevant revenue recognition criteria are recorded as deferred revenue in the accompanying Consolidated Balance Sheets and recognized as revenue when the related revenue recognition criteria are met. We recognize revenue under our collaboration agreements by using a cost-based input method to measure progress toward completion of the performance obligation, including employee hours contributed to each performance obligation, and to calculate the corresponding revenue to recognize each period.
Our collaboration agreements provide for non-refundable milestone payments. We recognize revenue that is contingent upon the achievement of a substantive milestone in its entirety in the period in which the milestone is achieved. A milestone is considered substantive when the consideration payable to us for such milestone (1) is consistent with our performance necessary to achieve the milestone or the increase in value to the collaboration resulting from our performance; (2) relates solely to our past performance; and (3) is reasonable relative to all of the other deliverables and payments within the arrangement. In making this assessment, we consider all facts and circumstances relevant to the arrangement, including factors such as the scientific, regulatory, commercial, and other risks that must be overcome to achieve the milestone, the level of effort and investment required to achieve the milestone and whether any portion of the milestone consideration is related to future performance or deliverables.
We review the contributed employee hours and progress towards completion for each performance obligation under our collaboration agreements, and adjust the revenue recognized to reflect changes in assumptions relating to the estimated satisfaction of the performance obligation. Revenue recognition may be accelerated in the event of early termination of programs or if our expectations change. Alternatively, revenue recognition may be decelerated if programs are extended or delayed. While such changes to our estimates have no impact on our reported cash flows, the timing of revenue recorded in future periods could be materially impacted.
Research and Development
Research and development costs are expensed as incurred. Research and development costs include personnel costs, clinical trials, external contract research and development expenses, raw materials, drug product manufacturing costs and allocated overhead – including depreciation, rent and utilities. Research and development costs that are paid in advance of performance are capitalized as a prepaid expense and amortized over the service period as the services are provided.
Stock-based Compensation
Stock-based compensation is recognized for all share-based payments based on the estimated fair value as of the date of grant. The fair value of our stock options is calculated using the Black-Scholes option pricing model, which requires judgmental assumptions including volatility, risk-free interest rate, expected term and dividend yield. The fair value of restricted stock units (“RSUs”) is based on the closing price of our common stock on the award date. Stock-based compensation expense is recognized over the requisite service period of the awards, usually the vesting period, on a straight-line basis. For performance-based awards where the vesting of the options may be accelerated upon the achievement of certain milestones, the
F-10
ALPINE IMMUNE SCIENCES, INC.
NOTES TO CONSOLIDATED FINANCIAL STATEMENTS (CONTINUED)
related stock-based compensation is recognized as expense when it is probable the milestone will be met. We recognize forfeiture of awards as they occur rather than estimating the expected forfeiture rate.
Income Taxes
Income taxes are accounted for using an asset and liability approach that requires the recognition of deferred tax assets and liabilities for the expected future tax consequences of temporary differences between the consolidated financial statement and tax bases of assets and liabilities at the applicable enacted tax rates. We establish a valuation allowance for deferred tax assets if it is more likely than not that these items will expire before we are able to realize their benefits or that future deductibility is uncertain.
Comprehensive Income (Loss)
Comprehensive income (loss) is comprised of net loss and certain changes in equity excluded from net loss. For the years ended December 31, 2023, 2022 and 2021, comprehensive income (loss) consisted of unrealized gains and losses on our investments and unrealized gains and losses on foreign currency translation.
Foreign Currency Translation
Our wholly-owned Australian subsidiary uses the Australian dollar as its functional currency. All assets and liabilities related to this subsidiary are translated using period-end exchange rates, and revenues and expenses are translated at average exchange rates for the year. Translation adjustments are included as components of comprehensive income (loss) in the Consolidated Statements of Operations and Comprehensive Income (Loss).
Recently Issued Accounting Pronouncements
In December 2023, the Financial Accounting Standards Board (“FASB”) issued Accounting Standards Update ("ASU”) 2023-09, Income Taxes (Topic 740): Improvements to Income Tax Disclosures, which requires public entities to disclose disaggregated information about their effective tax rate reconciliation as well as expanded information on income taxes paid by jurisdiction. The disclosure requirements will be applied on a prospective basis, with the option to apply them retrospectively. The standard is effective for annual periods beginning after December 15, 2024, with early adoption permitted. We plan to adopt this guidance for the fiscal year ending December 31, 2025. We are currently evaluating the impact of this new guidance on our disclosure requirements related to the new standard, but do not expect it to have a material impact on our financial condition, results of operations, or cash flows.
In November 2023, the FASB issued ASU 2023-07, Segment Reporting (Topic 280): Improvements to Reportable Segment Disclosures, which requires enhanced segment disclosures. Public entities with a single reporting segment are required to provide all disclosures required by Topic 280. This standard is effective for fiscal years beginning after December 15, 2023, and interim periods within fiscal years beginning after December 15, 2024, with early adoption permitted. The enhanced disclosures are required to be applied retrospectively to all prior periods presented in the financial statements. We plan to adopt this guidance for the fiscal year ending December 31, 2024. We are currently evaluating the impact of this new guidance on our disclosure requirements related to the new standard, but do not expect it to have a material impact on our financial condition, results of operations, or cash flows.
3. Net Loss Per Share
For each period presented, the increase in the number of shares outstanding impacts the comparability of our net loss per share. The net loss per share for the year ended December 31, 2023 reflects the November 2023 issuance of 9,791,832 shares of common stock in an underwritten public offering, including the subsequent partial exercise of the underwriters’ over-allotment option, 919,413 shares of common stock sold under our at-the-market offering in June 2023, and 2,711,389 shares of common stock issued throughout 2023 related to the exercise of warrants. The net loss per share for the year ended December 31, 2022, reflects the issuance of 15,509,282 shares of common stock sold in an underwritten public offering in September 2022, including the subsequent partial exercise of the underwriters’ over-allotment option in October 2022. The net loss per share for the year ended December 31, 2021, reflects 6,489,357 shares of our common stock issued pursuant to a
F-11
ALPINE IMMUNE SCIENCES, INC.
NOTES TO CONSOLIDATED FINANCIAL STATEMENTS (CONTINUED)
private placement financing completed in September 2021 and 951,980 shares of our common stock issued in December 2021 pursuant to a private placement financing with Amgen.
The common stock issuable upon the conversion or exercise of the following dilutive securities has been excluded from the diluted net loss per share calculation because their effect would have been anti-dilutive. Diluted net loss per share, therefore, is the same as basic net loss per share for the periods presented.
| December 31, | |||||||||||||||||
| 2023 | 2022 | 2021 | |||||||||||||||
| Common stock warrants | |||||||||||||||||
| Prefunded warrants to purchase common stock | |||||||||||||||||
| Stock options and RSUs outstanding | |||||||||||||||||
| Total | |||||||||||||||||
4. Cash Equivalents and Investments
The amortized cost and fair value of our cash equivalents and investments are as follows (in thousands):
| December 31, 2023 | |||||||||||||||||||||||
| Amortized Cost | Gross unrealized gains | Gross unrealized losses | Fair market value | ||||||||||||||||||||
| Money market funds | $ | $ | $ | $ | |||||||||||||||||||
| U.S. treasury bills | ( | ||||||||||||||||||||||
| U.S. agency securities | ( | ||||||||||||||||||||||
| Corporate debt securities and commercial paper | ( | ||||||||||||||||||||||
| Total | $ | $ | $ | ( | $ | ||||||||||||||||||
| Classified as: | |||||||||||||||||||||||
| Cash equivalents | $ | ||||||||||||||||||||||
| Short-term investments | |||||||||||||||||||||||
| Long-term investments | |||||||||||||||||||||||
| Total | $ | ||||||||||||||||||||||
| December 31, 2022 | |||||||||||||||||||||||
| Amortized Cost | Gross unrealized gains | Gross unrealized losses | Fair market value | ||||||||||||||||||||
| Money market funds | $ | $ | $ | $ | |||||||||||||||||||
| U.S. treasury bills | ( | ||||||||||||||||||||||
| U.S. agency securities | ( | ||||||||||||||||||||||
| Non-U.S. government securities | ( | ||||||||||||||||||||||
| Corporate debt securities and commercial paper | ( | ||||||||||||||||||||||
| Total | $ | $ | $ | ( | $ | ||||||||||||||||||
| Classified as: | |||||||||||||||||||||||
| Cash equivalents | $ | ||||||||||||||||||||||
| Short-term investments | |||||||||||||||||||||||
| Long-term investments | |||||||||||||||||||||||
| Total | $ | ||||||||||||||||||||||
All investments held as of December 31, 2023 and 2022 were classified as available-for-sale debt securities and consist of highly liquid funds with high credit ratings that, on their date of purchase, had a contractual maturity of two years 33,000 for the year ended December 31, 2023, and zero
F-12
ALPINE IMMUNE SCIENCES, INC.
NOTES TO CONSOLIDATED FINANCIAL STATEMENTS (CONTINUED)
December 31, 2022 and 2021,. There were no
For investments in an unrealized loss position as of the respective balance sheet dates, the following table summarizes the fair value and gross unrealized losses by category, disaggregated by the length of time that individual debt securities have been in a continuous unrealized loss position (in thousands):
| December 31, 2023 | |||||||||||||||||||||||||||||||||||
| Less Than 12 Months | 12 Months or Greater | Total | |||||||||||||||||||||||||||||||||
| Fair Value | Unrealized Losses | Fair Value | Unrealized Losses | Fair Value | Unrealized Losses | ||||||||||||||||||||||||||||||
| U.S. treasury bills | $ | $ | ( | $ | $ | ( | $ | $ | ( | ||||||||||||||||||||||||||
| U.S. agency securities | ( | ( | |||||||||||||||||||||||||||||||||
| Corporate debt securities and commercial paper | ( | ( | |||||||||||||||||||||||||||||||||
| Total | $ | $ | ( | $ | $ | ( | $ | $ | ( | ||||||||||||||||||||||||||
| December 31, 2022 | |||||||||||||||||||||||||||||||||||
| Less Than 12 Months | 12 Months or Greater | Total | |||||||||||||||||||||||||||||||||
| Fair Value | Unrealized Losses | Fair Value | Unrealized Losses | Fair Value | Unrealized Losses | ||||||||||||||||||||||||||||||
| U.S. treasury bills | $ | $ | ( | $ | $ | ( | $ | $ | ( | ||||||||||||||||||||||||||
| U.S. agency securities | ( | ( | |||||||||||||||||||||||||||||||||
| Non-U.S. government securities | ( | ( | ( | ||||||||||||||||||||||||||||||||
| Corporate debt securities and commercial paper | ( | ( | ( | ||||||||||||||||||||||||||||||||
| Total | $ | $ | ( | $ | $ | ( | $ | $ | ( | ||||||||||||||||||||||||||
5. Fair Value Measurements
Cash and cash equivalents, restricted cash, receivables, accounts payable and accrued liabilities, which are recorded at invoiced amount or cost, approximate fair value based on the short-term nature of these financial instruments. Fair value is defined as the exchange price received for an asset or paid to transfer a liability, or an exit price, in the principal or most advantageous market for the asset or liability in an orderly transaction between market participants on the measurement date. Valuation techniques used to measure fair value must maximize the use of observable inputs and minimize the use of unobservable inputs. The three-tier fair value hierarchy, which prioritizes the inputs used in measuring fair value, is as follows:
Level 1: Quoted prices in active markets for identical assets or liabilities.
Level 2: Observable inputs other than Level 1 prices, such as quoted prices for similar assets or liabilities, quoted prices in inactive markets, or other inputs that are observable or can be corroborated by observable market data for substantially the full term of the assets or liabilities.
Level 3: Unobservable inputs supported by little or no market activity and significant to the fair value of the assets or liabilities.
F-13
ALPINE IMMUNE SCIENCES, INC.
NOTES TO CONSOLIDATED FINANCIAL STATEMENTS (CONTINUED)
As of December 31, 2023 and 2022, cash of $3.4 million and $2.4 million, respectively, is excluded from the fair value table below. We had no financial liabilities measured at fair value for the periods presented and the following tables summarize our financial assets measured at fair value on a recurring basis (in thousands):
| Assets: | December 31, 2023 | ||||||||||||||||||||||
| Level 1 | Level 2 | Level 3 | Total | ||||||||||||||||||||
| Money market funds | $ | $ | $ | $ | |||||||||||||||||||
| U.S. treasury bills | |||||||||||||||||||||||
| U.S. agency securities | |||||||||||||||||||||||
| Corporate debt securities and commercial paper | |||||||||||||||||||||||
| Total | $ | $ | $ | $ | |||||||||||||||||||
| Assets: | December 31, 2022 | ||||||||||||||||||||||
| Level 1 | Level 2 | Level 3 | Total | ||||||||||||||||||||
| Money market funds | $ | $ | $ | $ | |||||||||||||||||||
| U.S. treasury bills | |||||||||||||||||||||||
| U.S. agency securities | |||||||||||||||||||||||
| Non-U.S. government securities | |||||||||||||||||||||||
| Corporate debt securities and commercial paper | |||||||||||||||||||||||
| Total | $ | $ | $ | $ | |||||||||||||||||||
Our Level 2 assets consist of U.S. agency securities, non-U.S government securities, corporate debt securities, and commercial paper. We review trading activity and pricing for our available-for-sale securities as of the measurement date. When sufficient quoted pricing for identical securities is not available, we use market pricing and other observable market inputs for similar securities obtained from various third-party data providers. These inputs either represent quoted prices for similar assets in active markets or have been derived from observable market data.
6. Property and Equipment
Property and equipment, net, consists of the following (in thousands):
| December 31, | |||||||||||
| 2023 | 2022 | ||||||||||
| Laboratory equipment | $ | $ | |||||||||
| General equipment and furniture | |||||||||||
| Computer equipment and software | |||||||||||
| Leasehold improvements | |||||||||||
| Property and equipment, at cost | |||||||||||
| Less accumulated depreciation and amortization | ( | ( | |||||||||
| Property and equipment, net | $ | $ | |||||||||
F-14
ALPINE IMMUNE SCIENCES, INC.
NOTES TO CONSOLIDATED FINANCIAL STATEMENTS (CONTINUED)
7. Additional Balance Sheet Information
Prepaid expenses and other current assets consist of the following (in thousands):
| December 31, | |||||||||||
| 2023 | 2022 | ||||||||||
| Prepaid research and development | $ | $ | |||||||||
| Prepaid insurance | |||||||||||
| Prepaid other | |||||||||||
| Other receivables | |||||||||||
| Prepaid expenses and other current assets | $ | $ | |||||||||
Accrued liabilities consist of the following (in thousands):
| December 31, | |||||||||||
| 2023 | 2022 | ||||||||||
| Research and development services | $ | $ | |||||||||
| Employee compensation | |||||||||||
| Legal and professional fees | |||||||||||
| Accrued taxes | |||||||||||
| Accrued other | |||||||||||
| Accrued liabilities | $ | $ | |||||||||
8. Long-term Debt
In August 2019, we entered into an Amended and Restated Loan and Security Agreement (the “Loan Agreement”) with Silicon Valley Bank (“SVB”), pursuant to which SVB agreed to extend term loans to us with an aggregate principal amount of up to $15.0 million (the “Term Loans”). Borrowings under the Loan Agreement consisted of up to three separate tranches. The initial tranche of $5.0 million was funded in August 2019, the second tranche of $5.0 million was funded in March 2020, and we did not draw down the final tranche of $5.0 million, which expired in July 2020.
The Term Loans accrued interest at a floating per annum rate of 0.25 % above the prime rate, subject to a floor of 5.75 %, payable monthly commencing in September 2019. The Term Loans were interest only until September 30, 2020, however, under the Loan Agreement our interest only period automatically extended to June 30, 2021, if we received aggregate new capital of at least $40.0 million no later than June 30, 2020. We met this milestone in June 2020 in conjunction with the execution of our agreement with AbbVie, discussed in detail in Note 10.
In connection with the Loan Agreement, we issued SVB warrants to purchase up to 52,083 shares of our common stock at a price of $4.32 per share, 17,361 shares of which became exercisable in August 2019 after we drew down the initial tranche. In March 2020, after we drew down the second tranche of our Term Loans, an additional 17,361 shares became exercisable. The remaining warrants did not vest and expired upon the expiration of the third tranche of our Term Loans. The fair value of the warrants on the date of issuance for the initial tranche and second tranche was $60,000 and $60,000 , respectively, determined using the Black-Scholes option-pricing model, and was recorded as a component of equity and as a debt discount in our accompanying Consolidated Balance Sheets.
In May 2023, we voluntarily repaid in full the remaining outstanding carrying value of $1.4 million of our Term Loans, which consisted of $800,000 in principal and final payments of $625,000 , plus prorated accrued interest. In connection with the debt payoff, we wrote-off the remaining unamortized debt discount. As of December 31, 2023, we had no remaining balance outstanding under our Loan Agreement with SVB.
F-15
ALPINE IMMUNE SCIENCES, INC.
NOTES TO CONSOLIDATED FINANCIAL STATEMENTS (CONTINUED)
9. Commitments and Contingencies
Operating Leases
In March 2019, we entered into a lease for office and laboratory space located at 188 East Blaine Street, Seattle, Washington. The term of the lease is 10.8 years with one option to extend the term by 5.0 years. Our option to extend the rental term of our lease was not considered reasonably certain as of December 31, 2023. The lease term commenced in June 2019. The “Rent Commencement Date” began in March 2020, nine months after the commencement date. The annual base rent under the lease is $1.7 million for the first year and will increase by 3.0 % each year thereafter. We were not required to pay base rent from the Rent Commencement Date through November 2020, the last day of the ninth month following the Rent Commencement Date. We received a tenant improvement allowance of $5.4 million, which is included in our base rent, and a maximum additional tenant improvement allowance of $1.8 million, which will result in additional rent amortized over the term of the lease at an annual rate of 8.0 %. The lease also requires us to pay additional amounts for operating and maintenance expenses. In connection with the lease, we have provided to our landlord a $254,000 letter of credit as a security deposit, which is recorded as noncurrent restricted cash in our accompanying Consolidated Balance Sheets.
As of December 31, 2023, our operating lease right-of-use assets and operating lease liability associated with our lease were $7.5 million and $9.9 million, respectively.
Supplemental operating lease information is as follows (in thousands):
| Years Ended December 31, | |||||||||||||||||
| 2023 | 2022 | 2021 | |||||||||||||||
| Operating lease cost | $ | $ | $ | ||||||||||||||
| Variable lease cost | |||||||||||||||||
| Total lease cost | $ | $ | $ | ||||||||||||||
| Other information: | |||||||||||||||||
| Cash paid for amounts included in the measurement of lease liabilities | $ | $ | $ | ||||||||||||||
| Weighted-average remaining lease term (years) | |||||||||||||||||
| Weighted-average discount rate | |||||||||||||||||
Variable lease costs represent our share of the landlord’s operating expenses. We do not act as a lessor or have any leases classified as financing leases.
Maturities of our operating lease liabilities as of December 31, 2023, are as follows (in thousands):
| Minimum Lease Payments | |||||
| 2024 | $ | ||||
| 2025 | |||||
| 2026 | |||||
| 2027 | |||||
2028 | |||||
| Thereafter | |||||
| Total future minimum lease payments | |||||
| Less: imputed interest | ( | ||||
| Operating lease liabilities | $ | ||||
Contingencies
Certain credits received related to our research and development expenditures, which were previously recorded within other income within our Consolidated Statements of Operations and Comprehensive Income (Loss), were subject to review by foreign taxing authorities. We reached constructive agreement with the Australian Taxation Office (the “ATO”) during 2022 and recorded an estimated current foreign income tax provision of $1.3 million for the expected repayments, of which we paid $590,000 and $543,000 during the years December 31, 2023, and 2022, respectively. In 2023, the remaining balance of $136,000 was fully offset by research and development tax credits by the ATO, which were recorded within other income in
F-16
ALPINE IMMUNE SCIENCES, INC.
NOTES TO CONSOLIDATED FINANCIAL STATEMENTS (CONTINUED)
our Consolidated Statements of Operations and Comprehensive Income (Loss). As of December 31, 2023, we have no further liabilities associated with the ATO.
10. License and Collaboration Agreements
AbbVie
In June 2020, we entered into an option and license agreement with AbbVie (as amended, the “AbbVie Agreement”) for the development of ALPN-101 (“acazicolcept”). which grants AbbVie an exclusive option to take an exclusive license to acazicolcept (the “License Option”). In December 2023, we and AbbVie amended the AbbVie Agreement (the “AbbVie Amendment”) and agreed to stop enrollment in our global, randomized, double-blind, placebo-controlled Phase 2 study of acazicolcept in adults with moderate-to-severe SLE (“Synergy”) to allow for an early assessment of the study’s clinical trial data. Currently enrolled patients will be allowed to complete their study treatment protocol. Amended payment terms are discussed below.
Under the AbbVie Agreement, the License Option is exercisable by AbbVie at any time and will expire 90 days from the delivery of an agreed-upon data package by us to AbbVie. If AbbVie exercises the License Option, AbbVie will take over the future development and commercialization. Prior to the exercise of the License Option, we will perform research and development services, including completing our remaining deliverables under the Synergy study, based on an agreed-upon development plan (the “Development Plan”). We are fully responsible for all costs incurred to conduct the activities under the Development Plan, provided that, AbbVie may be responsible for increased costs under the Development Plan in connection with certain material amendments, if proposed by AbbVie. We are also responsible, at our sole cost and expense, for manufacturing and regulatory filings for acazicolcept necessary to complete activities under the Development Plan.
In June 2020, in connection with the execution of the AbbVie Agreement, AbbVie paid us a nonrefundable upfront payment of $60.0 million. Prior to the exercise of the License Option, AbbVie also agreed to make cash payments upon our achievement of certain development milestones (the “Alpine Development Milestones”) up to an aggregate amount of $75.0 million, of which $45.0 million was achieved in 2021, and the remaining $30.0 million was removed under the AbbVie Amendment. If AbbVie exercises the License Option, they will pay a one -time cash payment of $10.0 million (reduced from $75.0 million under the AbbVie Agreement). Following the exercise of the License Option, AbbVie has furthermore agreed to make aggregate cash payments per the AbbVie Amendment of up to $153.8 million upon AbbVie’s achievement of certain development and commercial milestones and additional aggregate cash payments of up to $337.5 million upon AbbVie’s achievement of certain sales-based cash milestones, collectively referred to as the “AbbVie Milestones”. Lastly, subsequent to commercialization, we are also eligible to receive mid-single-digit percentage royalties on worldwide net sales of licensed products.
For revenue recognition purposes, we determined that our contractual promises in the AbbVie Agreement are not distinct and are interdependent with our performance obligation to provide research and development services under the Development Plan. Thus, all contractual promises related to the upfront payment and Alpine’s Development Milestones were combined into a single performance obligation. We determined the Alpine Development Milestone payments are probable of significant revenue reversal as the achievement is highly dependent on factors outside our control. Therefore, these milestone payments were fully constrained and were not initially included in the transaction price. In June 2021, we re-evaluated and updated the transaction price to include the achieved portion of the Alpine Development Milestones. We will continue to re-evaluate the transaction price each reporting period and update as uncertain events are resolved or other changes in circumstances occur. We expect to recognize the remaining deferred revenue over the remaining life of the Development Plan, which began in June 2020 and ends upon the later of the exercise or expiration of the option.
The License Option and the AbbVie Milestones were determined not to be performance obligations at the inception of the contract as they did not represent material rights. If exercised, the License Option and AbbVie Milestones will be accounted for as a separate contract and will be recognized as revenue if and when triggered. Any consideration related to sales-based royalties and profit-sharing payments will be recognized when the related sales occur.
F-17
ALPINE IMMUNE SCIENCES, INC.
NOTES TO CONSOLIDATED FINANCIAL STATEMENTS (CONTINUED)
Amgen
In December 2021, we entered into an exclusive license and collaboration agreement with Amgen (the “Amgen Agreement”) for the development, manufacture, and commercialization of up to four preclinical candidates generated from our unique discovery platform. The agreement includes licensing of one of our existing preclinical biologic therapeutic programs (the “Existing Program”), as well as a research partnership to jointly develop candidates for up to three additional autoimmune and inflammatory disease programs for other designated biological targets (the “Research Programs”). These candidates include previously undisclosed multi-specific fusion protein-based therapeutic candidates for autoimmune and inflammatory diseases. We will advance candidate molecules to predefined preclinical milestones while Amgen will be responsible for the respective costs and, ultimately, Amgen will assume responsibility for development and commercialization activities and costs.
In connection with the execution of the Amgen Agreement in December 2021, we entered into a stock purchase agreement under which Amgen purchased 951,980 shares of our common stock in a private placement for approximately $15.76 per share and aggregate proceeds of $15.0 million. The shares were sold at a 25 % premium to the volume-weighted average share price of our common stock for a specified 30-day period prior to entering into the agreement. The fair value of the common stock issued to Amgen of $11.9 million was recorded to equity, based on the closing price of common stock on the effective date of the Amgen Agreement. For accounting purposes, the $3.1 million difference between the cash proceeds and the fair value of the common stock was treated as additional consideration attributable to the Amgen Agreement. Under the terms of the agreement, Amgen also paid us a non-refundable upfront payment of $25.0 million in the first quarter of 2022.
As of December 31, 2023, we have completed our activities under the Existing Program. We continue to support activities related to the First Research Program. In January 2024, we received a termination notification from Amgen for the non-exclusive license to use the Second Research Program. A Third Research Program was not selected by the respective option deadline.
In addition, we are eligible to receive up to $381.0 million per program, or a total of approximately $762.0 million for the remaining programs, in future success-based payments related to development, regulatory and commercial milestones. Furthermore, we are eligible to receive tiered royalties from a mid-single digit percentage to a low double-digit percentage on global net sales. In addition to proceeds from the non-refundable upfront payment, we have recognized $2.1 million in research and development support provided by us through December 31, 2023.
For revenue recognition purposes, we determined the transaction price at inception was $28.1 million, which consists of the upfront payment of $25.0 million and the $3.1 million premium on the stock purchase, and that the Existing Program and each Research Program are distinct performance obligations. We allocated revenue to each performance obligation based on its relative stand-alone selling price. The future success-based payments related to development and regulatory milestones are probable of significant revenue reversal as the achievement is highly dependent on factors outside our control. Therefore, these milestone payments are fully constrained and are not initially included in the transaction price. We will continue to re-evaluate the transaction price each reporting period and update as uncertain events are resolved or other changes in circumstances occur. Any consideration related to commercial milestones and royalties will be recognized when the related sales occur.
Adaptimmune
In May 2019, we entered into a collaboration and licensing agreement with Adaptimmune (the “Adaptimmune Agreement”) to develop next-generation SPEAR T cell products. Under this agreement, we performed certain research services and granted Adaptimmune a worldwide exclusive license to programs from our secreted immunomodulatory protein and transmembrane immunomodulatory protein technologies.
Through December 31, 2023, we have recorded a total of $3.0 million in license payments under the terms of the Adaptimmune Agreement, consisting of a $2.0 million upfront license payment received in June 2019, and an additional $1.0 million license fee upon Adaptimmune’s selection of an additional research program in June 2022. Furthermore, through December 31, 2023, we have recorded $2.1 million in research support payments received in connection with research services completed by us. If respective pre-specified milestones for each of the two active research programs are achieved, we are eligible for downstream development and commercialization milestones of up to an aggregate amount of $105.0 million, and we are also eligible to receive low-single digit percentage royalties on worldwide net sales of the applicable products.
Contract balances and revenue recognition
We report contract assets resulting from unconditional rights to consideration related to upfront payments, and for completed but unpaid research and development services within accounts receivable in our accompanying Consolidated Balance Sheets. Contract liabilities, representing advance consideration for licensing rights bundled with research and development services and other promises for which the underlying performance obligations have not yet been satisfied, are
F-18
ALPINE IMMUNE SCIENCES, INC.
NOTES TO CONSOLIDATED FINANCIAL STATEMENTS (CONTINUED)
reported as deferred revenue in our accompanying Consolidated Balance Sheets. Contract liabilities are presented as current and noncurrent based on estimated timing of when the underlying performance obligations will be met. Respective balances are as follows (in thousands):
| December 31, | |||||||||||
| 2023 | 2022 | ||||||||||
| Contract Assets | $ | $ | |||||||||
| Contract Liabilities | $ | $ | |||||||||
We use cost-based input methods to measure progress towards completion of our performance obligations and to calculate the corresponding revenue to recognize under our contracts with customers each period. In applying the cost-based input, we use actual costs incurred relative to budgeted costs for each combined performance obligation. Actual costs consist primarily of labor related to internal personnel, and third-party contracts. Revenue is recognized based on the percentage of costs incurred relative to the total estimated costs for the performance obligation. A cost-based input method of revenue recognition requires management to estimate the costs to complete our performance obligations. In making such estimates, significant judgment is required to evaluate assumptions related to cost estimates. The cumulative effect of revisions to estimated costs to complete our performance obligations will be recorded in the period in which changes are identified and amounts can be reasonably estimated. A significant change in these assumptions and estimates could have a material impact on the timing and amount of revenue recognized in future periods.
Collaboration revenue recognized in our accompanying Consolidated Statements of Operations and Comprehensive Income (Loss), disaggregated by customer, is as follows (in thousands):
| Years Ended December 31, | |||||||||||||||||
| 2023 | 2022 | 2021 | |||||||||||||||
| AbbVie | $ | $ | $ | ||||||||||||||
| Amgen | |||||||||||||||||
| Adaptimmune | |||||||||||||||||
| Total collaboration revenue | $ | $ | $ | ||||||||||||||
Revenue recognized during the period that was included in the opening contract liability balance was $57.5 million, $28.2 million and $23.4 million for the years ended December 31, 2023, 2022 and 2021, respectively. For 2023, the decrease in the contract liability balance includes a cumulative catch-up adjustment of $20.4 million recognized upon the contract modification related to the AbbVie Amendment, which resulted in downward revision of the projected program duration and a corresponding decrease in total direct and indirect development costs to complete the program, and $6.7 million in revenue recognized under the Amgen Agreement upon expiration of Amgen’s option to select an additional Third Research Program. For 2022, the change in the contract liability balance for AbbVie was reduced by a cumulative catch-up adjustment related to upward revisions to the projected program duration and corresponding increase in estimated total direct and indirect development costs to complete the program.
11. Stockholders’ Equity
Common Stock
Shares of common stock reserved for future issuance were as follows:
| December 31, | |||||||||||
| 2023 | 2022 | ||||||||||
| Shares to be issued upon exercise of outstanding stock options | |||||||||||
| Shares to be issued upon release of RSUs | |||||||||||
| Shares to be issued upon conversion of common stock warrants | |||||||||||
| Shares to be issued upon conversion of prefunded warrants | |||||||||||
| Shares available for future stock grants | |||||||||||
| Shares to be issued under employee stock purchase plan | |||||||||||
| Shares of common stock reserved for future issuance | |||||||||||
F-19
ALPINE IMMUNE SCIENCES, INC.
NOTES TO CONSOLIDATED FINANCIAL STATEMENTS (CONTINUED)
Securities Offerings
In November 2023, we sold an aggregate of 9,791,832 shares of our common stock (the “2023 Shares”) and prefunded warrants to purchase 3,200,000 shares of common stock (the “2023 Prefunded Warrants”) in an underwritten public offering, including the subsequent partial exercise of the underwriters’ over-allotment option, pursuant to our effective shelf registration statement on Form S-3 (File No. 333-271517). The purchase price for each 2023 Share and 2023 Prefunded Warrant was $12.50 and $12.499 per share, respectively, for an aggregate purchase price of $162.4 million. The 2023 Prefunded Warrants became fully exercisable upon the closing date and have an exercise price of $0.001 per share. In connection with this offering, we received net proceeds of $152.2 million after deducting underwriting discounts, commissions and offering costs. Offering costs of $440,000 were netted against the proceeds within additional-paid-in-capital on our accompanying Consolidated Balance Sheets.
In September 2022, we sold an aggregate of 15,509,282 shares of our common stock in an underwritten public offering, including the subsequent partial exercise of the underwriters’ over-allotment option in October 2022, pursuant to our effective shelf registration statement on Form S-3 (File No. 333-256107). We received resulting net proceeds of $106.7 million after deducting underwriting discounts, commissions and offering costs. Offering costs of $438,000 were netted against the proceeds within additional-paid-in-capital on our accompanying Consolidated Balance Sheets.
In September 2021, we entered into a securities purchase agreement (the “2021 Securities Purchase Agreement”) for a private placement with a select group of institutional investors, pursuant to which we sold 6,489,357 shares of our common stock (the “2021 Shares”) and prefunded warrants to purchase 3,191,487 shares of common stock (the “2021 Prefunded Warrants”). The purchase price for each 2021 Share and for each 2021 Prefunded Warrant was $9.40 per share, for an aggregate purchase price of approximately $91.0 million. The 2021 Prefunded Warrants became fully exercisable upon the closing date and have an exercise price of $0.001 per share. We incurred $266,000 in offering costs associated with the 2021 Securities Purchase Agreement, which was netted against the proceeds within additional-paid-in-capital on our accompanying Consolidated Balance Sheets.
The securities sold and issued under the 2021 Securities Purchase Agreement have not been registered under the Securities Act of 1933, as amended, or state securities laws and may not be offered or sold in the United States absent registration with the SEC or an applicable exemption from such registration requirements. We filed a registration statement for the 2021 Securities Purchase Agreement with the SEC, which was declared effective by the SEC in November 2021 and covers the resale of the shares of common stock issuable in connection with the private placements and upon exercise of the warrants.
In September 2021, we entered into an exchange agreement (the “Exchange Agreement”) with Frazier Life Sciences VIII, L.P. (the “Exchanging Stockholder”), which Exchanging Stockholder is affiliated with a member of our board of directors, pursuant to which we exchanged an aggregate of 1,200,000 shares of common stock held by the Exchanging Stockholder for prefunded warrants (the “Exchange Warrants”) to purchase an aggregate of 1,200,000 shares of common stock. Upon the closing of the exchange, we reclassified 1,200,000 shares of common stock into treasury stock on our accompanying Consolidated Balance Sheets.
Financing Agreements
In April 2023, we entered into a sales agreement (the “2023 Sales Agreement”) with Cowen and Company, LLC (“TD Cowen”) to sell shares of our common stock, from time to time, through an “at-the-market” equity offering for up to $100.0 million in aggregate gross proceeds. TD Cowen will act as the sales agent and will be entitled to compensation for services of up to 3.0 % of the gross sales proceeds from shares sold through TD Cowen under the 2023 Sales Agreement. The shares will be issued pursuant to our shelf registration statement on Form S-3 (File No. 333-271517), which was filed with the SEC on April 28, 2023, and declared effective on May 9, 2023. On May 11, 2023, we filed a final prospectus supplement with the SEC relating to the offer and sale of the shares pursuant to the 2023 Sales Agreement. As of December 31, 2023, we have sold 919,413 shares of common stock under the 2023 Sales Agreement for a price of $10.93 per share. The associated gross proceeds of $10.0 million were recorded net of directly related offering costs of $355,000 within additional-paid-in-capital on our accompanying Consolidated Balance Sheets.
In September 2022, we and TD Cowen mutually terminated our prior sales agreement (the “2021 Sales Agreement”), which we had entered into in July 2021. The 2021 Sales Agreement provided that we may sell shares of our common stock from time to time through an “at-the-market” equity offering for up to $75.0 million in gross cash proceeds, with TD Cowen acting as the sales agent. No common stock was sold under the 2021 Sales Agreement. In connection with the termination of
F-20
ALPINE IMMUNE SCIENCES, INC.
NOTES TO CONSOLIDATED FINANCIAL STATEMENTS (CONTINUED)
the 2021 Sales Agreement, we wrote off $488,000 of deferred offering costs to expense, which were previously included within prepaid expenses and other current assets on our accompanying Consolidated Balance Sheets.
Treasury Shares
In June 2023, we retired 1,250,467 shares of treasury stock, and returned the shares of common stock to the status of authorized but unissued shares.
Warrants
We have issued warrants in connection with our securities offerings, SVB loans, and to certain non-employee professional advisers. Excluding the prefunded warrants we issued in connection with our securities offerings discussed above, the table below summarizes our common stock warrant activity:
| Warrants Outstanding | Weighted- average Exercise Price | Weighted- average Remaining Contract Term (in years) | |||||||||||||||
Outstanding at December 31, 2022 | $ | ||||||||||||||||
| Exercised | ( | ||||||||||||||||
Outstanding and Exercisable at December 31, 2023 | $ | ||||||||||||||||
In January 2024, we issued 1,694,282 shares of common stock and received $17.6 million in proceeds in connection with exercises of 2,309,404 of our common stock warrants. In addition, in February 2024, we issued 3,199,879 shares of common stock in connection with the exercise of 3,200,000 of our prefunded warrants.
Equity Incentive Plans
Our board of directors has approved “inducement” grants, pursuant to Rule 5635(c)(4) of the Nasdaq Listing Rules, which are exempt from registration under the Securities Act of 1933, as amended, pursuant to Section 4(a)(2). In August 2023, we issued an “inducement” option grant to purchase 185,000 shares of our common stock at a per-share exercise price of $13.44 to our Chief Technology Officer. In August 2022, we issued an “inducement” option grant to purchase 160,000 shares of our common stock at a per-share exercise price of $8.38 to our Chief Medical Officer.
In June 2018, our stockholders approved the 2018 Equity Incentive Plan (the “2018 Plan”). Upon adoption, we ceased granting stock awards under the Nivalis Therapeutics, Inc. 2015 Equity Incentive Plan (the “2015 EIP”) and the Amended and Restated 2015 Stock Plan, collectively, the “Legacy Plans”. All shares of common stock subject to awards under the Legacy Plans that expire or terminate without having been exercised in full, or are forfeited to or repurchased by the company, will be added to the 2018 Plan, up to a maximum of 1,972,784 shares.
Under our 2018 Plan we may issue stock options, stock appreciation rights, restricted stock, RSUs or performance shares. As of December 31, 2023, we have only issued stock options and RSUs. Our 2018 Plan provides for an annual increase in the number of shares reserved for issuance equal to the lesser of (1) 5 % of the number of shares of common stock outstanding as of the last day of the preceding calendar year or (2) 1,500,000 . However, our board of directors may act prior to January 1 of a given year to provide that there will be no January 1 increase for such year or that the increase for such year will be a lesser number of shares. On January 1, 2024, a total of 1,500,000 additional shares was automatically added to the shares authorized under the 2018 Plan.
In July 2017, in connection with the merger with Nivalis, we assumed Nivalis’ Employee Stock Purchase Plan (the “ESPP”) and the 2015 EIP. Upon assumption of the ESPP, there were 45,211 shares available for issuance under the ESPP. As of December 31, 2023, we have not activated the ESPP.
Stock options granted to our employees under our equity plans generally vest within four years , and vested options are exercisable from the vest date until ten years after the date of grant. Vesting of certain employee options may be accelerated in the event of a change in control of the Company. We grant stock options to employees with exercise prices equal to the fair value of our common stock on the date of grant. The term of incentive stock options may not exceed ten years from the date of grant.
As of December 31, 2023, a total of 9,616,862 shares of common stock were authorized for issuance under our 2018 Plan and Legacy Plans.
F-21
ALPINE IMMUNE SCIENCES, INC.
NOTES TO CONSOLIDATED FINANCIAL STATEMENTS (CONTINUED)
A summary of stock option activity under our plans is presented below:
| Options Outstanding | Weighted- average Exercise Price (per share) | Weighted- average Remaining Contract Term (in years) | Aggregate Intrinsic Value (in thousands) | ||||||||||||||||||||
Outstanding at December 31, 2022 | $ | ||||||||||||||||||||||
| Granted | $ | ||||||||||||||||||||||
| Exercised | ( | $ | |||||||||||||||||||||
Forfeited | ( | $ | |||||||||||||||||||||
Outstanding at December 31, 2023 | $ | $ | |||||||||||||||||||||
Vested and expected to vest after December 31, 2023 | $ | $ | |||||||||||||||||||||
Exercisable at December 31, 2023 | $ | $ | |||||||||||||||||||||
The aggregate intrinsic value of stock options exercised during the years ended December 31, 2023, 2022 and 2021 was $7.6 million, $1.1 million and $546,000 , respectively. The fair value of stock options vested during the years ended December 31, 2023, 2022 and 2021 was $9.6 million, $8.6 million and $3.4 million, respectively.
A summary of our RSU activity under our plans is presented below:
| Number of Shares | Weighted- Average Grant Date Fair Value (per share) | Weighted- average Remaining Contract Life (in years) | Aggregate Intrinsic Value (in thousands) | ||||||||||||||||||||
Non-vested at December 31, 2022 | $ | ||||||||||||||||||||||
Vested | ( | $ | |||||||||||||||||||||
| Forfeited | ( | $ | |||||||||||||||||||||
Non-vested at December 31, 2023 | $ | $ | |||||||||||||||||||||
The aggregate intrinsic value of RSUs vested during the years ended December 31, 2023 and 2022 was $1.0 million and $527,000 , respectively. The fair value of RSUs vested during the years ended December 31, 2023 and 2022 was $1.4 million and $735,000 , respectively. No RSUs vested during the year ended December 31, 2021.
We utilize newly issued shares to satisfy option exercises and RSU releases. As of December 31, 2023, there was $22.4 million of unrecognized stock-based compensation expense related to approximately 3.6 million nonvested stock options and RSU awards that is expected to be recognized over a weighted-average remaining period of 2.7 years.
Stock-Based Compensation Expense
We use the Black-Scholes option pricing model to estimate the fair value of stock options at the grant date. The fair value of RSUs is equal to the closing stock price on the date of grant. The Black-Scholes option pricing model requires us to make certain estimates and assumptions, including assumptions related to the expected price volatility of our stock, the period during which the options will be outstanding, the rate of return on risk-free investments, and the expected dividend yield of our stock.
The fair values of stock options granted to employees were calculated using the following assumptions:
| Years Ended December 31, | |||||||||||||||||
| 2023 | 2022 | 2021 | |||||||||||||||
| Weighted-average estimated fair value at grant | $ | $ | $ | ||||||||||||||
| Risk-free interest rate (1) | |||||||||||||||||
| Expected term of options (in years) (2) | |||||||||||||||||
| Expected stock price volatility (3) | |||||||||||||||||
| Expected dividend yield (4) | |||||||||||||||||
(1)The risk-free interest rate assumption was based on zero-coupon U.S. Treasury instruments that had terms consistent with the expected term of our stock option grants.
F-22
ALPINE IMMUNE SCIENCES, INC.
NOTES TO CONSOLIDATED FINANCIAL STATEMENTS (CONTINUED)
(2)We used the “simplified method” for options to determine the expected term of stock options granted, since we do not have sufficient historical exercise data to provide a reasonable basis upon which to estimate expected term due to the limited time our shares have been publicly traded. Under this approach, the weighted-average expected life is presumed to be the average of the vesting term and the contractual term of the option.
(3)Volatility is a measure of the amount by which a financial variable, such as share price, has fluctuated or is expected to fluctuate during a period. We analyzed the historical stock price volatility of companies at a similar stage of development to estimate the expected volatility of our stock price.
(4)We have never declared or paid any cash dividends and do not presently plan to pay cash dividends in the foreseeable future.
Stock-based compensation expense is classified in the Consolidated Statements of Operations and Comprehensive Income (Loss) as follows (in thousands):
| Years Ended December 31, | |||||||||||||||||
| 2023 | 2022 | 2021 | |||||||||||||||
| Research and development | $ | $ | $ | ||||||||||||||
| General and administrative | |||||||||||||||||
| Total stock-based compensation expense | $ | $ | $ | ||||||||||||||
12. Income Taxes
Our loss before taxes is derived from domestic (United States) and foreign (Australian) sources as follows (in thousands):
| Years Ended December 31, | |||||||||||||||||
| 2023 | 2022 | 2021 | |||||||||||||||
| Domestic | $ | ( | $ | ( | $ | ( | |||||||||||
| Foreign | ( | ||||||||||||||||
| Total | $ | ( | $ | ( | $ | ( | |||||||||||
The provision for income taxes is composed of the following (in thousands):
| Years Ended December 31, | |||||||||||||||||
| 2023 | 2022 | 2021 | |||||||||||||||
| Current: | |||||||||||||||||
| U.S. - Federal | $ | $ | ( | $ | |||||||||||||
| U.S. - State | ( | ||||||||||||||||
| Foreign | ( | ( | |||||||||||||||
| Total current | ( | ( | |||||||||||||||
| Deferred: | |||||||||||||||||
| Foreign | ( | ( | |||||||||||||||
| Total deferred | ( | ( | |||||||||||||||
Total income tax (expense) benefit | $ | ( | $ | ( | $ | ||||||||||||
F-23
ALPINE IMMUNE SCIENCES, INC.
NOTES TO CONSOLIDATED FINANCIAL STATEMENTS (CONTINUED)
The effective tax rate of the provision for income taxes differs from the federal statutory rate as follows:
| Years Ended December 31, | |||||||||||||||||
| 2023 | 2022 | 2021 | |||||||||||||||
| U.S. Statutory rate | % | % | % | ||||||||||||||
| Effect of: | |||||||||||||||||
| State taxes (net of federal benefit) | % | % | % | ||||||||||||||
| Permanent differences | % | % | ( | % | |||||||||||||
| Federal research and development credit | % | % | % | ||||||||||||||
| Change in valuation allowance | ( | % | ( | % | ( | % | |||||||||||
| Global intangible low-taxed income recapture | % | ( | % | ( | % | ||||||||||||
| Stock-based compensation | ( | % | ( | % | ( | % | |||||||||||
| Foreign rate differential | ( | % | % | % | |||||||||||||
| Other | ( | % | % | ( | % | ||||||||||||
| Voluntary disclosure net change in prior years’ tax liabilities | % | % | % | ||||||||||||||
| Effective income tax rate | ( | % | ( | % | % | ||||||||||||
For the year ended December 31, 2023, tax expense of $103,000 primarily represents deferred tax expense from the application of a full valuation allowance against our remaining foreign deferred tax assets, partially offset by the recognition of current income tax benefits resulting from the finalization of our prior period tax returns.
For the year ended December 31, 2022, $1.0 million of our tax expense represents the recognition of current domestic federal and state income tax liabilities, which was a result of the mandatory capitalization of research and development expenses under Internal Revenue Code (the “IRC”) Section 174. As part of the Tax Cuts and Jobs Act of 2017, beginning with the 2022 tax year, expenses that are incurred for research and development in the U.S. will be capitalized and amortized over five years , and expenses that are incurred for research and experimentation outside the U.S. will be capitalized and amortized over 15 years.
For the year ended December 31, 2022, $1.3 million of our tax expense represents the recognition of current tax liabilities, which were the result of a cumulative change to our foreign income tax provision for the activities of Alpine Immune Sciences Australia PTY LTD. In June 2022, Alpine Immune Sciences Australia PTY LTD’s was notified that the tax return filed under a revised transfer pricing model was accepted for the six-month period ended December 31, 2019. Following the acceptance notification, the tax provisions for each open tax year have been recalculated using the same transfer pricing methodology underlying the accepted return. Additionally, consistent with the change to our transfer pricing methodology, we recorded $48,000 of deferred tax expense resulting from a reduction to our deferred tax assets for the year ended December 31, 2022.
The $87,000 tax benefit for the year ended December 31, 2021, represents deferred tax benefits resulting from the finalization of our prior-period tax returns and the removal of the valuation allowance in place against our foreign deferred tax assets, partially offset by income tax expense for current year activity.
For the years ended December 31, 2023, 2022, and 2021, the difference between the U.S. federal statutory tax rate of 21% and our effective tax rates in all periods is primarily due to changes in our valuation allowance related to our deferred tax assets and the generation and consumption of federal research and development tax credits. We have elected to treat taxes due on future U.S. inclusions in taxable income under the global intangible low-taxed income (the “GILTI”) provision as a current-period expense when incurred. As such, expected future GILTI inclusions have not been factored into the measurement of our deferred taxes.
Deferred income taxes reflect the net tax effects of temporary differences between the carrying amounts of assets and liabilities for financial reporting purposes and the amounts used for income tax purposes. The following table represents the
F-24
ALPINE IMMUNE SCIENCES, INC.
NOTES TO CONSOLIDATED FINANCIAL STATEMENTS (CONTINUED)
significant components of our deferred tax assets and liabilities for the periods presented (in thousands):
| December 31, | |||||||||||
| 2023 | 2022 | ||||||||||
| Deferred tax assets: | |||||||||||
| Net operating loss | $ | $ | |||||||||
| Research and development credits | |||||||||||
| Intangible asset basis | |||||||||||
| Lease liability | |||||||||||
| Deferred revenue | |||||||||||
| Stock based compensation | |||||||||||
| Capitalized research and experimental costs | |||||||||||
| Other | |||||||||||
| Gross deferred tax assets | |||||||||||
| Valuation allowance | ( | ( | |||||||||
| Total deferred tax assets, net of valuation allowance | |||||||||||
| Deferred tax liabilities: | |||||||||||
| Prepaid expenses | ( | ( | |||||||||
| Fixed asset basis | ( | ( | |||||||||
| Right-of-use asset basis | ( | ( | |||||||||
| Total deferred tax liability | ( | ( | |||||||||
| Net deferred tax assets and liabilities | $ | $ | |||||||||
A valuation allowance is provided for deferred tax assets where the recoverability of the assets is uncertain. The determination to provide a valuation allowance is dependent upon the assessment of whether it is more likely than not that sufficient taxable income will be generated to utilize the deferred tax assets. For the year ended December 31, 2023, we determined that based on an evaluation of our sources of income and all available evidence, both positive and negative, including our latest forecasts and cumulative losses in recent years, it was more likely than not that none of our domestic deferred tax assets would be realized and therefore we continued to record a full valuation allowance. For the year ended December 31, 2023, we determined that it was more likely than not that none of our foreign deferred tax assets would be realized. As such, we have recorded a full valuation allowance against all foreign deferred tax assets. The valuation allowance increased by $9.1 million and $16.1 million during the years ended December 31, 2023 and 2022, respectively.
We have net operating loss (“NOL”) carryforwards as follows (in thousands):
| December 31, | |||||||||||
| 2023 | 2022 | ||||||||||
| Federal (after January 1, 2018) | $ | $ | |||||||||
| State | $ | $ | |||||||||
Federal NOL carryforwards created after January 1, 2018, carry forward indefinitely, and our state NOL carryforwards begin to expire in 2038.
We have net research and development tax credit carryforwards as follows (in thousands):
| December 31, | |||||||||||
| 2023 | 2022 | ||||||||||
| Federal | $ | $ | |||||||||
| Foreign | $ | $ | |||||||||
Federal research and development tax credit carryforwards begin to expire in 2035, and our foreign research and development tax credits carry forward indefinitely.
Current tax laws impose substantial restrictions on the utilization of research and development credit and NOL carryforwards in the event of an ownership change, as defined by the IRC Section 382 and 383. Such an event may limit our ability to utilize NOLs and research and development tax credit carryforwards. We have commissioned Section 382 studies, focused on AIS Operating Co., Inc., evaluating changes in ownership for periods from inception through December 31, 2023. We concluded that we experienced ownership changes on June 10, 2016, and September 17, 2021, and as a result, our ability to
F-25
ALPINE IMMUNE SCIENCES, INC.
NOTES TO CONSOLIDATED FINANCIAL STATEMENTS (CONTINUED)
use research and development tax credit and NOL carryforwards created prior to September 17, 2021, has been limited. We have incorporated the resulting limitations into our provision for income taxes for the years ended December 31, 2023 and 2022. Though limited in the amount which can be utilized for the year ended December 31, 2023, and annually thereafter, the restrictions do not definitively prevent the impacted research and development tax credit carryforwards from utilization in future years and before expiration. As such, we have not reduced our research and development tax credit carryforwards as of December 31, 2023.
Additionally, under IRC Section 382 and 383, the 2017 merger with Nivalis is likely considered an ownership change with respect to the potential limitation of the Nivalis federal tax credits and NOLs. As such, it is likely that any future utilization of Nivalis federal tax credits and NOLs is substantially limited. Therefore, as of December 31, 2018, all Nivalis tax credit and NOL carryforwards have been reduced to zero .
We account for uncertainty in income taxes in accordance with ASC 740, Income Taxes. Tax positions are evaluated in a two-step process, whereby we first determine whether it is more likely than not that a tax position will be sustained upon examination by the tax authority, including resolutions of any related appeals or litigation processes, based on technical merit. If a tax position meets the more-likely-than-not recognition threshold it is then measured to determine the amount of benefit to recognize in the financial statements. The tax position is measured as the largest amount of benefit that is greater than 50% likely of being realized upon ultimate settlement.
The following table summarizes the activity related to unrecognized tax benefits (in thousands):
| Years Ended December 31, | |||||||||||||||||
| 2023 | 2022 | 2021 | |||||||||||||||
| Unrecognized benefits – beginning of year | $ | $ | $ | ||||||||||||||
| Gross increases (decreases) – prior year tax positions | ( | ||||||||||||||||
| Gross increases – current year tax positions | |||||||||||||||||
| Unrecognized benefit – end of year | $ | $ | $ | ||||||||||||||
All of the unrecognized tax benefits as of December 31, 2023, are accounted for as a reduction in our deferred tax assets. Due to our valuation allowance, none of the $2.9 million of unrecognized tax benefits would affect our effective tax rate, if recognized. We do not expect any significant change in our unrecognized tax benefits during the next twelve months.
We recognize interest and penalties related to unrecognized tax benefits as income tax expense. There were no
Our material income tax jurisdictions are the United States (federal), California (state), and Australia (foreign). We are subject to audit for tax years 2012 and forward for federal purposes, 2017 and forward for California purposes, and 2019 and forward for foreign purposes.
13. Related Party Transactions
In February 2024, certain of our stockholders whose beneficial ownership exceeded 5 %, exercised 3,200,000 prefunded warrants pursuant to a net exercise mechanism under the warrants.
In January 2024, certain of our affiliates or stockholders whose beneficial ownership exceeded 5 %, exercised 1,379,887 common stock warrants for proceeds of $17.6 million.
In December 2023, certain of our affiliates or stockholders whose beneficial ownership exceeded 5 % exercised 219,692 common stock warrants for proceeds of $1.9 million.
14. 401(k) Retirement Plan
We have adopted a 401(k) defined contribution retirement savings plan. All employees are eligible to participate, provided they meet the requirements of the plan. Beginning in 2022, we started offering employer 401(k) matching contributions at our discretion subject to annually determined limits. The expense recognized related to the employer matching
F-26
ALPINE IMMUNE SCIENCES, INC.
NOTES TO CONSOLIDATED FINANCIAL STATEMENTS (CONTINUED)
F-27