UNITED STATES
SECURITIES AND EXCHANGE COMMISSION
SECURITIES AND EXCHANGE COMMISSION
Washington, D.C. 20549
FORM 10-K
| ANNUAL REPORT PURSUANT TO SECTION 13 OR 15(d) OF THE SECURITIES EXCHANGE ACT OF 1934 | |||||
For the fiscal year ended December 31 , 2023
OR
| TRANSITION REPORT PURSUANT TO SECTION 13 OR 15(d) OF THE SECURITIES EXCHANGE ACT OF 1934 | |||||
For transition period from to
Commission File Number: 001-40136
(Exact name of registrant as specified in its charter)
| (State or other jurisdiction of incorporation or organization) | (I.R.S. Employer Identification No.) | |||||||
(Address of principal executive offices) (Zip Code)
(212 ) 255-6200
(Registrant’s telephone number, including area code)
Securities registered pursuant to Section 12(b) of the Act:
| Title of each class | Trading Symbol(s) | Name of each exchange on which registered | ||||||
Securities registered pursuant to Section 12(g) of the Act: None.
Indicate by check mark if the registrant is a well-known seasoned issuer, as defined in Rule 405 of the Securities Act. Yes ☐ No ☒
Indicate by check mark if the registrant is not required to file reports pursuant to Section 13 or Section 15(d) of the Act. Yes ☐ No ☒
Indicate by check mark whether the Registrant (1) has filed all reports required to be filed by Section 13 or 15 (d) of the Securities Exchange Act of 1934 during the preceding 12 months (or for such shorter period that the Registrant was required to file such reports), and (2) has been subject to such filing requirements for the past 90 days. Yes ☒ No ☐
Indicate by check mark whether the registrant has submitted electronically every Interactive Data File required to be submitted pursuant to Rule 405 of Regulation S-T (§ 232.405 of this chapter) during the preceding 12 months (or for such shorter period that the registrant was required to submit such files). Yes ☒ No ☐
Indicate by check mark whether the registrant is a large accelerated filer, an accelerated filer, a non-accelerated filer, a smaller reporting company, or an emerging growth company. See the definitions of “large accelerated filer,” “accelerated filer,” “smaller reporting company,” and “emerging growth company” in Rule 12b–2 of the Exchange Act.
Large accelerated filer | ☐ | ☒ | |||||||||||||||||||||
Non-accelerated filer | ☐ | Smaller reporting company | Emerging growth company | ||||||||||||||||||||
If an emerging growth company, indicate by check mark if the registrant has elected not to use the extended transition period for complying with any new or revised financial accounting standards provided pursuant to Section 13(a) of the Exchange Act. ☐
Indicate by check mark whether the registrant has filed a report on and attestation to its management’s assessment of
the effectiveness of its internal control over financial reporting under Section 404(b) of the Sarbanes-Oxley Act (15 U.S.C.
7262(b)) by the registered public accounting firm that prepared or issued its audit report. ☒
If securities are registered pursuant to Section 12(b) of the Act, indicate by check mark whether the financial statements of the registrant included in the filing reflect the correction of an error to previously issued financial statements. ☐
Indicate by check mark whether any of those error corrections are restatements that required a recovery analysis of incentive-based compensation received by any of the registrant’s executive officers during the relevant recovery period pursuant to § 240.10D-1(b). ☐
Indicate by check mark whether the registrant is a shell company (as defined in Rule 12b-2 of the Act). Yes ☐ No ☒
The aggregate market value of the voting stock of the registrant held by non‑affiliates was approximately $284,459,116 based on the closing sale price of $16.09 per share on June 30, 2023. For purposes of the foregoing calculation only, all directors and named executive officers of the registrant, Workers United have been deemed affiliates. As of March 6, 2024, the registrant had 30,509,410 shares of common stock outstanding at $0.01 par value per share.
DOCUMENTS INCORPORATED BY REFERENCE
The information required by Part III of this Annual Report on Form 10-K is incorporated by reference from the registrant’s definitive proxy statement relating to the 2024 Annual Meeting of Stockholders, which will be filed with the U.S. Securities and Exchange Commission within 120 days after the end of the fiscal year to which this Annual Report on Form 10-K relates.
1
TABLE OF CONTENTS
Item 1C. | ||||||||
| Item 6. | ||||||||
Item 9. | ||||||||
Item 9A. | ||||||||
Item 9B. | ||||||||
Part III. | ||||||||
Item 10. | Directors, Executive Officers and Corporate Governance | |||||||
Item 11. | Executive Compensation | |||||||
Item 12. | Security Ownership of Certain Beneficial Owners and Management and Related Stockholder Matters | |||||||
Item 13. | Certain Relationships and Related Transactions and Director Independence | |||||||
Item 14. | Principal Accounting Fees and Services | |||||||
Part IV. | ||||||||
Item 15. | Exhibits, Financial Statement Schedules | |||||||
| Item 16. | ||||||||
Signatures. | ||||||||
2
Part I
CAUTIONARY NOTE REGARDING FORWARD-LOOKING STATEMENTS
Statements included in this report that are not historical in nature are intended to be, and are hereby identified as, forward-looking statements for purposes of the safe harbor provided by Section 21E of the Exchange Act. The words “may,” “approximately,” “will,” “anticipate,” “should,” “would,” “believe,” “contemplate,” “expect,” “estimate,” “continue,” “plan,” “possible,” and “intend,” as well as other similar words and expressions of the future, are intended to identify forward-looking statements. These forward-looking statements include, but are not limited to, statements related to our projected growth, anticipated future financial performance, and management’s long-term performance goals, as well as statements relating to the anticipated effects on results of operations and financial condition from expected developments or events, or business and growth strategies, including anticipated internal growth.
These forward-looking statements involve significant risks and uncertainties that could cause our actual results to differ materially from those anticipated in such statements. Potential risks and uncertainties include, but are not limited to, those described under “Risk Factors” and the following:
•uncertain conditions in the banking industry and in national, regional and local economies in our core markets, which may have an adverse impact on our business, operations and financial performance;
•deterioration in the financial condition of borrowers resulting in significant increases in credit losses and provisions for those losses;
•deposit outflows and subsequent declines in liquidity caused by factors that could include lack of confidence in the banking system, a deterioration in market conditions or the financial condition of depositors;
•changes in our deposits, including an increase in uninsured deposits;
•our ability to maintain sufficient liquidity to meet our deposit and debt obligations as they come due, which may require that we sell investment securities at a loss, negatively impacting our net income, earnings and capital;
•unfavorable conditions in the capital markets, which may cause declines in our stock price and the value of our investments;
•continued fluctuation of the interest rate environment, including changes in net interest margin or changes that affect the yield curve on investments;
•the general decline in the real estate and lending markets, particularly in commercial real estate in our market areas, and the effects of the enactment of or changes to rent-control and other similar regulations on multi-family housing;
•changes in legislation, regulation, public policies, or administrative practices impacting the banking industry, including increased minimum capital requirements and other regulation in the aftermath of recent bank failures;
•the outcome of legal or regulatory proceedings that may be instituted against us;
•our inability to achieve organic loan and deposit growth and the composition of that growth;
•the composition of our loan portfolio, including any concentration in industries or sectors that may experience unanticipated or anticipated adverse conditions greater than other industries or sectors in the national or local economies in which we operate;
•inaccuracy of the assumptions and estimates we make and policies that we implement in establishing our allowance for credit losses, including changes in the allowance for credit losses resulting from the adoption and implementation of the Current Expected Credit Loss (“CECL”) methodology;
•changes in loan underwriting, credit review or loss reserve policies associated with economic conditions, examination conclusions, or regulatory developments;
•any matter that would cause us to conclude that there was impairment of any asset, including intangible assets;
•limitations on our ability to declare and pay dividends;
•the impact of competition with other financial institutions, including pricing pressures and the resulting impact on our results, including as a result of compression to net interest margin;
•increased competition for experienced members of the workforce including executives in the banking industry;
•a failure in or breach of our operational or security systems or infrastructure, or those of third party vendors or other service providers, including as a result of unauthorized access, computer viruses, phishing schemes, spam attacks, human error, natural disasters, power loss and other security breaches;
•increased regulatory scrutiny and exposure from the use of “big data” techniques, machine learning, and artificial intelligence;
•a downgrade in our credit rating;
•“greenwashing claims” against us and our Environmental, Social and Governance (“ESG”) products and increased scrutiny and political opposition to ESG and Diversity, Equity and Inclusion (“DEI”) practices;
1
•any unanticipated or greater than anticipated adverse conditions (including the possibility of earthquakes, wildfires, and other natural disasters) affecting the markets in which we operate;
•physical and transitional risks related to climate change as they impact our business and the businesses that we finance;
•future repurchase of our shares through our common stock repurchase program; and
•descriptions of assumptions underlying or relating to any of the foregoing.
All forward-looking statements are necessarily only estimates of future results, and there can be no assurance that actual results will not differ materially from expectations, and, therefore, you are cautioned not to place undue reliance on any forward-looking statements, which should be read in conjunction with the other cautionary statements that are included elsewhere in this report. In particular, you should consider the numerous risks described in Item 1A, “Risk Factors,” for a description of some of the important factors that may affect actual outcomes. Further, any forward-looking statement speaks only as of the date on which it is made and we undertake no obligation to update or revise any forward-looking statement to reflect events or circumstances after the date on which the statement is made or to reflect the occurrence of unanticipated events, unless required to do so under the federal securities laws.
2
Item 1. Business
General Overview
Amalgamated Financial Corp., a Delaware public benefit corporation ("we" or the "Company"), was formed on August 25, 2020 to serve as the holding company for Amalgamated Bank and is a bank holding company registered with the Board of Governors of the Federal Reserve under the Bank Holding Company Act of 1956, as amended. On March 1, 2021 (the “Effective Date”), the Company acquired all of the outstanding stock of Amalgamated Bank, a New York state-chartered commercial bank in a statutory share exchange transaction (the “Reorganization”) effected under New York law and in accordance with the terms of a Plan of Acquisition dated September 4, 2020 (the “Agreement”). Pursuant to the Reorganization, the Bank became the sole subsidiary of the Company, the Company became the holding company for the Bank and the stockholders of the Bank became stockholders of the Company.
The Bank was formed in 1923 as Amalgamated Bank of New York by the Amalgamated Clothing Workers of America, one of the country’s oldest labor unions. Although we are no longer majority union-owned, the Amalgamated Clothing Workers of America’s successor, Workers United, an affiliate of the Service Employees International Union that represents workers in the textile, distribution, food service and gaming industries, remains a significant stockholder, holding approximately 42% of our equity as of December 31, 2023.
We offer a complete suite of commercial and retail banking, investment management and trust and custody services. Our commercial banking and trust businesses are national in scope and we also offer a full range of products and services to both commercial and retail customers through our three branch offices across New York City, one branch office in Washington, D.C., one branch office in San Francisco, one commercial office in Boston and our digital banking platform. Our corporate divisions include Commercial Banking, Trust and Investment Management and Consumer Banking. Our product line includes residential mortgage loans, commercial and industrial ("C&I") loans, commercial real estate ("CRE") loans, multifamily loans, consumer loans (predominantly residential solar) and a variety of commercial and consumer deposit products, including non-interest-bearing accounts, interest-bearing demand products, savings accounts, money market accounts and certificates of deposit. We also offer online banking and bill payment services, online cash management, safe deposit box rentals, debit card and ATM card services, and the availability of a nationwide network of ATMs for our customers.
We currently offer a wide range of trust, custody and investment management services, including asset safekeeping, corporate actions, income collections, proxy services, account transition, asset transfers, and conversion management. We also offer a broad range of investment products, including both index and actively-managed funds spanning equity, fixed-income, real estate and alternative investment strategies to meet the needs of our clients. Our products and services are tailored to our target customer base that prefers a financial partner that is socially responsible, values-oriented and committed to creating positive change in the world. These customers include advocacy-based non-profits, social welfare organizations, national labor unions, political organizations, foundations, socially responsible businesses, and other for-profit companies that seek to balance their profit-making activities with activities that benefit their other stakeholders, as well as the members and stakeholders of these commercial customers.
Our goal is to be the go-to financial partner for people and organizations who strive to make a meaningful impact in our society and who care about their communities, the environment, and social justice. The growth of our business is fundamental to our social mission and how we deliver impact and value for our stakeholders. The Company has obtained B CorporationTM certification, a distinction earned after being evaluated under rigorous standards of social and environmental performance, accountability, and transparency. The Company is also the largest of twelve commercial financial institutions in the United States that are members of the Global Alliance for Banking on Values, a network of banking leaders from around the world committed to advancing positive change in the banking sector. We hold governance positions in the United Nations ("UN") convened Net Zero Banking Alliance and the Global Partnership for Carbon Accounting Financials ("PCAF") and an advisory role for the Glasgow Finance Alliance for Net Zero.
3
Environmental, Social, and Governance Responsibility
We maintain an explicit commitment to the highest corporate social responsibility and ESG standards. Under the direction of our Board of Directors (the "Board") and executive management, we are diligent in fulfilling our mission to be America’s socially responsible bank, empowering organizations and individuals to advance positive social change. This year, the full Board of Directors took the oversight role for our Corporate Social Responsibility, ESG activities and communications from the Executive Committee of the Board. In addition, a formal cross-departmental Corporate Social Responsibility (“CSR”) Committee is comprised of employees and executive leadership responsible for implementing various CSR and ESG policies, strategies, and communications. The CSR Committee is led by the Chief Sustainability Officer and reports quarterly to the Board.
Our business strategy is focused on providing impact banking and lending services to a customer base that cares about how their money is invested. That strategy is rooted in our 100-year history as a bank serving working people, labor unions, nonprofits, foundations, and impact businesses. We believe that there is a growing base of customers who want to entrust their monies with a company that aligns with their values. Our policy is to not lend to, or invest our own money in, (i) fossil fuel companies, (ii) companies that manufacture weapons, (iii) companies that we do not believe support the rights of workers, women, immigrants, or the lesbian, gay, bisexual, transgender, queer or questioning, and more ("LGBTQ+") community, or (iv) companies that take positions that are not aligned with our mission.
We have been an international leader in supporting strong environmental standards, sustainable finance, and responsible and sustainable banking practices. As a founding signatory of the United Nations Principles for Responsible Investing, a founding signatory to the United Nations Principles for Responsible Banking, and a founding member and Steering Group member of the UN Net Zero Banking Alliance, we publicly committed to use finance as a tool to build a more sustainable planet. We have taken several steps to continue our leadership in climate finance. We were one of the first U.S. banks to publish data in accordance with the PCAF and were the first U.S. bank to publish a net zero climate target in accordance with and now validated by the Science Based Targets ("SBTi") methodology. We published our loan portfolio climate targets in October 2021, which built on a 2030 target of 49% reduction in absolute emissions from our 2020 baseline and reaching Net Zero in 2045. As a part of our Net Zero Report we disclosed asset class level targets and transition details.
In calculating the carbon impact of Company operations, we report to the standards of the Greenhouse Gas Protocol and disclose our Scope 1, 2, and 3 emissions, including Scope 3 Category 15 which covers our balance sheet loans and investments as well as our Assets Under Management. Within our operational emission, we measure our Scope 1, Scope 2 and Scope 3 greenhouse gas emissions and purchase carbon offsets for any unavoidable carbon emissions. As part of our net zero climate targets, we are also seeking to reduce our direct or "operational" emissions to net zero by 2030. We are committed to 100% renewable energy across our corporate footprint where available.
In 2023, Amalgamated Bank received recertification by B Labs USA, allowing it to promote itself to clients and the public as a B CorporationTM certified business. The median score of an ordinary business is 50.9, and the 2019 certification gave Amalgamated Bank a score of 115.1. With the 2023 impact score of 155.3, Amalgamated Bank has secured important external validation for our commitment to be America's socially responsible bank.
In 2023, we updated our Supplier Code of Conduct and have onboarded third-party resources to assist in assessing the diversity of vendors and increasing our ability to manage ongoing certification of vendors and compliance with our supplier policies.
Through our institutional investing platform, we regularly engage portfolio companies on climate transition, workplace equity and other material ESG matters. In 2023, as in previous years we have reviewed our portfolio performance with third party vendors to assess areas of particular ESG risk and conduct dedicated engagement with those companies in order to address potential risk to investors. We work with allied investor networks such as the Interfaith Center on Corporate Responsibility, Climate Action 100+ and As You Sow. This work is overseen by the Trust Committee of the Board of Directors and led by the Chief Trust Officer and Chief Sustainability Officer.
Engagement is an important part of our strategy across the Company. We work with lending clients that have positive impacts on environmental and social goals and have begun offering sustainability linked loans with increased environmental attributes. We have strict supplier policies that cover ESG goals and engage with major suppliers on their ESG performance.
Human Capital Management
We have an explicit commitment to strong social and human capital management standards. As of December 31, 2023, approximately 21% of our employees are unionized under a collective bargaining agreement. Employees are aware of our stance
4
in supporting organized labor and workers’ rights. In 2019, we became the first U.S. bank to raise our minimum wage to $20 per hour. Over the course of 2021, we participated in the development of the Living Wage Initiative along with a select group of corporate leaders with strong human capital management track records and have now been certified as a Living Wage Employer. Our Code of Business Conduct and Ethics and Diversity, Equity and Inclusion ("DEI") Plan, informs our efforts for hiring, training, and workplace culture. As of December 31, 2023, 58% of our employees identify as women and 63% of our employees identify as people of color. As of December 31, 2023, women held 17 of 41 senior management positions (which is defined as Senior Vice President and above) and five of 11 executive management positions (which is defined as Executive Vice President and above). Additionally, nine of our 13, or 69%, of Board members identify as women and/or people of color and/or LGBTQ+.
Our employees are engaged through our human capital management and DEI initiatives, which supports their engagement and retention at the Company, as well as the development of new programs and products that further our ESG performance.
Competition
The financial services industry is highly competitive and we compete for loans, deposits, and customer relationships in our geographic markets. We strive to be the bank of choice for socially responsible companies, organizations and individuals working to advance positive social change. Competition involves efforts to retain current customers, make new loans and obtain new deposits, increase the scope and sophistication of services offered, and offer competitive interest rates paid on deposits and charged on loans. Our cost of funds fluctuates with market interest rates and may be affected by higher rates offered by other financial institutions. In certain interest rate environments, additional significant competition for deposits may be expected to arise from corporate and government debt securities and money market mutual funds. We have a very small market share of the total deposit-gathering or lending activities in the metropolitan areas of New York City, Washington, D.C., Boston, and San Francisco.
In the financial services industry, market demands, technological and regulatory changes and economic pressures have increased competition among banks, as well as other financial institutions. As a result of increased competition, we believe that existing banks have been forced to diversify their services, increase rates paid on deposits and become more cost effective. Meanwhile, corresponding changes in the regulatory framework have resulted in increasing uniformity in the financial services offered by financial institutions. These market dynamics in the financial services industry have increased the number of new bank and non-bank competitors and have increased customer awareness of product and service differences among competitors.
We primarily face competition from the five major categories of competitors listed below. In each case, we rely on our focus on our socially responsible mission and on consumer products at a local and increasingly national level to attract mission-aligned customers and compete against these competitors.
•Local and regional bank competition within our branch footprint of the metropolitan areas of New York City, Washington, D.C., and San Francisco and our commercial office in Boston. These local and regional banks have the same local focus and engagement with the community and typically offer similar products and servicing capabilities.
•Large banks which have been and are expanding their physical footprint in the metropolitan areas of New York City, Washington, D.C., Boston, and San Francisco. These large banks have significant national-scale resources.
•National “direct” banks, which have sophisticated digital offerings and significant national brand investments that appeal to segments of the population that do not require a physical branch to conduct banking and may offer higher interest rates on deposits.
•Fintech “non-banks.” There are numerous emerging business models and technology innovators entering the field of personal finance. Much of the Fintech innovation has significant capabilities and may be disruptive to traditional banks.
•Other socially responsible banks and financial services companies, including credit unions. We anticipate an increase in competition in socially responsible banking given the recent high-level focus the concept has received.
In commercial banking, we compete to underwrite loans to sound, stable businesses and real estate projects at competitive price levels that also make sense for our business and risk profile. Our major commercial bank competitors include national, regional and local banks that are larger than us and, as a consequence of their size, have the ability to make loans on larger projects or provide a greater mix of product offerings. We also compete with local banks, some of which may offer aggressive pricing and unique terms on various types of loans.
5
In retail banking, we primarily compete with banks that have a visible retail presence and personnel in our market areas. The primary factors driving competition in consumer banking are customer service, interest rates, fees charged, branch location and hours of operation, online banking capabilities, and the range of products offered. We compete for deposits by advertising, offering competitive interest rates, and seeking to provide a high level of personal service.
In retail lending, we also compete with non-bank mortgage companies. The non-bank competition has access to a wide array of products and services offered through the secondary market and private participants. The ability to quickly utilize the latest technologies, while benefiting from lower regulatory and compliance costs, allow the non-bank competition to add new products at a fast pace. We seek to keep up with the non-bank mortgage competition by utilizing our portfolio products to give customers options they would not find at traditional banks. Veterans Administration ("VA") loans and Federal Housing Authority ("FHA") loans are part of our product offerings. We have invested in new technologies to keep pace in the market; integrating services directly into our point-of-sale and loan origination software systems to help mitigate risks and decrease the mortgage processing time. We have consistently increased our market presence in this retail lending space through the use of internet marketing, the ability to have customers apply online, adding more states to our mortgage lending area, collaborating with state and local nonprofits to help low to moderate income borrowers and hiring talented mortgage origination professionals.
In investment management and trust services, we compete with a variety of custodial banks as well as a diverse group of investment managers and consultants to those client segments. From a custody standpoint, we compete against larger custodial institutions, such as State Street and BNY Mellon, and smaller, client-service oriented custodial banks, such as US Bank, Regions Bank and M&T Bank. In investment management, we regularly compete against a host of firms that provide passive equity index replication to their clients, including State Street, BlackRock, and Vanguard. Our active products, both in equities and fixed-income, compete against dozens of institutional managers who traditionally provide services to Taft-Hartley funds, public funds and endowments/foundations. Our agreement with Invesco to be our principal investment sub-adviser has added to this suite of products.
We have focused on providing value-added products and services to our clients, which we are able to do because of our close relationships with them, and our affinity to their missions. We believe our ability to provide flexible, sophisticated products and a customer-centric process to our customers and clients allows us to stay competitive in the financial services environment. We have taken a segment-specific position on remaining competitive, both within our branch and online banking markets, for consumer, small business and commercial clients.
Our Market Area
We are focused on geographic markets with large and growing populations of our target customer base. Our primary geographic markets include the metropolitan areas in New York City, Washington, D.C., San Francisco, and Boston. Based on research we commissioned, each of these markets is densely populated with a significant number of values-based businesses and non-profit organizations. We are also able to leverage our heritage as a socially responsible bank to market to customers nationwide.
We currently have an efficiently managed network of three branch offices in New York City, one branch office in Washington, D.C., one branch office in San Francisco, and one commercial office in Boston. Following our success in New York, a community we have now been a part of for over a century, we entered the Washington, D.C. market with a successful strategic expansion in 1998. We bolstered our efforts in the Washington, D.C. market in 2012 and have generated a 11% compound annual deposit growth rate during the five-year period ended December 31, 2023. Additionally, following the successful acquisition of New Resource Bank in 2018, we have become a trusted commercial lender in San Francisco and established ourselves in Boston.
Our Business Model
We are a full-service commercial bank offering a broad range of deposit products, trust and investment management services, and lending services. We generate relationship deposits from our values-based commercial clients and consumer customers. We further develop new and existing relationships through our trust, custody, and investment management services, which generate fee income, and we also offer investment, brokerage, asset management, and insurance products to our retail customers through a third-party broker dealer. Because our target customer base has historically had limited credit needs, we generate a significant amount of excess liquidity from these relationships, which we, in turn, deploy through a conservative asset allocation strategy to achieve attractive risk-adjusted returns.
6
Deposits
We gather deposits primarily through teams of bankers organized based on region and client segment. In addition, we bank politically active customers, such as campaigns, political action committees, and state and national party committees, which we refer to as political deposits. These deposits exhibit seasonality based on election cycles. Our teams of dedicated bankers have a strong familiarity with the segments they cover, and many have worked with organizations that make up our target customer base before starting their career in banking. We believe our deep understanding of these segments, customized solutions and relationship-based, personalized service model enable us to address our customers’ unique banking needs. As a result, we believe we have become one of the leading banks of choice for many of these groups who, in turn, contribute a significant source of low-cost core deposits to the bank. Our total deposit base is composed of 42% non-interest-bearing accounts and has an average cost of deposits of only 117 basis points for the year ended December 31, 2023. We believe that our focus on serving the banking interests of the mission-driven customer market gives us a competitive advantage over other commercial banks in generating business from our target customer base.
In addition to this commercial business development structure, we source consumer deposits through our branch network, online network, and mobile platform. Through these channels, we offer a variety of deposit products, including demand deposit accounts, interest-bearing products, savings accounts, and certificates of deposit. As of December 31, 2023, our deposit base consisted of $2.94 billion of checking deposits, $3.64 billion of other liquid deposits such as money market checking, savings and passbook deposits, $187.5 million of certificate of deposits, and $242.2 million of brokered deposits. The vast majority of our commercial deposits are derived from socially responsible organizations.
Trust and Investment Management
We have been providing institutional trust, custody and investment management services since 1973. This business has become an integral contributor to our franchise and is complementary to our commercial banking business, as they each help support and grow the other. Approximately one-third of our trust and investment management clients utilize our deposit products. The majority of our trust and investment management business consists of institutional investment clients, such as multi-employer pension funds and Taft-Hartley funds.
Our custody service bankers have considerable experience with our target customer base, offering a highly personal approach to customer support and customizable solutions including those which are specifically designed to meet the requirements of the Employee Retirement Income Security Act of 1974 and public sector employee benefit and pension plans, endowments, foundations and family offices. Our core custody services feature a wide-ranging and comprehensive product suite, including asset safekeeping, corporate actions, income collections, proxy services, account transition, asset transfers and conversion management, which focus on adding value for our clients.
Our investment management offerings are currently composed of a broad range of both index and actively-managed funds spanning equity, fixed-income, real estate assets and alternative investment strategies. Our experienced team specifically tailors our investment strategy to align with the values of our clients. We launched our LongView family of funds in 1992 to promote advocacy through ownership guided by the investment belief that companies with strong corporate governance deliver stockholders greater and less volatile returns over the long term. We view accountability, prudent risk oversight, social and environmental awareness, relationship with workers, stockholders and the community as the key principles for sustainable value creation that define good governance best practices and enhance the prospects for sound stockholder returns. We play an active role in promoting strong corporate governance through our proxy-voting guidelines, the filing of socially-aligned stockholder proposals, and litigation brought by us on behalf of our investors, and we believe this distinguishes our index funds from similarly situated funds and provides us with a competitive marketing advantage.
The growth of our commercial banking business has contributed to our trust, custody and investment management services business in recent years. As of December 31, 2023, we had over 1,000 custody accounts with $41.66 billion in assets under custody and approximately 500 investment management accounts with $14.82 billion in assets under management. For the years ended December 31, 2023 and December 31, 2022, we generated $15.2 million and $14.4 million of investment and trust fees, respectively.
Asset Allocation
Our target customer base provides us with what has historically been a stable source of low-cost core deposits, with generally limited credit needs. Therefore, we have historically had a substantial amount of excess liquidity. We believe a key benefit of our differentiated business model is our flexibility to allocate our excess liquidity to achieve attractive risk-adjusted returns. Our
7
earning asset mix today is composed of a combination of loans to target commercial customers, various types of real estate loans, and securities. We have a robust governance process in place to maintain conservative credit standards and underwrite each loan on our balance sheet.
Commercial and Industrial Lending
We take a relationship-based approach to our target customer loan origination strategy, as our bankers have developed a deep level of experience with our customers within our target customer base and their unique banking needs. Our business strategy involves us growing our business by earning the trust of these customers through a demonstrated dedication to our shared values—these mission-aligned customers seek our expertise in order to obtain various forms of specialty lending. Our specialty lending includes bridge financing guaranteed by philanthropic grants, financing for owner-occupied union facilities, loans to affordable housing construction funds administered by leading Community Development Financial Institutions Funds, loans for commercial solar deployment and other renewable power and energy efficiency projects, and loans to political campaigns.
Real Estate Loans
Our real estate portfolio consists of loans to individuals and commercial businesses, including one-to-four family, multifamily, and CRE.
Residential Real Estate
Our portfolio of originated real estate loans to individuals is based primarily in our geographic markets, but also a minority of real estate loans are to individuals outside our geographic markets, some of which are affinity mortgage programs we have developed for members of certain commercial customers, such as the Service Employees International Union ("SEIU") and American Federation of Teachers ("AFT"). Our residential loans are primarily closed-end mortgage loans, secured by a first lien on one-to-four family dwellings primarily in our geographic footprint. The dwellings are typically residential structures consisting of principal residences, second or vacation homes and investment properties, with property types including single family homes, two-to-four unit homes, condominiums, and cooperative apartments. We also own portfolios of purchased one-to-four family loans, representing 3.1% of total assets as of December 31, 2023.
Multifamily and CRE
A substantial portion of our portfolio is composed of multifamily loans made to customers in New York, predominantly for rent-stabilized buildings. We generally apply stringent underwriting guidelines for LTV and debt service coverage ratios, which are intended to mitigate credit and concentration risk in this loan category. Our cumulative historical multifamily loss rate from January 1, 2019 through December 31, 2023 is 13 basis points. The average current LTV of our multifamily loans is approximately 54%. Our CRE exposure is also predominantly in the New York metropolitan area and includes loans on office buildings, owner-occupied office buildings, retail centers, industrial facilities, mixed-use buildings, and education centers, with an average current LTV of 48%.
The following table presents our CRE portfolio composition by property type at December 31, 2023:
Property Type | % of Portfolio | |||||||
| Office | 17.4 | % | ||||||
| Office - Owner Occupied | 8.7 | % | ||||||
| Retail | 15.7 | % | ||||||
| Industrial | 23.8 | % | ||||||
| Mixed Use | 6.0 | % | ||||||
| Education | 13.0 | % | ||||||
| Other | 15.6 | % | ||||||
Total | 100.0 | % | ||||||
At December 31, 2023 our total multifamily portfolio is $1.15 billion, and our total multifamily loan exposure in New York State is approximately $775.1 million. Approximately 74% of these loans are to buildings with at least one rent regulated unit.
8
Securities
Our securities portfolio primarily consists of high quality investments in mortgage-backed securities to government sponsored entities, other asset-backed securities and Property Assessed Clean Energy ("PACE") investments. All non-agency securities, composed of non-agency commercial mortgage-backed securities, collateralized loan obligations, non-agency mortgage-backed securities, and asset-backed securities, are senior tranche and approximately 85.6% carry AAA credit ratings and 14.4% carry A credit ratings or higher. As of December 31, 2023, our securities portfolio has a weighted average yield of 4.86% and an estimated weighted average life of 6 years. Approximately 46.6% of this portfolio is classified as “available for sale.” In total, our securities portfolio including FHLBNY stock represented 41.2% of total interest-earning assets as of December 31, 2023.
In 2019, we expanded into PACE financing which allows borrowers to finance energy efficient and other socially responsible building improvements with the repayment made through property tax assessments collected by municipalities. PACE assessments are typically pari passu with tax liens and senior to mortgage debt. Since 2019, we have purchased $1.48 billion of PACE assessments backed by improvements to residential and commercial properties. The residential assessments were originated by three different companies and were backed mostly by properties from California and Florida. The average assessment-to-value at origination for our residential and commercial PACE portfolios is approximately 9% and 22%, respectively. We added $319.7 million in PACE assets in 2023. PACE assessments are generally non-rated pass-through securities with no structural protections or guarantees added at the security level.
Our Business Strategy
We have a clearly defined mission to be America’s socially responsible bank, empowering organizations and individuals to advance positive social change. Our vision is to provide banking that furthers economic, social, racial, and environmental justice. Our differentiated model of providing relationship-based, personalized-service and customized solutions while sharing our customers’ values has driven the growth of our commercial banking, trust and investment management, and increasingly our consumer banking businesses.
We expect to further enhance our franchise value by continuing to develop organic relationships with our target customer base in existing markets, expanding strategically into new geographies while maintaining our risk and expense discipline. We believe this will drive growth in our core banking business and our trust and investment management business. Protecting our values-based franchise also requires disciplined risk and expense management, which we believe is essential to our business strategy. Commitment to our customers’ values is a central tenet of our differentiated business model and we expect it to continue to serve as the pillar of our broader business strategy.
Focus on Deposit-led Organic Growth
Our primary goal is to develop organic relationships in our target customer segments to support the growth of our high quality, low-cost core deposit base. Our growth has been achieved by providing relationship-based, personalized-service and customized solutions. The success of our deposit gathering strategy has enabled us to become a primarily core deposit-funded institution, resulting in a lower cost funding base. Core deposits, which include checking accounts, money market accounts, and savings accounts, totaled $6.58 billion as of December 31, 2023 and represented 94% of total deposits. Our deposit strategy enables us to attract commercial depositors that also borrow and invest with us. Our total deposit growth has increased at a 10.9% compound annual growth rate over the last five years. We believe our reputation within our target customer base positions us well to sustain our growth trajectory.
Geographic Expansion
We intend to consider strategic expansions into new markets that have a large constituency of socially responsible organizations and individuals. We demonstrated our ability to grow organically through our expansion into Washington, D.C. and through the completed acquisition of New Resource Bank, based in San Francisco. In 2020, we opened our first commercial office in Boston as part of our efforts to expand organically into new markets. We intend to continue evaluating opportunities to efficiently expand our geographic footprint into other large metropolitan areas throughout the United States that share the same characteristics as our other current markets.
9
Grow Trust and Investment Management Business
We have been dedicated to serving the investment needs of our institutional clients for more than 40 years. We are committed to fostering strong client relationships and unparalleled understanding of our clients’ goals and objectives. We offer a broad range of both index and actively-managed funds spanning equity, and fixed-income strategies. As of December 31, 2023, we had $41.66 billion of assets under custody and $14.82 billion of assets under management. The growth of our commercial banking business has fueled the continued growth of our trust and investment management business, as approximately one-third of our trust and investment management clients utilize our deposit products. Our existing commercial clients have large trust and investment management needs. Our current infrastructure provides the necessary scale to increase our market presence among corporations, endowments, foundations and family offices. Invesco serves as our primary investment management subadvisor, bringing significant scale and experience to our investment management business, with over $1.59 trillion in assets under management, as of December 2023. Invesco has a wide range of investment management services across asset classes, with experience in Taft-Hartley plans, and a significant range of social responsibility investment products aligned with our mission. Our alliance with Invesco has led to new product development aimed specifically at the needs expressed by our mission-oriented clients.
Maintain a Prudent Approach to Asset Allocation
Our business model has historically generated a substantial source of low-cost core deposits and we believe that it will continue to do so. As noted above, our target customers have historically had limited credit needs and we do not expect that these needs will change meaningfully. As such, our business model gives us access to excess liquidity, which we intend to prudently manage to optimize risk-adjusted returns. We expect that our lending strategy will continue to consist of real estate and C&I loans as well as purchases of high-quality loans such as government guaranteed loans supported by the Small Business Administration or the United States Department of Agriculture, consumer loans focused on mission-aligned solar panel installations, or syndicated loans originated by other financial institutions with a track record of strong credit quality and prudent underwriting.
Underwriting and Credit Risk Management
Underwriting. Certain credit risks are inherent in all loans. These include risks resulting from uncertainties in the future value of collateral, risks resulting from changes in economic and industry conditions, and risks inherent in dealing with individual borrowers. Although we both originate and purchase pools of loans, we apply the following underwriting standards to all of our loans. We attempt to mitigate repayment risks by adhering to internal credit limits, a multi-layered approval process for loans, documentation examination, and follow-up procedures for any exceptions to credit policies. Our management, lending officers and credit administration team emphasize a strong risk management culture which is supported by comprehensive policies and procedures for credit underwriting, funding and administration that we believe has enabled us to maintain sound asset quality. Our underwriting methodology emphasizes analysis of global cash flow coverage, property cash flow in the case of real estate loans, loan to collateral value, and obtaining personal guaranties where appropriate. Also, in the case of most income-property loans, we require that borrowers are special purpose entities.
Our Board of Directors has delegated oversight responsibility for our credit risk functions to its Credit Policy Committee, which is responsible for setting our credit risk appetite and approving our credit policy. This policy is updated periodically and reviewed in its entirety at least once per year. Our Board has established a management level Credit Committee, which is charged with formulating, subject to the Credit Policy Committee’s approval, and administering our credit policy. The management Credit Committee reviews and has the authority to approve, delay or deny all requests for new and existing credit exposures within the limits and practices established by our credit policy. Among other responsibilities, the management Credit Committee reviews and approves (i) all C&I and CRE non-multifamily commercial credit exposure requests greater than $7 million; (ii) CRE multifamily credit exposure requests greater than $10 million; and (iii) approves residential lending credit requests of more than $2 million. The Credit Policy Committee must approve any loan over $25 million, as well as specific programs that are new to the Bank or are subject to heightened risk.
Our management Credit Committee includes our Chief Credit Risk Officer, Chief Banking Officer, Director of Commercial Banking, Treasurer, Chief Legal Officer, Senior Credit Officers, Senior Lending Officer and Director of Commercial Real Estate. Our management Credit Committee generally meets weekly to evaluate and approve credits brought by loan officers. Prior to submitting a loan for approval, the loan will have gone through several rounds of underwriting and credit review starting with deal screens, underwriting performed by the lending unit, a review of the underwriting by our Credit Risk Management team, submission of a formal credit application memorandum that is also reviewed by our Credit Risk Management team, and an approval to move forward by a Senior Credit Officer. Particularly, during the underwriting process and prior to presentation to the management Credit Committee, the collateral properties on multifamily and CRE loans are visited by the originating relationship manager. There are no automatic factors that preclude a loan from being approved as we focus on the totality of the credit
10
opportunity including the borrower’s financial strength, industry, loan structure, strategic fit, and economics. In evaluating each potential loan relationship, we adhere to a disciplined underwriting evaluation process which includes, but is not limited to, the following:
•understanding the customer’s financial condition and ability to repay the loan;
•verifying that the primary and secondary sources of repayment are adequate in relation to the amount and structure of the loan;
•observing appropriate LTV guidelines for collateral secured loans;
•maintaining our targeted levels of diversification for the loan portfolio, both as to type of borrower, industry and geographic location of collateral;
•ensuring that each loan is properly documented with perfected liens on collateral; and
•the purpose of the loan.
There is a restricted industries and activities list; a loan falling within a restricted industry or activity may still be approved on an exception basis. The review of such a loan must include a review of the mitigations for the exception and a reason to continue considering the loan.
We use third party appraisers to appraise the properties on which we make CRE loans. We choose these appraisers from a small group of qualified individuals and firms based on the specific type of property and the geographic area in which the property is located. The appraisal review process has been outsourced. The Appraisal Management Committee selects the appraising individual or firm (from a Bank-approved list), orders the appraisal, and reviews the completed appraisal. The full process is managed by the Senior Real Estate Credit Officer.
For one-to-four family residential real estate loans (first lien), our general policy is not to exceed an LTV of 80% unless the borrower obtains mortgage insurance. The LTV generally declines as the amount of the loan increases. For multifamily and CRE loans, our policies are to obtain an appraisal on each loan and, generally, to not exceed an LTV of 80% and 75%, respectively.
Loans to One Borrower. In accordance with “loans-to-one-borrower” regulations promulgated by the New York State Department of Financial Services ("NYDFS"), we are generally limited to lending no more than 15% of our unimpaired capital and unimpaired surplus to any one borrower or borrowing entity. This limit may be increased by an additional 10% for loans secured by readily marketable collateral having a market value, as determined by reliable and continuously available price quotations, at least equal to the amount of funds outstanding. To qualify for this additional 10%, we must perfect a security interest in the collateral and the collateral must have a market value at all times of at least 100% of the loan amount that exceeds 15% of our unimpaired capital and unimpaired surplus. At December 31, 2023, our regulatory limit on loans-to-one borrower was approximately $123 million. Our management Credit Committee approval limit is $25 million, any loan over $25 million must be approved by the Credit Policy Committee. We regularly monitor concentration risk, which is the risk of lending too much to one particular customer or type of customer. Our loan policy establishes detailed concentration limits and sub limits by loan type and geography. Our management Credit Committee and our Credit Policy Committee review our concentration reports on a quarterly basis.
Ongoing Credit Risk Management. Credit risk management involves a collaboration among our loan officers or relationship managers, underwriters, and credit approval, credit administration, portfolio management and collections or loan workout personnel. We apply our collection policies uniformly to both our portfolio loans and loans serviced for others. We conduct monthly loan quality meetings, attended by representatives from each of the aforementioned groups, including the business unit leaders. Our Loan Quality Committee is our executive and senior management governing body for monitoring loans that have classified or criticized regulatory risk ratings, or as determined by our Chief Credit Risk Officer or Senior Credit Officers. Criticized loans are special mention loans as they show potential weakness that may result in the deterioration of future repayment. Classified loans are substandard loans and doubtful loans.
•Substandard loans are inadequately protected by the current net worth and paying capacity of the borrower or of the collateral pledged (these loans have a well-defined weakness, and there is a distinct possibility that the Company will sustain some loss).
•Doubtful loans, based on existing circumstances, have weaknesses that make collection or liquidation in full highly questionable and improbable.
11
Our review of classified and criticized loans includes an evaluation of the market conditions, the property’s (or business entity’s) trends, the borrower and guarantor status, the level of reserves required, and loan accrual status.
Our Loan Quality Committee also reviews: delinquent loans, upcoming maturities, credit review cycles, and other credit monitoring reports across both the loan quality portfolio and non-loan quality portfolio, as well as non-performing residential loans. The Loan Quality Committee has approval authority for loan amendments and credit risk rating changes for reviewed credit exposures. A credit risk rating change requires a majority vote of the Loan Quality Committee and is reported to the Credit Policy Committee. After approval by Loan Quality Committee, the credit risk rating change is processed under our internal controls procedures.
In accordance with our policy, we perform annual asset reviews of our multifamily, CRE, and C&I loans. All C&I loans in excess of $1 million are reviewed at least annually, or quarterly based on size criteria. Pass-rated CRE and multifamily loans are reviewed annually or biannually based on size and location, and all criticized and classified loans are reviewed monthly. As part of these credit reviews, we analyze recent financial statements of the borrower and any additional market data that may impact the borrower’s ability to repay the loan. Upon completion, we update the risk rating assigned to each loan. Relationship managers are encouraged to bring potential credit issues to the attention of credit administration personnel. Our credit policy requires at least 40% of our loans to be reviewed by an independent third party to ensure that our assigned risk grades are appropriate. Our current engagement requires the independent third party to review at least 50% of our loans by exposure. The loans are typically selected by the independent third-party reviewer except that the reviewer must review all of our leveraged loans, loans with over $20 million exposure, C&I loans with over $10 million exposure, all construction and farmland, all loans in our lowest pass-rated risk rating with exposures over $1 million, municipality/public finance loans, and classified or criticized loans.
Management reviews the reports prepared by the independent reviewers and presents these reports to the Credit Policy Committee of the Board. These asset review procedures provide management and the Board with additional information for assessing our asset quality.
Climate Risk Management
Climate-related risks are composed of (1) transitional risks, which are risks associated with the transition towards a low-carbon economy, (2) physical risks, which consist of the physical impacts from climate change including increased frequency and severity of natural disasters, sea levels rising, and extreme temperatures, and (3) regulatory risk as local, state and federal policy makers respond to the climate crisis with new regulations and market influence designed to speed up the transition to a low-carbon economy, mitigate climate risk and protect the economy from climate impacts. These longer-term impacts and events have broad material implications on business operations, supply chains, distribution channels, customers, and markets. The impacts of transition risk can lead to and amplify credit risk or market risk by reducing our customers’ operating income or the value of their assets as well as expose us to reputational and/or litigation risk due to increased regulatory scrutiny or negative public sentiment. Physical risk can lead to increased credit risk by diminishing borrowers’ repayment capacity or impacting the value of collateral.
The Bank is closely monitoring stability in the insurance markets and the impact of climate losses on the availability and pricing of insurance for the real estate sector. Disruption in these markets could impact the economic circumstances of borrowers, the valuation of assets and borrower ability to meet lending terms on insurance coverage.
We continue to embed climate risk into our business strategy, and we are committed to ambitious action through risk management programs. The Bank is a supporter of the Task Force on Climate Related Financial Disclosures ("TCFD") and follows the TCFD framework across governance, strategy, risk management and targets for disclosing clear, comparable and consistent information about our risks and opportunities presented by climate change. We are excited to embark on this work, engage with clients to realize our goals, and communicate our progress to our valued stakeholders. Our climate risk mitigation efforts are communicated through our Net Zero Climate Target Report which is our plan to measure our impact, to set targets that guide our business and the impact we have in the world, and to be transparent about what this will mean for our business and operations. Similarly, our annual CSR report includes the key pillars of TCFD reporting and our approach to climate risk management, including our Scope 1, Scope 2 and Scope 3 emissions disclosures. The information on our website is not incorporated by reference in this report.
With respect to operational risk, we maintain continuity of operation plans that factor in extreme weather events and our ability to adapt to physical events that change our access to certain locations. This plan is maintained by management and reviewed by the Enterprise Risk Oversight Committee.
With respect to regulatory and policy risk, regulators at the federal level and at NYDFS have outlined approaches and expectations for supervision of climate risk for financial institutions, including banks. In December 2023, NYDFS finalized
12
guidance to banks and mortgage institutions regarding material climate change-related financial and operational risks. NYDFS has not yet announced an implementation timeline for the guidance. The approach from policy makers reflects the frameworks of TCFD and an enterprise approach to risk management already very familiar to us and the work already underway.
With respect to transition risk, the Bank has low exposure to high emitting sectors, assets and geographies. The Bank's long standing position of fossil fuel exclusion policies in addition to its growth in climate solutions lending, significantly reduces the Bank's exposure to transition risk as a result of abrupt market or regulatory shifts. The Bank's credit and investment exposures are reflected in climate terms through GHG Protocol and PCAF Disclosures and add quantifiable metrics for managing emissions exposure. The Bank's climate targets and transition plans, published in 2021 and validated by the Science Based Targets Initiative ("SBTi") offer further assurance of transition risk management.
Information Technology Systems
We recognize the critical role of technology in driving operational efficiency and maintaining competitive advantage in today’s financial services landscape. We make investments in order to maintain scalable, efficient, secure and modern scalable information technology systems. We outsource a significant portion of our processing and services, which allows us to leverage vendors’ economies of scale and enables us to expand our capabilities as needed without the burden of legacy infrastructure. We work with our third-party vendors to ensure we are utilizing their applications efficiently and to their fullest capability. We use an integrated core system to originate and process loan and deposit accounts, which provides us with a high degree of automation, improves customer experience and reduces costs.
We continuously improve our cybersecurity posture and have implemented a multi-layered defense strategy to protect customer and confidential data. We actively monitor the cybersecurity threat landscape with a focus on the financial services sector for trends and new threats. Our Information Security Department proactively identifies and monitors systems to analyze risk to the organization and implement mitigating controls where appropriate. Formal security awareness training is conducted regularly to increase overall employee awareness about cyber threats. In addition to maintaining a defensive cybersecurity strategy, we have a disaster recovery site in an ISO 27001-certified separate colocation data center. We conduct regular business continuity and disaster recovery exercises to ensure our contingency plans support our operational needs.
Human Capital Resources
Our People
As of December 31, 2023, we had 425 employees, approximately 21% of whom are represented by a collective bargaining agreement. We consider our relationship with our employees to be good and have not experienced interruptions of operations due to labor disagreements.
Four of our service employees at our headquarters, responsible for mechanical and technical repairs, are covered by the 2016 Independent Office Agreement between us and Local 32BJ, Service Employees International Union, the agreement of which was amended and extended through December 31, 2023. We are still operating under the prior agreement while the updated agreement is being finalized. The agreement generally governs, among other things, the subject employee’s compensation, vacation, severance, and working conditions and provides the union will only strike under very limited circumstances.
Certain of our office and clerical employees are covered by the Collective Bargaining Agreement between us and the Office and Professional Employees International Union ("OPEIU") local 153. The agreement generally governs, among other things, the subject employees’ compensation, vacation, severance, and working conditions and contains a “no-strike” clause, whereby, during the term of the agreement, the union will not strike and we will not initiate a lockout. On December 20, 2023, we and OPEIU entered into a Memorandum of Agreement ("MOA"), which among other things (i) extended the term of the collective bargaining agreement to June 30, 2026, and (ii) provided for a 3.5% wage increase effective the 1st of July 2023, 2024 and 2025, respectively.
13
Diversity, Equity, and Inclusion
The Company's commitment to DEI starts at the top with direct oversight from our Chief Executive Officer. Diversity is important to us at the highest levels and our Board of Directors is currently comprised of seven women, four racially or ethnically diverse members, and one LGBTQ+ member. Progress on recruiting and diversity of the workforce is reported regularly by management to the Board of Directors. A Head of Diversity Equity and Inclusion has been hired and forms a part of the senior management team. We believe maintaining and promoting a diverse and inclusive workplace where everyone feels valued and respected is essential for our growth. We have a formal Board diversity policy that states that, when assessing board nominees, the Governance and Nominating Committee must ensure diverse characteristics, including but not limited to gender, age, race, ethnicity, disability, and sexual orientation, are included in any pool of candidates from which the Board nominees are chosen.
We are focused on cultivating a diverse, inclusive and equitable culture where our employees can freely bring varied perspectives and experiences to work. We are committed to strategies to attract, retain, and develop top talent to fuel our growth and create value for stockholders. In our employee recruitment and selection process and operation of our business, we adhere to equal employment opportunity policies and provide annual employee trainings on DEI. We have established employee resource groups to support employees from marginalized populations to help cultivate a healthy workplace culture. As of December 31, 2023, approximately 58% of our employees identify as women and women hold 17 of 41 senior management positions, and 63% of our employees identify as under-represented minorities and they hold 46% of senior management positions.
To increase diverse representation in our workforce, particularly in senior management, we have established placement goals for minorities and women where warranted and expanded recruitment at career fairs with diverse candidates.The Company promotes equity in employee hiring, retention and promotion, professional development and training, and community outreach. Our formal DEI plan includes enhanced policies, programs that recommit our focus to our social mission, and seek to drive continued change for our Company, customers, and communities. This plan is not only central to our mission but is a key part of our growth strategy and ensuring we are the Company of choice for our customer segments.
Pay Equity
The Company is committed to pay parity and in 2020 conducted its first pay equity audit. The Company published a pay equity analysis covering its 2022 compensation year, examining adjusted and median pay gaps for race and gender. The analysis of 2022 compensation found that there continues to be substantial parity in our adjusted pay for women and minorities. The adjusted female salary was 98 cents to the dollar of the adjusted male compensation. Similarly, on an adjusted basis, minorities earned 98 cents to the dollar compared to non-minorities. This disclosure also included data on the hiring, retention and promotion of employees by race and gender. The Company plans to publish similar analysis on an annual basis going forward.
Culture and Employee Engagement
We believe continuous engagement with our employees is important to driving our success. Our President and Chief Executive Officer and members of executive management hold town hall-style meetings in-person and virtually with all employees, covering topics such as business strategy and outlook, our competitive landscape, emerging industry trends, employee recognition, and includes a question and answer session with management. We believe this format, in addition to other on-going interactions between leadership and employees, promotes strong and productive conversations across our organization.
Competitive Pay/Benefits
To attract and retain talent, we offer a comprehensive compensation and benefits package that includes health insurance, pension, savings plans, employee stock purchase plan and tuition reimbursement. In 2019, we became the first U.S. bank to increase our minimum wage to $20 per hour.
We engage a nationally recognized outside compensation and benefits consulting firm to independently evaluate the effectiveness of our executive pay programs and to benchmark them against those of industry peers. We align our executives’ pay with performance by linking incentive pay to financial performance and we have stock ownership requirements for senior executives and our Board of Directors.
Promotions and Tenure
We believe our success depends on developing and promoting our employees. From December 31, 2022 to December 31, 2023, approximately 7.3% of our workforce was promoted. The average tenure of our employees is approximately seven years.
14
Health and Safety
The health and safety of our employees and customers is our highest priority. Given the fluidity of health and safety concerns since the start of the COVID-19 pandemic in 2020, we leverage federal, state, and local guidelines and requirements, in addition to consultation with an external healthcare consulting firm to guide our health and safety protocols.
Significant Subsidiaries
The Company owns all of the capital stock of the Bank. The Bank owns a 99.6% equity interest and controls the operations of its subsidiary, Amalgamated Real Estate Management Company (“AREMCO”), which is a consolidated real estate investment trust holding certain of our purchased and originated loans. The income generated from the loans held in AREMCO is paid out to stockholders, including the Bank, in the form of dividends. AREMCO calculates its annual dividend to equal or exceed 95% of the projected annual taxable income and during December of each year, the Board of Directors of AREMCO declares a dividend to be paid to stockholders in the following January.
For the year ending December 31, 2023, AREMCO had $9.5 million in taxable income. In December 2023, the Board of Directors of AREMCO declared a dividend payout of $9.2 million to be paid to stockholders on January 10, 2024. The dividend encompassed the outstanding tranches of AREMCO stock as follows; $9,237.00 per share of Class A Senior Preferred Stock.
The Bank also has several other insignificant subsidiaries, including subsidiaries to hold our other real estate owned property (OREO), which is real estate property owned by us that is not directly related to our business.
Available Information
We provide our Annual Reports on Form 10‑K, Quarterly Reports on Form 10‑Q, Current Reports on Form 8‑K, and amendments to those reports filed or furnished pursuant to Section 13(a) or 15(d) of the Exchange Act on our website at www.amalgamatedbank.com under the Investor Relations section. These filings are made accessible as soon as reasonably practicable after they have been filed electronically with the SEC. These reports are also available free of charge on the SEC's website at www.sec.gov. The information on our website is not incorporated by reference into this report.
15
SUPERVISION AND REGULATION
Both the Company and the Bank are subject to extensive banking regulations that impose restrictions on and provide for general regulatory oversight of their operations. These laws generally are intended primarily for the protection of customers, depositors and other consumers, the FDIC’s Deposit Insurance Fund (the “DIF”), and the banking system as a whole; not for the protection of our other creditors and stockholders.
The following discussion is not intended to be a complete list of all the activities regulated by the banking laws or of the impact of those laws and regulations on our operations. The following is a general summary of the material aspects of certain statutes and regulations applicable to us. These summary descriptions are not complete, and you should refer to the full text of the statutes, regulations, and corresponding guidance for more information. These statutes and regulations are subject to change, and additional statutes, regulations, and corresponding guidance may be adopted. We are unable to predict these future changes or the effects, if any, that these changes could have on our business, revenues, and results of operations.
Legislative and Regulatory Developments
The Dodd-Frank Wall Street Reform and Consumer Protection Act (“Dodd-Frank Act”)
The Dodd-Frank Act was signed into law in July 2010 and impacts financial institutions in numerous ways, including:
•The creation of a Financial Stability Oversight Council responsible for monitoring and managing systemic risk;
•Granting additional authority to the Board of Governors of the Federal Reserve (the “Federal Reserve”) to regulate certain types of nonbank financial companies;
•Granting new authority to the FDIC as liquidator and receiver;
•Changing the manner in which deposit insurance assessments are made;
•Requiring regulators to modify capital standards;
•Establishing the Consumer Financial Protection Bureau (the “CFPB”);
•Capping interchange fees that certain banks charge merchants for debit card transactions;
•Imposing more stringent requirements on mortgage lenders; and
•Limiting banks’ proprietary trading activities.
There are many provisions in the Dodd-Frank Act mandating regulators to adopt new regulations and conduct studies upon which future regulation may be based. While some have been issued, many remain to be issued. Governmental intervention and new regulations could materially and adversely affect our business, financial condition and results of operations.
Amalgamated Financial Corp.
The Company owns 100% of the outstanding capital stock of the Bank, and is considered to be a bank holding company registered under the federal Bank Holding Company Act of 1956 (the “BHC Act”). As a result, we are primarily subject to the supervision, examination and reporting requirements of the Federal Reserve under the BHC Act and its regulations promulgated thereunder.
Permitted Activities. Under the BHC Act, a bank holding company is generally permitted to engage in, or acquire direct or indirect control of more than 5% of the voting shares of any company engaged in, the following activities:
•banking or managing or controlling banks;
•furnishing services to or performing services for our subsidiaries; and
•any activity that the Federal Reserve determines to be so closely related to banking as to be a proper incident to the business of banking.
16
Activities that the Federal Reserve has found to be so closely related to banking as to be a proper incident to the business of banking include:
•factoring accounts receivable;
•making, acquiring, brokering or servicing loans and usual related activities;
•leasing personal or real property;
•operating a non-bank depository institution, such as a savings association;
•trust company functions;
•financial and investment advisory activities;
•conducting discount securities brokerage activities;
•underwriting and dealing in government obligations and money market instruments;
•providing specified management consulting and counseling activities;
•performing selected data processing services and support services;
•acting as agent or broker in selling credit life insurance and other types of insurance in connection with credit transactions; and
•performing selected insurance underwriting activities.
As a bank holding company, the Company can elect to be treated as a “financial holding company,” which would allow it to engage in a broader array of activities. In summary, a financial holding company can engage in activities that are financial in nature or incidental or complementary to financial activities, including insurance underwriting, sales and brokerage activities, providing financial and investment advisory services, underwriting services and limited merchant banking activities. We are contemplating seeking designation as a financial holding company. In order to elect financial holding company status, at the time of such election, each insured depository institution that the Company controls must be well capitalized, well managed and have at least a satisfactory rating under the Community Reinvestment Act.
The Federal Reserve has the authority to order a bank holding company or its subsidiaries to terminate any of these activities or to terminate its ownership or control of any subsidiary when it has reasonable cause to believe that the bank holding company’s continued ownership, activity or control constitutes a serious risk to the financial safety, soundness or stability of it or any of its bank subsidiaries.
Expansion Activities
The BHC Act requires a bank holding company to obtain the prior approval of the Federal Reserve before merging with another bank holding company, acquiring substantially all the assets of any bank or bank holding company, or acquiring directly or indirectly any ownership or control of more than 5% of the voting shares of any bank. A bank holding company is also prohibited from acquiring direct or indirect ownership or control of more than 5% of the voting shares of any company engaged in nonbanking activities, other than those determined by the Federal Reserve to be so closely related to banking as to be a proper incident to the business of banking.
Change in Control
Two statutes, the BHC Act and the Change in Bank Control Act, together with regulations promulgated under them, require some form of regulatory review before any company may acquire “control” of a bank or a bank holding company. Under the BHC Act, control is deemed to exist if a company acquires 25% or more of any class of voting securities of a bank holding company; controls the election of a majority of the members of the Board of Directors; or exercises a controlling influence over the management or policies of a bank or bank holding company. On January 30, 2020, the Federal Reserve issued a final rule (which became effective September 30, 2020) that clarified and codified the Federal Reserve’s standards for determining whether one
17
company has control over another. The final rule established four categories of tiered presumptions of noncontrol that are based on the percentage of voting shares held by the investor (less than 5%, 5-9.9%, 10-14.9% and 15-24.9%) and the presence of other indicia of control. As the percentage of ownership increases, fewer indicia of control are permitted without falling outside of the presumption of noncontrol. These indicia of control include nonvoting equity ownership, director representation, management interlocks, business relationship and restrictive contractual covenants. Under the final rule, investors can hold up to 24.9% of the voting securities and up to 33% of the total equity of a company without necessarily having a controlling influence. State laws, including New York law, require state approval before an acquirer may become the holding company of a state bank.
Under the Change in Bank Control Act, a person or company is required to file a notice with the Federal Reserve if it will, as a result of the transaction, own or control 10% or more of any class of voting securities or direct the management or policies of a bank or bank holding company and either if the bank or bank holding company has registered securities or if the acquirer would be the largest holder of that class of voting securities after the acquisition. For a change in control at the holding company level, both the Federal Reserve and the subsidiary bank's primary federal regulator must approve the change in control; at the bank level, only the bank’s primary federal regulator is involved. Transactions subject to the BHC Act are exempt from Change in Control Act requirements. For state banks, state laws, including that of New York, typically require approval by the state bank regulator as well.
Source of Strength
There are a number of obligations and restrictions imposed by law and regulatory policy on bank holding companies with regard to their depository institution subsidiaries that are designed to minimize potential loss to depositors and to the FDIC insurance funds in the event that the depository institution becomes in danger of defaulting under its obligations to repay deposits. Under a policy of the Federal Reserve, a bank holding company is required to serve as a source of financial strength to its subsidiary depository institutions and to commit resources to support such institutions in circumstances where it might not do so absent such policy. Under the Federal Deposit Insurance Corporation Improvement Act of 1991, to avoid receivership of its insured depository institution subsidiary, a bank holding company is required to guarantee the compliance of any insured depository institution subsidiary that may become “undercapitalized” within the terms of any capital restoration plan filed by such subsidiary with its appropriate federal banking agency up to the lesser of (i) an amount equal to 5% of the institution’s total assets at the time the institution became undercapitalized, or (ii) the amount which is necessary (or would have been necessary) to bring the institution into compliance with all applicable capital standards as of the time the institution fails to comply with such capital restoration plan.
The Federal Reserve also has the authority under the BHC Act to require a bank holding company to terminate any activity or relinquish control of a nonbank subsidiary (other than a nonbank subsidiary of a bank) upon the Federal Reserve's determination that such activity or control constitutes a serious risk to the financial soundness or stability of any subsidiary depository institution of the bank holding company. Further, federal law grants federal bank regulatory authorities’ additional discretion to require a bank holding company to divest itself of any bank or nonbank subsidiary if the agency determines that divestiture may aid the depository institution's financial condition.
In addition, the “cross guarantee” provisions of the Federal Deposit Insurance Act (the “FDIA”) require insured depository institutions under common control to reimburse the FDIC for any loss suffered or reasonably anticipated by the FDIC as a result of the default of a commonly controlled insured depository institution or for any assistance provided by the FDIC to a commonly controlled insured depository institution in danger of default. The FDIC’s claim for damages is superior to claims of stockholders of the insured depository institution or its holding company, but is subordinate to claims of depositors, secured creditors and holders of subordinated debt (other than affiliates) of the commonly controlled insured depository institutions.
The FDIA also provides that amounts received from the liquidation or other resolution of any insured depository institution by any receiver must be distributed (after payment of secured claims) to pay the deposit liabilities of the institution prior to payment of any other general or unsecured senior liability, subordinated liability, general creditor or stockholder. This provision would give depositors a preference over general and subordinated creditors and stockholders in the event a receiver is appointed to distribute the assets of our Company.
Any capital loans by a bank holding company to any of its subsidiary banks are subordinate in right of payment to deposits and to certain other indebtedness of such subsidiary bank. In the event of a bank holding company’s bankruptcy, any commitment by the bank holding company to a federal bank regulatory agency to maintain the capital of a subsidiary bank will be assumed by the bankruptcy trustee and entitled to a priority of payment.
18
Capital Requirements and Payment of Dividends
The Federal Reserve imposes certain capital requirements on the bank holding companies under the BHC Act, including a minimum leverage ratio and a minimum ratio of “qualifying” capital to risk-weighted assets. These requirements are essentially the same as those that apply to the Bank and are described below under “Amalgamated Bank—Capital and Related Requirements” Subject to our capital requirements and certain other restrictions, including the consent of the Federal Reserve, we are able to borrow money to make a capital contribution to the Bank, and these loans may be repaid from dividends paid from the Bank to the Company.
The Company’s ability to pay dividends to its stockholders may be affected by both general corporate law considerations and policies of the Federal Reserve applicable to bank holding companies. As a Delaware public benefit corporation, the Company is subject to the limitations of the Delaware General Corporation Law (DGCL"). The DGCL allows the Company to pay dividends only out of its surplus (as defined and computed in accordance with the provisions of the DGCL) or if the Company has no such surplus, out of its net profits for the fiscal year in which the dividend is declared and/or the preceding fiscal year.
As a general matter, the Federal Reserve has indicated that the Board of Directors of a bank holding company should eliminate, defer or significantly reduce dividends to stockholders if: (a) the company’s net income available to stockholders for the past four quarters, net of dividends previously paid during that period, is not sufficient to fully fund the dividends; (b) the prospective rate of earnings retention is inconsistent with the company’s capital needs and overall current and prospective financial condition; or (c) the company will not meet, or is in danger of not meeting, its minimum regulatory capital adequacy ratios. The Federal Reserve also possesses enforcement powers over bank holding companies and their non-bank subsidiaries to prevent or remedy actions that represent unsafe or unsound practices or violations of applicable statutes and regulations. Among these powers is the ability to proscribe the payment of dividends by banks and bank holding companies. In addition, under the Basel III capital rules, financial institutions that seek to pay dividends will have to maintain the 2.5% capital conservation buffer. See “Amalgamated Bank—Capital and Related Requirements.”
Restrictions on Affiliate Transactions
The Company is a legal entity separate and distinct from the Bank and its other subsidiaries. Various legal limitations restrict the Bank from lending or otherwise supplying funds to the Company or its non-bank subsidiaries. The Company and the Bank are subject to Sections 23A and 23B of the Federal Reserve Act and Federal Reserve Regulation W.
Section 23A of the Federal Reserve Act places limits on the amount of loans or extensions of credit by a bank to any affiliate, including its holding company, and on a bank’s investments in, or certain other transactions with, affiliates and on the amount of advances to third parties collateralized by the securities or obligations any of affiliates of the bank. Section 23A also applies to derivative transactions, repurchase agreements and securities lending and borrowing transactions that cause a bank to have credit exposure to an affiliate. The aggregate of all covered transactions is limited in amount, as to any one affiliate, to 10% of the Bank’s capital and surplus and, as to all affiliates combined, to 20% of the Bank’s capital and surplus. Furthermore, within the foregoing limitations as to amount, each covered transaction must meet specified collateral requirements. The Bank is forbidden to purchase low quality assets from an affiliate.
Section 23B of the Federal Reserve Act, among other things, prohibits a bank from engaging in certain transactions with certain affiliates unless the transactions are on terms and under circumstances, including credit standards, that are substantially the same, or at least as favorable to such bank or its subsidiaries, as those prevailing at the time for comparable transactions with or involving other nonaffiliated companies. If there are no comparable transactions, a bank’s (or one of its subsidiaries’) affiliate transaction must be on terms and under circumstances, including credit standards, that in good faith would be offered to, or would apply to, nonaffiliated companies. These requirements apply to all transactions subject to Section 23A as well as to certain other transactions.
The affiliates of a bank include any holding company of the bank, any other company under common control with the bank (including any company controlled by the same stockholders who control the bank), any subsidiary of the bank that is itself a bank, any company in which the majority of the directors or trustees also constitute a majority of the directors or trustees of the bank or holding company of the bank, any company sponsored and advised on a contractual basis by the bank or an affiliate, and any mutual fund advised by a bank or any of the bank’s affiliates. Regulation W generally excludes all non-bank and non-savings association subsidiaries of banks from treatment as affiliates, except to the extent that the Federal Reserve decides to treat these subsidiaries as affiliates.
19
Amalgamated Bank
General
As a New York state-chartered bank with FDIC-insured deposits, we are examined, supervised and regulated by the NYDFS, our primary regulator and the FDIC, our primary federal regulator. The statutes enforced by, and regulations and policies of, these agencies affect most aspects of our business, including prescribing the permissible scope of our activities, permissible types of loans and investments, the amount of required reserves, requirements for branch offices, and various other requirements.
New York Law
As a New York-chartered bank, New York law governs our licensing and regulation, including organizational and capital requirements, fiduciary powers, investment authority, branch offices and electronic terminals, declaration of dividends, changes of control and mergers, out of state activities, interstate branching and banking, debt offerings, borrowing limits, limits on loans to one obligor, liquidation, sale of shares or options in Amalgamated to its directors, officers, employees and others, the purchase by Amalgamated of its own shares, and the issuance of capital notes or debentures. The NYDFS is charged with our supervision and regulation.
Unsecured loans to one person generally may not exceed 15% of the sum of our capital stock, allowance and capital notes and debentures, and both secured and unsecured loans to one person (excluding certain secured lending and letters of credit) at any given time generally may not exceed 25% of the sum of our capital stock, allowance and capital notes and debentures. We are required to invest our funds in accordance with limitations under New York law and may only make investments that are permissible investments for banks, subject to any limitations under any other applicable law.
In addition to remedies available to the FDIC (which are discussed below), the Superintendent of the NYDFS may take possession of our bank if certain conditions exist, such as conducting business in an unsafe or unauthorized manner, impairments of capital, suspended payments of obligations, or violation of law.
FDIC
Our deposits are insured by the FDIC to the fullest extent permissible by law. As an insurer of deposits, the FDIC issues regulations, conducts examinations, requires the filing of reports and generally supervises the operations of all institutions to which it provides deposit insurance. The approval of the FDIC is required for certain transactions in which we may engage, including any merger or consolidation involving us, a change in control over us, or the establishment or relocation of any of our branch offices. In reviewing applications seeking approval of such transactions, the FDIC may consider, among other things, the competitive effect and public benefits of the transactions, the capital position, financial and managerial resources and future prospects of the organizations involved in the transaction, the risks to the stability of the U.S. banking or financial system, the applicant’s performance record under the Community Reinvestment Act (see “Community Reinvestment Act” below) and the effectiveness of the organizations involved in the transaction in combating money laundering activities. The FDIC also has the power to prohibit these and other transactions even if approval is not required, and could do so if we have otherwise failed to comply with all laws and regulations applicable to us.
Safety and Soundness Regulation
As an insured depository institution, we are subject to prudential regulation and supervision and must undergo regular on-site examinations by our banking agencies. The cost of examinations of insured depository institutions and any affiliates may be assessed by the appropriate agency against each institution or affiliate as it deems necessary or appropriate. We file quarterly consolidated reports of condition and income (“call reports”) with the NYDFS and FDIC. The FDIC has developed a method for insured depository institutions to provide supplemental disclosure of the estimated fair market value of assets and liabilities, to the extent feasible and practicable, in any balance sheet, financial statement, report of condition or any other report of any insured depository institution.
The federal banking agencies have also adopted guidelines establishing safety and soundness standards for all insured depository institutions including our bank. The safety and soundness guidelines relate to, among other things, our internal controls, information systems, internal audit systems, credit underwriting and documentation, compensation, fees, benefits, asset quality, asset growth, earnings, and interest rate exposure. The standards assist the federal banking agencies with early identification and resolution of problems at insured depository institutions. If we were to fail to meet these standards, the FDIC could require us to submit a compliance plan and take enforcement action if an acceptable compliance plan were not submitted. In addition, the FDIC
20
could terminate our deposit insurance if it determines that our financial condition was unsafe or unsound or that we engaged in unsafe or unsound practices that violated an applicable rule, regulation, order or condition enacted or imposed on us by our regulators.
Payment of Dividends
The power of the Board of Directors of an insured depository institution to declare a cash dividend or other distribution with respect to capital is subject to statutory and regulatory restrictions that limit the amount available for such distribution depending upon earnings, financial condition and cash needs of the institution, as well as general business conditions. Insured depository institutions are also prohibited from paying management fees to any controlling persons or, with certain limited exceptions, making capital distributions, including dividends, if after such transaction the institution would be less than adequately capitalized.
Under New York law, we are prohibited from declaring a dividend so long as there is any impairment of our capital stock. In addition, we would be required to obtain approval from the NYDFS prior to declaring a dividend if the dividend would cause the total aggregate amount of our dividends in the calendar year to exceed our total net profits for that calendar year combined with retained net profits of the preceding two years, less any required transfer to surplus or a fund for the retirement of any preferred stock.
Under certain circumstances, the FDIC may determine that the payment of a dividend would be an unsafe or unsound practice as a result of our financial condition and to prohibit the payment thereof. In particular, the FDIC has stated that excessive dividends can negate strong earnings performance and result in a weakened capital position and that dividends generally can be disbursed, in reasonable amounts, only after losses are eliminated and necessary reserves and prudent capital levels are established. In addition, the capital rules (and in particular, the capital conservation buffer, which was fully phased-in on January 1, 2019), require us to maintain 2.5% in Common Equity Tier 1 capital in order to pay a cash dividend. See “Capital and Related Requirements.”
Capital and Related Requirements
We are subject to comprehensive capital adequacy requirements intended to protect against losses that we may incur. Regulatory capital rules adopted in July 2013 and fully phased in as of January 1, 2019, which we refer to as Basel III, impose minimum capital requirements for bank holding companies and banks. The Basel III rules apply to all state and national banks and savings and loan associations regardless of size and bank holding companies and savings and loan holding companies other than "small bank holding companies," generally holding companies with consolidated assets of less than $3 billion. More stringent requirements are imposed on “advanced approaches” banking organizations—those organizations with $250 billion or more in total consolidated assets, $10 billion or more in total foreign exposures, or that have opted into the Basel II capital regime.
The rules include certain higher risk-based capital and leverage requirements than those previously in place. Specifically, we are required to maintain the following minimum capital requirements:
•a common equity Tier 1 (“CET1”) risk-based capital ratio of 4.5%;
•a Tier 1 risk-based capital ratio of 6%;
•a total risk-based capital ratio of 8%; and
•a leverage ratio of 4%.
Under Basel III, Tier 1 capital includes two components: CET1 capital and additional Tier 1 capital. The highest form of capital, CET1 capital, consists solely of common stock (plus related surplus), retained earnings, accumulated other comprehensive income, otherwise referred to as AOCI, and limited amounts of minority interests that are in the form of common stock. Additional Tier 1 capital is primarily comprised of noncumulative perpetual preferred stock, Tier 1 minority interests and grandfathered trust preferred securities. Tier 2 capital generally includes the allowance for credit losses up to 1.25% of risk-weighted assets, qualifying preferred stock, subordinated debt and qualifying tier 2 minority interests, less any deductions in Tier 2 instruments of an unconsolidated financial institution. AOCI is presumptively included in CET1 capital and often would operate to reduce this category of capital. When implemented, Basel III provided a one-time opportunity for covered banking organizations to opt out of much of this treatment of AOCI. We made this opt-out election in order to avoid significant variations in the level of capital depending upon the impact of interest rate fluctuations on the fair value of our investment securities portfolio.
21
In addition, in order to avoid restrictions on capital distributions or discretionary bonus payments to executives, under Basel III, a banking organization must maintain a “capital conservation buffer” on top of its minimum risk-based capital requirements. This buffer must consist solely of Tier 1 Common Equity, but the buffer applies to all three risk-based measurements (CET1, Tier 1 capital and total capital). The 2.5% capital conservation buffer was phased in incrementally over time, and became fully effective for us on January 1, 2019, resulting in the following effective minimum capital plus capital conservation buffer ratios: (i) a CET1 capital ratio of 7.0%, (ii) a Tier 1 risk-based capital ratio of 8.5%, and (iii) a total risk-based capital ratio of 10.5%.
In November 2019, the federal banking regulators published final rules implementing a simplified measure of capital adequacy for certain banking organizations that have less than $10 billion in total consolidated assets. Under the final rules, which went into effect on January 1, 2020, banks and holding companies that have less than $10 billion in total consolidated assets and meet other qualifying criteria, including a leverage ratio of greater than 9%, off-balance-sheet exposures of 25% or less of total consolidated assets and trading assets plus trading liabilities of 5% or less of total consolidated assets, are deemed “qualifying community banking organizations” and are eligible to opt into the “community bank leverage ratio framework.” A qualifying community banking organization that elects to use the community bank leverage ratio framework and that maintains a leverage ratio of greater than 9% is considered to have satisfied the generally applicable risk-based and leverage capital requirements under the Basel III rules and, if applicable, is considered to have met the “well capitalized” ratio requirements for purposes of its primary federal regulator’s prompt corrective action rules, discussed below. The final rules include a two-quarter grace period during which a qualifying community banking organization that temporarily fails to meet any of the qualifying criteria, including the greater-than-9% leverage capital ratio requirement, is generally still deemed “well capitalized” so long as the banking organization maintains a leverage capital ratio greater than 8%. A banking organization that fails to maintain a leverage capital ratio greater than 8% is not permitted to use the grace period and must comply with the generally applicable requirements under the Basel III rules and file the appropriate regulatory reports. We do not have any immediate plans to elect to use the community bank leverage ratio framework but may make such an election in the future.
Prompt Corrective Action
As an insured depository institution, we are required to comply with the capital requirements promulgated under the FDIA. The FDIA requires each federal banking agency to take prompt corrective action (“PCA”) to resolve the problems of insured depository institutions, including those that fall below one or more prescribed minimum capital ratios. The law requires each federal banking agency to promulgate regulations defining the following five categories in which an insured depository institution will be placed, based on the level of capital ratios: “well capitalized,” “adequately capitalized,” “undercapitalized,” “significantly undercapitalized,” or “critically undercapitalized.” As of December 31, 2023, our capital ratios exceeded the minimum ratios established for a “well capitalized” institution.
The following is a list of the criteria for each PCA capital category:
•Well Capitalized—The institution exceeds the required minimum level for each relevant capital measure. A well-capitalized institution:
•has total risk-based capital ratio of 10% or greater; and
•has a Tier 1 risk-based capital ratio of 8% or greater; and
•has a common equity Tier 1 risk-based capital ratio of 6.5% or greater; and
•has a leverage capital ratio of 5% or greater; and
•is not subject to any order or written directive to meet and maintain a specific capital level for any capital measure.
•Adequately Capitalized—The institution meets the required minimum level for each relevant capital measure. The institution may not make a capital distribution if it would result in the institution becoming undercapitalized. An adequately capitalized institution:
•has a total risk-based capital ratio of 8% or greater; and
•has a Tier 1 risk-based capital ratio of 6% or greater; and
•has a common equity Tier 1 risk-based capital ratio of 4.5% or greater; and
•has a leverage capital ratio of 4% or greater.
22
•Undercapitalized—The institution fails to meet the required minimum level for any relevant capital measure. An undercapitalized institution:
•has a total risk-based capital ratio of less than 8%; or
•has a Tier 1 risk-based capital ratio of less than 6%; or
•has a common equity Tier 1 risk-based capital ratio of less than 4.5% or greater; or
•has a leverage capital ratio of less than 4%.
•Significantly Undercapitalized—The institution is significantly below the required minimum level for any relevant capital measure. A significantly undercapitalized institution:
•has a total risk-based capital ratio of less than 6%; or
•has a Tier 1 risk-based capital ratio of less than 4%; or
•has a common equity Tier 1 risk-based capital ratio of less than 3% or greater; or
•has a leverage capital ratio of less than 3%.
•Critically Undercapitalized—The institution fails to meet a critical capital level set by the appropriate federal banking agency. A critically undercapitalized institution has a ratio of tangible equity to total assets that is equal to or less than 2%.
The FDIA generally prohibits a depository institution from making any capital distributions (including payment of a dividend) or paying any management fee to its parent holding company if the depository institution would thereafter be “undercapitalized.” Moreover, if the institution becomes less than adequately capitalized, it must adopt a capital restoration plan acceptable to the FDIC. The institution also would become subject to increased regulatory oversight and is increasingly restricted in the scope of its permissible activities. Except under limited circumstances consistent with an accepted capital restoration plan, an undercapitalized institution may not grow. An undercapitalized institution may not acquire another institution, establish additional branch offices or engage in any new line of business unless it is determined by the appropriate federal banking agency to be consistent with an accepted capital restoration plan or unless the FDIC determines that the proposed action will further the purpose of PCA. A critically undercapitalized institution is subject to having a receiver or conservator appointed to manage its affairs.
In addition to measures taken under the PCA provisions, insured banks may be subject to potential actions by the federal regulators for unsafe or unsound practices in conducting their businesses or for violations of any law, rule, regulation or any condition imposed in writing by the agency or any written agreement with the agency. Enforcement actions may include the issuance of cease and desist orders that can be judicially enforced, the imposition of civil money penalties, the issuance of directives to increase capital, formal and informal agreements, the imposition of a conservator or receiver, or removal and prohibition orders against “institution-affiliated” parties, and termination of insurance of deposits. The NYDFS also has broad powers to enforce compliance with New York laws and regulations.
Community Reinvestment Act Requirements
We are subject to certain requirements and reporting obligations under the Community Reinvestment Act (“CRA”). The CRA generally requires federal banking agencies to evaluate the record of a financial institution in meeting the credit needs of its local communities, including low- and moderate-income neighborhoods. The CRA further requires the agencies to take into account our record of meeting community credit needs when evaluating applications for, among other things, new branches or mergers. We are also subject to analogous state CRA requirements in New York and other states in which we may establish branch offices. In connection with their assessments of CRA performance, the FDIC and NYDFS assign a rating of “outstanding,” “satisfactory,” “needs to improve,” or “substantial noncompliance.” We received a “satisfactory” CRA Assessment Rating from both regulatory agencies in our most recent examinations. The federal banking agencies may take compliance with such laws and CRA into account when regulating and supervising other activities of the bank, including in acting on expansionary proposals.
In October 2023, federal bank agencies adopted a final rule to strengthen and modernize regulations implementing the CRA (the "CRA Rule"), which requires evaluation of bank performance to further address inequities in access to credit, and which would emphasize smaller-value loans and investments to low- and moderate-income communities. The CRA Rule also updates CRA assessment areas to include activities associated with online and mobile banking, and adopts a metrics-based approach to CRA evaluations of retail lending and community development financing. Some provisions of the CRA Rule will become effective on
23
April 1, 2024, while most provisions will become effective on January 1, 2026. Certain additional data collection and reporting requirements will not become effective until January 1, 2027.
Fair Lending Requirements
We are subject to certain fair lending requirements and reporting obligations involving lending operations. A number of laws and regulations provide these fair lending requirements and reporting obligations, including, at the federal level, the Equal Credit Opportunity Act (“ECOA”), as amended by the Dodd-Frank Act, and Regulation B, as well as the Fair Housing Act (“FHA”) and regulations implementing FHA found at 24 C.F.R. Part 100. ECOA and Regulation B prohibit discrimination in any aspect of a credit transaction based on a number of prohibited factors, including race or color, religion, national origin, sex, marital status, age, the applicant’s receipt of income derived from public assistance programs, and the applicant’s exercise, in good faith, of any right under the Consumer Credit Protection Act. ECOA and Regulation B include lending acts and practices that are specifically prohibited, permitted, or required, and these laws and regulations proscribe data collection requirements, legal action statute of limitations, and disclosure of the consumer’s ability to receive a copy of any appraisal(s) and valuation(s) prepared in connection with certain loans secured by dwellings. FHA prohibits discrimination in all aspects of residential real-estate related transactions based on prohibited factors, including race or color, national origin, religion, sex, familial status, and handicap. Fair lending requirements can also be imposed at the state level, including through Section 296-A of the New York Executive Law.
In addition to prohibiting discrimination in credit transactions on the basis of prohibited factors, these laws and regulations can cause a lender to be liable for policies that result in a disparate treatment of or have a disparate impact on a protected class of persons. If a pattern or practice of lending discrimination is alleged by a regulator, then the matter may be referred by the agency to the U.S. Department of Justice (“DOJ”) for investigation. In December 2012, the DOJ and CFPB entered into a Memorandum of Understanding under which the agencies have agreed to share information, coordinate investigations, and have generally committed to strengthen their coordination efforts.
In addition to substantive penalties and corrective measures that may be required for a violation of certain fair lending laws, the federal banking agencies may take compliance with fair lending requirements into account when regulating and supervising other activities of the bank, including in acting on expansionary proposals
Consumer Protection Regulations
Our activities are subject to a variety of statutes and regulations—both at the federal and state levels—designed to protect consumers. This includes Title X of the Dodd-Frank Act, which prohibits engaging in any unfair, deceptive, or abusive acts or practices (“UDAAP”). UDAAP claims involve detecting and assessing risks to consumers and to markets for consumer financial products and services. Interest and other charges collected or contracted for by us are subject to state usury laws and federal laws concerning interest rates. Our loan operations are also subject to federal laws applicable to credit transactions, such as:
•the Truth-In-Lending Act (“TILA”) and Regulation Z, governing disclosures of credit and servicing terms to consumer borrowers and including substantial new requirements for mortgage lending and servicing, as mandated by the Dodd-Frank Act;
•the Home Mortgage Disclosure Act of 1975 and Regulation C, requiring financial institutions to provide information to enable the public and public officials to determine whether a financial institution is fulfilling its obligation to help meet the housing needs of the communities it serves, and requiring collection and disclosure of data about applicant and borrower characteristics to assist in identifying possible discriminatory lending patterns and enforcing antidiscrimination statutes;
•the ECOA and Regulation B, prohibiting discrimination on the basis of race, color, religion, or other prohibited factors in any aspect of a credit transaction;
•the Fair Credit Reporting Act of 1978, as amended by the Fair and Accurate Credit Transactions Act and Regulation V, as well as the rules and regulations of the FDIC governing the use of consumer reports and provision of information to credit reporting agencies, certain identity theft protections and certain credit and other disclosures;
•the Fair Debt Collection Practices Act and Regulation F, governing the manner in which consumer debts may be collected by collection agencies and intending to eliminate abusive, deceptive, and unfair debt collection practices;
24
•the Real Estate Settlement Procedures Act (“RESPA”) and Regulation X, which governs aspects of residential mortgage loans, including the settlement and servicing process, dictates certain disclosures to be provided to consumers, and imposes other requirements related to compensation of service providers, insurance escrow accounts, and loss mitigation procedures;
•The Secure and Fair Enforcement for Mortgage Licensing Act (“SAFE Act”) which mandates a nationwide licensing and registration system for residential mortgage loan originators. The SAFE Act also prohibits individuals from engaging in the business of a residential mortgage loan originator without first obtaining and maintaining annually registration as either a federal or state licensed mortgage loan originator;
•The Homeowners Protection Act (“HPA”), or the PMI Cancellation Act, provides requirements relating to private mortgage insurance (PMI) on residential mortgages, including the cancelation and termination of PMI, disclosure and notification requirements, and the requirement to return unearned premiums;
•The FHA prohibits discrimination in all aspects of residential real-estate related transactions based on race or color, national origin, religion, sex, and other prohibited factors;
•The Servicemembers Civil Relief Act (“SCRA”) and Military Lending Act (“MLA”), providing certain protections for servicemembers, members of the military, and their respective spouses, dependents and others; and
•Section 106(c)(5) of the Housing and Urban Development Act requires making home ownership available to eligible homeowners.
Our deposit operations are also subject to federal laws, such as:
•the FDIA, which, among other things, imposes a minimum amount of deposit insurance available per account to $250,000 and imposes other limits on deposit-taking;
•the Right to Financial Privacy Act, which imposes a duty to maintain the confidentiality of consumer financial records and prescribes procedures for complying with administrative subpoenas of financial records;
•the Electronic Funds Transfer Act and Regulation E, which governs the rights, liabilities, and responsibilities of consumers and financial institutions using electronic fund transfer services, and which generally mandates disclosure requirements, establishes limitations on liability applicable to consumers for unauthorized electronic fund transfers, dictates certain error resolution processes, and applies other requirements relating to automatic deposits to and withdrawals from deposit accounts;
•the Expedited Funds Availability Act (“EFA Act”) and Regulation CC, setting forth requirements to make funds deposited into transaction accounts available according to specified time schedules, disclose funds availability policies to customers, and relating to the collection and return of checks and electronic checks, including the rules regarding the creation or receipt of substitute checks; and
•the Truth in Savings Act (“TISA”) and Regulation DD, which requires depository institutions to provide disclosures so that consumers can make meaningful comparisons about depository institutions and accounts.
In addition, we are subject to increased regulations concerning consumer privacy, including the California Consumer Privacy Act ("CCPA") with respect to certain data regarding California residents and the NYDFS Cybersecurity Regulations, as amended by NYDFS in November 2023.
The CFPB is an independent regulatory authority housed within the Federal Reserve. The CFPB has broad authority to regulate the offering and provision of consumer financial products and services. The CFPB has the authority to supervise and examine depository institutions with more than $10 billion in assets for compliance with federal consumer laws. The authority to supervise and examine depository institutions with $10 billion or less in assets, such as us, for compliance with federal consumer laws remains largely with those institutions’ primary regulators. However, the CFPB may participate in examinations of these smaller institutions on a “sampling basis” and may refer potential enforcement actions against such institutions to their primary regulators. As such, the CFPB may participate in examinations of the Bank. In addition, states are permitted to adopt consumer protection laws and regulations that are stricter than the regulations promulgated by the CFPB, and state attorneys general are permitted to enforce consumer protection rules adopted by the CFPB against certain institutions.
25
The CFPB has issued a number of significant rules that impact nearly every aspect of the lifecycle of consumer financial products and services, including rules regarding a residential mortgage loan. These rules implement Dodd-Frank Act amendments to the ECOA, TILA and RESPA. Among other things, the rules adopted by the CFPB require banks to: (i) develop and implement procedures to ensure compliance with a “reasonable ability-to-repay” test; (ii) implement new or revised disclosures, policies and procedures for originating and servicing mortgages, including, but not limited to, pre-loan counseling, early intervention with delinquent borrowers and specific loss mitigation procedures for loans secured by a borrower’s principal residence, and mortgage origination disclosures, which integrate existing requirements under TILA and RESPA; (iii) comply with additional restrictions on mortgage loan originator hiring and compensation; and (iv) comply with new disclosure requirements and standards for appraisals and certain financial products.
In March 2023, the CFPB adopted a final rule requiring covered lenders to collect information about their small business credit applications and report that information to the CFPB. Covered lenders that originate at least 2,500 small business loans annually must collect small business application data starting October 1, 2024, while lenders that originate at least 500 loans annually must collect small business application data starting April 1, 2025. Due to our small business lending volume, we anticipate that we will be required to comply with this rule by 2025, depending on the outcome of pending litigation challenging the final rule.
In recent years, the CFPB has increasingly scrutinized fees charged to consumers. In 2023, the CFPB brought enforcement actions against several financial institutions relating to consumer fees such as a subcategory of overdraft fee commonly referred to as an “APSN fee.” In October 2023, the CFPB issued an advisory opinion letter warning large financial institutions against charging fees to consumers in connection with account information requests. In January 2024, the CFPB issued a proposed rule entitled “Fees for Instantaneously Declined Transactions,” which proposes “to prohibit covered financial institutions from charging fees, such as nonsufficient funds fees, when consumers initiate payment transactions that are instantaneously declined”. As regulatory expectations regarding the assessment of fees continue to evolve, we may need to implement changes to our fees which could negatively impact our revenue.
Bank regulators take into account compliance with consumer protection laws when considering approval of expansionary proposals.
Anti-Money Laundering Regulation
As a financial institution, we must maintain anti-money laundering programs that include established internal policies, procedures and controls, a designated compliance officer, an ongoing employee training program, and testing of the program by an independent audit function. The program must comply with the anti-money laundering provisions of the Financial Recordkeeping and Reporting of Currency and Foreign Transactions Act of 1970, commonly referred to as the Bank Secrecy Act (“BSA”). Financial institutions are prohibited from entering into specified financial transactions and account relationships and must meet enhanced standards for due diligence and “knowing your customer” in their dealings with foreign financial institutions, foreign customers and other high risk customers. Financial institutions must also take reasonable steps to conduct enhanced scrutiny of account relationships to guard against money laundering and to report any suspicious transactions. Financial institutions must comply with requirements regarding risk-based procedures for conducing ongoing customer due diligence, which requires us to take appropriate steps to understand the nature and purpose of customer relationships and identify and verify the identity of the beneficial owners of legal entity customers.
Current laws, such as the Uniting and Strengthening America by Providing Appropriate Tools Required to Intercept and Obstruct Terrorism (“USA PATRIOT Act") (which amended the BSA), as described below, provide law enforcement authorities with increased access to financial information maintained by banks. Anti-money laundering obligations have been substantially strengthened as a result of the USA PATRIOT Act. Bank regulators routinely examine institutions for compliance with these obligations, and this area has become a particular focus of the regulators in recent years. In addition, the regulators are required to consider compliance in connection with the regulatory review of certain applications. In recent years, regulators have expressed concern over banking institutions’ compliance with anti-money laundering requirements and, in some cases, have delayed approval of their expansionary proposals. The regulators and other governmental authorities have been active in imposing “cease
26
and desist” orders and significant money penalty sanctions against institutions found to be in violation of the anti-money laundering regulations.
On January 1, 2021, Congress enacted the National Defense Authorization Act for Fiscal Year 2021 (“NDAA”). The NDAA provides for one of the most significant overhauls of the BSA and related anti-money laundering laws since the USA PATRIOT Act. Notably, changes include:
•expansion of coordination and information sharing efforts among the agencies tasked with administering anti-money laundering and countering the financing of terrorism requirements, including the Financial Crimes Enforcement Network (“FinCEN”), the primary federal banking regulators, federal law enforcement agencies, national security agencies, the intelligence community, and financial institutions;
•providing additional penalties with respect to violations of BSA and enhancing the powers of FinCEN;
•significant updates to the beneficial ownership collection rules and the creation of a registry of beneficial ownership which will track the beneficial owners of reporting companies which may be shared with law enforcement and financial institutions conducting due diligence under certain circumstances;
•improvements to existing information sharing provisions that permit financial institutions to share information relating to Suspicious Activity Reports with foreign branches, subsidiaries, and affiliates (except those located in China, Russia, or certain other jurisdictions) for the purpose of combating illicit finance risks; and
•enhanced whistleblower protection provisions, allowing whistleblower(s) who provide original information which leads to successful enforcement of anti-money laundering laws in certain judicial or administrative actions resulting in certain monetary sanctions to receive up to 30 percent of the amount that is collected in monetary sanctions as well as increased protections;
We are also subject to New York anti-money laundering laws and regulations. In June 2016, the NYDFS adopted a final rule that requires certain New York-regulated financial institutions, including us, to comply with enhanced anti-terrorism and anti-money laundering requirements beginning in 2017. The rule adds, among other anti-money laundering program requirements, greater specificity to certain transaction monitoring and filtering requirements and the obligation to conduct an ongoing, comprehensive risk assessment and expressly eliminates a regulated institution’s ability to adjust its monitoring and filtering programs to limit the number of alerts generated. Beginning in April 2018, the rule also required the Bank's BSA/AML Officer to submit certification of compliance with these requirements annually.
ERISA
We are also subject to regulation under the fiduciary laws of Employee Retirement Income Security Act of 1974 (“ERISA”), and to regulations promulgated thereunder, insofar as we are a “fiduciary” or service provider under ERISA with respect to certain of our clients. When we act as an ERISA fiduciary, we represent ERISA plans by taking fiduciary responsibility with respect to such plan’s transactions or investments. ERISA and the applicable provisions of the Code, impose certain duties on persons who are fiduciaries under ERISA, and prohibit certain transactions by the fiduciaries (and certain other related parties) to such plans. The foregoing laws and regulations generally grant supervisory agencies broad administrative powers, including the power to limit or restrict us from conducting certain business in the event that we fail to comply with such laws and regulations. Possible sanctions that may be imposed in the event of such noncompliance include the suspension of individual employees, limitations on the business activities for specified periods of time, revocation of registration, and other censures and fines and the potential of civil litigation.
USA PATRIOT Act
The USA PATRIOT Act became effective on October 26, 2001 and amended the BSA. The USA PATRIOT Act provides, in part, for the facilitation of information sharing among governmental entities and financial institutions for the purpose of combating terrorism and money laundering by enhancing anti-money laundering and financial transparency laws, as well as enhanced information collection tools and enforcement mechanisms for the U.S. government, including:
•due diligence requirements for financial institutions that administer, maintain, or manage private bank accounts or correspondent accounts for non-U.S. persons;
27
•requiring standards for verifying customer identification at account opening;
•rules to promote cooperation among financial institutions, regulators and law enforcement entities in identifying parties that may be involved in terrorism or money laundering;
•reports by nonfinancial trades and businesses filed with the Treasury Department’s Financial Crimes Enforcement Network for transactions exceeding $10,000; and
•filing suspicious activities reports by brokers and dealers if they believe a customer may be violating U.S. laws and regulations.
The USA PATRIOT Act requires financial institutions to undertake enhanced due diligence of private bank accounts or correspondent accounts for non-U.S. persons that they administer, maintain, or manage. Bank regulators routinely examine institutions for compliance with these obligations and are required to consider compliance in connection with the regulatory review of applications.
Under the USA PATRIOT Act, FinCEN can send Amalgamated lists of the names of persons suspected of involvement in terrorist activities or money laundering. Amalgamated may be requested to search its records for any relationships or transactions with persons on those lists. If we find any relationships or transactions, we must report those relationships or transactions to FinCEN.
The Office of Foreign Assets Control
The Office of Foreign Assets Control (“OFAC”), which is an office in the U.S. Department of the Treasury, is responsible for helping to ensure that U.S. entities do not engage in transactions with “enemies” of the United States, as defined by various Executive Orders and Acts of Congress. OFAC publishes lists of names of persons and organizations suspected of aiding, harboring or engaging in terrorist acts; owned or controlled by, or acting on behalf of target countries, and narcotics traffickers. If a bank finds a name on any transaction, account or wire transfer that is on an OFAC list, it must freeze or block the transactions on the account. Amalgamated has appointed a compliance officer to oversee the inspection of its accounts and the filing of any notifications. Amalgamated checks high-risk OFAC areas such as new accounts, wire transfers and customer files. These checks are performed using software that is updated each time a modification is made to the lists provided by OFAC and other agencies of Specially Designated Nationals and Blocked Persons.
Financial Privacy and Cybersecurity
There are a number of state and federal laws and regulations that govern financial privacy and cybersecurity. At the federal level, this includes the privacy protection provisions of the Gramm-Leach-Bliley Act of 1999 (“GLBA”) and related regulations, including Regulation P, which govern the treatment of nonpublic personal information. Under these privacy protection provisions, we are limited in our ability to disclose non-public information about consumers to nonaffiliated third parties. These limitations require disclosure of privacy policies and notices to consumers and, in some circumstances, allow consumers to prevent disclosure of certain personal information to a nonaffiliated third party. Federal banking agencies, including the FDIC, have adopted guidelines for establishing information security standards and cybersecurity programs for implementing safeguards under the supervision of the Board of Directors. These guidelines, along with related regulatory materials, increasingly focus on risk management and processes related to information technology and the use of third parties in the provision of financial services.
State laws and regulations governing financial privacy and cybersecurity include the CCPA and the California Privacy Rights Act ("CPRA"), which amends and supplements the CCPA, with respect to certain data regarding California residents, the New York Department of Financial Services Cybersecurity Regulations, and other New York financial privacy laws and regulations. The NYDFS issued a rule, effective March 1, 2017, that requires banks, insurance companies, and other financial services institutions regulated by the NYDFS to establish and maintain a cybersecurity program designed to protect consumers and ensure the safety and soundness of New York State’s financial services industry. The cybersecurity rule adds specific requirements for these institutions’ cybersecurity compliance programs and imposes an obligation to conduct an ongoing, comprehensive risk assessment and requires each institution’s Board of Directors, or a senior officer, to submit annual certifications of compliance with these requirements. Amendments effective November 1, 2023 further tailor the regulation to three tiers of companies with different defensive needs, increase governance and controls, and require more regular risk and vulnerability assessments.
28
Transactions with Related Parties
Transactions between banks and their affiliates are limited by Sections 23A and 23B of the Federal Reserve Act. An affiliate of a bank is any company or entity that controls, is controlled by or is under common control with the bank. In a holding company context, the parent bank holding company and any companies which are controlled by such parent holding company are affiliates of the bank.
Generally, Sections 23A and 23B of the Federal Reserve Act and Regulation W (i) limit the extent to which the bank or its subsidiaries may engage in “covered transactions” with any one affiliate to an amount equal to 10% of such institution’s capital stock and surplus, and contain an aggregate limit on all such transactions with all affiliates to an amount equal to 20% of such institution’s capital stock and surplus and (ii) require that all such transactions be on terms substantially the same, or at least as favorable, to the institution or subsidiary as those provided to non-affiliates. The term “covered transaction” includes the making of loans, purchase of assets, issuance of a guarantee and other similar transactions. In addition, loans or other extensions of credit by the financial institution to the affiliate are required to be collateralized in accordance with the requirements set forth in Section 23A of the Federal Reserve Act.
The Federal Reserve Act and its implementing Regulation O also provide limitations on our ability to extend credit to executive officers, directors and 10% stockholders (“insiders”). The law limits both the individual and aggregate amount of loans we may make to insiders based, in part, on our capital position and requires certain board approval procedures to be followed. Such loans are required to be made on terms substantially the same as those offered to unaffiliated individuals and must not involve more than the normal risk of repayment. There is an exception for loans made pursuant to a benefit or compensation program that is widely available to all employees of the institution and does not give preference to insiders over other employees. Loans to executive officers are further limited to specific categories.
On December 22, 2020, the federal banking agencies issued an interagency statement extending the temporary relief from enforcement action against banks or asset managers, which become principal shareholders of banks, with respect to certain extensions of credit by banks that otherwise would violate Regulation O, provided the asset managers and banks satisfy certain conditions designed to ensure that there is a lack of control by the asset manager over the bank. This relief has been extended and expired on January 1, 2023.
Incentive Compensation
Guidelines adopted by the federal banking agencies pursuant to the FDIA prohibit excessive compensation as an unsafe and unsound practice and describe compensation as excessive when the amounts paid are unreasonable or disproportionate to the services performed by an executive officer, employee, director or principal stockholder.
In June 2010, the federal banking agencies jointly adopted the Guidance on Sound Incentive Compensation Policies (“GSICP”). The GSICP intended to ensure that banking organizations do not undermine the safety and soundness of such organizations by encouraging excessive risk-taking. This guidance, which covers all employees that have the ability to expose the organization to material amounts of risk, either individually or as part of a group, is based upon a set of key principles relating to a banking organization’s incentive compensation arrangements. Specifically, incentive compensation arrangements should (i) provide employee incentives that appropriately balance risk in a manner that does not encourage employees to expose their organizations to imprudent risk, (ii) be compatible with effective controls and risk management, and (iii) be supported by strong corporate governance, including active and effective oversight by the organization’s Board of Directors. Any deficiencies in our compensation practices could lead to supervisory or enforcement actions by the FDIC.
The Dodd-Frank Act requires the federal banking agencies and the SEC to establish joint regulations or guidelines prohibiting incentive-based payment arrangements at specified regulated entities, such as us, having at least $1 billion in total assets that encourage inappropriate risk-taking by providing an executive officer, employee, director or principal stockholder with excessive compensation, fees, or benefits or that could lead to material financial loss to the entity. In addition, these regulators must establish regulations or guidelines requiring enhanced disclosure to regulators of incentive-based compensation arrangements. The federal banking agencies proposed such regulations in April 2011 and issued a second proposed rule in April 2016. The second proposed rule would apply to all banks, among other institutions, with at least $1 billion in average total consolidated assets. Final regulations have not been adopted as of December 31, 2023. If adopted, these or other similar regulations would impose limitations on the manner in which we may structure compensation for our executives and other employees. The scope and content of the federal banking agencies’ policies on incentive compensation are continuing to develop and are likely to continue evolving.
29
In October 2016, the NYDFS also announced a renewed focus on employee incentive arrangements and issued guidance to New York State-regulated banks to ensure that these arrangements do not encourage inappropriate practices. The guidance listed adapted versions of the key principles from the Guidance on Sound Incentive Compensation Policies as minimum requirements and advised these banks that incentive compensation arrangements must be subject to effective risk management, oversight, and control.
In addition, the Tax Cuts and Jobs Act of 2017 contains certain provisions affecting performance-based compensation. Specifically, the pre-existing exception to the $1 million deduction limitation applicable to performance-based compensation was repealed. The deduction limitation is now applied to all compensation exceeding $1.0 million, for our covered employees, regardless of how it is classified, which would have an adverse effect on income tax expense and net income.
Deposit Premiums and Assessments
As an FDIC-insured bank, we must pay deposit insurance assessments to the FDIC based on our average total assets minus our average tangible equity. Deposits are insured up to applicable limits by the FDIC and such insurance is backed by the full faith and credit of the U.S. Government.
As an institution with less than $10 billion in assets, our assessment rates are based on the level of risk we pose to the FDIC’s deposit insurance fund (DIF). Pursuant to changes adopted by the FDIC that were effective July 1, 2016, the initial base rate for deposit insurance is between three and 30 basis points. Total base assessment after possible adjustments now ranges between 1.5 and 40 basis points. For established smaller institutions, like us, the total base assessment rate is calculated by using supervisory ratings as well as (i) an initial base assessment rate, (ii) an unsecured debt adjustment (which can be positive or negative), and (iii) a brokered deposit adjustment.
In addition to the ordinary assessments described above, the FDIC has the ability to impose special assessments in certain instances. For example, under the Dodd-Frank Act, the minimum designated reserve ratio for the DIF was increased to 1.35% of the estimated total amount of insured deposits. On September 30, 2018, the DIF reached 1.36%, exceeding the statutorily required minimum reserve ratio of 1.35%. On reaching the minimum reserve ratio of 1.35%, FDIC regulations provided for two changes to deposit insurance assessments: (i) surcharges on insured depository institutions with total consolidated assets of $10 billion or more (large institutions) ceased; and (ii) small banks were to receive assessment credits for the portion of their assessments that contributed to the growth in the reserve ratio from between 1.15% and 1.35%, to be applied when the reserve ratio is at or above 1.38%. These assessment credits started with the June 30, 2019 assessment invoiced in September 2019 and ran off in March 2020. Assessment rates are expected to decrease if the reserve ratio increases such that it exceeds 2%.
The FDIC may terminate the deposit insurance of any insured depository institution if it determines after a notice and hearing that the institution has engaged in unsafe or unsound practices, is in an unsafe or unsound condition to continue operations or has violated any applicable law, regulation, rule, order or condition imposed by the FDIC.
CRE Guidance
In 2022 and 2023, CRE markets faced significant headwinds due to increased vacancies, elevated interest rates, and declining property values, among other factors. In June 2023, the FDIC and other federal banking agencies, in consultation with the Federal Financial Institutions Examination Council State Liaison Committee, issued guidance entitled “Interagency Policy Statement on Prudent Commercial Real Estate Loan Accommodations and Workouts” (the “2023 CRE Guidance”), which replaced agencies’ 2009 “Policy Statement on Prudent Commercial Real Estate Loan Workouts”. The 2023 CRE Guidance discusses the importance of working constructively with CRE borrowers experiencing financial difficulty and is appropriate for all supervised financial institutions engaged in CRE lending.
The 2023 CRE Guidance also addresses (i) risk management, (ii) classification of loans, (iii) regulatory reporting, and (iv) accounting considerations.
The federal banking regulators previously issued guidance in December 2015 entitled “Interagency Statement on Prudent Risk Management for Commercial Real Estate Lending” (the “2015 CRE Guidance”). In the 2015 CRE Guidance, the federal banking regulators (i) expressed concerns with institutions that ease CRE underwriting standards, (ii) directed financial institutions to maintain underwriting discipline and exercise risk management practices to identify, measure and monitor lending risks, and (iii) indicated that they will continue to pay special attention to CRE lending activities and concentrations. The federal banking regulators also previously issued guidance in December 2006, entitled “Interagency Guidance on Concentrations in CRE Lending, Sound Risk Management Practices,” which stated that an institution that is potentially exposed to significant CRE concentration
30
risk should employ enhanced risk management practices. Specifically, the guidance states that such institutions have (1) total CRE loans representing 300% or more of the institution’s total capital and (2) the outstanding balance of such institution’s CRE loan portfolio has increased by 50% or more during the prior 36 months.
Effect of Governmental Monetary Policies
Our earnings are affected by domestic economic conditions and the monetary policies of the U.S. and its agencies. The Federal Open Market Committee’s monetary policies have had, and are likely to continue to have, an important effect on the operating results of banks through its power to implement national monetary policy in order, among other things, to curb inflation or combat a recession. The monetary policies of the Federal Reserve have major effects on the levels of bank loans, investments and deposits through its open market operations in U.S. government securities and through its regulation of the discount rate on borrowings of member banks and the reserve requirements against member bank deposits. We cannot predict the nature or effect of future changes in such monetary policies.
Future Legislation and Regulation
Congress may enact legislation from time to time that affects the regulation of the financial services industry, and state legislatures may enact legislation from time to time affecting the regulation of financial institutions chartered by or operating in those states. Federal and state regulatory agencies also periodically propose and adopt changes to their regulations or change the manner in which existing regulations are applied or interpreted. The substance or impact of pending or future legislation or regulation, or the application thereof, cannot be predicted, although enactment of the proposed legislation has in the past and may in the future affect the regulatory structure under which we operate and may significantly increase our costs, impede the efficiency of our internal business processes, require us to increase our regulatory capital or modify our business strategy, or limit our ability to pursue business opportunities in an efficient manner. Our business, financial condition, results of operations or prospects may be adversely affected, perhaps materially, as a result.
31
Item 1A. Risk Factors.
There are risks, many beyond our control, that could cause our financial condition or results of operations to differ materially from management’s expectations. Any of the following risks, by itself or together with one or more other factors, could adversely affect our business, prospects, financial condition, results of operations and cash flows, perhaps materially. The risks presented below are not the only risks that we face. Additional risks that we do not presently know or that we currently deem immaterial may also have an adverse effect on our business, results of operations, financial condition, prospects, and the market price and liquidity of our common stock. The following discussion should be read in conjunction with the financial statements and notes to the financial statements included in this report. Further, to the extent that any of the information contained in this report constitutes forward-looking statements, the risk factors below also are cautionary statements identifying important factors that could cause actual results to differ materially from those expressed in any forward-looking statements made by us or on our behalf. See “Cautionary Note Regarding Forward-Looking Statements” beginning on page 1.
Market and Interest Rate Risks
Our business may be adversely affected by economic conditions.
Some elements of the business environment that affect our financial performance include short-term and long-term interest rates, the prevailing yield curve, inflation, monetary supply, fluctuations in the debt and equity capital markets, and the strength of the domestic economy and the local economies in the markets in which we operate. Unfavorable market conditions can result in a deterioration of the credit quality of borrowers, an increase in the number of loan delinquencies, defaults and charge-offs, foreclosures, additional provisions for credit losses, adverse asset values and a reduction in assets under management or administration. The majority of our loan portfolio is secured by real estate, 8.0% of which is commercial real estate. A decline in real estate values can negatively impact our ability to recover our investment should the borrower become delinquent. Loans secured by stock or other collateral may be adversely impacted by a downturn in the economy and other factors that could reduce the recoverability of our investment. Unsecured loans are dependent on the solvency of the borrower, which can deteriorate, leaving us with a risk of loss. Unfavorable or uncertain economic and market conditions can be caused by declines in economic growth, business activity or investor or business confidence, limitations on the availability of or increases in the cost of credit and capital, increases in inflation or interest rates, high unemployment, natural disasters, epidemics and pandemics (such as COVID-19), state or local government insolvency, or a combination of these or other factors.
There are continuing concerns related to, among other things, the level of U.S. government debt and fiscal actions that may be taken to address that debt, price fluctuations of key natural resources, the potential resurgence of economic and political tensions with China, the Russian invasion of Ukraine and increasing oil prices due to Russian supply disruptions, and the Israel-Hamas conflict, each of which may have a destabilizing effect on financial markets and economic activity. Economic pressure on consumers, including due to factors such as inflation and the end of student loan repayment moratoriums, as well as overall economic uncertainty may result in changes in consumer and business spending, borrowing and saving habits. These economic conditions and/or other negative developments in the domestic or international credit markets or economies may significantly affect the markets in which we do business, the value of our loans and investments, and our ongoing operations, costs and profitability. Declines in real estate values and sales volumes, high unemployment or underemployment, and inflation may also result in higher than expected loan delinquencies, increases in our levels of nonperforming and classified assets and a decline in demand for our products and services. These negative events may cause us to incur losses and may adversely affect our capital, liquidity and financial condition.
Fiscal challenges facing the U.S. government could negatively impact the value of investments in GSEs and the financial markets, which in turn could have an adverse effect on our financial position or results of operations.
Fiscal challenges facing the U.S. government, such as the recent downgrade of the sovereign credit ratings of the U.S. by Fitch Ratings, could have an adverse impact on value of investments in GSEs and on the financial markets, interest rates and economic conditions in the U.S. and worldwide. Federal budget deficit concerns and the potential for political conflict over legislation to fund U.S. government operations and raise the U.S. government's debt limit may increase the possibility of a default by the U.S. government on its debt obligations, additional related credit-rating downgrades, or an economic recession in the U.S. A significant portion of our securities portfolio is invested in GSE securities. As a result of uncertain domestic political conditions, including potential future federal government shutdowns or the possibility of the federal government defaulting on its obligations for a period of time, investments in financial instruments issued or guaranteed by the federal government pose liquidity and credit risks.
32
A debt default or further downgrades to the U.S. government’s sovereign credit rating or its perceived creditworthiness could also adversely affect the ability of the U.S. government to support the financial stability of Fannie Mae, Freddie Mac and the FHLBNY, with which we do business and in whose securities we invest.
Changes in U.S. trade policies and other global political factors beyond our control, including the imposition of tariffs, retaliatory tariffs, or other sanctions, may adversely impact our business, financial condition and results of operations.
There have been, and may be in the future, changes with respect to U.S. and international trade policies, legislation, treaties and tariffs, embargoes, sanctions and other trade restrictions. Tariffs, retaliatory tariffs or other trade restrictions on products and materials that customers import or export, or a trade war or other related governmental actions related to tariffs, international trade agreements or policies or other trade restrictions have the potential to negatively impact our customers' costs, demand for their products, or the U.S. economy or certain sectors thereof and, thus, could adversely impact our business, financial condition and results of operations. U.S. and China disputes over trade, Taiwanese independence and China’s expanding military presence may result in additional tariffs, sanctions and trade restrictions. As a result of Russia’s invasion of Ukraine, the U.S. has imposed, and is likely to impose material additional, financial and economic sanctions and export controls against certain Russian organizations and/or individuals, with similar actions either implemented or planned by the European Union (“EU”) and the U.K. and other jurisdictions. Additionally, an armed conflict involving Hamas and Israel, as well as further escalation of tensions between Israel and various countries in the Middle East and North Africa, may cause additional detrimental effects on the global economy, including capital markets. To the extent changes in the global political environment have a negative impact on us or on the markets in which we operate, our business, results of operations and financial condition could be materially and adversely impacted.
Our operations and clients are concentrated in large metropolitan areas.
The vast majority of our operations and clients are located in New York City, Washington, D.C., and San Francisco. In addition, at December 31, 2023, 88.7% of the properties securing our CRE, multifamily, or construction loans outstanding were located in the states of New York and California, and in Washington, D.C. Our success depends upon the economic vitality, growth prospects, business activity, population, income levels, deposits and real estate activity in those areas and may be impacted by the effects of past and future civil unrest and domestic disturbances in the communities that we serve. In addition, these areas have been and may continue to be the target of terrorist attacks. A major terrorist attack in one of these areas could severely disrupt our operations and the ability of our clients to do business with us and cause losses to loans secured by properties in these areas. Although our customers' business and financial interests may extend well beyond our market areas, adverse economic and social conditions that affect our specific market area could reduce our growth rate, affect the ability of our customers to repay their loans to us and impact the stability of our deposit funding sources. Consequently, declines in economic and social conditions in these markets could generally affect our business, financial condition, results of operations and prospects.
Our business is subject to interest rate risk and fluctuations in interest rates may adversely affect our earnings, capital levels and overall results.
The majority of our assets and liabilities are monetary in nature and, as a result, we are subject to significant risk from changes in interest rates, which may affect our net interest income as well as the valuation of our assets and liabilities. Our earnings depend significantly on our net interest income, which is the difference between interest income on interest-earning assets, such as loans and securities, and interest expense on interest-bearing liabilities, such as deposits and borrowings. We expect to periodically experience “gaps” in the interest rate sensitivities of our assets and liabilities, meaning that either our interest-bearing liabilities will be more sensitive to changes in market interest rates than our interest-earning assets, or vice versa. In either event, if market interest rates move contrary to our position, this “gap” may work against us, and our earnings may be adversely affected.
When interest-bearing liabilities mature or reprice more quickly, or to a greater degree than interest-earning assets in a period, an increase in interest rates could reduce net interest income. Similarly, when interest-earning assets mature or reprice more quickly, or to a greater degree than interest-bearing liabilities, falling interest rates could reduce net interest income. Additionally, an increase in the general level of interest rates may also, among other things, adversely affect the demand for loans and our ability to originate loans and decrease loan prepayment rates or adversely affect our results of operations by reducing the ability of borrowers to make payments under their current adjustable-rate loan obligations. Conversely, a decrease in the general level of interest rates, among other things, may lead to prepayments on our loan and mortgage-backed securities portfolios and increased competition for deposits, potentially reducing our deposit base. Accordingly, changes in the general level of market interest rates may adversely affect our net yield on interest-earning assets, loan origination volume and our overall results.
33
Although our asset-liability management strategy is designed to control and mitigate exposure to the risks related to changes in the general level of market interest rates, those rates are affected by many factors outside of our control, including inflation, recession, unemployment, money supply, international disorder, instability in domestic and foreign financial markets and policies of various governmental and regulatory agencies, particularly the Federal Open Market Committee ("FOMC") of the Federal Reserve. Adverse changes in the U.S. monetary policy or in economic conditions could materially and adversely affect us. In keeping with its commitment to returning inflation to its 2% objective, on January 31, 2024 the FOMC issued a statement that it decided to maintain short-term interest rates at a range of 5.25% to 5.50%, and indicated that the target range would not be reduced until there is greater confidence that inflation is moving sustainably towards 2%. We could experience net interest margin compression if our rates on our interest earning assets fail to increase in tandem with rates on our interest-bearing liabilities. Similarly, if short-term interest rates increase and long-term interest rates do not increase, or increase but at a slower rate, we could experience net interest margin compression as our rates on interest earning assets decline measured relative to rates on our interest-bearing liabilities. Any such occurrence could have a material adverse effect on our net interest income and on our business, financial condition and results of operations.
We may not be able to accurately predict the likelihood, nature and magnitude of changes in market interest rates or how and to what extent they may affect our business. We also may not be able to adequately prepare for or compensate for the consequences of such changes. Any failure to predict and prepare for changes in interest rates or adjust for the consequences of these changes may adversely affect our earnings and capital levels and overall results.
The fair value of our investment securities could fluctuate because of factors outside of our control, which could have a material adverse effect on us.
As of December 31, 2023, the fair value of our investment securities portfolio was approximately $3.03 billion. Factors beyond our control could significantly affect the fair value of these securities. These factors include, but are not limited to, changes in market conditions including changes in interest rates or spreads, changes in the credit profile of individual securities, changes in prepayment behavior of individual securities, rating agency actions in respect of the securities, or adverse regulatory action. Any of these factors, among others, could cause other-than-temporary impairments, or OTTI, and realized and/or unrealized losses in future periods and declines in earnings and/or other comprehensive income (loss), which could materially and adversely affect our assets, business, cash flow, condition (financial or otherwise), liquidity, results of operations and prospects. The process for determining whether impairment of a security is OTTI usually requires complex, subjective judgments about the future financial performance and liquidity of the issuer, any collateral underlying the security as well as our intent and ability to hold the security for a sufficient period of time to allow for any anticipated recovery in fair value in order to assess the probability of receiving all contractual principal and interest payments on the security. Our failure to assess any impairments or losses with respect to our securities could have a material adverse effect on our assets, business, cash flow, condition (financial or otherwise), liquidity, results of operations and prospects.
Credit Risks
If we fail to effectively manage credit risk, our business and financial condition will suffer.
We must effectively manage credit risk. As a lender, we are exposed to the risk that our borrowers will be unable to repay their loans according to their terms, and that the collateral securing repayment of their loans, if any, may not be sufficient to ensure repayment. In addition, there are risks inherent in making any loan, including risks relating to proper loan underwriting, risks resulting from changes in economic and industry conditions and risks inherent in dealing with individual borrowers, including the risk that a borrower may not provide information to us about its business in a timely manner, and/or may present inaccurate or incomplete information to us, and risks relating to the value of collateral. In order to manage credit risk successfully, we must, among other things, maintain disciplined and prudent underwriting standards and ensure that our lenders follow those standards. The weakening of these standards for any reason, such as an attempt to attract higher yielding loans, a lack of discipline or diligence by our employees in underwriting and monitoring loans, the inability of our employees to adequately adapt policies and procedures to changes in economic or any other conditions affecting borrowers and the quality of our loan portfolio, may result in loan defaults, foreclosures and additional charge-offs and may necessitate that we significantly increase our allowance, each of which could adversely affect our net income.
We are subject to risk arising from conditions in the commercial real estate market.
As of December 31, 2023, commercial real estate mortgage loans comprised approximately 8.0% of our loan portfolio. Commercial real estate mortgage loans generally involve a greater degree of credit risk than residential real estate mortgage loans because they typically have larger balances and are more affected by adverse conditions in the economy. Because payments on
34
loans secured by commercial real estate often depend upon the successful operation and management of the properties and the businesses which operate from within them, repayment of such loans may be affected by factors outside the borrower’s control, such as adverse conditions in the real estate market or the economy or changes in government regulations. In recent years, commercial real estate markets have been particularly impacted by the economic disruption resulting from the COVID-19 pandemic. The COVID-19 pandemic has also been a catalyst for the evolution of various remote work options which could impact the long-term performance of some types of office properties within our commercial real estate portfolio. Accordingly, the federal banking regulatory agencies have expressed concerns about weaknesses in the current commercial real estate market. Failures in our risk management policies, procedures and controls could adversely affect our ability to manage this portfolio going forward and could result in an increased rate of delinquencies in, and increased losses from, this portfolio, which, accordingly, could have a material adverse effect on our business, financial condition and results of operations.
We are exposed to higher credit risk related to our multifamily real estate lending in New York City.
In 2019, the New York State legislature passed the Housing Stability and Tenant Protection Act of 2019, impacting about one million rent regulated apartment units. Among other things, the legislation: (i) curtails rent increases from material capital improvements and individual apartment improvements; (ii) all but eliminates the ability for apartments to exit rent regulation; (iii) does away with vacancy decontrol and high-income deregulation; and (iv) repealed the 20% vacancy bonus. The act generally limits a landlord’s ability to increase rents on rent-regulated apartments and makes it more difficult to convert rent-regulated apartments to market-rate apartments. As a result, the value of the collateral located in New York State securing our multi-family loans or the future net operating income of such properties could potentially become impaired. At December 31, 2023, our total multifamily loan exposure in New York State is approximately $775.1 million, of which approximately $571.4 million, or 74%, represents our portfolio’s composition of rent stabilized and rent controlled apartments in the New York multifamily market.
Our solar loans expose us to higher credit risk.
A borrower’s ability to repay their solar loans can be negatively impacted by increases in their payment obligations to other lenders under mortgage, credit card and other loans resulting from increases in base lending rates or structured increases in payment obligations. If a client defaults on solar loan, we may be unsuccessful in our efforts to collect the amount of the loan. We are limited in our ability to collect on these loans if a client is unwilling or unable to repay them. Although solar loans are secured with security filings, we may be limited in our ability to recover any collateral supporting such loans due to the nature of the solar energy system becoming a fixture to the real property. Additionally, these short-term loans are subject to risks of defaults, bankruptcies, fraud, losses and special hazard losses that are not covered by standard hazard insurance. An increase in defaults precipitated by the risks and uncertainties associated with the above operations and activities could have a detrimental effect on our business.
Our estimated allowance for credit losses and fair value adjustments with respect to loans acquired in our acquisitions may prove to be insufficient to absorb actual losses in our loan portfolio, which may adversely affect our business, financial condition and results of operations.
We maintain an allowance for credit losses ("ACL") that represents management’s judgment of current expected credit losses and risks inherent in our loan portfolio. As of December 31, 2023, our ACL totaled $65.7 million, which represents approximately 1.49% of our total loans, net. The level of the allowance reflects management’s continuing evaluation of loan levels and portfolio composition, observable trends in nonperforming loans, historical loss experience, known and inherent risks in the portfolio, underwriting practices, adequacy of collateral, credit risk grading assessments, forecasted economic conditions, and other factors. The determination of the appropriate level of the ACL is inherently highly subjective and requires us to make significant estimates of and assumptions regarding current credit risks and future trends, all of which may undergo material changes. If, as a result of general economic conditions, there is a decrease in asset quality or growth in the loan portfolio, our management determines that additional increases in ACL are necessary, we may incur additional expenses which will reduce our net income, and our business, results of operations or financial condition may be materially and adversely affected. In addition, inaccurate management assumptions, deterioration of economic conditions affecting borrowers, new information regarding existing loans, identification or deterioration of additional problem loans, acquisition of problem loans and other factors, both within and outside of our control, may require us to increase our ACL.
35
Operational and Business Risks
We are at risk of increased losses from fraud.
Fraudulent activity has taken many forms, ranging from check fraud, mechanical devices attached to ATM machines, social engineering and phishing attacks to obtain personal information or impersonation of our clients through the use of falsified or stolen credentials and debit card fraud. Additionally, an individual or business entity may properly identify themselves, particularly when banking online, yet seek to establish a business relationship for the purpose of perpetrating fraud. Further, in addition to fraud committed against us, we may suffer losses as a result of fraudulent activity committed against third parties. Increased deployment of technologies, such as chip card technology, defray and reduce aspects of fraud; however, criminals are turning to other sources to steal personally identifiable information, such as unaffiliated healthcare providers and government entities, in order to impersonate the consumer to commit fraud. Many of these data compromises are widely reported in the media. Further, as a result of the increased sophistication of fraud activity, we have increased our spending on systems and controls to detect and prevent fraud. This will result in continued ongoing investments in the future. Nevertheless, these investments may prove insufficient and fraudulent activity could result in losses to us or our customers; loss of business and/or customers; damage to our reputation; the incurrence of additional expenses (including the cost of notification to consumers, credit monitoring and forensics, and fees and fines imposed by the card networks); disruption to our business; our inability to grow our online services or other businesses; additional regulatory scrutiny or penalties; or our exposure to civil litigation and possible financial liability any of which could have a material adverse effect on our business, financial condition and results of operations.
We could be adversely affected by a failure to establish and maintain effective internal controls over financial reporting.
A failure in our internal controls could have a significant negative impact not only on our earnings, but also on the perception that customers, regulators and investors may have of us. Any failure to maintain internal controls over financial reporting, or any difficulties that we may encounter in such maintenance, could result in significant deficiencies or material weaknesses, result in material misstatements in our consolidated financial statements and cause us to fail to meet our reporting obligations, each of which could result in a material adverse effect on our business, financial condition or results of operations or an adverse reaction in the financial markets due to a loss of confidence in the reliability of our financial statements. We continue to devote a significant amount of effort, time and resources to our controls and ensuring compliance with complex accounting standards and regulations. These efforts also include the management of controls to mitigate operational risks for programs and processes across the Company.
Our third party relationships could expose us to operational and regulatory risks.
We occasionally rely on third parties for internal and customer-facing services. The use of third parties may pose operational, compliance, and strategic risks to banks. The federal banking regulators expect banks implement controls to ensure that third parties perform their activities in compliance with applicable laws and regulations. In June 2023, the federal banking agencies issued “Interagency Guidance on Third-Party Relationships: Risk Management”, which requires banks to “analyze the risks associated with each third-party relationship and to calibrate its risk management processes”.
In addition, in October 2023, the FDIC issued a notice of proposed rulemaking and guidelines entitled “Guidelines Establishing Standards for Corporate Governance and Risk Management for Covered Institutions With Total Consolidated Assets of $10 Billion or More,” which would require covered institutions to implement corporate governance and risk management standards, among other things. Although we are not currently within the scope of institutions subject to the proposed rule, we may encounter heightened expectations for corporate governance and risk management in future FDIC examinations.
We depend on the accuracy and completeness of information about customers and counterparties.
In deciding whether to extend credit or enter into other transactions, and in evaluating and monitoring our loan and lease portfolio on an ongoing basis, we may rely on information furnished by or on behalf of customers and counterparties, including financial statements, credit reports and other financial information. We may also rely on representations of those customers or counterparties or of other third parties, such as independent auditors, as to the accuracy and completeness of that information. Reliance on inaccurate, incomplete, fraudulent or misleading financial statements, credit reports or other financial or business information, or the failure to receive such information on a timely basis, could result in credit losses, reputational damage or other effects that could have a material adverse effect on our business, financial condition or results of operations.
We participate in a multi-employer non-contributory defined benefit pension plan for both our unionized and non-unionized employees, which could subject us to substantial cash funding requirements in the future.
36
We are required to make contributions to the Consolidated Retirement Fund, a multi-employer pension plan that covers both our unionized and non-unionized employees. Our multi-employer pension plan expense totaled $7.2 million in 2023. Our obligations may be impacted by the funding status of the plan, the plan’s investment performance, changes in the participant demographics, financial stability of contributing employers and changes in actuarial assumptions. In addition, if a participating employer becomes insolvent and ceases to contribute to a multiemployer plan, the unfunded obligation of the plan will be borne by the remaining participating employers. Under current law, an employer that withdraws or partially withdraws from a multi-employer pension plan may incur withdrawal liability to the plan. If, in the future, we choose to withdraw from this multi-employer pension plan, we will likely need to record significant withdrawal liabilities, which could negatively impact our financial performance in the applicable periods.
Climate change and material environmental sustainability may have an effect on the performance of our business operations and asset quality which could adversely affect our financial condition and results of operations.
We are subject to the growing risk of climate change. There is an increasing concern over climate-related risks and material environmental sustainability on the impacts of business operations, asset quality, and earnings. The risks related to the physical impacts of climate change include acute risks which are event-driven such as increased instances of hurricanes, tropical storms, winter storms, freezes, wildfires, tornados, floods, and other large-scale weather catastrophes. Additionally, there are chronic physical risks which are long-term global impacts from rising average temperature and sea levels. Any of these events could disrupt the reliability of our operations and those of our customers, and third party vendors and suppliers. Such events could impair the value of our assets and those assets securing loans and mortgages in our portfolio, and they could lead to fluctuations in the value of our investments. Such events could cause downturns in economic and market conditions generally, which could negatively impact our customers and third party suppliers and vendors and which could have an adverse effect on our business and financial results. Our expenses could increase due to consumer preference changes and increased legislation and regulatory requirements such as those associated with the transition to a low-carbon economy. The potential costs, including strategic planning, litigation due to increased regulatory scrutiny or negative public sentiment, technology expenditures, and losses associated with climate change related risks are difficult to predict and could have a material adverse effect on our business, financial condition and results of operation.
We are exposed to risks related to our PACE financings.
Property Assessed Clean Energy ("PACE") financing is a means of financing energy-efficient upgrades or the installation of renewable energy sources for commercial, industrial and residential properties that are repaid over a selected term through property tax assessments, which are secured by the property itself and paid as an addition to the owners’ property tax bills. The unique characteristic of PACE assessments is that the assessment is attached to the property rather than the individual borrower. Active programs for residential PACE financing exist in California, Florida and Missouri. As of December 31, 2023, we had a portfolio of $258.0 million in commercial PACE assessments and $871.9 million in residential PACE assessments. These assessments are pari passu with tax liens and generally have priority over first mortgage liens.
Because PACE financing programs are typically enabled through state legislation and authorized at the local government level, variations between each state’s programs may expose us to increased compliance costs and risks. In addition, the Economic Growth, Regulatory Release, and Consumer Protection Act ("EGRRCPA") required the CFPB to prescribe regulations relating to residential PACE financings. In May 2023, the CFPB issued a proposed rule, but has not issued a proposed rule implementing EGRRCPA section 307 and amending Regulation ZX to address how TILA applies to PACE transactions. Specifically, the CFPB is contemplating regulations for PACE financing under the ability-to-repay requirements under the Truth in Lending Act, which are currently in place for residential mortgage loans. If final rules are adopted by the CFPB, we may be exposed to increased compliance and regulatory risks related to new residential PACE assessments. If we fail to comply with any final rules adopted by the CFPB, we may face reputational and litigation risks with respect to our PACE assessments.
Our trust and investment management business may be negatively impacted by changes in economic and market conditions and clients may seek legal remedies for investment performance.
Our trust and investment management business may be negatively impacted by changes in general economic and market conditions because the performance of this business is directly affected by conditions in the financial and securities markets. The financial markets and businesses operating in the securities industry are highly volatile (meaning that performance results can vary greatly within short periods of time) and are directly affected by, among other factors, domestic and foreign economic conditions and general trends in business and finance, and by the threat, as well as the occurrence of global conflicts, all of which are beyond our control. We cannot assure you that broad market performance will be favorable in the future. Declines in the financial markets or a lack of sustained growth may result in a decline in the performance of our investment management business
37
and may adversely affect the market value and performance of the investment securities that we manage, which could lead to reductions in our investment management fees, because they are based primarily on the market value of the securities we manage, and could lead some of our clients to reduce their assets under our management or seek legal remedies for investment performance. If any of these events occur, the financial performance of our trust and investment management business could be materially and adversely affected.
The investment management contracts we have with our clients are terminable without cause and on relatively short notice by our clients, which makes us vulnerable to short term declines in the performance of the securities under our management.
Like most other companies with an investment management business, our investment management contracts with our clients are typically terminable by the client without cause upon less than 30 days’ notice. As a result, even short term declines in the performance of the securities we manage, which can result from factors outside our control such as adverse changes in market or economic conditions or the poor performance of some of the investments we have recommended to our clients, could lead some of our clients to move assets under our management to other asset classes such as broad index funds or treasury securities, or to investment advisors that have investment product offerings or investment strategies different than ours. Therefore, our operating results are heavily dependent on the financial performance of our investment portfolios and the investment strategies we employ in our investment management businesses and even short-term declines in the performance of the investment portfolios we manage for our clients, whatever the cause, could result in a decline in assets under management and a corresponding decline in investment management fees, which would adversely affect our results of operations.
Risks Related to Privacy and Technology
A failure in, or breach of, our operational or security systems or infrastructure, or those of our third-party vendors and other service providers, including as a result of cyber-attacks, could disrupt our businesses, result in the disclosure or misuse of confidential or proprietary information, damage our reputation, increase our costs and cause losses.
Our operations rely on the secure processing, storage and transmission of confidential and other sensitive business and consumer information on our computer systems and networks and third-party providers. Under various federal and state laws, we are responsible for safeguarding such information. For example, our business is subject to joint federal bank agency rules, the GLBA, the NYDFS cybersecurity regulations, the CCPA, and the CPRA which, among other things: (i) impose certain limitations on our ability to share nonpublic personal information about our customers with nonaffiliated third parties; (ii) require that we provide certain disclosures to customers and others about our information collection, sharing and security practices and afford customers the right to “opt out” of any information sharing by us with nonaffiliated third parties (with certain exceptions); (iii) limit retention of customer data; (iv) require notification of certain data breaches be provided to consumers and, in some circumstances, regulators; (v) require notification of extortion payments and ransomware deployments; (vi) require enhanced governance of cyber risk, including risk assessments at least annually and whenever a change in the business or technology causes a material change to our cyber risk; and (vii) require that we develop, implement and maintain a written comprehensive information security program containing appropriate safeguards based on our size and complexity, the nature and scope of our activities, and the sensitivity of customer information we process, as well as plans for responding to data security breaches. Ensuring that our collection, use, transfer and storage of personal information complies with all applicable laws and regulations can increase our costs.
In particular, information pertaining to us and our customers is maintained, and transactions are executed, on our networks and systems or those of our customers or third-party partners, such as our online banking or reporting systems. The secure maintenance and transmission of confidential information, as well as execution of transactions over these systems, are essential to protect us and our customers against fraud and security breaches and to maintain our clients’ confidence. While we have not experienced any material breaches of information security, such breaches may occur through intentional or unintentional acts by those having access or gaining access to our systems or our customers’ or counterparties’ confidential information, including employees. In addition, increases in criminal activity levels and sophistication, advances in computer capabilities, new discoveries, vulnerabilities in third-party technologies (including browsers and operating systems) or other developments could result in a compromise or breach of the technology, processes and controls that we use to prevent fraudulent transactions and to protect data about us, our customers and underlying transactions, as well as the technology used by our customers to access our systems. Further, risk of cybersecurity incidents may increase with the political and economic instability or warfare (including the Russia and Ukraine war and campaigns by Chinese hackers to infiltrate computer networks associated with critical American infrastructure). We cannot be certain that the security measures we, or processors, have in place to protect this sensitive data will be successful or sufficient to protect against all current and emerging threats designed to breach our systems or those of processors. Although we have developed, and continue to invest in, systems and processes that are designed to detect and prevent security breaches and cyber-attacks and regularly test our security, a breach of our systems, or those of processors, could result in
38
losses to us or our customers; loss of business and/or customers; damage to our reputation; the incurrence of additional expenses (including the cost of notification to consumers, credit monitoring and forensics, and fees and fines imposed by the card networks); disruption to our business; our inability to grow our online services or other businesses; additional regulatory scrutiny or penalties; or our exposure to civil litigation and possible financial liability—any of which could have a material adverse effect on our business, financial condition and results of operations.
We depend on information technology and telecommunications systems of third-party servicers, and systems failures, interruptions or breaches of security involving these systems could have an adverse effect on our operations, financial condition and results of operations.
Our business is highly dependent on the successful and uninterrupted functioning of our information technology and telecommunications systems, third-party servicers' accounting systems and mobile and online banking platforms. We outsource many of our major systems, such as data processing, loan servicing, item/payment processing systems, and online banking platforms. The failure of these systems, or the termination of a third-party software license or service agreement on which any of these systems is based, could interrupt our operations. Because our information technology and telecommunications systems interface with and depend on third-party systems, we could experience service denials if demand for such services exceeds capacity or such third-party systems fail or experience interruptions. If sustained or repeated, a system failure or service denial could result in a deterioration of our ability to process new and renewal loans or to gather deposits and provide customer service and it could compromise our ability to operate effectively, damage our reputation, result in a loss of business and subject us to additional regulatory scrutiny and possible financial liability, any of which could have a material adverse effect on our financial condition and results of operations. In addition, failure of third parties to comply with applicable laws and regulations, or fraud, misconduct, or material errors on the part of our employees or employees of any of these third parties could disrupt our operations or adversely affect our reputation.
It may be difficult for us to replace some of our third-party vendors, particularly vendors providing our core banking, debit card services and information services, in a timely manner if they are unwilling or unable to provide us with these services in the future for any reason and even if we are able to replace them, it may be at higher cost or result in the loss of customers. Any such events could have a material adverse effect on our business, financial condition or results of operations.
In November 2021, federal bank regulators issued a joint final rule to establish computer-security incident notification requirements for banking organizations and their bank service providers. The rule requires FDIC-supervised banks to report certain incidents to their case manager and also requires covered bank service providers to promptly notify their FDIC-supervised bank customer when the service provider determines that it has experienced a notification incident.
As a result of financial entities and technology systems becoming more interdependent and complex, a cyber incident, information breach or loss, or technology failure that compromises the systems or data of one or more financial entities could have a material impact on counterparties or other market participants, including ourselves. Although we review business continuity and backup plans for our vendors and take other safeguards to support our operations, such plans or safeguards may be inadequate. As a result of the foregoing, our ability to conduct business may be adversely affected by any significant disruptions to us or to third parties with whom we interact.
We must respond to rapid technological changes, and these changes may be more difficult or expensive than anticipated.
We will have to respond to future technological changes. Specifically, if our competitors introduce new banking products and services embodying new technologies such as artificial intelligence and machine learning, or if new banking industry standards and practices emerge, then our existing product and service offerings, technology and systems may be impaired or become obsolete. Further, if we fail to adopt or develop new technologies or to adapt our products and services to emerging industry standards, then we may lose current and future customers, which could have a material adverse effect on our business, financial condition and results of operations. Many of our competitors have substantially greater resources to invest in technological improvements than we do. The financial services industry is changing rapidly, and to remain competitive, we must continue to enhance and improve the functionality and features of our products, services and technologies. These changes may be more difficult or expensive than we anticipate.
We expect that new technologies and business processes applicable to the banking industry will continue to emerge, and these new technologies and business processes may be better than those we currently use. Because the pace of technological change is high and our industry is intensely competitive, we may not be able to sustain our investment in new technology as critical systems and applications become obsolete or as better ones become available. A failure to maintain current technology and business
39
processes could cause disruptions in our operations or cause our products and services to be less competitive, all of which could have a material adverse effect on our business, financial condition or results of operations.
Risks Related to Our Human Capital
We depend on our executive officers and other key employees, and our ability to attract additional key personnel, to continue the implementation of our long-term business strategy, and we could be harmed by the unexpected loss of their services.
We believe that our continued growth and future success will depend in large part on the skills of our executive officers and other key employees and our ability to motivate and retain these individuals, as well as our ability to attract, motivate and retain qualified senior and middle management and other skilled employees. Competition for employees is intense, and the process of locating key personnel with the combination of skills and attributes required to execute our business strategy may be lengthy. If the services of any of our of key personnel should become unavailable for any reason, we may not be able to identify and hire qualified persons on terms acceptable to us, or at all, which could have a material adverse effect on our business, financial condition, results of operation and future prospects. We may not be successful in retaining our key personnel, and the unexpected loss of services of one or more of our key personnel could have a material adverse effect on our business because of their skill, customer relationships, knowledge of our markets, years of industry experience and the difficulty of promptly finding qualified replacement personnel. Leadership transitions can be inherently difficult to manage, and inadequate transitions may cause disruptions to our business due to, among other things, diverting management’s attention or causing a deterioration in morale.
Our business could suffer if we experience employee work stoppages, union campaigns or other labor difficulties, and efforts by labor unions could divert management attention and adversely affect operating results.
As of December 31, 2023, we had 425 employees, of which approximately 21% are represented by collective bargaining agreements or an employee union. Although we believe that our relationship with our employees is good, and we have not experienced any material work stoppages, work stoppages may occur in the future. Union activities also may significantly increase our labor costs, disrupt our operations and limit our operational flexibility. From time to time, we are subject to unfair labor practice charges, complaints and other legal, administrative and arbitration proceedings initiated against us by unions, the National Labor Relations Board or our employees, which could negatively impact our operating results. In addition, negotiating collective bargaining agreements could divert management attention, which could also adversely affect operating results.On December 20, 2023, we and OPEIU entered into a Memorandum of Agreement ("MOA"), which among other things (i) extended the term of the collective bargaining agreement to June 30, 2026, and (ii) provided for a 3.5% wage increase effective the 1st of July 2023, 2024 and 2025, respectively.
Capital and Liquidity Risks
We are subject to liquidity risk.
We require liquidity to meet our deposit and debt obligations as they come due. Our access to funding sources in amounts adequate to finance our activities or on terms that are acceptable to us could be impaired by factors that affect us specifically or the financial services industry or economy generally. Factors that could detrimentally impact our access to liquidity sources include a downturn in the geographic markets in which our loans are concentrated, difficult credit markets, adverse regulatory or judicial actions against labor unions, political organizations or not-for profits, or adverse regulatory actions against us.
Our access to deposits may also be affected by the liquidity needs of our depositors, particularly in an inflationary environment where they may be compelled to withdraw deposits in order to cover rising expenses. As a part of our liquidity management, we must ensure we can respond effectively to potential volatility in our customers’ deposit balances. Our total on-balance sheet and off-balance sheet deposits totaled $7.32 billion as of December 31, 2023. For instance, our on-balance sheet and off-balance sheet deposits from political campaigns, PACs, and state and national party committee clients totaled $1.19 billion, or 16% of total on-balance sheet and off-balance sheet deposits as of December 31, 2023 and may increase or decrease their deposit balances significantly as we approach an election campaign, resulting in short-term volatility in their deposit balances held with us through election cycles. Additionally, our on-balance sheet and off-balance sheet deposits from labor unions totaled $1.71 billion, or 23% of total on-balance sheet and off-balance sheet deposits as of December 31, 2023. Although we have been able to replace maturing or withdrawn deposits and advances historically as necessary, we might not be able to replace such funds in the future, especially if a large number of our depositors or those depositors with a high concentration of deposits sought to withdraw their accounts. We could encounter difficulty meeting a significant deposit outflow which could negatively impact our profitability or reputation. Any long-term decline in deposit funding would adversely affect our liquidity. While we believe our funding sources are adequate to meet any significant unanticipated deposit withdrawal, we may not be able to manage the risk of deposit volatility
40
effectively. A failure to maintain adequate liquidity could materially and adversely affect our business, results of operations or financial condition.
The recent bank failures caused substantial market disruption that has not yet stabilized, leading to ongoing concerns about the liquidity of the financial services industry. Ongoing destabilization could exacerbate deposit outflows due to concerns that deposits held at the Bank exceed the amount of insurance provided by the FDIC, which provides basic deposit coverage with limits up to $250,000 per customer. In particular, continuing negative media attention and the rapid spread of rumors, concerns and misinformation on social media could cause panic among investors, depositors, customers and the general public. Deposit outflows could increase if customers with uninsured deposits look for alternative placements for their funds to weather banking sector volatility and instability. Our total estimated uninsured deposits at December 31, 2023 was $4.0 billion. Our cash, off-balance sheet deposits, and borrowing capacity totaled $3.0 billion of immediately available funds, in addition to unpledged securities with two-day availability of $582 million for total liquidity within two-days of $3.6 billion, which provided coverage for 89% of total uninsured deposits.
An increase in deposit outflows could require us to seek alternate sources of liquidity to fund our operations and meet withdrawal demands. We may sell investment securities at a loss, negatively impacting our net income, earnings, and capital. As of December 31, 2023, our net unrealized losses on available for sale securities totaled $102.3 million, and our net unrecognized losses on held-to-maturity securities totaled $148.0 million. Other alternate sources of liquidity could include higher-cost borrowings (as a result of competition for liquidity and elevated interest rates), which could negatively affect our financial performance. Regulators could impose new liquidity requirements on banks, which could limit future growth. These changes may be more difficult or expensive than we anticipate.
In response to the recent bank failures and loss of public confidence in the banking sector, the government has increased its scrutiny of financial institutions. State and federal lawmakers and regulators have proposed new measures and regulations regarding capital levels, deposit concentrations, liquidity, risk management and deposit insurance. Such legal and regulatory changes could materially and adversely affect our business, results of operations or financial condition.
Our business needs and future growth may require us to raise capital, but that capital may not be available or may be dilutive.
Our ability to raise capital will depend on, among other things, conditions in the capital markets, which are outside of our control, and our financial performance. Accordingly, we cannot provide assurance that such capital will be available on terms acceptable to us or at all. Any occurrence that limits our access to capital, may adversely affect our capital costs and our ability to raise capital and, in turn, our liquidity. Further, if we need to raise capital in the future, we may have to do so when many other financial institutions are also seeking to raise capital and would then have to compete with those institutions for investors. Any inability to raise capital on acceptable terms when needed could have a material adverse effect on our business, financial condition and results of operations and could be dilutive to both tangible book value and our share price.
In addition, an inability to raise capital when needed may subject us to increased regulatory supervision and the imposition of restrictions on our growth and business. These restrictions could negatively affect our ability to operate or further expand our operations through loan growth, acquisitions or the establishment of additional branches. These restrictions may also result in increases in operating expenses and reductions in revenues that could have a material adverse effect on our financial condition, results of operations and our share price.
We may be subject to more stringent capital requirements in the future.
We are subject to regulatory requirements specifying minimum amounts and types of capital that we must maintain. From time to time, the regulators change these regulatory capital adequacy guidelines. If we fail to meet these minimum capital guidelines and other regulatory requirements, we may be restricted in the types of activities we may conduct and we may be prohibited from taking certain capital actions, such as paying dividends and repurchasing or redeeming capital securities.
In particular, the capital requirements applicable to us under the Basel III rules, which became fully phased-in on January 1, 2019 required us to satisfy additional, more stringent, capital adequacy standards. The Basel III endgame rules, which were proposed in July 2023, would impose higher capital requirements on U.S. banks with at least $100 billion of assets. While the proposed rules are not currently expected to impact us, and we expect to meet the requirements of the Basel III rules, a failure to meet minimum capital requirements could result in certain mandatory and possible additional discretionary actions by regulators that, if undertaken, could have an adverse material effect on our financial condition and results of operations. In addition, these requirements could have a negative impact on our ability to lend, grow deposit balances, make acquisitions or make capital distributions in the form of dividends or share repurchases. Higher capital levels could also lower our return on equity.
41
Risks Related to Our Strategy
We may not be able to implement our growth strategy or manage costs effectively, resulting in lower earnings or profitability.
There can be no assurance that we will be able to continue to grow and to be profitable in future periods, or, if profitable, that our overall earnings will remain consistent or increase in the future. Our growth requires that we increase our loans, assets under management and deposits while managing risks by following prudent loan underwriting standards without increasing interest rate risk, increasing our noninterest expenses or compressing our net interest margin, maintaining more than adequate capital at all times, hiring and retaining qualified employees and successfully implementing strategic initiatives. Even if we are able to increase our interest income, our earnings may nonetheless be reduced by increased expenses, such as additional employee compensation or other general and administrative expenses and increased interest expense on any liabilities incurred or deposits solicited to fund increases in assets. Additionally, if our competitors extend credit on terms we find to pose excessive risks, or at interest rates which we believe do not warrant the credit exposure, we may not be able to maintain our lending volume and could experience deteriorating financial performance. Our inability to manage our growth successfully or to continue to expand into new markets could have a material adverse effect on our business, financial condition or results of operations.
New lines of business, products, product enhancements or services may subject us to additional risks.
From time to time, we may implement new lines of business or offer new products or product enhancements as well as new services within our existing lines of business. There are substantial risks and uncertainties associated with these efforts, particularly in instances in which the markets are not fully developed. In implementing, developing or marketing new lines of business, products, product enhancements or services, we may invest significant time and resources, although we may not assign the appropriate level of resources or expertise necessary to make these new lines of business, products, product enhancements or services successful or to realize their expected benefits. Initial timetables for the introduction and development of new lines of business, products, product enhancements or services may not be achieved, and price and profitability targets may not prove feasible. For example, several of our competitors have successfully introduced innovative investment management products. The introduction of such new products requires continued innovative efforts on the part of our management and may require significant time and resources as well as ongoing support and investment. External factors, such as compliance with regulations, competitive alternatives and shifting market preferences, may also affect the implementation of a new line of business or offerings of new products, product enhancements or services. Furthermore, any new line of business, product, product enhancement or service or system conversion could have a significant impact on the effectiveness of our internal controls. Failure to successfully manage these risks in the development and implementation of new lines of business or offerings of new products, product enhancements or services could have a material adverse effect on our business, financial condition or results of operations.
Our ability to maintain our reputation is critical to the success of our business, including our ability to attract and retain customers, and failure to do so may materially adversely affect our performance.
We are a Certified B CorporationTM. The term “Certified B Corporation” does not refer to a particular form of legal entity, but instead refers to companies certified by the B Lab, an independent nonprofit organization, as meeting rigorous standards of social and environmental performance, accountability and transparency. B Labs sets the standards for Certified B CorporationTM certification and may change those standards over time. Our reputation could be harmed if we lose our Certified B CorporationTM status, whether by choice or by our failure to meet B Lab’s certification requirements, if that change in status were to create a perception that we are no longer committed to the values shared by Certified B CorporationsTM. Likewise, our reputation could be harmed if our publicly reported B CorporationTM score declines, if that were to create a perception that we are less focused on meeting the Certified B CorporationTM standards.
As a fund manager, we continue to engage in stockholder activism, pressing companies to adopt best practices on a range of environmental, social and corporate governance topics. This activism has caused and could cause increased scrutiny over our own environmental, social and corporate governance activities. Any failure, or perceived failure, in our ability to maintain environmental, social and corporate governance best practices could damage our reputation adversely affecting our business, results of operations or financial condition.
Maintaining our reputation also depends on our ability to successfully prevent third-parties from infringing on our brand and associated trademarks. Defense of our reputation and our trademarks, including through litigation, could result in costs adversely affecting our business, results of operations or financial condition.
We face strong competition from other banks and financial institutions and other wealth and investment management firms that could hurt our business.
42
The banking business is highly competitive, and we experience competition in our markets from many other financial institutions. We compete with commercial banks, credit unions, savings and loan associations, mortgage banking firms, non-traditional financial-services providers, other financial service businesses, including investment advisory and wealth management firms, mutual fund companies, and securities brokerage and investment banking firms, as well as super-regional, national and international financial institutions that operate offices in our primary market areas and elsewhere. As customers’ preferences and expectations continue to evolve, technology has lowered barriers to entry and made it possible for banks to expand their geographic reach by providing services over the Internet and for Fintech, i.e. “non-banks” to offer products and services traditionally provided by banks, such as automatic transfer and automatic payment systems. Because of this rapidly changing technology, our future success will depend in part on our ability to address our customers’ needs by using technology and to identify and develop new, value-added products for existing and future customers. Failure to do so could impede our time to market, reduce customer product accessibility, and weaken our competitive position. Customer loyalty can be easily influenced by a competitor’s products, especially offerings that could provide cost savings or a higher return to the customer. Moreover, this competitive industry could become even more competitive as a result of legislative, regulatory and technological changes and continued consolidation.
In October 2023, the CFPB issued a Notice of Proposed Rulemaking for the Required Rulemaking on Personal Financial Data Rights rule to promote “open and decentralized banking” by requiring covered institutions to allow customers to authorize the transfer of certain customer information to other financial institutions. Once finalized, this rule could enable greater competition among banks and nonbanks for consumer market share, which could have a material adverse effect on our business, financial condition or results of operations.
Difficulties in obtaining regulatory approval for acquisitions and in combining the operations of acquired entities with the Company’s own operations may prevent us from achieving the expected benefits from our acquisitions.
The Company has expanded its business through past acquisitions and may do so in the future. Our ability to complete acquisitions is in many instances subject to regulatory approval, and we cannot be certain when or if, or on what terms and conditions, any required regulatory approvals would be granted. In addition, inherent uncertainties exist when integrating the operations of an acquired entity, including in ability to fully achieve the Company’s strategic objectives and planned operating efficiencies in an acquisition, disruption of the Company’s business and diversion of management’s time and attention and exposure to unknown or contingent liabilities of acquired entities.
Legal, Accounting, Regulatory, and Compliance Risks
Changes in our accounting policies or in accounting standards could materially affect how we report our financial results and condition.
Changes in our accounting policies or in accounting standards could materially affect how we report our financial results and condition. From time to time, the FASB changes the financial accounting and reporting standards that govern the preparation of our financial statements. As a result of such changes, whether promulgated or required by the FASB or other regulators, we could be required to change certain of the assumptions or estimates we have previously used in preparing our financial statements, which could negatively affect how we record and report our results of operations and financial condition generally.
Our accounting estimates and risk management processes and controls rely on analytical and forecasting techniques and models and assumptions, which may not accurately predict future events.
Our accounting policies and methods are fundamental to how we record and report our financial condition and results of operations. Our management must exercise judgment in selecting and applying many of these accounting policies and methods so they comply with GAAP and reflect management’s judgment of the most appropriate manner in which to report our financial condition and results. In some cases, management must select the accounting policy or method to apply from two or more alternatives, any of which may be reasonable under the circumstances, yet which may result in our reporting materially different results than would have been reported under a different alternative.
Certain accounting policies are critical to presenting our financial condition and results of operations. They require management to make difficult, subjective or complex judgments about matters that are uncertain. Materially different amounts could be reported under different conditions or using different assumptions or estimates. The critical accounting policies include the ACL. Because of the uncertainty of estimates involved in this matters, we may be required to significantly increase the allowance or sustain credit losses that are significantly higher than the reserve provided. Any of these could have a material adverse effect on
43
our business, financial condition or results of operations. See “Management’s Discussion and Analysis of Financial Condition and Results of Operations.”
The banking industry is heavily regulated and that regulation, together with any future legislation or regulatory changes, could limit or restrict our activities and adversely affect our operations or financial results.
We operate in an extensively regulated industry and we are subject to examination, supervision, and comprehensive regulation by various federal and state agencies. The Company is subject to Federal Reserve regulations, and the Bank is subject to regulation, supervision and examination by the FDIC and the NYDFS. Our compliance with banking regulations is costly and restricts some of our activities, including payment of dividends, mergers and acquisitions, investments, loans and interest rates and locations of offices. We are also subject to capitalization guidelines established by our regulators, which require us to maintain adequate capital to support our business. If, as a result of an exam, a banking agency were to determine that the financial condition, capital adequacy, asset quality, asset concentration, earnings prospects, management, liquidity sensitivity to market risk or other aspects of any of our operations has become unsatisfactory, or that we or our management are in violation of any law or regulation, the banking agency could take a number of different remedial actions as it deems appropriate.
Furthermore, our regulators also have the ability to compel us to take certain actions, or restrict us from taking certain actions entirely, such as actions that our regulators deem to constitute an unsafe or unsound banking practice. Our failure to comply with any applicable laws or regulations, or regulatory policies and interpretations of such laws and regulations, could result in sanctions by regulatory agencies (such as a memorandum of understanding, a written supervisory agreement or a cease and desist order), civil money penalties or damage to our reputation, all of which could have a material adverse effect on our business, financial condition or results of operations.
Our trust and investment management businesses are highly regulated.
Through our investment management division, we provide investment management, custody, safekeeping and trust services to institutional clients. These products and services require us to comply with a number of regulations issued by the Department of Labor, the Employee Retirement Income Security Act, the FDIC Statement of Principles of Trust Department Management, and federal and state securities regulators.
Our failure to comply with applicable laws or regulations could result in fines, suspensions of individual employees, litigation, or other sanctions. Any such failure could have an adverse effect on our reputation and could adversely affect our business, financial condition, results of operations or prospects.
The Federal Reserve may require us to commit capital resources to support the Bank.
The Federal Reserve requires a bank holding company to act as a source of financial and managerial strength to a subsidiary bank and to commit resources to support such subsidiary bank. Under the “source of strength” doctrine, the Federal Reserve may require a bank holding company to make capital injections into a troubled subsidiary bank and may charge the bank holding company with engaging in unsafe and unsound practices for failure to commit resources to such a subsidiary bank. In addition, the Dodd-Frank Act directs the federal bank regulators to require that all companies that directly or indirectly control an insured depository institution serve as a source of strength for the institution. Under these requirements, in the future, we could be required to provide financial assistance to the Bank if the Bank experiences financial distress.
A capital injection may be required at times when we do not have the resources to provide it, and therefore we may be required to borrow the funds. In the event of a bank holding company’s bankruptcy, the bankruptcy trustee will assume any commitment by the holding company to a federal bank regulatory agency to maintain the capital of a subsidiary bank. Moreover, bankruptcy law provides that claims based on any such commitment will be entitled to a priority of payment over the claims of the holding company’s general unsecured creditors, including the holders of its note obligations. Thus, any borrowing that must be done by the holding company in order to make the required capital injection becomes more difficult and expensive and will adversely impact the holding company’s cash flows, financial condition, results of operations and prospects.
We face a risk of noncompliance with the BSA and other anti-money laundering statutes and regulations and corresponding enforcement proceedings.
The BSA, the PATRIOT Act, the Anti-Money Laundering Act of 2020, and other laws and regulations require financial institutions, among other duties, to institute and maintain effective anti-money laundering programs, and to file suspicious activity and currency transaction reports as appropriate. FinCEN, established by the U.S. Treasury Department to administer the BSA, is
44
authorized to impose significant civil money penalties for violations of those requirements and has engaged in coordinated enforcement efforts with the individual federal banking regulators, as well as the U.S. Department of Justice, Drug Enforcement Administration and IRS. There is also increased scrutiny of compliance with the rules enforced by the Office of Foreign Assets Control. Federal and state bank regulators also focus on compliance with BSA and anti-money laundering regulations. If our policies, procedures and systems are deemed deficient or the policies, procedures and systems of the financial institutions that we may acquire are deficient, we would be subject to liability, including fines, and regulatory actions such as restrictions on our ability to pay dividends and engage in acquisitions, which would negatively impact our business, financial condition and results of operations. In recent years, sanctions that the regulators have imposed on banks that have not complied with all requirements have been especially severe. Failure to maintain and implement adequate programs to combat money laundering and terrorist financing could also have serious reputational consequences for us, which could have a material adverse effect on our business, financial condition and results of operations.
We are subject to the Community Reinvestment Act and federal and state fair lending laws, and failure to comply with these laws could lead to material penalties.
The Community Reinvestment Act (“CRA”), the ECOA and the FHA impose nondiscriminatory lending requirements on financial institutions. The FDIC, the NYDFS, the Department of Justice, and other federal and state agencies are responsible for enforcing these laws and regulations. In October 2023, the FDIC, the FRB and the OCC jointly adopted final regulations for modernizing and implementing the CRA, which will become effective on April 1, 2024, with a multi-year phase-in. These regulations create a complex regulatory scheme that will impact how the Bank’s compliance with the CRA is evaluated and that will increase its compliance obligations, unless the regulations are successfully challenged in court. Private parties may also have the ability to challenge an institution’s performance under fair lending laws in private class action litigation. A successful challenge to our performance under the fair lending laws and regulations could adversely impact our rating under the CRA and result in a wide variety of sanctions, including the required payment of damages and civil money penalties, injunctive relief, imposition of restrictions on merger and acquisitions and expansion activity, which could negatively impact our reputation, business, financial condition and results of operations.
We are exposed to litigation and compliance risks related to our ESG products.
As a Certified B CorporationTM, we maintain an explicit commitment to the highest corporate social responsibility and ESG standards.
Recently, there has been growing concern from advocacy groups, government agencies and the general public on ESG matters and increasingly regulators, customers, investors, employees and other stakeholders are focusing on ESG matters and related disclosures. Growing interest on the part of investors and regulators in ESG factors and increased demand for, and scrutiny of, ESG-related disclosures, have also increased the risk that companies could be perceived as, or accused of, making inaccurate or misleading statements regarding their ESG efforts or initiatives.
There has been a significant rise in climate-related probes and litigation, including greenwashing claims, against banks. “Greenwashing” involves a business making misleading sustainability-related claims to investors or consumers, usually to boost its reputation and bottom line. Furthermore, ESG products in the banking and financial services sectors have become subject to heightened regulatory scrutiny for potentially misleading claims and poor controls. In 2021, the SEC established the Climate and ESG Task Force in the Division of Enforcement to identify and address potential ESG-related misconduct, including greenwashing. The SEC is bringing an increasing number of enforcement actions addressing ESG issues, including charges for making materially misleading statements about controls concerning ESG products and for policies and procedures failures. Allegations that our ESG products contain claims that have misled investors or consumers, or that the claims are subject to poor controls, even if ultimately unfounded, may fundamentally damage our reputation and our financial performance.
Our financial condition may be affected negatively by the costs of litigation.
In difficult market conditions, the volume of claims and amount of damages sought in litigation and investigations against financial institutions have historically increased. We may be involved from time to time in a variety of litigation, investigations or similar matters arising out of our business. In many cases, we may seek reimbursement from our insurance carriers to cover such costs and expenses. Our insurance may not cover all claims that may be asserted against us, and any claims asserted against us, regardless of merit or eventual outcome, may harm our reputation. Should the ultimate judgments or settlements in any litigation or investigation significantly exceed our insurance coverage, they could have a material adverse effect on our business, financial condition and results of operations. In addition, we may not be able to obtain appropriate types or levels of insurance in the future, nor may we be able to obtain adequate replacement policies with acceptable terms, if at all.
45
From time to time we are, or may become, involved in suits, legal proceedings, information-gatherings, investigations and proceedings by governmental and self-regulatory agencies that may lead to adverse consequences.
Many aspects of the banking business involve a substantial risk of legal liability. From time to time, we are, or may become, the subject of information-gathering requests, reviews, investigations and proceedings, and other forms of regulatory inquiry, including by bank regulatory agencies, self-regulatory agencies, and law enforcement authorities. The results of such proceedings could lead to significant civil or criminal penalties, including monetary penalties, damages, adverse judgments, settlements, fines, injunctions, restrictions on the way we conduct our business or reputational harm.
Risks Related to Our Common Stock
Shares of our common stock could face volatility due to banking sector uncertainty.
The recent bank failures have negatively impacted the price of securities issued by financial institutions, which underscores the sensitivity of bank holding company public trading prices to generalized concerns about the health of the banking industry as a whole, regardless of the health of a particular institution. Ongoing stress in the banking sector could adversely impact the market price of our common stock and our business, financial condition and results of operations. We cannot predict if investors will find our common stock less attractive as a result of these market stresses. If some investors find our common stock less attractive as a result, there may be a less active trading market for our common stock and our stock price may be more volatile.
Our ability to pay dividends is subject to regulatory limitations and the Bank’s ability to pay dividends to us is also subject to regulatory limitations.
The Company is a bank holding company that conducts substantially all of its operations through the Bank. As a result, our ability to make dividend payments on our common stock depends primarily on certain federal regulatory considerations and the receipt of dividends and other distributions from the Bank. As is the case with all financial institutions, the profitability of the Bank is subject to the fluctuating cost and availability of money, changes in interest rates, and in economic conditions in general.
Holders of our common stock are only entitled to receive such cash dividends as our Board of Directors may declare out of funds legally available for such payments. Although we currently expect to continue to pay quarterly dividends, any future determination relating to our dividend policy will be made by our Board of Directors and will depend on a number of factors. Any actual determination relating to our dividend policy and the declaration of future dividends will be made, subject to applicable law and regulatory approvals, by our Board of Directors and will depend on a number of factors, including: (i) our historical and projected financial condition, liquidity and results of operations, (ii) our capital levels and needs, (iii) tax considerations, (iv) any acquisitions or potential acquisitions that we may examine, (v) statutory and regulatory prohibitions and other limitations, (vi) the terms of any credit agreements or other borrowing arrangements that restrict our ability to pay cash dividends, (vii) general economic conditions and (viii) other factors deemed relevant by our Board of Directors. The Board of Directors may determine not to pay any cash dividends at any time. There can be no assurance that we will pay any dividends to holders of our common stock, or as to the amount of any such dividends. For more information, see “Cautionary Note Regarding Forward-Looking Statements” and “Market for Registrant’s Common Equity, Related Stockholder Matters and Issuer Purchases of Equity Securities—Dividend Policy.”
We have several significant investors whose individual interests may differ from yours.
A significant percentage of our common stock is currently held by investment funds affiliated with an amalgamation of Workers United and numerous joint boards, locals or similar organizations authorized under the constitution of Workers United (the “Workers United Related Parties”). Workers United Related Parties own approximately 42% of our common stock. Significant stockholders will have a greater ability than our other stockholders to influence the election of directors and the potential outcome of other matters submitted to a vote of our stockholders, including mergers and acquisition transactions, amendments to our certificate of incorporation and bylaws, and other extraordinary corporate matters. The interests of these investors could conflict with the interests of our other stockholders, and any future transfer by these investors of their shares of common stock to other investors who have different business objectives could adversely affect our business, results of operations, financial condition, prospects or the market value of our common stock.
Workers United Related Parties have also entered into agreements with us that contain certain provisions, including, among others, provisions relating to our governance, information rights, tag-along rights, board designation rights, and certain board and stockholder approval rights. Additionally, Workers United Related Parties have entered into agreements with us that provide
46
certain registration rights under existing registration rights agreements, and in the case of the Workers United Related Parties, the establishment of an advisory board.
Transfers of our common stock owned by the Workers United Related Parties could adversely impact your rights as a stockholder and the market price of our common stock.
The Workers United Related Parties may transfer all or part of the shares of our common stock that they own, without allowing you to participate or realize a premium for any investment in our common stock, or distribute shares of our common stock that it owns to their members. Sales or distributions by the Workers United Related Parties of such common stock could adversely impact prevailing market prices for our common stock.
Additionally, a sale of common stock by the Workers United Related Parties to a third party could adversely impact the market price of our common stock and our business, financial condition and results of operations. For example, a change in control caused by the sale of our shares by the Workers United Related Parties may result in a change of management decisions and business policy.
Shares of our common stock are subject to dilution.
We may issue additional shares of our common stock in the future pursuant to current or future equity compensation plans or in connection with future acquisitions or financings. If we choose to raise capital by selling shares of our common stock for any reason, the issuance would have a dilutive effect on the holders of our common stock and could have a material negative effect on the value of our common stock.
47
Item 1B. Unresolved Staff Comments.
None.
Item 1C. Cybersecurity
The Company’s Board recognizes the critical importance of maintaining the trust and confidence of our customers, clients, business partners and employees. The Board is actively involved in oversight of the Company’s risk management program, and cybersecurity represents an important component of the Company’s overall approach to enterprise risk management (“ERM”).
The Company’s cybersecurity policies, standards, processes and practices are fully integrated into the Company’s ERM program and are based on recognized frameworks established by the National Institute of Standards and Technology, the Federal Financial Institutions Examination Council (the “FFIEC”), the International Organization for Standardization and other applicable industry standards and regulations, including regulations promulgated by the NYDFS. In general, the Company seeks to address cybersecurity risks through a comprehensive, cross-functional approach that is focused on preserving the confidentiality, security and availability of the data and information that the Company collects and stores by identifying, preventing and mitigating cybersecurity threats and effectively responding to cybersecurity incidents when they occur. The Company’s strategy is informed by determinations of inherent risk and risk maturity level that are made in connection with an independent cybersecurity awareness assessment prepared for the FFIEC.
As one of the critical elements of the Company’s overall ERM approach, the Company’s Information Security Program is focused on the following key areas:
•Protecting the confidentiality, integrity, and availability of information systems and the nonpublic information stored on them.
•Identifying risks, defending against unauthorized access, and detecting, responding to, and recovering from cybersecurity incidents.
Risk Management, Strategy and Governance
Role of Management
The Company has implemented a comprehensive, cross-functional approach to identifying, preventing and mitigating cybersecurity threats and incidents, while also implementing controls and procedures that provide for the prompt escalation of certain cybersecurity incidents so that decisions regarding the public disclosure and reporting of such incidents can be made by management in a timely manner.
The Company has also established a governance structure and organization to manage cybersecurity risk. This includes escalation and reporting of cybersecurity incidents through the Chief Risk Officer’s organization to an Executive Response Team and the Board, and periodic reporting on the Information Security Program to the Information Cyber Security Subcommittee of the Enterprise Risk Management Committee, an executive committee that oversees the Information Security Program, and the Enterprise Risk Oversight Committee (the “EROC”), the Board committee that oversees the ERM framework.
The Chief Information Security Officer (“CISO”), under the supervision of the Company’s Chief Risk Officer (“CRO”) in coordination with the Company’s executive team, which includes our CEO, CFO, Chief Technology Officer (“CTO”) and Chief Legal Officer (“CLO”), works collaboratively across the Company to implement the Information Security Program, which is designed to protect the Company’s information systems from cybersecurity threats and to promptly respond to any cybersecurity incidents in accordance with the Company’s incident response and recovery plans.
The CISO coordinates all aspects of the Information Security Program and presents a report on the Information Security Program to the Information Cyber Security Subcommittee on a quarterly basis so that the Subcommittee is made aware of a wide range of topics including recent developments in the Information Security Program, evolving standards, vulnerability assessments, third-party and independent reviews, the threat environment, technological trends and information security considerations arising with respect to the Company’s peers and third parties.
In the absence of a permanent CISO at December 31, 2023, the Company contracted an interim CISO who previously had served as the Company's interim CTO from July of 2022 through October of 2023. Additionally this contractor served in various roles in information technology and information security for over 25 years, including serving as the Chief Information Officer and Chief
48
Technology Officer of two large public financial services companies. The interim CISO has also performed Information Security leadership roles in two technology companies assessing and managing cyber risk on large amounts of data.
The current CTO holds an undergraduate degree in computer science and a master’s degree in business administration. and has served in various roles in information technology for over 30 years, including serving as either the Chief Technology Officer or Chief Information Officer of four public companies.
Role of the Board of Directors
The Board’s oversight of cybersecurity risk management is supported by the EROC, which regularly interacts with the Company’s ERM function and the CISO.
The EROC oversees the Company’s ERM process, including the management of risks arising from cybersecurity threats. The EROC receives regular presentations and reports on the Information Security Program, which address a wide range of topics including recent developments, evolving standards, vulnerability assessments, third-party and independent reviews, the threat environment, technological trends and information security considerations arising with respect to the Company’s peers and third parties.
The EROC receives prompt and timely information regarding any cybersecurity incident that meets established reporting thresholds, as well as ongoing updates regarding any such incident until it has been addressed.
Although we have not historically experienced significant cybersecurity incidents, we and other banks are subject to attacks of increasing frequency and sophistication. Any significant breach, interruption or failure of our information systems could adversely affect our business operations and our financial condition, operating results and liquidity.
Technical Safeguards
The Company deploys technical safeguards that are designed to protect Company’s data and information systems from cybersecurity threats, including firewalls, intrusion prevention and detection systems, anti-malware functionality and access controls, which are evaluated and improved through vulnerability assessments and cybersecurity threat intelligence.
The Company engages in the periodic assessment and testing of the Company’s policies, standards, processes and practices that are designed to address cybersecurity threats and incidents. These efforts include a wide range of activities, including audits, assessments, tabletop exercises, threat modeling, vulnerability testing, stress testing based on top cyberattack scenarios and other exercises focused on evaluating the effectiveness of our cybersecurity measures and planning and by leveraging the Federal Reserve Bank of New York methodology for cyber risk (“FFIEC CyberSecurity Assessment Tool”). The Company regularly engages third parties to perform independent assessments on our cybersecurity measures, including information security maturity assessments, audits and independent reviews of our information security control environment and operating effectiveness. The results of such assessments, audits and reviews are reported to the EROC, and the Company adjusts its cybersecurity policies, standards, processes and practices as necessary based on the information provided by these assessments, audits and reviews.
Incident Response and Recovery Planning
The Company has established and maintains comprehensive incident response and recovery plans that fully address the Company’s timely and effective response to a cybersecurity incident, and such plans are tested and evaluated on a regular basis. Multidisciplinary teams throughout the Company are deployed to address cybersecurity threats and to respond to cybersecurity incidents. Through ongoing communications with these teams, the CISO monitors the prevention, detection, mitigation and remediation of cybersecurity threats and incidents in real time and reports such threats and incidents to the Executive Response Team of the Company and as guided by the Company’s Chief Risk Officer, to the Risk Committee when appropriate.
The Company’s Security Incident Response Team (“SIRT”) structure includes an Executive Response Team (“ERT”). The ERT is composed of all members of the Executive Management Team, the Head of Business Continuity Management, and the CISO (if the incident is due to a cyber breach), and it oversees a Management Response Team (“MRT”). In the event of a security incident, the Company’s designated Response Coordinator, who is the Information Security Manager or the CISO’s designee, shall investigate the reported security incident and assign an initial severity level. They will gather initial facts about the security incident, analyze information it has received, identify those entities affected by the security incident, assess the preliminary severity and extent of the damage (which can be financial or reputational).
If the severity is assessed as Low or Medium in accordance with criteria identified in the incident response and recovery plans, the Response Coordinator will report the incident to the CISO and complete the remediation actions for the cybersecurity incident and
49
report the final outcome to the CISO. The CISO will report to the ERT remediation of Low or Medium cybersecurity incidents at least on a quarterly basis. If the cybersecurity incident is classified as a High, or at the Response Coordinator’s discretion, the Response Coordinator will report the cybersecurity incident to the CISO and promptly convene the ERT. The ERT will determine the appropriate steps necessary to respond to the cybersecurity incident and oversee the MRT’s execution of the response. The ERT will determine whether the cybersecurity incident needs to be escalated to the Board.
Third-Party Risk Management
The Company’s Vendor Management Program provides a risk-based approach to the assessment, measurement, monitoring, and control of risks related to third parties with whom the Company does business, including vendors, service providers and other external users of Company’s systems, as well as the systems of third parties that could adversely impact our business in the event of a cybersecurity incident affecting those third-party systems. In particular, the Company confirms that new and existing service providers are implementing appropriate measures to protect customer information and customer information systems in conformance with the Company’s requirements.
Education and Awareness
Through its Information Security Awareness Program, the Company provides regular, mandatory training regarding cybersecurity threats as a means to equip the Company’s personnel with effective tools to address cybersecurity threats, and to communicate the Company’s evolving information security policies, standards, processes and effective practices.
Item 2. Properties.
As of December 31, 2023, our three branch offices in New York City, one branch office in Washington, D.C., one branch office in San Francisco, and one commercial office in Boston are leased. We believe that our current facilities are adequate to meet our present and foreseeable needs, subject to possible future expansion.
We lease 133,276 square feet in a building located at 275 Seventh Avenue, New York, New York 10001 that serves as our corporate headquarters.
Item 3. Legal Proceedings.
We are subject to certain pending and threatened legal proceedings that arise out of the ordinary course of business. Additionally, we, like all banking organizations, are subject to regulatory examinations and investigations. Based upon management’s current knowledge, following consultation with legal counsel, in the opinion of management, there is no pending or threatened legal matter that would result in a material adverse effect on our consolidated financial condition or results of operation, either individually or in the aggregate.
Item 4. Mine Safety Disclosures.
Not applicable.
50
PART II
Item 5. Market for Registrant’s Common Equity, Related Stockholder Matters and Issuer Purchases of Equity Securities.
Market Information and Holders of Record
Our common stock is listed on The NASDAQ Global Market under the symbol “AMAL.” As of December 31, 2023, we had 30,428,359 shares of common stock outstanding and approximately 200 stockholders of record.
Dividend Policy
We have historically paid a quarterly cash dividend, and intend to continue paying a quarterly cash dividend of $0.10 per share on our common stock, although we may elect not to pay dividends or to change the amount of such dividends. Any actual determination relating to our dividend policy and the declaration of future dividends will be made, subject to applicable law and regulatory approvals, by our Board of Directors and will depend on a number of factors, including: (1) our historical and projected financial condition, liquidity and results of operations, (2) our capital levels and needs, (3) tax considerations, (4) any acquisitions or potential acquisitions that we may examine, (5) statutory and regulatory prohibitions and other limitations, (6) the terms of any credit agreements or other borrowing arrangements that restrict our ability to pay cash dividends, (7) general economic conditions and (8) other factors deemed relevant by our Board of Directors.
The Company is a legal entity separate and distinct from the Bank. The Federal Reserve has issued a policy statement on the payment of cash dividends by bank holding companies, which expresses the Federal Reserve’s view that a bank holding company generally should pay cash dividends only to the extent that the holding company’s net income for the past year is sufficient to cover both the cash dividends and a rate of earnings retention that is consistent with the holding company’s capital needs, asset quality, and overall financial condition. The Federal Reserve has also indicated that a bank holding company should not maintain a level of cash dividends that places undue pressure on the capital of its bank subsidiaries, or that can be funded only through additional borrowings or other arrangements that undermine the bank holding company’s ability to act as a source of strength. As a Delaware public benefit corporation, we are also subject to certain restrictions on dividends under the DGCL. Generally, a Delaware corporation may only pay dividends either out of surplus or out of the current or the immediately preceding year’s net profits. Surplus is defined as the excess, if any, at any given time, of the total assets of a corporation over its total liabilities and statutory capital. The value of a corporation’s assets can be measured in a number of ways and may not necessarily equal their book value.
We pay cash dividends to our stockholders from our assets, which are provided primarily by dividends paid to the Company by our Bank. Certain restrictions exist regarding the ability of the Bank to transfer funds to the Company in the form of cash dividends, loans or advances. Federal bank regulators have stated that paying dividends that deplete a bank’s capital base to an inadequate level would be an unsafe and unsound banking practice and that banking organizations should generally pay dividends only out of current earnings. The FDIC’s prompt corrective action regulations also prohibit depository institutions, such as the Bank, from making any “capital distribution,” which includes any transaction that the FDIC determines, by order or regulation, to be “in substance a distribution of capital,” unless the depository institution will continue to be at least adequately capitalized after the distribution is made. Pursuant to these provisions, it is possible that the FDIC would seek to prohibit the payment of dividends from the Bank to the Company if we failed to maintain a status of at least adequately capitalized. The New York Banking Law contains similar provisions.
There can be no assurance that we will pay any dividends to holders of our common stock, or as to the amount of any such dividends. See “Cautionary Note Regarding Forward-Looking Statements” and “Supervision and Regulation—Amalgamated Financial Corp.—Capital Requirements and Payment of Dividends” and “Supervision and Regulation—Amalgamated Bank—Payment of Dividends.”
51
Stock Performance Graph
The following stock performance graph compares the cumulative total shareholder returns for the Company's common stock, KBW Bank Index and the KBW Regional Bank Index for the last five fiscal years. The graph assumes that an investor originally invested $100 in shares of the Bank's common stock at its closing price on December 31, 2018, and assumes reinvestment of dividends and other distributions to stockholders. The following stock performance graph and related information shall not be deemed to be “soliciting material” or “filed” with the SEC, or subject to the liabilities of Section 18 of the Exchange Act, nor shall such information be incorporated by reference into any future filings under the Exchange Act, except to the extent we specifically incorporate it by reference into such filing. The stock performance graph represents past performance and should not be considered an indication of future performance.
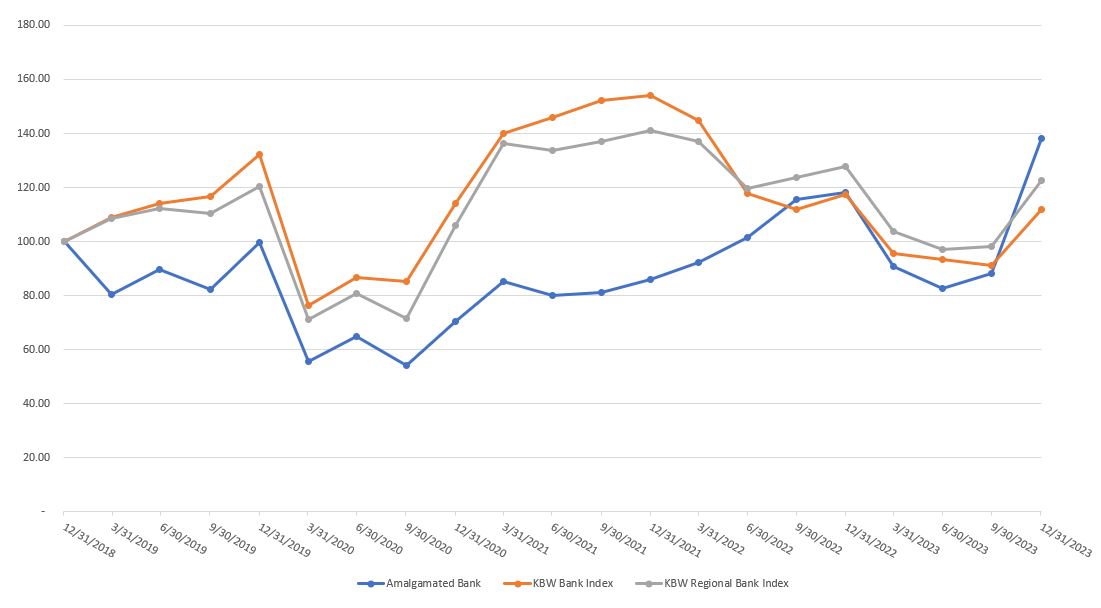
| Cumulative Total Returns Period Ending | |||||||||||||||||||||||||||||
| 12/31/18 | 12/31/19 | 12/31/20 | 12/31/21 | 12/31/22 | 3/31/23 | 6/30/23 | 9/30/23 | 12/31/23 | |||||||||||||||||||||
| Amalgamated | $ | 100.00 | $ | 99.74 | $ | 70.46 | $ | 86.00 | $ | 118.15 | $ | 90.72 | $ | 82.51 | $ | 88.31 | $ | 138.15 | |||||||||||
| KBW Bank Index | 100.00 | 132.14 | 114.13 | 154.12 | 117.55 | 95.63 | 93.50 | 91.26 | 111.92 | ||||||||||||||||||||
| KBW Regional Bank Index | 100.00 | 120.38 | 105.82 | 140.94 | 127.62 | 103.91 | 96.95 | 98.33 | 122.51 | ||||||||||||||||||||
52
Repurchases of Equity Securities
The following table contains information regarding purchases of our common stock during the three months ended December 31, 2023 by or on behalf of the Company or any “affiliate purchaser” as defined in Rule 10b-18(a)(3) under the Exchange Act.
| Issuer Purchases of Equity Securities | ||||||||||||||||||||||||||
Period | Total number of shares purchased (1) | Average price paid per share | Total number of shares purchased as part of publicly announced plans or programs | Approximate dollar value that may yet be purchased under plans or programs (2) | ||||||||||||||||||||||
October 1 through October 31, 2023 | 60,376 | $ | 16.56 | 60,376 | $ | 19,867,732 | ||||||||||||||||||||
November 1 through November 30, 2023 | 30,688 | 19.47 | 4,800 | $ | 19,781,192 | |||||||||||||||||||||
December 1 through December 31, 2023 | 5,283 | 26.82 | — | $ | 19,781,192 | |||||||||||||||||||||
| Total | 96,347 | $ | 18.68 | 65,176 | ||||||||||||||||||||||
(1) Includes shares purchased as part of our publicly announced share repurchase program and withheld by the Company to pay the costs associated with tax withholding related to the exercise of stock options and RSU and PSU vesting. There were 6,227 shares withheld by the Company during the year ended December 31, 2023.
(2) Effective February 25, 2022, our Board of Directors approved an increase to the share repurchase program authorizing the repurchase of an aggregate amount up to $40 million of our outstanding common stock. The authorization did not require us to acquire any specified number of shares and can be suspended or discontinued without prior notice. Under this authorization, $8.3 million of common stock were purchased during the year ended December 31, 2023. The approximate dollar value that may yet to be purchased under the plans or programs is $19.8 million.
53
Item 6. [Reserved]
Item 7. Management’s Discussion and Analysis of Financial Condition and Results of Operations.
General
The following is a discussion of our consolidated financial condition as of December 31, 2023, as compared to December 31, 2022, and our results of operations for the years ended December 31, 2023, December 31, 2022, and December 31, 2021. The purpose of this discussion is to focus on information about our financial condition and results of operations which is not otherwise apparent from our consolidated financial statements and is intended to provide insight into our results of operations and financial condition. This discussion and analysis is best read in conjunction with our consolidated financial statements and related notes as well as the financial and statistical data appearing elsewhere in this report. Historical results of operations and the percentage relationships among any amounts included, and any trends that may appear, may not indicate results of operations for any future periods.
This discussion generally focuses on 2023 and 2022 results and year-to-year comparisons between 2023 and 2022. Discussions of 2021 results and year-to-year comparisons between 2022 and 2021 can be found in the Management's Discussion and Analysis located in Part II, Item 7 of our annual report on Form 10-K for the fiscal year ended December 31, 2022, filed with the SEC on March 9, 2023.
In addition to historical information, this discussion includes certain forward-looking statements regarding business matters and events and trends that may affect our future results. For additional information regarding forward-looking statements and our related cautionary disclosures, see the “Cautionary Note Regarding Forward-Looking Statements” beginning on page ii of this report.
In this discussion, unless the context indicates otherwise, references to “we,” “us,” and “our” refer to the Company and the Bank. However, if the discussion relates to a period before the Effective Date of our Reorganization, the terms refer only to the Bank.
Our Business
Amalgamated Financial Corp., a Delaware public benefit corporation was formed on August 25, 2020 to serve as the holding company for the Bank, which was formed in 1923 as Amalgamated Bank of New York by the Amalgamated Clothing Workers of America, one of the country’s oldest labor unions. On March 1, 2021 (the “Effective Date”), the Company acquired all of the outstanding stock of the Bank and the Bank became the sole subsidiary of the Company. Although we are no longer majority union-owned, The Amalgamated Clothing Workers of America’s successor, Workers United, an affiliate of the Service Employees International Union that represents workers in the textile, distribution, food service and gaming industries, remains a significant stockholder, holding approximately 42% of our equity as of December 31, 2023. As of December 31, 2023, our total assets were $7.97 billion, our total loans, net of deferred fees and allowance were $4.35 billion, our total deposits were $7.01 billion, and our stockholders' equity was $585.4 million. As of December 31, 2023, our trust business held $41.66 billion in assets under custody and $14.82 billion in assets under management.
We offer a complete suite of commercial and retail banking, investment management and trust and custody services. Our commercial banking and trust businesses are national in scope and we also offer a full range of products and services to both commercial and retail customers through our three branch offices across New York City, one branch office in Washington, D.C., one branch office in San Francisco, one commercial office in Boston and our digital banking platform. Our corporate divisions include Commercial Banking, Trust and Investment Management and Consumer Banking. Our product line includes residential mortgage loans, C&I loans, CRE loans, multifamily mortgages, consumer loans (predominantly residential solar) and a variety of commercial and consumer deposit products, including non-interest bearing accounts, interest-bearing demand products, savings accounts, money market accounts and certificates of deposit. We also offer online banking and bill payment services, online cash management, safe deposit box rentals, debit card and ATM card services and the availability of a nationwide network of ATMs for our customers.
We currently offer a wide range of trust, custody, and investment management services, including asset safekeeping, corporate actions, income collections, proxy services, account transition, asset transfers, and conversion management. We also offer a broad range of investment products, including both index and actively-managed funds spanning equity, fixed-income, real estate and alternative investment strategies to meet the needs of our clients. Our products and services are tailored to our target customer base that prefers a financial partner that is socially responsible, values-oriented and committed to creating positive change in the world. These customers include advocacy-based non-profits, social welfare organizations, national labor unions, political
54
organizations, foundations, socially responsible businesses, and other for-profit companies that seek to ensure their profit-making activities align for the benefit of all their stakeholders.
Our goal is to be the go-to financial partner for people and organizations who strive to make a meaningful impact in our society and who care about their communities, the environment, and social justice. The growth of our business is fundamental to our social mission and how we deliver impact and value for our stakeholders. The Company has obtained B CorporationTM certification, a distinction earned after being evaluated under rigorous standards of social and environmental performance, accountability, and transparency. The Company is also the largest of twelve commercial financial institutions in the United States that are members of the Global Alliance for Banking on Values, a network of banking leaders from around the world committed to advancing positive change in the banking sector. We hold governance positions in the United Nations convened Net Zero Banking Alliance as part of the Steering Group, the Global Partnership for Carbon Accounting Financials as part of the Steering Committee, and as an advisory role for the Glasgow Finance Alliance for Net Zero. In 2022, our application to the International Standards Organization for a new merchant category code for gun and ammunition stores was approved, which will help in creating new tools that all financial institutions must now use to begin detecting and reporting suspicious activity associated with gun trafficking and mass shootings to FinCEN, the government agency charged with safeguarding the financial system from illicit use.
Critical Accounting Estimates
Our consolidated financial statements are prepared based on the application of generally accepted accounting policies ("GAAP") in the United States, or GAAP, the most significant of which are described in Note 1 of our audited consolidated financial statements, starting on page 86 of this report. To prepare financial statements in conformity with GAAP, management makes estimates, assumptions and judgments based on available information. These estimates, assumptions and judgments affect the amounts reported in the financial statements and accompanying notes. These estimates, assumptions and judgments are based on information available as of the date of the financial statements and, as this information changes, actual results could differ from the estimates, assumptions and judgments reflected in the financial statements. In particular, management has identified accounting policies that, due to the estimates, assumptions and judgments inherent in those policies, are critical in understanding our financial statements. Management has presented the application of these policies to the Audit Committee of our Board of Directors.
The following is a discussion of the critical accounting policies and significant estimates that require us to make complex and subjective judgments. Additional information about these policies can be found in Note 1 of our consolidated financial statements, which begin on page 86 of this report.
Allowance for credit losses on loans
Methods and Assumptions Underlying the Estimate
On January 1, 2023, we adopted the Current Expected Credit Losses (“CECL”) Standard, which requires that loans held for investment be accounted for under the current expected credit losses model. The allowance for credit losses is established and maintained through a provision for credit losses based on expected losses inherent in our loan portfolio. Management evaluates the adequacy of the allowance on a quarterly basis, and additions to the allowance are charged to expense and subsequent changes (favorable and unfavorable) in expected credit losses are recognized immediately in net income as a credit loss expense or a reversal of credit loss expense. Loans are charged off against the allowance when management believes the uncollectibility of a loan balance is confirmed. Expected recoveries do not exceed the aggregate of amounts previously charged-off and expected to be charged-off.
Determining the appropriateness of the allowance is complex and requires judgment by management about the effect of matters that are inherently uncertain. In determining the allowance for credit losses for loans that share similar risk characteristics, the Company utilizes a model which compares the amortized cost basis of the loan to the net present value of expected cash flows to be collected. Expected credit losses are determined by aggregating the individual cash flows and calculating a loss percentage by loan segment for loans that share similar risk characteristics. For a loan that does not share risk characteristics with other loans, the Company will evaluate the loan on an individual basis. Within the model, assumptions are made in the determination of baseline loss rates, severity rates, reasonable and supportable economic forecasts, and prepayment rate.
55
The Company assesses the sensitivity of key assumptions at least annually by stressing the assumptions to understand the impact on the model. While management utilizes its best judgment and information available, the ultimate adequacy of our allowance is dependent upon a variety of factors beyond our control which are inherently difficult to predict, the most significant being the macroeconomic forecasts. The Company's forecast of economic conditions considers baseline, favorable, and adverse scenarios. As economic conditions can change, the anticipated amount of estimated loan defaults and losses, and therefore the adequacy of the allowance, could change significantly. Economic conditions more favorable than forecasted could lead to reductions in the amount of the allowance, and conversely conditions more adverse than forecasted could require increases in the amount of the allowance. Changes in economic forecasts may not occur in the same direction or magnitude across all segments of our loan portfolio and deterioration in some quantitative inputs may offset improvement in others. The Company selects the economic forecast that is most reflective of expectations at that point in time, and changes could significantly impact the calculated estimated credit losses.
For segments that rely on a peer group to develop baseline loss rates, statistical regression is utilized to relate historical macro-economic variables to historical credit loss experience of a peer group of banks. These models are then utilized to forecast future expected credit losses based on expected future behavior of the same macro-economic variables. Adjustments to the quantitative results are made using qualitative factors. These factors include: (1) borrower's financial condition; (2) borrower's ability to pay; (3) nature and volume of financial assets; (4) value of the underlying collateral; (5) lending policies and procedures; (6) quality of the loan review system; (7) the experience, ability, and depth of staff; (8) regulatory and legal environment; (9) changes in market conditions; and (10) changes in economic conditions.
For loans that do not share risk characteristics, the Company evaluates these loans on an individual basis based on various factors. Factors that may be considered are borrower delinquency trends and nonaccrual status, probability of foreclosure or note sale, changes in the borrower’s circumstances or cash collections, borrower’s industry, or other facts and circumstances of the loan or collateral. The expected credit loss is measured based on net realizable value, that is, the difference between the discounted value of the expected future cash flows, based on the original effective interest rate, and the amortized cost basis of the loan. For collateral dependent loans, expected credit loss is measured as the difference between the amortized cost basis of the loan and the fair value of the collateral, less estimated costs to sell.
Uncertainties Regarding the Estimate
Estimating the timing and amounts of future credit losses is subject to significant management judgment as these projected cash flows rely upon the estimates discussed above and factors that are reflective of current or future expected conditions. These estimates depend on the duration of current overall economic conditions, industry, borrower, or portfolio specific conditions. Volatility in certain credit metrics and differences between expected and actual outcomes are to be expected.
Customers may not repay their loans according to the original terms, and the collateral securing the payment of those loans may be insufficient to pay any remaining loan balance. Bank regulators periodically review our allowance for credit losses and may require us to increase our provision for credit losses or loan charge-offs.
Impact on Financial Condition and Results of Operations
If our assumptions prove to be incorrect, the allowance for credit losses may not be sufficient to cover expected losses in the loan portfolio, resulting in additions to the allowance. Future additions or reductions to the allowance may be necessary based on changes in economic, market or other conditions. Changes in estimates could result in a material change in the allowance through charges to earnings would materially decrease our net income.
We may experience significant credit losses if borrowers experience financial difficulties, which could have a material adverse effect on our operating results.
In addition, various regulatory agencies, as an integral part of the examination process, periodically review the allowance for credit losses. Such agencies may require the Company to recognize adjustments to the allowance based on their judgments of the information available to them at the time of their examination.
Recently Issued Accounting Pronouncements
See Note 2 of our consolidated financial statements, which are included beginning on page 93 of this report for a discussion of recently issued accounting pronouncements that have been or will be adopted by us that will require enhanced disclosures in our financial statements in future periods.
56
Impact of Inflation and Changing Interest Rates
Our consolidated financial statements have been prepared in accordance with GAAP, which requires us to measure financial position and operating results primarily in terms of historic dollars. Changes in the relative value of money due to inflation or recession generally are not considered. The primary effect of inflation on our operations is reflected in increased operating costs. Unlike most industrial companies, our assets and liabilities are primarily monetary in nature. Therefore, the effect of changes in interest rates will have a more significant effect on our performance than will the effect of changing prices and inflation in general. While interest rates are greatly influenced by changes in the inflation rate, they do not necessarily change at the same rate or in the same magnitude as the inflation rate. Interest rates are highly sensitive to many factors that are beyond our control, including changes in the expected rate of inflation, the influence of general and local economic conditions and the monetary and fiscal policies of the United States government, its agencies and various other governmental regulatory authorities. For more information about how we evaluate interest rate risk, please see the section entitled “Quantitative and Qualitative Disclosures about Market Risk – Evaluation of Interest Rate Risk.”
Results of Operations
General
Our results of operations depend substantially on net interest income, which is the difference between interest income on interest-earning assets, consisting primarily of interest income on loans, investment securities and other short-term investments and interest expense on interest-bearing liabilities, consisting primarily of interest expense on deposits and borrowings. Our results of operations are also dependent on non-interest income, consisting primarily of income from Trust Department fees, service charges on deposit accounts, net gains or losses on sales of investment securities and income from bank-owned life insurance (“BOLI”). Other factors contributing to our results of operations include our provisions for credit losses, income taxes, and non-interest expenses, such as salaries and employee benefits, occupancy and depreciation expenses, professional fees, data processing fees and other miscellaneous operating costs.
Net income for the year ended December 31, 2023 was $88.0 million, or $2.86 per average diluted share, compared to $81.5 million, or $2.61 per average diluted share, for the same period in 2022. The $6.5 million increase was primarily due to net interest income which increased by $21.5 million, and an increase of non-interest income of $5.4 million, offset by an increase in non-interest expense of $10.6 million, an increase in income tax expense of $10.1 million.
Net Interest Income
Net interest income, representing interest income less interest expense, is a significant contributor to our revenues and earnings. We generate interest income from interest, dividends and prepayment fees on interest-earning assets, including loans, investment securities and other short-term investments. We incur interest expense from interest paid on interest-bearing liabilities, including interest-bearing deposits, FHLBNY advances and other borrowings. To evaluate net interest income, we measure and monitor (i) yields on our loans and other interest-earning assets, (ii) the costs of our deposits and other funding sources, (iii) our net interest spread and (iv) our net interest margin. Net interest spread is equal to the difference between rates earned on interest-earning assets and rates paid on interest-bearing liabilities. Net interest margin is equal to the annualized net interest income divided by average net interest-earning assets. Average balances were derived from average daily balances. Because non-interest-bearing sources of funds, such as non-interest-bearing deposits and stockholders’ equity, also fund interest-earning assets, net interest margin includes the benefit of these non-interest-bearing sources.
Changes in the market interest rates and interest rates we earn on interest-earning assets or pay on interest-bearing liabilities, as well as the volume and types of interest-earning assets, interest-bearing and non-interest-bearing liabilities, are usually the largest drivers of periodic changes in net interest spread, net interest margin and net interest income.
57
The following table sets forth information related to our average balance sheet, average yields on assets, and average costs of liabilities for the periods indicated:
| Year Ended December 31, | |||||||||||||||||||||||||||||||||||||||||||||||||||||
| 2023 | 2022 | 2021 | |||||||||||||||||||||||||||||||||||||||||||||||||||
| (In thousands) | Average Balance | Income / Expense | Yield / Rate | Average Balance | Income / Expense | Yield / Rate | Average Balance | Income / Expense | Yield / Rate | ||||||||||||||||||||||||||||||||||||||||||||
| Interest-earning assets: | |||||||||||||||||||||||||||||||||||||||||||||||||||||
| Interest-bearing deposits in banks | $ | 142,053 | $ | 5,779 | 4.07 | % | $ | 258,214 | $ | 2,186 | 0.85 | % | $ | 521,681 | $ | 651 | 0.12 | % | |||||||||||||||||||||||||||||||||||
Securities(1) | 3,250,788 | 160,298 | 4.93 | % | 3,391,056 | 106,417 | 3.14 | % | 2,461,661 | 54,615 | 2.22 | % | |||||||||||||||||||||||||||||||||||||||||
| Resell agreements | 10,233 | 705 | 6.89 | % | 182,304 | 4,237 | 2.32 | % | 138,833 | 1,942 | 1.40 | % | |||||||||||||||||||||||||||||||||||||||||
Total loans, net (2)(3) | 4,259,195 | 191,295 | 4.49 | % | 3,615,437 | 145,649 | 4.03 | % | 3,180,093 | 123,318 | 3.88 | % | |||||||||||||||||||||||||||||||||||||||||
| Total interest-earning assets | 7,662,269 | 358,077 | 4.67 | % | 7,447,011 | 258,489 | 3.47 | % | 6,302,268 | 180,526 | 2.86 | % | |||||||||||||||||||||||||||||||||||||||||
| Non-interest-earning assets: | |||||||||||||||||||||||||||||||||||||||||||||||||||||
| Cash and due from banks | 5,140 | 7,126 | 7,853 | ||||||||||||||||||||||||||||||||||||||||||||||||||
| Other assets | 208,902 | 273,028 | 259,718 | ||||||||||||||||||||||||||||||||||||||||||||||||||
| Total assets | $ | 7,876,311 | $ | 7,727,165 | $ | 6,569,839 | |||||||||||||||||||||||||||||||||||||||||||||||
| Interest-bearing liabilities: | |||||||||||||||||||||||||||||||||||||||||||||||||||||
| Savings, NOW and money market deposits | $ | 3,344,407 | $ | 59,818 | 1.79 | % | $ | 2,981,688 | $ | 10,069 | 0.34 | % | $ | 2,622,584 | $ | 4,788 | 0.18 | % | |||||||||||||||||||||||||||||||||||
| Time deposits | 167,167 | 3,452 | 2.07 | % | 185,692 | 638 | 0.34 | % | 248,507 | 1,035 | 0.42 | % | |||||||||||||||||||||||||||||||||||||||||
| Brokered CDs | 364,833 | 17,854 | 4.89 | % | 9,338 | 349 | 3.74 | % | — | — | — | % | |||||||||||||||||||||||||||||||||||||||||
| Total deposits | 3,876,407 | 81,124 | 2.09 | % | 3,176,718 | 11,056 | 0.35 | % | 2,871,091 | 5,823 | 0.20 | % | |||||||||||||||||||||||||||||||||||||||||
Other borrowings | 350,039 | 15,642 | 4.47 | % | 200,726 | 7,593 | 3.78 | % | 12,699 | 400 | 3.15 | % | |||||||||||||||||||||||||||||||||||||||||
| Total interest-bearing liabilities | 4,226,446 | 96,766 | 2.29 | % | 3,377,444 | 18,649 | 0.55 | % | 2,883,789 | 6,222 | 0.22 | % | |||||||||||||||||||||||||||||||||||||||||
| Non-interest-bearing liabilities: | |||||||||||||||||||||||||||||||||||||||||||||||||||||
| Demand and transaction deposits | 3,045,013 | 3,746,152 | 3,017,621 | ||||||||||||||||||||||||||||||||||||||||||||||||||
| Other liabilities | 73,770 | 82,931 | 116,256 | ||||||||||||||||||||||||||||||||||||||||||||||||||
| Total liabilities | 7,345,229 | 7,206,527 | 6,017,666 | ||||||||||||||||||||||||||||||||||||||||||||||||||
| Stockholders' equity | 531,082 | 520,638 | 552,173 | ||||||||||||||||||||||||||||||||||||||||||||||||||
| Total liabilities and stockholders' equity | $ | 7,876,311 | $ | 7,727,165 | $ | 6,569,839 | |||||||||||||||||||||||||||||||||||||||||||||||
| Net interest income / interest rate spread | $ | 261,311 | 2.38 | % | $ | 239,840 | 2.92 | % | $ | 174,304 | 2.64 | % | |||||||||||||||||||||||||||||||||||||||||
| Net interest-earning assets / net interest margin | $ | 3,435,823 | 3.41 | % | $ | 4,069,567 | 3.22 | % | $ | 3,418,479 | 2.77 | % | |||||||||||||||||||||||||||||||||||||||||
| Total Cost of Deposits | 1.17 | % | 0.16 | % | 0.10 | % | |||||||||||||||||||||||||||||||||||||||||||||||
(1) Includes FHLBNY stock in the average balance, and dividend income on FHLBNY stock in interest income
(2) Amounts are net of deferred origination costs. With the adoption of the CECL standard on January 1, 2023, the average balance of the allowance for credit losses on loans was reclassified for all presented periods to other assets to allow for comparability.
(3) Includes prepayment penalty income in 2023, 2022, and 2021 of $0.1 million, $1.7 million, and $1.7 million, respectively.
Net interest income was $261.3 million for the year ended December 31, 2023, compared to $239.8 million for the same period in 2022. The $21.5 million, or 9.0% increase was primarily attributable to continued loan growth as well as increases in yields earned on securities and loans. These impacts are partially offset by an increase in the average balances of deposits and other interest-bearing liabilities, as well as an increase in the cost of funds.
Net interest spread was 2.38% for the year ended December 31, 2023, compared to 2.92% for the same period in 2022, a decrease of 54 basis points. Our net interest margin was 3.41% for the year ended December 31, 2023, an increase of 19 basis points from
58
3.22% in the same period in 2022. This was largely due to the continued loan growth, as well as increase in yields earned on loans and securities outpacing the increase in the cost of funds.
The yield on average earning assets was 4.67% for the year ended December 31, 2023, compared to 3.47% for the same period in 2022, an increase of 120 basis points. This increase was driven primarily by the rising rate environment and an increase in average loan balances.
The average rate on interest-bearing liabilities was 2.29% for the year ended December 31, 2023, an increase of 174 basis points from the same period in 2022, which was primarily due to the rising rate environment, growth in interest-bearing deposits as customers moved into reciprocal products, as well as the utilization of brokered CDs and other borrowings. Non-interest-bearing deposits represented 44% of average deposits for the year ended December 31, 2023, compared to 54% for the year ended December 31, 2022.
Rate-Volume Analysis
Increases and decreases in interest income and interest expense result from changes in average balances (volume) of interest-earning assets and interest-bearing liabilities, as well as changes in weighted average interest rates. The table below presents the effect of volume and rate changes on interest income and expense. Changes in volume are changes in the average balance multiplied by the previous period’s average rate. Changes in rate are changes in the average rate multiplied by the average balance from the previous period. The net changes attributable to the combined impact of both rate and volume have been allocated proportionately to the changes due to volume and the changes due to rate:
| Year Ended December 31, 2023 over December 31, 2022 | |||||||||||||||||
| (In thousands) | Volume | Changes Due To Rate | Net Change | ||||||||||||||
| Interest-earning assets: | |||||||||||||||||
| Interest-bearing deposits in banks | $ | (2,823) | $ | 6,416 | $ | 3,593 | |||||||||||
Securities | (6,638) | 60,519 | 53,881 | ||||||||||||||
| Resell Agreements | (4,298) | 766 | (3,532) | ||||||||||||||
| Total loans, net | 27,206 | 18,440 | 45,646 | ||||||||||||||
| Total interest income | 13,447 | 86,141 | 99,588 | ||||||||||||||
| Interest-bearing liabilities: | |||||||||||||||||
| Savings, NOW and money market deposits | 5,874 | 43,875 | 49,749 | ||||||||||||||
| Time deposits | (347) | 3,161 | 2,814 | ||||||||||||||
| Brokered CDs | 17,505 | — | 17,505 | ||||||||||||||
| Total deposits | 23,032 | 47,036 | 70,068 | ||||||||||||||
| FHLBNY advances | (275) | 892 | 617 | ||||||||||||||
| Other borrowings | 5,517 | 1,915 | 7,432 | ||||||||||||||
| Total borrowings | 5,242 | 2,807 | 8,049 | ||||||||||||||
| Total interest expense | 28,274 | 49,843 | 78,117 | ||||||||||||||
| Change in net interest income | $ | (14,827) | $ | 36,298 | $ | 21,471 | |||||||||||
59
| Year Ended December 31, 2022 over December 31, 2021 | |||||||||||||||||
| (In thousands) | Volume | Changes Due To Rate | Net Change | ||||||||||||||
| Interest-earning assets: | |||||||||||||||||
| Interest-bearing deposits in banks | $ | (1,213) | $ | 2,748 | $ | 1,535 | |||||||||||
Securities | 25,037 | 26,765 | 51,802 | ||||||||||||||
| Resell Agreements | 862 | 1,433 | 2,295 | ||||||||||||||
| Total loans, net | 17,058 | 5,273 | 22,331 | ||||||||||||||
| Total interest income | 41,744 | 36,219 | 77,963 | ||||||||||||||
| Interest-bearing liabilities: | |||||||||||||||||
| Savings, NOW and money market deposits | 1,076 | 4,205 | 5,281 | ||||||||||||||
| Time deposits | (243) | 195 | (48) | ||||||||||||||
| Total deposits | 833 | 4,400 | 5,233 | ||||||||||||||
| FHLBNY advances | 2,368 | 2,370 | 4,738 | ||||||||||||||
| Other borrowings | 2,340 | 116 | 2,456 | ||||||||||||||
| Total borrowings | 4,708 | 2,486 | 7,194 | ||||||||||||||
| Total interest expense | 5,541 | 6,886 | 12,427 | ||||||||||||||
| Change in net interest income | $ | 36,203 | $ | 29,333 | $ | 65,536 | |||||||||||
Provision for Credit Losses
We establish an allowance for credit losses through a provision for credit losses charged as an expense in our Consolidated Statements of Income. On January 1, 2023, we adopted the CECL standard for calculating the allowance for credit losses and the provision for credit losses. For further discussion of the adoption of and methodology under the CECL standard, refer to Note 1 and Note 2 to the Consolidated Financial Statements in Item 8 of this Form 10-K.
Provision for credit losses totaled an expense of $14.7 million for the year ended December 31, 2023, compared to an expense of $15.0 million for the same period in 2022. For the year ended December 31, 2023, the provision for credit losses on loans totaled $13.5 million, the provision for credit losses on securities totaled $1.2 million, and the provision for credit losses on off-balance sheet credit exposures was a release of reserves of $0.1 million. Overall, the provision expense on loans was primarily driven by portfolio growth, and certain individual reserves, offset by improvements in macro-economic forecasts used in the CECL model and releases of reserves for lower unfunded exposures. The provision expense on securities was primarily driven by a $1.2 million charge-off of an unrealized loss position related to an corporate bond classified as available for sale related to Silicon Valley Bank following credit concerns over the issuer.
For a further discussion of the allowance, see “Allowance for Credit Losses” below.
Non-Interest Income
Our non-interest income includes Trust Department fees, which consist of fees received in connection with investment advisory and custodial management services of investment accounts, service fees charged on deposit accounts, income on BOLI, gain or loss on sales of securities, sales of loans, and other real estate owned, income from equity method investments, and other income.
The following table presents our non-interest income for the periods indicated:
60
| Year Ended December 31, | |||||||||||||||||
| (In thousands) | 2023 | 2022 | 2021 | ||||||||||||||
| Trust Department fees | $ | 15,175 | $ | 14,449 | $ | 13,352 | |||||||||||
| Service charges on deposit accounts | 10,999 | 10,999 | 9,355 | ||||||||||||||
| Bank-owned life insurance income | 2,882 | 3,868 | 2,388 | ||||||||||||||
| Gain (loss) on sale of securities | (7,392) | (3,637) | 649 | ||||||||||||||
| Gain (loss) on sale of loans | 32 | (610) | 1,887 | ||||||||||||||
| Loss on other real estate owned | — | (168) | (407) | ||||||||||||||
| Equity method investments income (loss) | 4,932 | (2,773) | 150 | ||||||||||||||
| Other income | 2,708 | 1,769 | 1,015 | ||||||||||||||
| Total non-interest income | $ | 29,336 | $ | 23,897 | $ | 28,389 | |||||||||||
Non-interest income was $29.3 million for the year ended December 31, 2023, compared to $23.9 million for the same period in 2022, an increase of $5.4 million. The increase of $5.4 million was primarily due to a $7.7 million increase in income from equity investments and an increase in other income of $0.9 million primarily attributed to increased gains on the repurchase of subordinated debt. This was partially offset by $3.8 million in increased losses on the sale of securities as part of strategic sales in order to reinvest in higher yielding securities.
Trust Department fees consist of fees we receive in connection with our investment advisory and custodial management services of investment accounts. Our Trust Department fees were $15.2 million in the year ended December 31, 2023, an increase of $0.7 million, or 5.0%, from same period in 2022.
Equity method investments income consists of income from solar tax equity investments. Due to the recognition of tax credits upon initial investment, income from these investments is volatile before achieving steady state. In the early stages of the investment, accelerated depreciation of the value of the investment creates net losses, after which steady state income is achieved, generally within four quarters of the initial investment. Equity method investments income was $4.9 million in the year ended December 31, 2023, compared to a loss of $2.8 million for the same period in 2022.
Non-Interest Expense
The following table presents non-interest expense for the periods indicated:
| Year Ended December 31, | |||||||||||||||||
| (In thousands) | 2023 | 2022 | 2021 | ||||||||||||||
| Compensation and employee benefits | $ | 85,774 | $ | 74,712 | $ | 69,844 | |||||||||||
| Occupancy and depreciation | 13,605 | 13,723 | 14,023 | ||||||||||||||
| Professional fees | 9,637 | 10,417 | 12,961 | ||||||||||||||
| Data processing | 17,744 | 17,732 | 16,042 | ||||||||||||||
| Office maintenance and depreciation | 2,830 | 3,012 | 3,057 | ||||||||||||||
| Amortization of intangible assets | 888 | 1,046 | 1,207 | ||||||||||||||
| Advertising and promotion | 4,181 | 3,741 | 3,230 | ||||||||||||||
| Federal deposit insurance premiums | 4,018 | 3,228 | 2,531 | ||||||||||||||
| Other expense | 12,570 | 12,960 | 9,360 | ||||||||||||||
| Total non-interest expense | $ | 151,247 | $ | 140,571 | 132,255 | ||||||||||||
Non-interest expense for the year ended December 31, 2023 was $151.2 million, an increase of $10.7 million from $140.6 million for the year ended December 31, 2022. The increase was primarily due to a $11.1 million increase in compensation expense due to increased headcount, corporate incentive payments, and temporary personnel costs, an increase in federal deposit insurance premiums expense of $0.8 million, and an increase in advertising and promotion expense of $0.5 million, offset by a $0.8 million decrease in professional fees, and a $0.4 million decrease in other expense.
61
Income Taxes
We had a provision for income tax expense of $36.8 million for the year ended December 31, 2023, compared to $26.7 million for the same period in 2022. Our effective tax rate was 29.5% for the year ended December 31, 2023, compared to 24.7% for the same period in 2022. The increase in the effective tax rate was primarily driven by a $3.3 million adjustment related to a state and city tax examination, which included a $2.7 million uncertain tax liability as of December 31, 2023 regarding the inventory of prior net operating losses. For further discussion of the uncertain tax position, refer to Note 11 to the Consolidated Financial Statements in Item 8 of this Form 10-K.
Financial Condition
Balance Sheet
Total assets were $7.97 billion at December 31, 2023, compared to $7.84 billion at December 31, 2022. Notable changes within individual balance sheet line items include a $417.0 million increase in total deposits, a $284.7 million increase in loans receivable, net, $27.0 million increase in cash and equivalents and a $24.2 million increase in resell agreements, offset by $173.9 million decrease in investment securities and a $345.6 million decrease in FHLB advances and other borrowings.
Investment Securities
The primary goal of our securities portfolio is to maintain an available source of liquidity and an efficient investment return on excess capital, while maintaining a low-risk profile. We also use our securities portfolio to manage interest rate risk, meet Community Reinvestment Act (“CRA”) goals, support the Company's mission, and to provide collateral for certain types of deposits or borrowings. An Investment Committee, chaired by our Chief Financial Officer, manages our investment securities portfolio according to written investment policies approved by our Board of Directors. Investments in our securities portfolio may change over time based on management’s objectives and market conditions.
We seek to minimize credit risk in our securities portfolio through diversification, concentration limits, restrictions on high risk investments (such as subordinated positions), comprehensive pre-purchase analysis and stress testing, ongoing monitoring and by investing a significant portion of our securities portfolio in U.S. Government sponsored entity (“GSE”) obligations. GSEs include the Federal Home Loan Mortgage Corporation (“FHLMC”), the Federal National Mortgage Association (“FNMA”), the Government National Mortgage Association (“GNMA”) and the Small Business Administration (“SBA”). GNMA is a wholly-owned U.S. Government corporation whereas FHLMC and FNMA are private. Mortgage-related securities may include mortgage pass-through certificates, participation certificates and collateralized mortgage obligations (“CMOs”). We invest in non-GSE securities, including property assessed clean energy, or PACE, assessments, in order to generate higher returns, improve portfolio diversification and reduce interest rate and prepayment risk. With the exception of small legacy CRA investments, Trust Preferred securities, and certain corporate bonds, all of our non-GSE securities are senior positions that are the top of the capital structure.
Our investment securities portfolio consists of securities classified as available for sale and held-to-maturity. There were no trading securities in our investment portfolio at December 31, 2023 or at December 31, 2022. All available for sale securities are carried at fair value and may be used for liquidity purposes should management consider it to be in our best interest.
At December 31, 2023 and December 31, 2022, we had available for sale securities of $1.48 billion and $1.81 billion, respectively.
At December 31, 2023, our held-to-maturity securities portfolio primarily consisted of PACE assessments, tax-exempt municipal securities, GSE commercial and residential certificates and other debt. We carry these securities at amortized cost. We had held-to-maturity securities of $1.70 billion at December 31, 2023, and $1.54 billion at December 31, 2022.
With the adoption of the CECL standard as of January 1, 2023, management measures expected credit losses on held-to-maturity debt securities on a collective basis by major security type. Accrued interest receivable on held-to-maturity debt securities totaled $22.5 million at December 31, 2023 and is excluded from the estimate of credit losses, as accrued interest receivable is reversed for securities placed on nonaccrual status. The allowance for credit losses for held-to-maturity securities at January 1, 2023 was $0.7 million. The provision for credit losses for held-to-maturity securities was $79.0 thousand for the year December 31, 2023.
For available-for-sale debt securities in an unrealized loss position, the Company first assesses whether it intends to sell, or it is more likely than not that it will be required to sell the security before the recovery of its amortized cost basis. If either of the criteria regarding intent or requirement to sell is met, the security's amortized cost basis is written down to fair value through
62
income. For debt securities available-for-sale that do not meet the aforementioned criteria, the Company evaluates whether the decline in fair value has resulted from credit losses or other factors. In making this assessment, management considers the extent to which fair value is less than amortized cost, any changes to the rating of the security by a rating agency, and adverse conditions specifically related to the security, among other factors. If this assessment indicates that an expected credit loss exists, the present value of cash flows expected to be collected from the security are compared to the amortized cost basis of the security. If the present value of cash flows expected to be collected is less than the amortized cost basis, a credit loss exists and an allowance for credit losses is recorded for the credit loss, limited by the amount that the fair value is less than the amortized cost basis. Any impairment that has not been recorded through an allowance for credit losses is recognized in other comprehensive income. There was no allowance for credit losses for available for sale securities at January 1, 2023.
Changes in the allowance for credit losses are recorded as credit loss expense (or reversal). Losses are charged against the allowance when management believes the uncollectibility of an available-for-sale security is confirmed or when either of the criteria regarding intent or requirement to sell is met.
Accrued interest receivable on available-for-sale debt securities totaled $12.6 million at December 31, 2023 and is excluded from the estimate of credit losses, as accrued interest receivable is reversed for securities placed on nonaccrual status.
The following table is a summary of our investment portfolio, using market value for available for sale securities and amortized cost for held-to-maturity securities, as of the dates indicated.
| December 31, 2023 | December 31, 2022 | December 31, 2021 | |||||||||||||||||||||||||||||||||
| (In thousands) | Amount | % of Portfolio | Amount | % of Portfolio | Amount | % of Portfolio | |||||||||||||||||||||||||||||
| Available for sale: | |||||||||||||||||||||||||||||||||||
| Traditional securities: | |||||||||||||||||||||||||||||||||||
| GSE certificates & CMOs | $ | 480,615 | 15.1 | % | $ | 596,638 | 17.8 | % | $ | 829,726 | 28.1 | % | |||||||||||||||||||||||
| Non-GSE certificates & CMOs | 196,860 | 6.2 | % | 224,706 | 6.7 | % | 172,706 | 5.8 | % | ||||||||||||||||||||||||||
| ABS | 627,635 | 19.7 | % | 848,427 | 25.3 | % | 972,211 | 32.9 | % | ||||||||||||||||||||||||||
| Corporate | 120,741 | 3.8 | % | 138,861 | 4.1 | % | 132,153 | 4.5 | % | ||||||||||||||||||||||||||
| Other | 3,888 | 0.1 | % | 3,844 | 0.1 | % | 6,614 | 0.2 | % | ||||||||||||||||||||||||||
| PACE assessments: | |||||||||||||||||||||||||||||||||||
| Residential PACE assessments | 53,303 | 1.7 | % | — | — | % | — | — | % | ||||||||||||||||||||||||||
| Total available for sale | 1,483,042 | 46.6 | % | 1,812,476 | 54.0 | % | 2,113,410 | 71.5 | % | ||||||||||||||||||||||||||
| Held-to-maturity: | |||||||||||||||||||||||||||||||||||
Traditional securities: | |||||||||||||||||||||||||||||||||||
| GSE certificates & CMOs | 194,329 | 6.1 | % | 187,652 | 5.6 | % | 58,820 | 2.0 | % | ||||||||||||||||||||||||||
| Non-GSE certificates & CMOs | 79,406 | 2.5 | % | 83,103 | 2.5 | % | 21,128 | 0.7 | % | ||||||||||||||||||||||||||
| ABS | 279,916 | 8.8 | % | 288,683 | 8.6 | % | 75,800 | 2.6 | % | ||||||||||||||||||||||||||
| Municipal | 66,635 | 2.1 | % | 67,986 | 2.0 | % | 57,327 | 1.9 | % | ||||||||||||||||||||||||||
| Other | — | — | % | 2,000 | 0.1 | % | 3,100 | 0.1 | % | ||||||||||||||||||||||||||
PACE assessments: | |||||||||||||||||||||||||||||||||||
| Commercial PACE assessments | 258,306 | 8.1 | % | 255,424 | 7.6 | % | 175,712 | 5.9 | % | ||||||||||||||||||||||||||
| Residential PACE assessments | 818,963 | 25.8 | % | 656,453 | 19.6 | % | 451,682 | 15.3 | % | ||||||||||||||||||||||||||
Total held-to-maturity | 1,697,555 | 53.4 | % | 1,541,301 | 46.0 | % | 840,469 | 28.5 | % | ||||||||||||||||||||||||||
| Total securities | $ | 3,180,597 | 100.0 | % | $ | 3,353,777 | 100.0 | % | $ | 2,956,979 | 100.0 | % | |||||||||||||||||||||||
63
The following table show contractual maturities and yields for the available-for sale and held-to-maturity securities portfolios:
| Contractual Maturity as of December 31, 2023 | |||||||||||||||||||||||||||||||||||||||||||||||
| One Year or Less | One to Five Years | Five to Ten Years | Due after Ten Years | ||||||||||||||||||||||||||||||||||||||||||||
| (In thousands) | Amortized Cost | Weighted Average Yield (1) | Amortized Cost | Weighted Average Yield (1) | Amortized Cost | Weighted Average Yield (1) | Amortized Cost | Weighted Average Yield (1) | |||||||||||||||||||||||||||||||||||||||
| Available for sale: | |||||||||||||||||||||||||||||||||||||||||||||||
| Traditional securities: | |||||||||||||||||||||||||||||||||||||||||||||||
| GSE certificates & CMOs | $ | — | — | % | $ | 17,324 | 2.9 | % | $ | 128,279 | 4.7 | % | $ | 375,498 | 3.6 | % | |||||||||||||||||||||||||||||||
| Non-GSE certificates & CMOs | — | — | % | — | — | % | 6,500 | 0.4 | % | 212,050 | 3.4 | % | |||||||||||||||||||||||||||||||||||
| ABS | — | — | % | 5,149 | 4.9 | % | 247,595 | 7.1 | % | 395,841 | 5.9 | % | |||||||||||||||||||||||||||||||||||
| Corporate | 3,000 | 6.5 | % | 57,032 | 4.2 | % | 80,006 | 3.8 | % | — | — | % | |||||||||||||||||||||||||||||||||||
| Other | 200 | 1.3 | % | 3,997 | 6.2 | % | — | — | % | — | — | % | |||||||||||||||||||||||||||||||||||
| PACE assessments: | |||||||||||||||||||||||||||||||||||||||||||||||
| Residential PACE assessments | — | — | % | — | — | % | — | — | % | 52,863 | 7.5 | % | |||||||||||||||||||||||||||||||||||
| Held-to-maturity: | |||||||||||||||||||||||||||||||||||||||||||||||
| Traditional securities: | |||||||||||||||||||||||||||||||||||||||||||||||
| GSE certificates & CMOs | — | — | % | 14,948 | 3.1 | % | 22,144 | 3.0 | % | 157,237 | 2.9 | % | |||||||||||||||||||||||||||||||||||
| Non-GSE certificates & CMOs | — | — | % | — | — | % | — | — | % | 79,406 | 2.7 | % | |||||||||||||||||||||||||||||||||||
| ABS | — | — | % | — | 0.0 | % | 85,572 | 7.0 | % | 194,344 | 5.4 | % | |||||||||||||||||||||||||||||||||||
| Municipal | — | — | % | 9,438 | 3.7 | % | 3,545 | 2.2 | % | 53,652 | 2.8 | % | |||||||||||||||||||||||||||||||||||
| PACE assessments: | |||||||||||||||||||||||||||||||||||||||||||||||
| Commercial PACE assessments | — | — | % | — | — | % | — | — | % | 258,306 | 5.0 | % | |||||||||||||||||||||||||||||||||||
| Residential PACE assessments | — | — | % | — | — | % | — | — | % | 818,963 | 5.1 | % | |||||||||||||||||||||||||||||||||||
| Total securities | $ | 3,200 | 6.2 | % | $ | 107,888 | 3.9 | % | $ | 573,641 | 5.8 | % | $ | 2,598,160 | 4.7 | % | |||||||||||||||||||||||||||||||
(1) Estimated yield based on book price (amortized cost divided by par) using estimated prepayments and no change in interest rates.
64
The following table shows a breakdown of our asset backed securities by sector and ratings at carrying value based on the fair value of available for sale securities and amortized cost of held-to-maturity securities as of December 31, 2023:
| Expected Avg. Life in Years | Credit Ratings Highest Rating if split rated | |||||||||||||||||||||||||||||||
| (In thousands) | Amount | % | % Floating | % AAA | % AA | % A | % BBB | % Not Rated | Total | |||||||||||||||||||||||
| CLO Commercial & Industrial | $ | 531,375 | 58 | % | 2.7 | 100 | % | 98 | % | 2 | % | 0 | % | 0 | % | 0 | % | 100 | % | |||||||||||||
| Consumer | 160,276 | 18 | % | 6.0 | 0 | % | 14 | % | 20 | % | 66 | % | 0 | % | 0 | % | 100 | % | ||||||||||||||
| Mortgage | 146,939 | 16 | % | 2.6 | 0 | % | 100 | % | 0 | % | 0 | % | 0 | % | 0 | % | 100 | % | ||||||||||||||
| Student | 68,961 | 8 | % | 4.3 | 30 | % | 79 | % | 21 | % | 0 | % | 0 | % | 0 | % | 100 | % | ||||||||||||||
| Total Securities: | $ | 907,551 | 100 | % | 3.4 | 61 | % | 82 | % | 6 | % | 12 | % | 0 | % | 0 | % | 100 | % | |||||||||||||
Our securities portfolio primarily consists of high quality investments in mortgage-backed securities to government sponsored entities and other asset-backed securities and PACE assessments. All non-agency securities, composed of non-agency commercial mortgage-backed securities, collateralized loan obligations, non-agency mortgage-backed securities, and asset-backed securities, are senior tranche and approximately 86% carry AAA credit ratings and 14% carry A credit ratings or higher. Approximately 70% of this portfolio is classified as “available for sale.”
Loans
Lending-related income is an important component of our net interest income and is a main driver of our results of operations. Total loans, net of deferred origination fees and allowance for credit losses, were $4.35 billion as of December 31, 2023 compared to $4.06 billion as of December 31, 2022. Within our commercial loan portfolio, our primary focus has been on C&I, multifamily and CRE lending. Within our retail loan portfolio, our primary focus has been on residential one-to-four family (1st lien) mortgages and residential solar loans. We intend to focus any organic growth in our loan portfolio on these lending areas as part of our strategic plan.
We actively purchase loans from other originating institutions that we believe provide attractive risk-adjusted returns or for CRA purposes. Over the last two years we have made the following loan purchases:
•In 2023, we purchased $39.2 million of residential solar loans, $13.7 million of residential mortgages, $1.7 million of commercial loans that are unconditionally guaranteed by the U.S. Government, $2.1 million of consumer home improvement loans and $10.8 million of commercial energy efficient loans.
•In 2022, we purchased $196.4 million of residential solar loans, $122.1 million of residential mortgages, $34.9 million of commercial loans that are unconditionally guaranteed by the U.S. Government, $32.2 million of consumer home improvement loans and $11.2 million of commercial energy efficient loans.
We plan to selectively evaluate the purchase of additional loan pools that meet our underwriting criteria as part of our strategic plan.
65
The following table sets forth the composition of our loan portfolio, as of December 31, 2023 and December 31, 2022:
(In thousands) | December 31, 2023 | December 31, 2022 | |||||||||||||||||||||
Amount | % of total loans | Amount | % of total loans | ||||||||||||||||||||
| Commercial portfolio: | |||||||||||||||||||||||
| Commercial and industrial | $ | 1,010,998 | 22.9 | % | $ | 925,641 | 22.5 | % | |||||||||||||||
| Multifamily mortgages | 1,148,120 | 26.1 | % | 967,521 | 23.6 | % | |||||||||||||||||
| Commercial real estate mortgages | 353,432 | 8.0 | % | 335,133 | 8.2 | % | |||||||||||||||||
| Construction and land development mortgages | 23,626 | 0.5 | % | 37,696 | 0.9 | % | |||||||||||||||||
| Total commercial portfolio | 2,536,176 | 57.5 | % | 2,265,991 | 55.2 | % | |||||||||||||||||
| Retail portfolio: | |||||||||||||||||||||||
| Residential real estate lending | 1,425,596 | 32.3 | % | 1,371,779 | 33.5 | % | |||||||||||||||||
Consumer solar(1) | 408,260 | 9.3 | % | 416,849 | 10.2 | % | |||||||||||||||||
Consumer and other(1) | 41,287 | 0.9 | % | 47,150 | 1.1 | % | |||||||||||||||||
| Total retail portfolio | 1,875,143 | 42.5 | % | 1,835,778 | 44.8 | % | |||||||||||||||||
| Total loans | 4,411,319 | 100.0 | % | 4,101,769 | 100.0 | % | |||||||||||||||||
Net deferred loan origination costs (fees)(2) | — | 4,233 | |||||||||||||||||||||
Allowance for credit losses(3) | (65,691) | (45,031) | |||||||||||||||||||||
| Total loans, net | $ | 4,345,628 | $ | 4,060,971 | |||||||||||||||||||
(2) With the adoption of the CECL standard, loans balances as of December 31, 2023 are presented at amortized cost, net of deferred loan origination costs.
(3) With the adoption of the CECL standard, the allowance for credit losses on loans as of December 31, 2023 is calculated under the current expected credit losses model. For December 31, 2022, and the allowance on loans presented is the allowance for loan losses calculated using the incurred loss model.
Commercial loan portfolio
Our commercial loan portfolio comprised 57.5% of our total loan portfolio at December 31, 2023 and 55.2% of our total loan portfolio at December 31, 2022. The major categories of our commercial loan portfolio are discussed below:
C&I. Our C&I loans are generally made to small and medium-sized manufacturers and wholesale, retail and service-based businesses to provide either working capital or to finance major capital expenditures. In addition, our C&I portfolio includes commercial solar financings; for many of these we are the sole lender, while for some others we are a participant in a syndicated credit facility led by another institution. The primary source of repayment for C&I loans is generally operating cash flows of the business or project. We also seek to minimize risks related to these loans by requiring such loans to be collateralized by various business assets (including inventory, equipment, accounts receivable, and the assignment of contracts that generate cash flow). The average size of our C&I loans at December 31, 2023 by exposure was $4.6 million with a median size of $1.0 million. We have shifted our lending strategy to focus on developing full customer relationships including deposits, cash management, and lending. The businesses that we focus on are generally mission aligned with our core values, including organic and natural products, sustainable companies, clean energy, nonprofits, and B Corporations TM.
Our C&I loans totaled $1.01 billion at December 31, 2023, which comprised 22.9% of our total loan portfolio. During the year ended 2023, the C&I loan portfolio increased by 9.2% from $925.6 million at December 31, 2022.
Multifamily. Our multifamily loans are generally used to purchase or refinance apartment buildings of five units or more, which collateralize the loan, in major metropolitan areas within our markets. Multifamily loans have 74% of their exposure in New York City—our largest geographic concentration. Our multifamily loans have been underwritten under stringent guidelines on loan-to-value and debt service coverage ratios that are designed to mitigate credit and concentration risk in this loan category. The average current LTV of our multifamily loans is approximately 54%.
66
Our multifamily loans totaled $1.15 billion at December 31, 2023, which comprised 26.1% of our total loan portfolio. During the year ended 2023, the multifamily loan portfolio increased by 18.7% from $967.5 million at December 31, 2022.
CRE. Our CRE loans are used to purchase or refinance office buildings, owner-occupied office buildings, retail centers, industrial facilities, mixed-used buildings, and education centers. Our CRE loans totaled $353.4 million at December 31, 2023, which comprised 8.0% of our total loan portfolio. During the year ended December 31, 2023, the CRE loan portfolio increased by 5.5% from $335.1 million at December 31, 2022.
Retail loan portfolio
Our retail loan portfolio comprised 42.5% of our total loan portfolio at December 31, 2023 and 44.8% of our loan portfolio at December 31, 2022. The major categories of our retail loan portfolio are discussed below:
Residential real estate lending. Our residential one-to-four family mortgage loans are residential mortgages that are primarily secured by single-family homes, which can be owner occupied or investor owned. These loans are either originated by our loan officers or purchased from other originators with the servicing retained by such originators. Our residential real estate lending portfolio is 99% first mortgage loans and 1% second mortgage loans. As of December 31, 2023, approximately 80% of our residential one-to-four family mortgage loans were either originated by our loan officers since 2012 or were acquired in our acquisition of New Resource Bank, and approximately 20% were purchased or acquired. Our residential real estate lending loans totaled $1.43 billion at December 31, 2023, which comprised 76.0% of our retail loan portfolio and 32.3% of our total loan portfolio. During the year ended December 31, 2023, our residential real estate lending loans increased by 3.9% from $1.37 billion at December 31, 2022.
Consumer solar. Our consumer solar portfolio is comprised of purchased residential solar loans, secured by Uniform Commercial Code (UCC) financing statements. Our consumer solar loans totaled $408.3 million at December 31, 2023, which comprised 9.3% of our total loan portfolio, compared to $416.8 million, or 10.2%, of our total loan portfolio at December 31, 2022.
Consumer and other. Our consumer and other portfolio is comprised of purchased student loans, unsecured consumer loans and overdraft lines. Our consumer and other loans totaled $41.3 million at December 31, 2023, which comprised 0.9% of our total loan portfolio, compared to $47.2 million, or 1.1% of our total loan portfolio, at December 31, 2022.
Maturities and Sensitivity of Loans to Changes in Interest Rates
The information in the following table is based on the contractual maturities of individual loans, including loans that may be subject to renewal at their contractual maturity. Renewal of these loans is subject to review and credit approval, as well as
67
modification of terms upon maturity. Actual repayments of loans may differ from the maturities reflected below because borrowers have the right to prepay obligations with or without prepayment penalties.
The following table summarizes our loans held for investment portfolio at December 31, 2023 by maturity date.
| (In thousands) | One year or less | After one but within five years | After 5 years but within 15 years | After 15 years | Total | ||||||||||||||||||||||||
| Commercial Portfolio: | |||||||||||||||||||||||||||||
| Commercial and industrial | $ | 136,242 | $ | 319,128 | $ | 362,246 | $ | 193,382 | $ | 1,010,998 | |||||||||||||||||||
| Multifamily | 176,574 | 603,317 | 362,067 | 6,162 | 1,148,120 | ||||||||||||||||||||||||
| Commercial real estate | 71,796 | 205,887 | 69,167 | 6,582 | 353,432 | ||||||||||||||||||||||||
| Construction and land development | 22,030 | 1,596 | — | — | 23,626 | ||||||||||||||||||||||||
| Retail Portfolio: | |||||||||||||||||||||||||||||
| Residential real estate lending | 2 | 4,231 | 147,186 | 1,274,177 | 1,425,596 | ||||||||||||||||||||||||
| Consumer solar | 211 | 2,639 | 58,719 | 346,691 | 408,260 | ||||||||||||||||||||||||
| Consumer and other | 956 | 3,313 | 28,400 | 8,618 | 41,287 | ||||||||||||||||||||||||
| Total Loans | $ | 407,811 | $ | 1,140,111 | $ | 1,027,785 | $ | 1,835,612 | $ | 4,411,319 | |||||||||||||||||||
The following table presents our loans held for investment with maturity due after December 31, 2024:
| (In thousands) | Fixed | Adjustable | Total | ||||||||||||||
| Commercial Portfolio: | |||||||||||||||||
| Commercial and industrial | $ | 540,212 | $ | 334,544 | $ | 874,756 | |||||||||||
| Multifamily | 951,874 | 19,672 | 971,546 | ||||||||||||||
| Commercial real estate | 269,291 | 12,345 | 281,636 | ||||||||||||||
| Construction and land development | 1,596 | — | 1,596 | ||||||||||||||
| Retail Portfolio: | |||||||||||||||||
| Residential real estate lending | 794,281 | 631,313 | 1,425,594 | ||||||||||||||
| Consumer solar | 408,049 | — | 408,049 | ||||||||||||||
| Consumer and other | 40,129 | 202 | 40,331 | ||||||||||||||
| Total Loans | $ | 3,005,432 | $ | 998,076 | $ | 4,003,508 | |||||||||||
68
Allowance for Credit Losses
We maintain the allowance at a level we believe is sufficient to absorb current expected credit losses in our loan portfolio. For further discussion of the adoption of and methodology under the CECL standard, refer to Note 1 to the Consolidated Financial Statements in Item 8 of this Form 10-K.
The following tables presents, by loan type, the changes in the allowance for the periods indicated. With the adoption of the CECL standard, the allowance for credit losses for the year ended December 31, 2023 is calculated under the expected credit losses model. For the years ended December 31, 2022 and 2021, the allowance on loans presented is the allowance for loan losses using the incurred loss model.
| Year Ended December 31, | |||||||||||||||||
| (In thousands) | 2023 | 2022 | 2021 | ||||||||||||||
| Beginning balance | $ | 45,031 | $ | 35,866 | $ | 41,589 | |||||||||||
| Adoption of ASU No. 2016-13 | 21,229 | — | — | ||||||||||||||
| Loan charge-offs: | |||||||||||||||||
| Commercial portfolio: | |||||||||||||||||
| Commercial and industrial | 1,726 | — | 813 | ||||||||||||||
| Multifamily | 2,367 | 416 | 4,081 | ||||||||||||||
| Commercial real estate | — | — | 314 | ||||||||||||||
| Construction and land development | 4,664 | 389 | — | ||||||||||||||
| Retail portfolio: | |||||||||||||||||
| Residential real estate lending | 65 | 2,448 | 1,081 | ||||||||||||||
| Consumer solar | 6,966 | 4,942 | 2,424 | ||||||||||||||
| Consumer and other | 270 | 201 | 275 | ||||||||||||||
| Total loan charge-offs | 16,058 | 8,396 | 8,988 | ||||||||||||||
| Recoveries of loans previously charged-off: | |||||||||||||||||
| Commercial portfolio: | |||||||||||||||||
| Commercial and industrial | 53 | 274 | 221 | ||||||||||||||
| Multifamily | 20 | — | — | ||||||||||||||
| Construction and land development | — | 2 | 3 | ||||||||||||||
| Retail portfolio: | |||||||||||||||||
| Residential real estate lending | 706 | 1,800 | 3,168 | ||||||||||||||
| Consumer solar | 1,211 | 423 | 87 | ||||||||||||||
| Consumer and other | 36 | 60 | 73 | ||||||||||||||
| Total loan recoveries | 2,026 | 2,559 | 3,552 | ||||||||||||||
| Net charge-offs | 14,032 | 5,837 | 5,436 | ||||||||||||||
| Provision for credit losses | 13,463 | 15,002 | (287) | ||||||||||||||
| Balance at end of period | $ | 65,691 | $ | 45,031 | $ | 35,866 | |||||||||||
The allowance for credit losses increased $20.7 million to $65.7 million at December 31, 2023 from $45.0 million at December 31, 2022. On January 1, 2023, the adoption of the CECL standard increased the allowance for credit losses on loans by $21.2 million to recognize the Day 1 cumulative effect, primarily attributed to our consumer solar portfolio. The ratio of allowance to total loans was 1.49% at December 31, 2023 and 1.10% at December 31, 2022. Considering the Day 1 cumulative effect, the ratio of allowance to total loans at January 1, 2023 was 1.61%.
At December 31, 2023, the allowance for credit losses on held-to-maturity securities was $0.7 million. On January 1, 2023, an allowance of $0.7 million was recorded to recognize the Day 1 cumulative effect, primarily attributed to commercial and residential PACE assessments. Additionally, the allowance for expected credit losses on off-balance sheet loan exposures was increased by $2.7 million to recognize the Day 1 cumulative impact of adopting the CECL standard.
69
Allocation of Allowance for Credit Losses on Loans
The following table presents the allocation of the allowance and the percentage of the total amount of loans in each loan category listed as of the dates indicated:
| At December 31, 2023 | At December 31, 2022 | ||||||||||||||||||||||
| (In thousands) | Amount | % of total loans | Amount | % of total loans | |||||||||||||||||||
| Commercial Portfolio: | |||||||||||||||||||||||
| Commercial and industrial | $ | 18,331 | 22.9 | % | $ | 12,916 | 22.5 | % | |||||||||||||||
| Multifamily | 2,133 | 26.1 | % | 7,104 | 23.6 | % | |||||||||||||||||
| Commercial real estate | 1,276 | 8.0 | % | 3,627 | 8.2 | % | |||||||||||||||||
| Construction and land development | 24 | 0.5 | % | 825 | 0.9 | % | |||||||||||||||||
| Total commercial portfolio | $ | 21,764 | 57.5 | % | $ | 24,472 | 55.2 | % | |||||||||||||||
| Retail Portfolio: | |||||||||||||||||||||||
| Residential real estate lending | 13,273 | 32.3 | % | 11,338 | 33.5 | % | |||||||||||||||||
| Consumer solar | 27,978 | 9.3 | % | 6,867 | 10.2 | % | |||||||||||||||||
| Consumer and other | 2,676 | 0.9 | % | 2,354 | 1.1 | % | |||||||||||||||||
| Total retail portfolio | $ | 43,927 | 42.5 | % | $ | 20,559 | 44.8 | % | |||||||||||||||
| Total allowance for credit losses | $ | 65,691 | $ | 45,031 | |||||||||||||||||||
Nonperforming Assets
Nonperforming assets include all loans categorized as nonaccrual, other real estate owned and other repossessed assets. The accrual of interest on loans is discontinued, or the loan is placed on nonaccrual, when the full collection of principal and interest is in doubt. Interest on loans is generally recognized on the accrual basis. Interest is not accrued on loans that are more than 90 days delinquent on payments, and any interest that was accrued but unpaid on such loans is reversed from interest income at that time, or when deemed to be uncollectible. Interest subsequently received on such loans is recorded as interest income or alternatively as a reduction in the amortized cost of the loan if there is significant doubt as to the collectability of the unpaid principal balance. Loans are returned to accrual status when principal and interest amounts contractually due are brought current and future payments are reasonably assured.
70
The following table sets forth information about our nonperforming assets as of December 31, 2023 and December 31, 2022:
| (In thousands) | December 31, 2023 | December 31, 2022 | |||||||||
| Loans 90 days past due and accruing | $ | — | $ | — | |||||||
| Nonaccrual loans held for sale | 989 | 6,914 | |||||||||
| Nonaccrual loans - Commercial | 23,189 | 18,308 | |||||||||
| Nonaccrual loans - Retail | 9,994 | 3,391 | |||||||||
| Nonaccrual securities | 31 | 36 | |||||||||
| Total nonperforming assets | $ | 34,203 | 28,649 | ||||||||
| Nonaccrual loans: | |||||||||||
| Commercial and industrial | $ | 7,533 | 9,629 | ||||||||
| Multifamily | — | 3,828 | |||||||||
| Commercial real estate | 4,490 | 4,851 | |||||||||
| Construction and land development | 11,166 | — | |||||||||
| Total commercial portfolio | 23,189 | 18,308 | |||||||||
| Residential real estate lending | 7,218 | 1,807 | |||||||||
| Consumer solar | 2,673 | 1,584 | |||||||||
| Consumer and other | 103 | — | |||||||||
| Total retail portfolio | 9,994 | 3,391 | |||||||||
| Total nonaccrual loans | $ | 33,183 | 21,699 | ||||||||
| Nonperforming assets to total assets | 0.43 | % | 0.37 | % | |||||||
| Nonaccrual assets to total assets | 0.43 | % | 0.36 | % | |||||||
| Nonaccrual loans to total loans | 0.75 | % | 0.53 | % | |||||||
| Allowance for credit losses on loans to nonaccrual loans | 197.97 | % | 207.53 | % | |||||||
| Allowance for credit losses on loans to total loans | 1.49 | % | 1.10 | % | |||||||
| Ratio of net charge-offs (recoveries) to average loans outstanding during the period: | |||||||||||
| Commercial and industrial | 0.17 | % | (0.03) | % | |||||||
| Multifamily | 0.22 | % | 0.05 | % | |||||||
| Commercial real estate | 0.00 | % | — | % | |||||||
| Construction and land development | 15.21 | % | 1.12 | % | |||||||
| Total commercial portfolio | 0.36 | % | 0.03 | % | |||||||
| Residential real estate lending | (0.05) | % | 0.05 | % | |||||||
| Consumer solar | 1.39 | % | 1.32 | % | |||||||
| Consumer and other | 0.53 | % | 0.39 | % | |||||||
| Total retail portfolio | 0.29 | % | 0.33 | % | |||||||
| Total | 0.33 | % | 0.16 | % | |||||||
Nonperforming assets totaled $34.2 million, or 0.43% of period-end total assets at December 31, 2023, a increase of $5.6 million, compared with $28.6 million, or 0.37% of period-end total assets at December 31, 2022. The increase in nonperforming assets at December 31, 2023 compared to December 31, 2022 was primarily driven by an increase in residential real estate loans on nonaccrual status.
71
Refer to "Allowance for Credit Losses" for discussion on the allowance for credit losses.
Potential problem loans are loans which management has doubts as to the ability of the borrowers to comply with the present loan repayment terms. Potential problem loans are performing loans and include our special mention and substandard-accruing commercial loans and/or loans 30-89 days past due. Potential problem loans are not included in the nonperforming assets table above and totaled $103.5 million, or 1.3% of total assets, at December 31, 2023, as follows: $76.8 million are commercial loans currently in workout that management expects will be rehabilitated; $9.1 million are residential real estate loans, with $9.1 million at 30-89 days delinquent.
At December 31, 2023, a $12.0 million multifamily loan that was in the process of being refinanced has been included as 30-89 days past due as it was past the maturity date. This loan was subsequently refinanced and is performing in accordance with the updated terms.
Resell Agreements
As of December 31, 2023, we had $50.0 million in short term investments of resell agreements, with a weighted interest rate of 6.34%. As of December 31, 2022, we had $25.8 million of short term investments of resell agreements backed by government guaranteed loans, with a weighted interest rate of 6.86%.
Deferred Tax Asset
We had a deferred tax asset, net of deferred tax liabilities, of $56.6 million at December 31, 2023 and $62.5 million at December 31, 2022. As of December 31, 2023, our deferred tax assets were fully realizable with no valuation allowance held against the balance. Our management concluded that it was more-likely-than-not that the entire amount will be realized.
We will evaluate the recoverability of our net deferred tax asset on a periodic basis and record decreases (increases) as a deferred tax provision (benefit) in the Consolidated Statements of Income as appropriate.
Deposits
Deposits represent our primary source of funds. We are focused on growing our core deposits through relationship-based banking with our business and consumer clients. Total deposits were $7.01 billion at December 31, 2023, compared to $6.60 billion at December 31, 2022. We believe that our strong deposit franchise is attributable to our mission-based strategy of developing and maintaining relationships with our clients who share similar values and through maintaining a high level of service.
We gather deposits through each of our three branch locations across New York City, our one branch in Washington, D.C., our one branch in San Francisco and through the efforts of our commercial banking team including our Boston group which focuses nationally on business growth. Through our branch network, online, mobile and direct banking channels, we offer a variety of deposit products including demand deposit accounts, money market deposits, NOW accounts, savings and certificates of deposit, Insured Cash Sweep ("ICS") accounts, Certificate of Deposit Account Registry Service accounts, and brokered certificates of deposit. We bank politically active customers, such as campaigns, PACs, and state and national party committees, which we refer to as political deposits. These deposits exhibit seasonality based on election cycles. As of December 31, 2023 and December 31, 2022, we had approximately $1.19 billion and $643.6 million, respectively, in on-balance sheet and off-balance sheet political deposits which are primarily in demand deposits.
72
The following table sets forth the average balance amounts and the average rates paid on deposits held by us for the years ended December 31, 2023, December 31, 2022 and December 31, 2021.
| 2023 | 2022 | 2021 | |||||||||||||||||||||||||||||||||||||||||||||||||||
| Average Balance | Income / Expense | Average Rate Paid | Average Balance | Income / Expense | Average Rate Paid | Average Balance | Income / Expense | Average Rate Paid | |||||||||||||||||||||||||||||||||||||||||||||
| (In thousands) | |||||||||||||||||||||||||||||||||||||||||||||||||||||
| Non-interest-bearing demand and transaction deposits | $ | 3,045,013 | $ | — | 0.00 | % | $ | 3,746,152 | $ | — | 0.00 | % | $ | 3,017,621 | $ | — | 0.00 | % | |||||||||||||||||||||||||||||||||||
| NOW accounts | 193,765 | 1,804 | 0.93 | % | 207,675 | 450 | 0.22 | % | 203,144 | 170 | 0.08 | % | |||||||||||||||||||||||||||||||||||||||||
| Money market deposit accounts | 2,787,911 | 54,334 | 1.95 | % | 2,391,641 | 8,753 | 0.37 | % | 2,054,286 | 4,237 | 0.21 | % | |||||||||||||||||||||||||||||||||||||||||
| Savings accounts | 362,731 | 3,680 | 1.01 | % | 382,372 | 866 | 0.23 | % | 365,154 | 381 | 0.10 | % | |||||||||||||||||||||||||||||||||||||||||
| Time deposits | 167,167 | 21,286 | 12.73 | % | 185,692 | 961 | 0.52 | % | 248,507 | 1,035 | 0.42 | % | |||||||||||||||||||||||||||||||||||||||||
| Brokered CDs | 364,833 | 20 | 0.01 | % | 9,338 | 26 | 0.28 | % | — | — | — | % | |||||||||||||||||||||||||||||||||||||||||
| $ | 6,921,420 | $ | 81,124 | 1.17 | % | $ | 6,922,870 | $ | 11,056 | 0.16 | % | $ | 5,888,712 | $ | 5,823 | 0.10 | % | ||||||||||||||||||||||||||||||||||||
Additionally, we utilize a custodial deposit transference structure through the IntraFi ICS network for certain deposit programs whereby we, acting as custodian of account holder funds, places a portion of such account holder funds that are not needed to support near term settlement at one or more third-party banks insured by the FDIC (each, a "Program Bank"). Accounts opened at Program Banks are established in our name as custodian, for the benefit of our account holders. We remain the issuer of all accounts under the applicable account holder agreements and have sole custodial control and transaction authority over the accounts opened at Program Banks. We maintain the records of each account holder's deposits maintained at Program Banks. These off-balance sheet deposits totaled $303.1 million at December 31, 2023 and zero at December 31, 2022. In return for record keeping services at Program Banks, the Company receives a servicing fee (“Servicing Fee”). For the fiscal year ended December 31, 2023, the Company recognized $149 thousand in servicing fee income compared to $17 thousand for the year ended December 31, 2022, and zero for the year ended December 31, 2021.
We had uninsured deposits of $4.04 billion, $4.52 billion, and $4.33 billion for the years ended 2023, 2022, and 2021, respectively. The decrease in uninsured deposits compared to the prior year is driven by customers moving excess funds into reciprocal deposit products.
Maturities of time certificates of deposit and other time deposits of $250,000 or more outstanding at December 31, 2023 are summarized as follows:
| Maturities as of December 31, 2023 | |||||
| (In thousands) | |||||
| Within three months | $ | 22,026 | |||
| After three but within six months | 1,865 | ||||
| After six months but within twelve months | 7,463 | ||||
| After twelve months | 750 | ||||
| $ | 32,104 | ||||
Liquidity
Liquidity refers to our ability to maintain cash flow that is adequate to fund our operations, support asset growth, maintain reserve requirements and meet present and future obligations of deposit withdrawals, lending obligations and other contractual obligations through either the sale or maturity of existing assets or by obtaining additional funding through liability management. Our liquidity risk management policy provides the framework that we use to maintain adequate liquidity and sources of available liquidity at levels that enable us to meet all reasonably foreseeable short-term, long-term and strategic liquidity demands. The Asset and Liability Management Committee is responsible for oversight of liquidity risk management activities in accordance with the provisions of our liquidity risk policy and applicable bank regulatory capital and liquidity laws and regulations. Our
73
liquidity risk management process includes (i) ongoing analysis and monitoring of our funding requirements under various balance sheet and economic scenarios, (ii) review and monitoring of lenders, depositors, brokers and other liability holders to ensure appropriate diversification of funding sources and (iii) liquidity contingency planning to address liquidity needs in the event of unforeseen market disruption impacting a wide range of variables. We continuously monitor our liquidity position in order for our assets and liabilities to be managed in a manner that will meet our immediate and long-term funding requirements. We manage our liquidity position to meet the daily cash flow needs of customers, while maintaining an appropriate balance between assets and liabilities to meet the return on investment objectives of our stockholders. We also monitor our liquidity requirements in light of interest rate trends, changes in the economy, and the scheduled maturity and interest rate sensitivity of our securities and loan portfolios and deposits. Liquidity management is made more complicated because different balance sheet components are subject to varying degrees of management control. For example, the timing of maturities of our investment portfolio is fairly predictable and subject to a high degree of control when we make investment decisions. Net deposit inflows and outflows, however, are far less predictable and are not subject to the same degree of certainty.
In addition to assessing liquidity risk on a consolidated basis, we monitor the parent company’s liquidity. The parent company’s routine funding requirements consist primarily of operating expenses, dividends paid to shareholders, debt service, repurchases of common stock and funds used for acquisitions. The parent company obtains funding to meet its obligations from dividends collected from its subsidiaries and the issuance of debt and capital securities. Dividend payments to the parent company by its subsidiary bank are subject to regulatory review and statutory limitations and, in some instances, regulatory approval. The Company maintains sufficient funding to meet expected capital and debt service obligations for 18 months without the support of dividends from subsidiaries and assuming access to the wholesale markets is maintained. The Company maintains sufficient liquidity to meet its capital and debt service obligations for 12 months under adverse conditions without the support of dividends from subsidiaries or access to the wholesale markets.
Our liquidity position is supported by management of our liquid assets and liabilities and access to alternative sources of funds. Our short-term and long-term liquidity requirements are primarily to fund on-going operations, including payment of interest on deposits and debt, extensions of credit to borrowers and capital expenditures. These liquidity requirements are met primarily through our deposits, FHLBNY advances and the principal and interest payments we receive on loans and investment securities. Cash, interest-bearing deposits in third-party banks, securities available for sale and maturing or prepaying balances in our investment and loan portfolios are our most liquid assets. Other sources of liquidity that are available to us include the sale of loans we hold for investment, securitization of loans or PACE assessments, the ability to acquire additional national market non-core deposits, borrowings through the Federal Reserve’s discount window and the issuance of debt or equity securities. We believe that the sources of available liquidity are adequate to meet our current and reasonably foreseeable future liquidity needs.
At December 31, 2023, our cash and equivalents, which consist of cash and amounts due from banks and interest-bearing deposits in other financial institutions, amounted to $90.6 million, or 1.1% of total assets, compared to $63.5 million, or 0.8% of total assets at December 31, 2022. The $27.0 million, or 42.5%, increase is due to normal business activities, strategic investment securities sales, and borrowings. Our available for sale securities at December 31, 2023 were $1.48 billion, or 18.6% of total assets, compared to $1.81 billion, or 23.1% of total assets at December 31, 2022. Available for sale securities with an aggregate fair value at December 31, 2023 of $909.9 million were pledged to secure outstanding advances, letters of credit, provide additional borrowing potential, and collateralize municipal deposits. Additionally, mortgage loans with an unpaid principal balance of $2.35 billion were pledged to the FHLBNY to secure outstanding advances, letters of credit and to provide additional borrowing potential.
The liability portion of the balance sheet serves as our primary source of liquidity. Over the long term, we plan to meet our future cash needs through the generation of deposits. Customer deposits have historically provided a sizeable source of relatively stable and low-cost funds. We are also a member of the FHLBNY, from which we can borrow for leverage or liquidity purposes. The FHLBNY requires that securities and qualifying loans be pledged to secure any advances. At December 31, 2023, we had $4.4 million in advances from the FHLBNY and a remaining credit availability of $2.03 billion. In addition, we maintain additional borrowing capacity of approximately $588.0 million with the Federal Reserve’s discount window or Bank Term Funding Program ("BTFP") that is secured by certain securities from our portfolio which are not pledged for other purposes. The outstanding balance related to borrowings from the BTFP at December 31, 2023 was $230.0 million, and is recorded in Other borrowings on the Consolidated Statements of Financial Condition.
We also had $70.5 million in subordinated debt, net of issuance costs. Our cash, off-balance sheet deposits, and borrowing capacity totaled $3.01 billion of immediately available funds, in addition to unpledged securities with two-day availability of $582 million for total liquidity within two-days of $3.59 billion, which provided coverage for 89% of total uninsured deposits.
74
The Company is party to agreements with Pace Funding Group LLC, which operates Home Run Financing, for the purchase of property assessed clean energy, or PACE, assessment securities until the end of July 2023. These investments are to be held in the Company's available for sale and held-to-maturity investment portfolio. As of December 31, 2023, we had purchased $718.2 million of PACE assessment securities from Pace Funding Group LLC and had a remaining commitment of $85.0 million. The PACE assessments have equal-lien priority with property taxes and generally rank senior to first lien mortgages. The Company anticipates these commitments will be funded by means of normal cash flows, will be funded by a reduction in cash and cash equivalents, or by pay-downs and maturities of loans and other investments.
Capital Resources
Total stockholders’ equity at December 31, 2023 was $585.4 million, compared to $509.0 million at December 31, 2022, an increase of $76.4 million. The increase was primarily driven by $88.0 million in net income and a $22.7 million increase in accumulated other comprehensive income due to the mark to market on our available for sale securities portfolio, offset by $12.4 million of dividends, $8.3 million in stock repurchases, and a $17.8 million tax effected charge to retained earnings related to the adoption of the CECL standard. We did not elect to utilize the optional three-year phase-in period for the Day 1 adverse regulatory capital effects upon adopting the CECL standard.
We are subject to various regulatory capital requirements administered by federal banking regulators. Failure to meet minimum capital requirements can initiate certain mandatory and possibly additional discretionary actions by federal banking regulators that, if undertaken, could have a direct material effect on our financial statements.
Regulatory capital rules adopted in July 2013 and fully phased in as of January 1, 2019, which are referred to as the Basel III rules, impose minimum capital requirements for bank holding companies and banks. The Basel III rules apply to all national and state banks and savings associations regardless of size and bank holding companies and savings and loan holding companies with consolidated assets of more than $3 billion. In order to avoid restrictions on capital distributions or discretionary bonus payments to executives, a covered banking organization must maintain the fully phased in “capital conservation buffer” of 2.5% on top of its minimum risk-based capital requirements. This buffer must consist solely of common equity Tier 1 risk-based capital, but the buffer applies to all three measurements (common equity Tier 1 risk-based capital, Tier 1 capital and total capital). The capital conservation is equal to 2.5% of risk-weighted assets.
The following table shows the regulatory capital ratios for the Company and the Bank at the dates indicated:
75
| Actual | For Capital Adequacy Purposes(1) | To Be Considered Well Capitalized | |||||||||||||||||||||||||||||||||
| Amount | Ratio | Amount | Ratio | Amount | Ratio | ||||||||||||||||||||||||||||||
| (In thousands) | |||||||||||||||||||||||||||||||||||
| December 31, 2023 | |||||||||||||||||||||||||||||||||||
| Consolidated: | |||||||||||||||||||||||||||||||||||
| Total capital to risk weighted assets | $ | 788,207 | 15.64 | % | $ | 403,277 | 8.00 | % | N/A | N/A | |||||||||||||||||||||||||
| Tier 1 capital to risk weighted assets | 654,555 | 12.98 | % | 302,458 | 6.00 | % | N/A | N/A | |||||||||||||||||||||||||||
| Tier 1 capital to average assets | 654,555 | 8.07 | % | 324,511 | 4.00 | % | N/A | N/A | |||||||||||||||||||||||||||
| Common equity tier 1 to risk weighted assets | 654,555 | 12.98 | % | 226,843 | 4.50 | % | N/A | N/A | |||||||||||||||||||||||||||
| Bank: | |||||||||||||||||||||||||||||||||||
| Total capital to risk weighted assets | $ | 752,828 | 14.93 | % | $ | 403,266 | 8.00 | % | $ | 504,083 | 10.00 | % | |||||||||||||||||||||||
| Tier 1 capital to risk weighted assets | 689,724 | 13.68 | % | 302,450 | 6.00 | % | 403,266 | 8.00 | % | ||||||||||||||||||||||||||
| Tier 1 capital to average assets | 689,724 | 8.50 | % | 324,515 | 4.00 | % | 405,643 | 5.00 | % | ||||||||||||||||||||||||||
| Common equity tier 1 to risk weighted assets | 689,724 | 13.68 | % | 226,837 | 4.50 | % | 327,654 | 6.50 | % | ||||||||||||||||||||||||||
| December 31, 2022 | |||||||||||||||||||||||||||||||||||
| Consolidated: | |||||||||||||||||||||||||||||||||||
| Total capital to risk weighted assets | $ | 721,324 | 14.87 | % | $ | 387,957 | 8.00 | % | N/A | N/A | |||||||||||||||||||||||||
| Tier 1 capital to risk weighted assets | 597,022 | 12.31 | % | 290,967 | 6.00 | % | N/A | N/A | |||||||||||||||||||||||||||
| Tier 1 capital to average assets | 597,022 | 7.52 | % | 317,738 | 4.00 | % | N/A | N/A | |||||||||||||||||||||||||||
| Common equity tier 1 to risk weighted assets | 597,022 | 12.31 | % | 218,226 | 4.50 | % | N/A | N/A | |||||||||||||||||||||||||||
| Bank: | |||||||||||||||||||||||||||||||||||
| Total capital to risk weighted assets | $ | 715,458 | 14.75 | % | $ | 388,107 | 8.00 | % | $ | 485,134 | 10.00 | % | |||||||||||||||||||||||
| Tier 1 capital to risk weighted assets | 668,864 | 13.79 | % | 291,080 | 6.00 | % | 388,107 | 8.00 | % | ||||||||||||||||||||||||||
| Tier 1 capital to average assets | 668,864 | 8.44 | % | 317,111 | 4.00 | % | 396,389 | 5.00 | % | ||||||||||||||||||||||||||
| Common equity tier 1 to risk weighted assets | 668,864 | 13.79 | % | 218,310 | 4.50 | % | 315,337 | 6.50 | % | ||||||||||||||||||||||||||
As of December 31, 2023, the Bank was categorized as “well capitalized” under the prompt corrective action measures and met the capital conservation buffer requirements.
Contractual Obligations
We have entered into contractual obligations in the normal course of business that involve elements of credit risk, interest rate risk and liquidity risk. The following table summarizes these relations as of December 31, 2023:
| December 31, 2023 | |||||||||||||||||||||||||||||
| (In thousands) | Total | Less than 1 year | 1-3 years | 3-5 years | More than 5 years | ||||||||||||||||||||||||
| FHLBNY Advances | $ | 4,389 | $ | 4,389 | $ | — | $ | — | $ | — | |||||||||||||||||||
| Subordinated Debt | 70,546 | — | — | — | 70,546 | ||||||||||||||||||||||||
| Other Borrowings | 230,000 | 230,000 | — | — | — | ||||||||||||||||||||||||
| Operating Leases | 32,076 | 11,324 | 20,752 | — | — | ||||||||||||||||||||||||
| Certificates of Deposit | 429,667 | 258,311 | 136,625 | 26,870 | 7,861 | ||||||||||||||||||||||||
| $ | 766,678 | $ | 504,024 | $ | 157,377 | $ | 26,870 | $ | 78,407 | ||||||||||||||||||||
76
Item 7A. Quantitative and Qualitative Disclosures about Market Risk.
Our primary market risk is interest rate risk, which is defined as the risk of loss of net interest income or net interest margin because of changes in interest rates.
We seek to measure and manage the potential impact of interest rate risk on our net interest income and net interest expense. Interest rate risk occurs when interest-earning assets and interest-bearing liabilities mature or re-price at different times, on a different basis or in unequal amounts. Interest rate risk also arises when our assets, liabilities and off-balance sheet contracts each respond differently to changes in interest rates, including as a result of explicit and implicit provisions in agreements related to such assets and liabilities and in off-balance sheet contracts that alter the applicable interest rate and cash flow characteristics as interest rates change. The two primary examples of such provisions that we are exposed to are the duration and rate sensitivity associated with indeterminate-maturity deposits (e.g., non-interest-bearing checking accounts, negotiable order of withdrawal accounts, savings accounts and money market deposits accounts) and the rate of prepayment associated with fixed-rate lending and mortgage-backed securities. Interest rates may also affect loan demand, credit losses, mortgage origination volume and other items affecting earnings.
Our Asset Liability Management Committee, chaired by our Treasurer, manages our interest rate risk according to written policies approved by our Board of Directors. Changes in our risk profiles are monitored and managed on a continual basis while risk limits are based on quarterly calculations. We use two primary models to monitor interest rate risk: economic value of equity and net interest income simulations. Scenarios include parallel shifts, ramped shifts, twists of yield curves and other adverse impacts. In addition, we monitor the impact of changes to various assumptions including asset prepayments and deposit repricing and decay assumptions. Our risk management infrastructure also requires the Asset Liability Management Committee to periodically review and disclose all key assumptions used, compare these assumptions and observations to actual historical experience, and check model reliability and validity by sample testing data inputs, back testing and third party validation.
We manage our interest rate risk by monitoring calculated risk measures and balance sheet trends such as growth in fixed rate loans, deposit trends and other factors that affect our risk profile. In order to counter changes in risk, we evaluate costs and other trade-offs associated with changing the composition of assets and liabilities; such as selling fixed rate securities, extending the term of borrowings, changing pricing of loans or deposits or selling residential mortgage loans in the secondary market. We do not engage in speculative trading activities relating to interest rates, foreign exchange rates, commodity prices, equities or credit.
We are also subject to credit risk. Credit risk is the risk that borrowers or counterparties will be unable or unwilling to repay their obligations in accordance with the underlying contractual terms. We manage and control credit risk in the loan portfolio by adhering to well-defined underwriting criteria and account administration standards established by management. Written credit policies document underwriting standards, approval levels, exposure limits and other limits or standards deemed necessary and prudent. Portfolio diversification at the obligor, industry, product and/or geographic location levels is actively managed to mitigate concentration risk. In addition, credit risk management also includes an independent credit review process that assesses compliance with commercial, real estate and other credit policies, risk ratings and other critical credit information. In addition to implementing risk management practices that are based upon established and sound lending practices, we adhere to sound credit principles. We understand and evaluate our customers’ borrowing needs and capacity to repay, in conjunction with their character and history. We manage and control credit risk in the securities portfolio by adhering to investment policies established by management. Our written investment policies ensure that our risk is diversified and monitored, and we only invest in securities that have strong credit quality. The credit risk associated with each investment is thoroughly reviewed, and certain investments are required to undergo stress testing of variables to ensure the Company is not subject to undue credit risk.
Evaluation of Interest Rate Risk
Our simulation models incorporate various assumptions, which we believe are reasonable but which may have a significant impact on results such as: (1) the timing of changes in interest rates, (2) shifts or rotations in the yield curve, (3) loan and securities prepayment speeds for different interest rate scenarios, (4) interest rates and balances of indeterminate-maturity deposits for different scenarios, and (5) new volume and yield assumptions for loans, securities and deposits. Because of limitations inherent in any approach used to measure interest rate risk, simulation results are not intended as a forecast of the actual effect of a change in market interest rates on our results but rather to better plan and execute appropriate asset-liability management strategies and manage our interest rate risk.
Potential changes to our net interest income and economic value of equity in hypothetical rising and declining rate scenarios calculated as of December 31, 2023 are presented in the following table. The projections assume immediate, parallel shifts
77
downward of the yield curve of 100 and 200 basis points and immediate, parallel shifts upward of the yield curve of 100, 200, 300 and 400 basis points.
The results of this simulation analysis are hypothetical and should not be relied on as indicative of expected operating results. A variety of factors might cause actual results to differ substantially from what is depicted. For example, if the timing and magnitude of interest rate changes differ from those projected, our net interest income might vary significantly. Non-parallel yield curve shifts such as a flattening or steepening of the yield curve or changes in interest rate spreads, would also cause our net interest income to be different from that depicted. An increasing interest rate environment could reduce projected net interest income if deposits and other short-term liabilities re-price faster than expected or faster than our assets re-price. Actual results could differ from those projected if we grow assets and liabilities faster or slower than estimated, if we experience a net outflow of deposit liabilities or if our mix of assets and liabilities otherwise changes. Actual results could also differ from those projected if we experience substantially different repayment speeds in our loan portfolio than those assumed in the simulation model. Finally, these simulation results do not contemplate all the actions that we may undertake in response to potential or actual changes in interest rates, such as changes to our loan, investment, deposit, funding or hedging strategies.
| Change in Market Interest Rates as of December 31, 2023 | Estimated Increase (Decrease) in: | |||||||||||||||||||||||||
| Immediate Shift | Economic Value of Equity | Economic Value of Equity ($) | Year 1 Net Interest Income | Year 1 Net Interest Income ($) | ||||||||||||||||||||||
| +400 basis points | -24.0% | (358,682) | -11.7% | (30,832) | ||||||||||||||||||||||
| +300 basis points | -15.5% | (232,293) | -6.0% | (15,696) | ||||||||||||||||||||||
| +200 basis points | -8.3% | (123,513) | -2.0% | (5,368) | ||||||||||||||||||||||
| +100 basis points | -1.8% | (26,588) | -0.1% | (235) | ||||||||||||||||||||||
| -100 basis points | -3.2% | (47,367) | -2.3% | (6,185) | ||||||||||||||||||||||
| -200 basis points | -6.5% | (97,549) | -3.5% | (9,140) | ||||||||||||||||||||||
78
Item 8. Financial Statements and Supplementary Data
Index to the Financial Statements
Consolidated Statements of Financial Condition as of December 31, 2023 and 2022 | |||||
Consolidated Statements of Income for the years ended December 31, 2023, 2022, and 2021 | |||||
Consolidated Statements of Comprehensive Income for the years ended December 31, 2023, 2022, and 2021 | |||||
Consolidated Statements of Changes in Stockholders' Equity for the years ended December 31, 2023, 2022, and 2021 | |||||
Consolidated Statements of Cash Flows for the years ended December 31, 2023, 2022, and 2021 | |||||
Report of Independent Registered Accounting Firm, | |||||
79
Consolidated Statements of Financial Condition (Dollars in thousands except for per share amounts) | |||||||||||
| December 31, 2023 | December 31, 2022 | ||||||||||
| Assets | |||||||||||
| Cash and due from banks | $ | $ | |||||||||
| Interest-bearing deposits in banks | |||||||||||
| Total cash and cash equivalents | |||||||||||
| Securities: | |||||||||||
Available for sale, at fair value: | |||||||||||
Traditional securities | |||||||||||
Property Assessed Clean Energy ("PACE") assessments | |||||||||||
Held-to-maturity, at amortized cost: | |||||||||||
Traditional securities, net of allowance for credit losses of $ | |||||||||||
PACE assessments, net of allowance for credit losses of $ | |||||||||||
| Loans held for sale | |||||||||||
| Loans receivable, net of deferred loan origination costs | |||||||||||
| Allowance for credit losses | ( | ( | |||||||||
| Loans receivable, net | |||||||||||
| Resell agreements | |||||||||||
| Federal Home Loan Bank of New York ("FHLBNY") stock, at cost | |||||||||||
| Accrued interest and dividends receivable | |||||||||||
| Premises and equipment, net | |||||||||||
| Bank-owned life insurance | |||||||||||
| Right-of-use lease asset | |||||||||||
| Deferred tax asset, net | |||||||||||
| Goodwill | |||||||||||
| Intangible assets, net | |||||||||||
| Equity method investments | |||||||||||
| Other assets | |||||||||||
| Total assets | $ | $ | |||||||||
| Liabilities | |||||||||||
| Deposits | $ | $ | |||||||||
Subordinated debt, net | |||||||||||
| Other borrowings | |||||||||||
| Operating leases | |||||||||||
| Other liabilities | |||||||||||
| Total liabilities | |||||||||||
| Stockholders’ equity | |||||||||||
Common stock, par value $ | |||||||||||
| Additional paid-in capital | |||||||||||
| Retained earnings | |||||||||||
| Accumulated other comprehensive loss, net of income taxes | ( | ( | |||||||||
Treasury stock, at cost ( | ( | ||||||||||
| Total Amalgamated Financial Corp. stockholders' equity | |||||||||||
| Noncontrolling interests | |||||||||||
| Total stockholders' equity | |||||||||||
| Total liabilities and stockholders’ equity | $ | $ | |||||||||
See accompanying notes to consolidated financial statements
80
Consolidated Statements of Income (Dollars in thousands, except for per share amounts) | |||||||||||||||||
| Year Ended December 31, | |||||||||||||||||
| 2023 | 2022 | 2021 | |||||||||||||||
| INTEREST AND DIVIDEND INCOME | |||||||||||||||||
| Loans | $ | $ | $ | ||||||||||||||
| Securities | |||||||||||||||||
| Interest-bearing deposits in banks | |||||||||||||||||
| Total interest and dividend income | |||||||||||||||||
| INTEREST EXPENSE | |||||||||||||||||
| Deposits | |||||||||||||||||
| Borrowed funds | |||||||||||||||||
| Total interest expense | |||||||||||||||||
| NET INTEREST INCOME | |||||||||||||||||
| Provision for credit losses | ( | ||||||||||||||||
| Net interest income after provision for credit losses | |||||||||||||||||
| NON-INTEREST INCOME | |||||||||||||||||
| Trust Department fees | |||||||||||||||||
| Service charges on deposit accounts | |||||||||||||||||
| Bank-owned life insurance income | |||||||||||||||||
| Gain (loss) on sale of securities | ( | ( | |||||||||||||||
| Gain (loss) on sale of loans | ( | ||||||||||||||||
| Loss on other real estate owned | ( | ( | |||||||||||||||
| Equity method investments income (loss) | ( | ||||||||||||||||
| Other income | |||||||||||||||||
| Total non-interest income | |||||||||||||||||
| NON-INTEREST EXPENSE | |||||||||||||||||
| Compensation and employee benefits | |||||||||||||||||
| Occupancy and depreciation | |||||||||||||||||
| Professional fees | |||||||||||||||||
| Data processing | |||||||||||||||||
| Office maintenance and depreciation | |||||||||||||||||
| Amortization of intangible assets | |||||||||||||||||
| Advertising and promotion | |||||||||||||||||
| Federal deposit insurance premiums | |||||||||||||||||
| Other expense | |||||||||||||||||
| Total non-interest expense | |||||||||||||||||
| Income before income taxes | |||||||||||||||||
| Income tax expense | |||||||||||||||||
| Net income | $ | $ | $ | ||||||||||||||
| Earnings per common share - basic | $ | $ | $ | ||||||||||||||
| Earnings per common share - diluted | $ | $ | $ | ||||||||||||||
See accompanying notes to consolidated financial statements
81
Consolidated Statements of Comprehensive Income (Dollars in thousands) | |||||||||||||||||
| Year Ended December 31, | |||||||||||||||||
| 2023 | 2022 | 2021 | |||||||||||||||
| Net income | $ | $ | $ | ||||||||||||||
| Other comprehensive income (loss), net of taxes: | |||||||||||||||||
| Change in total obligation for postretirement benefits, prior service credit, and other benefits | ( | ||||||||||||||||
| Net unrealized gains (losses) on securities: | |||||||||||||||||
| Unrealized holding gains (losses) on securities available for sale | ( | ( | |||||||||||||||
| Reclassification adjustment for losses (gains) realized in income | ( | ||||||||||||||||
| Accretion of net unrealized loss on securities transferred to held-to-maturity | |||||||||||||||||
| Net unrealized gains (losses) on securities | ( | ( | |||||||||||||||
| Other comprehensive income (loss), before tax | ( | ( | |||||||||||||||
| Income tax benefit (expense) | ( | ||||||||||||||||
| Total other comprehensive income (loss), net of taxes | ( | ( | |||||||||||||||
| Total comprehensive income (loss), net of taxes | $ | $ | ( | $ | |||||||||||||
See accompanying notes to consolidated financial statements
82
| Consolidated Statements of Changes in Stockholders’ Equity (Dollars in thousands) | |||||||||||||||||||||||||||||||||||||||||
| Number of Shares of Common Stock | Common Stock | Additional Paid-in Capital | Retained Earnings | Accumulated Other Comprehensive Income (Loss) | Treasury Stock, at cost | Total Stockholder's Equity | Noncontrolling Interest | Total Equity | |||||||||||||||||||||||||||||||||||||||||||||
| Balance at January 1, 2021 | $ | $ | $ | $ | $ | $ | $ | $ | |||||||||||||||||||||||||||||||||||||||||||||
| Net income | — | — | — | — | — | — | |||||||||||||||||||||||||||||||||||||||||||||||
| Dividend declared on AREMCO Sr. Preferred class B shares and Jr. Preferred shares | — | — | — | ( | — | — | ( | — | ( | ||||||||||||||||||||||||||||||||||||||||||||
| Dividends on common stock | — | — | — | ( | — | — | ( | — | ( | ||||||||||||||||||||||||||||||||||||||||||||
| Repurchase of shares | ( | ( | ( | — | — | — | ( | — | ( | ||||||||||||||||||||||||||||||||||||||||||||
| Exercise of stock options, net of repurchases | ( | — | — | — | ( | — | ( | ||||||||||||||||||||||||||||||||||||||||||||||
| Restricted stock unit vesting, net of repurchases | — | ( | — | — | — | ( | — | ( | |||||||||||||||||||||||||||||||||||||||||||||
| Stock-based compensation expense | — | — | — | — | — | — | |||||||||||||||||||||||||||||||||||||||||||||||
| Other comprehensive loss, net of taxes | — | — | — | — | ( | — | ( | — | ( | ||||||||||||||||||||||||||||||||||||||||||||
| Balance at December 31, 2021 | |||||||||||||||||||||||||||||||||||||||||||||||||||||
| Net income | — | — | — | — | — | — | |||||||||||||||||||||||||||||||||||||||||||||||
| Dividend declared on AREMCO Sr. Preferred class B shares and Jr. Preferred shares | — | — | — | ( | — | — | ( | — | ( | ||||||||||||||||||||||||||||||||||||||||||||
| Common stock issued under Employee Stock Purchase Plan | — | — | — | — | — | ||||||||||||||||||||||||||||||||||||||||||||||||
| Dividends on common stock | — | — | — | ( | — | — | ( | — | ( | ||||||||||||||||||||||||||||||||||||||||||||
| Repurchase of shares | ( | ( | ( | — | — | — | ( | — | ( | ||||||||||||||||||||||||||||||||||||||||||||
| Exercise of stock options, net of repurchases | ( | — | — | — | ( | — | ( | ||||||||||||||||||||||||||||||||||||||||||||||
| Restricted stock unit vesting, net of repurchases | ( | — | — | — | ( | — | ( | ||||||||||||||||||||||||||||||||||||||||||||||
| Stock-based compensation expense | — | — | — | — | — | — | |||||||||||||||||||||||||||||||||||||||||||||||
| Other comprehensive loss, net of taxes | — | — | — | — | ( | — | ( | — | ( | ||||||||||||||||||||||||||||||||||||||||||||
| Balance at December 31, 2022 | ( | ||||||||||||||||||||||||||||||||||||||||||||||||||||
| — | — | — | ( | — | — | ( | — | ( | |||||||||||||||||||||||||||||||||||||||||||||
| Balance at January 1, 2023 adjusted for change in accounting principle | ( | ||||||||||||||||||||||||||||||||||||||||||||||||||||
| Net income | — | — | — | — | — | — | |||||||||||||||||||||||||||||||||||||||||||||||
| Common stock issued under Employee Stock Purchase Plan | — | — | — | — | |||||||||||||||||||||||||||||||||||||||||||||||||
| Dividends on common stock | — | — | — | ( | — | — | ( | — | ( | ||||||||||||||||||||||||||||||||||||||||||||
| Repurchase of common stock | ( | — | — | — | — | ( | ( | — | ( | ||||||||||||||||||||||||||||||||||||||||||||
| Exercise of stock options, net of repurchases | — | ( | — | — | ( | — | ( | ||||||||||||||||||||||||||||||||||||||||||||||
| Restricted stock unit vesting, net of repurchases | — | ( | — | — | ( | — | ( | ||||||||||||||||||||||||||||||||||||||||||||||
| Stock-based compensation expense | — | — | — | — | — | — | |||||||||||||||||||||||||||||||||||||||||||||||
| Other comprehensive income, net of taxes | — | — | — | — | — | — | |||||||||||||||||||||||||||||||||||||||||||||||
| Balance at December 31, 2023 | $ | $ | $ | $ | ( | $ | ( | $ | $ | $ | |||||||||||||||||||||||||||||||||||||||||||
83
Consolidated Statements of Cash Flows (Dollars in thousands) | |||||||||||||||||
| Year Ended December 31, | |||||||||||||||||
| 2023 | 2022 | 2021 | |||||||||||||||
| CASH FLOWS FROM OPERATING ACTIVITIES | |||||||||||||||||
| Net income | $ | $ | $ | ||||||||||||||
| Adjustments to reconcile net income to net cash provided by operating activities: | |||||||||||||||||
| Depreciation and amortization | |||||||||||||||||
| Amortization of intangible assets | |||||||||||||||||
| Deferred income tax expense | |||||||||||||||||
| Provision for (recovery of) credit losses | ( | ||||||||||||||||
| Stock-based compensation expense | |||||||||||||||||
| Net amortization on loan fees, costs, premiums, and discounts | |||||||||||||||||
Net amortization on securities premiums, discounts, and net unrealized loss on securities transferred to held-to-maturity | |||||||||||||||||
| OTTI gain recognized in earnings | ( | ( | |||||||||||||||
| Net (income) loss from equity method investments | ( | ( | |||||||||||||||
| Net loss (gain) on sale of securities available for sale | ( | ||||||||||||||||
| Net (gain) loss on sale of loans | ( | ( | |||||||||||||||
| Net loss on sale of other real estate owned | |||||||||||||||||
| Net gain on redemption of bank-owned life insurance | ( | ( | ( | ||||||||||||||
| Net gain on repurchase of subordinated debt | ( | ( | |||||||||||||||
| Proceeds from sales of loans held for sale | |||||||||||||||||
| Originations of loans held for sale | ( | ( | ( | ||||||||||||||
| Increase in cash surrender value of bank-owned life insurance | ( | ( | ( | ||||||||||||||
| Increase in accrued interest and dividends receivable | ( | ( | ( | ||||||||||||||
| Decrease in other assets | |||||||||||||||||
Increase (decrease) in other liabilities | ( | ( | |||||||||||||||
| Net cash provided by operating activities | |||||||||||||||||
| CASH FLOWS FROM INVESTING ACTIVITIES | |||||||||||||||||
| Net decrease (increase) in loans | ( | ( | |||||||||||||||
| Purchase of securities available for sale | ( | ( | ( | ||||||||||||||
| Purchase of securities held-to-maturity | ( | ( | ( | ||||||||||||||
| Proceeds from sales of securities available for sale | |||||||||||||||||
| Maturities, principal payments and redemptions of securities available for sale | |||||||||||||||||
| Maturities, principal payments and redemptions of securities held-to-maturity | |||||||||||||||||
| Decrease (increase) in resell agreements | ( | ( | |||||||||||||||
| Increase in equity method investments | ( | ( | ( | ||||||||||||||
| Decrease (increase) in FHLBNY stock, net | ( | ||||||||||||||||
| Purchases of premises and equipment, net | ( | ( | ( | ||||||||||||||
| Proceeds from redemption of bank-owned life insurance | |||||||||||||||||
| Proceeds from sale of other real estate owned | |||||||||||||||||
| Net cash used in investing activities | ( | ( | ( | ||||||||||||||
| CASH FLOWS FROM FINANCING ACTIVITIES | |||||||||||||||||
| Net increase in deposits | |||||||||||||||||
| Net (decrease) increase in other borrowings | ( | ||||||||||||||||
| Proceeds from (repurchase of) subordinated debt | ( | ( | |||||||||||||||
84
| Common stock issued under Employee Stock Purchase Plan | |||||||||||||||||
| Repurchase of common stock | ( | ( | ( | ||||||||||||||
| Dividends paid | ( | ( | ( | ||||||||||||||
| Repurchase of common stock for equity awards | ( | ( | ( | ||||||||||||||
| Net cash provided by financing activities | |||||||||||||||||
| Increase (decrease) in cash, cash equivalents, and restricted cash | ( | ||||||||||||||||
| Cash, cash equivalents, and restricted cash at beginning of year | |||||||||||||||||
| Cash, cash equivalents, and restricted cash at end of year | $ | $ | $ | ||||||||||||||
| Supplemental disclosures of cash flow information: | |||||||||||||||||
| Interest paid during the year | $ | $ | $ | ||||||||||||||
| Income taxes paid during the year | |||||||||||||||||
Supplemental non-cash activities: | |||||||||||||||||
| Right-of-use assets obtained in exchange for lease liabilities | |||||||||||||||||
| Loans transferred from held-for-sale | |||||||||||||||||
| Loans transferred to held-for-sale | |||||||||||||||||
| Loans transferred to other real estate owned | |||||||||||||||||
| Purchase of securities available for sale, net not settled | |||||||||||||||||
| Securities available for sale transferred to held-to-maturity | |||||||||||||||||
| Cumulative change due to adoption of ASU No. 2016-13 | |||||||||||||||||
See accompanying notes to consolidated financial statements
85
Notes to the Consolidated Financial Statements | ||
1. SUMMARY OF SIGNIFICANT ACCOUNTING POLICIES
Nature of Operations and Principles of Consolidation
Amalgamated Financial Corp., a Delaware public benefit corporation (the "Company"), was formed on August 25, 2020 to serve as the holding company for Amalgamated Bank and is a bank holding company registered with the Federal Reserve Board of Governors under the Bank Holding Company Act of 1956, as amended. On March 1, 2021 (the “Effective Date”), the Company acquired all of the outstanding stock of Amalgamated Bank, a New York state-chartered commercial bank in a statutory share exchange transaction (the “Reorganization”) effected under New York law and in accordance with the terms of a Plan of Acquisition dated September 4, 2020 (the “Agreement”). Pursuant to the Reorganization, the Bank became the sole subsidiary of the Company, the Company became the holding company for the Bank and the stockholders of the Bank became stockholders of the Company.
The Bank was formed in 1923 as Amalgamated Bank of New York by the Amalgamated Clothing Workers of America, one of the country’s oldest labor unions.
The audited consolidated financial statements presented in this Annual Report on Form 10-K include the collective results of the Holding Company and its wholly-owned subsidiary, the Bank, which are collectively herein referred to as the “Company.”
Basis of Accounting and Changes in Significant Accounting Policies
The accounting and reporting policies of the Company conform to generally accepted accounting principles ("GAAP") in the United States of America, or GAAP and predominant practices within the banking industry. The Company uses the accrual basis of accounting for financial statement purposes.
The accompanying consolidated financial statements include the accounts of the Company and its majority-owned and wholly-owned subsidiaries. All significant inter-company transactions and balances are eliminated in consolidation.
The preparation of financial statements in conformity with GAAP requires management to make estimates and assumptions that affect the reported amounts of assets, liabilities and disclosures of contingent assets and liabilities at the date of the financial statements, as well as the reported amounts of revenues and expenses during the reporting period. In particular, estimates and assumptions are used in measuring the fair value of certain financial instruments, determining the appropriateness of the allowance for credit losses (“allowance”), evaluating potential other-than-temporary securities impairment, assessing the ability to realize deferred tax assets, and the valuation of share-based payment awards. Estimates and assumptions are based on available information and judgment; therefore actual results could differ from those estimates.
Cash, Cash Equivalents and Restricted Cash
For purposes of reporting cash flows, cash, cash equivalents, and restricted cash include cash, due from banks, interest-bearing deposits in other banks and federal funds sold with original maturities of three months or less. The Company had $0.4 million and $0.4 million in restricted cash as of December 31, 2023 and December 31, 2022, respectively and is included in total cash and cash equivalents on the Consolidated Statements of Financial Condition. The Company’s restricted cash reflects funds held in other financial institutions to secure business operating rights or contractually obligated minimum account funding requirements.
Securities
Purchases of investments in debt securities are designated as either trading, available for sale or held-to-maturity depending on the intent and ability to hold the securities. The initial designation is made at the time of purchase.
As of December 31, 2023 and December 31, 2022, the Company had no securities designated as trading.
Securities available for sale are carried at fair value, with any net unrealized appreciation or depreciation in fair value reported net of taxes as a component of accumulated other comprehensive income (loss) in stockholders’ equity. Debt securities held-to-maturity are carried at amortized cost provided management does not have the intent to sell these securities and does not anticipate that it will be necessary to sell these securities before the full recovery of principal and interest, which may be at maturity.
86
Notes to the Consolidated Financial Statements | ||
Premiums (discounts) on debt securities are amortized (accreted) to income using the level yield method to the contractual maturity date adjusted for actual prepayment experience.
Realized gains and losses on sale of securities are determined using the specific identification method and are reported in non-interest income.
Loans Held for Sale
Loans and Loan Interest Income Recognition
Loans are stated at the principal amount outstanding, net of charge-offs, deferred origination costs and fees and purchase premiums and discounts. Loan origination and commitment fees and certain direct and indirect costs incurred in connection with loan originations are deferred and amortized to income over the life of the related loans as an adjustment to yield. Premiums or discounts on purchased portfolios are amortized or accreted to income using the level yield method.
Interest on loans is generally recognized on the accrual basis. Interest is not accrued on loans that are more than 90 days delinquent on payments, and any interest that was accrued but unpaid on such loans is reversed from interest income at that time, or when deemed to be uncollectible. Interest subsequently received on such loans is recorded as interest income or alternatively as a reduction in the amortized cost of the loan if there is significant doubt as to the collectability of the unpaid principal balance. Loans are returned to accrual status when principal and interest amounts contractually due are brought current and future payments are reasonably assured.
Loans are considered modifications made to borrowers experiencing financial difficulty if the borrower is experiencing financial difficulty at the time of the modification and the modification is in the form of: (i) principal forgiveness; (ii) an interest rate reduction; (iii) another-than-insignificant payment delay; (iv) a term extension, or (v) any combination of the aforementioned. If a modification results in an effective interest rate less than the market rate for comparable loans with similar collection risks, a change in present value of cash flows of at least 10%, or is more than minor based on the specific facts and circumstances, the modification is accounted for as a new receivable. Absent these conditions, the modification is accounted for as a continuation of the existing receivable.
Allowance for Credit Losses
Allowance for Credit Losses - Available for Sale Securities: Any available for sale security in an unrealized loss position is assessed for Management's intent to sell, or if it is more likely than not that it will be required to sell before the recovery of its amortized cost basis. If either criteria regarding intent or requirement to sell is met, the security's amortized cost basis is written down to fair value through income. Accrued interest receivable is excluded from the estimate of expected credit losses, as accrued interest receivable is reversed for securities placed on nonaccrual status. Securities issued by U.S. government entities are either explicitly or implicitly guaranteed by the U.S. government, and are highly rated by major ratings agencies and have a long history of no credit losses. For debt securities that do not meet the aforementioned criteria, the Company evaluates whether the decline in fair value has resulted from expected credit losses or other factors in making this assessment. Management considers the extent in which fair value is less than amortized cost, any changes to the rating of the security by a rating agency, and adverse conditions specifically related to the security, among other factors. If this assessment indicates that a credit loss exists, the present value of cash flows expected to be collected from the security are compared to the amortized cost basis of the security. If the present value of cash flows is expected to be collected is less than the amortized cost basis, a credit loss exists and an allowance for credit losses is recorded for the credit loss, limited by the amount that the fair value is less than the amortized cost basis. Any impairment that has not been recorded through an allowance for credit losses is recognized in other comprehensive income.
Allowance for Credit Losses - Held-to-maturity Securities: Management measures expected credit losses on held-to-maturity securities on a collective basis by security type. The Company’s methodology to measure the allowance for credit losses incorporates both quantitative and qualitative information to assess lifetime expected credit losses. The calculation is based on
87
Notes to the Consolidated Financial Statements | ||
projected annual default rates, loss severities, and prepayment rates. Expected credit losses are estimated over the contractual term of the securities, adjusted for forecasted prepayments when appropriate.
Accrued interest receivable is excluded from the estimate of expected credit losses, as accrued interest receivable is reversed for securities placed on nonaccrual status. The Company has identified the following portfolio segments and measures the allowance for credit losses using the following methods:
Non-GSE residential and commercial mortgage-backed securities held by the Company are secured by pools of commercial or residential certificates.
Asset-backed securities ("ABS") - ABS held by the Company are secured by pools of consumer products such as student loans, consumer loans, and consumer residential solar loans.
Property assessed clean energy ("PACE assessments") - PACE assessments held by the Company are secured low loan to value long-term funding for energy efficient and renewable energy projects for residential or commercial projects.
Other securities - Other securities held by the Company include corporate securities, municipal securities and small investments community reinvestment act investments secured by loans.
GSE and U.S. Treasury securities are either explicitly or implicitly guaranteed by the U.S. government, and are highly rated by major rating agencies and have a long history of no credit losses, therefore the Company does not estimate or recognize an allowance for credit losses on these securities.
Allowance for Credit Losses - Loans: The allowance for credit losses is a valuation account that is deducted from the amortized cost basis of a financial asset or a group of financial assets so that the balance sheet reflects the net amount the Company expects to collect. Amortized cost is the principal balance outstanding, net of purchase premiums and discounts, and deferred fees and costs. Accrued interest receivable on loans is excluded from the estimate of expected credit losses, as accrued interest receivable is reversed for loans placed on nonaccrual status. Subsequent changes (favorable and unfavorable) in expected credit losses are recognized in net income as a credit loss expense or a reversal of credit loss expense. Loans are charged off against the allowance when management believes the uncollectibility of a loan balance is confirmed. Expected recoveries do not exceed the aggregate of amounts previously charged-off and expected to be charged-off.
Management calculates the estimation of the allowance for credit losses on loans on a quarterly basis. The Company’s methodology to measure the allowance for credit losses incorporates both quantitative and qualitative information to assess lifetime expected credit losses at the portfolio segment level. The quantitative component of the allowance model calculates future loan level balances by considering the loan segment baseline loss rate based on a peer group and severity rate, with the exception of the consumer solar segment which is based on the Company's loss history for this segment. Expected credit losses are estimated over the contractual term of the loans, adjusted for forecasted prepayments when appropriate. The baseline loss rate is adjusted for relevant macroeconomic variables by loan segment that consider forecasted economic conditions. The adjusted loss rate is calculated for an eight quarter forecast period then reverts to the historical loss rate on a straight-line basis over four quarters. The loan level cash flows are discounted at the effective interest rate to calculate a loan level allowance which is aggregated at the loan segment level to arrive at the estimated allowance.
Economic parameters are developed using available information relating to past events, current conditions, and reasonable and supportable forecasts. Historical credit experience provides the basis for the estimation of expected credit losses, with qualitative adjustments made to loan segments for differences in current loan-specific risk characteristics such as differences in underwriting standards, portfolio mix, delinquency levels and terms, as well as for changes in environmental conditions, such as changes in unemployment rates, property values or other relevant factors.
The principal business of the Company is lending in commercial and industrial loans, multifamily mortgage loans, commercial real estate loans, construction and land development loans, residential real estate mortgage loans, and consumer solar and consumer and other loans. The Company considers its primary lending area to be the states of New York, and California, and Washington, D.C. A substantial portion of the Company’s loans are secured by real estate in these areas. Accordingly, the ultimate collectability of the loan portfolio is susceptible to changes in market and economic conditions in this region.
88
Notes to the Consolidated Financial Statements | ||
The allowance for credit losses on loans is measured on a collective (pool) basis when similar risk characteristics exist. The Company has identified the following portfolio segments and measures the allowance for credit losses using the methods described above.
Commercial and Industrial Loans - Loans in this classification are made to businesses and include term loans, lines of credit, and senior secured loans to corporations. Generally, these loans are secured by assets of the business and repayment is expected from the cash flows of the business. A weakened economy, and resultant decreased consumer and/or business spending, will have an effect on the credit quality in this loan class.
Multifamily Mortgage Loans - Loans in this classification include income producing residential investment properties of five or more families. Loans are made to established owners with a proven and demonstrable record of strong performance. Repayment is derived generally from the rental income generated from the property and may be supplemented by the owners’ personal cash flow. Credit risk arises with an increase in vacancy rates, property mismanagement and the predominance of non-recourse loans that are customary in the industry.
Commercial Real Estate Loans - Loans in this classification include income producing investment properties and owner-occupied real estate used for business purposes. The underlying properties are located largely in the Company’s primary market area. The cash flows of the income producing investment properties are adversely impacted by a downturn in the economy as evidenced by increased vacancy rates, which in turn, will have an effect on credit quality. In the case of owner-occupied real estate used for business purposes, a weakened economy and resultant decreased consumer and/or business spending will have an adverse effect on credit quality.
Construction and Land Development Loans - Loans in this classification primarily include land loans to local individuals, contractors and developers for developing the land for sale or for the purpose of making improvements thereon. Repayment is derived primarily from sale of the lots/units including any pre-sold units. Credit risk is affected by market conditions, time to sell at an adequate price and cost overruns. To a lesser extent, this class includes commercial development projects that the Company finances, which in most cases are interest only during construction, and then convert to permanent financing. Construction delays, cost overruns, market conditions and the availability of permanent financing, to the extent such permanent financing is not being provided by the Bank, all affect the credit risk in this loan class.
Residential Real Estate Loans - Loans in this classification are generally secured by owner-occupied residential real estate and repayment is dependent on the credit quality of the individual borrower. Loans in this class are secured by both first liens and second liens. The overall health of the economy, including unemployment rates and housing prices, can have an effect on the credit quality in this loan class.
Consumer Solar Loans - Loans in this classification may be either secured or unsecured. This portfolio is comprised of residential solar loans. Repayment is dependent on the credit quality of the individual borrower and, if applicable, sale of the collateral securing the loan. Therefore, the overall health of the economy, including unemployment rates and housing prices, will have an effect on the credit quality in this loan class.
Consumer and Other Loans - Loans in this classification may be either secured or unsecured. This portfolio is comprised of student loans and other consumer products. Repayment is dependent on the credit quality of the individual borrower and, if applicable, sale of the collateral securing the loan. Therefore, the overall health of the economy, including unemployment rates and housing prices, will have an effect on the credit quality in this loan class.
Loans that are determined to have unique risk characteristics are evaluated on an individual basis by Management. Loans evaluated individually are not included in the collective evaluation. Factors that may be considered are borrower delinquency trends and nonaccrual status, probability of foreclosure or note sale, changes in the borrower’s circumstances or cash collections, borrower’s industry, or other facts and circumstances of the loan or collateral.
Individually Evaluated Loans with an ACL: For collateral-dependent loans where the Company has determined that foreclosure of the collateral is probable, or where the borrower is experiencing financial difficulty and the Company expects repayment of the loan to be provided substantially through the operation or sale of the collateral, the ACL is measured based on the difference between the fair value of the collateral, less the estimated costs to sell, and the amortized cost basis of the loan as of the measurement date. The fair value of real estate collateral is determined based on recent appraised values. The fair value of non-real estate collateral, may be determined based on an appraisal, net book value per the borrower’s financial statements, aging
89
Notes to the Consolidated Financial Statements | ||
reports, or by reference to market activity, adjusted or discounted based on management’s historical knowledge, changes in market conditions from the time of the valuation and management’s expertise and knowledge of the borrower and its business. For non-collateral dependent loans, ACL is measured based on the difference between the present value of expected cash flows and the amortized cost basis of the loan as of the measurement date.
Allowance for Credit Losses on Off-Balance Sheet Credit Exposures: The Company estimates expected credit losses over the contractual period in which the Company is exposed to credit risk via a contractual obligation to extend credit, unless that obligation is unconditionally cancellable by the Company for its security and loan portfolios. The allowance for credit losses on off-balance sheet credit exposures is recorded in other liabilities on the consolidated statements of financial condition, and adjusted through the credit loss expense which is recorded in the provision for credit losses on the consolidated statements of income. The estimate includes consideration of the likelihood that funding will occur and an estimate of expected credit losses on commitments expected to be funded over its estimated life, which is the same as the expected loss factor as determined based on the corresponding portfolio segment.
FHLBNY Stock
As a condition of membership with the FHLBNY, the Company is required to hold FHLBNY stock in an amount equal to 0.125% of its aggregate mortgage related assets plus 4.5% of its outstanding FHLBNY advances. The Company’s holdings of FHLBNY stock are pledged against outstanding advances. FHLBNY stock is a non-marketable equity security and is, therefore, reported at cost, which equals par value (the amount at which shares have been redeemed in the past). The investment is periodically evaluated for impairment based on, among other things, the capital adequacy of the FHLBNY and its overall financial condition.
Other Real Estate Owned
Goodwill and Intangible Assets
Premises and Equipment
Leases
The Company determines whether a contract is or contains a lease at inception. For leases with terms greater than twelve months under which the Company is lessee, right-of-use ("ROU") assets and lease liabilities are recorded at the commencement date. Lease liabilities are initially recorded based on the present value of future lease payments over the lease term. ROU assets are
90
Notes to the Consolidated Financial Statements | ||
Bank-Owned Life Insurance
The Company invests in bank-owned life insurance (“BOLI”). BOLI involves the purchase of life insurance policies by the Company on a chosen group of employees. The Company is the owner and beneficiary of the policies. The insurance and earnings thereon is used to offset a portion of future employee benefit costs. BOLI is carried at the cash surrender value of the underlying policies. Earnings from BOLI, as well as changes in cash surrender value, are recognized as non-interest income.
Advertising Costs
The Company expenses advertising and promotion costs as incurred.
Income Taxes
There are two components of income tax expense: current and deferred. Current income tax expense (benefit) approximates cash to be paid (refunded) for income taxes for the applicable period. Deferred income tax expense (benefit) results from differences between assets and liabilities measured for financial reporting and for income-tax return purposes.
The Company records as a deferred tax asset on its Consolidated Statement of Financial Condition an amount equal to the tax credit and tax loss carry-forwards and tax deductions (tax benefits) that we believe will be available to us to offset or reduce the amounts of our income taxes in future periods. Under applicable federal and state income tax laws and regulations, such tax benefits will expire if not used within specified periods of time. Accordingly, the ability to fully utilize our deferred tax asset may depend on the amount of taxable income that we generate during those time periods. At least once each year, or more frequently, if warranted, we make estimates of future taxable income that we believe we are likely to generate during those future periods. If we conclude, on the basis of those estimates and the amount of the tax benefits available to us, that it is more likely than not that we will be able to fully utilize those tax benefits prior to their expiration, we recognize the deferred tax asset in full on our Consolidated Statement of Financial Condition. If, however, we conclude on the basis of those estimates and the amount of the tax benefits available to us that it has become more likely than not that we will be unable to utilize those tax benefits in full prior to their expiration, then we would establish (or increase any existing) a valuation allowance to reduce the deferred tax asset on our Consolidated Statement of Financial Condition to the amount which we believe we are more likely than not to be able to utilize. Such a reduction is implemented by recognizing a non-cash charge that would have the effect of increasing the provision, or reducing any benefit, for income taxes that we would otherwise have recorded in our Consolidated Statements of Income. The determination of whether and the extent to which we will be able to utilize our deferred tax asset involves management judgments and assumptions that are subject to period-to-period changes as a result of changes in tax laws, changes in the market, or economic conditions that could affect our operating results or variances between our actual operating results and our projected operating results, as well as other factors.
When measuring the amount of current taxes to be paid (or refunded) management considers the merit of various tax treatments in the context of statutory, judicial and regulatory guidance. Management also considers results of recent tax audits and historical experience. While management considers the amount of income taxes payable (or receivable) to be appropriate based on information currently available, future additions or reductions to such amounts may be necessary due to unanticipated events or changes in circumstances. Management has not taken, and does not expect to take, any position in a tax return which it deems to be uncertain.
The Company recognizes interest and penalties related to income tax matters in income tax expense.
91
Notes to the Consolidated Financial Statements | ||
The deferral method of accounting is used for investments that generate investment tax credits. Under this method, the investment tax credits are recognized as a reduction of the related asset. Contributions made by the Company are recognized as an increase of the related asset, and distributions are recognized as a reduction. Income and loss generated by the investment is recognized as a corresponding increase or reduction in the related asset.
Post-Retirement Benefit Plans
The Company sponsors several post-retirement benefit plans for current and former employees and certain directors. Contributions to the trustee of a multi-employer defined benefit pension plan are recorded as expense in the period of contribution. Plan obligations and related expenses for other post-retirement plans are calculated using actuarial methodologies. The measurement of such obligations and expenses requires management to make certain assumptions, in particular the discount rate, which is evaluated on an annual basis. Other factors include retirement patterns, mortality and turnover assumptions. The Company uses a December 31 measurement date for its post-retirement benefit plans. Financial Accounting Standards Board ("FASB") Accounting Standards Codification ("ASC") 715-30 “Compensation – Retirement Benefits – Defined Benefit Plans – Pension” requires the Company to recognize the overfunded or underfunded status of a defined benefit postretirement plan as an asset or liability in its statement of financial condition and to recognize changes in that funded status in the year the changes occur through comprehensive income.
Comprehensive Income
Comprehensive income includes net income and all other changes in equity during a period, except those resulting from investments by owners and distributions to owners. Other comprehensive income includes income, expenses, gains and losses that under generally accepted accounting principles are included in comprehensive income but excluded from net income. Other comprehensive income (loss) and accumulated other comprehensive income (loss) are reported net of deferred income taxes. Accumulated other comprehensive income for the Company includes unrealized holding gains or losses on available for sale securities, unaccreted unrealized losses on securities transferred to held-to-maturity, and actuarial gains or losses on the Company’s pension plans. FASB ASC 715‑30 “Compensation – Retirement Benefits – Defined Benefit Plans – Pension” requires employers to recognize the overfunded or underfunded status of a defined benefit postretirement plan as an asset or liability in its statement of financial position and to recognize changes in that funded status in the year the changes occur through comprehensive income.
Stock-Based Compensation
Variable Interest Entities
The consolidated financial statements include investments in certain variable interest entities (“VIEs”). The Company considers a voting rights entity to be a subsidiary and consolidates if the Company has a controlling financial interest in the entity. VIEs are consolidated if the Company has the power to direct the activities of the VIE that significantly impact financial performance and has the obligation to absorb losses or the right to receive benefits that could potentially be significant to the VIE (i.e., the Company is the primary beneficiary).
Investments in VIEs where the Company is not the primary beneficiary of a VIE are accounted for using the equity method of accounting. The determination of whether the Company is the primary beneficiary of a VIE is reassessed on an ongoing basis. The consolidation status may change as a result of these reassessments.
These investments are included in Equity Investments on the Company’s Consolidated Statements of Financial Condition. The maximum potential exposure to losses relative to investments in VIEs is generally limited to the sum of the outstanding balance,
92
Notes to the Consolidated Financial Statements | ||
Resell Agreements
Segment Information
Transfers of Financial Assets
Transfers of financial assets are accounted for as sales when control over the assets has been relinquished. Control over transferred assets is deemed to be surrendered when the assets have been isolated from the Company, the transferee obtains the right (free of conditions that constrain it from taking advantage of that right) to pledge or exchange the transferred assets, and the Company does not maintain effective control over the transferred assets through an agreement to repurchase them before their maturity.
Treasury Stock
Treasury stock is carried at cost. Shares issued out of treasury are valued based on the weighted average cost.
Reclassifications
Certain reclassifications have been made to prior year amounts to conform to the current year presentation. The reclassifications had no impact to net income on the Consolidated Statements of Income or the stockholders' equity on the Consolidated Statements of Changes in Stockholders’ Equity.
2. RECENT ACCOUNTING PRONOUNCEMENTS
Accounting Standards Effective in 2023 and onward
ASU No. 2016-13, Financial Instruments - Credit Losses (Topic 326) - Measurement of Credit Losses on Financial Instruments
The Company adopted ASU No. 2016-13 inclusive of subsequent amendments as of January 1, 2023. ASU No. 2016-13 amends guidance on reporting credit losses for assets held on an amortized cost basis and available-for-sale debt securities, as well as off balance sheet credit exposures. For assets held at amortized cost, ASU No. 2016-13 eliminates the probable incurred recognition threshold in current GAAP and, instead, requires an entity to reflect its current estimate of all expected credit losses. The amendments in ASU No. 2016-13 replace the incurred loss impairment methodology with a methodology that reflects the measurement of expected credit losses based on relevant information about past events, including historical loss experience, current conditions, and reasonable and supportable forecasts that affect the collectability of the reported amounts. The allowance for credit losses is a valuation account that is deducted from the amortized cost basis of financial assets to present the net amount expected to be collected. For available for sale debt securities, credit losses will be presented as an allowance rather than as a
93
Notes to the Consolidated Financial Statements | ||
write-down. For the Company, the amendments affected loans, debt securities, off-balance sheet credit exposures, and any other financial assets not excluded from the scope that have the contractual right to receive cash.
The Company adopted ASU No. 2016-13 on a modified retrospective basis with a cumulative-effect adjustment to retained earnings as of the adoption date and, accordingly, the Company recorded a $24.6 million increase to the allowance for credit losses, a $6.8 million increase to deferred tax assets, and a decrease of $17.8 million to retained earnings as of January 1, 2023. The results for prior period amounts continue to be reported in accordance with previously applicable GAAP.
The below table illustrates the impact of the adoption of ASU 2016-13.
| January 1, 2023 | |||||||||||||||||
| Gross Adjustment | Tax Impact | Net Adjustment to Retained Earnings | |||||||||||||||
| Assets: | |||||||||||||||||
| Allowance for credit losses on held-to-maturity securities | $ | $ | ( | $ | |||||||||||||
| Allowance for credit losses on loans | ( | ||||||||||||||||
| Liabilities: | |||||||||||||||||
| Allowance for credit losses on off-balance sheet credit exposures | ( | ||||||||||||||||
| Total Day 1 Adjustment for Adoption of ASU 2016-13 | $ | $ | ( | $ | |||||||||||||
ASU 2022-02, Financial Instruments - Credit Losses (Topic 326) - Troubled Debt Restructurings and Vintage Disclosures
The Company adopted ASU No. 2022-02 as of January 1, 2023, which eliminates the troubled debt restructuring ("TDR") accounting model for creditors that have adopted Topic 326, “Financial Instruments – Credit Losses.” Specifically, rather than applying the recognition and measurement guidance for TDRs, this ASU requires entities to evaluate receivable modifications, consistent with the accounting for other loan modifications, to determine whether a modification made to a borrower results is a new loan or a continuation of the existing loan. In addition, under the new ASU, entities are no longer required to use a discounted cash flow ("DCF") method to measure the ACL as a result of a modification or restructuring with a borrower experiencing financial difficulty. If a DCF method is used, the post-modification-derived effective interest rate is to be used, instead of the original interest rate as stipulated under the current GAAP. This ASU also enhances the disclosure requirements related to certain modifications of receivables made to borrowers experiencing financial difficulty. This ASU amends the guidance on “vintage disclosures” to require the disclosure of current-period gross write-offs by year of origination.
ASU 2023-07, Segment Reporting (Topic 280) - Improvements to Reportable Segment Disclosures
On November 27, 2023, the FASB issued ASU 2023-07, Segment Reporting (Topic 280): Improvements to Reportable Segment Disclosures, which is intended to improve reportable segment disclosure requirements, primarily through enhanced disclosures about significant segment expenses. In addition, the amendments enhance interim disclosure requirements, clarify circumstances in which an entity can disclose multiple segment measures of profit or loss, provide new segment disclosure requirements for entities with a single reportable segment, and contain other disclosure requirements. The purpose of the amendments is to enable investors to better understand an entity’s overall performance and assess potential future cash flows. A public entity should apply the amendments retrospectively to all prior periods presented in the financial statements. Upon transition, the segment expense categories and amounts disclosed in the prior periods should be based on the significant segment expense categories identified and disclosed in the period of adoption. This ASU is effective for fiscal years beginning after December 15, 2023, and interim periods within fiscal years beginning after December 15, 2024. Early adoption is permitted. The Company is currently evaluating the impact of this standard on our consolidated financial statements and related disclosures.
94
Notes to the Consolidated Financial Statements | ||
ASU 2023-09, Income Taxes (Topic 740) - Improvements to Income Tax Disclosures
On December 14, 2023, the FASB issued ASU 2023-09, Income Taxes (Topic 740): Improvements to Income Tax Disclosures, which is intended to enhance the transparency and decision usefulness of income tax disclosures. The amendments in ASU 2023-09 address investor requests for enhanced income tax information primarily through changes to the rate reconciliation and income taxes paid information. The update will be effective for annual periods beginning after December 15, 2024, and early adoption is permitted. The Company is currently evaluating the impact of this standard on our consolidated financial statements and related disclosures.
95
Notes to the Consolidated Financial Statements | ||
3. ACCUMULATED OTHER COMPREHENSIVE INCOME (LOSS)
The Company records unrealized gains and losses, net of taxes, on securities available for sale in accumulated other comprehensive income (loss) in the Consolidated Statements of Changes in Stockholders’ Equity. Gains and losses on securities available for sale are reclassified to operations as the gains or losses are recognized. Other-than-temporary impairment losses on debt securities are reflected in earnings as realized losses to the extent the impairment is related to credit losses. The amount of the impairment related to other factors is recognized in other comprehensive income (loss). The Company also recognizes as a component of other comprehensive income (loss) the actuarial gains or losses as well as the prior service costs or credits that arise during the period from post-retirement benefit plans.
Other comprehensive income (loss) components and related income tax effects were as follows:
| Year Ended December 31, | |||||||||||||||||
| 2023 | 2022 | 2021 | |||||||||||||||
| (In thousands) | |||||||||||||||||
Postretirement Benefit Plans | |||||||||||||||||
| Change in obligation for postretirement benefits and for prior service credit | $ | $ | $ | ||||||||||||||
Reclassification adjustment for prior service expense included in other expense for the year ended December 31, 2023, and in compensation and employee benefits for the year ended December 31, 2022 and 2021 | |||||||||||||||||
| Change in obligation for other benefits | ( | ||||||||||||||||
| Change in total obligation for postretirement benefits and for prior service credit and for other benefits | ( | ||||||||||||||||
| Income tax expense | ( | ( | |||||||||||||||
| Net change in total obligation for postretirement benefits and prior service credit and for other benefits | ( | ||||||||||||||||
Securities | |||||||||||||||||
| Unrealized holding gains (losses) on available for sale securities | ( | ( | |||||||||||||||
| Reclassification adjustment for losses (gains) realized in income | ( | ||||||||||||||||
| Accretion of net unrealized loss on securities transferred to held-to-maturity | |||||||||||||||||
| Change in unrealized gains (losses) on available for sale securities | ( | ( | |||||||||||||||
| Income tax benefit (expense) | ( | ||||||||||||||||
| Net change in unrealized gains (losses) on securities | ( | ( | |||||||||||||||
| Total | $ | $ | ( | $ | ( | ||||||||||||
96
Notes to the Consolidated Financial Statements | ||
The following is a summary of the accumulated other comprehensive income (loss) balances, net of income taxes:
| Balance as of January 1, 2023 | Current Period Change | Income Tax Effect | Balance as of December 31, 2023 | ||||||||||||||||||||
| (In thousands) | |||||||||||||||||||||||
| Unrealized gains (losses) on benefits plans | $ | ( | $ | $ | ( | $ | ( | ||||||||||||||||
| Unrealized gains (losses) on available for sale securities | ( | ( | ( | ||||||||||||||||||||
| Unaccreted unrealized loss on securities transferred to held-to-maturity | ( | ( | ( | ||||||||||||||||||||
| Total | $ | ( | $ | $ | ( | $ | ( | ||||||||||||||||
Balance as of January 1, 2022 | Current Period Change | Income Tax Effect | Balance as of December 31, 2022 | ||||||||||||||||||||
| (In thousands) | |||||||||||||||||||||||
| Unrealized gains (losses) on benefits plans | $ | ( | $ | $ | ( | $ | ( | ||||||||||||||||
| Unrealized gains (losses) on available for sale securities | ( | ( | |||||||||||||||||||||
| Unaccreted unrealized loss on securities transferred to held-to-maturity | ( | ( | |||||||||||||||||||||
| Total | $ | $ | ( | $ | $ | ( | |||||||||||||||||
97
Notes to the Consolidated Financial Statements | ||
4. INVESTMENT SECURITIES
The amortized cost and fair value of investment securities available for sale and held-to-maturity as of December 31, 2023 are as follows:
| December 31, 2023 | |||||||||||||||||||||||
| (In thousands) | Amortized Cost | Gross Unrealized Gains | Gross Unrealized Losses | Fair Value | |||||||||||||||||||
| Available for sale: | |||||||||||||||||||||||
Traditional securities: | |||||||||||||||||||||||
Government sponsored entities ("GSE") certificates and CMOs ("collateralized mortgage obligations") | $ | $ | $ | ( | $ | ||||||||||||||||||
Non-GSE certificates and CMOs | ( | ||||||||||||||||||||||
| ABS | ( | ||||||||||||||||||||||
| Corporate | ( | ||||||||||||||||||||||
| Other | ( | ||||||||||||||||||||||
| ( | |||||||||||||||||||||||
PACE assessments: | |||||||||||||||||||||||
| Residential PACE assessments | |||||||||||||||||||||||
| Total available for sale | $ | $ | $ | ( | $ | ||||||||||||||||||
| Amortized Cost | Gross Unrecognized Gains | Gross Unrecognized Losses | Fair Value | ||||||||||||||||||||
| Held-to-maturity: | |||||||||||||||||||||||
Traditional securities: | |||||||||||||||||||||||
| GSE certificates & CMOs | $ | $ | $ | ( | $ | ||||||||||||||||||
| Non-GSE certificates & CMOs | ( | ||||||||||||||||||||||
| ABS | ( | ||||||||||||||||||||||
| Municipal | ( | ||||||||||||||||||||||
| ( | |||||||||||||||||||||||
PACE assessments: | |||||||||||||||||||||||
| Commercial PACE assessments | ( | ||||||||||||||||||||||
| Residential PACE assessments | ( | ||||||||||||||||||||||
| ( | |||||||||||||||||||||||
| Allowance for credit losses | ( | ||||||||||||||||||||||
| Total held-to-maturity | $ | $ | $ | ( | $ | ||||||||||||||||||
As of December 31, 2023, available for sale securities with a fair value of $909.9 million were pledged and held-to-maturity securities with a fair value of $512.3 million were pledged. The majority of the securities were pledged to the FHLBNY to secure outstanding advances, letters of credit and to provide additional borrowing potential. In addition, securities were pledged to provide capacity to borrow from the Federal Reserve Bank, secure outstanding Bank Term Funding Program advances, and to collateralize municipal deposits.
98
Notes to the Consolidated Financial Statements | ||
The amortized cost and fair value of investment securities available for sale and held-to-maturity as of December 31, 2022 are as follows:
| December 31, 2022 | |||||||||||||||||||||||
| (In thousands) | Amortized Cost | Gross Unrealized Gains | Gross Unrealized Losses | Fair Value | |||||||||||||||||||
| Available for sale: | |||||||||||||||||||||||
Traditional securities: | |||||||||||||||||||||||
GSE certificates and CMOs | $ | $ | $ | ( | $ | ||||||||||||||||||
Non-GSE certificates and CMOs | ( | ||||||||||||||||||||||
| ABS | ( | ||||||||||||||||||||||
| Corporate | ( | ||||||||||||||||||||||
| Other | ( | ||||||||||||||||||||||
| Total available for sale | $ | $ | $ | ( | $ | ||||||||||||||||||
| Amortized Cost | Gross Unrecognized Gains | Gross Unrecognized Losses | Fair Value | ||||||||||||||||||||
| Held-to-maturity: | |||||||||||||||||||||||
Traditional securities: | |||||||||||||||||||||||
| GSE certificates & CMOs | $ | $ | $ | ( | $ | ||||||||||||||||||
| Non-GSE certificates & CMOs | ( | ||||||||||||||||||||||
| ABS | ( | ||||||||||||||||||||||
| Municipal | ( | ||||||||||||||||||||||
Other | |||||||||||||||||||||||
| ( | |||||||||||||||||||||||
PACE assessments: | |||||||||||||||||||||||
| Commercial PACE assessments | ( | ||||||||||||||||||||||
| Residential PACE assessments | ( | ||||||||||||||||||||||
| ( | |||||||||||||||||||||||
| Total held-to-maturity | $ | $ | $ | ( | $ | ||||||||||||||||||
As of December 31, 2022, available for sale securities with a fair value of $907.1 million were pledged; $126.6 million held-to-maturity securities were pledged. The majority of the securities were pledged to the FHLBNY to secure outstanding advances, letters of credit and to provide additional borrowing potential. In addition, securities were pledged to provide capacity to borrow from the Federal Reserve and to collateralize municipal deposits.
During the year ended December 31, 2023, there were no transfers of securities between available for sale and held-to-maturity. The Company reassessed the classification of certain investments during the year ended December 31, 2022 and transferred securities with a book value of $277.3 million from available for sale to held-to-maturity. The transfer occurred at fair market value totaling $260.1 million. The related unrealized losses of $17.1 million were converted to a discount that is being accreted through interest income on a level-yield method over the term of the securities, while the unrealized losses recorded in other comprehensive income are amortized out of other comprehensive income through interest income on a level-yield method over the remaining term of the securities, with no net change to interest income. No gain or loss was recorded at the time of the transfer.
99
Notes to the Consolidated Financial Statements | ||
The following table summarizes the amortized cost and fair value of debt securities available for sale and held-to-maturity, exclusive of mortgage-backed securities, by their contractual maturity as of December 31, 2023. Actual maturities may differ from contractual maturities because borrowers may have the right to call or prepay obligations with or without penalty:
| Available for Sale | Held-to-maturity | ||||||||||||||||||||||
| (In thousands) | Amortized Cost | Fair Value | Amortized Cost | Fair Value | |||||||||||||||||||
| Due within one year | $ | $ | $ | $ | |||||||||||||||||||
| Due after one year through five years | |||||||||||||||||||||||
| Due after five years through ten years | |||||||||||||||||||||||
| Due after ten years | |||||||||||||||||||||||
| $ | $ | $ | $ | ||||||||||||||||||||
Proceeds received and gains and losses realized on sales of securities are summarized below:
| Year Ended December 31, | |||||||||||||||||
| (In thousands) | 2023 | 2022 | 2021 | ||||||||||||||
| Proceeds | $ | $ | $ | ||||||||||||||
| Realized gains | |||||||||||||||||
| Realized losses | ( | ( | ( | ||||||||||||||
| Net realized gains (losses) | $ | ( | $ | ( | $ | ||||||||||||
There were no sales of held-to-maturity securities during the year ended December 31, 2023 or December 31, 2022.
The Company controls and monitors inherent credit risk in its securities portfolio through due diligence, diversification, concentration limits, periodic securities reviews, and by investing in low risk securities. This includes high quality Non-Agency Securities, low LTV PACE Bonds and a significant portion of the securities portfolio in GSE obligations. GSEs include the Federal Home Loan Mortgage Corporation (“FHLMC”), the Federal National Mortgage Association (“FNMA”), the Government National Mortgage Association (“GNMA”) and the Small Business Administration (“SBA”). GNMA is a wholly owned U.S. Government corporation whereas FHLMC and FNMA are private. Mortgage-related securities may include mortgage pass-through certificates, participation certificates and CMOs. At December 31, 2023 and December 31, 2022, there were no holdings of securities of any one issuer, other than the U.S. Government and its agencies, in an amount greater than 10% of stockholders' equity.
100
Notes to the Consolidated Financial Statements | ||
The following summarizes the fair value and unrealized losses for those available for sale and held-to-maturity securities as of December 31, 2023 and December 31, 2022, respectively, segregated between securities that have been in an unrealized loss position for less than twelve months and those that have been in a continuous unrealized loss position for twelve months or longer at the respective dates:
| December 31, 2023 | |||||||||||||||||||||||||||||||||||
Less Than Twelve Months | Twelve Months or Longer | Total | |||||||||||||||||||||||||||||||||
| (In thousands) | Fair Value | Unrealized Losses | Fair Value | Unrealized Losses | Fair Value | Unrealized Losses | |||||||||||||||||||||||||||||
| Available for sale: | |||||||||||||||||||||||||||||||||||
| Traditional securities: | |||||||||||||||||||||||||||||||||||
| GSE certificates & CMOs | $ | $ | $ | $ | $ | $ | |||||||||||||||||||||||||||||
| Non-GSE certificates & CMOs | |||||||||||||||||||||||||||||||||||
| ABS | |||||||||||||||||||||||||||||||||||
| Corporate | |||||||||||||||||||||||||||||||||||
| Other | |||||||||||||||||||||||||||||||||||
| Total available for sale | $ | $ | $ | $ | $ | $ | |||||||||||||||||||||||||||||
Less Than Twelve Months | Twelve Months or Longer | Total | |||||||||||||||||||||||||||||||||
| Fair Value | Unrecognized Losses | Fair Value | Unrecognized Losses | Fair Value | Unrecognized Losses | ||||||||||||||||||||||||||||||
| Held-to-maturity: | |||||||||||||||||||||||||||||||||||
Traditional securities: | |||||||||||||||||||||||||||||||||||
| GSE certificates & CMOs | $ | $ | $ | $ | $ | $ | |||||||||||||||||||||||||||||
| Non-GSE certificates & CMOs | |||||||||||||||||||||||||||||||||||
| ABS | |||||||||||||||||||||||||||||||||||
| Municipal | |||||||||||||||||||||||||||||||||||
PACE assessments: | |||||||||||||||||||||||||||||||||||
| Commercial PACE assessments | |||||||||||||||||||||||||||||||||||
| Residential PACE assessments | |||||||||||||||||||||||||||||||||||
| Total held-to-maturity | $ | $ | $ | $ | $ | $ | |||||||||||||||||||||||||||||
101
Notes to the Consolidated Financial Statements | ||
| December 31, 2022 | |||||||||||||||||||||||||||||||||||
| Less Than Twelve Months | Twelve Months or Longer | Total | |||||||||||||||||||||||||||||||||
| (In thousands) | Fair Value | Unrealized Losses | Fair Value | Unrealized Losses | Fair Value | Unrealized Losses | |||||||||||||||||||||||||||||
| Available for sale: | |||||||||||||||||||||||||||||||||||
| Traditional securities: | |||||||||||||||||||||||||||||||||||
| GSE certificates & CMOs | $ | $ | $ | $ | $ | $ | |||||||||||||||||||||||||||||
| Non-GSE certificates & CMOs | |||||||||||||||||||||||||||||||||||
| ABS | |||||||||||||||||||||||||||||||||||
| Corporate | |||||||||||||||||||||||||||||||||||
| Other | |||||||||||||||||||||||||||||||||||
| Total available for sale | $ | $ | $ | $ | $ | $ | |||||||||||||||||||||||||||||
| Less Than Twelve Months | Twelve Months or Longer | Total | |||||||||||||||||||||||||||||||||
| Fair Value | Unrecognized Losses | Fair Value | Unrecognized Losses | Fair Value | Unrecognized Losses | ||||||||||||||||||||||||||||||
| Held-to-maturity: | |||||||||||||||||||||||||||||||||||
Traditional securities: | |||||||||||||||||||||||||||||||||||
| GSE certificates & CMOs | $ | $ | $ | $ | $ | $ | |||||||||||||||||||||||||||||
| Non-GSE certificates & CMOs | |||||||||||||||||||||||||||||||||||
| ABS | |||||||||||||||||||||||||||||||||||
| Municipal | |||||||||||||||||||||||||||||||||||
PACE assessments: | |||||||||||||||||||||||||||||||||||
| Commercial PACE assessments | |||||||||||||||||||||||||||||||||||
| Residential PACE assessments | |||||||||||||||||||||||||||||||||||
| Total held-to-maturity | $ | $ | $ | $ | $ | $ | |||||||||||||||||||||||||||||
Available for sale securities
As discussed in Note 1, upon adoption of the Current Expected Credit Losses ("CECL") standard, no allowance for credit losses was recorded on available for sale securities. During the year ended December 31, 2023, the Company charged-off an unrealized loss position of $1.2 million related to a corporate bond related to Silicon Valley Bank following credit concerns over the issuer, and the sale of the security resulted in an immaterial additional loss.
As of December 31, 2023, none of the Company’s available for sale debt securities were in an unrealized loss position due to credit and therefore no allowance for credit losses on available for sale debt securities was required. The temporary impairment of fixed income securities is primarily attributable to changes in overall market interest rates and/or changes in credit/liquidity spreads since the investments were acquired. In general, as market interest rates rise and/or credit/liquidity spreads widen, the fair value of fixed rate securities will decrease, as market interest rates fall and/or credit spreads tighten, the fair value of fixed rate securities will increase.
With respect to the Company’s security investments that are temporarily impaired as of December 31, 2023, management does not intend to sell these investments and does not believe it will be necessary to do so before anticipated recovery. If either criteria regarding intent or requirement to sell is met, the security's amortized cost basis is written down to fair value through income. The Company expects to collect all amounts due according to the contractual terms of these investments. Therefore, the Company
102
Notes to the Consolidated Financial Statements | ||
does not hold an allowance for credit losses for available for sale securities at December 31, 2023.
Held-to-maturity securities
Management conducts an evaluation of expected credit losses on held-to-maturity securities on a collective basis by security type. Management monitors the credit quality of debt securities held-to-maturity through reasonable and supportable forecasts, reviews of credit trends on underlying assets, credit ratings, and other factors. Holdings of securities issued by GSEs with unrealized losses are either explicitly or implicitly guaranteed by the U.S. government, and are highly rated by major rating agencies and have a long history of no credit losses.
With the exception of PACE assessments, which are generally not rated, our traditional securities were rated investment grade by at least one nationally recognized statistical rating organization with no ratings below investment grade. All issues were current as to their interest payments. We have had insignificant losses on PACE assessments that we have invested in and are not aware of any significant losses in the PACE bonds sector given the low loan-to-value position and the superior lien position on the property. Management considers that the temporary impairment of these investments as of December 31, 2023 is primarily due to an increase in interest rates and spreads since the time these investments were acquired.
totaling $35.1 million and $23.2 million at December 31, 2023 and December 31, 2022, respectively, was included in other assets in the consolidated balance sheet and excluded from the amortized cost and estimated fair value totals in the table above.
The following table presents the activity in the allowance for credit losses for securities held-to-maturity for the year ended December 31, 2023:
| (In thousands) | Non-GSE commercial certificates | Commercial PACE | Residential PACE | Total | |||||||||||||||||||
| Allowance for credit losses: | |||||||||||||||||||||||
| Beginning balance | $ | $ | $ | $ | |||||||||||||||||||
| Adoption of ASU No. 2016-13 | |||||||||||||||||||||||
| Provision for (recovery of) credit losses | ( | ||||||||||||||||||||||
| Charge-offs | ( | ( | |||||||||||||||||||||
| Recoveries | |||||||||||||||||||||||
| Ending Balance | $ | $ | $ | $ | |||||||||||||||||||
Federal Home Loan Bank Stock
The Company owned 43,892 shares and 296,068 shares at a cost of $100 0.8 million, $0.5 million, $0.2 million during the years ended December 31, 2023, 2022 and 2021, respectively.
103
Notes to the Consolidated Financial Statements | ||
5. LOANS RECEIVABLE, NET
With the adoption of ASU 2016-13 on January 1, 2023, all loan balances in this footnote for the period ended December 31, 2023 are presented at amortized cost, net of deferred loan origination costs. Loan balances for the period ended December 31, 2022 are presented at unpaid principal balance.
Loans receivable are summarized as follows:
| December 31, 2023 | December 31, 2022 | ||||||||||
| (In thousands) | |||||||||||
| Commercial and industrial | $ | $ | |||||||||
| Multifamily | |||||||||||
| Commercial real estate | |||||||||||
| Construction and land development | |||||||||||
| Total commercial portfolio | |||||||||||
| Residential real estate lending | |||||||||||
| Consumer solar | |||||||||||
| Consumer and other | |||||||||||
| Total retail portfolio | |||||||||||
| Total loans receivable | |||||||||||
| Net deferred loan origination costs | |||||||||||
Total loans receivable, net of deferred loan origination costs | |||||||||||
| Allowance for credit losses | ( | ( | |||||||||
| Total loans receivable, net | $ | $ | |||||||||
The following table presents information regarding the past due status of the Company’s loans as of December 31, 2023:
| 30-89 Days Past Due | Non- Accrual | 90 Days or More Delinquent and Still Accruing Interest | Total Past Due | Current | Total Loans Receivable | ||||||||||||||||||||||||||||||
| (In thousands) | |||||||||||||||||||||||||||||||||||
| Commercial and industrial | $ | $ | $ | $ | $ | $ | |||||||||||||||||||||||||||||
| Multifamily | |||||||||||||||||||||||||||||||||||
| Commercial real estate | |||||||||||||||||||||||||||||||||||
| Construction and land development | |||||||||||||||||||||||||||||||||||
| Total commercial portfolio | |||||||||||||||||||||||||||||||||||
| Residential real estate lending | |||||||||||||||||||||||||||||||||||
| Consumer solar | |||||||||||||||||||||||||||||||||||
| Consumer and other | |||||||||||||||||||||||||||||||||||
| Total retail portfolio | |||||||||||||||||||||||||||||||||||
| $ | $ | $ | $ | $ | $ | ||||||||||||||||||||||||||||||
Within the table above is a $12.0 million multifamily loan that was in the process of being refinanced at December 31, 2023, and has been included as 30-89 days past due as it was past the maturity date. This loan was subsequently refinanced and is performing in accordance with the updated terms.
104
Notes to the Consolidated Financial Statements | ||
The following table presents information regarding the past due status of the Company’s loans as of December 31, 2022:
| 30-89 Days Past Due | Non- Accrual | 90 Days or More Delinquent and Still Accruing Interest | Total Past Due | Current | Total Loans Receivable | ||||||||||||||||||||||||||||||
| (In thousands) | |||||||||||||||||||||||||||||||||||
| Commercial and industrial | $ | $ | $ | $ | $ | $ | |||||||||||||||||||||||||||||
| Multifamily | |||||||||||||||||||||||||||||||||||
| Commercial real estate | |||||||||||||||||||||||||||||||||||
| Construction and land development | |||||||||||||||||||||||||||||||||||
| Total commercial portfolio | |||||||||||||||||||||||||||||||||||
| Residential real estate lending | |||||||||||||||||||||||||||||||||||
| Consumer solar | |||||||||||||||||||||||||||||||||||
| Consumer and other | |||||||||||||||||||||||||||||||||||
| Total retail portfolio | |||||||||||||||||||||||||||||||||||
| $ | $ | $ | $ | $ | $ | ||||||||||||||||||||||||||||||
Within the table above are $10.3 million of commercial real estate loans that were in the process of being refinanced at December 31, 2022, and have been included as 30-89 days past due as they are past their maturity date.
The following table presents information regarding loan modifications granted to borrowers experiencing financial difficulty during the year ended December 31, 2023:
| Year Ended December 31, 2023 | ||||||||||||||||||||||||||
| (Iin thousands) | Term Extension | Term Extension and Payment Delay | Total | % of Portfolio | ||||||||||||||||||||||
| Commercial and industrial | $ | $ | $ | % | ||||||||||||||||||||||
| Multifamily | % | |||||||||||||||||||||||||
| Commercial real estate | % | |||||||||||||||||||||||||
| Construction and land development | % | |||||||||||||||||||||||||
| Total | $ | $ | $ | |||||||||||||||||||||||
The following table describes the financial effect of the modifications made to borrowers experiencing financial difficulty:
| Year Ended December 31, 2023 | ||||||||||||||
Weighted Average Years of Term Extension | Weighted Average Years of Term Extension and Payment Delay | |||||||||||||
| Commercial and industrial | ||||||||||||||
| Multifamily | — | |||||||||||||
| Commercial real estate | — | |||||||||||||
| Construction and land development | — | |||||||||||||
105
Notes to the Consolidated Financial Statements | ||
In order to manage credit quality, we view the Company’s loan portfolio by various segments. For commercial loans, we assign individual credit ratings ranging from 1 (lowest risk) to 10 (highest risk) as an indicator of credit quality. These ratings are based on specific risk factors including (i) historical and projected financial results of the borrower, (ii) market conditions of the borrower’s industry that may affect the borrower’s future financial performance, (iii) business experience of the borrower’s management, (iv) nature of the underlying collateral, if any, including the ability of the collateral to generate sources of repayment, and (v) history of the borrower’s payment performance. These specific risk factors are then utilized as inputs in our credit model to determine the associated allowance for credit loss. Non-rated loans generally include residential mortgages and consumer loans.
The below classifications follow regulatory guidelines and can be generally described as follows:
•pass loans are of satisfactory quality;
•special mention loans have a potential weakness or risk that may result in the deterioration of future repayment;
•substandard loans are inadequately protected by the current net worth and paying capacity of the borrower or of the collateral pledged (these loans have a well-defined weakness, and there is a distinct possibility that the Company will sustain some loss); and
•doubtful loans, based on existing circumstances, have weaknesses that make collection or liquidation in full highly questionable and improbable.
In addition, residential loans are classified utilizing an inter-agency methodology that incorporates the extent of delinquency. Assigned risk rating grades are continuously updated as new information is obtained.
The following table provides information regarding the methods used to evaluate the Company’s loans for impairment by portfolio, and the Company’s allowance by portfolio based upon the method of evaluating loan impairment as of December 31, 2023:
Term Loans by Origination Year | ||||||||||||||||||||||||||
| (In thousands) | 2023 | 2022 | 2021 | 2020 | 2019 & Prior | Revolving loans | Revolving Loans Converted to Term | Total | ||||||||||||||||||
| Commercial and Industrial: | ||||||||||||||||||||||||||
| Pass | $ | $ | $ | $ | $ | $ | $ | $ | ||||||||||||||||||
| Special Mention | ||||||||||||||||||||||||||
| Substandard | ||||||||||||||||||||||||||
| Doubtful | ||||||||||||||||||||||||||
| Total commercial and industrial | $ | $ | $ | $ | $ | $ | $ | $ | ||||||||||||||||||
| Current period gross charge-offs | $ | $ | $ | $ | $ | $ | $ | $ | ||||||||||||||||||
| Multifamily: | ||||||||||||||||||||||||||
| Pass | $ | $ | $ | $ | $ | $ | $ | $ | ||||||||||||||||||
| Special Mention | ||||||||||||||||||||||||||
| Substandard | ||||||||||||||||||||||||||
| Doubtful | ||||||||||||||||||||||||||
| Total multifamily | $ | $ | $ | $ | $ | $ | $ | $ | ||||||||||||||||||
| Current period gross charge-offs | $ | $ | $ | $ | $ | $ | $ | $ | ||||||||||||||||||
| Commercial real estate: | ||||||||||||||||||||||||||
| Pass | $ | $ | $ | $ | $ | $ | $ | $ | ||||||||||||||||||
| Special Mention | ||||||||||||||||||||||||||
| Substandard | ||||||||||||||||||||||||||
| Doubtful | ||||||||||||||||||||||||||
| Total commercial real estate | $ | $ | $ | $ | $ | $ | $ | $ | ||||||||||||||||||
| Current period gross charge-offs | $ | $ | $ | $ | $ | $ | $ | $ | ||||||||||||||||||
106
Notes to the Consolidated Financial Statements | ||
| Construction and land development: | ||||||||||||||||||||||||||
| Pass | $ | $ | $ | $ | $ | $ | $ | $ | ||||||||||||||||||
| Special Mention | ||||||||||||||||||||||||||
| Substandard | ||||||||||||||||||||||||||
| Doubtful | ||||||||||||||||||||||||||
| Total construction and land development | $ | $ | $ | $ | $ | $ | $ | $ | ||||||||||||||||||
| Current period gross charge-offs | $ | $ | $ | $ | $ | $ | $ | $ | ||||||||||||||||||
| Residential real estate lending: | ||||||||||||||||||||||||||
| Pass | $ | $ | $ | $ | $ | $ | $ | $ | ||||||||||||||||||
| Special Mention | ||||||||||||||||||||||||||
| Substandard | ||||||||||||||||||||||||||
| Doubtful | ||||||||||||||||||||||||||
| Total residential real estate lending | $ | $ | $ | $ | $ | $ | $ | $ | ||||||||||||||||||
| Current period gross charge-offs | $ | $ | $ | $ | $ | $ | $ | $ | ||||||||||||||||||
| Consumer solar: | ||||||||||||||||||||||||||
| Pass | $ | $ | $ | $ | $ | $ | $ | $ | ||||||||||||||||||
| Special Mention | ||||||||||||||||||||||||||
| Substandard | ||||||||||||||||||||||||||
| Doubtful | ||||||||||||||||||||||||||
| Total consumer solar | $ | $ | $ | $ | $ | $ | $ | $ | ||||||||||||||||||
| Current period gross charge-offs | $ | $ | $ | $ | $ | $ | $ | $ | ||||||||||||||||||
| Consumer and other: | ||||||||||||||||||||||||||
| Pass | $ | $ | $ | $ | $ | $ | $ | $ | ||||||||||||||||||
| Special Mention | ||||||||||||||||||||||||||
| Substandard | ||||||||||||||||||||||||||
| Doubtful | ||||||||||||||||||||||||||
| Total consumer and other | $ | $ | $ | $ | $ | $ | $ | $ | ||||||||||||||||||
| Current period gross charge-offs | $ | $ | $ | $ | $ | $ | $ | $ | ||||||||||||||||||
| Total Loans: | ||||||||||||||||||||||||||
| Pass | $ | $ | $ | $ | $ | $ | $ | $ | ||||||||||||||||||
| Special Mention | ||||||||||||||||||||||||||
| Substandard | ||||||||||||||||||||||||||
| Doubtful | ||||||||||||||||||||||||||
| Total loans | $ | $ | $ | $ | $ | $ | $ | $ | ||||||||||||||||||
| Current period gross charge-offs | $ | $ | $ | $ | $ | $ | $ | $ | ||||||||||||||||||
The following tables summarize the Company’s loan portfolio by credit quality indicator as of December 31, 2022:
| (In thousands) | Pass | Special Mention | Substandard | Doubtful | Total | ||||||||||||||||||||||||
| Commercial and industrial | $ | $ | $ | $ | $ | ||||||||||||||||||||||||
| Multifamily | |||||||||||||||||||||||||||||
| Commercial real estate | |||||||||||||||||||||||||||||
| Construction and land development | |||||||||||||||||||||||||||||
| Residential real estate lending | |||||||||||||||||||||||||||||
| Consumer solar | |||||||||||||||||||||||||||||
| Consumer and other | |||||||||||||||||||||||||||||
| Total loans | $ | $ | $ | $ | $ | ||||||||||||||||||||||||
107
Notes to the Consolidated Financial Statements | ||
The activities in the allowance by portfolio for the year ended December 31, 2023 are as follows:
| (In thousands) | Commercial and Industrial | Multifamily | Commercial Real Estate | Construction and Land Development | Residential Real Estate Lending | Consumer Solar | Consumer and Other | Total | |||||||||||||||||||||||||||||||||||||||
| Allowance for credit losses: | |||||||||||||||||||||||||||||||||||||||||||||||
| Beginning balance - ALLL | $ | $ | $ | $ | $ | $ | $ | $ | |||||||||||||||||||||||||||||||||||||||
| Adoption of ASU No. 2016-13 | ( | ( | ( | ||||||||||||||||||||||||||||||||||||||||||||
| Beginning balance - ACL | |||||||||||||||||||||||||||||||||||||||||||||||
| Provision for (recovery of) credit losses | ( | ( | ( | ( | |||||||||||||||||||||||||||||||||||||||||||
| Charge-offs | ( | ( | ( | ( | ( | ( | ( | ||||||||||||||||||||||||||||||||||||||||
| Recoveries | |||||||||||||||||||||||||||||||||||||||||||||||
| Ending balance - ACL | $ | $ | $ | $ | $ | $ | $ | $ | |||||||||||||||||||||||||||||||||||||||
The activities in the allowance by portfolio for the year ended December 31, 2022 are as follows:
| (In thousands) | Commercial and Industrial | Multifamily | Commercial Real Estate | Construction and Land Development | Residential Real Estate Lending | Consumer Solar | Consumer and Other | Total | |||||||||||||||||||||||||||||||||||||||
| Allowance for loan losses: | |||||||||||||||||||||||||||||||||||||||||||||||
| Beginning balance | $ | $ | $ | $ | $ | $ | $ | $ | |||||||||||||||||||||||||||||||||||||||
| Provision for (recovery of) loan losses | ( | ||||||||||||||||||||||||||||||||||||||||||||||
| Charge-offs | ( | ( | ( | ( | ( | ( | |||||||||||||||||||||||||||||||||||||||||
| Recoveries | |||||||||||||||||||||||||||||||||||||||||||||||
| Ending balance | $ | $ | $ | $ | $ | $ | $ | $ | |||||||||||||||||||||||||||||||||||||||
The activities in the allowance by portfolio for the year ended December 31, 2021 are as follows:
| (In thousands) | Commercial and Industrial | Multifamily | Commercial Real Estate | Construction and Land Development | Residential Real Estate Lending | Consumer Solar | Consumer and Other | Total | |||||||||||||||||||||||||||||||||||||||
| Allowance for loan losses: | |||||||||||||||||||||||||||||||||||||||||||||||
| Beginning balance | $ | $ | $ | $ | $ | $ | $ | $ | |||||||||||||||||||||||||||||||||||||||
| Provision for (recovery of) loan losses | ( | ( | ( | ( | |||||||||||||||||||||||||||||||||||||||||||
| Charge-offs | ( | ( | ( | ( | ( | ( | ( | ||||||||||||||||||||||||||||||||||||||||
| Recoveries | |||||||||||||||||||||||||||||||||||||||||||||||
| Ending balance | $ | $ | $ | $ | $ | $ | $ | $ | |||||||||||||||||||||||||||||||||||||||
108
Notes to the Consolidated Financial Statements | ||
The amortized cost basis of loans on nonaccrual status and the specific allowance as of December 31, 2023 are as follows:
Nonaccrual with No Allowance | Nonaccrual with Allowance | Reserve | ||||||||||||||||||
| (In thousands) | ||||||||||||||||||||
| Commercial and industrial | $ | $ | $ | |||||||||||||||||
| Commercial real estate | ||||||||||||||||||||
| Construction and land development | ||||||||||||||||||||
| Total commercial portfolio | $ | $ | $ | |||||||||||||||||
| Residential real estate lending | ||||||||||||||||||||
| Consumer solar | ||||||||||||||||||||
| Consumer and other | ||||||||||||||||||||
| Total retail portfolio | ||||||||||||||||||||
| $ | $ | $ | ||||||||||||||||||
The below table summarizes collateral dependent loans which were individually evaluated to determine expected credit losses as of December 31, 2023:
| Real Estate Collateral Dependent | Associated Allowance for Credit Losses | |||||||||||||
| (In thousands) | ||||||||||||||
| Commercial real estate | $ | $ | ||||||||||||
| Construction and land development | ||||||||||||||
| $ | $ | |||||||||||||
As of December 31, 2023 and December 31, 2022, mortgage loans with an unpaid principal balance of $2.35 billion and $0.82 billion, respectively, were pledged to the FHLBNY to secure outstanding advances, letters of credit and to provide additional borrowing potential.
There were $1.7 million in related party loans outstanding as of December 31, 2023 compared to $1.6 million related party loans as of December 31, 2022.
The Company has certain non-performing loans included in the balance of Loans held for sale on the Consolidated Statements of Financial Condition. There were $1.0 million and $6.9 million such loans as of December 31, 2023 and December 31, 2022, respectively.
Impaired Loans (prior to the adoption of ASU 2016-13)
The following table provides information regarding the methods used to evaluate the Company’s loans for impairment by portfolio, and the Company’s allowance by portfolio based upon the method of evaluating loan impairment as of December 31, 2022:
109
Notes to the Consolidated Financial Statements | ||
| (In thousands) | Commercial and Industrial | Multifamily | Commercial Real Estate | Construction and Land Development | Residential Real Estate Lending | Consumer Solar | Consumer and Other | Total | |||||||||||||||||||||||||||||||||||||||
| Loans: | |||||||||||||||||||||||||||||||||||||||||||||||
| Individually evaluated for impairment | $ | $ | $ | $ | $ | $ | $ | $ | |||||||||||||||||||||||||||||||||||||||
| Collectively evaluated for impairment | $ | $ | $ | $ | $ | $ | $ | $ | |||||||||||||||||||||||||||||||||||||||
| Total loans | $ | $ | $ | $ | $ | $ | $ | $ | |||||||||||||||||||||||||||||||||||||||
| Allowance for credit losses: | |||||||||||||||||||||||||||||||||||||||||||||||
| Individually evaluated for impairment | $ | $ | $ | $ | $ | $ | $ | $ | |||||||||||||||||||||||||||||||||||||||
| Collectively evaluated for impairment | $ | $ | $ | $ | $ | $ | $ | $ | |||||||||||||||||||||||||||||||||||||||
| Total allowance for credit losses | $ | $ | $ | $ | $ | $ | $ | $ | |||||||||||||||||||||||||||||||||||||||
The following is additional information regarding the Company's impaired loans and the allowance related to such loans prior to the adoption of ASU 2016-13, as of and for the year ended December 31, 2022.
| December 31, 2022 | |||||||||||||||||||||||
| (In thousands) | Recorded Investment | Average Recorded Investment | Unpaid Principal Balance | Related Allowance | |||||||||||||||||||
| Loans without a related allowance: | |||||||||||||||||||||||
| Residential real estate lending | $ | $ | $ | $ | — | ||||||||||||||||||
| Multifamily | — | ||||||||||||||||||||||
| Construction and land development | — | ||||||||||||||||||||||
| Commercial real estate | — | ||||||||||||||||||||||
| Commercial and industrial | — | ||||||||||||||||||||||
| — | |||||||||||||||||||||||
| Loans with a related allowance: | |||||||||||||||||||||||
| Residential real estate lending | |||||||||||||||||||||||
| Multifamily | |||||||||||||||||||||||
| Commercial and industrial | |||||||||||||||||||||||
| Total individually impaired loans: | |||||||||||||||||||||||
| Residential real estate lending | |||||||||||||||||||||||
| Multifamily | |||||||||||||||||||||||
| Construction and land development | |||||||||||||||||||||||
| Commercial real estate | |||||||||||||||||||||||
| Commercial and industrial | |||||||||||||||||||||||
| $ | $ | $ | $ | ||||||||||||||||||||
110
Notes to the Consolidated Financial Statements | ||
6. PREMISES AND EQUIPMENT
Premises and equipment are summarized as follows:
| December 31, | |||||||||||
| 2023 | 2022 | ||||||||||
| (In thousands) | |||||||||||
| Buildings, premises and improvements | $ | $ | |||||||||
| Furniture, fixtures and equipment | |||||||||||
| Projects in process | |||||||||||
| Accumulated depreciation and amortization | ( | ( | |||||||||
| $ | $ | ||||||||||
Depreciation and amortization expense charged to operations amounted to $3.5 million, $3.5 million, and $3.6 million for the years ended December 31, 2023, 2022 and 2021, respectively.
111
Notes to the Consolidated Financial Statements | ||
7. DEPOSITS
Deposits are summarized as follows:
| December 31, 2023 | December 31, 2022 | ||||||||||||||||||||||
| Amount | Weighted Average Rate | Amount | Weighted Average Rate | ||||||||||||||||||||
| (In thousands) | |||||||||||||||||||||||
| Non-interest-bearing demand deposit accounts | $ | 0.00 | % | $ | 0.00 | % | |||||||||||||||||
| NOW accounts | % | % | |||||||||||||||||||||
| Money market deposit accounts | % | % | |||||||||||||||||||||
| Savings accounts | % | % | |||||||||||||||||||||
| Time deposits | % | % | |||||||||||||||||||||
| Brokered CDs | % | % | |||||||||||||||||||||
| Total deposits | $ | % | $ | % | |||||||||||||||||||
The scheduled maturities of time deposits and brokered CDs as of December 31, 2023 are as follows:
| (In thousands) | Balance | |||||||
| 2024 | $ | |||||||
| 2025 | ||||||||
| 2026 | ||||||||
| 2027 | ||||||||
| 2028 | ||||||||
| Thereafter | ||||||||
Total | $ | |||||||
Time deposits greater than $250,000 totaled $42.2 million as of December 31, 2023 and $110.4 million as of December 31, 2022.
From time to time the Company will issue time deposits through the Certificate of Deposit Account Registry Service (“CDARS”) for the purpose of providing FDIC insurance to bank customers with balances in excess of FDIC insurance limits. CDARS deposits totaled approximately $63.1 28.3
Our total deposits included deposits from Workers United and its related entities, a related party, in the amounts of $56.4 million as of December 31, 2023 and $52.2 million as of December 31, 2022.
Included in total deposits are state and municipal deposits totaling $51.9 million and $88.3 million as of December 31, 2023 and December 31, 2022, respectively. Such deposits are secured by letters of credit issued by the FHLBNY or by securities pledged with the FHLBNY.
112
Notes to the Consolidated Financial Statements | ||
8. BORROWED FUNDS
FHLBNY advances are collateralized by the FHLBNY stock owned by the Bank plus a pledge of other eligible assets comprised of securities and mortgage loans. Assets are pledged as collateral for borrowing capacity. As of December 31, 2023, the value of the other eligible assets had an estimated market value net of haircut totaling $2.03 billion (comprised of securities of $392.9 million and mortgage loans of $1.64 billion). The fair value of assets pledged to the FHLBNY is required to be not less than 110% of the outstanding advances. There were $4.4 million in outstanding FHLBNY advances as of December 31, 2023 and $580.0 million in outstanding FHLBNY advances as of December 31, 2022. For the years ended December 31, 2023, 2022, and 2021, interest expense on FHLBNY advances was $5.4 million and $4.7 million, and zero , respectively.
In addition to FHLBNY advances, the Company uses other borrowings for short-term borrowing needs. Federal funds lines of credit are extended to the Company by non-affiliated banks with which a correspondent banking relationship exists. At December 31, 2023, and December 31, 2022 there was no outstanding balance related to federal funds purchased. In addition, following the recent bank failures, the Federal Reserve created a new Bank Term Funding Program ("BTFP") as an additional source of liquidity against high-quality securities, offering loans of up to one year to eligible institutions pledging qualifying assets as collateral. At December 31, 2023, there was an outstanding balance of $230.0 million related to the BTFP due in 2024 with a weighted average rate of 4.50 %, and no outstanding balance at December 31, 2022. For the years ended December 31, 2023, 2022, and 2021, interest expense on BTFP balances was $7.6 million, zero , and zero , respectively.
113
Notes to the Consolidated Financial Statements | ||
9. SUBORDINATED DEBT
On November 8, 2021, the Company completed a public offering of $85.0 million of aggregated principal amount of 3.250 % Fixed-to-Floating Rate subordinated notes due 2031 (the "Notes"). The fixed rate period is defined from and including November 8, 2021 to, but excluding, November 15, 2026, or the date of earlier redemption. The floating rate period is defined from and including November 15, 2026 to, but excluding, November 15, 2031, or the date of earlier redemption. The floating rate per annum is equal to three-month term SOFR (the "benchmark rate") plus a spread of 230 basis points for each quarterly interest period during the floating rate period, provided however, that if the benchmark rate is less than zero, the benchmark rate shall be deemed to be zero. The subordinated notes will mature on November 15, 2031.
The Company may, at its option, beginning with the interest payment date of November 15, 2026, and on any interest payment date thereafter, redeem the Notes, in whole or in part, from time to time, subject to obtaining prior approval of the Board of Governors of the Federal Reserve System (the "Federal Reserve Board") to the extent such approval is then required under the capital adequacy rules of the Federal Reserve Board, at a redemption price equal to 100 % of the principal amount of the Notes being redeemed, plus accrued and unpaid interest to, but excluding, the date of redemption.
Interest expense on subordinated debt for the years ended December 31, 2023, 2022, and 2021 was $2.7 million, $2.7 million, and $0.4 million, respectively.
During the year ended December 31, 2023 and 2022, the Company repurchased subordinated notes with a par value of $7.5 million and $6.3 million, for cash paid of $6.0 million and $5.6 million, respectively. There were no repurchases of subordinated notes during the year ended December 31, 2021.
Gains on repurchases of subordinated debt for the year ended December 31, 2023 and 2022, were $1.4 million and $0.6 million, respectively, and are recorded in Non-interest income - other on the consolidated statements of income.
114
Notes to the Consolidated Financial Statements | ||
10. REGULATORY CAPITAL
The Company and the Bank are subject to various regulatory capital requirements administered by the federal banking agencies. Failure to meet minimum capital requirements can result in certain mandatory and possibly additional discretionary actions by regulators that, if undertaken, could have a direct material effect on the Company’s consolidated financial statements. Under capital adequacy guidelines and, additionally for the Bank, the regulatory framework for prompt corrective action, the Company and the Bank must meet specific capital requirements that involve quantitative measures of the Company and the Bank’s assets, liabilities, and certain off-balance sheet items calculated under regulatory accounting practices. The Company and the Bank’s capital amounts and classifications also are subject to qualitative judgments by the regulators about components, risk weightings, and other factors.
Quantitative measures established by regulation to ensure capital adequacy require the Company and the Bank to maintain minimum amounts and ratios (set forth in the following table) of total, tier 1, and common equity tier 1 capital (as defined in the regulations) to risk weighted assets, and of tier 1 capital (as defined in the regulations) to average assets. Management believes as of December 31, 2023 and 2022, the Company and the Bank met all capital adequacy requirements.
As of December 31, 2023, the most recent notification from the Federal Deposit Insurance Corporation categorized the Bank as “well capitalized” under the regulatory framework for prompt corrective action. To be categorized as “well capitalized,” the Bank must maintain minimum total risk-based, tier 1 risk-based, common equity tier 1 risk-based, tier 1 leverage ratios as set forth in the table below. Since that notification, there are no conditions or events that management believes have changed the institution’s category.
The Company’s actual capital amounts and ratios are presented in the following table:
| Actual | For Capital Adequacy Purposes (1) | To Be Considered Well Capitalized | |||||||||||||||||||||||||||||||||
| (In thousands) | Amount | Ratio | Amount | Ratio | Amount | Ratio | |||||||||||||||||||||||||||||
| December 31, 2023 | |||||||||||||||||||||||||||||||||||
| Total capital to risk weighted assets | $ | % | $ | % | N/A | N/A | |||||||||||||||||||||||||||||
| Tier 1 capital to risk weighted assets | % | % | N/A | N/A | |||||||||||||||||||||||||||||||
| Tier 1 capital to average assets | % | % | N/A | N/A | |||||||||||||||||||||||||||||||
| Common equity tier 1 to risk weighted assets | % | % | N/A | N/A | |||||||||||||||||||||||||||||||
| December 31, 2022 | |||||||||||||||||||||||||||||||||||
| Total capital to risk weighted assets | $ | % | $ | % | N/A | N/A | |||||||||||||||||||||||||||||
| Tier 1 capital to risk weighted assets | % | % | N/A | N/A | |||||||||||||||||||||||||||||||
| Tier 1 capital to average assets | % | % | N/A | N/A | |||||||||||||||||||||||||||||||
| Common equity tier 1 to risk weighted assets | % | % | N/A | N/A | |||||||||||||||||||||||||||||||
(1)Amounts are shown exclusive of the applicable capital conservation buffer of 2.50%.
115
Notes to the Consolidated Financial Statements | ||
The Bank’s actual capital amounts and ratios are presented in the following table:
| Actual | For Capital Adequacy Purposes (1) | To Be Considered Well Capitalized | |||||||||||||||||||||||||||||||||
| (In thousands) | Amount | Ratio | Amount | Ratio | Amount | Ratio | |||||||||||||||||||||||||||||
| December 31, 2023 | |||||||||||||||||||||||||||||||||||
| Total capital to risk weighted assets | $ | % | $ | % | $ | % | |||||||||||||||||||||||||||||
| Tier 1 capital to risk weighted assets | % | % | % | ||||||||||||||||||||||||||||||||
| Tier 1 capital to average assets | % | % | % | ||||||||||||||||||||||||||||||||
| Common equity tier 1 to risk weighted assets | % | % | % | ||||||||||||||||||||||||||||||||
| December 31, 2022 | |||||||||||||||||||||||||||||||||||
| Total capital to risk weighted assets | $ | % | $ | % | $ | % | |||||||||||||||||||||||||||||
| Tier 1 capital to risk weighted assets | % | % | % | ||||||||||||||||||||||||||||||||
| Tier 1 capital to average assets | % | % | % | ||||||||||||||||||||||||||||||||
| Common equity tier 1 to risk weighted assets | % | % | % | ||||||||||||||||||||||||||||||||
(1)Amounts are shown exclusive of the applicable capital conservation buffer of 2.50%.
116
Notes to the Consolidated Financial Statements | ||
11. INCOME TAXES
The components of the provision for income taxes for the years ended December 31, 2023, 2022, and 2021 are as follows:
| Year Ended December 31, | |||||||||||||||||
| (In thousands) | 2023 | 2022 | 2021 | ||||||||||||||
| Current: | |||||||||||||||||
| Federal | $ | $ | $ | ||||||||||||||
| State and local | |||||||||||||||||
| Deferred: | |||||||||||||||||
| Federal | |||||||||||||||||
| State and local | |||||||||||||||||
| Total income tax provision | $ | $ | $ | ||||||||||||||
A reconciliation of the expected income tax expense at the statutory federal income tax rate of 21% to the Company’s actual income tax benefit and effective tax rate for the years ended December 31, 2023, 2022, and 2021 and is as follows:
| Year Ended December 31, | |||||||||||||||||||||||||||||||||||
| 2023 | 2022 | 2021 | |||||||||||||||||||||||||||||||||
| Amount | % | Amount | % | Amount | % | ||||||||||||||||||||||||||||||
| (In thousands) | |||||||||||||||||||||||||||||||||||
| Tax expense at federal income tax rate | $ | % | $ | % | $ | % | |||||||||||||||||||||||||||||
| Increase (decrease) resulting from: | |||||||||||||||||||||||||||||||||||
| Tax exempt income | ( | ( | % | ( | ( | % | ( | ( | % | ||||||||||||||||||||||||||
| State tax, net of federal benefit | % | % | % | ||||||||||||||||||||||||||||||||
| Equity awards windfall | ( | ( | % | ( | ( | % | ( | ( | % | ||||||||||||||||||||||||||
| Other | % | ( | ( | % | % | ||||||||||||||||||||||||||||||
| Total | $ | % | $ | % | $ | % | |||||||||||||||||||||||||||||
As of December 31, 2023 the Company had remaining federal, state and local net operating loss carryforwards of approximately $8 thousand, $13.5 million and $8.0 million, respectively, which are available to offset future federal, state and local income and which expire over varying periods from 2030 through 2035.
Deferred income tax assets and liabilities result from temporary differences between the carrying value of assets and liabilities for financial reporting purposes and for income tax return purposes. These assets and liabilities are measured using the enacted tax rates and laws that are currently in effect and are reported net in the accompanying Consolidated Statement of Financial Condition.
117
Notes to the Consolidated Financial Statements | ||
The significant components of the net deferred tax assets and liabilities as of December 31, 2023 and 2022, are as follows:
| December 31, | ||||||||||||||
| 2023 | 2022 | |||||||||||||
| (In thousands) | ||||||||||||||
| Deferred tax assets: | ||||||||||||||
| Excess tax basis over carrying value of assets: | ||||||||||||||
Allowance for credit losses | $ | $ | ||||||||||||
| Postretirement and other employee benefits | ||||||||||||||
| Available for sale securities carried at fair value for financial statement purposes | ||||||||||||||
| Depreciation and amortization | ||||||||||||||
| Operating leases | ||||||||||||||
| Federal, state and local net operating loss carryforward | ||||||||||||||
| Transfer of available for sale securities to held-to-maturity | ||||||||||||||
| Other, net | ||||||||||||||
| Gross deferred tax asset | ||||||||||||||
| Deferred tax liabilities: | ||||||||||||||
| Purchase accounting adjustments, net | ( | ( | ||||||||||||
| Operating leases | ( | ( | ||||||||||||
| Net deferred loan fees | ( | ( | ||||||||||||
| Depreciation and amortization | ( | |||||||||||||
| Gross deferred tax liabilities | ( | ( | ||||||||||||
| Deferred tax asset, net | $ | $ | ||||||||||||
As of December 31, 2023, the Company’s deferred tax assets were valued without an allowance as management concluded that it is more likely than not that the entire amount may be realized. ASC 740, Income Taxes, provides for the recognition of deferred tax assets if realization of such assets is more likely than not. Management reassesses the need for a valuation allowance on an annual basis, or more frequently if warranted. If it is later determined that a valuation allowance is required, it generally will be an expense to the income tax provision in the period such determination is made.
The Company and its subsidiaries are subject to Federal, New York State, California, Colorado, District of Columbia, Florida, New Jersey, Massachusetts, Minnesota, North Carolina, Pennsylvania, Virginia and New York City income taxes. A tax position is recognized as a benefit only if it is “more likely than not” that the tax position would be sustained in a tax examination; with a tax examination presumably to occur. The amount recognized is the largest amount of tax benefit that is greater than 50% likely of being realized on examination. For tax positions not meeting the “more likely than not” test, no tax benefit is recorded. As of December 31, 2023, the Company had an uncertain tax liability of $2.7 million related to a state and city tax examination regarding inventory of prior net operating losses. The Company reasonably expects to resolve this tax position in the next 12 months. The Company had no uncertain tax positions as of December 31, 2022.
As of December 31, 2023, the Company is generally subject to possible examination by federal, state, and local taxing authorities for 2020 and subsequent tax years. Income tax receivable, which is included in other assets, totaled $8.0 million and $12.1 million as of December 31, 2023 and 2022, respectively.
118
Notes to the Consolidated Financial Statements | ||
12. EARNINGS PER SHARE
Under the two-class method, earnings available to common stockholders for the period are allocated between common stockholders and participating securities according to participation rights in undistributed earnings. Our time-based and performance-based restricted stock units are not considered participating securities as they do not receive dividend distributions until satisfaction of the related vesting requirements. As of December 31, 2023 and December 31, 2022, the Company had 3,233 and 10,934 anti-dilutive shares, respectively.
Following is a table setting forth the factors used in the earnings per share computation follow:
| Year Ended December 31, | |||||||||||||||||
| 2023 | 2022 | 2021 | |||||||||||||||
| (In thousands, except per share amounts) | |||||||||||||||||
| Net income attributable to Amalgamated Financial Corp. | $ | $ | $ | ||||||||||||||
| Dividends paid on preferred stock | ( | ( | |||||||||||||||
| Income attributable to common stock | $ | $ | $ | ||||||||||||||
| Weighted average common shares outstanding, basic | |||||||||||||||||
| Basic earnings per common share | $ | $ | $ | ||||||||||||||
| Income attributable to common stock | $ | $ | $ | ||||||||||||||
| Weighted average common shares outstanding, basic | |||||||||||||||||
| Incremental shares from assumed conversion of options and RSUs | |||||||||||||||||
| Weighted average common shares outstanding, diluted | |||||||||||||||||
| Diluted earnings per common share | $ | $ | $ | ||||||||||||||
119
Notes to the Consolidated Financial Statements | ||
13. EMPLOYEE BENEFIT PLANS
The Company offers various pension and retirement benefit plans, as well as a long-term incentive plan to eligible employees and directors. Significant benefit plans are described as follows:
Pension Plan
The Company participates in a multi-employer non-contributory pension plan which covers substantially all full-time employees, both unionized and non-unionized. Employees generally qualify for participation in the plan on the first January 1st or July 1st after attaining age 21 and completing 1,000 Hours of Service in a 12 consecutive month period. a Memorandum of Agreement covering the unionized employees was entered into on December 20, 2023 which extended the term of the collective bargaining agreement to June 30, 2026. Under the terms of this plan, participants vest 100 % upon completion of five years of service, as defined in the plan document. Plan assets are invested in the Consolidated Retirement Fund ("CRF"). The Employer Identification Number of the CRF is 13-3177000 and the Plan Number is 001 .
As a multi-employer plan, the Administrator of the CRF does not make separate actuarial valuations with respect to each employer, nor are plan assets so segregated. The benefits provided by the CRF are being funded by the Company and other participating employers through contributions to the Administrator, which are necessary to maintain the CRF on a sound actuarial basis. Contributions are calculated based on a percentage of participants’ qualifying base salary, which percentage is determined from time to time by the CRF Board of Trustees.
The Pension Protection Act of 2006 ("PPA") ranks the funded status of multi-employer plans depending upon a plan’s current and projected funding. A plan is in the Red Zone (Critical Status) if it has a current funded percentage (as defined) of less than 65%. A plan is in the Yellow Zone (Endangered Status) if it has a current funded percentage of less than 80%, or projects a credit balance deficit within seven years. A plan is in the Green Zone if it has a current funded percentage greater than 80% and does not have a projected credit balance deficit within seven years. For the 2023 and 2022 plan years, pursuant to the PPA, the CRF was certified to be in the Green Zone (i.e. neither Critical Status nor Endangered Status).
The following table summarizes certain information regarding contributions made by the Company to the CRF:
| (In thousands) | Contributions | Company contributions greater than 5% of total contributions received by the CRF? | |||||||||
| Year Ended December 31, | |||||||||||
| 2023 | $ | Yes | |||||||||
| 2022 | Yes | ||||||||||
| 2021 | Yes | ||||||||||
The amounts of contributions presented in the preceding table represent expense recorded by the Company during the respective periods and are included in Compensation and Employee Benefits expense on the Consolidated Statements of Income.
Retirement Benefit Plans
The Company offers a post-retirement health plan, a life insurance plan, and provides for two other non-qualifying supplemental retirement plan benefits; one for certain former directors, and one for certain former employees. The Company’s policy is to fund the cost of health and life benefits in amounts determined in accordance with the plan provisions. The other retirement benefit plans generally contain vesting provisions and service requirements. These plans are unfunded and represent a general obligation of the Company.
120
Notes to the Consolidated Financial Statements | ||
The following table summarizes the plans’ benefit obligation, the changes in the plans’ benefit obligation, changes in plan assets and the plan’s funded status:
| Year Ended December 31, | |||||||||||
| (In thousands) | 2023 | 2022 | |||||||||
| Change in benefit obligation: | |||||||||||
| Benefit obligation at beginning of year | $ | $ | |||||||||
| Service cost | |||||||||||
| Interest cost | |||||||||||
| Amendments | |||||||||||
| Actuarial gain | ( | ( | |||||||||
| Benefits paid | ( | ( | |||||||||
| Benefit obligation at end of year | $ | $ | |||||||||
| Change in plan assets: | |||||||||||
| Employer contributions | $ | $ | |||||||||
| Benefits paid | ( | ( | |||||||||
| Plan assets at end of year | $ | $ | |||||||||
| Benefit obligation, included in other liabilities | $ | $ | |||||||||
The following table presents before tax effected amounts recognized in accumulated other comprehensive income (loss) at December 31:
| (In thousands) | 2023 | 2022 | 2021 | ||||||||||||||
| Net actuarial loss | $ | $ | $ | ||||||||||||||
| Prior service credit | ( | ( | ( | ||||||||||||||
| Total amount recognized | $ | $ | $ | ||||||||||||||
121
Notes to the Consolidated Financial Statements | ||
The following table summarizes the components of net periodic benefit cost and other amounts recognized in :
| (In thousands) | 2023 | 2022 | 2021 | ||||||||||||||
| Components of net periodic benefit cost: | |||||||||||||||||
| Service cost | $ | $ | $ | ||||||||||||||
| Interest cost | |||||||||||||||||
| Prior service credit amortization | ( | ( | ( | ||||||||||||||
| Recognized actuarial loss | |||||||||||||||||
| Net periodic benefit | $ | $ | $ | ||||||||||||||
| Components of other amounts: | |||||||||||||||||
| Net regular actuarial gain | $ | ( | $ | ( | $ | ( | |||||||||||
| Recognized actuarial loss | ( | ( | ( | ||||||||||||||
| Prior service credit amortization | |||||||||||||||||
| Prior service credit due to curtailments | |||||||||||||||||
| Total recognized in other comprehensive income | $ | ( | $ | ( | $ | ||||||||||||
| Total recognized in comprehensive income | $ | $ | ( | $ | |||||||||||||
The following table summarizes certain weighted average assumptions used to measure the plans’ obligation at the end of the year as well as net periodic benefit expense during the year:
| 2023 | 2022 | 2021 | |||||||||||||||
| Weighted average assumptions used to determine benefit obligations: | |||||||||||||||||
| Discount rate | % | % | % | ||||||||||||||
| Weighted average assumptions used to determine net periodic benefit cost: | |||||||||||||||||
| Discount rate | % | % | % | ||||||||||||||
The net actuarial loss and prior service credit that is expected to be amortized from accumulated other comprehensive loss and into net periodic expense during the year ended December 31, 2024 is $0.2 million.
Future estimated benefit payments are expected to be approximately $0.3
401(k) Plans
The Company also offers 2 retirement savings plans which are qualified under Section 401(k) of the Internal Revenue Code ("401(k) Plan"). Substantially all employees are eligible to participate, and participants can contribute up to 15 % of their salary subject to certain limitations. The Company does not make contributions to the 401(k) Plan and as such does not incur any direct compensation expense related to the 401(k) Plan.
Long Term Incentive Plans
Stock Options:
The Company has granted stock options in previous years to employees and directors. As of December 31, 2020, all options have vested and are exercisable at the option of the vested holders until the termination of each tranche after 10 years from the grant date or earlier if the employee or director has changed their employment status. The Company does not currently have an active stock option plan that is available for issuing new options.
122
Notes to the Consolidated Financial Statements | ||
A summary of the status of the Company’s options as of December 31, 2023 follows:
| Number of Options | Weighted Average Exercise Price | Weighted Average Remaining Contractual Term | Intrinsic Value (in thousands) | |||||||||||||||||||||||
| Outstanding, January 1, 2023 | $ | years | ||||||||||||||||||||||||
| Granted | — | |||||||||||||||||||||||||
| Forfeited/ Expired | — | |||||||||||||||||||||||||
| Exercised | ( | — | ||||||||||||||||||||||||
| Outstanding, December 31, 2023 | years | $ | ||||||||||||||||||||||||
| Vested and Exercisable, December 31, 2023 | $ | years | $ | |||||||||||||||||||||||
The range of exercise prices is $11.00 to $14.65 per share.
There were no 0.7 million, and is recorded within compensation and employee benefits expense on the Consolidated Statements of Income. The fair value of all awards outstanding as of December 31, 2023 and December 31, 2022 was $4.7 million and $4.2 million, respectively. No
The Company repurchased 55,881 shares and 310,176 shares for options exercised in the years ended December 31, 2023 and December 31, 2022, respectively.
Restricted Stock Units:
The Amalgamated Financial Corp. 2023 Equity Incentive Plan (the “Equity Plan”) provides for the grant of stock-based incentive awards to employees and directors of the Company. The number of shares of common stock of the Company available for stock-based awards in the Equity Plan is 1,300,000 of which 1,265,610 shares were available for issuance as of December 31, 2023.
Restricted stock units ("RSUs") represent an obligation to deliver shares to an employee or director at a future date if certain vesting conditions are met. RSUs are subject to a time-based vesting schedule, the satisfaction of performance conditions, or the satisfaction of market conditions, and are settled in shares of the Company’s common stock. RSUs do not provide dividend equivalent rights from the date of grant and do not provide voting rights. RSUs accrue dividends based on dividends paid on common shares, but those dividends are paid in cash upon satisfaction of the specified vesting requirements on the underlying RSU.
A summary of the status of the Company’s time-based vesting RSUs as of December 31, 2023 follows:
| Shares | Grant Date Fair Value | ||||||||||
| Unvested, January 1, 2023 | $ | ||||||||||
| Awarded | |||||||||||
| Forfeited/Expired | ( | ||||||||||
| Vested | ( | ||||||||||
| Unvested, December 31, 2023 | $ | ||||||||||
123
Notes to the Consolidated Financial Statements | ||
A summary of the status of the Company’s performance-based RSUs as of December 31, 2023 follows:
| Shares | Grant Date Fair Value | ||||||||||
| Unvested, January 1, 2023 | $ | ||||||||||
| Awarded | |||||||||||
| Forfeited/Expired | ( | ||||||||||
| Vested | ( | ||||||||||
| Unvested, December 31, 2023 | $ | ||||||||||
During the year ended December 31, 2023, the Company granted 29,923 performance-based RSUs at a fair value of $23.42 per share, which vest subject to the achievement of the Company’s corporate goal for the three-year period from January 1, 2023 to December 31, 2025. The corporate goal is based on the Company achieving a target increase in Tangible Book Value, adjusted for certain factors. The minimum and maximum awards that are achievable are 0 and 44,885 shares, respectively.
During the year ended December 31, 2023, the Company granted 29,747 market-based RSUs at a fair value of $23.56 per share which vest subject to the Bank’s relative total shareholder return compared to a group of peer banks over a three-year period from February 15, 2023 to February 14, 2026. The minimum and maximum awards that are achievable are 0 and 44,621 shares, respectively.
During the year ended December 31, 2023, the Company awarded 619 and 2,656 shares at a fair value of $14.45 and $15.23 per share, respectively, related to the vesting of performance-based RSUs to satisfy the achievement of corporate goals above target.
As of December 31, 2023, the Company reserved 188,945 shares for issuance upon vesting of performance-based RSUs assuming the Company’s employees achieve the maximum share payout.
The Company repurchased 58,942 shares and 54,191 shares for RSUs vested in the years ended December 31, 2023 and 2022, respectively.
Of the 417,725 unvested RSUs as of December 31, 2023, the minimum units that will vest, solely due to a service test, are 291,762 . The maximum units that will vest, assuming the highest payout on performance and market-based units, are 480,707 .
Compensation expense attributable to the employee RSUs was $4.2 million, $2.2 million, and $1.8 million for the years ended December 31, 2023, 2022, and 2021, respectively. The Company recorded an expense of $0.5 million, $0.5 million, and $0.3 million attributable to RSUs granted to directors for the years ended December 31, 2023, 2022, and 2021, respectively. As of December 31, 2023, there was $11.3 million of total unrecognized compensation cost related to the non-vested RSUs granted to employees and directors. This expense may increase or decrease depending on the expected number of performance-based shares to be issued. This expense is expected to be recognized over 1.4 years.
Employee Stock Purchase Plan
On April 28, 2021, the Company's stockholders approved the Amalgamated Financial Corp. Employee Stock Purchase Plan (the "ESPP") which was implemented on March 2, 2022. The aggregate number of shares of common stock that may be purchased and issued under the ESPP will not exceed 500,000 of previously authorized shares. Under the terms of the ESPP, employees may authorize the withholding of up to 15 % of their eligible compensation to purchase the Company's shares of common stock, not to exceed $25,000 of the fair market value of such common stock for any calendar year. The purchase price per shares acquired under the ESPP will never be less than 85 % of the fair market value of the Company's common stock on the last day of the offering period. The Company's Board of Directors in its discretion may terminate the ESPP at any time with respect to any shares for which options have not been granted.
The Compensation and Human Resources Committee of the Board of Directors (the "Committee") has the right to amend the ESPP without the approval of our stockholders; provided, that no such change may impair the rights of a participant with respect to any outstanding offering period without the consent of such participant, other than a change determined by the Committee to be
124
Notes to the Consolidated Financial Statements | ||
necessary to comply with applicable law. A participant may not dispose of shares acquired under the ESPP until six months following the grant date of such shares, or any earlier date as of which the Committee has determined that the participant would qualify for a hardship distribution from the Company’s 401(k) Plan. Accordingly, the fair value award associated with their discounted purchase price is expensed at the time of purchase. The below following summarizes the shares purchased under the ESPP since the inception of the plan:
| Number of Shares | |||||
| Maximum shares available for purchase at plan inception | |||||
| Purchases during the year ended: | |||||
| December 31, 2021 | |||||
| December 31, 2022 | ( | ||||
| December 31, 2023 | ( | ||||
| Purchases since plan inception | ( | ||||
| Remaining shares available for purchase at December 31, 2023 | |||||
125
Notes to the Consolidated Financial Statements | ||
14. FAIR VALUE OF FINANCIAL INSTRUMENTS
Fair value is defined as the price that would be received to sell an asset or paid to transfer a liability in an orderly transaction between market participants at the measurement date. Assumptions are developed based on prioritizing information within a fair value hierarchy that gives the highest priority to quoted prices in active markets and the lowest priority to unobservable data. A description of the disclosure hierarchy and the types of financial instruments recorded at fair value that management believes would generally qualify for each category are as follows:
Level 1 - Valuations are based on quoted prices in active markets for identical assets or liabilities. Accordingly, valuation of these assets and liabilities does not entail a significant degree of judgment. Examples include most U.S. Government securities and exchange-traded equity securities.
Level 2 - Valuations are based on either quoted prices in markets that are not considered to be active or significant inputs to the methodology that are observable, either directly or indirectly. Financial instruments in this level would generally include mortgage-related securities and other debt issued by GSEs, non-GSE mortgage-related securities, corporate debt, certain redeemable fund investments and certain trust preferred securities.
Level 3 - Valuations are based on inputs to the methodology that are unobservable and significant to the fair value measurement. These inputs reflect management’s own judgments about the assumptions that market participants would use in pricing the assets and liabilities.
Assets Measured at Fair Value on a Recurring Basis
Available for sale securities
The Company’s available for sale securities are reported at fair value. Investments in fixed income securities are generally valued based on evaluations provided by an independent pricing service. These evaluations represent an exit price or their opinion as to what a buyer would pay for a security, typically in an institutional round lot position, in a current sale. The pricing service utilizes evaluated pricing techniques that vary by asset class and incorporate available market information and, because many fixed income securities do not trade on a daily basis, applies available information through processes such as benchmark curves, benchmarking of available securities, sector groupings and matrix pricing. Model processes, such as option adjusted spread models, are used to value securities that have prepayment features. In those limited cases where pricing service evaluations are not available for a fixed income security, such as PACE assessments, management will typically value those instruments using observable market inputs in a discounted cash flow analysis.
The following summarizes those financial instruments measured at fair value on a recurring basis in the Consolidated Statements of Financial Condition as of the dates indicated, categorized by the relevant class of investment and level of the fair value hierarchy:
| December 31, 2023 | |||||||||||||||||||||||
| (In thousands) | Level 1 | Level 2 | Level 3 | Total | |||||||||||||||||||
| Available for sale securities: | |||||||||||||||||||||||
| Traditional securities: | |||||||||||||||||||||||
| GSE certificates & CMOs | $ | $ | $ | $ | |||||||||||||||||||
| Non-GSE certificates & CMOs | |||||||||||||||||||||||
| ABS | |||||||||||||||||||||||
| Corporate | |||||||||||||||||||||||
| Other | |||||||||||||||||||||||
| PACE assessments: | |||||||||||||||||||||||
| Residential PACE assessments | |||||||||||||||||||||||
| Total assets carried at fair value | $ | $ | $ | $ | |||||||||||||||||||
126
Notes to the Consolidated Financial Statements | ||
| December 31, 2022 | |||||||||||||||||||||||
| (In thousands) | Level 1 | Level 2 | Level 3 | Total | |||||||||||||||||||
| Available for sale securities: | |||||||||||||||||||||||
| Traditional securities: | |||||||||||||||||||||||
| GSE certificates & CMOs | $ | $ | $ | $ | |||||||||||||||||||
| Non-GSE certificates & CMOs | |||||||||||||||||||||||
| ABS | |||||||||||||||||||||||
| Corporate | |||||||||||||||||||||||
| Other | |||||||||||||||||||||||
| Total assets carried at fair value | $ | $ | $ | $ | |||||||||||||||||||
During the years ended December 31, 2023 and 2022, there were no transfers of financial instruments between Level 1 and Level
2.
The table below presents a reconciliation of all assets measured at fair value on a recurring basis using significant unobservable inputs (Level 3) for the years ended December 31, 2023 and 2022:
Residential PACE Assessments | |||||||||||
| 2023 | 2022 | ||||||||||
(In thousands) | |||||||||||
Balance of recurring Level 3 assets at January 1 | $ | $ | |||||||||
Amortization included in interest income in net income | |||||||||||
Change in unrealized holding gains/losses included in other comprehensive income | |||||||||||
Purchases | |||||||||||
Principal paydowns | ( | ||||||||||
Balance of recurring Level 3 assets at December 31 | $ | $ | |||||||||
The fair value of the Company's PACE assessments are determined internally by calculating discounted cash flows using expected conditional prepayment rates, market spreads, and the Treasury yield curve. Qualitative assessments from recent commentary from dealers or investors or issuers, information revealed from secondary market trades of clean energy senior asset-backed securities, and volatility in the marketplace are reviewed and incorporated into the calculations.
The following table presents quantitative information about recurring Level 3 fair value measurements at December 31, 2023:
| December 31, 2023 | ||||||||||||||||||||||||||
Fair Value | Valuation Technique | Unobservable Input | Range (Weighted Average) | |||||||||||||||||||||||
(In thousands) | ||||||||||||||||||||||||||
Residential PACE assessments | $ | Discounted cash flow | Conditional prepayment rate | |||||||||||||||||||||||
The significant unobservable input used in the fair value measurement of the Company's residential PACE assessments is conditional prepayment rate. Significant increases/(decreases) in this input in isolation would have results in a modestly higher/(lower) fair value measurement. Unobservable inputs were weighted by the relative fair value of the instruments.
127
Notes to the Consolidated Financial Statements | ||
Assets Measured at Fair Value on a Non-recurring Basis
Certain financial assets are measured at fair value on a non-recurring basis. That is, they are subject to fair value adjustments in certain circumstances.
Collateral-dependent loans
Fair values for individually analyzed collateral-dependent loans are based on the fair value of the collateral based on an appraised values, net book value per the borrower’s financial statements, aging reports, or by reference to market activity, adjusted or discounted based on management’s historical knowledge, changes in market conditions from the time of the valuation and management’s expertise and knowledge of the borrower and its business. At December 31, 2023, there were no individually analyzed collateral-dependent loans.
Impaired loans (prior to the adoption of ASU 2016-13)
Fair values for loans considered impaired are based on discounted cash flows using the loan’s initial effective interest rate or the fair value of the underlying collateral in the case of collateral dependent loans. The methods used to estimate the fair value of loans are extremely sensitive to the assumptions and estimates used. While management has attempted to use assumptions and estimates that best reflect the Company’s loan portfolio and current market conditions, a greater degree of subjectivity is inherent in these values than in those determined in active markets. The following tables summarize assets measured at fair value on a non-recurring basis in the Consolidated Statements of Financial Condition as of the dates indicated, categorized by the relevant class of investment and level of the fair value hierarchy.
| December 31, 2022 | |||||||||||||||||||||||||||||
| (In thousands) | Carrying Value | Level 1 | Level 2 | Level 3 | Estimated Fair Value | ||||||||||||||||||||||||
| Fair Value Measurements: | |||||||||||||||||||||||||||||
| Impaired loans | $ | $ | $ | $ | $ | ||||||||||||||||||||||||
Financial Instruments Not Measured at Fair Value
A description of the methods, factors and significant assumptions utilized in estimating the fair values for significant categories of financial instruments not measured at fair value follows:
•Held-to-maturity securities – Investments in fixed income securities are generally valued based on evaluations provided by an independent pricing service. These evaluations represent an exit price or their opinion as to what a buyer would pay for a security, typically in an institutional round lot position, in a current sale. The pricing service utilizes evaluated pricing techniques that vary by asset class and incorporate available market information and, because many fixed income securities do not trade on a daily basis, applies available information through processes such as benchmark curves, benchmarking of available securities, sector groupings and matrix pricing. Model processes, such as option adjusted spread models, are used to value securities that have prepayment features. In those limited cases where pricing service evaluations are not available for a fixed income security, such as PACE assessments, management will typically value those instruments using observable market inputs in a discounted cash flow analysis. Held-to-maturity securities, with the exception of PACE securities which are categorized as Level 3, are generally categorized as Level 2.
•Loans held for sale – Loans held for sale are carried at the lower of cost or fair value. The fair value of loans held for sale is determined using the price we expect to receive for the loans based on commitments received from third party investors. Loans held on our balance sheet greater than 90 days are evaluated to determine if a valuation allowance is required to adjust for a decline in fair value below the carrying amount, and then subject to quarterly evaluation going forward. Loans held for sale are generally categorized as Level 3.
•Loans receivable – Loans are valued using a present value technique that incorporates management’s assumptions as to what a market participant would assume given the attributes of the loans. The observable U.S. Treasury yield curve is a significant input to the valuation. Assumptions, including prepayment speeds and credit spreads, are based on observable market data where possible or alternatively are based on terms currently offered on loans to borrowers of similar credit quality. The
128
Notes to the Consolidated Financial Statements | ||
methods used to estimate the fair value of loans are extremely sensitive to the assumptions and estimates used. While management has attempted to use assumptions and estimates that best reflect the Company’s loan portfolio and current market conditions, a greater degree of subjectivity is inherent in these values than in those determined in active markets. Loans would generally be categorized as Level 3.
•Resell agreements – Resell agreements are carried at fair value, as these are short term agreements. All existing trades are done at the current rate for new trades, so there is no market value adjustment. The agreements are generally categorized as Level 3, as we have limited market information.
•Deposits – Deposits without a defined maturity date are valued at the amount payable on demand, and are categorized as Level 2. Certificates of deposit, which are categorized as Level 2, are valued using a present value technique that incorporates current rates offered by the Company for certificates of comparable remaining maturity.
•FHLBNY Advances – FHLBNY advances are valued using a present value technique that incorporates current rates offered by the FHLBNY for advances of comparable remaining maturity. FHLBNY advances are categorized as Level 2.
•Subordinated debt – Bank issued subordinated debt is valued based on recent trades for similar issues and or values provided by firms that transact in our bonds. Subordinated debt is categorized as Level 2.
•Other borrowings - Other borrowings are valued using a present value technique that incorporates current rates offered by the FRB for advances of comparable remaining maturity. Other borrowings are categorized as Level 2.
•Other – The Company holds or issues other financial instruments for which management considers the carrying value to approximate fair value. Such items include cash and cash equivalents, accrued interest receivable and payable. Many of these items are short term in nature with minimal risk characteristics.
For those financial instruments that are not recorded at fair value in the consolidated statements of financial condition, but are measured at fair value for disclosure purposes, management follows the same fair value measurement principles and guidance as for instruments recorded at fair value.
There are significant limitations in estimating the fair value of financial instruments for which an active market does not exist. Due to the degree of management judgment that is often required, such estimates tend to be subjective, sensitive to changes in assumptions and imprecise. Such estimates are made as of a point in time and are impacted by then-current observable market conditions; also such estimates do not give consideration to transaction costs or tax effects if estimated unrealized gains or losses were to become realized in the future. Because of inherent uncertainties of valuation, the estimated fair value may differ significantly from the value that would have been used had a ready market for the investment existed and the difference could be material. Lastly, consideration is not given to nonfinancial instruments, including various intangible assets, which could represent substantial value. Fair value estimates are not necessarily representative of the Company’s total enterprise value.
The following table summarizes the financial statement basis and estimated fair values for significant categories of financial instruments:
129
Notes to the Consolidated Financial Statements | ||
| December 31, 2023 | |||||||||||||||||||||||||||||
| Carrying Value | Level 1 | Level 2 | Level 3 | Estimated Fair Value | |||||||||||||||||||||||||
| (In thousands) | |||||||||||||||||||||||||||||
| Financial assets: | |||||||||||||||||||||||||||||
| Cash and cash equivalents | $ | $ | $ | $ | $ | ||||||||||||||||||||||||
| Held-to-maturity securities | |||||||||||||||||||||||||||||
| Loans held for sale | |||||||||||||||||||||||||||||
| Loans receivable, net | |||||||||||||||||||||||||||||
| Resell agreements | |||||||||||||||||||||||||||||
| Accrued interest receivable | |||||||||||||||||||||||||||||
| Financial liabilities: | |||||||||||||||||||||||||||||
| Deposits payable on demand | $ | $ | $ | $ | $ | ||||||||||||||||||||||||
| Time deposits and brokered CDs | |||||||||||||||||||||||||||||
| FHLBNY advances | |||||||||||||||||||||||||||||
| Other borrowings | |||||||||||||||||||||||||||||
| Subordinated debt, net | |||||||||||||||||||||||||||||
| Accrued interest payable | |||||||||||||||||||||||||||||
| December 31, 2022 | |||||||||||||||||||||||||||||
| (In thousands) | Carrying Value | Level 1 | Level 2 | Level 3 | Estimated Fair Value | ||||||||||||||||||||||||
| Financial assets: | |||||||||||||||||||||||||||||
| Cash and cash equivalents | $ | $ | $ | $ | $ | ||||||||||||||||||||||||
| Held-to-maturity securities | |||||||||||||||||||||||||||||
| Loans held for sale | |||||||||||||||||||||||||||||
| Loans receivable, net | |||||||||||||||||||||||||||||
| Resell agreements | |||||||||||||||||||||||||||||
| Accrued interest and dividends receivable | |||||||||||||||||||||||||||||
| Financial liabilities: | |||||||||||||||||||||||||||||
| Deposits payable on demand | |||||||||||||||||||||||||||||
| Time deposits and brokered CDs | |||||||||||||||||||||||||||||
| FHLBNY advances | |||||||||||||||||||||||||||||
| Subordinated debt, net | |||||||||||||||||||||||||||||
| Accrued interest payable | |||||||||||||||||||||||||||||
130
Notes to the Consolidated Financial Statements | ||
15. COMMITMENTS, CONTINGENCIES AND OFF BALANCE SHEET RISK
Credit Commitments
The Company is party to various credit related financial instruments with off balance sheet risk. The Company, in the normal course of business, issues such financial instruments in order to meet the financing needs of its customers. These financial instruments include commitments to extend credit and standby letters of credit. Such commitments involve, to varying degrees, elements of credit and interest rate risk in excess of the amounts recognized in the consolidated statements of financial condition.
The following financial instruments were outstanding whose contract amounts represent credit risk as of the related periods:
| December 31, 2023 | December 31, 2022 | ||||||||||
| (In thousands) | |||||||||||
| Commitments to extend credit | $ | $ | |||||||||
| Standby letters of credit | |||||||||||
| Total | $ | $ | |||||||||
Commitments to extend credit are contracts to lend to a customer as long as there is no violation of any condition established in the contract. These commitments have fixed expiration dates and other termination clauses and generally require the payment of nonrefundable fees. Since a portion of the commitments are expected to expire without being drawn upon, the contractual principal amounts do not necessarily represent future cash requirements. The Company’s maximum exposure to credit risk is represented by the contractual amount of these instruments. These instruments represent ultimate exposure to credit risk only to the extent they are subsequently drawn upon by customers.
Standby letters of credit are conditional lending commitments issued by the Company to guarantee the financial performance of a customer to a third party. The credit risk involved in issuing standby letters of credit is essentially the same as that involved in extending loan facilities to customers. The balance sheet carrying value of standby letters of credit approximates any nonrefundable fees received but not yet recorded as income. The Company considers this carrying value, which is not material, to approximate the estimated fair value of these financial instruments.
The Company reserves for the credit risk inherent in off balance sheet credit commitments. Upon adoption of ASU 2016-13 on January 1, 2023, the Day 1 adjustment to allowance for credit losses on off-balance sheet credit exposures was $2.7 million. This allowance, which is included in other liabilities, amounted to approximately $4.2 million as of December 31, 2023, compared to a reserve of $1.6 million as of December 31, 2022. The provision for credit losses related to off balance sheet credit commitments was a recovery of $0.1 million for the year ended December 31, 2023. The expense related to off balance sheet credit commitments in other non-interest expense was an expense of $0.1 million for the year ended December 31, 2022, and an expense of $0.3 million for the year ended December 31, 2021.
Investment Obligations
The Company is a party to agreements with Pace Funding Group LLC, which operates Home Run Financing, for the purchase of PACE assessment securities until December 2023. As of December 31, 2023, the Company had purchased $718.2 million of these obligations and had an estimated remaining commitment of $85.0 million. The PACE assessments have equal-lien priority with property taxes and generally rank senior to first lien mortgages. These investments are currently held in the Company's available for sale and held-to-maturity investment portfolio. The Company evaluates these obligations for credit risk and the recorded reserve is immaterial.
Other Commitments and Contingencies
In the ordinary course of business, there are various legal proceedings pending against the Company. Based on the opinion of counsel, management believes that the aggregate liabilities, if any, arising from such actions would not have a material adverse effect on the consolidated financial position or results of operations of the Company. As part of the Company's ongoing investments in variable interest entity ("VIE") projects, we also have commitments to provide financing, which are included in Note 18.
131
Notes to the Consolidated Financial Statements | ||
16. LEASES
The Company as a lessee has operating leases primarily consisting of real estate arrangements where the Company operates its headquarters, branches and business production offices. All leases identified as in scope are accounted for as operating leases as of December 31, 2023 and December 31, 2022. These leases are typically long-term leases and generally are not complicated arrangements or structures. Several of the leases contain renewal options at a rate comparable to the fair market value based on comparable analysis to similar properties in the Company’s geographies.
Real estate operating leases are presented as a right-of-use asset and a related operating lease liability on the Consolidated Statements of Financial Condition. The ROU asset represents the Company’s right to use the underlying asset for the lease term and the operating lease liabilities represent the obligation to make lease payments arising from the lease. The Company applied its incremental borrowing rate as the discount rate to the remaining lease payments to derive a present value calculation for initial measurement of the operating lease liability. The IBR reflects the interest rate the Company would have to pay to borrow on a collateralized basis over a similar term for an amount equal to the lease payments. Lease expense is recognized on a straight-line basis over the lease term.
The following table summarizes our lease cost and other operating lease information:
| Year Ended December 31, | |||||||||||
| 2023 | 2022 | ||||||||||
| (In thousands) | |||||||||||
| Operating lease cost | $ | $ | |||||||||
| Cash paid for amounts included in the measurement of operating leases liability | $ | $ | |||||||||
| Note: Sublease income and variable income or expense considered immaterial | |||||||||||
The weighted average remaining lease term on operating leases at December 31, 2023 and December 31, 2022 was 3.2 years and 3.9 years, respectively.
The weighted average discount rate used for the operating lease liability was 3.26 % and 3.25 % at December 31, 2023 and December 31, 2022, respectively.
The following table presents the remaining commitments for operating lease payments for the next five years and thereafter, as well as a reconciliation to the discounted operating leases liability recorded in the Consolidated Statements of Financial Condition as of December 31, 2023:
| (In thousands) | As of December 31, 2023 | ||||
| 2024 | $ | ||||
| 2025 | |||||
| 2026 | |||||
| 2027 | |||||
| 2028 | |||||
| Thereafter | |||||
| Total undiscounted operating lease payments | |||||
| Less: present value adjustment | |||||
| Total Operating leases liability | $ | ||||
132
Notes to the Consolidated Financial Statements | ||
17. GOODWILL AND INTANGIBLE ASSETS
Goodwill
In accordance with GAAP, the Company performs an annual test as of June 30 to identify potential impairment of goodwill, or more frequently if events or circumstances indicate a potential impairment may exist. If the carrying amount of the Company, as a sole reporting unit, including goodwill, exceeds its fair value, an impairment loss is recognized in an amount equal to that excess up to the amount of the recorded goodwill.
The Company performed its annual test based upon market data as of June 30, 2023 and estimates and assumptions that the Company believes most appropriate for the analysis. Based on the qualitative analysis performed in accordance with ASC 350, the Company determined it more likely than not that goodwill was not impaired as of June 30, 2023. Changes in certain assumptions used in the Company's assessment could result in significant differences in the results of the impairment test. Should market conditions or management’s assumptions change significantly in the future, an impairment to goodwill is possible.
At December 31, 2023 and December 31, 2022, the carrying amount of goodwill was $12.9
Intangible Assets
The following table reflects the estimated amortization expense, comprised entirely by the Company’s core deposit intangible asset, for the next five years and thereafter:
| (In thousands) | Total | ||||
| 2024 | $ | ||||
| 2025 | |||||
| 2026 | |||||
| 2027 | |||||
| 2028 | |||||
| Thereafter | |||||
| Total | $ | ||||
Accumulated amortization of the core deposit intangible was $6.9 million as of December 31, 2023.
Amortization expense recognized on the core deposit intangible was $0.9 million, $1.0 million, and $1.2 million for the years ended December 31, 2023, December 31, 2022, and December 31, 2021, respectively.
133
Notes to the Consolidated Financial Statements | ||
18. VARIABLE INTEREST ENTITIES
Tax Credit Investments
The Company makes investments in unconsolidated entities that construct, own and operate solar generation facilities. An unrelated third party is the managing member and has control over the significant activities of the variable interest entities ("VIE"). The Company generates a return through the receipt of tax credits allocated to the projects, as well as operational distributions. The primary risk of loss is generally mitigated by policies requiring that the project qualify for the expected tax credits prior to the Company making its investment. Any loans to the VIE are secured. As of December 31, 2023, the Company's maximum exposure to loss is $61.2 million.
| December 31, 2023 | December 31, 2022 | ||||||||||
| (In thousands) | |||||||||||
| Unconsolidated Variable Interest Entities | |||||||||||
| Tax credit investments included in equity investments | $ | $ | |||||||||
| Loans and letters of credit commitments | |||||||||||
| Funded portion of loans and letters of credit commitments | |||||||||||
The following table summarizes the tax benefits conveyed by the Company’s solar generation VIE investments:
| Year Ended | |||||||||||
| December 31, | |||||||||||
| 2023 | 2022 | ||||||||||
| (In thousands) | |||||||||||
| Tax credits and other tax benefits recognized | $ | $ | |||||||||
134
Notes to the Consolidated Financial Statements | ||
19. PARENT COMPANY ONLY CONDENSED FINANCIAL INFORMATION
Condensed financial information of Amalgamated Financial Corp. follows:
| CONDENSED BALANCE SHEET | |||||||||||
| December 31, 2023 | December 31, 2022 | ||||||||||
| (in thousands) | |||||||||||
| ASSETS | |||||||||||
| Cash and cash equivalents | $ | $ | |||||||||
| Investment in banking subsidiary | |||||||||||
| Other assets | |||||||||||
| Total assets | $ | $ | |||||||||
| LIABILITIES AND EQUITY | |||||||||||
| Subordinated debt | $ | $ | |||||||||
| Accrued expense and other liabilities | |||||||||||
| Stockholders' equity | |||||||||||
| Total liabilities and stockholders' equity | $ | $ | |||||||||
| CONDENSED STATEMENTS OF INCOME AND COMPREHENSIVE INCOME | |||||||||||||||||
| Year Ended December 31, | |||||||||||||||||
| 2023 | 2022 | 2021 | |||||||||||||||
| (in thousands) | |||||||||||||||||
| Dividends from subsidiaries | $ | $ | $ | ||||||||||||||
| Other income | |||||||||||||||||
| Equity in undistributed subsidiary income | |||||||||||||||||
| Interest expense | |||||||||||||||||
| Other expense | |||||||||||||||||
| Income before tax expense | |||||||||||||||||
| Income tax benefit | ( | ||||||||||||||||
| Net income | $ | $ | $ | ||||||||||||||
| Comprehensive income (loss) | $ | $ | ( | $ | |||||||||||||
135
Notes to the Consolidated Financial Statements | ||
| CONDENSED STATEMENT OF CASH FLOWS | |||||||||||||||||
| Year Ended December 31, | |||||||||||||||||
| 2023 | 2022 | 2021 | |||||||||||||||
| (in thousands) | |||||||||||||||||
CASH FLOWS FROM OPERATING ACTIVITIES | |||||||||||||||||
| Net income | $ | $ | $ | ||||||||||||||
Adjustments to reconcile net income to net cash provided by operating activities: | |||||||||||||||||
| Equity in undistributed subsidiary income | ( | ( | ( | ||||||||||||||
| Net gain on repurchase of subordinated debt | ( | ( | |||||||||||||||
| Decrease (increase) in other assets | ( | ( | |||||||||||||||
| Increase (decrease) in other liabilities | ( | ( | |||||||||||||||
| Net cash provided by (used in) operating activities | ( | ||||||||||||||||
| Cash flows from investing activities | |||||||||||||||||
| Payments for investments in subsidiaries | ( | ||||||||||||||||
| Net cash provided by (used in) investing activities | ( | ||||||||||||||||
CASH FLOWS FROM FINANCING ACTIVITIES | |||||||||||||||||
| Dividends paid | ( | ( | ( | ||||||||||||||
| Repurchase of common stock | ( | ( | ( | ||||||||||||||
| Proceeds from (repurchases of) subordinated debt | ( | ( | |||||||||||||||
| Proceeds from common stock issued under Employee Stock Purchase Plan | |||||||||||||||||
| Net cash provided by (used in) financing activities | ( | ( | |||||||||||||||
Increase (decrease) in cash and cash equivalents | ( | ||||||||||||||||
Cash and cash equivalents at beginning of year | |||||||||||||||||
Cash and cash equivalents at end of year | $ | $ | $ | ||||||||||||||
136
REPORT OF INDEPENDENT REGISTERED PUBLIC ACCOUNTING FIRM
Stockholders and the Board of Directors of
Amalgamated Financial Corp.
New York, New York
Opinions on the Financial Statements and Internal Control over Financial Reporting
We have audited the accompanying consolidated statements of financial condition of Amalgamated Financial Corp. (the "Company") as of December 31, 2023 and 2022, the related consolidated statements of income, comprehensive income, changes in stockholders’ equity, and cash flows for each of the years in the three-year period ended December 31, 2023, and the related notes (collectively referred to as the "financial statements"). We also have audited the Company’s internal control over financial reporting as of December 31, 2023, based on criteria established in Internal Control – Integrated Framework: (2013) issued by the Committee of Sponsoring Organizations of the Treadway Commission (COSO).
In our opinion, the financial statements referred to above present fairly, in all material respects, the financial position of the Company as of December 31, 2023 and 2022, and the results of its operations and its cash flows for each of the years in the three-year period ended December 31, 2023 in conformity with accounting principles generally accepted in the United States of America. Also in our opinion, the Company maintained, in all material respects, effective internal control over financial reporting as of December 31, 2023, based on criteria established in Internal Control – Integrated Framework: (2013) issued by COSO.
Change in Accounting Principle
As discussed in Notes 1, 2, and 5 to the financial statements, the Company has changed its method of accounting for credit losses effective January 1, 2023 due to the adoption of Accounting Standards Update (“ASU”) No. 2016-13, Financial Instruments – Credit Losses (Topic 326). The Company adopted the new credit loss standard using the modified retrospective method such that prior period amounts are not adjusted and continue to be reported in accordance with previously applicable generally accepted accounting principles. The adoption of the new credit loss standard and its subsequent application is also communicated as a critical audit matter below.
Basis for Opinions
The Company’s management is responsible for these financial statements, for maintaining effective internal control over financial reporting, and for its assessment of the effectiveness of internal control over financial reporting, included in the accompanying Management Report on Internal Control Over Financial Reporting. Our responsibility is to express an opinion on the Company’s financial statements and an opinion on the Company’s internal control over financial reporting based on our audits. We are a public accounting firm registered with the Public Company Accounting Oversight Board (United States) ("PCAOB") and are required to be independent with respect to the Company in accordance with the U.S. federal securities laws and the applicable rules and regulations of the Securities and Exchange Commission and the PCAOB.
We conducted our audits in accordance with the standards of the PCAOB. Those standards require that we plan and perform the audits to obtain reasonable assurance about whether the financial statements are free of material misstatement, whether due to error or fraud, and whether effective internal control over financial reporting was maintained in all material respects.
Our audits of the financial statements included performing procedures to assess the risks of material misstatement of the financial statements, whether due to error or fraud, and performing procedures that respond to those risks. Such procedures included examining, on a test basis, evidence regarding the amounts and disclosures in the financial statements. Our audits also included evaluating the accounting principles used and significant estimates made by management, as well as evaluating the overall presentation of the financial statements. Our audit of internal control over financial reporting included obtaining an understanding of internal control over financial reporting, assessing the risk that a material weakness exists, and testing and evaluating the design and operating effectiveness of internal control based on
137
the assessed risk. Our audits also included performing such other procedures as we considered necessary in the circumstances. We believe that our audits provide a reasonable basis for our opinions.
Definition and Limitations of Internal Control Over Financial Reporting
A company’s internal control over financial reporting is a process designed to provide reasonable assurance regarding the reliability of financial reporting and the preparation of financial statements for external purposes in accordance with generally accepted accounting principles. A company’s internal control over financial reporting includes those policies and procedures that (1) pertain to the maintenance of records that, in reasonable detail, accurately and fairly reflect the transactions and dispositions of the assets of the company; (2) provide reasonable assurance that transactions are recorded as necessary to permit preparation of financial statements in accordance with generally accepted accounting principles, and that receipts and expenditures of the company are being made only in accordance with authorizations of management and directors of the company; and (3) provide reasonable assurance regarding prevention or timely detection of unauthorized acquisition, use, or disposition of the company’s assets that could have a material effect on the financial statements.
Because of its inherent limitations, internal control over financial reporting may not prevent or detect misstatements. Also, projections of any evaluation of effectiveness to future periods are subject to the risk that controls may become inadequate because of changes in conditions, or that the degree of compliance with the policies or procedures may deteriorate.
Critical Audit Matter
The critical audit matter communicated below is a matter arising from the current period audit of the financial statements that was communicated or required to be communicated to the audit committee and that: (1) relates to accounts or disclosures that are material to the financial statements and (2) involved our especially challenging, subjective, or complex judgments. The communication of the critical audit matter does not alter in any way our opinion on the financial statements, taken as a whole, and we are not, by communicating the critical audit matter below, providing a separate opinion on the critical audit matter or on the accounts or disclosures to which it relates.
Allowance for Credit Losses for Loans – Model Design and Qualitative Factors
As described in Notes 1, 2, and 5 to the financial statements and referred to in the change in accounting principle explanatory paragraph above, on January 1, 2023 (“adoption date”), the Company adopted ASU No. 2016-13, Financial Instruments – Credit Losses (Topic 326) under a modified retrospective approach, which required the Company to estimate expected credit losses for its financial assets carried at amortized cost utilizing the current expected credit loss (“CECL”) methodology.
Management estimates the ACL on each loan pool using relevant available information, from internal and external sources, relating to past events, current conditions, and reasonable and supportable forecasts. The quantitative component of the allowance model calculates expected credit losses by considering the loan segment baseline loss rate, generally based on a peer group, and severity rate. Expected credit losses are estimated over the contractual term of the loans, adjusted for forecasted prepayments when appropriate. The baseline loss rate is adjusted for relevant macroeconomic variables by loan segment that consider forecasted economic conditions. The loan level cash flows are discounted at the effective interest rate to calculate a loan level allowance which is aggregated at the loan segment level to arrive at the quantitative component of the allowance. Adjustments to the quantitative results are made using qualitative factors. These factors include: (1) borrower's financial condition; (2) borrower's ability to pay; (3) nature and volume of financial assets; (4) value of the underlying collateral; (5) lending policies and procedures; (6) quality of the loan review system; (7) the experience, ability, and depth of staff; (8) regulatory and legal environment; (9) changes in market conditions; and (10) changes in economic conditions.
We identified the auditing of the model design and the qualitative factors related to the ACL as a critical audit matter. With the adoption of ASC 326, a new loss estimation model was developed, and a significant amount of judgment was required to evaluate the conceptual soundness in the design of the quantitative model. In addition, qualitative factors are subjective and require significant management judgment in their determination and significant auditor judgment in the evaluation of their reasonableness.
138
The primary procedures we performed to address the critical audit matter included:
•Testing the effectiveness of controls over the evaluation of the conceptual design and construction of the models and the evaluation of the qualitative factors, including controls addressing:
◦Management’s judgments in the design of the quantitative and qualitative models.
◦Management’s reconciliation and testing of loan data inputs to the models.
◦Management’s review of the results of the third-party model validation.
◦Management’s review and approval of the qualitative factors.
•Substantively testing management’s process related to the conceptual design and construction of the models and determination of qualitative factors, which included:
◦Evaluation, with the assistance of internal specialists, of the reasonableness of management’s judgments related to the conceptual design and construction of the models.
◦Evaluation of the relevance and reliability of data utilized in the quantitative and qualitative models, including reconciliation and testing of loan data inputs.
◦Evaluation of the reasonableness of management’s judgments related to qualitative factors to determine if they are calculated to conform with management’s policies and were consistently applied from the point of adoption to year end.
/s/ Crowe LLP
We have served as the Company's auditor since 2020.
New York, New York
March 7, 2024
139
Item 9. Changes in and Disagreements with Accountants on Accounting and Financial Disclosure.
None.
Item 9A. Controls and Procedures.
Evaluation of Disclosure Controls and Procedures
Our Chief Executive Officer (principal executive officer) and Chief Financial Officer (principal financial officer), with the participation of other members of management, have evaluated the effectiveness of our disclosure controls and procedures (as defined in Rules 13a-15(e) and 15d-15(e)) under the Exchange Act, as of the end of the period covered by this report. Based on such evaluations, our Chief Executive Officer and Chief Financial Officer concluded that, as of such date, our disclosure controls and procedures were effective (at the reasonable assurance level) to ensure that the information required to be included in this report has been recorded, processed, summarized and reported within the time periods specified in the SEC’s rules and forms and to ensure that the information required to be included in this report was accumulated and communicated to management, including our Chief Executive Officer and Chief Financial Officer, to allow timely decisions regarding required disclosure.
Changes in Internal Control over Financial Reporting
There were no changes in our internal control over financial reporting during the quarter ended December 31, 2023 that have materially affected, or are reasonably likely to materially affect, our internal control over financial reporting.
Management Report on Internal Control over Financial Reporting
Our management is responsible for establishing and maintaining adequate internal control over financial reporting as defined in Rule 13a-15(f) under the Exchange Act. Internal control over financial reporting is a process to provide reasonable assurance regarding the reliability of our financial reporting for external purposes in accordance with accounting principles generally accepted in the United States. Because of its inherent limitations, internal control over financial reporting may not prevent or detect misstatements. Projections of any evaluation of effectiveness to future periods are subject to the risk that controls may become inadequate because of changes in conditions, or that the degree of compliance with the policies or procedures may deteriorate.
Our management, including the Chief Executive Officer and Chief Financial Officer, assessed the effectiveness of our internal control over financial reporting as of December 31, 2023. In making this assessment, we used the criteria set forth by the Committee of Sponsoring Organizations of the Treadway Commission (“COSO”) in Internal Control-Integrated Framework (2013). Based on such assessment our management has concluded that, as of December 31, 2023, our internal control over financial reporting was effective based on those criteria.
The Company’s independent registered public accounting firm that audited the financial statements that are included in this annual report on Form 10-K, has issued an attestation report on the Company’s internal control over financial reporting. The attestation report of Crowe LLP appears on page 137.
Item 9B. Other Information.
Securities Trading Plans
On December 13, 2023 , Sam Brown , Senior Executive Vice President, Chief Banking Officer , adopted a Rule 10b5-1 trading arrangement that is intended to satisfy the affirmative defense of Rule 10b5-1(c) for the sale of up to 31,250 shares of the Company’s common stock, net of shares to be withheld for the exercise price and for taxes upon the exercise or vesting of underlying stock awards, with such transactions to occur during sale periods beginning on or after March 13, 2024 and ending on the earlier of March 12, 2025 or the date on which all shares authorized for sale have been sold in conformance with the terms of the arrangement.
On December 14, 2023 , Jason Darby , Senior Executive Vice President, Chief Financial Officer , adopted a Rule 10b5-1 trading arrangement that is intended to satisfy the affirmative defense of Rule 10b5-1(c) for the sale of up to 4,000 shares of the Company’s common stock, with such transactions to occur during sale periods beginning on or after March 14, 2024 and ending on the earlier of March 13, 2025 or the date on which all shares authorized for sale have been sold in conformance with the terms of the arrangement.
Item 9C. Disclosures Regarding Foreign Jurisdiction that Prevent Inspection
Not applicable.
140
PART III
Item 10. Directors, Executive Officers and Corporate Governance.
The information required to be disclosed by this item will be disclosed in the Company’s definitive proxy statement to be filed with the SEC no later than 120 days after December 31, 2023 and in connection with our 2024 Annual Meeting of Stockholders under the following captions, which sections are incorporated herein by reference:
•“Proposal 1—“Election of Directors” under the subsection titled “Biographical Information” and “Biographical Information for Our Executive Officers”;
•“Corporate Governance and Social Responsibility” under the subsections titled “Family Relationships,” “Code of Business Conduct and Ethics,” “Nominations of Directors,” and “Audit Committee;” and
•“Delinquent Section 16(a) Reports.”
Item 11. Executive Compensation.
The information required to be disclosed by this item will be disclosed in the Company’s definitive proxy statement to be filed with the SEC no later than 120 days after December 31, 2023 and in connection with our 2024 Annual Meeting of Stockholders under the following captions, which sections are incorporated herein by reference:
•“Director and Executive Officer Compensation”;
•“Compensation Committee Report”; and
•“Corporate Governance and Social Responsibility” under the subsections titled “Compensation Committee Interlocks and Insider Participation.”
Item 12. Security Ownership of Certain Beneficial Owners and Management and Related Stockholder Matters.
The information required to be disclosed by this item will be disclosed in the Company’s definitive proxy statement to be filed with the SEC no later than 120 days after December 31, 2023 and in connection with our 2024 Annual Meeting of Stockholders under the following captions, which sections are incorporated herein by reference:
•“Security Ownership of Certain Beneficial Owners and Management”; and
•“Equity Compensation Plan Information”
Item 13. Certain Relationships and Related Transactions, and Director Independence.
The information required to be disclosed by this item will be disclosed in the Company’s definitive proxy statement to be filed with the SEC no later than 120 days after December 31, 2023 and in connection with our 2024 Annual Meeting of Stockholders under the following captions, which sections are incorporated herein by reference:
•“Certain Relationships and Related Party Transactions”; and
•“Corporate Governance and Social Responsibility” under the subsections titled “Director Independence.”
Item 14. Principal Accounting Fees and Services.
The information required to be disclosed by this item will be disclosed in the Company’s definitive proxy statement to be filed with the SEC no later than 120 days after December 31, 2023 and in connection with our 2024 Annual Meeting of Stockholders under the caption “Ratification of Appointment of Independent Registered Public Accounting Firm” under the subsections titled “Audit and Related Fees” and “Pre-Approval Policy,” which sections are incorporated herein by reference.
141
PART IV
Item 15. Exhibits, Financial Statement Schedules.
A list of financial statements filed herewith is contained in Part II, Item 8, “Financial Statements and Supplementary Data,” above of this Annual Report on Form 10-K and is incorporated by reference herein. The financial statement schedules have been omitted because they are not required, not applicable or the information has been included in our consolidated financial statements. The exhibits required by this Item are contained in the Exhibit Index on page 143 of this Annual Report on Form 10-K and are incorporated herein by reference.
Item 16. Form 10-K Summary.
None.
142
EXHIBIT INDEX
| Exhibit No. | Description of Exhibit | |||||||
| 3.1 | ||||||||
| 3.2 | ||||||||
| 4.1 | ||||||||
| 4.2 | ||||||||
| 4.3 | ||||||||
| 4.4 | See Exhibits 3.1 and 3.2 for provisions of the Amended and Restated Organization Certificate and Bylaws of Amalgamated Financial Corp. defining rights of the holders of common stock of Amalgamated Financial Corp. | |||||||
| 4.5 | The registrant agrees to provide the SEC, upon request, copies of instruments defining the rights of holders of long-term debt of the registrant and its consolidated subsidiaries; currently no issuance of debt of the registrant exceeds 10% of the assets of the registrant and its subsidiaries on a consolidated basis. | |||||||
| 4.6 | ||||||||
| 4.7 | ||||||||
| 4.8 | ||||||||
| 4.9 | ||||||||
| 10.1 | ||||||||
| 10.2 | ||||||||
| 10.3 | ||||||||
| 10.4 | ||||||||
| 10.5 | ||||||||
| 10.6 | ||||||||
143
| 10.7 | ||||||||
| 10.8 | ||||||||
| 10.9 | ||||||||
| 10.10 | ||||||||
| 10.11 | ||||||||
| 10.12 | ||||||||
| 10.13 | ||||||||
| 10.14 | ||||||||
| 10.15 | ||||||||
| 10.16 | ||||||||
| 10.17 | ||||||||
| 10.18 | ||||||||
| 10.19 | ||||||||
| 10.20 | ||||||||
| 10.21 | ||||||||
| 10.22 | ||||||||
| 10.23 | ||||||||
144
| 10.24 | ||||||||
| 10.25 | ||||||||
| 21.1 | ||||||||
| 23.1 | ||||||||
| 24.1 | ||||||||
| 31.1 | ||||||||
| 31.2 | ||||||||
| 32.1 | ||||||||
| 97.1 | ||||||||
| 101 | The following financial statements from the Annual Report on Form 10-K of Amalgamated Financial Corp., formatted in iXBRL (Inline eXtensible Business Reporting Language): (i) Consolidated Statements of Financial Condition at December 31, 2023 and December 31, 2022, (ii) Consolidated Statements of Income for the years ended December 31, 2023, 2022, and 2021, (iii) Consolidated Statements of Comprehensive Income for the years ended December 31, 2023, 2022, and 2021, (iv) Consolidated Statements of Changes in Stockholders’ Equity for the years ended December 31, 2023, 2022, and 2021, (v) Consolidated Statements of Cash Flows for the years ended December 31, 2023, 2022, and 2021 and (vi) Notes to Consolidated Financial Statements. | |||||||
| 104 | The cover page of Amalgamated Financial Corp.’s Form 10-K Report for the year ended December 31, 2023, formatted in iXBRL (included with the Exhibit 101 attachments). | |||||||
* Management contract or compensatory plan or arrangement.
** Filed herewith.
145
SIGNATURES
Pursuant to the requirements of the Securities Exchange Act of 1934, the registrant has duly caused this report to be signed on its behalf by the undersigned thereunto duly authorized.
AMALGAMATED FINANCIAL CORP.
| March 7, 2024 | By: | /s/ Priscilla Sims Brown | |||||||||
| Priscilla Sims Brown | |||||||||||
| President and Chief Executive Officer | |||||||||||
(Principal Executive Officer) | |||||||||||
POWER OF ATTORNEY
KNOW ALL PERSONS BY THESE PRESENTS, that each person whose signature appears below constitutes and appoints Priscilla Sims Brown, his or her true and lawful attorney-in-fact and agent, with full power of substitution and resubstitution, for him or her and in his or her name, place and stead, in any and all capacities, to sign any and all amendments to this Annual Report on Form 10-K, and to file the same, with all exhibits thereto, and other documents in connection therewith, with the U.S. Securities and Exchange Commission, granting unto such attorney-in-fact and agent full power and authority to do and perform each and every act and thing requisite or necessary to be done in and about the premises, as fully to all intents and purposes as he or she might or could do in person, hereby ratifying and confirming all that such attorney-in-fact and agent, or his or her substitute or substitutes, may lawfully do or cause to be done by virtue hereof.
Pursuant to the requirements of the Securities Exchange Act of 1934, this report has been signed below by the following persons on behalf of the registrant and in the capacities and on the dates indicated.
146
Signature | Title | Date | ||||||||||||||||||
| /s/ Lynne P. Fox | Director and Chair of the Board | March 7, 2024 | ||||||||||||||||||
| Lynne P. Fox | ||||||||||||||||||||
/s/ Priscilla Sims Brown | Director, President and Chief Executive Officer (Principal Executive Officer) | March 7, 2024 | ||||||||||||||||||
Priscilla Sims Brown | ||||||||||||||||||||
/s/ Maryann Bruce | Director | March 7, 2024 | ||||||||||||||||||
Maryann Bruce | ||||||||||||||||||||
/s/ Mark A. Finser | Director | March 7, 2024 | ||||||||||||||||||
Mark A. Finser | ||||||||||||||||||||
| /s/ Darrell Jackson | Director | March 7, 2024 | ||||||||||||||||||
| Darrell Jackson | ||||||||||||||||||||
/s/ Julie Kelly | Director | March 7, 2024 | ||||||||||||||||||
Julie Kelly | ||||||||||||||||||||
/s/ JoAnn Lilek | Director | March 7, 2024 | ||||||||||||||||||
JoAnn Lilek | ||||||||||||||||||||
/s/ John McDonagh | Director | March 7, 2024 | ||||||||||||||||||
John McDonagh | ||||||||||||||||||||
| /s/ Meredith Miller | Director | March 7, 2024 | ||||||||||||||||||
| Meredith Miller | ||||||||||||||||||||
/s/ Robert G. Romasco | Director | March 7, 2024 | ||||||||||||||||||
Robert G. Romasco | ||||||||||||||||||||
/s/ Edgar Romney, Sr. | Director | March 7, 2024 | ||||||||||||||||||
Edgar Romney, Sr. | ||||||||||||||||||||
/s/ Julieta Ross | Director | March 7, 2024 | ||||||||||||||||||
Julieta Ross | ||||||||||||||||||||
/s/ Scott Stoll | Director | March 7, 2024 | ||||||||||||||||||
Scott Stoll | ||||||||||||||||||||
| /s/ Jason Darby | Chief Financial Officer (Principal Financial Officer) | March 7, 2024 | ||||||||||||||||||
| Jason Darby | ||||||||||||||||||||
/s/ Leslie Veluswamy | Chief Accounting Officer (Principal Accounting Officer) | March 7, 2024 | ||||||||||||||||||
Leslie Veluswamy | ||||||||||||||||||||
147