UNITED STATES
SECURITIES AND EXCHANGE COMMISSION
WASHINGTON, D.C. 20549
_________________________________
FORM 10-K
_________________________________
| ANNUAL REPORT PURSUANT TO SECTION 13 or 15(d) OF THE SECURITIES EXCHANGE ACT OF 1934 | |||||
For the fiscal year ended March 2 , 2024
| TRANSITION REPORT PURSUANT TO SECTION 13 or 15(d) OF THE SECURITIES EXCHANGE ACT OF 1934 | |||||
For the transition period from to
Commission File Number: 0-6365
_________________________________
(Exact name of registrant as specified in its charter)
_________________________________
| (State or other jurisdiction of incorporation or organization) | (I.R.S. Employer Identification No.) | ||||||||||||||||
| (Address of principal executive offices) | (Zip Code) | ||||||||||||||||
Registrant’s telephone number, including area code: (952 ) 835-1874
Securities registered pursuant to Section 12(b) of the Act:
| Title of each class | Trading Symbol(s) | Name of each exchange on which registered | ||||||||||||||||||
Securities registered pursuant to Section 12(g) of the Act: None
________________________________
Indicate by check mark if the registrant is a well-known seasoned issuer, as defined in Rule 405 of the Securities Act.
☒ Yes ☐ No
Indicate by check mark if the registrant is not required to file reports pursuant to Section 13 or Section 15(d) of the Act.
☐ Yes ☒ No
Indicate by check mark whether the registrant (1) has filed all reports required to be filed by Section 13 or 15(d) of the Securities Exchange Act of 1934 during the preceding 12 months (or for such shorter period that the registrant was required to file such reports), and (2) has been subject to such filing requirements for the past 90 days. ☒ Yes ☐ No
Indicate by check mark whether the registrant has submitted electronically every Interactive Data File required to be submitted pursuant to Rule 405 of Regulation S-T during the preceding 12 months (or for such shorter period that the registrant was required to submit such files). ☒ Yes ☐ No
Indicate by check mark whether the registrant is a large accelerated filer, an accelerated filer, a non-accelerated filer, smaller reporting company or an emerging growth company. See the definitions of “large accelerated filer,” “accelerated filer,” “smaller reporting company” and “emerging growth company” in Rule 12b-2 of the Exchange Act.
| ☒ | Accelerated Filer | ☐ | ||||||||||||||||||
| Non-accelerated Filer | ☐ | Smaller Reporting Company | ||||||||||||||||||
| Emerging Growth Company | ||||||||||||||||||||
| If an emerging growth company, indicate by check mark if the registrant has elected not to use the extended transition period for complying with any new or revised financial accounting standards provided pursuant to Section 13(a) of the Exchange Act. | ☐ | |||||||||||||||||||
Indicate by check mark whether the registrant has filed a report on and attestation to its management's assessment of the effectiveness of its internal control over financial reporting under Section 404(b) of the Sarbanes-Oxley Act (15 U.S.C. 7262(b)) by the registered public accounting firm that prepared or issued its audit report. ☒
If securities are registered pursuant to Section 12(b) of the Act, indicate by check mark whether the financial statements of the registrant included in the filing reflect the correction of an error to previously issued financial statements. ☐
Indicate by check mark whether any of those error corrections are restatements that required a recovery analysis of incentive-based compensation received by any of the registrant's executive officers during the relevant recovery period pursuant to §240.10D-1(b). ☐
Indicate by check mark whether the registrant is a shell company (as defined in Rule 12b-2 of the Exchange Act). ☐ Yes ☒ No
As of August 25, 2023, the last business day of the registrant's most recently completed second fiscal quarter, the approximate aggregate market value of voting and non-voting common equity held by non-affiliates of the registrant was $1,075,300,000 (based on the closing price of $49.87 per share as reported on The Nasdaq Stock Market as of that date).
As of April 22, 2024, 22,128,308 shares of the registrant’s common stock, par value $0.33 1/3 per share, were outstanding.
DOCUMENTS INCORPORATED BY REFERENCE:
In accordance with General Instruction G(3) of Form 10-K, certain information required by Part III hereof will either be incorporated into this Annual Report on Form 10-K by reference to our Definitive Proxy Statement for our Annual Meeting of Shareholders filed within 120 days of our fiscal year ended March 2, 2024 or will be included in an amendment to this Annual Report on Form 10-K filed within 120 days of March 2, 2024.
APOGEE ENTERPRISES, INC.
Annual Report on Form 10-K
For the fiscal year ended March 2, 2024
TABLE OF CONTENTS
| Page | ||||||||
3
Forward-Looking Statements
This Annual Report on Form 10-K, including “Management's Discussion and Analysis of Financial Condition and Results of Operations” in Part II, Item 7, contains certain statements that are considered “forward-looking statements” within the meaning of the Private Securities Litigation Reform Act of 1995. These statements reflect our current views with respect to future events and financial performance. Forward-looking statements generally can be identified by the use of forward-looking terminology such as “may,” “believe,” “expect,” “anticipate,” “intend,” “estimate,” “forecast,” “project,” “should,” "will," "continue" or similar words or expressions. All forecasts and projections in this document are “forward-looking statements,” and are based on management's current expectations or beliefs of the Company's near-term results, based on current information available pertaining to the Company, including the risk factors noted under Item 1A in this Form 10-K. From time to time, we also may provide oral and written forward-looking statements in other materials we release to the public, such as press releases, presentations to securities analysts or investors, or other communications by the Company. Any or all of our forward-looking statements in this report and in any public statements we make could be materially different from actual results.
Accordingly, we wish to caution investors that any forward-looking statements made by or on behalf of the Company are subject to uncertainties and other factors that could cause actual results to differ materially from such statements. These uncertainties and other risk factors include, but are not limited to, the risks and uncertainties set forth under Item 1A in this Form 10-K, all of which are incorporated by reference into Item 7.
We wish to caution investors that other factors might in the future prove to be important in affecting the Company's results of operations. New factors emerge from time to time; it is not possible for management to predict all such factors, nor can it assess the impact of each such factor on the business or the extent to which any factor, or a combination of factors, may cause actual results to differ materially from those contained in any forward-looking statements. We undertake no obligation to update publicly or revise any forward-looking statements, whether as a result of new information, future events or otherwise.
4
PART I
ITEM 1. BUSINESS
The Company
Apogee Enterprises, Inc. (Apogee, we, us, our or the Company) was incorporated under the laws of the State of Minnesota in 1949. We are a leading provider of architectural products and services for enclosing buildings, and high-performance glass and acrylic products used in applications for preservation, protection and enhanced viewing.
We have four reporting segments, with three of the four segments serving the non-residential construction market, and the fourth serving the custom framing and fine art market:
•The Architectural Framing Systems Segment designs, engineers, fabricates and finishes aluminum window, curtainwall, storefront and entrance systems for the exterior of buildings. In fiscal 2024, this segment accounted for approximately 42% of our net sales.
•The Architectural Glass Segment coats and fabricates high-performance glass used in custom window and wall systems on non-residential buildings. In fiscal 2024, this segment accounted for approximately 24% of our net sales.
•The Architectural Services Segment integrates technical services, project management, and field installation services to design, engineer, fabricate, and install building glass and curtainwall systems. In fiscal 2024, this segment accounted for approximately 27% of our net sales.
•The Large-Scale Optical (LSO) Segment manufactures high-performance glazing products for the custom framing, fine art, and engineered optics markets. In fiscal 2024, this segment accounted for approximately 7% of our net sales.
Strategy
Our enterprise strategy is based on the following three key elements:
1.Become the economic leader in our target markets. We are developing a deep understanding of our target markets and align our businesses with clear go-to-market strategies to drive value for our customers through differentiated product and service offerings. We will focus on operational execution, driving productivity improvements, and maintaining a competitive cost structure, so that we may bring more value to our customers and improve our own profitability.
2.Actively manage our portfolio to drive higher margins and returns. We are shifting our business mix toward higher operating margin offerings in order to improve our return on invested capital performance. We expect to accomplish this by allocating resources to grow our top performing businesses, actively addressing underperforming businesses, and investing to add new differentiated product and service offerings to accelerate our growth and increase margins.
3.Strengthen our core capabilities. We are shifting from our historical, decentralized operating model, to one with center-led functional expertise that enables us to leverage the scale of the enterprise to better support the needs of the business. In fiscal 2022, we established a Company-wide operating system with common tools and processes based on the foundation of Lean and Continuous Improvement, which we call the "Apogee Management System". Our strategy is supported by a robust talent management program and a commitment to strong governance to ensure compliance and drive sustainable performance.
We set this strategy by developing a deep knowledge of the markets we serve and by gaining extensive input from customers and industry influencers, along with detailed competitive benchmarking. We continually analyze our portfolio of products, services, and capabilities to identify the best areas for future profitable growth. We also evaluate our operating model to ensure we have the organizational structure and capabilities needed to deliver consistent profitable growth. Through this work, we validate strengths that we can leverage and identify opportunities to improve our performance.
We have made significant progress against our strategy and will continue to identify opportunities to build upon it. To measure our progress, we established three consolidated enterprise financial targets:
•Adjusted Return on Invested Capital (ROIC)1 greater than 12%
•Adjusted operating margin1 greater than 10%
•Revenue growth greater than 1.2 times the overall non-residential construction market.
1 Adjusted ROIC and adjusted operating margin are non-GAAP measures. See discussion of non-GAAP measures within the Overview section of Management's Discussion and Analysis.
5
In fiscal 2024, we drove further progress toward our strategic goals and financial targets. We continued the deployment of the Apogee Management System across our business, supporting sustainable cost and productivity improvements. We invested in organic growth initiatives, including capacity expansion in the Large-Scale Optical Segment and geographic growth in Architectural Services. We increased our focus on differentiated products and services, and continued to diversify the mix of architectural projects that we serve while leaning more heavily into higher, value-added products. We also advanced several initiatives to strengthen our core capabilities, driving the standardization of key business processes and systems, and strengthening talent management and leadership development programs.
Products and Services
Architectural Framing Systems, Architectural Glass and Architectural Services Segments
These three segments primarily serve the non-residential construction industry and participate in various phases of the value stream to design, engineer, fabricate and install custom glass and aluminum window, curtainwall, storefront and entrance systems for the exterior of buildings, primarily in the non-residential construction sectors.
Our product and service offerings across these architectural segments allow architects to create distinctive looks for buildings in the non-residential construction industry such as healthcare facilities, government buildings, office towers, hotels, education and athletic facilities, retail centers, transportation centers, mixed use and multi-family residential buildings. Our solutions also help meet functional requirements such as energy efficiency, hurricane, blast and other impact resistance and sound control.
Many of our architectural products and services help architects, developers, and building owners achieve their energy-efficiency and sustainability goals by improving energy performance, reducing greenhouse gas emissions, providing daylight and natural ventilation, and increasing comfort and safety for occupants. These architectural products include high-performance thermal framing systems, energy efficient glass coatings, and sun control products such as sunshades and light shelves. Many of our framing systems products can be specified with recycled aluminum content and utilize environmentally friendly anodize and paint finishes. In addition, we offer renovation solutions to help modernize aging buildings, providing significantly improved energy performance, while preserving historically accurate aesthetics.
Architectural Framing Systems Segment
Our Architectural Framing Systems Segment designs, engineers and fabricates aluminum windows, storefront and entrance systems. We also extrude aluminum and provide finishing services for metal components used in a variety of building materials applications, as well as plastic components for other markets.
Architectural Glass Segment
Our Architectural Glass Segment provides a wide range of high-performance glass products, offering customized solutions that enable architects and building owners to meet their design, aesthetic, and performance goals. We fabricate insulating, laminated, and monolithic glass units that are used in windows, curtainwall, storefront, and entrance systems. We provide premium glass solutions to meet our customers’ design and energy-performance requirements. These include proprietary, high-performance coatings, digital and silkscreen printing, heat-soaking of tempered glass, and thermal spacers.
Architectural Services Segment
Our Architectural Services Segment delivers value by integrating technical capabilities, project management skills and field installation services, to provide design, engineering, fabrication and installation for the exteriors of non-residential buildings. Our ability to efficiently design high-quality window and curtainwall systems and effectively manage the installation of building façades enables our customers to meet schedule and cost requirements of their projects.
LSO Segment
The LSO Segment provides coated glass and acrylic primarily for use in custom picture framing, museum framing, wall decor and technical glass and acrylic for other display applications. Products vary based on size and coatings to provide conservation-grade UV protection, anti-reflective and anti-static properties and/or security features.
6
Product Demand and Distribution Channels
Architectural Framing Systems, Architectural Glass and Architectural Services Segments
Demand for the products and services offered by our architectural segments is not only impacted by general economic conditions, but has historically been affected by changes in the North American non-residential construction industry, which is cyclical in nature.
We look to several external indicators to analyze potential demand for our products and services, such as U.S. and Canadian job growth, office vacancy rates, credit and interest rates, architectural billing indices, and material costs. We also rely on internal indicators to analyze demand, including our sales pipeline, which is made up of contracts in review, projects awarded or committed, and bidding activity. Our sales pipeline, together with ongoing feedback, analysis and data from our customers, architects and building owners, provides visibility into near- and medium-term demand. Additionally, we evaluate data on U.S. and Canadian non-residential construction market activity, industry analysis and longer-term trends provided by external data sources.
Our architectural products and services are used in subsets of the non-residential construction industry differentiated by the following factors:
•Building type - Our products and services are primarily used in commercial buildings (office buildings, hotels and retail centers), institutional buildings (education facilities, health care facilities and government buildings), transportation facilities (airports and transit terminals), and multi-family residential buildings (a subset of residential construction).
•Level of customization - Many of our projects involve a high degree of customization, as the product or service is designed or fabricated to meet customer-specified requirements for aesthetics, performance and size, and local building codes.
•Customers and distribution channels - Our customers are mainly glazing subcontractors and general contractors, with project design being influenced by architects and building owners. Our windows, curtainwall, storefront and entrance systems are sold using a combination of direct sales forces and independent sales representatives and distributors. Our installation services are sold by a direct sales force in certain metropolitan areas in the U.S and Canada. Our high-performance architectural glass is sold using both a direct sales force and independent sales representatives.
•Geographic location - We primarily supply architectural glass products and aluminum framing systems, including window, curtainwall, storefront and entrance systems, to customers in North America. We are one of only a few architectural glass installation service companies in the U.S. to have a national presence and we have the ability to provide installation project management throughout the U.S. and Canada.
LSO Segment
In our LSO Segment, we have a leading brand of value-added coated glass and acrylic used in the custom picture-framing market, museum market, and various technical glass applications. Under the Tru Vue brand, products are sold primarily in North America through national and regional retail chains using a direct sales force, as well as to local retailers through an independent distribution network. We have a global distribution network and supply our products to museums, galleries and other customers outside of North America, including Europe and Asia.
Competitive Conditions
The North American non-residential construction market is highly fragmented. Competitive factors include price, product quality, product attributes and performance, reliable service, on-time delivery, lead-time, warranties, and the ability to provide project management, technical engineering and design services. To protect and improve our competitive position, we maintain strong relationships with building owners, architects, and other stakeholders who influence the selection of products and services on a project, and with general contractors, who initiate projects and develop specifications.
Architectural Framing Systems Segment
Our Architectural Framing Systems Segment competes against several national, regional, and local aluminum window and storefront manufacturers, as well as regional finishing companies. Our businesses compete by providing a broad portfolio of high-quality products, robust engineering capabilities, a vertically integrated manufacturing model, and dependable, short lead-time service.
7
Architectural Glass Segment
In our Architectural Glass Segment, we compete with regional glass fabricators and international competitors who can provide certain products with attributes similar to ours. We differentiate by providing a wide range of high-quality products, including several proprietary offerings, that we can bundle together into customized solutions. We maintain strong relationships with architects, developers, and other industry stakeholders, and provide strong customer service and reliable delivery.
Architectural Services Segment
Our Architectural Services Segment competes against international, national and regional glass installation companies. We compete by offering a robust set of capabilities at a competitive cost. Our capabilities include preconstruction services, engineering and design, project management, manufacturing, and field installation. We deliver these services using an operating model that is designed to reduce costs and risk for our customers, and we have established a track record of regularly meeting each project's unique execution requirements.
LSO Segment
Our LSO Segment competes primarily with European, U.S., and Asia Pacific providers of both basic and valued-added glass and acrylic. Our competitive strengths include innovative proprietary products and process technologies, a highly automated manufacturing model, innovative marketing programs, strong customer relationships, and an established distribution network.
Warranties
We offer product and service warranties that we believe are competitive for the markets in which our products and services are sold. The nature and extent of these warranties depend upon the product or service, the market and, in some cases, the customer being served. Our standard warranties are generally from two to 12 years for our curtainwall, window system and architectural glass products, while we generally offer warranties of two years or less on our other products and services.
Sources and Availability of Raw Materials
Materials used in the Architectural Framing Systems Segment include aluminum billet and extrusions, fabricated glass, plastic extrusions, hardware, paint and chemicals. Within the Architectural Services Segment, materials used include fabricated glass, finished aluminum extrusions, fabricated metal panels and hardware. Raw materials used within the Architectural Glass Segment include flat glass, vinyl, silicone sealants and lumber. Materials used in the LSO Segment are primarily glass and acrylic. Most of our raw materials are readily available from a variety of domestic and international sources.
Intellectual Property
We have several patents, trademarks, trade names, trade secrets and proprietary technologies and customer relationships that we believe constitute valuable assets, but we do not regard our business as being materially dependent on any single item or category of intellectual property. We take measures that we believe to be appropriate to protect our intellectual property to the extent such intellectual property can be protected.
Seasonality
Activity in the non-residential construction industry is impacted by the seasonal impact of weather and weather events in our operating locations, with activity in some markets reduced in winter due to inclement weather.
Activity in the non-residential construction industry is impacted by the seasonal impact of weather and weather events in our operating locations, with activity in some markets reduced in winter due to inclement weather.
Working Capital Requirements
Trade and contract-related receivables and other contract assets are the largest components of our working capital. Inventory requirements, mainly related to raw materials, are most significant in our Architectural Framing Systems, Architectural Glass, and LSO Segments.
Compliance with Government Regulations
We are subject to various environmental and occupational safety and health laws and regulations in the U.S. and in other countries in which we operate. These laws and regulations relate to, among other things, our use and storage of hazardous materials in our manufacturing operations and associated air emissions and discharges to surface and underground waters. We have several continuing programs designed to ensure compliance with foreign, federal, state and local environmental and occupational safety and health laws and regulations. We contract with outside vendors to collect and dispose of waste at our production facilities in compliance with applicable environmental laws. In addition, we have procedures in place that enable us to properly manage the regulated materials used in and wastes created by our manufacturing processes. We believe we are currently in material compliance with all such laws and regulations.
Sustainability Focus
As a leading provider of architectural products and services, we are committed to integrating sustainable business practices and environmental stewardship throughout our business. Our company-wide commitment to sustainable business practices is focused on delivering long-term profitable growth while carefully stewarding the resources entrusted to us, and delivering products and services that address our customers’ increased focus on energy efficiency and greenhouse gas reductions.
8
Our architectural products and services are key enablers of green building and sustainable design. We have long been at the forefront of developing innovative products and services that conserve resources and help architects and building owners achieve their sustainability goals, such as attaining Leadership in Energy and Environmental Design (LEED) certifications. Our high-performance thermal framing systems, energy-efficient architectural glass, and other products are designed to help improve building energy efficiency, reduce greenhouse gas emissions, and increase security and comfort for building occupants. Our products are made primarily with glass and aluminum components, which are recyclable at the end of their useful lives. In addition, many of our framing products can be specified with recycled aluminum content.
Our commitment to sustainable business practices and environmental stewardship also extends to our own operations, including incorporating environmentally sustainable manufacturing processes, eliminating waste, and minimizing our resource consumption. During fiscal 2024, we calculated and publicly disclosed our baseline Scope 1 and Scope 2 greenhouse gas emissions, along with data on enterprise-wide energy consumption. We plan to use this data to evaluate new opportunities for reducing our emissions and energy use.
Human Capital Resources
We had approximately 4,400 employees on March 2, 2024, down from 4,900 employees on February 25, 2023, of which 78% are male and 22% are female. As of March 2, 2024, approximately 367, or approximately 8%, of our employees are covered by collective bargaining agreements.
Based on the most recent information available from our latest filing with the U.S. Equal Employment Opportunity Commission, our U.S employees had the following race and ethnicity demographics:
| Employee Demographic | Percent of Total | |||||||
| White | 66% | |||||||
| Hispanic / Latinx | 19% | |||||||
| Black / African American | 8% | |||||||
| Asian | 5% | |||||||
| Multiracial, Native American, Native Hawaiian, and Pacific Islander | 2% | |||||||
Competition for qualified employees in the markets and industries in which we operate is significant, and our success depends on the ability to attract, select, develop and retain a productive and engaged workforce. Investing in our employees and their well-being, offering competitive compensation and benefits, promoting diversity and inclusion, and adopting positive human capital management practices are critical components of our corporate strategy.
Health, Wellness and Safety
The safety of our employees is integral to our Company. Providing a safe and secure work environment is one of our highest priorities and we devote significant time and resources to workplace safety. Our safety programs are designed to comply with stringent regulatory requirements and to meet or exceed best practices in our industry. This commitment requires focus and dedication to fundamental aspects of our business to minimize the risk of accidents, injury, and exposure to health hazards.
In fiscal 2024, we adopted an enterprise-wide health and safety program to build centralized oversight of workplace safety and to actively share best practices across our business. Our Apogee Safety Council meets regularly to review facility-level performance, maintain our policies, and provide short and long-term plans to achieve our ambition of achieving an incident rate of zero.
We utilize a safety culture assessment process along with safety compliance audits to monitor safety programs within our businesses and regularly share best practices. These annual assessments and audits provide suggestions for continuous improvement in safety programs and measure employee engagement. In addition, the programs encourage the development of a proactive, inter-dependent safety culture in which leadership and employees interact to ensure safety is viewed as everyone’s responsibility. Our leadership team and Board of Directors are briefed regularly on our health and safety performance metrics.
We offer comprehensive health and wellness programs for our employees. In addition to standard health programs, including medical insurance and preventive care, we have a variety of resources available to employees relating to physical and mental wellness. We also conduct employee engagement surveys at the site level annually to hear directly from our employees with respect to what we are doing well, in addition to areas where they may need additional support.
9
Diversity, Equity and Inclusion
Our diversity, equity and inclusion program promotes a workplace where each employee’s abilities are recognized, respected, and utilized to further our goals. Our aim is to create an environment where people feel included as a part of a team because of their diversity of outlooks, perspectives, and characteristics, and have an equal opportunity to add value to our Company. We strive to create a culture of inclusion, reduce bias in our talent practices, and invest in and engage with our communities. We conduct diversity and Code of Business Ethics and Conduct trainings with employees and managers annually to define our expectations on creating an inclusive and diverse workplace, where all individuals feel respected and part of a team regardless of their race, national origin, ethnicity, gender, age, religion, disability, sexual orientation or gender identity.
Talent Management and Development
Our talent management program is focused on developing employees and leaders to meet our evolving needs. Employees are able to track and manage their growth through a performance management system and managers actively engage with their employees to provide coaching and feedback, identify training and development opportunities to improve performance in the employee’s current role, and to position the employee for future growth. Training and development opportunities include new-hire training, job specific training, stretch assignments, and safety training. We also offer leadership development opportunities, along with technical training for engineers, designers and sales staff. In addition, we offer an education assistance program in which certain eligible employees receive tuition reimbursement to help defray the costs associated with their continuing education. Our executive leadership and Human Resources teams regularly conduct talent reviews and succession planning to assist with meeting critical talent and leadership needs.
International Sales
Information regarding export and international sales is included in Item 8, Financial Statements and Supplementary Data, within Note 15 of our Consolidated Financial Statements.
Available Information
Our internet address is www.apog.com. Through a link to a third-party content provider, our website provides free access to our Annual Reports on Form 10-K, Quarterly Reports on Form 10-Q, Current Reports on Form 8-K and, if applicable, amendments to those reports filed or furnished pursuant to Section 13(a) or 15(d) of the Securities Exchange Act of 1934, as amended (the Exchange Act), as soon as reasonably practicable after electronic filing such material with, or furnishing it to, the Securities and Exchange Commission (SEC). These reports are also available on the SEC's website at www.sec.gov. Also available on our website are various corporate governance documents, including our Code of Business Ethics and Conduct, Corporate Governance Guidelines, and charters for the Audit, Compensation, and Nominating and Corporate Governance Committees of the Board of Directors.
10
INFORMATION ABOUT OUR EXECUTIVE OFFICERS
| Name | Age | Positions with Apogee Enterprises and Past Experience | ||||||||||||
| Ty R. Silberhorn | 56 | Chief Executive Officer of the Company since January 2021. Prior to joining the Company, Mr. Silberhorn worked for 3M, a diversified global manufacturer and technology company, most recently serving as Senior Vice President of 3M's Transformation, Technologies and Services from April 2019 through December 2020. Prior to this position and since 2001, he held several 3M global business unit leadership roles, serving as Vice President and General Manager for divisions within Safety & Industrial, Transportation & Electronics, and the Consumer business groups. | ||||||||||||
Matt Osberg | 48 | Executive Vice President and Chief Financial Officer of the Company since April 2023. Prior to joining the Company, Mr. Osberg served as Chief Financial Officer at Helen of Troy Limited, a global consumer products company. Previously, Mr. Osberg worked in finance roles at Best Buy Co., Inc. and Ernst & Young LLP. | ||||||||||||
| Curtis Dobler | 59 | Executive Vice President and Chief Human Resources Officer since April 2019. Prior to joining the Company, Mr. Dobler served as Executive Vice President and Chief Human Resources Officer at Associated Materials, Inc., a manufacturer and distributor of exterior residential building products, from 2015 through 2019. | ||||||||||||
| Meghan M. Elliott | 47 | Vice President, General Counsel and Secretary of the Company since June 2020. Prior to this role, Ms. Elliott served as Assistant General Counsel for the Company since 2014. Prior to joining the Company, Ms. Elliott was a partner with Lindquist & Vennum, PLLP (n/k/a Ballard Spahr LLP). | ||||||||||||
| Brent C. Jewell | 50 | President of Apogee's Architectural Glass Segment since October 2023. Prior to this role, Mr. Jewell served as President of Apogee's Architectural Framing Systems segment from August 2019 to October 2023, and as Senior Vice President, Business Development and Strategy for the Company from May 2018 to August 2019. Prior to joining the Company, Mr. Jewell served in multiple Senior leadership positions at Valspar, a developer, manufacturer and distributor of paints and coatings, from 2010 to 2017. | ||||||||||||
| Troy R. Johnson | 50 | President of Apogee’s Architectural Services Segment since March 2020. Prior to this role, Mr. Johnson served in several leadership roles in the Architectural Services segment since 2011. | ||||||||||||
| Nick C. Longman | 52 | President of Apogee's Architectural Framing Systems Segment since October 2023. Prior to this role, Mr. Longman served as President of Apogee's Architectural Glass segment from June 2021 to October 2023. Prior to joining the Company, Mr. Longman served as Chief Executive Officer and Chief Operating Officer for Harvey Building Products, a manufacturer of windows, doors and accessory products, from March 2018 to November 2020 and in various functional and business leadership roles at Colfax Fluid Handling, a diversified technology company, from 2012 to 2018. | ||||||||||||
Jane Boyce | 59 | President of Apogee’s Large-Scale Optical Segment since February 2006. Prior to joining Apogee, Ms. Boyce held general management and marketing leadership roles in consumer packaged goods companies including North American General Manager and Vice President of Marketing for Equal Sweetener (Merisant) and marketing roles with United Signature Foods, Quaker Oats and Kraft Foods. | ||||||||||||
ITEM 1A. RISK FACTORS
Our business faces many risks. Any of the risks discussed below, or elsewhere in this Form 10-K or our other filings with the Securities and Exchange Commission, could have a material adverse impact on our business, financial condition or operating results.
Market and Industry Risks
North American and global economic and industry-related business conditions materially adversely affect our sales and results of operations
Our Architectural Framing Systems, Architectural Glass, and Architectural Services Segments are influenced by North American economic conditions and the cyclical nature of the North American non-residential construction industry. The non-residential construction industry is impacted by macroeconomic trends, such as availability of credit, employment levels, consumer confidence, interest rates and commodity prices. In addition, changes in architectural design trends, demographic trends, and/or remote work trends could impact demand for our products and services. To the extent changes in these factors negatively impact the overall non-residential construction industry, our business, operating results and financial condition could be significantly adversely impacted.
Our LSO Segment primarily depends on the strength of the U.S. retail custom picture framing industry. This industry is heavily influenced by consumer confidence and the conditions of the U.S. economy. A decline in consumer confidence, whether as a result of an economic slowdown, uncertainty regarding the future or other factors, could materially and adversely reflect the operating results of the segment.
11
Global instability and uncertainty arising from events outside of our control, such as significant natural disasters, political crises, public health crises, and/or other catastrophic events could materially adversely affect our results of operations
Natural disasters, political crises, public health crises, and other catastrophic events or other events outside of our control, may negatively impact our facilities or the facilities of third parties on which we depend, have broader adverse impacts on the non-residential construction market, consumer confidence and spending, and/or impact both the well-being of our employees and our ability to operate our facilities. These types of disruptions or other events outside of our control could affect our business negatively, cause delays or cancellation of non-residential construction projects or cause us to temporarily close our facilities, harming our operating results. In addition, if any of our facilities, including our manufacturing, finishing or distribution facilities, or the facilities of our suppliers, third-party service providers, or customers, is affected by natural disasters, political crises, public health crises, or other catastrophic events or events outside of our control, our business and operating results could be materially impacted.
New competitors or specific actions of our existing competitors could materially harm our business
We operate in competitive industries in which the actions of our existing competitors or new competitors could result in loss of customers and/or market share. Changes in our competitors' products, prices or services could negatively impact our share of demand and our operating results.
Our LSO Segment competes with several specialty glass manufacturers and acrylic suppliers. If these competitors are able to successfully improve their product attributes, service capabilities and production capacity and/or improve their sales and marketing focus within the markets we serve, this segment's operating results could be negatively impacted.
Our customer concentration in the LSO Segment creates a significant risk for product sale declines
The LSO Segment is highly dependent on a relatively small number of customers for its sales, while working to grow in new markets and with new customers. Accordingly, loss of a significant customer, a significant reduction in pricing, or a shift to a less favorable mix of value-added picture framing glass or acrylic products for one or more of those customers could materially reduce the segment's operating results.
Strategic Risks
We could be unable to effectively manage and implement our enterprise strategy, which could have a material adverse effect on our business, financial condition, and results of operations
Our strategy includes differentiating our product and service offerings, shifting our business mix toward higher operating margin products and services and higher return on invested capital performance, and moving away from our historical, decentralized operating model. Execution of this strategy will require additional investments of time and resources and could fail to achieve the desired results. For example, we may be unable to increase our sales and earnings by differentiating our product and service offerings in a cost-effective manner. We may fail to accurately predict future customer needs and preferences, and thus focus on the wrong business mix. Our centralized operating system may not produce the desired operating efficiencies.
Risks related to acquisitions, divestitures and restructuring programs could adversely affect our operating results
We continue to look for strategic business opportunities to drive long-term growth and operating efficiencies, which may include acquisitions, divestitures and/or restructuring plans. We frequently evaluate our brand and product portfolios and may consider acquisitions that complement our business or divestitures of businesses that we no longer believe to be an appropriate strategic fit. We have initiated, and may initiate in the future, restructuring plans to achieve strategic objectives and improve financial results.
As we consider and execute future acquisitions, we may incur risks in integrating operations, technologies, products, and employees; we may fail to realize expected revenue growth and cost synergies from integration initiatives; we would likely increase debt levels to finance the acquisition; we may not fully anticipate changes in cash flows or other market-based assumptions or conditions that cause the value of acquired assets to fall below book value, requiring impairment of intangible assets including goodwill; we may subsequently identify contingent liabilities; and we may be entering markets in which we have no or limited experience.
As we consider and execute future divestitures, we may be exposed to risks associated to our ability to find appropriate buyers; difficulties in executing transactions on favorable terms; separating divested business operations with minimal impact to our remaining operations; incur write-offs and impairment charges; and we may have challenges effectively managing any transition service arrangements.
12
As we consider and execute restructuring plans, we may be exposed to risks associated with successfully completing the initiative in a timely manner, or at all; advancing our business strategy as expected; accurately predicting costs; realizing anticipated cost savings, efficiencies, synergies, financial targets and other benefits; and we may experience the loss of key employees and/or reduced employee morale and productivity.
Any acquisition, divestiture or restructuring plan, if not favorably executed by management, could have a material adverse effect on our operating results and/or financial condition.
Operational Risks
Loss of key personnel and inability to source sufficient labor could adversely affect our operating results
The loss of our CEO or any of our key senior executives could have a material adverse effect on our business, operating results and financial condition, particularly if we are unable to hire and integrate suitable replacements on a timely basis. Further, as we continue to grow our business, we will continue to adjust our senior management team. If we are unable to attract or retain the right individuals for the team, it could hinder our ability to efficiently execute our business, and could disrupt our operations or otherwise have a material adverse effect on our business.
Additionally, our success depends on the skills of construction project managers and other key technical personnel, and our ability to secure sufficient manufacturing and installation labor. In recent years, strong residential and non-residential construction and low U.S. unemployment have caused increased competition for experienced construction project managers and other labor. If we are unable to retain existing employees, provide a safe and healthy working environment, and/or recruit and train additional employees with the requisite skills and experience, our operating results could be adversely impacted.
Continuing inflation may negatively impact our profitability.
Rising inflation, interest rates, and construction costs, or any one of them, could reduce the demand for our products and services and impact our profitability. Higher interest rates make it more expensive for our customers to finance construction projects, and as a result, may reduce the number of projects available to us and the demand for our products and services, and also increase the interest expenses associated with our borrowings. Cost inflation, including significant cost increases for freight, aluminum, glass, paint and other materials used in our operations, has impacted, and could continue to impact, our profitability. Furthermore, in some of our segments, we operate on contracts wherein we bear part or all of the risk of inflation on materials costs and the cost of installation services. Our ability to mitigate these costs, or recover the cost increases through price increases, may lag the cost increases, which could negatively impact our margins.
If we are unable to manage our supply and distribution chains effectively our results of operations will be negatively affected
Our Architectural Framing Systems and Architectural Services Segments use aluminum as a significant input to their products and our operating results in those two segments could be negatively impacted by supply chain disruptions and adverse price movements in the market for raw aluminum. In recent years, we have seen increased volatility in the price of aluminum that we purchase from both domestic and international sources. Due to our Architectural Framing Systems and Architectural Services Segments presence in Canada, we have significant cross-border activity, as our Canadian businesses purchase inputs from U.S.-based suppliers and sell to U.S.-based customers. A significant change in U.S. trade policy with Canada could, therefore, have an adverse impact on our operating results.
Our Architectural Glass and LSO Segments use raw glass as a significant input to their products. We periodically experience a tighter supply of raw glass when there is growth in automotive manufacturing and residential and non-residential construction. Failure to acquire a sufficient amount of raw glass on terms as favorable as current terms, including as a result of a significant unplanned downtime or shift in strategy at one or more of our key suppliers, could negatively impact our operating results.
Our suppliers are subject to the fluctuations in general economic cycles. Global economic conditions and trade policies may impact their ability to operate their businesses. They may also be impacted by the increasing costs or availability of raw materials, labor and distribution, resulting in demands for less attractive contract terms or an inability for them to meet our requirements or conduct their own businesses. The performance and financial condition of one or more suppliers may cause us to alter our business terms or to cease doing business with a particular supplier or suppliers, or change our sourcing practices generally, which could in turn adversely affect our business and financial condition.
13
If we encounter problems with distribution, our ability to deliver our products to market could be adversely affected. Our operations are vulnerable to interruptions in the event of work stoppages, whether due to public health concerns, labor disputes or shortages, and natural disasters that may affect our distribution and transportation to job sites. Moreover, our distribution system includes computer-controlled and automated equipment, which may be subject to a number of risks related to data and system security or computer viruses, the proper operation of software and hardware, power interruptions or other system failures. If we encounter problems with our distribution systems, our ability to meet customer and consumer expectations, manage inventory, manage transportation-related costs, complete sales and achieve operating efficiencies could be adversely affected.
Project management and installation issues could adversely affect our operating results
Some of our segments are awarded fixed-price contracts that include material supply and installation services. Often, bids are required before all aspects of a construction project are known. An underestimate in the amount of labor required and/or cost of materials for a project; a change in the timing of the delivery of product; system design errors; difficulties or errors in execution; or significant project delays, caused by us or other trades, could result in failure to achieve the expected results. Any one or more of such issues could result in losses on individual contracts that could negatively impact our operating results.
Difficulties in maintaining our information technology systems, and potential cybersecurity threats, could negatively affect our operating results and/or our reputation
Our operations are dependent upon various information technology systems that are used to process, transmit and store electronic information and data, and to manage or support our manufacturing operations and a variety of other business processes and activities, some of which are managed by third parties. We could encounter difficulties in maintaining our existing systems, developing and implementing new systems, or integrating information technology systems across our business units. Such difficulties could lead to disruption in business operations and/or significant additional expenses that could adversely affect our results.
Additionally, our information technology and Internet based systems, and those of our third-party service providers, are subject to disruption and data loss due to natural disasters, power losses, unauthorized access, telecommunication failures and cyber-attacks of increasing frequency and sophistication. These systems have in the past been, and may in the future be, subject to cyber-attacks and other attempts to gain unauthorized access, breach, damage, disrupt or otherwise compromise such systems, none of which have been material to us in the last three fiscal years. The occurrence of any of these events could adversely affect our reputation and could result in the compromise of confidential information, litigation, manipulation and loss of data and intellectual property, regulatory action, production downtimes, disruption in availability of financial data, misrepresentation of information via digital media, and increased costs and operational consequences of implementing further data protection systems.
Our security measures may also be breached in the future as a result of employee error, failure to implement appropriate processes and procedures, advances in computer and software capabilities and encryption technology, new tools and discoveries, malfeasance, third-party action, including cyber-attacks or other international misconduct by computer hackers or otherwise. Additionally, we may have heightened cybersecurity, information security and operational risks as a result of work-from-home arrangements. Our workforce operates with a combination of remote work and flexible work schedules opening us up for cybersecurity threats and potential breaches as a result of increased employee usage of networks other than company-managed. This could result in one or more third-parties obtaining unauthorized access to our customer or supplier data or our internal data, including personally identifiable information, intellectual property and other confidential business information. Third-parties may also attempt to fraudulently induce employees into disclosing sensitive information such as user names, passwords or other information in order to gain access to customer or supplier data or our internal data, including intellectual property, financial, and other confidential business information.
14
We believe our mitigation measures reduce, but cannot eliminate, the risk of a cyber incident; however, there can be no assurance that our existing and planned precautions of backup systems, regular data backups, security protocols and other procedures will be adequate to prevent significant damage, system failure or data loss and the same is true for our partners, vendors and other third parties on which we rely. Because techniques used to obtain unauthorized access or sabotage systems change frequently and generally are not identified until they are launched against a target, we may be unable to anticipate these techniques or to implement adequate preventative or mitigation measures. Though it is difficult to determine what harm may directly result from any specific interruption or breach, any failure to maintain performance, reliability, security and availability of our network infrastructure or otherwise maintain the confidentiality, security, and integrity of data that we store or otherwise maintain on behalf of third-parties may harm our reputation and our employee, and customer relationships. If such unauthorized disclosure or access does occur, we may be required to notify our customers, employees or those persons whose information was improperly used, disclosed or accessed. We may also be subject to claims of breach of contract for such use or disclosure, investigation and penalties by regulatory authorities and potential claims by persons whose information was improperly used or disclosed. We could also become the subject of regulatory action or litigation from our customers, employees, suppliers, service providers, and shareholders, which could damage our reputation, require significant expenditures of capital and other resources, and cause us to lose business. Additionally, an unauthorized disclosure or use of information could cause interruptions in our operations and might require us to spend significant management time and other resources investigating the event and dealing with local and federal law enforcement. Regardless of the merits and ultimate outcome of these matters, we may be required to devote time and expense to their resolution.
In addition, the increase in the number and the scope of data security incidents has increased regulatory and industry focus on security requirements and heightened data security industry practices. New regulation, evolving industry standards, and the interpretation of both, may cause us to incur additional expense in complying with any new data security requirements. As a result, the failure to maintain the integrity of and protect customer or supplier data or our confidential internal data could have a material adverse effect on our business, operating results and financial condition.
Legal, Regulatory and Tax Risks
Violations of legal and regulatory compliance requirements, including environmental laws, and changes in existing legal and regulatory requirements, may have a negative impact on our business and results of operations.
We are subject to a legal and regulatory framework imposed under federal and state laws and regulatory agencies, including laws and regulations that apply specifically to U.S. public companies and laws and regulations applicable to our manufacturing and construction site operations. Our efforts to comply with evolving laws, regulations, and reporting standards, including climate-related regulations, may increase our general and administrative expenses, divert management time and attention, or limit our operational flexibility, all of which could have a material adverse effect on our business, financial position, and results of operations. Additionally, new laws, rules, and regulations, or changes to existing laws or their interpretations, could create added legal and compliance costs and uncertainty for us.
We use hazardous materials in our manufacturing operations, and have air and water emissions that require controls. Accordingly, we are also subject to federal, state, local and foreign environmental laws and regulations, including those governing the storage and use of hazardous materials and disposal of wastes. A violation of such laws and regulations, or a release of such substances, may expose us to various claims, including claims by third parties, as well as remediation costs and fines.
Product quality issues and product liability claims could adversely affect our operating results
We manufacture and/or install a significant portion of our products based on the specific requirements of each customer. We believe that future orders of our products or services will depend on our ability to maintain the performance, reliability, quality and timely delivery standards required by our customers. We have in the past, and are currently, subject to product liability and warranty claims, including certain legal claims related to a commercial sealant product formerly incorporated into our products, and there is no certainty we will prevail on these claims. If our products have performance, reliability or quality problems, or products are installed using incompatible glazing materials or installed improperly (by us or a customer), we may experience additional warranty and other expenses; reduced or canceled orders; higher manufacturing or installation costs; or delays in the collection of accounts receivable. Additionally, product liability and warranty claims, including relating to the performance, reliability or quality of our products and services, could result in costly and time-consuming litigation that could require significant time and attention of management and involve significant monetary damages that could negatively impact our operating results. There is also no assurance that the number and value of product liability and warranty claims will not increase as compared to historical claim rates, or that our warranty reserve at any particular time is sufficient. No assurance can be given that coverage under insurance policies, if applicable, will be adequate to cover future product liability claims against us. If we are unable to recover on insurance claims, in whole or in part, or if we exhaust our available insurance coverage at some point in the future, then we might be forced to expend our own funds on legal fees and settlement or judgment costs, which could negatively impact our profitability, results of operations, cash flows and financial condition.
15
Potential future tariffs may result in increased costs and could adversely affect the Company’s operating results
We utilize certain aluminum products in our manufacturing processes. Tariffs imposed in the U.S. or other countries on these aluminum products imported into the U.S. could result in increased costs and a decreased available supply. We may be unable to pass price increases on to our customers and may be unable to secure adequate alternative sources. The tariffs, and our inability to offset them with higher pricing, could have a material adverse effect on our operating results.
Our judgments regarding the accounting for tax positions and the resolution of tax disputes, as well as any changes in tax legislation may impact our net earnings and cash flow
Significant judgment is required to determine our effective tax rate and evaluate our tax positions. We provide for uncertain tax positions when such tax positions do not meet the recognition thresholds or measurement criteria prescribed by applicable accounting standards. Fluctuations in federal, state, local and foreign taxes or a change to uncertain tax positions, including related interest and penalties, may impact our effective tax rate and financial results. Additionally, we are subject to audits in the various taxing jurisdictions in which we conduct business. In cases where audits are conducted and issues are raised, a number of years may elapse before such issues are finally resolved. Unfavorable resolution of any tax matter could increase the effective tax rate, which could have an adverse effect on our operating results and cash flow. The impact of future tax legislation in the U.S. or abroad is always uncertain. Changes in such laws could adversely impact our effective income tax rate.
Financial Risks
Results can differ significantly from our expectations and the expectations of analysts, which could have an adverse effect on the market price of our common stock
From time to time, we may provide financial projections to our shareholders, lenders, investment community, and other stakeholders. Our projections are based on management’s best estimate utilizing prevailing business and economic conditions as well as other relevant information available at the time. These projections are highly subjective and are based upon a variety of factors that could change materially over time. As a result, our future actual results could vary materially from our projections which could have an adverse impact on the market price of our common stock.
We may experience further impairment of our goodwill, indefinite- and definite-lived intangible assets and long-lived assets, in the future, which could adversely impact our financial condition and results of operations
Our assets include a significant amount of goodwill, indefinite- and definite-lived intangible assets and long-lived assets. We evaluate goodwill and indefinite-lived intangible assets for impairment annually in our fiscal fourth quarter, or more frequently if events or changes in circumstances indicate that the carrying value of a reporting unit may not be recoverable. We evaluate definite-lived intangible assets and long-lived assets for impairment if events or changes in circumstances indicate that the carrying value of the long-lived asset may not be recoverable. The assessment of impairment involves significant judgment and projections about future performance.
Based on our annual impairment valuation analysis performed in the fourth quarter of fiscal 2024, there was no impairment of goodwill or indefinite and definite-lived intangibles identified. As a result of a publicly announced restructuring plan in the fourth quarter of fiscal 2024, we incurred $6.2 million of impairment charges related to property, plant and equipment and operating lease right-of-use assets.
The discounted cash flow projections and revenue projections used in our annual impairment valuation analysis are dependent upon achieving forecasted levels of revenue and profitability. If revenue or profitability were to fall below forecasted levels, or if market conditions were to decline in a material or sustained manner, impairment could be indicated and we could incur a non-cash impairment expense that would negatively impact our financial condition and results of operations.
Failure to maintain effective internal controls over financial reporting could adversely impact our ability to timely and accurately report financial results and comply with our reporting obligations, which could materially affect our business
Regardless of how internal financial reporting control systems are designed, implemented, and enforced, they cannot ensure with absolute certainty that our internal control objectives will be met in every instance. Because of the inherent limitations of all such systems, our internal controls over financial reporting may not always prevent or detect misstatements. Failure to maintain effective internal control over financial reporting could adversely affect our ability to accurately and timely report financial results, to prevent or detect fraud, or to comply with the requirements of the SEC or the Sarbanes-Oxley Act of 2002, which could necessitate a restatement of our financial statements, and/or result in an investigation, or the imposition of sanctions, by regulators. Such failure could additionally expose us to litigation and/or reputational harm, impair our ability to obtain financing, or increase the cost of any financing we obtain. All of these impacts could adversely affect the price of our common stock and our business overall.
16
Our liquidity or cost of capital may be materially adversely affected by constraints or changes in the capital and credit markets, interest rates and limitations under our financing arrangements
We need sufficient sources of liquidity to fund our working capital requirements, service our outstanding indebtedness and finance business opportunities. Without sufficient liquidity, we could be forced to curtail our operations, or we may not be able to pursue business opportunities. The principal sources of our liquidity are funds generated from operating activities, available cash, credit facilities, and other debt arrangements. If our sources of liquidity do not satisfy our requirements, we may need to seek additional financing. The future availability of financing will depend on a variety of factors, such as economic and market conditions, the regulatory environment for banks and other financial institutions, the availability of credit and our reputation with potential lenders. These factors could materially adversely affect our liquidity, costs of borrowing and our ability to pursue business opportunities or grow our business.. We may also assume or incur additional debt, including secured debt, in the future in connection with, or to fund, future acquisitions or for other operating needs.
ITEM 1B. UNRESOLVED STAFF COMMENTS
None.
ITEM 1C. CYBERSECURITY
Risk Management and Strategy
We recognize the critical importance of maintaining the confidentiality, integrity and availability of our information systems and data, and of effectively, assessing, identifying and managing cybersecurity and related risks. Our cybersecurity risk management program is integrated into our Enterprise Risk Management framework and utilizes a holistic approach to addressing cybersecurity risk, and it is supported by our employees, cybersecurity team, senior management, the Enterprise Risk Management committee (a committee comprised of primary corporate functions) and our Board of Directors. The underlying controls for the cyber risk management program are based on recognized best practices and standards for cybersecurity and information technology, including the National Institute of Standards and Technology (NIST) and the Center for Internet Security Benchmark (CIS).
Our cyber risk management program includes an incident response plan for evaluation, response and reporting of cybersecurity incidents, including notification of the Board and third parties, as appropriate. Under the plan, a Cybersecurity Intake Team (CIT), which is comprised of the Chief Information Officer (CIO), Senior Director of Information Security (SDIS) and other executive management, is responsible for a materiality assessment of cybersecurity incidents, taking into consideration both quantitative and qualitative factors, and subject to ongoing monitoring and escalation based on materiality.
Third party vendors and suppliers also play a role in our cyber risk management program. In circumstances where such third parties will access our systems and data, our SDIS participates in the vendor management process, including the review of contractual requirements and contractually imposing obligations on the vendor to report cybersecurity incidents to us so that we can assess the impact.
In addition to the incident response plan and vendor management process, our cyber risk management program includes:
•an information technology and cybersecurity training program, and ongoing employee testing to evaluate the effectiveness of quarterly internal training and awareness communications;
•external advisors to assist with cybersecurity risk assessment, including third-party monitoring of the Company's systems, external network penetration testing, and yearly cyber event preparedness exercises;
•development of strategies to mitigate cyber risks;
•crisis management, business continuity, and disaster recovery plans.
We have not encountered cybersecurity incidents or identified risks from cybersecurity threats that have had a material adverse effect on our operations or financial standing.
Notwithstanding the efforts we take to manage our cybersecurity risk, we may not be successful in preventing or mitigating a cybersecurity incident that could have a material adverse effect on us. While the Company maintains cybersecurity insurance, the costs related to cybersecurity threats or disruptions may not be fully insured. See Item 1A. “Risk Factors” for a discussion of cybersecurity risks.
17
Governance
Management's Role in Managing Risk
Within our organization, our CIO, who reports to our CEO, oversees our cybersecurity function. Our SDIS reports to our CIO and is generally responsible for management of cybersecurity risk and the protection and defense of our network and systems, including the development and management of policies and processes to identify, contain, and investigate potential incidents and ensure recovery therefrom. Our SDIS has over 15 years of experience managing information technology and cybersecurity matters in multiple industries. The SDIS maintains Certified Information Systems Security Professional (CISSP) and Certified Information Security Manager (CISM) certifications and holds a degree in information technology management.
Board's Role in Oversight
Our full Board oversees our cyber risk management program, and includes cybersecurity as part of the assessment of the Company's overall Enterprise Risk Management program. At least twice per year, and more frequently, if necessary, our CIO updates our Board on the Company's cyber risk profile and the steps taken by management to mitigate those risks. In the event of a material cybersecurity incident, the Board would receive prompt and timely information regarding the incident, as well as ongoing updates regarding such incident until it has been addressed. Cybersecurity-related risks are included in the Enterprise Risk Management committee’s evaluation of top risks to the enterprise, which are also presented to the Board and executive management twice per year.
ITEM 2. PROPERTIES
The following table lists, by segment, the Company's principal physical properties as of March 2, 2024. We believe these properties are generally in good operating condition, suitable for their respective uses and adequate for our current needs as our business is presently conducted.
| Property Location | Owned/ Leased | Function | ||||||||||||
Architectural Framing Systems Segment | ||||||||||||||
| Wausau, WI | Owned | Manufacturing/Administrative | ||||||||||||
| Stratford, WI | Owned | Manufacturing | ||||||||||||
| Reed City, MI | Owned | Manufacturing | ||||||||||||
| Walker, MI | Leased | Manufacturing/Administrative | ||||||||||||
| Mesquite, TX | Leased | Manufacturing | ||||||||||||
| Monett, MO | Owned | Manufacturing/Warehouse/Administrative | ||||||||||||
| Toronto, ON Canada | Leased | Manufacturing/Warehouse/Administrative | ||||||||||||
Architectural Glass Segment | ||||||||||||||
| Owatonna, MN | Owned | Manufacturing/Administrative | ||||||||||||
| Nazaré Paulista, Brazil | Owned(1) | Manufacturing/Administrative | ||||||||||||
Architectural Services Segment | ||||||||||||||
| Minneapolis, MN | Leased | Administrative | ||||||||||||
| West Chester, OH | Leased | Manufacturing | ||||||||||||
| Mesquite, TX | Leased | Manufacturing | ||||||||||||
| Brampton, ON Canada | Leased | Manufacturing/Warehouse/Administrative | ||||||||||||
LSO Segment | ||||||||||||||
| McCook, IL | Leased | Manufacturing/Warehouse/Administrative | ||||||||||||
| Faribault, MN | Owned | Manufacturing/Administrative | ||||||||||||
| Other | ||||||||||||||
| Minneapolis, MN | Leased | Administrative | ||||||||||||
(1)This is an owned facility; however, the land is leased from the city.
18
ITEM 3. LEGAL PROCEEDINGS
The Company is a party to various legal proceedings incidental to its normal operating activities. In particular, like others in the construction supply and services industry, the Company is routinely involved in various disputes and claims arising out of construction projects, sometimes involving significant monetary damages or product replacement. We have in the past and are currently subject to product liability and warranty claims, including certain legal claims related to a commercial sealant product formerly incorporated into our products. In December 2022, the claimant in an arbitration of one such claim was awarded $20 million. The Company has appealed the award and believes, after taking into account all currently available information, including the advice of counsel and the likelihood of available insurance coverage, that this award will not have a material adverse effect on the Company's business, financial condition, results of operations or cash flows. The Company is also subject to litigation arising out of areas such as employment practices, workers compensation and general liability matters. Although it is very difficult to accurately predict the outcome of any such proceedings, facts currently available indicate that no matters will result in losses that would have a material adverse effect on the results of operations, cash flows or financial condition of the Company.
ITEM 4. MINE SAFETY DISCLOSURES
Not applicable.
19
PART II
ITEM 5. MARKET FOR REGISTRANT'S COMMON EQUITY, RELATED STOCKHOLDER MATTERS AND ISSUER PURCHASES OF EQUITY SECURITIES
Market Information
Our common stock is traded on The Nasdaq Stock Market under the ticker symbol "APOG". As of April 5, 2024, there were 1,061 shareholders of record and 12,990 shareholders for whom securities firms acted as nominees.
Dividends
Quarterly, the Board of Directors evaluates declaring dividends based on operating results, available funds and the Company's financial condition. Cash dividends have been paid each quarter since 1974. The chart below shows quarterly and annual cumulative cash dividends per share for the past three fiscal years.
| Fiscal Year | First | Second | Third | Fourth | Total | |||||||||||||||||||||||||||
| 2024 | $ | 0.2400 | $ | 0.2400 | $ | 0.2400 | $ | 0.2500 | $ | 0.9700 | ||||||||||||||||||||||
| 2023 | 0.2200 | 0.2200 | 0.2200 | 0.2400 | 0.9000 | |||||||||||||||||||||||||||
| 2022 | 0.2000 | 0.2000 | 0.2000 | 0.2200 | 0.8200 | |||||||||||||||||||||||||||
Purchases of Equity Securities by the Company
The following table provides information with respect to purchases made by the Company of its own stock during the fourth quarter of fiscal 2024:
| Period | Total Number of Shares Purchased (a) | Average Price Paid per Share | Total Number of Shares Purchased as Part of Publicly Announced Plans or Programs (b) | Maximum Number of Shares that May Yet Be Purchased under the Plans or Programs (b) | ||||||||||||||||||||||
| November 26, 2023 through December 30, 2023 | — | $ | — | — | 2,973,483 | |||||||||||||||||||||
| December 31, 2023 through January 27, 2024 | 229 | 53.79 | — | 2,973,483 | ||||||||||||||||||||||
| January 28, 2024 through March 2, 2024 | 120 | 54.02 | — | 2,973,483 | ||||||||||||||||||||||
| Total | 349 | $ | 53.86 | — | 2,973,483 | |||||||||||||||||||||
(a) The shares in this column represent the total number of shares that were surrendered to us by plan participants to satisfy withholding tax obligations related to share-based compensation. We did not purchase any shares pursuant to our publicly announce repurchase program during the fiscal quarter.
(b) In fiscal 2004, announced on April 10, 2003, the Board of Directors authorized the repurchase of 1,500,000 shares of Company stock. The Board increased the authorization by 750,000 shares, announced on January 24, 2008; by 1,000,000 shares on each of the announcement dates of October 8, 2008, January 13, 2016, January 9, 2018, January 14, 2020, October 7, 2021 and June 22, 2022; and by 2,000,000 shares, announced on October 3, 2018, January 14, 2022 and October 6, 2023. The repurchase program does not have an expiration date.
20
Comparative Stock Performance
The graph below compares the cumulative total shareholder return on a $100 investment in our common stock for the last five fiscal years with the cumulative total return on a $100 investment in the Russell 2000 Index, a broad equity market index, and the S&P 600 Industrials Index. Effective as of February 26, 2023, the Company changed industry indexes, from the S&P Small Cap 600 Growth Index to the S&P 600 Industrials Index. We believe that the S&P 600 Industrials Index is the best available published industry index, composed of companies with similar market capitalization and a mix of GICS classifications that reasonably reflect our diverse business activities, although most of our direct competitors in our various business units are either privately owned or are divisions of larger, publicly owned companies. The graph assumes an investment at the close of trading on March 2, 2019, and also assumes the reinvestment of all dividends.
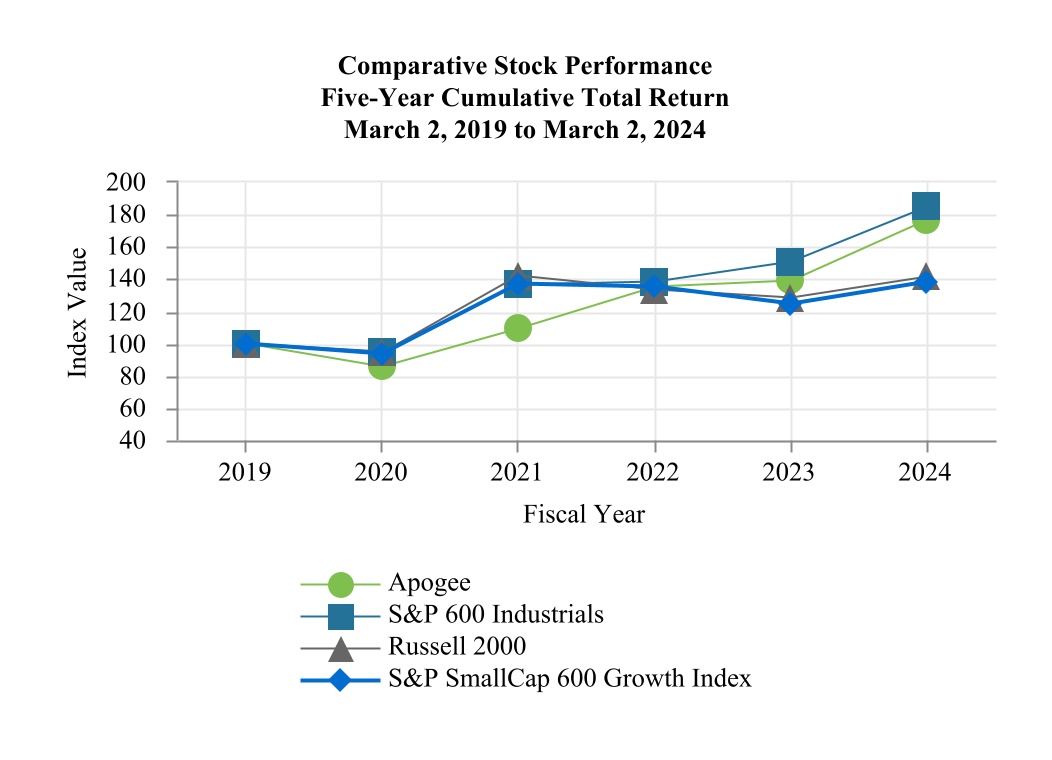
| 2019 | 2020 | 2021 | 2022 | 2023 | 2024 | |||||||||||||||||||||||||||||||||
| Apogee | $ | 100.00 | $ | 85.42 | $ | 109.04 | $ | 135.34 | $ | 139.22 | $ | 176.98 | ||||||||||||||||||||||||||
| S&P 600 Industrials | 100.00 | 94.77 | 136.18 | 138.58 | 150.46 | 184.84 | ||||||||||||||||||||||||||||||||
| Russell 2000 Index | 100.00 | 94.22 | 142.27 | 133.31 | 128.11 | 141.46 | ||||||||||||||||||||||||||||||||
| S&P SmallCap 600 Growth Index | 100.00 | 93.43 | 137.20 | 135.00 | 124.44 | 138.14 | ||||||||||||||||||||||||||||||||
ITEM 6. [RESERVED]
21
ITEM 7. MANAGEMENT'S DISCUSSION AND ANALYSIS OF FINANCIAL CONDITION AND RESULTS OF OPERATIONS
The following Management’s Discussion and Analysis of Financial Condition and Results of Operations is intended to assist the reader in understanding our financial condition and results of operations, including an evaluation of the amounts and certainty of cash flows from operations and from outside sources, and is provided as a supplement to and should be read in conjunction with the consolidated financial statements and related notes in Item 8. Financial Statements and Supplementary Data in this Form 10-K. Refer to Item 7, Management’s Discussion and Analysis of Financial Condition and Results of Operations, in our Form 10-K for the fiscal year ended February 25, 2023, for discussion of the results of operations for the year ended February 25, 2023, compared to the year ended February 26, 2022, which is incorporated by reference herein.
We have included in this report measures of financial performance that are not defined by GAAP. We believe that these measures provide useful information and include these measures in other communications to investors. For each of these non-GAAP financial measures, we provide a reconciliation of the differences between the non-GAAP measure and the most directly comparable GAAP measure, (see "Reconciliation of Non-GAAP Financial Measures" in this Item 7 below), and an explanation of why we believe the non-GAAP measure provides useful information to management and investors. These non-GAAP measures should be viewed in addition to, and not in lieu of, the comparable GAAP measure. Adjusted net earnings and adjusted earnings per diluted share (adjusted diluted EPS) are supplemental non-GAAP financial measures provided by the Company to assess performance on a more comparable basis from period-to-period by excluding amounts that management does not consider part of core operating results. Management uses these non-GAAP measures to evaluate the Company’s historical and prospective financial performance, measure operational profitability on a consistent basis, as a factor in determining executive compensation, and to provide enhanced transparency to the investment community.
Overview
We are a leading provider of architectural products and services for enclosing buildings, and high-performance glass and acrylic products used for preservation, energy conservation, and enhanced viewing. Our four reporting segments are: Architectural Framing Systems, Architectural Glass, Architectural Services and Large-Scale Optical (LSO).
In fiscal 2024, we made further progress toward our strategic goals and financial targets we established in fiscal 2021. We continued the deployment of the Apogee Management System across our business, supporting sustainable cost and productivity improvements. We invested in organic growth initiatives, including capacity expansion in the Large-Scale Optical Segment and geographic growth in Architectural Services. We increased our focus on differentiated products and services, and continued to diversify the mix of architectural projects that we serve while leaning more heavily into higher, value-added products. We also advanced several initiatives to strengthen our core capabilities, driving the standardization of key business processes and systems, and strengthening talent management and leadership development programs.
On January 30, 2024, the Company announced strategic actions to further streamline its business operations, enable a more efficient cost model, and better position the Company for profitable growth (referred to as “Project Fortify”). During the fourth quarter, the Company incurred $12.4 million of pre-tax charges related to Project Fortify, of which $5.5 million is included in cost of sales and $6.9 million is included in selling, general, and administrative (SG&A) expenses. The Company expects a total of $16 million to $18 million of pre-tax charges in connection with Project Fortify, leading to annualized cost savings of $12 million to $14 million. We expect that approximately 60% of these savings will be realized in fiscal 2025, with the remainder in fiscal 2026. We expect that approximately 70% of the savings will be realized in the Architectural Framing Systems segment, 20% in the Architectural Services Segment, and 10% in Corporate and other, with the plan to be substantially complete in the third quarter of fiscal 2025.
22
Results of Operations
The following tables provide various components of our operations for fiscal years 2024, 2023 and 2022, in U.S. dollar amounts and percentages reflecting annual changes in such amounts and as a percentage of net sales in each fiscal year.
Our fiscal year ends on the Saturday closest to the last day of February, or as otherwise determined by the Board of Directors. Fiscal 2024 consisted of 53 weeks, while fiscal 2023 and fiscal 2022 each consisted of 52 weeks.
% Change | ||||||||||||||||||||||||||||||||
| (Dollars in thousands) | 2024 | 2023 | 2022 | 2024 vs. 2023 | 2023 vs. 2022 | |||||||||||||||||||||||||||
| Net sales | $ | 1,416,942 | $ | 1,440,696 | $ | 1,313,977 | (1.6) | % | 9.6 | % | ||||||||||||||||||||||
| Cost of sales | 1,049,814 | 1,105,423 | 1,039,816 | (5.0) | % | 6.3 | % | |||||||||||||||||||||||||
| Gross profit | 367,128 | 335,273 | 274,161 | 9.5 | % | 22.3 | % | |||||||||||||||||||||||||
| Selling, general and administrative expenses | 233,295 | 209,485 | 202,643 | 11.4 | % | 3.4 | % | |||||||||||||||||||||||||
| Impairment expense on goodwill and intangible assets | — | — | 49,473 | N/M | (100.0) | % | ||||||||||||||||||||||||||
| Operating income | 133,833 | 125,788 | 22,045 | 6.4 | % | 470.6 | % | |||||||||||||||||||||||||
| Interest expense, net | 6,669 | 7,660 | 3,767 | (12.9) | % | 103.3 | % | |||||||||||||||||||||||||
Other (income) expense, net | (2,089) | 1,507 | 4,409 | N/M | (65.8) | % | ||||||||||||||||||||||||||
| Earnings before income taxes | 129,253 | 116,621 | 13,869 | 10.8 | % | 740.9 | % | |||||||||||||||||||||||||
| Income tax expense | 29,640 | 12,514 | 10,383 | 136.9 | % | 20.5 | % | |||||||||||||||||||||||||
| Net earnings | $ | 99,613 | $ | 104,107 | $ | 3,486 | (4.3) | % | 2,886.4 | % | ||||||||||||||||||||||
Diluted earnings per share | $ | 4.51 | $ | 4.64 | $ | 0.14 | (2.8) | % | 3,214.3 | % | ||||||||||||||||||||||
N/M - Indicates calculation is not meaningful | ||||||||||||||||||||||||||||||||
(Percentage of net sales) | 2024 | 2023 | 2022 | |||||||||||||||||
| Net sales | 100.0 | % | 100.0 | % | 100.0 | % | ||||||||||||||
| Cost of sales | 74.1 | 76.7 | 79.1 | |||||||||||||||||
| Gross profit | 25.9 | 23.3 | 20.9 | |||||||||||||||||
| Selling, general and administrative expenses | 16.5 | 14.5 | 15.4 | |||||||||||||||||
| Impairment expense on goodwill and intangible assets | — | — | 3.8 | |||||||||||||||||
| Operating income | 9.4 | 8.7 | 1.7 | |||||||||||||||||
| Interest expense, net | 0.5 | 0.5 | 0.3 | |||||||||||||||||
Other (income) expense, net | (0.1) | 0.1 | 0.3 | |||||||||||||||||
| Earnings before income taxes | 9.1 | 8.1 | 1.1 | |||||||||||||||||
| Income tax expense | 2.1 | 0.9 | 0.8 | |||||||||||||||||
| Net earnings | 7.0 | % | 7.2 | % | 0.3 | % | ||||||||||||||
Effective income tax rate | 22.9 | % | 10.7 | % | 74.9 | % | ||||||||||||||
Comparison of Fiscal 2024 to Fiscal 2023
•Consolidated net sales were $1.42 billion compared to $1.44 billion, a decrease of 1.6%, primarily reflecting lower volumes, partially offset by improved product mix and higher pricing.
•Gross profit margin improved to 25.9% of net sales, compared to 23.3%. The gross margin improvement was primarily driven by higher pricing, improved mix and the impact of lower costs from saving initiatives. These items were partially offset by the impact of lower volume, a less favorable mix of projects in the Architectural Services Segment, $5.5 million of restructuring costs related to Project Fortify, and the inflationary impact of higher costs.
•SG&A expense increased $23.8 million to 16.5% of net sales, compared to 14.5%. The increase in expense was primarily due to increased salaries and benefits costs as well as $6.9 million in restructuring costs related to Project Fortify.
23
•Operating income grew 6.4% to $133.8 million, and operating margin increased 70 basis points to 9.4%, driven by higher pricing, improved product mix, and the impact of lower costs from saving initiatives. These items were partially offset by a less favorable mix of projects in the Architectural Services Segment, increased salaries and benefits costs, $12.4 million of restructuring costs related to Project Fortify, and the inflationary impact of higher costs. Adjusted operating margin increased by 160 basis points, to 10.3%.
•Other income was $2.1 million, reflecting the impact of a $4.7 million pre-tax gain related to a New Markets Tax Credit, partially offset by an investment valuation adjustment.
•Net interest expense was $6.7 million, compared to $7.7 million driven by a lower average debt level, partially offset by a higher average interest rate.
•The effective tax rate was 22.9%, compared to 10.7%. During fiscal 2023, we claimed certain tax deductions, including a worthless stock loss deduction and other discrete tax benefits, related to our investment in Sotawall Limited, a Canadian subsidiary. These deductions generated a net tax benefit of $14.8 million, and reduced our effective tax rate for fiscal 2023 by approximately 13.1 percentage points.
•Diluted EPS was $4.51 compared to $4.64 driven by higher operating income, which was more than offset by a higher effective tax rate. Adjusted diluted EPS grew 19.8% to $4.77.
Segment Analysis
% Change | ||||||||||||||||||||||||||||||||
| (Dollars in thousands) | 2024 | 2023 | 2022 | 2024 vs. 2023 | 2023 vs. 2022 | |||||||||||||||||||||||||||
| Segment net sales | ||||||||||||||||||||||||||||||||
| Architectural Framing Systems | $ | 601,736 | $ | 649,778 | $ | 546,557 | (7.4) | % | 18.9 | % | ||||||||||||||||||||||
| Architectural Glass | 378,449 | 316,554 | 309,241 | 19.6 | % | 2.4 | % | |||||||||||||||||||||||||
| Architectural Services | 378,422 | 410,627 | 407,421 | (7.8) | % | 0.8 | % | |||||||||||||||||||||||||
| Large-Scale Optical | 99,223 | 104,215 | 101,673 | (4.8) | % | 2.5 | % | |||||||||||||||||||||||||
| Intersegment eliminations | (40,888) | (40,478) | (50,915) | 1.0 | % | (20.5) | % | |||||||||||||||||||||||||
| Net sales | $ | 1,416,942 | $ | 1,440,696 | $ | 1,313,977 | (1.6) | % | 9.6 | % | ||||||||||||||||||||||
| Segment operating income (loss) | ||||||||||||||||||||||||||||||||
| Architectural Framing Systems | $ | 64,833 | $ | 81,875 | $ | 38,088 | (20.8) | % | 115.0 | % | ||||||||||||||||||||||
| Architectural Glass | 68,046 | 28,610 | 1,785 | 137.8 | % | 1,502.8 | % | |||||||||||||||||||||||||
| Architectural Services | 11,840 | 18,140 | (22,071) | (34.7) | % | N/M | ||||||||||||||||||||||||||
| Large-Scale Optical | 24,233 | 25,348 | 23,618 | (4.4) | % | 7.3 | % | |||||||||||||||||||||||||
| Corporate and other | (35,119) | (28,185) | (19,375) | 24.6 | % | 45.5 | % | |||||||||||||||||||||||||
| Operating income | $ | 133,833 | $ | 125,788 | $ | 22,045 | 6.4 | % | 470.6 | % | ||||||||||||||||||||||
Segment operating margin | ||||||||||||||||||||||||||||||||
| Architectural Framing Systems | 10.8 | % | 12.6 | % | 7.0 | % | ||||||||||||||||||||||||||
| Architectural Glass | 18.0 | % | 9.0 | % | 0.6 | % | ||||||||||||||||||||||||||
| Architectural Services | 3.1 | % | 4.4 | % | (5.4) | % | ||||||||||||||||||||||||||
| Large-Scale Optical | 24.4 | % | 24.3 | % | 23.2 | % | ||||||||||||||||||||||||||
Corporate and other | N/M | N/M | N/M | |||||||||||||||||||||||||||||
Operating margin | 9.4 | % | 8.7 | % | 1.7 | % | ||||||||||||||||||||||||||
Segment net sales is defined as net sales for a certain segment and includes revenue related to intersegment transactions. We report net sales intersegment eliminations separately to exclude these sales from our consolidated total. Segment operating income is equal to net sales, less cost of goods sold, SG&A, and any asset impairment charges associated with the segment. Segment operating income includes operating income related to intersegment sales transactions and excludes certain corporate costs that are not allocated at a segment level. We report these unallocated corporate costs separately in Corporate and other. Operating income does not include other income or expense, interest expense or a provision for income taxes.
24
Architectural Framing Systems
Comparison of Fiscal 2024 to Fiscal 2023
•Net sales were $601.7 million, compared to $649.8 million, primarily reflecting lower volume, partially offset by more favorable sales mix and improved pricing.
•Operating income was $64.8 million and operating margin decreased 180 basis points to 10.8% of net sales, primarily driven by the impact of lower volume, a less favorable mix of projects and $6.0 million of restructuring costs related to Project Fortify. These items were partially offset by improved sales mix and pricing, as well as the impact of lower costs from saving initiatives. Adjusted operating income was $70.8 million and adjusted operating margin decreased 80 basis points to 11.8% of net sales.
Architectural Glass
Comparison of Fiscal 2024 to Fiscal 2023
•Net sales were $378.4 million, compared to $316.6 million, primarily driven by improved pricing and a more favorable sales mix.
•Operating income was $68.0 million and operating margin increased 900 basis points to 18.0% of net sales, primarily driven by improved pricing and mix, partially offset by cost inflation.
Architectural Services
Comparison of Fiscal 2024 to Fiscal 2023
•Net sales were $378.4 million, compared to $410.6 million, primarily reflecting lower project volume and a less favorable mix of projects.
•Operating income was $11.8 million and operating margin decreased 130 basis points to 3.1% of net sales primarily driven by lower project volume, a less favorable mix of projects, and $2.5 million of restructuring costs related to Project Fortify, partially offset by lower short-term incentive compensation expense. Adjusted operating income was $14.4 million and adjusted operating margin decreased 60 basis points to 3.8% of net sales.
Large-Scale Optical (LSO)
Comparison of Fiscal 2024 to Fiscal 2023
•Net sales were $99.2 million, compared to $104.2 million, primarily reflecting lower volume due to slower customer demand in the retail markets, partially offset by favorable mix and pricing.
•Operating income was $24.2 million and operating margin increased 10 basis points to 24.4% of net sales, compared to $25.3 million, or 24.3% of net sales, primarily driven by favorable mix and pricing, partially offset by the impact of lower volume.
Corporate and other
Comparison of Fiscal 2024 to Fiscal 2023
•Corporate and other expense was $35.1 million, compared to $28.2 million, primarily driven by $3.9 million of restructuring costs related to Project Fortify, increased compensation expense and higher consulting costs, partially offset by lower insurance-related costs.
Backlog
Backlog is an operating measure used by management to assess future potential sales revenue. Backlog is defined as the dollar amount of signed contracts or firm orders, generally as a result of a competitive bidding process, which is expected to be recognized as revenue. Backlog is not a term defined under U.S. GAAP and is not a measure of contract profitability. Backlog should not be used as the sole indicator of future revenue because we have a substantial number of projects with short lead times that book-and-bill within the same reporting period that are not included in backlog.
25
Architectural Framing Systems
As of fiscal 2024 year-end, segment backlog was $200.7 million, compared to $243.3 million at the end of the prior year, reflecting a decrease in order volume. As part of the actions of Project Fortify, we expect to phase out this segment's longer-cycle project business over time as the segment eliminates certain lower-margin product and service offerings. As a result, the majority of projects in this segment will generally be completed in six months or less and backlog as an operating measure will be less effective in assessing future potential sales revenue. Effective in the first quarter of fiscal 2025, backlog will no longer be reported for this segment.
Architectural Services
As of fiscal 2024 year-end, backlog in the Architectural Services Segment was $807.8 million, compared to $726.7 million at the end of the prior year, primarily driven by several large project awards in the current year.
Reconciliations of Non-GAAP Financial Measures
Adjusted operating income, adjusted operating margin, adjusted net earnings, adjusted diluted earnings per share (adjusted diluted EPS), adjusted earnings before interest, taxes, depreciation and amortization (adjusted EBITDA), adjusted EBITDA margin, and adjusted return on invested capital (ROIC) are supplemental non-GAAP financial measures provided by the Company to assess performance on a more comparable basis from period-to-period by excluding amounts that management does not consider part of core operating results. Management uses these non-GAAP measures as noted below:
•We use adjusted operating income, adjusted operating margin, adjusted net earnings, and adjusted diluted EPS to provide meaningful supplemental information about our operating performance by excluding amounts that are not considered part of core operating results to enhance comparability of results from period to period.
•Adjusted EBITDA represents adjusted net earnings before interest, taxes, depreciation, and amortization. We believe adjusted EBITDA and adjusted EBITDA margin metrics provide useful information to investors and analysts about our core operating performance.
•Adjusted return on invested capital (ROIC) is defined as adjusted operating income net of tax, divided by average invested capital. We believe this measure is useful in understanding operational performance and capital allocation over time, and it is used as a factor in determining executive compensation.
These non-GAAP measures should be viewed in addition to, and not as an alternative to, the reported financial results of the Company prepared in accordance with GAAP. Other companies may calculate these measures differently, thereby limiting the usefulness of the measures for comparison with other companies.
| Reconciliation of Non-GAAP Financial Measures | ||||||||||||||||||||||||||||||||||||||
| Adjusted Operating Income and Adjusted Operating Margin | ||||||||||||||||||||||||||||||||||||||
| (Unaudited) | ||||||||||||||||||||||||||||||||||||||
Year Ended March 2, 2024 (53 weeks) | ||||||||||||||||||||||||||||||||||||||
(In thousands, except percentages) | Architectural Framing Systems | Architectural Glass | Architectural Services | LSO | Corporate and other | Consolidated | ||||||||||||||||||||||||||||||||
| Operating income | $ | 64,833 | $ | 68,046 | $ | 11,840 | $ | 24,233 | $ | (35,119) | $ | 133,833 | ||||||||||||||||||||||||||
Restructuring costs (1) | 5,970 | — | 2,526 | — | 3,907 | 12,403 | ||||||||||||||||||||||||||||||||
| Adjusted operating income | $ | 70,803 | $ | 68,046 | $ | 14,366 | $ | 24,233 | $ | (31,212) | $ | 146,236 | ||||||||||||||||||||||||||
Operating margin | 10.8 | % | 18.0 | % | 3.1 | % | 24.4 | % | N/M | 9.4 | % | |||||||||||||||||||||||||||
Restructuring costs (1) | 1.0 | % | — | % | 0.7 | % | — | % | N/M | 0.9 | % | |||||||||||||||||||||||||||
Adjusted operating margin | 11.8 | % | 18.0 | % | 3.8 | % | 24.4 | % | N/M | 10.3 | % | |||||||||||||||||||||||||||
Year Ended February 25, 2023 (52 weeks) | ||||||||||||||||||||||||||||||||||||||
| Architectural Framing Systems | Architectural Glass | Architectural Services | LSO | Corporate and other | Consolidated | |||||||||||||||||||||||||||||||||
Operating income(2) | $ | 81,875 | $ | 28,610 | $ | 18,140 | $ | 25,348 | $ | (28,185) | $ | 125,788 | ||||||||||||||||||||||||||
Operating margin(2) | 12.6 | % | 9.0 | % | 4.4 | % | 24.3 | % | N/M | 8.7 | % | |||||||||||||||||||||||||||
| (1) | Restructuring costs related to Project Fortify, including $6.2 million of asset impairment charges, $5.9 million of employee termination costs and $0.3 million of other costs. | ||||||||||||||||||||||||||||
(2) | For fiscal year 2023, we did not make any adjustments to operating income or operating margin as calculated in accordance with GAAP. | ||||||||||||||||||||||||||||
26
| Reconciliation of Non-GAAP Financial Measures | |||||||||||||||||||||||||||||
| Adjusted Net Earnings and Adjusted Diluted Earnings Per Share | |||||||||||||||||||||||||||||
| (Unaudited) | |||||||||||||||||||||||||||||
| Diluted per share amounts | |||||||||||||||||||||||||||||
Year Ended | Year Ended | ||||||||||||||||||||||||||||
| March 2, 2024 | February 25, 2023 | March 2, 2024 | February 25, 2023 | ||||||||||||||||||||||||||
(In thousands, except per share amounts) | (53 weeks) | (52 weeks) | (53 weeks) | (52 weeks) | |||||||||||||||||||||||||
| Net earnings | $ | 99,613 | $ | 104,107 | $ | 4.51 | $ | 4.64 | |||||||||||||||||||||
Restructuring costs (1) | 12,403 | — | 0.56 | — | |||||||||||||||||||||||||
NMTC Settlement Gain(2) | (4,687) | — | (0.21) | — | |||||||||||||||||||||||||
Worthless stock deduction and other discrete tax benefits(3) | — | (14,833) | — | (0.66) | |||||||||||||||||||||||||
Income tax impact on above adjustments (4) | (1,890) | — | (0.09) | — | |||||||||||||||||||||||||
| Adjusted net earnings | $ | 105,439 | $ | 89,274 | $ | 4.77 | $ | 3.98 | |||||||||||||||||||||
| Shares outstanding for EPS | 22,091 | 22,416 | |||||||||||||||||||||||||||
| (1) | Restructuring costs related to Project Fortify, including $6.2 million of asset impairment charges, $5.9 million of employee termination costs and $0.3 million of other costs. | ||||||||||||||||||||||||||||
| (2) | Realization of a New Markets Tax Credit (NMTC) benefit during the second quarter of fiscal 2024, which was recorded in other (income) expense, net. | ||||||||||||||||||||||||||||
| (3) | Worthless stock deduction and related discrete income tax benefits from the impairment of the Sotawall business in fiscal 2023, which was recorded in income tax expense. | ||||||||||||||||||||||||||||
(4) | Income tax impact calculated using an estimated statutory tax rate of 24.5%, which reflects the estimated blended statutory tax rate for the jurisdictions in which the charge or income occurred. | ||||||||||||||||||||||||||||
| Reconciliation of Non-GAAP Financial Measures | ||||||||||||||
| Adjusted EBITDA and Adjusted EBITDA Margin (Earnings before interest, taxes, depreciation and amortization) | ||||||||||||||
| (Unaudited) | ||||||||||||||
Year Ended | ||||||||||||||
| March 2, 2024 | February 25, 2023 | |||||||||||||
| (In thousands) | (53 weeks) | (52 weeks) | ||||||||||||
| Net earnings | $ | 99,613 | $ | 104,107 | ||||||||||
| Income tax expense | 29,640 | 12,514 | ||||||||||||
| Interest expense, net | 6,669 | 7,660 | ||||||||||||
| Depreciation and amortization | 41,588 | 42,403 | ||||||||||||
| EBITDA | $ | 177,510 | $ | 166,684 | ||||||||||
Restructuring costs(1) | 12,403 | — | ||||||||||||
NMTC settlement gain(2) | (4,687) | — | ||||||||||||
| Adjusted EBITDA | $ | 185,226 | $ | 166,684 | ||||||||||
| Adjusted EBITDA Margin | 13.1 | % | 11.6 | % | ||||||||||
| (1) | Restructuring costs related to Project Fortify, including $6.2 million of asset impairment charges, $5.9 million of employee termination costs and $0.3 million of other costs. | ||||||||||||||||||||||||||||
| (2) | Realization of a New Markets Tax Credit (NMTC) benefit during the second quarter of fiscal 2024, which was recorded in other income (expense), net. | ||||||||||||||||||||||||||||
27
| Reconciliation of Non-GAAP Financial Measures | |||||||||||||||||
Adjusted Return on Invested Capital Reconciliation | |||||||||||||||||
| (Unaudited) | |||||||||||||||||
Year Ended | |||||||||||||||||
| March 2, 2024 | February 25, 2023 | ||||||||||||||||
| (In thousands, except percentages) | (53 weeks) | (52 weeks) | |||||||||||||||
| Operating income | $ | 133,833 | $ | 125,788 | |||||||||||||
Restructuring costs (1) | 12,403 | — | |||||||||||||||
| Adjusted operating income | $ | 146,236 | $ | 125,788 | |||||||||||||
Tax adjustment (2) | 35,828 | 30,818 | |||||||||||||||
| Adjusted operating income after taxes | $ | 110,408 | $ | 94,970 | |||||||||||||
Average invested capital (3) | $ | 668,555 | $ | 686,124 | |||||||||||||
Adjusted return on invested capital (ROIC) (4) | 16.5 | % | 13.8 | % | |||||||||||||
| (1) | Restructuring costs related to Project Fortify, including $6.2 million of asset impairment charges, $5.9 million of employee termination costs and $0.3 million of other costs. | ||||||||||||||||
| (2) | Income tax impact calculated using an estimated statutory tax rate of 24.5%, which reflects the estimated blended statutory tax rate for the jurisdictions in which the charge or income occurred. | ||||||||||||||||
| (3) | Average invested capital represents a trailing five quarter average of total assets less average current liabilities (excluding current portion long-term debt). | ||||||||||||||||
| (4) | Adjusted ROIC calculated by dividing adjusted operating income after taxes by average invested capital | ||||||||||||||||
Liquidity and Capital Resources
We rely on cash provided by operations for our material cash requirements, including working capital needs, capital expenditures, satisfaction of contractual commitments (including principal and interest payments on our outstanding indebtedness) and shareholder return through dividend payments and share repurchases.
Operating Activities. Net cash provided by operating activities was $204.2 million, compared to $102.7 million, primarily driven by favorable changes in working capital.
Investing Activities. Net cash used by investing activities was $43.7 million, compared to $27.7 million. Capital expenditures were the primary use of cash in fiscal 2024, largely driven by strategic investments to fund a capacity expansion in our Large-Scale Optical Segment and to enhance productivity through automation.
Financing Activities. Net cash used by financing activities was $144.6 million, compared to $91.0 million, primarily driven by higher net debt repayments in the current year period, partially offset by lower share repurchases.
Additional Liquidity Considerations. We periodically evaluate our liquidity requirements, cash needs and availability of debt resources relative to acquisition plans, significant capital plans, and other working capital needs.
As of the end of fiscal 2024, we had a committed revolving credit facility in the U.S. with maximum borrowings of up to $385 million, with a maturity date of August 5, 2027, and two Canadian committed, revolving credit facilities totaling $25 million (USD). At March 2, 2024, we had outstanding borrowings under our revolving credit facility of $50.0 million, while there were no outstanding borrowings under the Canadian committed, revolving credit facilities. We are required to make periodic interest payments on our outstanding indebtedness, and future interest payments will be determined based on the amount of outstanding borrowings and prevailing interest rates during that time.
Our revolving credit facilities contain two maintenance financial covenants that require us to stay below a maximum debt-to-EBITDA ratio of 3.25 and maintain a minimum ratio of EBITDA-to-interest expense of 3.00. Both ratios are computed quarterly, with EBITDA calculated on a rolling four-quarter basis. At March 2, 2024, we were in compliance with both financial covenants (which are identical in all three of our revolving credit facilities).
28
The revolving credit facilities also contain an acquisition holiday. In the event we make an acquisition for which the purchase price is greater than $75 million, we can elect to increase the maximum debt-to-EBITDA ratio to 3.75 for a period of four consecutive fiscal quarters, commencing with the fiscal quarter in which a qualifying acquisition occurs. No more than two acquisition "holidays" can occur during the term of the facilities, and at least two fiscal quarters must separate qualifying acquisitions.
Borrowings under the credit facilities bear floating interest at either the Base Rate or Term Secured Overnight Financing Rate (SOFR), or, in the case of the Canadian facilities, Canadian Overnight Repo Rate Average (CORRA) plus, in each, a margin based on the Leverage Ratio (as defined in the Credit Agreements). For Base Rate borrowings, the margin ranges from 0.125% to 0.75%. For Term SOFR and CORRA borrowings, the margin ranges from 1.125% to 1.75%, with an incremental Term SOFR and CORRA adjustment of 0.10% and 0.29547%, respectively.
The U.S. facility also contains an "accordion" provision. Under this provision, we can request that the facility be increased by as much $200.0 million. Any Lender may elect or decline to participate in the requested increase at the Lender’s sole discretion.
Additionally, at March 2, 2024, we had a total of $15.0 million of ongoing letters of credit related to industrial revenue bonds, construction contracts and insurance collateral that expire in fiscal year 2025 and reduce borrowing capacity under the U.S. revolving credit facility. As of March 2, 2024, the amount available for revolving borrowings under the U.S credit facility was $320.0 million.
We acquire the use of certain assets through operating leases, such as property, manufacturing equipment, vehicles and other equipment. Future payments for such leases, excluding leases with initial terms of one year or less, were $44.8 million at March 2, 2024, with $12.5 million payable within the next 12 months. See Note 8 - Leases of the Notes to Consolidated Financial Statements included in Item 8 of this Form 10-K for further detail surrounding our lease obligations and the timing of expected future payments.
As of March 2, 2024, we had $41.2 million of open purchase obligations, of which payments totaling $33.7 million are expected to become due within the next 12 months. These purchase obligations primarily relate to raw material commitments.
We expect to make contributions of approximately $0.4 million to our defined-benefit pension plans in fiscal 2025, which will equal or exceed our minimum funding requirements.
As of March 2, 2024, we had reserves of $5.1 million and $0.4 million for long-term unrecognized tax benefits and environmental liabilities, respectively. We are unable to reasonably estimate in which future periods the remaining unrecognized tax benefits will ultimately be settled.
We are required, in the ordinary course of business, to provide surety or performance bonds that commit payments to our customers for any non-performance. At March 2, 2024, $463.3 million of our backlog was bonded by performance bonds with a face value of $1.3 billion. These bonds have expiration dates that align with completion of the purchase order or contract. We have not been required to make any payments under these bonds with respect to our existing businesses.
Due to our ability to generate strong cash from operations and our borrowing capability under our committed revolving credit facilities, we believe that our sources of liquidity will be adequate to meet our short-term and long-term liquidity and capital expenditure needs. In addition, we believe we have the ability to obtain both short-term and long-term debt to meet our financing needs, including additional sources of debt to finance potential material acquisitions for the foreseeable future. We also believe we will be able to operate our business so as to continue to be in compliance with our existing debt covenants over the next fiscal year.
We continually review our portfolio of businesses and their assets and how they support our business strategy and performance objectives. As part of this review, we may acquire other businesses, pursue geographic expansion, take actions to manage capacity and further invest in, divest and/or sell parts of our current businesses.
Recently Issued Accounting Pronouncements
See Note 1 of the Notes to Consolidated Financial Statements within Item 8 of this Form 10-K for information pertaining to recently issued accounting pronouncements, incorporated herein by reference.
29
Critical Accounting Policies and Estimates
Our analysis of operations and financial condition is based on our consolidated financial statements prepared in accordance with U.S. GAAP. Preparation of these consolidated financial statements requires us to make estimates and assumptions affecting the reported amounts of assets and liabilities at the date of the consolidated financial statements, reported amounts of revenues and expenses during the reporting period and related disclosures of contingent assets and liabilities. Our estimates are evaluated on an ongoing basis and are drawn from historical experience and other assumptions that we believe to be reasonable under the circumstances. Actual results could differ under other assumptions or circumstances.
We consider the following items in our consolidated financial statements to require significant estimation or judgment.
Revenue recognition
We generate revenue from the design, engineering and fabrication of architectural glass, curtainwall, window, storefront and entrance systems, and from installing those products on non-residential buildings. We also manufacture value-added glass and acrylic products. Due to the diverse nature of our operations and various types of contracts with customers, we have businesses that recognize revenue over time and businesses that recognize revenue at a point in time. We believe the most significant areas of estimation and judgment are related to our businesses that recognize revenue using the over-time input method.
Approximately 34% of our total revenue in fiscal 2024 was from longer-term, fixed-price contracts. The contracts for these businesses have a single, bundled performance obligation, as these businesses generally provide interrelated products and services and integrate these products and services into a combined output specified by the customer. The customer obtains control of this combined output, generally integrated window systems or installed window and curtainwall systems, over time. We measure progress on these contracts following an input method, by comparing total costs incurred to-date to the total estimated costs for the contract, and record that proportion of the total contract price as revenue in the period. Contract costs include materials, labor and other direct costs related to contract performance. We believe this method of recognizing revenue is consistent with our progress in satisfying our contract obligations.
Due to the nature of the work required under these long-term contracts, the estimation of total revenue and costs incurred and remaining to complete on a project is subject to many variables and requires significant judgment. It is common for these contracts to contain potential bonuses or penalties which are generally awarded or charged upon certain project milestones or cost or timing targets, and can be based on customer discretion. We estimate variable consideration at the most likely amount to which we expect to be entitled. We include estimated amounts in the transaction price to the extent that it is probable that a significant reversal of cumulative revenue recognized will not occur when the uncertainty associated with the variable consideration is resolved. Our estimates of variable consideration and determination of whether to include estimated amounts in the transaction price are based largely on our assessments of anticipated performance and all information (historical, current and forecasted) that is reasonably available to us.
Long-term contracts are often modified to account for changes in contract specifications and requirements of work to be performed. We consider contract modifications to exist when the modification, generally through a change order, either creates new or changes existing enforceable rights and obligations, and we evaluate these types of modifications to determine whether they may be considered distinct performance obligations. In many cases, these contract modifications are for goods or services that are not distinct from the existing contract, due to the significant integration service provided in the context of the contract. Therefore, these modifications are generally accounted for as part of the existing contract. The effect of a contract modification on the transaction price and our measure of progress is recognized as an adjustment to revenue, generally on a cumulative catch-up basis.
Due to the significant judgments utilized in our revenue recognition on long-term contracts, if subsequent actual results and/or updated assumptions, estimates, or projections were to change from those utilized at March 2, 2024, it could result in a material impact to our results of operations in the future.
Impairment of goodwill and indefinite-lived intangible assets
Goodwill
We evaluate goodwill for impairment annually on the first day in our fiscal fourth quarter, or more frequently if events or changes in circumstances indicate the carrying value of the goodwill may not be recoverable. Evaluating goodwill for impairment involves the determination of the fair value of each reporting unit in which goodwill is recorded using a qualitative or quantitative analysis. A reporting unit is an operating segment, or a component of an operating segment, for which discrete financial information is available and is reviewed by segment management on a regular basis.
30
The reporting units for our fiscal 2024 annual impairment test align with our reporting segments, with the exception of our Architectural Framing Systems Segment. This segment contains two reporting units, Window and Wall Systems and Storefront and Finishing Solutions, which represent $53.6 million and $35.7 million, of the goodwill balance at March 2, 2024, respectively. During the fourth quarter of fiscal 2024, as a result of an announced restructuring plan, we reassessed our reporting units, which led to a combination of the Window and Wall Systems and Storefront and Finishing Solutions reporting units into one Architectural Framing Systems reporting unit. We evaluated goodwill on a qualitative basis prior to and subsequent to this change and concluded that no adjustment to the carrying value of goodwill was necessary as a result of this change. In addition, no qualitative indicators of impairment were identified during the fourth quarter of fiscal 2024. Following this change, we have four reporting units, which align with our reporting segments.
For our fiscal 2024 annual impairment test, we elected to bypass the qualitative assessment process and proceed directly to comparing the fair value of each of our reporting units to carrying value, including goodwill. If fair value exceeds the carrying value, goodwill impairment is not indicated. If the carrying amount of a reporting unit is higher than its estimated fair value, the excess is recognized as an impairment expense.
We estimate the fair value of a reporting unit using both the income approach and the market approach. The income approach uses a discounted cash flow methodology that involves significant judgment and projections of future performance. Assumptions about future revenues and future operating expenses, capital expenditures and changes in working capital are based on the annual operating plan and other business plans for each reporting unit. These plans take into consideration numerous factors, including historical experience, current and future operational plans, anticipated future economic conditions and growth expectations for the industries and end markets in which we participate. These projections are discounted using a weighted-average cost of capital, which considers the risk inherent in our projections of future cash flows. We determine the weighted-average cost of capital for this analysis by weighting the required returns on interest-bearing debt and common equity capital in proportion to their estimated percentages in an expected capital structure, using published data where possible. We used discount rates that are commensurate with the risks and uncertainties inherent in the respective businesses and in the internally developed forecasts. The market approach uses a multiple of earnings and revenue based on publicly traded companies.
Based on these analyses, estimated fair value exceeded carrying value at all of our reporting units. The discounted cash flow projections used in these analyses are dependent upon achieving forecasted levels of revenue and profitability. If revenue or profitability were to fall below forecasted levels, or if market conditions were to decline in a material or sustained manner, impairment could be indicated at our reporting units and we could incur non-cash impairment expense that would negatively impact our net earnings. For example, keeping all other assumptions constant, a 100 basis point increase in the weighted average cost of capital would cause the estimated fair values of our reporting units to decrease in the range of $17 million to $46 million. In addition, keeping all other assumptions constant, a 100 basis point reduction in the long-term growth rate would cause the estimated fair values of our reporting units to decrease in the range of $7 million to $20 million. Given the amounts by which the fair value exceeds the carrying value for each of our reporting units, the decreases in estimated fair values described above would not have significantly impacted the results of our impairment tests.
Indefinite-lived intangible assets
We have intangible assets for certain acquired trade names and trademarks which we have determined to have indefinite useful lives. We evaluate the reasonableness of the useful lives and test indefinite-lived intangible assets for impairment annually at the same measurement date as goodwill, the first day of our fiscal fourth quarter, or more frequently if events or changes in circumstances indicate that it is more likely than not that the asset is impaired.
For our fiscal 2024 annual impairment test, we bypassed a qualitative assessment and performed a quantitative impairment test to compare the fair value of each indefinite-lived intangible asset with its carrying value. If the carrying value of an indefinite-lived intangible asset exceeds its fair value, an impairment expense is recognized in an amount equal to that excess. If an impairment expense is recognized, the adjusted carrying amount becomes the asset's new accounting basis.
31
Fair value is measured using the relief-from-royalty method. This method assumes the trade name or trademark has value to the extent that the owner is relieved of the obligation to pay royalties for the benefits received from the asset. This method requires estimation of future revenue from the related asset, the appropriate royalty rate, and the weighted average cost of capital. The assessment of fair value involves significant judgment and projections about future performance. In the fair value analysis, we assumed discount rates ranging from 13.5% to 14.0%, a royalty rate of 1.5%, and a long-term growth rate of 3.0%. Based on our annual analysis, the fair value of each of our trade names and trademarks exceeded the carrying amount. The discounted cash flow projections used in these analyses are dependent upon achieving forecasted levels of revenue. If revenue was to fall below forecasted levels, or if market conditions were to decline in a material or sustained manner, impairment could be indicated for our indefinite-lived intangible assets and we could incur non-cash impairment expense that would negatively impact our net earnings. For example, keeping all other assumptions constant, a 100 basis point increase in the weighted average cost of capital would cause the estimated fair values of our indefinite-lived intangibles to fall below carrying value, and would indicate impairment of around $0.4 million.
We continue to conclude that the useful lives of our remaining indefinite-lived intangible assets is appropriate. If future revenue were to fall below forecasted levels or if market conditions were to decline in a material or sustained manner, impairment could be indicated on these indefinite-lived intangible assets.
Reserves for disputes and claims regarding product liability, warranties and other project-related contingencies
We are subject to claims associated with our products and services, principally as a result of disputes with our customers involving the performance or aesthetics of our products, some of which may be covered under our warranty policies. We have in the past and are currently subject to product liability and warranty claims, including certain legal claims related to a commercial sealant product formerly incorporated into our products. We also are subject to project management and installation-related contingencies as a result of our fixed-price material supply and installation service contracts, primarily in our Architectural Services Segment and certain of our Architectural Framing Systems businesses. The time period from when a claim is asserted to when it is resolved, either by negotiation, settlement or litigation, can be several years. While we maintain various types of product liability insurance, the insurance policies include significant self-retention of risk in the form of policy deductibles. In addition, certain claims could be determined to be uninsured. We also actively manage the risk of these exposures through contract negotiations and proactive project management.
We reserve estimated exposures on known claims, as well as on a portion of anticipated claims for product warranty and rework costs, based on similar historical product liability claims, as a ratio of sales. We also reserve for estimated exposures on other claims as they are known and reasonably estimable.
Income taxes
We are required to make judgments regarding the potential tax effects of various financial transactions and ongoing operations to estimate our obligation to taxing authorities. These tax obligations include income, real estate, franchise and sales/use taxes. Judgments related to income taxes require the recognition in our financial statements that a tax position is more-likely-than-not to be sustained on audit.
Judgment and estimation is required in developing the provision for income taxes and the reporting of tax-related assets and liabilities and, if necessary, any valuation allowances. The interpretation of tax laws can involve uncertainty, since tax authorities may interpret such laws differently. Actual income tax could vary from estimated amounts and may result in favorable or unfavorable impacts to net income, cash flows and tax-related assets and liabilities. In addition, the effective tax rate may be affected by other changes, including the allocation of property, payroll and revenues between states.
We assess the deferred tax assets for recoverability taking into consideration historical and anticipated earnings levels; the reversal of other existing temporary differences; available net operating losses and tax carryforwards; and available tax planning strategies that could be implemented to realize the deferred tax assets. Based on this assessment, management must evaluate the need for, and amount of, a valuation allowance against the deferred tax assets. As facts and circumstances change, adjustment to the valuation allowance may be required.
32
ITEM 7A. QUANTITATIVE AND QUALITATIVE DISCLOSURES ABOUT MARKET RISK
We are exposed to ongoing market risk related to changes in interest rates, foreign currency exchange rates and raw material pricing.
Interest Rate Risk
A rise in interest rates could negatively affect the fair value of our fixed income investments, while serving to provide greater long-term return potential on these investments. To manage our direct risk from changes in market interest rates, we actively monitor the interest-sensitive components of our balance sheet, primarily available-for-sale securities, fixed income securities and debt obligations, and maintain a diversified portfolio in order to minimize the impact of changes in interest rates on net earnings and cash flow. We do not hold any financial instruments for trading purposes. We also hedge a portion of the floating interest rate on our long-term line of credit through a floating-to-fixed interest rate swap.
The primary measure of interest rate risk is the simulation of net income under different interest rate environments. If interest rates were to increase or decrease over the next 12 months by 200 basis points, net earnings would be impacted by approximately $1.0 million. Our debt exceeded investments at March 2, 2024, so as interest rates increase, net earnings decrease; as interest rates decrease, net earnings increase.
In addition to the market risk related to interest rate changes on our financial instruments, the non-residential construction markets in which our businesses operate are highly affected by changes in interest rates. Increases in interest rates could adversely impact activity in the non-residential construction industry and our operating results.
Foreign Currency Exchange Rate Risk
We are subject to market risk due to changes in the value of foreign currencies in relation to our reporting currency, the U.S. dollar.
We have operations in Canada and Brazil, which primarily transact business in local currencies. We manage these operating activities locally. Revenues, costs, assets and liabilities of these operations are generally denominated in local currencies, thereby mitigating some of the risk associated with changes in foreign exchange rates. However, our consolidated financial results are reported in U.S. dollars. Thus, changes in exchange rates between the Canadian dollar and Brazilian Real, versus the U.S. dollar, will impact our reported financial results. From time to time, we enter into forward purchase foreign currency contracts, generally with an original maturity date of less than one year, to hedge foreign currency risk (see Note 4 of the Notes to Consolidated Financial Statements in Item 8 of this Form 10-K). Sales from our domestic operations are generally denominated in U.S. dollars.
Raw Material Pricing Risk
We are subject to market risk exposure related to volatility in the prices of aluminum and lumber, among other raw materials and supplies used in our end products. A significant amount of our cost of sales relates to materials costs. The commodities markets, which include the aluminum industry, are highly cyclical in nature. As a result, commodity costs can be volatile. Commodity costs are influenced by numerous factors beyond our control, including general economic conditions, the availability of raw materials, competition, labor costs, freight and transportation costs, production costs, import duties and other trade restrictions.
We principally manage our exposures to the market fluctuations in the aluminum industry through fixed/floating rate swaps and forward purchase agreements. Although we have the ability to purchase aluminum from a number of suppliers, a production cutback by one or more of our current suppliers could create challenges in meeting delivery schedules to our customers. The prices we offer to our customers are also impacted by changes in commodity costs. We manage the alignment of the cost of our raw materials and the prices offered to customers, and attempt to pass changes to raw material costs through to our customers. To improve our management of commodity costs, we attempt to maintain inventory levels not in excess of our production requirements.
We cannot accurately calculate the pre-tax impact a one percent change in the commodity costs of aluminum and/or lumber would have on our fiscal 2024 operating results, as the change in commodity costs would both impact the cost to purchase materials and the selling prices we offer our customers. The impact to our operating results would significantly depend on the competitive environment and the costs of other alternative products, which could impact our ability to pass commodities costs to our customers.
33
ITEM 8. FINANCIAL STATEMENTS AND SUPPLEMENTARY DATA
Management's Annual Report on Internal Control over Financial Reporting
Management of Apogee Enterprises, Inc. and its subsidiaries (the Company) is responsible for establishing and maintaining adequate internal control over financial reporting, as such term is defined in Rules 13a-15(f) of the Securities Exchange Act of 1934. The Company's internal control over financial reporting is designed to provide reasonable assurance regarding the reliability of financial reporting and the preparation of financial statements for external purposes in accordance with generally accepted accounting principles. The Company's internal control over financial reporting includes those policies and procedures that (1) pertain to maintenance of records that, in reasonable detail, accurately and fairly reflect the transactions and dispositions of the assets of the Company; (2) provide reasonable assurance that transactions are recorded as necessary to permit preparation of the financial statements in accordance with generally accepted accounting principles, and that receipts and expenditures of the Company are being made only in accordance with authorizations of management and directors of the Company; and (3) provide reasonable assurance regarding prevention or timely detection of unauthorized acquisition, use or disposition of the Company's assets that could have a material effect on the financial statements.
Because of inherent limitations, internal control over financial reporting may not prevent or detect misstatements. Also, projections of any evaluation of the effectiveness of internal control over financial reporting to future periods are subject to the risk that the controls may become inadequate because of changes in conditions, or that the degree of compliance with the policies or procedures may deteriorate.
The Company's management assessed the effectiveness of the Company's internal control over financial reporting as of March 2, 2024, using criteria set forth by the Committee of Sponsoring Organizations of the Treadway Commission (COSO) in Internal Control - Integrated Framework (2013). The Company's management believes that, as of March 2, 2024, the Company's internal control over financial reporting was effective based on those criteria.
Following this report are reports from the Company's independent registered public accounting firm, Deloitte & Touche LLP, on the Company's consolidated financial statements and on the effectiveness of the Company's internal control over financial reporting as of March 2, 2024.
34
REPORT OF INDEPENDENT REGISTERED PUBLIC ACCOUNTING FIRM
To the shareholders and the Board of Directors of
Apogee Enterprises, Inc.
Opinion on the Financial Statements
We have audited the accompanying consolidated balance sheets of Apogee Enterprises, Inc. and subsidiaries (the "Company") as of March 2, 2024 and February 25, 2023, and the related consolidated results of operations, statements of comprehensive earnings, cash flows, and shareholders' equity, for each of the three years in the period ended March 2, 2024, and the related notes (collectively referred to as the "financial statements"). In our opinion, the financial statements present fairly, in all material respects, the financial position of the Company as of March 2, 2024 and February 25, 2023, and the results of its operations and its cash flows for each of the three years in the period ended March 2, 2024, in conformity with accounting principles generally accepted in the United States of America.
We have also audited, in accordance with the standards of the Public Company Accounting Oversight Board (United States) (PCAOB), the Company's internal control over financial reporting as of March 2, 2024, based on criteria established in Internal Control — Integrated Framework (2013) issued by the Committee of Sponsoring Organizations of the Treadway Commission and our report dated April 26, 2024, expressed an unqualified opinion on the Company's internal control over financial reporting.
Basis for Opinion
These financial statements are the responsibility of the Company's management. Our responsibility is to express an opinion on the Company's financial statements based on our audits. We are a public accounting firm registered with the PCAOB and are required to be independent with respect to the Company in accordance with the U.S. federal securities laws and the applicable rules and regulations of the Securities and Exchange Commission and the PCAOB.
We conducted our audits in accordance with the standards of the PCAOB. Those standards require that we plan and perform the audit to obtain reasonable assurance about whether the financial statements are free of material misstatement, whether due to error or fraud. Our audits included performing procedures to assess the risks of material misstatement of the financial statements, whether due to error or fraud, and performing procedures that respond to those risks. Such procedures included examining, on a test basis, evidence regarding the amounts and disclosures in the financial statements. Our audits also included evaluating the accounting principles used and significant estimates made by management, as well as evaluating the overall presentation of the financial statements. We believe that our audits provide a reasonable basis for our opinion.
Critical Audit Matter
The critical audit matter communicated below is a matter arising from the current-period audit of the financial statements that was communicated or required to be communicated to the audit committee and that (1) relates to accounts or disclosures that are material to the financial statements and (2) involved our especially challenging, subjective, or complex judgments. The communication of critical audit matters does not alter in any way our opinion on the financial statements, taken as a whole, and we are not, by communicating the critical audit matter below, providing separate opinions on the critical audit matter or on the accounts or disclosures to which it relates.
Net Sales — Revenue Recognition for Long-Term Contracts in the Architectural Services Segment — Refer to Notes 1, 2, and 15 to the consolidated financial statements
The Architectural Services segment, which provides building glass and curtainwall installation services and operates under long-term, fixed-price contracts, accounted for approximately $378.4 million, or 27 percent of total net sales for the year ended March 2, 2024. The contracts for this business typically have a single, bundled performance obligation, as the business generally provides interrelated services and integrates these services into a combined output specified by the customer. The customer obtains control of this combined output, generally installed window and curtainwall systems, over time. The Company measures progress on these contracts following an input method, by comparing total costs incurred to-date to the total estimated costs for the contract and recording that proportion of the total contract price as revenue.
Given the judgments necessary to estimate total costs and profit for the contract performance obligations used to recognize revenue for long-term, fixed-price contracts in the Architectural Services segment, auditing such estimates required extensive audit effort due to the complexity of long-term contracts and a high degree of auditor judgment when performing audit procedures and evaluating the results of those procedures.
35
How the Critical Audit Matter Was Addressed in the Audit
Our audit procedures related to management’s estimates of total costs and profit for the contract performance obligations used to recognize revenue for certain long-term contracts in the Architectural Services segment included, but were not limited to the following:
•We tested the effectiveness of controls over long-term contract revenue, including those over the estimates of total costs and profit for performance obligations.
•We developed an expectation of the amount of total long-term contract revenue based on prior year margins applied to cost of sales in the current year and compared our expectation to the amount of long-term contract revenue ultimately recorded by management.
•We evaluated management’s ability to estimate total costs and profit by comparing actual costs and profit to management’s historical estimates for performance obligations that have been fulfilled.
•We selected a sample of long-term contracts from the contract portfolio and performed the following procedures:
•Evaluated whether the long-term contracts were properly included in management’s calculation of long-term contract revenue based on the terms and conditions of each contract, including whether continuous transfer of control to the customer occurred as progress was made toward fulfillment of the performance obligations.
•Compared the transaction prices to the consideration expected to be received based on current rights and obligations under the long-term contracts and any modifications that were agreed upon with the customers.
•Tested management’s identification of distinct performance obligations by evaluating whether the underlying services are highly interdependent and interrelated.
•Tested the accuracy and completeness of the costs incurred to date for the performance obligations.
•We tested the mathematical accuracy of management’s calculation of long-term contract revenue for the performance obligation.
•Evaluated the estimates of total cost and profit for the performance obligations by:
•Comparing costs incurred to date to the costs management estimated to be incurred to date.
•Evaluating management’s ability to achieve the estimates of total cost and profit by performing corroborating inquiries with the Company’s project managers and engineers, and comparing the estimates to management’s work plans, engineering specifications, and supplier contracts.
/s/ Deloitte & Touche LLP
April 26, 2024
We have served as the Company's auditor since fiscal 2003.
36
REPORT OF INDEPENDENT REGISTERED PUBLIC ACCOUNTING FIRM
To the shareholders and the Board of Directors of
Apogee Enterprises, Inc.
Opinion on Internal Control over Financial Reporting
We have audited the internal control over financial reporting of Apogee Enterprises, Inc. and subsidiaries (the “Company”) as of March 2, 2024, based on criteria established in Internal Control — Integrated Framework (2013) issued by the Committee of Sponsoring Organizations of the Treadway Commission (COSO). In our opinion, the Company maintained, in all material respects, effective internal control over financial reporting as of March 2, 2024, based on criteria established in Internal Control — Integrated Framework (2013) issued by COSO.
We have also audited, in accordance with the standards of the Public Company Accounting Oversight Board (United States) (PCAOB), the consolidated financial statements as of and for the year ended March 2, 2024, of the Company and our report dated April 26, 2024, expressed an unqualified opinion on those financial statements.
Basis for Opinion
The Company’s management is responsible for maintaining effective internal control over financial reporting and for its assessment of the effectiveness of internal control over financial reporting, included in the accompanying Management's Annual Report on Internal Control over Financial Reporting. Our responsibility is to express an opinion on the Company’s internal control over financial reporting based on our audit. We are a public accounting firm registered with the PCAOB and are required to be independent with respect to the Company in accordance with the U.S. federal securities laws and the applicable rules and regulations of the Securities and Exchange Commission and the PCAOB.
We conducted our audit in accordance with the standards of the PCAOB. Those standards require that we plan and perform the audit to obtain reasonable assurance about whether effective internal control over financial reporting was maintained in all material respects. Our audit included obtaining an understanding of internal control over financial reporting, assessing the risk that a material weakness exists, testing and evaluating the design and operating effectiveness of internal control based on the assessed risk, and performing such other procedures as we considered necessary in the circumstances. We believe that our audit provides a reasonable basis for our opinion.
Definition and Limitations of Internal Control over Financial Reporting
A company’s internal control over financial reporting is a process designed to provide reasonable assurance regarding the reliability of financial reporting and the preparation of financial statements for external purposes in accordance with generally accepted accounting principles. A company’s internal control over financial reporting includes those policies and procedures that (1) pertain to the maintenance of records that, in reasonable detail, accurately and fairly reflect the transactions and dispositions of the assets of the company; (2) provide reasonable assurance that transactions are recorded as necessary to permit preparation of financial statements in accordance with generally accepted accounting principles, and that receipts and expenditures of the company are being made only in accordance with authorizations of management and directors of the company; and (3) provide reasonable assurance regarding prevention or timely detection of unauthorized acquisition, use, or disposition of the company’s assets that could have a material effect on the financial statements.
Because of its inherent limitations, internal control over financial reporting may not prevent or detect misstatements. Also, projections of any evaluation of effectiveness to future periods are subject to the risk that controls may become inadequate because of changes in conditions, or that the degree of compliance with the policies or procedures may deteriorate.
/s/ Deloitte & Touche LLP
Minneapolis, MN
April 26, 2024
37
CONSOLIDATED BALANCE SHEETS
| (In thousands, except per share data) | March 2, 2024 | February 25, 2023 | ||||||||||||
| Assets | ||||||||||||||
| Current assets | ||||||||||||||
| Cash and cash equivalents | $ | $ | ||||||||||||
| Restricted cash | ||||||||||||||
| Receivables, net | ||||||||||||||
| Inventories, net | ||||||||||||||
| Contract assets | ||||||||||||||
| Other current assets | ||||||||||||||
| Total current assets | ||||||||||||||
| Property, plant and equipment, net | ||||||||||||||
| Operating lease right-of-use assets | ||||||||||||||
| Goodwill | ||||||||||||||
| Intangible assets, net | ||||||||||||||
| Other non-current assets | ||||||||||||||
| Total assets | $ | $ | ||||||||||||
| Liabilities and Shareholders’ Equity | ||||||||||||||
| Current liabilities | ||||||||||||||
| Accounts payable | $ | $ | ||||||||||||
| Accrued compensation and benefits | ||||||||||||||
| Contract liabilities | ||||||||||||||
| Operating lease liabilities | ||||||||||||||
| Other current liabilities | ||||||||||||||
| Total current liabilities | ||||||||||||||
| Long-term debt | ||||||||||||||
| Non-current operating lease liabilities | ||||||||||||||
| Non-current self-insurance reserves | ||||||||||||||
| Other non-current liabilities | ||||||||||||||
| Commitments and contingent liabilities (Note 10) | ||||||||||||||
| Shareholders’ equity | ||||||||||||||
Junior preferred stock of $ | ||||||||||||||
Common stock of $ | ||||||||||||||
| Additional paid-in capital | ||||||||||||||
| Retained earnings | ||||||||||||||
| Accumulated other comprehensive loss | ( | ( | ||||||||||||
| Total shareholders’ equity | ||||||||||||||
| Total liabilities and shareholders’ equity | $ | $ | ||||||||||||
See accompanying notes to consolidated financial statements.
38
CONSOLIDATED RESULTS OF OPERATIONS
| Year-Ended | ||||||||||||||||||||
| March 2, 2024 | February 25, 2023 | February 26, 2022 | ||||||||||||||||||
| (In thousands, except per share data) | (53 weeks) | (52 weeks) | (52 weeks) | |||||||||||||||||
| Net sales | $ | $ | $ | |||||||||||||||||
| Cost of sales | ||||||||||||||||||||
| Gross profit | ||||||||||||||||||||
| Selling, general and administrative expenses | ||||||||||||||||||||
| Impairment expense on goodwill and intangible assets | ||||||||||||||||||||
| Operating income | ||||||||||||||||||||
| Interest expense, net | ||||||||||||||||||||
Other (income) expense, net | ( | |||||||||||||||||||
| Earnings before income taxes | ||||||||||||||||||||
| Income tax expense | ||||||||||||||||||||
| Net earnings | $ | $ | $ | |||||||||||||||||
Basic earnings per share | $ | $ | $ | |||||||||||||||||
Diluted earnings per share | $ | $ | $ | |||||||||||||||||
| Weighted average basic shares outstanding | ||||||||||||||||||||
| Weighted average diluted shares outstanding | ||||||||||||||||||||
See accompanying notes to consolidated financial statements.
39
CONSOLIDATED STATEMENTS OF COMPREHENSIVE EARNINGS
| Year-Ended | ||||||||||||||||||||
| March 2, 2024 | February 25, 2023 | February 26, 2022 | ||||||||||||||||||
| (In thousands) | (53 weeks) | (52 weeks) | (52 weeks) | |||||||||||||||||
| Net earnings | $ | $ | $ | |||||||||||||||||
| Other comprehensive earnings (loss): | ||||||||||||||||||||
Unrealized gain (loss) on marketable securities, net of $ | ( | ( | ||||||||||||||||||
Unrealized (loss) gain on derivative instruments, net of $( | ( | ( | ||||||||||||||||||
Unrealized gain on pension obligation, net of $ | ||||||||||||||||||||
| Foreign currency translation adjustments | ( | ( | ||||||||||||||||||
| Other comprehensive earnings (loss) | ( | |||||||||||||||||||
| Total comprehensive earnings | $ | $ | $ | |||||||||||||||||
See accompanying notes to consolidated financial statements.
40
CONSOLIDATED STATEMENTS OF CASH FLOWS
| Year-Ended | ||||||||||||||||||||
| March 2, 2024 | February 25, 2023 | February 26, 2022 | ||||||||||||||||||
(In thousands) | (53 weeks) | (52 weeks) | (52 weeks) | |||||||||||||||||
| Operating Activities | ||||||||||||||||||||
| Net earnings | $ | $ | $ | |||||||||||||||||
| Adjustments to reconcile net earnings to net cash provided by operating activities: | ||||||||||||||||||||
| Depreciation and amortization | ||||||||||||||||||||
| Share-based compensation | ||||||||||||||||||||
| Deferred income taxes | ( | ( | ( | |||||||||||||||||
| Asset impairment charges | ||||||||||||||||||||
| Loss (gain) on disposal of property, plant and equipment | ( | ( | ||||||||||||||||||
| Impairment expense on goodwill and intangible assets | ||||||||||||||||||||
| Proceeds from New Markets Tax Credit transaction, net of deferred costs | ||||||||||||||||||||
| Settlement of New Markets Tax Credit transaction | ( | ( | ||||||||||||||||||
| Non-cash lease expense | ||||||||||||||||||||
| Other, net | ( | |||||||||||||||||||
| Changes in operating assets and liabilities: | ||||||||||||||||||||
| Receivables | ( | |||||||||||||||||||
| Inventories | ( | |||||||||||||||||||
| Contract assets | ( | ( | ||||||||||||||||||
| Accounts payable | ( | ( | ||||||||||||||||||
| Accrued compensation and benefits | ( | |||||||||||||||||||
| Contract liabilities | ( | |||||||||||||||||||
| Operating lease liability | ( | ( | ( | |||||||||||||||||
| Refundable and accrued income taxes | ( | |||||||||||||||||||
| Other current assets and liabilities | ( | |||||||||||||||||||
| Net cash provided by operating activities | ||||||||||||||||||||
| Investing Activities | ||||||||||||||||||||
| Capital expenditures | ( | ( | ( | |||||||||||||||||
| Proceeds from sales of property, plant and equipment | ||||||||||||||||||||
| Purchases of marketable securities | ( | ( | ||||||||||||||||||
| Sales/maturities of marketable securities | ||||||||||||||||||||
| Net cash (used) provided by investing activities | ( | ( | ||||||||||||||||||
| Financing Activities | ||||||||||||||||||||
| Proceeds from revolving credit facilities | ||||||||||||||||||||
| Repayment on debt | ( | ( | ||||||||||||||||||
| Repayments on revolving credit facilities | ( | ( | ||||||||||||||||||
| Proceeds from exercise of stock options | ||||||||||||||||||||
| Repurchase of common stock | ( | ( | ( | |||||||||||||||||
| Dividends paid | ( | ( | ( | |||||||||||||||||
| Other, net | ( | ( | ( | |||||||||||||||||
| Net cash used by financing activities | ( | ( | ( | |||||||||||||||||
| Effect of exchange rates on cash | ( | ( | ||||||||||||||||||
| Increase (decrease) in cash, cash equivalents and restricted cash | ( | ( | ||||||||||||||||||
| Cash, cash equivalents and restricted cash at beginning of year | ||||||||||||||||||||
| Cash and cash equivalents at end of year | $ | $ | $ | |||||||||||||||||
Non-cash Activity | ||||||||||||||||||||
| Capital expenditures in accounts payable | $ | $ | $ | |||||||||||||||||
See accompanying notes to consolidated financial statements.
41
Consolidated Statements of Shareholders' Equity
| (In thousands, except per share data) | Common Shares Outstanding | Common Stock at Par Value | Additional Paid-In Capital | Retained Earnings | Accumulated Other Comprehensive (Loss) Income | Total Shareholders' Equity | ||||||||||||||||||||||||||||||||
| Balance at February 27, 2021 | $ | $ | $ | $ | ( | $ | ||||||||||||||||||||||||||||||||
| Net earnings | — | — | — | — | ||||||||||||||||||||||||||||||||||
| Other comprehensive income, net of tax | — | — | — | — | ||||||||||||||||||||||||||||||||||
| Issuance of stock, net of cancellations | ( | — | ||||||||||||||||||||||||||||||||||||
| Share-based compensation | — | — | — | — | ||||||||||||||||||||||||||||||||||
| Exercise of stock options | — | — | ||||||||||||||||||||||||||||||||||||
| Share repurchases | ( | ( | ( | ( | — | ( | ||||||||||||||||||||||||||||||||
| Other share retirements | ( | ( | ( | ( | — | ( | ||||||||||||||||||||||||||||||||
Cash dividends ($ | — | — | — | ( | — | ( | ||||||||||||||||||||||||||||||||
| Balance at February 26, 2022 | $ | $ | $ | $ | ( | $ | ||||||||||||||||||||||||||||||||
| Net earnings | — | — | — | — | ||||||||||||||||||||||||||||||||||
| Other comprehensive loss, net of tax | — | — | — | — | ( | ( | ||||||||||||||||||||||||||||||||
| Issuance of stock, net of cancellations | — | |||||||||||||||||||||||||||||||||||||
| Share-based compensation | — | — | — | — | ||||||||||||||||||||||||||||||||||
| Exercise of stock options | ( | — | — | ( | ||||||||||||||||||||||||||||||||||
| Share repurchases | ( | ( | ( | ( | — | ( | ||||||||||||||||||||||||||||||||
| Other share retirements | ( | ( | ( | ( | — | ( | ||||||||||||||||||||||||||||||||
Cash dividends ($ | — | — | — | ( | — | ( | ||||||||||||||||||||||||||||||||
| Balance at February 25, 2023 | $ | $ | $ | $ | ( | $ | ||||||||||||||||||||||||||||||||
| Net earnings | — | — | — | — | ||||||||||||||||||||||||||||||||||
| Other comprehensive income, net of tax | — | — | — | — | ||||||||||||||||||||||||||||||||||
| Issuance of stock, net of cancellations | ( | ( | — | ( | ||||||||||||||||||||||||||||||||||
| Share-based compensation | — | — | — | — | ||||||||||||||||||||||||||||||||||
| Exercise of stock options | ( | — | — | ( | ||||||||||||||||||||||||||||||||||
| Share repurchases | ( | ( | ( | ( | — | ( | ||||||||||||||||||||||||||||||||
| Other share retirements | ( | ( | ( | ( | — | ( | ||||||||||||||||||||||||||||||||
Cash dividends ($ | — | — | — | ( | — | ( | ||||||||||||||||||||||||||||||||
| Balance at March 2, 2024 | $ | $ | $ | $ | ( | $ | ||||||||||||||||||||||||||||||||
See accompanying notes to consolidated financial statements.
42
NOTES TO CONSOLIDATED FINANCIAL STATEMENTS
1.Summary of Significant Accounting Policies and Related Data
Basis of consolidation
Fiscal year
Accounting estimates
Reclassifications
Cash equivalents
Highly liquid investments with an original maturity of three months or less are included in cash equivalents and are stated at cost, which approximates fair value.
Restricted Cash
Cash held that is specifically dedicated to fund each capital project related to our New Markets Tax Credit transactions.
Marketable securities
To the extent the amortized cost basis of the available-for-sale securities exceeds the fair value, we assess the debt securities for credit loss. When assessing the risk of credit loss, we consider factors such as the severity and the reason of the decline in value, including any changes to the rating of the security by a rating agency or other adverse conditions specifically related to the security, and management's intended holding period and time horizon for selling. During fiscal 2024, 2023, and 2022, the Company did not recognize any credit losses related to its available-for-sale securities. Further, as of March 2, 2024 and February 25, 2023, the Company did not record an allowance for credit losses related to its available-for-sale securities. Marketable securities are included in other current and non-current assets on the consolidated balance sheets and gross realized gains and losses are included in other (income) expense, net in our consolidated results of operations.
Inventories
Property, plant and equipment
Property, plant and equipment (PP&E) is recorded at cost. Significant improvements and renewals that extend the useful life of the asset are capitalized. Repairs and maintenance are charged to expense as incurred. When an asset is retired or otherwise disposed of, the cost and related accumulated depreciation are removed from the accounts and any related gains or losses are included in selling, general and administrative expenses. Long-lived assets to be held and used, such as PP&E, are reviewed for impairment whenever events or changes in circumstances indicate that the carrying amount may not be recoverable.
43
Impairment of long-lived assets
Long-lived assets or asset groups, including definite-lived intangible assets subject to amortization and property and equipment, are reviewed for impairment whenever events or changes in circumstances such as asset utilization, physical change, legal factors or other matters indicate that the carrying value of those assets may not be recoverable. When this review indicates the carrying value of an asset or asset group exceeds the sum of the undiscounted cash flows expected to result from the use and eventual disposition of the asset or asset group, an asset impairment expense is recognized in earnings in the period such a determination is made. The amount of the impairment expense recorded is the amount by which the carrying value of the impaired asset or asset group exceeds its fair value based on discounted cash flows.
As a result of restructuring plans announced during the fourth quarter of fiscal 2024, asset impairments on property, plant and equipment and leases in the amount of $6.2 million were recorded for the year ended March 2, 2024. As a result of restructuring plans announced during the second quarter of fiscal 2022, asset impairments on property, plant and equipment and leases in the amount of $21.5 million were recorded for the year ended February 26, 2022.
During the third quarter of fiscal 2022, an impairment of $3.0 million was recognized within other (income) expense within the consolidated results of operations related to a minority equity investment held by the Company. This represents a write-down of the entire investment in the other company.
During the fourth quarter of fiscal 2022, based on the finalization of our plans for integrating the Sotawall business into the Architectural Services Segment, which was effective beginning in fiscal 2023, we determined that the related definite-lived intangible assets were impaired as of February 26, 2022. As such, a of $36.7 million in finite-lived intangible assets was recognized in the fourth quarter of fiscal year 2022 within the Architectural Framing Systems Segment.
Goodwill and intangible assets
Goodwill
Goodwill represents the excess of the cost over the net tangible and identified intangible assets of acquired businesses. We evaluate goodwill for impairment annually on the first day in our fiscal fourth quarter, or more frequently if events or changes in circumstances indicate the carrying value of the goodwill may not be recoverable.
Evaluating goodwill for impairment involves the determination of the fair value of each reporting unit in which goodwill is recorded using a qualitative or quantitative analysis. A reporting unit is an operating segment or a component of an operating segment for which discrete financial information is available and reviewed by segment management on a regular basis. At the beginning of the first quarter of fiscal 2023, we began management of the Sotawall and Harmon businesses under the Architectural Services Segment in order to create a single, unified offering for larger custom curtainwall projects. In connection with the transition, leadership of our Sotawall and Harmon businesses was combined to form the Architectural Services reporting unit. We evaluated goodwill on a qualitative basis prior to and subsequent to this change for these reporting units and concluded no adjustment to the carrying value of goodwill was necessary as a result of this change. Concurrent with this change in composition of the operating segments effective at the start of our first quarter of fiscal 2023, goodwill was reallocated to the affected reporting units within each operating segment, using a relative fair value approach as outlined in ASC 350, Intangibles - Goodwill and Other.
The reporting units for our fiscal 2024 annual impairment test align with reporting segments, with the exception of our Architectural Framing Systems Segment. This segment contains two reporting units, Window and Wall Systems and Storefront and Finishing Solutions, which represent $53.6 million and $35.7 million, of the goodwill balance at March 2, 2024, respectively. During the fourth quarter of fiscal 2024, as a result of an announced restructuring plan, we reassessed our reporting units, which led to a combination of the Window and Wall Systems and Storefront and Finishing Solutions reporting units into one Architectural Framing Systems reporting unit. We evaluated goodwill on a qualitative basis prior to and subsequent to this change and concluded that no adjustment to the carrying value of goodwill was necessary as a result of this change. In addition, no qualitative indicators of impairment were identified during the fourth quarter of fiscal 2024. Following this change, we have four reporting units, which align with our reporting segments.
44
We estimate the fair value of a reporting unit using both the income approach and the market approach. The income approach uses a discounted cash flow methodology that involves significant judgment and projections of future performance. Assumptions about future revenues and future operating expenses, capital expenditures and changes in working capital are based on the annual operating plan and other business plans for each reporting unit. These plans take into consideration numerous factors, including historical experience, current and future operational plans, anticipated future economic conditions and growth expectations for the industries and end markets in which we participate. These projections are discounted using a weighted-average cost of capital, which considers the risk inherent in our projections of future cash flows. We determine the weighted-average cost of capital for this analysis by weighting the required returns on interest bearing debt and common equity capital in proportion to their estimated percentages in an expected capital structure, using published data where possible. We used discount rates that are commensurate with the risks and uncertainties inherent in the respective businesses and in the internally developed forecasts. The market approach uses a multiple of earnings and revenue based on guidelines for publicly traded companies.
Intangible assets
We have intangible assets for certain acquired trade names and trademarks which are determined to have indefinite useful lives. We test indefinite-lived intangible assets for impairment annually at the same measurement date as goodwill, the first day of our fiscal fourth quarter, or more frequently if events or changes in circumstances indicate that it is more likely than not that the asset is impaired. If the carrying amount of an indefinite-lived intangible asset exceeds its fair value, an impairment expense is recognized in an amount equal to that excess. If an impairment expense is recognized, the adjusted carrying amount becomes the asset's new accounting basis.
Fair value of indefinite-lived intangible assets is measured using the relief-from-royalty method. This method assumes the trade name or trademark has value to the extent that the owner is relieved of the obligation to pay royalties for the benefits received from the asset. This method requires estimation of future revenue from the related asset, the appropriate royalty rate, and the weighted average cost of capital. The assessment of fair value involves significant judgment and projections about future performance.
Definite-lived intangible assets are amortized based on estimated useful lives ranging from 18 months to 30 years and are reviewed for impairment whenever events or changes in circumstances indicate that the carrying amount may not be recoverable. We use undiscounted cash flows to determine whether impairment exists and measure any impairment loss using discounted cash flows to determine the fair value of long-lived assets.
The estimated useful lives of all intangible assets are reviewed annually, and we have determined that the remaining lives were appropriate. Refer to Note 6 for additional information.
Leases
We have commercially negotiated leases where we recognize a right-of-use asset and lease liability on our consolidated balance sheet at lease commencement for leases with terms greater than twelve months. The initial lease liability is recognized at the present value of remaining lease payments over the lease term. Leases with an initial term of twelve months or less are not recorded on our consolidated balance sheet. We recognize lease expense for operating leases on a straight-line basis over the lease term. We combine lease and non-lease components, such as common area maintenance costs, in calculating the related asset and lease liabilities for all underlying asset groups. Refer to Note 8 for additional information.
Self-Insurance
We obtain commercial insurance to provide coverage for potential losses in areas such as employment practices, workers' compensation, directors and officers, automobile, architect's and engineer's errors and omissions, product rework and general liability. A substantial portion of this risk is retained on a self-insured basis through our wholly-owned insurance subsidiary. We establish a reserve for estimated ultimate losses on reported claims and those incurred but not yet reported utilizing actuarial projections. Reserves are classified within other current liabilities or non-current self-insurance reserves based on expectations of when the estimated loss will be paid.
45
Warranty and project-related contingencies
Foreign currency
Derivatives and hedging activities
We are exposed to, among other risks, the impact of changes in aluminum prices, foreign currency exchange rates, and interest rates in the normal course of business. In order to manage the exposure and volatility arising from these risks, we utilize derivative financial instruments to offset a portion of these risks. We use derivative financial instruments only to hedge identified business risks, and do not hold or issue derivative financial instruments for trading purposes and are not a party to leveraged derivatives.
All derivative instruments within the scope of ASC 815, Derivatives and Hedging, are recorded as either assets or liabilities at fair value on the consolidated balance sheets. All hedging instruments that qualify for hedge accounting are designated and effective as hedges with changes recognized in other comprehensive earnings (loss). Instruments that do not qualify for hedge accounting are marked to market with changes recognized directly in earnings. Cash flows from derivative instruments are classified in the statements of cash flows in the same category as the cash flows from the items subject to designated hedge or undesignated (economic) hedge relationships. Refer to Note 4 for additional information.
Revenue recognition
Our significant accounting policy for revenue recognition follows ASC 606, Revenue from Contracts with Customers. We generate revenue from the design, engineering and fabrication of architectural glass, curtainwall, window, storefront and entrance systems, and from installing those products on non-residential buildings. We also manufacture value-added glass and acrylic products. Due to the diverse nature of our operations and various types of contracts with customers, we have businesses that recognize revenue at a point in time at shipment, businesses that recognize revenue following an over-time input method and businesses that recognize revenue following an over-time output method.
Approximately 42 % of our fiscal 2024 revenue was recognized at the time products were shipped from our manufacturing facilities, which is when control is transferred to our customer, consistent with past practices. These businesses do not generate contract-related assets or liabilities. Variable consideration associated with these contracts and orders, generally related to early pay discounts or volume rebates, is not considered significant.
Approximately 34 % of our fiscal 2024 revenue was from long-term, fixed-price contracts, following an over-time input method. The contracts for these businesses have a single, bundled performance obligation, as these businesses generally provide interrelated products and services and integrate these products and services into a combined output specified by the customer. The customer obtains control of this combined output, generally integrated window systems or installed window and curtainwall systems, over time. We measure progress on these contracts following an input method, by comparing total costs incurred to-date to the total estimated costs for the contract, and record that proportion of the total contract price as revenue in the period. Contract costs include materials, labor and other direct costs related to contract performance. We believe this method of recognizing revenue is consistent with our progress in satisfying our contract obligations.
Due to the nature of the work required under these long-term contracts, the estimation of total revenue and costs incurred throughout a project is subject to many variables and requires significant judgment. It is common for these contracts to contain potential bonuses or penalties which are generally awarded or charged upon certain project milestones or cost or timing targets, and these can be based on customer discretion. We estimate variable consideration at the most likely amount to which we expect to be entitled. We include estimated amounts in the transaction price to the extent that it is probable that a significant reversal of cumulative revenue recognized will not occur when the uncertainty associated with the variable consideration is resolved. Our estimates of variable consideration and determination of whether to include estimated amounts in the transaction price are based largely on our assessments of anticipated performance and all information (historical, current and forecasted) that is reasonably available to us.
46
Long-term contracts are often modified to account for changes in contract specifications and requirements of work to be performed. We consider contract modifications to exist when the modification, generally through a change order, either creates new or changes existing enforceable rights and obligations, and we evaluate these types of modifications to determine whether they may be considered distinct performance obligations. In most cases, these contract modifications are for goods or services that are not distinct from the existing contract, due to the significant integration service provided in the context of the contract. Therefore, these modifications are accounted for as part of the existing contract. The effect of a contract modification on the transaction price and our measure of progress is recognized as an adjustment to revenue, generally on a cumulative catch-up basis.
Typically, under these fixed-price contracts, we bill our customers following an agreed-upon schedule based on work performed. Because the progress billings do not generally correspond to our measurement of revenue on a contract, we generate contract assets when we have recognized revenue in excess of the amount billed to the customer. We generate contract liabilities when we have billed the customer in excess of revenue recognized on a contract.
Approximately 24 % of our fiscal 2024 revenue was recognized following an over-time output method based upon units produced. The customer is considered to have control over the products at the time of production, as the products are highly customized with no alternative use, and we have an enforceable right to payment for performance completed over the production period. We believe this over-time output method of recognizing revenue reasonably depicts the fulfillment of our performance obligations under our contracts. Billings still occur upon shipment. Therefore, contract assets are generated for the unbilled amounts on contracts when production is complete. Variable consideration associated with these orders, generally related to early pay discounts, is not considered significant.
Additionally, we have made the following policy elections associated with revenue recognition:
•We account for shipping and handling activities that occur after control of the related goods transfers to the customer as fulfillment activities, instead of assessing such activities as performance obligations.
•We exclude from the transaction price all sales taxes related to revenue-producing transactions that are collected from the customer for a government authority. We are considered a pass-through conduit for collecting and remitting sales taxes.
•We generally expense incremental costs of obtaining a contract when incurred because the amortization period would be less than one year. These costs primarily relate to sales commissions and are included in selling, general and administrative expenses.
•We do not adjust contract price for a significant financing component, as we expect the period between when our goods and services are transferred to the customer and when the customer pays for those goods and services to be less than a year.
Shipping and handling
Restructuring
Restructuring charges are recorded as a result of fundamental changes in the manner in which certain business functions are conducted, including initiatives to drive earnings and cash flow growth and to realign and simplify our business structure. These charges primarily consist of employee severance benefits, asset impairments on property, plant and equipment and operating lease assets and termination penalties for facility closures and consolidations. We record restructuring accruals when it is probable that a liability has been incurred and the amount of the liability is reasonably estimable. To the extent our assumptions and estimates differ from our actual costs, subsequent adjustments to restructuring accruals have been and will be required. Restructuring accruals for severance-related costs are included in accrued compensation and related benefits and accruals for remaining obligations and termination penalties are included in other current liabilities in our consolidated balance sheets. Refer to Note 16 for additional information.
Research and development
Advertising
47
Income taxes
The Company recognizes deferred tax assets and liabilities based upon the future tax consequences of temporary differences between financial statement carrying amounts of assets and liabilities and their respective tax bases. Refer to Note 13 for additional information.
Subsequent events
We have evaluated subsequent events for potential recognition and disclosure through the date of this filing and determined that there were no subsequent events that required recognition or disclosure in the consolidated financial statements.
Adoption of new accounting standards
The following table summarizes the obligation activity and outstanding as of March 2, 2024 that we have confirmed as valid to the administrators of our program with U.S. Bank:
| (In thousands) | 2024 | |||||||
Balance at beginning of period | $ | |||||||
Obligations added to the program | ||||||||
Obligations settled | ( | |||||||
| $ | ||||||||
At the beginning of fiscal 2022, we adopted the guidance in ASU 2019-12, Income Taxes (Topic 740): Simplifying the Accounting for Income Taxes. The amendments in this ASU removed exceptions on intra-period tax allocations and reporting and provided simplification on accounting for franchise taxes, tax basis goodwill and tax law changes. The adoption of this ASU did not have a significant impact on the consolidated financial statements.
At the beginning of fiscal 2022, we adopted the guidance in ASU 2020-04, Reference Rate Reform (Topic 848): Facilitation of the Effects of Reference Rate Reform on Financial Reporting. The amendments in this ASU apply only to contracts, hedging relationships, and other transactions that reference LIBOR or another reference rate expected to be discontinued because of reference rate reform. The adoption of this ASU did not have a significant impact on the consolidated financial statements.
Accounting standards not yet adopted
In November 2023, the FASB issued ASU 2023-07, Improvements to Reportable Segment Disclosures, which expands the required disclosure for reportable segments. This guidance requires entities to disclose significant segment expenses and other segment items on an annual and interim basis and to provide in interim periods all segment disclosures which are currently required annually. This ASU additionally requires entities to disclose the title and position of the individual or the name of the group or committee identified as its chief operating decision-maker. Such guidance, which is required to be applied retrospectively, is effective for fiscal years beginning after December 15, 2023, and interim periods within fiscal years beginning after December 15, 2024, although early adoption is permitted. While the adoption of this ASU will not have an impact on our financial position and/or results of operations, we are currently evaluating the impact to our segment disclosures.
48
In December 2023, the FASB issued ASU 2023-09, Improvements to Income Tax Disclosures, intended to enhance the transparency and decision-usefulness of income tax disclosures. Such guidance requires entities to provide additional information within their income tax rate reconciliation, including further disclosure of federal, state, and foreign income taxes and to provide more details about these reconciling items if a quantitative threshold is met. This guidance additionally requires expanded disclosure of income taxes paid, including amounts paid for federal, state, and foreign taxes. This ASU, which is required to be applied prospectively, is effective for fiscal years beginning after December 15, 2024, although early adoption and retrospective application is permitted. While the adoption of this ASU will not have an impact on our financial position and/or results of operations, we are currently evaluating the impact on our income tax disclosures, including the processes and controls around the collection of this information.
2.Revenue, Receivables and Contract Assets and Liabilities
Revenue
The following table disaggregates total revenue by timing of recognition (see Note 15 for disclosure of revenue by segment):
| March 2, 2024 | February 25, 2023 | February 26, 2022 | ||||||||||||||||||
| (In thousands) | (53 weeks) | (52 weeks) | (52 weeks) | |||||||||||||||||
| Recognized at shipment | $ | $ | $ | |||||||||||||||||
| Recognized over time (input method) | ||||||||||||||||||||
| Recognized over time (output method) | ||||||||||||||||||||
| Total | $ | $ | $ | |||||||||||||||||
Receivables
Receivables reflected in the financial statements represent the net amount expected to be collected. An allowance for credit losses is established based on expected losses. Expected losses are estimated by reviewing individual accounts, considering aging, financial condition of the debtor, recent payment history, current and forecast economic conditions and other relevant factors. Upon billing, aging of receivables is monitored until collection. An account is considered current when it is within agreed upon payment terms. An account is written off when it is determined that the asset is no longer collectible. Retainage on construction contracts represents amounts withheld by our customers on long-term projects until the project reaches a level of completion where amounts are released.
| (In thousands) | 2024 | 2023 | ||||||||||||
| Trade accounts | $ | $ | ||||||||||||
| Construction contracts | ||||||||||||||
| Total receivables | ||||||||||||||
| Less: allowance for credit losses | ||||||||||||||
| Receivables, net | $ | $ | ||||||||||||
The following table summarizes the activity in the allowance for credit losses:
| (In thousands) | 2024 | 2023 | ||||||||||||
| Beginning balance | $ | $ | ||||||||||||
| Additions charged to costs and expenses | ||||||||||||||
| Deductions from allowance, net of recoveries | ( | ( | ||||||||||||
| Other deductions | ( | |||||||||||||
| Ending balance | $ | $ | ||||||||||||
49
Contract assets and liabilities
Contract assets consist of retainage, costs and earnings in excess of billings and other unbilled amounts typically generated when revenue recognized exceeds the amount billed to the customer. Retainage on construction contracts represents amounts withheld by our customers on long-term projects until the project reaches a level of completion where amounts are released to us from the customer. Contract liabilities consist of billings in excess of costs and earnings and other unearned revenue on contracts.
The time period between when performance obligations are complete and when payment is due is not significant. In certain of our businesses that recognize revenue over time, progress billings follow an agreed-upon schedule of values.
| (In thousands) | March 2, 2024 | February 25, 2023 | ||||||||||||
| Contract assets | $ | $ | ||||||||||||
| Contract liabilities | ||||||||||||||
The change in contract assets and contract liabilities was due to timing of project activity from businesses that operate under long-term contracts.
Other contract-related disclosures
| March 2, 2024 | February 25, 2023 | |||||||||||||
| (In thousands) | (53 weeks) | (52 weeks) | ||||||||||||
| Revenue recognized related to contract liabilities from prior year-end | $ | $ | ||||||||||||
| Revenue recognized related to prior satisfaction of performance obligations | ||||||||||||||
Some of our contracts have an expected duration of longer than a year, with performance obligations extending over that time frame. Generally, these contracts are found in our businesses that typically operate with long-term contracts, which recognize revenue over time. The transaction price associated with unsatisfied performance obligations at March 2, 2024 are expected to be satisfied, and the corresponding revenue to be recognized, over the following estimated time periods:
| (In thousands) | March 2, 2024 | |||||||
Within | $ | |||||||
Within | ||||||||
Beyond | ||||||||
| Total | $ | |||||||
3.Supplemental Balance Sheet Information
Inventories
| (In thousands) | 2024 | 2023 | ||||||||||||
| Raw materials | $ | $ | ||||||||||||
| Work-in-process | ||||||||||||||
| Finished goods | ||||||||||||||
| Total inventories, net | $ | $ | ||||||||||||
Other current liabilities
| (In thousands) | 2024 | 2023 | ||||||||||||
| Warranties and backcharges | $ | $ | ||||||||||||
| Accrued self-insurance reserves | ||||||||||||||
| Income and other taxes | ||||||||||||||
| Other | ||||||||||||||
| Total other current liabilities | $ | $ | ||||||||||||
50
Other non-current liabilities
| (In thousands) | 2024 | 2023 | ||||||||||||
| Deferred warranty revenue | $ | $ | ||||||||||||
| Deferred benefit from New Markets Tax Credit transactions | ||||||||||||||
| Deferred compensation plan | ||||||||||||||
| Retirement plan obligations | ||||||||||||||
| Deferred tax liabilities | ||||||||||||||
| Other | ||||||||||||||
| Total other non-current liabilities | $ | $ | ||||||||||||
4.Financial Instruments
Marketable Securities
Through our wholly-owned insurance subsidiary, Prism Assurance, Ltd. (Prism), we hold the following available-for-sale marketable securities, made up of municipal and corporate bonds:
| (In thousands) | Amortized Cost | Gross Unrealized Gains | Gross Unrealized Losses | Estimated Fair Value | ||||||||||||||||||||||
| March 2, 2024 | $ | $ | $ | $ | ||||||||||||||||||||||
| February 25, 2023 | ||||||||||||||||||||||||||
Prism insures a portion of our general liability, workers' compensation and automobile liability risks using reinsurance agreements to meet statutory requirements. The reinsurance carrier requires Prism to maintain fixed-maturity investments, for the purpose of providing collateral for Prism's obligations under the reinsurance agreements.
The amortized cost and estimated fair values of our municipal and corporate bonds at March 2, 2024, by contractual maturity, are shown below. Expected maturities may differ from contractual maturities, as borrowers may have the right to call or prepay obligations with or without penalty. Investments that are due within one year are included in other current assets while those due after one year are included as other non-current assets. Gross realized gains and losses were insignificant for all periods presented.
| (In thousands) | Amortized Cost | Estimated Fair Value | ||||||||||||
| Due within one year | $ | $ | ||||||||||||
| Due after one year through five years | ||||||||||||||
| Total | $ | $ | ||||||||||||
Derivative instruments
We use interest rate swaps, currency put options, and forward purchase contracts to manage risks generally associated with foreign exchange rate, interest rate and commodity price fluctuations. The information that follows explains the various types of derivatives and financial instruments we use, how such instruments are accounted for, and how such instruments impact our financial position and performance.
In fiscal 2020, we entered into an interest rate swap with a notional value of $30 million with an expiration date of February 5, 2026, to hedge a portion of our exposure to variability in cash flows from interest payments on our floating-rate revolving credit facility.
We periodically enter into forward purchase contracts to manage the risk associated with fluctuations in foreign currency rates (primarily related to the Canadian dollar and Euro) and aluminum prices, generally with an original maturity date of less than one year. As of March 2, 2024, we held foreign exchange option contracts and aluminum purchase contracts with U.S. dollar notional values of $1.4 million and $9.3 million, respectively.
The mark to market adjustments on these derivative instruments are recorded within our consolidated balance sheets within other current assets and other current liabilities. Gains or losses associated with these instruments are recorded as a component of accumulated other comprehensive loss until which time the hedged transaction is settled and gains or losses are reclassified to earnings.
51
Fair value measurements
Financial assets and liabilities are classified in the fair value hierarchy based on the lowest level input that is significant to the fair value measurement: Level 1 (unadjusted quoted prices in active markets for identical assets or liabilities); Level 2 (observable market inputs, other than quoted prices included in Level 1); and Level 3 (unobservable inputs that cannot be corroborated by observable market data). We do not have any Level 3 assets or liabilities.
Financial assets and liabilities measured at fair value on a recurring basis were:
| (In thousands) | Quoted Prices in Active Markets (Level 1) | Other Observable Inputs (Level 2) | Total Fair Value | |||||||||||||||||
| March 2, 2024 | ||||||||||||||||||||
| Assets: | ||||||||||||||||||||
| Money market funds | $ | $ | $ | |||||||||||||||||
| Municipal and corporate bonds | ||||||||||||||||||||
| Foreign currency option contract | ||||||||||||||||||||
| Interest rate swap contract | ||||||||||||||||||||
| Liabilities: | ||||||||||||||||||||
| Aluminum hedging contract | ||||||||||||||||||||
| February 25, 2023 | ||||||||||||||||||||
| Assets: | ||||||||||||||||||||
| Money market funds | $ | $ | $ | |||||||||||||||||
| Municipal and corporate bonds | ||||||||||||||||||||
| Interest rate swap contract | ||||||||||||||||||||
| Liabilities: | ||||||||||||||||||||
| Foreign currency option contract | ||||||||||||||||||||
| Aluminum hedging contract | ||||||||||||||||||||
Money market funds and commercial paper
Fair value of money market funds was determined based on quoted prices for identical assets in active markets. Commercial paper was measured at fair value using inputs based on quoted prices for similar securities in active markets. These assets are included within cash and cash equivalents on our consolidated balance sheets.
Municipal and corporate bonds
Municipal and corporate bonds were measured at fair value based on market prices from recent trades of similar securities and are classified within our consolidated balance sheets as other current or other non-current assets based on maturity date.
Derivative instruments
The interest rate swap is measured at fair value using other observable market inputs, based off benchmark interest rates. Forward foreign exchange and forward purchase aluminum contracts are measured at fair value using other observable market inputs, such as quotations on forward foreign exchange points, foreign currency exchange rates and forward purchase aluminum prices. Derivative positions are primarily valued using standard calculations and models that use as their basis readily observable market parameters. Industry standard data providers are our primary source for forward and spot rate information for interest and currency rates and aluminum prices.
Nonrecurring fair value measurements
We measure certain financial instruments at fair value on a nonrecurring basis including goodwill, intangible assets, property and equipment and right-of-use lease assets. These assets were initially measured and recognized at amounts equal to the fair value determined as of the date of acquisition or purchase, subject to changes in value only for foreign currency translation. Periodically, these assets are tested for impairment, by comparing their respective carrying values to the estimated fair value of the reporting unit or asset group in which they reside. In the event any of these assets were to become impaired, we would recognize an impairment expense equal to the amount by which the carrying value of the reporting unit, impaired asset or asset group exceeds its estimated fair value.
52
5.Property, Plant and Equipment
| (In thousands) | 2024 | 2023 | ||||||||||||
| Land | $ | $ | ||||||||||||
| Buildings and improvements | ||||||||||||||
| Machinery and equipment | ||||||||||||||
| Computer and office equipment and furniture | ||||||||||||||
| Construction in progress | ||||||||||||||
| Total property, plant and equipment | ||||||||||||||
| Less: accumulated depreciation | ||||||||||||||
| Net property, plant and equipment | $ | $ | ||||||||||||
Depreciation expense was $37.6 million, $38.2 million, and $42.2 million in fiscal 2024, 2023, and 2022, respectively.
6. Goodwill and Other Intangible Assets
Goodwill
Refer to Note 1 to the consolidated financial statements for a description of the Accounting Policy related to Goodwill.
Goodwill represents the excess of the cost over the net tangible and identified intangible assets of acquired businesses. We evaluate goodwill for impairment annually as of the first day of our fiscal fourth quarter, or more frequently if events or changes in circumstances indicate the carrying value of goodwill may not be recoverable, as described in Note 1. Based on the impairment analysis performed in the fourth quarter, estimated fair value was in excess of carrying value at all of our reporting units.
The carrying amount of goodwill attributable to each reporting segment was:
| (In thousands) | Architectural Framing Systems | Architectural Glass | Architectural Services | Large-Scale Optical | Total | |||||||||||||||||||||||||||
| Balance at February 26, 2022 | $ | $ | $ | $ | $ | |||||||||||||||||||||||||||
Reallocation among reporting units(1) | ( | |||||||||||||||||||||||||||||||
| Foreign currency translation | ( | ( | ( | |||||||||||||||||||||||||||||
| Balance at February 25, 2023 | ||||||||||||||||||||||||||||||||
| Foreign currency translation | ||||||||||||||||||||||||||||||||
| Balance at March 2, 2024 | $ | $ | $ | $ | $ | |||||||||||||||||||||||||||
(1) Represents the reallocation of goodwill as a result of transitioning Sotawall from the Architectural Framing Systems Segment to the Architectural Services Segment as of the start of the first quarter of fiscal 2023.
53
Intangible assets
Indefinite-lived intangible assets
We have intangible assets for certain acquired trade names and trademarks which are determined to have indefinite useful lives. We test indefinite-lived intangible assets for impairment annually at the same measurement date as goodwill, the first day of our fiscal fourth quarter, or more frequently if events or changes in circumstances indicate that it is more likely than not that the asset is impaired as described in Note 1. Based on our annual analysis, the fair value of each of our trade names and trademarks exceeded the carrying amount. During fiscal 2022, as a result of triggering events resulting from the finalization of our plans for integrating the Sotawall business into the Architectural Services Segment, beginning in fiscal 2023, it was determined that the carrying value of the Sotawall trade name exceeded fair value by $12.7 million as it was determined to have an immaterial fair value, resulting in the as of fiscal 2022 year end. This amount was recognized as impairment expense in the fourth quarter ended February 26, 2022.
Definite-lived intangible assets
Long-lived assets or asset groups, including intangible assets subject to amortization and property and equipment, are reviewed for impairment whenever events or changes in circumstances indicate that the carrying value of those assets may not be recoverable, as described in Note 1. Due to triggering events as a result of finalization of our plans for integrating the Sotawall business into the Architectural Services Segment, beginning in fiscal 2023, we determined that certain related finite-lived intangible assets were impaired as of February 26, 2022. As such, a long-lived asset impairment charge of $36.7 million in finite-lived intangible assets was recognized in the fourth quarter of fiscal year 2022.
The gross carrying amount of our intangible assets and related accumulated amortization was:
| (In thousands) | Gross Carrying Amount | Accumulated Amortization | Foreign Currency Translation | Net | ||||||||||||||||||||||
| March 2, 2024 | ||||||||||||||||||||||||||
Definite-lived intangible assets: | ||||||||||||||||||||||||||
| Customer relationships | $ | $ | ( | $ | $ | |||||||||||||||||||||
| Other intangibles | ( | |||||||||||||||||||||||||
Total | ( | |||||||||||||||||||||||||
| Indefinite-lived intangible assets: | ||||||||||||||||||||||||||
Trademarks | — | |||||||||||||||||||||||||
| Total intangible assets | $ | $ | ( | $ | $ | |||||||||||||||||||||
| February 25, 2023 | ||||||||||||||||||||||||||
| Definite-lived intangible assets: | ||||||||||||||||||||||||||
| Customer relationships | $ | $ | ( | $ | ( | $ | ||||||||||||||||||||
| Other intangibles | ( | ( | ||||||||||||||||||||||||
Total | ( | ( | ||||||||||||||||||||||||
| Indefinite-lived intangible assets: | ||||||||||||||||||||||||||
Trademarks | — | ( | ||||||||||||||||||||||||
| Total intangible assets | $ | $ | ( | $ | ( | $ | ||||||||||||||||||||
Amortization expense on finite-lived intangible assets was $4.9 million, $4.2 million and $7.8 million in fiscal 2024, 2023 and 2022, respectively. All amortization expense is included within selling, general and administrative expenses. Estimated future amortization expense for finite-lived intangible assets is:
| (In thousands) | 2025 | 2026 | 2027 | 2028 | 2029 | |||||||||||||||||||||||||||
| Estimated amortization expense | $ | $ | $ | $ | $ | |||||||||||||||||||||||||||
7. Debt
As of March 2, 2024, we had a committed revolving credit facility with Wells Fargo Bank, N.A. as administrative agent, and other lenders (U.S. credit facility) with maximum borrowings of up to $385 million and a maturity of August 5, 2027. Outstanding borrowings under the revolving credit facility were $50.0 million and $156.0 million as of March 2, 2024 and February 25, 2023, respectively.
54
We also maintain two Canadian committed, revolving credit facilities with the Bank of Montreal totaling $25.0 million USD (Canadian facilities). The Canadian facilities expire annually in February, but can be renewed each year solely at our discretion until August 5, 2027. Therefore, we classify all outstanding amounts under these facilities as long-term debt within our consolidated balance sheets. At March 2, 2024, we had no outstanding borrowings under these Canadian facilities. At February 25, 2023, outstanding borrowings under these Canadian facilities were $1.8 million.
Our revolving credit facilities contain two maintenance financial covenants that require us to stay below a maximum debt-to-EBITDA ratio of 3.25 and maintain a minimum ratio of EBITDA-to-interest expense of 3.00 . Both ratios are computed quarterly, with EBITDA calculated on a rolling four-quarter basis. At March 2, 2024, we were in compliance with both financial covenants.
The revolving credit facilities also contain an acquisition holiday. In the event we make an acquisition for which the purchase price is greater than $75 million, we can elect to increase the maximum debt-to-EBITDA ratio to 3.75 for a period of four consecutive fiscal quarters, commencing with the fiscal quarter in which a qualifying acquisition occurs. No more than two acquisition "holidays" can occur during the term of the facilities, and at least two fiscal quarters must separate qualifying acquisitions.
Borrowings under the credit facilities bear floating interest at either the Base Rate or Term Secured Overnight Financing Rate (SOFR), or, in the case of the Canadian facilities, Canadian Overnight Repo Rate Average (CORRA) plus, in each a margin based on the Leverage Ratio (as defined in the Credit Agreements). For Base Rate borrowings, the margin ranges from 0.125 % to 0.75 %. For Term SOFR and CORRA borrowings, the margin ranges from 1.125 % to 1.75 %, with an incremental Term SOFR and CORRA adjustment of 0.10 % and 0.29547 %.
The U.S. credit facility also contains an "accordion" provision. Under this provision, we can request that the facility be increased by as much as $200.0 million. Any Lender may elect or decline to participate in the requested increase at the Lender’s sole discretion.
At March 2, 2024, we had a total of $15.0 million of ongoing letters of credit related to industrial revenue bonds, construction contracts and insurance collateral that expire in fiscal year 2025 and reduce borrowing capacity under the revolving credit facility. As of March 2, 2024, the amount available for revolving borrowings was $320.0 million and $25.0 million under the U.S. credit facility and Canadian facilities, respectively.
At March 2, 2024, debt included $12.0 million of industrial revenue bonds that mature in fiscal years 2036 through 2043.
The fair value of our U.S. credit facility, Canadian credit facilities and industrial revenue bonds approximated carrying value at March 2, 2024, and would be classified as Level 2 within the fair value hierarchy described in Note 4, due to the variable interest rates on these instruments.
Debt maturities and other selected information follows:
| (In thousands) | 2025 | 2026 | 2027 | 2028 | 2029 | Thereafter | Total | |||||||||||||||||||||||||||||||||||||
| Maturities | $ | $ | $ | $ | $ | $ | $ | |||||||||||||||||||||||||||||||||||||
| (In thousands, except percentages) | 2024 | 2023 | ||||||||||||
| Average daily borrowings during the year | $ | $ | ||||||||||||
| Weighted average interest rate during the year | % | % | ||||||||||||
| (In thousands) | March 2, 2024 | February 25, 2023 | February 26, 2022 | |||||||||||||||||
| Interest on debt | $ | $ | $ | |||||||||||||||||
| Interest rate swap (income) expense | ( | ( | ||||||||||||||||||
| Other interest expense | ||||||||||||||||||||
Interest expense, net | $ | $ | $ | |||||||||||||||||
Interest payments were $9.3 million in fiscal 2024, $8.2 million in fiscal 2023 and $3.5 million in fiscal 2022.
55
8. Leases
We have operating leases for certain of the buildings and equipment used in our operations. We determine if an arrangement contains a lease at inception. Under ASU 2016-20, Leases, we have elected the package of practical expedients permitted under the transition guidance in adopting ASC 842, which, among other things, allowed us to carry forward our historical lease classification. Operating lease assets and liabilities are recognized at the lease commencement date based on the present value of lease payments over the lease term. Lease expense is recognized on a straight-line basis over the lease term. Our leases have remaining lease terms of to ten years , some of which include renewal options that can extend the lease for up to an additional ten years , at our sole discretion. We have made an accounting policy election not to record leases with an original term of twelve months or less on our consolidated balance sheet; such leases are expensed on a straight-line basis over the lease term. As of March 2, 2024, we have one additional future operating lease commitment of $13.7 million that is signed but has not yet commenced, for one facility located in Texas within our Architectural Services Segment.
In determining lease asset value, we consider fixed or variable payment terms, prepayments, incentives, and options to extend, terminate or purchase. Renewal, termination or purchase options affect the lease term used for determining lease asset value only if the option is reasonably certain to be exercised. We use a discount rate for each lease based upon an estimated incremental borrowing rate over a similar term. We have elected the practical expedient to account for lease and non-lease components (e.g., common-area maintenance costs) as a single lease component. Our lease agreements do not contain any material residual value guarantees or material restrictive covenants.
The components of lease expense were as follows:
| (In thousands) | March 2, 2024 | February 25, 2023 | ||||||||||||
| Operating lease cost | $ | $ | ||||||||||||
| Short-term lease cost | ||||||||||||||
| Variable lease cost | ||||||||||||||
| Sublease income | ( | ( | ||||||||||||
| Total lease cost | $ | $ | ||||||||||||
Other supplemental information related to leases are as follows:
| (In thousands) | March 2, 2024 | February 25, 2023 | ||||||||||||
| Cash paid for amounts included in the measurement of operating lease liabilities | $ | $ | ||||||||||||
| Lease assets obtained in exchange for new operating lease liabilities | $ | $ | ||||||||||||
| Weighted-average remaining lease term - operating leases | ||||||||||||||
| Weighted-average discount rate - operating leases | % | % | ||||||||||||
Future maturities of lease liabilities are as follows:
| (In thousands) | 2024 | |||||||
| Fiscal 2025 | $ | |||||||
| Fiscal 2026 | ||||||||
| Fiscal 2027 | ||||||||
| Fiscal 2028 | ||||||||
| Fiscal 2029 | ||||||||
| Thereafter | ||||||||
| Total lease payments | ||||||||
| Less: Amounts representing interest | ||||||||
| Present value of lease liabilities | $ | |||||||
56
9. Employee Benefit Plans
401(k) Retirement Plan
We sponsor a single 401(k) retirement plan covering substantially all full-time, non-union employees, as well as union employees at two of our manufacturing facilities. Under the plan, employees are allowed to contribute up to 60 % of eligible earnings to the plan, up to statutory limits. On January 1, 2023, we began matching 100 % of the first two percent contributed and 50 % of the next four percent contributed on eligible compensation that non-union employees contribute. Previously, we matched 100 % of the first one percent contributed and 50 % of the next five percent contributed on eligible compensation that non-union employees contribute. We contribute to the union plans based on the contractual terms. In total, our matching contributions were $9.6 million in fiscal 2024, $8.6 million in fiscal 2023 and $7.7 million in fiscal 2022.
Deferred Compensation Plan
We maintain a plan that allows participants to defer compensation. The deferred compensation liability was $5.9 million and $9.5 million at March 2, 2024 and February 25, 2023, respectively. We have investments in corporate-owned life insurance policies (COLI) of $8.5 million and money market funds (classified as cash equivalents) of $0.3 million with the intention of utilizing them as long-term funding sources for this plan. The COLI assets are recorded at their net cash surrender values and are included in other non-current assets in the consolidated balance sheets.
Plans under Collective Bargaining Agreements
We contribute to a number of multi-employer union retirement plans, which provide retirement benefits to the majority of our union-represented employees; none of the plans is considered significant. However, the risks of participating in these multi-employer plans are different from single-employer plans in the following aspects:
•Assets contributed to these plans by one employer may be used to provide benefits to employees of other participating employers
•If a participating employer stops contributing to the plan, the unfunded obligations of the plan may be borne by the remaining participating employers
•If we choose to stop participating in some of these plans, we may be required to pay those plans an amount based on the underfunded status of the plan, referred to as a withdrawal liability
Our participation in these plans is outlined in the following table. The most recent Pension Protection Act zone status available in 2024 and 2023 relates to the plan years ending December 31, 2023 and December 31, 2022, respectively.
The zone status is based on information that we have received from each plan, certified by an actuary. Among other factors, plans in the red zone are generally less than 65% funded, plans in the yellow zone are between 65% and 80% funded, and plans in the green zone are at least 80% funded.
57
| Pension Protection Act Zone Status | Contributions (In thousands) | |||||||||||||||||||||||||||||||||||||||||||||||||||||||||||||
| Pension Fund | EIN/Pension Plan Number | 2024 | 2023 | 2024 | 2023 | 2022 | FIP/RP Status Pending/Implemented(2) | Minimum Contribution | Surcharge Imposed | Expiration Date of Collective Bargaining Agreement(1) | ||||||||||||||||||||||||||||||||||||||||||||||||||||
| Iron Workers Local Union No. 5 and Iron Workers Employers Association Employees Pension Trust Fund | 521075473 | Green | Green | $ | $ | $ | No | No | No | 5/31/2017 | ||||||||||||||||||||||||||||||||||||||||||||||||||||
| International Painters and Allied Trades Industry Pension Fund | 526073909 | Red | Red | Implemented | No | No | 11/30/2017 | |||||||||||||||||||||||||||||||||||||||||||||||||||||||
| Ironworkers Local 580 Pension Fund | 136178514 | Green | Green | Implemented | No | Yes | 6/30/2023 | |||||||||||||||||||||||||||||||||||||||||||||||||||||||
| Western Glaziers Retirement Plan (Washington) | 916123685 | Green | Green | No | No | No | 6/30/2017 | |||||||||||||||||||||||||||||||||||||||||||||||||||||||
| Iron Workers Mid-America Pension Fund | 366488227 | Green | Green | No | No | No | 5/31/2017 | |||||||||||||||||||||||||||||||||||||||||||||||||||||||
| Glazier's Union Local 27 Pension and Retirement Plan | 366034076 | Green | Green | No | No | No | 5/31/2017 | |||||||||||||||||||||||||||||||||||||||||||||||||||||||
| Atlanta Ironworkers Local Union 387 Pension Plan | 586051152 | Green | Green | No | No | No | 1/31/2017 | |||||||||||||||||||||||||||||||||||||||||||||||||||||||
| Western Glaziers Retirement Fund (Oregon and Southwest Washington) | 936074376 | Green | Green | No | No | No | 11/30/2017 | |||||||||||||||||||||||||||||||||||||||||||||||||||||||
| Other funds | ||||||||||||||||||||||||||||||||||||||||||||||||||||||||||||||
| Total contributions | $ | $ | $ | |||||||||||||||||||||||||||||||||||||||||||||||||||||||||||
(1) Plans include contributions required by collective bargaining agreements which have expired, but contain provisions automatically renewing their terms in the absence of a subsequent negotiated agreement. | ||||||||||||||||||||||||||||||||||||||||||||||||||||||||||||||
(2) FIP is defined as Funding Improvement Plan; RP is defined as Rehabilitation Plan | ||||||||||||||||||||||||||||||||||||||||||||||||||||||||||||||
The Company was listed in the plans' Forms 5500 as providing more than 5% of the total contributions for the following plans and plan years:
| Pension Fund | Year contributions to Plan Exceeded More Than 5 Percent of Total Contributions | |||||||
| Iron Workers Local Union No. 5 and Iron Workers Employers Association Employees Pension Trust Fund | 2024, 2023 and 2022 | |||||||
| Western Glaziers Retirement Plan (Washington) | 2022 | |||||||
| Iron Workers Mid-America Pension Fund | 2023 and 2022 | |||||||
| Atlanta Ironworkers Local Union 387 Pension Plan | 2023 | |||||||
Amounts contributed in fiscal 2024, 2023, and 2022 to defined contribution multiemployer plans were $2.2 million, $2.2 million and $1.6 million, respectively.
Obligations and Funded Status of Defined-Benefit Pension Plans
We sponsor the Tubelite Inc. Hourly Employees' Pension Plan, a defined-benefit pension plan that was frozen to new entrants in fiscal 2004, with no additional benefits accruing to plan participants after such time. We also sponsor an unfunded SERP, a defined-benefit pension plan that was frozen to new entrants in fiscal 2009, with no additional benefits accruing to plan participants after such time.
58
The following tables present reconciliations of the benefit obligation and the funded status of these plans. The Tubelite plan uses a measurement date as of the calendar month-end closest to our fiscal year-end, while the SERP uses a measurement date aligned with our fiscal year-end.
| (In thousands) | 2024 | 2023 | ||||||||||||
| Change in projected benefit obligation | ||||||||||||||
| Benefit obligation beginning of period | $ | $ | ||||||||||||
| Interest cost | ||||||||||||||
| Actuarial gain | ( | ( | ||||||||||||
| Benefits paid | ( | ( | ||||||||||||
| Benefit obligation at measurement date | ||||||||||||||
| Change in plan assets | ||||||||||||||
| Fair value of plan assets beginning of period | $ | $ | ||||||||||||
| Actual return on plan assets | ( | |||||||||||||
| Company contributions | ||||||||||||||
| Benefits paid | ( | ( | ||||||||||||
| Fair value of plan assets at measurement date | ||||||||||||||
| Underfunded status | $ | ( | $ | ( | ||||||||||
The funded status was recognized in the consolidated balance sheets as follows:
| (In thousands) | 2024 | 2023 | ||||||||||||
| Other non-current assets | $ | $ | ||||||||||||
| Current liabilities | ( | ( | ||||||||||||
| Other non-current liabilities | ( | ( | ||||||||||||
| Total | $ | ( | $ | ( | ||||||||||
The following was included in accumulated other comprehensive loss and has not yet been recognized as a component of net periodic benefit cost:
| (In thousands) | 2024 | 2023 | ||||||||||||
| Net actuarial loss | $ | $ | ||||||||||||
The net actuarial gain recognized in comprehensive earnings, net of tax expense, was $0.9 million in fiscal 2024, and $0.7 million in fiscal 2023.
Components of the defined-benefit pension plans' net periodic benefit cost:
| (In thousands) | 2024 | 2023 | 2022 | |||||||||||||||||
| Interest cost | $ | $ | $ | |||||||||||||||||
| Expected return on assets | ( | ( | ( | |||||||||||||||||
| Net periodic benefit cost | $ | $ | $ | |||||||||||||||||
Total net periodic pension benefit cost is expected to be approximately $0.5 million in fiscal 2025. The estimated net actuarial gain for the defined-benefit pension plans that will be amortized from accumulated other comprehensive loss into net periodic benefit cost for fiscal 2025 is $0.2 million, net of tax expense.
59
Additional Information
Assumptions
| Benefit Obligation Weighted-Average Assumptions | 2024 | 2023 | 2022 | |||||||||||||||||
| Discount rate | % | % | % | |||||||||||||||||
| Net Periodic Benefit Expense Weighted-Average Assumptions | 2024 | 2023 | 2022 | |||||||||||||||||
| Discount rate | % | % | % | |||||||||||||||||
| Expected long-term rate of return on assets | % | % | % | |||||||||||||||||
Discount rate. The discount rate reflects the current rate at which the defined-benefit plans' pension liabilities could be effectively settled at the end of the year based on the measurement date. The discount rate was determined by matching the expected benefit payments to payments from the Principal Discount Yield Curve. There are no known or anticipated changes in the discount rate assumption that will have a significant impact on pension expense in fiscal 2025.
Expected return on assets. The expected long-term rate of return on assets is based on historical long-term rates of return achieved by the plan investments, the plan's investment strategy, and current and projected market conditions. During fiscal 2019, the assets of the Tubelite plan were moved from investment in a short-term bond fund to various duration fixed income funds. The investments are carried at fair value based on prices from recent trades of similar securities, which would be classified as Level 2 in the valuation hierarchy. We do not maintain assets intended for the future use of the SERP.
Contributions
Company contributions to the plans for fiscal 2024 were $0.6 million and fiscal 2023 were $0.7 million, which equaled or exceeded the minimum funding requirements.
Estimated Future Benefit Payments
The following benefit payments, which reflect expected future service, are expected to be paid by the plans:
| (In thousands) | 2025 | 2026 | 2027 | 2028 | 2029 | 2030-2034 | ||||||||||||||||||||||||||||||||
| Estimated future benefit payments | $ | $ | $ | $ | $ | $ | ||||||||||||||||||||||||||||||||
10. Commitments and Contingent Liabilities
Bond commitments
In the ordinary course of business, predominantly in the Architectural Services and Architectural Framing Systems Segments, we are required to provide surety or performance bonds that commit payments to our customers for any non-performance. At March 2, 2024, $1.3 billion of these types of bonds were outstanding, of which, $463.3 million is on our backlog. These bonds have expiration dates that align with completion of the purchase order or contract. We have never been required to make payments under surety or performance bonds with respect to our existing businesses.
Warranty and project-related contingencies
We reserve estimated exposures on known claims, as well as on a portion of anticipated claims, for product warranty and rework costs, based on historical product liability claims as a ratio of sales. Claim costs are deducted from the accrual when paid. Factors that could have an impact on the warranty accrual in any given period include the following: changes in manufacturing quality, changes in product mix, and any significant changes in sales volume.
| (In thousands) | 2024 | 2023 | ||||||||||||
| Balance at beginning of period | $ | $ | ||||||||||||
| Additional accruals | ||||||||||||||
| Claims paid | ( | ( | ||||||||||||
| Balance at end of period | $ | $ | ||||||||||||
Additionally, we are subject to project management and installation-related contingencies as a result of our fixed-price material supply and installation service contracts, primarily in our Architectural Services segment and certain of our Architectural Framing Systems businesses. We manage the risk of these exposures through contract negotiations, proactive project management and insurance coverages.
60
Letters of credit
At March 2, 2024, we had $15.0 million of ongoing letters of credit, all of which have been issued under our revolving credit facility, as discussed in Note 7.
Purchase obligations
Purchase obligations for raw material commitments and capital expenditures totaled $41.2 million as of March 2, 2024.
Environmental liability
In fiscal 2008, we acquired one manufacturing facility which has certain historical environmental conditions. Remediation of these conditions is ongoing without significant disruption to our operations. The estimated remaining liability for these was $0.4
New Markets Tax Credit (NMTC) transactions
We have two outstanding NMTC arrangements which help to support operational expansion. Proceeds received from investors on these transactions are included within other non-current liabilities on our consolidated balance sheets. The NMTC arrangements are subject to 100% tax credit recapture for a period of seven years from the date of each respective transaction. Upon the termination of each arrangement, these proceeds will be recognized in earnings in exchange for the transfer of tax credits. The direct and incremental costs incurred in structuring these arrangements have been deferred and are included in other non-current assets on our consolidated balance sheets. These costs will be recognized in conjunction with the recognition of the related proceeds on each arrangement. During the construction phase or for working capital purposes for each project, we are required to hold cash dedicated to fund each capital project which is classified as restricted cash on our consolidated balance sheets. Variable-interest entities, which have been included within our consolidated financial statements, have been created as a result of the structure of these transactions, as investors in the programs do not have a material interest in their underlying economics.
During the second quarter of fiscal 2024, one NMTC transaction was settled as expected and as a result, a $4.7 million benefit was recorded in other (income) expense, net.
The table below provides a summary of our outstanding NMTC transactions (in thousands):
| Inception date | Termination date | Proceeds received | Deferred costs | Net benefit | ||||||||||||||||||||||
May 2022(1) | August 2025 | $ | $ | $ | ||||||||||||||||||||||
| September 2018 | September 2025 | |||||||||||||||||||||||||
| Total | $ | $ | $ | |||||||||||||||||||||||
(1) Continuation of the August 2018 NMTC financing transaction
Litigation
61
11. Shareholders' Equity
Share Repurchases
During fiscal 2004, the Board of Directors authorized a share repurchase program, with subsequent increases in authorization. We repurchased 279,916 shares under the program during fiscal 2024, for a total cost of $11.8 million. We repurchased 1,571,139 shares under the program, for a total cost of $74.3 million, in fiscal 2023, and repurchased 2,292,846 shares under the program, for a total cost of $100.0 million, in fiscal 2022. We have repurchased a total of 11,276,517 shares, at a total cost of $393.5 million, since the inception of this program. On October 6, 2023, the Board of Directors increased the share repurchase authorization by 2 million shares. We have remaining authority to repurchase 2,973,483 shares under this program, which has no expiration date.
In addition to the shares repurchased under this repurchase plan, during fiscal 2024, 2023 and 2022, the Company also withheld $2.5 million, $2.3 million and $2.1 million, respectively, of Company stock from employees in order to satisfy stock-for-stock option exercises or tax obligations related to stock-based compensation, pursuant to terms of Board and shareholder-approved compensation plans.
Accumulated Other Comprehensive Loss
The following summarizes the accumulated other comprehensive loss, net of tax, at March 2, 2024 and February 25, 2023:
| (In thousands) | 2024 | 2023 | ||||||||||||
| Net unrealized loss on marketable securities | $ | ( | $ | ( | ||||||||||
| Net unrealized gain on derivative instruments | ||||||||||||||
| Pension liability adjustments | ( | ( | ||||||||||||
| Foreign currency translation adjustments | ( | ( | ||||||||||||
| Total accumulated other comprehensive loss | $ | ( | $ | ( | ||||||||||
12. Share-Based Compensation
We have a 2019 Stock Incentive Plan and a 2019 Non-Employee Director Stock Plan (the Plans) that provide for the issuance of 1,150,000 and 150,000 shares, respectively, for various forms of stock-based compensation to employees and non-employee directors. Awards under these Plans may be in the form of incentive stock options (to employees only), non-statutory options, stock-settled stock appreciation rights (SARs), or nonvested share awards and units, all of which are granted at a price or with an exercise price equal to the fair market value of the Company’s stock at the date of award. We also have 2009 Non-Employee Director Stock Incentive Plan under which deferred restricted stock units were allocated, in addition to deferred restricted stock units acquired pursuant to a dividend equivalent reinvestment feature. As of June 23, 2019, no additional awards can be made under the 2009 Non-Employee Director Stock Incentive Plan.
We recorded share-based compensation expense, in which we account for any forfeitures as they occur, as follows:
| (In thousands) | 2024 | 2023 | 2022 | |||||||||||||||||
| Restricted stock awards and restricted stock unit awards | $ | $ | $ | |||||||||||||||||
| Performance stock unit awards | ||||||||||||||||||||
| Stock options | ||||||||||||||||||||
Share-based compensation expense | ||||||||||||||||||||
Stock Options
Stock option and SAR activity for the current fiscal year is summarized below:
| Number of Shares | Weighted Average Exercise Price | Weighted Average Remaining Contractual Life | Aggregate Intrinsic Value at Year-End | |||||||||||||||||||||||
| Outstanding at February 25, 2023 | $ | |||||||||||||||||||||||||
| Awards exercised | ( | |||||||||||||||||||||||||
| Awards canceled | ( | |||||||||||||||||||||||||
Outstanding at March 2, 2024 | $ | $ | ||||||||||||||||||||||||
62
For the fiscal year ended March 2, 2024, there were no cash proceeds from the exercise of stock options as all stock options were exercised on a stock-for-stock basis. The aggregate intrinsic value of securities exercised (the amount by which the stock price on the date of exercise exceeded the stock price of the award on the date of grant) was $1.8 million. For the fiscal year ended February 25, 2023, there were no cash proceeds from the exercise of stock options as all stock options were exercised on a stock-for-stock basis. The aggregate intrinsic value of securities exercised was $2.7 million.
Service Condition Awards
Nonvested share awards and units generally vest over a , or four-year period. The following table summarizes nonvested restricted stock awards and restricted stock units activity for fiscal 2024:
| Number of Shares and Units | Weighted Average Grant Date Fair Value | |||||||||||||
| February 25, 2023 | $ | |||||||||||||
Granted | ||||||||||||||
| Vested | ( | |||||||||||||
Canceled | ( | |||||||||||||
| March 2, 2024 | $ | |||||||||||||
Performance Condition Awards
In fiscal 2022, the Compensation Committee of the Board of Directors implemented an executive compensation program for certain key employees. In each of the first quarters of fiscal 2024, 2023 and fiscal 2022, we issued performance shares in the form of nonvested share unit awards, which give the recipient the right to receive shares earned at the end of the respective three -fiscal-year performance period. The number of share units issued at grant is equal to the target number of performance shares and allows for the right to receive a variable number of shares, ranging from 0 % to 200 % of target, dependent on achieving a defined performance goal and being employed at the end of the performance period.
The following table summarizes nonvested performance share units granted and outstanding for which all plans are at maximum achievement of 200 % of target:
| Number of Shares and Units | Weighted Average Grant Date Fair Value | |||||||||||||
| February 25, 2023 | $ | |||||||||||||
Granted | ||||||||||||||
Canceled | ( | |||||||||||||
| March 2, 2024 | $ | |||||||||||||
At March 2, 2024, there was $11.2 million of total unrecognized compensation cost related to nonvested share and nonvested share unit awards, which is expected to be recognized over a weighted average period of approximately 21 months. The total fair value of shares vested during fiscal 2024 was $5.8 million.
13. Income Taxes
Earnings before income taxes consisted of the following:
| (In thousands) | 2024 | 2023 | 2022 | |||||||||||||||||
| United States | $ | $ | $ | |||||||||||||||||
| International | ( | ( | ( | |||||||||||||||||
| Earnings before income taxes | $ | $ | $ | |||||||||||||||||
63
The components of income tax expense for each of the last three fiscal years are as follows:
| (In thousands) | 2024 | 2023 | 2022 | |||||||||||||||||
| Current | ||||||||||||||||||||
| Federal | $ | $ | $ | |||||||||||||||||
| State and local | ||||||||||||||||||||
| International | ||||||||||||||||||||
| Total current | ||||||||||||||||||||
| Deferred | ||||||||||||||||||||
| Federal | ( | ( | ( | |||||||||||||||||
| State and local | ( | ( | ( | |||||||||||||||||
| International | ( | |||||||||||||||||||
| Total deferred | ( | ( | ( | |||||||||||||||||
| Total non-current tax (benefit) expense | ( | |||||||||||||||||||
| Total income tax expense | $ | $ | $ | |||||||||||||||||
Income tax payments, net of refunds, were $33.0 million, $27.4 million and $8.2 million in fiscal 2024, 2023 and 2022, respectively.
The following table provides a reconciliation of the statutory federal income tax rate to our consolidated effective tax rates:
| 2024 | 2023 | 2022 | ||||||||||||||||||
| Statutory federal income tax rate | % | % | % | |||||||||||||||||
| State and local income taxes, net of federal tax benefit | ||||||||||||||||||||
| Foreign tax rate differential | ( | ( | ( | |||||||||||||||||
| Valuation allowance | ( | |||||||||||||||||||
| Nontaxable gain (loss) on life insurance policies | ||||||||||||||||||||
| Deduction for foreign derived intangible income | ( | ( | ( | |||||||||||||||||
| Research & development tax credit | ( | ( | ( | |||||||||||||||||
| §162(m) Executive Compensation Limitation | ||||||||||||||||||||
| Tax benefit of share based awards | ( | ( | ( | |||||||||||||||||
| Worthless stock deduction | ( | |||||||||||||||||||
| Other, net | ( | |||||||||||||||||||
| Consolidated effective income tax rate | % | % | % | |||||||||||||||||
The effective tax rate for fiscal 2024 increased 12.2 percentage points from fiscal 2023, primarily due to the impact of discrete items in fiscal 2023.
64
Deferred tax assets and deferred tax liabilities at March 2, 2024 and February 25, 2023 were:
| (In thousands) | 2024 | 2023 | ||||||||||||
| Deferred tax assets | ||||||||||||||
| Accrued expenses | $ | $ | ||||||||||||
| Deferred compensation | ||||||||||||||
| Section 174 capitalized costs | ||||||||||||||
| Goodwill and other intangibles | ||||||||||||||
| Liability for unrecognized tax benefits | ||||||||||||||
| Unearned income | ||||||||||||||
| Operating lease liabilities | ||||||||||||||
| Net operating losses and tax credits | ||||||||||||||
| Other | ||||||||||||||
| Total deferred tax assets | ||||||||||||||
| Less: valuation allowance | ( | ( | ||||||||||||
| Deferred tax assets, net of valuation allowance | ||||||||||||||
| Deferred tax liabilities | ||||||||||||||
| Depreciation | ||||||||||||||
| Operating lease, right-of-use assets | ||||||||||||||
| Bad debt | ||||||||||||||
| Prepaid expenses | ||||||||||||||
| Other | ||||||||||||||
| Total deferred tax liabilities | ||||||||||||||
| Net deferred tax assets (liabilities) | $ | $ | ||||||||||||
The Company has state and foreign net operating loss carryforwards with a tax effect of $12.3 million. A valuation allowance of $9.0 million has been established for these net operating loss carryforwards due to the uncertainty of the use of the tax benefits in future periods.
Management assesses the available positive and negative evidence to estimate whether sufficient future taxable income will be generated to permit use of the existing Deferred Tax Assets. This has resulted in valuation allowances being recorded against Deferred Tax Assets in prior years in Brazil, Canada and various states.
The Company files income tax returns in the U.S. federal jurisdiction, various U.S. state jurisdictions, Canada, Brazil and other international jurisdictions. The Company is no longer subject to U.S. federal tax examinations or state and local tax examinations for years prior to fiscal 2021. The Company is not currently under U.S. federal examination for years subsequent to fiscal 2020, and there is very limited audit activity of the Company’s income tax returns in U.S. state jurisdictions or international jurisdictions.
The Company considers the earnings of its non-U.S. subsidiaries to be indefinitely invested outside of the United States on the basis of estimates that future domestic cash generation will be sufficient to meet future domestic cash needs and specific plans for reinvestment of those subsidiary earnings. Should the Company decide to repatriate the foreign earnings, it would need to adjust the income tax provision in the period it was determined that the earnings will no longer be indefinitely invested outside the U.S.
If we were to prevail on all unrecognized tax benefits recorded, $3.3 million, $3.8 million and $1.7 million for fiscal 2024, 2023 and 2022, respectively, would benefit the effective tax rate. Also included in the balance of unrecognized tax benefits for fiscal 2024, 2023 and 2022 are $1.8 million, $1.5 million, and $1.7 million, respectively, of tax benefits that, if recognized, would result in decreases to deferred taxes.
Penalties and interest related to unrecognized tax benefits are recorded in income tax expense. For fiscal 2024, 2023 and 2022, we accrued penalties and interest related to unrecognized tax benefits of $0.6 million, $0.4 million, and $0.3 million, respectively.
65
The following table provides a reconciliation of the total amounts of gross unrecognized tax benefits:
| (In thousands) | 2024 | 2023 | 2022 | |||||||||||||||||
| Gross unrecognized tax benefits at beginning of year | $ | $ | $ | |||||||||||||||||
| Gross increases in tax positions for prior years | ||||||||||||||||||||
| Gross decreases in tax positions for prior years | ( | ( | ( | |||||||||||||||||
| Gross increases based on tax positions related to the current year | ||||||||||||||||||||
| Gross decreases based on tax positions related to the current year | ( | |||||||||||||||||||
| Settlements | ( | ( | ||||||||||||||||||
| Statute of limitations expiration | ( | ( | ( | |||||||||||||||||
| Gross unrecognized tax benefits at end of year | $ | $ | $ | |||||||||||||||||
In December 2021, the OECD issued model rules for a new global minimum tax framework (“Pillar Two”), and various governments around the world have issued, or are in the process of issuing, legislation to implement these rules. The Company is within the scope of the OECD Pillar Two model rules and is assessing the impact thereof. As of March 4, 2024, we believe the implementation of these rules will not have a material impact on our financial results.
14.Earnings per Share
Basic earnings per share is computed by dividing net earnings by the weighted average number of common shares outstanding. Diluted earnings per share is computed by dividing net earnings by the weighted average number of common shares outstanding, including the dilutive effects of stock options, SARs and nonvested shares. The following table presents a reconciliation of the share amounts used in the computation of basic and diluted earnings per share:
| (In thousands) | 2024 | 2023 | 2022 | |||||||||||||||||
| Basic earnings per share - weighted average common shares outstanding | ||||||||||||||||||||
| Weighted average effect of nonvested share grants and assumed exercise of stock options | ||||||||||||||||||||
| Diluted earnings per share - weighted average common shares and potential common shares outstanding | ||||||||||||||||||||
| Stock awards excluded from the calculation of earnings per share because the award price was greater than the average market price of the common shares | ||||||||||||||||||||
15. Business Segment Data
We have four reporting segments:
•The Architectural Framing Systems Segment designs, engineers, fabricates and finishes the aluminum window, curtainwall, storefront and entrance systems for the exterior of buildings.
•The Architectural Glass Segment coats and fabricates high-performance glass used in custom window and wall systems on non-residential buildings.
•The Architectural Services Segment integrates technical services, project management, and field installation services to design, engineer, fabricate, and install building glass and curtainwall systems.
•The Large-Scale Optical (LSO) Segment manufactures high-performance glazing products for the custom framing, fine art, and engineered optics markets.
Segment net sales is defined as net sales for a certain segment and includes revenue related to intersegment transactions. We report net sales intersegment eliminations separately to exclude these sales from our consolidated total. Segment operating income is equal to net sales, less cost of goods sold, SG&A, and any asset impairment charges associated with the segment. Segment operating income includes operating income related to intersegment sales transactions and excludes certain corporate costs that are not allocated at a segment level. We report these unallocated corporate costs separately in Corporate and other. Operating income does not include other income or expense, interest expense or a provision for income taxes.
66
| (In thousands) | 2024 | 2023 | 2022 | |||||||||||||||||
| Net Sales | ||||||||||||||||||||
| Architectural Framing Systems | $ | $ | $ | |||||||||||||||||
Architectural Glass | ||||||||||||||||||||
Architectural Services | ||||||||||||||||||||
| Large-Scale Optical | ||||||||||||||||||||
| Intersegment elimination | ( | ( | ( | |||||||||||||||||
| Total | $ | $ | $ | |||||||||||||||||
| Operating Income (Loss) | ||||||||||||||||||||
| Architectural Framing Systems | $ | $ | $ | |||||||||||||||||
Architectural Glass | ||||||||||||||||||||
Architectural Services | ( | |||||||||||||||||||
| Large-Scale Optical | ||||||||||||||||||||
| Corporate and other | ( | ( | ( | |||||||||||||||||
| Total | $ | $ | $ | |||||||||||||||||
| Depreciation and Amortization | ||||||||||||||||||||
| Architectural Framing Systems | $ | $ | $ | |||||||||||||||||
Architectural Glass | ||||||||||||||||||||
Architectural Services | ||||||||||||||||||||
| Large-Scale Optical | ||||||||||||||||||||
| Corporate and other | ||||||||||||||||||||
| Total | $ | $ | $ | |||||||||||||||||
| Capital Expenditures | ||||||||||||||||||||
| Architectural Framing Systems | $ | $ | $ | |||||||||||||||||
Architectural Glass | ||||||||||||||||||||
Architectural Services | ||||||||||||||||||||
| Large-Scale Optical | ||||||||||||||||||||
| Corporate and other | ||||||||||||||||||||
| Total | $ | $ | $ | |||||||||||||||||
| Identifiable Assets | ||||||||||||||||||||
| Architectural Framing Systems | $ | $ | $ | |||||||||||||||||
Architectural Glass | ||||||||||||||||||||
Architectural Services | ||||||||||||||||||||
| Large-Scale Optical | ||||||||||||||||||||
| Corporate and other | ||||||||||||||||||||
| Total | $ | $ | $ | |||||||||||||||||
Due to the varying combinations and integration of individual window, storefront and curtainwall systems, it is impractical to report product revenues generated by class of product beyond the segment revenues currently reported.
67
The following table presents net sales, based on the location in which the sale originated, and long-lived assets, representing property, plant and equipment, net of related depreciation, by geographic region.
| (In thousands) | 2024 | 2023 | 2022 | |||||||||||||||||
| Net Sales | ||||||||||||||||||||
| United States | $ | $ | $ | |||||||||||||||||
| Canada | ||||||||||||||||||||
| Brazil | ||||||||||||||||||||
| Total | $ | $ | $ | |||||||||||||||||
| Long-Lived Assets | ||||||||||||||||||||
| United States | $ | $ | $ | |||||||||||||||||
| Canada | ||||||||||||||||||||
| Brazil | ||||||||||||||||||||
| Total | $ | $ | $ | |||||||||||||||||
Our export net sales from U.S. operations were $47.6 million, $56.2 million, and $59.5 million in fiscal 2024, 2023, and 2022, respectively, representing approximately 3 %, 4 %, and 5 % of consolidated net sales in each of these fiscal years, respectively.
16.Restructuring
During the fourth quarter of fiscal 2024, we announced strategic actions to further streamline our business operations, enable a more efficient cost model, and better position the Company for profitable growth (referred to as “Project Fortify”). Project Fortify will primarily impact the Architectural Framing Systems Segment and include:
•Eliminating certain lower-margin product and service offerings, enabling consolidation into a single operating entity.
•Transferring production operations from the Company’s facility in Walker, Michigan, to the Company’s facilities in Monett, Missouri and Wausau, Wisconsin.
•Simplifying the segment’s brand portfolio and commercial model to improve flexibility, better leverage the Company’s capabilities, and enhance customer service.
Additionally, the Company will implement actions to optimize processes and streamline resources in its Architectural Services and Corporate Segments. The Company expects these actions to be substantially complete by the third quarter of fiscal 2025. The Company expects to incur approximately $16 million to $18 million of pre-tax charges in connection with Project Fortify, including:
•$7 million to $9 million of severance and employee related costs;
•$2 million to $3 million of contract termination costs: and
•$6 million to $7 million of other expenses.
During the second quarter of fiscal 2022, we announced plans to realign and simplify our business structure, which resulted in the closure of two facilities within the Architectural Glass Segment, in Dallas, Texas and Statesboro, Georgia. These closures were made in order to concentrate this segment on premium, high-performance products. Additionally, employee termination costs were incurred related to these facility closures, realignment of the Architectural Framing Systems Segment, and within the Corporate office. During the fourth quarter of fiscal 2022, as a result of the announced restructuring plan, we sold a building in Statesboro, Georgia within our Architectural Glass Segment for $29.1 million. The carrying value of the building was $9.4 million, and we recognized a gain on this sale of approximately $19.5 million, net of associated transaction costs, which is included as a reduction of cost of sales within our consolidated statements of operations.
During the first quarter of fiscal 2023, we completed the execution of these plans with the sale of the remaining manufacturing assets at our Architectural Glass location, in Dallas, Texas, for $4.1 million. The remaining assets had a carrying value of $3.4 million, and we recognized a gain on the sale of approximately $0.6 million, net of associated transaction costs, which is included as a reduction of cost of sales within our consolidated statements of operations.
68
During fiscal 2024, we incurred $12.4 million of pre-tax costs associated Project Fortify, of which $5.5 million is included within cost of sales and $6.9 million is included within selling, general and administrative expenses. During fiscal 2023, we incurred $0.1 million of additional pre-tax costs associated with the finalization of the restructuring plans that were announced in fiscal 2022. During fiscal 2022, we incurred $30.5 million of pre-tax costs associated with the execution of the restructuring plans that were announced in fiscal 2022, of which $28.2 million is included within cost of sales and $2.3 million is included within selling, general and administrative expenses, excluding the gain on sale mentioned above, within our consolidated statements of operations.
| (In thousands) | Architectural Framing | Architectural Glass | Architectural Services | Corporate & Other | Total | |||||||||||||||||||||||||||
| March 2, 2024 | ||||||||||||||||||||||||||||||||
| Asset impairment on property, plant and equipment | $ | $ | $ | $ | $ | |||||||||||||||||||||||||||
| Termination benefits | ||||||||||||||||||||||||||||||||
| Other restructuring charges | ||||||||||||||||||||||||||||||||
| Total restructuring charges | $ | $ | $ | $ | $ | |||||||||||||||||||||||||||
| February 25, 2023 | ||||||||||||||||||||||||||||||||
| Termination benefits | ||||||||||||||||||||||||||||||||
| Total restructuring charges | $ | $ | $ | $ | $ | |||||||||||||||||||||||||||
| February 26, 2022 | ||||||||||||||||||||||||||||||||
| Asset impairment on property, plant and equipment | ||||||||||||||||||||||||||||||||
| Termination benefits | ||||||||||||||||||||||||||||||||
| Other restructuring charges | ||||||||||||||||||||||||||||||||
| Total restructuring charges | $ | $ | $ | $ | $ | |||||||||||||||||||||||||||
The following table summarizes our restructuring related accrual balances included within accrued payroll and related benefits and other current liabilities in the consolidated balance sheets. All remaining accrual balances are expected to be paid within fiscal 2025.
| (In thousands) | Architectural Framing | Architectural Glass | Architectural Services | Corporate & Other | Total | |||||||||||||||||||||||||||
| Balance at February 26, 2022 | $ | $ | $ | $ | $ | |||||||||||||||||||||||||||
| Restructuring expense | ||||||||||||||||||||||||||||||||
| Payments | ( | ( | ( | ( | ||||||||||||||||||||||||||||
| Other adjustments | ( | ( | ( | ( | ||||||||||||||||||||||||||||
Balance at February 25, 2023 | $ | $ | $ | $ | $ | |||||||||||||||||||||||||||
| Restructuring expense | ||||||||||||||||||||||||||||||||
| Payments | ( | ( | ( | ( | ||||||||||||||||||||||||||||
| Balance at March 2, 2024 | $ | $ | $ | $ | $ | |||||||||||||||||||||||||||
The charges presented in the rollforward of our restructuring accruals do not include items charged directly to expense as incurred, as those items are not reflected in accrued payroll and related benefits and other current liabilities in the consolidated balance sheets.
ITEM 9. CHANGES IN AND DISAGREEMENTS WITH ACCOUNTANTS ON ACCOUNTING AND FINANCIAL DISCLOSURE
None.
69
ITEM 9A.CONTROLS AND PROCEDURES
Evaluation of Disclosure Controls and Procedures. As of the end of the period covered by this report (the Evaluation Date), we carried out an evaluation, under the supervision and with the participation of management, including the Chief Executive Officer and the Chief Financial Officer, of the effectiveness of the design and operation of our disclosure controls and procedures (as defined in Rules 13a-15(e) or 15d-15(e) of the Exchange Act). Based upon that evaluation, the Chief Executive Officer and Chief Financial Officer concluded that, as of the Evaluation Date, our disclosure controls and procedures were effective to ensure that information required to be disclosed by the Company in the reports that it files or submits under the Exchange Act is (i) recorded, processed, summarized and reported within the time periods specified in applicable rules and forms, and (ii) accumulated and communicated to our management, including our Chief Executive Officer and Chief Financial Officer, to allow timely decisions regarding required disclosure.
Management's Annual Report on Internal Control Over Financial Reporting. The report of management required under this Item 9A is contained on page 32 in Item 8 of this Annual Report on Form 10-K under the caption “Management's Annual Report on Internal Control Over Financial Reporting.”
Attestation Report of Independent Registered Public Accounting Firm. The attestation report required under this Item 9A is contained on page 33 in Item 8 of this Annual Report on Form 10-K under the caption “Report of Independent Registered Public Accounting Firm.”
Changes in Internal Control over Financial Reporting. There have not been any changes in our internal control over financial reporting (as such term is defined in Rules 13a-15(f) and 15d-15(f) under the Exchange Act) during the most recent fiscal quarter covered by this report that would have materially affected, or are reasonably likely to materially affect, the Company's internal control over financial reporting.
ITEM 9B. OTHER INFORMATION
Insider Adoption or Termination of Trading Arrangements
During the fiscal quarter ended March 2, 2024, none of our directors or officers (as defined in Rule 16a-1(f) of the Exchange Act) adopted terminated
ITEM 9C. DISCLOSURES REGARDING FOREIGN JURISDICTIONS THAT PREVENT INSPECTIONS
Not applicable.
PART III
ITEM 10.DIRECTORS, EXECUTIVE OFFICERS, CODE OF ETHICS AND CORPORATE GOVERNANCE
We have adopted a Code of Business Ethics and Conduct that applies to all of our employees, including our principal executive officer, president, principal financial officer and principal accounting officer, and Board of Directors. The Code of Business Ethics and Conduct is published on the “Investors-Governance” section of our website at www.apog.com. Any amendments to the Code of Business Ethics and Conduct and waivers of the Code of Business Ethics and Conduct for our Chief Executive Officer and Chief Financial Officer will be published on our website.
The other information required by this item, other than the information set forth in Part I above under the heading “Information About Our Executive Officers,” is set forth under the headings “Proposal 1: Election of Directors,” “Frequently Asked Questions - How Can I Recommend or Nominate a Director Candidate?”, “Corporate Governance - Board Meetings and 2024 Annual Meeting of Shareholders,” and “Corporate Governance - Board Committee Responsibilities, Meetings and Membership” in the Proxy Statement for the Company's Annual Meeting of Shareholders to be held on June 20, 2024, which will be filed with the Securities and Exchange Commission within 120 days after our fiscal year-end (our 2024 Proxy Statement). This information is incorporated herein by reference.
ITEM 11.EXECUTIVE AND DIRECTOR COMPENSATION
The information required by this item is set forth under the headings “Executive Compensation,” "CEO Pay Ratio Disclosure" and “Non-Employee Director Compensation" in our 2024 Proxy Statement. This information is incorporated herein by reference.
70
ITEM 12. SECURITY OWNERSHIP OF CERTAIN BENEFICIAL OWNERS AND MANAGEMENT AND RELATED STOCKHOLDER MATTERS
The information required by this item is set forth under the headings “Equity Compensation Plan Information”, “Security Ownership of Certain Beneficial Owners” and “Security Ownership of Directors and Management” in our 2024 Proxy Statement. This information is incorporated herein by reference.
ITEM 13. CERTAIN RELATIONSHIPS AND RELATED TRANSACTIONS, AND DIRECTOR INDEPENDENCE
The information required by this item is set forth under the headings “Corporate Governance - Director Independence” and "Corporate Governance - Certain Relationships and Related Transactions" in our 2024 Proxy Statement. This information is incorporated herein by reference.
ITEM 14. PRINCIPAL ACCOUNTANT FEES AND SERVICES
Information about aggregate fees billed to us by our principal accountant, Deloitte & Touche LLP (PCAOB ID No. 34 ) will be presented under the headings “Audit Committee Report" and "Fees Paid to Independent Registered Public Accounting Firm - Audit Fees, Audit-Related Fees, Tax Fees and All Other Fees” and “Policy on Audit Committee Pre-Approval of Audit and Permissible Non-Audit Services” in our 2024 Proxy Statement. This information is incorporated herein by reference.
PART IV
ITEM 15. EXHIBITS AND FINANCIAL STATEMENT SCHEDULES
a)List of documents filed as a part of this report:
1.Financial Statements - The consolidated financial statements listed below are set forth in Item 8 of Part II of this report.
Consolidated Balance Sheets as of March 2, 2024 and February 25, 2023
Consolidated Results of Operations for the Years Ended March 2, 2024, February 25, 2023 and February 26, 2022
Consolidated Statements of Comprehensive Earnings for the Years Ended March 2, 2024, February 25, 2023 and February 26, 2022
Consolidated Statements of Cash Flows for the Years Ended March 2, 2024, February 25, 2023 and February 26, 2022
Consolidated Statements of Shareholders' Equity for the Years Ended March 2, 2024, February 25, 2023 and February 26, 2022
Notes to Consolidated Financial Statements
2.Financial Statement Schedules - All schedules for which provision is made in the applicable accounting regulations of the Securities and Exchange Commission have been omitted because they are not applicable or the required information is shown in the financial statements or notes thereto.
3.Exhibits - Exhibits marked with an asterisk (*) identify each management contract or compensatory plan or arrangement. Exhibits marked with a pound sign (#) are filed herewith. The remainder of the exhibits have heretofore been filed with the Securities and Exchange Commission and are incorporated herein by reference.
71
Description of Securities. Incorporated by reference to Exhibit 4.2 to Registrant's Annual Report on Form 10-K for the year ended February 29, 2020. | ||||||||
72
73
| 101 | The following materials from Apogee Enterprises, Inc.'s Annual Report on Form 10-K for the year ended March 2, 2024 are furnished herewith, formatted in iXBRL (Inline Extensible Business Reporting Language): (i) the Consolidated Balance Sheets as of March 2, 2024 and February 25, 2023, (ii) the Consolidated Results of Operations for the three years ended March 2, 2024, February 25, 2023 and February 26, 2022, (iii) the Consolidated Statements of Comprehensive Earnings for the three years March 2, 2024, February 25, 2023 and February 26, 2022, (iv) the Consolidated Statements of Cash Flows for the three years ended March 2, 2024, February 25, 2023 and February 26, 2022, (v) the Consolidated Statements of Shareholders' Equity for the three years ended March 2, 2024, February 25, 2023 and February 26, 2022 and (vi) the Notes to Consolidated Financial Statements. | |||||||
| 104 | Cover Page Interactive Data File (formatted as Inline XBRL and contained in Exhibit 101). | |||||||
ITEM 16. FORM 10-K SUMMARY
None.
74
SIGNATURES
Pursuant to the requirements of Section 13 or 15(d) of the Securities Exchange Act of 1934, the registrant has duly caused this report to be signed on its behalf by the undersigned, thereunto duly authorized, on April 26, 2024.
| APOGEE ENTERPRISES, INC. | |||||
| /s/ Ty R. Silberhorn | |||||
| Ty R. Silberhorn | |||||
President and Chief Executive Officer | |||||
Pursuant to the requirements of the Securities Exchange Act of 1934, this report has been signed below by the following persons on behalf of the registrant and in the capacities indicated on April 26, 2024.
| Signature | Title | Signature | Title | |||||||||||||||||||||||
| /s/ Ty R. Silberhorn | President, Chief Executive Officer and Director | /s/ Matthew J. Osberg | Executive Vice President and Chief Financial Officer | |||||||||||||||||||||||
| Ty R. Silberhorn | (Principal Executive Officer) | Matthew J. Osberg | (Principal Financial and Accounting Officer) | |||||||||||||||||||||||
| /s/ Donald A. Nolan | /s/ Elizabeth M. Lilly | |||||||||||||||||||||||||
| Donald A. Nolan | Chairman | Elizabeth M. Lilly | Director | |||||||||||||||||||||||
| /s/ Christina M. Alvord | /s/ Herbert K. Parker | |||||||||||||||||||||||||
| Christina M. Alvord | Director | Herbert K. Parker | Director | |||||||||||||||||||||||
| /s/ Frank G. Heard | /s/ Mark A. Pompa | |||||||||||||||||||||||||
| Frank G. Heard | Director | Mark A. Pompa | Director | |||||||||||||||||||||||
| /s/ Lloyd E. Johnson | /s/ Patricia K. Wagner | |||||||||||||||||||||||||
| Lloyd E. Johnson | Director | Patricia K. Wagner | Director | |||||||||||||||||||||||
75