UNITED STATES
SECURITIES AND EXCHANGE COMMISSION
WASHINGTON, D.C. 20549
FORM
(MARK ONE)
FOR THE FISCAL YEAR ENDED
OR
FOR THE TRANSITION PERIOD FROM TO
COMMISSION FILE NUMBER
(Exact name of registrant as specified in its charter)
(State or other jurisdiction of | (I.R.S. Employer |
incorporation or organization) | Identification No.) |
(Address of principal executive offices) | (Zip Code) |
Registrant’s telephone number, including area code (
Securities registered pursuant to Section 12(b) of the Act:
Title Of Each Class |
| Trading Symbol |
| Name of Each Exchange On Which Registered |
The | ||||
Securities registered pursuant to Section 12(g) of the Act: None
Indicate by check mark if the registrant is a well-known seasoned issuer, as defined in Rule 405 of the Securities Act. ◻ Yes ⌧
Indicate by check mark if the registrant is not required to file reports pursuant to Section 13 or Section 15(d) of the Act. ◻ Yes ⌧
Indicate by check mark whether the registrant (1) has filed all reports required to be filed by Section 13 or 15(d) of the Securities Exchange Act of 1934 during the preceding 12 months (or for such shorter period that the registrant was required to file such reports) and (2) has been subject to such filing requirements for the past 90 days. ⌧
Indicate by check mark whether the registrant has submitted electronically every Interactive Data File required to be submitted pursuant to Rule 405 of Regulation S-T (232.405 of this chapter) during the preceding 12 months (or for such shorter period that the registrant was required to submit such files). ⌧
Indicate by check mark whether the registrant is a large accelerated filer, an accelerated filer, a non-accelerated filer, a smaller reporting company, or an emerging growth company. See definitions of “large accelerated filer,” “ accelerated filer,” “smaller reporting company,” and “emerging growth company” in Rule 12b-2 of the Exchange Act.
Large accelerated filer ◻ | Accelerated filer ◻ | Smaller reporting company | |
Emerging growth company |
If an emerging growth company, indicate by check mark if the registrant has elected not to use the extended transition period for complying with any new or revised financial accounting standards provided pursuant to Section 13(a) of the Exchange Act. ◻
Indicate by check mark whether the registrant has filed a report on and attestation to its mangagement’s assessment of the effectiveness of its internal control over financial reporting under Section 404(b) of the Sarbanes-Oxley Act (15 U.S.C. 7262(b)) by the registered public accounting firm that prepared or issued its audit report.
If securities are registered pursuant to Section 12(b) of the Act, indicate by check mark whether the financial statements of the registrant included in the filing reflect the correction of an error to previously issued financial statements.
Indicate by check mark whether any of those error corrections are restatements that required a recovery analysis of incentive-based compensation received by any of the registrant’s executive officers during the relevant recovery period pursuant to §240.10D-1(b). ☐
Indicate by check mark whether the registrant is a shell company (as defined in Rule 12b-2 of the Act).
State the aggregate market value of the voting and non-voting common equity held by non-affiliates computed by reference to the price at which the common equity was last sold, or the average bid and asked price of such common equity, as of the last business day of the registrant’s most recently completed second fiscal quarter. The aggregate market value was $
Indicate the number of shares outstanding of each of the registrant’s classes of common stock, as of the latest practicable date. There were
DOCUMENTS INCORPORATED BY REFERENCE.
None
FORM 10-K INDEX
2
PART I
ITEM 1. BUSINESS
GENERAL
AmeriServ Financial, Inc. (the Company) is a bank holding company organized under the Pennsylvania Business Corporation Law. The Company became a holding company upon acquiring all of the outstanding shares of AmeriServ Financial Bank (the Bank) in January 1983. The Company’s other wholly owned subsidiary is AmeriServ Trust and Financial Services Company (the Trust Company) which was formed in October 1992. When used in this report, the “Company” may refer, depending on the context, to AmeriServ Financial, Inc. individually or AmeriServ Financial, Inc. and its direct and indirect subsidiaries.
The Company’s principal activities consist of owning and operating its two wholly owned subsidiary entities. At December 31, 2023, the Company had, on a consolidated basis, total assets, deposits, and shareholders’ equity of $1.4 billion, $1.2 billion, and $102.3 million, respectively. The Company and its subsidiaries derive substantially all of their income from banking, bank related services, and trust and wealth management related services. The Company functions primarily as a coordinating and servicing unit for its subsidiary entities in general management, accounting and taxes, loan review, internal audit, investment accounting, marketing and risk management.
As a bank holding company, the Company is subject to supervision and regular examination by the Federal Reserve Bank of Philadelphia and the Pennsylvania Department of Banking and Securities (PDB). The Company is also under the jurisdiction of the Securities and Exchange Commission (SEC) for matters relating to registered offerings and sales of its securities under the Securities Act of 1933, as amended, and the disclosure and regulatory requirements of the Securities Exchange Act of 1934, as amended. The Company’s common stock is listed on The NASDAQ Stock Market under the trading symbol “ASRV,” and the Company is subject to the NASDAQ rules applicable to listed companies.
AMERISERV FINANCIAL BANK
The Bank is a state bank chartered under the Pennsylvania Banking Code of 1965, as amended (Banking Code). Through 17 branch locations in Allegheny, Cambria, Centre, Somerset, and Westmoreland counties, Pennsylvania and Washington county, Maryland, the Bank conducts a general banking business. It is a full-service bank offering (i) retail banking services, such as demand, savings and time deposits, checking accounts, money market accounts, secured and unsecured consumer loans, mortgage loans, safe deposit boxes, holiday club accounts, and money orders; and (ii) lending, depository and related financial services to commercial, industrial, financial, and governmental customers, such as commercial real estate mortgage loans (CRE), short and medium-term loans, revolving credit arrangements, lines of credit, inventory and accounts receivable financing, real estate construction loans, business savings accounts, time deposits, wire transfers, night depository, and lock box services. The Bank also operates 18 automated bank teller machines (ATMs) through its 24-hour banking network that is linked with NYCE, a regional ATM network, and CIRRUS, a national ATM network. West Chester Capital Advisors (WCCA), a SEC-registered investment advisor, is a subsidiary of the Bank. The Company also operates loan production offices (LPOs) in Altoona and Wilkins Township in Pennsylvania.
We believe that the loss of one depositor or a related group of depositors would not have a materially adverse effect on the Bank’s business. The Bank’s business is not seasonal, nor does it have any risks attendant to foreign sources. A significant majority of the Bank’s customer base is located within a 250-mile radius of Johnstown, Pennsylvania, the Bank’s headquarters.
3
The Bank is subject to supervision and regular examination by the Federal Reserve Bank of Philadelphia and the PDB. Various federal and state laws and regulations govern many aspects of its banking operations. The following is a summary of key data (dollars in thousands) and ratios of the Bank at December 31, 2023:
Headquarters |
| Johnstown, PA |
| |
Total Assets | $ | 1,378,660 | ||
Total Investment Securities (net of allowance for credit losses) |
| 222,213 | ||
Total Loans and Loans Held for Sale (net of unearned income) |
| 1,038,401 | ||
Total Deposits |
| 1,162,066 | ||
Total Net Loss |
| (250) | ||
Asset Leverage Ratio |
| 8.78 | % | |
Return on Average Assets |
| (0.02) | ||
Return on Average Equity |
| (0.22) | ||
Total Full-time Equivalent Employees |
| 236 | ||
RISK MANAGEMENT OVERVIEW
Risk identification and management are essential elements for the successful management of the Company. In the normal course of business, the Company is subject to various types of risk, which includes credit, interest rate and market, liquidity, operational, legal/compliance, strategic/reputational and security risk. The Company seeks to identify, manage and monitor these risks with policies, procedures, and various levels of oversight from the Company’s Board of Directors (the Board) and management. The Company has a Management Enterprise Risk Committee with Board of Director representation to help manage and monitor the Company’s risk position, which is reported formally to the Board, at a minimum, on a semi-annual basis.
Interest rate risk is the sensitivity of net interest income and the market value of financial instruments to the magnitude, direction, and frequency of changes in interest rates. Interest rate risk results from various repricing frequencies and the maturity structure of assets and liabilities. The Company uses its asset/liability management policy to monitor and manage interest rate risk.
Liquidity risk represents the inability to generate cash or otherwise obtain funds at reasonable rates to satisfy commitments to borrowers, as well as the obligations to depositors, debtholders and the funding of operating costs. The Company uses its asset/liability management policy and contingency funding plan to monitor and manage liquidity risk.
Credit risk represents the possibility that a customer may not perform in accordance with contractual terms resulting in an economic loss to the organization. Credit risk results from extending credit to customers, purchasing securities, and entering into certain off-balance sheet loan funding commitments. The Company’s primary credit risk occurs in the loan portfolio with limited credit risk within the investment portfolio due to holdings of corporate and municipal securities. The Company uses its credit policy and disciplined approach to evaluating the adequacy of the allowance for credit losses (the ACL) to monitor and manage credit risk. The Company’s investment policy and hedging policy seeks to limit the amount of credit risk that may be assumed in the investment portfolio and through hedging activities.
A significant portion of the Company's loan portfolio consists of commercial real estate loans, including owner occupied properties, non-owner-occupied properties, and other commercial properties. These types of loans are generally viewed as having more risk of default than residential real estate loans and depend on cash flows from the owner’s business or the property’s tenants to service the debt. The borrower’s cash flows may be affected significantly by general economic conditions, a downturn in the local economy or in occupancy rates in the market where the property is located, any of which could increase the likelihood of default. Commercial real estate loans also typically have larger loan balances, and, therefore, the deterioration of one or a few of these loans could cause a significant increase in the percentage of the Company's non-performing loans. An increase in non-performing loans could result in a loss of earnings from these loans, an increase in the provision for credit losses for loans, and an increase in charge-offs, all of which could have a material adverse effect on the Company's business, financial condition, and results of operations.
The banking regulatory agencies have recently expressed concerns about weaknesses in the current commercial real estate market. Banking regulators generally give commercial real estate lending greater scrutiny and may require banks with higher levels of commercial real estate loans to implement enhanced risk management practices, including stricter underwriting, internal controls, risk management policies, more granular reporting, and portfolio stress testing, as well as possibly higher levels of allowances for credit losses and capital levels as a result of commercial real estate lending
4
growth and exposures. If the Company's banking regulators determine that our commercial real estate lending activities are particularly risky and are subject to such heightened scrutiny, the Company may incur significant additional costs or be required to restrict certain of our commercial real estate lending activities. Furthermore, failures in the Company's risk management policies, procedures and controls could adversely affect our ability to manage this portfolio going forward and could result in an increased rate of delinquencies in, and increased losses from, this portfolio, which could have a material adverse effect on the Company's business, financial condition, and results of operations.
The following summarizes and describes the Company’s various loan categories and the underwriting standards applied to each:
Commercial Loans
This category includes credit extensions to commercial and industrial borrowers. Business assets, including accounts receivable, inventory and/or equipment, typically secure these credits. The commercial loan segment includes commercial loans secured by owner occupied real estate. In appropriate instances, extensions of credit in this category are subject to collateral advance formulas. Balance sheet strength and profitability are considered when analyzing these credits, with special attention given to historical, current and prospective sources of cash flow, and the ability of the customer to sustain cash flow at acceptable levels. The Bank’s policy permits flexibility in determining acceptable debt service coverage ratios. Personal guarantees are frequently required; however, as the financial strength of the borrower increases, the Bank’s ability to obtain personal guarantees decreases. In addition to economic risk, this category is impacted by the strength of the borrower’s management, industry risk and portfolio concentration risk each of which are also monitored and considered during the underwriting process.
Commercial Loans Secured by Non-Owner Occupied Real Estate
This category includes various types of loans, including acquisition and construction of investment property. Maximum term, minimum cash flow coverage, leasing requirements, maximum amortization and maximum loan to value ratios are controlled by the Bank’s credit policy and follow industry guidelines and norms, and regulatory limitations. Personal guarantees are frequently required on CRE loans especially if there is a speculative component to the credit. In addition to economic risk, this category is subject to geographic and portfolio concentration risk, each of which are monitored and considered in underwriting.
The Company utilizes a robust and diligent risk management framework to monitor the non-owner occupied commercial real estate segment of the portfolio. This analysis considers more forward looking credit metrics such as stress test results and underwriting trend data, coupled with risk tolerance and concentration guidelines. The process is intended to allow identification of emerging risk, in part, to determine any future change to lending policy, underwriting practices or broader lending strategy prior to any indication of performance deterioration.
The commercial real estate loan segment includes the non-owner occupied commercial real estate loan classes of retail, multi-family, and other. At December 31, 2023, the Bank’s non-owner occupied commercial real estate loan concentration stood at 375% of total regulatory capital. It should be noted that this ratio increased from 350% at December 31, 2022 due to growth in non-owner occupied commercial real estate loan balances as well as a slight decrease in total regulatory capital between years. Further, non-owner occupied commercial real estate loans represented 49.3% and 45.5% of total loans as of December 31, 2023 and 2022, respectively.
5
The following table presents our non-owner occupied commercial real estate loan portfolio by property type.
DECEMBER 31, 2023 | ||||||||||||
COMMERCIAL | COMMERCIAL | |||||||||||
REAL ESTATE | REAL ESTATE | OTHER COMMERCIAL | ||||||||||
(NON-OWNER OCCUPIED) - | (NON-OWNER OCCUPIED) - | REAL ESTATE | ||||||||||
| RETAIL |
| MULTI-FAMILY |
| (NON-OWNER OCCUPIED) |
| TOTAL | |||||
(IN THOUSANDS) | ||||||||||||
1-4 unit residential | $ | — | $ | — | $ | 27,038 | $ | 27,038 | ||||
Multi-family |
| — |
| 92,037 |
| — |
| 92,037 | ||||
Mixed use - apartments & retail/office | — | 17,971 | — | 17,971 | ||||||||
Retail strip plaza | 45,691 | — | — | 45,691 | ||||||||
Mall | 3,995 | — | — | 3,995 | ||||||||
Major shopping center with anchor tenants | 29,471 | — | — | 29,471 | ||||||||
Commercial office - urban | — | — | 13,734 | 13,734 | ||||||||
Commercial office - suburban | — | — | 9,404 | 9,404 | ||||||||
Mixed use - retail/office | — | — | 34,144 | 34,144 | ||||||||
Hotel/motel |
| — |
| — |
| 43,546 |
| 43,546 | ||||
Retail/service shops |
| 82,804 |
| — |
| — |
| 82,804 | ||||
Personal care/hospital/medical office |
| — |
| — |
| 20,291 |
| 20,291 | ||||
Manufacturing/warehouse |
| — |
| — |
| 85,981 |
| 85,981 | ||||
Other |
| — |
| — |
| 68 |
| 68 | ||||
Land acquisition and development |
| — |
| — |
| 6,080 |
| 6,080 | ||||
Total | $ | 161,961 | $ | 110,008 | $ | 240,286 | $ | 512,255 | ||||
Residential Mortgages
This category includes mortgages that are secured by residential property. Underwriting of loans within this category is pursuant to Freddie Mac/Fannie Mae underwriting guidelines, with the exception of Community Loan Program loans, which have specialized internal loan program standards. The major risk in this category is that a significant downward economic trend would increase unemployment and cause payment default. The Bank does not engage, and has never engaged, in subprime residential mortgage lending.
Secondary Market Activities
The residential lending department of the Bank continues to originate one-to-four family mortgage loans for customers, some of which are sold to outside investors in the secondary market and some of which are retained for the Bank’s portfolio. Mortgages sold in the secondary market are sold to investors on a “flow” basis; mortgages are priced and delivered on a “best efforts” pricing basis, with servicing released to the investor. As previously stated above, Fannie Mae/Freddie Mac guidelines are used in underwriting all mortgages with the exception of a limited amount of Community Reinvestment Act (CRA) loans and internal special programs. Mortgages with longer terms, such as 30-year, FHA, and VA loans, are usually sold. The remaining production of the department includes construction, adjustable rate mortgages, and quality non-salable loans. These loans are usually kept in the Bank’s portfolio.
Consumer Loans
This category includes consumer installment loans and revolving credit plans. A meaningful portion of this portfolio consists of home equity loans secured by residential real estate. Underwriting is pursuant to industry norms and guidelines. The major risk in this category is a significant economic downturn.
INVESTMENTS
The strategic focus of the investment securities portfolio is managed for liquidity and earnings in a prudent manner that is consistent with proper bank asset/liability management and current banking practices. The objectives of portfolio management include consideration of proper liquidity levels, interest rate and market valuation sensitivity, and profitability. The investment portfolio of the Company and its subsidiaries are proactively managed, including in accordance with federal and state laws and regulations and in accordance with generally accepted accounting principles (GAAP). All holdings must meet standards documented in its investment policy, unless otherwise approved by the Company’s CEO or the Asset/Liability Management Committee.
6
The investment portfolio is primarily made up of AAA rated agency mortgage-backed securities, high quality corporate securities, taxable municipal securities, and agency securities. Management strives to maintain a portfolio duration that is less than 60 months.
Investment securities classified as held to maturity are carried at amortized cost while investment securities classified as available for sale are reported at fair market value with unrealized aggregate appreciation/depreciation excluded from income and credited/charged to accumulated other comprehensive income (loss) within shareholders’ equity on a net of tax basis. The Company measures current expected credit losses on debt securities in accordance with ASU 2016-13, Financial Instruments - Credit Losses (Topic 326): Measurement of Credit Losses on Financial Instruments. See Note 1 within the Notes to Consolidated Financial Statements for information regarding the Company’s calculation of the allowance for credit losses on both the held to maturity and available for sale investment securities portfolios.
The following table sets forth the weighted average yield for each type of investment security and range of maturity as of December 31, 2023. Yields are not presented on a tax-equivalent basis, but are based upon the cost basis and are weighted for the scheduled maturity.
Investment securities available for sale:
AT DECEMBER 31, 2023 | |||||||||||||||
TOTAL | |||||||||||||||
|
|
|
| U.S. AGENCY | INVESTMENT | ||||||||||
MORTGAGE- | SECURITIES | ||||||||||||||
CORPORATE | BACKED | AVAILABLE | |||||||||||||
U. S. AGENCY | MUNICIPAL | BONDS | SECURITIES | FOR SALE | |||||||||||
Within 1 year | 5.20 | % |
| 2.71 | % |
| 5.16 | % |
| — | % | 4.48 | % | ||
After 1 year but within 5 years | 2.69 |
| 3.01 |
| 5.95 |
| 2.83 | 5.41 | |||||||
After 5 years but within 10 years | 1.67 |
| 2.41 |
| 7.18 |
| 2.81 | 5.50 | |||||||
Over 10 years | 2.69 |
| — |
| 4.31 |
| 3.09 | 3.09 | |||||||
Total | 2.22 |
| 2.71 |
| 6.40 |
| 3.07 | 4.13 | |||||||
Investment securities held to maturity:
AT DECEMBER 31, 2023 | |||||||||||||||
TOTAL | |||||||||||||||
|
|
|
| U.S. AGENCY | INVESTMENT | ||||||||||
CORPORATE | MORTGAGE- | SECURITIES | |||||||||||||
BONDS AND | BACKED | HELD TO | |||||||||||||
U. S. AGENCY | MUNICIPAL | OTHER | SECURITIES | MATURITY | |||||||||||
Within 1 year | — | % |
| 3.58 | % |
| 1.16 | % |
| 2.82 | % | 2.59 | % | ||
After 1 year but within 5 years | — |
| 3.37 |
| 4.21 |
| — | 3.48 | |||||||
After 5 years but within 10 years | 2.01 |
| 2.84 |
| 7.36 |
| 3.86 | 2.91 | |||||||
Over 10 years | — |
| 2.82 |
| 7.44 |
| 3.87 | 3.96 | |||||||
Total | 2.01 |
| 3.08 |
| 4.58 |
| 3.83 | 3.43 | |||||||
DEPOSITS
The Bank believes it has a stable core deposit base made up of traditional commercial bank products that exhibit modest fluctuation during the year, other than jumbo certificates of deposit and certain municipal deposits, which demonstrate some seasonality. The Company also utilizes certain Trust Company specialty deposits related to the ERECT funds as a funding source, which serve as an alternative to wholesale borrowings and can exhibit some limited degree of volatility. The Company does not use brokered deposits as a funding source.
7
The following table sets forth the average balance of the Company’s deposits and average rates paid thereon for the past two calendar years:
| 2023 |
| 2022 |
| |||||||
(IN THOUSANDS, EXCEPT PERCENTAGES) | |||||||||||
Demand: |
|
| |||||||||
Non-interest bearing | $ | 191,580 |
| — | % | $ | 215,196 |
| — | % | |
Interest bearing |
| 225,713 |
| 1.80 |
| 227,838 |
| 0.53 | |||
Savings |
| 127,539 |
| 0.10 |
| 137,845 |
| 0.10 | |||
Money market |
| 302,964 |
| 2.46 |
| 289,674 |
| 0.69 | |||
Time deposits (1) |
| 306,044 |
| 3.06 |
| 285,760 |
| 1.08 | |||
Total deposits | $ | 1,153,840 |
| 2.18 | % | $ | 1,156,313 |
| 0.68 | % | |
| (1) | Time deposits include certificates of deposit (CDs) and individual retirement accounts (IRAs). |
The Federal Deposit Insurance Corporation (FDIC) is an independent agency of the United States government that protects bank depositors against loss. The Bank is an FDIC-insured institution, therefore, deposits are insured up to the standard insurance amount of $250,000 per depositor. As of December 31, 2023 and 2022, the estimated amount of uninsured deposits was $384.5 million and $316.5 million, respectively. The estimate of uninsured deposits was done at a single account level and does not take into account total customer balances in the Bank. It should be noted that approximately 50% of these uninsured deposits relate to public funds from municipalities, government entities, and school districts which by law are required to be collateralized with investment securities or FHLB letters of credit to protect these depositor funds.
The maturities on CDs with balances that exceed the FDIC insurance limit of $250,000 as of December 31, 2023, are as follows:
| (IN THOUSANDS) | ||
MATURING IN: |
|
| |
Three months or less | $ | 27,194 | |
Over three through six months |
| 13,655 | |
Over six through twelve months |
| 36,248 | |
Over twelve months |
| 4,734 | |
Total | $ | 81,831 | |
AMERISERV TRUST AND FINANCIAL SERVICES COMPANY
AmeriServ Trust and Financial Services Company is a trust company organized under Pennsylvania law in October 1992. Its staff of approximately 44 professionals administers assets valued at approximately $2.5 billion that are not recognized on the Company’s balance sheet at December 31, 2023. The Trust Company focuses on wealth management. Wealth management includes personal trust products and services such as personal investment portfolio management, estate planning and administration, custodial services and pre-need trusts. Also, institutional trust products and services such as 401(k) plans, defined benefit and defined contribution employee benefit plans, and individual retirement accounts are included in this segment. This segment also includes financial services, which provide the sale of mutual funds, annuities, and insurance products. The wealth management business also includes the union collective investment funds, the ERECT funds, which are designed to use union pension dollars in construction projects that utilize union labor. At December 31, 2023, the Trust Company had total assets of $6.4 million and total shareholders’ equity of $6.1 million. In 2023, the Trust Company contributed earnings to the Company as its gross revenue amounted to $10.4 million and the net income contribution was $1.1 million. The Trust Company is subject to regulation and supervision by the Federal Reserve Bank of Philadelphia and the PDB.
MONETARY POLICIES
Commercial banks are affected by policies of various regulatory authorities including the Board of Governors of the Federal Reserve System (the Federal Reserve). An important function of the Federal Reserve is to regulate the national supply of bank credit. Among the instruments of monetary policy used by the Federal Reserve are: open market operations in U.S. Government securities, changes in the federal funds rate and discount rate on member bank borrowings, and changes in reserve requirements on bank deposits. These means are used in varying combinations to influence overall growth of bank loans, investments, and deposits, and may also affect interest rate charges on loans or
8
interest paid for deposits. The monetary policies of the Federal Reserve have had a significant effect on the operating results of commercial banks in the past and are expected to continue to do so in the future.
COMPETITION
Our subsidiaries face strong competition from other commercial banks, savings banks, credit unions, savings and loan associations, and other financial or investment service institutions for business in the communities they serve. Several of these institutions are affiliated with major banking and financial institutions which are substantially larger and have greater financial resources than the Bank and the Trust Company. As the financial services industry continues to consolidate, the scope of potential competition affecting our subsidiaries will also increase. Brokerage houses, consumer finance companies, insurance companies, financial technology firms, and pension trusts are important competitors for various types of financial services. Personal and corporate trust investment counseling services are offered by insurance companies, other firms, and individuals. In addition, some of these competitors, such as credit unions, are subject to a lesser degree of regulation or taxation than that imposed on us.
MARKET AREA & ECONOMY
After a year of the most aggressive Fed tightening in four decades in 2022, most economists, including the Federal Reserve staff, expected a recession when 2023 began. The recession never happened, making resilience the economic word of 2023. In early March, two regional banks failed in quick succession, followed by a third a few weeks later, rocking the financial markets. After weeks of stalemate, Congressional leaders eventually agreed to suspend the debt ceiling in late May, but ratings agencies viewed the systemic dysfunction as worthy of a credit downgrade that further rocked markets. Recession fears subsided over the summer when consumer services spending soared. In the third quarter of 2023, gross domestic product (GDP) grew 4.9% annualized, the fastest since mid-2021, further quelling recession fears. Inflation subsided at an accelerating pace all year. Fed rhetoric was still hawkish at the September Federal Open Market Committee (FOMC) meeting, but the FOMC stopped hiking in July. At the December FOMC meeting, a dovish pivot by Chair Powell suggested the focus for 2024 will shift to deciding when to end quantitative tightening and start to cut fed funds. The S&P 500 rose 23.8% in 2023. The 10-year U.S. Treasury yield started and ended the year at 3.87%. There was plenty of movement in the interim. GDP far exceeded expectations in 2023, thanks to consumer and government spending. The 2023 budget was more stimulative than expected, and a surge in late filings for 2021 Employer Tax Credits further lifted demand. A resilient labor market allowed consumers to maintain elevated spending. GDP growth and falling inflation are the key ingredients to a soft landing. The pace of nonfarm payrolls growth slowed through 2023 but remained solid through the end of the year, even with the United Auto Workers strike in October. The labor market has become more balanced, with job openings falling and wage growth moderating. The Fed’s 25 basis point hike in July could very well be the last for this cycle. History suggests the longer the Fed pauses, the larger the chance the next move is in the other direction. December FOMC minutes indicate Fed officials are already discussing rate cuts, but with no urgency.
Johnstown, Pennsylvania, where the Company is headquartered, continues to have a cost of living that is lower than the national average. Johnstown is home to The University of Pittsburgh at Johnstown, Pennsylvania Highlands Community College and Conemaugh Health System. The high-tech defense industry is the main non-health care staple of the Johnstown economy, with the region fulfilling many federal government contracts, punctuated by one of the premier defense trade shows in the U.S., the annual Showcase for Commerce. The city also hosts annual events such as the Flood City Music Festival that draws several thousand visitors. The Johnstown, PA MSA unemployment rate decreased from a 5.1% average in 2022 to a 4.4% average in 2023. The Johnstown, PA MSA continues to have one of the highest jobless rates among the 18 metropolitan statistical areas across the state. Slow economic conditions, coupled with a declining population trend, creates a growth challenge moving forward.
Economic conditions are stronger in the State College market and have demonstrated the same improvement experienced in the national economy. The community is a college town, dominated economically and demographically by the presence of the University Park campus of the Pennsylvania State University. “Happy Valley” is another often-used term to refer to the State College area, including the borough and the townships of College, Harris, Patton, and Ferguson. The unemployment rate for the State College MSA decreased from a 3.2% average in 2022 to a 2.9% average in 2023 and remains one of the lowest of all regions in the Commonwealth. A large percentage of the population in State College falls into the 18 to 34-year-old age group, while potential customers in the Cambria/Somerset markets tend to be over 50 years of age.
9
Hagerstown in Washington County, Maryland offers a rare combination of business advantages providing a major crossroads location that is convenient to the entire East Coast at the intersection of I-81 and I-70. It has a workforce of over 400,000 with strengths in manufacturing and technology. It also offers an affordable cost of doing business and living, all within an hour of the Washington, D.C./Baltimore regions. There are also plenty of facilities and land slated for industrial/commercial development. Hagerstown has become a choice location for manufacturers, financial services, and distribution companies. The Hagerstown, MD-Martinsburg, WV MSA unemployment rate decreased from a 3.4% average in 2022 to a 2.8% average in 2023.
The Company also has loan production offices in Wilkins Township in Allegheny County and Altoona in Blair County, Pennsylvania. Wilkins Township in Allegheny County, Pennsylvania is located 15 miles east of the city of Pittsburgh. While the city is historically known for its steel industry, today its economy is largely based on healthcare, education, technology and financial services. The city of Pittsburgh is home to many colleges, universities and research facilities, the most well-known of which are Carnegie Mellon University, Duquesne University and the University of Pittsburgh. Pittsburgh is rich in art and culture. Pittsburgh museums and cultural sites include the Andy Warhol Museum, the Carnegie Museum of Art, the Frick Art & Historical Center, and Pittsburgh Center for the Arts among numerous others. Pittsburgh is also the home of the Pirates, Steelers and Penguins. The unemployment rate for the Pittsburgh MSA decreased from a 4.3% average in 2022 to a 3.7% average in 2023.
Altoona is the business center of Blair County, Pennsylvania with a strong retail, government and manufacturing base. The top field of employment in Altoona and the metro area is healthcare. Its location along I-99 draws from a large trade area over a wide geographic area that extends to State College and Johnstown. It serves as the headquarters for Sheetz Corporation, which ranks on Forbes’ list of the top privately owned companies. In addition to being located adjacent to I-99 and a major highway system, Altoona also has easy access to rail and air transportation. The average unemployment rate in the Altoona MSA decreased from 4.1% in 2022 to 3.5% in 2023.
HUMAN CAPITAL RESOURCES
The Company’s long-term growth and success depends on its ability to attract, develop and retain a high-performing and diverse workforce. The Company strives to provide a work environment that promotes collaboration, productivity, and employee engagement, which in turn drives both employee and customer success, as well as benefits the communities in which the Company does business.
The Company’s executive team and the Compensation/Human Resources Committee of the Board of Directors oversee the strategic management of the Company’s human capital resources, and the Company’s Human Resources Department manages the day-to-day of those resources.
Employee profile
The Company employed 323 people as of December 31, 2023 in full- and part-time positions. Approximately 149 non-supervisory employees of the Company are represented by the United Steelworkers AFL-CIO-CLC, Local Union 2635-06. The Company is under a four-year labor contract with the United Steelworkers Local, which expires on October 15, 2025. The contract calls for annual wage increases of 2% during the life of the contract. The Company has not experienced a work stoppage since 1979. Unionization in financial institutions remains exceptionally low with less than 0.25% of banks nationwide being covered by a collective bargaining agreement. This unique unionization situation creates both challenges and opportunities for the Company. The key goals of organized labor are to provide their members with strong wages and benefits, stable jobs, and safe and respectable workplaces. As a result of these key union goals, the Company’s salaries and benefit costs are higher than its non-union peers as we offer good wages and strong benefits which include affordable health care and strong retirement benefits with the majority of current union employees participating in a defined benefit pension plan. The Company has consistently viewed its positive union relationships as a potential source of additional revenue. Examples of success in these efforts include the previously mentioned ERECT Fund where the wealth management group is trustee for this $243 million fund whose purpose is to invest in commercial construction projects with the requirement that they utilize union labor. The Bank has also been a preferred mortgage and consumer loan provider for the Pennsylvania State Education Association for almost 10 years which provides us with the opportunity to expand our lending in these products throughout Pennsylvania. Since inception of the partnership, the Bank has funded over $315 million in mortgage and consumer loans to unionized teachers and their family members.
10
Competitive Compensation
As part of the Company’s compensation philosophy, market competitive programs are maintained for employees to attract and retain top talent. In addition to competitive base wages, additional programs include health and welfare benefits, a 401(k) Plan, flexible spending accounts, paid time off, family leave, and employee assistance programs. Some employees participate in a defined benefit pension plan. In addition, the Company promotes health and wellness by encouraging work-life balance and, where appropriate, offering flexible work schedules. The Company has also adopted a hybrid remote work policy for certain positions.
Talent and Promoting Diversity
A core tenet of the Company’s talent philosophy is to both develop talent from within and supplement with external hires. Whenever possible, the Company seeks to fill positions by promotion and transfer from within the organization. The Company’s talent acquisition team uses internal and external resources to recruit highly skilled and talented candidates; employee referrals are also encouraged.
The Company is dedicated to recruitment and career development practices that support its employees and promotes diversity in its workforce at all levels of the Company. The Company is committed to having a workforce that reflects the communities in which it serves. The Company strives to promote inclusion through defined Company values and behaviors. With the support from the Board of Directors, the Company continues to explore additional diversity, equity, inclusion, and belonging efforts through multiple approaches to inclusion: candidates, employees, and the marketplace. The Company is focused on sourcing and hiring with fair and equitable approaches, creating an environment where all employees can develop and thrive.
INDUSTRY REGULATION
The banking and trust industry, and the operation of bank holding companies, is highly regulated by federal and state law, and by numerous regulations adopted by the federal and state banking agencies. Bank regulation affects all aspects of conducting business as a bank, including such major items as minimum capital requirements, limits on types and amounts of investments, loans and other assets, as well as borrowings and other liabilities, and numerous restrictions or requirements on the loan terms and other products made available to customers, particularly consumers. Federal deposit insurance from the Federal Deposit Insurance Corporation (FDIC) is required for all banks in the United States, and maintaining FDIC insurance requires observation of the various rules of the FDIC, as well as payment of deposit insurance premiums. New branches, or acquisitions or mergers, are required to be pre-approved by the responsible agency, which in the case of the Company and the Bank is the Federal Reserve and the PDB. The Bank provides detailed financial information to its regulators, including a quarterly call report that is filed pursuant to detailed prescribed instructions to ensure that all U.S. banks report the same way. The U.S. banking laws and regulations are frequently updated and amended, especially in response to crises in the financial industry, such as the global financial crisis of 2008, which resulted in the Dodd-Frank Wall Street Reform and Consumer Protection Act enacted in 2010 (the Dodd-Frank Act), a statute affecting many facets of the financial industry. The Economic Growth, Regulatory Relief, and Consumer Protection Act was enacted into law in 2018 and was designed to ease certain restrictions imposed by the Dodd-Frank Act.
While it is impractical to discuss all laws and regulations that regularly affect the business of the Company and its subsidiaries, set forth below is an overview of some of the major provisions and statutes that apply.
CAPITAL REQUIREMENTS
One of the most significant regulatory requirements for banking institutions is minimum capital, imposed as a ratio of capital to assets. The Federal Deposit Insurance Act, as amended (FDIA), identifies five capital categories for insured depository institutions: well capitalized, adequately capitalized, undercapitalized, significantly undercapitalized and critically undercapitalized. It requires U.S. federal bank regulatory agencies to implement systems for prompt corrective action for insured depository institutions that do not meet minimum capital requirements based on these categories. Both federal and state banking regulation impose progressively more restrictive constraints on operations, management and capital distributions, depending on the category in which an institution is classified. Unless a bank is well capitalized, it is subject to restrictions on its ability to utilize brokered deposits and on other aspects of its operations. Generally, a bank is prohibited from paying any dividend or making any capital distribution or paying any management fee to its holding company if the bank would thereafter be undercapitalized.
11
Minimum Capital | Well |
| |||
| Plus Buffer |
| Capitalized |
| |
Common equity tier 1 capital ratio |
| 7.00 | % | 6.50 | % |
Tier 1 capital ratio |
| 8.50 | % | 8.00 | % |
Total capital ratio |
| 10.50 | % | 10.00 | % |
DIVIDEND RESTRICTIONS
The primary source of cash to pay dividends, if any, to the Company’s shareholders and to meet the Company’s obligations is dividends paid to the Company by the Bank and the Trust Company. Dividend payments by the Bank to the Company are subject to the laws of the Commonwealth of Pennsylvania, the Banking Code, the FDIA and the regulation of the PDB and the Federal Reserve. Under the Banking Act and the FDIA, a bank may not pay any dividends if, after paying such dividends, it would be undercapitalized under applicable capital requirements. In addition to these explicit limitations, the federal regulatory agencies are authorized to prohibit a banking subsidiary or bank holding company from engaging in unsafe or unsound banking practices. Depending upon the circumstances, the agencies could take the position that paying a dividend would constitute an unsafe or unsound banking practice.
It is the policy of the Federal Reserve that bank holding companies should generally pay cash dividends on common stock only out of income available from the immediately preceding year and only if prospective earnings retention is consistent with the organization’s expected future needs and financial condition. The policy provides that bank holding companies should not maintain a level of cash dividend that undermines the bank holding company’s ability to serve as a source of strength to its banking subsidiary. A bank holding company may not pay dividends when it is insolvent.
For more information regarding quarterly cash dividends, see Part II, Item 5. Market for the Registrant’s Common Equity, Related Stockholder Matters and Issuer Purchases of Equity Securities below.
PRIVACY PROVISIONS
Federal banking regulators adopted rules that limit the ability of banks and other financial institutions to disclose non-public information about customers to non-affiliated third parties. These limitations require disclosure of privacy policies to consumers and, in some circumstances, allow consumers to prevent disclosure of certain personal information to non-affiliated third parties. The privacy provisions affect how consumer information is transmitted through diversified financial companies and conveyed to outside vendors. The Company believes it is in compliance with the various provisions.
USA PATRIOT ACT
A major focus of governmental policy on financial institutions has been aimed at combating money laundering and terrorist financing. The USA Patriot Act substantially broadened the scope of United States anti-money laundering laws and regulations by imposing significant new compliance and due diligence obligations, creating new crimes and penalties and expanding the extra-territorial jurisdiction of the United States. The United States Treasury Department has issued and, in some cases, proposed a number of regulations that apply various requirements of the USA Patriot Act to financial institutions. These regulations impose obligations on financial institutions to maintain appropriate policies, procedures and controls to detect, prevent and report money laundering and terrorist financing and to verify the identity of their customers. Failure of a financial institution to maintain and implement adequate programs to combat money laundering and terrorist financing, or to comply with all of the relevant laws or regulations, could have serious legal and reputational consequences for the Company.
Community Reinvestment Act
All FDIC-insured institutions have a responsibility under the Community Reinvestment Act (CRA) and related regulations to help meet the credit needs of their communities, including low- and moderate-income neighborhoods. In connection with its examination of a state-chartered bank, the federal bank regulators are required to assess an institution’s record of compliance with the CRA. On October 24, 2023, the FDIC, the Federal Reserve Board, and the Office of the Comptroller of the Currency issued a final rule to strengthen and modernize the CRA regulations. Under the final rule, the asset size thresholds were updated to account for changes in the banking industry as follows: (a) “small banks” with assets less than $600 million (from less than $376 million), (b) “intermediate banks” with assets between $600 million and $2 billion (from between $376 million and $1.503 billion), and (c) “large banks” with assets greater than or equal to $2 billion (from $1.503 billion), each as adjusted for inflation subsequently. The assets as of December
12
31st in both of the prior two calendar years will be used to determine the appropriate size threshold. The agencies will evaluate large banks under four performance tests: the Retail Lending Test, the Retail Services and Products Test, the Community Development Financing Test, and the Community Development Services Test. For intermediate banks, the two performance tests will be: Retail Lending Test and the existing CD test, which is the default but banks can opt-in to the CD Financing Test. The rule also exempts small and intermediate banks from new data collection requirements that apply to banks with assets of at least $2 billion and limits certain data collection and reporting requirements to large banks with assets greater than $10 billion. The applicability date for the majority of the provisions in the CRA regulations is January 1, 2026, and additional requirements will be applicable on January 1, 2027.
FDIC Insurance of Certain Accounts and Regulation by the FDIC
The Bank is an FDIC insured financial institution whereby the FDIC provides deposit insurance for a certain maximum dollar amount per customer. The Bank, as is true for all FDIC insured banks, is subject to deposit insurance assessments as determined by the FDIC.
Under the FDIC’s risk-based deposit premium assessment system, the assessment rates for an insured depository institution (IDI) are determined by an assessment rate calculator, which is based on a number of elements that measure the risk each institution poses to the Deposit Insurance Fund (DIF). As a result of the Dodd-Frank Act, the calculated assessment rate is applied to average consolidated assets less the average tangible equity of the IDI during the assessment period to determine the dollar amount of the quarterly assessment. Under the current system, premiums are assessed quarterly and could increase if, for example, criticized loans and leases and/or other higher risk assets increase or balance sheet liquidity decreases. In addition, the FDIC can impose special assessments in certain instances. Deposit insurance assessments fund the DIF.
On October 18, 2022, the FDIC adopted a final rule that increased initial base deposit insurance assessment rates by 2 basis points, beginning with the first quarterly assessment period of 2023. Due to the decline in the DIF reserve ratio below the statutory minimum of 1.35% as of June 30, 2020, caused by extraordinary growth in insured deposits during the first and second quarters of 2020, the FDIC established a Restoration Plan in September 2020 to restore the DIF reserve ratio to meet or exceed the statutory minimum of 1.35% within eight years. This 2020 plan did not include an increase in the deposit insurance assessment rate. On June 21, 2022, however, the FDIC adopted an Amended Restoration Plan and notice of proposed rulemaking to increase the deposit insurance assessment rates as it was otherwise at risk of not reaching the statutory minimum by the statutory deadline of September 30, 2028. The proposed rule was adopted as final without change.
Also, in the final rule adopted on October 18, 2022, the FDIC incorporated Accounting Standards Update (ASU) 2022-02, Financial Instruments - Credit Losses (Topic 326) Troubled Debt Restructurings and Vintage Disclosures in the risk-based deposit insurance assessment system applicable to all large and highly complex IDIs. In March 2022, the FASB issued ASU 2022-02, which eliminates accounting guidance for troubled debt restructurings (TDRs) and introduces new disclosures and enhances existing disclosures concerning certain loan refinancings and restructurings when a borrower is experiencing financial difficulty. The FDIC final rule amends the assessment regulations to include a new term, “modifications to borrowers experiencing financial difficulty,” in two financial measures—the underperforming assets ratio and the higher-risk assets ratio – used to determine deposit insurance assessments for large and highly complex IDIs. This final rule was effective January 1, 2023, and applicable to the first quarterly assessment period of 2023.
On November 16, 2023, the FDIC adopted a final rule on special assessment to recover the losses to the DIF from the protection of uninsured depositors following the closures of Silicon Valley Bank, Santa Clara, CA, and Signature Bank, New York, NY during March 2023. The assessment base for the special assessment is equal to an IDI’s estimated uninsured deposits, reported for the quarter that ended December 31, 2022, adjusted to exclude the first $5 billion in estimated uninsured deposits from the IDI, or for IDIs that are part of a holding company with one or more subsidiary IDIs, at the banking organization level. The FDIC will collect the special assessment at an annual rate of approximately 13.4 basis points, over eight quarterly assessment periods. The FDIC retains the ability to cease collection early, extend the special assessment collection period, and impose a final shortfall special assessment to collect the difference between actual losses and the amounts collected after the receiverships for Silicon Valley Bank and Signature Bank terminate. The final rule will be effective April 1, 2024, with the first collection for the special assessment reflected on the invoice for the first quarterly assessment period of 2024 with a payment date of June 28, 2024.
13
AVAILABLE INFORMATION
We file annual, quarterly and current reports, proxy statements and other information with the SEC. These filings are available to the public on the internet at the SEC’s website at http://www.sec.gov.
Our internet address is http://www.ameriserv.com. We make available, free of charge on http://www.ameriserv.com, our annual, quarterly and current reports, and amendments to those reports, as soon as reasonably practical after we electronically file such material with, or furnish it to, the SEC.
ITEM 1A. RISK FACTORS
Not applicable.
ITEM 1B. UNRESOLVED STAFF COMMENTS
The Company has no unresolved staff comments from the SEC for the reporting periods presented.
ITEM 1C. CYBERSECURITY
The Company maintains comprehensive and continually evolving processes for assessing, identifying, and managing material risks from cybersecurity threats, including any potential unauthorized occurrence on, or conducted through, the Company’s information systems that may result in adverse effects on the confidentiality, integrity, or availability of such systems or any information residing on such systems. The processes relating to cybersecurity threats are integrated into the Company’s overall risk management processes, which are overseen by the Board of Directors.
Risk Management and Strategy
The Company’s Enterprise Risk Management Policy assists the Board of Directors and management in clarifying their tolerance for identifying those credit, market, liquidity, operational, legal, compliance, strategic, reputation and security (information and physical) risks that have the potential to cause material financial harm to the institution, as well as describing a methodology for determining the proper level of controls to manage and mitigate those risks. Cybersecurity is a critical component of risk management, given the increasing reliance on technology and the increasing cybersecurity threat landscape. The Information Security Program is built on the Federal Financial Institutions Examination Council (FFIEC) IT Handbooks, National Institute of Standards and Technology (NIST) Cybersecurity Framework, the Center for Internet Security (CIS) Cybersecurity Controls (CSC), and industry best practice. The Information Security Program utilizes a defense in depth strategy that leverages multiple security measures to protect Company assets and information.
The Board of Directors is responsible for overseeing management’s development and execution of the Company’s risk management process. Risk management is administered by a senior management team called the Management Enterprise Risk Committee (MERC). Periodic risk assessments are performed to identify technical and physical risks to information systems. These risk assessments identify internal and external threats that could cause a cybersecurity incident, assessing the likelihood of potential impact of those threats, and assessing the measures and controls in place to manage the risks. As per FFIEC guidance, a Change Management Policy and Committee are in place to manage changes to technology and systems. Information Security is a member of this Committee to evaluate changes for information security impact.
The Company leverages internal and external auditors to periodically review information technology and information security policy, processes, and controls to ensure they meet regulatory compliance and operate effectively. Independent penetration testing is performed annually.
The Company maintains an Incident Response Plan and a Crisis Communication Plan that provide documented guidelines for handling potential threats and taking appropriate measures including timely notification of cybersecurity threats and incidents to senior management and the Board of Directors when appropriate. The Incident Response Plan is managed by the Chief Information Security Officer (CISO) and is reviewed and tested at least annually. The Crisis Communication Plan, managed by the Director of Marketing and Alternative Delivery, is reviewed and tested at least annually.
14
The Company uses third-party vendors to assist in monitoring, detecting, and managing cyber threats, including managed security service monitoring, penetration testing and vulnerability assessment. The Management Enterprise Risk Committee has established risk management guidelines for third-party vendors. Through the Vendor Management Committee, the Company conducts due diligence reviews of third-party vendors before contracts or agreements for provision of services are signed and conducts ongoing due diligence and oversight procedures with the frequency of the procedures determined based on a risk assessment of the services provided. Generally, the Company’s agreements with service providers include requirements related to cybersecurity and data privacy. All such agreements are reviewed periodically. The Company cannot guarantee, however, that such agreements, due diligence, and oversight procedures will prevent a cybersecurity incident from impacting information systems. Moreover, as a result of applicable laws and regulations or applicable contractual provisions, the Company may be held responsible for cybersecurity incidents attributed to its service providers in relation to any data that the Company shares with such providers.
Notwithstanding our efforts at cybersecurity, no system of prevention is impenetrable, and we cannot guarantee that we will be successful in preventing or mitigating a cybersecurity incident that could have a material adverse effect on us. To date, the Company has not detected any material cybersecurity incident to our own systems. However, during the second quarter of 2023, a prominent third-party vendor experienced a cybersecurity incident due to a previously unknown (i.e., zero-day) vulnerability in a popular file sharing software the vendor used called MOVEit Transfer. For further information regarding this incident, please see our Quarterly Report on Form 10-Q for the quarter ended June 30, 2023 filed on August 10, 2023 and our Quarterly Report on Form 10-Q for the quarter ended September 30, 2023 filed on November 9, 2023. Future cybersecurity incidents could, however, materially affect our business strategy, results of operations, or financial condition.
Governance
The Company’s information technology resources are managed by the Information Technology Department, which is responsible for the first line of defense – identifying, assessing, and managing material risks from cybersecurity threats. The Information Technology Department is managed by the Chief Information Officer (CIO), who reports to the Company’s President and CEO. The present CIO has been employed by the Company in the information technology area for two and a half years and was previously the CISO at the Company for two years. The present CIO has over thirty-five years of IT experience, twelve of that in banking. The CIO holds a current Certified Information Systems Security Professional (CISSP) designation.
The Chief Information Security Officer (CISO) whose responsibilities constitute the second line of defense provides the vision, leadership, and strategies necessary to protect the information security of the Company. The CISO manages policy, procedure, and process to ensure the execution of the Company’s Information Security and Business Continuity/ Disaster Recovery (BC/DR) Programs. The CISO reports directly to the Chief Risk Officer to provide segregation between the first and second line of defense. The Information Security Department, among other duties, supervises internal employee training relating to cybersecurity risks, conducts access reviews relating to the Company’s information systems, and monitors implemented security measures.
The Company has established a Management Technology Committee and a Board Technology Committee. These Committees provide oversight and governance of information technology and the Information Security Program and meet quarterly. The Board Technology Committee’s responsibilities include: (1) monitoring the strategic deployment and usage of Information Technology throughout the Company using reports and presentations from management; (2) oversight of cybersecurity preparedness through information security reports, discussion of internal events and discussion of cybersecurity topics pertinent to the Company and the industry; (3) oversight of activities in support of the Company’s business continuity/disaster recovery program to ensure optimal corporate resiliency in the unlikely event of a disaster; and (4) providing broad strategic guidance on the technology direction of the Company by, among other things, overseeing the development of the AmeriServ Strategic Technology Plan.
ITEM 2. PROPERTIES
The principal offices of the Company and the Bank occupy the five-story AmeriServ Financial building at the corner of Main and Franklin Streets in Johnstown plus eleven floors of the building adjacent thereto. The Company occupies the main office and its subsidiary entities have 14 locations which are owned. Seven additional locations are leased with terms expiring from April 30, 2025 to June 30, 2033.
15
ITEM 3. LEGAL PROCEEDINGS
The Company is subject to various types of lawsuits and claims arising in the ordinary course of business. In the opinion of management, after review and consultation with counsel, there are no material legal proceedings currently pending to which the Company or any of its subsidiaries is a party or of which any of their property is the subject. As discussed further in the Non-Interest Expense section of Item 7, Management’s Discussion and Analysis of Consolidated Financial Position and Results of Operations, during 2023, the Company incurred certain non-interest expenses due to increased legal and professional fees resulting from the activities of an activist investor and a proxy contest relating to the Company’s 2023 annual meeting of shareholders, some of which expenses involved lawsuits brought by the activist investor in connection with the Company’s 2023 annual meeting of shareholders.
ITEM 4. MINE SAFETY DISCLOSURES
Not applicable.
16
PART II
ITEM 5. MARKET FOR THE REGISTRANT’S COMMON EQUITY, RELATED STOCKHOLDER MATTERS AND ISSUER PURCHASES OF EQUITY SECURITIES
COMMON STOCK
As of March 20, 2024, the Company had 2,489 shareholders of record for its common stock. The Company’s common stock is traded on The NASDAQ Stock Market under the symbol “ASRV.” The following table sets forth the actual high and low closing prices and the cash dividends declared per share for the periods indicated:
CASH | |||||||||
PRICES | DIVIDENDS | ||||||||
| HIGH |
| LOW |
| DECLARED | ||||
Year ended December 31, 2023: |
|
|
| ||||||
First Quarter | $ | 4.09 | $ | 3.05 | $ | 0.030 | |||
Second Quarter |
| 3.28 |
| 2.46 |
| 0.030 | |||
Third Quarter |
| 3.33 |
| 2.41 |
| 0.030 | |||
Fourth Quarter |
| 3.28 |
| 2.51 |
| 0.030 | |||
Year ended December 31, 2022: |
|
|
|
|
|
| |||
First Quarter | $ | 4.50 | $ | 3.85 | $ | 0.025 | |||
Second Quarter |
| 4.08 |
| 3.92 |
| 0.030 | |||
Third Quarter |
| 4.03 |
| 3.80 |
| 0.030 | |||
Fourth Quarter |
| 4.10 |
| 3.70 |
| 0.030 | |||
The declaration of cash dividends on the Company’s common stock is at the discretion of the Board, and any decision to declare a dividend is based on a number of factors, including, but not limited to, earnings, prospects, financial condition, regulatory capital levels, applicable covenants under any credit agreements and other contractual restrictions, Pennsylvania law, federal and Pennsylvania bank regulatory law, and other factors deemed relevant. Additionally, the Company does not currently have a common stock repurchase program authorized.
ITEM 6. [RESERVED]
17
ITEM 7. MANAGEMENT’S DISCUSSION AND ANALYSIS OF CONSOLIDATED FINANCIAL CONDITION AND RESULTS OF OPERATIONS (MD&A)
The following discussion and analysis of financial condition and results of operations of the Company should be read in conjunction with the consolidated financial statements of the Company including the related notes thereto, included elsewhere herein.
SELECTED FIVE-YEAR CONSOLIDATED FINANCIAL DATA
AT OR FOR THE YEAR ENDED DECEMBER 31, | ||||||||||||||||
| 2023 |
| 2022 |
| 2021 |
| 2020 |
| 2019 | |||||||
(DOLLARS IN THOUSANDS, EXCEPT PER SHARE DATA AND RATIOS) | ||||||||||||||||
SUMMARY OF INCOME STATEMENT DATA: |
|
|
|
|
|
|
|
|
|
| ||||||
Total interest income | $ | 60,860 | $ | 49,058 | $ | 46,669 | $ | 46,882 | $ | 49,767 | ||||||
Total interest expense |
| 24,840 |
| 8,495 |
| 7,586 |
| 10,515 |
| 14,325 | ||||||
Net interest income |
| 36,020 |
| 40,563 |
| 39,083 |
| 36,367 |
| 35,442 | ||||||
Provision for credit losses |
| 7,429 |
| 50 |
| 1,100 |
| 2,375 |
| 800 | ||||||
Net interest income after provision for credit losses |
| 28,591 |
| 40,513 |
| 37,983 |
| 33,992 |
| 34,642 | ||||||
Total non-interest income |
| 16,389 |
| 16,692 |
| 17,761 |
| 16,275 |
| 14,773 | ||||||
Total non-interest expense |
| 49,368 |
| 48,004 |
| 46,970 |
| 44,455 |
| 41,815 | ||||||
Income (loss) before income taxes |
| (4,388) |
| 9,201 |
| 8,774 |
| 5,812 |
| 7,600 | ||||||
Provision (benefit) for income taxes |
| (1,042) |
| 1,753 |
| 1,702 |
| 1,214 |
| 1,572 | ||||||
Net income (loss) | $ | (3,346) | $ | 7,448 | $ | 7,072 | $ | 4,598 | $ | 6,028 | ||||||
PER COMMON SHARE DATA: |
|
|
|
|
|
|
|
|
|
| ||||||
Basic earnings per share | $ | (0.20) | $ | 0.44 | $ | 0.41 | $ | 0.27 | $ | 0.35 | ||||||
Diluted earnings per share |
| (0.20) |
| 0.43 |
| 0.41 |
| 0.27 |
| 0.35 | ||||||
Cash dividends declared |
| 0.120 |
| 0.115 |
| 0.100 |
| 0.100 |
| 0.095 | ||||||
Book value at period end |
| 5.96 |
| 6.20 |
| 6.82 |
| 6.12 |
| 5.78 | ||||||
BALANCE SHEET AND OTHER DATA: |
|
|
|
|
|
|
|
|
|
| ||||||
Total assets | $ | 1,389,638 | $ | 1,363,874 | $ | 1,335,560 | $ | 1,282,733 | $ | 1,171,184 | ||||||
Loans and loans held for sale, net of unearned income |
| 1,038,401 |
| 990,825 |
| 986,037 |
| 978,345 |
| 887,574 | ||||||
Allowance for credit losses - loans |
| 15,053 |
| 10,743 |
| 12,398 |
| 11,345 |
| 9,279 | ||||||
Investment securities, net of allowance for credit losses: | ||||||||||||||||
Available for sale |
| 165,711 |
| 179,508 |
| 163,171 |
| 144,165 |
| 141,749 | ||||||
Held to maturity |
| 63,979 |
| 61,878 |
| 53,751 |
| 44,222 |
| 39,936 | ||||||
Deposits |
| 1,158,360 |
| 1,108,537 |
| 1,139,378 |
| 1,054,920 |
| 960,513 | ||||||
Total borrowed funds |
| 115,556 |
| 138,373 |
| 72,837 |
| 114,080 |
| 100,574 | ||||||
Shareholders’ equity |
| 102,277 |
| 106,178 |
| 116,549 |
| 104,399 |
| 98,614 | ||||||
Full-time equivalent employees |
| 307 |
| 315 |
| 304 |
| 299 |
| 309 | ||||||
SELECTED FINANCIAL RATIOS: |
|
|
|
|
|
|
|
|
|
| ||||||
Return on average assets |
| (0.25) | % |
| 0.55 | % |
| 0.52 | % |
| 0.37 | % |
| 0.51 | % | |
Return on average total equity |
| (3.23) |
| 6.83 |
| 6.48 |
| 4.52 |
| 6.02 | ||||||
Loans and loans held for sale, net of unearned income, as a percent of deposits, at period end |
| 89.64 |
| 89.38 |
| 86.54 |
| 92.74 |
| 92.41 | ||||||
Common stock cash dividends as a percent of net income (loss) |
| (61.48) |
| 26.41 |
| 24.14 |
| 37.09 |
| 27.36 | ||||||
Interest rate spread |
| 2.47 |
| 3.11 |
| 3.01 |
| 3.01 |
| 3.05 | ||||||
Net interest margin |
| 2.86 |
| 3.27 |
| 3.15 |
| 3.19 |
| 3.29 | ||||||
Allowance for credit losses - loans as a percentage of loans, net of unearned income, at period end |
| 1.45 |
| 1.08 |
| 1.26 |
| 1.16 |
| 1.05 | ||||||
Non-performing assets as a percentage of loans and other real estate owned, at period end |
| 1.19 |
| 0.52 |
| 0.34 |
| 0.34 |
| 0.26 | ||||||
Net charge-offs as a percentage of average loans |
| 0.35 |
| 0.17 |
| — |
| 0.03 |
| 0.02 | ||||||
18
RESULTS OF OPERATIONS FOR THE YEARS ENDED DECEMBER 31, 2023, 2022, AND 2021
PERFORMANCE OVERVIEW. The following table summarizes some of the Company’s key profitability performance indicators for each of the past three years.
| YEAR ENDED DECEMBER 31, |
| ||||||||
| 2023 |
| 2022 |
| 2021 |
| ||||
(IN THOUSANDS, EXCEPT |
| |||||||||
PER SHARE DATA AND RATIOS) | ||||||||||
Net income (loss) | $ | (3,346) | $ | 7,448 | $ | 7,072 | ||||
Diluted earnings per share |
| (0.20) |
| 0.43 |
| 0.41 | ||||
Return on average assets |
| (0.25) | % |
| 0.55 | % |
| 0.52 | % | |
Return on average equity |
| (3.23) |
| 6.83 |
| 6.48 | ||||
The Company reported a net loss of $3,346,000, or $0.20 per diluted common share, in 2023. This compares to net income of $7,448,000, or $0.43 per diluted common share, for 2022. The net loss was caused primarily by an increased provision for credit losses related to certain commercial real estate loans as well as management’s decision to execute an investment portfolio repositioning strategy. Specifically, Rite Aid, a national tenant in several commercial real estate properties financed by the Bank, declared bankruptcy in the fourth quarter of 2023 resulting in increased credit costs and charge-offs related to these loans. Total non-interest income was lower for the full year of 2023 when compared to last year primarily due to the recognition of a loss on the sale of investment securities in December of 2023. The Company believes that recognizing this loss on the investment securities positions the Company for improved interest earnings from the investment securities portfolio in 2024. Total non-interest expense is higher for the full year of 2023 compared to 2022, due to additional legal and professional services costs caused by litigation and responses to the actions of an activist investor. Overall, the Company’s 2023 net loss reflects the significantly higher provision for credit losses, decreased levels of both net interest income and non-interest income and increased total non-interest expense. Despite the net loss recognized for 2023, the Company continued to see several encouraging new business development results during the year which included a $47.6 million, or 4.8%, increase in total loans and the fourth consecutive quarter of growth in wealth management revenues. Additionally, the Company continued to maintain strong capital ratios that exceed the regulatory defined well capitalized status.
The Company reported net income of $7.4 million, or $0.43 per diluted common share, in 2022. This represented a 4.9% increase in earnings per share from the full year of 2021 when net income totaled $7.1 million, or $0.41 per diluted common share. The improved earnings performance for the 2022 year reflected the full benefit of several important strategic actions that the Company executed in 2021, the successful management of our asset quality throughout the pandemic, and effective balance sheet management. Overall, the increase in net interest income, along with a reduced loan loss provision, more than offset a lower level of non-interest income and higher non-interest expense resulting in an improved earnings performance in 2022.
The Company reported net income of $7.1 million, or $0.41 per diluted common share, for 2021. This represented a 51.9% increase in earnings per share from 2020 when net income totaled $4.6 million, or $0.27 per diluted common share. During 2021, earnings demonstrated meaningful improvement as the Company realized the benefit of several important strategic actions that were executed during the year. Overall, increased net interest income, a growing level of non-interest income, and a reduced loan loss provision more than offset a higher level of non-interest expense resulting in an improved earnings performance.
NET INTEREST INCOME AND MARGIN. The Company’s net interest income represents the amount by which interest income on earning assets exceeds interest paid on interest bearing liabilities. Net interest income is a primary source of the Company’s earnings; it is affected by interest rate fluctuations as well as changes in the amount
19
and mix of earning assets and interest bearing liabilities. The following table summarizes the Company’s net interest income performance for each of the past three years:
| YEAR ENDED DECEMBER 31, |
| ||||||||
| 2023 |
| 2022 |
| 2021 |
| ||||
(IN THOUSANDS, EXCEPT RATIOS) |
| |||||||||
Interest income | $ | 60,860 | $ | 49,058 | $ | 46,669 | ||||
Interest expense |
| 24,840 |
| 8,495 |
| 7,586 | ||||
Net interest income |
| 36,020 |
| 40,563 |
| 39,083 | ||||
Net interest margin |
| 2.86 | % |
| 3.27 | % |
| 3.15 | % | |
2023 NET INTEREST PERFORMANCE OVERVIEW. The Company’s net interest income for the full year of 2023 decreased by $4.5 million, or 11.2%, when compared to the full year of 2022. The Company’s net interest margin was 2.86% for the full year of 2023 representing a 41-basis point decline from the full year of 2022. The decrease in net interest income reflects total interest expense increasing to a higher level than the increase in total interest income. The Company continues to benefit from increased yields on total loans and investment securities due to a higher U.S. Treasury yield curve and the Federal Reserve’s action to tighten monetary policy in their effort to tame decades high inflation. But, similar to what is occurring across the banking industry, increased national interest rates have caused total deposit and borrowing costs to increase to a higher degree, resulting in net interest margin compression and lower net interest income.
Overall, in 2023, the average balance of total interest earning assets was modestly higher than the full year of 2022 average, totaling $1.3 billion. Specifically, total loans averaged $997.2 million in 2023 which is $19.7 million, or 2.0%, higher than the 2022 full year average. Short-term investments averaged $3.9 million in 2023 which is $19.3 million, or 83.0%, lower than the 2022 full year average. Total investment securities averaged $262.2 million in 2023 which is $16.9 million, or 6.9%, higher than the 2022 full year average. Given only a slight increase in the balance of total interest earning assets from the prior year, total interest income increased by $11.8 million, or 24.1%, between years due primarily to an improvement in the yield on earning assets, which increased from 3.95% to 4.84%.
Total deposits, including non-interest bearing demand deposits, averaged $1.154 billion for the full year of 2023, which was $2.5 million, or 0.2%, lower than the $1.156 billion average for the full year of 2022. The 2023 full year average of short-term and FHLB borrowed funds was $57.9 million, which represented an increase of $15.4 million, or 36.2%. Overall, the cost of total interest bearing liabilities increased from 0.84% to 2.36%.
COMPONENT CHANGES IN NET INTEREST INCOME: 2023 VERSUS 2022. Regarding the separate components of net interest income, the Company’s total interest income in 2023 increased by $11.8 million, or 24.1%, when compared to 2022. Overall, the 2023 full year average balance of total interest earning assets increased over last year’s full year average by $17.3 million, or 1.4% as there was an increased level of average total loans and average total investment securities which were partially offset by a decreased level of short-term investments. Interest income was favorably impacted by an increase in the earning asset yield which improved by 89 basis points from 3.95% to 4.84%. All categories within the earning asset base demonstrated an interest income increase between years. The average total loan portfolio yield increased by 93 basis points from 4.25% to 5.18% in 2023 while the average yield on total investment securities increased by 43 basis points from 3.00% to 3.43%.
Total average loans for the full year of 2023 were $19.7 million, or 2.0%, higher than the 2022 full year average. More significantly, on an end of period basis, total loans at December 31, 2023 increased by $47.6 million, or 4.8%, since December 31, 2022. Loan pipelines were strong, and the loan portfolio demonstrated good growth in 2023, particularly in the second half of the year, as total loans surpassed and continued to grow above the $1.0 billion threshold for the first time in Company history. Year over year growth in commercial & industrial (C&I), commercial real estate (CRE), and home equity loans more than offset decreased residential mortgage and consumer loans. Overall, the higher interest rate environment along with the higher average volumes of C&I, CRE and home equity loans, resulted in total loan interest income improving by $10.1 million, or 24.5%, for the full year of 2023 when compared to last year. This increase occurred despite a $434,000 total reduction in PPP loan related income in 2023.
Total investment securities averaged $262.2 million for the full year of 2023, which is $16.9 million, or 6.9%, higher than the $245.2 million average for the full year of 2022. The increase reflects additional securities purchased over this period as the U.S. Treasury yield curve increased resulting in a more favorable market for securities purchasing activity causing the Company to redeploy some of its short-term excess liquidity. Overall, the higher rates resulted in
20
yields for new federal agency mortgage-backed securities and federal agency bonds improving and exceeding the overall average yield of the existing securities portfolio causing interest income from investments to increase by $1.6 million, or 21.9%, for the 2023 year. In 2023, purchases of securities were slower than what occurred in the second half of 2022 as more funds were allocated to the loan portfolio while the Company controlled the amount of overnight borrowed funds. While yields on new security purchases exceeded the overall average yield of the existing securities portfolio, the spread between overnight borrowings and the yield on new securities ranged from negative to only marginally positive causing the slowdown in purchasing activity. Thus, new investment security purchases during 2023 were primarily used to replace cash flow from maturing securities to maintain appropriate balances for pledging purposes related to deposits of public funds. This is an example of how the inverted treasury yield curve impacts the Company’s balance sheet management strategies. Finally, the full year 2023 total average balance of short-term investments and bank deposits decreased since last year by $19.3 million, or 83.0%, as the Company re-deployed its excess liquidity into higher yield loans and securities.
On the liability side of the balance sheet, for the full year of 2023, total average deposits were relatively consistent with the 2022 full year average, decreasing by only $2.5 million, or 0.2%. The modest decrease since last year is reflective of a portion of the funds from the government stimulus programs leaving the balance sheet and greater pricing competition in the market to retain deposits because of the increasing national interest rates. The Company’s core deposit base continued to demonstrate the strength and stability that it has for many years, even during times of turmoil when three large bank failures occurred early in 2023 and customer fear of contagion within the industry caused deposit flight. Total deposits grew during 2023 by $49.8 million, or 4.5%, on an end of period basis since December 31, 2022, demonstrating customer confidence in the Bank. The Company does not utilize brokered deposits as a funding source. In addition to its loyal core deposit base, the Company has several other sources of liquidity, including a significant unused borrowing capacity at the Federal Home Loan Bank (FHLB), overnight lines of credit at correspondent banks and access to the Federal Reserve Discount Window. The loan to deposit ratio averaged 88.1% in the fourth quarter of 2023, which indicates that the Company has ample capacity to continue to grow its loan portfolio and is well positioned to support our customers and our community during times of economic volatility.
Total interest expense increased by $16.3 million, or 192.4%, for the full year of 2023 when compared to last year, due to higher deposit and borrowings interest expense. Deposit interest expense was higher by $14.6 million, or 227.1%, while the full year 2023 average volume of total interest-bearing deposits grew from the 2022 full year average by $21.1 million, or 2.2%. The rising national interest rates resulted in certain deposit products, particularly public funds, which are tied to a market index, repricing upward with the move in short-term national interest rates causing interest expense to increase. Additionally, increased market competition resulted in the Company increasing rates on certain shorter-term certificates of deposit to retain funds. Another factor contributing to net interest margin compression was an unfavorable deposit mix shift as the full year average of non-interest bearing demand deposits declined by $23.6 million, or 11.0%, while, as mentioned above, total interest-bearing deposits increased by $21.1 million, or 2.2%. For interest rate risk management purposes and to offset a portion of the unfavorable impact that rising funding costs are having on net interest income, management proactively executed $70 million of interest rate hedge transactions during 2023 to fix the cost of certain deposits that are indexed and move with short-term interest rates. These hedging transactions reduced the Company’s negative variability of net interest income in a rising interest rate environment and helped slow net interest margin compression. Overall, total deposit cost averaged 1.82% for the full year of 2023, which is 126 basis points higher than total deposit cost of 0.56% for the full year of 2022.
Total borrowings interest expense increased by $1.8 million, or 84.7%, for the full year of 2023 when compared to 2022. The increase primarily results from the impact that the higher national interest rates had on overnight borrowings cost as well as the Company utilizing more overnight borrowed funds in 2023. Total fed funds purchased and other short-term borrowings averaged $35.8 million for the full year of 2023 after averaging $9.3 million for the full year of 2022. The increase to borrowings interest expense in 2023 also reflects a higher level of interest expense from FHLB term borrowings, which increased by $178,000, or 32.2%, for the full year of 2023 compared to 2022. The full year average balance of advances from FHLB was lower in 2023 by $11.1 million, or 33.3%. However, management began to replace maturing term advances and then began to increase our level of term advances in the fourth quarter of 2023 due to the inversion in the yield curve and as part of our overall balance sheet management strategy. Although new FHLB term advances have higher interest rates than the term advances they replaced, their cost is lower than overnight night borrowed funds due to the inverted yield curve.
2022 NET INTEREST PERFORMANCE OVERVIEW. The Company’s net interest income for the full year of 2022 increased by $1.5 million, or 3.8%, when compared to the full year of 2021. The Company’s net interest margin
21
was 3.27% for the full year of 2022 representing a 12-basis point improvement from the full year of 2021. Net interest income demonstrated an increasing trend through the first three quarters of 2022 as interest income increased to a higher level than the increase in interest expense. However, this positive trend reversed in the fourth quarter as interest expense increased to a higher level than the increase in interest income.
The Company benefitted from the higher U.S. Treasury yield curve as interest rates increased due to the Federal Reserve’s action to tighten monetary policy in their effort to tame decades high inflation. The higher interest rate environment along with increased investment in the securities portfolio more than offset a reduced level of Paycheck Protection Program (PPP) loan fee income and caused total interest income to increase for the full year of 2022 when compared to 2021. The increased national interest rates also resulted in total deposit and borrowing costs increasing in 2022. However, the increase in deposit interest expense was partially offset by a 26% reduction in total borrowings interest expense, as the strategic actions taken by management in 2021 to lower funding costs favorably impacted financial performance.
Overall, in 2022, the average balance of total interest earning assets was consistent with the full year 2021 average, totaling $1.2 billion. Specifically, total loans averaged $978 million in 2022 which was $11.2 million, or 1.1%, lower than the 2021 full year average. Short-term investments including commercial paper averaged $23.2 million in 2022 which was $24.1 million, or 50.9%, lower than the 2021 full year average. Total investment securities averaged $245.2 million in 2022 which was $35.3 million, or 16.8%, higher than the 2021 full year average. Despite the balance of total average interest earning assets remaining relatively unchanged from 2021, total interest income increased by $2.4 million, or 5.1%, between years due to an increase in the yield on earning assets, which increased from 3.76% to 3.95%.
Total deposits, including non-interest bearing demand deposits, averaged $1.156 billion for the full year of 2022, which was $1.9 million, or 0.2%, higher than the $1.154 billion average for the full year of 2021. The 2022 full year average of short-term and FHLB borrowed funds was $42.5 million, which represented a decrease of $7.2 million, or 14.5%. Overall, the cost of total interest bearing liabilities increased from 0.75% to 0.84%.
COMPONENT CHANGES IN NET INTEREST INCOME: 2022 VERSUS 2021. Regarding the separate components of net interest income, the Company’s total interest income in 2022 increased by $2.4 million, or 5.1%, when compared to 2021. Total average earning assets remained consistent in 2022 as there was a decreased level of average total loans and short-term investments which were offset by an increased level of average total investment securities. Despite this, interest income was favorably impacted by an increase in the earning asset yield which improved by 19 basis points from 3.76% to 3.95%. All categories within the earning asset base demonstrated an interest income increase between years. The average total loan portfolio yield increased by 14 basis points from 4.11% to 4.25% in 2022 while the average yield on total investment securities increased by 13 basis points from 2.87% to 3.00%.
Total average loans for the full year of 2022 were $11.2 million, or 1.1%, lower than the 2021 full year average. Strong loan pipelines resulted in 2022 production more than offsetting a higher than typical level of payoff activity during the year. Excluding PPP loans, total average loans for the full year of 2022 exceeded the 2021 full year average by $30.1 million, or 3.2%, as growth of commercial real estate (CRE) and home equity loans along with a higher volume of residential mortgage loans more than offset a decrease in the level of commercial & industrial loans. Of the approximately $100 million of PPP loans originated from the government stimulus programs, only one very small PPP loan remained on the balance sheet, reflecting the Company’s successful efforts working with our customers through the Small Business Administration (SBA) to complete the forgiveness process. Overall, the higher interest rate environment along with the higher average volumes of CRE, residential mortgages and home equity loans, resulted in total loan interest income improving by $899,000, or 2.2%, for 2022 when compared to 2021. This resulted from the favorable impact of the higher volume of traditional loans and the higher interest rate environment being partially offset by a $1.8 million, or 80.9%, reduction in PPP loan fee related income. Finally, on an end of period basis at December 31, 2022 and excluding total PPP loans, the total loan portfolio was approximately $22.1 million, or 2.3%, higher than the December 31, 2021 level.
Total investment securities averaged $245.2 million for the full year of 2022 which was $35.3 million, or 16.8%, higher than the $209.9 million average for the twelve months of 2021. The increase in the U.S. Treasury yield curve resulted in a more favorable market for securities purchasing activity in 2022. The two-year to ten-year portion of the yield curve increased by approximately 225 to 363 basis points since the beginning of the year, with shorter yields in that range increasing to a higher degree than the longer yields, resulting in yield curve inversion. Overall, the higher rates resulted in yields for new federal agency mortgage-backed securities and federal agency bonds improving and exceeding
22
the overall average yield of the existing securities portfolio. Management purchased more of these investments by redeploying the cash flow from the excess payoff activity from the loan portfolio and profitably utilizing the increased short-term liquidity on our balance sheet. This redeployment of funds contributed to total securities growing between years. Management also continued to purchase taxable municipals and corporate securities to maintain a well-diversified portfolio.
Due to a combination of increased investment in securities, loan growth and total deposits modestly declining, short-term investments decreased throughout 2022 and returned to pre-pandemic levels before government stimulus impacted the economy. Total short-term investments including commercial paper averaged $23.2 million in 2022, which is $24.1 million, or 50.9%, lower than the 2021 average. Despite this decline, the Company’s liquidity position remained strong.
On the liability side of the balance sheet, total average deposits for 2022 were relatively consistent with the 2021 full year average, exceeding by $1.9 million, or 0.2%. Total deposits continued to demonstrate stability despite a $16.3 million, or 1.4%, decrease in total average deposits when comparing the 2022 fourth quarter to the 2021 fourth quarter. Deposit volumes continued to reflect the favorable impact of government stimulus which provided support to many Americans and financial assistance to municipalities and school districts during the pandemic. However, the quarterly decrease reflected a portion of the funds from the government stimulus programs leaving the balance sheet and also reflected greater pricing competition in the market to retain deposits because of the increasing national interest rates. Overall, the loan to deposit ratio averaged 85.4% in the fourth quarter of 2022.
Total interest expense for the full year of 2022 increased by $909,000, or 12.0%, when compared to the full year of 2021, due to higher deposit and short-term borrowings interest expense. Deposit interest expense was higher by $1.6 million, or 33.7%, despite the full year average volume of total deposits remaining relatively consistent with the 2021 full year average. The impact that the higher national interest rates had on deposit costs combined with increased market competition to retain and attract deposits became more evident during the fourth quarter of 2022. In 2022, the Company benefitted from management’s decision to allow a high-cost, institutional deposit to mature during the third quarter of 2021 which proved to be beneficial since the interest rate on this particular deposit was indexed to the market and would have become more expensive with the rising national interest rates experienced in 2022. This large institutional deposit was replaced by the additional low cost, fixed rate deposits from the Somerset County branch acquisition and resulted in significant interest expense savings. The rising national interest rates in 2022 resulted in certain deposit products, particularly public funds, that are tied to a market index, repricing upward with the move in national interest rates and causing interest expense to increase. Specifically, total deposit cost averaged 0.56% in 2022, which is 14 basis points higher than total deposit cost of 0.42% in 2021.
Total borrowings interest expense decreased by $709,000, or 25.5%, when comparing the full year of 2022 to the full year of 2021. The decrease resulted from the favorable impact of the August 2021 subordinated debt offering which was used to replace higher cost debt. This transaction effectively lowered debt cost on these long-term funds by nearly 4.0%. This savings was recognized even though the size of the new subordinated debt was $7.0 million higher than the debt instruments it replaced. Note that included in 2021 borrowings interest expense was $202,000 of additional interest expense that the Company had to recognize from the write-off of the unamortized issuance costs from the original debt instruments that the new sub-debt replaced. Borrowings interest expense was favorably impacted by reduced interest expense from Federal Home Loan Bank (FHLB) term borrowings, which declined by $322,000, or 36.8%, for 2022. The average balance of FHLB term borrowings was lower in 2022 by $16.1 million, or 32.6%, as strength of the Company’s liquidity position allowed management to let FHLB term advances mature and not be replaced.
The table that follows provides an analysis of net interest income on a tax-equivalent basis (non-GAAP) setting forth (i) average assets, liabilities, and shareholders’ equity, (ii) interest income earned on interest earning assets and interest expense paid on interest bearing liabilities, (iii) average yields earned on interest earning assets and average rates paid on interest bearing liabilities, (iv) interest rate spread (the difference between the average yield earned on interest earning assets and the average rate paid on interest bearing liabilities), and (v) net interest margin (net interest income as a percentage of average total interest earning assets). For purposes of this table, loan balances include non-accrual loans, and interest income on loans includes loan fees or amortization of such fees which have been deferred. Regulatory stock is included within available for sale investment securities for this analysis. Additionally, a tax rate of 21% was used to compute tax-equivalent interest income and yields (non-GAAP). The tax equivalent adjustments to interest income on loans and municipal securities for the years ended December 31, 2023, 2022, and 2021 was $15,000, $13,000, and $18,000, respectively, which is reconciled to the corresponding GAAP measure at the bottom of the table. Differences between the net interest spread and margin from a GAAP basis to a tax-equivalent basis were not material.
23
YEAR ENDED DECEMBER 31, |
| ||||||||||||||||||||||||
2023 | 2022 | 2021 |
| ||||||||||||||||||||||
INTEREST | INTEREST | INTEREST |
| ||||||||||||||||||||||
AVERAGE | INCOME/ | YIELD/ | AVERAGE | INCOME/ | YIELD/ | AVERAGE | INCOME/ | YIELD/ |
| ||||||||||||||||
| BALANCE |
| EXPENSE |
| RATE |
| BALANCE |
| EXPENSE |
| RATE |
| BALANCE |
| EXPENSE |
| RATE |
| |||||||
(IN THOUSANDS, EXCEPT PERCENTAGES) |
| ||||||||||||||||||||||||
Interest earning assets: |
|
|
|
|
|
|
|
|
|
|
|
|
|
|
|
|
|
| |||||||
Loans, net of unearned income | $ | 997,204 | $ | 51,643 |
| 5.18 | % | $ | 977,541 | $ | 41,497 |
| 4.25 | % | $ | 988,761 | $ | 40,603 |
| 4.11 | % | ||||
Short-term investments and bank deposits |
| 3,942 |
| 251 |
| 6.38 |
| 23,213 |
| 209 |
| 0.90 |
| 46,977 |
| 58 |
| 0.12 | |||||||
Commercial paper |
| — |
| — |
| — |
| — |
| — |
| — |
| 329 |
| 2 |
| 0.52 | |||||||
Investment securities: |
|
|
|
|
|
|
|
|
|
|
|
|
|
|
|
|
|
| |||||||
Available for sale |
| 201,077 |
| 7,059 |
| 3.51 |
| 185,710 |
| 5,610 |
| 3.02 |
| 159,458 |
| 4,543 |
| 2.85 | |||||||
Held to maturity |
| 61,090 |
| 1,922 |
| 3.15 |
| 59,516 |
| 1,755 |
| 2.95 |
| 50,434 |
| 1,481 |
| 2.94 | |||||||
Total investment securities |
| 262,167 |
| 8,981 |
| 3.43 |
| 245,226 |
| 7,365 |
| 3.00 |
| 209,892 |
| 6,024 |
| 2.87 | |||||||
TOTAL INTEREST EARNING ASSETS/ INTEREST INCOME |
| 1,263,313 |
| 60,875 |
| 4.84 |
| 1,245,980 |
| 49,071 |
| 3.95 |
| 1,245,959 |
| 46,687 |
| 3.76 | |||||||
Non-interest earning assets: |
|
|
|
|
|
|
|
|
|
|
|
|
|
|
|
|
|
| |||||||
Cash and due from banks |
| 15,446 |
|
|
| 17,602 |
|
|
| 18,736 |
|
| |||||||||||||
Premises and equipment |
| 17,270 |
|
|
| 17,498 |
|
|
| 17,749 |
|
| |||||||||||||
Other assets |
| 75,111 |
|
|
| 77,194 |
|
|
| 77,806 |
|
| |||||||||||||
Allowance for credit losses |
| (13,066) |
|
|
| (11,895) |
|
|
| (11,919) |
|
| |||||||||||||
TOTAL ASSETS | $ | 1,358,074 | $ | 1,346,379 | $ | 1,348,331 | |||||||||||||||||||
Interest bearing liabilities: |
|
|
|
|
|
|
|
|
|
|
|
|
|
|
| ||||||||||
Interest bearing deposits: |
|
|
|
|
|
|
|
|
|
|
|
|
|
|
| ||||||||||
Interest bearing demand | $ | 225,713 | $ | 4,058 | 1.80 | % | $ | 227,838 | $ | 1,198 | 0.53 | % | $ | 213,736 | $ | 248 | 0.12 | % | |||||||
Savings |
| 127,539 |
| 124 | 0.10 |
| 137,845 |
| 135 | 0.10 |
| 126,050 |
| 173 | 0.14 | ||||||||||
Money market |
| 302,964 |
| 7,457 | 2.46 |
| 289,674 |
| 2,008 | 0.69 |
| 297,844 |
| 673 | 0.23 | ||||||||||
Other time |
| 306,044 |
| 9,375 | 3.06 |
| 285,760 |
| 3,083 | 1.08 |
| 305,251 |
| 3,712 | 1.22 | ||||||||||
Total interest bearing deposits |
| 962,260 |
| 21,014 | 2.18 |
| 941,117 |
| 6,424 | 0.68 |
| 942,881 |
| 4,806 | 0.51 | ||||||||||
Federal funds purchased and other short-term borrowings |
| 35,755 |
| 1,944 | 5.44 |
| 9,268 |
| 364 | 3.97 |
| 389 |
| 1 | 0.37 | ||||||||||
Advances from Federal Home Loan Bank |
| 22,167 |
| 731 | 3.30 |
| 33,253 |
| 553 | 1.66 |
| 49,328 |
| 875 | 1.77 | ||||||||||
Guaranteed junior subordinated deferrable interest debentures |
| — |
| — | — |
| — |
| — | — |
| 9,741 |
| 944 | 9.69 | ||||||||||
Subordinated debt |
| 27,000 |
| 1,054 | 3.90 |
| 27,000 |
| 1,054 | 3.90 |
| 15,079 |
| 854 | 5.66 | ||||||||||
Lease liabilities |
| 3,238 |
| 97 | 3.00 |
| 3,446 |
| 100 | 2.89 |
| 3,729 |
| 106 | 2.86 | ||||||||||
TOTAL INTEREST BEARING LIABILITIES/INTEREST EXPENSE |
| 1,050,420 |
| 24,840 | 2.36 |
| 1,014,084 |
| 8,495 | 0.84 |
| 1,021,147 |
| 7,586 | 0.75 | ||||||||||
Non-interest bearing liabilities: |
|
|
|
|
|
|
|
|
|
|
|
|
|
|
| ||||||||||
Demand deposits |
| 191,580 |
|
| 215,196 |
|
| 211,557 |
| ||||||||||||||||
Other liabilities |
| 12,507 |
|
| 8,113 |
|
| 6,446 |
| ||||||||||||||||
Shareholders’ equity |
| 103,567 |
|
| 108,986 |
|
| 109,181 |
| ||||||||||||||||
TOTAL LIABILITIES AND SHAREHOLDERS’ EQUITY | $ | 1,358,074 | $ | 1,346,379 | $ | 1,348,331 | |||||||||||||||||||
Interest rate spread |
|
| 2.48 |
|
| 3.11 |
|
| 3.01 | ||||||||||||||||
Net interest income/net interest margin (non-GAAP) |
|
| 36,035 | 2.86 | % |
|
| 40,576 | 3.27 | % |
|
| 39,101 | 3.15 | % | ||||||||||
Tax-equivalent adjustment |
|
| (15) |
|
| (13) |
|
| (18) | ||||||||||||||||
Net interest income (GAAP) | $ | 36,020 |
| $ | 40,563 |
| $ | 39,083 | |||||||||||||||||
Net interest income may also be analyzed by segregating the volume and rate components of interest income and interest expense. The table below sets forth an analysis of volume and rate changes in net interest income on a tax-equivalent basis. For purposes of this table, changes in interest income and interest expense are allocated to volume and rate categories based upon the respective percentage changes in average balances and average rates. Changes in net interest income that could not be specifically identified as either a rate or volume change were allocated proportionately to changes in volume and changes in rate.
24
2023 vs. 2022 | 2022 vs. 2021 | |||||||||||||||||
INCREASE (DECREASE) | INCREASE (DECREASE) | |||||||||||||||||
DUE TO CHANGE IN: | DUE TO CHANGE IN: | |||||||||||||||||
AVERAGE | AVERAGE | |||||||||||||||||
| VOLUME |
| RATE |
| TOTAL |
| VOLUME |
| RATE |
| TOTAL | |||||||
(IN THOUSANDS) | ||||||||||||||||||
INTEREST EARNED ON: |
|
|
|
|
|
|
|
|
|
|
|
| ||||||
Loans, net of unearned income | $ | 854 | $ | 9,292 | $ | 10,146 | $ | (468) | $ | 1,362 | $ | 894 | ||||||
Short-term investments and bank deposits |
| (300) |
| 342 |
| 42 |
| (42) |
| 193 |
| 151 | ||||||
Commercial paper |
| — |
| — |
| — |
| (1) |
| (1) |
| (2) | ||||||
Investment securities: |
|
|
|
|
|
|
|
|
|
| ||||||||
Available for sale |
| 489 |
| 960 |
| 1,449 |
| 783 |
| 284 |
| 1,067 | ||||||
Held to maturity |
| 47 |
| 120 |
| 167 |
| 269 |
| 5 |
| 274 | ||||||
Total investment securities |
| 536 |
| 1,080 |
| 1,616 |
| 1,052 |
| 289 |
| 1,341 | ||||||
Total interest income |
| 1,090 |
| 10,714 |
| 11,804 |
| 541 |
| 1,843 |
| 2,384 | ||||||
INTEREST PAID ON: |
|
|
|
|
|
|
|
|
|
|
|
| ||||||
Interest bearing demand deposits |
| (11) |
| 2,871 |
| 2,860 |
| 18 |
| 932 |
| 950 | ||||||
Savings deposits |
| (11) |
| — |
| (11) |
| 16 |
| (54) |
| (38) | ||||||
Money market |
| 96 |
| 5,353 |
| 5,449 |
| (19) |
| 1,354 |
| 1,335 | ||||||
Other time deposits |
| 235 |
| 6,057 |
| 6,292 |
| (225) |
| (404) |
| (629) | ||||||
Federal funds purchased and other short-term borrowings |
| 1,399 |
| 181 |
| 1,580 |
| 255 |
| 108 |
| 363 | ||||||
Advances from Federal Home Loan Bank |
| (230) |
| 408 |
| 178 |
| (270) |
| (52) |
| (322) | ||||||
Guaranteed junior subordinated deferrable interest debentures |
| — |
| — |
| — |
| (472) |
| (472) |
| (944) | ||||||
Subordinated debt |
| — |
| — |
| — |
| 524 |
| (324) |
| 200 | ||||||
Lease liabilities |
| (6) |
| 3 |
| (3) |
| (7) |
| 1 |
| (6) | ||||||
Total interest expense |
| 1,472 |
| 14,873 |
| 16,345 |
| (180) |
| 1,089 |
| 909 | ||||||
Change in net interest income | $ | (382) | $ | (4,159) | $ | (4,541) | $ | 721 | $ | 754 | $ | 1,475 | ||||||
LOAN QUALITY. The Company’s written lending policies require underwriting, loan documentation, and credit analysis standards to be met prior to funding any loan. After the loan has been approved and funded, continued periodic credit review is required. At a minimum, credit reviews are mandatory for all commercial and commercial mortgage loan relationships with aggregate balances in excess of $1,000,000 within a 12-month period. The Company’s commercial relationship managers are responsible for the timely and accurate risk rating of the loans in their portfolios at origination and on an ongoing basis. Risk ratings are assigned by the account officer, but require independent review and rating concurrence from the Company’s internal Loan Review Department.
In addition to loan monitoring by the account officer and Loan Review Department, the Company also requires presentation of all credits rated pass-6 with aggregate balances greater than $2,000,000, all credits rated special mention or substandard with aggregate balances greater than $250,000, and all credits rated doubtful with aggregate balances greater than $100,000 on an individual basis to the Company’s Loan Loss Reserve Committee on a quarterly basis. Additionally, the Asset Quality Task Force, which is a group comprised of senior level personnel, meets monthly to monitor the status of problem loans.
25
AT DECEMBER 31, |
| |||||||||
| 2023 |
| 2022 |
| 2021 | |||||
(IN THOUSANDS, |
| |||||||||
EXCEPT PERCENTAGES) |
| |||||||||
Total accruing loan delinquency (past due 30 to 89 days) | $ | 1,818 | $ | 6,296 | $ | 6,336 | ||||
Total non-accrual loans |
| 12,167 |
| 5,161 |
| 3,323 | ||||
Total non-performing assets (1) |
| 12,393 |
| 5,200 |
| 3,323 | ||||
Accruing loan delinquency, as a percentage of total loans, net of unearned income |
| 0.18 | % |
| 0.64 | % |
| 0.64 | % | |
Non-accrual loans, as a percentage of total loans, net of unearned income |
| 1.17 |
| 0.52 |
| 0.34 | ||||
Non-performing assets, as a percentage of total loans, net of unearned income, and other real estate owned and repossessed assets (1) |
| 1.19 |
| 0.52 |
| 0.34 | ||||
Non-performing assets, as a percentage of total assets (1) |
| 0.89 |
| 0.38 |
| 0.25 | ||||
Total classified loans (loans rated substandard or doubtful) (2) | $ | 24,996 | $ | 23,837 | $ | 17,009 | ||||
(1) | Non-performing assets are comprised of (i) loans that are on a non-accrual basis, (ii) loans that are contractually past due 90 days or more as to interest and principal payments, and (iii) other real estate owned and repossessed assets. |
(2) | Total classified loans include non-performing residential mortgage and consumer loans. |
The decline in accruing loan delinquency is primarily attributable to a decrease in commercial real estate loan delinquency. Non-performing assets totaled $12.4 million, or 1.19% of total loans, at December 31, 2023 which is an increase from the December 31, 2022 total of $5.2 million, or 0.52% of total loans. The increase in non-performing assets, as well as non-accrual loans, primarily reflects the partial charge-down and transfer into non-accrual status of one commercial real estate loan for a mixed-use retail/office property that has Rite Aid as a major tenant. Total classified loans increased $1.2 million since the prior year-end and now total $25.0 million. The increase in classified loans is the result of the risk rating downgrade of three commercial real estate loan relationships which were partially offset by the risk rating upgrade of a commercial and industrial loan and commercial real estate loan as well as the charge-off of a substandard credit during 2023.
We also continue to closely monitor the loan portfolio given the number of relatively large-sized commercial and commercial real estate loans within the portfolio. As of December 31, 2023, the 25 largest credits represented 22.7% of total loans outstanding, which represents an increase from December 31, 2022 when it was 21.7%.
ALLOWANCE AND PROVISION FOR CREDIT LOSSES. As described in more detail in the Critical Accounting Policies and Estimates section of this MD&A, the Company adopted ASU 2016-13, Financial Instruments - Credit Losses (Topic 326): Measurement of Credit Losses on Financial Instruments (ASU 2016-13) and subsequent related updates effective January 1, 2023. This standard replaces the incurred loss methodology for recognizing credit losses and requires the Company to measure the current expected credit losses (CECL) on financial assets measured at amortized cost, including loans and held to maturity (HTM) securities, and off-balance sheet credit exposures such as unfunded commitments. In addition, ASU 2016-13 requires credit losses on available for sale (AFS) debt securities to be presented as an allowance rather than as a write-down when management does not intend to sell or believes that it is not more likely than not they will be required to sell the security. The Company believes this is a critical accounting policy since it involves significant estimates and judgments.
The adoption of ASU 2016-13 necessitated a day one increase of $1.2 million be made to the allowance for credit losses on our loan portfolio and a $177,000 increase to the allowance for credit losses on unfunded commitments. Furthermore, based on the credit quality of the Company’s HTM debt securities portfolio, the day one allowance for credit losses on our HTM securities portfolio totaled only $114,000. In addition, the Company adopted the provisions of
26
ASU 2016-13 related to presenting other-than-temporary impairment on available for sale debt securities on January 1, 2023, though no such charges were recorded on the securities held by the Company as of the date of adoption.
The following table sets forth the allowance for credit losses and certain ratios for the periods ended.
AT DECEMBER 31, | ||||||||||
2023 |
| 2022 |
| 2021 | ||||||
(IN THOUSANDS, EXCEPT PERCENTAGES) | ||||||||||
Allowance for credit losses - loans | $ | 15,053 | $ | 10,743 | $ | 12,398 | ||||
Allowance for credit losses - loans as a percentage of each of the following: |
|
|
|
|
|
| ||||
total loans, net of unearned income |
| 1.45 | % |
| 1.08 | % |
| 1.26 | % | |
total non-accrual loans |
| 123.72 |
| 208.16 |
| 373.10 | ||||
total non-performing assets |
| 121.46 |
| 206.60 |
| 373.10 | ||||
Allowance for credit losses - securities | $ | 963 | $ | — | $ | — | ||||
Allowance for credit losses - unfunded loan commitments | 940 |
| 746 |
| 989 | |||||
The Company recognized an increased provision for credit losses and higher net loan charge-offs in 2023. For 2023, the Company recorded a $7.4 million provision for credit losses after recognizing a $50,000 provision expense for 2022. The Company recognized net loan charge-offs of approximately $3.5 million, or 0.35% of total average loans, for the full year of 2023 compared to net loan charge-offs of $1.7 million, or 0.17% of total average loans, for the 2022 year.
Rite Aid, a national tenant in several commercial real estate properties financed by the Bank, declared bankruptcy in the fourth quarter of 2023. As a result of this action, the Bank updated its comprehensive evaluation of its exposure to Rite Aid throughout its loan portfolio as it received information on leases that Rite Aid either rejected or modified. This evaluation required the recognition of $2 million in charge-offs related to two CRE loans in which Rite Aid was the sole tenant. Note that these loans had been on the Company’s books since 2009 and the Company was able to completely exit these two credits with no ongoing exposure to Rite Aid. There was also a partial charge-off of $804,000 on another CRE loan for a mixed-use retail/office property that has Rite Aid as the major tenant. The remaining balance of this loan moved into non-accrual status. Also contributing to the significant increase in the provision for credit losses in 2023 was an unfavorable adjustment to the historical loss factor used to calculate the allowance for credit losses in accordance with CECL requirements and growth in the loan portfolio.
As a result of this action, the Company built its allowance for credit losses and maintained solid coverage of both total loans and non-performing assets at December 31, 2023 as indicated by the allowance for credit losses coverage ratio of non-performing assets at 121% while the allowance for credit losses as a percentage of total loans increased to 1.45%. This compares to allowance coverage of non-performing assets of 207%, and total loans of 1.08% as of December 31, 2022. Finally, also included in the 2023 provision expense was the recognition of a $926,000 loss in the first quarter of 2023 from a subordinated debt investment with Signature Bank which was closed by banking regulators on March 12, 2023.
For 2022, the Company recorded a $50,000 provision expense for credit losses compared to a $1.1 million provision expense in 2021. The $1,050,000 favorable comparison for total provision expense for the full year of 2022 reflected improved credit quality for the overall portfolio due to several loan upgrades and increased payoff and paydown activity of criticized loans. As demonstrated historically, the Company continued its strategic conviction that a strong allowance for credit losses was needed, which proved to be essential given the support provided to certain borrowers as they fully recovered from the COVID-19 pandemic. Overall, the Company experienced net loan charge-offs of $1.7 million, or 0.17% of total average loans, for the 2022 year and was higher than net loan charge-offs of $47,000, which equates to 0.00% of total average loans, for the full year of 2021. The higher level of net charge-offs in 2022 is primarily related to the partial charge-down and transfer of one non-owner occupied commercial real estate loan relationship into non-accrual status while the borrower pursued the sale of the property. In summary, the allowance for loan losses provided 207% coverage of non-performing assets, and 1.08% of total loans, on December 31, 2022, compared to 373% coverage of non-performing assets, and 1.26% of total loans, on December 31, 2021.
27
The following table sets forth changes specific to the allowance for credit losses on the loan portfolio and certain ratios for the periods ended.
YEAR ENDED DECEMBER 31, | ||||||||||
2023 | 2022 | 2021 | ||||||||
(IN THOUSANDS, EXCEPT RATIOS AND PERCENTAGES) | ||||||||||
Loans and loans held for sale, net of unearned income: |
|
|
|
|
|
| ||||
Average for the year: | ||||||||||
Commercial real estate (owner occupied) | $ | 85,590 | $ | — | $ | — | ||||
Other commercial and industrial | 151,378 | — | — | |||||||
Commercial (owner occupied real estate and other) | — | 225,487 | 275,795 | |||||||
Commercial real estate (non-owner occupied) - retail | 157,054 | — | — | |||||||
Commercial real estate (non-owner occupied) - multi-family | 103,468 | — | — | |||||||
Other commercial real estate (non-owner occupied) | 228,314 | 443,406 | 424,765 | |||||||
Residential mortgages | 175,299 | 295,528 | 274,016 | |||||||
Consumer | 101,350 | 14,218 | 15,796 | |||||||
Total loans and loans held for sale, net of unearned income | 997,204 | 977,541 | 988,761 | |||||||
At December 31, |
| 1,038,401 |
| 990,825 |
| 986,037 | ||||
As a percent of average loans: |
|
|
|
|
|
| ||||
Net charge-offs (recoveries): |
| |||||||||
Commercial real estate (owner occupied) | (0.03) | % | — | % | — | % | ||||
Other commercial and industrial | 0.32 | — | — | |||||||
Commercial (owner occupied real estate and other) | — |
| 0.04 |
| 0.02 | |||||
Commercial real estate (non-owner occupied) - retail | 1.29 | — | — | |||||||
Commercial real estate (non-owner occupied) - multi-family | (0.01) | — | — | |||||||
Other commercial real estate (non-owner occupied) | 0.35 | 0.30 | (0.01) | |||||||
Residential mortgages | 0.02 | — | (0.01) | |||||||
Consumer | 0.15 | 1.88 | 0.46 | |||||||
Total loans and loans held for sale, net of unearned income | 0.35 | 0.17 | — | |||||||
Provision for credit losses |
| 0.66 |
| 0.01 |
| 0.11 | ||||
Allowance, as a multiple of net charge-offs |
| 4.35x |
| 6.30x |
| 263.79x | ||||
The following schedule sets forth the allocation of the allowance for credit losses among the various loan categories. The entire allowance for credit losses is available to absorb future loan losses in any loan category.
AT DECEMBER 31, |
| |||||||||||||||||||||||||
2023 | 2022 | 2021 | 2020 | 2019 |
| |||||||||||||||||||||
PERCENT | PERCENT | PERCENT | PERCENT | PERCENT |
| |||||||||||||||||||||
OF LOANS | OF LOANS | OF LOANS | OF LOANS | OF LOANS |
| |||||||||||||||||||||
| IN EACH |
| IN EACH | IN EACH |
| IN EACH |
| IN EACH | ||||||||||||||||||
| CATEGORY | CATEGORY |
| CATEGORY | CATEGORY | CATEGORY | ||||||||||||||||||||
TO TOTAL |
| TO TOTAL | TO TOTAL |
| TO TOTAL |
| TO TOTAL | |||||||||||||||||||
| AMOUNT |
| LOANS |
| AMOUNT |
| LOANS |
| AMOUNT |
| LOANS |
| AMOUNT |
| LOANS |
| AMOUNT |
| LOANS | |||||||
| (IN THOUSANDS, EXCEPT PERCENTAGES) | |||||||||||||||||||||||||
Commercial real estate (owner occupied) |
| $ | 1,529 | 8.6 | % | $ | — | — | % | $ | — | — | % | $ | — | — | % | $ | — | — | % | |||||
Other commercial and industrial | 3,030 | 15.4 | — | — | — | — | — | — | — | — | ||||||||||||||||
Commercial (owner occupied real estate and other) | — | — | 2,653 | 23.1 | 3,071 | 25.5 | 3,472 | 31.4 | 3,951 | 30.1 | ||||||||||||||||
Commercial real estate (non-owner occupied) - retail | 3,488 | 15.6 | — | — | — | — | — | — | — | — | ||||||||||||||||
Commercial real estate (non-owner occupied) - multi-family | 1,430 | 10.6 | — | — | — | — | — | — | — | — | ||||||||||||||||
Other commercial real estate (non-owner occupied) |
| 3,428 |
| 23.1 |
| 5,972 |
| 45.5 |
| 6,392 |
| 43.8 |
| 5,373 |
| 41.2 |
| 3,119 |
| 41.2 | ||||||
Residential mortgages |
| 1,021 |
| 16.8 |
| 1,380 |
| 30.1 |
| 1,590 |
| 29.2 |
| 1,292 |
| 25.7 |
| 1,159 |
| 26.6 | ||||||
Consumer |
| 1,127 |
| 9.9 |
| 85 |
| 1.3 |
| 113 |
| 1.5 |
| 115 |
| 1.7 |
| 126 |
| 2.1 | ||||||
Allocation to general risk |
| — |
| — |
| 653 |
| — |
| 1,232 |
| — |
| 1,093 |
| — |
| 924 |
| — | ||||||
Total | $ | 15,053 |
| 100.0 | % | $ | 10,743 |
| 100.0 | % | $ | 12,398 |
| 100.0 | % | $ | 11,345 |
| 100.0 | % | $ | 9,279 |
| 100.0 | % | |
The disproportionately higher allocations for commercial loans, including commercial loans secured by owner occupied real estate and commercial & industrial loans, and commercial loans secured by non-owner occupied real estate reflect the increased credit risk associated with those types of lending, the Company’s historical loss experience in these categories, and other qualitative factors.
Based on the Company’s current allowance for credit losses methodology and the related assessment of the inherent risk factors contained within the Company’s investment securities and loan portfolios, we believe that the allowance for
28
credit losses is adequate at December 31, 2023 to cover losses within the Company’s investment securities and loan portfolios.
NON-INTEREST INCOME. Non-interest income for 2023 totaled $16.4 million, a decrease of $303,000, or 1.8%, from 2022. Factors contributing to this lower level of non-interest income in 2023 included:
| ● | AmeriServ Financial Bank sold all 7,859 shares of the Class B common stock of Visa, Inc. that it owned for a sale price of $1.7 million. The shares had no carrying value on the balance sheet and, as the Bank had no historical cost basis in the shares, the entire sale price was recognized as a gain. The Company elected to capture this gain in 2023 due to the volatility and uncertainty in the financial markets; |
| ● | the Company recognized a $922,000 loss on investment securities during 2023 after selling $16.8 million of available for sale (AFS) investment securities which included both government agency obligations and municipal bonds. No gain or loss on the sale of investment securities was recognized in 2022. The sold securities had an average yield of 3.1% and an effective duration of 3.3 years. The proceeds from this sale were used to purchase new government agency mortgage-backed securities that have a yield of 5.2% and an effective duration of 3.6 years. The Company expects to recover this loss in 3.7 years and to generate additional interest income from this transaction of approximately $325,000 in 2024; |
| ● | a $765,000, or 30.0%, decrease in other income due primarily to the recognition of an unfavorable adjustment to the fair market value of a risk participation agreement as well as the recognition of a credit valuation adjustment to the market value of the interest rate swap contracts that the Company executed to accommodate the needs of certain borrowers while managing our interest rate risk position; and |
| ● | a $354,000, or 3.0%, decrease in wealth management fees due to the unfavorable market conditions for both equity securities and particularly bonds which existed for the majority of the 2023 year that more than offset the positive impact of new customer business growth. Overall, the fair market value of wealth management assets totaled $2.5 billion at December 31, 2023. |
Non-interest income for 2022 totaled $16.7 million, a decrease of $1.1 million, or 6.0%, from 2021. Factors contributing to this lower level of non-interest income in 2022 included:
| ● | a $456,000, or 68.7%, decrease in net gains on loans held for sale due to the lower level of residential mortgage loan production which reflected a reduced level of mortgage loan refinance activity because of the rapid escalation of interest rates since the beginning of 2022. Residential mortgage loan production through twelve months in 2022 totaled $24.8 million representing a $65.8 million, or 72.6%, reduction from the 2021 production level. The reduced level of mortgage loan production also caused mortgage related fees to decline by $243,000, or 67.9%; |
| ● | a $366,000, or 3.1%, decline in wealth management fees due to the unfavorable impact of the declining equity markets as well as the unfavorable impact that the move in the bond market was having on wealth management asset values, both of which were partially offset by new customer business growth. The fair market value of wealth management assets declined since the fourth quarter of 2021 by $398.3 million, or 14.7%, and totaled $2.3 billion at December 31, 2022; |
| ● | a $143,000, or 14.8%, increase in service charges on deposit accounts as consumers were more active in 2022, increasing their spending habits; and |
| ● | the Company recognized an $84,000 gain on investment securities in 2021 as compared to 2022 when no such gain was recognized. |
NON-INTEREST EXPENSE. Non-interest expense for 2023 totaled $49.4 million and increased by $1.4 million, or 2.8%, from 2022. Factors contributing to the higher non-interest expense in 2023 included:
| ● | the rise in total non-interest expense was primarily due to increased legal and professional fees related to the activities of an activist investor and a proxy contest relating to our 2023 annual meeting. These costs amounted to $2.2 million for the full year of 2023. As expected, costs related to the activist shareholder declined as the |
29
| year progressed. However, given continued activity by the activist investor, the Company cannot estimate, at this time, costs related to this issue in 2024; |
| ● | a $2.5 million, or 47.7%, reduction in other expense as the Company did not have to recognize a pension settlement charge in 2023; |
| ● | a $1.1 million, or 4.0%, increase in salaries and employee benefits expense. The increase is attributable to management restructuring costs within the wealth management division, annual employee merit increases, a greater level of full-time equivalent employees as the Company filled certain open positions that were vacant last year, and the impact that inflationary pressures are having on the cost of new hires. Partially offsetting the higher level of salaries were lower incentive compensation and reduced pension expense as there are fewer employees in the defined benefit pension plan due to numerous retirements over the past few years; |
| ● | a $485,000, or 12.3%, increase in data processing and IT expenses due to increased software costs from our core data provider and additional expenses related to monitoring our computing and network environment; and |
| ● | a $200,000, or 38.8%, increase in FDIC insurance due to an increase in both the asset assessment base as well as the assessment rate. |
Non-interest expense for 2022 totaled $48.0 million and increased by $1.0 million, or 2.2%, from 2021. Factors contributing to the higher non-interest expense in 2022 included:
| ● | the Company was required to recognize a settlement charge in connection with its defined benefit pension plan in 2022, which is explained in Note 16, Employee Benefit Plans. The amount of the 2022 charge was $2.5 million which is $762,000, or 43.9%, higher than the $1.7 million settlement charge recognized in 2021; |
| ● | a $645,000, or 2.3%, increase in salaries and employee benefits expense. Within total salaries and benefits expense, salaries cost increased by $1.4 million, or 7.8%, due to merit increases and a higher level of full-time equivalent employees as the Company was able to fill certain open positions during 2022. Also, contributing to the higher salaries and employee benefits costs were additional increases to health care, payroll taxes and other employee benefits. Partially offsetting these higher costs within salaries and benefits expense was lower incentive compensation by $808,000, or 38.2%, due to the reduced level of loan production and no performance related executive incentive payments in 2022; |
| ● | a $338,000, or 11.8%, increase in professional fees due primarily to higher legal costs within our wealth management group; |
| ● | no additional costs related to the branch acquisition were recognized in 2022 after $389,000 was recognized in 2021; |
| ● | a $279,000, or 7.6%, increase in data processing and IT expense resulted from additional costs from our core data provider and increased costs related to monitoring our computing and network environment; |
| ● | a $263,000, or 10.0%, increase in net occupancy expense due to increased utilities cost along with maintenance and repair expense which was primarily related to the new branch office; |
| ● | other expense was favorably impacted by a $243,000 credit for the unfunded commitment reserve after $117,000 of expense was recognized in 2021, resulting in a $360,000 favorable shift; and |
| ● | a $140,000, or 21.4%, reduction in FDIC deposit insurance expense. |
INCOME TAX EXPENSE. The Company recorded an income tax benefit of $1.0 million in 2023, compared to income tax expense of $1.8 million, or a 19.1% effective tax rate, in 2022, and compared to income tax expense of $1.7 million, or a 19.4% effective tax rate, in 2021. The income tax benefit in 2023 resulted from the Company’s recognition of a net loss. The Company’s deferred tax asset was $2.7 million at December 31, 2023 compared to $2.8 million at December 31, 2022, resulting primarily from the change in the allowance for credit losses which was offset by the change in the the fair value of the available for sale investment securities portfolio and the pension liability.
30
SEGMENT RESULTS. The community banking segment reported a net income contribution of $11.5 million in 2023 which declined from the $12.4 million contribution in 2022 and also decreased from the $12.1 million contribution in 2021. The decline between years is due to a higher provision for credit losses and a reduced level of non-interest income, both of which more than offset increased net interest income and a lower level of non-interest expense. The provision for credit losses on the loan portfolio was significantly higher in 2023 versus last year by $6.5 million. Rite Aid, a national tenant in several commercial real estate properties financed by the Bank, declared bankruptcy in the fourth quarter of 2023 resulting in increased credit costs and charge-offs related to these loans. (This is discussed in more detail in the Allowance and Provision for Credit Losses section of the MD&A.) Non-interest income was $765,000, or 14.8%, lower in 2023 due primarily to the recognition of an unfavorable adjustment to the fair market value of an interest rate swap related risk participation agreement as well as the recognition of a credit valuation adjustment to the market value of the interest rate swap contracts that the Company executed to accommodate the needs of certain borrowers while managing our interest rate risk position. Net interest income improved between years due to the strength that this segment provides to the Company which was determined by a thorough funds transfer pricing analysis. In short, a funds transfer pricing analysis determines how funding (deposits) and use of this funding (loans) by each segment contributes to the overall profitability of the Company by providing an estimated positive or negative dollar value of the segment’s contribution to the Company. Overall, the funds transfer pricing analysis indicated that the community banking segment provided an additional $9.2 million benefit to the Company in 2023 when compared to 2022. Despite the benefit that community banking provides, this segment was unfavorably impacted from net interest margin compression as total deposit interest expense increased to a higher level than the increase to total loan interest income. Another factor contributing to net interest margin compression was an unfavorable deposit mix shift as the full year 2023 average of non-interest bearing demand deposits declined by $23.6 million, or 11.0%, while total interest-bearing deposits increased by $21.1 million, or 2.2%. The Company benefitted from a higher level of total average loans in 2023 by $19.7 million, or 2.0%. This segment did benefit from an additional $140,000 of total loan charge income which partially offset a decline in PPP processing fees and interest. The Company recognized $434,000 of PPP related income in 2022 and did not recognize any PPP related income in 2023. Non-interest expense, within the community banking segment, in 2023 compares favorably to last year as reduced pension expense, explained in Note 16, and lower incentive compensation more than offset higher salaries cost. As mentioned previously in the MD&A, the Company did not have to recognize a pension settlement charge in 2023 after recognizing a $2.5 million pension settlement charge last year, which positively impacted all segments. The lower pension expense more than offset higher levels of FDIC insurance and data processing costs.
The wealth management segment’s net income contribution was $1.3 million in 2023 compared to $2.2 million in 2022 and $2.9 million in 2021. The decrease between years results from a combination of lower revenue and increased non-interest expense. The higher level of non-interest expense resulted primarily from management restructuring costs that caused a greater level of salaries expense. These additional costs more than offset lower levels of pension costs and professional fees. The lower level of total revenue reflects the unfavorable market conditions for both equity securities and bonds which have reduced the market value of wealth management assets. Also, new customer business growth has only partially offset the unfavorable impact of market conditions on fee income. The fair market value of wealth management assets declined since December 31, 2021 by $191.2 million, or 7.0%, and totaled $2.5 billion at December 31, 2023. Note that, the market value of wealth management assets increased since year end 2022 and contributed to positive momentum of four consecutive quarters of growth in wealth management revenues. However, full year 2023 results for wealth management fees continue to reflect the unfavorable market conditions.
The investment/parent segment reported a net loss of $16.2 million in 2023, which was higher than the net loss of $7.1 million in 2022 and $7.8 million in 2021. The funds transfer pricing analysis within this segment caused the loss reported within this segment to be $7.7 million higher due to the inverted yield curve and the accelerated increase in funding costs on our balance sheet. Also, contributing to the greater loss within this segment was the first quarter of 2023 recognition of a $926,000 loss from a subordinated debt investment with Signature Bank and $2.2 million of additional legal and professional fees related to the Company’s recent annual meeting proxy contest and defense against an activist shareholder. This segment was also unfavorably impacted by $1.8 million of additional total borrowings interest expense due to the higher average balance of short-term borrowed funds. These unfavorable items more than offset the $1.7 million gain recognized during the first quarter of 2023 from the sale of the 7,859 shares of the Class B common stock of Visa Inc. that the Bank owned and an increased level of interest income from investment securities and short-term investments by $1.7 million as the higher interest rates resulted in an improved overall total portfolio yield.
BALANCE SHEET. The Company’s total consolidated assets of $1.390 billion at December 31, 2023 increased by $25.8 million, or 1.9%, from the $1.364 billion level at December 31, 2022. This change was related, primarily, to increased levels of loans and other assets which were partially offset by a decrease in cash and cash equivalents and
31
investment securities. Specifically, loans and loans held for sale increased by $47.6 million, or 4.8%. Loan pipelines were strong, and the loan portfolio demonstrated good growth in 2023, particularly in the second half of the year, as total loans surpassed and continued to grow above the $1.0 billion threshold for the first time in Company history. Year over year growth in commercial & industrial, commercial real estate, and home equity loans more than offset decreased residential mortgage and consumer loans. Due to the growth in the loan portfolio as well as increased charge-off activity, the Company increased its allowance for credit losses on loans by $4.3 million, or 40.1%. Other assets increased $2.7 million, or 8.1%, as a result of an increase in the positive balance of the accrued pension liability, which totaled $24.7 million and $21.3 million as of December 31, 2023 and 2022, respectively. Due to the positive (debit) balance of the accrued pension liability, it was reclassified to other assets on the Consolidated Balance Sheets as of December 31, 2023 and 2022. These increases were partially offset by a decrease of $8.9 million, or 38.9%, in cash and cash equivalents as the Company re-deployed its excess liquidity into higher yield loans. Total investment securities decreased $11.7 million, or 4.8%. In 2023, purchases of securities were slower than the second half of 2022 as more funds were allocated to the loan portfolio while the Company controlled the amount of overnight borrowed funds. While yields on new security purchases exceeded the overall average yield of the existing securities portfolio, the spread between overnight borrowings and the yield on new securities ranged from negative to only marginally positive causing the slowdown in purchasing activity. Thus, new investment security purchases during 2023 were primarily used to replace cash flow from maturing securities to maintain appropriate balances for pledging purposes related to deposits of public funds.
Total deposits increased by $49.8 million, or 4.5%, during 2023. This demonstrates customer confidence and the strength and loyalty of our core deposit base along with the successful acquisition of a large deposit account. As of December 31, 2023, the 25 largest depositors represented 22.4% of total deposits, which is an increase from December 31, 2022 when it was 18.8%. As of December 31, 2023 and 2022, the estimated amount of uninsured deposits was $384.5 million and $316.5 million, respectively. The estimate of uninsured deposits was done at a single account level and does not take into account total customer balances in the Bank. It should be noted that approximately 50% of these uninsured deposits relate to public funds from municipalities, government entities, and school districts which by law are required to be collateralized with investment securities or FHLB letters of credit to protect these depositor funds. Total borrowings have decreased by $22.8 million, or 16.5%, since year-end 2022. This change was driven by a decrease in short-term borrowings which was partially offset by an increase in FHLB term advances. Specifically, short-term borrowings decreased by $47.7 million, or 53.8%. Given the high cost of overnight borrowed funds, management has been effectively controlling the usage of this funding source. In addition, the inversion in the yield curve has caused FHLB term advances to have rates that are lower than the cost of overnight borrowed funds. Therefore, management began replacing matured FHLB term advances in 2023 leading to an increase in this line item of $24.8 million, or 125.5%.
The Company’s total shareholders’ equity decreased by $3.9 million, or 3.7%, since year-end 2022. Capital was increased during 2023 by the positive impact on accumulated other comprehensive loss from the revaluation of the pension obligation totaling $1.7 million and the increased market value of the available for sale investment securities portfolio totaling $1.2 million. More than offsetting these increases was the $3.3 million net loss recognized for the year, the $2.1 million common stock cash dividend, the $1.2 million cumulative effect adjustment for the adoption of ASU 2016-13, and the $352,000 fair value adjustment on the interest rate hedges. The Company continues to be considered well capitalized for regulatory purposes with a risk based capital ratio of 13.03% and an asset leverage ratio of 7.80% at December 31, 2023. The Company’s book value per common share was $5.96, its tangible book value per common share was $5.16(1) and its tangible common equity to tangible assets ratio was 6.44%(1) at December 31, 2023. The decline in the Company’s book value and tangible book value per share in 2023 primarily reflects the net loss recognized for the year.
(1) Non-GAAP financial information, see “Reconciliation of Non-GAAP Financial Measures” later in this MD&A.
LIQUIDITY. The Company’s liquidity position continues to be strong. Total average deposits for the full year of 2023 were relatively consistent with the 2022 full year average, decreasing by only $2.5 million, or 0.2%. The modest decrease is reflective of a portion of the funds from the government stimulus programs leaving the balance sheet and also reflects greater pricing competition in the market to retain deposits because of the higher national interest rates. The Company’s core deposit base continued to demonstrate the strength and stability that it has for many years, even during times of turmoil when three large bank failures occurred earlier in 2023 and customer fear of contagion within the industry caused deposit flight. Total deposits grew during 2023 by $49.8 million, or 4.5%, on an end of period basis since December 31, 2022, demonstrating customer confidence in AmeriServ Financial Bank. The Company does not utilize brokered deposits as a funding source. In addition to its strong, loyal core deposit base, the Company has several
32
other sources of liquidity, including a significant unused borrowing capacity at the Federal Home Loan Bank (FHLB), overnight lines of credit at correspondent banks and access to the Federal Reserve Discount Window. Overall, deposit volumes continue to remain at a high level by historical standards in relation to the levels experienced prior to the pandemic. The core deposit base is adequate to fund the Company’s operations. Cash flow from maturities, prepayments and amortization of securities is used to help fund loan growth.
Average short-term investments demonstrated a lower average balance in 2023 compared to last year by $19.3 million, or 83.0%. The average balance of FHLB term borrowings was lower in 2023 compared to 2022 by $11.1 million, or 33.3%, as the strength of the Company’s liquidity position allowed management to let FHLB term advances mature during 2022 and not be replaced. However, given the inversion in the yield curve, FHLB term advances have rates that are lower than the cost of overnight borrowed funds. Therefore, management replaced matured FHLB term advances in 2023. The challenge remains as to the uncertainty regarding the duration that the higher than historical level of deposits will remain on the balance sheet which will be determined by customer behavior as the economic conditions change. Diligent monitoring and management of our short-term investment position and our level of overnight borrowed funds remains a priority. Given the high cost of overnight borrowed funds, management has been effectively controlling the usage of this funding source. Continued loan growth and prudent investment in securities are critical to achieve the best return on the normal level of earning asset cash flow that occurs each month. In 2023, purchases of securities were slow as more funds were allocated to the loan portfolio. Loan pipelines continue to be strong, and the loan portfolio demonstrated consistent growth in 2023. We strive to operate our loan to deposit ratio in a range of 80% to 100%. The Company’s loan to deposit ratio averaged 86.4% in 2023, which indicates that the Company has ample capacity to continue to grow its loan portfolio and is strongly positioned to support our customers and our community during times of economic volatility. We are also well positioned to service our existing loan pipeline and grow our loan to deposit ratio while remaining within our guideline parameters.
Liquidity can also be analyzed by utilizing the Consolidated Statements of Cash Flows. Cash and cash equivalents decreased by $8.9 million from December 31, 2022, to $14.0 million at December 31, 2023, due to $40.0 million of net cash used in investing activities more than offsetting $24.8 million of net cash provided in financing activities and $6.3 million of net cash provided by operating activities. Within investing activities, cash advanced for new loans originated totaled $200.8 million and was $50.9 million higher than the $149.9 million of cash received from loan principal payments. Within financing activities, total short-term borrowings decreased by $47.7 million, total FHLB borrowings increased by $24.8 million while total deposits increased by $49.9 million.
The holding company had $8.2 million of cash, short-term investments, and investment securities at December 31, 2023, which represents a $1.4 million decrease from the holding company’s cash position since December 31, 2022. Dividend payments from our subsidiaries provided ongoing cash to the holding company. At December 31, 2023, our subsidiary Bank had $7.4 million of cash available for immediate dividends to the holding company under applicable regulatory formulas. Management follows a policy that limits dividend payments from the Trust Company to 75% of annual net income. Overall, we believe that the holding company has sufficient liquidity to meet its subordinated debt interest payments and its dividend payout level with respect to its common stock.
Financial institutions must maintain liquidity to meet day-to-day requirements of depositors and borrowers, take advantage of market opportunities, and provide a cushion against unforeseen needs. Liquidity needs can be met by either reducing assets or increasing liabilities. Sources of asset liquidity are provided by short-term investments, interest bearing deposits with banks, and federal funds sold. These assets totaled $14.0 million and $23.0 million at December 31, 2023 and December 31, 2022, respectively. Maturing and repaying loans, as well as the monthly cash flow associated with mortgage-backed securities and security maturities are other significant sources of asset liquidity for the Company.
Liability liquidity can be met by attracting deposits with competitive rates, using repurchase agreements, buying federal funds, or utilizing the facilities of the Federal Reserve or the FHLB systems. The Company utilizes a variety of these methods of liability liquidity. Additionally, the Company’s subsidiary bank is a member of the FHLB, which provides the opportunity to obtain short-term to longer-term advances based upon the Company’s investment in certain residential mortgage, commercial real estate, and commercial and industrial loans. At December 31, 2023, the Company had $294 million of overnight borrowing availability at the FHLB, $40 million of short-term borrowing availability at the Federal Reserve Bank and $35 million of unsecured federal funds lines with correspondent banks. The Company believes it has ample liquidity available to fund outstanding loan commitments if they were fully drawn upon.
33
CAPITAL RESOURCES. The Bank meaningfully exceeds all regulatory capital ratios for each of the periods presented and is considered well capitalized. The Company’s common equity tier 1 capital ratio was 9.46%, the tier 1 capital ratio was 9.46%, and the total capital ratio was 13.03% at December 31, 2023. The Company’s tier 1 leverage ratio was 7.80% at December 31, 2023. We anticipate that we will maintain our strong capital ratios throughout 2024.
Capital generated from earnings will be utilized to pay the common stock cash dividend and will support controlled balance sheet growth. Total Parent Company cash was $8.2 million at December 31, 2023. There is a particular emphasis on ensuring that the subsidiary bank has appropriate levels of capital to support its non-owner occupied commercial real estate loan concentration, which stood at 375% of regulatory capital at December 31, 2023. It should be noted that this ratio increased from 350% at December 31, 2022 due to growth in non-owner occupied commercial real estate loan balances as well as a slight decrease in total regulatory capital between years.
Our focus is on preserving capital to support customer lending and allow the Company to take advantage of business opportunities as they arise. Despite the net loss recognized during 2023, the Company’s Board of Directors expects to continue the common stock dividend at its current level of $0.03 per quarter given the Company’s strong capital position and projected earnings improvement in 2024. While the Company has frequently executed common stock buyback programs in the past, we presently do not have one in place due to the drop in our tangible common equity ratio to 6.44%(1). At December 31, 2023, the Company had approximately 17.1 million common shares outstanding.
The Basel III capital standards establish the minimum capital levels in addition to the well capitalized requirements under the federal banking regulations prompt corrective action. The capital rules also impose a 2.5% capital conservation buffer (CCB) on top of the three minimum risk-weighted asset ratios. Banking institutions that fail to meet the effective minimum ratios once the CCB is taken into account will be subject to constraints on capital distributions, including dividends and share repurchases, and certain discretionary executive compensation. The severity of the constraints depends on the amount of the shortfall and the institution’s “eligible retained income” (four quarter trailing net income, net of distributions and tax effects not reflected in net income). The Company and the Bank meet all capital requirements, including the CCB, and continue to be committed to maintaining strong capital levels that exceed regulatory requirements while also supporting balance sheet growth and providing a return to our shareholders.
Under the Basel III capital standards, the minimum capital ratios are:
MINIMUM CAPITAL RATIO |
| ||||
MINIMUM | PLUS CAPITAL |
| |||
| CAPITAL RATIO |
| CONSERVATION BUFFER |
| |
Common equity tier 1 capital to risk-weighted assets | 4.5 | % | 7.0 | % | |
Tier 1 capital to risk-weighted assets |
| 6.0 |
| 8.5 | |
Total capital to risk-weighted assets |
| 8.0 |
| 10.5 | |
Tier 1 capital to total average consolidated assets |
| 4.0 |
| N/A |
(1) Non-GAAP financial information, see “Reconciliation of Non-GAAP Financial Measures” later in this MD&A.
INTEREST RATE SENSITIVITY. Asset/liability management involves managing the risks associated with changing interest rates and the resulting impact on the Company’s net interest income, net income and capital. The management and measurement of interest rate risk at the Company is performed by using the following tools: (i) simulation modeling, which analyzes the impact of interest rate changes on net interest income, net income and capital levels over specific future time periods. The simulation modeling forecasts earnings under a variety of scenarios that incorporate changes in the absolute level of interest rates, the shape of the yield curve, prepayments and changes in the volumes and rates of various loan and deposit categories. The simulation modeling incorporates assumptions about reinvestment and the repricing characteristics of certain assets and liabilities without stated contractual maturities; (ii) market value of portfolio equity sensitivity analysis; and (iii) static GAP analysis, which analyzes the extent to which interest rate sensitive assets and interest rate sensitive liabilities are matched at specific points in time. The overall interest rate risk position and strategies are reviewed by senior management and the Company’s Board of Directors on an ongoing basis.
34
The following table presents a summary of the Company’s static GAP positions at December 31, 2023:
OVER | OVER | ||||||||||||||
| 3 MONTHS |
| 6 MONTHS | ||||||||||||
3 MONTHS OR |
| THROUGH |
| THROUGH | OVER | ||||||||||
INTEREST SENSITIVITY PERIOD |
| LESS |
| 6 MONTHS |
| 1 YEAR |
| 1 YEAR |
| TOTAL | |||||
| (IN THOUSANDS, EXCEPT RATIOS AND PERCENTAGES) | ||||||||||||||
RATE SENSITIVE ASSETS: | |||||||||||||||
Loans and loans held for sale | $ | 274,613 | $ | 44,503 | $ | 100,832 | $ | 618,453 | $ | 1,038,401 | |||||
Investment securities |
| 26,787 |
| 4,600 |
| 18,082 |
| 181,184 |
| 230,653 | |||||
Short-term assets |
| 4,349 |
| — |
| — |
| — |
| 4,349 | |||||
Regulatory stock |
| 5,210 |
| — |
| — |
| 2,125 |
| 7,335 | |||||
Bank owned life insurance |
| — |
| — |
| 39,560 |
| — |
| 39,560 | |||||
Total rate sensitive assets | $ | 310,959 | $ | 49,103 | $ | 158,474 | $ | 801,762 | $ | 1,320,298 | |||||
RATE SENSITIVE LIABILITIES: |
|
|
|
|
|
|
|
|
|
| |||||
Deposits: |
|
|
|
|
|
|
|
|
|
| |||||
Non-interest bearing demand deposits | $ | — | $ | — | $ | — | $ | 172,070 | $ | 172,070 | |||||
Interest bearing demand deposits |
| 136,396 |
| 1,492 |
| 2,983 |
| 147,253 |
| 288,124 | |||||
Savings |
| 533 |
| 534 |
| 1,068 |
| 117,349 |
| 119,484 | |||||
Money market |
| 83,486 |
| 6,352 |
| 12,704 |
| 153,663 |
| 256,205 | |||||
Time deposits (1) |
| 49,373 |
| 24,756 |
| 117,440 |
| 130,908 |
| 322,477 | |||||
Total deposits |
| 269,788 |
| 33,134 |
| 134,195 |
| 721,243 |
| 1,158,360 | |||||
Borrowings |
| 44,776 |
| 3,235 |
| 1,194 |
| 66,351 |
| 115,556 | |||||
Total rate sensitive liabilities | $ | 314,564 | $ | 36,369 | $ | 135,389 | $ | 787,594 | $ | 1,273,916 | |||||
INTEREST SENSITIVITY GAP: |
|
|
|
|
|
|
|
|
|
| |||||
Interval |
| (3,605) |
| 12,734 |
| 23,085 |
| 14,168 |
| — | |||||
Cumulative | $ | (3,605) | $ | 9,129 | $ | 32,214 | $ | 46,382 | $ | 46,382 | |||||
Period GAP ratio |
| 0.99X |
| 1.35X |
| 1.17X |
| 1.02X |
|
| |||||
Cumulative GAP ratio |
| 0.99 |
| 1.03 |
| 1.07 |
| 1.04 |
|
| |||||
Ratio of cumulative GAP to total assets |
| (0.26) | % |
| 0.66 | % |
| 2.32 | % |
| 3.34 | % |
|
| |
| (1) | Time deposits include certificates of deposit (CDs) and individual retirement accounts (IRAs). |
When December 31, 2023 is compared to December 31, 2022, the Company’s cumulative GAP ratio through three months indicates that the Company’s balance sheet is slightly liability sensitive, representing a significant decline in the level of liability sensitivity to a near neutral position. The shift primarily results from a substantial decrease in the level of short-term borrowings, which are immediately impacted by changes to national interest rates. The Company also experienced a modest decrease in the balance of deposits that have an interest rate that is indexed to the market. Although we are still experiencing a higher than historical level of funds in money market type accounts as customers seek to benefit from the higher interest rates in the economy. We are beginning to see loan customer preference for fixed rate loans soften given the expectation that interest rates have peaked and will decline later in 2024. The Company’s interest rate sensitivity position shifts from being liability sensitive to an asset sensitive position over three months and beyond as more of our loans begin to reprice. Finally, the balance of FHLB term advances at December 31, 2023 increased $24.8 million, or 125.5%, from the prior year, due to the inversion in the yield curve resulting in FHLB term advances having interest rates that are lower than the cost of overnight borrowings.
Management places primary emphasis on simulation modeling to manage and measure interest rate risk. The Company’s asset/liability management policy seeks to limit net interest income variability over the first twelve months of the forecast period to -5.0% and -7.5%, which include interest rate movements of 100 and 200 basis points, respectively. Additionally, the Company also uses market value sensitivity measures to further evaluate the balance sheet exposure to changes in interest rates. The Company monitors the trends in market value of portfolio equity sensitivity analysis on a quarterly basis.
The following table presents an analysis of the sensitivity inherent in the Company’s net interest income and market value of portfolio equity. The interest rate scenarios in the table compare the Company’s base forecast, which was prepared using a flat interest rate scenario, to scenarios that reflect immediate interest rate changes of 100 and 200 basis
35
points. Each rate scenario contains unique prepayment and repricing assumptions that are applied to the Company’s existing balance sheet that was developed under the flat interest rate scenario.
INTEREST RATE SCENARIO |
| VARIABILITY OF NET INTEREST INCOME |
| CHANGE IN MARKET VALUE OF PORTFOLIO EQUITY | |
200 bp increase | (1.2) | % | 3.2 | % | |
100 bp increase |
| (0.6) |
| 2.6 | |
100 bp decrease |
| 0.2 |
| (6.0) | |
200 bp decrease |
| (0.2) |
| (13.9) |
The Company believes that its overall interest rate risk position is well controlled. The execution of $70 million of interest rate hedges during 2023, in order to fix the cost of certain deposits that are indexed and move with short-term interest rates, reduced the Company’s negative variability of net interest income in a rising interest rate environment and helped slow net interest margin compression. The fed funds rate is currently at a targeted range of 5.25% to 5.50% as the Federal Reserve took action during 2023 to increase the rate a total of 100 basis points.
Overall, the Company’s interest rate risk position is relatively neutral. The variability of net interest income is slightly negative in the upward rate scenarios as the Company is marginally more exposed to liabilities repricing upward to a greater extent than assets. Specifically, the cost of funds is immediately impacted when short-term national interest rates increase because certain deposit products and overnight borrowed funds move with the market. This was partially offset by the Company’s investment securities portfolio and the scheduled repricing of loans tied to an index, such as SOFR or prime. In addition to the interest rate hedges discussed above, the Company has effectively utilized interest rate swaps for interest rate risk management purposes. The interest rate swaps allow our customers to lock in fixed interest rates while the Company retains the benefit of interest rates moving with the market. Regarding interest bearing liabilities, the Company will continue its disciplined approach to price its core deposit accounts in a controlled but competitive manner and control the amount of overnight borrowed funds. The variability of net interest income is neutral in the downward rate scenarios. The market value of portfolio equity increases in the upward rate shocks due to the improved value of the Company’s core deposit base. Negative variability of market value of portfolio equity occurs in the downward rate shocks due to a reduced value for core deposits.
Within the investment securities portfolio at December 31, 2023, 74.2% of the portfolio was classified as available for sale and 25.8% as held to maturity. The available for sale classification provides management with greater flexibility to manage the securities portfolio to better achieve overall balance sheet rate sensitivity goals and provide liquidity if needed. The mark to market of the available for sale securities does inject more volatility in the book value of equity, but has no impact on regulatory capital. There were 270 available for sale securities that were in an unrealized loss position at December 31, 2023. These unrealized losses are primarily a result of increases in market yields from the time of purchase. Management generally views changes in fair value caused by changes in interest rates as temporary; therefore, no provision for credit losses has been recorded for these securities. Management does not intend to sell these securities and does not believe it will be required to sell these securities before they recover in value or mature. Furthermore, it is the Company’s intent to manage its long-term interest rate risk by continuing to sell a portion of newly originated fixed-rate 30-year mortgage loans into the secondary market (excluding construction and any jumbo loans). The Company sells 15-year fixed-rate mortgage loans into the secondary market as well, depending on market conditions. For the year ended December 31, 2023, 34.0% of all residential mortgage loan production was sold into the secondary market.
36
The amount of loans outstanding by category as of December 31, 2023, which are due in (i) one year or less, (ii) more than one year through five years, (iii) more than five years through 15 years, and (iv) over 15 years, are shown in the following table.
MORE | MORE |
| ||||||||||||||
THAN ONE | THAN FIVE |
| ||||||||||||||
ONE | YEAR | YEARS |
| |||||||||||||
YEAR OR | THROUGH | THROUGH | OVER 15 | TOTAL | ||||||||||||
| LESS |
| FIVE YEARS |
| 15 YEARS | YEARS |
| LOANS | ||||||||
| (IN THOUSANDS, EXCEPT RATIOS) | |||||||||||||||
Commercial real estate (owner occupied) | $ | 2,575 | $ | 22,904 | $ | 63,286 | $ | 382 | $ | 89,147 | ||||||
Other commercial and industrial | 31,463 | 80,900 | 16,454 | 30,607 | 159,424 | |||||||||||
Commercial real estate (non-owner occupied) - retail |
| 4,516 |
| 56,652 |
| 92,474 | 8,319 |
| 161,961 | |||||||
Commercial real estate (non-owner occupied) - multi-family | 8,415 | 25,383 | 76,186 | 24 | 110,008 | |||||||||||
Other commercial real estate (non-owner occupied) |
| 21,506 |
| 75,792 |
| 134,155 | 8,833 |
| 240,286 | |||||||
Residential mortgages |
| 1,340 |
| 1,533 |
| 28,855 | 142,942 |
| 174,670 | |||||||
Consumer |
| 5,439 |
| 13,899 |
| 40,437 | 43,000 |
| 102,775 | |||||||
Total | $ | 75,254 | $ | 277,063 | $ | 451,847 | $ | 234,107 | $ | 1,038,271 | ||||||
Loans with fixed-rate | $ | 30,745 | $ | 179,526 | $ | 93,503 | $ | 134,794 | $ | 438,568 | ||||||
Loans with floating-rate |
| 44,509 |
| 97,537 |
| 358,344 |
| 99,313 |
| 599,703 | ||||||
Total | $ | 75,254 | $ | 277,063 | $ | 451,847 | $ | 234,107 | $ | 1,038,271 | ||||||
Percent composition of maturity |
| 7.2 | % |
| 26.7 | % |
| 43.5 | % | 22.6 | % |
| 100.0 | % | ||
Fixed-rate loans as a percentage of total loans |
| 42.2 | % | |||||||||||||
Floating-rate loans as a percentage of total loans |
| 57.8 | % | |||||||||||||
The loan maturity information is based upon original loan terms and is not adjusted for principal paydowns and rollovers. In the ordinary course of business, loans maturing within one year may be renewed, in whole or in part, as to principal amount at interest rates prevailing at the date of renewal.
The following table summarizes the fixed-rate and floating-rate loans due in more than one year by portfolio segment.
FIXED-RATE | FLOATING-RATE | ||||||||
| LOANS |
| LOANS |
| TOTAL | ||||
| (IN THOUSANDS) | ||||||||
Commercial real estate (owner occupied) | $ | 25,135 | $ | 61,437 | $ | 86,572 | |||
Other commercial and industrial | 65,249 | 62,712 | 127,961 | ||||||
Commercial real estate (non-owner occupied) - retail |
| 40,336 |
| 117,109 |
| 157,445 | |||
Commercial real estate (non-owner occupied) - multi-family | 15,828 | 85,765 | 101,593 | ||||||
Other commercial real estate (non-owner occupied) |
| 50,505 |
| 168,275 |
| 218,780 | |||
Residential mortgages |
| 159,038 |
| 14,292 |
| 173,330 | |||
Consumer |
| 51,732 |
| 45,604 |
| 97,336 | |||
Total | $ | 407,823 | $ | 555,194 | $ | 963,017 | |||
OFF BALANCE SHEET ARRANGEMENTS. The Company incurs off-balance sheet risks in the normal course of business in order to meet the financing needs of its customers. These risks derive from commitments to extend credit and standby letters of credit. Such commitments and standby letters of credit involve, to varying degrees, elements of credit risk in excess of the amount recognized in the consolidated financial statements. The Company’s exposure to credit loss in the event of nonperformance by the other party to these commitments to extend credit and standby letters of credit is represented by their contractual amounts. The Company uses the same credit and collateral policies in making commitments and conditional obligations as for all other lending. The Company had various outstanding commitments to extend credit approximating $236.6 million and standby letters of credit of $8.2 million as of December 31, 2023.
37
The Company can also use various interest rate contracts, such as interest rate swaps, caps, floors and swaptions to help manage interest rate and market valuation risk exposure, which is incurred in normal recurrent banking activities. As of December 31, 2023, the Company had $76.5 million in the notional amount of interest rate swap assets outstanding, with a fair value of $4.6 million. Simultaneously, the Company had $76.5 million in the notional amount of interest rate swap liabilities outstanding, with a negative fair value of $4.7 million. The Company entered into risk participation agreements (RPAs) with the lead bank of two commercial real estate loan arrangements. As a participating bank, the Company guarantees the performance on a borrower-related interest rate swap contract. The notional amount of the RPAs outstanding at December 31, 2023 was $6.8 million, with a negative fair value of $410,000. In addition, the Company has entered into three interest rate swaps with a total notional value of $70 million in order to hedge the interest rate risk associated with certain floating-rate time deposit accounts. At December 31, 2023, the hedges had a negative fair value of $446,000.
As of December 31, 2023 and 2022, municipal deposit letters of credit issued by the Federal Home Loan Bank of Pittsburgh on behalf of AmeriServ Financial Bank naming applicable municipalities as beneficiaries totaled $121.4 million and $72.9 million, respectively. The letters of credit serve as collateral, in place of pledged securities, for municipal deposits maintained at AmeriServ Financial Bank.
RECONCILIATION OF NON-GAAP FINANCIAL MEASURES. This document contains certain financial information determined by methods other than in accordance with generally accepted accounting principles in the United States (GAAP). The tangible common equity ratio and tangible book value per share are considered to be non-GAAP measures and are calculated by dividing tangible equity by tangible assets or shares outstanding. The Company believes that these non-GAAP financial measures provide information to investors that is useful in understanding its financial condition. This non-GAAP data should be considered in addition to results prepared in accordance with GAAP, and is not a substitute for, or superior to, GAAP results. Limitations associated with non-GAAP financial measures include the risks that persons might disagree as to the appropriateness of items included in these measures, and, because not all companies use the same calculation of tangible common equity and tangible assets, this presentation may not be comparable to other similarly titled measures calculated by other companies.
The following table sets forth the calculation of the Company’s tangible common equity ratio and tangible book value per share at December 31, 2023 and 2022 (in thousands, except share and ratio data):
AT DECEMBER 31, | |||||||
| 2023 |
| 2022 |
| |||
Total shareholders’ equity | $ | 102,277 | $ | 106,178 | |||
Less: Intangible assets |
| 13,712 |
| 13,739 | |||
Tangible common equity |
| 88,565 |
| 92,439 | |||
Total assets |
| 1,389,638 |
| 1,363,874 | |||
Less: Intangible assets |
| 13,712 |
| 13,739 | |||
Tangible assets |
| 1,375,926 |
| 1,350,135 | |||
Tangible common equity ratio (non-GAAP) |
| 6.44 | % |
| 6.85 | % | |
Total shares outstanding |
| 17,147,270 |
| 17,117,617 | |||
Tangible book value per share (non-GAAP) | $ | 5.16 | $ | 5.40 | |||
CRITICAL ACCOUNTING POLICIES AND ESTIMATES. The accounting and reporting policies of the Company are in accordance with Generally Accepted Accounting Principles (GAAP) and conform to general practices within the banking industry. Accounting and reporting policies for the pension liability, allowance for credit losses (related to investment securities, loans, and unfunded commitments), and derivatives (interest rate swaps/hedges) are deemed critical because they involve the use of estimates and require significant management judgments. Application of assumptions different than those used by the Company could result in material changes in the Company’s financial position or results of operation.
ACCOUNT — Pension liability
BALANCE SHEET REFERENCE — Other assets
INCOME STATEMENT REFERENCE — Salaries and employee benefits and Other expense
DESCRIPTION
Pension costs and liabilities are dependent on assumptions used in calculating such amounts. These assumptions include discount rates, benefits earned, interest costs, expected return on plan assets, mortality rates, and other factors. In accordance with GAAP, actual results that differ from the assumptions are accumulated and amortized over future
38
periods and, therefore, generally affect recognized expense and the recorded obligation of future periods. While management believes that the assumptions used are appropriate, differences in actual experience or changes in assumptions may affect the Company’s pension obligations and future expense. Additionally, pension expense can also be impacted by settlement accounting charges if the amount of employee selected lump sum distributions exceed the total amount of service and interest component costs of the net periodic pension cost in a particular year. Our pension benefits are described further in Note 16 of the Notes to Consolidated Financial Statements.
ACCOUNT — Allowance for credit losses
BALANCE SHEET REFERENCE — Investment securities, net of allowance for credit losses, Allowance for credit losses – loans, Other liabilities
INCOME STATEMENT REFERENCE — Provision for credit losses
DESCRIPTION
Effective January 1, 2023, the Company adopted ASU 2016-13, Financial Instruments - Credit Losses (Topic 326): Measurement of Credit Losses on Financial Instruments (ASU 2016-13) and subsequent related updates. This standard replaces the incurred loss methodology for recognizing credit losses and requires the Company to measure the current expected credit losses (CECL) on financial assets measured at amortized cost, including loans and held to maturity (HTM) securities, and off-balance sheet credit exposures such as unfunded commitments. In addition, ASU 2016-13 requires credit losses on available for sale (AFS) debt securities to be presented as an allowance rather than as a write-down when management does not intend to sell or believes that it is not more likely than not they will be required to sell the security.
The Company measures expected credit losses on held to maturity debt securities, which are comprised of U.S. government agency and mortgage-backed securities as well as taxable municipal, corporate, and other bonds. The Company’s agency and mortgage-backed securities are issued by U.S. government entities and agencies and are either explicitly or implicitly guaranteed by the U.S. government, are highly rated by major rating agencies, and have a long history of no credit losses. As such, no allowance for credit losses has been established for these securities. The allowance for credit losses on the taxable municipal, corporate, and other bonds within the held to maturity securities portfolio is calculated using the PD/LGD method. The calculation is completed on a quarterly basis using the default studies provided by an industry leading source. Based on management judgment, certain qualitative adjustments, such as the Company’s historical loss experience and/or the issuer’s credit quality, may be applied.
The Company measures expected credit losses on available for sale debt securities when the Company does not intend to sell, or when it is not more likely than not that it will be required to sell, the security before recovery of its amortized cost basis. If either of the criteria regarding intent or requirement to sell is met, the security’s amortized cost basis is written down to fair value through income. For available for sale debt securities that do not meet the aforementioned criteria, the Company evaluates whether the decline in fair value has resulted from credit losses or other factors. In making this assessment, the Company considers the extent to which fair value is less than amortized cost, any changes to the rating of the security by a rating agency, and adverse conditions specifically related to the security, among other factors. If this evaluation indicates that a credit loss exists, the present value of cash flows expected to be collected from the security are compared to the amortized cost basis of the security. If the present value of cash flows expected to be collected is less than the amortized cost, a credit loss exists and an allowance for credit losses is recorded for the credit loss, equal to the amount that the fair value is less than the amortized cost basis.
The allowance for credit losses (ACL) is a valuation reserve established and maintained by charges against income and is deducted from the amortized cost basis of loans to present the net amount expected to be collected on the loans. Loans, or portions thereof, are charged-off against the ACL when they are deemed uncollectible.
The ACL is an estimate of expected credit losses, measured over the contractual life of a loan, that considers our historical loss experience, current conditions and forecasts of future economic conditions. Determination of an appropriate ACL is inherently subjective and may have significant changes from period to period. The methodology for determining the ACL has two main components: evaluation of expected credit losses for certain groups of homogeneous loans that share similar risk characteristics and evaluation of loans that do not share risk characteristics with other loans.
The allowance for credit losses is calculated with the objective of maintaining reserve levels believed by management to be sufficient to absorb current expected credit losses. Management’s determination of the adequacy of the allowance is based on periodic evaluations of the credit portfolio and other relevant factors. However, this quarterly evaluation is inherently subjective as it requires material estimates. This process also considers economic conditions, for
39
a reasonable and supportable forecast period of two years. All of these factors may be susceptible to significant change. To the extent actual outcomes differ from management estimates, additional provision for credit losses may be required that would adversely impact earnings in future periods.
The Company estimates expected credit losses over the contractual period in which it is exposed to credit risk via a contractual obligation to extend credit, unless that obligation is unconditionally cancellable. The estimate includes consideration of the likelihood that funding will occur and an estimate of expected credit losses on commitments expected to be funded over its estimated life.
ACCOUNT — Derivatives (interest rate swaps/hedges)
BALANCE SHEET REFERENCE — Other assets and Other liabilities
INCOME STATEMENT REFERENCE — Other income
DESCRIPTION
The Company periodically enters into derivative instruments to meet the financing, interest rate and equity risk management needs of its customers or the Bank.
The Company recognizes all derivatives as either assets or liabilities on the Consolidated Balance Sheets and measures those instruments at fair value. For derivatives designated as fair value hedges, changes in the fair value of the derivative and hedged item related to the hedged risk are recognized in earnings. Changes in fair value of derivatives designated and accounted for as cash flow hedges, to the extent they are effective as hedges, are recorded in other comprehensive loss, net of deferred taxes and are subsequently reclassified to earnings when the hedged transaction affects earnings. Any hedge ineffectiveness would be recognized in the income statement line item pertaining to the hedged item.
To accommodate the needs of our customers and support the Company’s asset/liability positioning, we may enter into interest rate swap agreements with customers and a large financial institution that specializes in these types of transactions. The Company enters into offsetting positions to minimize interest rate and equity risk to the Company. These derivative financial instruments are reported at fair value with any resulting gain or loss recorded in current period earnings in amounts that offset. These instruments and their offsetting positions are recorded in other assets and other liabilities on the Consolidated Balance Sheets.
FORWARD LOOKING STATEMENTS
THE STRATEGIC FOCUS:
AmeriServ Financial is committed to improving shareholder value by striving for consistently improving financial performance; providing our customers with products and exceptional service for every step in their lifetime financial journey; cultivating an employee atmosphere rooted in trust, empowerment and growth; and serving our communities through employee involvement and a philanthropic spirit. We will strive to provide our shareholders with consistently improved financial performance; the products, services and know-how needed to forge lasting banking for life customer relationships; a work environment that challenges and rewards staff; and the manpower and financial resources needed to make a difference in the communities we serve. Our strategic initiatives will focus on these four key constituencies:
| ● | Shareholders — We strive to increase earnings per share; identifying and managing revenue growth and expense control; and managing risk. Our goal is to increase value for AmeriServ shareholders by growing earnings per share and narrowing the financial performance gap between AmeriServ and its peer banks. We try to return earnings to shareholders through a combination of dividends and share repurchases (none currently authorized) subject to maintaining sufficient capital to support balance sheet growth and economic uncertainty. We strive to educate our employee base as to the meaning/importance of earnings per share as a performance measure. Our goal is to develop a value added combination for increasing revenue and controlling expenses that is rooted in developing and offering high-quality financial products and services; an existing branch network; electronic banking capabilities with 24/7 convenience; and providing truly exceptional customer service. We explore branch consolidation opportunities and further leverage union affiliated revenue streams, prudently manage the Company’s risk profile to improve asset yields and increase profitability and continue to identify and implement technological opportunities and advancements to drive efficiency for the holding company and its affiliates. |
40
| ● | Customers — The Company expects to provide exceptional customer service, identifying opportunities to enhance the Banking for Life philosophy by providing products and services to meet the financial needs in every step through a customer’s life cycle, and further defining the role technology plays in anticipating and satisfying customer needs. We anticipate providing leading banking systems and solutions to improve and enhance customers’ Banking for Life experience. We will provide customers with a comprehensive offering of financial solutions including retail and business banking, home mortgages and wealth management at one location. We have upgraded and modernized select branches to be more inviting and technologically savvy to meet the needs of the next generation of AmeriServ customers without abandoning the needs of our existing demographic. |
| ● | Staff — We are committed to developing high-performing employees, establishing and maintaining a culture of trust and effectively and efficiently managing staff attrition. We will employ a work force succession plan to manage anticipated staff attrition while identifying and grooming high performing staff members to assume positions with greater responsibility within the organization. We will employ technological systems and solutions to provide staff with the tools they need to perform more efficiently and effectively. |
| ● | Communities — We will continue to promote and encourage employee community involvement and leadership while fostering a positive corporate image. This will be accomplished by demonstrating our commitment to the communities we serve through assistance in providing affordable housing programs for low-to-moderate-income families; donations to qualified charities; and the time and talent contributions of AmeriServ staff to a wide-range of charitable and civic organizations. |
This Form 10-K contains various forward-looking statements and includes assumptions concerning the Company’s beliefs, plans, objectives, goals, expectations, anticipations, estimates, intentions, operations, future results, and prospects, including statements that include the words “may,” “could,” “should,” “would,” “believe,” “expect,” “anticipate,” “estimate,” “intend,” “project,” “plan” or similar expressions. These forward-looking statements are based upon current expectations, are subject to risk and uncertainties and are applicable only as of the dates of such statements. Forward-looking statements involve risks, uncertainties and assumptions. Although we do not make forward-looking statements unless we believe we have a reasonable basis for doing so, we cannot guarantee their accuracy. You should not put undue reliance on any forward-looking statements. These statements speak only as of the date of this Form 10-K, even if subsequently made available on our website or otherwise, and we undertake no obligation to update or revise these statements to reflect events or circumstances occurring after the date of this Form 10-K. In connection with the “safe harbor” provisions of the Private Securities Litigation Reform Act of 1995, the Company provides the following cautionary statement identifying important factors (some of which are beyond the Company’s control) which could cause the actual results or events to differ materially from those set forth in or implied by the forward-looking statements and related assumptions.
Such factors include the following: (i) the effect of changing regional and national economic conditions; (ii) the effects of trade, monetary and fiscal policies and laws, including interest rate policies of the Federal Reserve; (iii) significant changes in interest rates and prepayment speeds; (iv) inflation, stock and bond market, and monetary fluctuations; (v) credit risks of commercial, real estate, consumer, and other lending activities; (vi) changes in federal and state banking and financial services laws and regulations and supervisory actions by such regulators, including bank failures; (vii) the presence in the Company’s market area of competitors with greater financial resources than the Company; (viii) the timely development of competitive new products and services by the Company and the acceptance of those products and services by customers and regulators (when required); (ix) the willingness of customers to substitute competitors’ products and services for those of the Company and vice versa; (x) changes in consumer spending and savings habits; (xi) unanticipated regulatory or judicial proceedings; (xii) the ability to attract new or retain existing deposits or to retain or grow loans, including growth from unfunded closed loans; (xiii) the ability to generate future revenue growth or to control future growth in non-interest expense, including, but not limited to, those related to technological changes, including changes regarding artificial intelligence and cybersecurity, changes affecting oversight of the financial services industry, and changes intended to manage or mitigate climate and related environmental risks; (xiv) the impact of failure in, or breach of, our operational or security systems or those of third parties with whom we do business, including as a result of cyberattacks or an increase in the incidence of fraud, illegal payments, security breaches or other illegal acts impacting us or our customers; (xv) expense and reputational impact on the Company as a result of litigation and other expenses related to the continuing activities of an activist shareholder; (xvi) legal, reputational, and financial risks resulting from the MOVEit cyber incident, our ongoing investigation of the incident, including the Company’s potential discovery of additional information related to the incident in connection with this investigation, any potential regulatory inquiries and/or litigation to which the Company may become subject in
41
connection with this incident, the extent of remediation and other additional costs that may be incurred by the Company in connection with this incident, the extent of insurance coverage and contractual indemnification, the potential that other third-party vendors may have been affected by the MOVEit vulnerability in a manner that may compromise client data, including personally identifiable information; and (xvii) other external developments which could materially impact the Company’s operational and financial performance.
The foregoing list of important factors is not exclusive, and neither such list nor any forward-looking statement takes into account the impact that any future acquisition may have on the Company and on any such forward-looking statement.
ITEM 7A. QUANTITATIVE AND QUALITATIVE DISCLOSURES ABOUT MARKET RISK
Risk identification and management are essential elements for the successful management of the Company. In the normal course of business, the Company is subject to various types of risk, including interest rate, credit, and liquidity risk. The Company seeks to identify, manage and monitor these risks with policies, procedures, and various levels of managerial and Board oversight. The Company’s objective is to optimize profitability while managing and monitoring risk within Board approved policy limits.
Interest rate risk is the sensitivity of net interest income and the market value of financial instruments to the magnitude, direction, and frequency of changes in interest rates. Interest rate risk results from various repricing frequencies and the maturity structure of assets, liabilities, and hedges. The Company uses its asset/liability management policy and hedging policy to control and manage interest rate risk. For information regarding the effect of changing interest rates on the Company’s net interest income and market value of its investment portfolio, see “Management’s Discussion and Analysis of Consolidated Financial Condition and Results of Operations — Interest Rate Sensitivity.”
Liquidity risk represents the inability to generate cash or otherwise obtain funds at reasonable rates to satisfy commitments to borrowers, as well as, the obligations to depositors, debtholders and to fund operating expenses. The Company uses its asset/liability management policy and contingency funding plan to control and manage liquidity risk. See “Management’s Discussion and Analysis of Consolidated Financial Condition and Results of Operations — Liquidity.”
Credit risk represents the possibility that a customer may not perform in accordance with contractual terms. Credit risk results from extending credit to customers, purchasing securities, and entering into certain off-balance sheet loan funding commitments. The Company’s primary credit risk occurs in the loan portfolio and to a lesser extent in the corporate and municipal portions of the investment portfolio. The Company uses its credit policy and disciplined approach to evaluating the adequacy of the allowance for credit losses to control and manage credit risk. The Company’s investment policy and hedging policy strictly limit the amount of credit risk that may be assumed in the investment portfolio and through hedging activities.
For information regarding the market risk of the Company’s financial instruments, see “Management’s Discussion and Analysis of Consolidated Financial Condition and Results of Operations — Interest Rate Sensitivity.” The Company’s principal market risk exposure is to interest rates.
42
ITEM 8. CONSOLIDATED FINANCIAL STATEMENTS AND SUPPLEMENTARY DATA
AMERISERV FINANCIAL, INC.
CONSOLIDATED BALANCE SHEETS
AT DECEMBER 31, | ||||||
| 2023 |
| 2022 | |||
(IN THOUSANDS, | ||||||
EXCEPT SHARE DATA) | ||||||
ASSETS |
|
|
|
| ||
Cash and due from depository institutions | $ | | $ | | ||
Interest bearing deposits and short-term investments |
| |
| | ||
Cash and cash equivalents |
| |
| | ||
Investment securities, net of allowance for credit losses: |
|
|
|
| ||
Available for sale, at fair value (allowance for credit losses $ |
| |
| | ||
Held to maturity (fair value $ |
| |
| | ||
Loans held for sale |
| |
| | ||
Loans (net of unearned income $ |
| |
| | ||
Less: Allowance for credit losses |
| |
| | ||
Net loans |
| |
| | ||
Premises and equipment: |
|
| ||||
Operating lease right-of-use asset | | | ||||
Financing lease right-of-use asset | | | ||||
Other premises and equipment, net | | | ||||
Accrued interest income receivable |
| |
| | ||
Intangible assets: |
|
| ||||
Goodwill |
| |
| | ||
Core deposit intangible |
| |
| | ||
Bank owned life insurance |
| |
| | ||
Net deferred tax asset |
| |
| | ||
Federal Home Loan Bank stock |
| |
| | ||
Federal Reserve Bank stock |
| |
| | ||
Other assets |
| |
| | ||
TOTAL ASSETS | $ | | $ | | ||
LIABILITIES | ||||||
Non-interest bearing deposits | $ | | $ | | ||
Interest bearing deposits |
| |
| | ||
Total deposits |
| |
| | ||
Short-term borrowings |
| |
| | ||
Advances from Federal Home Loan Bank |
| |
| | ||
Operating lease liabilities | | | ||||
Financing lease liabilities | | | ||||
Subordinated debt |
| |
| | ||
Total borrowed funds |
| |
| | ||
Other liabilities |
| |
| | ||
TOTAL LIABILITIES |
| |
| | ||
SHAREHOLDERS' EQUITY |
|
|
|
| ||
Common stock, par value $ |
| |
| | ||
Treasury stock at cost, |
| ( |
| ( | ||
Capital surplus |
| |
| | ||
Retained earnings |
| |
| | ||
Accumulated other comprehensive loss, net |
| ( |
| ( | ||
TOTAL SHAREHOLDERS' EQUITY |
| |
| | ||
TOTAL LIABILITIES AND SHAREHOLDERS' EQUITY | $ | | $ | | ||
See accompanying notes to consolidated financial statements.
43
AMERISERV FINANCIAL, INC.
CONSOLIDATED STATEMENTS OF OPERATIONS
YEAR ENDED DECEMBER 31, | |||||||||
| 2023 |
| 2022 |
| 2021 | ||||
(IN THOUSANDS, | |||||||||
EXCEPT PER SHARE DATA) | |||||||||
INTEREST INCOME |
|
|
|
|
|
| |||
Interest and fees on loans |
|
|
|
|
|
| |||
Taxable | $ | | $ | | $ | | |||
Tax exempt |
| |
| |
| | |||
Interest bearing deposits and short-term investments |
| |
| |
| | |||
Investment securities: |
|
|
|
|
|
| |||
Available for sale |
| |
| |
| | |||
Held to maturity |
| |
| |
| | |||
Total Interest Income |
| |
| |
| | |||
INTEREST EXPENSE |
|
|
|
|
|
| |||
Deposits |
| |
| |
| | |||
Short-term borrowings |
| |
| |
| | |||
Advances from Federal Home Loan Bank |
| |
| |
| | |||
Financing lease liabilities | | | | ||||||
Guaranteed junior subordinated deferrable interest debentures |
| — |
| — |
| | |||
Subordinated debt |
| |
| |
| | |||
Total Interest Expense |
| |
| |
| | |||
Net Interest Income |
| |
| |
| | |||
Provision for credit losses |
| |
| |
| | |||
Net Interest Income after Provision for Credit Losses |
| |
| |
| | |||
NON-INTEREST INCOME |
|
|
|
|
|
| |||
Wealth management fees |
| |
| |
| | |||
Service charges on deposit accounts |
| |
| |
| | |||
Net gains on loans held for sale |
| |
| |
| | |||
Mortgage related fees |
| |
| |
| | |||
Net realized gains (losses) on investment securities |
| ( |
| — |
| | |||
Gain on sale of Visa Class B shares | | — | — | ||||||
Bank owned life insurance |
| |
| |
| | |||
Other income |
| |
| |
| | |||
Total Non-Interest Income |
| |
| |
| | |||
NON-INTEREST EXPENSE |
|
|
|
|
|
| |||
Salaries and employee benefits |
| |
| |
| | |||
Net occupancy expense |
| |
| |
| | |||
Equipment expense |
| |
| |
| | |||
Professional fees |
| |
| |
| | |||
Data processing and IT expense | | | | ||||||
Supplies, postage and freight |
| |
| |
| | |||
Miscellaneous taxes and insurance |
| |
| |
| | |||
Federal deposit insurance expense |
| |
| |
| | |||
Branch acquisition costs |
| — |
| — |
| | |||
Other expense |
| |
| |
| | |||
Total Non-Interest Expense |
| |
| |
| | |||
PRETAX INCOME (LOSS) | ( | | | ||||||
Provision (benefit) for income taxes | ( | | | ||||||
NET INCOME (LOSS) | $ | ( | $ | | $ | | |||
44
AMERISERV FINANCIAL, INC.
CONSOLIDATED STATEMENTS OF OPERATIONS (CONTINUED)
YEAR ENDED DECEMBER 31, | |||||||||
| 2023 |
| 2022 |
| 2021 | ||||
(IN THOUSANDS, | |||||||||
EXCEPT PER SHARE DATA) | |||||||||
PER COMMON SHARE DATA: |
|
|
|
|
|
| |||
Basic: |
|
|
|
|
|
| |||
Net income (loss) | $ | ( | $ | | $ | | |||
Average number of shares outstanding | | | | ||||||
Diluted: | |||||||||
Net income (loss) | $ | ( | $ | | $ | | |||
Average number of shares outstanding | | | | ||||||
Cash dividends declared | $ | | $ | | $ | | |||
See accompanying notes to consolidated financial statements.
45
AMERISERV FINANCIAL, INC.
CONSOLIDATED STATEMENTS OF COMPREHENSIVE INCOME (LOSS)
YEAR ENDED DECEMBER 31, | |||||||||
| 2023 |
| 2022 |
| 2021 | ||||
(IN THOUSANDS) | |||||||||
COMPREHENSIVE INCOME (LOSS) |
|
|
|
|
|
| |||
Net income (loss) | $ | ( | $ | | $ | | |||
Other comprehensive income (loss) |
|
|
|
|
|
| |||
Pension obligation change for defined benefit plan |
| |
| |
| | |||
Income tax effect |
| ( |
| ( |
| ( | |||
Unrealized holding gains (losses) on available for sale securities arising during period |
| |
| ( |
| ( | |||
Income tax effect |
| ( |
| |
| | |||
Reclassification adjustment for net realized (gains) losses on available for sale securities included in net income |
| |
| — |
| ( | |||
Income tax effect |
| ( |
| — |
| | |||
Fair value change for interest rate hedge |
| ( |
| — |
| — | |||
Income tax effect |
| |
| — |
| — | |||
Other comprehensive income (loss) |
| |
| ( |
| | |||
Comprehensive income (loss) | $ | ( | $ | ( | $ | | |||
See accompanying notes to consolidated financial statements.
46
AMERISERV FINANCIAL, INC.
CONSOLIDATED STATEMENTS OF CHANGES IN SHAREHOLDERS’ EQUITY
YEAR ENDED DECEMBER 31, | |||||||||
| 2023 |
| 2022 |
| 2021 | ||||
(IN THOUSANDS) | |||||||||
COMMON STOCK |
|
|
|
|
|
| |||
Balance at beginning of period | $ | | $ | | $ | | |||
New common shares issued for exercise of stock options ( |
| |
| — |
| — | |||
Balance at end of period |
| |
| |
| | |||
TREASURY STOCK |
|
|
|
|
|
| |||
Balance at beginning of period |
| ( |
| ( |
| ( | |||
Treasury stock purchased |
| — |
| — |
| — | |||
Balance at end of period |
| ( |
| ( |
| ( | |||
CAPITAL SURPLUS |
|
|
|
|
|
| |||
Balance at beginning of period |
| |
| |
| | |||
New common shares issued for exercise of stock options ( |
| |
| |
| | |||
Stock option expense |
| |
| |
| | |||
Balance at end of period |
| |
| |
| | |||
RETAINED EARNINGS |
|
|
|
|
|
| |||
Balance at beginning of period |
| |
| |
| | |||
Net income (loss) |
| ( |
| |
| | |||
Cash dividend declared on common stock ($ |
| ( |
| ( |
| ( | |||
Cumulative effect adjustment for adoption of ASU 2016-13 |
| ( |
| — |
| — | |||
Balance at end of period |
| |
| |
| | |||
ACCUMULATED OTHER COMPREHENSIVE LOSS, NET |
|
|
|
|
|
| |||
Balance at beginning of period |
| ( |
| ( |
| ( | |||
Other comprehensive income (loss) |
| |
| ( |
| | |||
Balance at end of period |
| ( |
| ( |
| ( | |||
TOTAL SHAREHOLDERS’ EQUITY | $ | | $ | | $ | | |||
See accompanying notes to consolidated financial statements.
47
AMERISERV FINANCIAL, INC.
CONSOLIDATED STATEMENTS OF CASH FLOWS
YEAR ENDED DECEMBER 31 | |||||||||
| 2023 |
| 2022 |
| 2021 | ||||
| (IN THOUSANDS) | ||||||||
OPERATING ACTIVITIES | |||||||||
Net income (loss) | $ | ( | $ | | $ | | |||
Adjustments to reconcile net income (loss) to net cash provided by operating activities: |
|
|
|
|
|
| |||
Provision for credit losses |
| |
| |
| | |||
Depreciation and amortization expense |
| |
| |
| | |||
Amortization expense of core deposit intangible |
| |
| |
| | |||
Amortization of fair value adjustment on acquired time deposits |
| ( |
| ( |
| ( | |||
Net amortization of investment securities |
| |
| |
| | |||
Net realized losses (gains) on investment securities — available for sale |
| |
| — |
| ( | |||
Net amortization of deferred loan fees |
| ( |
| ( |
| ( | |||
Net gains on loans held for sale |
| ( |
| ( |
| ( | |||
Origination of mortgage loans held for sale |
| ( |
| ( |
| ( | |||
Sales of mortgage loans held for sale |
| |
| |
| | |||
(Increase) decrease in accrued interest receivable |
| ( |
| ( |
| | |||
Increase (decrease) in accrued interest payable |
| |
| |
| ( | |||
Earnings on bank-owned life insurance |
| ( |
| ( |
| ( | |||
Deferred income taxes |
| ( |
| |
| | |||
Stock compensation expense |
| |
| |
| | |||
Net change in operating leases | ( | ( | ( | ||||||
Other, net |
| ( |
| ( |
| ( | |||
Net cash provided by operating activities |
| |
| |
| | |||
INVESTING ACTIVITIES |
|
|
|
|
|
| |||
Purchase of investment securities — available for sale |
| ( |
| ( |
| ( | |||
Purchase of investment securities — held to maturity |
| ( |
| ( |
| ( | |||
Proceeds from maturities of investment securities — available for sale |
| |
| |
| | |||
Proceeds from maturities of investment securities — held to maturity |
| |
| |
| | |||
Proceeds from sales of investment securities — available for sale |
| |
| |
| | |||
Purchase of regulatory stock |
| ( |
| ( |
| ( | |||
Proceeds from redemption of regulatory stock |
| |
| |
| | |||
Long-term loans originated |
| ( |
| ( |
| ( | |||
Principal collected on long-term loans |
| |
| |
| | |||
Purchases of premises and equipment |
| ( |
| ( |
| ( | |||
Proceeds from sale of other real estate owned and repossessed assets |
| |
| |
| | |||
Cash acquired in branch acquisition, net |
| — |
| — |
| | |||
Proceeds from life insurance policies |
| |
| |
| | |||
Net cash used in investing activities |
| ( |
| ( |
| ( | |||
FINANCING ACTIVITIES |
|
|
|
|
|
| |||
Net increase (decrease) in deposit balances |
| |
| ( |
| | |||
Net (decrease) increase in other short-term borrowings |
| ( |
| |
| ( | |||
Principal borrowings on advances from Federal Home Loan Bank |
| |
| — |
| | |||
Principal repayments on advances from Federal Home Loan Bank |
| ( |
| ( |
| ( | |||
Principal payments on financing lease liabilities | ( | ( | ( | ||||||
Redemption of guaranteed junior subordinated deferrable interest debentures | — | — | ( | ||||||
Subordinated debt issuance, net | — | — | | ||||||
Redemption of subordinated debt | — | — | ( | ||||||
Stock options exercised |
| |
| |
| | |||
Common stock dividend paid |
| ( |
| ( |
| ( | |||
Net cash provided by financing activities |
| |
| |
| | |||
NET (DECREASE) INCREASE IN CASH AND CASH EQUIVALENTS |
| ( |
| ( |
| | |||
CASH AND CASH EQUIVALENTS AT JANUARY 1 |
| |
| |
| | |||
CASH AND CASH EQUIVALENTS AT DECEMBER 31 | $ | | $ | | $ | | |||
See accompanying notes to consolidated financial statements.
48
1. SUMMARY OF SIGNIFICANT ACCOUNTING POLICIES
BUSINESS AND NATURE OF OPERATIONS:
AmeriServ Financial, Inc. (the Company) is a bank holding company, headquartered in Johnstown, Pennsylvania. Through its banking subsidiary, the Company operates
AmeriServ Trust and Financial Services Company (the Trust Company) offers a complete range of trust and financial services and administers assets valued at approximately $
PRINCIPLES OF CONSOLIDATION:
The consolidated financial statements include the accounts of AmeriServ Financial, Inc. and its wholly-owned subsidiaries, AmeriServ Financial Bank (the Bank) and the Trust Company. The Bank is a Pennsylvania state-chartered full service bank with
In addition, the Parent Company is an administrative group that provides support in such areas as audit, finance, investments, loan review, general services, and marketing. Intercompany accounts and transactions have been eliminated in preparing the Consolidated Financial Statements. The preparation of financial statements in conformity with accounting principles generally accepted in the United States of America (generally accepted accounting principles, or GAAP) requires management to make estimates and assumptions that affect the amounts reported in the Consolidated Financial Statements and accompanying notes. Actual results may differ from these estimates and the differences may be material to the Consolidated Financial Statements. The Company’s most significant estimates relate to the allowance for credit losses (related to investment securities, loans, and unfunded commitments), pension, and derivatives (interest rate swaps/hedges).
INVESTMENT SECURITIES:
Securities are classified at the time of purchase as investment securities held to maturity if it is management’s intent and the Company has the ability to hold the securities until maturity. These held to maturity securities are carried on the Company’s books at cost, adjusted for amortization of premium and accretion of discount which is computed using the level yield method which approximates the effective interest method. Alternatively, securities are classified as available for sale if it is management’s intent at the time of purchase to hold the securities for an indefinite period of time and/or to use the securities as part of the Company’s asset/liability management strategy. Securities classified as available for sale include securities which may be sold to effectively manage interest rate risk exposure, prepayment risk, and other factors (such as liquidity requirements). These available for sale securities are reported at fair value with unrealized aggregate appreciation/depreciation excluded from income and credited/charged to accumulated other comprehensive income (loss) within shareholders’ equity on a net of tax basis. Realized gains or losses on securities sold are computed upon the adjusted cost of the specific securities sold. Additionally, the Company holds equity securities which are comprised of mutual funds held within a rabbi trust for the executive deferred compensation plan. Such securities are reported at fair value within other assets on the Consolidated Balance Sheets. Unrealized holding gains and losses on equity securities are included in earnings. Any securities classified as trading assets are reported at fair value with unrealized aggregate appreciation/depreciation included in income on a net of tax basis. The Company does not engage in trading activity.
Allowance for Credit Losses – Held to Maturity Securities
The Company measures expected credit losses on held to maturity debt securities, which are comprised of U.S. government agency and mortgage-backed securities as well as taxable municipal, corporate, and other bonds. The Company’s agency and mortgage-backed securities are issued by U.S. government entities and agencies and are either explicitly or implicitly guaranteed by the U.S. government, are highly rated by major rating agencies, and have a long history of
49
allowance for credit losses on the taxable municipal, corporate, and other bonds within the held to maturity securities portfolio is calculated using the probability of default/loss given default (PD/LGD) method. The calculation is completed on a quarterly basis using the default studies provided by an industry leading source. Additionally, based on management judgment, certain qualitative adjustments, such as the Company’s historical loss experience and/or the issuer’s credit quality, may be applied. At December 31, 2023, the allowance for credit losses on the held to maturity securities portfolio totaled $
The allowance for credit losses on held to maturity debt securities is included within investment securities held to maturity on the Consolidated Balance Sheets. Changes in the allowance for credit losses are recorded within provision for credit losses on the Consolidated Statements of Operations.
Accrued interest receivable on held to maturity debt securities totaled $
Allowance for Credit Losses – Available for Sale Securities
The Company measures expected credit losses on available for sale debt securities when the Company does not intend to sell, or when it is not more likely than not that it will be required to sell, the security before recovery of its amortized cost basis. If either of the criteria regarding intent or requirement to sell is met, the security’s amortized cost basis is written down to fair value through income. For available for sale debt securities that do not meet the aforementioned criteria, the Company evaluates whether the decline in fair value has resulted from credit losses or other factors. In making this assessment, the Company considers the extent to which fair value is less than amortized cost, any changes to the rating of the security by a rating agency, and adverse conditions specifically related to the security, among other factors. If this evaluation indicates that a credit loss exists, the present value of cash flows expected to be collected from the security are compared to the amortized cost basis of the security. If the present value of cash flows expected to be collected is less than the amortized cost, a credit loss exists and an allowance for credit losses is recorded for the credit loss, equal to the amount that the fair value is less than the amortized cost basis. At December 31, 2023, the allowance for credit losses on the available for sale securities portfolio totaled $
The allowance for credit losses on available for sale debt securities is included within investment securities available for sale on the Consolidated Balance Sheets. Changes in the allowance for credit losses are recorded within provision for credit losses on the Consolidated Statements of Operations. Losses are charged against the allowance when the Company believes the collectability of an available for sale security is in jeopardy or when either of the criteria regarding intent or requirement to sell is met.
Accrued interest receivable on available for sale debt securities totaled $
50
Credit Losses on Investment Securities – Prior to adopting ASU 2016-13
The Company adopted ASU 2016-13 effective January 1, 2023. Financial statement amounts related to investment securities recorded as of December 31, 2022 and for the period ending December 31, 2022 are presented in accordance with the accounting policies described in the following paragraphs.
Available for sale and held to maturity securities are reviewed quarterly for possible other than temporary impairment. The review includes an analysis of the facts and circumstances of each individual investment such as the expectation for that security’s performance, the creditworthiness of the issuer, and the Company’s intent and ability to hold the security to recovery. The term other than temporary is not intended to indicate that the decline is permanent but indicates that the prospects for a near-term recovery of value are not necessarily favorable or that there is a lack of evidence to support a realizable value equal to or greater than the carrying value of the investment.
Declines in the fair value of securities below their cost that are deemed to be other than temporary are separated into (a) the amount of the total other than temporary impairment related to a decrease in cash flows expected to be collected from the debt security (the credit loss) and (b) the amount of the total other than temporary impairment related to all other factors. The amount of the total other than temporary impairment related to the credit loss is recognized in earnings. The amount of the total other than temporary impairment related to all other factors is recognized in other comprehensive income (loss).
At December 31, 2022, the Company believes the unrealized losses on certain securities within the investments portfolio are primarily a result of increases in market yields from the time of purchase. In general, as market yields rise, the value of securities will decrease; as market yields fall, the fair value of securities will increase. Management generally views changes in fair value caused by changes in interest rates as temporary; therefore, these securities have not been classified as other than temporarily impaired. Management has also concluded that based on current information we expect to continue to receive scheduled interest payments as well as the entire principal balance. Furthermore, management does not intend to sell these securities and does not believe it will be required to sell these securities before they recover in value.
FEDERAL HOME LOAN BANK STOCK:
The Bank is a member of the Federal Home Loan Bank of Pittsburgh (FHLB) and as such, is required to maintain a minimum investment in stock of the FHLB that varies with the level of advances outstanding with the FHLB. The stock is bought from and sold to the FHLB based upon its $
LOANS:
Loans that management has the intent and ability to hold for the foreseeable future or until maturity or payoff are stated at their outstanding unpaid principal balances, net of any deferred fees or costs and an allowance for credit losses. Interest income is accrued on the unpaid principal balance and is recognized using the level yield method. As of December 31, 2023 and 2022, accrued interest receivable on loans totaled $
The Company typically discontinues the accrual of interest income when loans become
51
Payments received on non-accrual loans are credited to principal until full recovery of principal has been recognized; or the loan has been returned to accrual status. The only exception to this policy is for residential mortgage loans wherein interest income is recognized on a cash basis as payments are received. Generally, a non-accrual commercial or consumer loan is returned to accrual status after becoming current and remaining current for twelve consecutive payments. Residential mortgage loans are returned to accrual status upon becoming current.
LOAN FEES:
Loan origination and commitment fees, net of certain direct origination costs, are deferred and recognized as an adjustment of the yield (interest income) over the contractual life of the loan.
LOANS HELD FOR SALE:
Certain newly originated residential mortgage loans are classified as held for sale, because it is management’s intent to sell these residential mortgage loans. The residential mortgage loans held for sale are carried at the lower of aggregate cost or fair value.
TRANSFERS OF FINANCIAL ASSETS:
Transfers of financial assets are accounted for as sales when control over the assets has been surrendered. Control over transferred assets is deemed to be surrendered when (1) the assets have been isolated from the Company; (2) the transferee obtains the right (free of conditions that constrain it from taking advantage of that right) to pledge or exchange the transferred assets; and (3) the Company does not maintain effective control over the transferred assets through an agreement to repurchase them before their maturity.
PREMISES AND EQUIPMENT:
Premises and equipment are stated at cost less accumulated depreciation and amortization. Land is carried at cost. Depreciation is charged to operations over the estimated useful lives of the premises and equipment using the straight-line method with a half-year convention. Useful lives of up to
LEASES:
The Company has operating and financing leases for several office locations and equipment. Generally, the underlying lease agreements do not contain any material residual value guarantees or material restrictive covenants. Many of our leases include both lease (e.g., minimum rent payments) and non-lease components, such as common area maintenance charges, utilities, real estate taxes, and insurance. The Company has elected to account for the variable non-lease components separately from the lease component. Such variable non-lease components are reported in net occupancy expense on the Consolidated Statements of Operations when incurred. These variable non-lease components were excluded from the calculation of the present value of the remaining lease payments, therefore, they are not included in the right-of-use assets and lease liabilities reported on the Consolidated Balance Sheets.
Certain of the Company’s leases contain options to renew the lease after the initial term. Management considers the Company’s historical pattern of exercising renewal options on leases and the performance of the leased locations, when determining whether it is reasonably certain that the leases will be renewed. If management concludes that there is reasonable certainty about the renewal option, it is included in the calculation of the remaining term of each applicable lease. The discount rate utilized in calculating the present value of the remaining lease payments for each lease is the Federal Home Loan Bank of Pittsburgh advance rate corresponding to the remaining maturity of the lease.
Under ASC 842, the lessee can elect to not record on the Consolidated Balance Sheets a lease whose term is twelve months or less and does not include a purchase option that the lessee is reasonably certain to exercise.
52
ALLOWANCE FOR CREDIT LOSSES – LOANS:
The allowance for credit losses (ACL) is a valuation reserve established and maintained by charges against income and is deducted from the amortized cost basis of loans to present the net amount expected to be collected on the loans. Loans, or portions thereof, are charged-off against the ACL when they are deemed uncollectible. Expected recoveries do not exceed the aggregate of amounts previously charged-off and expected to be charged-off.
The ACL is an estimate of expected credit losses, measured over the contractual life of a loan, that considers our historical loss experience, current conditions and forecasts of future economic conditions. Determination of an appropriate ACL is inherently subjective and may have significant changes from period to period. The methodology for determining the ACL has two main components: evaluation of expected credit losses for certain groups of homogeneous loans that share similar risk characteristics and evaluation of loans that do not share risk characteristics with other loans.
The allowance for credit losses is measured on a collective (pool) basis when similar risk characteristics exist. The Company has aligned our segmentation to the quarterly Call Report. This allowed the Company to use not only our data, but also peer institutions to supplement loss observations in determining our qualitative adjustments. Some further sub-segmenting was performed on the commercial and industrial (C&I) and commercial real estate (CRE) portfolios based on collateral type. The Company has identified the following portfolio segments:
| ● | C&I and CRE Owner Occupied – Real Estate |
| ● | C&I and CRE Owner Occupied – Other |
| ● | CRE Non-Owner Occupied – Retail |
| ● | CRE Non-Owner Occupied – Multi-Family |
| ● | CRE Non-Owner Occupied – Other |
| ● | Residential Mortgages |
| ● | Consumer |
The Company is utilizing the static pool analysis (cohort) method for our CECL model. The static pool analysis methodology captures loans that qualify for a segment (i.e. balance of a pool of loans with similar risk characteristics) as of a point in time to form a cohort, then tracks that cohort over their remaining lives to determine their loss behavior. The remaining lifetime loss rate is then applied to current loans that qualify for the same segmentation criteria to form a remaining life expectation on current loans. Once historical cohorts are established, the loans in each individual cohort are tracked over their remaining lives for loss and recovery events. Each cohort is evaluated individually and as a result, a loss may be counted in several different quarterly cohort periods, as long as the specific loan existed in the population of each of those cohort periods.
Historical credit loss experience is the basis for the estimation of expected credit losses. The Company applies historical loss rates to pools of loans with similar risk characteristics. After consideration of the historic loss calculation, management applies qualitative adjustments to reflect the current conditions and reasonable and supportable forecasts not already captured in the historical loss information at the balance sheet date. Our reasonable and supportable forecast adjustment is based on a blend of peer and Company data as well as management judgment. Including peer data addresses the Company’s lack of loss history in some pools of loans. For periods beyond our reasonable and supportable forecast period of two years, loss expectations revert to the long-run historical mean. The qualitative adjustments for current conditions are based upon the following factors:
53
| ● | changes in lending policies and procedures; |
| ● | changes in economic conditions; |
| ● | changes in the nature and volume of the portfolio; |
| ● | staff experience; |
| ● | changes in volume and severity of delinquency, non-performing loans, and classified loans; |
| ● | changes in the quality of the Company’s loan review system; |
| ● | trends in underlying collateral value; |
| ● | concentration risk; and |
| ● | external factors: competition, legal, regulatory. |
These modified historical loss rates are multiplied by the outstanding principal balance of each loan to calculate a required reserve. Ultimately,
In accordance with ASU 2016-13, the Company will evaluate individual loans for expected credit losses when those loans do not share similar risk characteristics with loans evaluated using a collective (pooled) basis. In contrast to legacy accounting standards, this criterion is broader than the impairment concept and management may evaluate loans individually even when no specific expectation of collectability is in place. Loans will not be included in both collective and individual analysis. The individual analysis will establish a specific reserve for loans in scope. It should be noted that there is a review threshold of $
Specific reserves are established based on the following three acceptable methods for measuring the ACL: 1) the present value of expected future cash flows discounted at the loan’s original effective interest rate; 2) the loan’s observable market price; or 3) the fair value of the collateral when the loan is collateral dependent. The method is selected on a loan-by-loan basis, with management primarily utilizing either the discounted cash flows or the fair value of collateral method. The evaluation of the need and amount of a specific allocation of the allowance is made on a quarterly basis.
The need for an updated appraisal on collateral dependent loans is determined on a case-by-case basis. The useful life of an appraisal or evaluation will vary depending upon the circumstances of the property and the economic conditions in the marketplace. A new appraisal is not required if there is an existing appraisal which, along with other information, is sufficient to determine a reasonable value for the property and to support an appropriate and adequate allowance for credit losses. At a minimum, annual documented reevaluation of the property is completed by the Bank’s internal Collections and Assigned Risk Department to support the value of the property.
When reviewing an appraisal associated with an existing real estate collateral dependent transaction, the Bank’s Chief Credit Officer must determine if there have been material changes to the underlying assumptions in the appraisal which affect the original estimate of value. Some of the factors that could cause material changes to reported values include:
| ● | the passage of time; |
| ● | the volatility of the local market; |
| ● | the availability of financing; |
| ● | natural disasters; |
| ● | the inventory of competing properties; |
| ● | new improvements to, or lack of maintenance of, the subject property or competing properties upon physical inspection by the Bank; |
| ● | changes in underlying economic and market assumptions, such as material changes in current and projected vacancy, absorption rates, capitalization rates, lease terms, rental rates, sales prices, concessions, construction overruns and delays, zoning changes, etc.; and/or |
54
| ● | environmental contamination. |
The value of the property is adjusted to appropriately reflect the above listed factors and the value is discounted to reflect the value impact of a forced or distressed sale, any outstanding senior liens, any outstanding unpaid real estate taxes, transfer taxes and closing costs that would occur with sale of the real estate. If the Chief Credit Officer determines that a reasonable value cannot be derived based on available information, a new appraisal is ordered. The determination of the need for a new appraisal, versus completion of a property valuation by the Bank’s Collections and Assigned Risk Department personnel, rests with the Chief Credit Officer and not the originating account officer.
Allowance for Loan Losses – Prior to adopting ASU 2016-13
Prior to the adoption of ASU 2016-13, Financial Instruments - Credit Losses (Topic 326): Measurement of Credit Losses on Financial Instruments (ASU 2016-13), the Company calculated our allowance for loan losses (ALL) using an incurred loss methodology. The following policy related to the ALL in prior periods.
As a financial institution, which assumes lending and credit risks as a principal element of its business, the Company anticipates that credit losses will be experienced in the normal course of business. Accordingly, the Company consistently applies a comprehensive methodology and procedural discipline to perform an analysis which is updated on a quarterly basis at the Bank level to determine both the adequacy of the allowance for loan losses and the necessary provision for loan losses to be charged against earnings.
The segments of the Company’s loan portfolio are disaggregated into classes that allows management to monitor risk and performance. The loan classes used are consistent with the internal reports evaluated by the Company’s management and Board of Directors to monitor risk and performance within various segments of its loan portfolio. The commercial loan segment includes both the commercial and industrial and the owner occupied commercial real estate loan classes while the remaining segments are not separated into classes as management monitors risk in these loans at the segment level. The residential mortgage loan segment is comprised of first lien amortizing residential mortgage loans and home equity loans secured by residential real estate. The consumer loan segment consists primarily of installment loans and overdraft lines of credit connected with customer deposit accounts.
The allowance consists of three elements: (1) an allowance established on specifically identified problem loans, (2) formula driven general reserves established for loan categories based upon historical loss experience and other qualitative factors, and (3) a general risk reserve which provides support for variance from our assessment of the qualitative factors, provides protection against credit risks resulting from other inherent risk factors contained in the Company’s loan portfolio, and recognizes the model and estimation risk associated with the specific and formula driven allowances. The qualitative factors used in the formula driven general reserves are evaluated quarterly (and revised if necessary) by the Company’s management to establish allocations which accommodate each of the risk factors.
Management reviews the loan portfolio on a quarterly basis using a defined, consistently applied process in order to make appropriate and timely adjustments to the ALL. Specifically, this methodology includes:
| ● | Review of all impaired commercial and commercial real estate loans to determine if any specific reserve allocations are required on an individual loan basis. In addition, consumer and residential mortgage loans with a balance of $ |
| ● | The application of formula driven reserve allocations for all commercial and commercial real estate loans by using a three-year migration analysis of net losses incurred within each risk grade for the entire commercial |
55
| loan portfolio. The difference between estimated and actual losses is reconciled through the nature of the migration analysis. |
| ● | The application of formula driven reserve allocations to consumer and residential mortgage loans which are based upon historical net charge-off experience for those loan types. The residential mortgage loan and consumer loan allocations are based upon the Company’s three-year historical average of actual loan net charge-offs experienced in each of those categories. |
| ● | The application of formula driven reserve allocations to all outstanding loans is based upon review of historical losses and qualitative factors, which include but are not limited to, economic trends, delinquencies, levels of non-accrual and TDR loans, concentrations of credit, trends in loan volume, experience and depth of management, examination and audit results, effects of any changes in lending policies and trends in policy, financial information and documentation exceptions. Pass rated credits are segregated from criticized and classified credits for the application of qualitative factors. |
| ● | Management recognizes that there may be events or economic factors that have occurred affecting specific borrowers or segments of borrowers that may not yet be fully reflected in the information that the Company uses for arriving at reserves for a specific loan or portfolio segment. Therefore, the Company believes that there is estimation risk associated with the use of specific and formula driven allowances. |
After completion of this process, a formal meeting of the Loan Loss Reserve Committee is held to evaluate the adequacy of the reserve.
When it is determined that the prospects for recovery of the principal of a loan have significantly diminished, the loan is charged-off against the allowance account; subsequent recoveries, if any, are credited to the allowance account. In addition, non-accrual and large delinquent loans are reviewed monthly to determine potential losses.
The Company’s policy is to individually review, as circumstances warrant, its commercial and commercial mortgage loans to determine if a loan is impaired. At a minimum, credit reviews are mandatory for all commercial and commercial mortgage loan relationships with aggregate balances in excess of $
The ALL is maintained to support loan growth and cover charge-offs from the loan portfolio. The ALL is based on management’s continuing evaluation of the risk characteristics and credit quality of the loan portfolio, assessment of current economic conditions, diversification and size of the portfolio, adequacy of collateral, the amount of non-performing loans, and past and anticipated loss experience.
ALLOWANCE FOR CREDIT LOSSES – UNFUNDED LOAN COMMITMENTS AND LETTERS OF CREDIT:
The Company estimates expected credit losses over the contractual period in which it is exposed to credit risk via a contractual obligation to extend credit, unless that obligation is unconditionally cancellable. The allowance for credit losses on off-balance sheet credit exposures is adjusted through the provision for credit losses line on the Consolidated Statements of Operations. The estimate includes consideration of the likelihood that funding will occur and an estimate of expected credit losses on commitments expected to be funded over its estimated life. The carrying amount of the allowance for credit losses for the Company’s obligations related to unfunded commitments and standby letters of credit, is reported in other liabilities on the Consolidated Balance Sheets.
56
BANK-OWNED LIFE INSURANCE:
The Company has purchased life insurance policies on certain current and previous employees. These policies are recorded on the Consolidated Balance Sheets at their cash surrender value, or the amount that can be realized. Income from these policies and changes in the cash surrender value are recorded in bank owned life insurance within non-interest income. Additionally, income is accrued on certain policies that have reached the minimum floor rate of return. This guaranteed portion of income is not added to the cash surrender value of the policy until the policy anniversary date and is reported in other assets on the Consolidated Balance Sheets.
INTANGIBLE ASSETS:
Goodwill arising from business combinations represents the value attributable to unidentifiable intangible elements in the business acquired. Goodwill is not amortized, but is periodically evaluated for impairment. The Company tests goodwill for impairment on at least an annual basis. This approach could cause more volatility in the Company’s reported net income because impairment losses, if any, could occur irregularly and in varying amounts.
Identifiable intangible assets are amortized to their estimated residual values over their expected useful lives. Such lives are also periodically reassessed to determine if any amortization period adjustments are required. The identifiable intangible assets consist of a core deposit intangible which is being amortized on an accelerated basis over a
EARNINGS PER COMMON SHARE:
Basic earnings per share include only the weighted average common shares outstanding. Diluted earnings per share include the weighted average common shares outstanding and any potentially dilutive common stock equivalent shares in the calculation. Treasury shares are excluded for earnings per share purposes. Options to purchase
YEAR ENDED DECEMBER 31, | |||||||||
| 2023 |
| 2022 |
| 2021 | ||||
(IN THOUSANDS, EXCEPT PER SHARE DATA) | |||||||||
Numerator: | |||||||||
Net income (loss) | $ | ( | $ | | $ | | |||
Denominator: |
|
|
|
|
|
| |||
Weighted average common shares outstanding (basic) |
| |
| |
| | |||
Effect of stock options |
| |
| |
| | |||
Weighted average common shares outstanding (diluted) |
| |
| |
| | |||
Earnings per common share: |
|
|
|
|
|
| |||
Basic | $ | ( | $ | | $ | | |||
Diluted |
| ( |
| |
| | |||
STOCK-BASED COMPENSATION:
The Company uses the modified prospective method for accounting of stock-based compensation. The fair value of each option grant is estimated on the grant date using the Binomial or Black-Scholes option pricing model and the expense is recognized ratably over the service period. Forfeitures are recognized as they occur. See Note 18 for details on the assumptions used.
57
ACCUMULATED OTHER COMPREHENSIVE LOSS:
The Company presents the components of other comprehensive income (loss) in the Consolidated Statements of Comprehensive Income (Loss). These components are comprised of the change in the defined benefit pension obligation, the unrealized holding gains (losses) on available for sale securities, net of any reclassification adjustments for realized gains and losses, and fair value change for the interest rate hedges.
CONSOLIDATED STATEMENT OF CASH FLOWS:
On a consolidated basis, cash and cash equivalents include cash and due from depository institutions, interest bearing deposits, and short-term investments in both money market funds and commercial paper. The Company made $
As a result of the adoption of ASU 2016-13, Financial Instruments - Credit Losses (Topic 326): Measurement of Credit Losses on Financial Instruments, as of January 1, 2023, the Company had non-cash transactions associated with the day one adjustments necessary to record the adoption. Specifically, the adoption of this accounting standard necessitated that a day one increase of $
On May 21, 2021, AmeriServ Financial Bank completed its acquisition from Citizen’s Neighborhood Bank (CNB), an operating division of Riverview Bank, the branch and related deposit customers in Meyersdale, Pennsylvania and the deposit customers in Somerset, Pennsylvania. In addition to the branch acquisition related information disclosed on the Consolidated Statements of Cash Flows, the following were recorded as non-cash transfers (in thousands).
Acquisition of Riverview Bank Branches | |||
Non-cash assets acquired |
| ||
Loans | $ | | |
Other premises and equipment, net |
| | |
Intangible assets | | ||
| |||
Non-cash liabilities assumed |
| ||
Non-interest bearing deposits | ( | ||
Interest bearing deposits |
| ( | |
Other liabilities |
| ( | |
( | |||
Net non-cash liabilities assumed | $ | ( |
INCOME TAXES:
Deferred tax assets or liabilities are computed based on the difference between the financial statement and income tax basis of assets and liabilities using the enacted marginal tax rate. Deferred income tax expenses or credits are based on the changes in the corresponding asset or liability from period to period. Deferred tax assets are reduced, if necessary, by the amounts of such benefits that are not expected to be realized based upon available evidence.
58
INTEREST RATE CONTRACTS:
The Company recognizes all derivatives as either assets or liabilities on the Consolidated Balance Sheets and measures those instruments at fair value. For derivatives designated as fair value hedges, changes in the fair value of the derivative and hedged item related to the hedged risk are recognized in earnings. Changes in fair value of derivatives designated and accounted as cash flow hedges, to the extent they are effective as hedges, are recorded in “Other Comprehensive Income,” net of deferred taxes and are subsequently reclassified to earnings when the hedged transaction affects earnings. Any hedge ineffectiveness would be recognized in the income statement line item pertaining to the hedged item.
The Company periodically enters into derivative instruments to meet the financing, interest rate and equity risk management needs of its customers or the Bank. Upon entering into these instruments to meet customer needs, the Company enters into offsetting positions to minimize interest rate and equity risk to the Company. These derivative financial instruments are reported at fair value with any resulting gain or loss recorded in current period earnings in amounts that offset. These instruments and their offsetting positions are recorded in other assets and other liabilities on the Consolidated Balance Sheets.
PENSION:
Pension costs and liabilities are dependent on assumptions used in calculating such amounts. These assumptions include discount rates, benefits earned, interest costs, expected return on plan assets, mortality rates, and other factors. In accordance with GAAP, actual results that differ from the assumptions are accumulated and amortized over future periods and, therefore, generally affect recognized expense and the recorded obligation of future periods. While management believes that the assumptions used are appropriate, differences in actual experience or changes in assumptions may affect the Company’s pension obligations and future expense. Additionally, pension expense can also be impacted by settlement accounting charges if the amount of employees selecting lump sum distributions exceed the total amount of service and interest component costs of the net periodic pension cost in a particular year.
The service cost component of net periodic benefit cost is determined by aggregating the product of the discounted cash flows of the plan’s service cost for each year and an individual spot rate (referred to as the “spot rate” approach). The interest cost component is determined by aggregating the product of the discounted cash flows of the plan’s projected benefit obligations for each year and an individual spot rate. Management believes this methodology is an appropriate measure of the service cost and interest cost as each year’s cash flows are specifically linked to the interest rates of bond payments in the same respective year. Our pension benefits are described further in Note 16 of the Notes to Consolidated Financial Statements.
FAIR VALUE OF FINANCIAL INSTRUMENTS:
We group our assets at fair value in three levels, based on the markets in which the assets are traded and the reliability of the assumptions used to determine fair value. These levels are:
Level I — Valuation is based upon quoted prices for identical instruments traded in active markets.
Level II — Valuation is based upon quoted prices for similar instruments in active markets, quoted prices for identical or similar instruments in markets that are not active, and model-based valuation techniques for which all significant assumptions are observable in the market.
Level III — Valuation is generated from model-based techniques that use significant assumptions not observable in the market. These unobservable assumptions reflect the Company’s own estimates of assumptions that market participants would use in pricing the asset.
We base our fair values on the price that would be received to sell an asset or paid to transfer a liability in an orderly transaction between market participants at the measurement date. It is our policy to maximize the use of observable
59
inputs and minimize the use of unobservable inputs when developing fair value measurements, in accordance with the fair value hierarchy in generally accepted accounting principles.
2. ADOPTION OF ACCOUNTING STANDARDS
In June 2016, the FASB issued ASU 2016-13, Financial Instruments - Credit Losses (Topic 326): Measurement of Credit Losses on Financial Instruments (ASU 2016-13) and subsequent related updates. This ASU replaces the incurred loss methodology for recognizing credit losses and requires businesses and other organizations to measure the current expected credit losses (CECL) on financial assets measured at amortized cost, including loans and held to maturity (HTM) securities, off-balance sheet credit exposures such as unfunded commitments, and other financial instruments. In addition, ASU 2016-13 requires credit losses on available for sale (AFS) debt securities to be presented as an allowance rather than as a write-down when management does not intend to sell or believes that it is not more likely than not they will be required to sell. This guidance became effective on January 1, 2023 for the Company. The results reported for periods beginning after January 1, 2023 are presented under ASU 2016-13 while prior period amounts continue to be reported in accordance with previously applicable accounting standards.
The Company adopted ASU 2016-13, and subsequent related updates, using the modified retrospective approach for all financial assets measured at amortized cost, including loans and held to maturity debt securities, as well as unfunded commitments. On January 1, 2023, the Company recorded a cumulative effect decrease to retained earnings of $
60
It should be noted that the Company expanded the pooling utilized under the legacy incurred loss method to include additional segmentation based on risk within the loan portfolio. The following table presents the impact of the change from the incurred loss model to the current expected credit loss model.
JANUARY 1, 2023 | |||||||||
| Pre-ASU 2016-13 |
| Impact of ASU 2016-13 Adoption |
| As Reported Under ASU 2016-13 | ||||
(IN THOUSANDS) | |||||||||
Assets | |||||||||
Allowance for credit losses - held to maturity securities | |||||||||
Municipal | $ | — | $ | | $ | | |||
Corporate bonds and other securities | — | | | ||||||
Allowance for credit losses - held to maturity securities | $ | — | $ | | $ | | |||
Loans, net of unearned income | |||||||||
Commercial real estate (owner occupied) | $ | | $ | | $ | | |||
Other commercial and industrial | | ( | | ||||||
Commercial real estate (non-owner occupied) - retail | — | | | ||||||
Commercial real estate (non-owner occupied) - multi-family | — | | | ||||||
Other commercial real estate (non-owner occupied) | | ( | | ||||||
Residential mortgages | | ( | | ||||||
Consumer | | | | ||||||
Loans, net of unearned income | $ | | $ | — | $ | | |||
Allowance for credit losses - loans | |||||||||
Commercial real estate (owner occupied) | $ | — | $ | | $ | | |||
Other commercial and industrial | — | | | ||||||
Commercial real estate (non-owner occupied) - retail | — | | | ||||||
Commercial real estate (non-owner occupied) - multi-family | — | | | ||||||
Other commercial real estate (non-owner occupied) | | ( | | ||||||
Commercial (owner occupied real estate and other) | | ( | — | ||||||
Residential mortgages | | ( | | ||||||
Consumer | | | | ||||||
Allocation for general risk | | ( | — | ||||||
Allowance for credit losses - loans | $ | | $ | | $ | | |||
Liabilities | |||||||||
Allowance for credit losses - unfunded commitments | $ | | $ | | $ | | |||
In summary, the adoption of ASU 2016-13 necessitated a day one increase of $
In January 2023, the Company adopted ASU 2022-02, Financial Instruments – Credit Losses (Topic 326): Troubled Debt Restructurings (TDRs) and Vintage Disclosures (ASU 2022-02), which eliminated the accounting guidance for TDRs while enhancing disclosure requirements for certain loan refinancing and restructuring activities by creditors when a borrower is experiencing financial difficulty. Specifically, rather than applying TDR recognition and measurement guidance, the Company determines whether a modification results in a new loan or continuation of an existing loan.
61
Upon adoption of this guidance, the Company no longer establishes a specific reserve for modifications to borrowers experiencing financial difficulty. Instead, these modifications are included in their respective homogenous loan pools. Additionally, the amendments of ASU 2022-02 require the Company to disclose current-period gross charge-offs by year of origination within the vintage disclosures. The vintage disclosures contain the amortized cost basis of financing receivables by credit quality indicator and class of financing receivable by year of origination. This guidance was applied on a prospective basis.
3. REVENUE RECOGNITION
ASU 2014-09, Revenue from Contracts with Customers – Topic 606, requires the Company to recognize the amount of revenue to which it expects to be entitled for the transfer of promised goods or services to customers at the time the transfer of goods or services takes place. Management determined that the primary sources of revenue associated with financial instruments, including interest and fee income on loans and interest on investments, along with certain non-interest revenue sources including net realized gains (losses) on investment securities, mortgage related fees, net gains on loans held for sale, and bank owned life insurance are not within the scope of Topic 606. These sources of revenue cumulatively comprise
Non-interest income within the scope of Topic 606 is as follows:
| ● | Wealth management fees – Wealth management fee income is primarily comprised of fees earned from the management and administration of trusts and customer investment portfolios. The Company’s performance obligation is generally satisfied over a period of time and the resulting fees are billed monthly or quarterly, based upon the month end market value of the assets under management. Payment is generally received after month end through a direct charge to customers’ accounts. Due to this delay in payment, a receivable of $ |
| ● | Service charges on deposit accounts – The Company has contracts with its deposit account customers where fees are charged for certain items or services. Service charges include account analysis fees, monthly service fees, overdraft fees, and other deposit account related fees. Revenue related to account analysis fees and service fees is recognized on a monthly basis as the Company has an unconditional right to the fee consideration. Fees attributable to specific performance obligations of the Company (i.e. overdraft fees, etc.) are recognized at a defined point in time based on completion of the requested service or transaction. |
| ● | Other non-interest income – Other non-interest income consists of other recurring revenue streams such as safe deposit box rental fees, gain (loss) on sale of other real estate owned, ATM and VISA debit card fees, and other miscellaneous revenue streams. Safe deposit box rental fees are charged to the customer on an annual basis and recognized when billed. However, if the safe deposit box rental fee is prepaid (i.e. paid prior to issuance of annual bill), the revenue is recognized upon receipt of payment. The Company has determined that since rentals and renewals occur consistently over time, revenue is recognized on a basis consistent with the duration of the performance obligation. Gains and losses on the sale of other real estate owned are recognized at the completion of the property sale when the buyer obtains control of the real estate and all the performance obligations of the Company have been satisfied. The Company offers ATM and VISA debit cards to deposit account holders which allows our customers to access their account electronically at ATMs and POS terminals. Fees related to ATM and VISA debit card transactions are recognized when the transactions are completed and the Company has satisfied it performance obligation. |
62
The following presents non-interest income, segregated by revenue streams in-scope and out-of-scope of Topic 606, for the years ended December 31, 2023, 2022, and 2021 (in thousands).
| AT DECEMBER 31, | ||||||||
| 2023 |
| 2022 |
| 2021 | ||||
Non-interest income: | |||||||||
In-scope of Topic 606 |
|
|
|
|
|
| |||
Wealth management fees | $ | | $ | | $ | | |||
Service charges on deposit accounts |
| |
| |
| | |||
Other |
| |
| |
| | |||
Non-interest income (in-scope of Topic 606) |
| |
| |
| | |||
Non-interest income (out-of-scope of Topic 606) |
| |
| |
| | |||
Total non-interest income | $ | | $ | | $ | | |||
4. CASH AND DUE FROM DEPOSITORY INSTITUTIONS
Cash and due from depository institutions totaled $
5. INVESTMENT SECURITIES
The cost basis and fair values of investment securities are summarized as follows:
Investment securities available for sale:
DECEMBER 31, 2023 | |||||||||||||||
GROSS | GROSS | ALLOWANCE | |||||||||||||
UNREALIZED | UNREALIZED | FOR CREDIT | FAIR | ||||||||||||
| COST BASIS |
| GAINS |
| LOSSES | LOSSES |
| VALUE | |||||||
(IN THOUSANDS) | |||||||||||||||
U.S. Agency | $ | | $ | — | $ | ( | $ | — | $ | | |||||
U.S. Agency mortgage-backed securities |
| |
| |
| ( | — |
| | ||||||
Municipal |
| |
| |
| ( | — |
| | ||||||
Corporate bonds |
| |
| |
| ( | ( |
| | ||||||
Total | $ | | $ | | $ | ( | $ | ( | $ | | |||||
Investment securities held to maturity:
DECEMBER 31, 2023 | |||||||||||||||
GROSS | GROSS | ALLOWANCE | |||||||||||||
UNREALIZED | UNREALIZED | FAIR | FOR CREDIT | ||||||||||||
| COST BASIS |
| GAINS |
| LOSSES | VALUE |
| LOSSES | |||||||
(IN THOUSANDS) | |||||||||||||||
U.S. Agency | $ | | $ | — | $ | ( | $ | | $ | — | |||||
U.S. Agency mortgage-backed securities | | | ( | | — | ||||||||||
Municipal |
| |
| — |
| ( |
| |
| ( | |||||
Corporate bonds and other securities |
| |
| — |
| ( |
| |
| ( | |||||
Total | $ | | $ | | $ | ( | $ | | $ | ( | |||||
63
Investment securities available for sale:
DECEMBER 31, 2022 | ||||||||||||
GROSS | GROSS | |||||||||||
UNREALIZED | UNREALIZED | FAIR | ||||||||||
| COST BASIS |
| GAINS |
| LOSSES |
| VALUE | |||||
(IN THOUSANDS) | ||||||||||||
U.S. Agency | $ | | $ | | $ | ( | $ | | ||||
U.S. Agency mortgage-backed securities |
| |
| |
| ( |
| | ||||
Municipal |
| |
| — |
| ( |
| | ||||
Corporate bonds |
| |
| |
| ( |
| | ||||
Total | $ | | $ | | $ | ( | $ | | ||||
Investment securities held to maturity:
DECEMBER 31, 2022 | ||||||||||||
GROSS | GROSS | |||||||||||
UNREALIZED | UNREALIZED | FAIR | ||||||||||
COST BASIS |
| GAINS |
| LOSSES |
| VALUE | ||||||
(IN THOUSANDS) | ||||||||||||
U.S. Agency |
| $ | | $ | — | $ | ( | $ | | |||
U.S. Agency mortgage-backed securities |
| | | ( | | |||||||
Municipal |
| |
| |
| ( |
| | ||||
Corporate bonds and other securities |
| |
| — |
| ( |
| | ||||
Total | $ | | $ | | $ | ( | $ | | ||||
The Company and its subsidiaries, collectively, did not hold securities of any single issuer, excluding U.S. agencies, that exceeded 10% of shareholders’ equity at December 31, 2023. Management conducted a review of the investment securities portfolio in order to identify exposures to issuers within foreign countries experiencing significant economic, fiscal, and/or political strains. Given the instablity and continuing military conflict between Israel and Hamas, the nation of Israel has been identified by management as significantly strained. At December 31, 2023, the Company had State of Israel Jubilee bonds within the held to maturity portfolio with an amortized cost of $
The Company realized $
The carrying value of securities, both available for sale and held to maturity, pledged to secure public and trust deposits was $
The interest rate environment and market yields can have a significant impact on the yield earned on mortgage-backed securities (MBS). Prepayment speed assumptions are an important factor to consider when evaluating the returns on an MBS. Generally, as interest rates decline, borrowers have more incentive to refinance into a lower rate, so prepayments will rise. Conversely, as interest rates increase, prepayments will decline. When an MBS is purchased at a premium, the yield will decrease as prepayments increase and the yield will increase as prepayments decrease. As of December 31, 2023, the Company had low premium risk as the book value of our mortgage-backed securities purchased at a premium was only
64
The Company’s consolidated investment securities portfolio had an effective duration of approximately
Investment securities available for sale:
AT DECEMBER 31, 2023 | |||||||||||||||
TOTAL | |||||||||||||||
|
|
|
| U.S. AGENCY | INVESTMENT | ||||||||||
MORTGAGE- | SECURITIES | ||||||||||||||
CORPORATE | BACKED | AVAILABLE | |||||||||||||
U. S. AGENCY | MUNICIPAL | BONDS | SECURITIES | FOR SALE | |||||||||||
(IN THOUSANDS) | |||||||||||||||
COST BASIS |
|
|
|
|
|
|
|
|
|
| |||||
Within 1 year | $ | |
| $ | |
| $ | |
| $ | — | $ | | ||
After 1 year but within 5 years |
| |
|
| |
|
| |
|
| |
| | ||
After 5 years but within 10 years |
| |
|
| |
|
| |
|
| |
| | ||
Over 10 years |
| |
|
| — |
|
| |
|
| |
| | ||
Total | $ | |
| $ | |
| $ | |
| $ | | $ | | ||
FAIR VALUE |
|
|
|
|
|
|
|
|
|
|
|
|
|
| |
Within 1 year | $ | |
| $ | |
| $ | $ | — | $ | | ||||
After 1 year but within 5 years |
| |
|
| |
|
|
| |
| | ||||
After 5 years but within 10 years |
| |
|
| |
|
|
| |
| | ||||
Over 10 years |
| |
|
| — |
|
|
| |
| | ||||
Total | $ | |
| $ | |
| $ | | $ | | $ | | |||
Investment securities held to maturity:
AT DECEMBER 31, 2023 | |||||||||||||||
|
|
| TOTAL | ||||||||||||
U.S. AGENCY | INVESTMENT | ||||||||||||||
CORPORATE | MORTGAGE- | SECURITIES | |||||||||||||
BONDS AND | BACKED | HELD TO | |||||||||||||
U.S. AGENCY | MUNICIPAL | OTHER | SECURITIES | MATURITY | |||||||||||
(IN THOUSANDS) | |||||||||||||||
COST BASIS |
|
|
|
|
|
|
|
|
| ||||||
Within 1 year | $ | — |
| $ | |
| $ | |
| $ | |
| $ | | |
After 1 year but within 5 years |
| — |
| |
| |
| — |
| | |||||
After 5 years but within 10 years |
| |
| |
| |
| |
| | |||||
Over 10 years |
| — |
| |
| |
| |
| | |||||
Total | $ | | $ | | $ | | $ | | $ | | |||||
FAIR VALUE |
|
|
|
|
|
|
|
|
|
|
|
|
|
| |
Within 1 year | $ | — |
| $ | |
| $ |
| $ | |
| $ | | ||
After 1 year but within 5 years |
| — |
| |
|
| — |
| | ||||||
After 5 years but within 10 years |
| |
| |
|
| |
| | ||||||
Over 10 years |
| — |
| |
|
| |
| | ||||||
Total | $ | | $ | | $ | | $ | | $ | | |||||
65
The following table summarizes the available for sale debt securities in an unrealized loss position for which an allowance for credit losses has not been recorded as of December 31, 2023, aggregated by security type and length of time in a continuous loss position (in thousands):
DECEMBER 31, 2023 | ||||||||||||||||||
LESS THAN 12 MONTHS | 12 MONTHS OR LONGER | TOTAL | ||||||||||||||||
FAIR | UNREALIZED | FAIR | UNREALIZED | FAIR | UNREALIZED | |||||||||||||
| VALUE |
| LOSSES |
| VALUE |
| LOSSES |
| VALUE |
| LOSSES | |||||||
U.S. Agency | $ | — | $ | — | $ | | $ | ( | $ | | $ | ( | ||||||
U.S. Agency mortgage-backed securities | | ( | | ( | | ( | ||||||||||||
Municipal |
| — | — | | ( | | ( | |||||||||||
Corporate bonds |
| | ( | |
| ( |
| | ( | |||||||||
Total | $ | | $ | ( | $ | | $ | ( | $ | | $ | ( | ||||||
At December 31, 2023, within the available for sale debt securities portfolio, the Company had
These unrealized losses are primarily a result of increases in market yields from the time of purchase. In general, as market yields rise, the value of securities will decrease; as market yields decrease, the fair value of securities will increase. Management generally views changes in fair value caused by changes in interest rates as temporary; therefore,
The Company recorded a $
The following table presents the activity in the allowance for credit losses on held to maturity debt securities by major security type for the year ended December 31, 2023 (in thousands).
YEAR ENDED DECEMBER 31, 2023 | ||||||||||||||||||
Balance at | Impact of Adopting | Charge- | Provision | Balance at | ||||||||||||||
December 31, 2022 | ASU 2016-13 | Offs | Recoveries | (Credit) | December 31, 2023 | |||||||||||||
U.S. Agency |
| $ | — | $ | — |
| $ | — |
| $ | — |
| $ | — |
| $ | — | |
U.S. Agency mortgage-backed securities | — | — | — | — | — | — | ||||||||||||
Municipal | — | | — | — | ( | | ||||||||||||
Corporate bonds and other securities | — | | — | — | ( | | ||||||||||||
Total | $ | — | $ | | $ | — | $ | — | $ | ( | $ | | ||||||
66
The Company’s agency and mortgage-backed securities are issued by U.S. government entities and agencies and are either explicitly or implicitly guaranteed by the U.S. government, are highly rated by major rating agencies, and have a long history of no credit losses. As such, no allowance for credit losses has been established for these securities. The allowance for credit losses on the taxable municipal, corporate, and other bonds within the held to maturity securities portfolio is calculated using the PD/LGD method. The calculation is completed on a quarterly basis using the default studies provided by an industry leading source. Additionally, based on management judgment, certain qualitative adjustments, such as the Company’s historical loss experience and/or the issuer’s credit quality, may be applied.
Maintaining investment quality is a primary objective of the Company’s investment policy which, subject to certain limited exceptions, prohibits the purchase of any investment security below a Moody’s Investors Service or Standard & Poor’s rating of A. The Company monitors the credit ratings of its debt securities on a quarterly basis. At December 31, 2023,
Specifically, the following table summarizes the amortized cost of held to maturity debt securities at December 31, 2023, aggregated by credit quality indicator (in thousands).
DECEMBER 31, 2023 | ||||||||||||
CREDIT RATING | ||||||||||||
AAA/AA/A | BBB/BB/B | UNRATED | TOTAL | |||||||||
U.S. Agency |
| $ | | $ | — |
| $ | — |
| $ | | |
U.S. Agency mortgage-backed securities | | — | — | | ||||||||
Municipal | | — | — | | ||||||||
Corporate bonds and other securities | | — | | | ||||||||
Total | $ | | $ | — | $ | | $ | | ||||
The Company had no held to maturity debt securities in non-accrual status or past due 90 days still accruing interest at December 31, 2023. The underlying issuers continue to make timely principal and interest payments on the securities.
As of December 31, 2023, 2022, and 2021, the Company reported $
6. LOANS
The segments of the Company’s loan portfolio are disaggregated into classes that allows management to monitor risk and performance. The loan classes used are consistent with the internal reports evaluated by the Company’s management and Board of Directors to monitor risk and performance within various segments of its loan portfolio. The commercial loan segment includes both the owner occupied commercial real estate loan and the other commercial and industrial loan classes. The commercial real estate loan segment includes the non-owner occupied commercial real estate loan classes of retail, multi-family, and other. The residential mortgage loan segment is comprised of first lien
67
amortizing residential mortgage loans while the consumer loan segment consists primarily of home equity loans secured by residential real estate, installment loans, and overdraft lines of credit associated with customer deposit accounts.
The loan portfolio of the Company consists of the following:
DECEMBER 31, 2023 | |||
(IN THOUSANDS) | |||
Commercial: | |||
Commercial real estate (owner occupied) (1) | $ | | |
Other commercial and industrial | | ||
Commercial real estate (non-owner occupied): |
| ||
Retail (1) | | ||
Multi-family (1) | | ||
Other (1) | | ||
Residential mortgages (1) |
| | |
Consumer |
| | |
Loans, net of unearned income | $ | | |
DECEMBER 31, 2022 | |||
(IN THOUSANDS) | |||
Commercial: | |||
Commercial and industrial | $ | | |
Paycheck Protection Program (PPP) | | ||
Commercial real estate (owner occupied) (1) |
| | |
Commercial real estate (non-owner occupied) (1) |
| | |
Residential mortgages (1) |
| | |
Consumer |
| | |
Loans, net of unearned income | $ | ||
| (1) | Real estate construction loans constituted |
Loan balances at December 31, 2023 and 2022 are net of unearned income of $
The Company has no exposure to subprime mortgage loans in either the loan or investment portfolios. The Company has no direct loan exposures to sovereign or non-sovereign (i.e. financial institutions and corporations) borrowers within foreign countries experiencing significant economic, fiscal, and/or political strains.
The Company has no significant industry lending concentrations. Specifically, as of December 31, 2023 and 2022, loans to customers engaged in similar activities and having similar economic characteristics, as defined by standard industrial classifications, did not exceed 10% of total loans. Additionally, the majority of the Company’s lending occurs within a 250-mile radius of the Johnstown market.
In the ordinary course of business, the subsidiaries have transactions, including loans, with their officers, directors, and their affiliated companies. In management’s opinion, these transactions were on substantially the same terms as those prevailing at the time for comparable transactions with unaffiliated parties and do not involve more than the normal credit risk. These loans totaled $
68
The following tables summarize the loan activity with related parties for the years ended December 31, 2023 and 2022 (in thousands).
YEAR ENDED DECEMBER 31, 2023 | ||||||||||||
BALANCE AT DECEMBER 31, 2022 | ADDITIONS | REPAYMENTS | BALANCE AT DECEMBER 31, 2023 | |||||||||
Loans to related parties | $ | | $ | | $ | | $ | | ||||
YEAR ENDED DECEMBER 31, 2022 | ||||||||||||
BALANCE AT DECEMBER 31, 2021 | ADDITIONS | REPAYMENTS | BALANCE AT DECEMBER 31, 2022 | |||||||||
Loans to related parties | $ | | $ | | $ | | $ | | ||||
7. ALLOWANCE FOR CREDIT LOSSES – LOANS
The following tables summarize the rollforward of the allowance for credit losses by loan portfolio segment for the years ended December 31, 2023, 2022, and 2021 (in thousands).
BALANCE AT | IMPACT OF | CHARGE- | PROVISION | BALANCE AT | ||||||||||||||
| DECEMBER 31, 2022 | ADOPTING ASU 2016-13 |
| OFFS |
| RECOVERIES |
| (CREDIT) |
| DECEMBER 31, 2023 | ||||||||
Commercial real estate (owner occupied) | $ | — | $ | | $ | | $ | | $ | | $ | | ||||||
Other commercial and industrial |
| — |
| |
| ( |
| |
| |
| | ||||||
Commercial real estate (non-owner occupied) - retail |
| — |
| |
| ( |
| — |
| |
| | ||||||
Commercial real estate (non-owner occupied) - multi-family |
| — |
| |
| |
| |
| |
| | ||||||
Other commercial real estate (non-owner occupied) |
| |
| ( |
| ( |
| |
| |
| | ||||||
Commercial (owner occupied real estate and other) |
| |
| ( |
| |
| — |
| — |
| — | ||||||
Residential mortgages |
| |
| ( |
| ( |
| |
| |
| | ||||||
Consumer |
| |
| |
| ( |
| |
| |
| | ||||||
Allocation for general risk |
| |
| ( |
| |
| — |
| — |
| — | ||||||
Total | $ | | $ | | $ | ( | $ | | $ | | $ | | ||||||
BALANCE AT | CHARGE- | PROVISION | BALANCE AT | ||||||||||||
| DECEMBER 31, 2021 |
| OFFS |
| RECOVERIES |
| (CREDIT) |
| DECEMBER 31, 2022 | ||||||
Commercial | $ | | $ | ( | $ | | $ | ( | $ | | |||||
Commercial real estate (non-owner occupied) |
| |
| ( |
| |
| |
| | |||||
Residential mortgages |
| |
| ( |
| |
| ( |
| | |||||
Consumer |
| |
| ( |
| |
| |
| | |||||
Allocation for general risk |
| |
| — |
| — |
| ( |
| | |||||
Total | $ | | $ | ( | $ | | $ | | $ | | |||||
BALANCE AT | CHARGE- | PROVISION | BALANCE AT | ||||||||||||
| DECEMBER 31, 2020 |
| OFFS |
| RECOVERIES |
| (CREDIT) |
| DECEMBER 31, 2021 | ||||||
Commercial | $ | | $ | ( | $ | | $ | ( | $ | | |||||
Commercial real estate (non-owner occupied) |
| |
| — |
| |
| |
| | |||||
Residential mortgages |
| |
| ( |
| |
| |
| | |||||
Consumer |
| |
| ( |
| |
| |
| | |||||
Allocation for general risk |
| |
| — |
| — |
| |
| | |||||
Total | $ | | $ | ( | $ | | $ | | $ | | |||||
The Company recorded a $
69
bankruptcy in the fourth quarter of 2023. As a result of this action, the Company updated its comprehensive evaluation of its exposure to Rite Aid throughout its loan portfolio as it received information on leases that Rite Aid either rejected or modified. This evaluation required the recognition of $
The $
The $
The following tables summarize the loan portfolio and allowance for credit losses by the primary segments of the loan portfolio.
AT DECEMBER 31, 2023 | ||||||||||||||||||||||||
COMMERCIAL | COMMERCIAL | |||||||||||||||||||||||
COMMERCIAL | REAL ESTATE | REAL ESTATE | OTHER COMMERCIAL | |||||||||||||||||||||
REAL ESTATE | OTHER COMMERCIAL | (NON-OWNER OCCUPIED) - | (NON-OWNER OCCUPIED) - | REAL ESTATE | RESIDENTIAL | |||||||||||||||||||
Loans: |
| (OWNER OCCUPIED) |
| AND INDUSTRIAL |
| RETAIL |
| MULTI-FAMILY |
| (NON-OWNER OCCUPIED) |
| MORTGAGES |
| CONSUMER |
| TOTAL | ||||||||
(IN THOUSANDS) | ||||||||||||||||||||||||
Individually evaluated | $ | | $ | | $ | | $ | | $ | | $ | | $ | | $ | | ||||||||
Collectively evaluated |
| |
| |
| |
| |
| |
| |
| |
| | ||||||||
Total loans | $ | | $ | | $ | | $ | | $ | | $ | | $ | | $ | | ||||||||
AT DECEMBER 31, 2023 | ||||||||||||||||||||||||
COMMERCIAL | COMMERCIAL | |||||||||||||||||||||||
COMMERCIAL | REAL ESTATE | REAL ESTATE | OTHER COMMERCIAL | |||||||||||||||||||||
Allowance for | REAL ESTATE | OTHER COMMERCIAL | (NON-OWNER OCCUPIED) - | (NON-OWNER OCCUPIED) - | REAL ESTATE | RESIDENTIAL | ||||||||||||||||||
credit losses: |
| (OWNER OCCUPIED) |
| AND INDUSTRIAL |
| RETAIL |
| MULTI-FAMILY |
| (NON-OWNER OCCUPIED) |
| MORTGAGES |
| CONSUMER |
| TOTAL | ||||||||
(IN THOUSANDS) | ||||||||||||||||||||||||
Specific reserve allocation | $ | | $ | | $ | | $ | | $ | | $ | | $ | | $ | | ||||||||
General reserve allocation |
| |
| |
| |
| |
| |
| |
| |
| | ||||||||
Total allowance for credit losses | $ | | $ | | $ | | $ | | $ | | $ | | $ | | $ | | ||||||||
70
AT DECEMBER 31, 2022 | |||||||||||||||
COMMERCIAL | |||||||||||||||
REAL ESTATE | RESIDENTIAL | ||||||||||||||
Loans: |
| COMMERCIAL |
| (NON-OWNER OCCUPIED) |
| MORTGAGES |
| CONSUMER |
| TOTAL | |||||
(IN THOUSANDS) | |||||||||||||||
Individually evaluated | $ | | $ | | $ | | $ | | $ | | |||||
Collectively evaluated |
| |
| |
| |
| |
| | |||||
Total loans | $ | | $ | | $ | | $ | | $ | | |||||
AT DECEMBER 31, 2022 | ||||||||||||||||||
COMMERCIAL | ||||||||||||||||||
Allowance for | REAL ESTATE | RESIDENTIAL | ALLOCATION FOR | |||||||||||||||
credit losses: | COMMERCIAL |
| (NON-OWNER OCCUPIED) |
| MORTGAGES |
| CONSUMER |
| GENERAL RISK |
| TOTAL | |||||||
(IN THOUSANDS) | ||||||||||||||||||
Specific reserve allocation |
| $ | | $ | | $ | | $ | | $ | | $ | | |||||
General reserve allocation |
| |
| |
| |
| |
| |
| | ||||||
Total allowance for credit losses | $ | | $ | | $ | | $ | | $ | | $ | | ||||||
The following table presents the amortized cost basis of collateral-dependent non-accrual loans by class of loans (in thousands).
COLLATERAL TYPE | |||
DECEMBER 31, 2023 | REAL ESTATE | ||
Commercial: | |||
Commercial real estate (owner occupied) | $ | | |
Commercial real estate (non-owner occupied): |
| ||
Other | | ||
Residential mortgages |
| | |
Total | $ | | |
Non-Performing Assets
Non-performing assets are comprised of (i) loans which are on a non-accrual basis, (ii) loans which are contractually past due 90 days or more as to interest or principal payments, and (iii) other real estate owned (OREO – real estate acquired through foreclosure and in-substance foreclosures) and repossessed assets.
Loans will be transferred to non-accrual status when, based on current information and events, it is probable that the Company will be unable to collect the scheduled payments of principal or interest when due according to the contractual terms of the loan agreement. Factors considered by management in evaluating the loan include payment status, collateral value, and the probability of collecting scheduled principal and interest payments when due. Management determines the significance of payment delays and payment shortfalls on a case-by-case basis, taking into consideration all of the circumstances surrounding the loan and the borrower, including the length of the delay, the reasons for the delay, the borrower’s prior payment record, and the amount of the shortfall in relation to the principal and interest owed. The following table presents non-accrual loans, loans past due over 90 days still accruing interest, and OREO and repossessed assets by portfolio class (in thousands).
71
AT DECEMBER 31, 2023 | ||||||||||||||||||
| NON-ACCRUAL WITH NO ACL |
| NON-ACCRUAL WITH ACL |
| TOTAL NON-ACCRUAL |
| LOANS PAST DUE OVER 90 DAYS STILL ACCRUING | OREO AND REPOSSESSED ASSETS |
| TOTAL NON-PERFORMING ASSETS | ||||||||
Commercial real estate (owner occupied) | $ | | $ | — | $ | | $ | — | $ | — | $ | | ||||||
Other commercial and industrial | — | | | | — | | ||||||||||||
Commercial real estate (non-owner occupied) - retail | — | — | — | — | — | — | ||||||||||||
Commercial real estate (non-owner occupied) - multi-family | — | — | — | — | — | — | ||||||||||||
Other commercial real estate (non-owner occupied) | | — | | — | — | | ||||||||||||
Residential mortgages | | | | — | | | ||||||||||||
Consumer | — | | | — | — | | ||||||||||||
Total | $ | | $ | | $ | | $ | | $ | | $ | | ||||||
AT DECEMBER 31, 2022 | ||||
Non-accrual loans: | ||||
Commercial and industrial | $ | | ||
Commercial real estate (non-owner occupied) | | |||
Residential mortgages |
| | ||
Consumer | | |||
Total |
| | ||
Other real estate owned and repossessed assets: |
|
| ||
Residential mortgages |
| | ||
Consumer |
| | ||
Total |
| | ||
Total non-performing assets | $ | | ||
It should be noted that the Company has elected to exclude accrued interest receivable from the measurement of its ACL. When a loan is placed in non-accrual status, any outstanding interest is reversed against interest income.
Non-performing assets increased from $
Overall, the Company has built its allowance for credit losses and maintained solid coverage of both total loans and non-performing assets at December 31, 2023 as indicated by the allowance for credit losses coverage ratio of non-performing assets at
Credit Quality Indicators
The Company categorizes loans into risk categories based on relevant information about the ability of borrowers to service their debt such as: current financial information, historical payment experience, credit documentation, public information, and current economic trends, among other factors. The Company analyzes loans individually to classify the loans as to credit risk.
Management uses a nine-point internal risk rating system to monitor the credit quality of the overall loan portfolio. The first six categories are considered not criticized. The first five pass categories are aggregated, while the pass-6, special mention, substandard and doubtful categories are disaggregated to separate pools. The criticized rating categories
72
utilized by management generally follow bank regulatory definitions. The special mention category includes assets that are currently protected but are potentially weak, resulting in an undue and unwarranted credit risk, but not to the point of justifying a substandard classification. Loans in the substandard category have well-defined weaknesses that jeopardize the liquidation of the debt, and have a distinct possibility that some loss will be sustained if the weaknesses are not corrected. Loans in the doubtful category have all the weaknesses inherent in those classified as substandard, with the added characteristic that the weaknesses make collection or liquidation in full, on the basis of currently existing facts, conditions, and values, highly questionable and improbable. All loans greater than 90 days past due, or for which any portion of the loan represents a specific allocation of the allowance for credit losses are placed in substandard or doubtful.
To help ensure that risk ratings are accurate and reflect the present and future capacity of borrowers to repay a loan as agreed, the Company has a structured loan rating process, which dictates that, at a minimum, credit reviews are mandatory for all commercial and commercial mortgage loan relationships with aggregate balances in excess of $
In addition to loan monitoring by the account officer and Loan Review Department, the Company also requires presentation of all credits rated pass-6 with aggregate balances greater than $
73
The following table presents the classes of the commercial and commercial real estate loan portfolios summarized by the aggregate pass and the criticized categories of special mention, substandard and doubtful within the internal risk rating system.
AT DECEMBER 31, 2023 | |||||||||||||||||||||||||||
REVOLVING | REVOLVING | ||||||||||||||||||||||||||
LOANS | LOANS | ||||||||||||||||||||||||||
AMORTIZED | CONVERTED | ||||||||||||||||||||||||||
TERM LOANS AMORTIZED COST BASIS BY ORIGINATION YEAR | COST | TO | |||||||||||||||||||||||||
| 2023 |
| 2022 |
| 2021 |
| 2020 |
| 2019 |
| PRIOR |
| BASIS |
| TERM |
| TOTAL | ||||||||||
(IN THOUSANDS) | |||||||||||||||||||||||||||
Commercial real estate (owner occupied) | |||||||||||||||||||||||||||
Pass | $ | | $ | | $ | | $ | | $ | | $ | | $ | | $ | — | $ | | |||||||||
Special Mention | — | — | | — | | — | | — | | ||||||||||||||||||
Substandard | — | — | — | — | — | | — | — | | ||||||||||||||||||
Doubtful | — | — | — | — | — | — | — | — | — | ||||||||||||||||||
Total | $ | | $ | | $ | | $ | | $ | | $ | | $ | | $ | — | $ | | |||||||||
Current period gross charge-offs | $ | — | $ | — | $ | — | $ | — | $ | — | $ | — | $ | — | $ | — | $ | — | |||||||||
Other commercial and industrial | |||||||||||||||||||||||||||
Pass | $ | | $ | | $ | | $ | | $ | | $ | | $ | | $ | | $ | | |||||||||
Special Mention | — | — | | — | — | — | — | — | | ||||||||||||||||||
Substandard | — | | — | — | — | | | — | | ||||||||||||||||||
Doubtful | — | — | — | — | — | — | — | — | — | ||||||||||||||||||
Total | $ | | $ | | $ | | $ | | $ | | $ | | $ | | $ | | $ | | |||||||||
Current period gross charge-offs | $ | — | $ | | $ | — | $ | — | $ | — | $ | | $ | — | $ | — | $ | | |||||||||
Commercial real estate (non-owner occupied) - retail | |||||||||||||||||||||||||||
Pass | $ | | $ | | $ | | $ | | $ | | $ | | $ | | $ | — | $ | | |||||||||
Special Mention | — | | — | — | — | | — | — | | ||||||||||||||||||
Substandard | — | — | — | — | — | — | — | — | — | ||||||||||||||||||
Doubtful | — | — | — | — | — | — | — | — | — | ||||||||||||||||||
Total | $ | | $ | | $ | | $ | | $ | | $ | | $ | | $ | — | $ | | |||||||||
Current period gross charge-offs | $ | — | $ | — | $ | — | $ | — | $ | — | $ | | $ | — | $ | — | $ | | |||||||||
Commercial real estate (non-owner occupied) - multi-family | |||||||||||||||||||||||||||
Pass | $ | | $ | | $ | | $ | | $ | | $ | | $ | | $ | — | $ | | |||||||||
Special Mention | — | — | — | — | — | — | — | — | — | ||||||||||||||||||
Substandard | — | — | — | | | | — | — | | ||||||||||||||||||
Doubtful | — | — | — | — | — | — | — | — | — | ||||||||||||||||||
Total | $ | | $ | | $ | | $ | | $ | | $ | | $ | | $ | — | $ | | |||||||||
Current period gross charge-offs | $ | — | $ | — | $ | — | $ | — | $ | — | $ | — | $ | — | $ | — | $ | — | |||||||||
Other commercial real estate (non-owner occupied) | |||||||||||||||||||||||||||
Pass | $ | | $ | | $ | | $ | | $ | | $ | | $ | | $ | — | $ | | |||||||||
Special Mention | — | — | — | — | — | | — | — | | ||||||||||||||||||
Substandard | — | | — | — | | | — | | | ||||||||||||||||||
Doubtful | — | — | — | — | — | — | — | — | — | ||||||||||||||||||
Total | $ | | $ | | $ | | $ | | $ | | $ | | $ | | $ | | $ | | |||||||||
Current period gross charge-offs | $ | — | $ | — | $ | — | $ | — | $ | | $ | — | $ | — | $ | — | $ | | |||||||||
Total by risk rating |
| ||||||||||||||||||||||||||
Pass | $ | | $ | | $ | | $ | | $ | | $ | | $ | | $ | | $ | | |||||||||
Special Mention | — | | | — | | | | — | | ||||||||||||||||||
Substandard | — | | — | | | | | | | ||||||||||||||||||
Doubtful | — | — | — | — | — | — | — | — | — | ||||||||||||||||||
Total | $ | | $ | | $ | | $ | | $ | | $ | | $ | | $ | | $ | | |||||||||
Current period gross charge-offs | $ | — | $ | | $ | — | $ | — | $ | | $ | | $ | — | $ | — | $ | | |||||||||
74
AT DECEMBER 31, 2022 | |||||||||||||||
SPECIAL | |||||||||||||||
| PASS |
| MENTION |
| SUBSTANDARD |
| DOUBTFUL |
| TOTAL | ||||||
(IN THOUSANDS) | |||||||||||||||
Commercial and industrial | $ | | $ | — | $ | | $ | — | $ | | |||||
Paycheck Protection Program (PPP) | | — | — | — | | ||||||||||
Commercial real estate (owner occupied) |
| |
| — |
| |
| — |
| | |||||
Commercial real estate (non-owner occupied) |
| |
| |
| |
| |
| | |||||
Total | $ | | $ | | $ | | $ | | $ | | |||||
It is generally the policy of the Bank that the outstanding balance of any residential mortgage or home equity loan that exceeds 90-days past due as to principal and/or interest is transferred to non-accrual status and an evaluation is completed to determine the fair value of the collateral less selling costs, unless the balance is minor. A charge-down is recorded for any deficiency balance determined from the collateral evaluation. It is generally the policy of the Bank that the outstanding balance of any unsecured consumer loan that exceeds 90-days past due as to principal and/or interest is charged-off. Loans past due 90 days or more and loans in non-accrual status are considered non-performing. The following tables present the performing and non-performing outstanding balances of the residential mortgage and consumer loan portfolio classes.
AT DECEMBER 31, 2023 | |||||||||||||||||||||||||||
REVOLVING | REVOLVING | ||||||||||||||||||||||||||
LOANS | LOANS | ||||||||||||||||||||||||||
AMORTIZED | CONVERTED | ||||||||||||||||||||||||||
TERM LOANS AMORTIZED COST BASIS BY ORIGINATION YEAR | COST | TO | |||||||||||||||||||||||||
| 2023 |
| 2022 |
| 2021 |
| 2020 |
| 2019 |
| PRIOR |
| BASIS |
| TERM |
| TOTAL | ||||||||||
(IN THOUSANDS) | |||||||||||||||||||||||||||
Residential mortgages | |||||||||||||||||||||||||||
Performing | $ | | $ | | $ | | $ | | $ | | $ | | $ | — | $ | — | $ | | |||||||||
Non-performing | — | — | — | — | — | | — | — | | ||||||||||||||||||
Total | $ | | $ | | $ | | $ | | $ | | $ | | $ | — | $ | — | $ | | |||||||||
Current period gross charge-offs | $ | — | $ | — | $ | — | $ | — | $ | — | $ | | $ | — | $ | — | $ | | |||||||||
Consumer | |||||||||||||||||||||||||||
Performing | $ | | $ | | $ | | $ | | $ | | $ | | $ | | $ | | $ | | |||||||||
Non-performing | | — | — | | | | | | | ||||||||||||||||||
Total | $ | | $ | | $ | | $ | | $ | | $ | | $ | | $ | | $ | | |||||||||
Current period gross charge-offs | $ | | $ | | $ | | $ | | $ | | $ | | $ | — | $ | — | $ | | |||||||||
Total by payment performance |
| ||||||||||||||||||||||||||
Performing | $ | | $ | | $ | | $ | | $ | | $ | | $ | | $ | | $ | | |||||||||
Non-performing | | — | — | | | | | | | ||||||||||||||||||
Total | $ | | $ | | $ | | $ | | $ | | $ | | $ | | $ | | $ | | |||||||||
Current period gross charge-offs | $ | | $ | | $ | | $ | | $ | | $ | | $ | — | $ | — | $ | | |||||||||
AT DECEMBER 31, 2022 | |||||||||
|
| NON- |
| ||||||
| PERFORMING |
| PERFORMING |
| TOTAL | ||||
(IN THOUSANDS) | |||||||||
Residential mortgages | $ | | $ | | $ | | |||
Consumer |
| |
| | | ||||
Total | $ | | $ | | $ | | |||
75
Management further monitors the performance and credit quality of the loan portfolio by analyzing the age of the portfolio as determined by the length of time a recorded payment is past due. The following tables present the classes of the loan portfolio summarized by the aging categories of performing loans and non-accrual loans.
AT DECEMBER 31, 2023 | ||||||||||||||||||
30 – 59 | 60 – 89 | |||||||||||||||||
DAYS | DAYS | 90 DAYS | TOTAL | TOTAL | ||||||||||||||
| CURRENT |
| PAST DUE |
| PAST DUE |
| PAST DUE |
| PAST DUE |
| LOANS | |||||||
(IN THOUSANDS) | ||||||||||||||||||
Commercial real estate (owner occupied) | $ | | $ | — | $ | — | $ | | $ | | $ | | ||||||
Other commercial and industrial | | | | | | | ||||||||||||
Commercial real estate (non-owner occupied) - retail |
| |
| — | — |
| — |
| — | | ||||||||
Commercial real estate (non-owner occupied) - multi-family |
| |
| — | — |
| — |
| — | | ||||||||
Other commercial real estate (non-owner occupied) | | — | — | | | | ||||||||||||
Residential mortgages |
| |
| | |
| |
| | | ||||||||
Consumer |
| |
| |
| |
| |
| | | |||||||
Total | $ | | $ | | $ | | $ | | $ | | $ | | ||||||
AT DECEMBER 31, 2022 | ||||||||||||||||||
| ||||||||||||||||||
30 – 59 | 60 – 89 | |||||||||||||||||
DAYS | DAYS | 90 DAYS | TOTAL | TOTAL | ||||||||||||||
| CURRENT |
| PAST DUE |
| PAST DUE |
| PAST DUE |
| PAST DUE |
| LOANS | |||||||
(IN THOUSANDS) | ||||||||||||||||||
Commercial and industrial | $ | | $ | | $ | | $ | — | $ | | $ | | ||||||
Paycheck Protection Program (PPP) | | — | — | — | — | | ||||||||||||
Commercial real estate (owner occupied) |
| |
| | — |
| — |
| | | ||||||||
Commercial real estate (non-owner occupied) |
| |
| | — |
| — |
| | | ||||||||
Residential mortgages |
| |
| | |
| |
| | | ||||||||
Consumer |
| |
| |
| |
| |
| | | |||||||
Total | $ | | $ | | $ | | $ | | $ | | $ | | ||||||
76
Loan Modifications to Borrowers Experiencing Financial Difficulty
Occasionally, the Company modifies loans to borrowers experiencing financial difficulty as a result of our loss mitigation activities. A variety of solutions are offered to borrowers, including loan modifications that may result in principal forgiveness, interest rate reductions, term extensions, payment delays, or combinations thereof.
| ● | Principal forgiveness includes principal and accrued interest forgiveness. When principal forgiveness is provided, the amount of forgiveness is charged-off against the ACL. |
| ● | Interest rate reductions include modifications where the interest rate is reduced and interest is deferred. |
| ● | Term extensions extend the original contractual maturity date of the loan. |
| ● | Payment delays consist of modifications where we expect to collect the contractual amounts due, but result in a delay in the receipt of payments specified under the original loan terms. We generally consider payment delays to be insignificant when the delay is three months or less. |
The following table summarizes the amortized cost basis, as of December 31, 2023, of loans modified to borrowers experiencing financial difficulty during the year ended December 31, 2023 (in thousands).
TERM EXTENSION | |||||||
| AMORTIZED COST BASIS |
| % OF TOTAL CLASS OF LOANS |
| |||
Residential mortgages | $ | | % | ||||
Total | $ | | |||||
COMBINATION - INTEREST RATE REDUCTION AND TERM EXTENSION | |||||||
| AMORTIZED COST BASIS |
| % OF TOTAL CLASS OF LOANS |
| |||
Other commercial real estate (non-owner occupied) | $ | | % | ||||
Total | $ | | |||||
At December 31, 2023, the Company had no unfunded loan commitments associated with the loan modifications to borrowers experiencing financial difficulty.
The following table describes the financial effect of the modifications made to borrowers experiencing financial difficulty during the year ended December 31, 2023.
TERM EXTENSION | ||
LOAN TYPE |
| FINANCIAL EFFECT |
Residential mortgages | During the fourth quarter, provided a maturity date extension of approximately | |
COMBINATION - INTEREST RATE REDUCTION AND TERM EXTENSION | ||
LOAN TYPE |
| FINANCIAL EFFECT |
Other commercial real estate (non-owner occupied) | During the second quarter, provided | |
77
The Company closely monitors the performance of the loans that are modified to borrowers experiencing financial difficulty to understand the effectiveness of its modification efforts. During 2023, there was an additional loan modification made to a borrower experiencing financial difficulty in the form of a term extension. This non-accrual, other commercial and industrial loan, in the amount of $
The following table details the loans modified as troubled debt restructurings (TDR) during the year ended December 31, 2022 (dollars in thousands).
Loans in non-accrual status | # of Loans |
| Current Balance |
| Concession Granted | ||
Commercial and industrial |
| | $ | |
| ||
Commercial real estate (non-owner occupied) |
| | $ | |
| ||
8. PREMISES AND EQUIPMENT
An analysis of premises and equipment follows:
AT DECEMBER 31, | ||||||
| 2023 |
| 2022 | |||
(IN THOUSANDS) | ||||||
Land | $ | | $ | | ||
Premises |
| |
| | ||
Furniture and equipment |
| |
| | ||
Leasehold improvements |
| |
| | ||
Total at cost |
| |
| | ||
Less: Accumulated depreciation and amortization |
| |
| | ||
Premises and equipment, net | $ | | $ | | ||
The Company recorded depreciation and amortization expense of $
The Company utilizes a contract cleaner to provide janitorial services for several office locations. The contract cleaner is owned by a Director of the Company. The amount paid to this related party totaled $
9. LEASE COMMITMENTS
The Company has operating and financing leases for several office locations and equipment. Several assumptions and judgments were made when applying the requirements of ASC 842, to the Company’s lease commitments, including the allocation of consideration in the contracts between lease and non-lease components, determination of the lease term, and determination of the discount rate used in calculating the present value of the lease payments. See Note 1 for information on policy elections.
78
The following table presents the lease cost associated with both operating and financing leases for the years ended December 31, 2023, 2022, and 2021.
YEAR ENDED DECEMBER 31, | |||||||||
2023 | 2022 | 2021 | |||||||
(IN THOUSANDS) | |||||||||
Lease cost |
|
| |||||||
Financing lease cost: |
|
| |||||||
Amortization of right-of-use asset | $ | | $ | | $ | | |||
Interest expense |
| |
| |
| | |||
Operating lease cost | | | | ||||||
Total lease cost | $ | | $ | | $ | | |||
The following table presents the weighted-average remaining lease term and discount rate for the leases outstanding at December 31, 2023 and 2022.
| AT DECEMBER 31, | |||||||||||
2023 | 2022 | |||||||||||
| OPERATING |
| FINANCING | OPERATING |
| FINANCING | ||||||
Weighted-average remaining term (years) |
|
|
| |||||||||
Weighted-average discount rate |
| | % | | % | | % | | % | |||
The following table presents the undiscounted cash flows due related to operating and financing leases as of December 31, 2023 and 2022, along with a reconciliation to the discounted amount recorded on the Consolidated Balance Sheets.
DECEMBER 31, 2023 | ||||||
| OPERATING |
| FINANCING | |||
(IN THOUSANDS) | ||||||
Undiscounted cash flows due in: | ||||||
2024 | $ | | $ | | ||
2025 |
| |
| | ||
2026 |
| |
| | ||
2027 |
| |
| | ||
2028 |
| |
| | ||
Thereafter |
| |
| | ||
Total undiscounted cash flows |
| |
| | ||
Discount on cash flows |
| ( |
| ( | ||
Total lease liabilities | $ | | $ | | ||
DECEMBER 31, 2022 | ||||||
| OPERATING |
| FINANCING | |||
(IN THOUSANDS) | ||||||
Undiscounted cash flows due in: | ||||||
2023 | $ | | $ | | ||
2024 |
| |
| | ||
2025 |
| |
| | ||
2026 |
| |
| | ||
2027 |
| |
| | ||
Thereafter |
| |
| | ||
Total undiscounted cash flows |
| |
| | ||
Discount on cash flows |
| ( |
| ( | ||
Total lease liabilities | $ | | $ | | ||
79
The Company leases approximately
10. DEPOSITS
The following table sets forth the balance of the Company’s deposits:
AT DECEMBER 31, | ||||||
| 2023 |
| 2022 | |||
(IN THOUSANDS) | ||||||
Demand: |
|
|
|
| ||
Non-interest bearing | $ | | $ | | ||
Interest bearing |
| |
| | ||
Savings |
| |
| | ||
Money market |
| |
| | ||
Time deposits (1) |
| |
| | ||
Total deposits | $ | | $ | | ||
| (1) | Time deposits include certificates of deposit (CDs) and individual retirement accounts (IRAs). |
The following table sets forth the balance of time deposits as of December 31, 2023 maturing in the periods presented:
YEAR: |
| TIME DEPOSITS |
| |
| (IN THOUSANDS) | |||
2024 | $ | | ||
2025 |
| | ||
2026 |
| | ||
2027 |
| | ||
2028 |
| | ||
2029 and after |
| | ||
Total | $ | | ||
The aggregate amount of time deposits that exceed the FDIC insurance limit of $250,000 at December 31, 2023 and 2022 are $
The amount of related party deposits totaled $
80
11. SHORT-TERM BORROWINGS
Short-term borrowings, which consist of federal funds purchased and other short-term borrowings are summarized as follows:
AT DECEMBER 31, 2023 |
| ||||||
| FEDERAL |
|
| ||||
FUNDS | SHORT-TERM |
| |||||
| PURCHASED |
| BORROWINGS |
| |||
(IN THOUSANDS, EXCEPT RATES) |
| ||||||
Balance | $ | — | $ | | |||
Maximum balance at any month end |
| — |
| | |||
Average balance during year |
| |
| | |||
Average rate paid for the year |
| | % |
| | % | |
Interest rate on year-end balance |
| — |
| | |||
AT DECEMBER 31, 2022 |
| ||||||
| FEDERAL |
|
| ||||
FUNDS | SHORT-TERM |
| |||||
| PURCHASED |
| BORROWINGS |
| |||
(IN THOUSANDS, EXCEPT RATES) |
| ||||||
Balance | $ | | $ | | |||
Maximum balance at any month end |
| — |
| | |||
Average balance during year |
| |
| | |||
Average rate paid for the year |
| | % |
| | % | |
Interest rate on year-end balance |
| — |
| | |||
Average amounts outstanding during the year represent daily averages. Average interest rates represent interest expense divided by the related average balances.
These borrowing transactions have an average maturity of overnight.
12. ADVANCES FROM FEDERAL HOME LOAN BANK AND SUBORDINATED DEBT
Advances from the Federal Home Loan Bank (FHLB) consist of the following:
| AT DECEMBER 31, 2023 | ||||
WEIGHTED | |||||
| AVERAGE YIELD |
| BALANCE | ||
MATURING | (IN THOUSANDS, EXCEPT RATES) | ||||
2024 |
| | % | $ | |
2025 |
| |
| | |
2026 |
| |
| | |
2027 |
| |
| | |
2028 |
| |
| | |
Total advances from FHLB |
| | $ | | |
| AT DECEMBER 31, 2022 | ||||
WEIGHTED | |||||
| AVERAGE YIELD |
| BALANCE | ||
MATURING | (IN THOUSANDS, EXCEPT RATES) | ||||
2023 |
| | % | $ | |
2024 |
| |
| | |
Total advances from FHLB |
| | $ | | |
81
The Company’s subsidiary Bank is a member of the FHLB which provides this subsidiary with the opportunity to obtain short to longer-term advances based upon the Company’s investment in assets secured by one- to four-family residential real estate and certain types of commercial and commercial real estate loans. The rate on open repo plus advances, which are typically overnight borrowings, can change daily, while the rates on the advances are fixed until the maturity of the advance. All FHLB stock along with an interest in certain residential mortgage, commercial real estate, and commercial and industrial loans with an aggregate statutory value equal to the amount of the advances, are pledged as collateral to the FHLB of Pittsburgh to support these borrowings. At December 31, 2023, the Company had immediately available $
Subordinated Debt:
On August 26, 2021, the Company completed a private placement of $
The Company used approximately $
13. DISCLOSURES ABOUT FAIR VALUE MEASUREMENTS
The following disclosures establish a hierarchal disclosure framework associated with the level of pricing observability utilized in measuring assets and liabilities at fair value. Financial assets and liabilities are classified in their entirety based on the lowest level of input that is significant to the fair value measurement. The three broad levels defined within this hierarchy are as follows:
Level I: Quoted prices are available in active markets for identical assets or liabilities as of the reported date.
Level II: Pricing inputs are other than the quoted prices in active markets, which are either directly or indirectly observable as of the reported date. The nature of these assets and liabilities includes items for which quoted prices are available but traded less frequently and items that are fair-valued using other financial instruments, the parameters of which can be directly observed.
Level III: Assets and liabilities that have little to no pricing observability as of the reported date. These items do not have two-way markets and are measured using management’s best estimate of fair value, where the inputs into the determination of fair value require significant management judgment or estimation.
Assets and Liabilities Measured and Recorded on a Recurring Basis
Equity securities are reported at fair value utilizing Level 1 inputs. These securities are mutual funds held within a rabbi trust for the Company’s executive deferred compensation plan. The mutual funds held are open-end funds that are registered with the Securities and Exchange Commission. These funds are required to publish their daily net asset value and to transact at that price.
Securities classified as available for sale are reported at fair value utilizing Level 2 inputs. For these securities, the Company obtains fair value measurements from an independent pricing service. The fair value measurements consider
82
observable data that may include dealer quoted market spreads, cash flows, the U.S. Treasury yield curve, live trading levels, trade execution data, market consensus prepayment speeds, credit information and the bond’s terms and conditions, among other things. It should be noted that available for sale securities are reported at fair value, net of any related allowance for credit losses.
The fair values of the simultaneous interest rate swaps and the interest rate hedge used for interest rate risk management and the risk participation agreements associated with certain commercial real estate loans are based on an external derivative valuation model using data inputs from similar transactions as of the valuation date and classified Level 2.
The following table presents the assets and liabilities measured and reported on the Consolidated Balance Sheets on a recurring basis at their fair value as of December 31, 2023 and 2022 by level within the fair value hierarchy (in thousands).
FAIR VALUE MEASUREMENTS AT DECEMBER 31, 2023 | ||||||||||||
| TOTAL |
| (LEVEL 1) |
| (LEVEL 2) |
| (LEVEL 3) | |||||
Equity securities (1) | $ | | $ | | $ | — | $ | — | ||||
Available for sale securities: | ||||||||||||
U.S. Agency |
| |
| |
| |
| | ||||
U.S. Agency mortgage-backed securities | | — | | — | ||||||||
Municipal |
| |
| |
| |
| | ||||
Corporate bonds |
| |
| |
| |
| | ||||
| |
| |
| |
| | |||||
| ( |
| — |
| ( |
| — | |||||
| ( |
| — |
| ( |
| — | |||||
Risk participation agreement (2) |
| ( |
| |
| ( |
| | ||||
FAIR VALUE MEASUREMENTS AT DECEMBER 31, 2022 | ||||||||||||
| TOTAL |
| (LEVEL 1) |
| (LEVEL 2) |
| (LEVEL 3) | |||||
Equity securities (1) | $ | | $ | | $ | — | $ | — | ||||
Available for sale securities: | ||||||||||||
U.S. Agency |
| |
| — |
| |
| — | ||||
U.S. Agency mortgage-backed securities | | — | | — | ||||||||
Municipal |
| |
| — |
| |
| — | ||||
Corporate bonds |
| |
| — |
| |
| — | ||||
| |
| — |
| |
| — | |||||
| ( |
| — |
| ( |
| — | |||||
Risk participation agreement (2) |
| — |
| — |
| — |
| — | ||||
| (1) | Included within other assets on the Consolidated Balance Sheets. |
| (2) | Included within other liabilities on the Consolidated Balance Sheets. |
Assets Measured and Recorded on a Non-Recurring Basis
The Company evaluates individual loans for expected credit losses when those loans do not share similar risk characteristics with loans evaluated using a collective (pooled) basis. Individually evaluated loans are reported at the fair value of the underlying collateral if the repayment is expected solely from the collateral. Collateral values are estimated using Level 3 inputs based on observable market data which at times are discounted using unobservable inputs. At December 31, 2023, the Company had
Other real estate owned is measured at fair value based on appraisals, less estimated costs to sell at the date of foreclosure. The Bank’s internal Collections and Assigned Risk Department estimates the fair value of repossessed
83
assets, such as vehicles and equipment, using a formula driven analysis based on automobile or other industry data, less estimated costs to sell at the time of repossession. Valuations are periodically performed by management and the assets are carried at the lower of carrying amount or fair value, less costs to sell. Income and expenses from operations and changes in valuation allowance are included in the net expenses from OREO and repossessed assets.
Assets measured and recorded at fair value on a non-recurring basis are summarized below (in thousands, except range data):
FAIR VALUE MEASUREMENTS AT DECEMBER 31, 2023 | ||||||||||||
TOTAL | (LEVEL 1) |
| (LEVEL 2) |
| (LEVEL 3) | |||||||
Other real estate owned and repossessed assets |
| |
| |
| |
| | ||||
FAIR VALUE MEASUREMENTS AT DECEMBER 31, 2022 | ||||||||||||
| TOTAL |
| (LEVEL 1) |
| (LEVEL 2) |
| (LEVEL 3) | |||||
Impaired loans | $ | | $ | | $ | | $ | | ||||
Other real estate owned and repossessed assets |
| |
| |
| |
| | ||||
Quantitative Information About Level 3 Fair Value Measurements |
| |||||||||
Valuation | Unobservable | |||||||||
DECEMBER 31, 2023 |
| Fair Value |
| Techniques |
| Input |
| Range (Wgtd Avg) |
| |
Other real estate owned and repossessed assets |
| |
| Appraisal of |
| Appraisal |
| |||
|
|
| collateral (1) |
| adjustments (2) |
| ||||
Liquidation | ||||||||||
expenses | ||||||||||
Quantitative Information About Level 3 Fair Value Measurements |
| |||||||||
Valuation | Unobservable | |||||||||
DECEMBER 31, 2022 |
| Fair Value |
| Techniques |
| Input |
| Range (Wgtd Avg) |
| |
Impaired loans |
| $ | |
| of |
|
| |||
|
|
| collateral (1) |
| adjustments (2) |
| ||||
Other real estate owned and repossessed assets |
|
| |
| of |
|
| |||
collateral (1) | adjustments (2) | |||||||||
Liquidation | ||||||||||
expenses | ||||||||||
| (1) | Fair Value is generally determined through independent appraisals of the underlying collateral, which generally include various level 3 inputs which are not identifiable. Also includes qualitative adjustments by management and estimated liquidation expenses. |
| (2) | Appraisals may be adjusted by management for qualitative factors such as economic conditions. |
14. DISCLOSURES ABOUT FAIR VALUE OF FINANCIAL INSTRUMENTS
For the Company, as for most financial institutions, approximately
Fair values have been determined by the Company using independent third party valuations that use the best available data (Level 2) and an estimation methodology (Level 3) the Company believes is suitable for each category of financial instruments. Management believes that cash and cash equivalents, bank owned life insurance, regulatory stock, accrued interest receivable and payable, deposits with no stated maturities, and short-term borrowings have fair values which approximate the recorded carrying values. The fair value measurements for all of these financial instruments are Level 1 measurements.
84
The estimated fair values based on US GAAP measurements and recorded carrying values at December 31, 2023 and 2022, for the remaining financial instruments not required to be reported at fair value were as follows:
AT DECEMBER 31, 2023 | |||||||||||||||
| Carrying |
|
|
|
| ||||||||||
Value | Fair Value | (Level 1) | (Level 2) | (Level 3) | |||||||||||
(IN THOUSANDS) | |||||||||||||||
FINANCIAL ASSETS: |
|
|
|
|
|
|
|
|
|
| |||||
Investment securities – HTM | $ | | $ | | $ | — | $ | | $ | | |||||
Loans held for sale |
| | | |
| — |
| — | |||||||
Loans, net of allowance for credit losses and unearned income |
| | | — |
| — |
| | |||||||
FINANCIAL LIABILITIES: |
|
|
|
|
|
|
|
|
|
| |||||
Deposits with stated maturities | | | — | — | | ||||||||||
All other borrowings (1) |
| |
| |
| — |
| — |
| | |||||
AT DECEMBER 31, 2022 | |||||||||||||||
| Carrying | ||||||||||||||
Value |
| Fair Value |
| (Level 1) |
| (Level 2) |
| (Level 3) | |||||||
(IN THOUSANDS) | |||||||||||||||
FINANCIAL ASSETS: | |||||||||||||||
Investment securities – HTM | $ | | $ | | $ | — | $ | | $ | | |||||
Loans held for sale |
| | | |
| — |
| — | |||||||
Loans, net of allowance for credit losses and unearned income |
| | | — |
| — |
| | |||||||
FINANCIAL LIABILITIES: |
|
|
|
|
|
|
|
|
|
| |||||
Deposits with stated maturities | | | — | — | | ||||||||||
All other borrowings (1) |
| |
| |
| — |
| — |
| | |||||
| (1) | All other borrowings include advances from Federal Home Loan Bank and subordinated debt. |
Changes in assumptions or estimation methodologies may have a material effect on these estimated fair values. The Company’s remaining assets and liabilities which are not considered financial instruments have not been valued differently than has been customary under historical cost accounting.
15. INCOME TAXES
The expense for income taxes is summarized below and includes both federal and applicable state corporate income taxes:
YEAR ENDED DECEMBER 31, | |||||||||
| 2023 |
| 2022 |
| 2021 | ||||
(IN THOUSANDS) | |||||||||
Current | $ | ( | $ | | $ | | |||
Deferred |
| ( |
| |
| | |||
Income tax expense (benefit) | $ | ( | $ | | $ | | |||
85
The reconciliation between the federal statutory tax rate and the Company’s effective consolidated income tax rate is as follows:
YEAR ENDED DECEMBER 31, |
| |||||||||||||||
2023 | 2022 | 2021 |
| |||||||||||||
| AMOUNT |
| RATE |
| AMOUNT |
| RATE |
| AMOUNT |
| RATE |
| ||||
(IN THOUSANDS, EXCEPT PERCENTAGES) |
| |||||||||||||||
Income tax expense (benefit) based on federal statutory rate | $ | ( |
| | % | $ | |
| | % | $ | |
| | % | |
Tax exempt income |
| ( |
| |
| ( |
| ( |
| ( |
| ( | ||||
Other |
| |
| ( |
| |
| |
| |
| | ||||
Total expense (benefit) for income taxes | $ | ( |
| | % | $ | |
| | % | $ | |
| | % | |
The following table highlights the major components comprising the deferred tax assets and liabilities for each of the periods presented:
AT DECEMBER 31, | ||||||
| 2023 |
| 2022 | |||
(IN THOUSANDS) | ||||||
DEFERRED TAX ASSETS: |
|
| ||||
Allowance for credit losses - loans | $ | | $ | | ||
Allowance for credit losses - securities |
| |
| — | ||
Allowance for credit losses - unfunded commitments |
| |
| | ||
Unrealized investment security losses |
| |
| | ||
Premises and equipment |
| |
| | ||
Lease liabilities | | | ||||
Interest rate hedges |
| |
| — | ||
Other |
| |
| | ||
Total tax assets |
| |
| | ||
DEFERRED TAX LIABILITIES: |
|
| ||||
Investment accretion |
| ( |
| ( | ||
Lease right-of-use assets | ( | ( | ||||
Accrued pension obligation | ( | ( | ||||
Other |
| ( |
| ( | ||
Total tax liabilities |
| ( |
| ( | ||
Net deferred tax asset | $ | | $ | | ||
At December 31, 2023 and 2022, the Company had
The Company utilizes a recognition threshold and a measurement attribute for the financial statement recognition and measurement of a tax position taken or expected to be taken in a tax return. Benefits from tax positions should be recognized in the financial statements only when it is more likely than not that the tax position will be sustained upon examination by the appropriate taxing authority that would have full knowledge of all relevant information. A tax position that meets the more-likely-than-not recognition threshold is measured at the largest amount of benefit that is greater than fifty percent likely of being realized upon ultimate settlement. Tax positions that previously failed to meet the more-likely-than-not recognition threshold should be recognized in the first subsequent financial reporting period in which that threshold is met. Previously recognized tax positions that no longer meet the more-likely-than-not recognition threshold should be derecognized in the first subsequent financial reporting period in which that threshold is no longer met. The Company has
86
16. EMPLOYEE BENEFIT PLANS
PENSION PLAN:
The Company has a noncontributory defined benefit pension plan covering certain employees who work at least
PENSION BENEFITS:
YEAR ENDED DECEMBER 31, | ||||||
| 2023 |
| 2022 | |||
(IN THOUSANDS) | ||||||
CHANGE IN BENEFIT OBLIGATION: |
|
|
|
| ||
Benefit obligation at beginning of year | $ | | $ | | ||
Service cost |
| | | |||
Interest cost |
| | | |||
Actuarial loss (gain) |
| | ( | |||
Settlements |
| — | ( | |||
Benefits paid |
| ( | ( | |||
Benefit obligation at end of year |
| | | |||
CHANGE IN PLAN ASSETS: |
|
|
|
| ||
Fair value of plan assets at beginning of year |
| | | |||
Actual return on plan assets |
| | ( | |||
Employer contributions |
| — | | |||
Settlements |
| — | ( | |||
Benefits paid |
| ( | ( | |||
Fair value of plan assets at end of year |
| | | |||
Funded status of the plan | $ | | $ | | ||
YEAR ENDED DECEMBER 31, | ||||||
| 2023 |
| 2022 | |||
(IN THOUSANDS) | ||||||
AMOUNTS NOT YET RECOGNIZED AS A COMPONENT OF NET PERIODIC PENSION COST: |
|
|
| |||
Amounts recognized in accumulated other comprehensive loss consists of: |
|
|
| |||
Net actuarial loss | $ | | $ | | ||
Total | $ | | $ | | ||
87
YEAR ENDED DECEMBER 31, | ||||||
| 2023 |
| 2022 | |||
(IN THOUSANDS) | ||||||
ACCUMULATED BENEFIT OBLIGATION: |
|
|
|
| ||
Accumulated benefit obligation | $ | | $ | | ||
The weighted-average assumptions used to determine benefit obligations at December 31, 2023 and 2022 were as follows:
YEAR ENDED DECEMBER 31, |
| ||||
| 2023 |
| 2022 |
| |
WEIGHTED AVERAGE ASSUMPTIONS: |
|
|
|
| |
Discount rate |
| | % | | % |
Salary scale | |||||
Ages 25-34 | | | |||
Ages 35-44 | | | |||
Ages 45-54 | | | |||
Ages 55+ |
| |
| | |
YEAR ENDED DECEMBER 31, | |||||||||
| 2023 |
| 2022 |
| 2021 | ||||
(IN THOUSANDS) | |||||||||
COMPONENTS OF NET PERIODIC BENEFIT COST: |
|
|
|
|
| ||||
Service cost | $ | | $ | | $ | | |||
Interest cost |
| |
| |
| | |||
Expected return on plan assets |
| ( |
| ( |
| ( | |||
Amortization of net loss |
| |
| |
| | |||
Settlement charge |
| — |
| |
| | |||
Net periodic pension (benefit) cost | $ | ( | $ | | $ | | |||
The service cost component of net periodic benefit cost is included in salaries and employee benefits and all other components of net periodic benefit cost are included in other expense on the Consolidated Statements of Operations.
The reduced pension expense in 2023 reflects the retirement of a larger than typical number of employees over the past two years who chose to take a lump sum payment instead of receiving future monthly annuity payments. These individuals are no longer included in the pension plan which therefore favorably impacts the Company’s basic pension expense. Additionally, the Company recognized a settlement charge in connection with its defined benefit pension plan of $
Note that pension settlement charges are dependent upon the level of national interest rates from the previous year and the impact that interest rates have on lump sum distributions to those employees eligible to retire. Pension settlement charges are also dependent upon the choice of retiring employees to either take a lump sum distribution or receive future monthly annuity payments.
The accrued pension liability, which had a positive (debit) balance of $
88
balance of the accrued pension liability continues to be a positive value as a result of Company contributions to the plan and the revaluation of the obligation.
YEAR ENDED DECEMBER 31, | |||||||||
| 2023 |
| 2022 |
| 2021 | ||||
(IN THOUSANDS) | |||||||||
OTHER CHANGES IN PLAN ASSETS AND BENEFIT OBLIGATIONS RECOGNIZED IN OTHER COMPREHENSIVE LOSS |
|
|
|
|
| ||||
Net (gain) loss | $ | ( | $ | | $ | ( | |||
Recognized loss |
| ( |
| ( |
| ( | |||
Total recognized in other comprehensive loss before tax effect | $ | ( | $ | | $ | ( | |||
Total recognized in net benefit cost and other comprehensive loss before tax effect | $ | ( | $ | | $ | ( | |||
For the year ended December 31, 2023, actuarial gains/losses in the projected benefit obligation were the result of the plan experience, updated census data, discount rate, lump sum interest rates and lump sum mortality tables. These sources generated a combined loss of about
The weighted-average assumptions used to determine net periodic benefit cost for the years ended December 31, 2023, 2022 and 2021 were as follows:
YEAR ENDED DECEMBER 31, |
| ||||||
| 2023 |
| 2022 |
| 2021 |
| |
WEIGHTED AVERAGE ASSUMPTIONS: |
|
|
|
|
|
| |
Discount rate |
| | % | | % | | % |
Expected return on plan assets |
| |
| |
| | |
Rate of compensation increase | |||||||
Ages 25-34 | | | | ||||
Ages 35-44 | | | | ||||
Ages 45-54 | | | | ||||
Ages 55+ |
| |
| |
| | |
The Company has assumed a
PLAN ASSETS:
The plan’s measurement date is December 31, 2023. This plan’s asset allocation at December 31, 2023 and 2022, by asset category is as follows:
YEAR ENDED DECEMBER 31, |
| ||||
| 2023 |
| 2022 |
| |
ASSET CATEGORY: |
|
|
|
| |
Cash and cash equivalents |
| | % | | % |
Domestic equities |
| |
| | |
Mutual funds/ETFs |
| |
| | |
Corporate bonds |
| |
| | |
Total |
| | % | | % |
89
The major categories of assets in the Company’s pension plan as of year-end are presented in the following table. Assets are segregated by the level of the valuation inputs within the fair value hierarchy established by ASC Topic 820 utilized to measure fair value.
YEAR ENDED DECEMBER 31, | ||||||
| 2023 |
| 2022 | |||
(IN THOUSANDS) | ||||||
Level 1: |
|
|
|
| ||
Cash and cash equivalents | $ | | $ | | ||
Domestic equities |
| | | |||
Mutual funds/ETFs |
| | — | |||
Level 2: |
| |||||
Corporate bonds |
| — | | |||
Total fair value of plan assets | $ | | $ | | ||
Cash and cash equivalents may include uninvested cash balances along with money market mutual funds, treasury bills, or other assets normally categorized as cash equivalents. Domestic equities may include common or preferred stocks, covered options, rights or warrants, or American Depository Receipts which are traded on any U.S. equity market. Mutual funds/ETFs may include any equity, fixed income, balanced, international, or global mutual fund or exchange traded fund including any proprietary fund managed by the Trust Company. Agencies may include any U.S. government agency security or asset-backed security. Collective investment funds may include equity, fixed income, or balanced collective investment funds managed by West Chester Capital Advisors. Corporate bonds may include any corporate bond or note.
The investment strategy objective for the pension plan is a balance of growth and income. This objective seeks to develop a portfolio for acceptable levels of current income together with the opportunity for capital appreciation. The balanced growth and income objective reflects an equal balance between equity and fixed income investments such as debt securities. The allocation between equity and fixed income assets may vary by a moderate degree during normal market cycles. The pension plan’s allocation to equities is
CASH FLOWS:
The Company presently expects to contribute $
90
ESTIMATED FUTURE BENEFIT PAYMENTS:
The following benefit payments, which reflect future service, as appropriate, are expected to be paid.
| ESTIMATED FUTURE | ||
YEAR: | BENEFIT PAYMENTS | ||
(IN THOUSANDS) | |||
2024 | $ | | |
2025 |
| | |
2026 |
| | |
2027 |
| | |
2028 |
| | |
Years 2029-2033 |
| | |
401(k) PLAN:
The Company maintains a qualified 401(k) plan that allows for participation by Company employees. Under the plan, employees may elect to make voluntary contributions to their accounts which the Company will match one half on the first
Effective January 1, 2013, any new non-union employees receive a
DEFERRED COMPENSATION PLAN:
The Company maintains a nonqualified deferred compensation plan in which a select group of executives are permitted to participate. An eligible executive can defer a certain percentage of their current salary to be placed into the plan. The Company has established a rabbi trust to provide funding for the benefits payable under our deferred compensation plan. As of December 31, 2023 and 2022, the Company reported a deferred compensation liability of $
Except for the above described benefit plans, the Company has no significant additional exposure for any other post-retirement or post-employment benefits.
91
17. COMMITMENTS AND CONTINGENT LIABILITIES
The Company incurs off-balance sheet risks in the normal course of business in order to meet the financing needs of its customers. These risks derive from commitments to extend credit and standby letters of credit. Such commitments and standby letters of credit involve, to varying degrees, elements of credit risk in excess of the amount recognized in the consolidated financial statements. Commitments to extend credit are obligations to lend to a customer as long as there is no violation of any condition established in the loan agreement. Commitments generally have fixed expiration dates or other termination clauses and may require payment of a fee. Because many of the commitments are expected to expire without being drawn upon, the total commitment amounts do not necessarily represent future cash requirements. The Company evaluates each customer’s creditworthiness on a case-by-case basis. Commitments to extend credit are issued both on an unsecured and secured basis. Collateral which secures these types of commitments is the same as for other types of secured lending such as accounts receivable, inventory, fixed assets, and real estate.
Standby letters of credit are conditional commitments issued by the Company to guarantee the performance of a customer to a third party. Those guarantees are primarily issued to support public and private borrowing arrangements, including normal business activities, bond financings, and similar transactions. The credit risk involved in issuing letters of credit is essentially the same as that involved in extending loans to customers. Letters of credit are issued both on an unsecured and secured basis. Collateral securing these types of transactions is similar to collateral securing the Company’s commercial loans.
The Company’s exposure to credit loss in the event of nonperformance by the other party to these commitments to extend credit and standby letters of credit is represented by their contractual amounts. The Company uses the same credit and collateral policies in making commitments and conditional obligations as for all other lending. At December 31, 2023, the Company had various outstanding commitments to extend credit approximating $
Standby letters of credit had terms ranging from to
The Company estimates expected credit losses over the contractual period in which it is exposed to credit risk via a contractual obligation to extend credit, unless that obligation is unconditionally cancellable. The allowance for credit losses on off-balance sheet credit exposures is adjusted through the provision for credit losses line on the Consolidated Statements of Operations. The estimate includes consideration of the likelihood that funding will occur and an estimate of expected credit losses on commitments expected to be funded over its estimated life. The Company recorded a provision for credit losses on unfunded commitments for the year ended December 31, 2023 of $
Pursuant to its bylaws, the Company provides indemnification to its directors and officers against certain liabilities incurred as a result of their service on behalf of the Company. In connection with this indemnification obligation, the Company can advance on behalf of covered individuals costs incurred in defending against certain claims. Additionally, the Company is also subject to a number of asserted and unasserted potential claims encountered in the normal course of business. Neither the resolution of these claims nor the funding of these credit commitments is expected to have a material adverse effect on the Company’s consolidated financial position, results of operations or cash flows.
18. STOCK COMPENSATION PLANS
The Company uses the modified prospective method for accounting for stock-based compensation and recognized $
92
During 2021, the Company’s Board adopted, and its shareholders approved, the AmeriServ Financial, Inc. 2021 Equity Incentive Plan (the Plan) authorizing the grant of options or restricted stock covering
A summary of the status of the Company’s Equity Incentive Plan at December 31, 2023, 2022, and 2021, and changes during the years then ended is presented in the table and narrative following:
YEAR ENDED DECEMBER 31, | |||||||||||||||
2023 | 2022 | 2021 | |||||||||||||
|
| WEIGHTED |
|
| WEIGHTED |
|
| WEIGHTED | |||||||
AVERAGE | AVERAGE | AVERAGE | |||||||||||||
SHARES | EXERCISE PRICE | SHARES | EXERCISE PRICE | SHARES | EXERCISE PRICE | ||||||||||
Outstanding at beginning of year | $ | | $ | | $ | | |||||||||
Granted |
| — | — | — | — |
| | | |||||||
Exercised |
| ( | | ( | |
| ( | | |||||||
Forfeited |
| ( | | ( | |
| ( | | |||||||
Outstanding at end of year |
| | | | |
| | | |||||||
Exercisable at end of year |
| | | | |
| | | |||||||
Weighted average fair value of options granted in current year |
|
| $ | — |
| $ | — |
|
| $ | | ||||
A total of
YEAR ENDED DECEMBER 31, | |||
PRICING MODEL ASSUMPTION RANGES |
| 2021 |
|
Risk-free interest rate |
| % | |
Expected lives in years |
|
| |
Expected volatility |
| % | |
Expected dividend rate |
| % |
The intrinsic value of stock options exercised was $
93
19. ACCUMULATED OTHER COMPREHENSIVE LOSS
The following table presents the changes in each component of accumulated other comprehensive loss, net of tax, for the periods ended December 31, 2023, 2022, and 2021 (in thousands):
YEAR ENDED DECEMBER 31, 2023 | YEAR ENDED DECEMBER 31, 2022 | YEAR ENDED DECEMBER 31, 2021 | ||||||||||||||||||||||||||||
| Net |
|
|
|
| Net |
|
|
| Net |
|
| ||||||||||||||||||
Unrealized | Unrealized | Unrealized | ||||||||||||||||||||||||||||
Gains and | Gains and | Gains and | ||||||||||||||||||||||||||||
Losses on | Defined | Losses on | Defined | Losses on | Defined | |||||||||||||||||||||||||
Investment | Interest | Benefit | Investment | Benefit | Investment | Benefit | ||||||||||||||||||||||||
Securities | Rate | Pension | Securities | Pension | Securities | Pension | ||||||||||||||||||||||||
AFS(1) | Hedge(1) | Items(1) | Total(1) | AFS(1) | Items(1) | Total(1) | AFS(1) | Items(1) | Total(1) | |||||||||||||||||||||
Beginning balance | $ | ( | $ | — | $ | ( | $ | ( | $ | | $ | ( | $ | ( | $ | | $ | ( | $ | ( | ||||||||||
Other comprehensive income (loss) before reclassifications |
| |
| |
| |
| |
| ( |
| ( |
| ( |
| ( |
| |
| | ||||||||||
Amounts reclassified from accumulated other comprehensive loss |
| |
| ( |
| |
| |
| — |
| |
| |
| ( |
| |
| | ||||||||||
Net current period other comprehensive income (loss) |
| |
| ( |
| |
| |
| ( |
| |
| ( |
| ( |
| |
| | ||||||||||
Ending balance | $ | ( | $ | ( | $ | ( | $ | ( | $ | ( | $ | ( | $ | ( | $ | | $ | ( | $ | ( | ||||||||||
| (1) | Amounts in parentheses indicate debits on the Consolidated Balance Sheets. |
The following table presents the amounts reclassified out of each component of accumulated other comprehensive loss for the periods ended December 31, 2023, 2022, and 2021 (in thousands):
Amount reclassified from accumulated | |||||||||||
other comprehensive loss(1) | |||||||||||
Details about accumulated other | YEAR ENDED | YEAR ENDED | YEAR ENDED | Affected line item in the | |||||||
comprehensive loss components |
| DECEMBER 31, 2023 |
| DECEMBER 31, 2022 |
| DECEMBER 31, 2021 |
| statement of operations | |||
Realized (gains) losses on sale of securities | |||||||||||
$ | | $ | — | $ | ( | Net realized gains (losses) on investment securities | |||||
( | — | | Provision (benefit) for income taxes | ||||||||
$ | | $ | — | $ | ( |
| |||||
Interest rate hedge | |||||||||||
$ | ( | $ | — | $ | — | Interest expense - Deposits | |||||
| — | — | Provision (benefit) for income taxes | ||||||||
$ | ( | $ | — | $ | — |
| |||||
Amortization of estimated defined benefit pension plan loss(2) | |||||||||||
$ | | $ | | $ | |
| Other expense | ||||
| ( |
| ( |
| ( |
| Provision (benefit) for income taxes | ||||
$ | | $ | | $ | |
| |||||
Total reclassifications for the period | $ | | $ | | $ | |
| ||||
| (1) | Amounts in parentheses indicate credits. |
| (2) | These accumulated other comprehensive loss components are included in the computation of net periodic benefit cost (see Note 16 for additional details). |
20. INTANGIBLE ASSETS
The Company’s Consolidated Balance Sheets show both tangible assets (such as loans, buildings, and investments) and intangible assets (such as goodwill and core deposit intangible). Goodwill has an indefinite life and is not amortized.
94
Instead such intangible is evaluated for impairment at the reporting unit level at least annually, or more frequently if indicators of impairment are present. Any resulting impairment would be reflected as a non-interest expense. Based on this analysis,
Other identifiable intangible assets, such as core deposit intangible, are assigned useful lives, which are amortized on an accelerated basis over their useful lives. Such lives are also periodically reassessed to determine if any amortization period adjustments are required. During the years ended December 31, 2023 and 2022, no such adjustments were recorded. During 2021, the Company recorded a core deposit intangible of $
YEAR ENDED DECEMBER 31, | ||||||
2023 | 2022 |
| ||||
(IN THOUSANDS) | ||||||
CORE DEPOSIT INTANGIBLE | ||||||
Balance at beginning of year | $ | | $ | | ||
Amortization |
| ( | ( | |||
Balance at end of year | $ | | $ | | ||
As of December 31, 2023, the estimated future amortization expense for the core deposit intangible associated with the Riverview branch acquisition is as follows (in thousands):
2024 | $ | |
2025 | | |
2026 |
| |
2027 |
| |
2028 |
| |
After five years | | |
$ | |
21. DERIVATIVE HEDGING INSTRUMENTS
The Company can use various interest rate contracts, such as interest rate swaps, caps, floors and swaptions to help manage interest rate and market valuation risk exposure, which is incurred in normal recurrent banking activities.
Interest Rate Swap Agreements
The Company can use derivative instruments, primarily interest rate swaps, to manage interest rate risk and match the rates on certain assets by hedging the fair value of certain fixed rate debt, which converts the debt to variable rates and by hedging the cash flow variability associated with certain variable rate debt by converting the debt to fixed rates.
To accommodate the needs of our customers and support the Company’s asset/liability positioning, we may enter into interest rate swap agreements with customers and a large financial institution that specializes in these types of transactions. These arrangements involve the exchange of interest payments based on the notional amounts. The Company entered into floating rate loans and fixed rate swaps with our customers. Simultaneously, the Company entered into offsetting fixed rate swaps with this large financial institution. In connection with each swap transaction, the Company agrees to pay interest to the customer on a notional amount at a variable interest rate and receive interest from the customer on the same notional amount at a fixed interest rate. At the same time, the Company agrees to pay the large financial institution the same fixed interest rate on the same notional amount and receive the same variable interest rate
95
on the same notional amount. These transactions allow the Company’s customers to effectively convert a variable rate loan to a fixed rate. Because the Company acts as an intermediary for its customers, changes in the fair value of the underlying derivative contracts offset each other and do not significantly impact the Company’s results of operations. For the years ended December 31, 2023, 2022, and 2021, the Company received $
These swaps are considered free-standing derivatives and are reported at fair value within other assets and other liabilities on the Consolidated Balance Sheets. Disclosures related to the fair value of the swap transactions can be found in Note 13.
The following table summarizes the interest rate swap transactions that impacted the Company’s 2023 and 2022 performance (in thousands, except percentages).
DECEMBER 31, 2023 | ||||||||||||
INCREASE | ||||||||||||
AGGREGATE | WEIGHTED | (DECREASE) | ||||||||||
NOTIONAL | AVERAGE RATE | REPRICING | IN INTEREST | |||||||||
HEDGE TYPE | AMOUNT | RECEIVED/(PAID) | FREQUENCY | EXPENSE | ||||||||
Swap assets |
|
| $ | |
| | % |
| $ | | ||
Swap liabilities |
|
| ( |
| ( |
|
| ( | ||||
Net exposure |
| $ | — |
| — | % |
| $ | — | |||
DECEMBER 31, 2022 | ||||||||||||
INCREASE | ||||||||||||
AGGREGATE | WEIGHTED | (DECREASE) | ||||||||||
NOTIONAL | AVERAGE RATE | REPRICING | IN INTEREST | |||||||||
HEDGE TYPE | AMOUNT | RECEIVED/(PAID) | FREQUENCY | EXPENSE | ||||||||
Swap assets |
|
| $ | |
| | % |
| $ | | ||
Swap liabilities |
|
| ( |
| ( |
|
| ( | ||||
Net exposure |
| $ | — |
| — | % |
| $ | — | |||
Risk Participation Agreement
The Company entered into risk participation agreements (RPAs) with the lead bank of certain commercial real estate loan arrangements. As a participating bank, the Company guarantees the performance on a borrower-related interest rate swap contract. The Company has no obligations under the RPAs unless the borrower defaults on their swap transaction with the lead bank and the swap is a liability to the borrower. In that instance, the Company has agreed to pay the lead bank a pre-determined percentage of the swap’s value at the time of default. In exchange for providing the guarantee, the Company receives an upfront fee from the lead bank. For the year ended December 31, 2023, the Company received $
RPAs are derivative financial instruments and are recorded at fair value. These derivatives are not designated as hedges and therefore, changes in fair value are recognized in earnings with a corresponding offset within other liabilities. Disclosures related to the fair value of the RPAs can be found in Note 13. The notional amount of the risk participation agreements outstanding at December 31, 2023 and 2022 was $
Interest Rate Hedge
The Company has entered into
96
For derivatives designated as cash flow hedges, the effective portion of changes in the fair value of the derivative is reported in accumulated other comprehensive loss (within Shareholders’ Equity), net of tax, with a corresponding offset within other liabilities. Disclosures related to the fair value of the interest rate hedge can be found in Note 13. Amounts recorded in accumulated other comprehensive loss for the effective portion of changes in the fair value are subsequently reclassified to earnings when the hedged transaction affects earnings. The ineffective portion of changes in the fair value of the derivative is recognized directly in earnings. The Company assesses the effectiveness of the hedging relationship by comparing the changes in cash flows of the derivative hedging instrument with the changes in cash flows of the designated hedged transactions. The Company did not recognize any hedge ineffectiveness in earnings during 2023.
Amounts reported in accumulated other comprehensive loss related to derivatives will be reclassified to interest expense as interest payments are made on certain of the Company’s variable rate time deposit accounts. During the year ended December 31, 2023, the Company had $
The following table summarizes the effect of the effective portion of the Company’s cash flow hedge accounting on accumulated other comprehensive loss for the year ended December 31, 2023 (in thousands).
YEAR ENDED DECEMBER 31, 2023 | ||||||||
Derivatives in Cash Flow Hedging Relationships | Amount Recognized in Other Comprehensive Loss on Derivative | Location on Consolidated Statements of Operations of Reclassification from Accumulated Other Comprehensive Loss | Amount Reclassified from Accumulated Other Compreshensive Loss | |||||
Interest rate hedge | $ | ( |
|
| $ | ( | ||
Total | $ | ( |
| $ | ( | |||
The Company monitors and controls all derivative products with a comprehensive Board of Directors approved Hedging Policy. This policy permits a total maximum notional amount outstanding of $
22. SEGMENT RESULTS
The financial performance of the Company is also monitored by an internal funds transfer pricing profitability measurement system which produces line of business results and key performance measures. The Company’s major business units include community banking, wealth management, and investment/parent. The reported results reflect the underlying economics of the business segments. Expenses for centrally provided services are allocated based upon the cost and estimated usage of those services. The businesses are match-funded and interest rate risk is centrally managed and accounted for within the investment/parent business segment. The key performance measure the Company focuses on for each business segment is net income contribution.
The community banking segment includes both retail and commercial banking activities. Retail banking includes the deposit-gathering branch franchise and lending to both individuals and small businesses. Lending activities include residential mortgage loans, direct consumer loans, and small business commercial loans. Commercial banking to businesses includes commercial loans, business services, and CRE loans. The wealth management segment includes the Trust Company, West Chester Capital Advisors (WCCA), our registered investment advisory firm, and Financial Services. Wealth management activities include personal trust products and services such as personal portfolio investment management, estate planning and administration, custodial services and pre-need trusts. Also, institutional trust products and services such as 401(k) plans, defined benefit and defined contribution employee benefit plans, and
97
individual retirement accounts are included in this segment. Financial Services include the sale of mutual funds, annuities, and insurance products. The wealth management businesses also include the union collective investment funds (ERECT funds) which are designed to use union pension dollars in construction projects that utilize union labor. The investment/parent includes the net results of investment securities and borrowing activities, general corporate expenses not allocated to the business segments, interest expense on corporate debt, and centralized interest rate risk management. Inter-segment revenues were not material.
The contribution of the major business segments to the Consolidated Statements of Operations were as follows:
YEAR ENDED DECEMBER 31, 2023 | ||||||||||||
COMMUNITY | WEALTH | INVESTMENT/ | ||||||||||
BANKING | MANAGEMENT | PARENT | TOTAL | |||||||||
(IN THOUSANDS) | ||||||||||||
Net interest income (expense) |
| $ | |
| $ | |
| $ | ( |
| $ | |
Provision for credit losses |
| |
| — |
| |
| | ||||
Non-interest income |
| |
| |
| |
| | ||||
Non-interest expense |
| |
| |
| |
| | ||||
Income (loss) before income taxes |
| |
| |
| ( |
| ( | ||||
Income tax expense (benefit) |
| |
| |
| ( |
| ( | ||||
Net income (loss) | $ | | $ | | $ | ( | $ | ( | ||||
Total assets | $ | | $ | | $ | | $ | | ||||
YEAR ENDED DECEMBER 31, 2022 | ||||||||||||
COMMUNITY | WEALTH | INVESTMENT/ | ||||||||||
BANKING | MANAGEMENT | PARENT | TOTAL | |||||||||
(IN THOUSANDS) | ||||||||||||
Net interest income (expense) |
| $ | |
| $ | |
| $ | ( |
| $ | |
Provision for credit losses |
| |
| — |
| — |
| | ||||
Non-interest income (loss) |
| |
| |
| ( |
| | ||||
Non-interest expense |
| |
| |
| |
| | ||||
Income (loss) before income taxes |
| |
| |
| ( |
| | ||||
Income tax expense (benefit) |
| |
| |
| ( |
| | ||||
Net income (loss) | $ | | $ | | $ | ( | $ | | ||||
Total assets | $ | | $ | | $ | | $ | | ||||
YEAR ENDED DECEMBER 31, 2021 | ||||||||||||
COMMUNITY | WEALTH | INVESTMENT/ | ||||||||||
BANKING | MANAGEMENT | PARENT | TOTAL | |||||||||
(IN THOUSANDS) | ||||||||||||
Net interest income (expense) |
| $ | |
| $ | |
| $ | ( |
| $ | |
Provision for credit losses |
| |
| |
| |
| | ||||
Non-interest income |
| |
| |
| |
| | ||||
Non-interest expense |
| |
| |
| |
| | ||||
Income (loss) before income taxes |
| |
| |
| ( |
| | ||||
Income tax expense (benefit) |
| |
| |
| ( |
| | ||||
Net income (loss) | $ | | $ | | $ | ( | $ | | ||||
Total assets | $ | | $ | | $ | | $ | | ||||
23. REGULATORY CAPITAL
The Company is subject to various capital requirements administered by the federal banking agencies. Under capital adequacy guidelines and the regulatory framework for prompt corrective action, the Company must meet specific capital guidelines that involve quantitative measures of the Company’s assets, liabilities, and certain off-balance sheet items as calculated under regulatory accounting practices. The Company’s capital amounts and classification are also subject to
98
qualitative judgments by the regulators about components, risk weightings, and other factors. Failure to meet minimum capital requirements can initiate certain mandatory and possibly additional discretionary actions by regulators that, if undertaken, could have a direct material effect on the Company’s consolidated financial statements. For a more detailed discussion see the Capital Resources section of Management’s Discussion and Analysis of Financial Condition and Results of Operations (MD&A).
Quantitative measures established by regulation to ensure capital adequacy require the Company to maintain minimum amounts and ratios (set forth in the table below) of total, common equity tier 1, and tier 1 capital to risk-weighted assets (as defined) and tier 1 capital to average assets. Additionally, under Basel III rules, the decision was made to opt-out of including accumulated other comprehensive income in regulatory capital. As of December 31, 2023 and 2022, the Company was categorized as “well capitalized” under the regulatory framework for prompt corrective action promulgated by the Federal Reserve. The Company believes that no conditions or events have occurred that would change this conclusion as of such date. To be categorized as well capitalized, the Company must maintain minimum total capital, common equity tier 1 capital, tier 1 capital, and tier 1 leverage ratios as set forth in the table.
AT DECEMBER 31, 2023 |
| ||||||||||||||
TO BE WELL |
| ||||||||||||||
MINIMUM | CAPITALIZED |
| |||||||||||||
REQUIRED | UNDER |
| |||||||||||||
FOR | PROMPT |
| |||||||||||||
CAPITAL | CORRECTIVE |
| |||||||||||||
ADEQUACY | ACTION |
| |||||||||||||
COMPANY | BANK | PURPOSES | REGULATIONS* |
| |||||||||||
| AMOUNT |
| RATIO |
| AMOUNT |
| RATIO |
| RATIO |
| RATIO | ||||
| (IN THOUSANDS, EXCEPT RATIOS) | ||||||||||||||
Total Capital (To Risk Weighted Assets) | $ | |
| | % | $ | |
| | % | | % | | % | |
Common Equity Tier 1 Capital (To Risk Weighted Assets) |
| |
| |
| |
| |
| |
| | |||
Tier 1 Capital (To Risk Weighted Assets) |
| |
| |
| |
| |
| |
| | |||
Tier 1 Capital (To Average Assets) |
| |
| |
| |
| |
| |
| | |||
AT DECEMBER 31, 2022 |
| ||||||||||||||
TO BE WELL |
| ||||||||||||||
MINIMUM | CAPITALIZED |
| |||||||||||||
REQUIRED | UNDER |
| |||||||||||||
FOR | PROMPT |
| |||||||||||||
CAPITAL | CORRECTIVE |
| |||||||||||||
ADEQUACY | ACTION |
| |||||||||||||
COMPANY | BANK | PURPOSES | REGULATIONS* |
| |||||||||||
| AMOUNT |
| RATIO |
| AMOUNT |
| RATIO |
| RATIO |
| RATIO | ||||
| (IN THOUSANDS, EXCEPT RATIOS) | ||||||||||||||
Total Capital (To Risk Weighted Assets) | $ | |
| | % | $ | |
| | % | | % | | % | |
Common Equity Tier 1 Capital (To Risk Weighted Assets) |
| |
| |
| |
| |
| |
| | |||
Tier 1 Capital (To Risk Weighted Assets) |
| |
| |
| |
| |
| |
| | |||
Tier 1 Capital (To Average Assets) |
| |
| |
| |
| |
| |
| | |||
* Applies to the Bank only.
99
24. PARENT COMPANY FINANCIAL INFORMATION
The parent company functions primarily as a coordinating and servicing unit for all subsidiary entities. Provided services include general management, accounting and taxes, loan review, internal audit, investment advisory, marketing, insurance, risk management, general corporate services, and financial and strategic planning. The following financial information relates only to the parent company operations:
BALANCE SHEETS
AT DECEMBER 31, | ||||||
| 2023 |
| 2022 | |||
(IN THOUSANDS) | ||||||
ASSETS |
|
|
|
| ||
Cash | $ | | $ | | ||
Short-term investments |
| |
| | ||
Cash and cash equivalents | | | ||||
Investment securities available for sale |
| |
| | ||
Equity investment in banking subsidiary |
| |
| | ||
Equity investment in non-banking subsidiaries |
| |
| | ||
Other assets |
| |
| | ||
TOTAL ASSETS | $ | | $ | | ||
LIABILITIES |
|
|
|
| ||
Subordinated debt | $ | | $ | | ||
Other liabilities |
| |
| | ||
TOTAL LIABILITIES |
| |
| | ||
SHAREHOLDERS’ EQUITY |
|
|
|
| ||
Total shareholders’ equity |
| |
| | ||
TOTAL LIABILITIES AND SHAREHOLDERS’ EQUITY | $ | | $ | | ||
STATEMENTS OF OPERATIONS
YEAR ENDED DECEMBER 31, | |||||||||
| 2023 |
| 2022 |
| 2021 | ||||
(IN THOUSANDS) | |||||||||
INCOME |
|
|
|
|
|
| |||
Inter-entity management and other fees | $ | | $ | | $ | | |||
Dividends from banking subsidiary |
| |
| |
| | |||
Dividends from non-banking subsidiary |
| |
| |
| | |||
Interest, dividend and other income |
| |
| |
| | |||
TOTAL INCOME |
| |
| |
| | |||
EXPENSE |
|
|
| ||||||
Interest expense |
| |
| |
| | |||
Salaries and employee benefits |
| |
| |
| | |||
Other expense |
| |
| |
| | |||
TOTAL EXPENSE |
| |
| |
| | |||
INCOME (LOSS) BEFORE INCOME TAXES AND EQUITY IN UNDISTRIBUTED EARNINGS OF SUBSIDIARIES |
| ( |
| |
| ( | |||
Benefit for income taxes |
| ( |
| ( |
| ( | |||
Equity in undistributed earnings of subsidiaries |
| ( |
| |
| | |||
NET INCOME (LOSS) | $ | ( | $ | | $ | | |||
COMPREHENSIVE INCOME (LOSS) | $ | ( | $ | ( | $ | | |||
100
STATEMENTS OF CASH FLOWS
YEAR ENDED DECEMBER 31, | |||||||||
| 2023 |
| 2022 |
| 2021 | ||||
(IN THOUSANDS) | |||||||||
OPERATING ACTIVITIES |
|
|
|
|
|
| |||
Net income (loss) | $ | ( | $ | | $ | | |||
Adjustment to reconcile net income (loss) to net cash provided by operating activities: |
|
|
| ||||||
Equity in undistributed earnings of subsidiaries |
| |
| ( |
| ( | |||
Stock compensation expense |
| |
| |
| | |||
Other – net |
| ( |
| |
| | |||
NET CASH PROVIDED BY OPERATING ACTIVITIES |
| |
| |
| | |||
INVESTING ACTIVITIES |
|
|
|
|
|
| |||
Purchase of investment securities – available for sale |
| — |
| ( |
| ( | |||
Proceeds from maturity and sales of investment securities – available for sale |
| |
| |
| | |||
Capital contribution to banking subsidiary |
| — |
| — |
| ( | |||
NET CASH PROVIDED BY (USED IN) INVESTING ACTIVITIES |
| |
| ( |
| ( | |||
FINANCING ACTIVITIES |
|
|
|
|
|
| |||
Redemption of guaranteed junior subordinated deferrable interest debentures |
| — |
| — |
| ( | |||
Subordinated debt issuance, net |
| — |
| — |
| | |||
Redemption of subordinated debt |
| — |
| — |
| ( | |||
Stock options exercised |
| |
| |
| | |||
Purchases of treasury stock |
| |
| |
| | |||
Common stock dividends paid |
| ( |
| ( |
| ( | |||
NET CASH (USED IN) PROVIDED BY FINANCING ACTIVITIES |
| ( |
| ( |
| | |||
NET INCREASE (DECREASE) IN CASH AND CASH EQUIVALENTS |
| |
| ( |
| | |||
CASH AND CASH EQUIVALENTS AT JANUARY 1 |
| |
| |
| | |||
CASH AND CASH EQUIVALENTS AT DECEMBER 31 | $ | | $ | | $ | | |||
The ability of the subsidiary Bank to upstream cash to the parent company is restricted by regulations. Federal law prevents the parent company from borrowing from its subsidiary Bank unless the loans are secured by specified assets. Further, such secured loans are limited in amount to ten percent of the subsidiary Bank’s capital and surplus. In addition, the Bank is subject to legal limitations on the amount of dividends that can be paid to its shareholder. The dividend limitation generally restricts dividend payments to a bank’s retained net income for the current and preceding two calendar years. The subsidiary Bank had a combined $
101
25. SELECTED QUARTERLY CONSOLIDATED FINANCIAL DATA (unaudited)
The following table sets forth certain unaudited quarterly consolidated financial data regarding the Company:
2023 QUARTER ENDED | ||||||||||||
| DEC. 31 |
| SEPT. 30 |
| JUNE 30 |
| MARCH 31 | |||||
(IN THOUSANDS, EXCEPT PER SHARE DATA) | ||||||||||||
Interest income | $ | | $ | | $ | | $ | | ||||
Interest expense |
| |
| |
| |
| | ||||
Net interest income |
| |
| |
| |
| | ||||
Provision for credit losses |
| |
| |
| |
| | ||||
Net interest income after provision for credit losses |
| |
| |
| |
| | ||||
Non-interest income |
| |
| |
| |
| | ||||
Non-interest expense |
| |
| |
| |
| | ||||
Income (loss) before income taxes |
| ( |
| |
| ( |
| | ||||
Provision (benefit) for income taxes |
| ( |
| |
| ( |
| | ||||
Net income (loss) | $ | ( | $ | | $ | ( | $ | | ||||
Basic earnings per common share | $ | ( | $ | | $ | ( | $ | | ||||
Diluted earnings per common share |
| ( |
| |
| ( |
| | ||||
Cash dividends declared per common share |
| |
| |
| |
| | ||||
2022 QUARTER ENDED | ||||||||||||
| DEC. 31 |
| SEPT. 30 |
| JUNE 30 |
| MARCH 31 | |||||
(IN THOUSANDS, EXCEPT PER SHARE DATA) | ||||||||||||
Interest income | $ | | $ | | $ | | $ | | ||||
Interest expense |
| |
| |
| |
| | ||||
Net interest income |
| |
| |
| |
| | ||||
Provision (credit) for credit losses |
| |
| |
| ( |
| ( | ||||
Net interest income after provision (credit) for credit losses |
| |
| |
| |
| | ||||
Non-interest income |
| |
| |
| |
| | ||||
Non-interest expense |
| |
| |
| |
| | ||||
Income before income taxes |
| |
| |
| |
| | ||||
Provision for income taxes |
| |
| |
| |
| | ||||
Net income | $ | | $ | | $ | | $ | | ||||
Basic earnings per common share | $ | | $ | | $ | | $ | | ||||
Diluted earnings per common share |
| |
| |
| |
| | ||||
Cash dividends declared per common share |
| |
| |
| |
| | ||||
A
102
REPORT OF INDEPENDENT REGISTERED PUBLIC ACCOUNTING FIRM
To the Shareholders and the Board of Directors of AmeriServ Financial, Inc.
Opinion on the Financial Statements
We have audited the accompanying consolidated balance sheets of AmeriServ Financial, Inc. and subsidiaries (the “Company”) as of December 31, 2023 and 2022; the related consolidated statements of operations, comprehensive income (loss), changes in shareholders’ equity, and cash flows for each of the three years in the period ended December 31, 2023; and the related notes to the consolidated financial statements (collectively, the financial statements). In our opinion, the financial statements present fairly, in all material respects, the financial position of the Company as of December 31, 2023 and 2022, and the results of its operations and its cash flows for each of the three years in the period ended December 31, 2023, in conformity with accounting principles generally accepted in the United States of America.
Change in Accounting Principle
As discussed in Note 1 to the financial statements, the Company changed its method of accounting for credit losses effective January 1, 2023, due to the adoption of Accounting Standards Codification (ASC) Topic 326, Financial Instruments – Credit Losses.
Basis for Opinion
These financial statements are the responsibility of the Company’s management. Our responsibility is to express an opinion on the Company’s financial statements based on our audits. We are a public accounting firm registered with the Public Company Accounting Oversight Board (United States) (PCAOB) and are required to be independent, with respect to the Company, in accordance with U.S. federal securities laws and the applicable rules and regulations of the Securities and Exchange Commission and the PCAOB.
We conducted our audits in accordance with the standards of the PCAOB. Those standards require that we plan and perform the audit to obtain reasonable assurance about whether the financial statements are free of material misstatement, whether due to error or fraud. The Company is not required to have, nor were we engaged to perform, an audit of its internal control over financial reporting. As part of our audits, we are required to obtain an understanding of internal control over financial reporting but not for the purpose of expressing an opinion on the effectiveness of the Company’s internal control over financial reporting. Accordingly, we express no such opinion.
Our audits included performing procedures to assess the risks of material misstatement of the financial statements, whether due to error or fraud, and performing procedures that respond to those risks. Such procedures included examining, on a test basis, evidence regarding the amounts and disclosures in the financial statements. Our audits also included evaluating the accounting principles used and significant estimates made by management, as well as evaluating the overall presentation of the financial statements. We believe that our audits provide a reasonable basis for our opinion.
Critical Audit Matters
The critical audit matters communicated below are matters arising from the current period audit of the financial statements that were communicated or required to be communicated to the Audit Committee and that: (1) relate to accounts or disclosures that are material to the financial statements; and (2) involve our especially challenging, subjective, or complex judgments. The communication of critical audit matters does not alter, in any way, our opinion on the financial statements, taken as a whole, and we are not, by communicating the critical audit matters below, providing separate opinions on the critical audit matters or on the accounts or disclosures to which they relate.
Allowance for Credit Losses (ACL) – Qualitative Factor
The Company’s loan portfolio totaled $1 billion as of December 31, 2023, and the associated ACL was $15.1 million. As discussed in Note 1 to the consolidated financial statements, determining the amount of the ACL requires significant judgment about the expected future losses, which is based on capturing loans that qualify for a segment as of a point in time to form a cohort, then tracks that cohort over their remaining lives to determine their loss behavior. The remaining
103
lifetime loss rate is then applied to current loans that qualify for the same segmentation criteria to form a remaining life expectation on current loans. Once historical cohorts are established, the loans in each individual cohort are tracked over their remaining lives for loss and recovery events. Management applies these qualitative adjustments to the baseline lifetime loss rate to reflect changes in the current and forecasted environment, both internal and external, that are different from the conditions that existed during the historical loss calculation period.
We identified these qualitative adjustments within the ACL as critical audit matters because they involve a high degree of subjectivity. While the determination of these qualitative adjustments includes analysis of observable data over the historical loss period, the judgments required to assess the directionality and magnitude of adjustments are highly subjective. Auditing these complex judgments and assumptions involved especially challenging auditor judgment due to the nature of audit evidence and the nature and extent of effort required to address these matters.
The primary procedures we performed to address this critical audit matter included:
• | Testing the design, implementation, and operating effectiveness of internal controls over the calculation of the allowance for credit losses, including the qualitative factor adjustments. |
• | Testing the completeness and accuracy of the significant data points that management uses in their evaluation of the qualitative adjustments. |
• | Testing the anchoring calculation that management completes to properly align the magnitude of the adjustments with the Company’s historical loss data. |
• | Evaluating the directional consistency and reasonableness of management’s conclusions regarding basis points applied (whether positive or negative) based on the trends identified in the underlying data. |
• | Testing the mathematical accuracy of the application of the qualitative adjustments to the loan segments within the ACL calculation. |
We have served as the Company’s auditor since 2007.
/s/
March 27, 2024
104
REPORT ON MANAGEMENT’S ASSESSMENT OF INTERNAL CONTROL OVER FINANCIAL REPORTING
We, as management of AmeriServ Financial, Inc., are responsible for establishing and maintaining effective internal control over financial reporting that is designed to produce reliable financial statements in conformity with United States generally accepted accounting principles. The system of internal control over financial reporting as it relates to the financial statements is evaluated for effectiveness by management and tested for reliability through a program of internal audits. Actions are taken to correct potential deficiencies as they are identified. Any system of internal control, no matter how well designed, has inherent limitations, including the possibility that a control can be circumvented or overridden and misstatements due to error or fraud may occur and not be detected. Also, because of changes in conditions, internal control effectiveness may vary over time. Accordingly, even an effective system of internal control will provide only reasonable assurance with respect to financial statement preparation.
Management assessed the Company’s system of internal control over financial reporting as of December 31, 2023, in relation to criteria for effective internal control over financial reporting as described in “2013 Internal Control — Integrated Framework,” issued by the Committee of Sponsoring Organizations of the Treadway Commission. Based on this assessment, management concludes that, as of December 31, 2023, its system of internal control over financial reporting is effective and meets the criteria of the “2013 Internal Control — Integrated Framework”.
Management is responsible for compliance with the federal and state laws and regulations concerning dividend restrictions and federal laws and regulations concerning loans to insiders designated by the Federal Reserve as safety and soundness laws and regulations.
Management has assessed compliance by the Company with the designated laws and regulations relating to safety and soundness. Based on the assessment, management believes that the Company complied, in all significant respects, with the designated laws and regulations related to safety and soundness for the year ended December 31, 2023.
/s/ JEFFREY A. STOPKO |
| /s/ MICHAEL D. LYNCH | |
Jeffrey A. Stopko | Michael D. Lynch | ||
President & Chief Executive Officer | Executive Vice President & Chief Financial Officer |
Johnstown, PA
March 27, 2024
105
STATEMENT OF MANAGEMENT RESPONSIBILITY
March 27, 2024
To the Stockholders and Board of Directors of AmeriServ Financial, Inc.
Management of AmeriServ Financial, Inc. and its subsidiaries have prepared the consolidated financial statements and other information in the Annual Report and Form 10-K in accordance with United States generally accepted accounting principles and are responsible for its accuracy.
In meeting its responsibility, management relies on internal accounting and related control systems, which include selection and training of qualified personnel, establishment and communication of accounting and administrative policies and procedures, appropriate segregation of responsibilities, and programs of internal audit. These systems are designed to provide reasonable assurance that financial records are reliable for preparing financial statements and maintaining accountability for assets and that assets are safeguarded against unauthorized use or disposition. Such assurance cannot be absolute because of inherent limitations in any internal control system.
Management also recognizes its responsibility to foster a climate in which Company affairs are conducted with the highest ethical standards. The Company’s Code of Conduct, furnished to each employee and director, addresses the importance of open internal communications, potential conflicts of interest, compliance with applicable laws, including those related to financial disclosure, the confidentiality of proprietary information, and other items. There is an ongoing program to assess compliance with these policies.
The Audit Committee of the Company’s Board of Directors consists solely of independent directors. The Audit Committee meets periodically with management and the independent auditors to discuss audit, financial reporting, and related matters. S.R. Snodgrass P.C. and the Company’s internal auditors have direct access to the Audit Committee.
/s/ JEFFREY A. STOPKO |
| /s/ MICHAEL D. LYNCH | ||
Jeffrey A. Stopko | Michael D. Lynch | |||
President & Chief Executive Officer | Executive Vice President & Chief Financial Officer |
106
ITEM 9. CHANGES IN AND DISAGREEMENTS WITH ACCOUNTANTS ON ACCOUNTING AND FINANCIAL DISCLOSURE
None.
ITEM 9A. CONTROLS AND PROCEDURES
Evaluation of Disclosure Controls and Procedures. As of December 31, 2023, an evaluation was performed under the supervision and with the participation of the Company’s management, including the Chief Executive Officer and Chief Financial Officer, on the effectiveness of the design and operation of the Company’s disclosure controls and procedures (as defined in Rules 13a-15(e) and 15d-15(e) promulgated under the Securities Exchange Act of 1934, as amended (the Exchange Act)). Based on that evaluation, the Company’s management, including the Chief Executive Officer and Chief Financial Officer, concluded that the Company’s disclosure controls and procedures were effective as of December 31, 2023.
Disclosure controls and procedures are the controls and other procedures that are designed to ensure that the information required to be disclosed by the Company in its reports filed and submitted under the Exchange Act, is recorded, processed, summarized and reported within the time periods specified in the SEC’s rules and forms. Disclosure controls and procedures include, without limitation, controls and procedures designed to ensure that information required to be disclosed by the Company in its reports filed under the Exchange Act is accumulated and communicated to the Company’s management, including its principal executive officer and principal financial officer, as appropriate to allow timely decisions regarding required disclosure.
Management Report on Internal Control Over Financial Reporting. The Company’s management is responsible for establishing and maintaining adequate internal control over financial reporting, as such term is defined in Rule 13a-15(f) under the Exchange Act. Management’s assessment of internal control over financial reporting for the fiscal year ended December 31, 2023 is included in Item 8.
Changes in Internal Control Over Financial Reporting. Effective January 1, 2023, AmeriServ Financial Inc. adopted CECL. The Company designed new controls and modified existing controls as part of this adoption. These additional controls over financial reporting included controls over model creation and design, model governance, assumptions, and expanded controls over loan level data. There were no other changes in the Company’s internal controls over financial reporting (as defined in Rule 13a-15(f)) that occurred during the most recent fiscal quarter that has materially affected, or are reasonably likely to materially affect, the Company’s internal control over financial reporting.
ITEM 9B. OTHER INFORMATION
Rule 10b5-1 Trading Plans
During the fourth quarter of 2023, no officer or director of the Company or any contract, instruction, or written plan for the purchase or sale of securities of the Company’s common stock that is intended to satisfy the affirmative defense conditions of Securities Exchange Act -1(c) or any -1 trading arrangement as defined in 17 CFR § 229.408(c).
ITEM 9C. DISCLOSURE REGARDING FOREIGN JURISDICTIONS THAT PREVENT INSPECTIONS
Not Applicable.
107
PART III
ITEM 10. DIRECTORS, EXECUTIVE OFFICERS AND CORPORATE GOVERNANCE
Directors
Under our Articles of Incorporation, the total number of directors may be determined by either a resolution adopted by a majority vote of the directors then in office or by a resolution adopted by the shareholders at a meeting. The number of directors for 2023 has been set by the Board at eight who are not officers of the Company or a subsidiary or affiliate of the Company plus the President and Chief Executive Officer.
The Board, as provided in our Articles of Incorporation, is divided into three classes, each being as nearly equal in number as possible. The directors in each class serve a term of three years or until the earlier of their resignation or their respective successors have been elected and qualified. Under our Articles of Incorporation, a person who is elected to fill a vacancy on the Board will serve as a director for the remaining term of office of the class to which he or she was elected.
The Board has determined that all current members of our Board are independent, pursuant to the listing standards of The NASDAQ Global Market (“NASDAQ”), except Mr. Stopko, the current President & Chief Executive Officer of the Company who is not independent by reason of his current employment relationship with the Company.
The following tables set forth as to each of the continuing Class I, Class II and Class III directors, his or her age, principal occupation and business experience, the period during which he or she has served as a member of our Board, or an affiliate or predecessor, and their current and recent directorships in other public companies. In addition, we briefly describe the particular experience, qualifications, attributes or skills that led our Board to conclude that the person should serve as a member of our Board. There are no family relationships between any of the listed persons.
Class II Directors — Term Expires in 2024
J. Michael Adams, Jr., Esquire, 62
Director since: 2000
Other Current Public Company Directorships: None
Other Public Company Directorships within past 5 years: None
Mr. Adams currently serves as Non-Executive Chairman of the Company. He also serves as Chair of the Nominating/Corporate Governance Committee. Since 2021, Mr. Adams has been Managing Member of Mike Adams & Associates, LLC, a consulting firm in law, business and government. He previously served as Chief Counsel to the Pennsylvania Department of Community and Economic Development. He received degrees from Carnegie Mellon University, BS and the University of Pittsburgh School of Law, JD. As a public company, we believe Mr. Adams’ corporate, legal, and board experience for over three decades of providing professional services are valuable to a public company in a highly regulated industry.
Margaret A. O’Malley, Esquire, 64
Director since: 1997
Other Current Public Company Directorships: None
Other Public Company Directorships within past 5 years: None
Ms. O’Malley has more than three decades of experience in private legal practice at, and is the owner of, Yost & O’Malley, a law firm in Johnstown, Pennsylvania, where she advises both individuals and corporate for profit and non-profit entities. She received a Bachelor of Arts from the Pennsylvania State University and a J.D. from the University of Pittsburgh School of Law. She is licensed to practice law in Pennsylvania and the District of Columbia and is an experienced litigator in both state and federal courts. Because we are a public company operating in a highly regulated industry, we believe Ms. O’Malley’s experience and perspective as an attorney is valuable not only as a member of the Board but also in her continued role as Chair of the audit committee. With ASRV’s increased regulatory and corporate governance measures passed in recent years, we believe that Ms. O’Malley’s continued leadership in these roles remains important to the Board’s success.
108
Mark E. Pasquerilla, 64
Director since: 1997
Other Current Public Company Directorships: Pennsylvania Real Estate Investment Trust (“PREIT”)
Other Public Company Directorships within past 5 years: None
Mr. Pasquerilla has been an officer and director of Pasquerilla Enterprises, LP, a Johnstown-based real estate owner and manager, and its subsidiaries since 2006. He has served as its Chief Executive Officer since 2013 and was its President from 2006 to 2013. From 1992 to 2006, Mr. Pasquerilla served as an officer and director of Crown Holding Company and its subsidiaries (Chief Executive Officer and Chairman from April 1999 to December 2006, and President from 1992 to 2006). Mr. Pasquerilla is sole member of Pasquerilla Management LLC, which incorporated in June 2019. From April 1999 until it was acquired by PREIT, a publicly-traded real estate investment trust, in November 2003, he also served as Chairman and Chief Executive Officer of Crown American Realty Trust and as a trustee. Mr. Pasquerilla has been a trustee of PREIT since 2003 and a member of the audit committee since 2017 and the nominating and corporate governance committees of its board of trustees since 2011. He received a bachelor of arts from Notre Dame University and a M.S. from the London School of Economics. In connection with his work as an officer and trustee of Pasquerilla Enterprises, LP, Crown Holding Company and PREIT, Mr. Pasquerilla has acquired substantial experience in real estate finance. Because, like most banks, ASRV has many real estate loans, we believe this experience is important to our Board. Mr. Pasquerilla is Chair of the executive committee.
Class I Directors — Term Expires in 2026
Richard W. Bloomingdale, 71
Director since: 2023
Other Current Public Company Directorships: None
Other Public Company Directorships within past 5 years: None
Mr. Bloomingdale is the recently retired President of the Pennsylvania American Federation of Labor and Congress of Industrial Organizations (“Pennsylvania AFL-CIO”), a labor federation. In addition to holding the President role for 12 years, he previously served as Secretary-Treasurer of the Pennsylvania AFL-CIO and has a more than four-decade career in labor relations. Mr. Bloomingdale graduated from the University of Arizona with a bachelor’s degree in government. The Board believes Mr. Bloomingdale’s finance and labor experience will strengthen AmeriServ’s human capital management efforts and position the Company to further expand its union business throughout Pennsylvania. Mr. Bloomingdale is a member of the audit committee.
David J. Hickton, 68
Director since: 2023
Other Current Public Company Directorships: None
Other Public Company Directorships within past 5 years: None
Since 2017, Mr. Hickton has been the Founding Director of the Institute for Cyber Law, Policy and Security at the University of Pittsburgh, a research institute. Previously, he was the U.S. Attorney for the Western District of Pennsylvania from August 2010 until November 2016. Mr. Hickton also served as staff director and senior counsel to the House Select Subcommittee on the Coronavirus Crisis from May 2020 until June 2021. He received a bachelor’s degree from Pennsylvania State University and a J.D. from the University of Pittsburgh. The Board believes Mr. Hickton’s experience in cybersecurity, legal affairs, regulatory matters, and data security and privacy approaches will directly benefit the Company as it meets customers’ expectations for online and mobile services. Mr. Hickton is chair of the technology committee.
Daniel A. Onorato, 63
Director since: 2020
Other Current Public Company Directorships: None
Other Public Company Directorships within past 5 years: None
Since 2012, Mr. Onorato has been Executive Vice President, Chief Corporate Affairs Officer for Highmark Health, a health and wellness organization headquartered in Pittsburgh, Pennsylvania. Prior to joining Highmark Health, he served two terms as chief executive of Allegheny County. Prior to that, Mr. Onorato served as Allegheny County’s controller and two terms on the Pittsburgh City Council. His professional background also includes work as an attorney
109
and certified public accountant (CPA). Mr. Onorato has a bachelor’s degree in accounting from Pennsylvania State University and a J.D. from the University of Pittsburgh. We believe that his professional experience in healthcare, government, accounting and law make Mr. Onorato a valuable addition to our Board given the areas that banking touches. Mr. Onorato is a member of the investment/asset liability committee and the audit committee, on which he also serves as the Board’s designated audit committee financial expert under applicable SEC rules.
Class III Directors — Term Expires in 2025
Amy Bradley, 56
Director since: 2022
Other Current Public Company Directorships: None
Other Public Company Directorships within past 5 years: None
Since March 2018, Ms. Bradley has been the President and Chief Executive Officer of the Cambria Regional Chamber of Commerce, a regional business organization. Prior to that, from June 2000 to March 2018, she was director of communication and public affairs of the Conemaugh Health System, a healthcare provider in Pennsylvania. Her professional background also includes work as a television news anchor at WJAC TV. We believe that, as an accomplished community leader, Ms. Bradley has a deep understanding of the challenges and opportunities our regional businesses are facing, as well as familiarity with securing the resources needed to aid and counsel them. Ms. Bradley is a member of the investment/ALCO committee.
Kim W. Kunkle, 68
Director since: 1994
Other Current Public Company Directorships: None
Other Public Company Directorships within past 5 years: None
Since 1984, Mr. Kunkle has served as the President and Chief Executive Officer of Laurel Holdings, Inc. (“Laurel Holdings”), which is a closely held private company with wholly owned subsidiaries involved in underground utility construction, plumbing, janitorial services, metal machining, industrial tool distribution, and pipeline rehabilitation. Laurel Holdings employs over 200 and has sales in excess of $20 million. We believe that Mr. Kunkle’s professional experience managing a diverse organization of Laurel Holdings’ size demonstrates his ability to effectively oversee ASRV’s management as a member of the Board and continues to make valuable contributions to ASRV’s committees. Mr. Kunkle is a graduate of Duke University with a bachelor of arts in Management Science. Mr. Kunkle is Non-Executive Vice Chair of the Company and Chair of the Bank’s discount committee.
Jeffrey A. Stopko, 61
Director since: 2015
Other Current Public Company Directorships: None
Other Public Company Directorships within past 5 years: None
Mr. Jeffrey A. Stopko has been the Chief Executive Officer and President of AmeriServ Financial, Inc. since March 24, 2015 and the Chief Executive Officer and President of AmeriServ Financial Bank since February 16, 2016. Mr. Stopko served as Interim Chief Executive Officer and President of AmeriServ Financial, Inc. from January 9, 2015 until March 24, 2015. Mr. Stopko served as Executive Vice President and Chief Financial and Administrative Officer of AmeriServ Financial, Inc. from May 2010 until January 9, 2015, where he directed all administrative services to include finance, information technology, credit administration and human resources. Prior to that, Mr. Stopko served as Chief Financial Officer and Principal Accounting Officer of AmeriServ Financial, Inc. since 1997, where he directed all financial and investment activities. He guided a major corporate balance sheet restructuring at AmeriServ that reduced the risk profile and provided the foundation for improved earnings. He is a licensed Certified Public Accountant with Big Four accounting experience. Mr. Stopko is a 1984 graduate of Bucknell University with a Bachelor of Science degree in Business Administration. Mr. Stopko’s extensive banking experience coupled with his accounting experience enables him to provide the Board with insight as to our operations, policies, and implementation of strategic plans.
Executive Officers
Our current executive officers and certain biographical information regarding them, other than Mr. Stopko, whose information is included above under “Directors,” is listed below. All data is as of the date hereof.
110
David A. Finui, age 69, President and Chief Executive Officer of AmeriServ Trust and Financial Services Company. Effective September 1, 2023, Mr. Finui was appointed the President and Chief Executive Officer of AmeriServ Trust and Financial Services Company. Until such appointment, Mr. Finui was the Executive Vice President and Director of Wealth and Capital Management of AmeriServ Trust and Financial Services Company since January 1, 2019. Prior to this appointment, Mr. Finui served as Senior Vice President/Personal Trust and Financial Services of the Trust Company from September 12, 2016. Prior to joining AmeriServ Trust and Financial Services Company, Mr. Finui was Vice President/Director of Business Development and promoted to Senior Vice President and Senior Wealth Management Advisor of S&T Bank’s Wealth Management division from July 2008 and Vice President/Trust Officer and promoted to Senior Vice President, Senior Wealth Management Advisor, Chief Retail Officer and Chief Operating Officer of Irwin Bank and Trust Company from November 1999.
Michael D. Lynch, age 63, Executive Vice President, Chief Financial Officer, Chief Investment Officer, and Chief Risk Officer of AmeriServ Financial, Inc. Mr. Lynch became Executive Vice President, Chief Financial Officer, Chief Investment Officer, and Chief Risk Officer on April 1, 2021. Mr. Lynch had been interim Chief Financial Officer of AmeriServ Financial, Inc. from January 15, 2015, until such appointment, following the promotion of Mr. Stopko. Mr. Lynch has served as Senior Vice President and Chief Investment and Chief Risk Officer of AmeriServ since 2013. He had been Vice President and Chief Investment Officer of AmeriServ from 2005 to 2013.
Delinquent Section 16(a) Reports
Based solely upon our review of the Forms 3 and Forms 4 filed by the beneficial owners of our Common Stock, we believe all reports required by Section 16(a) of the Exchange Act were filed on time, except for a purchase of Common Stock for Mr. Bloomingdale. This related to a single transaction which was reported once the inadvertent omission was recognized.
Corporate Governance Documents
A copy of our Employee Code of Ethics and Legal Code of Conduct, Code of Conduct for Directors, our Code of Ethics for Senior Financial Officers and the charters of our audit committee, nominating/corporate governance committee, compensation/human resources committee, and investment/ALCO committee are available on our website at https://investors.ameriserv.com/governance/governance-documents and any shareholder may obtain a printed copy of these documents by writing to Investor Relations, AmeriServ Financial, Inc., P.O. Box 430, Johnstown, Pennsylvania 15907-0430, by e-mail at info@ameriserv.com or by calling Investor Relations at (814) 533-5193.
Board and Committees 2023
The Board has various standing committees, including an audit committee, a compensation/human resources committee, an executive committee, an investment/ALCO committee, a nominating/corporate governance committee, and a technology committee, and each committee operates under a written charter. For information regarding availability of certain of these charters, see information under the heading “Corporate Governance Documents” below. Directors are expected to attend meetings of the Board, meetings of the committees on which they serve and the ASRV annual meeting of shareholders. During 2023, the Board held 15 meetings, the audit committee held 8 meetings, the executive committee held 0 meetings, the investment/ALCO committee held 4 meetings, the technology committee held 4 meetings, the compensation/human resources committee held 3 meetings, and the nominating/corporate governance committee held 3 meetings. There was 1 executive session of the Board excluding management. Each director attended at least 75% of the combined total of meetings of the Board and of each committee of which he or she was a member. Each director attended ASRV’s 2023 annual meeting of shareholders.
111
The composition of each of the committees, as of December 31, 2023, is below:
Name | Executive | Technology | Investment/ | Audit | Nominating/ | Compensation/ |
J. Michael Adams, Jr. | X | Chair | X | |||
Richard W. Bloomingdale | X | |||||
Amy Bradley | X | |||||
David J. Hickton | Chair | |||||
Kim W. Kunkle | X | Vice Chair | Vice Chair | |||
Margaret A. O’Malley | Vice Chair | Vice Chair | X | Chair | Vice Chair | X |
Daniel A. Onorato | Chair | Vice Chair | ||||
Mark E. Pasquerilla | Chair | X | X | X | X | Chair |
Jeffrey A. Stopko | X | X | ||||
Michael D. Lynch | X | |||||
David A. Finui | X |
The executive committee serves as a resource for management to seek guidance on issues between regularly scheduled meetings or with respect to matters that generally do not warrant calling a special board meeting. In addition, from time to time, the executive committee is asked to study strategic issues in greater depth. The executive committee is comprised of Directors Pasquerilla (Chair), O’Malley (Vice Chair), Adams and Kunkle.
The technology committee is comprised of Directors Hickton (Chair), O’Malley (Vice Chair), Pasquerilla, Stopko and Mr. Finui. The technology committee facilitates communication and cooperation between the Directors and Management regarding important issues related to technology.
The technology committee’s responsibilities include: (1) monitoring the deployment and usage of Information Technology throughout the Company using reports and presentations from management; (2) oversight of cyber security preparedness through information security reports, discussion of internal events and discussion of cyber security topics pertinent to the Company and the industry; (3) oversight of activities in support of the ASRV disaster recovery/business continuity (DR/BC) oversight to ensure optimal corporate resiliency in the unlikely event of a disaster; and (4) providing broad strategic guidance on the technology direction of ASRV by, among other things, overseeing the development of the ASRV Strategic Technology Plan.
The investment/ALCO committee is comprised of Directors Onorato (Chair), Kunkle (Vice Chair), Bradley, O’Malley, Pasquerilla, Stopko and Michael D. Lynch. This committee ensures the safety and soundness of the Company and its subsidiaries through proper asset/liability management and is responsible for, among other things: developing and overseeing our asset/liability management process, including developing investment policies and monitoring investment activities; monitoring management’s handling of risks to our balance sheet; and monitoring interest rate, liquidity and market risks in accordance with policies approved by the Board. The investment/ALCO committee meets regularly to review investment transactions and to discuss other strategic initiatives that relate to balance sheet management and structure as considered necessary.
The audit committee is comprised of Directors O’Malley (Chair), Onorato (Vice Chair), Bloomingdale, and Pasquerilla each of whom in the judgment of the Board is independent within the meaning of the NASDAQ listing requirements. Mr. Onorato is also designated as the audit committee financial expert and meets the qualifications to serve as such under the NASDAQ listing standards. This designation does not impose any duties, obligations or liabilities on Mr. Onorato that are greater than the duties, obligations or liabilities imposed on the other members of the Audit Committee. The audit committee is responsible for the appointment, compensation, oversight, and termination of our independent auditors. The audit committee is also responsible for oversight of internal audit and loan review. The committee is required to pre-approve audit and certain non-audit services performed by the independent auditors. The committee also assists the Board in providing oversight over the integrity of our financial statements, compliance with applicable legal and regulatory requirements and the performance of our internal audit function. The committee also is responsible for, among other things, reporting to our Board on the results of the annual audit and reviewing the financial statements and related financial and non-financial disclosures included in our Annual Report on Form 10-K and Quarterly Reports on Form 10-Q. Importantly, from a corporate governance perspective, the audit committee regularly evaluates the independent auditors’ independence from ASRV and its management, including approving consulting and other legally permitted, non-audit services provided by our auditors and the potential impact of the services on the auditors’ independence. The committee meets periodically with our independent auditors and our internal auditors
112
outside of the presence of management and possesses the authority to retain professionals to assist it in meeting its responsibilities without consulting with management. The committee reviews and discusses with management earnings releases, including the use of pro forma information (if applicable). The committee also discusses with management and the independent auditors the effect of accounting initiatives. The committee also is responsible for receiving and evaluating complaints and concerns relating to accounting and auditing matters.
The nominating/corporate governance committee is comprised of Directors Adams (Chair), O’Malley (Vice Chair), and Pasquerilla each of whom in the judgment of the Board is independent within the meaning of the NASDAQ listing standards. The nominating/corporate governance committee is responsible for nominating individuals to stand for election as directors at the annual meeting of shareholders, assisting the Board in the event of any vacancy on the Board by identifying individuals qualified to become Board members, recommending to the Board qualified individuals to fill such vacancy, and recommending to the Board, on an annual basis, nominees for each Board committee. The committee has the responsibility to develop and recommend criteria for the selection of director nominees to the Board, including, but not limited to, diversity, age, skills, experience, and time availability (including consideration of the number of other boards on which the proposed director sits) in the context of the needs of the Board and ASRV and such other criteria as the committee determines to be relevant at the time. The committee has the power to apply these criteria in connection with the identification of individuals to be Board members, as well as to apply the standards for independence imposed by our listing agreement with NASDAQ and all applicable federal laws in connection with this identification process.
The nominating/corporate governance committee does not maintain a formal diversity policy with respect to the identification or selection of directors for nomination to the Board. Diversity is just one of many factors the nominating/corporate governance committee considers in the identification and selection of director nominees. ASRV defines diversity broadly to include differences in race, gender, ethnicity, age, viewpoint, professional experience, educational background, skills and other personal attributes that can foster Board heterogeneity in order to encourage and maintain Board effectiveness.
The nominating/corporate governance committee considers potential candidates recommended by its members, management and others, including shareholders. In considering candidates recommended by shareholders, the committee will apply the same criteria it applies in connection with candidates recommended by the nominating/corporate governance committee. Shareholders may propose candidates to the nominating/corporate governance committee by delivering a notice to the nominating/corporate governance committee that contains the information required by Section 1.3 of our Bylaws. In addition, shareholders may nominate persons directly for election as directors in accordance with the procedures set forth in Section 1.3 of our Bylaws. A notice of any such nomination must contain all required information and must be mailed or delivered to our Non-Executive Chairman not less than 90 days or more than 120 days prior to the annual meeting. The nominating/corporate governance committee did not pay any fee to any third party to search for, identify and/or evaluate the 2023 nominees for directors.
The nominating/corporate governance committee is also responsible for making recommendations to the Board regarding, and monitoring compliance with: corporate governance principles applicable to the Company; matters involving the Company’s Articles of Incorporation, Bylaws, shareholder proposals, committee responsibilities and other corporate governance issues; and the Company’s policies, including, but not limited to, its Code of Ethics and Legal Code of Conduct, Code of Conduct for Directors, Code of Ethics for the Chief Executive Officer and Senior Financial Officers, and Policy on Personal Securities Transactions. The committee also serves as the initial reviewing forum for allegations of violations of the policies identified in this paragraph, as well as allegations of wrongdoing concerning directors and the chief executive officer.
The compensation/human resources committee is comprised of Directors Pasquerilla (Chair), Kunkle (Vice Chair), Adams, and O’Malley, each of whom in the judgment of the Board is independent within the meaning of the NASDAQ listing standards. The purpose of the committee is to ensure the compensation programs, including the incentive plans, do not encourage unnecessary or excessive risk to the value of ASRV; support the long-term mission of ASRV and help ASRV attract and retain high quality management and directors through competitive, flexible compensation arrangements that adequately reward significant achievement in a manner that is economically defensible and consistent with corporate performance; and comply with disclosure and other legal, tax and regulatory requirements. The committee’s oversight includes, but are not limited to, an understanding of ASRV’s long-term goals; director compensation; CEO total compensation including base salary compensation, cash-based incentive compensation and stock-based compensation; evaluate and review other executive base compensation, cash-based incentive compensation and stock-based compensation with compensation adjustments for ASRV’s other named executive officers in its proxy
113
statement on an individual basis after receiving recommendations from the CEO; executive employment and change in control agreements; and review of management succession plans. The committee’s processes and procedures for determining executive compensation are described below under “Compensation Discussion and Analysis.” The committee’s procedure for determining director compensation is to benchmark director compensation against compensation paid by similar asset size publicly traded peer financial institutions. The committee also encourages stock ownership by directors by directing that the annual retainer be paid in our Common Stock and by facilitating the use of monthly Board fees for the purchase of additional shares of our Common Stock. The committee also has general oversight of human resources matters at ASRV’s subsidiaries. During 2023, the committee retained Strategic Compensation Planning, Inc. as its independent compensation consultant.
Board Leadership Structure and Risk Oversight
The Board currently separates the role of Non-Executive Chairman of the Board of Directors from the role of President and Chief Executive Officer. We believe that the separation of these roles, while not always necessary, is appropriate in the current economic and regulatory environment in which ASRV operates. We believe that the President and Chief Executive Officer should primarily focus on managing ASRV’s operations in a manner that executes its corporate strategy. Conversely, we believe that our Non-Executive Chairman of the Board of Directors should primarily focus on leading the Board’s oversight of corporate governance matters, monitoring the progress and effectiveness of the President and Chief Executive Officer and management in implementing the Company’s corporate strategy, and ensuring that the Board is receiving, with sufficient frequency, the information it requires to act effectively, including providing proper risk oversight.
We believe that each member of our Board in his or her fiduciary capacity has a responsibility to monitor and manage risks faced by ASRV. The Board has the Chief Risk Officer, representing management, making two detailed presentations to the entire Board each year. These presentations speak of each known risk in the Company, its severity, and the actions of management to eliminate it or at the very least to mitigate it. At a minimum this requires the members of our Board to be actively engaged in Board discussions, review materials provided to them, and know when it is appropriate to request further information from management and/or engage the assistance of outside advisors. Furthermore, because the banking industry is highly regulated, certain risks to ASRV are monitored by the Board through its review of ASRV’s compliance with regulations set forth by its regulatory authorities, including the Pennsylvania Department of Banking and Securities, the Board of Governors of the Federal Reserve System, and the Federal Deposit Insurance Corporation, and recommendations contained in regulatory examinations.
We believe risk oversight is a responsibility for each member of the Board. Each of our committees concentrates on specific risks for which they have an expertise, and each committee is required to regularly report to the Board on its findings. For example, the investment/ALCO committee regularly monitors ASRV’s exposure to certain investment risks, such as the effect of interest rate or liquidity changes, while our audit committee monitors ASRV’s exposure to certain reputational risks by establishing and evaluating the effectiveness of the Company programs to report and monitor fraud and by monitoring ASRV’s internal controls over financial reporting. Our compensation/human resources committee’s role in monitoring the risks related to our compensation structure is discussed in further detail in the section titled “Our Compensation Policies and Risk” below.
Diversity
We are committed to supporting a culture of diversity and inclusion among our workforce and community. We have implemented various training sessions to promote a workforce and work environment that recognizes the value of a diverse employee base.
As we strive to build a more diverse workforce, we also focused on increasing diversity on the Board and the boards of our various subsidiaries. The vetting process for Board members includes diversity as a factor for consideration.
114
Board Diversity Matrix as of March 1, 2024
Total Number of Directors and Director Nominees of the Board:9
Female | Male | Non-Binary | Did Not Disclose Gender | |
Part I: Gender Identity | ||||
Directors and Director Nominees of the Board | 2 | 7 | — | — |
Part II: Demographic Background | ||||
African American or Black | — | — | — | — |
Alaskan Native or Native American | — | — | — | — |
Asian | — | — | — | — |
Hispanic or Latinx | — | — | — | — |
Native Hawaiian or Pacific Islander | — | — | — | — |
White | 2 | 7 | — | — |
Two or More Races or Ethnicities | — | — | — | — |
LGBTQ+ | — | — | — | — |
Did Not Disclose Demographic Background | — | — | — | — |
Insider Trading Policies; Hedging and Pledging Prohibition
We generally do not permit our directors, officers and employees to hedge their economic exposures to our Common Stock that they own by engaging in transactions involving puts, calls, or other derivative securities, zero-cost collars, forward sales contracts, or buying on margin or pledging shares as collateral for a loan, except such limitation shall not apply to our securities pledged by directors and officers as collateral for a loan prior to September 1, 2015. After September 1, 2015, our Board may, in its discretion, approve in advance a pledge of our securities by directors and officers as collateral for a loan in a particular case and as permitted by bank regulations after taking into consideration the magnitude of the number and market value of shares proposed to be pledged in relation to the number of outstanding shares and the market value and trading volume of outstanding shares (generally, the aggregate shares pledged should not exceed 5% of shares outstanding on the date of the pledge), the percentage of shares proposed to be pledged to the total shares owned by the pledger, the amount of shares proposed to be pledged in relation to the total shares then pledged by other directors and officers, and all other factors deemed relevant by our Board. We believe that permitting limited pledging of our securities to serve as collateral for a bona fide loan in appropriate circumstances will encourage our directors and officers to purchase and retain shares. We have also adopted insider trading policies and procedures governing the purchase, sale and/or other disposition of our securities by directors, officers and employees that are reasonably designed to promote compliance with insider trading laws, rules and regulations and applicable listing standards of NASDAQ.
ITEM 11. EXECUTIVE COMPENSATION
Executive Compensation
Introduction
The compensation/human resources committee administers our executive compensation program. The committee, which is composed entirely of independent directors, operates under a written charter and is responsible for determining and recommending to the full Board the total compensation of the President and Chief Executive Officer (the “CEO”) and, with the recommendations of the CEO, evaluating and reviewing the compensation of the other executive officers identified in the Summary Compensation Table that appears following this “Executive Compensation” (we refer to the CEO and the other executive officers identified in that table collectively as the “Named Executive Officers”), for administering our incentive compensation programs (including our stock incentive plan), for approving and overseeing the administration of our employee benefits programs, for providing insight and guidance to management with respect to employee compensation generally, and for reviewing and making recommendations to the Board with respect to director compensation. The committee retained Strategic Compensation Planning, Inc. as its independent compensation consultant for 2023.
115
The compensation/human resources committee annually reviews the adequacy of its charter and recommends changes to the Board for approval. The compensation/human resources committee meets at scheduled times during the year and also acts upon occasion by written consent. The chair of the committee reports on committee activities and makes committee recommendations at meetings of the Board.
Compensation Philosophy
Our executive compensation programs seek to achieve and maintain equity with respect to balancing the interests of shareholders and executive officers, while supporting our need to attract and retain competent executive management. Toward this end, the compensation/human resources committee has developed an executive compensation policy, along with supporting executive compensation plans and programs, which are intended to attain the following objectives:
• | emphasize the enhancement of shareholder value while effectively managing the Company for all key stakeholder groups which also includes customers, employees, and the communities in which we operate; |
•support the acquisition and retention of competent executives;
•deliver the total executive compensation package in a cost-effective manner;
•reinforce key business objectives;
•provide competitive compensation opportunities for competitive results;
•encourage management ownership of our Common Stock; and
•comply with applicable regulations.
The committee collects and analyzes findings regarding competitive positioning of compensation in light of ongoing performance results. These findings generally assess: ASRV’s financial and securities market performance; executive compensation competitiveness by position (survey-based and peer-based); and aggregate organization-wide compensation competitiveness and total personnel costs. In light of this information, the committee recommends executive salary adjustments, recommends executive discretionary incentive/bonus plans, and administers our 2021 Equity Incentive Plan. Additionally, from time to time, the committee reviews other human resource issues, including qualified and non-qualified benefits, management performance appraisals, and succession planning.
In order to make the foregoing assessments, the committee uses comparisons of competitive executive pay practices taken from banking industry compensation surveys and, from time-to-time, consultation with independent executive compensation advisors. Peer groups and competitive compensation practices are determined using executive compensation packages at bank holding companies and subsidiaries of comparable size to us and our subsidiaries. However, the committee does not maintain a specific target percentile with respect to this peer group in determining executive compensation levels; however, our past practice has been to target executive compensation in the lowest quartile of comparable peer groups. A selection of national information is used for comparative compensation survey data, including data from a peer group of small-cap bank holding companies in our geographic area. The peer group, which consists of publicly traded bank holding companies with asset size of between $1 billion and $3 billion, is periodically revised, and, for 2023 compensation decisions, the group consisted of the following companies: ACNB Corporation, Franklin Financial Services Corporation, Chemung Financial Corporation, Codorus Valley Bancorp, Inc., First United Corporation, FNCB Bancorp, Citizens & Northern Corporation, Penns Woods Bancorp, Inc., Orrstown Financial Services, Inc., ESSA Bancorp, Inc., CB Financial Services, Inc., Ohio Valley Bancorp, LINKBANCORP, and Norwood Financial Corporation.
Our executive compensation policy is designed to encourage decisions and actions that have a positive impact on overall corporate performance. For that reason, participation is focused on executive officers who have the greatest opportunity to influence the achievement of strategic corporate objectives.
We use two components of the executive compensation program to establish and maintain the desired relationship between executive pay and performance.
The first component, the formal performance appraisal system, relates to annual salary adjustments. We establish quantitative and qualitative performance factors for each executive position, and annually evaluate the performance of
116
the executive against these standards. We then integrate this appraisal with market-based adjustments to salary ranges to determine if a base salary increase is merited.
The second component of ensuring the desired relationship between executive pay and performance relates to the committee’s role in administering our 2021 Equity Incentive Plan and recommending executive discretionary cash incentive/bonus awards. The committee recommends cash and equity at-risk compensation awards to the Board when, in the judgment of committee members, such awards are justified by the performance of executive officers in relation to our performance with due regard for the level of risk assumed by the company.
The accounting and tax treatment of particular forms of compensation do not materially affect the committee’s compensation decisions. However, the committee evaluates the effect of such accounting and tax treatment on an ongoing basis and will make appropriate modifications to its compensation policies where appropriate.
Components of Compensation
The elements of compensation for the Named Executive Officers are generally comprised of the following:
•base salary,
•incentive opportunities under our cash- and stock-based incentive compensation program,
•equity awards under our 2021 Equity Incentive Plan,
•benefits under our pension plan,
•benefits under our health and welfare benefits plans, and
•certain limited perquisites.
1. Base Salary. The compensation/human resources committee reviews the base salaries of the Named Executive Officers on an annual basis as well as in the event of any promotion or significant change in job responsibilities. The committee reviews peer group data to establish a market-competitive executive base salary program, combined with a formal performance appraisal system that focuses on awards that are integrated with strategic corporate objectives. Salary income for each Named Executive Officer is reported in the Summary Compensation Table, which appears following this Compensation Discussion and Analysis.
2. Incentive Cash and Stock Compensation. We have an established, written executive incentive compensation plan, our Executive At-Risk Incentive Compensation Plan, which generally provides for payment of 75% in cash and 25% in stock for the achievement of corporate performance goals, weighted 75%, and individual performance goals, weighted 25%. In order to receive a payment under the plan, a participant has to be employed on the date of payout. With respect to the corporate performance goals for 2023, we based incentive award opportunities on both an annual company-wide budgeted return on assets (“ROA”) target, with a minimum payout threshold requiring 0.61%, and 65% of the average ROA for the previously named peer group, after excluding the highest and lowest performer. The maximum bonus targets for 2023 were 33%, 25%, and 28% of base salary for Messrs. Stopko, Lynch and Huerth, respectively. The compensation/human resources committee believes it set the performance measures for 2023 such that the performance goals were appropriate. Based upon publicly reported results for the year ended December 31, 2023, the Company reported a net loss of $3.3 million, so there was no payout for any of the named executive officers under the Executive At-Risk Incentive Compensation Plan.
3. Equity Awards. We use the grant of stock options under our 2021 Equity Incentive Plan as the primary vehicle for providing long-term incentive compensation opportunities to our senior officers, including the Named Executive Officers. The 2021 Equity Incentive Plan provides for the grant of restricted stock awards and qualified and non-qualified stock options. We grant all stock options with a per share exercise price that is not less than 100% of the fair market value of such shares on the date that the option is granted. Accordingly, grantees will not obtain any value from the option grant under our 2021 Equity Incentive Plan unless the market price of our Common Stock increases after the date of grant. The 2021 Equity Incentive Plan is designed to provide at-risk (incentive) compensation that aligns management’s financial interests with those of our shareholders, encourages management ownership of our Common Stock, supports the achievement of corporate short and long-term financial objectives, and provides competitive equity reward opportunities. We have not adopted any specific policy regarding the amount or timing of any stock-based
117
compensation under our 2021 Equity Incentive Plan. Information concerning the number of options held by each Named Executive Officer as of December 31, 2023, is set forth in the Outstanding Equity Awards at Fiscal Year-End Table, which appears below. There were no equity awards granted during 2023 to any of the named executive officers.
4. Pension Plan and Deferred Compensation Plan. We maintain a defined benefit pension plan for the benefit of our employees, including the Named Executive Officers. Benefits under the plan are based upon an employee’s years of service and highest average compensation for a five-year period. The 2023 change in the actuarial present values of each Named Executive Officer’s accumulated benefit under the plan for each of Messrs. Stopko, Lynch and Huerth was an increase of $149,650, $124,979 and $176,451, respectively, which is also set forth in the Summary Compensation Table, which appears below. The actuarial present value of each Named Executive Officer’s accumulated benefit under the plan and the aggregate number of years of service credited to each Named Executive Officer is set forth in the Pension Benefits Table, which also appears below. Effective January 1, 2013, we amended the defined benefit pension plan to provide that non-union employees hired on or after that date are not eligible to participate. Effective January 1, 2014, we amended the defined benefit pension plan to provide that union employees hired on or after that date are not eligible to participate. Instead, such employees are eligible to participate in a qualified 401(k) retirement plan. All of the Named Executive Officers continue to participate in the defined benefit pension plan under the old plan provisions.
We also maintain the AmeriServ Financial Executive Deferred Compensation Plan (the “Deferred Compensation Plan”), under which participants who are among a select group of management or highly compensated employees (including our Named Executive Officers) may elect to defer receipt of all or a portion of any annual incentive bonus and/or salary payable to such participants with respect to a fiscal year. Under the Deferred Compensation Plan, each participant may make an irrevocable deferral election before the beginning of the fiscal year to which such compensation relates. Participants can elect to receive distributions of their accounts in the Deferred Compensation Plan, either in a lump sum or in installments, commencing within 30 days following either (i) their separation of service or disability, or (ii) a specified date. Participants may elect to allocate the deferred amounts into an investment account and select among various investment options upon which the rate of return of the deferred amounts will be based. Participants’ investment accounts are adjusted periodically to reflect the deemed gains and losses attributable to the deferred amounts. Each participant is always 100% vested in their investment accounts. The Deferred Compensation Plan is a non-qualified deferred compensation plan. As such, the rights of all participants to any deferred amounts represent our unsecured promise to pay and the deferred amounts remain subject to the claims of the company’s creditors. Information about our Named Executive Officers participation in the Deferred Compensation Plan for 2023 can be found below under the caption “Nonqualified Deferred Compensation Plan.”
5. Health and Welfare Benefits. We provide health, life, and disability insurance, and other employee benefits programs to our employees, including the Named Executive Officers. The compensation/human resources committee is responsible for overseeing the administration of these programs and believes that our employee benefits programs should be comparable to those maintained by other members of our peer group so as to assure that we are able to maintain a competitive position in terms of attracting and retaining officers and other employees. We provide these employee benefits plans on a non-discriminatory basis to all full-time employees.
6. Perquisites. We provide our Named Executive Officers with additional benefits not generally available to our other employees. For example, as set forth in the footnotes to our Summary Compensation Table, which appears below, certain of our Named Executive Officers receive reimbursements for the purchase or lease of, and the operation expenses for, a motor vehicle and for country club membership fees and dues. The compensation/human resources committee believes that these perquisites are offered by its competitors for talented executive officers and allow us to remain competitive in attracting and retaining talented executive officers.
2023 Executive Officer Compensation
For 2023, we increased the Named Executive Officers’ base salaries in order to, among other things, maintain their compensation at a competitive level. The committee’s independent compensation consultant provided a study to the committee, which included the compensation levels of each of the Named Executive Officers and those from the previously identified peer group. The independent compensation consultant also examined with the committee the pay practices from other Pennsylvania, Maryland, New York, New Jersey, and Ohio based financial institutions with assets generally between $1 billion and $3 billion, with data from the Economic Research Institute used to normalize the information for Johnstown, Pennsylvania. The compensation/human resources committee also considered a number of factors in setting these new levels, including an annual review of peer compensation and the overall performance of the company.
118
As part of our compensation program, we entered into agreements with Messrs. Stopko, Lynch and Huerth pursuant to which they will be entitled to receive severance benefits upon the occurrence of certain enumerated events following a change in control. The events that trigger payment are generally those related to termination of employment without cause or detrimental changes in the executive’s terms and conditions of employment. See “Employment Contracts and Payments Upon Termination or Change in Control” below for a more detailed description of these events. We believe that this structure will help: (i) assure the executives’ full attention and dedication to the company, free from distractions caused by personal uncertainties and risks related to a pending or threatened change in control; (ii) assure the executives’ objectivity for shareholders’ interests; (iii) assure the executives of fair treatment in case of involuntary termination following a change in control; and (iv) attract and retain key talent during uncertain times.
Our Compensation Policies and Risk
The compensation/human resources committee discussed, evaluated, and reviewed with our chief risk officer all of the company’s employee compensation programs in light of the risks posed to us by such programs. The compensation/human resources committee also discussed, evaluated, and reviewed with our chief risk officer all of the compensation programs in which the Named Executive Officers participate to assess whether any aspect of these programs create risks that are reasonably likely to have a material adverse effect on us. The compensation/human resources committee met with our chief risk officer in February 2023 and November 2023 with respect to the foregoing.
At the conclusion of this review, the compensation/human resources committee determined that our compensation programs for our Named Executive Officers do not create risks that are reasonably likely to have a material adverse effect on us.
Restatement of Financial Statements
The compensation/human resources committee is of the view that, to the extent permitted by law, it has authority to retroactively adjust any cash or equity-based incentive award paid to any senior officer (including any Named Executive Officer) where the award was based upon our achievement of specified financial goals and it is subsequently determined following a restatement of our financial statements that the specified goals were not in fact achieved. There has been no restatement of our financial statements, and, therefore, there have been no retroactive adjustments of any cash or equity-based incentive award on such a basis.
Compensation Paid to Executive Officers
The following table sets forth information for the years ended December 31, 2021, 2022 and 2023 concerning the compensation of our Named Executive Officers for services in all capacities to us and our subsidiaries.
119
SUMMARY COMPENSATION TABLE
Name, Age and Principal Position | Year | Salary | Bonus | Stock Awards | Option | Non-Equity | Changes in | All Other | Total |
Jeffrey A. Stopko, age 61 | 2023 | 390,830 | 0 | 0 | 0 | 0 | 149,650 | 20,959 | 561,439 |
2022 | 377,423 | 0 | 0 | 0 | 0 | 0 | 21,335 | 398,758 | |
2021 | 362,600 | 47,863 | 0 | 35,400 | 0 | 22,210 | 14,275 | 482,348 | |
Michael D. Lynch, age 63 | 2023 | 239,500 | 0 | 0 | 0 | 0 | 124,979 | 11,771 | 376,250 |
2022 | 231,175 | 0 | 0 | 0 | 0 | 0 | 11,567 | 242,742 | |
2021 | 218,225 | 21,823 | 0 | 26,550 | 0 | 44,318 | 8,009 | 318,925 | |
James T. Huerth, age 62(2) | 2023 | 240,916 | 0 | 0 | 0 | 0 | 192,660 | 259,054 | 692,630 |
2022 | 312,750 | 0 | 0 | 0 | 0 | 0 | 19,631 | 332,281 | |
2021 | 300,950 | 33,706 | 0 | 26,550 | 0 | 75,518 | 16,286 | 453,010 |
| (1) | For 2023, includes, as applicable, (a) premiums we pay for life insurance policies with coverage limits above $50,000 for each named executive officer; (b) country club dues for Messrs. Stopko and Huerth; (c) the aggregate incremental cost of a company-provided automobile for Messrs. Stopko and Huerth and an auto allowance for Lynch; (d) our 401(k) plan matching contributions for each of Messrs. Stopko, Lynch, and Huerth, in the amount of $3,908, $2,371, and $2,409, respectively; and (e) separation amount equal to $244,125 for Mr. Huerth. |
(2) | Effective August 28, 2023, Mr. Huerth ceased to be employed with the Company. |
Outstanding Equity Awards at Fiscal Year-End
The following table sets forth information concerning outstanding equity awards held by each Named Executive Officer as of December 31, 2023.
OUTSTANDING EQUITY AWARDS AT DECEMBER 31, 2023
Option Awards | |||||
Name | Number of | Number of | Equity | Option | Option |
Jeffrey A. Stopko | 25,000 | 0 | 0 | $3.18 | 2/19/2024 |
10,000 | 0 | 0 | $2.96 | 3/19/2025 | |
13,333 | 6,667(1) | 0 | $3.84 | 2/17/2031 | |
Michael D. Lynch | 6,000 | 0 | 0 | $2.96 | 4/11/2026 |
10,000 | 5,000(1) | 0 | $3.84 | 2/17/2031 | |
James T. Huerth | 10,000 | 0 | 0 | $3.84 | 2/17/2031 |
(1) | Vested on February 17, 2024. |
Pension Benefits
The following table sets forth information concerning plans that provide for payments or other benefits at, following, or in connection with, retirement for each Named Executive Officer.
120
PENSION BENEFITS
FOR THE YEAR ENDED DECEMBER 31, 2023
Name | Plan Name | Number of | Present | Payments |
Jeffrey A. Stopko | Defined Benefit Plan | 37 | 1,065,555 | 0 |
Michael D. Lynch | Defined Benefit Plan | 41 | 987,982 | 0 |
James T. Huerth | Defined Benefit Plan | 14 | 939,681 | 0 |
(1) | The present value of accumulated benefits was calculated with the following assumptions. Retirement occurs at age 65. At that time, the participants take a lump sum based on the accrued benefit as of December 31, 2023. The lump sum is calculated using an interest rate of 5.12% and the IRS 2024 applicable mortality table for IRC Section 417(e). The lump sum is discounted to December 31, 2023, at a rate of 5.12% per year. |
Benefits described in the foregoing table relate to the qualified defined benefit retirement plan. Remuneration for pension benefit purposes is total cash remuneration paid to an employee for a calendar year, including base salary, wages, commissions, overtime, bonuses and any other form of extra cash compensation and any pre-tax contributions under a qualified retirement or cafeteria plan. Effective January 1, 2015, excluded items include amounts contributed by the Employer under the plan, non-taxable fringe benefits, country club dues, company-paid automobiles, cafeteria plan refund reimbursements and employee automobile allowances. Effective January 1, 2016, excluded items also include our contributions to a health savings account. An employee’s benefit is determined on the basis of the employee’s final average compensation, which means the average annual compensation received by the employee in the five consecutive years out of ten years before the employee’s termination of employment for which the average annual compensation is highest.
As of December 31, 2023, Messrs. Stopko, Lynch, and Huerth are eligible for an early retirement benefit under the pension plan because they are at least 55 years old and have at least 10 years of credited service. The early retirement benefit is equal to the accrued normal retirement benefit reduced by five-ninths of one percent (5/9%) per month for each of the first five years and by five-eighteenths of one percent (5/18%) per month for each of the next five years by which the commencement date of the pension precedes the normal retirement date. Effective August 28, 2023, Mr. Huerth ceased to be employed with the Company and, as of December 31, 2023, had not yet elected to commence his benefit hereunder.
Retirement benefits under the pension plan are paid for the life of the employee with a right of survivorship with respect to ten years of post-retirement benefits. Other optional forms of benefits are available in actuarially equivalent amounts.
Nonqualified Deferred Compensation Plan
Set forth below is information regarding our Named Executive Officers’ participation in the AmeriServ Financial Executive Deferred Compensation Plan.
Nonqualified Deferred Compensation — 2023
Name | Executive | Registrant | Aggregate | Aggregate | Aggregate |
James T. Huerth | 21,463 | — | 16,209 | — | 344,127 |
Employment Contracts and Payments Upon Termination or Change in Control
We enter into employment contracts and change in control agreements with certain of our employees, including the Named Executive Officers, when we determine that an employment or change in control agreement is warranted in order to ensure the executive’s continued employment in light of prevailing market competition for the particular position held
121
by the executive officer, or where it is determined it is necessary in light of the prior experience of the executive or our practices with respect to other similarly situated employees.
Mr. Stopko’s Employment Agreement
In connection with Mr. Stopko’s appointment as our President and Chief Executive Officer on April 27, 2015, we entered into an employment agreement with Mr. Stopko, which was for a period of two years from the effective date and automatically renews annually for a one-year term unless one party provides the other party a written non-renewal notice at least 90 days in advance of the end of such period. The employment agreement provides that Mr. Stopko must maintain a primary residence during his employment term in our primary market area and generally provides that Mr. Stopko may not compete with our business for at least two years following termination of his employment or solicit any of its employees, consultants, customers, clients, or vendors for at least one year following termination of his employment. Under his employment agreement, Mr. Stopko is entitled to, among other things: (i) an annual base salary of $285,000 ($393,930 as of December 31, 2023); (ii) participate in our health insurance and life insurance benefit plans, defined benefit program, 401(k) plan and long-term disability benefit plan; (iii) be eligible to receive annual bonuses, in such amounts and at such times, if any, as may be approved by our Board in accordance with the Executive At-Risk Compensation Plan as a level one participant, with such annual payment not to exceed 33% of Mr. Stopko’s base salary; and (iv) certain other perquisites related to personal time, use of a vehicle owned or leased by us, and country club membership expenses.
The employment agreement and Mr. Stopko’s employment may be terminated for cause (as defined in the employment agreement) by written notice from us. If the employment agreement is terminated for cause, Mr. Stopko’s rights under the employment agreement terminate as of the effective date of termination. The employment agreement also terminates without further payments to Mr. Stopko as of the termination date, in the event of his voluntary termination of employment (other than as specified following a change in control as defined in the employment agreement), retirement at his election, death or disability (as defined in the employment agreement). Mr. Stopko agrees that, in the event his employment under the employment agreement is terminated for any reason, he will concurrently resign as our director and a director of any of our respective affiliates if he is then serving as a director of any such entities.
In the event that Mr. Stopko’s employment is either involuntarily terminated other than for cause or disability in the absence of a change in control (as defined in the employment agreement), he will continue to receive his monthly base salary in effect on the date of termination for a period of twenty-four months and health insurance benefits substantially similar to those which Mr. Stopko was receiving immediately prior to the date of termination for the two year period immediately following the date of termination; provided that Mr. Stopko will be responsible for the payment of premiums for such benefits in the same amount as our active employees.
In the event that, following a change in control, either Mr. Stopko’s employment is terminated involuntarily other than for cause or disability or Mr. Stopko resigns after the occurrence of certain specified occurrences described below, Mr. Stopko will generally receive a cash lump-sum payment within 30 days following his termination in an amount equal to 2.99 times his annual base salary then in effect. In addition, for a period of three years following termination, we will arrange to provide Mr. Stopko with health insurance benefits substantially similar to those which Mr. Stopko was receiving immediately prior to the date of termination effect; provided that Mr. Stopko will be responsible for the payment of premiums for such benefits in the same amount as our active employees.
The additional specified circumstances include:
• | a reduction in his title, responsibilities, including reporting responsibilities, or authority, including such title, responsibilities, or authority as such may have been increased from time to time during the term of the employment agreement, which results in a material negative change to Mr. Stopko in the employment relationship; |
• | the assignment of Mr. Stopko to duties inconsistent with his office as existed on the day immediately prior to the date of a change in control, which results in a material negative change to Mr. Stopko in the employment relationship; |
• | a reduction in Mr. Stopko’s annual base salary in effect on the day immediately prior to the date of the change in control; |
122
• | a termination of Mr. Stopko’s participation, on substantially similar terms, in any of our incentive compensation or bonus plans in which Mr. Stopko participated immediately prior to the change in control, or any change or amendment to any of the substantive provisions of any of such plans which would materially decrease the potential benefits to Mr. Stopko under any of such plans; |
• | a failure by us to provide Mr. Stopko with benefits at least as favorable as those enjoyed by Mr. Stopko under any of our pension, life insurance, medical, health and accident, disability or other employee plans in which Mr. Stopko participated immediately prior to the change in control, or the taking of any action by us that would materially reduce any of such benefits in effect at the time of the change in control, unless such reduction relates to a reduction in benefits applicable to all employees generally; or |
•our material breach of the employment agreement.
The employment agreement provides that in the event that any amounts or benefits payable to Mr. Stopko under the employment agreement as a result of his termination of employment, when added to other amounts or benefits which may become payable to him by us, would be subject to an excise tax, the amounts and benefits payable under the employment agreement will be reduced to such extent as may be necessary to avoid such imposition.
The employment agreement generally defines the term “change in control” as the occurrence of any of the following during the term of the employment agreement:
• | any “person” or “group” which is not an affiliate of AmeriServ (as those terms are defined or used in Section 13(d) of the Exchange Act), as enacted and in force on the date of the employment agreement) is or becomes the “beneficial owner” (as that term is defined in Rule 13d-3 under the Exchange Act, as enacted and in force on the date of the employment agreement) of our securities representing fifty percent (50%) or more of the combined voting power of our securities then outstanding; or |
• | there occurs a merger, consolidation, share exchange, division or other reorganization involving us and another entity which is not our affiliate in which our shareholders do not continue to hold a majority of the capital stock of the resulting entity, or a sale, exchange, transfer, or other disposition of substantially all of our assets to another entity or other person which is not our affiliate. |
The employment agreement generally defines the term “cause” as:
• | a material breach of the employment agreement by Mr. Stopko that is not cured by Mr. Stopko within 30 days following the date he received written notice from us of our intent to terminate his employment for cause as a result of such material breach; |
• | Mr. Stopko’s commission of any act involving dishonesty or fraud or conduct, whether or not said act brings us into public disgrace or disrepute in any respect, including but not limited to acts of dishonesty or fraud, commission of a felony or a crime of moral turpitude; |
• | gross negligence or willful misconduct by Mr. Stopko with respect to us or Mr. Stopko’s continuing and unreasonable refusal to substantially perform his duties with us as specifically directed by the Board; or |
• | Mr. Stopko’s abuse of drugs, alcohol, or other controlled substances if Mr. Stopko has refused treatment for such substance abuse or has failed to successfully complete treatment for such substance abuse within the past 12 months. |
In connection with the employment agreement, a termination for “good reason” will be considered to have occurred if such termination occurs absent a change in control and is on account of a reduction in the Executive’s annual base salary except for: (i) across-the-board salary reductions similarly affecting all our salaried employees; or (ii) across-the-board salary reductions similarly affecting all our senior executive officers. Mr. Stopko’s right to terminate employment for good reason is subject to the following conditions: (a) we will pay amounts payable upon a good reason termination if Mr. Stopko actually terminates employment within two years following the initial existence of the good reason event; and (b) Mr. Stopko must provide written notice to us of the good reason event within 90 days of the initial existence of the event and we must be given at least 30 days to remedy such situation.
123
Mr. Lynch’s Change in Control Agreement
On February 19, 2016, we entered into a change in control agreement with Mr. Lynch. The initial term of the agreement is for three years and the agreement annually renews for a term ending three years from each annual anniversary date, unless a party has given the other party written notice at least 60 days prior to such anniversary date that such party does not agree to renew the employment agreement. Under the agreement, if we or a successor terminate Mr. Lynch’s employment, without cause, or if Mr. Lynch terminates employment upon the occurrence of certain events (following his written notice to us within 90 days of the occurrence of any event of good reason and our failure to cure the same within 30 days of receipt of such notice) following a change in control, he will be entitled to certain severance benefits; provided that he executes a release agreement. The severance benefits under the agreement consist of the following:
• | a lump-sum payment, within 30 days following termination, equal to one times his base salary then in effect, or immediately prior to any reduction which would entitle to Mr. Lynch to terminate his employment under certain circumstances under the agreement; |
• | a lump-sum payment, within 30 days following termination, equal to the present value (determined based upon 120% of the then prevailing monthly short-term applicable federal rate) of the excess of (i) the aggregate retirement benefits Mr. Lynch would have received under the terms of each and every retirement plan (as defined in the agreement) had he (A) continued to be employed for one more year, and (B) received (on a pro rata basis, as appropriate) the greater of (1) the highest compensation taken into account under each such retirement plan with respect to one of the two years immediately preceding the year in which the date of termination occurs, or (2) his annualized base compensation in effect prior to the date of termination (or prior to any reduction which would entitle to Mr. Lynch to terminate his employment under certain circumstances under the agreement), over (ii) the retirement benefits he actually receives under the retirement plans; |
• | for a period of one year from the date of termination of employment, life, disability, and medical insurance benefits will be provided at levels equivalent to the highest levels in effect for Mr. Lynch during any one of the three calendar years preceding the year in which notice of termination is delivered, or, to the extent such benefits cannot be provided under a plan because Mr. Lynch is no longer an employee, a lump sum cash payment equal to the after tax cost (estimated in good faith by us) of obtaining such benefits, or substantially similar benefits, within 30 days following termination; and |
• | all unvested stock options will become immediately vested, and such options will be exercisable at any time prior to the earlier of the expiration date of such options or the date which is 90 days after termination of employment. |
If Mr. Lynch becomes entitled to receive the severance benefits under the agreement, he will be subject to a covenant not to compete and an agreement not to solicit our customers or employees for 12 months following termination of employment.
The agreement generally defines the term “change in control” as the occurrence of any of the following during the term of the agreement:
• | any “person” or “group” (as those terms are defined or used in Section 13(d) of the Exchange Act), as enacted and in force on the date of the agreement) is or becomes the “beneficial owner” (as that term is defined in Rule 13d-3 under the Exchange Act, as enacted and in force on the date of the agreement) of our securities representing 24.99% or more of the combined voting power of our securities then outstanding; or |
• | there occurs a merger, consolidation, share exchange, division or other reorganization involving us and another entity which is not our affiliate in which our shareholders do not continue to hold a majority of the capital stock of the resulting entity, or a sale, exchange, transfer, or other disposition of substantially all of our assets to another entity or other person; or |
• | there occurs a contested proxy solicitation or solicitations of our shareholders which results in the contesting party or parties obtaining the ability to elect a majority of the members of our Board standing for election at one or more meetings of our shareholders. |
124
The agreement generally defines the term “cause” as:
• | a material breach of any provision of the agreement that Mr. Lynch fails to cure within 30 days following his receipt of written notice from us specifying the nature of his breach; or |
• | willful misconduct of Mr. Lynch that is materially adverse to the best interests, monetary or otherwise, of AmeriServ; or |
• | conviction, or the entering of a plea of guilty or nolo contendere, of a felony or of any crime involving moral turpitude, fraud or deceit. |
The additional specified triggering circumstances following a change in control include:
• | any material reduction in his title, responsibilities, including reporting responsibilities, or authority, including such title, responsibilities, or authority as such may have been increased from time to time during the term of the agreement; |
• | the assignment of Mr. Lynch to duties inconsistent with his office as existed on the day immediately prior to the date of a change in control, which has a material negative impact to Mr. Lynch on the employment relationship; |
• | any material reduction in Mr. Lynch’s annual base salary in effect on the day immediately prior to the date of the change in control; |
• | any failure to continue Mr. Lynch’s participation, on substantially similar terms, in any of our incentive compensation or bonus plans in which Mr. Lynch participated immediately prior to the change in control, or any change or amendment to any of the substantive provisions of any of such plans which would materially decrease the potential benefits to Mr. Lynch under any of such plans; |
• | any failure by us to provide Mr. Lynch with benefits at least as favorable as those enjoyed by Mr. Lynch under any of our pension, life insurance, medical, health and accident, disability or other employee plans in which Mr. Lynch participated immediately prior to the change in control, or the taking of any action by us that would materially reduce any of such benefits in effect at the time of the change in control, unless such reduction relates to a reduction in benefits applicable to all employees generally; or |
•our breach of any provision of the agreement.
Mr. Huerth’s Employment Agreement
On August 28, 2023, Mr. Huerth was separated from employment with the Company and its affiliates. Under the terms of his employment agreement, dated May 10, 2010, with the Bank, Mr. Huerth received a severance payment equal to 0.75 times his annual base salary currently in effect and nine months of continued health insurance benefits, which amounted to, in the aggregate, $244,125.
125
The table below summarizes the payments the Named Executive Officers (other than Mr. Huerth which is described above) would receive if they were terminated as of, or if a change in control occurred on, December 31, 2023.
Before Change in Control | After Change in Control | ||||||
Termination | Involuntary | Involuntary | Voluntary | Involuntary | Voluntary | ||
Jeffery A. Stopko | Severance(1) | $0 | $0 | $733,734 | $733,734 | $1,168,582 | $1,168,582 |
Welfare continuation(2) | $0 | $0 | $27,525 | $27,525 | $ 40,072 | $ 40,072 | |
Value of Accelerated Stock Options | $0 | $0 | $0 | $0 | $ 0 | $ 0 | |
Potential reduction in payout due to operation of Code Section 280G | $0 | $0 | $0 | $0 | $(127,176) | $ (127,176) | |
Total | $0 | $0 | $761,259 | $761,259 | $1,081,477 | $1,081,477 | |
Michael D. Lynch | Severance(1) | $0 | $0 | $0 | $0 | $239,500 | $239,500 |
Additional retirement benefit payment | $0 | $0 | $0 | $0 | $127,350 | $127,350 | |
Welfare continuation(2) | $0 | $0 | $0 | $0 | $17,835 | $17,835 | |
Value of Accelerated Stock Options | $0 | $0 | $0 | $0 | $0 | $0 | |
Potential reduction in payout due to operation of Code Section 280G | $0 | $0 | $0 | $0 | $0 | $0 | |
Total | $0 | $0 | $0 | $0 | $384,685 | $384,685 | |
(1) | For severance and welfare continuation payment calculation, and time and form of such payments, see “Employment and Severance Agreements.” |
(2) | Assumes no increase in the cost of welfare benefits. |
Compensation of Directors
The following table sets forth information concerning compensation that we or the Bank or the Trust Company paid or accrued to each non-employee member of our Board during the year ended December 31, 2023.
Name | Fees Earned or Paid | Stock Awards | Total |
J. Michael Adams, Jr. | $98,500 | $27,500 | $126,000 |
Amy Bradley | $35,400 | $27,500 | $62,900 |
Richard W. Bloomingdale | $19,400 | $16,038 | $35,438 |
Allan R. Dennison(2) | $45,000 | $11,458 | $56,458 |
David J. Hickton | $19,200 | $16,042 | $35,242 |
Kim W. Kunkle | $63,950 | $27,500 | $91,450 |
Margaret A. O’Malley | $42,700 | $27,500 | $70,200 |
Daniel A. Onorato | $30,600 | $27,500 | $58,100 |
Mark E. Pasquerilla | $52,000 | $27,500 | $79,500 |
Sara A. Sargent(2) | $23,500 | $11,458 | $34,958 |
(1) | Represents the price paid for such shares purchased in the open market. All non-employee independent directors serving as of May 16, 2023, received an annual retainer of $27,500 payable in shares of our Common Stock, which amounted to 9,557 shares with the exception of Mr. Bloomingdale and Mr. Hickton who became Directors after May 16, 2023. Mr. Bloomingdale received an annual retainer of $16,038 payable in shares of our Common Stock, which amounted to 4,866 shares. Mr. Hickton received an annual retainer of $16,041 payable in shares of our Common Stock, which amounted to 4,998 shares. Board meeting and committee meeting attendance fees are paid in cash. For such stock awards, the Trust Company engages in open market purchases on each director’s behalf over a period of several days until sufficient shares are purchased for the account of all directors up to the annual retainer amount. Shares are allocated to the accounts of each director on the basis of such average price. |
(2) | Each of Mr. Dennison and Ms. Sargent retired as members of our Board on May 26, 2023. |
126
In 2023, all ASRV and Bank board meetings were held separately with separate agendas and minutes. During 2023, non-employee directors received $1,000 for each ASRV Board meeting and $750 for each Bank board meeting attended and received $600 for their attendance at certain committee meetings of the ASRV and Bank board of directors. In 2023, each committee Chair received an annual retainer of $2,500 in addition to the committee meeting fee. However, directors frequently were not compensated for specially called committee meetings, telephonic meetings, or committee meetings convened for a limited purpose. Mr. Adams, in connection with his service as non-executive Chairman of the Board and all subsidiaries after May 26, 2023, received a monthly retainer of $9,000. Mr. Kunkle, in connection with his service as non-executive Vice Chairman of the Board and all subsidiaries after May 26, 2023, received a monthly retainer of $6,000. Prior to his retirement, Mr. Dennison, in connection with his service as non-executive Chairman of the Board and all subsidiaries during 2023, received a monthly retainer of $9,000.
Directors Adams, Kunkle and O’Malley are also directors of the Trust Company. Prior to their respective retirements, Mr. Dennison and Ms. Sargent were also directors of the Trust Company. Directors serving on the board of directors of the Trust Company, other than Mr. Adams after May 26, 2023 and Mr. Dennison, received $750 for each Trust Company board of directors meeting attended. Mr. Adams receives no additional compensation for attending such meetings after his appointment as Non-Executive Chairman of the Board. Mr. Dennison received no additional compensation for attending such meetings.
Mr. Adams and, prior to his retirement, Mr. Dennison also serve on the board of directors of West Chester Capital Advisors, a wholly-owned subsidiary of the Bank. Messrs. Adams and Dennison received no additional compensation for attending such meetings.
Director Deferred Compensation Plan
Under the Deferred Compensation Plan for Directors of AmeriServ Financial, Inc., which we refer to as the “Director Plan,” each director may defer receipt of all or a portion of any cash fees that are payable to the director for service on our Board or that of our affiliate. Deferred fees either: (i) accrue simple interest daily from the date of the deferral election until the date of distribution at an annual rate of return determined by the administrator of the Director Plan, in its sole discretion; or (ii) in the discretion of the administrator of the Director Plan, achieve a pre-tax rate of return based upon the participant’s selection among various investment options from the date of the deferral election until the date of distribution. Each participant is 100% vested with respect to the amounts deferred and any earnings with respect to such deferral. The Director Plan is a nonqualified deferred compensation plan. As such, the rights of all participants to any deferred amounts represent our unsecured promise to pay and the deferred amounts remain subject to the claims of our creditors.
Compensation/Human Resources Committee Interlocks and Insider Participation
Directors Pasquerilla (Chair), Kunkle (Vice Chair), Adams, and O’Malley are excluded from participation in any plan administered by the compensation/human resources committee while serving as a member of such committee, except for participation in the Independent Directors’ Annual Retainer Plan (the committee’s administration of which is limited to coordinating the payment of a predetermined retainer), a non-employee director deferred compensation plan, and the 2021 Equity Incentive Plan, which was previously approved by shareholders on April 27, 2021.
None of our executive officers serves as a member of the Board, or on the compensation committee, of any entity that has one or more executive officers serving on our Board or compensation/human resources committee.
127
Pay Versus Performance Information
In August 2022, the SEC adopted final rules to implement Section 953(a) of the Dodd-Frank Wall Street Reform and Consumer Protection Act. The following information about the relationship between executive compensation actually paid and certain financial performance of the Corporation is provided pursuant to Item 402(v) of SEC Regulation S-K.
Year | | | Summary | | | Compensation | | | Average | | | Average | | | Value of | | | Net Income | ||||||||||||||||||
(a) | | | (b) | | | (c) | | | (d) | | | (e) | | | (f) | | | (g) | ||||||||||||||||||
2023 | | | | $ | 561,439 | | | | | $ | 519,383 | | | | | $ | 534,440 | | | | | $ | 522,473 | | | | | $ | 107.35 | | | | | $ | (3,346) | |
2022 | $ | 398,758 | $ | 403,714 | $ | 287,512 | $ | 291,170 | $ | 132.75 | $ | 7,448 | ||||||||||||||||||||||||
2021 | | | | $ | 482,348 | | | | | $ | 510,997 | | | | | $ | 385,968 | | | | | $ | 408,148 | | | | | $ | 126.20 | | | | | $ | 7,072 | |
(1) | The dollar amounts reported in column (b) are the amounts of total compensation reported for Mr. Stopko (President and Chief Executive Officer) for each corresponding year in the “Total” column of the Summary Compensation Table. Refer to “Executive Compensation—Summary Compensation Table.” |
(2) | The dollar amounts reported in column (c) represent the amount of “compensation actually paid” to Mr. Stopko, as computed in accordance with Item 402(v) of SEC Regulation S-K. The dollar amounts do not reflect the actual amount of compensation earned by or paid to Mr. Stopko during the applicable year. In accordance with the requirements of Item 402(v) of Regulation S-K, the following adjustments were made to Mr. Stopko’s total compensation for each year to determine the compensation actually paid: |
Year | | | Reported | | | Reported | | | Equity | | | Compensation | ||||||||||||
2023 | | | | $ | 561,439 | | | | | $ | — | | | | | $ | (42,056) | | | | | $ | 519,383 | |
2022 | | | | $ | 398,758 | | | | | $ | — | | | | | $ | 4,956 | | | | | $ | 403,714 | |
2021 | | | | $ | 482,348 | | | | | $ | 35,400 | | | | | $ | 28,649 | | | | | $ | 510,997 | |
(a) | The grant date fair value of equity awards represents the total of the amounts reported in the “Option Awards” columns in the Summary Compensation Table for the applicable year. |
(b) | The equity award adjustments for each applicable year include the addition (or subtraction, as applicable) of the following: (i) the year-end fair value of any equity awards granted in the applicable year that are outstanding and unvested as of the end of the year; (ii) an amount equal to the change as of the end of the applicable year (from the end of the prior fiscal year) in fair value of any awards granted in prior years that are outstanding and unvested as of the end of the applicable year; (iii) for awards that are granted and vest in same applicable year, the fair value as of the vesting date; (iv) for awards granted in prior years that vest in the applicable year, an amount equal to the change as of the vesting date (from the end of the prior fiscal year) in fair value; (v) for awards granted in prior years that are determined to fail to meet the applicable vesting conditions during the applicable year, a deduction for the amount equal to the fair value at the end of the prior fiscal year; and (vi) the dollar value of any dividends or other earnings paid on stock or option awards in the applicable year prior to the vesting date that are not otherwise reflected in the fair value of such award or included in any other component of total compensation for the applicable year. The valuation assumptions used to calculate fair values did not materially differ from those disclosed at the time of grant. The amounts deducted or added in calculating the equity award adjustments are as follows: |
128
Year | | Year End | | | Year over | | | Fair Value as | | | Year over | | | Fair Value at | | | Value of | | | Total | |||||||||||||||||||||||||
2023 | | | $ | — | | | | | $ | (4,667) | | | | | $ | — | | | | | $ | (37,389) | | | | | $ | — | | | | | $ | — | | | | | $ | (42,056) | |||||
2022 | | | $ | — | | | | | $ | 933 | | | | | $ | — | | | | | $ | 4,023 | | | | | $ | — | | | | | $ | — | | | | | $ | 4,956 | |||||
2021 | | | $ | 35,600 | | | | | $ | — | | | | | $ | — | | | | | $ | 28,449 | | | | | $ | — | | | | | $ | — | | | | | $ | 28,649 | |||||
(3) | The dollar amounts reported in column (d) represent the average of the amounts reported for our company’s named executive officers as a group (excluding Mr. Stopko) in the “Total” column of the Summary Compensation Table in each applicable year. The names of each of the named executive officers (excluding Mr. Stopko) included for purposes of calculating the average amounts in each applicable year are as follows: for 2023, 2022 and 2021, Mr. Huerth, and Mr. Lynch. |
(4) | The dollar amounts reported in column (e) represent the average amount of “compensation actually paid” to the named executive officers as a group (excluding Mr. Stopko), as computed in accordance with Item 402(v) of Regulation S-K. The dollar amounts do not reflect the actual average amount of compensation earned by or paid to the named executive officers as a group (excluding Mr. Stopko) during the applicable year. In accordance with the requirements of Item 402(v) of Regulation S-K, the following adjustments were made to average total compensation for the named executive officers as a group (excluding Mr. Stopko) for each year to determine the compensation actually paid, using the same methodology described in Note 2 above: |
Year | | | Average | | | Average | | | Average Equity | | | Average | |||||||||||
2023 | | | | $ | 534,440 | | | | | $ | — | | | | | $ | (11,967) | | | | | $ | 522,473 |
2022 | | | | $ | 287,512 | | | | | $ | — | | | | | $ | 3,658 | | | | | $ | 291,170 |
2021 | | | | $ | 385,968 | | | | | $ | 26,550 | | | | | $ | 22,180 | | | | | $ | 408,148 |
(a) | The amounts deducted or added in calculating the total average equity award adjustments are as follows: |
Year | | Year End | | Year over | | Fair Value as | | Year over | | Fair Value at | | Value of | | Total | |||||||||||||||||||||
2023 | | | $ | — | | | | $ | (1,750) | | | | $ | — | | | | $ | (10,217) | | | | $ | — | | | | $ | — | | | | $ | (11,967) | |
2022 | | | $ | — | | | | $ | 700 | | | | $ | — | | | | $ | 2,958 | | | | $ | — | | | | $ | — | | | | $ | 3,658 | |
2021 | | | $ | 26,700 | | | | $ | — | | | | $ | — | | | | $ | 22,030 | | | | $ | — | | | | $ | — | | | | $ | 22,180 | |
(5) Cumulative TSR is calculated by dividing the sum of the cumulative amount of cash dividends for the measurement period, assuming dividend reinvestment, and the difference between the Corporation’s share price at the end and the beginning of the measurement period by the share price at the beginning of the measurement period.
(6) The dollar amounts reported represent the amount of net income (loss) reflected in our consolidated audited financial statements for the applicable year.
129
Analysis of the Information Presented in the Pay Versus Performance Table
In accordance with Item 402(v) of Regulation S-K, we are providing the following descriptions of the relationships between information presented in the Pay Versus Performance Table.
Compensation Actually Paid and Net Income (Loss)
In 2021 and 2022, net income was $7.1 million and $7.4 million, respectively, representing a 5.32% increase year over year. In 2023, net income was negative $3.3 million, representing a 144.9% decrease year over year from 2022. The graph below displays the relationship between this net income fluctuation and compensation actually paid to the PEO and NEOs:
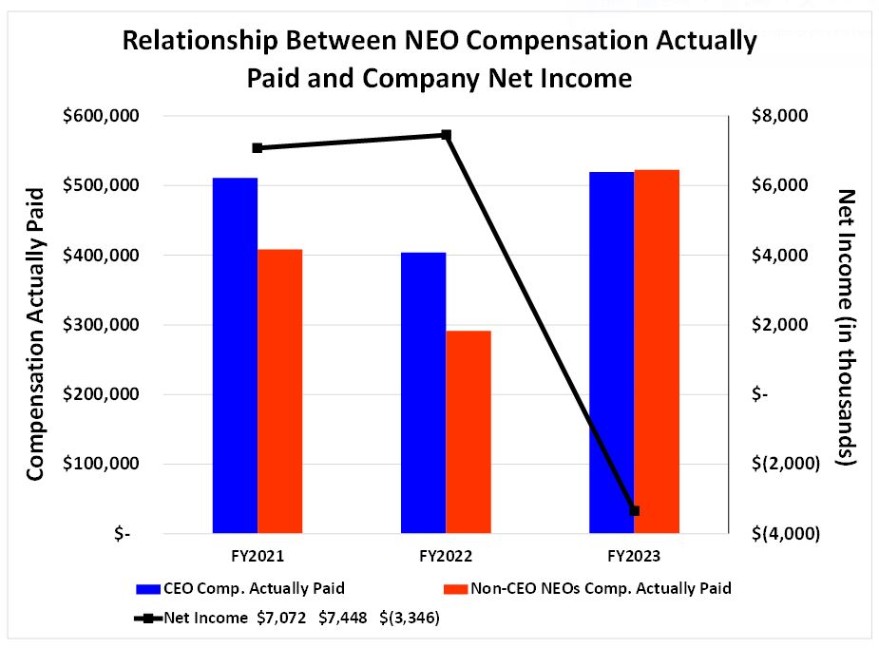
130
Compensation Actually Paid and Cumulative TSR
In 2021, 2022, and 2023 our cumulative TSR on the value of a fixed $100 investment was $126.20, $132.75, and $107.35 respectively. The graph below displays the relationship between the change in the cumulative TSR and compensation actually paid to the PEO and NEOs:
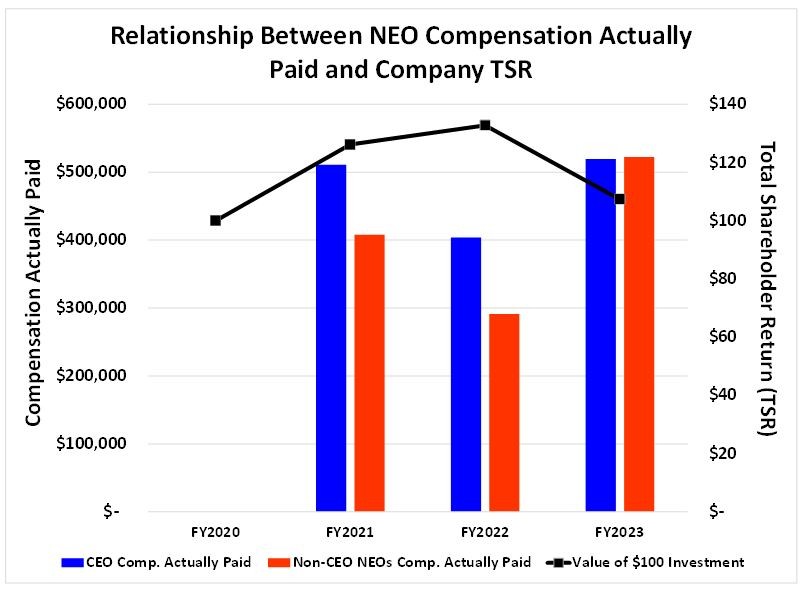
All information provided above under the “Pay Versus Performance Information” heading will not be deemed to be incorporated by reference in any filing of our company under the Securities Act of 1933, as amended, whether made before or after the date hereof and irrespective of any general incorporation language in any such filing.
131
ITEM 12. SECURITY OWNERSHIP OF CERTAIN BENEFICIAL OWNERS AND MANAGEMENT AND RELATED STOCKHOLDER MATTERS
Equity Compensation Plan Information
The following table summarizes the number of shares remaining for issuance under the Company’s outstanding equity incentive plans as of December 31, 2023.
Equity Compensation Plan Information | |||||||
|
|
| Number of securities | ||||
|
| remaining available for | |||||
|
| future issuance under | |||||
| Number of securities |
| Weighted-average | equity compensation | |||
| to be issued upon exercise |
| exercise price of | plans (excluding | |||
of outstanding options, | outstanding options, | securities reflected in | |||||
warrants and rights | warrants and rights | column (a)) | |||||
Plan category | (a) | (b) |
| (c) | |||
Equity compensation plans approved by security holders |
| 245,000 | $ | 3.64 |
| 600,000 | |
Equity compensation plans not approved by security holders |
| — |
| — |
| — | |
Total |
| 245,000 | $ | 3.64 |
| 600,000 | |
Security Ownership of Directors and Management
The following table sets forth information concerning the number of shares of our Common Stock beneficially owned, as of March 1, 2024, by each present director, nominee for director, and each executive officer named in the Summary Compensation Table as well as by all directors, nominees, and executive officers as a group.
Name of Beneficial Owner(1) | Shares Beneficially | Percent | ||
J. Michael Adams, Jr.(3) | 152,438 | * | ||
Richard W. Bloomingdale | 9,919 | * | ||
Amy Bradley | 14,098 | * | ||
David A. Finui(2) | 21,143 | |||
David J. Hickton | 4,998 | * | ||
Kim W. Kunkle(4) | 214,413 | 1.3 | ||
Michael D. Lynch(2) | 35,332 | * | ||
Margaret A. O’Malley | 357,328 | 2.1 | ||
Daniel A. Onorato | 33,502 | * | ||
Mark E. Pasquerilla(5) | 486,237 | 2.8 | ||
Jeffrey A. Stopko(2)(6) | 164,189 | * | ||
Officers, Directors and Nominees for Director as a Group (11 persons)(2) | 1,493,597 | 8.7% |
* | Less than 1% |
(1) | Except as noted below, each of the identified beneficial owners, including the officers, directors and nominees for director, has sole investment and voting power as to all the shares beneficially owned with the exception of those held jointly by certain officers, directors and nominees for director with their spouses or directly by their spouses or other relatives. In addition, unless otherwise indicated, the address for each person is c/o AmeriServ Financial, Inc., P.O. Box 430, Johnstown, Pennsylvania 15907-0430. |
(2) | Includes shares of our Common Stock that may be acquired within sixty (60) days after the Record Date upon the exercise of presently exercisable stock options that were granted under the 2011 Stock Incentive Plan as follows: |
Finui — 20,000 Lynch — 21,000 Stopko — 30,000
132
(3) | Includes 23,897 shares of our Common Stock held in a voting trust for the benefit of his parents, of which Mr. Adams serves as voting trustee, and 50 shares of our Common Stock held on behalf of his child. |
(4) | Includes 67,390 shares of our Common Stock held by Laurel Holdings, Inc., of which Mr. Kunkle is an officer. With respect to each, Mr. Kunkle has voting and investment power. |
(5) | Includes 287,150 shares of our Common Stock held by Pasquerilla Enterprises LP, of which Mark E. Pasquerilla is the sole member of its general partner, and has the power to vote such shares, and 125,500 shares held by the Marenrico Partnership, of which Mr. Pasquerilla is one of the partners and has the power to vote such shares. 125,500 shares held by Marenrico Partnership and 287,150 shares held by Pasquerilla Enterprises LP are separately pledged to financial institutions. |
(6) | Includes 79,434 shares of our Common Stock held in Mr. Stopko’s 401(k) plan. |
Other Shareholders
Based on filings made under the Exchange Act, as of March 1, 2024, the only persons known by us to be beneficial owners of five percent or more of the outstanding shares of our Common Stock were as follows:
Name and Address of Beneficial Owner | | | Amount of | | | Percent of | | ||||||
SB Value Partners, L.P.(1) | | | | | 1,320,760 | | | | | | 7.7% | | |
1903 San Pedro Ave. | | | | ||||||||||
Tontine Financial Partners, L.P.(2) | | | | | 1,246,113 | | | | | | 7.3% | | |
1 Sound Shore Drive, Suite 304 | | | | ||||||||||
Dimensional Fund Advisors LP(3) | | | | | 1,169,279 | | | | | | 6.8% | | |
Building One | | | | ||||||||||
(1) | This information is based upon a Schedule 13G filed on August 15, 2023 with the SEC. |
(2) | Includes its general partner, Tontine Management, L.L.C., and Jeffrey L. Gendell, who serves as the managing member of the general partner. This information is based upon Amendment No. 3 to a Schedule 13G filed on February 13, 2024 with the SEC. |
(3) | Includes subsidiaries of Dimensional Fund Advisors LP (“Dimensional”), four investment companies to which Dimensional furnishes investment advice and certain other commingled fund, group trusts and separate accounts to which Dimensional may serve as investment manager or sub-adviser. |
ITEM 13. CERTAIN RELATIONSHIPS AND RELATED TRANSACTIONS, AND DIRECTOR INDEPENDENCE
Director Independence
The Board undertakes a formal review of director independence semi-annually with input from outside corporate counsel. This process consists of an oral question and answer session at a board meeting at which all directors hear the responses of each director and have an opportunity to evaluate the facts presented. As part of this question and answer session, each director is asked to confirm that there are no facts or circumstances with respect to the director that would be in conflict with the NASDAQ listing standards regarding independence or that would otherwise compromise the director’s independence. This independence review is further supplemented by an annual questionnaire that directors are required to complete that contains a number of questions designed to ascertain the facts necessary to determine independence, as well as facts regarding any related party transactions. Based upon these reviews, the Board has determined that all of our current directors, other than Mr. Stopko, our President and Chief Executive Officer, are
133
independent. In making this determination, the Board considered a number of specific relationships between directors and ASRV as follows:
• | Director Kunkle is the majority owner of Laurel Holdings, Inc. Among other things, Laurel Holdings operates a company that provides janitorial services to the Company. In 2023, the Company paid Laurel Holdings the sum of approximately $293,000 for these services. The amount paid represents less than five percent of Laurel Holdings’ consolidated revenues. Accordingly, the Board concluded that the existence of this relationship did not impair Mr. Kunkle’s independence. |
Transactions With Related Parties
Certain directors, nominees, and executive officers or their associates were customers of and had transactions with the Company or its subsidiaries during 2023. Transactions that involved loans or commitments by the Bank were made in the ordinary course of business and on substantially the same terms, including interest rates and collateral, as those prevailing at the time for comparable transactions with unrelated persons and did not involve more than the normal risk of collectability or present other unfavorable features. All transactions, products or services provided to the directors, nominees, executive officers, or their associates by the Company or its subsidiaries are on substantially the same terms and conditions that those directors, nominees, executive officer, or their associates could receive elsewhere.
Review, Approval or Ratification of Transactions with Related Persons
Our audit committee charter requires that the audit committee approve all related party transactions other than routine deposit relationships and loans that otherwise comply with federal regulations. ASRV also reviews the independence of directors semi-annually. During this process, related party transactions are disclosed to all board members.
ITEM 14. PRINCIPAL ACCOUNTANT FEES AND SERVICES
General
On March 9, 2023, the audit committee of our Board extended the engagement of Snodgrass to provide audit, tax, and benefit plan audit services and September 7, 2023 for SSAE 18 audit related services for the years ending on December 31, 2023, 2024 and 2025. Snodgrass has audited our consolidated financial statements as of and for the year ended December 31, 2023. The report on those consolidated financial statements appears in this Annual Report on Form 10-K.
Audit Fees
The following table sets forth the aggregate fees billed to us by Snodgrass for the fiscal years ended December 31, 2023, and December 31, 2022.
| | | 2023 | | | 2022 | | ||||||
Audit Fees | | | | $ | 298,375 | | | | | $ | 268,146 | | |
Audit-Related Fees | | | | | 147,828 | | | | | | 120,831 | | |
Tax Fees | | | | | 35,390 | | | | | | 35,100 | | |
All Other Fees | | | | | 0 | | | | | | 24,267 | | |
“Audit Fees” include fees for audit services associated with the integrated audit of the company’s financial statements and internal controls over financial reporting, the services associated with the quarterly reviews of Form 10-Q and the annual Form 10-K, compliance audit procedures required by HUD and out-of-pocket expenses for all services aforementioned.
“Audit-Related Fees” includes fees associated with the SSAE 18 examination issued by the Trust Company, the audit of the 401(k) profit sharing plan on Form 11-K, an audit of certain common and collective funds of the Trust Company, the surprise custody examination of procedures for our registered investment advisory subsidiary and out-of-pocket expenses for all services aforementioned.
“Tax Fees” includes tax preparation, tax compliance and tax advice.
134
“All Other Fees” include an information technology network security assessment.
The audit committee’s Pre-Approval Policy is available on the Company’s website at:
https://investors.ameriserv.com/governance/governance-documents.
The audit committee pre-approves all audit and legally permissible non-audit services provided by Snodgrass in accordance with the pre-approval policies and procedures adopted by the committee at its meeting on August 3, 2023 and further updated on October 19, 2023. These services may include audit services, audit-related services, tax services and other services. Under the policy, pre-approved services include pre-approval of non-prohibited services for a limited dollar amount. A list of the prohibited non-audit services as defined by the SEC is attached to the pre-approval policy. The SEC’s rule and relevant guidance will be consulted to determine the precise definitions of these services and the applicability of exceptions to certain of the prohibitions.
The pre-approval fee levels for all services to be provided by Snodgrass are established annually by the audit committee. Any proposed services exceeding these levels will require specific pre-approval by the audit committee. All services performed by Snodgrass in 2023 were pre-approved in accordance with the pre-approval policy.
135
PART IV
ITEM 15. EXHIBITS AND CONSOLIDATED FINANCIAL STATEMENT SCHEDULES
CONSOLIDATED FINANCIAL STATEMENTS FILED:
The consolidated financial statements listed below are from this 2023 Form 10-K and Part II — Item 8. Page references are to this Form 10-K.
CONSOLIDATED FINANCIAL STATEMENTS:
AmeriServ Financial, Inc. and Subsidiaries | |
43 | |
44 | |
46 | |
47 | |
48 | |
49 | |
Report of Independent Registered Public Accounting Firm (PCAOB ID 000 | 103 |
Report of Management’s Assessment of Internal Control Over Financial Reporting | 105 |
106 |
CONSOLIDATED FINANCIAL STATEMENT SCHEDULES:
These schedules are not required or are not applicable under SEC accounting regulations and therefore have been omitted.
EXHIBITS:
The exhibits listed below are filed herewith or to other filings.
EXHIBIT |
| DESCRIPTION |
| PRIOR FILING OR EXHIBIT | |
|---|---|---|---|---|---|
3.1 | Amended and Restated Articles of Incorporation as amended through August 11, 2011. | Exhibit 3.1 to the Registration Statement on Form S-8 (File No. 333-176869) filed on September 16, 2011 | |||
3.2 | Exhibit 3.1 to the Current Report on Form 8-K filed on April 6, 2020 | ||||
4.1 | Attached | ||||
10.1 | Employment Agreement, dated April 27, 2015, between AmeriServ Financial, Inc. and Jeffrey A. Stopko. | Exhibit 10.1 to the Current Report on Form 8-K filed on April 28, 2015 | |||
10.2 | Appendix A to the Definitive Proxy Statement, filed under Schedule 14A, filed on March 23, 2021 | ||||
10.3 | Exhibit 10.1 to the Current Report on Form 8-K filed on October 21, 2014 | ||||
136
EXHIBIT |
| DESCRIPTION |
| PRIOR FILING OR EXHIBIT | |
|---|---|---|---|---|---|
10.4 | Exhibit 10.1 to the Current Report on Form 8-K filed on February 24, 2016 | ||||
10.5 | Employment Agreement, dated May 17, 2010, between AmeriServ Financial, Inc. and James T. Huerth. | Exhibit 10.1 to the Current Report on Form 8-K filed on August 29, 2023 | |||
10.6 | Appendix A to the Definitive Proxy Statement, filed under Schedule 14A, filed on March 21, 2011 | ||||
21.1 | Attached | ||||
23.1 | Attached | ||||
31.1 | Attached | ||||
31.2 | Attached | ||||
32.1 | Attached | ||||
32.2 | Attached | ||||
97 | AmeriServ Financial, Inc. & Subsidiaries Compensation Recovery/Clawback Policy. | Attached | |||
101 | The following information from AMERISERV FINANCIAL, INC.’s Annual Report on Form 10-K for the year ended December 31, 2023, formatted in Inline XBRL (eXtensible Business Reporting Language): (i) Consolidated Balance Sheets, (ii) Consolidated Statements of Operations, (iii) Consolidated Statements of Comprehensive Income (Loss), (iv) Consolidated Statements of Changes in Shareholders’ Equity, (v) Consolidated Statements of Cash Flows, and (vi) Notes to the Consolidated Financial Statements. | Attached | |||
104 | Cover Page Interactive Data File (formatted as Inline XBRL and contained in Exhibit 101). | Attached |
137
SIGNATURES
Pursuant to the requirements of Section 13 or 15(d) of the Securities Exchange Act of 1934, the registrant has duly caused this report to be signed on its behalf by the undersigned, thereunto duly authorized.
AmeriServ Financial, Inc. | ||
(Registrant) | ||
By : | /s/ Jeffrey A. Stopko | |
Jeffrey A. Stopko | ||
President & CEO | ||
Date: March 27, 2024 | ||
Pursuant to the requirements of the Securities Exchange Act of 1934, this report has been signed below by the following persons on behalf of the registrant and in the capacities indicated on March 27, 2024:
/s/ J. Michael Adams, Jr. |
| Chairman |
| /s/ Kim W. Kunkle | Vice Chairman | ||
J. Michael Adams, Jr. | Director | Kim W. Kunkle | Director | ||||
/s/ Jeffrey A. Stopko | President & CEO (principal executive officer) | /s/ Michael D. Lynch | EVP & CFO | ||||
Jeffrey A. Stopko | Director | Michael D. Lynch | (principal financial and accounting officer) | ||||
/s/ Richard W. Bloomingdale | Director | /s/ Margaret A. O’Malley | Director | ||||
Richard W. Bloomingdale | Margaret A. O’Malley | ||||||
/s/ Amy M. Bradley | Director | /s/ Daniel A. Onorato | Director | ||||
Amy M. Bradley | Daniel A. Onorato | ||||||
/s/ David J. Hickton | Director | /s/ Mark E. Pasquerilla | Director | ||||
David J. Hickton | Mark E. Pasquerilla |
138
AMERISERV FINANCIAL, INC.
AMERISERV FINANCIAL BANK OFFICE LOCATIONS | AMERISERV LOAN PRODUCTION LOCATIONS | |
HEADQUARTERS Main Office Johnstown Carrolltown Central City Derry East Hills Drive Up Eighth Ward* * Office location closed effective February 29, 2024 Hagerstown Lovell Park Meyersdale 135 Center Street Meyersdale, PA 15552 | Nanty Glo North Atherton Northern Cambria Suite 1 Pittsburgh Suite 100 Seward Suite 1 Somerset University Heights Westmont Windber | Altoona Wilkins Township Suite 200 |
24-hr ATM available at all branches except Pittsburgh where there is no ATM available
139
SHAREHOLDER INFORMATION
SECURITIES MARKETS
AmeriServ Financial, Inc. Common Stock is publicly traded and quoted on the NASDAQ National Market System. The common stock is traded under the symbol of “ASRV.” The listed market makers for the stock are:
Piper Sandler Companies 1251 Avenue of the Americas 6th Floor New York, NY 10020 Telephone: (800) 635-6860 |
| Stifel Nicolaus 7111 Fairway Drive, STE 301 Palm Beach Gardens, FL 33418 Telephone: (561) 615-5300 | |
Raymond James & Associates 222 S. Riverside Plaza, 7th Floor Chicago, IL 60606 Telephone: (312) 655-2961 | Virtu Financial, Inc. 1 Liberty Plaza New York, NY 10006 Telephone: (888) 931-4357 |
CORPORATE OFFICES
The corporate offices of AmeriServ Financial, Inc. are located at 216 Franklin Street, Johnstown, PA 15901.
Mailing address:
P.O. Box 430
Johnstown, PA 15907-0430
(814) 533-5300
AGENTS
The transfer agent and registrar for AmeriServ Financial, Inc.’s common stock is:
Computershare Investor Services
P.O. Box 505000
Louisville, KY 40233-5000
Shareholder Inquiries: 1-800-730-4001
Internet Address: http://www.Computershare.com
INFORMATION
Analysts, investors, shareholders, and others seeking financial data about AmeriServ Financial, Inc. or any of its subsidiaries’ annual and quarterly reports, proxy statements, 10-K, 10-Q, 8-K, and call reports are asked to contact Michael D. Lynch, Executive Vice President & Chief Financial Officer at (814) 533-5193 or by e-mail at MLynch@AmeriServ.com. The Company also maintains a website (www.AmeriServ.com) that makes available, free of charge, such reports and proxy statements and other current financial information, such as press releases and SEC documents, as well as the corporate governance documents under the Investor Relations tab on the Company’s website. Information contained on the Company’s website is not incorporated by reference into this Annual Report on Form 10-K.
140
AMERISERV FINANCIAL, INC.
AMERISERV FINANCIAL, INC.
Board of Directors |
|
| General Officers | |
J. Michael Adams, Jr. Managing Member of Mike Adams & Associates, LLC Non-Executive Chairman of the Board and of all Subsidiaries Richard W. Bloomingdale Amy M. Bradley President & CEO, Cambria Regional Chamber of Commerce David J. Hickton Founding Director of the Institute for Cyber Law, Policy and Security, University of Pittsburgh Kim W. Kunkle President & CEO, Laurel Holdings, Inc Non-Executive Vice Chairman of the Board | Margaret A. O’Malley Attorney-at-Law, Yost & O’Malley Daniel A. Onorato Executive Vice President, Chief Corporate Affairs and Communications Officer of Highmark Health Mark E. Pasquerilla President, Pasquerilla Enterprises L.P. Jeffrey A. Stopko, CPA President & Chief Executive Officer, AmeriServ Financial, Inc. & AmeriServ Financial Bank | Jeffrey A. Stopko, CPA President & Chief Executive Officer Michael D. Lynch Executive Vice President, Chief Financial Officer, Chief Investment Officer & Chief Risk Officer Susan Tomera Angeletti Senior Vice President, Director of Marketing & Alternative Delivery Laura L. Fiore, CPA Senior Vice President, Chief Auditor Wendy M. Gressick Senior Vice President, Chief Loan Review Officer Jessica L. Johnson Vice President, Manager of Regulatory Accounting Susan F. Joseph Vice President, Audit Manager Andrew Schneck Vice President, Digital Marketing Lead Tammie L. Slavick Vice President, Financial & Profitability Analysis Sharon M. Callihan Corporate Secretary | ||
141
AMERISERV FINANCIAL, INC.
AMERISERV FINANCIAL BANK
Board of Directors |
| General Officers |
| |
J. Michael Adams, Jr. Managing Member of Mike Adams & Associates, LLC Non-Executive Chairman of the Board and of all Subsidiaries Richard W. Bloomingdale Retired President, PA AFL-CIO Amy M. Bradley President & CEO, Cambria Regional Chamber of Commerce David J. Hickton Founding Director of the Institute for Cyber Law, Policy and Security, University of Pittsburgh Kim W. Kunkle President & CEO, Laurel Holdings, Inc. Non-Executive Vice Chairman of the Board Margaret A. O’Malley Attorney-at-Law, Yost & O’Malley Daniel A. Onorato Executive Vice President, Chief Corporate Affairs and Communications Officer of Highmark Health Mark E. Pasquerilla President, Pasquerilla Enterprises L.P. Jeffrey A. Stopko, CPA President & Chief Executive Officer, AmeriServ Financial, Inc. & AmeriServ Financial Bank | Jeffrey A. Stopko, CPA President & Chief Executive Officer Michael R. Baylor Executive Vice President & Chief Lending Officer Michael D. Lynch Executive Vice President, Chief Financial Officer, Chief Investment Officer & Chief Risk Officer Robert J. Cabala Senior Vice President, Area Executive, Johnstown Mitchell D. Edwards Senior Vice President, Area Executive, Wilkins Township Russell B. Flynn Senior Vice President, Retail Lending Bettina D. Fochler Senior Vice President, Chief Credit Officer Kerri L. Mueller Senior Vice President, Retail Banking Douglas Parker Senior Vice President, Area Executive, Hagerstown Michele M. Scanlan Senior Vice President, Chief Human Resources Officer Tara M. Shaffer Senior Vice President, Area Executive, State College Shana M. Stiles Senior Vice President, Chief Compliance Officer Charlene J. Tessari Senior Vice President, Operations & Applications Catherine M. Torok Senior Vice President, Chief Information Officer Cynthia R. Barton-Burket Vice President, Business Services Officer Scott Berardinelli Vice President, Portfolio Manager II Thomas R. Boyd, Jr. Vice President, Commercial Relationship Manager II Carie L. Braniff Vice President, Corporate Security Officer Angela M. Briggs Vice President, Deposit Operations Manager George T. Chaney II Vice President, Commercial Relationship Manager III Bradley Clevenger Vice President, Bank Applications Lori L. Czekaj-Thompson Vice President, Commercial Relationship Manager II | Jason D. Eminhizer Vice President, Commercial Relationship Manager III Kurt Fetzer Vice President, Commercial Relationship Manager II Stephen M. Gagan Vice President, Manager of Technology Chelsea M. Hartnett Vice President, Manager Credit Analysis Nathan Kirk Vice President, Consumer Underwriting Manager Melissa A. Lohr Vice President, Collections & Loan Administration Randy S. McLaughlin Vice President, Regional Sales Officer David J. O’Leary Vice President, Residential Mortgage Lending Heidi L. Rosenberger Vice President, Retail Operations Cynthia L. Stewart Vice President, Mortgage Administrator Michelle D. Wyandt Vice President, Credit Specialist Project Manager |
142
AMERISERV FINANCIAL, INC.
AMERISERV TRUST & FINANCIAL |
|
| WEST CHESTER | |
Board of Directors | Board of Directors | |||
J. Michael Adams, Jr. Managing Member of Mike Adams & Associates, LLC Non-Executive Chairman of the Board and of all Subsidiaries Richard W. Bloomingdale George B. Kaufman James D. Kohley Kim W. Kunkle Non-Executive Vice Chairman of the Board Margaret A. O’Malley Jeffrey A. Stopko, CPA General Officers David A. Finui Michael D. Lynch Michael P. Geiser Scott D. Porterfield | Kathleen M. Wallace, CPA, CRPP Timothy E. Walters Mary Ann Brustle Keashia R. Holtzman-Kishlock James A. Hotchkiss Mark F. Lumley Vice President, Chief Administrative Office & Director of Personal Trust Justin F. Maser Robert Vamos Trust Company Office Locations 216 Franklin Street 140 South Main Street | J. Michael Adams, Jr. Managing Member of Mike Adams & Associates, LLC Non-Executive Chairman of the Board and of all Subsidiaries Richard W. Bloomingdale James D. Kohley Jeffrey A. Stopko, CPA General Officers Frank J. Lapinsky, AIF Michael D. Lynch Eric Ludy Ron Shostek Office Location 216 Franklin Street |
143