UNITED STATES
SECURITIES AND EXCHANGE COMMISSION
Washington, D.C. 20549
Form
(Mark One)
REGISTRATION STATEMENT PURSUANT TO SECTION 12(b) OR 12(g) OF THE SECURITIES EXCHANGE ACT OF 1934 |
or
ANNUAL REPORT PURSUANT TO SECTION 13 OR 15(d) OF THE SECURITIES EXCHANGE ACT OF 1934 |
For the fiscal year ended
TRANSITION REPORT PURSUANT TO SECTION 13 OR 15(d) OF THE SECURITIES EXCHANGE ACT OF 1934 |
or
SHELL COMPANY REPORT PURSUANT TO SECTION 13 OR 15(d) OF THE SECURITIES EXCHANGE ACT OF 1934 |
Date of event requiring this shell company report ___________________
For the transition period from to _______________
Commission file number:
(Exact name of Registrant as specified in its charter)
N/A
(Translation of Registrant’s name into English)
(Jurisdiction of incorporation or organization)
The People’s Republic of
(Address of principal executive offices)
Chief Executive Officer
Tel: +
E-mail:
ir@autohome.com.cn
Fax: +86 (10) 5985-7400
The People’s Republic of
(Name, Telephone, Email and/or Facsimile number and Address of Company Contact Person)
Securities registered or to be registered pursuant to Section 12(b) of the Act:
|
|
|
|
|
Title of Each Class |
|
Trading Symbol(s) |
|
Name of Each Exchange on Which Registered |
|
|
|||
|
|
The Stock Exchange of Hong Kong Limited |
Securities registered or to be registered pursuant to Section 12(g) of the Act:
None
(Title of Class)
Securities for which there is a reporting obligation pursuant to Section 15(d) of the Act:
None
(Title of Class)
Indicate the number of outstanding shares of each of the Issuer’s classes of capital or common stock as of the close of the period covered by the annual report.
Indicate by check mark if the registrant is a well-known seasoned issuer, as defined in Rule 405 of the Securities Act.
If this report is an annual or transition report, indicate by check mark if the registrant is not required to file reports pursuant to Section 13 or 15(d) of the Securities Exchange Act of 1934. Yes ☐
Indicate by check mark whether the registrant (1) has filed all reports required to be filed by Section 13 or 15(d) of the Securities Exchange Act of 1934 during the preceding 12 months (or for such shorter period that the registrant was required to file such reports), and (2) has been subject to such filing requirements for the past 90 days.
Indicate by check mark whether the registrant has submitted electronically every Interactive Data File required to be submitted pursuant to Rule 405 of Regulation S-T (§232.405 of this chapter) during the preceding 12 months (or for such shorter period that the registrant was required to submit such files)
Indicate by check mark whether the registrant is a large accelerated filer, an accelerated filer, a non-accelerated filer or an emerging growth company. See definition of “large accelerated filer,” “accelerated filer,” and “emerging growth company” in Rule 12b-2 of the Exchange Act. (Check one):
Accelerated filer ◻ |
Non-accelerated filer ◻ |
Emerging growth company |
If an emerging growth company that prepares its financial statements in accordance with U.S. GAAP, indicate by check mark if the registrant has elected not to use the extended transition period for complying with any new or revised financial accounting standards† provided pursuant to Section 13(a) of the Exchange Act. Yes ☐ No ☐
† The term “new or revised financial accounting standard” refers to any update issued by the Financial Accounting Standards Board to its Accounting Standards Codification after April 5, 2012.
Indicate by check mark whether the registrant has filed a report on and attestation to its management’s assessment of the effectiveness of its internal control over financial reporting under Section 404(b) of the Sarbanes-Oxley Act (15 U.S.C. 7262(b)) by the registered public accounting firm that prepared or issued its audit report. Yes
If securities are registered pursuant to Section 12(b) of the Act, indicate by check mark whether the financial statements of the registrant included in the filing reflect the correction of an error to previously issued financial statements. ☐
Indicate by check mark whether any of those error corrections are restatements that required a recovery analysis of incentive-based compensation received by any of the registrant’s executive officers during the relevant recovery period pursuant to § 240.10D-1(b). ☐
Indicate by check mark which basis of accounting the registrant has used to prepare the financial statements included in this filing:
|
International Financial Reporting Standards as issued by the International Accounting Standards Board ☐ |
|
Other ☐ |
If “Other” has been checked in response to the previous question, indicate by check mark which financial statement item the registrant has elected to follow. Item 17 ☐ Item 18 ☐
If this is an annual report, indicate by check mark whether the registrant is a shell company (as defined in Rule 12b-2 of the Exchange Act) Yes ☐ No
(APPLICABLE ONLY TO ISSUERS INVOLVED IN BANKRUPTCY PROCEEDINGS DURING THE PAST FIVE YEARS)
Indicate by check mark whether the registrant has filed all documents and reports required to be filed by Sections 12, 13 or 15(d) of the Securities Exchange Act of 1934 subsequent to the distribution of securities under a plan confirmed by a court. Yes ☐ No ☐
TABLE OF CONTENTS
|
|
|
Page |
|
1 |
||
|
4 |
||
|
5 |
||
ITEM 1 |
|
5 |
|
ITEM 2 |
|
5 |
|
ITEM 3 |
|
5 |
|
ITEM 4 |
|
65 |
|
ITEM 4A |
|
102 |
|
ITEM 5 |
|
102 |
|
ITEM 6 |
|
125 |
|
ITEM 7 |
|
137 |
|
ITEM 8 |
|
143 |
|
ITEM 9 |
|
144 |
|
ITEM 10 |
|
145 |
|
ITEM 11 |
|
154 |
|
ITEM 12 |
|
155 |
|
|
160 |
||
ITEM 13 |
|
160 |
|
ITEM 14 |
MATERIAL MODIFICATIONS TO THE RIGHTS OF SECURITY HOLDERS AND USE OF PROCEEDS |
|
160 |
ITEM 15 |
|
161 |
|
ITEM 16A |
|
161 |
|
ITEM 16B |
|
162 |
|
ITEM 16C |
|
162 |
|
ITEM 16D |
|
162 |
|
ITEM 16E |
PURCHASES OF EQUITY SECURITIES BY THE ISSUER AND AFFILIATED PURCHASERS |
|
162 |
ITEM 16F |
|
163 |
|
ITEM 16G |
|
163 |
|
ITEM 16H |
|
163 |
|
ITEM 16I |
DISCLOSURE REGARDING FOREIGN JURISDICTIONS THAT PREVENT INSPECTIONS |
|
164 |
ITEM 16J |
|
164 |
|
|
164 |
||
ITEM 17 |
|
164 |
|
ITEM 18 |
|
164 |
|
ITEM 19 |
|
164 |
|
|
171 |
||
i
INTRODUCTION
Unless otherwise indicated and except where the context otherwise requires, references in this annual report on Form 20-F to:
1
In February 2021 we effected a 4-for-1 share split and an ADS-to-ordinary share ratio adjustment from one ADS representing one Class A ordinary share to one ADS representing four ordinary shares upon the approval of our shareholders, which applies to all share numbers in this annual report retrospectively.
Substantially all of our operations are conducted in mainland China and substantially all of our revenues are denominated in RMB. This annual report contains translations of RMB and Hong Kong dollar amounts into U.S. dollars at specific rates solely for the convenience of the readers. Unless otherwise noted, all translations from RMB and Hong Kong dollars to U.S. dollars and from U.S. dollars to RMB in this annual report were made at a rate of RMB6.8972 to US$1.00 and HK$7.8015 to US$1.00, the respective exchange rates set forth in the H.10 statistical release of the Board of Governors of the Federal Reserve System as of December 30, 2022. We make no representation that any RMB, Hong Kong dollar or U.S. dollar amounts could have been, or could be, converted into U.S. dollars, RMB or Hong Kong dollars, as the case may be, at any particular rate, or at all. The mainland China government imposes control over its foreign currency reserves in part through direct regulation of the conversion of
2
RMB into foreign exchange and through restrictions on foreign trade. Any discrepancies in any table between totals and sums of amounts listed therein are due to rounding.
3
FORWARD-LOOKING STATEMENTS
This annual report contains forward-looking statements that reflect our current expectations and views of future events. The forward-looking statements are contained principally in the sections titled “Item 3. Key Information—D. Risk Factors,” “Item 4. Information on the Company—B. Business Overview” and “Item 5. Operating and Financial Review and Prospects.” These forward-looking statements are made under the “safe-harbor” provisions of the U.S. Private Securities Litigation Reform Act of 1995. Known and unknown risks, uncertainties and other factors, including those listed under “Item 3. Key Information—D. Risk Factors,” may cause our actual results, performance or achievements to be materially different from those expressed or implied by the forward-looking statements.
You can identify some of these forward-looking statements by words or phrases such as “may,” “will,” “expect,” “anticipate,” “aim,” “estimate,” “intend,” “plan,” “believe,” “is/are likely to,” “potential,” “continue” or other similar expressions. We have based these forward-looking statements largely on our current expectations and projections about future events that we believe may affect our financial condition, results of operations, business strategy and financial needs. These forward-looking statements include statements relating to:
These forward-looking statements involve various risks and uncertainties. Although we believe that our expectations expressed in these forward-looking statements are reasonable, our expectations may later be found to be incorrect. Our actual results could be materially different from our expectations. Other sections of this annual report include additional factors that could adversely impact our business and financial performance. Moreover, we operate in an evolving environment. New risk factors and uncertainties emerge from time to time and it is not possible for our management to predict all risk factors and uncertainties, nor can we assess the impact of all factors on our business or the extent to which any factor, or combination of factors, may cause actual results to differ materially from those contained in any forward-looking statements. You should read thoroughly this annual report and the documents that we refer to with the understanding that our actual future results may be materially different from, or worse than, what we expect. We qualify all of our forward-looking statements by these cautionary statements.
This annual report contains certain data and information that we obtained from various government and private publications. Statistical data in these publications also include projections based on a number of assumptions. The online automotive advertising industry may not grow at the rate projected by market data, or at all. The failure of this market to grow at the projected rate may have a material adverse effect on our business and the market price of our ADSs and/or ordinary shares. In addition, the rapidly changing nature of the online automotive advertising industry and the online automobile transaction industry results in significant uncertainties for any projections or estimates relating to the growth prospects or future condition of our market. Furthermore, if any one or more of the assumptions underlying the market data are later found to be incorrect, actual results may differ from the projections based on these assumptions. You should not place undue reliance on these forward-looking statements.
The forward-looking statements made in this annual report relate only to events or information as of the date on which the statements are made in this annual report. Except as required by law, we undertake no obligation to update or revise publicly any forward-looking statements, whether as a result of new information, future events or otherwise, after the date on which the statements are made or to reflect the occurrence of unanticipated events. You should read this annual report and the documents that we refer to in this annual report and exhibits to this annual report completely and with the understanding that our actual future results may be materially different from what we expect.
4
PART I.
ITEM 1 IDENTITY OF DIRECTORS, SENIOR MANAGEMENT AND ADVISORS
Not applicable.
ITEM 2 OFFER STATISTICS AND EXPECTED TIMETABLE
Not applicable.
ITEM 3 KEY INFORMATION
Our Holding Company Structure and VIE Contractual Arrangements
Autohome Inc. is not a Chinese operating company but a Cayman Islands holding company with no equity ownership in VIEs. We conduct our operations primarily through our mainland China subsidiaries and the VIEs. We conduct our business activities related to internet content services through the VIEs in order to comply with the PRC laws and regulations, which place certain restrictions on foreign ownership of companies that provide internet content services in mainland China. Accordingly, we operate these businesses in mainland China through the VIEs, and rely on contractual arrangements among our WFOEs, the VIEs and their shareholders to obtain the financial interest of VIEs. The VIEs are consolidated for accounting purposes, but are not entities in which our Cayman Islands holding company, or our investors, own equity. Revenues contributed by the VIEs accounted for 8.1%, 13.1% and 12.7% of our total net revenues for the fiscal years 2020, 2021 and 2022, respectively. As used in this annual report, “we,” “us,” “our,” “our company” or “the Company” refer to Autohome Inc., its predecessors, subsidiaries and, in the context of describing our operations and consolidated financial information, the VIEs in mainland China. Investors in our ordinary shares or ADSs are not purchasing equity interest in the VIEs in mainland China but instead are purchasing equity interest in a holding company incorporated in the Cayman Islands.
A series of contractual agreements, including power of attorney, equity interest pledge agreements, exclusive technology consulting and service agreements, equity option agreements and loan agreements, have been entered into by and among our WFOEs, the VIEs and their respective shareholders. Terms contained in each set of contractual arrangements with the VIEs and their respective shareholders are substantially similar. As a result of the contractual arrangements, Autohome Inc. becomes the primary beneficiary of the VIEs and their subsidiaries for accounting purposes and treat each of them as a mainland China consolidated entity under U.S. GAAP. For more details of these contractual arrangements, see “Item 7. Major Shareholders and Related Party Transactions—B. Related Party Transactions—Contractual Arrangements with the Variable Interest Entities.”
However, the contractual arrangements may not be as effective as direct ownership in providing us with control over the VIEs, and we may incur substantial costs to enforce the terms of the arrangements. In addition, these contractual arrangements have not been tested in a court of law in mainland China. See “Item 3. Key Information—D. Risk Factors—Risks Related to Our Corporate Structure—Our contractual arrangements with the VIEs may not be as effective in providing operational control as direct ownership” and “—The interests of the individual nominee shareholders of the VIEs may be different from our interests, which may materially and adversely affect our business.”
There are also substantial uncertainties regarding the interpretation and application of current and future laws, regulations and rules of mainland China regarding the status of the rights of our Cayman Islands holding company with respect to its contractual arrangements with the VIEs and their shareholders. It is uncertain whether any new laws or regulations of mainland China relating to variable interest entity structures will be adopted or if adopted, what they would provide. If we or any of the VIEs is found to be in violation of any existing or future laws or regulations of mainland China, or fail to obtain or maintain any of the required permits or approvals, the relevant PRC regulatory authorities would have broad discretion to take action in dealing with such violations or failures. See “Item 3. Key Information—D. Risk Factors—Risks Related to Our Corporate Structure—If the PRC government finds that the agreements that establish the structure for operating our services in mainland China do not comply with PRC governmental restrictions on foreign investment in internet businesses, or if these regulations or the
5
interpretation of existing regulations change in the future, we could be subject to severe penalties or be forced to relinquish our interests in those operations, and we may face significant disruption to our business operations” and “Item 3. Key Information—D. Risk Factors—Risks Related to Doing Business in Mainland China—Substantial uncertainties exist with respect to the interpretation and implementation of the PRC Foreign Investment Law and how it may impact the viability of our current corporate structure, corporate governance and business operations.”
Our corporate structure is subject to risks associated with our contractual arrangements with the VIEs. If the PRC government deems that our contractual arrangements with the VIEs do not comply with regulatory restrictions of mainland China on foreign investment in the relevant industries, or if these regulations or the interpretation of existing regulations change or are interpreted differently in the future, we could be subject to severe penalties or be forced to relinquish our interests in those operations. Our holding company, our mainland China subsidiaries and the VIEs, and investors of our company face uncertainty about potential future actions by the PRC government that could affect the enforceability of the contractual arrangements with the VIEs and, consequently, significantly affect the financial performance of the VIEs and our company as a whole. For a detailed description of the risks associated with our corporate structure, please refer to risks disclosed under “Item 3. Key Information—D. Risk Factors—Risks Related to Our Corporate Structure.”
We face various risks and uncertainties related to doing business in mainland China. Our business operations are primarily conducted in mainland China, and we are subject to complex and evolving PRC laws and regulations. For example, we face risks associated with regulatory approvals on offshore offerings, anti-monopoly regulatory actions, and oversight on cybersecurity and data privacy. The PRC government’s significant authority in regulating our operations and its oversight and control over offerings conducted overseas by, and foreign investment in, China-based issuers could significantly limit or completely hinder our ability to offer or continue to offer securities to investors. Implementation of industry-wide regulations, including data security or anti-monopoly related regulations, in this nature may cause the value of our securities to significantly decline or become worthless. For a detailed description of risks related to doing business in mainland China, please refer to risks disclosed under “Item 3. Key Information—D. Risk Factors—Risks Related to Doing Business in Mainland China.”
Risks and uncertainties arising from the legal system in mainland China, including risks and uncertainties regarding the enforcement of laws and quickly evolving rules and regulations in mainland China, could result in a material adverse change in our operations and the value of our ADSs and ordinary shares. For more details, see “Item 3. Key Information—D. Risk Factors—Risks Related to Doing Business in Mainland China—Uncertainties with respect to the PRC legal system could adversely affect us” and “—We may be adversely affected by the complexity, uncertainties and changes in the regulation of internet business and companies in mainland China.”
The Holding Foreign Companies Accountable Act
Pursuant to the Holding Foreign Companies Accountable Act, or the HFCAA, if the SEC determines that we have filed audit reports issued by a registered public accounting firm that has not been subject to inspections by the Public Company Accounting Oversight Board, or the PCAOB, for two consecutive years, the SEC will prohibit our shares or the ADSs from being traded on a national securities exchange or in the over-the-counter trading market in the United States. On December 16, 2021, the PCAOB issued a report to notify the SEC of its determination that the PCAOB was unable to inspect or investigate completely registered public accounting firms headquartered in mainland China and Hong Kong, including our auditor. In May 2022, the SEC conclusively listed us as a Commission-Identified Issuer under the HFCAA following the filing of our annual report on Form 20-F for the fiscal year ended December 31, 2021. On December 15, 2022, the PCAOB issued a report that vacated its December 16, 2021 determination and removed mainland China and Hong Kong from the list of jurisdictions where it is unable to inspect or investigate completely registered public accounting firms. For this reason, we do not expect to be identified as a Commission-Identified Issuer under the HFCAA after we file this annual report on Form 20-F. Each year, the PCAOB will determine whether it can inspect and investigate completely audit firms in mainland China and Hong Kong, among other jurisdictions. If PCAOB determines in the future that it no longer has full access to inspect and investigate completely accounting firms in mainland China and Hong Kong and we continue to use an accounting firm headquartered in one of these jurisdictions to issue an audit report on our financial statements filed with the SEC, we would be identified as a Commission-Identified Issuer following the filing of the annual report on Form 20-F for the relevant fiscal year. There can be no assurance that we would not be identified as a Commission-Identified Issuer for any future fiscal year, and if we were so identified for two consecutive years, we would become
6
subject to the prohibition on trading under the HFCAA. See “Item 3. Key Information—D. Risk Factors—Risks Relating to Our Business and Industry—The PCAOB had historically been unable to inspect our auditor in relation to their audit work performed for our financial statements and the inability of the PCAOB to conduct inspections of our auditor in the past has deprived our investors with the benefits of such inspections,” and “—Our ADSs may be prohibited from trading in the United States under the HFCAA in the future if the PCAOB is unable to inspect or investigate completely auditors located in China. The delisting of the ADSs, or the threat of their being delisted, may materially and adversely affect the value of your investment.”
Permissions Required from the PRC Authorities for Our Operations
We conduct our business primarily through our subsidiaries and the VIEs in mainland China. Our operations in mainland China are governed by laws and regulations of mainland China. As of the date of this annual report, our mainland China subsidiaries and the VIEs have obtained the requisite licenses and permits from the PRC government authorities that are material for the business operations of our holding company, the VIEs in mainland China, including, among others, the ICP licenses, the Value-added Telecommunications License for Online Data Processing and Transaction Processing Business (for operational e-commerce only), the Surveying and Mapping Qualification Certificate for Internet Mapping (such certificate held by the Autohome Information is in the process of the renewal), the Operating Licenses for the Production and Dissemination of Radio and Television Programs, the internet Audio/Video Program Transmission License, the Internet Culture Business Permit, which is in the process of the renewal, and the auction business approval certificate. Given the uncertainties of interpretation and implementation of relevant laws and regulations and the enforcement practice by relevant government authorities, we may be required to obtain additional licenses, permits, filings or approvals for the functions and services of our platform in the future. For more detailed information, see “Item 3. Key Information—D. Risk Factors—Risks Related to Doing Business in Mainland China—We may be adversely affected by the complexity, uncertainties and changes in the regulation of internet business and companies in mainland China.”
Furthermore, if we are deemed as a critical information infrastructure operator under the cybersecurity laws and regulations of mainland China, we must fulfill certain obligations as required under the cybersecurity laws and regulations of mainland China, including, among others, storing personal information and important data collected and produced within the mainland China territory during our operations in mainland China, and we may be subject to review when purchasing internet products and services. If we are not able to comply with the cybersecurity and data privacy requirements in a timely manner, or at all, we may be subject to government enforcement actions and investigations, fines, penalties, suspension of our non-compliant operations, or removal of our app from the relevant application stores, among other sanctions, which could materially and adversely affect our business and results of operations. In addition, the approval of and/or filing with the CSRC or other PRC government authorities may be required, and we and the VIEs may be required to go through cybersecurity review by the CAC, in case of any relevant future issuance of securities to foreign investors. Any failure to complete such procedures would subject us to sanctions by the CSRC, CAC or other PRC regulatory authorities. These regulatory authorities may impose fines and penalties on our operations in mainland China, limit our ability to pay dividends outside of mainland China, limit our operating privileges in mainland China, delay or restrict the repatriation of the proceeds from our offshore offerings into mainland China or take other actions that could materially and adversely affect our business, financial condition, results of operations, and prospects, as well as the trading price of our ADSs and ordinary shares. For more detailed information, see “Item 3. Key Information—D. Risk Factors—Risks Related to our Business and Industry—Our business is subject to complex and evolving Chinese laws and regulations regarding data privacy and cybersecurity, many of which are subject to changes and uncertain interpretations. Any changes in these laws could cause changes to our business practices and increased cost of operations, and any security breaches or our actual or perceived failure to comply with such laws could result in claims, penalties, damages to our reputation and brand, declines in user growth or engagement, or otherwise harm our business, results of operations and financial condition,” and “—Risks Related to Doing Business in Mainland China—The approval of and filing with the CSRC or other PRC government authorities may be required if we were to conduct offshore offerings in the future, and, if required, we cannot predict whether or for how long we will be able to obtain such approval or complete such filing.”
7
Cash Flows through Our Organization
Autohome Inc. is a holding company with no operations of its own. We conduct our operations in mainland China primarily through our subsidiaries and the VIEs in mainland China. As a result, although other means are available for us to obtain financing at the holding company level, Autohome Inc.’s ability to pay dividends to the shareholders and to service any debt it may incur may depend upon dividends paid by our mainland China subsidiaries and service fees paid by the VIEs.
If any of our subsidiaries incurs debt on its own behalf in the future, the instruments governing such debt may restrict its ability to pay dividends to Autohome Inc. In addition, our mainland China subsidiaries are permitted to pay dividends to Autohome Inc. only out of their retained earnings, if any, as determined in accordance with PRC accounting standards and regulations. Further, our mainland China subsidiaries and the VIEs are required to make appropriations to certain statutory reserve funds or may make appropriations to certain discretionary funds, which are not distributable as cash dividends and can only be used for specific purposes. Under the laws and regulations of mainland China, our mainland China subsidiaries and the VIEs are subject to certain restrictions with respect to paying dividends or otherwise transferring any of their net assets to us. Remittance of dividends by a wholly foreign-invested enterprise out of mainland China is also subject to examination by the banks designated by the State Administration of Foreign Exchange, or SAFE. The amounts restricted include the paid-up capital and the statutory reserve funds of our mainland China subsidiaries and the net assets of the VIEs in which we have no legal ownership. For more details, see “Item 5. Operating and Financial Review and Prospects—B. Liquidity and Capital Resources—Holding Company Structure.” For risks relating to the fund flows of our operations in mainland China, see “Item 3. Key Information—D. Risk Factors—Risks Related to Our Corporate Structure—We may rely to a significant extent on dividends and other distributions on equity paid by our mainland China subsidiaries to fund any cash and financing requirements we may have. Any limitation on the ability of our mainland China subsidiaries to pay dividends to us could have a material adverse effect on our ability to conduct our business.” In the years ended December 31, 2020, 2021 and 2022, our mainland China subsidiaries paid to Autohome Inc. and its offshore subsidiaries a total of RMB649.6 million, RMB681.4 million and RMB1,430.0 million (US$207.3 million), respectively, in the form of dividends.
Under the laws of mainland China, Autohome Inc. and its offshore subsidiaries may provide funding to our mainland China subsidiaries only through capital contributions or loans, and to the VIEs only through loans, subject to satisfaction of applicable government registration and approval requirements.
The VIEs may transfer cash to our WFOEs by paying service fees according to the exclusive technology consulting and service agreements. Pursuant to these agreements, the VIEs agree to pay the applicable subsidiaries technology consulting and service fees, subject to conditions therein.
Autohome Inc. has in place a regular dividend policy. For the fiscal years of 2020, 2021 and 2022, we paid cash dividends in the total amounts of US$99.8 million, US$105.7 million and US$61.1 million, respectively, to our shareholders, pursuant to our dividend policy. See “Item 8. Financial Information—A. Consolidated Statements and Other Financial Information—Dividend Policy.” For the United States federal income tax consequences of the dividends we make, see “Item 10. Additional Information—E. Taxation—United States Federal Income Tax Considerations—Dividends.” For mainland China, Hong Kong and United States federal income tax considerations of an investment in our ADSs and/or ordinary shares, see “Item 10. Additional Information—E. Taxation.”
8
The cash transfer within the Company was summarized as below:
|
|
For the Year Ended December 31, |
|
|||||||||||||
|
|
2020 |
|
|
2021 |
|
|
2022 |
|
|||||||
|
|
RMB |
|
|
RMB |
|
|
RMB |
|
|
US$ |
|
||||
|
|
(in thousands) |
|
|||||||||||||
Cash flows from intercompany borrowings and loans among the entities |
|
|
|
|
|
|
|
|
|
|
|
|
||||
Capital contributions from offshore subsidiaries to onshore subsidiaries |
|
|
— |
|
|
|
163,755 |
|
|
|
— |
|
|
|
— |
|
Amounts from parent to offshore subsidiaries(1) |
|
|
101,785 |
|
|
|
5,524,211 |
|
|
|
2,750,371 |
|
|
|
398,766 |
|
Amounts from offshore subsidiaries to parent(1) |
|
|
— |
|
|
|
2,000,733 |
|
|
|
3,505,307 |
|
|
|
508,222 |
|
Amounts from VIEs to onshore subsidiaries(2) |
|
|
— |
|
|
|
375,370 |
|
|
|
823,937 |
|
|
|
119,460 |
|
Amounts from onshore subsidiaries to VIEs(2) |
|
|
— |
|
|
|
163,424 |
|
|
|
666,853 |
|
|
|
96,685 |
|
Cash flows from dividend payment among the entities |
|
|
|
|
|
|
|
|
|
|
|
|
||||
Dividend paid by WFOEs and onshore subsidiaries to offshore subsidiaries |
|
|
649,551 |
|
|
|
681,427 |
|
|
|
1,430,000 |
|
|
|
207,331 |
|
Dividend paid by offshore subsidiaries to parent company |
|
|
634,078 |
|
|
|
682,188 |
|
|
|
1,210,471 |
|
|
|
175,502 |
|
Cash flows from services transaction among the entities |
|
|
|
|
|
|
|
|
|
|
|
|
||||
Cash paid by WFOEs and onshore subsidiaries to the VIEs(3) |
|
|
121,156 |
|
|
|
251,369 |
|
|
|
138,414 |
|
|
|
20,068 |
|
Cash paid by VIEs to onshore subsidiaries and WFOES(4) |
|
|
231,420 |
|
|
|
587,771 |
|
|
|
316,357 |
|
|
|
45,868 |
|
Notes:
In the years ended December 31, 2020, 2021 and 2022, no assets other than cash were transferred through our organization.
The following tables present the selected consolidated financial information for our company. Our selected consolidated statements of operations data presented below for the years ended December 31, 2020, 2021 and 2022 and our selected consolidated balance sheet data as of December 31, 2021 and 2022 have been derived from our consolidated financial statements, which are included in this annual report beginning on page F-1.
Our selected consolidated balance sheet data as of December 31, 2018, 2019 and 2020 and the selected consolidated statements of operations data for 2018 and 2019 presented below have been derived from our consolidated financial statements not included in this annual report. Our historical results for any period are not necessarily indicative of results to be expected for any future period. You should read the following selected financial data in conjunction with the consolidated financial statements and related notes and the information under
9
“Item 5. Operating and Financial Review and Prospects” in this annual report. Our audited consolidated financial statements are prepared and presented in accordance with U.S. GAAP.
|
|
For the Year Ended December 31, |
|
|||||||||||||||||||||
|
|
2018 |
|
|
2019 |
|
|
2020 |
|
|
2021 |
|
|
2022 |
|
|||||||||
|
|
RMB |
|
|
RMB |
|
|
RMB |
|
|
RMB |
|
|
RMB |
|
|
US$ |
|
||||||
|
|
(in thousands, except for number of shares and per share data) |
|
|||||||||||||||||||||
Selected Consolidated Statements of Operations Data: |
|
|
|
|
|
|
|
|
|
|
|
|
|
|
|
|
|
|
||||||
Net revenues |
|
|
7,233,151 |
|
|
|
8,420,751 |
|
|
|
8,658,559 |
|
|
|
7,237,004 |
|
|
|
6,940,828 |
|
|
|
1,006,325 |
|
Cost of revenues(1) |
|
|
(820,288 |
) |
|
|
(960,292 |
) |
|
|
(961,170 |
) |
|
|
(1,047,892 |
) |
|
|
(1,235,173 |
) |
|
|
(179,083 |
) |
Gross profit |
|
|
6,412,863 |
|
|
|
7,460,459 |
|
|
|
7,697,389 |
|
|
|
6,189,112 |
|
|
|
5,705,655 |
|
|
|
827,242 |
|
Operating expenses |
|
|
|
|
|
|
|
|
|
|
|
|
|
|
|
|
|
|
||||||
Sales and marketing expenses(1) |
|
|
(2,435,236 |
) |
|
|
(3,093,345 |
) |
|
|
(3,246,507 |
) |
|
|
(2,759,905 |
) |
|
|
(2,866,206 |
) |
|
|
(415,561 |
) |
General and administrative expenses(1) |
|
|
(314,846 |
) |
|
|
(317,967 |
) |
|
|
(381,843 |
) |
|
|
(543,799 |
) |
|
|
(502,340 |
) |
|
|
(72,832 |
) |
Product development expenses(1) |
|
|
(1,135,247 |
) |
|
|
(1,291,054 |
) |
|
|
(1,364,227 |
) |
|
|
(1,398,037 |
) |
|
|
(1,417,094 |
) |
|
|
(205,459 |
) |
Total operating expenses |
|
|
(3,885,329 |
) |
|
|
(4,702,366 |
) |
|
|
(4,992,577 |
) |
|
|
(4,701,741 |
) |
|
|
(4,785,640 |
) |
|
|
(693,852 |
) |
Other operating income, net |
|
|
341,391 |
|
|
|
477,699 |
|
|
|
443,215 |
|
|
|
294,241 |
|
|
|
327,507 |
|
|
|
47,484 |
|
Operating profit |
|
|
2,868,925 |
|
|
|
3,235,792 |
|
|
|
3,148,027 |
|
|
|
1,781,612 |
|
|
|
1,247,522 |
|
|
|
180,874 |
|
Interest and investment income, net(2) |
|
|
347,794 |
|
|
|
464,529 |
|
|
|
392,160 |
|
|
|
395,245 |
|
|
|
565,090 |
|
|
|
81,931 |
|
Earnings/(loss) from equity method investments |
|
|
24,702 |
|
|
|
685 |
|
|
|
(1,246 |
) |
|
|
301 |
|
|
|
(49,766 |
) |
|
|
(7,215 |
) |
Income before income taxes |
|
|
3,241,421 |
|
|
|
3,701,006 |
|
|
|
3,538,941 |
|
|
|
2,177,158 |
|
|
|
1,762,846 |
|
|
|
255,590 |
|
Income tax expense |
|
|
(377,890 |
) |
|
|
(500,361 |
) |
|
|
(260,945 |
) |
|
|
(34,006 |
) |
|
|
61,780 |
|
|
|
8,957 |
|
Net income |
|
|
2,863,531 |
|
|
|
3,200,645 |
|
|
|
3,277,996 |
|
|
|
2,143,152 |
|
|
|
1,824,626 |
|
|
|
264,547 |
|
Net (income)/loss attributable to noncontrolling interests |
|
|
7,484 |
|
|
|
(679 |
) |
|
|
(2,338 |
) |
|
|
105,633 |
|
|
|
30,548 |
|
|
|
4,429 |
|
Net income attributable to Autohome Inc. |
|
|
2,871,015 |
|
|
|
3,199,966 |
|
|
|
3,275,658 |
|
|
|
2,248,785 |
|
|
|
1,855,174 |
|
|
|
268,976 |
|
Accretion of mezzanine equity. |
|
|
— |
|
|
|
— |
|
|
|
— |
|
|
|
(411,792 |
) |
|
|
(137,610 |
) |
|
|
(19,952 |
) |
Accretion attributable to noncontrolling interests. |
|
|
— |
|
|
|
— |
|
|
|
— |
|
|
|
311,573 |
|
|
|
89,612 |
|
|
|
12,993 |
|
Net income attributable to ordinary shareholders |
|
|
2,871,015 |
|
|
|
3,199,966 |
|
|
|
3,275,658 |
|
|
|
2,148,566 |
|
|
|
1,807,176 |
|
|
|
262,017 |
|
Earnings per share for ordinary shares(3) |
|
|
|
|
|
|
|
|
|
|
|
|
|
|
|
|
|
|
||||||
Basic |
|
|
6.10 |
|
|
|
6.75 |
|
|
|
6.86 |
|
|
|
4.30 |
|
|
|
3.62 |
|
|
|
0.52 |
|
Diluted |
|
|
6.02 |
|
|
|
6.69 |
|
|
|
6.83 |
|
|
|
4.29 |
|
|
|
3.62 |
|
|
|
0.52 |
|
Earnings per ADS attributable to ordinary |
|
|
|
|
|
|
|
|
|
|
|
|
|
|
|
|
|
|
||||||
Basic |
|
|
24.40 |
|
|
|
26.99 |
|
|
|
27.44 |
|
|
|
17.19 |
|
|
|
14.48 |
|
|
|
2.10 |
|
Diluted |
|
|
24.08 |
|
|
|
26.77 |
|
|
|
27.32 |
|
|
|
17.17 |
|
|
|
14.47 |
|
|
|
2.10 |
|
Weighted average number of shares used to compute |
|
|
|
|
|
|
|
|
|
|
|
|
|
|
|
|
|
|
||||||
Ordinary shares: |
|
|
|
|
|
|
|
|
|
|
|
|
|
|
|
|
|
|
||||||
Basic |
|
|
470,687,884 |
|
|
|
474,328,384 |
|
|
|
477,467,268 |
|
|
|
499,861,764 |
|
|
|
499,160,564 |
|
|
|
499,160,564 |
|
Diluted |
|
|
476,941,516 |
|
|
|
478,060,988 |
|
|
|
479,686,380 |
|
|
|
500,481,540 |
|
|
|
499,666,792 |
|
|
|
499,666,792 |
|
Dividend per share(5) |
|
|
— |
|
|
|
— |
|
|
|
— |
|
|
|
— |
|
|
|
|
|
|
|
||
Notes:
|
|
For the Year Ended December 31, |
|
|||||||||||||||||||||
|
|
2018 |
|
|
2019 |
|
|
2020 |
|
|
2021 |
|
|
2022 |
|
|||||||||
|
|
RMB |
|
|
RMB |
|
|
RMB |
|
|
RMB |
|
|
RMB |
|
|
US$ |
|
||||||
|
|
(in thousands) |
|
|||||||||||||||||||||
Allocation of share-based compensation expenses |
|
|
|
|
|
|
|
|
|
|
|
|
|
|
|
|
|
|
||||||
Cost of revenues |
|
|
16,112 |
|
|
|
15,508 |
|
|
|
21,372 |
|
|
|
23,142 |
|
|
|
8,608 |
|
|
|
1,248 |
|
Sales and marketing expenses |
|
|
61,599 |
|
|
|
46,081 |
|
|
|
40,103 |
|
|
|
46,823 |
|
|
|
38,317 |
|
|
|
5,555 |
|
General and administrative expenses |
|
|
55,992 |
|
|
|
62,884 |
|
|
|
55,868 |
|
|
|
48,803 |
|
|
|
53,209 |
|
|
|
7,715 |
|
Product development expenses |
|
|
68,622 |
|
|
|
79,535 |
|
|
|
93,863 |
|
|
|
87,292 |
|
|
|
68,756 |
|
|
|
9,969 |
|
Total share-based compensation expenses |
|
|
202,325 |
|
|
|
204,008 |
|
|
|
211,206 |
|
|
|
206,060 |
|
|
|
168,890 |
|
|
|
24,487 |
|
10
|
|
For the Year Ended December 31, |
|
|||||||||||||||||||||
|
|
2018 |
|
|
2019 |
|
|
2020 |
|
|
2021 |
|
|
2022 |
|
|
|
|
||||||
|
|
RMB |
|
|
RMB |
|
|
RMB |
|
|
RMB |
|
|
RMB |
|
|
US$ |
|
||||||
|
|
(in thousands) |
|
|||||||||||||||||||||
Selected Consolidated Balance Sheet Data: |
|
|
|
|
|
|
|
|
|
|
|
|
|
|
|
|
|
|
||||||
Cash and cash equivalents, restricted cash, current |
|
|
10,061,458 |
|
|
|
12,795,110 |
|
|
|
14,629,398 |
|
|
|
20,822,623 |
|
|
|
22,090,066 |
|
|
|
3,202,758 |
|
Accounts receivable, net |
|
|
2,795,835 |
|
|
|
3,231,486 |
|
|
|
3,124,197 |
|
|
|
2,139,471 |
|
|
|
1,927,699 |
|
|
|
279,490 |
|
Total current assets |
|
|
13,141,317 |
|
|
|
16,358,382 |
|
|
|
18,364,080 |
|
|
|
23,325,718 |
|
|
|
24,424,931 |
|
|
|
3,541,282 |
|
Total assets(1) (2) |
|
|
15,756,201 |
|
|
|
19,155,865 |
|
|
|
23,601,274 |
|
|
|
28,399,435 |
|
|
|
29,715,819 |
|
|
|
4,308,389 |
|
Deferred revenue |
|
|
1,510,726 |
|
|
|
1,370,953 |
|
|
|
1,315,667 |
|
|
|
1,553,013 |
|
|
|
1,147,131 |
|
|
|
166,318 |
|
Total current liabilities |
|
|
4,164,769 |
|
|
|
3,965,903 |
|
|
|
4,185,683 |
|
|
|
3,986,219 |
|
|
|
4,058,676 |
|
|
|
588,452 |
|
Total non-current liabilities |
|
|
479,989 |
|
|
|
584,021 |
|
|
|
736,370 |
|
|
|
605,417 |
|
|
|
568,517 |
|
|
|
82,427 |
|
Total liabilities(1) |
|
|
4,644,758 |
|
|
|
4,549,924 |
|
|
|
4,922,053 |
|
|
|
4,591,636 |
|
|
|
4,627,193 |
|
|
|
670,879 |
|
Mezzanine equity |
|
|
— |
|
|
|
— |
|
|
|
1,056,237 |
|
|
|
1,468,029 |
|
|
|
1,605,639 |
|
|
|
232,796 |
|
Total Autohome Inc. shareholders’ equity(2) |
|
|
11,135,278 |
|
|
|
14,629,097 |
|
|
|
17,496,163 |
|
|
|
22,624,848 |
|
|
|
23,888,842 |
|
|
|
3,463,557 |
|
Total equity(2) |
|
|
11,111,443 |
|
|
|
14,605,941 |
|
|
|
17,622,984 |
|
|
|
22,339,770 |
|
|
|
23,482,987 |
|
|
|
3,404,714 |
|
Total liabilities, mezzanine equity and equity(2) |
|
|
15,756,201 |
|
|
|
19,155,865 |
|
|
|
23,601,274 |
|
|
|
28,399,435 |
|
|
|
29,715,819 |
|
|
|
4,308,389 |
|
Note:
Financial Information Related to the VIEs
The following table presents the condensed consolidating schedule of financial position for the VIEs and other entities as of the dates presented.
11
Selected Condensed Consolidating Statements of Income Information
|
|
For the Year Ended December 31, 2022 |
|
|||||||||||||||||||||
|
|
Autohome |
|
|
Other |
|
|
Primary |
|
|
VIEs and |
|
|
Eliminations |
|
|
Consolidated |
|
||||||
|
|
(RMB in thousands) |
|
|||||||||||||||||||||
Net revenues: |
|
|
|
|
|
|
|
|
|
|
|
|
|
|
|
|
|
|
||||||
-Third-party revenues |
|
|
— |
|
|
|
5,743,002 |
|
|
|
315,550 |
|
|
|
882,276 |
|
|
|
— |
|
|
|
6,940,828 |
|
-Inter-company revenues (1) |
|
|
— |
|
|
|
5,456 |
|
|
|
831,890 |
|
|
|
160,272 |
|
|
|
(997,618 |
) |
|
|
— |
|
Total Revenue |
|
|
— |
|
|
|
5,748,458 |
|
|
|
1,147,440 |
|
|
|
1,042,548 |
|
|
|
(997,618 |
) |
|
|
6,940,828 |
|
Total Cost and expense |
|
|
(18,462 |
) |
|
|
(4,980,484 |
) |
|
|
(864,216 |
) |
|
|
(1,155,269 |
) |
|
|
997,618 |
|
|
|
(6,020,813 |
) |
Share of income of subsidiaries and VIEs(2): |
|
|
|
|
|
|
|
|
|
|
|
|
|
|
|
|
|
|
||||||
-Share of income of subsidiaries |
|
|
1,854,834 |
|
|
|
201,386 |
|
|
|
4,770 |
|
|
|
— |
|
|
|
(2,060,990 |
) |
|
|
— |
|
-Share of loss of VIEs |
|
|
— |
|
|
|
— |
|
|
|
(85,283 |
) |
|
|
— |
|
|
|
85,283 |
|
|
|
— |
|
Others, Income/(loss) |
|
|
18,802 |
|
|
|
805,666 |
|
|
|
746 |
|
|
|
17,617 |
|
|
|
— |
|
|
|
842,831 |
|
Income before income taxes |
|
|
1,855,174 |
|
|
|
1,775,026 |
|
|
|
203,457 |
|
|
|
(95,104 |
) |
|
|
(1,975,707 |
) |
|
|
1,762,846 |
|
Income tax expense |
|
|
— |
|
|
|
49,260 |
|
|
|
2,699 |
|
|
|
9,821 |
|
|
|
— |
|
|
|
61,780 |
|
Net income/(loss) |
|
|
1,855,174 |
|
|
|
1,824,286 |
|
|
|
206,156 |
|
|
|
(85,283 |
) |
|
|
(1,975,707 |
) |
|
|
1,824,626 |
|
Net loss/(income) attributable to noncontrolling |
|
|
— |
|
|
|
30,548 |
|
|
|
|
|
|
|
|
|
|
|
|
30,548 |
|
|||
Net income/(loss) attributable to Autohome Inc. |
|
|
1,855,174 |
|
|
|
1,854,834 |
|
|
|
206,156 |
|
|
|
(85,283 |
) |
|
|
(1,975,707 |
) |
|
|
1,855,174 |
|
Note:
|
|
For the Year Ended December 31, 2021 |
|
|||||||||||||||||||||
|
|
Autohome |
|
|
Other |
|
|
Primary |
|
|
VIEs and |
|
|
Eliminations |
|
|
Consolidated |
|
||||||
|
|
(RMB in thousands) |
|
|||||||||||||||||||||
Net revenues: |
|
|
|
|
|
|
|
|
|
|
|
|
|
|
|
|
|
|
||||||
-Third-party revenues |
|
|
— |
|
|
|
6,081,662 |
|
|
|
206,822 |
|
|
|
948,520 |
|
|
|
— |
|
|
|
7,237,004 |
|
-Inter-company revenues (1) |
|
|
— |
|
|
|
18,446 |
|
|
|
1,085,139 |
|
|
|
131,524 |
|
|
|
(1,235,109 |
) |
|
|
— |
|
Total Revenue |
|
|
— |
|
|
|
6,100,108 |
|
|
|
1,291,961 |
|
|
|
1,080,044 |
|
|
|
(1,235,109 |
) |
|
|
7,237,004 |
|
Total Cost and expense |
|
|
(36,007 |
) |
|
|
(4,671,667 |
) |
|
|
(1,100,250 |
) |
|
|
(1,176,818 |
) |
|
|
1,235,109 |
|
|
|
(5,749,633 |
) |
Share of income of subsidiaries and VIEs(2): |
|
|
|
|
|
|
|
|
|
|
|
|
|
|
|
|
|
|
||||||
-Share of income of subsidiaries |
|
|
2,326,018 |
|
|
|
130,868 |
|
|
|
26,825 |
|
|
|
— |
|
|
|
(2,483,711 |
) |
|
|
— |
|
-Share of loss of VIEs |
|
|
— |
|
|
|
— |
|
|
|
(89,397 |
) |
|
|
— |
|
|
|
89,397 |
|
|
|
— |
|
Others, Income/(loss) |
|
|
(41,226 |
) |
|
|
725,283 |
|
|
|
3,869 |
|
|
|
1,861 |
|
|
|
— |
|
|
|
689,787 |
|
Income before income taxes |
|
|
2,248,785 |
|
|
|
2,284,592 |
|
|
|
133,008 |
|
|
|
(94,913 |
) |
|
|
(2,394,314 |
) |
|
|
2,177,158 |
|
Income tax (expense)/benefit |
|
|
— |
|
|
|
(64,207 |
) |
|
|
24,685 |
|
|
|
5,516 |
|
|
|
— |
|
|
|
(34,006 |
) |
Net income/(loss) |
|
|
2,248,785 |
|
|
|
2,220,385 |
|
|
|
157,693 |
|
|
|
(89,397 |
) |
|
|
(2,394,314 |
) |
|
|
2,143,152 |
|
Net loss/(income) attributable to noncontrolling |
|
|
— |
|
|
|
105,633 |
|
|
|
— |
|
|
|
— |
|
|
|
— |
|
|
|
105,633 |
|
Net income/(loss) attributable to Autohome Inc. |
|
|
2,248,785 |
|
|
|
2,326,018 |
|
|
|
157,693 |
|
|
|
(89,397 |
) |
|
|
(2,394,314 |
) |
|
|
2,248,785 |
|
Note:
12
|
|
For the Year Ended December 31, 2020 |
|
|||||||||||||||||||||
|
|
Autohome |
|
|
Other |
|
|
Primary |
|
|
VIEs and |
|
|
Eliminations |
|
|
Consolidated |
|
||||||
|
|
(RMB in thousands) |
|
|||||||||||||||||||||
Net revenues: |
|
|
|
|
|
|
|
|
|
|
|
|
|
|
|
|
|
|
||||||
-Third-party revenues |
|
|
— |
|
|
|
7,642,110 |
|
|
|
315,841 |
|
|
|
700,608 |
|
|
|
— |
|
|
|
8,658,559 |
|
-Inter-company revenues(1) |
|
|
— |
|
|
|
10,623 |
|
|
|
900,900 |
|
|
|
173,299 |
|
|
|
(1,084,822 |
) |
|
|
— |
|
Total Revenue |
|
|
— |
|
|
|
7,652,733 |
|
|
|
1,216,741 |
|
|
|
873,907 |
|
|
|
(1,084,822 |
) |
|
|
8,658,559 |
|
Total Cost and expense |
|
|
(21,109 |
) |
|
|
(5,252,144 |
) |
|
|
(887,750 |
) |
|
|
(877,566 |
) |
|
|
1,084,822 |
|
|
|
(5,953,747 |
) |
Share of income of subsidiaries and VIEs(2): |
|
|
|
|
|
|
|
|
|
|
|
|
|
|
|
|
|
|
||||||
-Share of income of subsidiaries |
|
|
3,361,422 |
|
|
|
482,106 |
|
|
|
9,172 |
|
|
|
— |
|
|
|
(3,852,700 |
) |
|
|
— |
|
-Share of income of VIEs |
|
|
— |
|
|
|
— |
|
|
|
23,342 |
|
|
|
— |
|
|
|
(23,342 |
) |
|
|
— |
|
Others, Income/(loss)(3) |
|
|
(64,655 |
) |
|
|
752,063 |
|
|
|
131,438 |
|
|
|
15,283 |
|
|
|
— |
|
|
|
834,129 |
|
Income before income taxes |
|
|
3,275,658 |
|
|
|
3,634,758 |
|
|
|
492,943 |
|
|
|
11,624 |
|
|
|
(3,876,042 |
) |
|
|
3,538,941 |
|
Income tax (expense)/benefit |
|
|
— |
|
|
|
(270,998 |
) |
|
|
(1,665 |
) |
|
|
11,718 |
|
|
|
— |
|
|
|
(260,945 |
) |
Net income/(loss) |
|
|
3,275,658 |
|
|
|
3,363,760 |
|
|
|
491,278 |
|
|
|
23,342 |
|
|
|
(3,876,042 |
) |
|
|
3,277,996 |
|
Net loss/(income) attributable to noncontrolling |
|
|
— |
|
|
|
(2,338 |
) |
|
|
— |
|
|
|
— |
|
|
|
— |
|
|
|
(2,338 |
) |
Net income attributable to Autohome Inc. |
|
|
3,275,658 |
|
|
|
3,361,422 |
|
|
|
491,278 |
|
|
|
23,342 |
|
|
|
(3,876,042 |
) |
|
|
3,275,658 |
|
Notes:
Selected Condensed Consolidating Balance Sheets Information
13
|
|
As of December 31, 2022 |
|
|||||||||||||||||||||
|
|
Autohome |
|
|
Other |
|
|
Primary |
|
|
VIEs and |
|
|
Eliminations |
|
|
Consolidated |
|
||||||
|
|
(RMB in thousands) |
|
|||||||||||||||||||||
Cash and cash equivalents, restricted cash and |
|
|
1,267,174 |
|
|
|
18,180,625 |
|
|
|
2,322,350 |
|
|
|
319,917 |
|
|
|
— |
|
|
|
22,090,066 |
|
Amounts due from Group companies |
|
|
3,413,603 |
|
|
|
1,773,135 |
|
|
|
576,346 |
|
|
|
333,174 |
|
|
|
(6,096,258 |
) |
|
|
— |
|
Other current assets |
|
|
12,918 |
|
|
|
2,175,054 |
|
|
|
54,927 |
|
|
|
91,966 |
|
|
|
— |
|
|
|
2,334,865 |
|
Total current assets |
|
|
4,693,695 |
|
|
|
22,128,814 |
|
|
|
2,953,623 |
|
|
|
745,057 |
|
|
|
(6,096,258 |
) |
|
|
24,424,931 |
|
Investment in subsidiaries and VIEs |
|
|
|
|
|
|
|
|
|
|
|
|
|
|
|
|
|
|
||||||
-Investment in subsidiaries(1) |
|
|
19,214,273 |
|
|
|
2,280,661 |
|
|
|
400,571 |
|
|
|
— |
|
|
|
(21,895,505 |
) |
|
|
— |
|
-Investment in VIE(1) |
|
|
— |
|
|
|
— |
|
|
|
1,610,343 |
|
|
|
— |
|
|
|
(1,610,343 |
) |
|
|
— |
|
Other non-current assets |
|
|
— |
|
|
|
3,352,420 |
|
|
|
100,757 |
|
|
|
1,837,711 |
|
|
|
— |
|
|
|
5,290,888 |
|
Total non-current assets |
|
|
19,214,273 |
|
|
|
5,633,081 |
|
|
|
2,111,671 |
|
|
|
1,837,711 |
|
|
|
(23,505,848 |
) |
|
|
5,290,888 |
|
Total assets |
|
|
23,907,968 |
|
|
|
27,761,895 |
|
|
|
5,065,294 |
|
|
|
2,582,768 |
|
|
|
(29,602,106 |
) |
|
|
29,715,819 |
|
Accrued expenses and other payables |
|
|
17,355 |
|
|
|
2,057,770 |
|
|
|
238,415 |
|
|
|
250,837 |
|
|
|
— |
|
|
|
2,564,377 |
|
Advance from customers |
|
|
— |
|
|
|
30,806 |
|
|
|
91 |
|
|
|
65,150 |
|
|
|
— |
|
|
|
96,047 |
|
Deferred revenue |
|
|
— |
|
|
|
1,091,727 |
|
|
|
19,305 |
|
|
|
36,099 |
|
|
|
— |
|
|
|
1,147,131 |
|
Income tax payable |
|
|
— |
|
|
|
220,791 |
|
|
|
27,486 |
|
|
|
2,844 |
|
|
|
— |
|
|
|
251,121 |
|
Amounts due to Group companies |
|
|
1,771 |
|
|
|
3,863,942 |
|
|
|
1,661,511 |
|
|
|
569,034 |
|
|
|
(6,096,258 |
) |
|
|
— |
|
Total current liabilities |
|
|
19,126 |
|
|
|
7,265,036 |
|
|
|
1,946,808 |
|
|
|
923,964 |
|
|
|
(6,096,258 |
) |
|
|
4,058,676 |
|
Total non-current liabilities |
|
|
— |
|
|
|
82,802 |
|
|
|
437,254 |
|
|
|
48,461 |
|
|
|
— |
|
|
|
568,517 |
|
Total liabilities |
|
|
19,126 |
|
|
|
7,347,838 |
|
|
|
2,384,062 |
|
|
|
972,425 |
|
|
|
(6,096,258 |
) |
|
|
4,627,193 |
|
Mezzanine equity: |
|
|
— |
|
|
|
1,605,639 |
|
|
|
— |
|
|
|
— |
|
|
|
— |
|
|
|
1,605,639 |
|
Total Autohome Inc. shareholders’ equity |
|
|
23,888,842 |
|
|
|
19,214,273 |
|
|
|
2,681,232 |
|
|
|
1,610,343 |
|
|
|
(23,505,848 |
) |
|
|
23,888,842 |
|
Noncontrolling interests |
|
|
— |
|
|
|
(405,855 |
) |
|
|
— |
|
|
|
— |
|
|
|
— |
|
|
|
(405,855 |
) |
Total shareholders’ equity |
|
|
23,888,842 |
|
|
|
18,808,418 |
|
|
|
2,681,232 |
|
|
|
1,610,343 |
|
|
|
(23,505,848 |
) |
|
|
23,482,987 |
|
Total liabilities, mezzanine equity and equity |
|
|
23,907,968 |
|
|
|
27,761,895 |
|
|
|
5,065,294 |
|
|
|
2,582,768 |
|
|
|
(29,602,106 |
) |
|
|
29,715,819 |
|
Notes:
14
|
|
As of December 31, 2021 |
|
|||||||||||||||||||||
|
|
Autohome |
|
|
Other |
|
|
Primary |
|
|
VIEs and |
|
|
Eliminations |
|
|
Consolidated |
|
||||||
|
|
(RMB in thousands) |
|
|||||||||||||||||||||
Cash and cash equivalents, restricted cash and short- |
|
|
320,639 |
|
|
|
16,968,899 |
|
|
|
3,074,976 |
|
|
|
458,109 |
|
|
|
— |
|
|
|
20,822,623 |
|
Amounts due from Group companies |
|
|
3,862,063 |
|
|
|
2,295,176 |
|
|
|
1,156,827 |
|
|
|
183,335 |
|
|
|
(7,497,401 |
) |
|
|
— |
|
Other current assets |
|
|
7,117 |
|
|
|
2,342,777 |
|
|
|
58,677 |
|
|
|
94,524 |
|
|
|
— |
|
|
|
2,503,095 |
|
Total current assets |
|
|
4,189,819 |
|
|
|
21,606,852 |
|
|
|
4,290,480 |
|
|
|
735,968 |
|
|
|
(7,497,401 |
) |
|
|
23,325,718 |
|
Investment in subsidiaries and VIEs |
|
|
|
|
|
|
|
|
|
|
|
|
|
|
|
|
|
|
||||||
-Investment in subsidiaries(1) |
|
|
18,477,331 |
|
|
|
3,009,373 |
|
|
|
395,800 |
|
|
|
— |
|
|
|
(21,882,504 |
) |
|
|
— |
|
-Investment in VIE(1) |
|
|
— |
|
|
|
— |
|
|
|
1,697,324 |
|
|
|
— |
|
|
|
(1,697,324 |
) |
|
|
— |
|
Other non-current assets(2) |
|
|
— |
|
|
|
3,006,415 |
|
|
|
144,454 |
|
|
|
1,922,848 |
|
|
|
— |
|
|
|
5,073,716 |
|
Total non-current assets |
|
|
18,477,331 |
|
|
|
6,015,788 |
|
|
|
2,237,578 |
|
|
|
1,922,848 |
|
|
|
(23,579,828 |
) |
|
|
5,073,716 |
|
Total assets |
|
|
22,667,150 |
|
|
|
27,622,640 |
|
|
|
6,528,058 |
|
|
|
2,658,816 |
|
|
|
(31,077,229 |
) |
|
|
28,399,434 |
|
Amounts due to Group companies |
|
|
22,740 |
|
|
|
4,713,764 |
|
|
|
2,235,914 |
|
|
|
524,983 |
|
|
|
(7,497,401 |
) |
|
|
— |
|
Accrued expenses and other payables |
|
|
19,562 |
|
|
|
1,529,808 |
|
|
|
271,463 |
|
|
|
255,661 |
|
|
|
— |
|
|
|
2,076,494 |
|
Advance from customers |
|
|
— |
|
|
|
34,610 |
|
|
|
61 |
|
|
|
88,699 |
|
|
|
— |
|
|
|
123,370 |
|
Deferred revenue |
|
|
— |
|
|
|
1,495,984 |
|
|
|
25,544 |
|
|
|
31,485 |
|
|
|
— |
|
|
|
1,553,013 |
|
Income tax payable |
|
|
— |
|
|
|
115,154 |
|
|
|
118,188 |
|
|
|
— |
|
|
|
— |
|
|
|
233,342 |
|
Total current liabilities |
|
|
42,302 |
|
|
|
7,889,320 |
|
|
|
2,651,170 |
|
|
|
900,828 |
|
|
|
(7,497,401 |
) |
|
|
3,986,219 |
|
Total non-current liabilities |
|
|
— |
|
|
|
73,038 |
|
|
|
471,715 |
|
|
|
60,664 |
|
|
|
— |
|
|
|
605,417 |
|
Total liabilities |
|
|
42,302 |
|
|
|
7,962,358 |
|
|
|
3,122,885 |
|
|
|
961,492 |
|
|
|
(7,497,401 |
) |
|
|
4,591,636 |
|
Mezzanine equity |
|
|
— |
|
|
|
1,468,029 |
|
|
|
— |
|
|
|
— |
|
|
|
— |
|
|
|
1,468,029 |
|
Total Autohome Inc. shareholders’ equity |
|
|
22,624,848 |
|
|
|
18,477,331 |
|
|
|
3,405,173 |
|
|
|
1,697,324 |
|
|
|
(23,579,828 |
) |
|
|
22,624,848 |
|
Noncontrolling interests |
|
|
— |
|
|
|
(285,078 |
) |
|
|
— |
|
|
|
— |
|
|
|
— |
|
|
|
(285,078 |
) |
Total shareholders’ equity |
|
|
22,624,848 |
|
|
|
18,192,253 |
|
|
|
3,405,173 |
|
|
|
1,697,324 |
|
|
|
(23,579,828 |
) |
|
|
22,339,770 |
|
Total liabilities, mezzanine equity and equity |
|
|
22,667,150 |
|
|
|
27,622,640 |
|
|
|
6,528,058 |
|
|
|
2,658,816 |
|
|
|
(31,077,229 |
) |
|
|
28,399,435 |
|
Notes:
Selected Condensed Consolidating Cash Flows Information
|
|
For the Year Ended December 31, 2022 |
|
|||||||||||||||||||||
|
|
Parent Only |
|
|
Other Equity Subsidiaries |
|
|
Primary Beneficiary of VIEs |
|
|
VIEs and VIEs’ subsidiaries |
|
|
Eliminations |
|
|
Consolidated Total |
|
||||||
|
|
(RMB in thousands) |
|
|||||||||||||||||||||
Net cash (used in)/provided by |
|
|
19,118 |
|
|
|
2,405,168 |
|
|
|
121,500 |
|
|
|
19,289 |
|
|
|
— |
|
|
|
2,565,075 |
|
Net cash (used in)/provided by |
|
|
763,328 |
|
|
|
(3,376,954 |
) |
|
|
(326,046 |
) |
|
|
(812,606 |
) |
|
|
642,861 |
|
|
|
(3,109,417 |
) |
Net cash (used in)/provided by |
|
|
(1,140,065 |
) |
|
|
(191,728 |
) |
|
|
167,736 |
|
|
|
666,853 |
|
|
|
(642,861 |
) |
|
|
(1,140,065 |
) |
15
|
|
For the Year Ended December 31, 2021 |
|
|||||||||||||||||||||
|
|
Parent Only |
|
|
Other Equity Subsidiaries |
|
|
Primary Beneficiary |
|
|
VIEs and VIEs’ subsidiaries |
|
|
Eliminations |
|
|
Consolidated Total |
|
||||||
|
|
(RMB in thousands) |
|
|||||||||||||||||||||
Net cash (used in)/provided by |
|
|
(10,770 |
) |
|
|
2,852,900 |
|
|
|
269,838 |
|
|
|
411,966 |
|
|
|
— |
|
|
|
3,523,934 |
|
Net cash (used in)/provided by |
|
|
(2,841,291 |
) |
|
|
(4,681,424 |
) |
|
|
173,535 |
|
|
|
(386,343 |
) |
|
|
3,922,510 |
|
|
|
(3,813,013 |
) |
Net cash (used in)/provided by |
|
|
2,898,296 |
|
|
|
3,886,326 |
|
|
|
(127,240 |
) |
|
|
163,424 |
|
|
|
(3,922,510 |
) |
|
|
2,898,296 |
|
|
|
For the Year Ended December 31, 2020 |
|
|||||||||||||||||||||
|
|
Parent Only |
|
|
Other Equity Subsidiaries |
|
|
Primary Beneficiary |
|
|
VIEs and VIEs’ subsidiaries |
|
|
Eliminations |
|
|
Consolidated Total |
|
||||||
|
|
(RMB in thousands) |
|
|||||||||||||||||||||
Net cash (used in)/provided by |
|
|
(1,188 |
) |
|
|
1,481,771 |
|
|
|
1,821,901 |
|
|
|
23,147 |
|
|
|
— |
|
|
|
3,325,631 |
|
Net cash (used in)/provided by |
|
|
532,293 |
|
|
|
(727,798 |
) |
|
|
(1,801,299 |
) |
|
|
193,190 |
|
|
|
(1,181,844 |
) |
|
|
(2,985,458 |
) |
Net cash (used in)/provided by |
|
|
(546,967 |
) |
|
|
(532,293 |
) |
|
|
(649,551 |
) |
|
|
— |
|
|
|
1,181,844 |
|
|
|
(546,967 |
) |
Not applicable.
Not applicable.
Summary of Risks Factors
An investment in our ADSs or ordinary shares involves significant risks. Below is a summary of material risks we face, organized under relevant headings. All the operational risks associated with being based in and having operations in mainland China also apply to operations in Hong Kong. With respect to the legal risks associated with being based in and having operations in mainland China, the laws, regulations and the discretion of mainland China governmental authorities discussed in this annual report are expected to apply to mainland China entities and businesses, rather than entities or businesses in Hong Kong which operate under a different set of laws from mainland China. These risks are discussed more fully in "Item 3. Key Information—D. Risk Factors."
Risks Related to Our Business and Industry
16
Risks Related to Our Corporate Structure
Risks Related to Doing Business in Mainland China
17
for our financial statements and the inability of the PCAOB to conduct inspections of our auditor in the past
has deprived our investors with the benefits of such inspections.
Risks Related to Our ADSs and Ordinary Shares
Risks Related to Our Business and Industry
We are dependent on mainland China’s automotive industry for substantially all of our revenues and future growth, the prospects of which are subject to many uncertainties, including government regulations and policies and health epidemics.
We rely on mainland China’s automotive industry for substantially all of our revenues and future growth. We have greatly benefited from the growth of mainland China’s automotive industry historically. However, this industry has experienced fluctuations in its development. In July 2018, mainland China’s automotive industry experienced negative growth for the first time in the past 28 years and new passenger vehicle purchases in mainland China declined for the whole year of 2018, 2019 and 2020. Although mainland China’s automotive industry turned into positive growth in the year of 2021 and 2022, we cannot predict how this industry will develop in the future, as it could be affected by complex factors, including general economic conditions in mainland China, the urbanization rate of mainland China’s population, the growth of disposable household income, the costs of new automobiles, the trade barriers and tensions and other governmental protectionist measures, as well as taxes and incentives related to automobile purchases, among other things. Specifically, tariffs or a global trade war could increase the cost of imported automobiles, which could negatively impact the demand for automobiles and adversely impact our business. In addition, governmental policies-including restrictions by major cities on new passenger vehicle plate issuance, increasingly stringent emission standards, adjustment of purchase tax and termination of subsidies may have a considerable impact on the growth of the automotive industry in mainland China.
18
The automotive industry in mainland China was negatively impacted as well by the outbreak of COVID-19, during which automobile production and the number of purchasers declined due to precautionary government-imposed closures of certain travel and business, the government’s order to delay resumption of service and mass production and the related quarantine measures. The containment efforts led by the government also caused delay in the near-term marketing demand of our automaker and dealer customers. While substantially all of the restrictions on movement within mainland China had been relaxed as of the date of this annual report, there is great uncertainty as to the future development of the COVID-19 outbreak and its impact on the automotive industry.
Such regulatory developments, health epidemics as well as other uncertainties, may adversely affect the growth prospects of mainland China’s automotive industry, and in turn reduce demand for automobiles. If automakers and automobile dealers were to reduce their marketing expenditures as a result, our business, financial condition and results of operations could be materially and adversely affected.
We face significant competition, and if we fail to compete effectively, we may lose market share and our business, prospects and results of operations may be materially and adversely affected.
The markets for our services are highly competitive. With respect to our auto media and leads generation businesses, we face competition from China’s automotive vertical websites and mobile applications, such as BitAuto, Dongchedi, Xcar and PCauto, from the automotive channels of major internet portals, such as Sina and Sohu, and from companies engaged in mobile social media, news, video and live-streaming applications. We may also face competition from online automobile transaction platforms, such as Uxin, Guazi and Renrenche as we develop our used car transaction business. Our auto finance business faces competition from other auto finance companies, such as Yixin and Souche. In addition, we also face competition from companies engaged in social media business, such as ByteDance and Tencent, companies engaged in data product offering, such as Bitauto and Dongchedi, and companies engaged in AI and big data technologies. We may also face competition from mobile applications of automakers as some automakers explore to connect with users directly. Competition with these and other websites and mobile applications is primarily centered on increasing user reach, user engagement and brand recognition, building relationships with the suppliers, and attracting and retaining customers, among other factors.
Some of our competitors or potential competitors have longer operating histories and may have greater financial, management, technological, sales, marketing and other resources than we do. They may use their experience and resources to compete with us in a variety of ways, including by competing more heavily for users and customers, investing more heavily in marketing, traffic acquisition and research and development, and making more acquisitions. Some of our competitors have entered or may enter into business cooperation agreements with search engines, which may impact our ability to obtain additional user traffic from the same sources. Our competitors may be acquired and consolidated by, or cooperate with, industry conglomerates who are able to further invest with significant resources into our operating space. We cannot assure you that any such large internet business or other popular technology companies will not in the future focus on the automotive sector. If we are unable to compete effectively and at a reasonable cost against our existing and future competitors, our business, prospects and results of operations could be materially and adversely affected.
For our media business, we also face competition from traditional advertising media, such as newspapers, magazines, television, radio and outdoor media. Advertisers in China generally allocate certain portion of their marketing budgets to traditional advertising media. If we cannot effectively compete with traditional media for the marketing budgets of our existing and potential customers, our results of operations and growth prospects could be adversely affected. For our online marketplace business, as online automobile transaction is a relatively new business model and consumers in China might be accustomed to make automobile purchases offline, we cannot guarantee that the automobile consumers in China will accept such business model.
Beginning in 2019, we expanded our business to the European market and established two subsidiaries in the UK and Germany. These subsidiaries have not generated significant revenues as of December 31, 2022 and are scaling back their operations due to the macroenvironmental changes and the evolution of our strategies. However, if we maintain our business overseas or decide to expand our global footprint in the future, we will face competition from local automotive vertical websites and mobile applications and online automobile transaction platforms, which may have more experience in the local markets and have relatively more established user bases. We cannot guarantee that we will be able to compete effectively for talents, users or customers. We may also incur additional
19
expenses in our overseas acquisitions and subsequent marketing and other spending to acquire new customers. If we cannot maintain customer recognition and trust in us and successfully attract and retain sufficient users on our overseas platform, our results of operations and growth prospects could be adversely affected.
We may not be able to maintain our current level of growth or ensure the success of our expansion and new business initiatives.
Our historical growth rates may not be indicative of our future growth, and we may not be able to generate similar growth rates in the future. Our revenue or profit growth may slow down, or our revenues or profits may decline for possible reasons, including increased costs and operating expenses, increasing competition, slow growth of our business development, failure in new business initiative exploration, emergence of alternative business models, adjustment of our certain business operations, and changes in government policies or general economic conditions. We cannot assure you that we will grow at the same rate as we had in the past.
We expect to continue to grow our user base and our business operations. We have been implementing our future strategy to integrate and create a consumer centric automotive ecosystem, but we may not have sufficient experience in executing our new business initiatives during this process. These new business initiatives may not be well received by the market and we may determine to cease some new initiatives from time to time. We cannot assure you that they will achieve the success we expect, in which case we may not be able to recoup the resources we invest to develop, optimize and expand our new business initiatives.
To manage the further expansion of our business, we need to continuously expand and enhance our infrastructure and technology, and improve our operational and financial systems, procedures and internal controls. We need to adapt our business management to the local corporate cultures and customs, and train, manage and motivate our growing employee base. In addition, we need to maintain and expand our relationships with automakers, automobile dealers, advertising agencies, financial institutions, insurance companies and other third parties. We cannot assure you that our current and planned personnel, infrastructure, systems, procedures and controls will be adequate to support our expanding operations, neither can we guarantee that we will be able to effectively adapt our business management to the local corporate cultures and customs and attract and motivate sufficient talents to support our new business initiatives if and when any of them are launched.
We may be required to further increase our research and development expenses in order to enhance our technology capabilities, such as artificial intelligence technologies, big data technologies and cloud technologies, to support any such expansion and our efforts may not be effective. Our new business initiatives may also expose us to new regulatory risks, which could be different from what we have experienced before and may increase our compliance costs. Lack of experience in handling these new risks and managing the related costs may result in failure to generate the expected results of operations and prospects, and may subject us to substantial liabilities, which could harm our reputation and business operations.
If we fail to attract and retain users and customers or if our services do not gain market acceptance or result in the loss of our current customer base, our business and results of operations may be materially and adversely affected.
In order to maintain and strengthen our position as the leading online destination for automobile consumers in China, we must continue to attract and retain users to our websites and mobile applications, which requires us to continue to provide quality content throughout the automobile ownership life cycles. We must also innovate and introduce services and applications that enhance user experience. In addition, we must maintain and enhance our brand recognition among consumers. If we fail to provide high-quality, enriched and customized content, offer a superior user experience or maintain and enhance our brand recognition, we may not be able to attract and retain users. If our user base decreases, our websites and mobile applications may be rendered less attractive to customers, including automakers and dealers, and our services may become less attractive, which may have a material and adverse impact on our business, financial condition and results of operations.
20
In addition, one element of our growth strategy is to expand our services to customers. As a result, we have added additional services in the past few years. To serve our dealer customers, we had local sales and service representatives covering 58 cities across mainland China as of December 31, 2022. We intend to increase our penetration in existing dealer advertising and subscription services markets. We have implemented business strategies to further monetize our large dealer network by enlarging the offering of products and services with new technologies on our dealer digital platform, increasing the average spending of our existing dealer subscribers and upselling our dealership packages for our leads generation services. In order to increase the average spending of our existing dealer subscribers, we keep close communications and negotiations with relevant parties such as dealers, dealer groups and automakers. However, we may not succeed in making our customers sufficiently aware of existing and future services or in creating customer acceptance of these services at the prices we would like to charge, and we cannot guarantee that our pricing strategy and measures will always be agreed and accepted by any and all of our customers. We may not be able to achieve the market acceptance of our products and services as we expect and thus may fail to achieve an increase from our “share of wallet” approach. Our existing customers may even terminate their cooperation with us if they are not satisfied with our pricing strategy or measures, which may subject us to negative publicity and adversely impact our business. The decline in the auto market may result in our dealer customers’ cancelation of subscription services from us or even discontinuance of operations, which would directly impact our number of dealer customers. Also, we may not identify trends correctly, or may not be able to bring new services to market as quickly, effectively or price-competitively as our competitors. New services may alienate existing customers or cause us to lose business to our competitors. If the number of our dealer customers decreases, we might not be able to generate sufficient revenues to cover our increased costs and expenses. As a result, our business and results of operations may be materially and adversely affected.
Our ability to attract and retain users and customers may also be impacted by the sales and marketing approach taken by automakers. For example, our potential users may be diverted to automakers of new energy vehicles that are pushing for direct sale model. While certain other automakers of new energy vehicles are conducting advertising and marketing through direct engagement with consumers in addition to advertising placements on internet platforms like us, and we are actively exploring new business initiatives in relation to the new energy vehicles, such as launching our first offline experience store – Autohome Energy Space – in Shanghai in September 2022, providing users with a one-stop car selecting and purchasing experience; there remain uncertainties that a portion, if not all, of our users or potential users who are interested in new energy vehicles direct sale model may be diverted to these automakers. In addition, our products and services under current business model may not be able to meet the needs of the continuous development of the new energy industry. Although we offer diversified products and services and look for new avenues to capture the opportunities brought by this trend, we cannot assure you that our products and services will gain wide acceptance from automakers. Any of these occurrences could adversely affect our results of operations, financial condition and business prospects.
Our business depends on strong brand recognition, and failure to maintain or enhance our brands could adversely affect our business and prospects.
Maintaining and enhancing our “Autohome,” “Che168” and “TTP” brands is critical to our business and prospects. We believe that brand recognition will become increasingly important as the number of internet users in China grows and competition in our industry intensifies. A number of factors could prevent us from successfully promoting our brands, including user dissatisfaction with the content offered on our websites or mobile applications, negative publicity involving our business, our management, our brand spokespersons, our relationship with our partners and customers, the failure of our sales and marketing activities, employee relationship and welfare, regulatory compliance and financial conditions. If we fail to maintain and enhance our brands, or if we incur excessive expenses in this effort, our business, results of operations and financial condition might be materially and adversely affected.
Our business is subject to complex and evolving Chinese laws and regulations regarding data privacy and cybersecurity, many of which are subject to changes and uncertain interpretations. Any changes in these laws could cause changes to our business practices and increased cost of operations, and any security breaches or our actual or perceived failure to comply with such laws could result in claims, penalties, damages to our reputation and brand, declines in user growth or engagement, or otherwise harm our business, results of operations and financial condition.
21
Our platform collects, stores and processes certain personal and other sensitive data from our users for purpose of providing our services. We have taken technical measures to ensure the security of such personal information and prevent the personal information from being divulged, damaged or lost, and we believe the measures we take regarding collection, storage, and use of personal data are generally compliant with industry standards. However, we face risks inherent in handling and protecting personal data. In particular, we face a number of challenges relating to data from transactions and other activities on our platform, including:
In general, we expect that data security and data protection compliance will receive greater attention and focus from regulators, both domestically and globally, as well as continued or greater public scrutiny and attention going forward, which could increase our compliance costs and subject us to heightened risks and challenges associated with data security and protection. If we are unable to manage these risks, or if we are accused of failing to comply with such laws and regulations, we could be subject to penalties, including fines, suspension of business, websites or applications, and revocation of required licenses, and our reputation and results of operations could be materially and adversely affected.
Regulatory authorities in mainland China have enhanced data protection and cybersecurity regulatory requirements, many of which are subject to change and uncertain interpretation. These laws continue to develop, and the PRC government may adopt further rules, restrictions and clarifications in the future. On March 10, 2023, the NPC adopted the institutional reform plan of the State Council, or the “Institutional Reform Plan (2023)”. Pursuant to Institutional Reform Plan (2023), the State Bureau for Data shall be established, aiming to be responsible for coordinating and promoting the development of data infrastructure of the State and to undertake some tasks related data infrastructure which was originally undertaken by CAC and NDRC. Moreover, different PRC regulatory bodies, including the SCNPC, the MIIT, the CAC, The Ministry of Public Security and the State Administration for Market Regulation, or the SAMR, have enforced data privacy and protections laws and regulations with varying standards and applications. See “Item 4. Information on the Company—B. Business Overview—Regulation—Regulations on Internet Privacy and Data Security.” The following are non-exhaustive examples of certain recent PRC regulatory activities in this area:
Cybersecurity
Due to the data assets we have, our platform is an attractive target and potentially vulnerable to cyberattacks, computer viruses, physical or electronic break-ins or similar disruptions. Because techniques used to sabotage or obtain unauthorized access to systems evolve continuously and frequently and generally are not recognized until they are launched against a target, we may be
22
unable to anticipate these techniques or to implement adequate preventative counter-measures. In addition to advances in technology, an increased level of sophistication and diversity of our products and services, an increased level of expertise of hackers, new discoveries in the field of cryptography or other risks can result in the compromise or breach of our websites or our apps. If security measures are breached because of third-party action, employee error, malfeasance or otherwise, or if design flaws in our technology infrastructure are exposed and exploited, user data or personal information could be stolen or misused, which could expose us to penalties or other administrative actions, time-consuming and expensive litigation and negative publicity, materially and adversely affect our business and reputation and deter potential users from using our products, each of which would have a material adverse impact on our results of operations, financial condition and business prospect.
Data Security
23
Personal Information and Privacy
Furthermore, the PRC government authorities have taken steps to limit the method and manner that internet companies may apply when using algorithms. For instance, on December 31, 2021, the CAC, the MIIT, the Ministry of Public Security, and the SAMR jointly promulgated the Administrative Provisions on Algorithm Recommendation in Internet Information Services, which came into effect on March 1, 2022. The Administrative Provisions on Algorithm Recommendation in Internet Information Services implements classification and hierarchical management for algorithm recommendation service providers based on various criteria. Under the Administrative Provisions on Algorithm Recommendation in Internet Information Services, algorithm recommendation service providers shall inform users in a conspicuous manner that algorithm is used in service recommendations, inform users of the basic principles, purpose and intentions, and inform users in an appropriate manner of the main operating mechanisms for the algorithm recommendation services. Under the Administrative Provisions on Algorithm Recommendation in Internet Information Services, algorithm recommendation service providers selling goods or providing services to consumers shall (i) protect consumers’ rights of fair trade, and (ii) be prohibited from applying differential treatments to consumers with respect to transaction terms and conditions in an unreasonable manner based on consumers’ preferences, purchasing habits and such other characteristics. In addition, on June 24, 2022, the SCNPC released the final version of the revised Anti-Monopoly Law, which came into effect on August 1, 2022. The revised Anti-Monopoly Law provides, among others, that business operators shall not abuse, among others, algorithms, to exclude or limit competition, and makes several major changes and additions, including prohibiting the use of certain technology to engage in anti-competitive behavior and raising the maximum fines for violations. As of the date of this annual report, we have not applied any algorithms-driven discriminatory treatment towards users. In addition, we have also provided an option for our users to deactivate the algorithm-driven recommendations. However, we cannot assure you that our algorithm recommendation functions are or will continue to be in compliance in all respects with the evolving rules in the area of the algorithm-based recommendations. We will closely monitor the regulatory development and adjust our business operations from time to time to comply with the regulations over algorithm-based recommendation. If our algorithm recommendation functions were to be required to adjust in a manner that is adverse to our business in accordance with applicable rules, our ability to enhance the quality of content offering on our platform and deepen user engagement may be adversely affected.
Many of the data and data privacy-related laws and regulations are relatively new and certain concepts thereunder remain subject to interpretation by the regulators. If any data that we possess belongs to data categories that are or may become subject to heightened scrutiny, we may be required to adopt stricter measures for protection and management of such data. We cannot predict the impact of the Cybersecurity Review Measures and the Draft Regulations on Network Data Security, if any, at this stage, and we will closely monitor and assess any
24
developments in the rule-making process. If the Cybersecurity Review Measures and the enacted version of the Draft Regulations on Network Data Security mandate clearance of cybersecurity review and other specific actions to be taken by issuers like us, we face uncertainties as to whether these additional procedures can be completed by us timely, or at all, which may subject us to government enforcement actions and investigations, fines, penalties, suspension of our non-compliant operations, or removal of our app from the relevant application stores, and materially and adversely affect our business and results of operations. As of the date of this annual report, we have not been requested or notified by the CAC to conduct any cybersecurity review.
In general, compliance with the existing PRC laws and regulations, as well as additional laws and regulations that PRC legislative and regulatory bodies may enact in the future, related to cybersecurity, data security and personal information protection, may be costly and result in additional expenses to us, and subject us to negative publicity, which could harm our reputation and business operations. There are also uncertainties with respect to how such laws and regulations will be implemented and interpreted in practice. In light of the fact that laws and regulations on cybersecurity, data privacy and personal information protection are evolving and uncertainty remains with respect to their interpretation and implementation, we cannot guarantee that we will be able to maintain full compliance at all times, or that our existing user information protection system and technical measures will be considered sufficient. Any non-compliance or perceived non-compliance with these laws, regulations or policies may lead to warnings, fines, investigations, lawsuits, confiscation of illegal gains, revocation of licenses, closedown of websites, removal of apps and suspension of downloads, price drops in our securities or even criminal liabilities against us by government agencies or other individuals. In addition, our launch of new products or services or other actions that we take in the future may subject us to additional laws, regulations, or other government scrutiny.
A limited number of automaker customers have accounted for, and are expected to continue to account for, a large portion of our revenues. Failure to maintain or to increase revenues from these customers could harm our prospects.
A limited number of automaker customers have accounted for, and are expected to continue to account for, a large portion of our revenues. In 2020, 2021 and 2022, 92, 91, and 100 automakers operating in mainland China used our media services, respectively. These automakers include independent Chinese automakers, joint ventures between Chinese and international automakers and international automakers that sell cars made outside of mainland China. In 2022, our top five automaker customers contributed 26.4% of our media services revenues. We believe that our major future revenue growth will be focused on deepening our existing commercial relationships with automakers to increase our share of each automaker’s budget. We cannot assure you that our automaker customers will continue to be satisfied with our cooperation model and strategy as well as our services, or our relationships with any of these automaker customers will continue in the future. Failure to provide deliverables satisfactory to our automaker customers or failure to reach a mutually amicable agreement with our automaker customers on the collection of payable fees may adversely impact our relationships with our automaker customers, which would have a negative impact on our reputation and results of operations. If we lose one or more of our important automaker customers, or if they materially reduce their purchase of our services, our results of operations would be materially and adversely affected.
We typically extend credit terms to automaker customers, which is relatively longer than other customers. We face risk of being unable to collect all the accounts receivable from automaker customers in light of fluctuations in mainland China’s domestic automotive market. If we fail to collect accounts receivable from automakers in a timely manner, or at all, our business, results of operations and financial conditions may be materially and adversely affected. See “Item 3. Key Information—D. Risk Factors—Risks Related to Our Business and Industry—We are subject to credit risk in collecting the accounts receivable due from our customers.”
Due to the limited number of automakers operating in mainland China, which is exacerbated by the increasing competition and concentration of automakers in mainland China, and our revenue concentration attributable to a small number of these companies, any of the following events, among others, may cause a material decline in our revenue and materially and adversely affect our results of operations and prospects:
25
If we are unable to grow our used automobile-related business, we may not be able to achieve our expected business growth and our results of operations may be adversely affected.
Our che168.com website has been focusing on used automobile information and content since October 2011. We also launched che168.com mobile application in 2012. Through these platforms, we offer used automobile listing services to used automobile dealers and individual car owners through a user interface that allows potential used car buyers to identify listings that meet their specific requirements and contact the seller. To further enhance user experience and optimize our used automobile-related business, in June 2018, we invested in TTP Car Inc., or TTP, a company operating an online bidding platform for used automobiles, and in the fourth quarter of 2020, we acquired control in TTP.
We may not be able to successfully grow our used automobile-related business. Although the used automobile market in China is growing due to the increased number of consumer-owned automobiles, there is still significant uncertainty regarding the extent to which our used automobile-related business may benefit from such growth. We may not be able to source sufficient used automobiles or attract a broad user base to our che168.com and ttpai.cn website and mobile application or be successful compared to our competitors. Even if we are able to do so, we may not be able to establish a business model that allows us to effectively monetize the user traffic. We may not be able to successfully facilitate used car transactions and our services might not be satisfactory to the used car buyers or sellers. Additionally, customers may not respond well to our new business initiatives as we expect. In such cases, we may suffer negative publicity and evolving regulatory risks, we may not be able to achieve our expected business growth and our results of operations and reputation may be adversely affected.
If we are unable to conduct our marketing activities cost-effectively, our results of operations and financial condition may be materially and adversely affected.
We have incurred expenses on a variety of marketing and brand promotion efforts designed to enhance our brand recognition and increase sales of our products and services. Our marketing and promotional activities may not be well received by customers and may not result in the level of sales of products and services that we anticipate. We incurred RMB3,246.5 million, RMB2,759.9 million and RMB2,866.2 million (US$415.6 million) in sales and marketing expenses in 2020, 2021 and 2022, respectively, representing 37.5%, 38.1% and 41.3%, respectively, of total net revenues in the corresponding years. Marketing approaches and tools in the consumer products market in China are evolving. This further requires us to enhance our marketing approaches and experiment with new marketing methods to keep pace with industry developments and consumer preferences, which may not be as cost-effective as our marketing activities in the past and may lead to significantly higher marketing expenses in the future. We conducted various sales and marketing initiatives to promote our brands through websites, search engines, mobile platforms, navigation sites and traditional media channels, for example, the annual “Singles’ Day” event, the “AR Auto Show” event and TV ad broadcast on China Central Television. We also conducted various offline promotional activities and cooperated with brands and dealers for promotions in target regions. In August 2019, we launched the 818 Super Auto Show, the first auto-themed gala in mainland China that created an innovative integration of online and offline promotion elements, which attracted a large number of automakers, dealers and potential auto consumers to participate and further promoted Autohome’s brand awareness to a much wider user base. As of the date of this annual report, we had held the show for four consecutive years. In addition, we engaged celebrities, primarily athletes, as our brand spokespersons to further promote our brand and stimulate user interest in our platform. We may not be able to continue or conduct these activities efficiently, and our marketing activities may not yield satisfactory results. Failure to refine our existing marketing approaches or to introduce new effective marketing approaches in a cost-effective manner could impact our net revenues and profitability.
26
Our auto insurance brokerage businesses are highly regulated. Non-compliance with applicable laws, regulations and regulatory requirements or failure to respond to legal and regulatory changes may adversely affect our business and prospects.
We have obtained the relevant license to conduct auto insurance brokerage businesses from the China Banking and Insurance Regulatory Commission, or the CBIRC, and such businesses generated an insignificant amount of revenue for us in the three years ended December 31, 2020, 2021 and 2022. The insurance industry in mainland China is highly regulated, and the regulatory regime continues to evolve. The CBIRC has extensive authority to supervise and regulate the insurance industry in mainland China. The CBIRC conducts various reviews and inspections on insurance brokerage business operations from time to time, which could cover a broad range of aspects, including financial reporting, tax reporting, internal control and compliance with applicable laws, rules and regulations. On March 10, 2023, the NPC adopted the Institutional Reform Plan (2023), a significant institutional reform is that CBIRC will be revoked, and the State Bureau of Financial Regulation and Supervision will be established instead. If any non-compliance incidents in our insurance brokerage business operation are identified, we may be required to take certain rectification measures in accordance with applicable laws and regulations, and would be subject to regulatory actions including penalties, warnings, suspension of operations, revocation of licenses, tax, civil, administrative and criminal liabilities, any one or a combination of which would have negative impacts on our reputation, businesses, results of operations and financial conditions.
Furthermore, mainland China’s insurance regulatory regime is undergoing significant changes. Development of regulations applicable to online insurance business or our auto insurance brokerage business may result in additional restrictions on its business operations or more intensive competition in this industry. We might be required to spend time and resources in order to comply with any material changes in the regulatory environment, which could trigger changes to the competitive landscape and we may lose some or all of our competitive advantages on our auto insurance business during this process. The attention of our management team could be diverted to these efforts to cope with an evolving regulatory or competitive environment. Meanwhile, staying compliant with the restriction may result in limitation to our insurance brokerage business and limitation to its product and service offerings, which may reduce the attraction to clients. As a result, our business and results of operations might be negatively affected though insurance brokerage business currently does not contribute a material amount of revenue for us.
Goodwill and intangible assets impairment could adversely affect our results of operations and financial condition.
We recorded goodwill of RMB3,941.8 million, RMB3,941.8 million and RMB3,941.8 million (US$571.5 million) as of December 31, 2020, 2021 and 2022, respectively, in connection with the acquisition of Cheerbright International Holdings Limited, or Cheerbright, China Topside Co., Ltd. and Norstar Advertising Media Holdings Co., Ltd. in June 2008 and the acquisition of TTP, in December 2020. In addition, we recorded intangible assets of RMB278.5 million (US$40.4 million) as of December 31, 2022, primarily consisting of technologies, trademarks, customer relationship and database from the acquisition of TTP. We do not amortize goodwill. We have and will continue to incur amortization expenses as we amortize intangible assets over their estimated useful life on a straight-line basis. We undertake goodwill and intangible assets impairment reviews periodically or more frequently if there are indicators of impairment present. As of December 31, 2020, 2021 and 2022, we performed an impairment assessment and no provisions of goodwill and intangible assets were required. However, if in the future our goodwill or intangible assets is determined to be impaired, we would be required to write down the carrying value or record a provision of impairment loss for goodwill or intangible assets in our financial statements during the period in which our goodwill or intangible assets is determined to be impaired, and this impairment would adversely affect our results of operations and our financial condition.
We may be adversely affected by the mergers, acquisitions and other consolidation activities in the automobile industry which may exacerbate our customer concentration.
The potential mergers, acquisitions and other consolidation activities in mainland China’s automobile industry will result in a lower number of automakers and dealers, which make up a major part of our customer base. We are already subject to risks related to customer concentration. See “—A limited number of automaker customers have accounted for, and are expected to continue to account for, a large portion of our revenues. Failure to maintain or to increase revenues from these customers could harm our prospects.” Further consolidation within the automobile
27
industry could exacerbate our customer concentration. If we fail to maintain a good relationship with a large customer, our business, results of operations and financial condition could be harmed.
Increasing focus with respect to environmental, social and governance matters may impose additional costs on us or expose us to additional risks. Failure to adapt to or comply with the evolving expectations and standards on environmental, social and governance matters from investors and the PRC government may adversely affect our business, financial condition and results of operation.
The PRC government and public advocacy groups have been increasingly focused on environment, social and governance, or ESG, issues in recent years, making our business more sensitive to ESG issues and changes in governmental policies and laws and regulations associated with environment protection and other ESG-related matters. Investor advocacy groups, certain institutional investors, investment funds, and other influential investors are also increasingly focused on ESG practices and in recent years have placed increasing importance on the implications and social cost of their investments. Regardless of the industry, increased focus from investors and the PRC government on ESG and similar matters may hinder access to capital, as investors may decide to reallocate capital or to not commit capital as a result of their assessment of a company’s ESG practices. We described our concepts, specific practices and key achievements in ESG matters in our 2022 ESG report, which is accessible via hyperlink in our press release furnished to the SEC as Exhibit 99.1 to our Form 6-K (File No. 001-36222) on March 9, 2023. See “Item 4. Information on the Company—B. Business Overview—Environmental, Social and Governance Initiatives” for more information regarding our ESG report. Any ESG concern or issue could increase our regulatory compliance costs. If we do not adapt to or comply with the evolving expectations and standards on ESG matters from investors and the PRC government or are perceived to have not responded appropriately to the growing concern for ESG issues, regardless of whether there is a legal requirement to do so, we may suffer from reputational damage and the business, financial condition, and the price of our ADSs and/or ordinary shares could be materially and adversely effected.
Our business is subject to fluctuations, including seasonality, which makes our results of operations difficult to predict and may cause our quarterly results of operations to fall short of expectations.
Our quarterly revenues and other operating results have fluctuated in the past and may continue to fluctuate depending upon a number of factors, many of which are beyond our control. Our business experiences seasonal variations in association with the demand for automobiles in mainland China. For example, the first quarter of each year generally contributes the lowest portion of our annual net revenues primarily due to a slowdown in business activity around and during the Chinese New Year holiday, which occurs during the period. Consequently, our results of operations may fluctuate from quarter to quarter. For these reasons, comparing our operating results on a period-to-period basis may not be meaningful, and you should not rely on our historical results as an indication of our future performance. As each of our business lines may have different seasonality factors and the mix of our revenue source may shift from year to year, our past performance may not be indicative of future trends.
In addition, because a portion of our revenues arising from our media services is attributable to new model promotion campaigns, the timing and the number of new car releases of our major automaker advertisers can have a significant impact on our results of operations. The timing and the number of such releases, however, is subject to uncertainty due to various factors, such as automakers’ design or manufacturing issues, marketing conditions and government incentives or restrictions. These factors may make our results of operations difficult to predict and cause our quarterly results of operations to fall short of expectations.
If we are unable to maintain our relationships with advertising agencies or if we are unable to collect accounts receivable from advertising agencies in a timely manner, our results of operations and prospects may be materially and adversely affected.
We are currently selling a substantial portion of our advertising services and solutions to third-party advertising agencies that represent the automakers and automobile dealers, who could maintain our business relationships with automakers and automobile dealers. We do not have long-term cooperation agreements or exclusive arrangements with these agencies and they may elect to direct business to other advertising service providers, including our competitors. If we fail to retain and enhance our business relationships with third-party advertising agencies, in particular the few ones we frequently transact with, we may suffer from a loss of advertisers and our business,
28
financial condition, results of operations and prospects may be materially and adversely affected. In our agreements with certain major advertising agencies, we undertake to provide them with most favored pricing terms. Such most favored pricing terms may hinder our ability to acquire new customers using special pricing terms.
In addition, we have been relying on third-party advertising agencies for the collection of payment from advertisers and we have been relying on a few advertising agencies to collect a significant portion of our total account receivables. As a result, the financial soundness of advertising agencies may affect our collection of accounts receivable. We make a credit assessment of a potential advertising agency to evaluate the collectability of the advertising service fees before entering into an advertising contract. However, we cannot assure you that we will be able to accurately assess the creditworthiness of each advertising agency, and any failure of advertising agencies to pay us in a timely manner may adversely affect our liquidity and cash flows. Amid the fluctuations in new automobile purchases in mainland China, certain automakers operating in mainland China have suffered declining performance or financial difficulties. As a result, advertising agencies that represent the automakers and automobile dealers may encounter financial and operational difficulties, or even go out of businesses. This in turn causes us to suffer from longer accounts receivable turnover days, allowance for expected credit losses. Initiating legal proceedings against such advertising agencies can be expensive and time-consuming, and could divert our management’s attention and other resources from our business operations, which could adversely affect our results of operations. Even if we receive a favorable judgment in such legal proceedings, it may still be challenging and uncertain for us to collect the outstanding payments promptly and in full from the advertising agencies if they are experiencing financial difficulties or even go bankrupt. Moreover, even if we are able to enforce our rights against any collaterals other than cash for the outstanding payments, it may still be challenging and uncertain for us to effectively liquidate such collaterals.
If online advertising and promotion do not continue to grow in mainland China, our ability to increase revenue and profitability could be materially and adversely affected.
With the continuous growth of internet usage in mainland China, the internet has become an increasingly important marketing and advertising channel to mainland China’s automotive industry. Although online advertising and promotion have constituted a significant portion of the overall marketing activities of our current and potential advertisers and dealer subscribers, if the promotional effect or outcome realized through online advertising and promotion cannot meet the expectations of advertisers and dealer subscribers or address their needs, our advertisers and dealer subscribers may decrease their spending and efforts on online advertising and promotion. Our ability to increase revenue and profitability from online marketing may be adversely impacted by a number of factors, many of which are beyond our control, including:
If the internet does not become more widely accepted as an effective media platform for advertising and marketing by mainland China’s automotive industry, our business, financial condition and results of operations could be materially and adversely affected.
We are subject to credit risk in collecting the accounts receivable due from our customers.
29
The credit terms we extend to our customers result in accounts receivable. As of December 31, 2020, 2021 and 2022, our accounts receivable (net of allowance for doubtful accounts) were RMB3,124.2 million, RMB2,139.5 million and RMB1,927.7 million (US$279.5 million), respectively, and we recognized additions to allowance for doubtful accounts of RMB95.7 million, RMB53.3 million and RMB8.3 million (US$1.2 million) in 2020, 2021 and 2022, respectively. We usually make credit assessment of our customers before entering into agreements. However, we cannot assure you that we are or will be able to accurately assess the creditworthiness of each of our customers before entering into agreements, neither can we guarantee that each of these customers will be able to strictly follow and enforce the payment schedules provided in the agreements. Any inability of our customers to pay us in a timely manner may adversely affect our liquidity and cash flows, which in turn has a material adverse effect on our business operations and financial condition.
Our short-term investments may expose us to default risk and adversely affect our business, financial condition and results of operations.
During the years ended December 31, 2020, 2021 and 2022, we invested in bank deposits and adjustable-rate financial products with original maturities of less than 1 year. As of December 31, 2020, 2021 and 2022, our short-term investments amounted to RMB12,878.2 million, RMB16,496.3 million and RMB19,279.6 million (US$2,795.3 million), respectively. We are subject to default risk associated with these short-term investments, and we have experienced default on payment by asset managers of certain of our investments. For example, the investment of one of our subsidiaries in a financial product experienced deferral of payment by the financial institution when the relevant investment units reached maturity. As of the date of this annual report, we have not received all the payment from such financial institution, for which we recognized the related loss in the consolidated statements of comprehensive income. Although we have initiated legal proceedings to recover such payment, uncertainties to the outcome of such legal proceedings exist. Even if we receive a favorable judgment in such legal proceedings, there is no guarantee for us to collect the outstanding payments promptly and/or in full. Neither can we assure you that we will receive investment income or will not incur financial losses from our other investments. In addition, changes of inputs such as annual interest rate will change the fair value of certain of our short-term investments. In the event that we incur financial losses from these short-term investments, our business, financial condition and results of operations may be adversely affected.
Inaccuracy in pricing and listing information provided by third parties on our platform may adversely affect our business and financial performance.
Our automobile listings and promotional information are provided and updated by third parties on our platform, including the automakers, dealers, financial partners and used car sellers. Users interested in particular vehicle models can conveniently search for up-to-date information on such models without having to visit the local showrooms of relevant dealers or solicit related information from other sources. Although we have optimized our system to detect pricing inaccuracy and have leveraged our advanced technology and third-party data to improve the accuracy of price listings and promotional information on our platform, we cannot assure you that these measures are always effective to ensure the accuracy and reliability of pricing and listing information provided to our users. If such listings and promotional information provided by the third parties on our platform are frequently inaccurate or not reliable, our users may lose faith in our websites and mobile applications, resulting in reduced user traffic to our websites and mobile applications and diminished value to customers. We may receive more customer complaints, and we may need to allocate more resources in responding and handling such complaints. We cannot guarantee that such complaints will be resolved in satisfactory outcome. Our reputation could be harmed, which could adversely affect our business and financial performance. For used car listings on our platforms in particular, we are subject to risks associated with inaccurate representation of used car conditions in the inspection reports we show on the listings. We may receive complaints or claims of damages arising out of such inaccuracies. While we are attempting to mitigate the issue through third-party inspection warranty, revising the report items and showing inspection methodologies, there is no guarantee that those measures will be effective.
If we are unable to effectively manage our auto finance business, we may not be able to achieve our expected business growth, our results of operations may be adversely affected and we may be subject to penalties as a result of noncompliance.
30
Since 2017, with the collaboration and integration of our business with Ping An Group, we have been developing our auto finance services for our cooperative banks and financial institutions and displaying and marketing their financial products, including financing and financial leasing products, on our platform. We enable banks and financial institutions to present their financial products to users of our websites and mobile applications and to accept users’ auto financing applications. Although we have an existing large user base, we cannot assure you that the business model of our auto finance business will be attractive to users and financial partners. Failure to provide satisfactory services on our platform or facilitate financing transactions between our users and financial product providers would cause an adverse impact on our auto finance business. As a result, we may not be able to achieve our expected business growth and our results of operations may be adversely affected.
Since our auto finance business is subject to broad regulation and supervision in the PRC, we may need to handle regulatory inspections during our ordinary course of business from time to time. In addition, although we don’t have business operations in the U.S., we may nevertheless be subject to its laws and regulations related to our auto finance business such as anti-money laundering laws and regulations. We have developed an internal control system relating to compliance matters for auto finance business. However, we cannot assure you that the internal control system could always work effectively in tracking and administering the compliance matters relevant to our auto finance business and we may need to incur increased compliance costs to maintain and upgrade such internal control system effectively. If we cannot satisfy any of the requirements of competent authorities, we would be exposed to the relevant regulatory risks, which may result in penalties imposed against us.
Any financial or economic crisis, or perceived threat of such a crisis, including a significant decrease in consumer confidence, may materially and adversely affect our business, financial condition and results of operations.
The global financial markets experienced significant disruptions in 2008 and the United States, European and other economies went into recession. The recovery from the lows of 2008 and 2009 was uneven and the global financial markets are facing new challenges, including the escalation of the European sovereign debt crisis since 2011, the hostilities in the Ukraine, the end of quantitative easing by the U.S. Federal Reserve and the economic slowdown in the Eurozone in 2014. In addition, the recent conflict in Ukraine and the imposition of broad economic sanctions on Russia could raise energy prices and disrupt global markets. It is unclear whether these challenges will continue to exist and what effects they each may have. There is considerable uncertainty over the long-term effects of the expansionary monetary and fiscal policies that have been adopted by the central banks and financial authorities of some of the world’s leading economies, including mainland China’s. Economic conditions in mainland China are sensitive to global economic conditions. Any prolonged slowdown in mainland China’s economic development might lead to tighter credit markets, increased market volatility, sudden drops in business and consumer confidence and dramatic changes in business and consumer behaviors. In response to their perceived uncertainty in economic conditions, consumers might delay, reduce or cancel purchases of automobiles, and our customers may also defer, reduce or cancel purchasing our services. To the extent any fluctuations in the Chinese economy significantly affect automakers’ and dealers’ demand for our services or change their spending habits, our results of operations may be materially and adversely affected.
We and our directors and officers may be subject to claims, suits, government investigations, and other proceedings that may result in adverse outcomes.
We and our directors and officers may be subject to claims, suits, and government investigations involving competition, intellectual property, privacy, consumer protection, tax, fiduciary duty, labor and employment, commercial disputes, advertisements and content placed on our websites and mobile applications, and other matters. Our business may also face intellectual property infringement claims, as further discussed elsewhere in this annual report, that expose us to the risk of reputation damage. Such claims, suits, and government investigations are inherently uncertain and their results cannot be predicted with certainty. Regardless of the outcome, any of these types of legal proceedings can have an adverse impact on us and our directors and officers due to the legal costs, diversion of management resources, negative publicity and other factors involved therein. It is possible that one or more of such proceedings could result in substantial fines and penalties that could adversely affect our business.
If we fail to protect our intellectual property rights, our brand and business may suffer.
31
We rely on a combination of trademark, patent, copyright and trade secret protection laws in mainland China and other jurisdictions, as well as through confidentiality agreements and other measures, to protect our intellectual property rights. Our major brand names and logos are registered trademarks in mainland China. Most of our originally-generated content and professionally-generated content available on our websites and mobile applications and proprietary software are protected by copyright laws. Despite our precautions, third parties may obtain and use our intellectual property without our authorization. Historically, the legal system and courts of mainland China have not protected intellectual property rights to the same extent as the legal system and courts of the United States, and companies operating in mainland China continue to face an increased risk of intellectual property infringement. Furthermore, the validity, application, enforceability and scope of protection of intellectual property rights for many internet-related activities, such as internet commercial methods patents, are uncertain and still evolving in mainland China and abroad, which may make it more difficult for us to protect our intellectual property. From time to time, other websites or mobile applications may use our articles, photos or other content without our proper authorization. Although such use has not in the past caused any material damage to our business, it is possible that there may be misappropriation on a much larger scale with a material adverse impact to our business. If we are unable to adequately protect our intellectual property rights in the future, our brand and business may suffer.
We may be vulnerable to intellectual property infringement claims brought against us by others.
Internet, technology and media companies are frequently involved in litigation based on allegations of infringement of intellectual property rights, unfair competition, invasion of privacy, defamation and other violation of other parties’ rights. We have not experienced any material claims on these issues against us in the past, but as we face increasing competition and as litigation becomes more common in mainland China in resolving commercial disputes, we face a higher risk of being the subject of intellectual property infringement claims. Also, third parties may submit intellectual property infringement claims against us to the app stores where our mobile applications are available. In such cases, our mobile applications may be taken down by the relevant app stores until such claims have been resolved, which could significantly restrict our users from downloading or updating our mobile applications and thus adversely affect our business and results of operations. In addition, we may be subject to legal proceedings and claims from time to time relating to the intellectual property of others in the ordinary course of our business. We could also be subject to claims based upon the content that is displayed on our websites, our mobile platforms or accessible from our websites through links to other websites or information on our websites and mobile applications supplied by third parties. Intellectual property claims and litigation are expensive and time-consuming to investigate and defend and may divert resources and management attention from the operation of our websites and mobile applications. Such claims, even if they do not result in liability, may harm our reputation. Any resulting liability or expenses, or changes required to our websites and mobile applications to reduce the risk of future liability, may have a material adverse effect on our business, financial condition and results of operations.
We may be subject to liability for advertisements and other content placed on our websites and mobile applications.
The PRC government has adopted regulations governing advertising content as well as internet access and the distribution of information over the internet. Under PRC advertising laws and regulations, we are obligated to monitor the advertising content shown on our websites and mobile applications to ensure that such content is true and accurate and in full compliance with applicable laws and regulations. See “Item 4. Information on the Company—B. Business Overview—PRC Regulation—Regulations on Advertisements.” Under the Administrative Measures for Internet Information Services, which were promulgated in September 2000 and revised in January 2011, internet content providers and internet publishers are prohibited from posting or displaying over the internet content that, among other things, compromises national security, harms the dignity or interests of the state, incites ethnic hatred or racial discrimination, undermines the PRC’s religious policy, disturbs social order, disseminates obscenity or pornography, encourages gambling, violence, murder or fear, incites the commission of a crime, infringes upon the lawful rights and interests of a third party, or is otherwise prohibited by law or administrative regulations. Internet service providers are required to conduct verification of identity information of users. If information disseminated by internet users on their internet accounts or internet chat groups contains information prohibited by laws and regulations, the service providers are obliged to take measures including issuing warnings to the relevant users, suspending their publication of the inappropriate information or closing their accounts or chat groups.
32
Under the Provisions on Governance of Network Information Content Ecosystem, which was promulgated on December 15, 2019 and came into effect on March 1, 2020, the network information content service platform shall strengthen the management of information content, and upon detecting any illegal information, shall immediately take measures prescribed by laws, keep relevant records, and report to the relevant competent authority. Additionally, the network information content platform shall also strengthen the examination and inspection of the advertising space set on the platform and the advertising content displayed on the platform. Those who publish illegal advertisements shall be punished according to laws. On August 25, 2017, the CAC promulgated the Administrative Provisions on Internet Follow-up Comment Services and the Administrative Provisions on Internet Forum and Community Services, both of which became effective as of October 1, 2017. As stipulated in the provisions, the internet follow-up comment service providers are imposed on strict primary obligations such as verifying the authenticity of registered users’ identity information, protecting personal information of users and developing system to review follow-up comments on news information prior to the publication. Moreover, the internet forum and community services providers may establish the systems of information review, real-time public information check, emergency response, personal information protection and other information security administration systems. In November 2022, the CAC issued the revised Administrative Provisions on Internet Follow-up Comment Services, which came into effect on December 15, 2022, expanding the scope of the supervision and specifying wider responsibilities, relevant internal control obligations of network operators and service providers. See “Item 4. Information on the Company—B. Business Overview—PRC Regulation—Regulations on Internet Content Services.”
Under the Provisions on the Administration of Online Live Streaming Services, online live-streaming service providers shall establish platforms for reviewing live-streaming content. Online live-streaming service providers and online live-streaming publishers that provide internet news information services without permits, or exceeding the scope of their permits, are subject to punishment. In addition, online live-streaming service providers shall make record filings with the local internet information office and the local public security authorities. Online live-streaming service providers that fail to file records with or get relevant permission from relevant authorities will be punished in accordance with laws. See “Item 4. Information on the Company—B. Business Overview—PRC Regulation—Regulations on Online Performances and Online Live-streaming Services.”
We display automotive advertisements on our websites, mobile applications and new media platforms. In addition, we allow users to upload written materials, images, pictures and other content on our websites, mobile applications, including user forums, and also allow users to share and link to content from other websites through our websites, mobile applications, including user forums. Moreover, we have also added online live-streaming features on our websites and mobile applications. Failure to identify and prevent illegal or inappropriate content from being displayed on or through our websites and mobile applications may subject us to liability. We cannot assure you that all of the advertisements and content shown or posted on our websites and mobile applications adhere to the advertising and internet content laws and regulations, especially given the uncertainty in the interpretation of these PRC laws and regulations.
If PRC regulatory authorities determine that any advertisements or content displayed on our websites and mobile applications do not adhere to applicable laws and regulations, they may require us to limit or eliminate the dissemination or availability of such advertisements and other content on our websites and mobile applications in the form of take-down orders or otherwise. Such regulatory authorities may also impose penalties on us, including fines, confiscation of advertising income or, in circumstances involving more serious violations by us, the termination of our internet content related licenses, any of which would materially and adversely affect our business and results of operations.
In addition, we may be subject to claims by consumers asserting that the information on our websites and mobile applications is misleading, and we may not be able to recover our losses from advertisers. As a result, our business, financial condition and results of operations could be materially and adversely affected.
33
Problems with our network infrastructure or information technology systems could impair our ability to provide services.
Our ability to provide our users with a high-quality online experience depends on the continuing operation and scalability of our network infrastructure and information technology systems. Our systems are potentially vulnerable to damage or interruption as a result of earthquakes, floods, fires, extreme temperatures, power loss, telecommunications failures, technical error, computer viruses, hacking or similar events. We may encounter problems when upgrading our systems or services and undetected programming errors could adversely affect the performance of the software we use to provide our services. The development and implementation of software upgrades and other improvements to our internet services is a complex process, and issues not identified during pre-launch testing of new services may only become evident when such services are made available to our entire user base.
In addition, we rely on content delivery networks, data centers and other network facilities provided by third parties. Any disruption to these network facilities may result in service interruptions, decreases in connection speed, degradation of our services or the permanent loss of user data and uploaded content. If we experience frequent or persistent service disruptions, whether caused by failures of our own systems or those of third-party service providers, our reputation or relationships with our users or customers may be damaged and our users and customers may switch to our competitors, which may have a material adverse effect on our business, financial condition and results of operations.
Computer viruses and hacking may cause delays or interruptions on our systems and may reduce use of our services and damage our reputation and brand.
Computer viruses and “hacking” may cause delays or other service interruptions on our systems. “Hacking” involves efforts to gain unauthorized access to information or systems or to cause intentional malfunctions, loss or corruption of data, including user data, software, hardware or other computer equipment. In addition, the inadvertent transmission of computer viruses could result in significant damage to our hardware and software systems and databases, disruptions to our business activities, including our e-mail and other communications systems, breaches of security and inadvertent disclosure of confidential or sensitive information, interruptions in access to our website through the use of “denial of service” or similar attacks and other material adverse effects on our operations. We have experienced hacking attacks in the past, and although such attacks in the past have not had a material adverse effect on our operations, there is no assurance that there will be no serious computer viruses or hacking attacks in the future. We may incur significant costs to protect our systems and equipment against the threat of, and to repair any damage caused by, computer viruses and hacking. Moreover, if a computer virus or hacking affects our systems and is highly publicized, our reputation and brand could be materially damaged and use of our services may decrease.
The continuing and collaborative efforts of our senior management, key employees and highly skilled personnel are crucial to our success, and our business may be harmed if we were to lose their services.
Our success depends on the continuous efforts and services of our senior management team and other key personnel. If one or more of our executive officers or other key personnel are unable or unwilling to continue to provide us with their services, we might not be able to replace them within a short period of time or at all. Our business could be severely disrupted, our financial condition and results of operations could be materially and adversely affected, and we might incur additional expenses to recruit, train and retain personnel. Our senior management team is crucial to executing our business strategies. Failure to retain our key management and personnel may create considerable uncertainty on the direction of our future development. If any of our executive officers joins a competitor or forms a competing company, we may lose customers, know-how and key professionals and staff members. Each of our executive officers has entered into an employment agreement with us, which contains non-competition provisions. However, if any dispute arises between us and our executive officers, we may have to incur substantial costs and expenses in order to enforce these agreements in mainland China.
Our performance and future success also depend on our ability to identify, hire, develop, motivate and retain skilled personnel for all areas of our organization. Competition in the automotive and internet advertising industries and the online automobile transaction industry for qualified employees is intense, and if competition in these industries further intensifies, it may be more difficult for us to hire, motivate and retain highly skilled personnel. If
34
the personnel holding key positions at our company are not as qualified as we expect or if we do not succeed in attracting additional highly skilled personnel or retaining or motivating our existing personnel, we may be unable to grow effectively or at all.
In addition, employee misconduct could expose us to significant legal liability and reputational harm. If any of our employees and management members engages in improper, illegal or suspicious activities or other misconduct in violation of our ethical policies, regulatory rules or regulations concerning anti-corruption, bribery and other ethical issues, we could suffer serious harm to our reputation, financial condition, relationships with our business partners, automakers and dealers and our ability to attract new users and customers. We could even be subject to regulatory sanctions and significant legal liability.
We may undertake acquisitions, investments, joint ventures or other alliances, which could prove difficult to integrate, disrupt our business or otherwise negatively impact our results of operations.
As part of our business strategy, we regularly evaluate potential acquisitions, investments and alliances, including joint ventures, minority equity investments and strategic investments. These transactions involve numerous risks, including:
In addition, if we finance acquisitions by issuing equity or convertible debt securities, our existing shareholders may be diluted, which could affect the market price of our ADSs and/or ordinary shares.
Furthermore, we may fail to identify or secure suitable acquisition, investment and other strategic opportunities, or our competitors may capitalize on such opportunities before we do, which could impair our ability to compete with our competitors and adversely affect our growth prospects and results of operations.
Our vendors may raise prices and, as a result, increase our operating expenses.
We rely on third parties for certain essential services such as internet services and we may not have any control over the costs of the services they provide. The third-party service providers may raise prices, which might not be commercially reasonable to us. If we are forced to seek other providers, there is no assurance that we will be able to find alternative providers that are willing or able to provide comparable high-quality services and that will not charge us higher prices for their services. If the prices that we are required to pay to third-party service providers rise significantly, our results of operations could be adversely affected.
Divestitures of businesses and assets may have a material and adverse effect on our business and financial situation.
35
We have undertaken, and may undertake in the future, partial or complete divestitures or other disposal transactions in connection with certain of our businesses and assets, particularly ones that are not closely related to our core focus areas or might require excessive resources or financial capital, to help our company meet its objectives. We also have and may in the future withdraw from certain of our businesses to shift our focus to other businesses. For example, we substantially withdrew from the offline insurance brokerage business in mainland China in 2021 and are scaling back our European business as of the date of this annual report. These decisions are largely based on our management’s assessment of the business models and likelihood of success of these businesses. However, our judgment could be inaccurate, and we may not achieve the desired strategic and financial benefits from these transactions. Our financial results could be adversely affected by the impact from the loss of earnings and corporate overhead contribution/allocation associated with divested businesses. In addition, as our net (loss)/ income from discontinued operations are non-recurrent, it may be difficult for investors and analysts to predict our future earnings potential based on our historical financial performance.
Dispositions may also involve continued financial involvement in the divested business, such as through guarantees, indemnities or other financial obligations. Under these arrangements, performance by the divested businesses or other conditions outside of our control could affect our future financial results. We may also be exposed to negative publicity as a result of the potential misconception that the divested business is still part of our consolidated group. On the other hand, we cannot assure you that the divesting business would not pursue opportunities to provide services to our competitors or other opportunities that would conflict with our interests. If any conflicts of interest that may arise between the divesting business and us cannot be resolved in our favor, our business, financial condition, results of operations could be materially and adversely affected.
Furthermore, reducing or eliminating our ownership interests in these businesses might negatively affect our operations, prospects, or long-term value. We may lose access to resources or know-how that would have been useful in the development of our own business. Our ability to diversify or expand our existing businesses or to move into new areas of business may be reduced, and we may have to modify our business strategy to focus more exclusively on areas of business where we already possess the necessary expertise. We may sell our interests too early, and thus forego gains that we otherwise would have received had we not sold. Selecting businesses to dispose of or spin off, finding buyers for them (or the equity interests in them to be sold) and negotiating prices for what may be relatively illiquid ownership interests with no easily ascertainable fair market value will also require significant attention from our management and may divert resources from our existing business, which in turn could have an adverse effect on our business operations.
Ping An Group has substantial influence over our company and its interests may not be aligned with ours.
As of March 31, 2023, Yun Chen Capital Cayman, or Yun Chen, a subsidiary of Ping An Group, owned 45.6% of the total equity interest in our company. Because Ping An Group beneficially owns a significant percentage of the voting rights in our company, it has substantial influence in determining the outcome of any corporate transaction or other matter submitted to the shareholders for approval, including mergers, consolidations and the sale of all or substantially all of our assets, election of directors and other significant corporate actions. Without the consent of Ping An Group, we may be prevented from entering into transactions that could be beneficial to us. The interests of Ping An Group may differ from the interests of our other shareholders. Furthermore, Ping An Group’s business activities, although not related to our operations, may adversely impact reputation. As Ping An Group is a public company listed on the Hong Kong Stock Exchange and the Shanghai Stock Exchange, and beneficially controls a significant percentage of our voting rights, Ping An Group may be required to disclose information on us from time to time, which may subject us to additional costs and efforts in making such disclosures.
We have and expect to continue to have related party transactions with Ping An Group. In 2020, 2021 and 2022, Ping An Group provided us with services and assets in the amount of RMB156.4 million, RMB176.9 million and RMB191.8 million (US$27.8 million), respectively. In 2020, 2021 and 2022, we provided services to Ping An Group in the amount of RMB621.8 million, RMB417.1 million and RMB226.5 million (US$32.8 million), respectively. Besides these transactions, we had cash or time deposits in commercial banks associated with Ping An Group and purchased short-term cash management products managed by Ping An Group as a part of our cash management plan, which totaled RMB3,466.9 million, RMB4,144.8 million and RMB5,187.0 million (US$752.0 million) as of December 31, 2020, 2021 and 2022, respectively. In January 2022, we entered into a limited partner interest subscription agreement, a limited partnership agreement and certain other auxiliary documents with Ping An
36
Capital Co., Ltd., pursuant to which we agreed to subscribe for RMB400 million worth of limited partner interests in an equity investment fund managed by Ping An Capital Co., Ltd. Although we did not and do not expect to rely upon revenues from Ping An Group, if Ping An Group decides to reduce or even terminate its transactions with us, our business, financial conditions and results of operations may be adversely affected.
If we fail to maintain an effective system of internal control over financial reporting, our ability to accurately and timely report our financial results or prevent fraud may be adversely affected, and investor confidence and the market price of our ADSs and/or ordinary shares may be adversely impacted.
The SEC, as required by Section 404 of the Sarbanes-Oxley Act of 2002, adopted rules requiring every public company to include a management report on the company’s internal control over financial reporting in its annual report, which contains management’s assessment of the effectiveness of the company’s internal control over financial reporting. Our management has concluded that our internal control over financial reporting was effective as of December 31, 2022. Our independent registered public accounting firm has issued an attestation report, which has concluded that our internal control over financial reporting was effective in all material aspects as of December 31, 2022. However, if we fail to maintain effective internal control over financial reporting in the future, our management and our independent registered public accounting firm may not be able to conclude that we have effective internal control over financial reporting at a reasonable assurance level. This could in turn result in loss of investor confidence in the reliability of our financial statements and negatively impact the trading price of our ADSs and/or ordinary shares. Furthermore, we have incurred and anticipate that we will continue to incur considerable costs, management time and other resources in an effort to comply with Section 404 and other requirements of the Sarbanes-Oxley Act.
We have limited business insurance coverage.
As of December 31, 2022, we maintained all the insurance policies required by laws and regulations of mainland China. We consider that the coverage from the insurance policies maintained by us is in line with the industry norm. However, insurance companies in mainland China currently do not offer as extensive an array of insurance products as insurance companies do in more developed economies. We do not have any business liability or disruption insurance to cover our operations. We have determined that the costs of insuring for these risks and the difficulties associated with acquiring such insurance on commercially reasonable terms make it impractical for us to have such insurance. Any uninsured occurrence of business disruption may result in our incurring substantial costs and the diversion of resources, which could have an adverse effect on our results of operations and financial condition.
We face risks related to health epidemics and natural disasters.
We are vulnerable to health epidemics, natural disasters, and other calamities. Any of such occurrences could cause severe disruption to our daily operations, and may even require a temporary closure of our offices, which may disrupt our business operations and adversely affect our results of operations. In addition, our results of operations could be adversely affected to the extent that any of these catastrophic events harms the Chinese economy in general. For example, our business has been negatively impacted by the COVID-19 pandemic, during which operation of ours, automakers and dealers slowed down, automobile production and purchases declined and the general economy of China was negatively impacted due to, among others, the precautionary government-imposed closures of certain travel and business, the government’s order to delay resumption of service and mass production and the related quarantine measures. The spread of COVID-19 had been substantially controlled in mainland China in late 2020. However, since 2021, there has been a resurgence of COVID-19 cases caused by new variants such as Delta and Omicron in multiple cities in China, as well as across the world. Restrictions had been re-imposed in certain cities to combat such outbreaks and emerging variants of the virus. While substantially all of the restrictions on movement within China had been relaxed as of the date of this annual report, uncertainty still exists as to the future development of the COVID-19 outbreak and its impact on the automotive industry. The extent to which the COVID-19 pandemic impacts us and the Chinese economy as a whole in 2023 and beyond depends on its future developments, which are highly uncertain and unpredictable. If there is not a material recovery in the COVID-19 situation, or it further deteriorates in China or globally, our business, results of operations and financial condition could be materially and adversely affected.
37
Risks Related to Our Corporate Structure
If the PRC government finds that the agreements that establish the structure for operating our services in mainland China do not comply with PRC governmental restrictions on foreign investment in internet businesses, or if these regulations or the interpretation of existing regulations change in the future, we could be subject to severe penalties or be forced to relinquish our interests in those operations, and we may face significant disruption to our business operations.
Current laws and regulations of mainland China place certain restrictions on foreign ownership of companies that provide internet content services in mainland China. Pursuant to the Special Administrative Measures (Negative List) for the Access of Foreign Investment (2021 Version) promulgated on December 27, 2021 and became effective on January 1, 2022, or the Negative List, and the Provisions on Administration of Foreign Invested Telecommunications Enterprises, or the FITE Provisions, promulgated by the State Council on December 11, 2001 and amended from time to time with the latest amendment effective on May 1, 2022, foreign investors are not allowed to own more than 50% of the equity interests in a value-added telecommunication service provider, unless otherwise stipulated in relevant rules. In addition, foreign investors are prohibited from investing in companies engaged in internet audio-visual programs businesses, internet culture businesses (except for music) and radio and television program production businesses. We are a Cayman Islands company and foreign legal person under laws of mainland China. Accordingly, neither we nor our wholly foreign-invested mainland China subsidiaries are currently eligible to apply for the required licenses for providing internet content services or other value-added telecommunication services or conduct other businesses which foreign-owned companies are prohibited or restricted from conducting in mainland China.
As such, we conduct our business activities related to internet content services by entering into a series of contractual arrangements with the VIEs in mainland China, primarily including Autohome Information, Shengtuo Hongyuan, Shanghai Jinwu and Shanghai Jinyou, and their respective shareholders. In particular, Autohome Information currently holds an ICP license, a Value-added Telecommunications License for Online Data Processing and Transaction Processing Business (for operational e-commerce only), a Surveying and Mapping Qualification Certificate for Internet Mapping which is in the process of the renewal, an Operating License for the Production and Dissemination of Radio and Television Programs, an internet Audio/Video Program Transmission License, and an Internet Culture Business Permit which is in the process of the renewal. In addition, Autohome Information is the sole shareholder of Shanghai Tianhe Insurance Brokerage Co., Ltd., or Shanghai Tianhe, an insurance brokerage company, which has completed the registration process required for engaging in online insurance business in the mainland China. Shengtuo Hongyuan currently holds an ICP license, a Surveying and Mapping Qualification Certificate for Internet Mapping, and an Operating License for the Production and Dissemination of Radio and Television Programs and is operating the che168.com website and automobile application-related business. Each of Shanghai Jinwu and Shanghai Jinyou currently holds an ICP license, an auction business approval certificate, and is filed as an entity conducting used automobiles brokerage business in the relevant systems of the MOFCOM, and as of the date of this annual report, the operation of the www.ttpai.cn website is being transferred from Shanghai Jinwu to Shanghai Jinyou.
These VIEs are currently owned by individual shareholders who are PRC citizens and hold the requisite licenses or permits to operate internet business in mainland China. We do not have any equity interests in these VIEs but substantially control their operations and receive the economic benefits through contractual arrangements. We have been and are expected to continue to be dependent upon these VIEs and their respective subsidiaries for the above-mentioned business operations. For more information regarding these contractual arrangements, see “Item 7. Major Shareholders and Related Party Transactions—B. Related Party Transactions—Contractual Arrangements with the Variable Interest Entities.”
Based on the advice of our PRC legal counsel, Commerce & Finance Law Offices, the corporate structure of the VIEs and our subsidiaries in mainland China are in compliance with all existing PRC laws and regulations. However, we are a Cayman Islands holding company with no equity ownership in the VIEs and we conduct our operations in mainland China primarily through our subsidiaries and the VIEs with which we have maintained contractual arrangements. Investors in our ordinary shares or the ADSs thus are not purchasing equity interest in the VIEs in mainland China but instead are purchasing equity interest in a Cayman Islands holding company. If the PRC government deems that our contractual arrangements with the VIEs do not comply with mainland China's regulatory
38
restrictions on foreign investment in the relevant industries, or if these regulations or the interpretation of existing regulations change or are interpreted differently in the future, we could be subject to severe penalties or be forced to relinquish our interests in those operations. The value of our ADSs/ordinary shares may decline or become worthless, if we are unable to assert our contractual control rights over the assets of the VIEs, which contributed 12.7% of our revenues in 2022. Our holding company in the Cayman Islands, the VIEs, and investors of our company face uncertainty about potential future actions by the PRC government that could affect the enforceability of the contractual arrangements with the VIEs and, consequently, significantly affect the financial performance of the VIEs and our company as a whole.
There are substantial uncertainties regarding the interpretation and application of PRC laws and regulations, we cannot assure you that the PRC government would agree that our corporate structure or any of the above contractual arrangements comply with PRC licensing, registration or other regulatory requirements, with existing policies or with requirements or policies that may be adopted in the future. PRC laws and regulations governing the validity of these contractual arrangements are uncertain and the relevant government authorities have broad discretion in interpreting these laws and regulations. The PRC regulatory authorities could disallow the variable interest entities structure, which would likely result in a material adverse change in our operations, and our ordinary shares or our ADSs may decline significantly in value.
If we or any of the current or future VIEs or our subsidiaries are found to be in violation of any existing or future laws or regulations of mainland China, or fail to obtain or maintain any of the required permits or approvals, the relevant PRC regulatory authorities, including the MIIT, the CAC, which regulates internet information services companies, the National Radio and Television Administration, or NRTA, and the CSRC, would have broad discretion in dealing with such violations, including, without limitation, levying fines, confiscating our income or the income of our WFOEs and the VIEs, revoking the business licenses or operating licenses of our WFOEs and the VIEs, shutting down our servers or blocking our websites and mobile applications, discontinuing or placing restrictions or onerous conditions on our operations, requiring us to undergo a costly and disruptive restructuring, restricting the VIEs’ right to collect revenues, imposing additional conditions or requirements with which the VIEs may not be able to comply, or taking other enforcement actions that could be harmful to our business.
Any of these actions could cause significant disruption to our business operations, including our business operations not carried out through the VIEs, and severely damage our reputation, which would in turn materially and adversely affect our business and results of operations. As we generate substantially all our revenues through or with the support of our online platforms, whose operation is dependent on the business or operating licenses held by our WFOEs and the VIEs, if such licenses are revoked, or if our servers are shut down or our websites and mobile applications are blocked, we may not be able to continue our operation. In addition, if the imposition of any of these penalties causes us to lose the rights to direct the activities of the VIEs or our right to receive their economic benefits, we would no longer be able to consolidate the VIEs.
Our contractual arrangements with the VIEs may not be as effective in providing operational control as direct ownership.
We have relied and expect to continue to rely on, among others, (i) contractual arrangements with Autohome Information and its shareholders, (ii) contractual arrangements with Shengtuo Hongyuan and its shareholders, (iii) contractual arrangements with Shanghai Jinwu and its shareholder and (iv) contractual arrangements with Shanghai Jinyou and its shareholders. For a description of these contractual arrangements, see “Item 7. Major Shareholders and Related Party Transactions—B. Related Party Transactions—Contractual Arrangements with the Variable Interest Entities.” These contractual arrangements have not been tested in a court of law in mainland China. There are very few precedents as to whether contractual arrangements would be judged to form a controlling financial interest in the relevant VIEs through the contractual arrangements, or how contractual arrangements in the context of a VIE should be interpreted or enforced by the courts of mainland China. Should legal actions become necessary, we cannot guarantee that the court will rule in favor of the enforceability of the VIE contractual arrangements. In the event we are unable to enforce these contractual arrangements, or if we suffer significant delay or other obstacles in the process of enforcing these contractual arrangements, we may not be able to obtain a controlling financial interest in the VIEs, and our ability to conduct our business may be materially adversely affected. Therefore, these contractual arrangements may not be as effective in providing us with control over the VIEs as direct ownership. If we had direct ownership of these entities, we would be able to exercise our rights as a shareholder to effect changes
39
in the board of directors, which in turn could effect changes, subject to any applicable fiduciary obligations, at the management level. However, under the current contractual arrangements, we rely on the performance by these entities and their shareholders of their contractual obligations to exercise control over the VIEs. Therefore, our contractual arrangements with the VIEs may not be as effective in ensuring our control over their operations as direct ownership would be.
The shareholders of the VIEs may breach, or cause the VIEs to breach, or refuse to renew, the existing contractual arrangements we have with them and the VIEs. Any failure by the VIEs or their shareholders to perform their obligations under our contractual arrangements with them would have a material adverse effect on our business and financial condition.
The shareholders of the VIEs may breach, or cause the VIEs to breach, or refuse to renew, the existing contractual arrangements we have with them and the VIEs. If the VIEs or their shareholders fail to perform their obligations under the contractual arrangements, we may have to incur substantial costs and expend resources to enforce our rights under the contracts. We may have to rely on legal remedies under PRC law, including seeking specific performance or injunctive relief and claiming damages, which may not be effective. For example, if the shareholders of the VIEs were to refuse to transfer their equity interests in the VIEs to us or our designee when we exercise the call option pursuant to these contractual arrangements, if they transfer the equity interests to other persons against our interests, or if they were otherwise to act in bad faith toward us, then we may have to take legal actions to compel them to perform their contractual obligations.
All of these contractual arrangements are governed by PRC law and provide for the resolution of disputes through arbitration in the PRC. Accordingly, these contracts would be interpreted in accordance with PRC law and any disputes would be resolved in accordance with PRC legal procedures. The legal system in the PRC is not as developed as in other jurisdictions, such as the United States. As a result, uncertainties in the PRC legal system could limit our ability to enforce these contractual arrangements. Under PRC law, rulings by arbitrators are final, parties cannot appeal the arbitration results in courts, and the prevailing parties may only enforce the arbitration awards in PRC courts through arbitration award recognition proceedings, which would incur additional expenses and delay. In the event we are unable to enforce these contractual arrangements, we may not be able to obtain a controlling financial interest in the VIEs, and our ability to conduct our business may be negatively affected.
The contractual arrangements among our subsidiaries and the VIEs may be subject to scrutiny by the PRC tax authorities and a finding that we or the VIEs owe additional taxes could substantially reduce our consolidated net income and the value of your investment.
Under PRC laws and regulations, arrangements and transactions among related parties may be subject to audit or challenge by the PRC tax authorities within ten years after the taxable year when the transactions are conducted. We could face material and adverse tax consequences if the PRC tax authorities determine that the contractual arrangements among our WFOEs, the VIEs and the shareholders of the VIEs do not represent arm’s length prices and consequently adjust our WFOEs’ or the VIEs’ income in the form of a transfer pricing adjustment. A transfer pricing adjustment could, among other things, result in a reduction, for PRC tax purposes, of expense deductions recorded by the VIEs, which could in turn increase their tax liabilities. In addition, the PRC tax authorities may impose late payment fees and other penalties on our WFOEs or the VIEs for any unpaid taxes. Our consolidated net income may be materially and adversely affected if our WFOEs or the VIEs’ tax liabilities increase or if they are subject to late payment fees or other penalties.
The interests of the individual nominee shareholders of the VIEs may be different from our interests, which may materially and adversely affect our business.
The individual nominee shareholders of Autohome Information and Shengtuo Hongyuan are Quan Long, the chairman of our board of directors and our chief executive officer, and Haiyun Lei, an employee of the affiliate of Yun Chen who has been working with Ping An Group and its affiliates for more than 20 years. They each hold 50% of the equity interests in Autohome Information and Shengtuo Hongyuan. Each of these two individuals is a PRC citizen. The individual nominee shareholder of Shanghai Jinwu is Weiwei Wang, who holds 100% of the equity interests in Shanghai Jinwu. The individual nominee shareholders of Shanghai Jinyou are Weiwei Wang and Lan Zhang, holding 95% and 5% of the equity interests, respectively, in Shanghai Jinyou. Weiwei Wang is the founder
40
of TTP and Lan Zhang is the vice president of TTP. Both of Weiwei Wang and Lan Zhang are PRC citizens. The interests of the individual nominee shareholders of the VIEs may be different from our interest. For example, the individual nominee shareholders of the VIEs do not have a significant equity stake in our company. These shareholders may breach, or cause the VIEs to breach, or refuse to renew, the existing contractual arrangements we have with them and the VIEs, which would have a material and adverse effect on our ability to obtain a controlling financial interest in VIEs and receive substantially all the economic benefits from them. For example, the shareholders may be able to cause our agreements with the VIEs to be performed in a manner adverse to us by, among other things, failing to remit payments due under the contractual arrangements to us on a timely basis. We cannot assure you that when a conflict of interest arises, any or all of these shareholders will act in the best interests of our company or such conflict will be resolved in our favor.
Currently, we rely on our contractual arrangements with these individual nominee shareholders and do not have other arrangements to address any potential difference of interests between them and our company. We rely on these individuals to comply with the laws of the PRC, which provide that directors and executive officers owe a fiduciary duty to our company and require them to avoid conflicts of interest and not to take advantage of their positions for personal gain. We also rely on Mr. Quan Long, the chairman of our board of directors and our chief executive officer, to abide by the laws of the Cayman Islands, which provide that directors owe a duty of care to our company. However, the legal frameworks of mainland China and the Cayman Islands do not provide guidance on resolving conflicts in the event of a conflict with another corporate governance regime. If we cannot resolve any difference of interests or dispute between us and the shareholders of the VIEs, we would have to rely on legal proceedings, which could result in disruption of our business and subject us to substantial uncertainty as to the outcome of any such legal proceedings.
The individual nominee shareholders of the VIEs may be involved in personal disputes with third parties or other incidents that may have an adverse effect on their respective equity interests in the relevant VIEs and the validity or enforceability of our contractual arrangements with the relevant entity and its shareholders. For example, in the event that any of such individual nominee shareholders divorces his or her spouse, the spouse may claim that the equity interests of the relevant VIE held by such individual nominee shareholder is part of their community property and should be divided between such individual nominee shareholder and his or her spouse. If such claim is supported by the court, the relevant equity interests may be obtained by the individual nominee shareholder’s spouse or another third party who is not subject to obligations under our contractual arrangements, which could result in a loss of the controlling financial interest in the relevant VIE by us. Similarly, if any of the equity interests of the VIEs is inherited by a third party with whom the current contractual arrangements are not binding, we could lose our control over the relevant VIE or have to maintain such control by incurring unpredictable costs, which could cause significant disruption to our business and operations and harm our financial condition and results of operations.
Although under our current contractual arrangements, the VIEs and their individual nominee shareholders shall not assign any of their respective rights or obligations to any third party without the prior written consent of our WFOEs, we cannot assure you that these undertakings and arrangements will be complied with or effectively enforced. In the case any of them is breached or becomes unenforceable and leads to legal proceedings, it could disrupt our business, distract our management’s attention and subject us to substantial uncertainties as to the outcome of any such legal proceedings.
We may rely to a significant extent on dividends and other distributions on equity paid by our mainland China subsidiaries to fund any cash and financing requirements we may have. Any limitation on the ability of our mainland China subsidiaries to pay dividends to us could have a material adverse effect on our ability to conduct our business.
We are a holding company and conduct all of our business through our subsidiaries and the VIEs. We may rely to a significant extent on dividends and other distributions on equity to be paid by our wholly-invested mainland China subsidiaries for our cash and financing requirements, including the funds necessary to pay dividends and other cash distributions to our shareholders and service any debt we may incur. If our mainland China subsidiaries incur debt on their own behalf in the future, the instruments governing the debt may restrict their ability to pay dividends or make other distributions to us.
41
Under PRC laws and regulations, our mainland China subsidiaries, as wholly foreign-invested enterprises in the PRC, may pay dividends only out of their accumulated profits as determined in accordance with PRC accounting standards and regulations. In addition, according to PRC Company Law, before the distribution of the dividends, enterprises in PRC are required to set aside at least 10% of their accumulated after-tax profits, if any, each year to fund certain statutory reserve funds, until the aggregate amount of such funds reach 50% of their registered capital. These statutory reserve funds are not distributable as cash dividends.
Any limitation on the ability of our mainland China subsidiaries to pay dividends or make other distributions to us could materially and adversely limit our ability to grow, make investments or acquisitions that could be beneficial to our business, pay dividends, or otherwise fund and conduct our business.
PRC regulation of loans to, and direct investment in, mainland China's entities by offshore holding companies and governmental control of currency conversion may restrict or prevent us from using the proceeds of our equity offerings to make loans to our mainland China subsidiaries and the VIEs or to make additional capital contributions to our mainland China subsidiaries, which may materially and adversely affect our liquidity and our ability to fund and expand our business.
We are an offshore holding company conducting our operations in mainland China through our mainland China subsidiaries and the VIEs. We may make loans to our mainland China subsidiaries and the VIEs, or we may make additional capital contributions to our mainland China subsidiaries. Any loans by us to our mainland China subsidiaries, which are treated as foreign-invested enterprises under laws of mainland China, are subject to regulations and foreign exchange loan registrations of mainland China. For example, loans by us to our mainland China subsidiaries to finance its activities cannot exceed statutory limits and must be registered with the competent local counterpart of the SAFE, or filed with SAFE in its information system. We may also decide to finance our mainland China subsidiaries by means of capital contributions. These capital contributions must be filed with the local counterparts of SAMR and subject to registration with a local bank authorized by SAFE. Any medium or long-term loans to be provided by us to the VIEs must be registered with the NDRC and SAFE or their local branches. Further, we are not likely to finance the activities of the VIEs by means of capital contributions due to regulatory restrictions relating to foreign investment in mainland China in domestic enterprises engaged in internet content services.
Pursuant to the Circular on the Reforming of the Management Method of the Settlement of Foreign Currency Capital of Foreign-Invested Enterprises, or SAFE Circular 19, which became effective on June 1, 2015 and the Circular on Reforming and Regulating Policies on the Control over Foreign Exchange Settlement of Capital Accounts, or SAFE Circular 16 which was promulgated in June 2016, foreign-invested enterprises may either continue to follow the current payment-based foreign currency settlement system or choose to follow the “conversion-at-will” system for foreign currency settlement. SAFE Circular 19 and SAFE Circular 16, therefore, have substantially lifted the restrictions on the usage by a foreign-invested enterprise of its Renminbi registered capital, foreign debt and repatriated funds raised through overseas listing converted from foreign currencies. According to SAFE Circular 19 and SAFE Circular 16, such Renminbi capital, foreign debt and repatriated funds raised through overseas listing may be used at the discretion of the foreign-invested enterprise and SAFE will eliminate the prior approval requirement and only examine the authenticity of the declared usage afterwards. Nevertheless, it is still not clear whether foreign-invested enterprises like our mainland China subsidiaries are allowed to extend intercompany loans to the VIEs. In addition, SAFE promulgated the Circular Regarding Further Promotion of the Facilitation of Cross-Border Trade and Investment on October 23, 2019, or SAFE Circular 28, pursuant to which all foreign-invested enterprises can make equity investments in the mainland China with their capital funds in accordance with the law. As the relevant government authorities have broad discretion in interpreting the regulation, it is unclear whether SAFE will permit such capital funds to be used for equity investments in the PRC in actual practice. See “Item 4. Information on the Company—B. Business Overview—PRC Regulation—Regulations on Foreign Exchange.”
In light of the various requirements imposed by regulations of mainland China on loans to and direct investment in entities in mainland China by offshore holding companies, we cannot assure you that we will be able to complete the necessary government registrations, filings or obtain the necessary government approvals on a timely basis, if at all, with respect to future loans by us to our mainland China subsidiaries or with respect to future capital contributions by us to our mainland China subsidiaries. If we fail to complete such registrations, filings or obtain
42
such approvals, our ability to use the proceeds we received from our equity offerings and to capitalize or otherwise fund our operations in mainland China may be negatively affected, which could materially and adversely affect our liquidity and our ability to fund and expand our business.
If our mainland China subsidiaries or the VIEs become the subject of a bankruptcy or liquidation proceeding, we may lose the ability to use and enjoy some of our key assets, which could reduce the size of our operations and materially and adversely affect our business, our ability to generate revenues and the market price of our securities.
As of the date of this annual report, we conduct our business mostly through our mainland China subsidiaries and the VIEs, which hold operating permits and licenses and some of the key assets that are important to the operation of our business. We expect to continue to be dependent on the VIEs to operate our business related to internet content services in mainland China. If the VIEs go bankrupt and all or part of their assets become subject to liens or rights of third-party creditors, we may be unable to continue some or all of our business activities, which would materially and adversely affect our business, financial condition and results of operations. If the VIEs undergo a voluntary or involuntary liquidation proceeding, their equity holders or unrelated third-party creditors may claim rights to some or all of these assets, thereby hindering our ability to operate our business, which would materially and adversely affect our business, our ability to generate revenues and the market price of our securities.
We are subject to changing laws and regulations regarding regulatory matters, corporate governance and public disclosure that may increase both our costs and the risk of non-compliance.
We are subject to rules and regulations by various governmental and self-regulatory organizations at various levels of the governing bodies, including, for example, the SEC, the Hong Kong Stock Exchange, the SFC and other financial market exchange entities, which are charged with the protection of investors and the oversight of companies whose securities are publicly traded, and various regulatory authorities in China, the Cayman Islands, the British Virgin Islands and to new and evolving regulatory measures under applicable law. Our efforts to comply with new and changing laws and regulations have resulted in and are likely to continue to result in, increased general and administrative expenses and a diversion of management time and attention from revenue-generating activities to compliance activities.
Moreover, because these laws, regulations and standards are subject to varying interpretations, their application in practice may evolve over time as new guidance becomes available. This evolution may result in continuing uncertainty regarding compliance matters and additional costs necessitated by ongoing revisions to our disclosure and governance practices. If we fail to address and comply with these regulations and any subsequent changes, we may be subject to penalty and our business may be harmed.
Risks Related to Doing Business in Mainland China
The PRC government’s significant oversight and discretion over our business operations could result in a material adverse change in our operations and the value of our ADSs and/or ordinary shares.
We conduct our business primarily in mainland China. Our operations in mainland China are governed by PRC laws and regulations. The PRC government has significant oversight and discretion over the conduct of our business, and may intervene or influence our operations as the government deems appropriate to advance regulatory and societal goals and policy positions. The PRC government has published new policies that significantly affected certain industries and we cannot rule out the possibility that it will in the future release regulations or policies that directly or indirectly affect our industry or require us to seek additional permission to continue our operations, which could result in a material adverse change in our operation and/or the value of our ADSs and/or ordinary shares. Therefore, investors of our company and our business face potential uncertainty from actions taken by the PRC government affecting our business.
Changes in mainland China’s economic, political or social conditions or government policies could have a material adverse effect on our business and operations.
43
The majority of our assets and operations are located in mainland China. Accordingly, our business, financial condition, results of operations and prospects may be influenced to a significant degree by political, economic and social conditions in China generally and by continued economic growth in mainland China as a whole.
The Chinese economy differs from the economies of most developed countries in many respects, including the level of government involvement, level of development, growth rate, control of foreign exchange and allocation of resources. Although the Chinese government has implemented measures since the late 1970s emphasizing the utilization of market forces for economic reform, the reduction of state ownership of productive assets, and the establishment of improved corporate governance in business enterprises, a substantial portion of productive assets in mainland China are still owned by the Chinese government. In addition, the Chinese government continues to play a significant role in regulating industry development by imposing industrial policies. The Chinese government also exercises significant control over China’s economic growth through allocating resources, controlling payment of foreign currency-denominated obligations, setting monetary policy, and providing preferential treatment to particular industries or companies.
While the Chinese economy has experienced significant growth over the past decades, the growth has been uneven, both geographically and among various sectors of the economy, and the rate of growth has been slowing. The Chinese government has implemented various measures to encourage economic growth and guide the allocation of resources. Some of these measures may benefit the overall Chinese economy, but may have a negative effect on us. For example, our financial condition and results of operations may be adversely affected by government control over capital investments or changes in tax regulations. In addition, in the past the Chinese government has implemented certain measures, including interest rate increases, to control the pace of economic growth. These measures may cause decreased economic activity in China, which may adversely affect our business and operating results.
Uncertainties with respect to the PRC legal system could adversely affect us.
We conduct our business primarily through our subsidiaries and the VIEs in mainland China. Our operations in mainland China are governed by laws and regulations of mainland China. Uncertainties in the interpretation and enforcement of PRC laws and regulations could limit the legal protections available to you and us. In 1979, the PRC government began to promulgate a comprehensive system of laws and regulations governing economic matters in general. The overall effect of legislation over the past several decades has significantly enhanced the protections afforded to various forms of foreign investments in mainland China. However, China has not developed a fully integrated legal system, and recently enacted laws and regulations may not sufficiently cover all aspects of economic activities in mainland China. In particular, because these laws and regulations are relatively new, and because of the limited volume of published decisions and their nonbinding nature, the interpretation and enforcement of these laws and regulations involve uncertainties. Since administrative and court authorities of mainland China have significant discretion in interpreting and implementing statutory and contractual terms, it may be difficult to evaluate the outcome of administrative and court proceedings and the level of legal protection we enjoy. Furthermore, the PRC legal system is based in part on government policies and internal rules, some of which are not published on a timely basis or at all, which may have a retroactive effect. As a result, we may not be aware of our violation of these policies and rules until sometime after the violation. In addition, any administrative and court proceedings in mainland China may be protracted, resulting in substantial costs and diversion of resources and management attention.
The PRC government has significant oversight over the conduct of our business and it has indicated an intent to exert more oversight over offerings that are conducted overseas and/or foreign investment in China-based issuers. Any such action could significantly limit or completely hinder our ability to offer or continue to offer securities to investors and cause the value of such securities to significantly decline or be worthless.
Substantial uncertainties exist with respect to the interpretation and implementation of the PRC Foreign Investment Law and how it may impact the viability of our current corporate structure, corporate governance and business operations.
In March 2019, the Foreign Investment Law was enacted by the National People’s Congress and it became effective in January 2020. The Foreign Investment Law embodies an expected PRC regulatory trend to rationalize
44
its foreign investment regulatory regime in line with prevailing international practice and the legislative efforts to unify the corporate legal requirements for both foreign and domestic investments.
The VIE structure has been adopted by many mainland China-based companies, including us, to obtain necessary licenses and permits in the industries that are currently subject to foreign investment restrictions in mainland China. See “Item 7. Major Shareholders and Related Party Transactions—B. Related Party Transactions—Contractual Arrangements with the Variable Interest Entities” and “Item 3. Key Information—D. Risk Factors—Risks Related to Our Corporate Structure—If the PRC government finds that the agreements that establish the structure for operating our services in mainland China do not comply with PRC governmental restrictions on foreign investment in internet businesses, or if these regulations or the interpretation of existing regulations change in the future, we could be subject to severe penalties or be forced to relinquish our interests in those operations, and we may face significant disruption to our business operations.” Although the Foreign Investment Law does not explicitly classify “contractual arrangements” as a form of foreign investment, it contains a catch-all provision under the definition of “foreign investment” which includes investments made by foreign investors through means stipulated in laws or administrative regulations or other methods prescribed by the State Council. Therefore, it still reserves certain leeway for future legislation by the Stale Council to provide “contractual arrangements” as a form of foreign investment, in which case it will be uncertain as to whether our contractual arrangements with the VIEs will be deemed to be in violation of the market access requirements for foreign investments under the PRC laws and regulations, such as the Negative List. According to the Classification Catalog of Telecommunications Services, or 2015 Catalog and the Negative List, the provision of internet content services, which we conduct through the VIEs, is subject to foreign investment restrictions. Therefore, such foreign investment restrictions will be inevitably imposed on the VIEs if our contractual arrangements with the VIEs are further defined or regarded as a form of foreign investment by any future provisions stipulated in laws or administrative regulations or other methods prescribed by the State Council. In addition, if future laws, administrative regulations or provisions prescribed by the State Council mandate further actions to be taken by companies with respect to existing contractual arrangements, we may face substantial uncertainties as to whether we could complete such actions in a timely manner, or at all, and our business and financial condition may be materially and adversely affected. Given the foregoing, uncertainties still exist in relation to the interpretation and implementation of the Foreign Investment Law, which may result in adverse impact on our current corporate structure.
If our contractual arrangements with the VIEs are defined or regarded as a form of foreign investment in the future, our corporate governance practice may be impacted and our compliance costs may increase. For instance, the Foreign Investment Law requires foreign investors or foreign-funded enterprises to submit the investment information to competent governmental authorities for review. Although the contents and scope of such information shall be determined under the principle of necessity and the information that can be obtained through interdepartmental information sharing will not be required to be resubmitted, foreign investors or foreign-funded enterprises which fail to report their investment information as requested will be required to take corrective measures and/or be subject to fines. Moreover, the Foreign Investment Law provides that a security examination mechanism will be established to examine any foreign investment activity that affects or may affect national security. The decision made upon the security examination may impact the operations of the foreign-funded enterprises.
We may be adversely affected by the complexity, uncertainties and changes in the regulation of internet business and companies in mainland China.
The PRC government extensively regulates the internet industry, including foreign ownership of, and the licensing and permit requirements pertaining to, companies in the internet industry. These internet-related laws and regulations are evolving, and their interpretation and enforcement involve significant uncertainties. As a result, in certain circumstances it may be difficult to determine what actions or omissions may be deemed to be in violations of applicable laws and regulations. Issues, risks and uncertainties relating to the PRC government regulation of the internet industry include, but are not limited to, the following:
45
On July 13, 2006, the MIIT, issued the Notice of the Ministry of Information Industry on Intensifying the Administration of Foreign Investment in Value-added Telecommunications Services. This notice prohibits domestic telecommunication service providers from leasing, transferring or selling telecommunications business operating licenses to any foreign investor in any form, or providing any resources, sites or facilities to any foreign investor for their illegal operation of a telecommunications business in mainland China. According to this notice, either the holder of a value-added telecommunications license or its shareholders must directly own the domain names and trademarks used by such license holders in their provision of value-added telecommunication services. The notice also requires each license holder to have the necessary facilities, including servers, for its approved business operations and to maintain such facilities in the regions covered by its license. Currently, Autohome Information, Shengtuo Hongyuan, Shanghai Jinwu and Shanghai Jinyou, four of the VIEs, own the related domain names and trademarks and hold the ICP licenses, necessary to conduct our operations for websites and mobile applications in mainland China.
On August 31, 2018, the SCNPC issued the E-commerce Law, which came into effect on January 1, 2019. Pursuant to the E-commerce Law, operators of e-commerce platforms shall verify and register the basic information of e-commerce operators on their platforms, including the identity, address, contact and administrative license, and establish archives with regular updates for such information. It further provides that operators of e-commerce
46
platforms shall submit information on the identification of e-commerce operators to department for market regulation, and submit e-commerce operators’ identification information and other information relating to tax payment to tax authority. Additionally, operators of e-commerce platforms shall record and save information released on their platform about commodities and services, and report to competent authorities, if such information shows that e-commerce operators have failed to obtain the administrative license when they are subject to the relevant administrative approval, or commodities sold or services offered by e-commerce operators are found to be in violation of certain requirements to safeguard personal safety, property security and the requirements on environmental protection, or to be prohibited by laws and administrative regulations. The E-commerce Law establishes obligations to protect consumers for operators of e-commerce platforms, such as obligations to protect consumers’ personal information and record information of deals concluded on their platforms, obligations to refund guarantee deposits to consumers in a timely manner and obligations to noticeably label commodities or services ranked under competitive bidding with the word “Advertisement.” E-commerce operators shall not conduct false or misleading commercial publicity by fabricating transactions, making up user reviews or any other means, to cheat or mislead consumers. E-commerce platform operators shall not delete consumers’ ratings of commodities sold or services provided on the platform. We have carried out compliance work in accordance with these regulatory requirements. However, there are substantial uncertainties with respect to the interpretation and implementation of the E-commerce Law and how it may impact our business operations. We cannot guarantee that the compliance measures we have taken are fully consistent with the interpretation of regulators, and there is a risk that the company will be punished by those regulators because of any non-compliance activities.
In addition, on February 7, 2021, the Anti-monopoly Committee of the State Council published the Guideline on Anti-monopoly of Platform Economy Sector, or the Guideline, which became effective on the same day, aiming at enhancing anti-monopoly administration on businesses that operate under the platform model and the overall platform economy. The Guideline intends to regulate abuse of a dominant position and other anti-competitive practices by online platform operators and the related operators and service providers on online platforms, i.e. unfairly locking in exclusive agreements with operators on the platform and targeting specific customers with unreasonable big-data driven tailored pricing through their online behavior to eliminate or limit market competition. There remains uncertainties as to how the Guideline will be implemented, and we cannot assure you that the governmental authorities will not take an opposite opinion. Any failure or perceived failure by us to comply with the Guideline and other anti-monopoly laws and regulations may result in governmental investigations or enforcement actions, litigation or claims against us and could have an adverse effect on our business, financial condition and results of operations.
The interpretation and application of existing laws, regulations and policies and possible new laws, regulations or policies relating to the internet industry of mainland China have created substantial uncertainties regarding the legality of existing and future foreign investments in, and the businesses and activities of, internet businesses in mainland China, including our business. We cannot assure you that we will be able to maintain our existing licenses or obtain any new licenses if required by any new laws or regulations. There are also risks that we may be found to violate existing or future laws and regulations given the uncertainty and complexity of mainland China’s regulation of the internet industry. If we or the VIEs fail to obtain or maintain any of the required assets, licenses or approvals, our continued business operations in the internet industry may subject us to various penalties, including the confiscation of illegal net revenues, fines and the discontinuation or restriction of our operations, any of which would materially and adversely affect our business and results of operations.
The approval of and filing with the CSRC or other PRC government authorities may be required if we were to conduct offshore offerings in the future, and, if required, we cannot predict whether or for how long we will be able to obtain such approval or complete such filing.
On July 6, 2021, the relevant PRC government authorities issued Opinions on Strictly Cracking Down Illegal Securities Activities in Accordance with the Law. These opinions emphasized the need to strengthen the administration over illegal securities activities and the supervision on overseas listings by mainland China-based companies and proposed to take effective measures, such as promoting the construction of relevant regulatory systems to deal with the risks and incidents faced by mainland China-based overseas-listed companies.
On December 27, 2021, the NDRC and the MOFCOM, jointly issued the Negative List, effective from January 1, 2022. Pursuant to the Negative List, if a domestic company engaging in the prohibited business stipulated in the
47
Negative List seeks an overseas offering and listing, it shall obtain the approval from the competent governmental authorities. Besides, the foreign investors of the company shall not be involved in the company’s operation and management, and their shareholding percentage shall be subject, mutatis mutandis, to the relevant regulations on the domestic securities investments by foreign investors. According to the public responses of relevant officials from the NDRC and the MOFCOM to reporters’ questions regarding the Negative List, no reduction in shareholding percentage of foreign investor is required with respect to enterprises that have been listed overseas, if the percentage of foreign shareholding of such enterprises had exceeded the stipulated threshold before the promulgation of the Negative List. As the Negative List is relatively new, there remain substantial uncertainties as to the interpretation and implementation of these new requirements, and it is unclear as to whether and to what extent listed companies like us will be subject to these new requirements. If we are required to comply with these requirements and fail to do so on a timely basis, if at all, our business operation, financial conditions and business prospect may be adversely and materially affected.
On February 17, 2023, the CSRC promulgated Trial Administrative Measures of the Overseas Securities Offering and Listing by Domestic Companies (the “Overseas Listing Trial Measures”) and relevant five guidelines, which became effective on March 31, 2023. The Overseas Listing Trial Measures comprehensively reformed the existing regulatory regime for direct and indirect overseas offering and listing of mainland China domestic companies’ securities. Pursuant to the Overseas Listing Trial Measures, mainland China domestic companies that seek to offer and list securities in overseas markets, either in direct or indirect means, are required to fulfil the filing procedure with the CSRC and report relevant information. The Overseas Listing Trial Measures provide that if the issuer meets both the following criteria, the overseas securities offering and listing conducted by such issuer will be deemed as indirect overseas offering by mainland China domestic companies: (i) 50% or more of any of the issuer's operating revenue, total profit, total assets or net assets as documented in its audited consolidated financial statements for the most recent fiscal year is accounted for by domestic companies; and (ii) the main parts of the issuer's business activities are conducted in mainland China, or its main place(s) of business are located in mainland China, or the majority of senior management staff in charge of its business operations and management are PRC citizens or have their usual place(s) of residence located in mainland China. Where an issuer submits an application for initial public offering to competent overseas regulators, such issuer must file with the CSRC within three business days after such application is submitted.
On the same day, the CSRC also held a press conference for the release of the Overseas Listing Trial Measures and clarifies that domestic companies that have been listed overseas are existing enterprises, which are not required to complete the overseas listing filing immediately, but shall complete filings as required if they conduct refinancing or are involved in other circumstances that require filing with the CSRC. If we were to conduct offshore offerings in the future, it is uncertain whether we can complete such filing procedure, if we fail to complete such filing procedures, we would be subject to sanctions by the CSRC or other PRC regulatory authorities. These regulatory authorities may impose fines and penalties on our operations in mainland China, limit our ability to pay dividends outside of mainland China, limit our operating privileges in mainland China, delay or restrict the repatriation of the proceeds from our offshore offerings into China or take other actions that could materially and adversely affect our business, financial condition, results of operations, and prospects, as well as the trading price of our listed securities. In addition, given that the Overseas Listing Trial Measures were recently promulgated, there remains substantial uncertainties as to their interpretation, application, and enforcement and how they will affect our operations and our future financing. We cannot guarantee that new rules or regulations promulgated in the future will not impose any additional requirements on us or otherwise tighten the regulations on companies with VIE structures.
It may be difficult for overseas regulators to conduct investigations or collect evidence within mainland China.
Shareholder claims or regulatory investigations that are common in jurisdictions outside mainland China are difficult to pursue as a matter of law or practicality in mainland China. For example, in mainland China, there are significant legal and other obstacles to providing information needed for regulatory investigations or litigation initiated outside mainland China. Although the authorities in mainland China may establish a regulatory cooperation mechanism with the securities regulatory authorities of another country or region to implement cross-border supervision and administration, such cooperation with the securities regulatory authorities in the United States or other jurisdictions may not be efficient in the absence of a mutual and practical cooperation mechanism. Furthermore, according to Article 177 of the PRC Securities Law, or Article 177, which became effective in March 2020, no overseas securities regulator is allowed to directly conduct investigation or evidence collection activities
48
within the territory of mainland China, without the consent by the Chinese securities regulatory authorities under the State Council and the State Council related competent agencies, no entity or individual may provide documents or materials related to securities business to any foreign party. While detailed interpretation of or implementation rules under Article 177 have yet to be promulgated, the inability of an overseas securities regulator to directly conduct investigation or evidence collection activities within mainland China and the potential obstacles for information provision may further increase difficulties you face in protecting your interests. See also “—Risks Related to Our ADSs and Ordinary Shares—You may face difficulties in protecting your interests, and your ability to protect your rights through the U.S. federal courts or Hong Kong courts may be limited because we are incorporated under Cayman Islands law, we conduct substantially all of our operations in mainland China and most of our directors and officers reside outside the United States and Hong Kong” for risks associated with investing in us as a Cayman Islands company.
The PCAOB had historically been unable to inspect our auditor in relation to their audit work performed for our financial statements and the inability of the PCAOB to conduct inspections of our auditor in the past has deprived our investors with the benefits of such inspections.
Our auditor, the independent registered public accounting firm that issues the audit report included elsewhere in this annual report, as an auditor of companies that are traded publicly in the United States and a firm registered with the PCAOB, is subject to laws in the United States pursuant to which the PCAOB conducts regular inspections to assess its compliance with the applicable professional standards. The auditor is located in mainland China, a jurisdiction where the PCAOB was historically unable to conduct inspections and investigations completely before 2022. As a result, we and investors in our ordinary shares or ADSs were deprived of the benefits of such PCAOB inspections. The inability of the PCAOB to conduct inspections of auditors in mainland China and Hong Kong in the past has made it more difficult to evaluate the effectiveness of our independent registered public accounting firm’s audit procedures or quality control procedures as compared to auditors outside of mainland China and Hong Kong that are subject to the PCAOB inspections. On December 15, 2022, the PCAOB issued a report that vacated its December 16, 2021 determination and removed mainland China and Hong Kong from the list of jurisdictions where it is unable to inspect or investigate completely registered public accounting firms. However, if the PCAOB determines in the future that it no longer has full access to inspect and investigate completely accounting firms in mainland China and Hong Kong, and we use an accounting firm headquartered in one of these jurisdictions to issue an audit report on our financial statements filed with the Securities and Exchange Commission, we and investors in our ordinary shares or ADSs would be deprived of the benefits of such PCAOB inspections again, which could cause investors and potential investors in our ordinary shares or ADSs to lose confidence in our audit procedures and reported financial information and the quality of our financial statements.
Our ADSs may be prohibited from trading in the United States under the HFCAA in the future if the PCAOB is unable to inspect or investigate completely auditors located in China. The delisting of the ADSs, or the threat of their being delisted, may materially and adversely affect the value of your investment.
Pursuant to the HFCAA, if the SEC determines that we have filed audit reports issued by a registered public accounting firm that has not been subject to inspections by the PCAOB for two consecutive years, the SEC will prohibit our ordinary shares or ADSs from being traded on a national securities exchange or in the over-the-counter trading market in the United States.
On December 16, 2021, the PCAOB issued a report to notify the SEC of its determination that the PCAOB was unable to inspect or investigate completely registered public accounting firms headquartered in mainland China and Hong Kong and our auditor was subject to that determination. In May 2022, the SEC conclusively listed us as a Commission-Identified Issuer under the HFCAA following the filing of our annual report on Form 20-F for the fiscal year ended December 31, 2021. On December 15, 2022, the PCAOB removed mainland China and Hong Kong from the list of jurisdictions where it is unable to inspect or investigate completely registered public accounting firms. For this reason, we do not expect to be identified as a Commission-Identified Issuer under the HFCAA after we file this annual report on Form 20-F for the fiscal year ended December 31, 2022.
49
Each year, the PCAOB will determine whether it can inspect and investigate completely audit firms in mainland China and Hong Kong, among other jurisdictions. If the PCAOB determines in the future that it no longer has full access to inspect and investigate completely accounting firms in mainland China and Hong Kong and we use an accounting firm headquartered in one of these jurisdictions to issue an audit report on our financial statements filed with the SEC, we would be identified as a Commission-Identified Issuer following the filing of the annual report on Form 20-F for the relevant fiscal year. In accordance with the HFCAA, our securities would be prohibited from being traded on a national securities exchange or in the over-the-counter trading market in the United States if we are identified as a Commission-Identified Issuer for two consecutive years in the future. A prohibition of being able to trade in the United States would substantially impair your ability to sell or purchase our ordinary shares and/or ADSs when you wish to do so, and the risk and uncertainty associated with delisting would have a negative impact on the price of our ordinary shares or ADSs. Also, such a prohibition would significantly affect our ability to raise capital on terms acceptable to us, or at all, which would have a material adverse impact on our business, financial condition, and prospects.
Fluctuations in exchange rates may have a material adverse effect on your investment.
Substantially all of our revenues and costs are denominated in RMB. The conversion of RMB into foreign currencies, including U.S. dollars, is based on rates set by the People’s Bank of China. In July 2005, the PRC government changed its decades-old policy of pegging the value of the RMB to the U.S. dollar, and the RMB appreciated more than 20% against the U.S. dollar over the following three years. Between July 2008 and June 2010, this appreciation halted and the exchange rate between the RMB and the U.S. dollar remained within a narrow band. Since June 2010, the RMB has fluctuated against the U.S. dollar, at times significantly and unpredictably. It is difficult to predict how market forces or PRC or U.S. government policy may impact the exchange rate between the RMB and the U.S. dollar in the future. On November 30, 2015, the Executive Board of the International Monetary Fund (IMF) completed the regular five-year review of the basket of currencies that make up the Special Drawing Right, or the SDR, and decided that with effect from October 1, 2016, RMB is determined to be a freely usable currency and will be included in the SDR basket as a fifth currency, along with the U.S. dollar, the Euro, the Japanese yen and the British pound. In the fourth quarter of 2016, the RMB depreciated significantly in the backdrop of a surging U.S. dollar and persistent capital outflows of China. This depreciation halted in 2017, and the RMB appreciated approximately 7% against the U.S. dollar during this one-year period. Between February 2018 and December 31, 2018, the RMB depreciated significantly, over 8% against the U.S. dollar. During the period from August 2019 to December 2019, the RMB depreciated to over seven per U.S. dollar, the lowest rate in over a decade. Since 2020, the RMB has appreciated about 2.3% against the U.S. dollar. With the development of the foreign exchange market and progress towards interest rate liberalization and RMB internationalization, the PRC government may in the future announce further changes to the exchange rate system, and we cannot assure you that the RMB will not appreciate or depreciate significantly in value against the U.S. dollar in the future. It is difficult to predict how market forces or PRC or U.S. government policy may impact the exchange rate between the RMB and the U.S. dollar in the future.
Significant revaluation of the RMB may have a material and adverse effect on your investment. To the extent that we need to convert U.S. dollars into RMB for capital expenditures and working capital and other business purposes, appreciation of the RMB against the U.S. dollar would have an adverse effect on the RMB amount we would receive from the conversion. Conversely, if we decide to convert RMB into U.S. dollars for the purpose of making payments for dividends on our ordinary shares or ADSs, strategic acquisitions or investments or other business purposes, appreciation of the U.S. dollar against the RMB would have a negative effect on the U.S. dollar amount available to us. In addition, a significant depreciation of the RMB against the U.S. dollar may significantly reduce the U.S. dollar equivalent of our earnings, which in turn could adversely affect the price of our ADSs.
Very limited hedging options are available in mainland China to reduce our exposure to exchange rate fluctuations. To date, we have not entered into any hedging transactions in an effort to reduce our exposure to foreign currency exchange risk. While we may decide to enter into hedging transactions in the future, the availability and effectiveness of these hedges may be limited and we may not be able to adequately hedge our exposure or to hedge our exposure at all. In addition, our currency exchange losses may be magnified by the exchange control regulations of mainland China that restrict our ability to convert RMB into foreign currency. As a result, fluctuations in exchange rates may have a material adverse effect on your investment.
50
Governmental control of currency conversion may limit our ability to utilize our revenues effectively and affect the value of your investment.
The PRC government imposes controls on the convertibility of the RMB into foreign currencies and, in certain cases, the remittance of currency out of mainland China. We receive substantially all of our revenues in RMB. Under the existing foreign exchange regulations of mainland China, payments of current account items, including profit distributions, interest payments and trade and service-related foreign exchange transactions, can be made in foreign currencies without prior SAFE approval by complying with certain procedural requirements. Therefore, our mainland China subsidiaries are able to pay dividends in foreign currencies to us without prior approval from SAFE. However, approval from or registration with appropriate government authorities is required where RMB is to be converted into foreign currency and remitted out of mainland China to pay capital expenses such as the repayment of loans denominated in foreign currencies. The PRC government may also at its discretion restrict access to foreign currencies for current account transactions in the future. If the foreign exchange control system prevents us from obtaining sufficient foreign currency to satisfy our foreign currency demands, we may not be able to pay dividends in foreign currencies to our shareholders, including holders of our ADSs and/or ordinary shares.
Certain regulations in the PRC may make it more difficult for us to pursue growth through acquisitions.
Among other things, certain regulations and rules concerning mergers and acquisitions established additional procedures and requirements that could make merger and acquisition activities by foreign investors more time-consuming and complex. For example, these regulations require that the MOFCOM be notified in advance of any change-of-control transaction in which a foreign investor takes control of a mainland China domestic enterprise or a foreign company with substantial mainland China operations, if certain thresholds under the Provisions on Thresholds for Prior Notification of Concentrations of Undertakings, issued by the State Council on August 3, 2008 and amended on September 18, 2018, are triggered. According to the Implementing Rules Concerning Security Review on Mergers and Acquisitions by Foreign Investors of Domestic Enterprises issued by the MOFCOM in August 2011, mergers and acquisitions by foreign investors involved in an industry related to national security are subject to strict review by the MOFCOM. These rules also prohibit any transactions attempting to bypass such security review, including by controlling entities through contractual arrangements. We believe that our business is not in an industry related to national security. However, we cannot preclude the possibility that the MOFCOM or other government agencies may publish interpretations contrary to our understanding or broaden the scope of such security review in the future. We may elect to grow our business in the future in part by directly acquiring, or investing in, complementary businesses in mainland China. Complying with the requirements of these regulations to complete such transactions could be time-consuming, and any required approval processes, including obtaining approval from the MOFCOM, may delay or inhibit our ability to complete such transactions.
On June 24, 2022, the SCNPC released the final version of the revised Anti-Monopoly Law, which came into effect on August 1, 2022. According to the revised Anti-monopoly Law, where a concentration of undertakings reaches the declaration threshold stipulated by the State Council, a declaration must be approved by the anti-monopoly authority before parties implement the concentration. On February 7, 2021, the Anti-monopoly Committee of the State Council published the Guideline on Anti-monopoly of Platform Economy Sector, or the Guideline, which became effective on the same day. The Guideline stipulates that if any concentration of undertakings involves any variable interest entities, such variable interest entities shall fall within the scope of anti-monopoly review. If a concentration of undertakings meets the criteria for declaration as stipulated by the State Council, an operator shall report such concentration of undertakings to the anti-monopoly law enforcement agency under the State Council in advance.
In particular, the PRC anti-monopoly enforcement agencies have in recent years strengthened enforcement under the PRC Anti-monopoly Law. In March 2018, the SAMR was formed as a new regulatory agency to take over, among other things, the anti-monopoly enforcement functions from the relevant departments under the MOFCOM, the NDRC and the then State Administration for Industry and Commerce, or SAIC (the predecessor of the SAMR), respectively. On November 18, 2021, the National Anti-monopoly Bureau was officially established to formulate anti-monopoly institutional measures and guidelines, implement anti-monopoly law enforcement, undertake the guidance for enterprises’ anti-monopoly action responding abroad and so on. Due to the enhanced implementation of the Anti-Monopoly Law, we may be under heightened regulatory scrutiny, which will increase our compliance costs and subject us to heightened risks and challenges. If any past or future acquisitions or
51
investments involving us may have triggered filing requirement for anti-monopoly review and we are found to have violated the Anti-Monopoly Law of the PRC for any failure to file the notification of concentration and request for review or otherwise, (i) we may be subject to a fine up to RMB 5,000,000, or (ii) if the concentration of undertakings has or may have an effect of excluding or limiting competition, the State Council anti-monopoly enforcement agency may order us to stop the implementation of the concentration, to dispose of shares, assets, and the business within a period of time, or take other necessary measures to restore the state before the concentration, and impose on us a fine of not more than 10% of its last year’s sales revenue.
Failure to comply with PRC regulations regarding the registration requirements for employee share ownership plans or share option plans may subject the PRC plan participants or us to fines and other legal or administrative sanctions.
In December 2006, the People’s Bank of China, or PBOC, promulgated the Administrative Measures of Foreign Exchange Matters for Individuals, which sets forth the respective requirements for foreign exchange transactions by individuals (both PRC and non-PRC citizens) under either the current account or the capital account. In January 2007, SAFE issued relevant implementing rules which were further revised by SAFE in 2016, that specified approval requirements for certain capital account transactions such as a PRC citizen’s participation in the employee stock incentive plans or share option plans of an overseas publicly listed company. In February 2012, SAFE promulgated the Notice on the Administration of Foreign Exchange Matters for Domestic Individuals Participating in the Stock Incentive Plans of Overseas Listed Companies, or the Stock Option Notice. The Stock Option Notice supersedes the requirements and procedures for the registration of mainland China resident individuals’ participation in stock incentive plans set forth by certain rules promulgated by SAFE in March 2007 and January 2008. Under these measures, mainland China resident individuals who participate in an employee stock incentive plan or a share option plan in an overseas publicly listed company are required to register with SAFE and complete certain other procedures. A domestic qualified agent appointed through the mainland China subsidiaries of such overseas listed company must file applications on behalf of such mainland China resident individuals with SAFE or its local counterpart to obtain approval for an annual allowance with respect to the foreign exchange in connection with stock holding or share option exercises. With the approval from SAFE or its local counterpart, the domestic qualified agent must open a special foreign exchange account at a mainland China bank to hold the funds required in connection with the stock purchase or option exercise, payment received upon sales of shares, dividends issued on the stock and any other income or expenditures approved by SAFE or its local counterpart. We and our mainland China resident employees who participate in our share incentive plans are subject to these regulations as we are an overseas listed company. We have made registration with the local counterparts of SAFE for our mainland China resident employees who participate in our share incentive plans as required under the Stock Option notice and relevant rules. If we or our PRC plan participants fail to comply with these regulations, we or our PRC plan participants may be subject to fines and other legal or administrative sanctions. See “Item 4. Information on the Company—B. Business Overview—PRC Regulation—Regulations on Employee Stock Options Plans.”
We face uncertainties with respect to indirect transfers of equity interests in mainland China resident enterprises by their non-mainland China holding companies.
On February 3, 2015, the State Administration of Taxation, or the SAT, issued SAT Notice 7, which was amended in December 2017, to supersede the existing tax rules in relation to the indirect transfer of assets by non-mainland China resident enterprises. SAT Notice 7 introduces a more sophisticated anti-avoidance guidance. SAT Notice 7 extends its tax jurisdiction to capture not only indirect transfer but also transactions involving transfer of movable and immovable property in mainland China of a foreign company through the offshore transfer of a foreign intermediate holding company. According to SAT Notice 7, if a non-resident enterprise indirectly transfers mainland China taxable properties through an arrangement without reasonable commercial purpose but to avoid PRC Corporate Income Tax, the indirect transfer shall be re-characterized and treated as a direct transfer of mainland China taxable properties. SAT Notice 7 also interprets the term “transfer of the equity interests in a foreign intermediate holding company” broadly. In addition, SAT Notice 7 provides clearer criteria on how to assess reasonable commercial purposes and introduces safe harbor scenarios applicable to the public trading of shares in a listed company holding taxable mainland China assets and indirect transfers resulting from a corporate restructuring.
52
Further, SAT Notice 7 adopts a voluntary reporting regime. Both the foreign transferor and the transferee, and the mainland China tax resident enterprise whose equity interests being transferred may voluntarily report the transfer by submitting the documents required in SAT Notice 7. In addition to the voluntary reporting, SAT Notice 7 empowers the Chinese tax authorities to require various documents from the parties involved. Although SAT Notice 7 provides clarities in many important areas such as reasonable commercial purpose and reporting requirements, it brings challenges to both the foreign transferor and transferee of the indirect transfer as they are required to make a self-assessment on whether the transaction should be subject to PRC tax and to file or withhold the PRC tax accordingly.
On October 17, 2017, the SAT issued the Announcement of the State Administration of Taxation on Matters Concerning Withholding of Income Tax of Non-Resident Enterprises at Source, or SAT Circular 37, which became effective on December 1, 2017. The SAT Circular 37 applies the principle of withholding of income tax of non-resident enterprises at source. The SAT Circular 37 stipulates that the taxable income from equity transfers refers to the balance of deducting the net value of equity transferred from the total income from the applicable equity transfer. Pursuant to SAT Circular 37, the payer, namely the principal, the designator, or the warrantee or the guaranteed party, should assume the obligation of withholding income tax in the circumstances where the payer entrusts an agent or designates a third party to make payments on its behalf, or the payments should be made by a third-party warrantor or guarantor as provided in the applicable guarantee contracts or applicable laws.
SAT Notice 7 became effective on February 3, 2015, but it also applies to indirect transfers which occurred before its issuance but have not received assessments from the tax authorities. SAT Circular 37 and SAT Notice 7 may be determined by the tax authorities to be applicable to our corporate restructuring where non-resident investors were involved, if any of such transactions were determined by the tax authorities to lack reasonable commercial purpose. As a result, we and our non-resident investors in such transactions may become at risk of being taxed under SAT Circular 37 and SAT Notice 7 and we may be required to expend valuable resources to comply with SAT Circular 37 and SAT Notice 7 or to establish that we should not be taxed under the general anti-avoidance rule of the amended PRC Enterprise Income Tax Law, or EIT Law, which may have a material adverse effect on our financial condition and results of operations or such non-resident investors’ investments in us.
Discontinuation of any of the preferential tax treatments or imposition of any additional taxes could adversely affect our financial condition and results of operations.
The amended EIT Law and its implementation rules permit certain “high and new technology enterprises strongly supported by the state”, or HNTEs, which hold independent ownership of core intellectual property to enjoy a preferential enterprise income tax rate of 15% subject to certain qualification criteria. In addition, PRC laws permit reduction in income tax for “key software enterprises”, or KSEs, or “software enterprises.” All of these statuses are subject to review and renewal, with HNTEs to be renewed every three years and KSEs and software enterprises annually. Currently we have six subsidiaries eligible for preferential tax treatments, six of which are recognized as HNTE and are eligible for the preferential 15% enterprise income tax rate, three of which are recognized as software enterprises and two of which is accredited as KSEs. However, if any of these subsidiaries fails to pass the review by, and filing with, the relevant tax authorities to be qualified as a HNTE, a KSE or a software enterprise, such company will no longer enjoy the corresponding preferential tax treatment described above.
Our global income and the dividends that we may receive from our mainland China subsidiaries, dividends distributed to our non-mainland China shareholders and ADS holders, and gains recognized by such shareholders or ADS holders, may be subject to PRC taxes under the EIT Law, which would have a material adverse effect on our results of operations.
Under the EIT Law, which became effective on January 1, 2008 and was most recently amended on December 29, 2018, and its implementation rules, which became effective on January 1, 2008 and was most recently amended on April 23, 2019, an enterprise established outside of the mainland China with “de facto management bodies” within the mainland China is considered a resident enterprise and will be subject to the enterprise income tax at the rate of 25% on its global income. The SAT issued the Notice Regarding the Determination of Chinese-Controlled Offshore Incorporated Enterprises as PRC Tax Resident Enterprises on the Basis of De Facto Management Bodies, or SAT Circular 82, on April 22, 2009, which was amended in 2013 and 2017 respectively. SAT Circular 82 provides certain specific criteria for determining whether the “de facto management body” of a Chinese-controlled offshore-incorporated enterprise is located in mainland China. On August 3, 2011, the SAT issued the
53
Administrative Measures of Enterprise Income Tax of Chinese-Controlled Offshore Incorporated Resident Enterprises (Trial), which became effective on September 1, 2011 and was most recently amended in 2018, to provide more guidance on the implementation of SAT Circular 82. Although we do not believe that our legal entities organized outside of the mainland China constitute mainland China resident enterprises, it is possible that the PRC tax authorities could reach a different conclusion. In such case, we may be considered a mainland China resident enterprise and may therefore be subject to enterprise income tax at a rate of 25% on our global income. If we are considered a mainland China resident enterprise and earn income other than dividends from our mainland China subsidiaries, a 25% enterprise income tax on our global income could significantly increase our tax burden and materially and adversely affect our cash flow and profitability.
Pursuant to the amended EIT Law and its implementation rules, dividends generated after January 1, 2008 and payable by a foreign-invested enterprise in mainland China to its foreign investors, which are non-mainland China tax resident enterprises without an establishment in mainland China, or whose income has no connection with their institutions and establishments inside mainland China, are subject to withholding tax at a rate of 10%, unless any such foreign investor’s jurisdiction of incorporation has a tax treaty with mainland China that provides for a different withholding arrangement. We are a Cayman Islands holding company and we conduct our business through our wholly-owned subsidiaries and VIEs in mainland China, of which our WFOEs are the primary beneficiaries of the VIEs. Autohome WFOE is 100% owned by Cheerbright, our wholly owned subsidiary located in the British Virgin Islands. The British Virgin Islands currently does not have any tax treaty with mainland China with respect to withholding tax. As long as Cheerbright is considered a non-mainland China resident enterprise, dividends that it receives from Autohome WFOE may be subject to withholding tax at a rate of 10%. As to our subsidiaries located in Hong Kong, such as Autohome Media Limited, the shareholder of our mainland China subsidiaries currently engaging in advertising business, and Autohome Link Hong Kong Limited, the shareholder of Chezhiying WFOE, and TTP CAR (HK) LIMITED, the shareholder of TTP WFOE, under the Arrangement between mainland China and the Hong Kong Special Administrative Region on the Avoidance of Double Taxation and Prevention of Fiscal Evasion, effective on January 1, 2007, as long as each of our Hong Kong subsidiaries is considered a non-mainland China resident enterprise and directly holds at least 25% of the equity interests of its respective mainland China subsidiaries, dividends that it receives from its mainland China subsidiaries may be subject to withholding tax at a preferential rate of 5%, if it is the beneficial owner of the dividends, upon receiving the approval from the local tax authority. In August 2015, the SAT promulgated the Administrative Measures for Non-Resident Taxpayers to Enjoy Treatments under Tax Treaties, or SAT Circular 60, which became effective on November 1, 2015. The SAT Circular 60 was replaced by the Administrative Measures for Non-Resident Taxpayers to Enjoy Treatments under Treaties, or SAT Circular 35, promulgated by the SAT on October 14, 2019 and became effective on January 1, 2020. Pursuant to the SAT Circular 35, non-resident enterprises are not required to obtain pre-approval from the relevant tax authority in order to enjoy the reduced withholding tax rate, and non-resident enterprises and their withholding agents may, by self-assessment and upon their confirmation that the prescribed criteria to enjoy the tax treaty benefits are met, directly apply the reduced withholding tax rate, and file necessary forms when performing tax filings. Moreover, non-resident enterprises and their withholding agents shall keep the supporting documents for post-filing examinations by the relevant tax authorities.
As uncertainties remain regarding the interpretation and implementation of the amended EIT Law and its implementation rules, we cannot assure you that if we are regarded as a mainland China resident enterprise, any dividends to be distributed by us to our non-mainland China enterprise shareholders and ADS holders would not be subject to any PRC withholding tax at a rate of 10% and to non-mainland China individual shareholders and ADS holders would not be subject to PRC individual income tax at a rate of 20%. Similarly, any gain recognized by such non-mainland China shareholders or ADS holders on the sale of shares or ADSs, as applicable, may also be subject to PRC tax. If our dividends payable to our non-mainland China enterprise shareholders, non-mainland China individual shareholders and ADS holders, or on gains recognized by such non-mainland China shareholders or ADS holders are required under the EIT Law and the Individual Income Tax Law to be subject to PRC tax, such investors’ investment in our ordinary shares or ADSs may be materially and adversely affected.
Increases in labor costs and enforcement of stricter labor-related laws and regulations may adversely affect our business and our results of operations.
China’s overall economy and the average wage in China have increased in recent years and are expected to continue to grow. The average wage level for our employees has also increased in recent years. We expect that our labor costs, including wages and employee benefits, will continue to increase. Unless we are able to pass on these
54
increased labor costs to our users and customers by increasing prices for our services, our profitability and results of operations may be materially and adversely affected.
In addition, we have been subject to stricter regulatory requirements in terms of entering labor contracts with our employees and paying various statutory employee benefits, including pensions, housing fund, medical insurance, work-related injury insurance, unemployment insurance and childbearing insurance to designated government agencies for the benefit of our employees. Pursuant to the PRC Labor Contract Law, or the Labor Contract law, which became effective in January 2008, as amended in December 2012 and effective as of July 1, 2013, and its implementation rules that became effective in September 2008, employers are subject to stricter requirements in terms of signing labor contracts, minimum wages, paying remuneration, determining the term of employees’ probation and unilaterally terminating labor contracts. In the event that we decide to terminate some of our employment contracts or otherwise change our employment or labor practices, the Labor Contract Law and its implementation rules may limit our ability to effect those changes in a desirable or cost- effective manner, which could adversely affect our business and results of operations. In October 2010, the SCNPC promulgated the PRC Social Insurance Law, or the Social Insurance Law, which became effective on July 1, 2011 and was amended on December 29, 2018. According to the Social Insurance Law, employees must participate in pension insurance, work-related injury insurance, medical insurance, unemployment insurance and maternity insurance and the employers must, together with their employees or separately, pay the social insurance premiums for such employees. On February 18, 2019, the Ministry of Human Resources and Social Security and eight other departments issued the Circular on Further Regulating Recruitment Activities to Promote Equal Employment for Women, or Circular on Promoting Equal Employment for Women, which came into force simultaneously. The Circular stipulates that if employers or human resources agencies are found to have posted hiring advertisements containing discriminatory content, they may be ordered to correct such discriminatory advertisements. Failure to correct the discriminatory advertisements as ordered will be punishable by a maximum fine of RMB50,000. Inquiring about a female applicant’s marital and childbearing status, conducting pregnancy test in the entry medical examination and other behaviors involving gender discrimination are also prohibited by the Circular on Promoting Equal Employment for Women.
As the interpretation and implementation of labor-related laws and regulations are still evolving, we cannot assure you that our employment practice does not and will not violate labor-related laws and regulations in mainland China, which may subject us to labor disputes or government investigations. If we are deemed to have violated relevant labor-related laws and regulations, we could be required to provide additional compensation to our employees and our business, financial condition and results of operations may be materially and adversely affected.
Changes in international trade policies and rising political tensions, particularly between the U.S. and China, may adversely impact our business and operating results.
There have been changes in international trade policies and rising political tensions, particularly between the U.S. and China, but also as a result of the conflict in Ukraine and sanctions on Russia. The U.S. government has made statements and taken certain actions that may lead to potential changes to U.S. and international trade policies towards China. For example, export controls, economic and trade sanctions have been threatened and/or imposed by the U.S. government on a number of Chinese technology companies. The United States has also threatened to impose further export controls, sanctions, trade embargoes, and other heightened regulatory requirements on China and Chinese companies for alleged activities both inside and outside of China. Against this backdrop, China has implemented, and may further implement, measures in response to the changing trade policies, treaties, tariffs and sanctions and restrictions against Chinese companies initiated by the U.S. government. For example, MOFCOM published Rules on Counteracting Unjustified Extra-Territorial Application of Foreign Legislation and Other Measures in January 2021 to counter restrictions imposed by foreign countries on Chinese citizens and companies. Rising trade and political tensions could reduce levels of trades, investments, technological exchanges and other economic activities between China and other countries, which would have an adverse effect on global economic conditions, the stability of global financial markets, and international trade policies.
While cross-border business currently may not be an area of our focus and we are scaling back our European business, any rising trade and political tensions or unfavorable government policies on international trade and Chinese companies could impact our competitive position or hinder our commercial activities in certain countries. In
55
addition, our results of operations could be adversely affected if any such tensions or unfavorable government trade policies harm the Chinese economy or the global economy in general.
Risks Related to Our ADSs and Ordinary Shares
The trading price of our ADSs and/or ordinary shares has been and is likely to continue to be, volatile, which could result in substantial losses to holders of our ADSs and/or ordinary shares.
The trading price of our ADSs and/or ordinary shares has been and is likely to continue to be volatile and could fluctuate widely in response to a variety of factors, many of which are beyond our control. For example, the daily closing trading prices for our ADSs on the NYSE ranged from US$21.50 to US$39.74 in 2022. Likewise, the daily closing trading prices for our ordinary shares on the Hong Kong Stock Exchange ranged from HK$39.80 to HK$78.05 in 2022. The trading price for our ADSs and/or ordinary shares may continue to fluctuate in response to factors including, without limitation, the following:
In addition, the stock market in general has experienced extreme price and volume fluctuations that have often been unrelated or disproportionate to the operating performance of companies like us. For example, concerns over economic slowdown resulting from the COVID-19 pandemic have triggered a US key market-wide circuit breaker
56
for several times since March 9, 2020, leading to a historic drop for the US capital market. No guarantee can be given on how the capital markets will react although actions have been taken worldwide to combat the spread of the coronavirus. These broad market and industry fluctuations may adversely affect the market price of our ADSs and/or ordinary shares. The market price of our ADSs and/or ordinary shares may also be adversely affected by any alleged untrue statement or alleged omission to state a material fact in our public announcements or press releases, which may even lead to securities class action suits against us. In the past, shareholders of a public company often brought securities class action suits against the company following periods of instability in the market price of that company’s securities. If we were involved in a class action suit, it could divert a significant amount of our management’s attention and other resources from our business and operations, which could harm our results of operations and require us to incur significant expenses to defend the suit. Any such class action suit, whether or not successful, could harm our reputation and restrict our ability to raise capital in the future. In addition, if a claim is successfully made against us, we may be required to pay significant damages, which could have a material adverse effect on our financial condition and results of operations. Volatility or a lack of positive performance in our ADS and/or ordinary share price may also adversely affect our ability to retain key employees, most of whom have been granted options or other equity incentives.
We believe that we were a passive foreign investment company, or PFIC, for U.S. federal income tax purposes for the taxable year ended December 31, 2022, which could result in adverse U.S. federal income tax consequences to U.S. holders of our ADSs or ordinary shares.
Under United States federal income tax law, we will be classified as a passive foreign investment company, or PFIC, for any taxable year if either (i) at least 75% of our gross income for the taxable year is passive income or (ii) at least 50% of the value of our assets (generally based on the average quarterly value of our assets during the taxable year) is attributable to assets that produce or are held for the production of passive income (the “asset test”). Although the law in this regard is not entirely clear, we treat the VIEs as being owned by us for United States federal income tax purposes because we control their management decisions and are entitled to substantially all of the economic benefits associated with such entities, and, as a result, we consolidate their results of operations in our consolidated U.S. GAAP financial statements.
Based upon the nature and composition of our assets (in particular, the retention of substantial amounts of cash, deposits and investments), and the market price of our ADSs, we believe that we were a PFIC for United States federal income tax purposes for the taxable year ended December 31, 2022, and we will likely be a PFIC for our current taxable year unless the market price of our ADSs increases and/or we invest a substantial amount of the cash and other passive assets we hold in assets that produce or are held for the production of active income. U.S. Holders should consult with their tax advisors regarding the implications of owning stock in a PFIC. No assurances regarding our PFIC status can be provided for any past, current or future taxable years. The determination of whether we are a PFIC is a fact-intensive determination made on an annual basis and the applicable law is subject to varying interpretation. Our U.S. counsel expresses no opinion with respect to our PFIC status for our taxable year ended December 31, 2022 or any future taxable year.
If we are classified as a PFIC, a U.S. Holder (as defined in “Item 10. Additional Information-E. Taxation-United States Federal Income Tax Considerations-General”) may incur significantly increased United States income tax on gains recognized on the sale or other disposition of the ADSs or ordinary shares and on the receipt of distributions on the ADSs or ordinary shares to the extent such gain or distribution is treated as an “excess distribution” under United States federal income tax rules. Further, if we are a PFIC for any year during which a U.S. Holder held our ADSs or ordinary shares, we generally would continue to be treated as a PFIC as to such U.S. Holder for all succeeding years during which such U.S. Holder held our ADSs or ordinary shares. For more information, see “Item 10. Additional Information—E. Taxation—United States Federal Income Tax Considerations—Passive Foreign Investment Company Rules.”
We adopt different practices as to certain matters as compared with many other companies listed on the Hong Kong Stock Exchange.
We completed our public offering in Hong Kong in March 2021 and the trading of our ordinary shares on the Hong Kong Stock Exchange commenced on March 15, 2021 under the stock code “2518.” As a company listed on the Hong Kong Stock Exchange pursuant to Chapter 19 of the Hong Kong Listing Rules, we are not subject to
57
certain provisions of the Hong Kong Listing Rules pursuant to Rule 19C.11, including, among others, rules on notifiable transactions, connected transactions, share option schemes, content of financial statements as well as certain other continuing obligations. In addition, in connection with the listing of our ordinary shares on the Hong Kong Stock Exchange, we applied for a number of waivers and/or exemptions from strict compliance with the Hong Kong Listing Rules, the Companies (Winding Up and Miscellaneous Provisions) Ordinance, the Takeovers Codes and the SFO. As a result, we adopt different practices as to those matters as compared with other companies listed on the Hong Kong Stock Exchange that do not enjoy those exemptions or waivers.
Furthermore, if there occurs involuntary delisting of our ADSs, or 55% or more of the total worldwide trading volume, by dollar value, of our ordinary shares and ADSs over our most recent fiscal year takes place on the Hong Kong Stock Exchange, the Hong Kong Stock Exchange will regard us as having a dual primary listing in Hong Kong and we will no longer enjoy certain exemptions or waivers from strict compliance with the requirements under the Hong Kong Listing Rules, the Companies (Winding Up and Miscellaneous Provisions) Ordinance, the Takeovers Codes and the SFO, which could result in us having to amend our corporate structure and memorandum and articles of association and our incurring of incremental compliance costs.
We cannot guarantee that any share repurchase program will be fully consummated or that any share repurchase program will enhance long-term shareholder value, and share repurchases could increase the volatility of the price of our ADSs and/or ordinary shares and could diminish our cash reserves.
On November 18, 2021, our board of directors authorized a share repurchase program, under which we may repurchase up to US$200 million of our ADSs over the next 12 months (the “Share Repurchase Program”). The Share Repurchase Program was publicly announced on the same day. On November 3, 2022, our board of directors authorized an extension of the term of the Share Repurchase Program for another twelve months to November 17, 2023. As of March 31, 2023, we have repurchased 3,819,907 ADSs for a total cost of approximately US$115.2 million. Our share repurchase program could affect the price of our stock and increase volatility, diminish our cash reserve, and may be suspended or terminated at any time. We cannot guarantee that any share repurchase program we institute, including the program approved on November 18, 2021, will be fully consummated or that it will enhance long-term shareholder value. For details of the volume of ADSs repurchased pursuant to our repurchase program, please see “Item 16E—Purchases of Equity Securities by the Issuer and Affiliated Purchasers.”
If securities or industry analysts do not publish research or reports about our business, or publish inaccurate or unfavorable research or reports about our business or if they adversely change their recommendations regarding our ADSs and/or ordinary shares, the market price for our ADSs and/or ordinary shares and trading volume could decline.
The trading market for our ADSs and/or ordinary shares will depend in part on the research and reports that securities or industry analysts publish about us or our business. If we do not establish and maintain adequate research coverage or if one or more of the analysts who covers us downgrades our ADSs and/or ordinary shares or publishes inaccurate or unfavorable research about our business, the market price for our ADSs and/or ordinary shares would likely decline. If one or more of these analysts ceases coverage of our company or fails to publish reports on us regularly, we could lose visibility in the financial markets, which, in turn, could cause the market price or trading volume for our ADSs and/or ordinary shares to decline.
Although we have a regular dividend policy in place, we cannot assure you that our existing dividend policy will not change in the future or the amount of dividends that you may receive, neither can we guarantee that we will have sufficient profits, reserves set aside from profits or otherwise funds to justify and enable dividend declaration and payment in compliance with laws for any year and, therefore, you may need to rely on price appreciation of our ADSs and/or ordinary shares as the sole source for return on your investment.
In November 2019, our board of directors resolved to adopt a regular dividend policy. Under this policy, we may issue recurring cash dividend every year from 2020 in an amount of approximately 20% of the net income generated in the previous fiscal year, with the exact amount to be determined by our directors based on our financial performance and cash position prior to the distribution. On February 16, 2023, our board of directors approved an amendment to change the annual cash dividend to a fixed amount of at least RMB500.0 million between 2022 and
58
2026. The exact amount of the annual cash dividend will be determined by our board of directors based on our financial performance and cash position prior to the distribution, and is expected to be adjusted upward each year.
Despite a regular dividend policy being in place, before any dividend is declared and paid for any given year, we need to have enough profits to justify such declaration and payment, or we need to have sufficient reserves set aside from profits previously generated that our board of directors determines are no longer needed. In addition, we must be able to pay our debts as they fall due in the ordinary course of business immediately following the dividend payment. We cannot assure you that we will be able to meet all of such conditions to enable dividend declaration and payment in compliance with laws. Even if our board of directors decides to declare and pay dividends, the timing and amount of future dividends, if any, will depend on, among other things, our future results of operations and cash flow, our capital requirements and surplus, the amount of distributions, if any, received by us from our subsidiaries, our financial condition, contractual restrictions and other factors deemed relevant by our board of directors. Therefore, the amount of dividends that you may receive is uncertain and subject to change.
Furthermore, our regular dividend policy is subject to change at any time at the discretion of our board of directors, and there can be no assurance that we will not adjust or terminate our dividend policy in the future. Accordingly, you should not rely on your investment in our ADSs and/or ordinary shares as a source for any future dividend income and the future return on your investment in our ADSs and/or ordinary shares will likely depend entirely upon any future price appreciation of our ADSs and/or ordinary shares. There is no guarantee that our ADSs and/or ordinary shares will appreciate in value or even maintain the price at which you purchased the ADSs and/or ordinary shares. You may not realize a return on your investment in our ADSs and/or ordinary shares and you may even lose your entire investment in our ADSs and/or ordinary shares.
Substantial future sales or perceived potential sales of our shares could cause the price of our ADSs and/or ordinary shares to decline.
Sales of our ADSs and/or ordinary shares in the public market or through private transactions, or the perception that these sales could occur, could cause the market price of our ADSs and/or ordinary shares to decline. Yun Chen owned 45.6% of our total outstanding shares as of March 31, 2023. In addition to unregistered sale, it can also dispose of these shares through registered transaction as it has the right to cause us to register under the Securities Act the sale of its shares. Sales of these shares, or the perception that such sales could occur, could cause the price of our ADSs and/or ordinary shares to decline. Such sales also might make it more difficult for us to sell equity or equity-related securities in the future at a time and price that we deem appropriate. We cannot predict what effect, if any market sales of securities held by our significant shareholders or any other shareholder or the availability of these securities for future sale will have on the market price of our ADSs and/or ordinary shares.
In addition, if we issue additional ordinary shares, through private transactions or in the public markets in the United States, Hong Kong or another jurisdiction, your ownership interests in our company would be diluted and this, in turn, could have a material and adverse effect on the price of our ADSs and/or ordinary shares.
Holders of our ADSs may not have the same voting rights as the holders of our ordinary shares and may not receive voting materials in time to be able to exercise their right to vote.
Except as described in this annual report and in the deposit agreement, holders of our ADSs will not be able to exercise voting rights attaching to the ordinary shares represented by our ADSs on an individual basis. Holders of our ADSs will appoint the depositary or its nominee as their representative to exercise the voting rights attaching to the ordinary shares represented by the ADSs. Upon receipt of their voting instructions, the depositary will vote the underlying ordinary shares in accordance with these instructions.
59
Pursuant to our sixth amended and restated memorandum and articles of association, we may convene a shareholders’ meeting upon 14 calendar days’ notice. If we give timely notice to the depositary under the terms of the deposit agreement (30 business days’ notice), the depositary will notify holders of our ADSs, of the upcoming general meeting and arrange to deliver our voting materials to them. We cannot guarantee that holders of our ADSs will receive the voting materials in time to instruct the depositary to vote the ordinary shares underlying their ADSs, and it is possible that they, or persons who hold their ADSs through brokers, dealers or other third parties, will not have the opportunity to exercise a right to vote. In addition, the depositary and its agents are not responsible for failing to carry out voting instructions or for the manner of carrying out voting instructions. This means that holders of our ADSs may not be able to exercise their right to vote and there may be nothing they can do if the ordinary shares underlying their ADSs are not voted as they requested. In addition, although holders of our ADSs may directly exercise their right to vote by withdrawing the ordinary shares underlying their ADSs and become a registered holder of such shares prior to the record date for the general meeting, they may not receive sufficient advance notice of an upcoming shareholders’ meeting to withdraw the ordinary shares underlying their ADSs to allow them to vote with respect to any specific matter.
The right of our ADS holders to participate in any future rights offerings may be limited, which may cause dilution to their holdings, and they may not receive cash dividends if it is illegal or impractical to make such dividends available to them.
We may from time to time distribute rights to our shareholders, including rights to acquire our securities. However, we cannot make rights available to holders of our ADSs in the United States unless we register both the rights and the securities to which the rights relate under the Securities Act or an exemption from the registration requirements is available. Under the deposit agreement, the depositary will not make rights available to holders of our ADSs unless both the rights and the underlying securities to be distributed to ADS holders are either registered under the Securities Act or exempt from registration under the Securities Act. We are under no obligation to file a registration statement with respect to any such rights or securities or to endeavor to cause such a registration statement to be declared effective and we may not be able to establish a necessary exemption from registration under the Securities Act. Accordingly, holders of our ADSs may be unable to participate in our rights offerings and may experience dilution in their holdings.
The depositary of our ADSs has agreed to pay to holders of our ADSs the cash dividends or other distributions it or the custodian receives on ordinary shares or other deposited securities after deducting its fees and expenses. Holders of our ADSs will receive these distributions in proportion to the number of ordinary shares their ADSs represent. However, the depositary is not responsible if it decides that it is inequitable or impractical to make a distribution available to any holders of ADSs. For example, the depositary may determine that it is not feasible to distribute certain property through the mail. Additionally, the value of certain distributions may be less than the cost of mailing them. In those cases, the depositary may determine not to distribute such property. We have no obligation to register under U.S. securities laws any ADSs, ordinary shares, rights or other securities received through such distributions. We also have no obligation to take any other action to permit the distribution of ADSs, ordinary shares, rights or anything else to holders of ADSs. This means that holders of our ADSs may not receive the distribution we make on our ordinary shares or any value for them if it is illegal or impractical for us to make them available to holders of our ADSs. These restrictions may have a material adverse effect on the value of the ADSs held by them.
Holders of our ADSs may be subject to limitations on the transfer of their ADSs.
Our ADSs are transferable on the books of the depositary. However, the depositary may close its transfer books at any time or from time to time when it deems expedient in connection with the performance of its duties. In addition, the depositary may refuse to deliver, transfer or register transfers of ADSs generally when our books or the books of the depositary are closed, or at any time if we or the depositary deems it advisable to do so because of any requirement of law or of any government or governmental body, or under any provision of the deposit agreement, or for any other reason in accordance with the terms of the deposit agreement.
60
You may face difficulties in protecting your interests, and your ability to protect your rights through the U.S. federal courts or Hong Kong courts may be limited because we are incorporated under Cayman Islands law, we conduct substantially all of our operations in mainland China and most of our directors and officers reside outside the United States and Hong Kong.
We are incorporated in the Cayman Islands and conduct most of our operations in mainland China through our mainland China subsidiaries, the VIEs and their subsidiaries in the mainland China, and majority of our assets are located in the mainland China. We do not and are not, and holders of our ADSs and ordinary shares do not and are not, legally permitted to have any, or more than the permitted percentage of, equity interest in the VIEs as current PRC laws and regulations restrict foreign ownership and investment in, among other areas, the business of providing value-added telecommunications services, including internet content services. As a result, we provide the services that may be subject to such restrictions in the mainland China through the VIEs and their subsidiaries, and we operate our businesses in the mainland China through certain contractual arrangements with the VIEs and their respective shareholders. For more details of these contractual arrangements, see “Item 7. Major Shareholders and Related Party Transactions—B. Related Party Transactions—Contractual Arrangements with the Variable Interest Entities.” Our ADSs and ordinary shares are equity securities of a Cayman Islands holding company rather than equity securities of our subsidiaries and the VIEs. In addition, most of our directors and officers reside in mainland China and a substantial portion of the assets of such directors and officers are located in mainland China. As a result, it may be difficult or impossible for you to bring an action against us or against these individuals in United States or Hong Kong in the event that you believe that your rights have been infringed under the U.S. securities laws, Hong Kong laws or otherwise. Even if you are successful in bringing an action of this kind, the laws of the Cayman Islands and mainland China may render you unable to enforce a judgment against our assets or the assets of our directors and officers.
There is no statutory enforcement in the Cayman Islands of judgments obtained in the Hong Kong courts or federal or state courts of the United States (and the Cayman Islands are not a party to any treaties for the reciprocal enforcement or recognition of such judgments). The courts of the Cayman Islands would recognize and enforce a foreign money judgment of a foreign court of competent jurisdiction without retrial on the merits based on the principle that a judgment of a competent foreign court imposes upon the judgment debtor an obligation to pay the sum for which judgment has been given provided certain conditions are met. For such a foreign judgment to be enforced in the Cayman Islands, such judgment must be final and conclusive and for a liquidated sum, and must not be in respect of taxes or a fine or penalty, inconsistent with a Cayman Islands judgment in respect of the same matter, impeachable on the grounds of fraud or obtained in a manner, and or be of a kind the enforcement of which is, contrary to natural justice or the public policy of the Cayman Islands (awards of punitive or multiple damages may well be held to be contrary to public policy). A Cayman Islands court may stay enforcement proceedings if concurrent proceedings are being brought elsewhere. However, the Cayman Islands courts are unlikely to enforce a judgment obtained from the U.S. or Hong Kong courts under civil liability provisions of the U.S. federal securities law or Hong Kong law if such judgment is determined by the courts of the Cayman Islands to give rise to obligations to make payments that are penal or punitive in nature. Because such a determination has not yet been made by a court of the Cayman Islands, it is uncertain whether such civil liability judgments from U.S. or Hong Kong courts would be enforceable in the Cayman Islands.
The recognition and enforcement of foreign judgments are provided for under the PRC Civil Procedures Law. The courts of mainland China may recognize and enforce foreign judgments in accordance with the requirements of the PRC Civil Procedures Law based either on treaties between mainland China and the country where the judgment is made or on principles of reciprocity between jurisdictions. Mainland China does not have any treaties or other forms of reciprocity with the United States that provide for the reciprocal recognition and enforcement of foreign judgments. In addition, according to the PRC Civil Procedures Law, the courts of mainland China will not enforce a foreign judgment against us or our director and officers if they decide that the judgment violates the basic principles of PRC laws or national sovereignty, security or public interest. As a result, it is uncertain whether and on what basis a court of mainland China would enforce a judgment rendered by a court in the United States.
Our corporate affairs are governed by our memorandum and articles of association, as amended and restated from time to time, and by the Cayman Companies Act, and common law of the Cayman Islands. The rights of shareholders to take legal action against us and our directors and officers, actions by minority shareholders and the fiduciary responsibilities of our directors are to a large extent governed by the common law of the Cayman Islands.
61
The common law of the Cayman Islands is derived in part from comparatively limited judicial precedent in the Cayman Islands as well as from English common law, which provides persuasive, but not binding, authority. The rights of our shareholders and the fiduciary responsibilities of our directors under Cayman Islands law are not as clearly established as they would be under statutes or judicial precedents in the United States. In particular, the Cayman Islands has a less developed body of securities laws than the United States and provides significantly less protection to investors. In addition, Cayman Islands companies may not have standing to initiate a shareholder derivative action in U.S. federal courts or a court of Hong Kong.
As a result, our public shareholders may have more difficulty in protecting their interests through actions against us, our management, our directors or our major shareholders than shareholders of a corporation incorporated in a jurisdiction in the United States or Hong Kong.
Our memorandum and articles of association contain anti-takeover provisions that could adversely affect the rights of holders of our ordinary shares and ADSs and/or ordinary shares.
Our sixth amended and restated memorandum and articles of association contain certain provisions that could limit the ability of others to acquire control of our company, including a provision that grants authority to our board of directors to establish from time to time one or more series of preferred shares without action by our shareholders and to determine, with respect to any series of preferred shares, the terms and rights of that series. Preferred shares could be issued quickly with terms calculated to delay or prevent a change in control of our company or make removal of management more difficult. If our board of directors decides to issue preferred shares, the price of our ADSs and/or ordinary shares may fall and the voting and other rights of the holders of our ADSs and/or ordinary shares may be materially and adversely affected. These provisions could have the effect of depriving our shareholders of the opportunity to sell their shares at a premium over the prevailing market price by discouraging third parties from seeking to obtain control of our company in a tender offer or similar transaction.
We are a foreign private issuer within the meaning of the rules under the Exchange Act, and as such we are exempt from certain provisions applicable to U.S. domestic public companies.
Because we qualify as a foreign private issuer under the Securities Exchange Act of 1934, as amended, or the Exchange Act, we are exempt from certain provisions of the securities rules and regulations in the United States that are applicable to U.S. domestic issuers, including:
We are required to file an annual report on Form 20-F within four months of the end of each fiscal year. We intend to publish our results on a quarterly basis as press releases, distributed pursuant to the rules and regulations of the NYSE. Press releases relating to financial results and material events will also be furnished to the SEC on Form 6-K.
However, the information we are required to file with or furnish to the SEC will be less extensive and less frequent compared to that required to be filed with the SEC by U.S. domestic issuers. As a result, you may not be afforded the same protections or information, which would be made available to you, were you investing in a United States domestic issuer.
62
As a company incorporated in the Cayman Islands, we are permitted to adopt certain home country practices in relation to corporate governance matters that differ significantly from the New York Stock Exchange listing standards.
As a Cayman Islands company listed on the New York Stock Exchange, we are subject to the New York Stock Exchange listing standards. However, New York Stock Exchange rules permit a foreign private issuer like us to follow the corporate governance practices of its home country. Certain corporate governance practices in the Cayman Islands, which is our home country, may differ significantly from the New York Stock Exchange listing standards. Currently, we rely on home country practice in lieu of the New York Stock Exchange listing standard with respect to our corporate governance, including requirements that listed companies have, among other things, a majority of their board members to be independent and have a nominating and corporate governance committee and a compensation committee composed entirely of independent directors. Therefore, our shareholders may be afforded less protection than they would otherwise enjoy if we complied fully with the New York Stock Exchange listing standards.
We incur increased costs as a result of being a public company.
As a public company, we incur significant accounting, legal and other expenses that we did not incur as a private company. The Sarbanes-Oxley Act, including Section 404 therein relating to internal control over financial reporting, as well as rules subsequently implemented by the SEC and the NYSE, have detailed requirements concerning corporate governance practices of public companies. We expect these rules and regulations applicable to public companies to increase our accounting, legal and financial compliance costs and to make certain corporate activities more time-consuming and costly. Our management is required to devote substantial time and attention to our public company reporting obligations and other compliance matters. We evaluate and monitor developments with respect to these rules and regulations, and we cannot predict or estimate the amount of additional costs we may incur or the timing of such costs. We also incur additional costs as a result of the listing of our ordinary shares on the Hong Kong Stock Exchange. Our reporting and other compliance obligations as a public company may place a significant strain on our management, operational and financial resources and systems for the foreseeable future.
The different characteristics of the capital markets in Hong Kong and the U.S. may negatively affect the trading prices of our ADSs and/or ordinary shares.
We are subject to Hong Kong and NYSE listing and regulatory requirements concurrently. The Hong Kong Stock Exchange and NYSE have different trading hours, trading characteristics (including trading volume and liquidity), trading and listing rules, and investor bases (including different levels of retail and institutional participation). As a result of these differences, the trading prices of our ordinary shares and our ADSs may not be the same, even allowing for currency differences. Fluctuations in the price of our ADSs due to circumstances peculiar to the U.S. capital markets could materially and adversely affect the price of our ordinary shares, or vice versa. Certain events having significant negative impact specifically on the U.S. capital markets may result in a decline in the trading price of our ordinary shares notwithstanding that such event may not impact the trading prices of securities listed in Hong Kong generally or to the same extent, or vice versa.
Exchange between our ordinary shares and our ADSs may adversely affect the liquidity and/or trading price of each other.
Subject to compliance with U.S. securities law and the terms of the deposit agreement, holders of our ordinary shares may deposit ordinary shares with the depositary in exchange for the issuance of our ADSs. Any holder of ADSs may also surrender ADSs and withdraw the underlying ordinary shares represented by the ADSs pursuant to the terms of the deposit agreement for trading on the Hong Kong Stock Exchange. In the event that a substantial number of ordinary shares are deposited with the depositary in exchange for ADSs or vice versa, the liquidity and trading price of our ordinary shares on the Hong Kong Stock Exchange and our ADSs on NYSE may be adversely affected.
63
The time required for the exchange between ordinary shares and ADSs might be longer than expected and investors might not be able to settle or effect any sale of their securities during this period, and the exchange of ordinary shares into ADSs involves costs.
There is no direct trading or settlement between NYSE and the Hong Kong Stock Exchange on which our ADSs and our ordinary shares are respectively traded. In addition, the time differences between Hong Kong and New York and unforeseen market circumstances or other factors may delay the deposit of ordinary shares in exchange of ADSs or the withdrawal of ordinary shares represented by the ADSs. Investors will be prevented from settling or effecting the sale of their securities during such periods of delay. In addition, there is no assurance that any exchange of ordinary shares into ADSs (and vice versa) will be completed in accordance with the timelines investors may anticipate.
Furthermore, the depositary for the ADSs is entitled to charge holders fees for various services including for the issuance of ADSs upon deposit of ordinary shares, cancelation of ADSs, distributions of cash dividends or other cash distributions, distributions of ADSs pursuant to share dividends or other free share distributions, distributions of securities other than ADSs and annual service fees. As a result, shareholders who exchange ordinary shares into ADSs, and vice versa, may not achieve the level of economic return the shareholders may anticipate.
An active trading market for our ordinary shares on the Hong Kong Stock Exchange might not develop or be sustained and trading prices of our ordinary shares might fluctuate significantly.
Since the listing of our ordinary shares on the Hong Kong Stock Exchange, we have consistently been an actively-traded company on the Hong Kong Stock Exchange. However, we cannot assure you that an active trading market for our ordinary shares on the Hong Kong Stock Exchange will be sustained. The trading price or liquidity for our ADSs on NYSE might not be indicative of those of our ordinary shares on the Hong Kong Stock Exchange. If an active trading market of our ordinary shares on the Hong Kong Stock Exchange is not sustained, the market price and liquidity of our ordinary shares could be materially and adversely affected.
In 2014, the Hong Kong, Shanghai and Shenzhen Stock Exchanges collaborated to create an inter-exchange trading mechanism called Stock Connect that allows international and mainland Chinese investors to trade eligible equity securities listed in each other’s markets through the trading and clearing facilities of their home exchange. Stock Connect currently covers over 2,000 equity securities trading in the Hong Kong, Shanghai and Shenzhen markets. Stock Connect allows mainland Chinese investors to trade directly in eligible equity securities listed on the Hong Kong Stock Exchange, known as Southbound Trading; without Stock Connect, mainland Chinese investors would not otherwise have a direct and established means of engaging in Southbound Trading. However, it is unclear whether and when the ordinary shares of our company, with a secondary listing in Hong Kong, will be eligible to be traded through Stock Connect, if at all. The ineligibility or any delay of our ordinary shares for trading through Stock Connect will affect mainland Chinese investors’ ability to trade our ordinary shares and therefore may limit the liquidity of the trading of our ordinary shares on the Hong Kong Stock Exchange.
There is uncertainty as to whether Hong Kong stamp duty will apply to the trading or conversion of our ADSs.
In connection with our initial public offering of ordinary shares in Hong Kong, or the Hong Kong IPO, we have established a branch register of members in Hong Kong, or the Hong Kong share register. Our ordinary shares that are traded on the Hong Kong Stock Exchange, including those issued in the Hong Kong IPO and those that may be converted from ADSs, are registered on the Hong Kong share register, and the trading of these ordinary shares on the Hong Kong Stock Exchange will be subject to the Hong Kong stamp duty. To facilitate ADS-ordinary share conversion and trading between NYSE and the Hong Kong Stock Exchange, we also moved a portion of our issued ordinary shares from our register of members maintained in the Cayman Islands to our Hong Kong share register.
Under the Hong Kong Stamp Duty Ordinance, any person who effects any sale or purchase of Hong Kong stock, defined as stock the transfer of which is required to be registered in Hong Kong, is required to pay Hong Kong stamp duty. The stamp duty is currently set at a total rate of 0.26% of the greater of the consideration for, or the value of, shares transferred, with 0.13% payable by each of the buyer and the seller.
64
To the best of our knowledge, Hong Kong stamp duty has not been levied in practice on the trading or conversion of ADSs of companies that are listed in both the United States and Hong Kong and that have maintained all or a portion of their ordinary shares, including ordinary shares underlying ADSs, in their Hong Kong share registers. However, it is unclear whether, as a matter of Hong Kong law, the trading or conversion of ADSs of these dual-listed companies constitutes a sale or purchase of the underlying Hong Kong-registered ordinary shares that is subject to Hong Kong stamp duty. We advise investors to consult their own tax advisors on this matter. If Hong Kong stamp duty is determined by the competent authority to apply to the trading or conversion of our ADSs, the trading price and the value of your investment in our ADSs and/or ordinary shares may be affected.
ITEM4 INFORMATION ON THE COMPANY
We incorporated Autohome Inc. under the laws of the Cayman Islands under its former name, Sequel Limited, in June 2008 and adopted its current name in October 2011. Shortly after our inception, in June 2008, we acquired all of the equity interests of the following entities:
To sharpen our business focus on the automotive industry, we completed a corporate reorganization in 2011 by spinning off our then subsidiaries that were not involved in our core business, after which we have been focusing on serving the automotive industry in China through our autohome.com.cn and che168.com websites.
In October 2013, we acquired Autohome Media Limited through one of our wholly-owned subsidiaries in Hong Kong. Autohome Media Limited had engaged in the advertising business outside the mainland China for more than three years at the time. We completed the migration of our advertising business from our then VIEs to the subsidiaries of Autohome Media Limited in 2015.
In December 2013, we completed our initial public offering of and listed our ADSs on the New York Stock Exchange under the symbol “ATHM.”
On June 22, 2016, Telstra Holdings Pty Limited, or Telstra, our then largest shareholder, completed the sale of approximately 47.4% of our then total issued and outstanding shares to Yun Chen for a consideration of US$1.6 billion. On February 22, 2017, Yun Chen further acquired from Telstra the remaining 6.5% equity interests held by Telstra in us.
In September 2017, we acquired 100% equity interests of Shanghai Tianhe, a company licensed by the CBIRC to engage in insurance brokerage business in the mainland China, through Autohome Information, with a total cash consideration of RMB21.1 million.
In June 2018, we invested in TTP, a company operating an online bidding platform for used automobiles, and we acquired control in TTP in December 2020.
On March 15, 2021, our ordinary shares commenced trading on the Main Board of the Hong Kong Stock Exchange under the stock code “2518.” We raised from our global offering in connection with the listing in Hong Kong approximately HK$4,294.9 million in net proceeds after deducting underwriting commissions, share issuance costs and the offering expenses.
65
Our principal executive offices are located at 18th Floor Tower B, CEC Plaza, 3 Dan Ling Street, Haidian District, Beijing 100080, the People’s Republic of China. Our telephone number at this address is +86 (10) 5985 7001. Our registered office in the Cayman Islands is located at the offices of Maples Corporate Services Limited at PO Box 309, Ugland House, Grand Cayman, KY1-1104, Cayman Islands.
See “Item 5. Operating and Financial Review and Prospects—B. Liquidity and Capital Resources—Material Cash Requirement” for a discussion of our capital expenditures and divestitures.
Overview
We are the leading online destination for automobile consumers in China, ranking first among automotive service platforms in terms of mobile daily active users as of December 31, 2022 according to QuestMobile. Through our three websites, autohome.com.cn, che168.com and ttpai.cn, accessible mainly through PCs, mobile devices, our mobile applications and mini apps, we deliver comprehensive, independent and interactive content and tools to automobile consumers as well as a full suite of services to automakers and dealers across the auto value chain.
We began in 2008 as a content-led vertical media company focusing on media services (“1.0 Media”). In 2016, we launched our “4+1” strategic transformation initiative (“2.0 Platform”), building a platform that covers “auto contents,” “auto transactions,” “auto financing” and “auto lifestyle” to transform and upgrade from a content-led vertical company to a data and technology-driven automotive platform. Since 2018, we have focused on developing a full suite of intelligent products and solutions with artificial intelligence (“AI”), big data and cloud technologies (collectively, “ABC”) to build an integrated ecosystem that connects all participants in the auto industry by providing end-to-end data-driven products and solutions across the value chain (“3.0 Intelligence”). We have been leveraging our “software as a service” (“SaaS”) capabilities together with our core AI, big data, and cloud technologies (“4.0 ABC + SaaS”) to both expand our product and service categories and refine our existing ones, and have upgraded our strategies to further develop the ecosystem around our offerings since 2021 to better serve stakeholders across the auto value chain, including consumers, automakers, dealers and other related eco-partners.
We generate revenues from media services, leads generation services and online marketplace and others.
66
The chart below illustrates our integrated ecosystem, including transaction flows and fund flows within each of our businesses1:
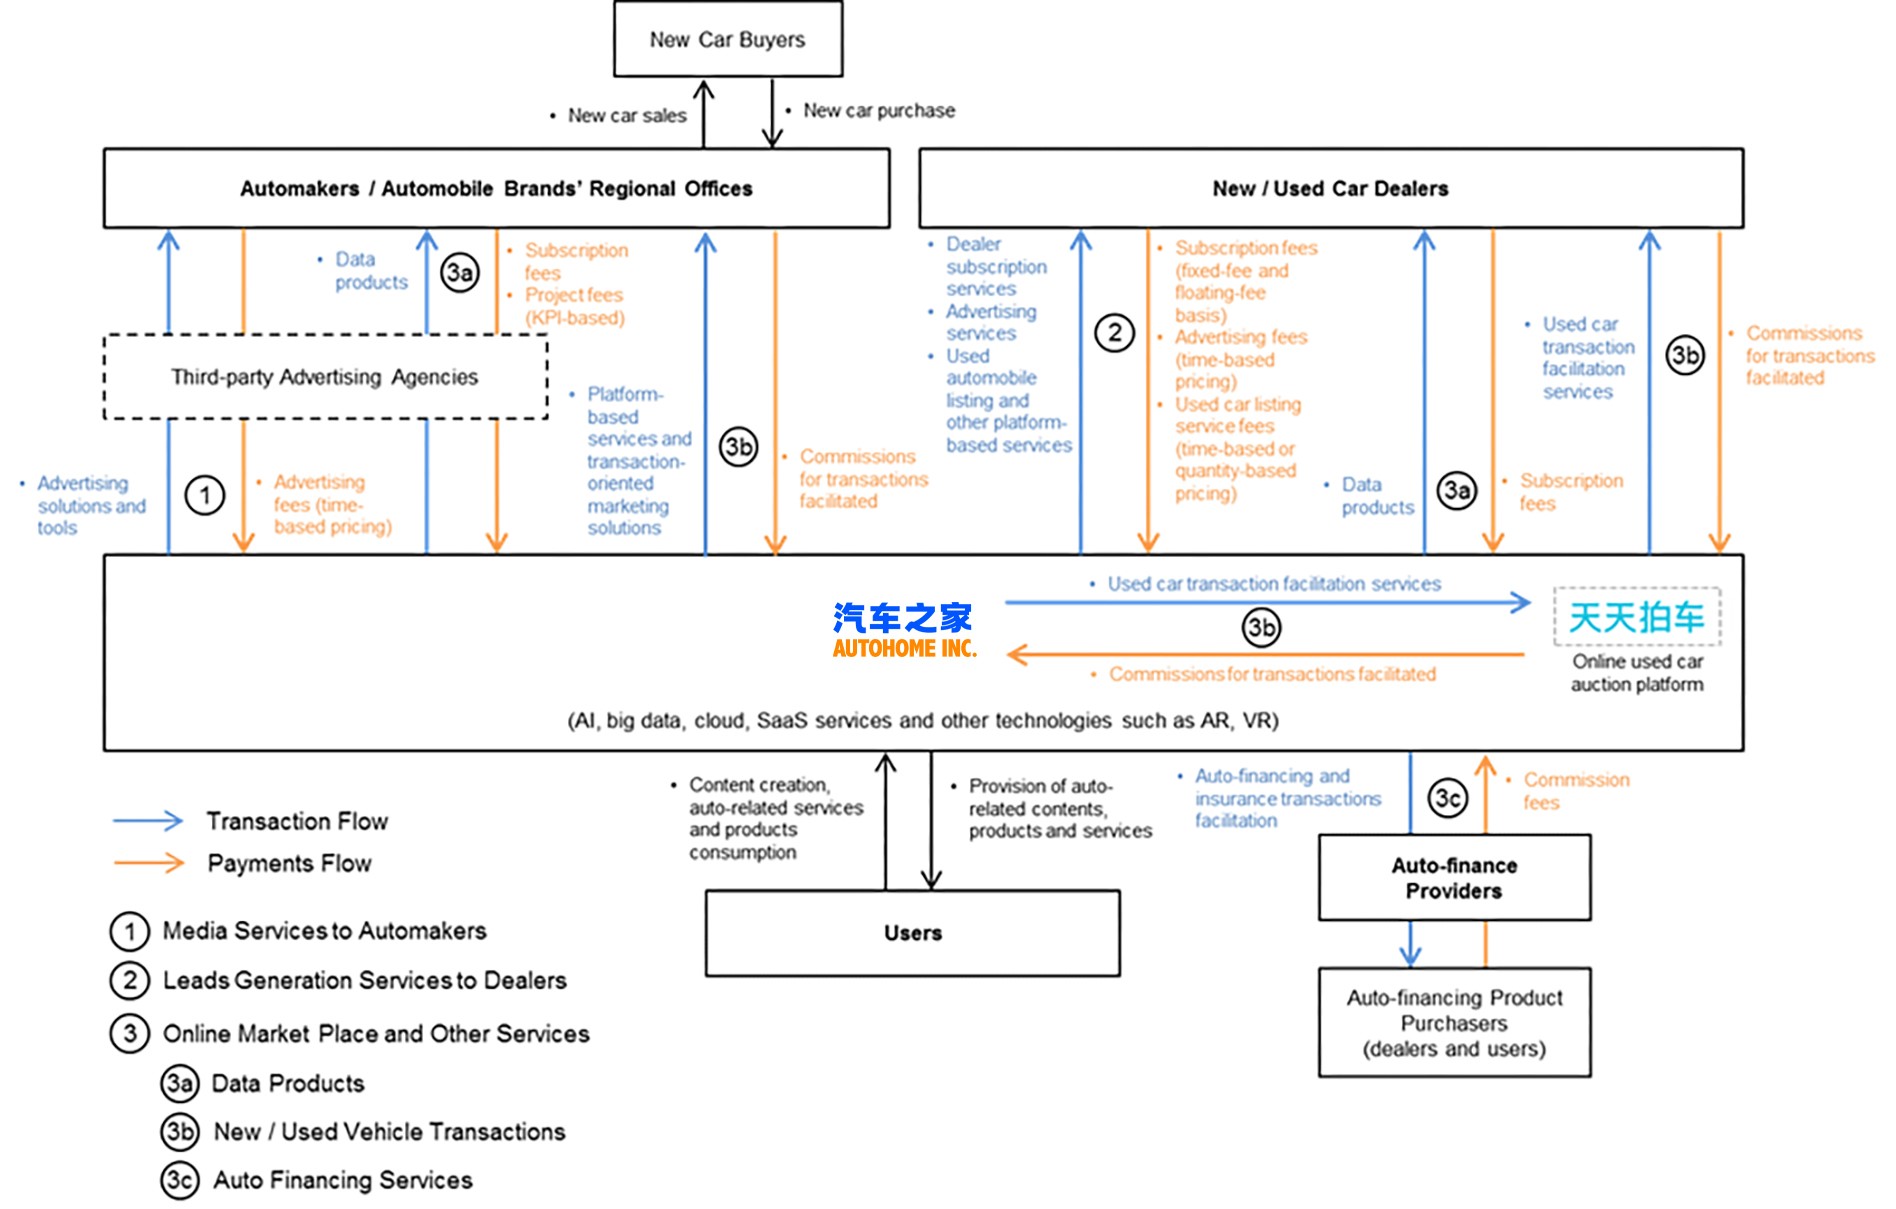
Delivery of Content
We deliver our auto-related content to users mainly through our websites, mobile applications and mini apps, and our interactive online community, all of which are powered by our data and technology capability as well as the extensive accumulated user data. We have access to valuable data of users’ needs, behaviors and patterns in their automotive ownership life cycles, which allows us to accurately and effectively customize content and commercial offerings. Our accurate and comprehensive user profiling enables us to continuously enhance user experience and improve our ability to attract and retain customers.
Our Websites
Our user-centric approach has successfully attracted a growing user base with a steady increase of daily active users to our websites. Our autohome.com.cn website targets a wide spectrum of automobile consumers with a focus on new automobiles and our che168.com and ttpai.cn websites focus on used automobiles.
67
Most of the content on our websites is tagged by vehicle models to facilitate easy user access. We have developed and are continuing to improve our user intelligence engine to analyze user browsing behavior and preferences and prioritize the content that the user is likely to find relevant and interesting. A user who searches for or navigates to a page for a specific vehicle model will be provided with links to relevant content such as vehicle specifications, photos and video clips, reviews, competing vehicle models, and listing and promotional information from local dealers. Users can easily compare competing vehicle models and brands for price and specifications to make informed purchase decisions. In addition, these user behavior data are summarized and analyzed on a regular basis to improve user experience and provide consumer intelligence to our customers.
To provide a superior experience to our users, we label sponsored content as advertisement to maintain objectivity.
Our Mobile Websites and Applications
For mobile users, our content can be accessed mainly on our websites, on our mobile applications and on our mini apps. We have made significant efforts in recent years to optimize the mobile version of our websites to display our content and develop and enhance the functions of our mobile applications to capture a greater number of users that access our services through mobile devices. For example, according to QuestMobile, our mobile daily active users amounted to 42.0 million, 46.8 million and 54.4 million in December 2020, December 2021, and December 2022, respectively. We were among the earliest in our industry in mainland China to introduce both iOS- and Android-based applications to allow users to easily access our content. Users can conveniently enjoy features available on our mobile websites and applications from their mobile devices, such as reading articles, checking vehicle prices and model parameters, viewing pictures, viewing dealer’s information, visiting our Autohome Mall and participating in forum discussions. We also launched a lite version of the Autohome application to attract younger audiences.
Our Content and Tools
The foundation of our platform is a large amount of originally-generated content, professionally-generated content, user-generated content, as well as a comprehensive automobile library and extensive automobile listing and promotional information organized around our automotive information database. Leveraging our content and user data, as well as our technological capabilities, we also offer a series of intelligent tools on our platform to provide our users with a smooth and efficient purchase experience.
Originally-generated Content
Our originally-generated content is created by our dedicated editorial team and includes automobile-related articles and reviews, pricing trends in various local markets, photographs, video clips and live streaming. This content covers topics throughout the automobile ownership life cycle, from automobile research, selection and purchase to ownership and maintenance and to eventual replacement. In 2018, we launched a new channel focusing on new energy vehicles to accommodate the increasing interest and attention of our users on new energy vehicles. Our review writers obtain first-hand experiences by test-driving many newly released vehicle models provided by various automakers. We also have an AH-100 Vehicle Rating System which applies standard criteria to measure a comprehensive set of performance-based features of the vehicles on sale, such as safety, dynamics, fuel consumption, comfortableness and driving experience. Our AH-100 Vehicle Rating System helps automobile consumers make an easier choice when selecting vehicles to purchase. In 2021, we further launched our motorcycle model library and car-in-use model library to expand our content offerings and rolled out Modified Car channel to broaden our user reach. In 2022, we launched our new energy vehicle library to expand our product service and offerings to cater to users’ diverse needs. We were also able to attract more users by leveraging our core IP brands. Our editorial team at our Beijing headquarters and sales offices located in 63 cities throughout mainland China work closely with automakers, dealers and other industry participants to create automobile-related articles. Although automakers may provide us with sample vehicles to test drive, we review all new automobiles independently, based upon our teams’ experience and from our users’ perspective.
68
We follow well-developed guidelines in creating and publishing content with attention to details, such as the angles of photos, image sizes and the time between industry events and the relevant article publication. These practices enable us to streamline our editorial process and quickly and efficiently make national and local content available to our users, while ensuring that we maintain high-quality standards and a consistent user experience.
Professionally-generated Content
In 2016, we launched an open content platform to invite the key opinion leaders and influential bloggers or writers in the automotive field to contribute their high-quality professional review, analysis and insights on automotive-related topics, including vehicle reviews, industry trends, auto photography, maintenance and others. Our diversified professionally-generated contents complement our automotive ecosystem strategy and bring our users enriched and customized content consisting of high-quality articles, photographs, video clips and live streaming. As of December 31, 2022, we had 29,598 professional content contributors on our platform, compared to over 26,950 contributors as of December 31, 2021. Since 2018, we have been expanding our collaboration with automakers, key opinion leaders, professional experts and social media to further upgrade our professionally-generated content ecosystem.
User-generated Content and User Forum
Our platform hosts an open and vibrant community of automobile consumers, from first-time buyers to sophisticated automobile enthusiasts. Our user community centers around our discussion forums, which are organized based on vehicle models, cities and regions, and various topics of interest. Registered users utilize our discussion forums to share a wide range of automotive experiences such as driving experiences and usage and maintenance tips. Users also frequently provide reviews of automobiles or automotive products and services, post questions and receive answers from fellow forum members. We continued to enhance user engagement and participation in the content generation and delivery process. For example, we launched the lite version of the Autohome application to attract younger audiences.
We strive to ensure the credibility, appeal and usefulness of our forums by identifying verified automobile owners and empowering selected registered users as forum moderators. Our verified automobile owners are registered users whose vehicle ownership has been confirmed through various channels. Our forum moderators are generally active registered users with significant forum post counts whom we have identified as being reputable automobile enthusiasts within our online community.
As of December 31, 2020, 2021 and 2022, we had over 135.5 million, over 170.4 million and over 189.5 million registered users, respectively. As our user base has grown and our user engagement and forum activity has increased, our database of user-generated content has expanded, which in turn has attracted more users.
We have taken a series of measures to ensure that there is no inappropriate, illegal or offensive advertising content published on our platform, particularly content contributed by users. We have dedicated advertising content reviewers who review the content posted on our platform and block illegal and inappropriate advertising content by using our sensitive words filter. We give a conspicuous reminder in our user agreement and the content uploading page that users should ensure that the content uploaded is legal and does not violate any third-party rights. Information published by automobile dealers on our platform is accompanied by a warning that the information comes from dealers and its truthfulness, accuracy and lawfulness are the responsibilities of the publishers, not the platform. In addition, we work with relevant government authorities in policing the content on our platform and remove illegal content and provide regular trainings on content monitoring to relevant employees.
As advised by our PRC legal counsel, if we fail to identify or monitor illegal or inappropriate content and limit or eliminate the dissemination or availability of such content on our platform, we may be subject to penalties imposed by the relevant regulatory authorities, including fines, confiscation of advertising income or, in circumstances involving more serious violations by us, the termination of our internet content licenses. In addition, we may be subject to claims by consumers asserting that the information on the websites and mobile applications operated by us is misleading. Please refer to “Item 3. Key Information—D. Risk Factors—We may be subject to liability for advertisements and other content placed on our websites and mobile applications”, “Item 4. Information on the Company—B. Business Overview—PRC Regulation—Regulations on Advertisements” and “Item 4. Information on the Company—B. Business Overview—PRC Regulation—Regulations on Internet Content Services” for details.
69
Automobile Library and Listing
We have one of the most comprehensive automobile libraries within our industry in mainland China with approximately 70,400 vehicle model configurations as of December 31, 2022.
We believe our automobile library covers the substantial majority of passenger vehicle models released in mainland China since 2005. It includes a broad range of specifications covering performance levels, dimensions, powertrains, vehicle bodies, interiors, safety, entertainment systems and other unique features, as well as automakers’ suggested retail prices. The scale of content in our automobile library, which we believe would require significant time, expertise and expense to replicate, makes it a valuable tool for our users in researching both new and used automobiles. Our database also includes a large amount of new and used automobile listings and promotional information. With the comprehensive and continuously updated listing information, users can conveniently search for up-to-date information of vehicle models without having to visit each individual dealer at their local showrooms. In addition, our automotive library contains a significant amount of user-generated content originating from our user forums. Leveraging our innovative AR- and VR-related technologies, we utilize three-dimension technology to restore the actual appearances of vehicles and present stereoscopic 720-degree review of automobiles on our platform. Compared to the traditional two-dimensional picture-based display of automobile appearances, the AR- and VR-based vehicle review functionality on our platform enables users to have a real perception of the specific vehicles they are interested in buying and has greatly enhanced user experience. In 2021, we also launched our motorcycle model library and car-in-use model library to diversify our content offering and in 2022, we launched new energy vehicle library to expand our product service and offerings to cater to users’ diverse needs.
Our Interactive Tools
Leveraging the rich content and user data on our platform and our advanced AI and data technologies, we have developed a portfolio of intelligent tools to facilitate our users’ potential vehicle purchases. For example, AskBob is a smart assistant tool empowered and enhanced by our rich data and unique algorisms and can generate customized purchase reports for users on the basis of each user’s browsing records and other data. Our car model comparison tool allows users to select a number of car models and compare them by a variety of metrics and other information, thus enabling the users to make an informed purchase decision based on extensive and immediately available comparative data. Our “7-step purchase tool” facilitates each step of a user’s purchase process from developing a purchase intent, viewing and choosing cars to visiting a dealer store and picking up the purchased car. The Intelligent Car Finder, on the other hand, is an interactive AI-based tool trained by the rich data we have and can answer a variety of questions from potential purchasers and recommend suitable choices to the users.
Our Services
Media Services to Automakers
Leveraging our large and rapidly growing user base and utilizing the user intelligence data we have collected, we provide our advertisers with a broad range of advertising solutions and tools. Our advertisers under media services are comprised primarily of automakers and automobile brands’ regional offices. The majority of our online advertising service contracts involve multiple deliverables or performance obligations presented on PC and mobile platforms and in different formats, such as banner advertisements, links and logos, other media insertions and promotional activities that are delivered over different periods of time. As millions of consumers visit our platform for automotive information, we have become an increasingly important medium for automakers and automobile brands’ regional offices to conduct their advertising and marketing campaigns.
Automakers typically utilize our advertising services for brand promotion, new model releases and sales promotions. We believe we are well-positioned to provide solutions to meet all of these needs. Our large and growing automobile purchase- and ownership-oriented user base provides a broad reach for automakers’ marketing messages. Our automotive content delivery and advertisement management platform allows us to segment our user base in a number of different dimensions, including by users’ geographical locations and specific automotive interests, and enables us to place advertisements with targeted audiences likely to be receptive to particular advertising messages.
70
Leveraging our large user base and extensive forum posting data, we provide automakers with more reliable and timely business insights than traditional customer surveys or other post-sales feedback channels. For instance, we analyze user posts in our forums to evaluate consumer behavioral and preference response. In addition, we organize various types of offline national or local events for our automaker customers through our online marketing campaigns and user forum activities to complement our advertising services. For example, we help automakers increase their brand awareness and execute sales promotions by organizing large-scale test driving activities and for specific vehicle models in multiple cities across mainland China. Users can conveniently participate and interact with automaker representatives through our forums.
In each of 2020, 2021 and 2022, 92, 91 and 100 automakers operating in mainland China, which include independent Chinese automakers, joint ventures between Chinese and international automakers and international automakers that sell their cars made outside of mainland China, purchased media services from us, respectively. As is customary in mainland China, we sell our advertising services and solutions primarily through third-party advertising agencies that represent the automakers and automobile brands’ regional offices. We typically enter into individual advertising agreements with the third-party advertising agencies. Although we sell our advertising services and solutions to third-party advertising agencies, we consider the automakers and automobile brands’ regional offices, who are the main decision makers as to whether to place advertisements on our websites and mobile applications, to be our end-customers.
As a result, our sales efforts focus primarily on automakers and automobile brands’ regional offices. However, through direct contact between our sales team, advertisers and advertising agencies, we are able to maintain good relationships with existing advertisers and their advertising agencies. The majority of the advertising content on our platform is provided by advertisers or created by advertising agencies or other third parties.
Leads Generation Services to Dealers
Our leads generation services enable our dealer subscribers to create their own online stores, list pricing and promotional information, provide dealer contact information, place advertisements and manage customer relationships to help them reach a broad set of potential customers and effectively market their automobiles to consumers online and ultimately generate sales leads. Our leads generation services also include used car listing services, which provide a user interface that allows potential used car buyers to identify suitable listings and contact the relevant sellers. We provided leads generation services to 24,517, 23,669 and 24,126 dealers in 2020, 2021 and 2022, respectively.
Dealer Subscription Services
We provide subscription services to dealers which allow them to market their inventory and services through our websites and mobile applications, extending the reach of their physical showrooms to potentially millions of internet users in mainland China and generating sales leads for them. Our dealer subscription services are delivered through our dealership information system mainly on a fixed-fee basis, typically for a period of one year. Through the web-based interface of our dealership information system, dealers can create online stores hosted on our websites and mobile applications and upload and manage their automobile inventories, pricing and promotional information. Potential automobile purchasers can interact with our dealer subscribers online or through phone numbers presented on the platform to inquire for more detailed information and schedule test drives. Our dealer subscribers can track all the interactions with their customers originating from our websites and mobile applications, analyze the number of sales leads and assess the effectiveness of their marketing activities.
We continue to develop our dealer subscription services and have begun to implement additional enriched and upgraded services, which we believe will allow us to expand sales leads based on consumer behaviors and preferences and enhance leads conversion and personalized marketing, and further to offer upgraded subscription packages at different price levels.
71
Advertising Services for Individual Dealers
We also offer advertising services for individual dealers to complement our leads generation services. Our dealer customers utilize our advertising services and leverage our large user base to support their sales and marketing activities. In addition to larger brand promotion advertising campaigns organized by the automakers or the group dealers, individual dealers utilize our advertising services to further enhance their visibility in local community, address local market conditions and promote local events. We also facilitate the process and connect our users from online to offline to generate sales leads and transaction for our dealer customers.
Used Automobile Listing and Other Platform-based Services
Our used automobile listing services allow dealers and individuals to market their used automobiles for sale on our websites and mobile applications. Our used automobile listing database has been expanding rapidly.
The che168.com website is a platform primarily focusing on used automobile services and is dedicated to providing features consisting of content, listings and interactive functionality similar to our autohome.com.cn website. We have been continuously developing and enhancing the functions of the used automobile website and application and have begun to provide advertising services, dealer subscription services, generation of sales leads and other platform-based services in selected cities.
Online Marketplace and Other Services
Our online marketplace and other businesses include our data products, our new and used car transaction services and our auto financing business, among others. Our data products leverage our intelligent big data analytics capabilities and massive pool of accumulated user data to provide end-to-end data-driven products and solutions for automakers and dealers across different stages of the value chain. We facilitate new and used vehicles transactions and provide other platform-based services for new and used car buyers and sellers. In September 2022, we launched our first offline experience store – Autohome Energy Space – in Shanghai, providing users with a one-stop car selecting and purchasing experience. We also provide an extensive suite of auto-related services to our users by integrating TTP’s offline vehicle examination, ownership transfer services and other ancillary services with our online services. Through our auto financing business, we provide services to our cooperative financial institutions that involve facilitating the sale of their loans and insurance products to consumers and used automobile sellers.
Data Products
We have been leveraging our AI, big data, cloud capabilities and other technologies to continue developing and providing to automakers and dealers innovative data products from the end of 2017 and have successfully advanced our data and intelligent recommendation and reinforced our entire ecosystem by providing highly differentiated value and data-driven end-to-end SaaS based solutions to our customers. The data products and solutions we offer to automakers and dealers on our platform primarily consist of (i) Intelligent R&D, Intelligent New Car Launch, Intelligent Activities, analytical tools and customized data reports prepared based on our big data and multi-dimensional analyzes on user reviews, purchasing interest and preferences, geographical competitive advantages of the relevant automakers and dealers and their geographical distribution strategies, and (ii) Intelligent Showroom, Smart DCC, Smart Sales, Smart Aftersales, Smart Call-Out, Smart Assistant, Compass and Smart Quality Control. Our Intelligent New Car Launch product generates large user attention with comprehensive launch plans based on big data, informing automakers of when and where to launch new products, what groups of potential buyers to target, what competition and selling points strategies to adopt, and what creative content to use in the launch. Post-launch, automakers continue to benefit from our Intelligent Activities services in maintaining a high level of market enthusiasm in the newly launched products and other mature products. The Intelligent Showroom, which is an intelligent and scenario-based marketing platform, integrates the technologies of AR, VR, big data and voice recognition to achieve the functions of panoramic car shopping, smart push notifications and smart shopping guide. On this premise, we have further launched a series of additional digital technology products for automakers from the end of 2021 and developed five series of data tools through 2022. Going forward, we will continue to enrich our data product portfolio to cover the data needs of the entire automobile ownership life cycle.
72
Used Vehicles Transactions
After the acquisition of TTP, we continuously enhance our strategic synergy and integration with TTP. Our transaction platform for used vehicles functions as a transaction system, which connects automobile buyers and used automobile sellers and facilitates their vehicle transactions on our platform through providing a wide range of auto related services, such as online bidding services, auto financing products and valuation tools. The used vehicle transaction platform has improved the under- served used automobile market and addressed problems such as lack of sourcing, traffic and consumer confidence, and has fostered business-to-consumer purchasing experiences for our consumers. We also provide comprehensive auto-related services to our users by integrating TTP’s offline vehicle examination, ownership transfer services and other ancillary services with our online-based services.
New Vehicles Transactions
In 2014, we launched Autohome Mall, an online transaction platform. Autohome Mall is a broad online transaction platform for users to review automotive-related information, purchase coupons offered by automakers for discounts and make purchases to complete the transaction. We primarily generate revenues by providing platform-based services and transaction-oriented marketing solutions and collecting commissions for transactions facilitated by our platform, for new vehicle transactions.
Auto Financing Services
Since 2017, with the collaboration and integration of our business with Ping An Group, we have been developing our auto financing business to address the under-served auto financing market in mainland China by providing comprehensive online-based financial services. We gradually shifted our focus from leads generation to transaction facilitation and promote successful transactions with targeted and diversified auto financial services. Based on users’ preferences and our big data analysis, we recommend a broad range of loans and insurance products offered by our cooperative financial institutions to our users that have auto financing needs and match them to facilitate transactions as an insurance brokerage service provider with the relevant license from the CBIRC. We also introduced merchant loans offered by our cooperative financial institutions to automobile sellers. Through our platform, we plan to enable our users and automobile sellers who are in need of auto financing to easily access various high-quality loans and insurance products and allow our cooperative financial partners to effectively increase the volume of their financing transactions. See “Item 3. Key Information—D. Risk Factors—Risks Related to Our Business and Industry—If we are unable to effectively manage our auto finance business, we may not be able to achieve our expected business growth, our results of operations may be adversely affected and we may be subject to penalties as a result of noncompliance.” We primarily generate revenues from collecting commissions for facilitating transactions of auto-financing and insurance products on our platform.
Our Pricing Policies and Revenue Models
For our media services to automakers, we primarily use a “cost per day” pricing model to price our online advertising services by charging advertisers on a daily basis for an advertisement placed in a given location on our websites and mobile applications. Although we have set up “cost per thousand impressions,” “cost per click” and other performance-based pricing models, the amount generated on the basis of such models is relatively insignificant. For our leads generation services to dealers, we charge different subscription fees based on the version of subscription (tech-version, premium-version etc.), tier of city (first tier, second tier etc.) and length of subscription (semi-yearly, yearly, etc.) for dealer subscription services, and charge for the advertising services to individual dealer advertisers and used car listing services mostly on a “cost per time” basis. We price our data products based on the scope of services provided by each product. For our transactions and auto financing services, we charge commissions on a per sale or lead basis, taking into consideration industry standards and the value of our services. When pricing all our products and services, we consider the price of comparable products or services (if any) in the market as well as our products and services themselves.
73
Technology and Product Development
Our technologies and infrastructure are critical to our success. We follow a user-centric strategy for our system architecture and have developed a robust and scalable technology platform driven by AI, big data and cloud technologies with sufficient flexibility to support our rapid growth.
A key component of our user-centric strategy is our user intelligence engine which we have developed and are continually enhancing. Our user intelligence engine allows us to rapidly gather user intelligence by analyzing large amounts of data from many sources throughout our content production system. We are able to monitor and analyze user behaviors and preferences through their browsing record on our platforms. We can utilize such user intelligence data to personalize user interfaces, associate and understand the relationship of information from different sources and facilitate interactions among users and various elements on our websites and mobile applications. It also helps us recommend suitable products, services and user connections to our users. Through our user intelligence engine, we can engage our users more closely by providing them with relevant content throughout their automotive life cycles. We are also able to provide precision and targeted marketing services to our automakers, dealers and other automotive-related customers so that they can accurately deliver relevant advertisements to targeted users who are more receptive to such marketing information. Leveraging our user intelligence engine and AI, big data and cloud capabilities, we have been able to further enrich our content library with our AI-enabled content generation tool by generating customized content in a timely manner.
We provide automobile consumers trend analysis services for our automaker and dealer customers that help them analyze data in specific demographic markets such as consumer purchasing behavior characteristics and their brand strength in comparison to those of their competitors. We believe the consumer intelligence gathered from our large user base reflects the current automotive market trends in China and provides excellent market insight to our automaker and dealer customers.
We invested heavily in mobile technologies and were among the earliest in our industry in mainland China to introduce a mobile version of our websites and both Apple iOS- and Android-based applications to allow our users to easily access our content. We have built up a team of research and development personnel to focus exclusively on the development and enhancement of our mobile websites and applications and to explore new business models and opportunities through mobile technology. We plan to continue to leverage our mobile technology to enhance the functions and user interfaces of our mobile applications for Apple iOS and Android platforms focusing on convenience, real-time interaction and location-based services.
Leveraging AR- and VR-related technologies, we realized significant technology upgrade in 2017 and launched AR automobile showroom and AR auto show during the year, all of which had enabled us to provide our users with an innovative and superior automobile review experience and thus enhanced our user loyalty. In addition, these technology improvements had strengthened our ability to obtain additional user traffic and expanded our user base. We have been continuing our efforts in expanding our VR product portfolio and utilizing AR- and VR-related technologies to improve the features of our services and commercialize innovative business initiatives. Since the second half of 2017, we have rolled out additional VR products including VR branding showrooms, intelligent automobile showrooms as well as direct visual access to automakers’ factory design and manufacturing process, which improved our user experience by enabling our users to review and comprehend the entire automobile production process. In 2019, we employed our AR and VR technologies in constructing a 360-degree panoramic multi-dimensional online visual scene that creates an offline auto show atmosphere for our 818 Super Auto Show, further carrying forward our pursuit of all round sensory user experience and aiding the creation of an innovative integration of auto show and the internet that helps automakers and dealers better engage with consumers. We plan to continue to make further upgrades and develop new technology to provide more diversified platforms for our users, and to expand the use of AR- and VR-related technologies throughout our ecosystem in order to offer automakers and dealers with more innovative and effective branding and marketing tools and greater exposure to highly targeted potential consumers throughout China. Also, we will continue to develop significant resources to expand the content breadth and depth offered on our platform in order to deliver the best user experience in the market.
74
We had an experienced product development team of 1,332 engineers as of December 31, 2022. Our past innovation has focused on helping users research, select and purchase suitable vehicles through our websites. We plan to develop additional products and services for our mobile applications and media-related technology and enhance our big data analytics capabilities and AR- and VR-related technologies.
Sales and Marketing and User Acquisition
Our nationwide in-house team of sales representatives sells our services to automakers and dealers. As of December 31, 2022, we had 1,453 sales and marketing representatives operating our physical sales office network spanning 58 cities across mainland China and visiting customers in an additional 120 satellite cities. We have a prudent expansion plan and we typically only open new physical sales offices in a city after we have already established a sufficient customer base in the area. In cities where we do not yet have a customer base, we provide sales coverage by telephone. Our Beijing-based telephone sales team provides sales coverage to the cities in which we do not have physical sales offices. Our sales team also provides ongoing customer support to our customers. In the past years, we have successfully expanded our market presence in the first- and second-tier cities in mainland China. We plan to continue to expand our sales and marketing efforts into third- and fourth-tier cities to further capture the opportunities for automobile sales growth in those markets.
Our sales team is equipped with specialized automotive industry knowledge and expertise, understands our customers’ needs and is trained to help them develop their advertising strategies. Salespeople work directly with our advertisers and advertising agencies that represent advertisers. Our sales team also maintains close relationships with our dealer customers by, among other things, providing continuing training, support and ongoing customer service for our dealer subscriptions services and other value-added services. Our sales team for transaction business is in charge of customer services and maintains our relationships with automakers, our dealership partners, and business development personnel.
Compensation for our salespeople includes a base salary and incentives based on the sales revenues they generate. We provide regular in-house and external education and training to our salespeople to help them provide current and prospective customers with information on, and the advantages of using, our services. We believe that our performance-linked compensation structure and career-oriented training help to retain and motivate our salespeople.
We believe brand recognition is important to our ability to attract users. We focus our sales and marketing efforts through search engines, navigation websites and mobile platforms to retain and strengthen our leading position in terms of user reach. For example, we cooperate with application stores and mobile browsers to promote our mobile applications and our websites. We also conduct online marketing events on Autohome Mall and other traditional and social media channels as well as offline promotional campaigns with our partners. For example, we conduct the annual “Singles’ Day” campaign to generate quality sales leads and further facilitate the transactions. Since the fourth quarter of 2017, we have been paying for TV ads on different channels of the China Central Television, the predominant state television broadcaster in mainland China, to reach more audience in the third- or lower-tier cities and towns in mainland China and promote their recognition of our platform as a one-stop destination for selecting and purchasing automobiles and various types of auto-related services. We have also engaged celebrities, primarily athletes, as our brand spokespersons to further promote our brand and stimulate user interest in our platform.
Intellectual Property
Our intellectual property includes trademarks and trademark applications related to our brands and services, software copyrights, trade secrets and other intellectual property rights and licenses. We seek to protect our intellectual property assets and brands through a combination of trademark, patent, copyright and trade secret protection laws in the PRC and other jurisdictions, as well as through confidentiality agreements and other measures.
We hold “汽车之家” and “车之家” (both meaning “auto home” in English), “AUTOHOME®” and “天天拍车” trademarks in mainland China through the VIEs, with each registered under different categories. In addition, as of December 31, 2022, we held 122 pending trademark applications and 591 registered trademarks. As at the same date, we had 97 registered domain names, including our main website domain names, autohome.com.cn,
75
che168.com and ttpai.cn, 474 pending patent applications, and 282 registered patents. We had 804 computer software copyrights as of December 31, 2022.
Competition
With respect to our auto media and leads generation businesses, we face competition from mainland China’s automotive vertical websites and mobile applications, such as BitAuto, Dongchedi, Xcar and PCauto, from the automotive channels of major internet portals, such as Sina and Sohu, and from companies engaged in mobile social media, news, video and live-streaming applications. We may also face competition from online automobile transaction platforms, such as Uxin, Guazi and Renrenche, as we develop our used car transaction business. Our auto finance business faces competition from other auto finance companies, such as Yixin and Souche. In addition, we also face competition from companies engaged in social media business, such as ByteDance and Tencent, companies engaged in data product offering, such as BitAuto and Dongchedi, and companies engaged in AI and big data technologies. We may also face competition from mobile applications of automakers as some automakers are exploring to connect with users directly. Competition will be centered on factors similar to those affecting our current media services and leads generation services, primarily centered on increasing user reach, user engagement and brand recognition, relationships with the suppliers, and attracting and retaining advertisers or customers, among other factors. For our transaction business, as online automobile transaction is a relatively new business model and consumers in mainland China might be accustomed to make automobile purchases with traditional dealerships, we cannot guarantee that the automobile consumers in mainland China will accept such business model. See “Item 3. Key Information—D. Risk Factors—Risks Related to Our Business and Industry—We face significant competition, and if we fail to compete effectively, we may lose market share and our business, prospects and results of operations may be materially and adversely affected.”
Seasonality
Our quarterly revenues and other operating results have fluctuated in the past and may continue to fluctuate depending upon a number of factors, many of which are beyond our control. Our business experiences seasonal variations in association with the demand for automobiles in mainland China. For example, the first quarter of each year generally contributes the lowest portion of our annual net revenues primarily due to a slowdown in business activities around and during the Chinese New Year holiday, which occurs during the period. Consequently, our results of operations may fluctuate from quarter to quarter. As each of our business lines may have different seasonality factors and the mix of our revenue sources may shift from year to year, our past performance may not be indicative of future trends. See also “Item 3. Key Information—D. Risk Factors—Risks Related to Our Business and Industry—Our business is subject to fluctuations, including seasonality, which makes our results of operations difficult to predict and may cause our quarterly results of operations to fall short of expectations.”
Environmental, Social and Governance Initiatives
We published our first ESG report in March 2023. As a leading online destination for automobile consumers in China, we are committed to providing consumers with one-stop services covering the entire car purchase and ownership cycle, including high-quality services on automotive consumption and lifestyle to support the vigorous development of the automotive industry in mainland China. As a market leader, we have the responsibility to lead our industry toward a more sustainable future. To this end, we seek to build sustainability into everything we do. Below is a summary of our 2022 ESG highlights:
Environmental. In 2022, we prepared and released Autohome Carbon Neutrality Report, announced the climate-related goal of “achieving carbon neutrality by 2030”, set the environmental management targets and carried out activities to identify climate change risks.
Social. In 2022, we made donation of RMB1,000,000 to public welfare projects and contributed 160 hours in community service project. 39% of our employees were women. There was no use of child labor or forced labor, and 100% of our employees were covered by mainland China’s social security system. Training courses were delivered to employees in both online and offline formats, with a participation rate of 100% and average training hours exceeding 38.5 hours.
76
Governance. In 2022, 100% of our directors and employee received integrity training. There were no corruption-related lawsuits. We encourage suppliers and related partners to act with honesty, integrity and self-discipline and by law in their business activities with us. In 2022, 100% of our suppliers and business partners signed up the Commitment on Integrity (Anti-Corruption and Anti-Bribery).
The ESG report describes ESG topics that we consider as material to our business, how we manage them, our current performance, our long-term targets, and our strategies to achieving those long-term targets. For more information, please refer to the ESG report, which is accessible via hyperlink in our press release furnished to the SEC as Exhibit 99.1 to our Form 6-K (File No. 001-36222) on March 9, 2023.
Compliance and Legal Proceedings
We may from time to time and in the future be subject to various claims and legal, regulatory and/or administrative proceedings that arise in the ordinary course of our business. There are currently no legal proceedings that, in the opinion of our management, may have a material adverse effect on our business and results of operations.
PRC Regulation
This section summarizes the principal laws and regulations of mainland China relevant to our business and operations.
Regulations on Value-Added Telecommunications Services
On September 25, 2000, the State Council promulgated the Telecommunications Regulations, or the Telecom Regulations, which draw a distinction between “basic telecommunication services” and “value-added telecommunications services.” The Telecommunications Regulations were subsequently revised on July 29, 2014 and on February 6, 2016. On December 28, 2015, the MIIT published the 2015 Catalog, which took effect on March 1, 2016 and was partially revised on June 6, 2019. Under the 2015 Catalog, “value-added telecommunication services” was further classified into two sub-categories and 10 items. Both internet content provision services, or ICP services, and online data processing and transaction processing services are under the second subcategory of value-added telecommunications businesses. Under the Telecom Regulations, commercial operators of value-added telecommunications services must first obtain an operating license from the MIIT or its provincial level counterparts.
On September 25, 2000, the State Council issued the Administrative Measures on Internet Information Services, or the Internet Measures. The measures were subsequently revised on January 8, 2011. According to the Internet Measures, commercial ICP service operators must obtain an ICP license from the relevant government authorities before engaging in any commercial ICP operations within the PRC.
On March 1, 2009, the MIIT promulgated the Administrative Measures on Telecommunications Business Operating License, or the Telecom License Measures, which took effect on April 10, 2009. The measures were subsequently revised on September 1, 2017. The Telecom License Measures set forth the types of licenses required to operate value-added telecommunications services and the qualifications and procedures for obtaining such licenses. For example, an ICP operator providing value-added services in multiple provinces is required to obtain an inter-regional license, whereas an ICP operator providing the same services in one province is required to obtain a local license.
To comply with these PRC laws and regulations, the VIEs hold ICP licenses. Autohome Information also holds a value-added telecommunications license for conducting online data processing and transaction processing services (for e-commerce only).
Restrictions on Foreign Ownership in Value-Added Telecommunications Services
77
According to the FITE Provisions, promulgated by the State Council on December 11, 2001 and amended from time to time, with the latest amendment effective on May 1, 2022, the ultimate foreign equity ownership in a value-added telecommunications service provider must not exceed 50%, unless otherwise stipulated in relevant rules.
On July 13, 2006, the MIIT issued the Notice of the MIIT on Intensifying the Administration of Foreign Investment in Value-added Telecommunications Services. This notice prohibits domestic telecommunication service providers from leasing, transferring or selling telecommunications business operating licenses to any foreign investor in any form, or providing any resources, sites or facilities to any foreign investor for their illegal operation of a telecommunications business in mainland China. According to this notice, either the holder of a value-added telecommunications license or its shareholders must legally own the domain names and trademarks used by such license holders in their provision of value-added telecommunication services. The notice further requires each license holder to have the necessary facilities, including servers, for its approved business operations and to maintain such facilities in the regions covered by its license. In addition, all value-added telecommunication service operators are required to maintain network and internet security in accordance with the standards set forth in relevant regulations of mainland China. If a license holder fails to comply with the requirements in the notice and cure such non-compliance, the MIIT or its local counterparts have the discretion to take measures against such license holders, including revoking their value-added telecommunications licenses.
To comply with these regulations of mainland China, we operate our websites through the VIEs. Each of Autohome Information and Shengtuo Hongyuan is currently 50% owned by Quan Long and 50% owned by Haiyun Lei, both of whom are PRC citizens. Shanghai Jinwu is wholly owned by Weiwei Wang, and Shanghai Jinyou is currently 95% owned by Weiwei Wang and 5% owned by Lan Zhang. Both of Weiwei Wang and Lan Zhang are PRC citizens. Each of the VIEs holds an ICP license.
Regulation on Foreign Investment
On March 15, 2019, the Foreign Investment Law was enacted by the National People’s Congress, which became effective on January 1, 2020 and replaced the trio of the laws regulating foreign investment in mainland China, namely, the Sino-foreign Equity Joint Venture Enterprise Law, the Sino-foreign Cooperative Joint Venture Enterprise Law and the Wholly Foreign-invested Enterprise Law, together with their implementation rules and ancillary regulations. The Foreign Investment Law embodies an expected PRC regulatory trend to rationalize its foreign investment regulatory regime in line with prevailing international practice and the legislative efforts to unify the corporate legal requirements for both foreign and domestic investments.
Unlike its first draft which was published in 2015, the Foreign Investment Law does not specifically expand the definition of “foreign investment” to include entities established through a VIE structure but contains a catch-all provision under the definition of “foreign investment” which includes investments made by foreign investors through means stipulated in laws or administrative regulations or other methods prescribed by the State Council.
Moreover, the Foreign Investment Law establishes a foreign investment information reporting system. Foreign investors or foreign-funded enterprises shall submit the investment information to competent governmental departments for commerce through the enterprise registration system and the enterprise credit information publicity system. The contents and scope of foreign investment information to be reported shall be determined under the principle of necessity. Where foreign-investors or foreign-invested enterprises are found to be non-compliant with these information reporting obligations, competent department for commerce shall order corrections within a specified period; if such corrections are not made in time, a penalty of not less than RMB100,000 yet not more than RMB500,000 shall be imposed. Aside from the reporting system for foreign investment information, the Foreign Investment Law shall also establish a security examination mechanism for foreign investment and conducts security review of foreign investment that affects or may affect national security. The decision made upon the security examination in accordance with the law shall be final. We will be subject to the Foreign Investment Law if our contractual arrangements with the VIEs are defined or regarded as a form of foreign investment in the future.
On December 30, 2019, the MOFCOM and the SAMR jointly promulgated the Measures for Reporting of Information on Foreign Investment, which came into effect on January 1, 2020 and pursuant to which, foreign investors or foreign-invested enterprises shall report investment information when foreign investors carry out investment activities directly or indirectly within mainland China, for example, the establishment of the
78
foreign-invested enterprises, including establishment through purchasing the equities of a domestic enterprise or subscribing to the increased capital of a domestic enterprise, and its subsequent changes are required to submit an initial or change report through the Enterprise Registration System.
Regulations on Internet Content Services
The National People’s Congress has enacted laws with respect to maintaining the security of internet operation and internet content. According to the Internet Measures, violators may be subject to penalties, including criminal sanctions, for internet content that:
In accordance with the Internet Measures, ICP operators are required to monitor their websites. They may not post or disseminate any content that falls within these prohibited categories and must remove any such content from their websites. The PRC government may order ICP operators to suspend their operations, or revoke their ICP licenses if such ICP license holders violate any of the above-mentioned content restrictions.
On February 4, 2015, the CAC promulgated the Administrative Provisions on Account Names of Internet Users, or the Account Names Provisions, which became effective as of March 1, 2015. The Account Name Provisions require all users of internet information service providers to authenticate their real identity information for registration of accounts. Relevant internet information service providers are responsible for the protection of users’ privacy, consistency of user information, such as account names, avatars, the requirements contemplated in the Account Names Provisions, making reports to the competent authorities if the names of institutions or social celebrities are illegally used for or associated with registration of account names, and taking appropriate measures to stop any such violations, such as notifying the user to make corrections within a specified time and suspending or closing accounts in the event of continuing non-compliance.
On August 25, 2017, the CAC promulgated the Administrative Provisions on Internet Follow-up Comment Services and the Administrative Provisions on Internet Forum and Community Services, both of which became effective as of October 1, 2017. As stipulated in the provisions, the internet follow-up comment service providers are imposed on strict primary obligations such as verifying the authenticity of registered users’ identity information, protecting personal information of users and developing system to review follow-up comments on news information prior to the publication. Moreover, the internet forum and community services providers may establish the systems of information review, real-time public information check, emergency response, personal information protection and other information security administration systems. In addition, the service providers should not publish information in violation of laws, regulations and the relevant provisions of the state. The Administrative Provisions on Internet Follow-up Comment Services was later amended by the CAC in November 2022 and took effect on December 15, 2022. The new amendment further clarifies the obligations of the internet follow-up comment service providers, for
79
example, for the users of internet follow-up comment services that release illegal and harmful information, the service providers shall take such measures as warning and reminding, refusing to release, deleting information, restricting account functions, suspending account updating, closing the account and prohibiting re-registration according to law or as agreed and keep the relevant records; for the content producers and business operators of official accounts that fail to fulfil their management obligations, which leads to illegal and harmful information exposed in the follow-up comments, the service providers shall take such measures as warning and reminding, deleting information, suspending the follow-up comment area functions till permanently closing the follow-up comment area, restricting account functions, suspending account updating, closing the account and prohibiting re-registration according to law or as agreed, keep the relevant records and timely report to the cyberspace administrations. The new amendment defines “internet follow-up comment services” as the services of threading text, symbols, expressions, pictures, audio and video and other information provided for the users by the internet websites, applications and other online platforms with a public opinion attribute or social mobilization capability, by way of comments, replies, messages, bullet screens, likes, etc.
On September 7, 2017, the CAC promulgated the Provisions on the Administration of Information Services Provided through Chat Groups on the Internet, or the Chat Groups Provision, and the Administrative Provisions on the Information Services Provided through Public Official Accounts of Internet Users, or the Public Official Accounts Provision, both of which became effective as of October 8, 2017. The Public Official Accounts Provision was subsequently revised on January 22, 2021, and became effective on February 22, 2021. According to the Provisions, the internet service providers are required to verify the authenticity of identity information of their users. In addition, for any violation of laws and regulations by chat groups or public official accounts, service providers should take certain measures such as issuing a warning, suspending publication of the inappropriate information, and closing the chat groups or the public official accounts.
On December 15, 2019, the CAC promulgated the Provisions on Governance of Network Information Content Ecosystem, which became effective as of March 1, 2020 and specifies the content scopes that are encouraged, prohibited, or prevented from producing, reproducing, and publishing. The online information content service platform must fulfill the main responsibility of content management, establish an ecological governance mechanism of the internet information, and improve system for user registration, account management, information publishing review, and emergency response. And the online information content service platform will be punished for violating related laws and regulations. The related legal consequences include suspension of information updates, restrictions on engaging in online information services, restrictions on online behavior, and prohibition of industry access.
On June 27, 2022, the CAC promulgated the Administrative Provisions on the Account Information of Internet Users, which became effective as of August 1, 2022 and sets out guidelines on the account information of Internet users. Specifically, Internet-based information service providers that provide internet users with information release services shall (i) formulate and make public the rules for the management of accounts of Internet users and platform conventions, (ii) enter into service agreements with Internet users, (iii) require the users who apply for registration of accounts for production of information content in the fields of economy, education, medical care and health, justice, etc., to provide relevant materials such as service qualification, professional qualification and professional background, verify the same and add a special mark to the account information (iv) display the home location information of the Internet protocol (IP) addresses of internet users’ accounts within a reasonable scope on the information page of internet users’ accounts so as to facilitate supervision by the public for public interests, and (v) establish a dynamic verification system for account information and a convenient portal for complaints and whistleblowing. Any Internet-based information service provider in violation of the present provisions shall be punished in accordance with relevant laws and administrative regulations.
On September 9, 2022, the Administrative Provisions on Internet Pop-up Push Notification Services was issued by the CAC, MIIT and SAMR, effective from September 30, 2022, which requires that providers of internet pop-up push notification services shall establish and improve management systems such as information content review, ecological governance, data security and personal information protection, and protection of minors.
These laws and regulations apply to the Internet content services we provide through the VIEs and impose responsibilities on the VIEs for monitoring the websites, mobile applications and users, safeguarding the security of the internet as well as maintaining the internet content.
80
Regulations on Internet Privacy and Data Security
In recent years, PRC government authorities have enacted legislation on internet use to protect personal information from any unauthorized disclosure. The PRC law does not prohibit ICP operators from collecting and using personal information from their users with the users’ consent. However, the Internet Measures prohibit an ICP operator from insulting or slandering a third party or infringing the lawful rights and interests of a third party. The regulations further authorize the relevant telecommunications authorities to order ICP operators to rectify unauthorized disclosure. ICP operators are subject to legal liability if the unauthorized disclosure results in damages or losses to users. The PRC government, however, has the power and authority to order ICP operators to turn over personal information if an internet user posts any prohibited content or engages in illegal activities on the internet. On December 29, 2011, the MIIT promulgated the Several Provisions on Regulating the Market Order of Internet Information Services, effective as of March 15, 2012. It stipulates that ICP operators may not, without a user’s consent, collect the user’s information that can be used alone or in combination with other information to identify the user and may not provide any such information to third parties without the user’s prior consent. ICP operators may only collect users’ personal information that is necessary to provide their services and must expressly inform the users of the method, content and purpose of the collection and use of such personal information. In addition, an ICP operator may only use users’ personal information for the stated purposes under the ICP operator’s scope of service. ICP operators are also required to ensure the proper security of users’ personal information, and take immediate remedial measures if users’ personal information is suspected to have been inappropriately disclosed. If the consequences of any such disclosure are expected to be serious, ICP operators must immediately report the incident to the telecommunications regulatory authority and cooperate with the authorities in their investigations.
On December 28, 2012, the SCNPC issued the Decision on Strengthening the Protection of Online Information. Most requirements under this decision relevant to ICP operators are consistent with the requirements already established under the MIIT provisions discussed above, but are often stricter and broader. Under this decision, ICP operators are required to take such technical and other measures necessary to safeguard information against inappropriate disclosure. To further implement this decision and relevant rules, MIIT issued the Regulation of Protection of Telecommunication and Internet User Information on July 16, 2013, which became effective on September 1, 2013.
In August 2015, the SCNPC promulgated the Ninth Amendment to the Criminal Law, which became effective in November 2015 and amended the standards of crime of infringing citizens’ personal information and reinforced the criminal culpability of unlawful collection, transaction, and provision of personal information. It further provides that any internet service provider that fails to fulfill the obligations related to internet information security administration as required by applicable laws and refuses to rectify upon orders will be subject to criminal penalty if such failure (i) causes dissemination of illegal information in large scale; (ii) causes user information leaks resulting in severe consequences; (iii) causes serious loss of evidence for criminal investigations; or (iv) implicates other severe circumstances.
On March 15, 2017, the National People’s Congress of the PRC issued the General Rules of the Civil Law of the People’s Republic of China, which came into effect on October 1, 2017. The General Rules have introduced personal information rights and data protection and provide that personal information of a natural person should be protected by the law. On May 28, 2020, the National People’s Congress of the PRC approved the Civil Code of the PRC, or the Civil Code, which came into effect on January 1, 2021 and abolished the General Rules of the Civil Law of the People’s Republic of China. Pursuant to the Civil Code, the collection, storage, use, process, transmission, provision and processing of personal information should follow the principles of legitimacy, properness and necessity.
The PRC Cyber Security Law, which was promulgated on November 7, 2016 by the SCNPC and came into effect on June 1, 2017, provides that network operators shall meet their cyber security obligations and shall take technical measures and other necessary measures to protect the safety and stability of their networks. Under the PRC Cyber Security Law, network operators are subject to various security protection-related obligations, including: (i) network operators shall comply with certain obligations regarding maintenance of the security of internet systems; (ii) network operators shall verify users’ identities before signing agreements or providing certain services such as information publishing or real-time communication services; (iii) when collecting or using personal information, network operators shall clearly indicate the purposes, methods and scope of the information collection, the use of
81
information collection, and obtain the consent of those from whom the information is collected; (iv) network operators shall strictly preserve the privacy of user information they collect, and establish and maintain systems to protect user privacy; (v) network operators shall strengthen management of information published by users, and when they discover information prohibited by laws and regulations from publication or dissemination, they shall immediately stop dissemination of that information, including taking measures such as deleting the information, preventing the information from spreading, saving relevant records, and reporting to the relevant governmental agencies. In addition, the PRC Cyber Security Law requires that critical information infrastructures operators generally shall store, within the territory of the mainland China, the personal information and important data collected and produced during their operations in the mainland China and their purchase of network products and services that affect or may affect national securities shall be subject to national cybersecurity review. According to the PRC Cyber Security Law, no individual or organization may engage in activities that threaten cybersecurity such as unlawful intrusion into others’ networks, interfering with the normal functions of others’ network and stealing network data, provide programs or tools for such intrusions, interference or stealing, or provide any assistance such as technical support, advertisement, payment or settlement for any other person if the individual or organization is fully aware that such person engages in an activity endangering cybersecurity.
On April 10, 2019, the Cyber Security and Protection Bureau of the Ministry of Public Security, the Beijing Internet Industry Association and the Third Research Institute of the Ministry of Public Security jointly issued Internet Personal Information Security Protection Guidance. The guidance applies to “personal information holders”, which means enterprises that provide services through the internet and organizations or individuals who use a private or internet- disconnected space to control and process personal information. It indicates that in addition to traditional internet companies, companies or individuals in other fields are also subject to its governance for long as they are involved in the control and processing of personal information. The guidance heightened requirements on the collection of personal information by personal information holders. For example, the guidance provides that personal information that is not related to the services provided by personal information holders should not be collected, and service providers shall not force users to provide personal information by bundling products or various business functions of the service.
On November 28, 2019, the Secretary Bureau of the CAC, the General Office of the MIIT, the General Office of the Ministry of Public Security and the General Office of SAMR, issued the Notice on the Measures for the Determination of the Collection and Use of Personal Information by Apps in Violation of Laws and Regulations. The notice requires that there shall be a privacy policy in the app, and the privacy policy shall contain the rules for collecting and using personal information. The notice also requires that the app shall prompt their users to read the privacy policy through obvious methods such as pop-up windows when an app is put into operation for the first time. According to the notice, the type of personal information collected by the app should be limited to the extent necessary to meet the operation of the corresponding business function. If personal information collected through app for a new business function is beyond the scope of a user’s previous consent, refusing to provide the original business function by the app upon the user’s disagreement with the new scope of personal information collection shall be considered as in violation of the necessity principle, except in the case where the new business function replaces the previous business function.
On June 10, 2021, the SCNPC promulgated the PRC Data Security Law, which became effective in September 2021. The PRC Data Security Law provides for data security and privacy obligations on entities and individuals carrying out data activities and introduces a data classification and hierarchical protection system based on the importance of data in economic and social development, as well as the degree of harm it will cause to national security, public interests, or legitimate rights and interests of individuals or organizations when such data is tampered with, destroyed, leaked, or illegally acquired or used. The appropriate level of protection measures is required to be taken for each respective category of data. For example, a processor of important data shall designate the personnel and the management body responsible for data security, carry out risk assessments for its data processing activities and file the risk assessment reports with the competent authorities. In addition, the PRC Data Security Law provides a national security review procedure for those data activities which affect or may affect national security and imposes export restrictions on certain data and information.
82
On July 30, 2021, the State Council promulgated the Regulations on Protection of Critical Information Infrastructure, which became effective on September 1, 2021. Pursuant to the Regulations on Protection of Critical Information Infrastructure, critical information infrastructure shall mean any important network facilities or information systems of the important industry or field such as public communication and information service, energy, transportation, water conservation, finance, public services, e-government affairs and national defense science, which may endanger national security, people’s livelihood and public interest in case of damage, function loss or data leakage. In addition, relevant administration departments of each critical industry and sector, or Protection Departments, shall be responsible to formulate eligibility criteria and determine the critical information infrastructure operator in the respective industry or sector. The operators shall be informed about the final determination as to whether they are categorized as critical information infrastructure operators.
On August 20, 2021, the SCNPC promulgated the Personal Information Protection Law, which came into effect on November 1, 2021. The Personal Information Protection Law integrates the scattered rules with respect to personal information rights and privacy protection. Pursuant to the Personal Information Protection Law, personal information refers to information related to identified or identifiable natural persons which is recorded by electronic or other means (excluding the anonymized information). The Personal Information Protection Law provides the circumstances under which a personal information processor could process personal information, including but not limited to, where the consent of the individual concerned is obtained and where it is necessary for the conclusion or performance of a contract to which the individual is a contractual party. It also stipulates certain specific rules with respect to the obligations of a personal information processor, such as to inform the purpose and method of processing to the individuals, and the obligation of the third party who has access to the personal information by way of co-processing or delegation etc. Processors processing personal information exceeding the threshold to be set by the relevant authorities and critical information infrastructure operators are required to store, within the territory of the mainland China, the personal information collected and produced within the mainland China. Specifically, personal information processors using personal information for automated decision-making shall ensure the transparency of decision-making and the fairness and impartiality of the results, and shall not impose unreasonable differential treatment on individuals in terms of pricing and other transaction conditions. The relevant governmental authorities shall organize assessment on mobile apps’ personal information protection and publicize the outcome. The mobile apps that are identified as not in compliance with personal information protection requirements under such law may be required to suspend or terminate the services and the operators may also be subject to penalties including confiscation of illegal revenues and fines. Furthermore, the Personal Information Protection Law also provides for the rights of natural persons whose personal information is processed, and heightens the protection of the personal information of minors under 14 and sensitive personal information.
On November 14, 2021, the CAC issued the Draft Regulations on Network Data Security, which provide that data processors conducting the following activities shall apply for cybersecurity review: (i) merger, reorganization or separation of Internet platform operators that have acquired a large number of data resources related to national security, economic development or public interests affects or may affect national security; (ii) listing abroad of data processors processing over one million users’ personal information; (iii) listing in Hong Kong which affects or may affect national security; or (iv) other data processing activities that affect or may affect national security.
On December 28, 2021, the CAC, the NDRC, the MIIT, the Ministry of Public Security, the Ministry of National Security, the MOF, the MOFCOM, the People’s Bank of China, the SAMR, NRTA, the CSRC, the National Administration of State Secrets Protection and the State Cryptography Administration jointly released the Cybersecurity Review Measures, which took effect on February 15, 2022. Pursuant to the Cybersecurity Review Measures, network platform operators with personal information of over one million users shall apply with the Cybersecurity Review Office for a cybersecurity review before going to list abroad.
On December 31, 2021, the CAC, the MIIT, the Ministry of Public Security, and the SAMR jointly promulgated the Administrative Provisions on Algorithm Recommendation in Internet Information Services, which came into effect on March 1, 2022. The Administrative Provisions on Algorithm Recommendation in Internet Information Services implements classification and hierarchical management for algorithm recommendation service providers based on various criteria, stipulates that algorithm recommendation service providers shall inform users of their provision of algorithm recommendation services in a conspicuous manner, and publicize the basic principles, purpose intentions, and main operating mechanisms of algorithm recommendation services in an appropriate manner, and that algorithm recommendation service providers selling goods or providing services to consumers
83
shall protect consumers’ rights of fair trade, and are prohibited from carrying out illegal conducts such as unreasonable differential treatment on transaction conditions based on consumers’ preferences, purchasing habits, and such other characteristics.
To comply with these laws and regulations, we require our users to accept a user terms of service whereby they agree to provide certain personal information to us, and have established information security systems to protect users’ privacy. To enhance data security, we have closely evaluated the effectiveness of our data security systems, and our core system has obtained a MLPS Level III certification. We have also built technology systems to protect us from security breach along the cycle of data usage, including data access control, data storage security, data audit and emergency response, among other. In addition, we have established a supervision committee on information security and adopted a complete information security management system in accordance with the requirements of ISO 27001 to enhance holistic management of our data practice.
Regulations on Anti-Monopoly
The Anti-Monopoly Law promulgated by the SCNPC on August 30, 2007, which became effective on August 1, 2008, and the Interim Provisions on the Review of Concentrations of Undertakings promulgated by the SAMR on October 23, 2020, which became effective on December 1, 2020, require that transactions which are deemed concentrations and involve parties with specified turnover thresholds must be cleared by the SAMR before they can be completed. Where the participation in concentration of undertakings by way of foreign-funded merger and acquisition of domestic enterprises or any other method which involves national security, the examination of concentration of undertakings shall be carried out pursuant to the provisions of the Anti-Monopoly Law, and examination of national security shall be carried out pursuant to the relevant provisions of the State. On June 24, 2022, the SCNPC released the final version of the revised Anti-Monopoly Law, which came into effect on August 1, 2022. The revised Anti-Monopoly Law provides, among others, that the market regulation department of the State Council shall be responsible for anti-monopoly law enforcement, and that business operators shall not abuse data, algorithms, technology, capital advantages and platform rules to exclude or limit competition. According to the revised Anti-monopoly Law, where a concentration of undertakings reaches the declaration threshold stipulated by the State Council, a declaration must be approved by the anti-monopoly authority before parties implement the concentration. Concentration refers to (i) a merger of undertakings; (ii) acquiring control over other undertakings by acquiring equities or assets; or (iii) acquisition of control over, or the possibility of exercising decisive influence on, an undertaking by contract or by any other means. If any business operator fails to comply with the mandatory declaration requirement, the anti-monopoly authority is empowered to order the operator to terminate and/or unwind the transaction, dispose of relevant assets, shares or businesses within certain periods and imposes fines of not more than 10% of its sales amount in the previous year; or not more than RMB5,000,000 if the concentration has no effect of eliminating or restricting competition. The revised Anti-monopoly Law also requires relevant government authorities strengthen the examination of concentration of undertakings in important fields such as national economy and people’s livelihood, etc. pursuant to the laws, and enhances penalties for violation of the regulations regarding concentration of undertakings.
On February 7, 2021, the Anti-monopoly Committee of the State Council published the Guideline on Anti-monopoly of Platform Economy Sector, or the Guideline, which became effective on the same day. As a compliance guidance under the existing PRC anti-monopoly laws and regulations for platform economy operators, the Guideline intends to regulate abuse of a dominant position and other anti-competitive practices. Pursuant to the Guideline, representative examples of abuse of dominance include unfairly locking in exclusive agreements with operators on the platform and targeting specific customers with unreasonable big-data driven tailored pricing through their online behavior to eliminate or limit market competition. In addition, the Guideline stipulates that if any concentration of undertakings involves any variable interest entity, such variable interest entity shall fall within the scope of anti-monopoly review. If a concentration of undertakings meets the criteria for declaration as stipulated by the State Council, an operator shall report such concentration of undertakings to the anti-monopoly law enforcement agency under the State Council in advance.
84
Regulations on Advertisements
Advertisers, advertising operators and advertising distributors are required by PRC advertising laws and regulations to ensure that the content of the advertisements they produce or distribute are true and in full compliance with applicable laws and regulations. In addition, where a special government review is required for certain categories of advertisements before publishing, the advertisers, advertising operators and advertising distributors are obligated to confirm that such review has been duly performed and that the relevant approval has been obtained. Violation of these regulations may result in penalties, including fines, confiscation of advertising income, orders to cease dissemination of the advertisements and orders to publish an advertisement correcting the misleading information. In circumstances involving serious violations, the SAMR or its local branches may order the violator to terminate its advertising operation or even revoke its business license. Furthermore, advertisers, advertising operators or advertising distributors may be subject to civil liabilities if they infringe on the legal rights and interests of third parties.
On April 29, 2021, the SCNPC revised the PRC Advertising Law or the Advertising Law, which came into effect on the same date. The Advertising Law applies to all advertising activities conducted via the internet. The Advertising Law requires that users must be able to close online pop-up ads with one click. Moreover, internet service providers are obligated to cease publishing any advertisements that they know or should know are illegal. Violation of these regulations may result in penalties, including fines, confiscation of the advertising incomes, termination of advertising operations and even suspension of the provider’s business license.
On July 4, 2016, the SAIC (the predecessor of the SAMR), issued the Interim Measures for the Administration of Internet Advertising or the Internet Advertising Measures, which came into effect as of September 1, 2016. All advertising activities by means of the internet are governed by the Advertising Law and the Internet Advertising Measures. Pursuant to the Internet Advertising Measures, the term “Internet Advertisement” shall mean commercial advertisement that promotes commodities or services, directly or indirectly, via Internet media such as websites, webpages and internet application programs in the form of texts, pictures, audios, videos or other forms, including the advertisement containing a web link or links, e-mail advertisement, paid search advertisement, and advertisement contained in commercial presentations that promote commodities or services, etc. The Internet Advertising Measures require that an internet advertisement shall be identifiable and clearly identified as an “advertisement” so that users will tell it is an advertisement, and the following activities shall be prohibited: (i) providing or using any application programs or hardware to intercept, filter, cover, fast forward or otherwise restrict any authorized advertisement of other persons; (ii) using network pathways, network equipment or applications to disrupt the normal data transmission of advertisements, alter or block authorized advertisements of other persons or load advertisements without authorization; or (iii) using false statistical data, transmission effect or internet medium value to induce incorrect quotations, seek undue interests or damage the interests of other persons.
On February 25, 2023, the SAMR promulgated the Measures for the Administration of Internet Advertisements, or the Measures for Internet Advertisement Administration, which will take effect on May 1, 2023 and take place of the Internet Advertising Measures. The Measures for Internet Advertisement Administration strengthens the management of, for example, pop-up advertisements, link advertisements and advertorials. The Measures for Internet Advertisement Administration stipulates that the promotion of commodities or services in the form of paid listing on the internet must be conspicuously identified as an advertisement, and it requires advertisers, operators and publishers of internet advertisements containing links to examine the contents in the next level link. Furthermore, the Internet platform operators are obliged to cooperate with advertising monitoring and assist in supervision and provide statistical data.
To comply with these laws and regulations, we include clauses in our advertising contracts requiring that all advertising content provided by advertisers must comply with relevant laws and regulations. Prior to posting on websites and mobile applications, our staff reviews advertising materials to ensure there is no violent, pornographic or any other improper content, and will request the advertiser to provide government approval if the advertisement is subject to special government review.
Regulations on Broadcasting Audio/Video Programs through the Internet
85
On July 6, 2004, the State Administration of Radio, Film, and Television, or the SARFT, promulgated the Rules for the Administration of Broadcasting of Audio/Video Programs through the Internet and Other Information Networks, or the A/V Broadcasting Rules, which were replaced by Provisions on the Administration of Private Network and Targeted Communication Audio-visual Program Services which took effect on June 1, 2016 and was amended on March 23, 2021. For an entity that engages in content delivery, integrated broadcast control, transmission distribution and other private network and targeted communication to send audio-visual program service, an “Internet Audio/Video Program Transmission License” is required.
On April 13, 2005, the State Council announced Several Decisions on Investment by Non-state-owned Companies in Culture-related Business in mainland China. These decisions encourage and support non-state-owned companies to enter certain culture-related business in mainland China, subject to restrictions and prohibitions for investment in audio/video broadcasting, website news and certain other businesses by non-state-owned companies. These decisions authorize the SARFT, the Ministry of Culture and Tourism and the National Press and Publication Administration to adopt detailed implementation rules according to these decisions.
On December 20, 2007, the SARFT and the MIIT jointly issued the Rules for the Administration of Internet Audio and Video Program Services, commonly known as Circular 56, which came into effect as of January 31, 2008 and was amended in August 2015. Circular 56 reiterates the requirement that online audio/video service providers must obtain an “Internet Audio/video Program Transmission License”. Furthermore, Circular 56 requires all online audio/video service providers to be either wholly state-owned or state-controlled companies. According to relevant official answers to press questions published on the SARFT’s website dated February 3, 2008, officials from the SARFT and the MIIT clarified that online audio/video service providers that already had been operating lawfully prior to the issuance of Circular 56 may re-register and continue to operate without becoming state-owned or controlled, provided that such providers have not engaged in any unlawful activities. This exemption will not be granted to online audio/video service providers established after Circular 56 was issued. These policies have been reflected in the application procedure for Internet Audio/video Program Transmission License. Failure to obtain the internet audio/video program transmission license may subject an online audio/video service provider to various penalties, including fines of up to RMB30,000, seizure of related equipment and servers used primarily for such activities and even suspension of its online audio/video services.
On March 17, 2010, the SARFT issued the Internet Audio/Video Program Services Categories (Provisional), or the Provisional Categories, which were amended on March 10, 2017. The amended Provisional Categories classified Internet audio/video programs into four categories, which are further divided into seventeen sub-categories.
To comply with these laws and regulations, Autohome Information obtained an internet audio/video program transmission license, for automotive-industry-information-related audio/video programs posted on our autohome.com.cn website and relevant mobile applications.
Regulations on Producing Audio/Video Programs
On July 19, 2004, the SARFT promulgated the Administrative Measures on the Production and Operation of Radio and Television Programs, effective as of August 20, 2004. On August 28, 2015, State General Administration of Press, Publication, Radio, Film and Television Decree No. 3 was issued to amend some provisions of the aforesaid Measures, which was further revised on by the NRTA on October 29, 2020. These Measures provide that anyone who wishes to produce or operate radio or television programs must first obtain an operating permit. Applicants for this permit must meet several criteria.
Both Autohome Information and Shengtuo Hongyuan hold operating licenses for the production and dissemination of radio and television programs for special topic programs, cartoons and television variety shows.
Regulations on Internet Mapping Services
According to the Administrative Rules on Surveying Qualification, as most recently amended by the Ministry of Natural Resources on June 7, 2021, which became effective on July 1, 2021, an entity providing internet mapping services should apply for the Surveying and Mapping Qualification Certificate for Surveying and Mapping, and
86
perform within the scope of the certificate. According to these rules, certain conditions and requirements, such as the number of technical personnel and map security verification personnel, security facilities and approval from relevant provincial or national government on the service provider’s security system, qualification management and filings management, are necessary for an entity applying for a Surveying and Mapping Qualification Certificate.
Pursuant to the Notice on Further Strengthening the Administration of Internet Map Services Qualification issued by the NASMG in December 2011, any entity that has not yet applied for a surveying qualification certificate for internet mapping services is prohibited from providing any internet mapping services.
On November 26, 2015, the State Council enacted the Administrative Regulations on Maps, or the Maps Regulations, effective as of January 1, 2016. The Maps Regulations requires entities engaging in internet mapping services, such as geographic positioning, the uploading of geographic information or markings, and the development of a public map database, to obtain a relevant qualification certificate for surveying and mapping. The Maps Regulations require entities engaging in online map services to use mapping data approved by the relevant governmental authorities, host servers storing map data within the mainland China, and establish a management system as well as protection measures for the data security of the online maps. The mapping data must not contain any content prohibited by the Maps Regulations, and no entities or individuals are allowed to upload or mark such prohibited content online. Further, entities engaging in internet mapping services shall keep confidential any information involving state secrets and trade secrets acquired during their work.
We have provided maps on our websites and mobile applications for the convenience of our users to locate certain service providers. Both Autohome Information and Shengtuo Hongyuan hold the Surveying and Mapping Qualification Certificates for internet mapping. As of the date of this annual report, the Surveying and Mapping Qualification Certificate for internet mapping held by Autohome Information is in the process of the renewal.
Regulations on Online Cultural Services
On February 17, 2011, the Ministry of Culture, the predecessor of the Ministry of Culture and Tourism, promulgated the Interim Administrative Provisions on Internet Culture, which became effective on April 1, 2011 and was most recently amended in December 2017. The Interim Administrative Provisions on Internet Culture require ICP operators engaged in “internet culture activities” to obtain an Internet Culture Business Permit from the provincial administration of culture. The term “internet culture activities” includes, among other things, online dissemination of internet cultural products (such as audio-video products, gaming products, performances of plays or programs, works of art and cartoons) and the production, reproduction, importation, publication and broadcasting of internet cultural products.
On August 12, 2013, the Ministry of Culture promulgated the Notice on Implementing the Administrative Measures for the Content Self-examination of Internet Culture Business Entities. According to this notice, any cultural product or service shall be reviewed by the provider before being released to the public and the review process shall be done by persons who have obtained the relevant content review certificate.
Autohome Information has obtained an Internet Culture Business Permit in January 2013, and we have renewed our permit to include “internet music entertainments, internet games, internet dramas (programs) and internet performances.” As of the date of this annual report, the Internet Culture Business Permit held by the Autohome Information is in the process of the renewal.
Regulations on Online Performances and Online Live-streaming Services
On December 2, 2016, the Ministry of Culture issued the Administrative Measures for Business Activities of Online Performances, which took effect on January 1, 2017. Under these measures, an operator of online performances conducting the business activities of online performances shall apply for an Internet Culture Business Permit with the competent provincial administrative cultural department, and the business scope indicated on the permit shall clearly include reference to online performances. An operator of online performances undertakes the primary responsibility for the business activities of online performances operated by it, and shall establish a content review and management system, arrange staff with corresponding qualifications to undertake the work of reviewing
87
the performance content, and establish technical supervision measures adaptable to content management in accordance with relevant laws and regulations.
The Provisions on the Administration of Online Live Streaming Services was issued by the CAC on November 4, 2016 and was effective on December 1, 2016. Under the provisions, those who provide online live-streaming services through online performances, internet video and audio programs, and so forth, shall obtain relevant qualifications as required by laws and regulations. Online live streaming service providers shall carry out entity responsibilities, equip professionals comparable to the service scale, and improve systems for information review, information security management, duty patrols, emergency response, and technical guarantee. Online live streaming service providers shall establish platforms for reviewing live streaming content. Online live streaming service providers and online live streaming publishers that provide internet news information services without licenses, or exceeding the scope of their licenses, are subject to punishment. Other violations of these provisions are subject to penalties from the national or local Internet information offices, or even criminal liabilities. Violations of the relevant laws and provisions in providing online live streaming services through Internet performances, online audio and visual programs and so forth are subject to punishment by the relevant departments in accordance with law.
The Notice of Launch of Record Filing for Internet Live-Streaming Service Enterprises was issued by the CAC on July 12, 2017. Under the notice, CAC requires the companies that provide internet live-streaming service to register with the local internet information office, commencing on July 15, 2017. Internet live-streaming service companies (including commercial news mobile applications that provide live-streaming sections/channels) which engage in internet news information republishing services or provide dissemination platform services, and other types of internet live-streaming service companies are subject to such notice and the requirements thereunder.
The Notice on Tightening the Administration of Online Live-streaming Services, or the Online Live-streaming Services Notice, was jointly issued by the CAC and five other PRC governmental authorities August 1, 2018. Under the Online Live-streaming Services Notice, the online live-streaming service provider involved in the business of telecommunications and internet news information, online shows, live-streaming of online audiovisual programs and other services shall apply to the relevant departments for licenses on operations of telecommunications business, internet news information services, internet culture business, and internet audio/video program transmission, respectively. In addition, live streaming services providers are required to file with the local public security authority within 30 days after it commences the service online.
According to the Guiding Opinions on Strengthening the Standardized Administration of Online Live-streaming issued by the CAC, the Office of the National Anti-pornography and Anti-illegal Working Group, the MIIT, the Ministry of Public Security, the Ministry of Culture and Tourism, the SAMR and the NRTA on February 9, 2021, live streaming platforms that carry out business-oriented online performance activities must hold the Internet Culture Business Permit and carry out ICP filing; live streaming platforms that carry out network audio-visual program services must hold the internet audio/video program transmission license (or complete the registration in the national network audio-visual platform information registration management system) and carry out ICP filing; live streaming platforms that carry internet news information service must hold internet news information service license. Live streaming platforms shall file with local cyberspace administration office in a timely manner, and shall cancel its filing immediately after it ceases to provide live streaming services.
Currently we are providing online live-streaming services through our websites and mobile applications. Autohome Information has obtained an internet audio/video program transmission license on February 9, 2010, and we have renewed our permit to include “live audio-video broadcasting service of cultural activities of social organizations, sport events or other activities”. In addition, in January 2013, Autohome Information obtained an Internet Culture Business Permit, which includes “internet music entertainments, internet games, internet dramas (programs) and internet performances.” As of the date of this annual report, the Internet Culture Business Permit held by the Autohome Information is in the process of the renewal.
Regulations on Internet Publishing
The Administrative Provisions on Online Publishing Services, or the Online Publishing Provisions, was jointly issued by the MIIT and the State General Administration of Press, Publication, Radio, Film and Television (the predecessor of the NRTA), or the SAPPRFT, in 2016, and came into effect on March 10, 2016. The Online
88
Publishing Provisions define “online publishing services” as providing online publications to the public through information networks. Any online publishing services provided in the territory of the mainland China are subject to these provisions. The Online Publishing Provisions requires any internet publishing services provider to obtain an online publishing service license to engage in online publishing services. Under the Online Publishing Provisions, online publications refer to digital works which have publishing features such as digital work that have been edited, produced or processed and which are made available to the public through information networks, including written works, pictures, maps, games, cartoons, audio/video reading materials and other methods. Any online game shall obtain approval from SAPPRFT before it is launched online. Furthermore, Sino-foreign equity joint ventures, Sino-foreign cooperative joint ventures and wholly foreign-invested enterprises cannot engage in providing online publishing services.
If we are deemed to be in breach of relevant internet publishing regulations, the PRC regulatory authorities may seize the related equipment and servers used primarily for such activities and confiscate any revenues generated from such activities. In addition, relevant PRC authorities may also impose a fine of five to ten times of any revenues exceeding RMB10,000 or a fine of not more than RMB50,000 if such related revenues are below RMB10,000.
Regulations on Internet News Information Service
On May 2, 2017, the CAC issued the Provisions for the Administration of Internet News Information Services, or Internet News Provision, which became effective on June 1, 2017 and replaced the original provisions promulgated in 2005.
Internet news information services shall include service of collecting, editing and publishing internet news information, service of reposting and service of providing dissemination platform. Under the Internet News Provision, internet news service providers shall also include entities that are not established by the press but reproduce internet news from other sources, provide electronic bulletin services on current and political events, and transmit such information to the public. The CAC shall be in charge of the supervision and administration of the internet news information services throughout mainland China.
If any of the internet news posted on our websites and mobile applications is deemed by the government to be political in nature, related to macroeconomics, or otherwise requires such license based on the sole discretion of the government authority, we would need to apply for such license. If we are deemed to be in breach of the Internet News Provision or other relevant internet news releasing regulations, the PRC regulatory authorities may suspend the related internet service and impose a fine exceeding RMB10,000 but not more than RMB30,000.
Regulations on E-commerce
China’s e-commerce industry is at an early stage of development and there are few PRC laws or regulations specifically regulating the e-commerce industry. Pursuant to the Measures for the Supervision and Administration of Online Trading (which became effective on May 1, 2021 and apply to business activities involving the sale of commodities or provision of services through the Internet and other information networks as well as the supervision and administration thereof by market regulatory departments), online transaction operators shall go through the market entity registration in accordance with the law, except for the circumstances under which registration is not required as specified in Article 10 of the E-Commerce Law. In addition, online transaction operators shall disclose commodity or service information in a comprehensive, truthful, accurate and timely manner, and protect consumers’ right to know and right to choose. Our platform business is subject to these aforementioned measures.
In August 2018, the SCNPC issued the E-commerce Law of the People’s Republic of China, or the E-commerce Law, which took effect on January 1, 2019. The E-commerce Law strengthens the regulation on e-commerce operators relating to consumer protection, personal data protection and intellectual property rights protection. If the goods or services may affect consumers’ life and health, and a platform operator fails to examine the qualifications of the operators on the platform or fails to fulfill the responsibilities of protecting consumers’ safety, it shall take corresponding liabilities and may be subject to warnings and fines up to RMB2,000,000. In accordance with the E-commerce Law, e-commerce operators include (i) platform operators; (ii) operators on platforms; and (iii) other e-commerce operators that sell goods or provide services through self-established websites or channels other than the
89
platforms. A platform operator shall require operators who apply to sell commodities or provide services on its platform to submit truthful information, verify and register such information, establish registration archives, and regularly verify and update the information. Besides, an e-commerce platform operator shall (i) submit the identification information of the operators on its platform to the competent market regulation authorities and remind the operators to complete the registration with such authorities; (ii) submit identification information and tax-related information to tax authorities and remind the operators to complete the tax registration; (iii) record and retain the information of the products and information on its platform and the sales information; (iv) display the platform service agreement and the transaction rules or links to such information on the homepage of the platform; (v) display information to let users know in the case of any products or services that are provided by the platform operator itself, and take responsibility for such products and services; (vi) establish a credit evaluation system, display the credit evaluation rules, provide consumers with accesses to make comments on the products and services provided on its platform, and refrain from deleting such comments; and (vii) establish intellectual property protection rules, and take necessary measures when any intellectual property holder notifies the platform operator that his intellectual property rights have been infringed.
An e-commerce platform operator shall take joint liabilities with the relevant operators on its platform and may be subject to warnings and fines up to RMB2,000,000 where (i) it fails to take necessary measures when it knows or should have known that the products or services provided by an operator on its platform does not comply with the personal or property safety requirements or such operator’s other acts may infringe on the lawful rights and interests of the consumers; or (ii) it fails to take necessary measures, such as deleting and blocking information, disconnecting, terminating transactions and services, when it knows or should have known that an operator on its platform infringes any intellectual property rights of any other third party. An E-commerce platform operator shall not take advantage of the service agreement, transaction rules or other means to impose unreasonable restrictions or transaction conditions on the transactions of operators on its platform or the price of such transactions, or collect unreasonable fees against operators on its platform.
On February 7, 2021, the Anti-monopoly Committee of the State Council published the Guideline on Anti-monopoly of Platform Economy Sector, or the Guideline, which became effective on the same day. As a compliance guidance under the existing PRC anti-monopoly laws and regulations for platform economy operators, the Guideline intends to regulate abuse of a dominant position and other anti-competitive practices. Pursuant to the Guideline, representative examples of abuse of dominance include unfairly locking in exclusive agreements with operators and targeting specific customers with unreasonable big-data driven tailored pricing through their online behavior to eliminate or limit market competition.
Regulations on Mobile Internet Applications
On June 28, 2016, the CAC promulgated the Administrative Provisions on Mobile Internet Applications Information Services, or the Mobile Application Administrative Provisions, which took effect on August 1, 2016. The Mobile Application Administrative Provisions was partially revised on June 14, 2022, and took effect on August 1, 2022. According to the revised Mobile Application Administrative Provisions, “mobile internet applications” refers to application software that run on mobile smart devices providing information services. “Mobile internet application providers” refer to the owners or operators of mobile internet applications. “Application distribution services” refer to the activities of providing application releasing, downloading, dynamic loading and other services through the Internet, including Internet application stores, quick application centers, Internet applet platforms, browser plug-in platforms and other types. The revised Mobile Application Administrative Provisions further emphasizes that mobile internet application providers shall comply with relevant provisions on the scope of necessary personal information when engaging in personal information processing activities. According to the revised Mobile Application Administrative Provisions, mobile internet application providers shall not compel users to agree to unnecessary personal information collection out of any reason, and shall not refuse users to use the apps’ basic functions in the event that such users do not consent to the collection of their personal information beyond necessity. On December 16, 2016, the MIIT promulgated the Interim Administrative Provisions on the Pre-installation and Distribution of the Mobile Smart Terminal Application Software, which took effect on July 1, 2017 and requires, among others, that internet information service providers must ensure that a mobile application, as well as its ancillary resource files, configuration files and user data can be uninstalled by a user easily, unless the mobile application is a basic function software, which refers to a software that supports the normal functioning of the hardware and operating system of a mobile smart device. In addition, mobile smart terminal application software
90
involving charges should strictly comply with the relevant regulations such as sale at an expressly marked price, and express the charge standard and method. The content expressed should be true, accurate, eye-catching and normative, and users should be charged only after their confirmation.
Pursuant to the Mobile Application Administrative Provisions, an internet application program provider must verify a user’s mobile phone number and other identity information under the principle of mandatory real name registration at the back-office end and voluntary real name display at the front-office end. An internet application provider must not enable functions that can collect a user’s geographical location information, access user’s contact list, activate the camera or recorder of the user’s mobile smart device or other functions irrelevant to its services, nor is it allowed to conduct bundle installations of irrelevant application programs, unless it has clearly indicated to the user and obtained the user’s consent on such functions and application programs. In respect of internet application store service providers, the Mobile Application Administrative Provisions requires that, among others, it must file a record with the provincial authority within 30 days after it rolls out the internet application service online. It must also examine the authenticity, security and legality of mobile internet application providers on its platform, establish a system to monitor application providers’ credit and file a record of such information with relevant governmental authorities. If an application provider violates the regulations, the internet application store service provider must take measures to stop the violations, including warning, suspension of release, withdrawal of the application from the platform, keeping a record and reporting the incident to the relevant governmental authorities.
Regulations on Used Automobiles Brokerage Business
On August 29, 2005, the MOFCOM, the Ministry of Public Security, the SAIC, and SAT together promulgated the Measures for the Administration of the Circulation of Used Automobiles, which was amended on 14 September 2017. On November 22, 2005, the MOFCOM further promulgated the Notice on Issues Concerning the Implementation of the Measures for the Administration of the Circulation of Used Automobiles. According to aforesaid regulations, the entity which engages brokerage of used automobiles shall be an enterprise with legal personality and shall go through the registration with the administrative department of industry and commerce. After obtaining the business license from the local branch of SAIC, the used automobile market operators and used automobile brokerage entities shall also file for record with the provincial level branch of the SAIC within two months. “Brokerage of used automobiles” refers to the business activities whereby a brokerage entity of used automobiles, for the purpose of collecting commissions, engages in such business activities as an intermediary, an agent, or a broker to promote other persons’ transaction of used automobiles.
We acquired Shanghai Jinwu in December 2020 and later established Shanghai Jinyou in December 2021, both of which have been filed as an entity conducting used automobiles business in the MOFCOM’s national car circulation information management and application service systems.
Regulations on Insurance Brokerage Business
In April 2015, the SCNPC promulgated the Insurance Law of PRC. In October 2015, the CIRC promulgated the Provisions on the Supervision and Administration of Insurance Brokers, which was replaced by the Provisions on the Regulation of Insurance Brokers, or the Insurance Brokers Provisions, on May 1, 2018. The Insurance Brokers Provisions define insurance brokers as institutions which provide intermediary services, in favor of the insured, in the course of concluding insurance contracts between the insured and the insurance companies and charge certain commission as agreed. Pursuant to the Insurance Law and Insurance Brokers Provisions, a license for engaging in insurance brokerage businesses is required in the course of setting up an insurance brokerage company. The companies which intend to provide insurance brokerage service should meet certain requirements set up by the CIRC and should not conduct insurance brokerage business unless the aforesaid license is received.
On December 7, 2020, the CBIRC published the Regulatory Measures for Internet Insurance Business, which became effective on February 1, 2021. The Regulatory Measures for Internet Insurance Business stipulates that only insurance companies and professional insurance intermediaries established upon approval by insurance regulatory authorities and registered could provide internet insurance services, such as providing insurance products consultation services, assisting policyholders with selecting insurance products, calculating insurance premiums, drafting insurance plans for policyholders and processing insurance application formalities. It also provides that insurance intermediaries are required to manage their marketing activities and retain records of online insurance
91
transactions. In addition, it requires insurance intermediaries that conduct online insurance business to improve IT infrastructure and cybersecurity protection.
In September 2017, we acquired Shanghai Tianhe, a company holding the license for engaging in insurance brokerage businesses. In October 2018, Shanghai Tianhe completed the registration process required for engaging in online insurance business.
Regulations on Auction
Pursuant to the Auction Law of the People’s Republic of China (2015 Amendment), which was promulgated by the SCNPC on July 5, 1996 and last amended on April 24, 2015, and Measures for the Administration of Auctions (2019 Amendment), which was promulgated by the MOFCOM on October 28, 2015 and last amended on November 30, 2019, an enterprise engaging in the bidding and auction of various products as permitted by auction-related laws of the PRC other than cultural relics shall satisfy various criteria, such as having registered capital of at least RMB1 million and at least one qualified auctioneer. To engage in the bidding and auction business, domestic entities shall first be verified and authorized by the municipal counterparts of MOFCOM at the locality, and then obtain auction business permit from the competent provincial counterparts of MOFCOM before launching their auction business. The enterprise engaging in auction business without approval and registration shall be banned by the administrative department for industry and commerce, the illegal gains shall be confiscated and he may also be subject to fines.
Currently, each of Shanghai Jinyou and Shanghai Jinwu holds an auction business approval certificate issued by the Shanghai Municipal Commission of Commerce of the PRC.
Regulations on Intellectual Property Rights
China has adopted legislation governing intellectual property rights, including trademarks, patents and copyrights. China is a signatory to the major international conventions on intellectual property rights and became a member of the Agreement on Trade Related Aspects of Intellectual Property Rights upon its accession to the World Trade Organization in December 2001.
Patent. The SCNPC adopted the Patent Law in 1984, and amended it in 1992, 2000, 2008 and 2020 (the current effective revision became effective on June 1, 2021). The purpose of the Patent Law is to protect lawful interests of patent holders, encourage invention, foster applications of inventions, enhance innovative capabilities and promote the development of science and technology. To be patentable, invention or utility models must meet three conditions: novelty, inventiveness and practical applicability. Patents cannot be granted for scientific discoveries, rules and methods for intellectual activities, methods used to diagnose or treat diseases, animal and plant breeds, substances obtained by means of nuclear transformation or a design which has major marking effect on the patterns or colors of graphic print products or a combination of both patterns and colors. The Patent Office under the China National Intellectual Property Administration is responsible for receiving, examining and approving patent applications. A patent is valid for a term of twenty years in the case of an invention, a term of ten years in the case of utility models and a term of fifteen years in the case of designs. A third-party user must obtain consent or a proper license from the patent owner to use the patent. Otherwise, the use constitutes an infringement of patent rights.
Copyright. The SCNPC adopted the Copyright Law in 1990 and amended it in 2001, 2010 and 2020 (the current effective revision became effective on June 1, 2021), respectively. The Copyright Law, and its related implementation regulations that were promulgated in 2002 and amended in 2013, are the principal laws and regulations governing the copyright related matters.
To address the problem of copyright infringement related to the content posted or transmitted over the internet, the National Copyright Administration and the MIIT jointly promulgated the Measures for Administrative Protection of Internet Copyright on April 29, 2005. This measure became effective on May 30, 2005.
In order to further implement the Computer Software Protection Regulations promulgated by the State Council on December 20, 2001, as amended in 2013, the National Copyright Administration of the PRC issued Computer
92
Software Copyright Registration Procedures on February 20, 2002, which apply to software copyright registration, license contract registration and transfer contract registration.
On December 26, 2009, the SCNPC adopted the Torts Liability Law, which became effective on July 1, 2010 and was abolished by the Civil Code which became effective on January 1, 2021. Pursuant to the Civil Code, both internet users and internet service providers may be liable for the wrongful acts of users who infringe the lawful rights of other parties. If an internet user utilizes internet services to commit a tortious act, the party whose rights are infringed may request the internet service provider to take measures, such as removing or blocking the content, or disabling the links thereto. Failure to take necessary measures after receiving such notice will subject the internet service providers to joint liability for any further damages suffered by the rights holder. Furthermore, if an internet service provider fails to take necessary measures when it knows that an internet user utilizes its internet services to infringe the lawful rights and interests of other parties, it will be held jointly liable with the internet user for damages resulting from the infringement.
Trademark. The PRC Trademark Law, adopted in 1982 and amended in 1993, 2001, 2013 and 2019, protects registered trademarks. The Trademark Office under the China National Intellectual Property Administration handles trademark registrations and grants a term of ten years for registered trademarks. Trademark license agreements must be filed with the Trademark Office for record. We hold “汽车之家” and “车之家” (both meaning “auto home” in English), “AUTOHOME®” and “天天拍车” trademarks in mainland China through the VIEs, with each registered under different categories.
Domain Names. On August 24, 2017, the MIIT promulgated the Administrative Measures for Internet Domain Names, which came into effect on November 1, 2017 and replaced the original measures promulgated in 2004. The measures regulate the registration of domain names, such as the first tier domain name “.cn.” Pursuant to the Implementing Rules on Registration of National Top-level Domain Names promulgated by the China Internet Network Information Center and took into effect on June 18, 2019, the domain name services follow a “first come, first file” principle. Applicants for registration of domain names shall provide their true, accurate and complete information of such domain names to and enter into registration agreements with domain name registration service institutions. The applicants will become the holders of such domain names upon the completion of the registration procedure. We have registered a number of domain names through the VIEs, including autohome.com.cn, autohome.com, che168.com and ttpai.cn.
Regulations on Overseas Offering and Listing
On July 6, 2021, the relevant PRC government authorities issued Opinions on Strictly Cracking Down Illegal Securities Activities in Accordance with the Law. These opinions emphasized the need to strengthen the administration over illegal securities activities and the supervision on overseas listings by China-based companies and proposed to take effective measures, such as promoting the construction of relevant regulatory systems to deal with the risks and incidents faced by China-based overseas-listed companies.
On December 27, 2021, the NDRC and the MOFCOM, jointly issued the Negative List, effective from January 1, 2022. Pursuant to the Negative List, if a domestic company engaging in the prohibited business stipulated in the Negative List seeks an overseas offering and listing, it shall obtain the approval from the competent governmental authorities. Besides, the foreign investors of the company shall not be involved in the company’s operation and management, and their shareholding percentage shall be subject, mutatis mutandis, to the relevant regulations on the domestic securities investments by foreign investors.
On February 17, 2023, the CSRC released the Overseas Listing Trial Measures and five supporting guidelines, which took effect on March 31, 2023. Pursuant to the Overseas Listing Trial Measures, domestic companies that seek to offer or list securities overseas, both directly and indirectly, should fulfill the filing procedure and report relevant information to the CSRC. If a domestic company fails to complete the filing procedure or conceals any material fact or falsifies any major content in its filing documents, such domestic company may be subject to administrative penalties, such as order to rectify, warnings, fines, and its controlling shareholders, actual controllers, the person directly in charge and other directly liable persons may also be subject to administrative penalties, such as warnings and fines.
93
Regulations on Tax
See “Item 5. Operating and Financial Review and Prospects—A. Operating Results—Taxation—Mainland China” and “Item 10. Additional Information—E. Taxation—Mainland China Taxation.”
Regulations on Foreign Exchange
Foreign exchange activities in mainland China are primarily governed by the following regulations:
Under the Exchange Rules, if documents certifying the purposes of the conversion of RMB into foreign currency are submitted to the relevant foreign exchange conversion bank, the RMB will be convertible for current account items, including the distribution of dividends, interest and royalties payments, and trade and service-related foreign exchange transactions. Conversion of RMB for capital account items, such as direct investment, loans, securities investment and repatriation of investment, however, is subject to the approval of, or registration with, SAFE or its local counterpart. Capital investments by mainland China entities outside of mainland China, after obtaining the required approvals of, or making filings with, the relevant approval authorities, such as the MOFCOM and the NDRC, or their local counterparts, are also required to register with SAFE or its local counterpart.
Under the Administration Rules, foreign-invested enterprises may only buy, sell and/or remit foreign currencies at banks authorized to conduct foreign exchange business after providing valid commercial documents and, in the case of capital account item transactions, obtaining approval from or being registered with SAFE or its local counterpart.
94
In utilizing the proceeds we received from our equity offerings, as an offshore holding company with mainland China subsidiaries, we may (a) make additional capital contributions to our mainland China subsidiaries, (b) establish new mainland China subsidiaries and make capital contributions to these new mainland China subsidiaries, (c) make loans to our mainland China subsidiaries or VIEs or (d) acquire offshore entities with business operations in mainland China in offshore transactions. However, such use of proceeds is subject to mainland China regulations.
On March 30, 2015, SAFE issued the Circular on the Reforming of the Management Method of the Settlement of Foreign Currency Capital of Foreign-Invested Enterprises, or SAFE Circular 19, which became effective on June 1, 2015. On June 9, 2016, SAFE issued the Circular on Reforming and Regulating Policies on the Control over Foreign Exchange Settlement of Capital Accounts, or SAFE Circular 16, which revised some provisions of SAFE Circular 19. According to SAFE Circular 19 and SAFE Circular 16, the flow and use of the Renminbi capital converted from registered capital denominated in foreign currency of a foreign-invested company is regulated such that Renminbi capital may not be used for business beyond its business scope or to provide loans to persons other than the foreign-invested company’s affiliates unless otherwise permitted under its business scope. Violations of SAFE Circular 19 or SAFE Circular 16 could result in administrative penalties. Pursuant to both of SAFE Circular 19 and SAFE Circular 16, foreign-invested enterprises may either continue to follow the current payment-based foreign currency settlement system or choose to follow the “conversion-at-will” system for foreign currency settlement. Where a foreign-invested enterprise follows the conversion-at-will system for foreign currency settlement, it may convert part or all of the amount of the foreign currency in its capital account, special account for foreign debt or special account for overseas listing into Renminbi at any time. The converted Renminbi will be kept in a designated account labeled as settled but pending payment, and if the foreign-invested enterprise needs to make payment from such designated account, it still needs to go through the review process with its bank and provide necessary supporting documents. SAFE Circular 19 and SAFE Circular 16, therefore, have substantially lifted the restrictions on the usage by a foreign-invested enterprise of its Renminbi registered capital, foreign debt and repatriated funds raised through overseas listing converted from foreign currencies. According to SAFE Circular 19 and SAFE Circular 16, such Renminbi capital, foreign debt and repatriated funds raised through overseas listing may be used at the discretion of the foreign-invested enterprise and SAFE will eliminate the prior approval requirement and only examine the authenticity of the declared usage afterwards. Nevertheless, it is still not clear whether foreign-invested enterprises like our mainland China subsidiaries are allowed to extend intercompany loans to the VIEs. See “Item 3. Key Information—D. Risk Factor—Risks Related to Our Corporate Structure—PRC regulation of loans to, and direct investment in, mainland China's entities by offshore holding companies and governmental control of currency conversion may restrict or prevent us from using the proceeds of our equity offerings to make loans to our mainland China subsidiaries and the VIEs or to make additional capital contributions to our mainland China subsidiaries, which may materially and adversely affect our liquidity and our ability to fund and expand our business.”
Moreover, on January 26, 2017, SAFE promulgated Circular on Further Advancing the Reform of Foreign Exchange Administration and Improving Examination of Authenticity and Compliance, or the Circular 3. The Circular 3 stipulates several control measures with respect to the outbound remittance of any profit from domestic entities to offshore entities, including (i) under the principle of genuine transaction, banks should review board resolutions, the original version of tax filing records and audited financial statements before wiring the foreign exchange profit distribution of a foreign-invested enterprise exceeding US$50,000; and (ii) domestic entities should hold income to make up previous years’ losses before remitting the profits to offshore entities. Moreover, pursuant to Circular 3, verification on the genuineness and compliance of foreign direct investments in domestic entities has also been tightened.
On October 23, 2019, SAFE issued the Circular Regarding Further Promotion of the Facilitation of Cross-Border Trade and Investment, or the Circular 28, which expressly allows all foreign-invested enterprises to make equity investments in the PRC with their capital funds in accordance with the law. In addition, Circular 28 stipulates that qualified enterprises in certain pilot areas may use their capital income from registered capital, foreign debt and overseas listing, for the purpose of domestic payments without providing authenticity certifications to the relevant banks in advance for those domestic payments.
95
Regulations on Dividend Distribution
The principal regulations governing dividend distributions of wholly foreign-invested enterprises include:
Under these regulations, foreign investors may freely remit into or out of mainland China, in Renminbi or any other foreign currency, their capital contributions, profits, capital gains, income from asset disposal, intellectual property royalties, lawfully acquired compensation, indemnity or liquidation income and so on generated within the territory of mainland China.
Wholly foreign-invested enterprises in the mainland China may pay dividends only out of their accumulated profits as determined in accordance with PRC accounting standards and regulations. In addition, according to PRC Company Law, these wholly foreign-invested enterprises are required to set aside at least 10% of their respective accumulated profits each year, if any, to fund certain statutory reserve funds, until the aggregate amount of such fund reaches 50% of its registered capital.
Regulations on Offshore Investment by Mainland China Residents
On July 4, 2014, SAFE promulgated the Notice on Relevant Issues Concerning Foreign Exchange Control of Domestic Residents’ Overseas Investment and Financing and Roundtrip Investment through Offshore Special Purpose Vehicles, or SAFE Circular No. 37, which replaced the former Notice on Relevant Issues Concerning Foreign Exchange Administration for Domestic Residents to Engage in Financing and Inbound Investment via Overseas Special Purpose Vehicles (generally known as SAFE Circular No. 75) promulgated by SAFE on October 21, 2005.
SAFE Circular No. 37 requires mainland China residents to register with local branches of SAFE in connection with their direct establishment or indirect control of an offshore entity, for the purpose of overseas investment and financing, with such mainland China residents’ legally owned assets or equity interests in domestic enterprises or offshore assets or interests, which is referred to in SAFE Circular No. 37 as a “special purpose vehicle.” SAFE Circular No. 37 further requires amendment to the registration in the event of any significant changes with respect to the special purpose vehicle, such as an increase or decrease of capital contributed by mainland China residents, share transfer or exchange, merger, division or other material events. In the event that a mainland China resident holding interests in a special purpose vehicle fails to complete the required SAFE registration, the mainland China subsidiaries of that special purpose vehicle may be prohibited from making profit distributions to the offshore parent and from carrying out subsequent cross-border foreign exchange activities and the special purpose vehicle may be restricted in its ability to contribute additional capital into its mainland China subsidiaries. Furthermore, failure to comply with the various SAFE registration requirements described above could result in liability under PRC law for evasion of foreign exchange controls.
Pursuant to the Circular on Further Simplifying and Improving the Direct Investment-related Foreign Exchange Administration Policies, or SAFE Circular No. 13, which was promulgated by SAFE on February 13, 2015 and came into effect on June 1, 2015, the administrative approvals of foreign exchange registration for direct domestic investment and direct overseas investment were canceled. In addition, SAFE Circular No. 13 simplified the procedures of registration of foreign exchange by allowing investors to register with local banks with respect to the registration of foreign exchange for direct domestic investment and direct overseas investment.
Should there be any mainland China residents proposed to become our shareholders in the future, they shall register with the competent local branch of SAFE or relevant banks with respect to their investments in our company as required by SAFE Circular No. 37 or SAFE Circular No. 13 and shall update their registration filings with SAFE
96
or relevant banks when there are any changes that should be registered under SAFE Circular No. 37 or SAFE Circular No. 13.
Regulations on Employee Stock Options Plans
In December 2006, the PBOC promulgated the Administrative Measures of Foreign Exchange Matters for Individuals, setting forth the respective requirements for foreign exchange transactions by individuals (both PRC or non-PRC citizens) under either the current account or the capital account. The relevant implementing rules which were issued in January 2007 and further revised in May 2016 by SAFE specified approval requirements for certain capital account transactions, such as a PRC citizen’s participation in employee stock ownership plans or share option plans of an overseas publicly listed company. In February 2012, SAFE promulgated the Stock Option Notice that supersedes the requirements and procedures for the registration of mainland China resident individuals’ participation in stock incentive plans set forth by certain rules promulgated by SAFE in March 2007. The purpose of the Stock Option Notice is to regulate the foreign exchange administration of mainland China resident individuals who participate in employee stock holding plans and share option plans of overseas listed companies.
According to the Stock Option Notice, if a mainland China resident individual participates in any employee stock incentive plan of an overseas listed company, a domestic qualified agent appointed through the mainland China subsidiary of such overseas listed company must, among other things, file, on behalf of such individual, an application with SAFE or its local counterpart to obtain approval for an annual allowance with respect to the purchase of foreign exchange in connection with stock holding or share option exercises. With the approval from SAFE or its local counterpart, the domestic qualified agent shall open a special foreign exchange account at a domestic bank to hold the funds required in connection with the stock purchase or option exercise, any returned principal or profits upon sales of shares, any dividends issued on the stock and any other income or expenditures approved by SAFE or its local counterpart.
Under the Foreign Currency Administration Rules, as amended, the foreign exchange proceeds of domestic entities and individuals can be remitted into mainland China or deposited abroad, subject to the terms and conditions to be issued by SAFE. However, the implementing rules in respect of depositing the foreign exchange proceeds abroad have not been issued by SAFE. The foreign exchange proceeds from the sales of shares can be converted into RMB or transferred to such individuals’ foreign exchange savings account after the proceeds have been remitted back to the special foreign exchange account opened at the domestic bank. If share options are exercised in a cashless exercise, the domestic individuals are required to remit the proceeds to special foreign exchange accounts.
Many issues with respect to the Stock Option Notice require further interpretation. We and our employees working in mainland China who participate in an employee stock incentive plan are subject to the Stock Option Notice as we are an overseas listed company. We have registered with the local counterparts of SAFE for our domestic resident employees who participate in our share incentive plans, as required under the Stock Option Notice and relevant rules. If we or our employees working in mainland China fail to comply with the Stock Option Notice, we and our employees working in mainland China may face sanctions imposed by the PRC foreign exchange authority or any other PRC government authorities, including restrictions on foreign currency conversions and additional capital contribution to our mainland China subsidiaries.
In addition, the MOF and the SAT has issued circulars concerning employee share options. Under these circulars, our employees working in mainland China who exercise share options will be subject to PRC individual income tax. Our mainland China subsidiary has obligations to file documents related to employee share options with relevant tax authorities and withhold the individual income taxes of employees who exercise their share options. If our employees fail to pay and we fail to withhold their income taxes, we may face sanctions imposed by tax authorities or any other PRC government authorities. See “Item 3. Key Information—D. Risk Factors—Risks Related to Doing Business in Mainland China—Failure to comply with PRC regulations regarding the registration requirements for employee share ownership plans or share option plans may subject the PRC plan participants or us to fines and other legal or administrative sanctions.”
Regulation on Employment
Pursuant to the PRC Labor Law and the PRC Labor Contract Law, employers must execute written labor contracts with full-time employees. All employers must compensate their employees with wages equal to at least the local minimum wage standards. All employers are required to establish a system for labor safety and sanitation,
97
strictly abide by state rules and standards and provide employees with workplace safety training. Violations of the PRC Labor Contract Law and the PRC Labor Law may result in the imposition of fines and other administrative liabilities.
In addition, employers in mainland China are obliged to provide employees with welfare schemes covering pension insurance, unemployment insurance, maternity insurance, work-related injury insurance, medical insurance and housing funds.
According to the Social Security Law of the PRC, which was promulgated by the SCNPC on October 28, 2010 and came into effect on July 1, 2011, and was amended on December 29, 2018, and other relevant PRC laws and regulations such as the Interim Regulations on the Collection and Payment of Social Insurance Premiums effective on January 22, 1999 and amended on March 24, 2019, Regulations on Work Injury Insurance implemented on January 1, 2004 and amended on December 20, 2010, Regulations on Unemployment Insurance promulgated on January 22, 1999 and Trial Measures on Employee Maternity Insurance of Enterprises implemented on January 1, 1995, the employer shall contribute to social insurance plans covering basic pensions insurance, basic medical insurance, maternity insurance, employment injury insurance and unemployment insurance. Basic pension, medical and unemployment insurance contributions shall be paid by both employers and employees, while employment injury insurance and maternity insurance contributions shall be paid only by employers, and employers who failed to promptly contribute social security premiums in full amount shall be ordered by the social security premium collection agency to make or supplement contributions within a stipulated period, and shall be subject to a late payment fine computed from the due date at the rate of 0.05% per day; and where payment is not made within the stipulated period, the relevant administrative authorities shall impose a fine ranging from one to three times the amount of the amount in arrears.
According to the Regulations on the Administration of Housing Fund, which was promulgated by the State Council and became effective on April 3, 1999, and was amended on March 23, 2002 and March 23, 2019, enterprises in the mainland China must register with the competent managing center for housing provident funds and upon the examination by such center, these enterprises shall complete procedures for opening an account at the relevant bank for the deposit of employees’ housing provident funds. Enterprises are also required to pay and deposit housing provident funds on behalf of their employees in full and in a timely manner. Employers that violate these regulations and fail to process housing provident fund payments or deposit registrations with the housing provident fund administration center within a designated period are subject to a fine ranging from RMB10,000 to RMB50,000.
Pursuant to the Reform Plan of the State Tax and Local Tax Collection Administration System, which was promulgated by the General Office of the Communist Party of China and the General Office of the State Council of the PRC on July 20, 2018, from January 1, 2019, all the social insurance premiums including the premiums of the basic pension insurance, unemployment insurance, maternity insurance, employment injury insurance and basic medical insurance will be collected by the tax authorities. According to the Notice by the General Office of the State Administration of Taxation on Conducting the Relevant Work Concerning the Collection Administration of Social Insurance Premiums in a Steady, Orderly and Effective Manner promulgated on September 13, 2018 and the Urgent Notice of the General Office of the Ministry of Human Resources and Social Security on Implementing the Spirit of the Executive Meeting of the State Council in Stabilizing the Collection of Social Security Contributions promulgated on September 21, 2018, all the local authorities responsible for the collection of social insurance are strictly forbidden to conduct self-collection of historical unpaid social insurance contributions from enterprises. Notice of the State Administration of Taxation on Implementing Measures on Further Support and Serve the Development of Private Economy promulgated on November 16, 2018 reiterates that tax authorities at all levels may not organize self-collection of arrears of taxpayers including private enterprises in the previous years.
98
Regulations on Concentration in Merger and Acquisition Transactions
In August 2006, six PRC regulatory agencies, including the CSRC, jointly adopted the Provisions Regarding Mergers and Acquisitions of Domestic Enterprises by Foreign Investors, or the M&A Rule, which became effective in September 2006 and was further amended in June 2009. The M&A Rules established procedures and requirements that could make merger and acquisition activities by foreign investors more time-consuming and complex. These rules require, among other things, that the MOFCOM be notified in advance of any change-of-control transaction in which a foreign investor will take control of a mainland China domestic enterprise or a foreign company with substantial mainland China operations, if certain thresholds under the Provisions on Thresholds for Prior Notification of Concentrations of Undertakings issued by the State Council on August 3, 2008 and amended on September 18, 2018 are triggered. This M&A Rule also purports to require, among other things, offshore special purpose vehicles, formed for listing purposes through acquisition of mainland China domestic companies and controlled by mainland China companies or individuals, to obtain the approval from the CSRC prior to publicly listing their securities on an overseas stock exchange.
Complying with these requirements could affect our ability to expand our business or maintain our market share. See “Item 3. Key Information—D. Risk Factors—Risks Related to Doing Business in Mainland China—Certain regulations in the PRC may make it more difficult for us to pursue growth through acquisitions.”
The following diagram illustrates our corporate structure, including our principal subsidiaries and VIEs, as of the date of this annual report:
99
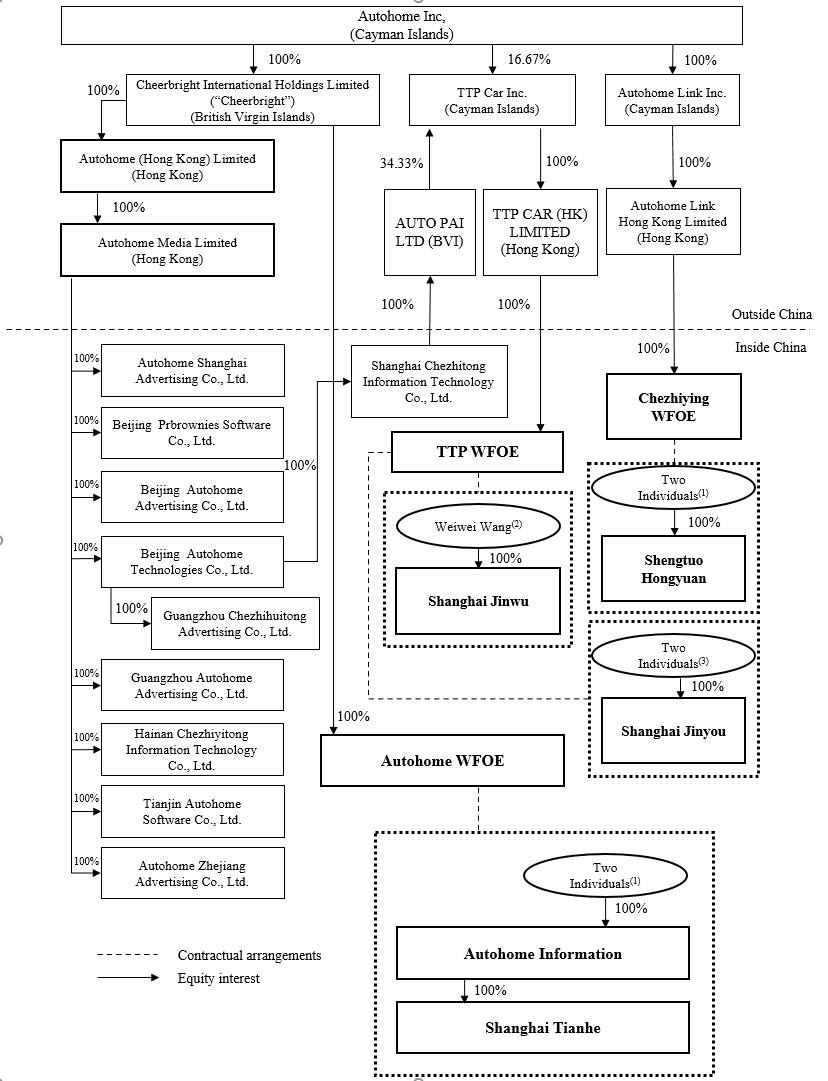
Notes:
100
As of March 31, 2023, Yun Chen owned 45.6% of our total issued and outstanding ordinary shares. Yun Chen is a subsidiary of Ping An Group, which beneficially owned 45.6% of the total voting rights in our company.
Autohome WFOE has entered into a series of contractual agreements with Autohome Information and each of its individual nominee shareholders. The currently effective contractual agreements were entered into in February 2021 by and between Autohome WFOE, Autohome Information, Mr. Quan Long, our chairman of the board of directors and chief executive officer, and Ms. Haiyun Lei. Autohome WFOE has also entered into a series of contractual agreements with Autohome Information and two of its subsidiaries, respectively, namely Autohome Advertising and Chengshi Advertising. Such contractual arrangements allow Autohome WFOE to (i) have power to direct significant activities of Autohome Information and its subsidiaries, (ii) receive substantially all of the economic benefits of Autohome Information and its subsidiaries, and (iii) have an exclusive option to purchase all or part of the equity interests in Autohome Information and its subsidiaries when and to the extent permitted by the PRC laws.
In addition, Chezhiying WFOE has entered into a series of contractual agreements with Shengtuo Hongyuan and each of its individual nominee shareholders. The currently effective contractual agreements were entered into in February 2021 by and between Chezhiying WFOE, Shengtuo Hongyuan, Mr. Quan Long, our chairman of the board of directors and chief executive officer, and Ms. Haiyun Lei. Chezhiying WFOE has also entered into a series of contractual agreements with Shengtuo Hongyuan and its subsidiary, namely Autohome Used Car Appraisal. Such contractual arrangements allow Chezhiying WFOE to (i) have power to direct significant activities of Shengtuo Hongyuan and its subsidiary, (ii) receive substantially all of the economic benefits of Shengtuo Hongyuan and its subsidiary, and (iii) have an exclusive option to purchase all or part of the equity interests in Shengtuo Hongyuan and its subsidiary when and to the extent permitted by the PRC laws.
In December 2020, we acquired TTP which operated an online bidding platform for used automobiles in mainland China primarily through Shanghai Jinwu, which holds an auction business approval certificate and a value-added telecommunications license for engaging in internet information services. In August 2015, TTP WFOE entered into a series of contractual agreements with Shanghai Jinwu and Weiwei Wang, being the individual nominee shareholder of Shanghai Jinwu. In March and May of 2022, TTP WFOE also entered into a series of contractual agreements with Shanghai Jinyou and its individual nominee shareholders, namely Weiwei Wang and Lan Zhang. As of the date of this annual report, the operation of online bidding platform for used automobiles in Shanghai Jinwu is in the process of transferring to Shanghai Jinyou, which also holds an auction business approval certificate and an ICP license for engaging in internet information services. The contractual arrangements of TTP WFOE with Shanghai Jinwu and Shanghai Jinyou, respectively, and their respective shareholder(s) allow TTP to (i) have power to direct significant activities of Shanghai Jinwu and Shanghai Jinyou, (ii) receive substantially all of the economic benefits of Shanghai Jinwu and Shanghai Jinyou, and (iii) have an exclusive option to purchase all or part of the equity interests in Shanghai Jinwu and Shanghai Jinyou when and to the extent permitted by the PRC laws.
For the information regarding our contractual arrangements, please refer to “Item 7. Major Shareholders and Related Party Transactions—B. Related Party Transactions—Contractual Arrangements with the Variable Interest Entities.”
Our corporate headquarters is located in Beijing, China, where we lease office space with an area of approximately 30,123 square meters. We generally make rental payments on a monthly or quarterly basis. In addition, as of December 31, 2022, we also leased office space in 58 cities for our representative offices, including regional operation centers in Shanghai, Guangzhou and Tianjin in China. We believe that our existing facilities are
101
generally adequate to meet our current needs, but we expect to seek additional space as needed to accommodate future growth.
Our servers are primarily hosted at internet data centers owned by major domestic internet data center providers. We believe that our current facilities are adequate and that we will be able to obtain additional facilities, principally through leasing, to accommodate any future expansion plans.
ITEM 4A UNRESOLVED STAFF COMMENTS
None.
ITEM 5 OPERATING AND FINANCIAL REVIEW AND PROSPECTS
You should read the following discussion and analysis of our financial condition and results of operations in conjunction with our consolidated financial statements and the related notes included elsewhere in this annual report. This discussion contains forward-looking statements that involve risks and uncertainties. Our actual results and the timing of selected events could differ materially from those anticipated in these forward-looking statements as a result of various factors, including those set forth under “Risk Factors” and elsewhere in this annual report.
Overview
We are the leading online destination for automobile consumers in mainland China, ranking first among automotive service platforms in terms of mobile daily active users as of December 31, 2022, according to QuestMobile. Through our three websites, autohome.com.cn, che168.com and ttpai.cn, accessible mainly through PCs, mobile devices, our mobile applications and mini apps, we deliver comprehensive, independent and interactive content and tools to automobile consumers as well as a full suite of services to automakers and dealers across the auto value chain.
We generate revenues from media services, leads generation services and online marketplace and others.
102
Our net revenues decreased by 16.4% from RMB8,658.6 million in 2020 to RMB7,237.0 million in 2021, and decreased by 4.1% from RMB7,237.0 million in 2021 to RMB6,940.8 million (US$1,006.3 million) in 2022. Our net income attributable to Autohome Inc. decreased by 31.3% from RMB3,275.7 million in 2020 to RMB2,248.8 million in 2021, and decreased by 17.5% from RMB2,248.8 million in 2021 to RMB1,855.2 million (US$269.0 million) in 2022.
General Factors Affecting Our Results of Operations
Our business and results of operations are significantly affected by mainland China’s overall economic conditions and the general trends in the automotive industry, especially automobile sales in mainland China and the sales and marketing budgets of automakers and dealers. Economic growth in mainland China has contributed to an increase in household disposable income and improved the availability of financing for automobile purchases. New automobile sales in mainland China experienced rapid growth for a sustained period of time until the first decline in annual sales starting in 2018, which trend continued through 2019 and 2020. New automobile sales achieved growth in the first quarter of 2021 primarily due to a low base effect of the first quarter of 2020 during which the COVID-19 pandemic negatively impacted the auto sales, while the decline trend remained throughout the rest of the year of 2021 due to shortage in auto chip supply. With the support of government policies and the ease of the COVID-19 pandemic situation, the automotive industry showed a recovery in 2022. In addition, our business is subject to the overall advertising expenditures by automakers and automobile dealers, the development of online advertising industry in mainland China and the market acceptance of online advertising and promotion. Our results of operations can also be significantly impacted by our ability to minimize costs and maximize efficiency in our operations.
In addition, our business and results of operations may be affected by our user reach, the level of user experience and engagement. Automakers and dealers, which contribute a substantial portion of our revenues, choose to advertise on our websites and mobile applications in significant part because of our leading market position in the online automotive advertising industry and the rich, diverse and customized content on our websites and mobile applications. Also, effective marketing and promotion activities we conduct are critical for us to maintain and enhance our brand recognition and attract more traffic to our platform. We anticipate that our ability to maintain a large user base while delivering superior user engagement and experience will affect our ability to attract new advertisers and dealer subscribers, which will ultimately impact our ability to generate leads and transactions. Finally, our business and results of operations may be affected by the development of e-commerce in mainland China and consumers’ acceptance of online automobile purchases.
Impact of COVID-19 on Our Operations
Our results of operations and financial condition since 2020 were affected by the spread of COVID-19. Going forward, the extent to which COVID-19 impacts our results of operations will depend on the future developments of the outbreak, which are highly uncertain and unpredictable.
Especially during the early stage of the COVID-19 outbreak, the automotive industry in mainland China was negatively impacted, as automobile production and the number of purchasers declined due to precautionary government-imposed closures of certain travel and business, the government’s order to delay resumption of service and mass production and the related quarantine measures. The containment efforts led by the government also caused delay in the near-term marketing demand of our automaker and dealer customers.
The spread of COVID-19 had been substantially controlled in China in late 2020. However, since 2021, there has been a resurgence of COVID-19 cases caused by new variants such as Delta and Omicron in multiple cities in China, as well as across the world. Restrictions had been re-imposed in certain cities to combat such outbreaks and emerging variants of the virus. While substantially all of the restrictions on movement within China had been relaxed as of the date of this annual report, there is great uncertainty as to the future development of the COVID-19 outbreak and its impact on the automotive industry. The extent to which the COVID-19 pandemic impacts us and the Chinese economy as a whole in 2023 and beyond depends on its future developments, which are highly uncertain and unpredictable.
103
As of December 31, 2022, we had cash and cash equivalents and short-term investments of RMB22.08 billion (US$3.20 billion). We believe our liquidity is sufficient for us to successfully navigate an extended period of uncertainty.
Key Income Statement Line Items and Specific Factors Affecting Our Results of Operations
While our business and results of operations are generally affected by the factors detailed above, our results of operations are more directly affected by specific financial factors such as the ones described below.
Net Revenues
We currently generate our net revenues from media services, leads generation services, online marketplace and others.
Media services mainly include automaker advertising services and regional marketing campaigns conducted by certain automobile brands’ regional offices. We sell our advertising services primarily to automakers and dealers through third-party advertising agencies, with automakers contributing a substantial majority of our advertising services revenues. We offer rebates to advertising agencies who represent automakers and automobile dealers that place advertisements on our platform. Our net revenues are presented net of rebates to advertising agencies.
We generate revenues from leads generation services through dealer subscription services, advertising services sold to individual dealer advertisers and used car listing services. We sell our dealer subscription services to automobile dealers mainly on a fixed-fee subscription basis, with fee rates that depend on the length and version of the subscription, and the cities where the automobile dealers are located.
We also generate revenues from online marketplace and others, which consist of data products, new and used vehicle transactions, auto financing and others. For data products, we provide end-to-end data-driven products and solutions for automakers and dealers. For new and used vehicle transactions and auto financing business, we provide services such as transaction facilitation, transaction-oriented marketing solutions, sales leads, loan facilitation and insurance brokerage services. The service fees are recognized when the services are provided, sales leads are delivered or upon the successful of transaction facilitation, or over the service period of data-driven products and solutions by automakers and dealers.
The following table sets forth the principal components of our net revenues in absolute amounts and as percentages of our total net revenues for the years presented:
|
|
For the Year Ended December 31, |
|
|||||||||||||||||||||||||
|
|
2020 |
|
|
2021 |
|
|
2022 |
|
|||||||||||||||||||
|
|
RMB |
|
|
% |
|
|
RMB |
|
|
% |
|
|
RMB |
|
|
US$ |
|
|
% |
|
|||||||
|
|
(in thousands, except percentages) |
|
|||||||||||||||||||||||||
Net revenues: |
|
|
|
|
|
|
|
|
|
|
|
|
|
|
|
|
|
|
|
|
|
|||||||
Media services |
|
|
3,455,056 |
|
|
|
39.9 |
|
|
|
2,011,446 |
|
|
|
27.8 |
|
|
|
1,963,289 |
|
|
|
284,650 |
|
|
|
28.3 |
|
Leads generation services |
|
|
3,198,832 |
|
|
|
36.9 |
|
|
|
2,988,075 |
|
|
|
41.3 |
|
|
|
3,056,924 |
|
|
|
443,212 |
|
|
|
44.0 |
|
Online marketplace and |
|
|
2,004,671 |
|
|
|
23.2 |
|
|
|
2,237,483 |
|
|
|
30.9 |
|
|
|
1,920,615 |
|
|
|
278,463 |
|
|
|
27.7 |
|
Total net revenues |
|
|
8,658,559 |
|
|
|
100.0 |
|
|
|
7,237,004 |
|
|
|
100.0 |
|
|
|
6,940,828 |
|
|
|
1,006,325 |
|
|
|
100.0 |
|
104
Media Services Revenues
We generate media services revenues primarily from automaker advertising services and regional marketing campaigns conducted by certain automobile brands’ regional offices. In 2020, 2021 and 2022, 92, 91 and 100 automakers operating in mainland China, respectively, purchased media services from us directly or through third-party advertising agencies. We primarily use a “cost per day” pricing model to price our online advertising services by charging advertisers on a daily basis for an advertisement placed in a given location on our websites and mobile applications. As we continue to grow our user base and enhance user engagement, we have set up “cost per thousand impressions,” “cost per click” and other performance-based pricing models. These initiatives have already begun to generate revenues, but the amount was relatively insignificant compared to the revenues generated from the “cost per day” pricing model.
We will continue to leverage a combination of the following to attract spending by automakers on our websites and mobile applications: (i) our ability to increase advertising volume, either due to (a) higher sell-through rates, which is calculated as the percentage of advertising locations actually sold over total advertising locations available for sale in a given period, or (b) the increased volume contribution from our mobile websites and applications; (ii) our ability to increase our pricing, as measured by price per location per day, as our user reach continues to expand, and we continue to enhance the effectiveness of the services we offer and build automakers’ increasing awareness of our platform; and (iii) our ability to constantly provide more diversified and optimized portfolio of product offerings.
Leads Generation Services Revenues
We generate leads generation services revenues through (i) dealer subscription services, (ii) advertising services sold to individual dealer advertisers, and (iii) used car listing services. Our dealer subscribers are dealers that have purchased subscription packages which are delivered through our dealership information system. We provide our dealer subscribers with additional tools and features to enable them to more effectively market their inventories on our websites and mobile applications. Our used car listing services primarily consist of listing and display of used vehicles and generation of sales leads to dealers through our platform. We provided leads generation services to 24,517, 23,669 and 24,126 dealers in 2020, 2021 and 2022, respectively. The decrease in 2021 was primarily due to the overall decline in mainland China’s automobile market. Our leads generation services revenues accounted for 36.9%, 41.3% and 44.0% of our net revenues in 2020, 2021 and 2022, respectively. We will continue to enhance our ability to (i) increase the penetration rate of high-end subscription packages; (ii) provide more diversified and upgraded value-added services to our dealer customers, leveraging our capabilities of connecting dealers with our large user base; and (iii) ultimately increase the average revenue contribution per dealer.
Online Marketplace and Others Revenues
We generate revenues from online marketplace and others through our data products, new and used vehicle transaction platform, auto financing services and others. Our data products leverage our intelligent big data analytics capabilities and massive pool of accumulated user data to provide end-to-end data-driven products and solutions for automakers and dealers across different stages of the value chain. For new vehicles, our transaction business currently focuses on platform-based services including facilitating transactions, providing transaction-oriented marketing solutions and other platform-based services. For used vehicles, our transaction platform functions as a transaction system, which connects automobile buyers and used automobile sellers and facilitates their vehicle transactions on our platform through providing a wide range of auto related services, such as online bidding services and valuation tools. For our auto financing business, based on users’ preferences and our big data analysis, we recommend a broad range of loans and insurance products offered by our cooperative financial institutions to our users who have auto financing needs and we match them with these financial institutions to facilitate transactions. We have also introduced merchant loans offered by our cooperative financial institutions to automobile sellers. As a result of our acquisition of Shanghai Tianhe in 2017, we currently facilitate the transactions of insurance products between consumers and our cooperative insurance business partner as an insurance brokerage service provider. We also provide comprehensive auto-related services to our users by integrating TTP’s offline vehicle examination, ownership transfer services and other ancillary services with our online services. Our revenues from online marketplace and others accounted for 23.2%, 30.9% and 27.7% of our net revenues in 2020, 2021 and 2022, respectively. Going forward, we will explore diversified business models and opportunities to build a robust and comprehensive e-commerce platform and continue to develop our transaction system and data products businesses.
105
Cost of Revenues
Cost of revenues refers primarily to (i) operational costs, (ii) content costs, (iii) bandwidth and internet data center (“IDC”) costs and (iv) tax surcharges. The following table sets forth the principal components of our cost of revenues in absolute amounts and as a percentage of our total net revenues for the years/periods indicated:
|
|
For the Year Ended December 31, |
|
|||||||||||||||||||||||||
|
|
2020 |
|
|
2021 |
|
|
2022 |
|
|||||||||||||||||||
|
|
RMB |
|
|
% |
|
|
RMB |
|
|
% |
|
|
RMB |
|
|
US$ |
|
|
% |
|
|||||||
|
|
(in thousands, except percentages) |
|
|||||||||||||||||||||||||
Cost of revenues: |
|
|
|
|
|
|
|
|
|
|
|
|
|
|
|
|
|
|
|
|
|
|||||||
Operational costs (1) |
|
|
388,648 |
|
|
|
4.5 |
|
|
|
520,805 |
|
|
|
7.2 |
|
|
|
548,309 |
|
|
|
79,497 |
|
|
|
7.9 |
|
Content costs |
|
|
182,868 |
|
|
|
2.1 |
|
|
|
204,614 |
|
|
|
2.8 |
|
|
|
359,404 |
|
|
|
52,109 |
|
|
|
5.2 |
|
Bandwidth and IDC costs |
|
|
113,858 |
|
|
|
1.3 |
|
|
|
105,343 |
|
|
|
1.5 |
|
|
|
113,150 |
|
|
|
16,405 |
|
|
|
1.6 |
|
Tax surcharges |
|
|
96,958 |
|
|
|
1.1 |
|
|
|
39,240 |
|
|
|
0.5 |
|
|
|
97,379 |
|
|
|
14,119 |
|
|
|
1.4 |
|
Others |
|
|
178,838 |
|
|
|
2.1 |
|
|
|
177,890 |
|
|
|
2.5 |
|
|
|
116,931 |
|
|
|
16,953 |
|
|
|
1.7 |
|
Total cost of revenues |
|
|
961,170 |
|
|
|
11.1 |
|
|
|
1,047,892 |
|
|
|
14.5 |
|
|
|
1,235,173 |
|
|
|
179,083 |
|
|
|
17.8 |
|
Note:
Operational Costs
Operational costs consist of costs for our revenue-generating business activities and maintaining our business operations, including the transaction fees incurred on our platform, execution costs of service contracts, salaries and benefits, and share-based compensation expenses of related employees.
Content Costs
Content costs consist of costs for creating and editing the originally-generated content, organizing and maintaining user-generated content on our websites and mobile applications, and purchasing professionally-generated content displayed on our websites and mobile applications.
Bandwidth and IDC Costs
Bandwidth and IDC costs consist of fees that we pay to telecommunication carriers and other service providers for telecommunication services and for hosting our servers at their internet data centers, as well as fees we pay to our content delivery network service provider for the distribution of our content.
Tax Surcharges
Our tax surcharges primarily consist of cultural development fees charged for our advertising services, construction and maintenance tax and education surcharges. Our overall tax surcharges as a percentage of our total net revenues was 1.1% in 2020, 0.5% in 2021 and 1.4% in 2022. The increase of tax surcharges in 2022 was mainly due to the resumption of payment in 2022 of the previously exempted cultural development fees.
Others
Others mainly include depreciation and amortization expenses, telecommunication charges, and miscellaneous charges such as travel and office expenses of our editorial and operation personnel.
Operating Expenses
106
Our operating expenses consist of sales and marketing expenses, general and administrative expenses and product development expenses. The following table sets forth our operating expenses in absolute amounts and as percentages of our total net revenues for the years indicated:
|
|
For the Year Ended December 31, |
|
|||||||||||||||||||||||||
|
|
2020 |
|
|
2021 |
|
|
2022 |
|
|||||||||||||||||||
|
|
RMB |
|
|
% |
|
|
RMB |
|
|
% |
|
|
RMB |
|
|
US$ |
|
|
% |
|
|||||||
|
|
(in thousands, except percentages) |
|
|||||||||||||||||||||||||
Operating expenses |
|
|
|
|
|
|
|
|
|
|
|
|
|
|
|
|
|
|
|
|
|
|||||||
Sales and marketing expenses(1) |
|
|
3,246,507 |
|
|
|
37.5 |
|
|
|
2,759,905 |
|
|
|
38.1 |
|
|
|
2,866,206 |
|
|
|
415,561 |
|
|
|
41.3 |
|
General and administrative expenses(2) |
|
|
381,843 |
|
|
|
4.4 |
|
|
|
543,799 |
|
|
|
7.5 |
|
|
|
502,340 |
|
|
|
72,832 |
|
|
|
7.2 |
|
Product development expenses(3) |
|
|
1,364,227 |
|
|
|
15.8 |
|
|
|
1,398,037 |
|
|
|
19.3 |
|
|
|
1,417,094 |
|
|
|
205,459 |
|
|
|
20.4 |
|
Total operating expenses |
|
|
4,992,577 |
|
|
|
57.7 |
|
|
|
4,701,741 |
|
|
|
64.9 |
|
|
|
4,785,640 |
|
|
|
693,852 |
|
|
|
68.9 |
|
Notes:
Sales and Marketing Expenses
Our sales and marketing expenses primarily consist of the branding and marketing expenses incurred in connection with promoting our brands and platform through search engines, mobile platforms, navigation sites and traditional media channels, sales promotion activities and salaries and benefits and sales commissions for our sales and marketing personnel. Our sales and marketing expenses also include offline execution and business development expenses associated with the implementation of our business and office- and travel-related expenses associated with our sales and marketing activities.
General and Administrative Expenses
Our general and administrative expenses primarily consist of expected credit losses, personnel-related expenses for management and administrative personnel and professional service fees.
Product Development Expenses
Our product development expenses primarily consist of personnel-related expenses associated with the development of new technologies and products, investment in underlying big data, AR and VR related technologies, and enhancement of our websites and mobile applications. We recognize these costs as expenses when incurred, unless they qualify for capitalization as software development costs.
107
Other Operating Income, net
Our other operating income, net primarily consists of VAT refunds, government grants and others. The government grants primarily represent subsidies and tax refunds for operating a business in certain jurisdictions and fulfillment of specified tax payment obligations. These grants are not subject to any specific requirements and are recorded when received. Depending on the local government policies, some of the grants are not recurring in nature. The following table sets forth our other operating income, net in absolute amounts and as percentages of our total net revenues for the years indicated:
|
|
For the Year Ended December 31, |
|
|||||||||||||||||||||||||
|
|
2020 |
|
|
2021 |
|
|
2022 |
|
|||||||||||||||||||
|
|
RMB |
|
|
% |
|
|
RMB |
|
|
% |
|
|
RMB |
|
|
US$ |
|
|
% |
|
|||||||
|
|
(in thousands, except percentages) |
|
|||||||||||||||||||||||||
VAT refunds |
|
|
218,412 |
|
|
|
2.5 |
|
|
|
231,452 |
|
|
|
3.2 |
|
|
|
223,926 |
|
|
|
32,466 |
|
|
|
3.2 |
|
Government grants |
|
|
210,022 |
|
|
|
2.4 |
|
|
|
51,685 |
|
|
|
0.7 |
|
|
|
56,406 |
|
|
|
8,178 |
|
|
|
0.8 |
|
Others |
|
|
14,781 |
|
|
|
0.2 |
|
|
|
11,104 |
|
|
|
0.2 |
|
|
|
47,175 |
|
|
|
6,840 |
|
|
|
0.7 |
|
Other Operating Income, net |
|
|
443,215 |
|
|
|
5.1 |
|
|
|
294,241 |
|
|
|
4.1 |
|
|
|
327,507 |
|
|
|
47,484 |
|
|
|
4.7 |
|
Taxation
Cayman Islands
Autohome Inc., Autohome Link Inc. and TTP Car Inc. were incorporated in the Cayman Islands. Autohome Inc. conducts substantially all of its business through its mainland China subsidiaries and VIEs. Under the current laws of the Cayman Islands, companies incorporated in the Cayman Islands are not subject to income or capital gains tax. In addition, dividend payments are not subject to withholding tax in the Cayman Islands.
British Virgin Islands
Cheerbright and Auto Pai Ltd. were incorporated in the British Virgin Islands. Under the current laws of the British Virgin Islands, they are not subject to income or capital gains tax. In addition, dividend payments are not subject to withholding tax in the British Virgin Islands.
Hong Kong
Autohome (Hong Kong) Limited, Autohome Media Limited, Autohome Link Hong Kong Limited and TTP Car (HK) Limited, were incorporated in Hong Kong. Subsidiaries in Hong Kong are subject to 16.5% income tax on their taxable income generated from operations in Hong Kong. On April 1, 2018, a two-tiered profits tax regime was introduced. The profits tax rate for the first HK$2 million of profits of corporations is lowered to 8.25%, while profits above that amount continue to be subject to the tax rate of 16.5%. Under the Hong Kong tax law, our subsidiaries in Hong Kong are exempted from income tax on their foreign-derived income and there are no withholding taxes in Hong Kong on remittance of dividends.
Mainland China
On December 29, 2018, the SCNPC amended the EIT Law, which was issued on March 16, 2007. The Implementing Regulations of the Law of the PRC on Enterprise Income Tax was issued on December 6, 2007 and became effective on January 1, 2008 and was revised on April 23, 2019. Under the EIT Law and its implementation rules, a standard 25% enterprise income tax rate is generally applicable to both foreign-invested enterprises and domestic enterprises, unless they qualify for certain exceptions.
An enterprise may benefit from a preferential tax rate of 15% under the EIT Law if it qualifies as a “High and New Technology Enterprise” strongly supported by the state. Pursuant to the Administrative Measures on the Recognition of High and New Technology Enterprises, or the Recognition Measures, as amended in January 2016, the provincial counterparts of the Ministry of Science and Technology, the Ministry of Finance and the State Administration of Taxation make joint determination on whether an enterprise is qualified as a “High and New
108
Technology Enterprise” under the EIT Law. In making such determination, these government agencies consider, among other factors, ownership of core technology, whether the key technology supporting the core products or services falls within the scope of high and new technology strongly supported by the state as specified in the Recognition Measures, the ratios of research and development personnel to total personnel, the ratio of research and development expenditures to annual sales revenues, the ratio of revenues attributed to high and new technology products or services to total revenues, and other measures set forth in relevant guidance. A “High and New Technology Enterprise” certificate is effective for a period of three years.
Autohome WFOE, Chezhiying WFOE, Beijing Autohome Technologies Co., Ltd., or Beijing Autohome Technologies, Beijing Prbrownies Software Co., Ltd., or Beijing Prbrownies, Hainan Chezhiyitong Information Technology Co., Ltd., or Hainan Chezhiyitong, and Tianjin Autohome Software Co., Ltd. (formerly known as Tianjin Autohome Data Information Technology Co., Ltd.), or Tianjin Autohome, are recognized as HNTEs and are eligible for a 15% preferential tax rate effective until 2024, 2023, 2023, 2023, 2022 and 2022, respectively, upon the completion of their filings with the relevant tax authorities.
An enterprise may benefit from a tax exemption or preferential tax rate of 10% under the EIT law if it qualifies as a “Key Software Enterprise.” “Key Software Enterprise” status will be subject to relevant governmental authorities’ assessment each year as to whether they are entitled to the tax exemption or preferential tax rate of 10%. In May 2016, the four PRC governmental authorities jointly issued a notice, pursuant to which an enterprise may be entitled to the preferential income tax rate of 10% by filing with the local tax authority with supporting documentation proving its qualifications to be a “Key Software Enterprise” during its annual income tax filing process. In December 2020, the Ministry of Finance, the State Administration of Taxation, the NDRC, and the MIIT jointly issued a circular which has repealed the original preferential tax treatment applicable to the “Key Software Enterprise.” Such circular provides that the Key Software Enterprise’s EIT would be waived for five years since its first year of making profit and it may benefit from a preferential tax rate of 10% for the following years.
Beijing Prbrownies registered as a KSE and enjoyed a reduced enterprise income tax of 10% for tax year from 2017 to 2021. Tianjin Autohome registered as a KSE in 2021 and enjoyed a tax exemption. Going forward, if Beijing Prbrownies or Tianjin Autohome, fails to complete the filing and registration with the relevant tax authorities, it will no longer enjoy the tax exemption or preferential tax rate.
Pursuant to the Circular on Income Tax Policies for Further Encouraging the Development of Software Industry and Integrated Circuit Industry jointly issued by the SAT and the MOF, on April 20, 2012, the Circular on Issues concerning Preferential Enterprise Income Tax Policies for Software and Integrated Circuit Industries jointly issued by the MOF, the SAT, the NDRC and the MIIT on May 4, 2016, and the Circular on Issues concerning Corporate Income Tax Policies for Promoting High-quality Development of Integrated Circuit Industry and Software Industry jointly issued by the MOF, the SAT, the NDRC and the MIIT on December 11, 2020, eligible software enterprises which pass annual review and filing with the relevant tax authorities can enjoy exemption of enterprise income tax for the first and second year as calculated from the profit making year or no later than December 31, 2017 if no profit is made prior to that date, and thereafter enjoy half of the statutory rate of 25% for the third through fifth year thereafter until the expiration of the preferential period.
Chezhiying WFOE, Hainan Chezhiyitong and Tianjin Autohome are recognized as software enterprise and could be exempt from income tax for the tax year of 2019 and 2020 and enjoyed a 50% reduction in the statutory income tax rate of 25% for the tax year of 2021. Above three entities can continue to enjoy the 12.5% preferential tax rate for the years of 2022 and 2023 provided that they maintains their status as a SE during each relevant tax year.
Except for the above-mentioned entities, our remaining mainland China subsidiaries and all the VIEs were subject to enterprise income tax at a rate of 25%.
If our holding company in the Cayman Islands, Autohome Inc., were deemed to be a “mainland China resident enterprise” under the EIT Law, it would be subject to enterprise income tax on its global income at a rate of 25%. If a subsidiary of us established in Hong Kong were deemed to be a “mainland China resident enterprise” and Autohome Inc. were not deemed to be a “mainland China resident enterprise” under the EIT Law, then dividends payable by such subsidiary to Autohome Inc. may become subject to 10% PRC dividend withholding tax. Under
109
such circumstances, it is not clear whether dividends payable by our mainland China subsidiaries to their respective shareholders in Hong Kong would still be subject to PRC dividend withholding tax at a rate of 5%. If such subsidiary in Hong Kong were deemed to be a “mainland China resident enterprise” under the EIT Law, it would be subject to enterprise income tax at a rate of 25%. See “Item 3. Key Information—D. Risk Factors—Risks Related to Doing Business in Mainland China—Our global income and the dividends that we may receive from our mainland China subsidiaries, dividends distributed to our non-mainland China shareholders and ADS holders, and gains recognized by such shareholders or ADS holders, may be subject to PRC taxes under the EIT Law, which would have a material adverse effect on our results of operations.”
Results of Operations
The following table presents our results of operations in absolute amounts and as a percentage of our total net revenues for the years indicated.
|
|
For the Year Ended December 31, |
|
|||||||||||||||||||||||||
|
|
2020 |
|
|
2021 |
|
|
2022 |
|
|||||||||||||||||||
|
|
RMB |
|
|
% |
|
|
RMB |
|
|
% |
|
|
RMB |
|
|
US$ |
|
|
% |
|
|||||||
|
|
(in thousands, except percentages) |
|
|||||||||||||||||||||||||
Net revenues |
|
|
|
|
|
|
|
|
|
|
|
|
|
|
|
|
|
|
|
|
|
|||||||
Media services |
|
|
3,455,056 |
|
|
|
39.9 |
|
|
|
2,011,446 |
|
|
|
27.8 |
|
|
|
1,963,289 |
|
|
|
284,650 |
|
|
|
28.3 |
|
Leads generation services |
|
|
3,198,832 |
|
|
|
36.9 |
|
|
|
2,988,075 |
|
|
|
41.3 |
|
|
|
3,056,924 |
|
|
|
443,212 |
|
|
|
44.0 |
|
Online marketplace and others |
|
|
2,004,671 |
|
|
|
23.2 |
|
|
|
2,237,483 |
|
|
|
30.9 |
|
|
|
1,920,615 |
|
|
|
278,463 |
|
|
|
27.7 |
|
Total net revenues |
|
|
8,658,559 |
|
|
|
100.0 |
|
|
|
7,237,004 |
|
|
|
100.0 |
|
|
|
6,940,828 |
|
|
|
1,006,325 |
|
|
|
100.0 |
|
Cost of revenues(1) |
|
|
(961,170 |
) |
|
|
(11.1 |
) |
|
|
(1,047,892 |
) |
|
|
(14.5 |
) |
|
|
(1,235,173 |
) |
|
|
(179,083 |
) |
|
|
(17.8 |
) |
Gross Profit |
|
|
7,697,389 |
|
|
|
88.9 |
|
|
|
6,189,112 |
|
|
|
85.5 |
|
|
|
5,705,655 |
|
|
|
827,242 |
|
|
|
82.2 |
|
Operating expenses |
|
|
|
|
|
|
|
|
|
|
|
|
|
|
|
|
|
|
|
|
|
|||||||
Sales and marketing expenses(1) |
|
|
(3,246,507 |
) |
|
|
(37.5 |
) |
|
|
(2,759,905 |
) |
|
|
(38.1 |
) |
|
|
(2,866,206 |
) |
|
|
(415,561 |
) |
|
|
(41.3 |
) |
General and administrative expenses(1) |
|
|
(381,843 |
) |
|
|
(4.4 |
) |
|
|
(543,799 |
) |
|
|
(7.5 |
) |
|
|
(502,340 |
) |
|
|
(72,832 |
) |
|
|
(7.2 |
) |
Product development expenses(1) |
|
|
(1,364,227 |
) |
|
|
(15.8 |
) |
|
|
(1,398,037 |
) |
|
|
(19.3 |
) |
|
|
(1,417,094 |
) |
|
|
(205,459 |
) |
|
|
(20.4 |
) |
Total operating expenses |
|
|
(4,992,577 |
) |
|
|
(57.7 |
) |
|
|
(4,701,741 |
) |
|
|
(65.0 |
) |
|
|
(4,785,640 |
) |
|
|
(693,852 |
) |
|
|
(68.9 |
) |
Other operating income, net |
|
|
443,215 |
|
|
|
5.1 |
|
|
|
294,241 |
|
|
|
4.1 |
|
|
|
327,507 |
|
|
|
47,484 |
|
|
|
4.7 |
|
Operating profit |
|
|
3,148,027 |
|
|
|
36.3 |
|
|
|
1,781,612 |
|
|
|
24.6 |
|
|
|
1,247,522 |
|
|
|
180,874 |
|
|
|
18.0 |
|
Interest and investment income, net(2) |
|
|
392,160 |
|
|
|
4.5 |
|
|
|
395,245 |
|
|
|
5.5 |
|
|
|
565,090 |
|
|
|
81,931 |
|
|
|
8.1 |
|
Earnings/(loss) from equity method |
|
|
(1,246 |
) |
|
|
0.0 |
|
|
|
301 |
|
|
|
0.0 |
|
|
|
(49,766 |
) |
|
|
(7,215 |
) |
|
|
(0.7 |
) |
Income before income taxes |
|
|
3,538,941 |
|
|
|
40.8 |
|
|
|
2,177,158 |
|
|
|
30.1 |
|
|
|
1,762,846 |
|
|
|
255,590 |
|
|
|
25.4 |
|
Income tax expense |
|
|
(260,945 |
) |
|
|
(3.0 |
) |
|
|
(34,006 |
) |
|
|
(0.5 |
) |
|
|
61,780 |
|
|
|
8,957 |
|
|
|
0.9 |
|
Net income |
|
|
3,277,996 |
|
|
|
37.8 |
|
|
|
2,143,152 |
|
|
|
29.6 |
|
|
|
1,824,626 |
|
|
|
264,547 |
|
|
|
26.3 |
|
Net loss/(income) attributable to |
|
|
(2,338 |
) |
|
|
0.0 |
|
|
|
105,633 |
|
|
|
1.5 |
|
|
|
30,548 |
|
|
|
4,429 |
|
|
|
0.4 |
|
Net income attributable to Autohome Inc. |
|
|
3,275,658 |
|
|
|
37.8 |
|
|
|
2,248,785 |
|
|
|
31.1 |
|
|
|
1,855,174 |
|
|
|
268,976 |
|
|
|
26.7 |
|
Accretion of mezzanine equity. |
|
|
— |
|
|
|
0.0 |
|
|
|
(411,792 |
) |
|
|
(5.7 |
) |
|
|
(137,610 |
) |
|
|
(19,952 |
) |
|
|
(2.0 |
) |
Accretion attributable to noncontrolling |
|
|
— |
|
|
|
0.0 |
|
|
|
311,573 |
|
|
|
4.3 |
|
|
|
89,612 |
|
|
|
12,993 |
|
|
|
1.3 |
|
Net income attributable to ordinary |
|
|
3,275,658 |
|
|
|
37.8 |
|
|
|
2,148,566 |
|
|
|
29.7 |
|
|
|
1,807,176 |
|
|
|
262,017 |
|
|
|
26.0 |
|
Note:
|
|
For the Year Ended December 31, |
|
|||||||||||||||||||||||||
|
|
2020 |
|
|
2021 |
|
|
2022 |
|
|||||||||||||||||||
|
|
RMB |
|
|
% |
|
|
RMB |
|
|
% |
|
|
RMB |
|
|
US$ |
|
|
% |
|
|||||||
|
|
(in thousands, except percentages) |
|
|||||||||||||||||||||||||
Allocation of Share-Based Compensation Expenses |
|
|
|
|
|
|
|
|
|
|
|
|
|
|
|
|
|
|
|
|
|
|||||||
Cost of revenues |
|
|
21,372 |
|
|
|
0.2 |
|
|
|
23,142 |
|
|
|
0.3 |
|
|
|
8,608 |
|
|
|
1,248 |
|
|
|
0.1 |
|
Sales and marketing expenses |
|
|
40,103 |
|
|
|
0.5 |
|
|
|
46,823 |
|
|
|
0.6 |
|
|
|
38,317 |
|
|
|
5,555 |
|
|
|
0.6 |
|
General and administrative expenses |
|
|
55,868 |
|
|
|
0.6 |
|
|
|
48,803 |
|
|
|
0.7 |
|
|
|
53,209 |
|
|
|
7,715 |
|
|
|
0.8 |
|
Product development expenses |
|
|
93,863 |
|
|
|
1.1 |
|
|
|
87,292 |
|
|
|
1.2 |
|
|
|
68,756 |
|
|
|
9,969 |
|
|
|
1.0 |
|
Total share-based compensation expenses |
|
|
211,206 |
|
|
|
2.4 |
|
|
|
206,060 |
|
|
|
2.8 |
|
|
|
168,890 |
|
|
|
24,487 |
|
|
|
2.5 |
|
110
Year Ended December 31, 2022 Compared to Year Ended December 31, 2021
Net Revenues
Our net revenues decreased by 4.1% from RMB7,237.0 million in 2021 to RMB6,940.8 million (US$1,006.3 million) in 2022.
Media services. Our media services revenues decreased by 2.4% from RMB2,011.4 million in 2021 to RMB1,963.3 million (US$284.7 million) in 2022. The decrease in revenues from our media services was primarily attributable to a 11.2% decrease in average revenue per automaker advertiser from RMB22.1 million in 2021 to RMB19.6 million in 2022.
Leads generation services. Leads generation services revenues increased by 2.3% from RMB2,988.1 million in 2021 to RMB3,056.9 million (US$443.2 million). The increase in leads generation services revenues was mainly driven by the higher pricing policy in 2022.
Online marketplace and others. Revenues from online marketplace and others decreased by 14.2% from RMB2,237.5 million in 2021 to RMB1,920.6 million (US$278.5 million) in 2022. This decrease was primarily attributable to automakers’ decreased spending on data products and the impact of COVID-19 pandemic in China.
Cost of Revenues
Our cost of revenues increased by 17.9% from RMB1,047.9 million in 2021 to RMB1,235.2 million (US$179.1million) in 2022. In addition, share-based compensation expenses included in cost of revenues in 2022 was RMB8.6 million (US$1.2 million), compared to RMB23.1 million in 2021.
Operational costs. Our operational costs increased by 5.3% from RMB520.8 million in 2021 to RMB548.3 million (US$79.5 million) in 2022.
Content Costs. Our content costs increased by 75.6% from RMB204.6 million in 2021 to RMB359.4 million (US$52.1 million) in 2022, primarily due to continuous investment in content generation, acquisition and execution.
Bandwidth and IDC Costs. Our bandwidth and IDC costs increased by 7.4% from RMB105.3 million in 2021 to RMB113.2 million (US$16.4 million) in 2022.
Tax Surcharges. Tax surcharges increased by 148.2% from RMB39.2 million in 2021 to RMB97.4 million (US$14.1 million) in 2022, primarily due to the resumption of payment in 2022 of the previously exempted cultural development fees.
Others. Other costs decreased by 34.3% from RMB177.9 million in 2021 to RMB116.9 million (US$17.0 million) in 2022.
Operating Expenses
Our operating expenses increased by 1.8% from RMB4,701.7 million in 2021 to RMB4,785.6 million (US$693.9 million) in 2022.
Sales and Marketing Expenses. Our sales and marketing expenses increased by 3.9% from RMB2,759.9 million in 2021 to RMB2,866.2 million (US$415.6 million) in 2022 primarily due to the increase in marketing and promotional spending. As a percentage of net revenues, sales and marketing expenses were 41.3% in 2022,
111
compared to 38.1% in 2021. Share-based compensation expense included in sales and marketing expenses in 2022 was RMB38.3 million (US$5.6 million), compared to RMB46.8 million in 2021.
General and Administrative Expenses. Our general and administrative expenses decreased by 7.6% from RMB543.8 million in 2021 to RMB502.3 million (US$72.8 million) in 2022. This decrease was primarily due to the decline of expected credit losses and professional expenses. As a percentage of net revenues, general and administrative expenses decreased from 7.5% in 2021 to 7.2% in 2022. Share-based compensation expense included in general and administrative expenses in 2022 was RMB53.2 million (US$7.7 million), compared to RMB48.8 million in 2021.
Product Development Expenses. Our product development expenses increased by 1.4% from RMB1,398.0 million in 2021 to RMB1,417.1 million (US$205.5 million) in 2022. As a percentage of net revenues, product development expenses were 20.4% in 2022, compared to 19.3% in 2021. Share-based compensation expense included in product development expenses in 2022 was RMB68.8 million (US$10.0 million), compared to RMB87.3 million in 2021.
Other operating income, net
Our other operating income, net, primarily consists of VAT refund, government grants and others. Other operating income, net, was RMB327.5 million (US$47.5 million) in 2021, compared to RMB294.2 million in 2021. The increase in other net operating income was primary due to the increase of input VAT deductions.
Income before Income Taxes
Our income before income taxes was RMB1,762.8 million (US$255.6 million) in 2022, compared to RMB2,177.2 million in 2021.
Income Tax Expense
We recorded an income tax benefit of RMB61.8 million (US$9.0 million) in 2022, compared to an income tax expense of RMB34.0 million in 2021, primarily due to the lower taxable income and tax filing adjustments as a result of the PRC preferential income tax rate and tax holidays for certain subsidiaries in 2022.
Net Income Attributable to Autohome
As a result of the foregoing, we had net income attributable to Autohome of RMB1,855.2 million (US$269.0 million) in 2022, decreasing by 17.5% compared to net income attributable to Autohome Inc. of RMB2,248.8 million in 2021.
Net Income attributable to Ordinary Shareholders
The net income attributable to ordinary shareholders was RMB1,807.2 million (US$262.0 million) in 2022, decreasing by 15.9 % compared to net income attributable to ordinary shareholders of RMB2,148.6 million in 2021.
Year Ended December 31, 2021 Compared to Year Ended December 31, 2020
Net Revenues
Our net revenues decreased by 16.4% from RMB8,658.6 million in 2020 to RMB7,237.0 million in 2021.
Media services. Our media services revenues decreased by 41.8% from RMB3,455.1 million in 2020 to RMB2,011.4 million in 2021. The decline was primarily due to the decrease in average revenue per automaker advertiser, who adjusted their advertising budgets due to the ongoing global chip shortage and the elevated pricing of raw materials. The decrease in revenues from our media services was primarily attributable to a 41.1% decrease in average revenue per automaker advertiser from RMB37.6 million in 2020 to RMB22.1 million in 2021.
112
Leads generation services. Leads generation services revenues decreased by 6.6% from RMB3,198.8 million in 2020 to RMB2,988.1 million in 2021. The decline in leads generation services revenues was mainly driven by decreases in dealers’ marketing spending.
Online marketplace and others. Revenues from online marketplace and others increased by 11.6% from RMB2,004.7 million in 2020 to RMB2,237.5 million in 2021. This increase was primarily attributable to the increased contribution from data products and the consolidation of TTP.
Cost of Revenues
Our cost of revenues increased by 9.0% from RMB961.2 million in 2020 to RMB1,047.9 million in 2021. In addition, our cost of revenues included share-based compensation expenses, which were RMB23.1 million in 2021, compared to RMB21.4 million in 2020.
Operational costs. Our operational costs increased by 34.0% from RMB388.6 million in 2020 to 520.8 million in 2021, which was mainly due to the consolidation of TTP.
Content Costs. Our content costs increased by 11.9% from RMB182.9 million in 2020 to RMB204.6 million in 2021, primarily due to the increased investment in content generation, acquisition and execution.
Bandwidth and IDC Costs. Our bandwidth and IDC costs decreased by 7.5% from RMB113.9 million in 2020 to RMB105.3 million in 2021.
Tax Surcharges. Tax surcharges decreased by 59.5% from RMB97.0 million in 2020 to RMB39.2 million in 2021, as a result of the revenue decline.
Others. Other costs decreased by 0.5% from RMB178.8 million in 2020 to RMB177.9 million in 2021.
Operating Expenses
Our operating expenses decreased by 5.8% from RMB4,992.6 million in 2020 to RMB4,701.7 million in 2021.
Sales and Marketing Expenses. Our sales and marketing expenses decreased by 15.0% from RMB3,246.5 million in 2020 to RMB2,759.9 million in 2021 primarily due to the decrease in promotional spending and continual budget control. As a percentage of net revenues, sales and marketing expenses were 38.1% in 2021, compared to 37.5% in 2020. Our sales and marketing expenses included share-based compensation expenses of RMB46.8 million in 2021, compared to RMB40.1 million in 2020.
General and Administrative Expenses. Our general and administrative expenses increased by 42.4% from RMB381.8 million in 2020 to RMB543.8 million in 2021. This increase was primarily due to the consolidation of TTP. As a percentage of net revenues, general and administrative expenses increased from 4.4% in 2020 to 7.5% in 2021. Our general and administrative expenses included share-based compensation expenses of RMB48.8 million in 2021, compared to RMB55.9 million in 2020.
Product Development Expenses. Our product development expenses increased by 2.5% from RMB1,364.2 million in 2020 to RMB1,398.0 million in 2021 primarily due to the consolidation of TTP. As a percentage of net revenues, product development expenses were 19.3% in 2021, compared to 15.8% in 2020. Our product development expenses included share-based compensation expenses of RMB87.3 million in 2021, compared to RMB93.9 million in 2020.
Other operating income, net
Our other operating income, net, primarily consists of VAT refund, government grants and others. Other operating income, net, was RMB294.2 million in 2021, compared to RMB443.2 million in 2020. The decrease in other net operating income was primary due to the reduction of certain government subsidies.
113
Income before Income Taxes
Our income before income taxes was RMB2,177.2 million in 2021, compared to RMB3,538.9 million in 2020.
Income Tax Expense
We incurred income tax expense of RMB34.0 million in 2021, representing a 87.0% decrease compared to RMB260.9 million in 2020, primarily due to the lower taxable income in 2021.
Net Income Attributable to Autohome
As a result of the foregoing, we had net income attributable to Autohome of RMB2,248.8 million in 2021, decreasing by 31.3% compared to net income attributable to Autohome of RMB3,275.7 million in 2020.
Net Income attributable to Ordinary Shareholders
The net income attributable to ordinary shareholders was RMB2,148.6 million in 2021, decreasing by 34.4% compared to net income attributable to ordinary shareholders of RMB3,275.7 million in 2020.
Inflation
Since our inception, inflation in China has not materially impacted our results of operations. According to the National Bureau of Statistics of China, the consumer price index in mainland China increased by 2.5%, 0.9% and 2% in 2020, 2021 and 2022, and the year-over-year percent changes in the consumer price index for December 2020, 2021 and 2022 were increases of 0.2%, 1.5% and 1.8%, respectively. Although we have not in the past been materially affected by inflation since our inception, we can provide no assurance that we will not be affected in the future by higher rates of inflation in mainland China.
Recent Accounting Pronouncements
See Item 17 of Part III, “Financial Statements—Note 2—Summary of significant accounting policies—Recent accounting pronouncements.”
Cash Flows and Working Capital
As of December 31, 2022, we had cash and cash equivalents, restricted cash and short-term investments altogether amounting to RMB22.10 billion (US$3.20 billion).
We believe that our current cash and anticipated cash flow from operations will be sufficient to meet our anticipated cash needs, including our cash needs for at least the next 12 months. We may require additional cash due to unanticipated business conditions or other future developments. We may also need additional cash resources if we find and wish to pursue opportunities for investments, acquisitions, strategic cooperation or other similar actions. If our existing cash is insufficient to meet our requirements, we may seek to sell additional equity securities, debt securities or secure debt funding from financial institutions.
114
The following table sets forth a summary of our cash flows for the years indicated.
|
|
For the Year Ended December 31, |
|
|||||||||||||
|
|
2020 |
|
|
2021 |
|
|
2022 |
|
|||||||
|
|
RMB |
|
|
RMB |
|
|
RMB |
|
|
US$ |
|
||||
|
|
(in thousands) |
|
|||||||||||||
Net cash generated from operating activities |
|
|
3,325,631 |
|
|
|
3,523,934 |
|
|
|
2,565,075 |
|
|
|
371,902 |
|
Net cash used in investing activities |
|
|
(2,985,458 |
) |
|
|
(3,813,013 |
) |
|
|
(3,109,417 |
) |
|
|
(450,823 |
) |
Net cash (used in)/generated from financing activities |
|
|
(546,967 |
) |
|
|
2,898,296 |
|
|
|
(1,140,065 |
) |
|
|
(165,294 |
) |
Effect of exchange rate changes on cash and cash |
|
|
(17,556 |
) |
|
|
(46,809 |
) |
|
|
168,325 |
|
|
|
24,403 |
|
Net (decrease)/increase in cash and cash equivalents and |
|
|
(224,350 |
) |
|
|
2,562,408 |
|
|
|
(1,516,082 |
) |
|
|
(219,812 |
) |
Cash and cash equivalents and restricted cash at |
|
|
1,993,498 |
|
|
|
1,769,148 |
|
|
|
4,331,556 |
|
|
|
628,017 |
|
Cash and cash equivalents and restricted cash at end of |
|
|
1,769,148 |
|
|
|
4,331,556 |
|
|
|
2,815,474 |
|
|
|
408,205 |
|
Operating Activities
Net cash generated from operating activities was RMB2,565.1 million (US$371.9 million) for 2022. The difference between the net income of RMB1,824.6 million (US$264.5 million) and the net cash generated from the operating activities of RMB2,565.1 million was primarily due to additional cash of RMB120.2 million (US$17.4 million) generated from working capital, and adding back certain non-cash expense items including share-based compensation of RMB168.9 million (US$24.5 million), amortization of operating lease right-of-use asset of RMB 118.8 million (US$17.2 million) and depreciation of RMB226.1 million (US$32.8 million). The change in working capital was in turn the result of (i) a RMB203.6 million (US$29.5 million) decrease in accounts receivable; (ii) a RMB534.3 million (US$77.5 million) increase in accrued expenses and other payables; (iii) a RMB405.9 million (US$58.8 million) decrease in deferred revenue; and (iv) a RMB101.5 million (US$14.7 million) increase in other non-current assets.
The decrease in accounts receivable was in line with the decrease in revenue. The increase in accrued expenses and other payables was primarily attributable to the increased promotion expenses. The decrease in deferred revenue was primarily attributable to the extension of collection of subscription fees from certain dealers affected by the outbreak of COVID 19 in December 2022. The increase in other non-current assets was primarily attributable to the recognition of operating lease right-of-use assets.
Net cash generated from operating activities was RMB3,523.9 million for 2021. The difference between the net income of RMB2,143.2 million and the net cash generated from the operating activities of RMB3,523.9 million was primarily due to additional cash of RMB735.4 million generated from working capital, and adding back certain non-cash expense items including share-based compensation of RMB206.1 million, and depreciation of RMB225.3 million. The change in working capital was in turn the result of (i) a RMB931.4 million decrease in accounts receivable; (ii) a RMB432.2 million decrease in accrued expenses and other payables; (iii) a RMB237.3 million increase in deferred revenue; and (iv) a RMB148.2 million increase in income tax payable.
The decrease in accounts receivable was in line with the decrease in revenue. The decrease in accrued expenses and other payables was primarily attributable to the decreased promotion expenses. The increase in deferred revenue was primarily attributable to the increased advanced payment related to dealer subscription services as of December 31, 2021. The increase in income tax payable was primarily attributable to the withholding tax.
Net cash generated from operating activities was RMB3,325.6 million for 2020. The difference between the net income of RMB3,278.0 million and the net cash generated from the operating activities of RMB3,325.6 million was primarily due to additional cash of RMB593.6 million used for working capital, partially offset by adding back certain non-cash expense items including share-based compensation of RMB211.2 million and depreciation of RMB158.2 million. The change in working capital was in turn the result of (i) a RMB217.7 million increase in prepaid expenses and other current assets; (ii) a RMB252.9 million increase in other non-current assets, and (iii) a RMB158.3 million decrease in accrued expenses and other payables.
115
The increase in prepaid expenses and other current assets was primarily attributable to the increased prepaid technical service expenses and receivables from third-party payment platform. The increase in other non-current assets was primarily due to the recognition of operating lease right-of-use assets. The decrease in accrued expenses and other payables was primarily attributable to the decreased promotion expenses.
As of December 31, 2022, 89.3% (or RMB2,070.0 million) of our total accounts receivable at the end of 2021 and 94.4% (or RMB3,071.5 million) of our total accounts receivable at the end of 2020 were subsequently settled. Our accounts receivable turnover days, which are the average accounts receivable balances as of the beginning and the end of the period divided by total net revenues during the period and multiplied by the number of days during the period, were 134.0 days in 2020, 132.7 days in 2021 and 106.9 days in 2022.
Investing Activities
Net cash used in investing activities was RMB3,109.4 million (US$450.8 million) in 2022, which was primarily attributable to purchase of term deposits and adjustable-rate financial products, increased capital expenditures primarily related to the purchase of servers and software, and acquisition of equity investment in Ping An Capital Co., Ltd.
Net cash used in investing activities was RMB3,813.0 million in 2021, which was primarily attributable to purchase of term deposits and adjustable-rate financial products, increased capital expenditures primarily related to the purchase of servers and software, and payment related to the acquisition of TTP.
Net cash used in investing activities was RMB2,985.5 million in 2020, which was primarily attributable to acquisition of TTP Car Inc., purchase of term deposits and adjustable-rate financial products and increased capital expenditures primarily related to the purchase of servers and software.
Financing Activities
Net cash used in financing activities in 2022 was RMB1,140.1 million (US$165.3 million), which was primarily attributable to payment for repurchase of ordinary shares and payment of dividends.
Net cash generated from financing activities in 2021 was RMB2,898.3 million, which was primarily attributable to the net proceeds from issuance of our ordinary shares in connection with the listing on the Hong Kong Stock Exchange in March 2021, partially offset by payment of dividends, and payment for repurchase of ordinary shares.
Net cash used in financing activities in 2020 was RMB547.0 million, which was attributable to payment of dividends, partially offset by proceeds from exercise of share-based awards.
Material Cash Requirement
Our material cash requirement as of December 31, 2022 and any subsequent interim period include our capital expenditures and operating lease obligations.
Our capital expenditures were primarily used for the purchase of servers and software for our business. Cash outflow in connection with capital expenditures amounted to RMB263.9 million, RMB218.8 million, and RMB116.5 million (US$16.9 million) in 2020, 2021 and 2022, respectively.
Our operating lease obligations mainly relate to the lease of office space and internet data centers. Lease cost for the years ended December 31, 2020, 2021 and 2022 were RMB213.5 million, RMB231.5 million and RMB215.7 million (US$31.3 million), respectively, with the figures in 2020, 2021 and 2022 including those related to lease of data centers.
116
The following summarizes our contractual obligations as of December 31, 2022:
|
|
Payments Due by Period |
|
|||||||||||||||||
|
|
Less than 1 Year |
|
|
1 to 3 Years |
|
|
3 to 5 Years |
|
|
More than 5 Years |
|
|
Total |
|
|||||
Operating lease obligations (1) |
|
|
64,341 |
|
|
|
54,737 |
|
|
|
6,061 |
|
|
|
— |
|
|
|
125,139 |
|
Note:
We intend to fund our existing and future material cash requirements with our existing cash balance. We will continue to make cash commitments, including capital expenditures, to support the growth of our business.
We have not entered into any financial guarantees or other commitments to guarantee the payment obligations of any third parties. We have not entered into any derivative contracts that are indexed to our shares and classified as shareholder’s equity. Furthermore, we do not have any retained or contingent interest in assets transferred to an unconsolidated entity that serves as credit, liquidity or market risk support to such entity. We do not have any variable interest in any unconsolidated entity that provides financing, liquidity, market risk or credit support to us or engages in leasing, hedging or research and development services with us.
Other than as discussed above, we did not have any significant capital and other commitments, long-term obligations or guarantees as of December 31, 2022.
Holding Company Structure
Our ability to pay dividends is primarily dependent on our receiving distributions of funds from our subsidiaries. Relevant statutory laws and regulations of mainland China permit payments of dividends by our mainland China subsidiaries only out of their retained earnings, if any, as determined in accordance with PRC accounting standards and regulations. The results of operations reflected in the consolidated financial statements prepared in accordance with U.S. GAAP differ from those reflected in the statutory financial statements of our mainland China subsidiaries.
Under PRC law, our mainland China subsidiaries are required to provide for certain statutory reserves, namely a general reserve, an enterprise expansion fund and a staff welfare and bonus fund and allocate at least 10% of their after-tax profits on an individual company basis as determined under PRC accounting standards to the general reserve, and have the right to discontinue allocations to the general reserve if such reserve has reached 50% of registered capital on an individual company basis. In addition, they are also required to make appropriations to the enterprise expansion fund and staff welfare and bonus fund at the discretion of their respective boards of directors. The VIEs in mainland China are also subject to similar statutory reserve requirements. These reserves can only be used for specific purposes and are not transferable to us in the form of loans, advances or cash dividends. As of December 31, 2020, 2021 and 2022, our mainland China subsidiaries and the VIEs had appropriated RMB87.8 million, RMB91.3 million and RMB93.6million (US$13.6 million), respectively, of retained earnings for their statutory reserves.
As a result of these mainland China laws and regulations, prior to allocations of after-tax profits to the statutory reserves, our PRC subsidiaries and the VIEs are restricted in their ability to transfer a portion of their net assets to us.
Foreign exchange and other regulation in the PRC may further restrict our mainland China subsidiaries and the VIEs from transferring funds to us in the form of dividends, loans and advances. As of December 31, 2020, 2021 and 2022, the amounts of the net restricted assets of our mainland China subsidiaries and the VIEs were RMB4,582.9 million, RMB4,925.0 million and RMB5,162.5 million, (US$748.5 million), respectively.
117
Technology and Product Development
Our technologies and infrastructure are critical to our success. We follow a user-centric strategy for our system architecture and have developed a robust and scalable technology platform driven by AI, big data and cloud technologies with sufficient flexibility to support our rapid growth.
We had an experienced product development team of 1,322 engineers as of December 31, 2022. Our past innovation has focused on helping users research, select and purchase suitable vehicles through our websites. We plan to develop additional products and services for our mobile applications and media-related technology and enhance our big data analytics capabilities and AR- and VR-related technologies. See “Item 4. Information on the Company—B. Business Overview—Technology and Product Development” for more details.
Intellectual Property
See “Item 4. Information on the Company—B. Business Overview—Intellectual Property.”
Other than as disclosed elsewhere in this annual report, we are not aware of any trends, uncertainties, demands, commitments or events since the beginning of our fiscal year 2022 that are reasonably likely to have a material effect on our net revenues, income from operations, profitability, liquidity or capital resources, or that would cause the disclosed financial information to be not necessarily indicative of future operating results or financial condition.
Critical Accounting Estimates
We prepare our financial statements in conformity with U.S. GAAP, which requires us to make judgments, estimates and assumptions that affect the reported amounts of assets and liabilities, disclosure of contingent assets and liabilities at the end of each reporting period and the reported amount of revenue and expenses during each reporting period. We evaluate these estimates and assumptions based on historical experience, knowledge and assessment of current business and other conditions and expectations that we believe to be reasonable under the circumstances.
We consider an accounting estimate to be critical if: (i) the accounting estimate requires us to make assumptions about matters that were highly uncertain at the time the accounting estimate was made, and (ii) changes in the estimate that are reasonably likely to occur from period to period or use of different estimates that we reasonably could have used in the current period, would have a material impact on our financial condition or results of operations. Such critical estimates are discussed below. For further information on our other significant accounting estimates, see Note 2 to our consolidated financial statements included elsewhere in this annual report.
Allowance for Credit Losses
The allowance for credit losses represents our management’s estimate of the expected lifetime credit losses inherent in accounts receivables as of December 31, 2022. The adequacy of allowance for credit losses is assessed quarterly, and the assumptions and models used in establishing the allowance are evaluated regularly.
We estimated the allowance by segmenting accounts receivable into groups based on certain credit risk characteristics and estimated the allowance for credit losses on receivables not sharing similar risk characteristic on an individual basis. The key factors considered when determining the allowances for credit losses include the historical loss experience, lifetime for debt recovery, financial performance of the customers, current and future economic conditions.
118
We also provide specific provisions for allowance when facts and circumstances indicate that the receivable is unlikely to be collected. Expected credit losses are recorded as general and administrative expenses on the consolidated statements of comprehensive income. Changes in these estimates and assumptions could materially affect the credit losses.
Mezzanine Equity
The mezzanine equity represents the convertible redeemable noncontrolling interests in TTP as of December 31, 2022. According to different share purchase agreements between TTP and its preferred shareholders, the accounting measurement of TTP’s different rounds of preferred share issuance varies. Depending on the accounting measurement adopted, the value of mezzanine equity we recorded can be determined as (i) a percentage of the issue price, (ii) the fair value of the underlying convertible redeemable noncontrolling interests or a percentage of the issue price, whichever is higher, and (iii) the fair value of the underlying convertible redeemable noncontrolling interests or the compound annual interests accrued on such convertible redeemable noncontrolling interests, whichever is higher . See Note 20 to our consolidated financial statements for information regarding mezzanine equity.
The valuation of the fair value of these convertible redeemable noncontrolling interests is based on valuation techniques under the income approach and market approach. Major assumptions used in determining the fair value of these convertible redeemable noncontrolling interests include revenue growth rate, operating margin and discount rate. The projection of revenue growth rate is consistent with our management’s current assumptions about our business outlook in a short term and our management’s best estimates of our long-term growth and the return on equity in a longer term.
In addition, we used the option pricing model in determining the fair value. The major unobservable input used in the option pricing model included the equity value of underlying business, which was determined by our management using valuation techniques under the income approach and the market approach. The significant assumptions used in the valuation included revenue growth rate, operating margin, discount rate and selection of valuation multiples.
Critical Accounting Policies
When reviewing our consolidated financial statements, you should consider (a) our selection of critical accounting policies, (b) the judgment and other uncertainties affecting the application of such policies and (c) the sensitivity of reported results to changes in conditions and assumptions. For further information on our significant accounting policies, see Note 2 to our consolidated financial statements for 2020, 2021 and 2022. We consider the policies discussed below to be critical to an understanding of our consolidated financial statements as their application places significant demands on the judgment of our management. They should be read in conjunction with our consolidated financial statements, the risks and uncertainties as described under “Item 3. Key Information—D. Risk Factors” and other disclosures included in this annual report.
Revenue Recognition and Accounts Receivable
The Company accounts for revenue in accordance with the ASU No. 2014-09, “Revenue from Contracts with Customers (Topic 606)” (“ASC 606”). ASC 606 permits entities to apply one of two methods: retrospective or modified retrospective, since first adoption on January 1, 2018. ASC 606 was adopted on January 1, 2018 using the modified retrospective method. Results for the three years ended December 31, 2020, 2021 and 2022 are presented under ASC 606. The adoption changed the presentation of value-added-tax on gross basis to net basis and there was no adjustment to the beginning retained earnings on January 1, 2018. Our revenues are derived from media services, leads generation services and online marketplace and others. Under ASC 606, revenues are recognized when control of the promised goods or services is transferred to the customers, in an amount that reflects the consideration we expect to be entitled to in exchange for those goods or services. The recognition of revenue involves certain management judgments including identification of performance obligations, stand-alone selling price for each performance obligation, estimation of variable consideration represented by sales rebates, etc. We provide rebates to agency companies based on their cumulative annual advertising and service volume, and the timeliness of their payments, which are accounted for as variable consideration. We estimate our obligations under such agreements by
119
applying the most likely amount method, based on an evaluation of the likelihood of the agency companies’ achievement of the advertising and service volume targets and the timeliness of their payments, after taking into account the agency companies’ purchase trends and history. A refund liability, included in accrued expenses and other payables, is recognized for expected sales rebates payable to agency companies in relation to advertising services provided. We recognize revenue for the amount of fees we receive from the customers, after deducting these sales rebates, and net of VAT collected from customers. We believe that there will not be significant changes to our estimates of variable consideration and update the estimate at each reporting period as actual utilization becomes available.
We determine revenue recognition through the following steps:
Media services
Media services revenues mainly include revenues from automaker advertising services and regional marketing campaigns conducted by certain automobile brands’ regional offices. The majority of our online advertising service contracts involve multiple deliverables or performance obligations presented on PC and mobile platforms and in different formats, such as banner advertisements, links and logos, other media insertions and promotional activities that are delivered over different periods of time.
Revenue is allocated among these different deliverables based on their relative stand-alone selling prices. We generally determine the stand-alone selling price as the observable price of a product or service charged to customers when sold on a stand-alone basis. Advertising services are primarily delivered based on cost per day (“CPD”) pricing model. For CPD advertising arrangements, revenue is recognized when the corresponding advertisements are published over the stated display period. For cost per thousand impressions (“CPM”) model, revenue is recognized when the advertisements are displayed and based on the number of times that the advertisement has been displayed. For cost-per-click (“CPC”) model, revenue is recognized when the user clicks on the customer-sponsored links and based on the number of clicks. For certain marketing campaigns and promotional activities services, revenue is recognized when the corresponding services have been rendered.
Leads generation services
Leads generation services primarily include revenues from (i) dealer subscription services, (ii) advertising services sold to individual dealer advertisers, and (iii) used car listing services. Under the dealer subscription services, we make available throughout the subscription period a webpage linked to our websites and mobile applications where the dealers can publish information such as the pricing of their products, locations and addresses and other related information. Usually, advanced payment is normally made for the dealer subscription services and revenue is recognized over time on a straight line basis as services are constantly provided over the subscription period. For the advertising services sold to individual dealers, revenue is recognized when the advertising is published over the stated display period. The used car listing services primarily include listing and display of used vehicles, generation of sales leads, etc. through our platform. Our used car platform acts as a user interface that allows potential used car buyers to identify listings that meet their specific requirements and contact the sellers. Our service fee is charged based on the number of displayed days, or quantity of sales leads delivered. Revenue is recognized respectively at a point in time upon the display of vehicles or the delivery of sales leads.
120
Online marketplace and others
Online marketplace and others revenues primarily consist of revenues related to (i) data products, (ii) new and used vehicle transaction platform, and (iii) auto financing business, and others.
For the data products, we provide data-driven products and solutions for automakers and dealers, and recognize revenue over the service period of data-driven products and solutions by the automakers and dealers.
For the new and used vehicle transaction business, we provide platform-based services including facilitation of transactions, transaction-oriented marketing solutions, and generation of sales leads. For the new car vehicle transaction, we act as the platform for users to review automotive-related information and inquiry, and facilitates of transaction by delivering sales leads to the automakers. For the used vehicle transaction, we act as a used car consumer-to-business-to-consumer transaction system that facilitates the used car transaction between the sellers and buyers and charge the service fee per each sale. The new and used vehicle transaction revenue is recognized at a point in time when the sales leads are delivered or upon the successful facilitation of transaction.
For the auto-financing business, we provide a platform which serves as a bridge to match users and automobile sellers that have auto financing needs with our cooperative financial institutions that offer a variety of products covering merchant loans, consumer loans, leases and insurance services. The auto-financing service fee is charged on a per sale or lead basis, and the service fee is recognized at a point in time when the sales leads are delivered or upon the successful facilitation of transaction.
Contract Balances and Accounts Receivable
Deferred revenue is primarily related to the advanced payment related to dealer subscription services and used car listings under leads generation services. As of December 31, 2020 and 2021 and 2022, there was deferred revenue of RMB1,315.7million, RMB1,553.0 million and RMB1,147.1 million (US$166.3 million), respectively.
The beginning balance of deferred revenue of RMB1,553.0 million was fully recognized as revenue for the year ended December 31, 2022.
Accounts receivable are carried at net realizable value. Prior to the adoption of ASC 326, an allowance for doubtful accounts is recorded in the period when a loss is probable based on an assessment of specific evidence indicating troubled collection, historical experience, accounts aging and other factors. On January 1, 2020, we adopted Accounting Standards Update No. 2016-13, Financial Instruments-Credit Losses (Topic 326): Measurement of Credit Losses on Financial Instruments (“ASC 326”) using the modified retrospective transition method. ASC 326 replaces the existing incurred loss impairment model with a forward-looking current expected credit loss (“CECL”) methodology. We estimated the allowance by segmenting accounts receivable into groups based on certain credit risk characteristics and estimated the allowance for credit losses on receivables not sharing similar risk characteristic on an individual basis. The key factors considered when determining the allowances for credit losses include the historical loss experience, lifetime for debt recovery, financial performance of the customers, current and future economic conditions. An accounts receivable balance is written off after all collection effort has ceased.
Practical Expedients and Exemptions
We have elected to use the practical expedient to not disclose the remaining performance obligations for contracts that have durations of one year or less. We do not have significant remaining performance obligations in excess of one year. For the remaining performance obligations as of December 31, 2022, most of them are to be recognized within a year
The revenue standard requires us to recognize an asset for the incremental costs of obtaining a contract with a customer if the benefit of those costs is expected to be longer than one year. We have determined that sales commission for sales personnel meet the requirements of capitalization. However, we apply a practical expedient to expense these costs as incurred for costs to obtain a contract with a customer when the amortization period would have been one year or less.
121
Leases
Adoption of the New Lease Accounting Standard
In February 2016, the Financial Accounting Standards Board (“FASB”) issued Accounting Standards Update No. 2016-02, Leases. Further, as a clarification of the new guidance, the FASB issued several amendments and updates. We adopted the new lease guidance beginning January 1, 2019 by applying the modified retrospective method to those contracts that are not completed as of January 1, 2019, with the comparative information not being adjusted and continues to be reported under historic accounting standards. There is no impact to retained earnings at adoption.
We have elected to utilize the package of practical expedients at the time of adoption, which allows us to (1) not reassess whether any expired or existing contracts are or contain leases, (2) not reassess the lease classification of any expired or existing leases, and (3) not reassess initial direct costs for any existing leases. We also have elected to utilize the short-term lease recognition exemption and, for those leases that qualified, we did not recognize operating lease right-of-use (“ROU”) assets or operating lease liabilities. Upon the adoption of the new guidance on January 1, 2019, we recognized operating lease ROU assets of RMB184.8 million and operating lease liabilities of RMB176.4 million (including current portion of RMB121.8 million and non-current portion of RMB54.6 million). The amount of the operating lease right-of-use assets of RMB184.8 million over the operating lease liabilities of RMB176.4 million recognized on January 1, 2019 was credited to prepaid expenses and other current assets on the consolidated balance sheet as of January 1, 2019.
New Lease Accounting Policies
We determine if an arrangement is a lease and determine the classification of the lease, as either operating or finance, at commencement. We have operating leases for office buildings and data centers and has no finance leases as of December 31, 2022. Operating lease ROU assets and operating lease liabilities are recognized based on the present value of the lease payments over the lease term at commencement date.
As our leases do not provide an implicit rate, an incremental borrowing rate is used based on the information available at commencement date, to determine the present value of lease payments. The incremental borrowing rates approximate the rate we would pay to borrow in the currency of the lease payments for the weighted-average life of the lease.
The operating lease ROU assets also include any lease payments made prior to lease commencement and excludes lease incentives and initial direct costs incurred if any. Lease terms may include options to extend or terminate the lease when it is reasonably certain that we will exercise that option. Lease expense for minimum lease payments is recognized on a straight-line basis over the lease term.
Our lease agreements contain both lease and non-leas components, which are accounted for separately based on their relative standalone price.
As of December 31, 2022, we recognized the following items related to operating lease in its consolidated balance sheet.
|
|
As of December 31, 2022 |
|
|||||
|
|
RMB |
|
|
US$ |
|
||
|
|
(in thousands) |
|
|||||
Operating lease ROU assets |
|
|
115,118 |
|
|
|
16,691 |
|
Operating lease liabilities, current portion |
|
|
59,798 |
|
|
|
8,670 |
|
Operating lease liabilities, non-current portion |
|
|
50,591 |
|
|
|
7,335 |
|
122
Lease cost recognized in our consolidated statements of comprehensive income is summarized as follows:
|
|
For the Year Ended December 31, |
|
|||||
|
|
RMB |
|
|
US$ |
|
||
|
|
(in thousands) |
|
|||||
Operating lease cost |
|
|
128,081 |
|
|
|
18,570 |
|
Cost of other leases with terms less than one year |
|
|
87,603 |
|
|
|
12,701 |
|
Income taxes
We account for income taxes using the asset and liability method. Under this method, deferred tax assets and liabilities are determined based on the difference between the financial reporting and tax bases of assets and liabilities using enacted tax rates that will be in effect in the period in which the differences are expected to reverse. We record a valuation allowance against deferred tax assets if, based on the weight of available evidence, it is more-likely-than-not that some portion, or all, of the deferred tax assets will not be realized. The effect on deferred taxes of a change in tax rates is recognized in income in the period that includes the enactment date.
We apply ASC 740, Accounting for Income Taxes, to account for uncertainty in income taxes. ASC 740 prescribes a recognition threshold a tax position is required to meet before being recognized in the financial statements. We have recorded unrecognized tax benefits in the other liabilities line item in the accompanying consolidated balance sheets. We have elected to classify interest and penalties related to unrecognized tax benefits, if and when required, as part of “income tax expense”, in the consolidated statements of comprehensive income.
Our estimated liability for unrecognized tax benefits and the related interest and penalties are periodically assessed for adequacy and may be affected by changing interpretations of laws, rulings by tax authorities, changes and/or developments with respect to tax audits, and expiration of the statute of limitations. The actual benefits ultimately realized may differ from our estimates. As each audit is concluded, adjustments, if any, are recorded in our consolidated financial statements. Additionally, in future periods, changes in facts and circumstances, and new information may require us to adjust the recognition and measurement estimates with regard to individual tax positions. Changes in recognition and measurement estimates are recognized in the period in which they occur.
Fair Value Measurements of Financial Instruments
Our financial instruments primarily comprise of cash and cash equivalents, restricted cash, short-term investments, accounts receivable, amounts due from related parties, prepaid expenses and other current assets excluding prepayments and staff advances, other non-current assets excluding operating lease right-of-use assets and prepayments, accrued expenses and other payables, and amounts due to related parties. The carrying values of these financial instruments excluding other non-current assets approximated their fair values due to the short-term maturity of these instruments.
ASC topic 820 (“ASC 820”), Fair Value Measurements and Disclosures, establishes a three-tier fair value hierarchy, which prioritizes the inputs used in measuring fair value as follows:
Level 1—Observable inputs that reflect quoted prices (unadjusted) for identical assets or liabilities in active markets
Level 2—Include other inputs that are directly or indirectly observable in the marketplace
Level 3—Unobservable inputs which are supported by little or no market activity
ASC 820 describes three main approaches to measuring the fair value of assets and liabilities: (1) market approach; (2) income approach and (3) cost approach. The market approach uses prices and other relevant information generated from market transactions involving identical or comparable assets or liabilities. The income approach uses valuation techniques to convert future amounts to a single present value amount. The measurement is
123
based on the value indicated by current market expectations about those future amounts. The cost approach is based on the amount that would currently be required to replace an asset.
Intangible Assets
Intangible assets are carried at cost less accumulated amortization and any recorded impairment. Intangible assets acquired in a business combination were recognized initially at fair value at the date of acquisition. Intangible assets acquired in asset acquisitions are measured based on the cost to the acquiring entity, which generally includes transaction costs. Intangible assets with finite useful lives are amortized using a straight-line method of amortization that reflects the estimated pattern in which the economic benefits of the intangible asset are to be consumed.
Goodwill
Goodwill represents the excess of the purchase price over the amounts assigned to the fair value of the assets acquired and the liabilities assumed of an acquired business. Our goodwill at December 31, 2020, 2021 and 2022 was related to our acquisition of Cheerbright, China Topside, Norstar and TTP. In accordance with ASC 350, Goodwill and Other Intangible Assets, recorded goodwill amounts are not amortized, but rather are tested for impairment annually or more frequently if there are indicators of impairment present.
Goodwill is tested for impairment at the reporting unit level on an annual basis (December 31 for us) and between annual tests if an event occurs or circumstances change that would more-likely-than-not reduce the fair value of a reporting unit below its carrying value. These events or circumstances include a significant change in stock prices, business environment, legal factors, financial performances, competition, or events affecting the reporting unit. Application of the goodwill impairment test requires judgment, including the identification of reporting units, assignment of assets and liabilities to reporting units, assignment of goodwill to reporting units, and determination of the fair value of each reporting unit. The estimates used to calculate the fair value of a reporting unit change from year to year based on operating results and market conditions. Changes in these estimates and assumptions could materially affect the determination of fair value and goodwill impairment for the reporting unit.
Our management has determined that we represent the lowest level within the entity at which goodwill is monitored for internal management purposes. Our management evaluated the recoverability of goodwill by performing a qualitative assessment at the reporting unit level. Based on an assessment of the qualitative factors, our management determined that it is more-likely-than-not that the fair value of the reporting unit is in excess of its carrying amount. As of December 31, 2020, 2021 and 2022, goodwill was RMB3.9 billion, RMB3.9 billion and RMB3.9 billion (US$571.5 million), respectively. No impairment loss was recorded for any of the years presented. If we reorganize our reporting structure in a manner that changes the composition of one or more of its reporting units, goodwill is reassigned based on the relative fair value of each of the affected reporting units.
Share-based Compensation
Share-based awards granted to employees are accounted for under ASC 718, Compensation-Stock Compensation, which requires that share-based awards granted to employees be measured based on the grant date fair value and recognized as compensation expense over the requisite service period (which is generally the vesting period) in the consolidated statements of comprehensive income. We have elected to recognize compensation expense using the straight-line method for all share-based awards granted with service conditions that have a graded vesting schedule. For awards with performance condition and multiple service dates, if the performance conditions are all set at inception and independent for each year, each tranche should be accounted for as a separate award with its own requisite service period. Compensation cost should be recognized over the respective requisite service period separately for each separately-vesting tranche as though each tranche of the award is, in substance, a separate award.
Under ASC 718, an entity can make an accounting policy election to either estimate the number of awards that are expected to vest or account for forfeitures when they occur. We have elected to estimate the forfeiture rate at the time of grant and revise, if necessary, in subsequent periods if actual forfeitures differ from initial estimates. We recognize compensation cost for awards with performance conditions if and when we conclude that it is probable
124
that the performance condition will be achieved. We reassess the probability of vesting at each reporting period for awards with performance conditions and adjust compensation cost based on its probability assessment.
Forfeiture rates are estimated based on historical and future expectations of employee turnover rates and are adjusted to reflect future changes in circumstances and facts, if any. Share-based compensation expense is recorded net of estimated forfeitures such that expense is recorded only for those share- based awards that are expected to vest. To the extent we revise these estimates in the future, the share- based payments could be materially impacted in the period of revision, as well as in following periods. We, with the assistance of an independent third-party valuation firm, determined the fair value of the stock options granted to employees. The binomial option pricing model was applied in determining the estimated fair value of the options granted to employees. Subsequent to the IPO, fair value of the ordinary shares is the price of our publicly traded shares.
We account for a change in any of the terms or conditions of share-based awards as a modification in accordance with ASC subtopic 718-20, Compensation-Stock Compensation: Awards Classified as Equity, whereby the incremental fair value, if any, of a modified award, is recorded as compensation cost on the date of modification for vested awards or over the remaining vesting period for unvested awards. The incremental compensation cost is the excess of the fair value of the modified award on the date of modification over the fair value of the original award immediately before the modification.
ITEM 6 DIRECTORS, SENIOR MANAGEMENT AND EMPLOYEES
The following table sets forth information regarding our directors and executive officers as of the date of this annual report.
Directors and Executive Officers |
|
Age |
|
Position/Title |
Quan Long |
|
52 |
|
Director, Chairman of the Board and Chief Executive Officer |
Jun Lu |
|
49 |
|
Director |
Jing Xiao |
|
50 |
|
Director |
Zheng Liu |
|
54 |
|
Director |
Junling Liu |
|
58 |
|
Independent Director |
Tianruo Pu |
|
54 |
|
Independent Director |
Dazong Wang |
|
68 |
|
Independent Director |
Bibo Xiang |
|
45 |
|
Chief Technology Officer |
Craig Yan Zeng |
|
55 |
|
Chief Financial Officer |
Mr. Quan Long has served as our director, chairman of the board and chief executive officer since January 2021. Before joining Autohome, Mr. Long had held a series of leadership roles within Ping An Group since he first joined as a salesman in 1998, including as the assistant general manager, vice general manager and general manager of several provincial-level branches of Ping An Property & Casualty Insurance Company of China, Ltd. He has served as vice general manager of Ping An Property & Casualty Insurance Company of China, Ltd. since December 2018. In addition, Mr. Long has extensive experience in business management at leading Internet companies, such as serving as the assistant general manager of Lufax Holding Ltd (NYSE: LU; HKEX: 6623) in charge of insurance business between October 2015 and January 2017, as the senior director of Ant Group’s insurance business since February 2017, and as the director, general manager and chief executive officer of Cathay Insurance Company Limited between June 2017 and September 2018. Mr. Long received his bachelor’s degree in engineering and master’s degree in engineering in June 1992 and April 2001, respectively, both from Wuhan University of Technology.
Mr. Jun Lu (Jeff) has served as our director since October 2021. Mr. Lu has served as the general manager of the Investment Management Center of Ping An Group and the chairman of the board of Xinfangzheng Holding Development Co., Ltd. since May 2021, where he managed an investment portfolio of strategically important investments involving a value of over RMB500 billion of Ping An Group. Before joining Ping An Group, Mr. Lu has 26 years of experience spanning the areas of corporate management, corporate transactions and portfolio management. He served as a co-president of Jinsheng Group from May 2020 to May 2021 and the president of Yoozoo Holding Group and chief financial officer of YOOZOO Games Co., Ltd. (SHE: 002174) from July 2017 to
125
April 2020. Prior to that, he worked at PwC Shanghai from January 2002 to June 2017, having served in a number of senior management positions including as senior global partner and a lead partner and co-founder of PwC China’s Corporate Finance and M&A department. Mr. Lu received his bachelor’s degree in electronic engineering and management from Fudan University in July 1995 and obtained an executive master of business administration degree from China Europe International Business School in March 2005. Mr. Lu is a senior member of the China Appraisal Society.
Dr. Jing Xiao has served as our director since June 2020. Dr. Xiao is the Group Chief Scientist of Ping An Group, leading its research and development work in AI-related technologies and their applications in the areas of finance, healthcare, and smart-city. Before joining Ping An Group, Dr. Xiao worked as Principal Applied Scientist Lead in Microsoft Corp. (Nasdaq: MSFT) and Manager of Algorithm Group in Epson Research and Development, Inc.. He has a long career in research and development in artificial intelligence and related fields, which began in 1995, covering a broad range of application areas such as healthcare, autonomous driving, three-dimensional (3D) printing and display, biometrics, web search, and finance. Dr. Xiao received his PhD degree in May 2005 from the School of Computer Science, Carnegie Mellon University in the U.S., and has published over 120 academic papers and owns over 100 U.S. patents.
Mr. Zheng Liu has served as our director since December 2017. Mr. Liu currently serves as the deputy general manager of Ping An Property Insurance Company of China and Mr. Liu has over 25 years of experience in business management and the industry of insurance, in particular property insurance. He joined Ping An Group in 1993 and served consecutively as the deputy general manager and the general manager of Ping An Property Insurance Company of China’s Beijing Branch. In 2011, Mr. Liu was relocated to Ping An Property Insurance Company of China’s headquarters, and has since then served consecutively as its assistant general manager and general director of western China business unit, and deputy general manager. Mr. Liu received a Bachelor of Laws degree in July 1991 from Sun Yat-sen University in China.
Mr. Junling Liu has served as our independent director since January 2015. Mr. Liu is the co-founder, chairman and chief executive officer of 111, Inc. (Nasdaq: YI), an online healthcare cloud service provider. He co-founded and served as chief executive officer of YHD.com from 2008 to 2015. Prior to founding YHD.com, Mr. Liu served as the global vice president and president for mainland China and Hong Kong at Dell Inc. from 2006 to 2007. He also held various executive positions at internationally renowned technology companies such as Avaya (China) Communication Co., Ltd, Mr. Liu serves as an independent director of Hua Medicine (HKEX: 02552). Mr. Liu received his bachelor’s degree in education from Flinders University in Australia and master’s degree in international business administration from Flinders University.
Mr. Tianruo Pu has served as our independent director since December 2016. Mr. Pu currently serves as an independent director and chairman of the audit committee of OneConnect Financial Technology Co., Ltd. (NYSE: OCFT; HKEX: 6638), a financial technology company, as an independent director and chairman of the audit committee of 3SBio Inc. (HKEX: 1530), a bio-pharmaceutical company and as a director, chairman of the audit committee and member of the compensation committee as well as nominating and corporate governance committee of AnPac Bio-Medical Science Co., Ltd. (Nasdaq: ANPC), a bio-medical company. Mr. Pu has more than twenty years of work experience in finance and accounting in both the United States and China. Previously, Mr. Pu served as the chief financial officer of several companies including Zhaopin Limited (formerly NYSE: ZPIN), UTStarcom (Nasdaq: UTSI) and Nuokang Bio-Pharmaceutical (formerly Nasdaq: NKBP). Mr. Pu received an MBA degree in June 2000 from Northwestern University’s Kellogg School of Management in the U.S. and a Master of Science degree in accounting in May 1996 from the University of Illinois in the U.S.
Dr. Dazong Wang has served as our independent director since December 2016. Dr. Wang has been the founder and the chairman of Ophoenix Capital Management since 2011. From 2008 to 2011, Dr. Wang was the president and chief executive officer of Beijing Automotive Industry Corporation. From 2006 to 2008, Dr. Wang served as the vice president of Shanghai Automotive Industry Corporation, where he was responsible for engineering and key component operations. Dr. Wang received a Ph.D. degree from Cornell University in 1985 and a Master of Science degree from Huazhong University of Science and Technology in China in 1982.
Mr. Bibo Xiang has extensive experience in the fields of search engine, commercial advertising, recommendation system, natural language processing and data mining. Prior to joining Autohome, Mr. Xiang served
126
as senior vice president of VIPKID, and Chief Technology Officer of East Buy Holding Limited (formerly known as Koolearn Technology Holding Limited) (HKEX: 1797), in charge of digital transformation of education and training business. Prior to that, Mr. Xiang worked at Yahoo Search, Taobao Advertising, Shanda Online, 360 Search and 360 Commercial Products, where he was responsible for technology management of search, recommendation and advertising businesses. Mr. Xiang received his bachelor’s degree in Computer Science and Technology from Southwest Jiaotong University in 1999, and his master’s degree in Information Security from Beijing University of Posts and Telecommunications in 2006.
Mr. Craig Yan Zeng joined our Group as the chief financial officer since May 2022. Mr. Zeng has over 20 years of experience in capital market and has held senior management positions in many companies. He has been a director of LexinFintech (Nasdaq: LX) since December 2017 and served as the chief financial officer of LexinFintech from November 2016 to June 2021. Prior to joining LexinFintech, Mr. Zeng served as the chief financial officer of YeePay, an e-payment service provider in China. Before that, he served as the vice president of Hop Hing Group Holdings Limited, a company previously listed on the Hong Kong Stock Exchange, from 2013 to 2015, and as the executive vice president of VanceInfo Technologies Inc., a company previously listed on the New York Stock Exchange, from 2010 to 2013. Prior to 2010, Mr. Zeng served as a financial director of Microsoft (Greater China) from 2008 to 2009, and worked for Venustech Group Inc. (SZ: 002439) from 2006 to 2008, during which he served several senior management positions including as its chief operating officer and chief financial officer. He also worked for General Electric in the U.S. Mr. Zeng received his master’s degree in business administration from the Stern School of Business of New York University in 1999, and his bachelor’s degree in chemistry from Beijing University of Chemical Technology in 1991.
For the fiscal year of 2022, we paid an aggregate compensation expense of approximately RMB14.0 million (US$2.0 million) for our executive officers and directors (not including share-based compensation expenses). Our mainland China subsidiaries and the VIEs are required by laws to make contributions equal to certain percentages of each employee’s salary for his or her pension insurance, medical insurance, unemployment insurance, housing fund and other statutory benefits. Other than the above-mentioned statutory contributions mandated by applicable PRC laws, we have not set aside or accrued any amount to provide pension, retirement or other similar benefits to our executive officers and directors. For additional information on share incentive grants to our directors and executive officers, see “—Share Incentive Plans.”
Employment Agreements
We have entered into employment agreements with each of our executive officers. Under these agreements, each of our executive officers is employed for a specified time period. We may terminate employment for cause at any time without advance notice or remuneration for certain acts of the executive officer, such as a conviction or plea of guilty to a felony or any crime involving moral turpitude, negligent or dishonest acts to our detriment, or misconduct or a failure to perform agreed duties. In such case, the executive officer will not be entitled to receive payment of any severance benefits or other amounts by reason of the termination, and the executive officer’s right to all other benefits will terminate, except as required by any applicable law. We may also terminate an executive officer’s employment without cause upon one-month advance written notice. In such case of termination by us, we are required to provide compensation to the executive officer, including cash compensation determined based on the term of office of the involved executive officer. The executive officer may terminate the employment at any time with a one-month advance written notice, if there is any significant change in the executive officer’s duties and responsibilities inconsistent in any material and adverse respect with his or her title and position, or a material reduction in the executive officer’s annual salary before the next annual salary review, or if otherwise approved by the board of directors.
Each executive officer has agreed to hold, both during and after the termination or expiry of his or her employment agreement, in strict confidence and not to use, except as required in the performance of his or her duties in connection with the employment, any of our confidential information or trade secrets, any confidential information or trade secrets of our clients or prospective clients, or the confidential or proprietary information of any third party received by us and for which we have confidential obligations. The executive officers have also agreed to disclose in confidence to us all inventions, designs and trade secrets which they conceive, develop or reduce to
127
practice and to assign all right, title and interest in them to us, and assist us in obtaining patents, copyrights and other legal rights for these inventions, designs and trade secrets.
In addition, each executive officer has agreed to be bound by non-competition and non-solicitation restrictions during the term of his or her employment. Specifically, each executive officer has agreed not to (a) approach our clients, advertisers or contacts or other persons or entities introduced to the executive officer for the purpose of doing business with such persons or entities that will harm our business relationships with these persons or entities; (b) assume employment with or provide services to any of our competitors, or engage, whether as principal, partner, licensor or otherwise, any of our competitors; or (c) seek directly or indirectly, to solicit the services of any of our employees who is employed by us on or after the date of the executive officer’s termination, or in the year preceding such termination.
Share Incentive Plans
Unless otherwise specified, numbers of shares disclosed in this section have taken into account the effect of the share re-designation and share subdivision effective in February 2021.
2013 Share Incentive Plan
We adopted the 2013 Share Incentive Plan in November 2013. The maximum aggregate number of ordinary shares which may be issued pursuant to all awards under the 2013 Share Incentive Plan is 13,400,000. As of December 31, 2022, 1,658,068 restricted shares under the 2013 Share Incentive plan were outstanding. The following table summarizes the outstanding awards we had granted under the 2013 Share Incentive Plan as of December 31, 2022:
Name |
|
Restricted Shares |
|
Date of Grant |
|
Vesting Schedule |
Individuals other than directors and |
|
* |
|
Between September 16, 2021 and July 1, 2022 |
|
Approximately four years from each date of grant |
The following paragraphs summarize the terms of the 2013 Share Incentive Plan:
Types of Awards. The 2013 Share Incentive Plan permits the awards of options, restricted shares and restricted share units. The following briefly describe the principal features of the various awards that may be granted under the 2013 Share Incentive Plan.
128
Plan Administration. Our board or a committee of one or more members of our board duly authorized for the purpose of the 2013 Share Incentive Plan can act as the plan administrator.
Award Agreement. Options, restricted shares or restricted share units granted under the 2013 Share Incentive Plan are evidenced by an award agreement that sets forth the terms, conditions and limitations for each grant.
Eligibility. We may grant awards to our directors, employees or consultants.
Exercise Price. The exercise price in respect of any option shall be determined by the plan administrator and set forth in the award agreement which may be a fixed or variable price related to the fair market value of the shares. The exercise price per share subject to an option may be amended or adjusted in the absolute discretion of the plan administrator, the determination of which shall be final, binding and conclusive.
Term of the Options. The term of each option grant shall normally be no more than ten years from the date of the grant. If the grantee is an employee of ours who owns shares representing more than ten percent of the voting power of all classes of our shares immediately prior to the time the option is granted, then the term of the grant shall be no more than five years from the date of the grant.
Vesting Schedule and Condition. In general, the plan administrator determines the vesting schedule and vesting condition, which is set forth in the award agreement.
Transfer Restrictions. Unless otherwise determined by the plan administrator, no awards may be transferred other than by will or the laws of descent and distribution. Nevertheless, awards (other than incentive share-based awards) can be transferred to certain persons or entities related to the plan participants.
Termination. The 2013 Share Incentive Plan will expire in 2023 and may be terminated earlier with the approval of our board.
Amended and Restated 2016 Share Incentive Plan
Our board of directors adopted and amended the 2016 Share Incentive Plan, or the Amended and Restated 2016 Plan, in March 2017 and April 2017, respectively. The Amended and Restated 2016 Plan was approved by our then parent company Ping An Group at its general meeting on June 16, 2017 and was subsequently approved, confirmed and ratified by our shareholders at our extraordinary general meeting of shareholders on June 27, 2017. The maximum aggregate number of ordinary shares which may be issued pursuant to all awards under the Amended and Restated 2016 Plan is 19,560,000. As of December 31, 2022, options to purchase 2,259,504 ordinary shares under the Amended and Restated 2016 Plan at exercise prices ranging from US$22.19 to US$98.44 were outstanding. The following table summarizes, as of December 31, 2022, the outstanding options we had granted to our directors and officers and to other individuals as a group under the Amended and Restated 2016 Plan.
Name |
|
Options |
|
Exercise Price |
|
Date of Grant |
|
Date of |
|
Vesting Schedule |
Quan Long |
|
* |
|
9.73 |
|
November 1, 2021 |
|
Ten years after grant date |
|
Approximately four years from grant date |
Bibo Xiang |
|
* |
|
9.73 |
|
November 1, 2021 |
|
Ten years after grant date |
|
Approximately four years from grant date |
Craig Yan Zeng |
|
* |
|
6.73 |
|
August 1, 2022 |
|
Ten years after grant date |
|
Approximately four years from grant date |
Other individuals as |
|
* |
|
5.55-24.61 |
|
Between August 2, 2016 and September 22, 2022 |
|
Ten years after grant date |
|
Approximately four years from grant date |
Note:
* Less than 1% of our total outstanding share capital.
129
The following paragraphs describe the principal terms of the Amended and Restated 2016 Plan:
Types of Awards. The Amended and Restated 2016 Plan permits the awards of options, restricted shares, restricted share units and share appreciation rights. The following briefly describe the principal features of the various awards that may be granted under the Amended and Restated 2016 Plan.
The options shall lapse (to the extent not already exercised) automatically on the earliest of: (i) expiry of the term of any option, (ii) the date of termination of employment for certain causes, (iii) expiry of the 60-day period from the date of voluntary resignation of the participant, (iv) the date of termination of such other contract or agreement constituting a participant for his breach of the terms thereof or in accordance with the termination provisions of such contract or agreement by any contracting party, (v) expiry of the three-month period following the occurrence of an event which causes the participant to cease to be an eligible person, including ill-health, injury, disability, death or retirement, (vi) the date on which the resolution to voluntarily wind up the Company is passed and the date of the commencement of winding up of the Company.
Plan Administration. Our board or a committee of one or more members of our board duly authorized for the purpose of the Amended and Restated 2016 Plan can act as the plan administrator. Such committee may from time to time in its absolute discretion waive or amend the rules of the Amended and Restated 2016 Plan as it deems desirable, provided that, except with the prior approval of the shareholders of our Company and the shareholders of
130
our Hong Kong Parent (for so long as we remain a subsidiary of the Hong Kong Parent) in general meetings: (i) no alterations to any of the matters set out in Rule 17.03 of the Hong Kong Listing Rules shall be made to the advantage of participants; and (ii) no alterations to the terms and conditions of the Amended and Restated 2016 Plan which are of a material nature or any change to the terms of the options granted may be made, except where the alterations take effect automatically under the existing terms of the Amended and Restated 2016 Plan, provided that as we remain a subsidiary of the Hong Kong Parent, the amended terms must still comply with the relevant requirements of Chapter 17 of the Hong Kong Listing Rules.
Award Agreement. Options, restricted shares or restricted share units granted under the Amended and Restated 2016 Plan are evidenced by an award agreement that sets forth the terms, conditions and limitations for each grant.
Eligibility. We may grant awards to our directors, employees or consultants.
Exercise Price. The exercise price in respect of any option shall be determined by the plan administrator and set forth in the award agreement which may be a fixed or variable price related to the fair market value of the shares. The exercise price per share subject to an option may be amended or adjusted in the absolute discretion of the plan administrator, the determination of which shall be final, binding and conclusive. For so long as we remain a subsidiary of the Hong Kong Parent, the determination of the exercise price shall comply with the Hong Kong Listing Rules.
Term of the Options. The term of each option grant shall normally be no more than ten years from the date of the grant. If the grantee is an employee of ours who owns shares representing more than ten percent of the voting power of all classes of our shares immediately prior to the time the option is granted, then the term of the grant shall be no more than five years from the date of the grant.
Vesting Schedule and Condition. In general, the plan administrator determines the vesting schedule and condition, which is set forth in the award agreement.
Transfer Restrictions. Unless otherwise determined by the plan administrator, no awards may be transferred other than by will or the laws of descent and distribution. Nevertheless, awards (other than options) can be transferred to certain persons or entities related to the plan participants.
Termination. The Amended and Restated 2016 Plan will expire in 2027 and may be terminated earlier with the approval of our board.
Amended 2016 Share Incentive Plan II
We adopted the 2016 Share Incentive Plan II (as amended by Amendment No. 1 to the 2016 Share Incentive Plan II), or the Amended 2016 Share Incentive Plan II, at the annual general meeting of shareholders in December 2016. The maximum aggregate number of ordinary shares which may be issued pursuant to all awards under the Amended 2016 Share Incentive Plan II is 12,000,000. As of December 31, 2022, 7,498,972 restricted shares under the Amended 2016 Share Incentive Plan II were outstanding.
131
The following table summarizes the outstanding restricted shares that we had granted to our directors and officers and to other individuals as a group under our Amended 2016 Share Incentive Plan II as of December 31, 2022.
Name |
|
Restricted |
|
Date of Grant |
|
Vesting Schedule |
Quan Long |
|
* |
|
November 1, 2021 |
|
Approximately four years from each date of grant |
Bibo Xiang |
|
* |
|
November 1, 2021 |
|
Approximately four years from each date of grant |
Craig Yan Zeng |
|
* |
|
August 1, 2022 |
|
Approximately four years from each date of grant |
Directors and officers as a group |
|
* |
|
March 1, 2021 |
|
Approximately four years from each date of grant |
Other individuals as a group |
|
* |
|
Between December28, 2018 and December 1, 2022 |
|
Approximately four years from each date of grant |
Note:
* Less than 1% of our total outstanding share capital.
The following paragraphs describe the principal terms of the Amended 2016 Share Incentive Plan II:
Types of Awards. The Amended 2016 Share Incentive Plan II permits the awards of restricted shares. A restricted share award is the grant of our ordinary shares which are subject to certain restrictions and may be subject to risk of forfeiture. Unless otherwise determined by our plan administrator, a restricted share is nontransferable and may be forfeited or repurchased by us upon termination of employment or service during a restricted period. Our plan administrator may also impose other restrictions on the restricted shares, such as limitations on the right to vote or the right to receive dividends.
Plan Administration. Our board or a committee of one or more members of our board duly authorized for the purpose of the Amended 2016 Share Incentive Plan II can act as the plan administrator.
Award Agreement. Restricted shares granted under the Amended 2016 Share Incentive Plan II are evidenced by an award agreement that sets forth the terms, conditions and limitations for each grant.
Eligibility. We may grant awards to our directors, employees or consultants.
Vesting Schedule and Condition. In general, the plan administrator determines the vesting schedule and condition, which is set forth in the award agreement.
Transfer Restrictions. Unless otherwise determined by the plan administrator, no awards may be transferred other than by will or the laws of descent and distribution, or to certain persons or entities related to the plan participants.
Termination. The Amended 2016 Share Incentive Plan II will expire in 2026 and may be terminated earlier with the approval of our board of directors.
Board of Directors
Our board of directors consists of seven directors. A director is not required to hold any shares in the Company by way of qualification. A director may vote with respect to any contract, proposed contract or arrangement in which he or she is materially interested provided that (a) such director, if his or her interest in such contract or arrangement is material, has declared the nature of his or her interest at the earliest meeting of the board at which it
132
is practicable for him or her to do so, either specifically or by way of a general notice and (b) if such contract or arrangement is a transaction with a related party, such transaction has been approved by the audit committee. The directors may exercise all the powers of the company to borrow money, mortgage its undertaking, property and uncalled capital, and issue debentures or other securities whenever money is borrowed or as security for any obligation of the company or of any third party. None of our independent directors has a service contract with us that provides for benefits upon termination of service.
Board committees
We have established three committees under the board of directors: the audit committee, the compensation committee and the nominating and corporate governance committee. We have adopted a charter for each of the three committees. The committee charters are available on our website. Each committee’s members and functions are described below.
Audit Committee. Our audit committee consists of Mr. Tianruo Pu, Dr. Dazong Wang and Mr. Junling Liu. Mr. Tianruo Pu is the chairman of our audit committee. All of the members of our audit committee satisfy the “independence” requirements of Section 303A of the New York Stock Exchange Listed Company Manual and Rule 10A-3 under the Exchange Act. In addition, our board of directors has determined that Mr. Tianruo Pu qualifies as an audit committee financial expert as defined in Item 16A of Form 20-F.
The audit committee oversees our accounting and financial reporting processes and the audits of the financial statements of our company. The audit committee is responsible for, among other things:
Compensation Committee. Our compensation committee consists of Mr. Quan Long, Mr. Zheng Liu and Dr. Dazong Wang. Mr. Quan Long is the chairman of our compensation committee. Dr. Dazong Wang satisfies the “independence” requirements of Section 303A of the New York Stock Exchange Listed Company Manual.
The compensation committee assists the board in reviewing and approving the compensation structure, including all forms of compensation, relating to our directors and executive officers. Our chief executive officer may not be present at any committee meeting during which his compensation is deliberated. The compensation committee is responsible for, among other things:
133
Nominating and Corporate Governance Committee. Our nominating and corporate governance committee consists of Mr. Quan Long, Dr. Jing Xiao and Mr. Tianruo Pu. Mr. Quan Long is the chairman of our nominating and corporate governance committee. Mr. Tianruo Pu satisfies the “independence” requirements of Section 303A of New York Stock Exchange Listed Company Manual.
The nominating and corporate governance committee assists the board of directors in selecting individuals qualified to become our directors and in determining the composition of the board and its committees. The nominating and corporate governance committee is responsible for, among other things:
Duties of Directors
Under Cayman Islands laws, our directors have a duty to act honestly in good faith with a view to our best interests. Our directors also owe to our company a duty to act with skill and care. It was previously considered that a director needs not exhibit in the performance of his or her duties a greater degree of skill than may reasonably be expected from a person of his or her knowledge and experience. However, English and Commonwealth courts have moved towards an objective standard with regard to the required skill and care and these authorities are likely to be followed in the Cayman Islands. In fulfilling their duty of care to us, our directors must ensure compliance with our memorandum and articles of association. Our company has the right to seek damages if a duty owed by our directors is breached.
Terms of Directors and Officers
Our directors are elected by an ordinary resolution or by a resolution of the directors. A director may be removed by way of a special resolution of the shareholders at any time before the expiration of his period of office for reasonable cause, including but not limited to fraud, criminal conviction or failure by such director to fulfill the duties of a director. A vacancy on the board created by the removal of a director may be filled by the appointment by ordinary resolution at the meeting at which such director is removed or by the affirmative vote of a simple majority of the remaining directors present and voting at a board meeting. In addition, a director will cease to be a director if he (i) becomes bankrupt or makes any arrangement or composition with his creditors; (ii) dies or is found to be or becomes of unsound mind; (iii) resigns his office by notice in writing; (iv) without special leave of absence from our board, is absent from meetings of our board for six consecutive months and the board resolves that his office be vacated; (v) is prohibited by law from being a director; or (vi) ceases to be a director by virtue of the Companies Act or is removed from office pursuant to our memorandum and articles of association. Our officers are elected by and serve at the discretion of the board of directors.
134
We had 3,905, 5,793 and 5,355 employees as of December 31, 2020, 2021 and 2022, respectively. The following table sets forth the number of our employees by function as of December 31, 2022:
Functional Area |
|
Number of Employees |
|
|
Sales and marketing |
|
|
2,249 |
|
Product development |
|
|
1,332 |
|
Content and editorial |
|
|
1,351 |
|
Management and administrative |
|
|
423 |
|
Total |
|
|
5,355 |
|
Through a combination of short-term performance evaluations and long-term incentive arrangements, we intend to build a competent, loyal and highly motivated workforce. We have not experienced any work stoppages due to labor disputes.
Ordinary Shares
As of March 31, 2023, we had 492,889,772 ordinary shares outstanding (excluding 16,497,828 treasury shares and ordinary shares that are reserved for future issuance under our share incentive plans). In addition, as of March 31, 2023, we had granted, and had outstanding, options to purchase a total of 2,320,552 ordinary shares and 8,348,300 restricted shares to our employees and directors. For information regarding the share incentive plans, see “Item 6. Directors, Senior Management and Employees—B. Compensation of Directors and Executive Officers.”
Beneficial Ownership of Ordinary Shares
Except as specifically noted in the table, the following table sets forth information with respect to the beneficial ownership of our ordinary shares as of March 31, 2023:
Beneficial ownership is determined in accordance with the rules and regulations of the SEC. In computing the number of shares beneficially owned by a person and the percentage ownership of that person, we have included shares that the person has the right to acquire within 60 days, including through the exercise of any option, warrant
135
or other right or the conversion of any other security. These shares, however, are not included in the computation of the percentage ownership of any other person.
|
|
Ordinary Shares Beneficially Owned as of |
|
|||||
|
|
Number |
|
|
%(1) |
|
||
Directors and Executive Officers:** |
|
|
|
|
|
|
||
Quan Long(2) |
|
* |
|
|
* |
|
||
Jun Lu |
|
|
— |
|
|
|
— |
|
Jing Xiao |
|
|
— |
|
|
|
— |
|
Zheng Liu |
|
|
— |
|
|
|
— |
|
Junling Liu(3) |
|
* |
|
|
* |
|
||
Tianruo Pu(4) |
|
* |
|
|
* |
|
||
Dazong Wang(5) |
|
* |
|
|
* |
|
||
Bibo Xiang(6) |
|
* |
|
|
* |
|
||
Craig Yan Zeng(7) |
|
* |
|
|
* |
|
||
All Directors and Executive Officers as a Group |
|
* |
|
|
* |
|
||
Principal Shareholders: |
|
|
|
|
|
|
||
Yun Chen(8) |
|
|
224,800,512 |
|
|
|
45.6 |
% |
Entities Affiliated with FIL(9) |
|
|
25,669,824 |
|
|
|
5.2 |
% |
Notes:
* Less than 1% of our total outstanding share capital.
** Except as indicated otherwise below, the business address of our directors and executive officers is 18th Floor Tower B, CEC Plaza, 3 Dan Ling Street, Haidian District, Beijing 100080, The People’s Republic of China.
To our knowledge, as of March 31, 2023, 268,373,648 ordinary shares (excluding 16,497,828 treasury shares and ordinary shares that are reserved for future issuance under our share incentive plans as of March 31, 2023) were held by one person in the United States, Deutsche Bank Trust Company Americas, the depositary of our ADS program, which holds ordinary shares in our company indirectly through HKSCC Nominees Limited following the Hong Kong Offering. The number of beneficial owners of our ADSs in the United States is likely to be much larger than the number of record holders of our ordinary shares in the United States.
136
Not applicable.
As of March 31, 2023, Yun Chen owned 45.6% of our total issued and outstanding ordinary shares. Yun Chen is a subsidiary of Ping An Group. As such, we are indirectly controlled by Ping An Group, which beneficially owned 45.6% of the total voting rights in our company.
Please refer to “Item 6. Directors, Senior Management and Employees—E. Share Ownership.”
Contractual Arrangements with the Variable Interest Entities
PRC laws and regulations currently limit foreign ownership of companies that engage in internet services. As a result, we provide the services that may be subject to such restrictions in the PRC through the VIEs and their subsidiaries, and we operate our businesses in the mainland China through certain contractual arrangements with the VIEs and their respective shareholders. Terms contained in each set of contractual arrangements with the VIEs and their respective shareholders are substantially similar. As a result of the contractual arrangements, Autohome Inc. becomes the primary beneficiary of the VIEs and their subsidiaries for accounting purposes and treat each of them as a mainland China consolidated entity under U.S. GAAP.
However, investors in our ordinary shares or ADSs are not purchasing equity interest in the VIEs in mainland China but instead are purchasing equity interest in a holding company incorporated in the Cayman Islands. The contractual arrangements may not be as effective as direct ownership in providing us with control over the VIEs, and we may incur substantial costs to enforce the terms of the arrangements. In addition, these arrangements have not been tested in courts of mainland China. See “Item 3. Key Information—D. Risk Factors—Risks Related to Our Corporate Structure—Our contractual arrangements with the VIEs may not be as effective in providing operational control as direct ownership” and “—The interests of the individual nominee shareholders of the VIEs may be different from our interests, which may materially and adversely affect our business.”
We have the following contractual arrangements by and among the following entities to conduct most of our operations in mainland China:
Autohome WFOE entered into a series of contractual agreements with Autohome Information and each of its individual nominee shareholders. The currently effective contractual agreements were entered into in February 2021 by and between Autohome WFOE, Autohome Information, Mr. Quan Long, our chairman of the board of directors and chief executive officer, and Ms. Haiyun Lei. Autohome WFOE has also entered into a series of contractual agreements with Autohome Information and two of its subsidiaries, respectively, namely Autohome Advertising and Chengshi Advertising. Such contractual arrangements allow Autohome WFOE to (i) have power to direct significant
137
activities of Autohome Information and its subsidiaries, (ii) receive substantially all of the economic benefits of Autohome Information and its subsidiaries, and (iii) have an exclusive option to purchase all or part of the equity interests in Autohome Information and its subsidiaries when and to the extent permitted by the PRC laws.
In addition, Chezhiying WFOE has entered into a series of contractual agreements with Shengtuo Hongyuan and each of its individual nominee shareholders. The currently effective contractual agreements were entered into in February 2021 by and between Chezhiying WFOE, Shengtuo Hongyuan, Mr. Quan Long, our chairman of the board of directors and chief executive officer, and Ms. Haiyun Lei. Chezhiying WFOE has also entered into a series of contractual agreements with Shengtuo Hongyuan and its subsidiary, namely Autohome Used Car Appraisal. Such contractual arrangements allow Chezhiying WFOE to (i) have power to direct significant activities of Shengtuo Hongyuan and its subsidiary, (ii) receive substantially all of the economic benefits of Shengtuo Hongyuan and its subsidiary, and (iii) have an exclusive option to purchase all or part of the equity interests in Shengtuo Hongyuan and its subsidiary when and to the extent permitted by the PRC laws.
In December 2020, the Company acquired TTP which operates an online bidding platform for used automobiles in mainland China primarily through Shanghai Jinwu, which holds an auction business approval certificate and a value-added telecommunications license for engaging in internet information services. In August 2015, TTP WFOE entered into a series of contractual agreements with Shanghai Jinwu and Weiwei Wang, being the individual nominee shareholder of Shanghai Jinwu. In March and May of 2022, TTP WFOE also entered into a series of contractual agreements with Shanghai Jinyou and its two individual nominee shareholders, namely Weiwei Wang and Lan Zhang. As of the date of this annual report, the operation of online bidding platform for used automobiles in Shanghai Jinwu is in the process of transferring to Shanghai Jinyou, which also holds an auction business approval certificate and a value-added telecommunications license for engaging in internet information services. The contractual arrangements of TTP WFOE with Shanghai Jinwu and Shanghai Jinyou, respectively, and their respective shareholder(s) allow TTP to (i) have power to direct significant activities of Shanghai Jinwu and Shanghai Jinyou, (ii) receive substantially all of the economic benefits of Shanghai Jinwu and Shanghai Jinyou, and (iii) have an exclusive option to purchase all or part of the equity interests in Shanghai Jinwu and Shanghai Jinyou when and to the extent permitted by the PRC laws.
We have also entered into contractual arrangements with other affiliate entities and their respective nominee shareholders, through our WFOEs in mainland China, which results in our WFOEs being the primary beneficiary of the relevant affiliate entities for accounting purposes. As a result of these contractual arrangements, we consolidate such affiliate entities as well, which have not generated significant revenues as of the date of this annual report.
138
The diagram below illustrates the general structure of the economic flow and control under the VIE structure created by the contractual arrangements:
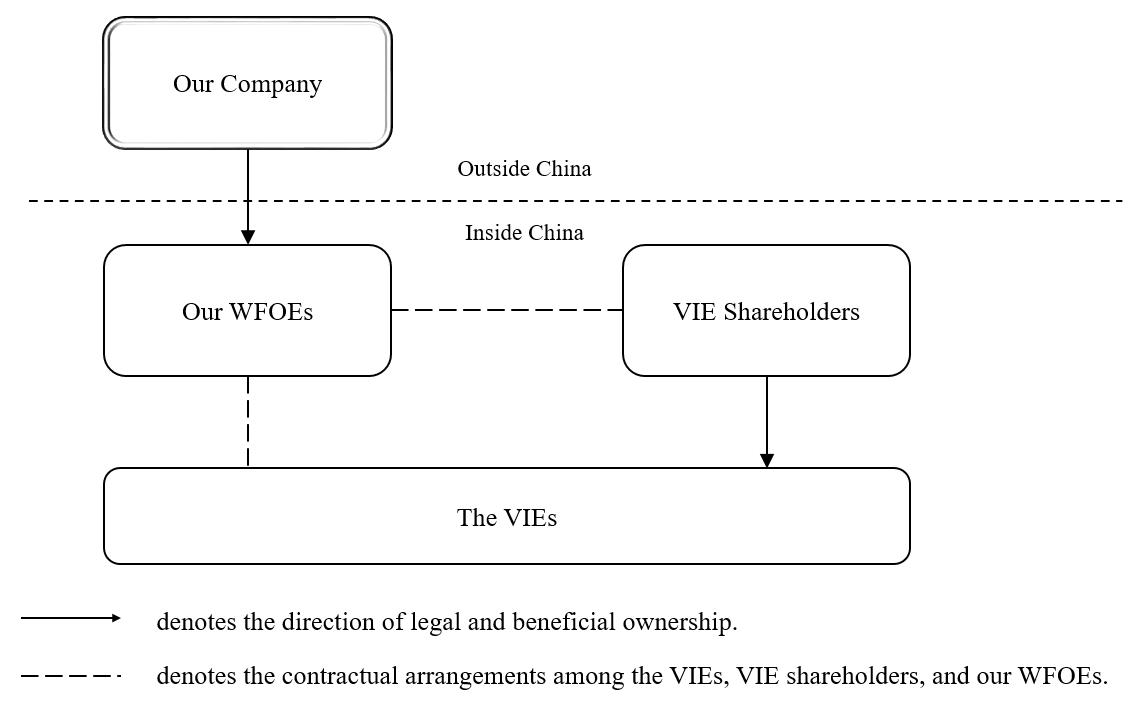
Agreements that provide us power to direct significant activities of Autohome Information, Autohome Advertising and Chengshi Advertising
The following is a summary of the currently effective contractual arrangements by and among Autohome WFOE, Autohome Information, the shareholders of Autohome Information, Autohome Advertising and Chengshi Advertising (as applicable).
Equity Interest Pledge Agreements. Pursuant to the equity interest pledge agreements between Autohome WFOE and each of the two shareholders of Autohome Information entered into in February 2021, each shareholder of Autohome Information pledges to Autohome WFOE all of his or her equity interests in Autohome Information to secure the performance of such shareholder’s respective obligations and Autohome Information’s obligations under the loan agreements, equity option agreements, and the exclusive technology consulting and service agreements. Without Autohome WFOE’s consent, shareholders of Autohome Information shall not create or permit to create any encumbrances on the pledged equity interests in Autohome Information. In the event of default, Autohome WFOE is entitled to request immediate repayment of the outstanding amounts payable under the loan agreements, the equity option agreements and the exclusive technology consulting and service agreements or to dispose of the pledged equity interests at Autohome WFOE’s sole discretion. The equity pledge agreements have an indefinite term and will terminate after all the secured obligations under these agreements have been satisfied in full or the pledged equity interests have been transferred to Autohome WFOE or its designee.
Pursuant to the equity interest pledge agreements between Autohome WFOE and Autohome Information entered into in September 2016, Autohome Information pledges to Autohome WFOE all of its equity interests in Chengshi Advertising and Autohome Advertising to secure the performance of its obligations under the equity option agreements and the obligations of Chengshi Advertising and Autohome Advertising under the exclusive technology consulting and service agreements. These equity interest pledge agreements contain substantially the same terms as the equity interest pledge agreements between Autohome WFOE and the shareholders of Autohome Information.
Exclusive Technology Consulting and Service Agreements. Pursuant to the exclusive technology consulting and service agreements entered into between Autohome WFOE and each of Autohome Information, Autohome
139
Advertising and Chengshi Advertising in February 2021, September 2016 and September 2016, respectively, Autohome WFOE has the exclusive right to provide each of these VIEs comprehensive technology and management consulting services. In addition, Autohome WFOE is obligated to provide financing support to each of these VIEs to ensure the cash flow requirements of the day-to-day operations of these VIEs. Each of these VIEs is obligated to pay to Autohome WFOE service fees, which are calculated based on such VIE’s revenues reduced by its tax, operating expenses and an appropriate amount of retained profit that is determined pursuant to our tax planning strategies and relevant tax laws. Such service fees may be adjusted by Autohome WFOE at Autohome WFOE’s sole discretion. Autohome WFOE owns the intellectual properties arising from the performance of these agreements. These agreements have a 30-year term that can be automatically extended for another 10 years at the option of Autohome WFOE and can only be terminated by the parties’ mutual written consent or by Autohome WFOE’s prior 30-day notice at its sole discretion. During the term of these agreements, these VIEs may not enter into any agreements with third parties for the provision of any technology or management consulting services without prior consent of Autohome WFOE.
Equity Option Agreements. Pursuant to the equity option agreements among Autohome WFOE, Autohome Information and each of the two shareholders of Autohome Information entered into in February 2021, each shareholder of Autohome Information jointly and severally grants to Autohome WFOE an option to purchase all or part of his or her equity interests in Autohome Information at a price equivalent to the lowest price permitted by PRC law. The purchase price is to be offset against the loan repayments under the loan agreements. If there will be additional payments to be made by Autohome Information to these shareholders required by the PRC law, these shareholders must immediately return the received payments to Autohome WFOE. Autohome WFOE may exercise its option at any time or transfer the rights and obligations under the equity option agreement to any of its designated parties. The equity option agreements have an indefinite term and will terminate at the earlier of (i) the date on which the equity interests in Autohome Information have been transferred to Autohome WFOE or its designated parties, or (ii) the unilateral termination by Autohome WFOE.
Pursuant to the equity option agreements among Autohome WFOE, Autohome Information and two of Autohome Information’s subsidiaries, namely Autohome Advertising and Chengshi Advertising, entered into in September 2016, Autohome Information granted Autohome WFOE or its designated parties an option to purchase all or part of Autohome Information’s equity interests in these Autohome Information subsidiaries at a price equivalent to the lowest price permitted by PRC laws. Autohome WFOE may exercise its option at any time. The equity option agreements have an indefinite term and will terminate at the earlier of (i) the date on which all of Autohome Information’s equity interests in these subsidiaries have been transferred to Autohome WFOE or its designated parties, or (ii) the unilateral termination by Autohome WFOE.
Power of Attorney. In February 2021, each of the shareholders of Autohome Information executed an irrevocable power of attorney appointing Autohome WFOE, or any person designated by Autohome WFOE, as their attorney-in-fact, to vote on their behalf at the shareholders’ meetings of Autohome Information and to exercise full voting rights as the shareholders of the company with powers granted under PRC laws and regulations and the articles of association of the company, including the rights to appoint directors and management personnel. In September 2016, Autohome Information executed irrevocable powers of attorney appointing Autohome WFOE, or any person designated by Autohome WFOE, as their attorney-in-fact, to vote on their behalf at the shareholders’ meetings of Autohome Advertising and Chengshi Advertising and to exercise full voting rights as the shareholders of these companies with powers granted under PRC laws and regulations and the articles of association of each of the above companies, including the rights to appoint directors and management personnel.
Loan Agreements. Pursuant to the loan agreements between Autohome WFOE and each of the two shareholders of Autohome Information entered into in February 2021, Autohome WFOE granted interest-free loans to these two shareholders of Autohome Information. The loans are to be used solely for the purpose of making capital contributions to the registered capital of Autohome Information. The term of the loans is indefinite and must be repaid in the manner specified in the agreements upon written notice from Autohome WFOE at any time in Autohome WFOE’s sole discretion or upon an event of default by the shareholders of Autohome Information.
140
Agreements that provide us power to direct significant activities of Shengtuo Hongyuan and Autohome Used Car Appraisal
Equity Interest Pledge Agreements. In February 2021, Chezhiying WFOE and each of the shareholders of Shengtuo Hongyuan entered into equity interest pledge agreements with respect to their equity interest in Shengtuo Hongyuan. The terms of these agreements are substantially the same as the equity interest pledge agreements between Autohome WFOE and each of the two shareholders of Autohome Information described above. In September 2016, Chezhiying WFOE and Shengtuo Hongyuan entered into equity interest pledge agreements with respect to the latter’s equity interest in Autohome Used Car Appraisal. The terms of these agreements are substantially the same as the equity interest pledge agreements between Autohome WFOE and Autohome Information. The registration of the equity interest pledge in Shengtuo Hongyuan was completed in March 2021.
Exclusive Technology Consulting and Service Agreements. In February 2021, Chezhiying WFOE and Shengtuo Hongyuan entered into an exclusive technology consulting and service agreement. In September 2016, Chezhiying WFOE and Autohome Used Car Appraisal entered into exclusive technology consulting and service agreement. The terms of these agreements are substantially the same as the exclusive technology consulting and service agreements between Autohome WFOE and each of Autohome Information, Autohome Advertising and Chengshi Advertising described above.
Equity Option Agreements. In February 2021, Chezhiying WFOE, Shengtuo Hongyuan and each of the shareholders of Shengtuo Hongyuan entered into equity option agreements. The terms of these agreements are substantially the same as the equity option agreements among Autohome WFOE, Autohome Information and each of the two shareholders of Autohome Information described above. In September 2016, Chezhiying WFOE, Shengtuo Hongyuan and Autohome Used Car Appraisal entered into equity option agreement. The terms of such agreement are substantially the same as the equity option agreements among Autohome WFOE, Autohome Information and each of Autohome Advertising and Chengshi Advertising.
Power of Attorney. In February 2021, each of the shareholders of Shengtuo Hongyuan executed an irrevocable power of attorney appointing Chezhiying WFOE, or any person designated by Chezhiying WFOE, as their attorney-in-fact, to vote on their behalf at the shareholders’ meetings of Shengtuo Hongyuan and to exercise full voting rights as the shareholders of Shengtuo Hongyuan with powers granted under PRC laws and regulations and the articles of association of the company, including the rights to appoint directors and management personnel. In September 2016, Shengtuo Hongyuan executed an irrevocable power of attorney appointing Chezhiying WFOE, or any person designated by Chezhiying WFOE, as their attorney-in-fact, to vote on their behalf at the shareholders’ meetings of Autohome Used Car Appraisal to exercise full voting rights as the shareholders of Autohome Used Car Appraisal with powers granted under PRC laws and regulations and the articles of association of Autohome Used Car Appraisal, including the rights to appoint directors and management personnel.
Loan Agreements. In Feburary 2021, Chezhiying WFOE and each of the shareholders of Shengtuo Hongyuan entered into loan agreements. The terms of these agreements are substantially the same as the loan agreements between Autohome WFOE and each of the two shareholders of Autohome Information described above.
Agreements that provide us power to direct significant activities of Shanghai Jinwu and Shanghai Jinyou
In December 2020, the Company acquired TTP which conducted its business related to internet content services in mainland China primarily through Shanghai Jinwu. In August 2015, TTP WFOE entered into a series of contractual agreements with Shanghai Jinwu and Weiwei Wang, being the individual nominee shareholder of Shanghai Jinwu. The contractual arrangements of TTP WFOE with Shanghai Jinwu and its shareholders allow TTP to (i) have power to direct significant activities of Shanghai Jinwu, (ii) receive substantially all of the economic benefits of Shanghai Jinwu, and (iii) have an exclusive option to purchase all or part of the equity interests in Shanghai Jinwu when and to the extent permitted by the PRC laws.
In March and May of 2022, TTP WFOE also entered into a series of contractual agreements with Shanghai Jinyou and its two individual nominee shareholders, namely Weiwei Wang and Lan Zhang. As of the date of this annual report, the operation of online bidding platform for used automobiles in Shanghai Jinwu is in the process of transferring to Shanghai Jinyou, which also holds an auction business approval certificate and a value-added
141
telecommunications license for engaging in internet information services. The terms of the contractual agreements of TTP WFOE with Shanghai Jinyou and its individual nominee shareholders are substantially the same as the contractual agreements among TTP WFOE, Shanghai Jinwu and its individual nominee shareholder as described above.
Autohome WFOE, Chezhiying WFOE and TTP WFOE recognized service fees from all the VIEs in the amount of RMB219.5 million in 2020, RMB309.7 million in 2021 and RMB496.9 million (US$72.0 million) in 2022 in consideration for services provided to the VIEs. In the years ended December 31, 2020, 2021 and 2022, the VIEs contributed in aggregate 8.1%, 13.1% and 12.7%, respectively, of our total net revenue.
Transactions with Entities Affiliated with Our Shareholders
Since Ping An Group became our controlling shareholder, it provided services including rental and property management services, technical services and other miscellaneous services, and assets to us for a total amount of RMB156.4 million in 2020, RMB176.9 million in 2021 and RMB191.8 million (US$27.8 million) in 2022.
We earned service fees primarily for providing facilitation services related to insurance products and loan and leasing product transactions for Ping An Group or its affiliates on our platform as well as providing advertising services to Ping An Group for a total amount of RMB621.8 million in 2020, RMB417.1 million in 2021 and RMB226.5 million (US$32.8 million) in 2022.
We also had cash or time deposits with commercial banks affiliated with Ping An Group and purchased in short-term cash management products managed by Ping An Group as a part of our cash management plan, which totaled RMB3,466.9 million, RMB4,144.8 million and RMB5,187.0 million (US$752.0 million) as of December 31, 2020, 2021 and 2022, respectively. On January 4, 2022, we entered into a limited partner interest subscription agreement, a limited partnership agreement and certain other auxiliary documents with Ping An Capital Co., Ltd., an affiliate of Ping An Group, pursuant to which we agreed to subscribe for RMB400 million worth of limited partner interests in an equity investment fund managed by Ping An Capital Co., Ltd. The subject subscription was approved by our board of directors and its audit committee and was announced on the same day.
Investor’s Rights Agreements
Following Yun Chen’s acquisition of 47.4% the Company’s equity interest from Telstra in June 2016, we entered into an investor’s rights agreement with Yun Chen on September 30, 2016 to the effect that Yun Chen shall enjoy the same special rights given to Telstra under the previous investors rights agreement. Under this investor’s rights agreement with Yun Chen, so long as Yun Chen holds at least 20% of our issued and outstanding shares, (i) we must permit Yun Chen and its designated representatives, at their own cost and expense, at reasonable times and upon reasonable prior notice to us, to review our books and records and to discuss our financial condition with our officers; and (ii) we must provide to Yun Chen our financial statements stated in the investor’s rights agreement so long as its external auditor considers it to be necessary to consolidate our financial statements into Yun Chen’s financial statements in accordance with the PRC accounting standards; and (iii) we must provide to Yun Chen a copy of our register of members after the end of each quarter. The investor’s rights agreement was approved by the Audit Committee and the Board.
Save as disclosed above, there are no other rights granted to Yun Chen or Ping An Group or other shareholders which are not available to all shareholders of the Company. The Directors take the view that the special rights granted to Yun Chen pursuant to the investor’s rights agreement are fair and reasonable and not prejudicial to the interest of our Company’s other shareholders. The same rights were granted to Telstra, the previous controlling shareholder of our Company (details of which were disclosed in the registration statement at the time of our Company’s listing on the NYSE and other public filings). Such rights were granted to Yun Chen in recognition of the significant investment made by Yun Chen. Taking into account the benefits of Yun Chen maintaining a significant shareholding interest in our Company, the Directors take the view that the grant of such rights to Yun Chen is in the best interest of our Company and the shareholders as a whole. After consulting our legal advisors, the Directors take the view that the grant of such special rights to Yun Chen does not contravene the shareholders’ protection requirements under the relevant U.S. federal securities laws and the NYSE rules, and the terms of the
142
investor’s rights agreement in relation to the grant of such special rights to Yun Chen do not violate the applicable laws and regulations in the Cayman Islands.
Employment Agreements
See “Item 6. Directors, Senior Management and Employees—B. Compensation of Directors and Executive Officers—Employment Agreements” for a description of the employment agreements we have entered into with our senior executive officers.
Share Incentive Plans
See “Item 6. Directors, Senior Management and Employees—B. Compensation of Directors and Executive Officers—Share Incentive Plans” for a description of share-based compensation awards we have granted to our directors and officers and to other individuals as a group.
See Note 12 to our financial statements for further information about our related party transactions.
Not applicable.
ITEM 8 FINANCIAL INFORMATION
We have appended consolidated financial statements filed as part of this annual report.
Legal Proceedings
From time to time, we may be subject to various claims and legal actions that arise in the ordinary course of our business. There are currently no legal proceedings that, in the opinion of our management, may have a material adverse effect on our business and results of operations.
Dividend Policy
Our board of directors has complete discretion to declare dividends subject to our Memorandum and Articles of Association and certain restrictions under Cayman Islands law. Our shareholders may also by ordinary resolution declare dividends but no dividend shall be declared in excess of the amount recommended by the board of directors. In November 2017, our board of directors declared a special cash dividend of US$0.76 per ordinary share (inclusive of applicable fees payable to our depositary bank) in favor of holders of our ordinary shares as of the close of business on January 4, 2018, which special cash dividend was paid on or about January 15, 2018. On November 4, 2019, our board of directors resolved to adopt a regular dividend policy. Under this policy, we may issue recurring cash dividend every year from 2020 in an amount of approximately 20% of the net income generated in the previous fiscal year, with the exact amount to be determined by our directors based on our financial performance and cash position prior to the distribution. For the fiscal years of 2020, 2021 and 2022, we paid cash dividends in a total amount of US$99.8 million, US$105.7 million and US$61.1 million, respectively, to our shareholders, pursuant to our dividend policy.
On February 16, 2023, our board of directors approved an amendment to change the annual cash dividend to a fixed amount of at least RMB500.0 million between 2022 and 2026. The exact amount of the annual cash dividend will be determined by our board of directors based on our financial performance and cash position prior to the distribution, and is expected to be adjusted upward each year.
Despite the dividend policy in place, our board of directors has the authority to decide the timing and amount of any future dividends, if any, based on, among other things, our future results of operations and cash flow, our capital
143
requirements and surplus, the amount of distributions, if any, received by us from our subsidiaries, our financial condition, contractual restrictions and other factors deemed relevant by our board of directors.
We are a holding company incorporated under the laws of the Cayman Islands. We may rely on dividends from our subsidiaries in mainland China for our cash requirements, including any payment of dividends to our shareholders. PRC regulations may restrict the ability of our mainland China subsidiaries to pay dividends to us. See “Item 3. Key Information—D. Risk Factors—Risks Related to Our Corporate Structure—We may rely to a significant extent on dividends and other distributions on equity paid by our mainland China subsidiaries to fund any cash and financing requirements we may have. Any limitation on the ability of our mainland China subsidiaries to pay dividends to us could have a material adverse effect on our ability to conduct our business.”
If we pay any dividends on our ordinary shares, we will pay those dividends which are payable in respect of the ordinary shares underlying our ADSs to the depositary, as the registered holder of such ordinary shares, and the depositary will then pay such amounts to our ADS holders in proportion to the ordinary shares underlying the ADSs held by such ADS holders, subject to the terms of the deposit agreement, including the fees and expenses payable thereunder. See “Item 12. Description of Securities other than Equity Securities—D. American Depositary Shares.” Cash dividends on our ordinary shares, if any, will be paid in U.S. dollars.
Except as disclosed elsewhere in this annual report, we have not experienced any significant changes since the date of our audited consolidated financial statements included in this annual report.
ITEM 9 THE OFFER AND LISTING
See “—C. Markets.”
B. Plan of Distribution
Not applicable.
C. Markets
Our ADSs have been listed on the NYSE since December 11, 2013 under the symbol “ATHM.”
Our ordinary shares have been listed on the Hong Kong Stock Exchange since March 15, 2021 under the stock code “2518.”
D. Selling Shareholders
Not applicable.
E. Dilution
Not applicable.
F. Expenses of the Issue
Not applicable.
144
ITEM 10 ADDITIONAL INFORMATION
Not applicable.
We are a Cayman Islands company and our affairs are governed by our memorandum and articles of association and the Cayman Companies Act, referred to as the Companies Act below. The following are summaries of certain provisions of our memorandum and articles of association in effect as of the date of this annual report insofar as they relate to the material terms of our ordinary shares.
Registered Office and Objects
Our registered office in the Cayman Islands is located at the offices of Maples Corporate Services Limited at PO Box 309, Ugland House, Grand Cayman, KY1-1104, Cayman Islands. The memorandum of association provides, inter alia, that the liability of the shareholders of our company is limited to the amount, if any, for the time being unpaid on the ordinary shares. The objects for which our company is established are unrestricted (including acting as an investment company), and we shall have and be capable of exercising all the functions of a natural person of full capacity irrespective of corporate benefit, as provided in section 27(2) of the Companies Act and in view of the fact that we are an exempted Company, we will not trade in the Cayman Islands with any person, firm or corporation except in furtherance of our business carried on outside the Cayman Islands.
Board of Directors
See “Item 6. Directors, Senior Management and Employees—C. Board Practices—Duties of Directors” and “—Terms of Directors and Officers.”
Ordinary Shares
General
All of our outstanding ordinary shares are fully paid and non-assessable. Certificates representing the ordinary shares are issued in registered form. Our shareholders who are non-residents of the Cayman Islands may freely hold and transfer their ordinary shares.
Ordinary Shares
The capital of our company is US$1,000,000,000 divided into 400,000,000,000 ordinary shares of a nominal or par value of US$0.0025 each. All of our issued and outstanding ordinary shares are fully paid and non-assessable. Certificates representing our ordinary shares are issued in registered form. Our shareholders who are non-residents of the Cayman Islands may freely hold and vote their ordinary shares.
Dividends
The holders of our ordinary shares are entitled to such dividends as may be declared by us in general meeting or by our board of directors, but no dividend may exceed the amount recommended by our directors. Our sixth amended and restated memorandum and articles of association provide that dividends may be declared and paid out of the funds of our Company lawfully available therefor. Under the laws of the Cayman Islands, our company may pay a dividend out of either profit or share premium account; provided that in no circumstances may a dividend be paid if this would result in our company being unable to pay its debts as they fall due in the ordinary course of business.
Voting Rights
145
At any general meeting every holder of ordinary shares who is present in person or by proxy (or, in the case of a shareholder being a corporation, by its duly authorized representative) shall have one vote on a show of hands, subject to any rights and restrictions for the time being attached to any share (including, for as long as our ordinary shares remain listed on the Hong Kong Stock Exchange, applicable rules under the Rules Governing the Listing of Securities on The Stock Exchange of Hong Kong Limited, as amended from time to time (unless otherwise waived)), and on a poll every shareholder holding ordinary shares present in person or by proxy (or, in the case of a shareholder being a corporation, by its duly appointed representative) shall have one vote for each fully paid ordinary share of which such shareholder is the holder.
A quorum required for a meeting of shareholders consists of one or more shareholders entitled to vote and present in person or by proxy or, if a corporation or other non-natural person, by its duly authorized representative holding at least ten percent of the voting rights represented by the issued and outstanding ordinary shares throughout the meeting. We shall hold a general meeting in each year as our annual general meeting. The annual general meeting shall be held at such time and place as may be determined by the directors. No business shall be transacted at any annual general meeting of the Company unless stated in the Company’s notice of annual general meeting. Each general meeting, other than an annual general meeting, shall be an extraordinary general meeting. A majority of our board of directors or our chairman may call extraordinary general meetings. Advance notice of at least fourteen clear days is required for the convening of our annual general meeting and other shareholders’ meetings. The agenda of any extraordinary general meeting will be set by a majority of the directors then in office.
An ordinary resolution to be passed by the shareholders requires the affirmative vote of a simple majority of the votes attaching to the ordinary shares cast in a general meeting, while a special resolution requires the affirmative vote of not less than two-thirds of the votes cast attaching to the outstanding ordinary shares. A special resolution will be required for important matters such as a change of name or making changes to our sixth amended and restated memorandum and articles of association.
Transfer of Ordinary Shares
Subject to the restrictions of our sixth amended and restated memorandum and articles of association, as applicable, any of our shareholders may transfer all or any of his or her ordinary shares by an instrument of transfer in the usual or common form or any other form approved by our board of directors.
Our board of directors may, in its absolute discretion, decline to register any transfer of any ordinary share which is not fully paid up or on which we have a lien. Our board of directors may also decline to register any transfer of any ordinary share unless:
If our directors refuse to register a transfer, they shall, within three months after the date on which the instrument of transfer was lodged, send to each of the transferor and the transferee notice of such refusal.
The registration of transfers may, after compliance with any notice required of the Designated Stock Exchange (as defined in the sixth amended and restated memorandum and articles of association), be suspended and the register closed at such times and for such periods as our board of directors may from time to time determine, provided, however, that the registration of transfers shall not be suspended nor the register closed for more than 30 days in any year.
146
Liquidation
On a return of capital on winding up or otherwise (other than on conversion, redemption or purchase of ordinary shares), assets available for distribution among the holders of ordinary shares shall be distributed among the holders of the ordinary shares on a pro rata basis in proportion to the amount paid up on the ordinary shares. The amount received by holders of ordinary shares should be the same in any liquidation event. If our assets available for distribution are insufficient to repay all of the paid-up capital, the assets will be distributed so that, as nearly as may be, the losses shall be borne by the shareholders in proportion to the capital paid up, or which ought to have been paid up, at the commencement of the winding up on the shares held by them respectively.
Calls on Ordinary Shares and Forfeiture of Ordinary Shares
Our board of directors may from time to time make calls upon shareholders for any amounts unpaid on their ordinary shares in a notice served to such shareholders at least 14 days prior to the specified time of payment. The ordinary shares that have been called upon and remain unpaid are subject to forfeiture.
Redemption of Ordinary Shares
Subject to the provisions of the Companies Act, we may repurchase or redeem shares at our option or at the option of the holders of these shares, on such terms and in such manner, including out of capital, as may be determined by our board of directors.
Variations of Rights of Shares
All or any of the special rights attached to any class of shares may, subject to the provisions of the Companies Act, be varied with the sanction of a special resolution passed at a general meeting of the holders of the shares of that class. The rights conferred upon the holders of the shares of any class issued with preferred or other rights shall not, unless otherwise expressly provided by the terms of issue of the shares of that class, be deemed to be varied by the creation or issue of further shares ranking pari passu with such existing class of shares.
General Meetings of Shareholders
Shareholders’ meetings may be convened by a majority of our board of directors or our chairman. Advance notice of at least fourteen clear days is required for the convening of our annual general shareholders’ meeting and any other general meeting of our shareholders. In addition, general meetings will also be convened on the requisition in writing of any shareholder or shareholders holding not less than one-tenth of the total issued and outstanding shares of our company that carry the right of voting at general meetings.
Appointment of Directors
Our shareholders may by ordinary resolution elect any person to fill a casual vacancy or as an addition to the existing board.
The directors will also have the power from time to time and at any time to appoint any person as a director to fill a casual vacancy on the board or as an addition to the existing board.
Inspection of Books and Records
Holders of our ordinary shares have no general right under Cayman Islands law to inspect or obtain copies of our list of shareholders or our corporate records (other than copies of our memorandum and articles of association, register of mortgages and charges and any special resolutions passed by our shareholders). However, we will allow our shareholders to inspect our register of members and provide our shareholders with annual audited financial statements.
147
Pursuant to the investor’s rights agreement we have with the Yun Chen and other shareholders, Yun Chen has the right to access our books and records so long as it holds in aggregate at least 20% of our issued and outstanding share capital.
Issuance of Additional Preferred Shares
Our sixth amended and restated memorandum of association authorizes our board of directors to issue additional ordinary shares from time to time as our board of directors shall determine, to the extent of available authorized but unissued shares.
Our sixth amended and restated memorandum of association authorizes our board of directors to establish from time to time one or more series of preferred shares and to determine, with respect to any series of preferred shares, the terms and rights of that series, including:
Our board of directors may issue preferred shares without action by our shareholders to the extent authorized but unissued. The issuance of preferred shares may be used as an anti-takeover device without further action on the part of the shareholders. Issuance of these shares may dilute the voting rights of holders of ordinary shares.
We have not entered into any material contracts other than in the ordinary course of business and other than those described elsewhere in “Item 4. Information on the Company—B. Business Overview,” “Item 7. Major Shareholders and Related Party Transactions—B. Related Party Transactions,” or elsewhere in this annual report.
See “Item 4. Information on the Company—B. Business Overview—PRC Regulation—Regulations on Foreign Exchange.”
Cayman Islands Taxation
The Cayman Islands currently levies no taxes on individuals or corporations based upon profits, income, gains or appreciation and there is no taxation in the nature of inheritance tax or estate duty. There are no other taxes levied by the Government of the Cayman Islands that are likely to be material to holders of ADSs or ordinary shares. The Cayman Islands is not party to any double tax treaties that are applicable to any payments made to or by our company. There are no exchange control regulations or currency restrictions in the Cayman Islands.
Pursuant to Section 6 of the Tax Concessions Act (As Revised) of the Cayman Islands, we have obtained an undertaking from the Governor-in-Cabinet:
148
The undertaking for us is for a period of 20 years from July 22, 2008.
Hong Kong Taxation
Our subsidiaries in Hong Kong are subject to 16.5% income tax on their taxable income generated from operations in Hong Kong. On April 1, 2018, a two-tiered profits tax regime was introduced. The profits tax rate for the first HK$2 million of profits of corporations is lowered to 8.25%, while profits above that amount continue to be subject to the tax rate of 16.5%.
Our principal register of members is maintained by our principal share registrar in the Cayman Islands, and our Hong Kong register of members is maintained by the Hong Kong Share Registrar in Hong Kong.
Dealings in our ordinary shares registered on our Hong Kong Share Register are subject to Hong Kong stamp duty. The stamp duty is charged to each of the seller and purchaser at the rate of 0.13% of the consideration for, or (if greater) the value of, our ordinary shares transferred. In other words, a total of 0.26% is currently payable on a typical sale and purchase transaction of our ordinary shares. In addition, a fixed duty of HK$5.00 is charged on each instrument of transfer (if required). To facilitate ADS-ordinary share conversion and trading between NYSE and the Hong Kong Stock Exchange, we have moved a portion of our issued ordinary shares from our Cayman share register to our Hong Kong share register. It is unclear whether, as a matter of Hong Kong law, the trading or conversion of ADSs constitutes a sale or purchase of the underlying Hong Kong registered ordinary shares that is subject to Hong Kong stamp duty. We advise investors to consult their own tax advisors on this matter. See “Item 3. Key Information — D. Risk Factors — Risks Related to Our ADSs and Ordinary Shares — There is uncertainty as to whether Hong Kong stamp duty will apply to the trading or conversion of our ADSs.”
Mainland China Taxation
We are a holding company incorporated in the Cayman Islands, which indirectly holds Autohome WFOE, Chezhiying WFOE and other subsidiaries in the mainland China. Our business operations are principally conducted through our mainland China subsidiaries and the VIEs. Although we believe we are not a mainland China resident enterprise for enterprise income tax purposes, substantial uncertainty exists. In the event that our company or any of our offshore entities, is considered to be a mainland China resident enterprise: (a) our company or our offshore entities, as the case may be, would be subject to the mainland China enterprise income tax at the rate of 25% on worldwide income; and (b) dividend income that our company or our offshore entities, as the case may be, receives from our mainland China subsidiaries would be exempt from the mainland China withholding tax since such income is exempted under the EIT Law for mainland China resident enterprise; and (c) any dividends we pay to our non-mainland China shareholders or ADS holders as well as gains realized by such shareholders or ADS holders from the transfer of our shares or ADSs may be regarded as mainland China-sourced income and as a result become subject to mainland China withholding tax at a rate of up to 10%, subject to reduction or exemption by an applicable treaty. See “Item 3. Key Information—D. Risk Factors—Risks Related to Doing Business in Mainland China—Our global income and the dividends that we may receive from our mainland China subsidiaries, dividends distributed to our non-mainland China shareholders and ADS holders, and gains recognized by such shareholders or ADS holders, may be subject to PRC taxes under the EIT Law, which would have a material adverse effect on our results of operations.”
As uncertainties remain regarding the interpretation and implementation of the EIT Law and its implementation rules, we cannot assure you that, if we are deemed a mainland China resident enterprise, any dividends to be distributed by us to our non-mainland China shareholders and ADS holders would not be subject to any PRC withholding tax. See “Item 3. Key Information—D. Risk Factors—Risks Related to Doing Business in Mainland China—Our global income and the dividends that we may receive from our mainland China subsidiaries, dividends distributed to our non-mainland China shareholders and ADS holders, and gains recognized by such shareholders or ADS holders, may be subject to PRC taxes under the EIT Law, which would have a material adverse effect on our results of operations.”
United States Federal Income Tax Considerations
149
The following discussion is a summary of United States federal income tax considerations relating to the ownership and disposition of our ADSs or ordinary shares by U.S. Holders (as defined below) that will hold ADSs or ordinary shares as “capital assets” (generally, property held for investment) under the United States Internal Revenue Code of 1986, as amended (the “Code”). This discussion is based upon applicable provisions of the Code, Treasury regulations (proposed, temporary and final) promulgated thereunder (“Regulations”), pertinent judicial decisions, interpretive rulings of the Internal Revenue Service and such other authorities as we have considered relevant, which are subject to change, possibly with retroactive effect. This discussion does not address all aspects of United States federal income taxation that may be important to particular investors in light of their individual investment circumstances, including investors subject to special tax rules (for example, certain financial institutions, insurance companies, broker-dealers, pension plans, regulated investment companies, real estate investment trusts, cooperatives, and tax-exempt organizations (including private foundations), holders who are not U.S. Holders, holders who own (directly, indirectly, or constructively) 10% or more of our stock (by vote or value), investors that will hold their ADSs or ordinary shares as part of a straddle, hedge, conversion, constructive sale, or other integrated transaction for United States federal income tax purposes, investors that are traders in securities that have elected the mark-to-market method of accounting or investors that have a functional currency other than the United States dollar), all of whom may be subject to tax rules that differ significantly from those discussed below. In addition, this discussion does not address United States federal estate, gift, Medicare, and alternative minimum tax considerations, or any non-United States, state, or local tax considerations. Each U.S. Holder is urged to consult its tax advisors regarding the United States federal, state, local, and non-United States income and other tax considerations of an investment in ADSs or ordinary shares.
General
For purposes of this summary, a “U.S. Holder” is a beneficial owner of our ADSs or ordinary shares that is, for United States federal income tax purposes, (i) an individual who is a citizen or resident of the United States, (ii) a corporation, or other entity treated as a corporation for United States federal income tax purposes, created in, or organized under the laws of the United States or any state thereof or the District of Columbia, or treated as such for United States federal income tax purposes, (iii) an estate the income of which is includible in gross income for United States federal income tax purposes regardless of its source, or (iv) a trust (A) the administration of which is subject to the primary supervision of a United States court and which has one or more United States persons who have the authority to control all substantial decisions of the trust or (B) that has otherwise validly elected to be treated as a United States person under the Code.
If a partnership (or other entity treated as a partnership for United States federal income tax purposes) is a beneficial owner of our ADSs or ordinary shares, the tax treatment of a partner in the partnership will generally depend upon the status of the partner and the activities of the partnership. If a U.S. Holder is a partner of a partnership holding our ADSs or ordinary shares, the U.S. Holder is urged to consult its tax advisors regarding an investment in our ADSs or ordinary shares.
It is generally expected that a U.S. Holder of ADSs will be treated as the beneficial owner, for United States federal income tax purposes, of the underlying shares represented by the ADSs. The remainder of this discussion assumes that a U.S. Holder of our ADSs will be treated in this manner. Accordingly, deposits or withdrawals of our ordinary shares for our ADSs will not be subject to United States federal income tax.
Passive Foreign Investment Company Considerations
A non-United States corporation, such as our company, will be classified as a PFIC, for United States federal income tax purposes for any taxable year, if either (i) 75% or more of its gross income for such year consists of certain types of “passive” income or (ii) 50% or more of the value of its assets (generally determined on the basis of a quarterly average) during such year produce or are held for the production of passive income (the “asset test”). Passive income generally includes dividends, interest, royalties, rents, annuities, net gains from the sale or exchange of property producing such income and net foreign currency gains. For this purpose, cash is categorized as a passive asset and the company’s goodwill and other unbooked intangibles associated with active business activity are taken into account as non-passive assets. We will be treated as owning our proportionate share of the assets and earning our proportionate share of the income of any other corporation in which we own, directly or indirectly, 25% or more (by value) of the stock.
150
Although the law in this regard is unclear, we treat the VIEs as being owned by us for United States federal income tax purposes, not only because we have power to direct significant activities of such entities but also because we are entitled to substantially all of their economic benefits, and, as a result, we consolidate their results of operation in our consolidated U.S. GAAP financial statements.
Based upon the nature and composition of our assets (in particular, the retention of substantial amounts of cash, deposits and investments), and the market price of our ADSs, we believe that we were a PFIC for United States federal income tax purposes for the taxable year ended December 31, 2022, and we will likely be a PFIC for our current taxable year unless the market price of our ADSs increases and/or we invest a substantial amount of the cash and other passive assets we hold in assets that produce or are held for the production of active income. U.S. Holders should consult with their tax advisors regarding the implications of owning stock in a PFIC. No assurances regarding our PFIC status can be provided for any past, current or future taxable years. The determination of whether we are a PFIC is a fact-intensive determination made on an annual basis and the applicable law is subject to varying interpretation. Our U.S. counsel expresses no opinion with respect to our PFIC status for our taxable year ended December 31, 2022 or any future taxable year.
If we are classified as a PFIC for any taxable year during which a U.S. Holder holds our ADSs or ordinary shares, we generally will continue to be treated as a PFIC for all succeeding years during which such U.S. Holder holds our ADSs or ordinary shares.
The United States federal income tax rules that apply if we are treated as a PFIC are generally discussed below under “Passive Foreign Investment Company Rules.”
Dividends
Subject to the discussion below under “Passive Foreign Investment Company Rules,” any cash distributions (including the amount of any mainland China tax withheld, if any) paid on our ADSs or ordinary shares out of our earnings and profits, as determined under United States federal income tax principles, will generally be includible in the gross income of a U.S. Holder as dividend income on the day actually or constructively received by the U.S. Holder, in the case of ordinary shares, or by the depositary bank, in the case of ADSs. Because we do not intend to determine our earnings and profits on the basis of United States federal income tax principles, any distribution paid will generally be treated as a “dividend” for United States federal income tax purposes. Dividends received on our ADSs or ordinary shares will not be eligible for the dividends received deduction allowed to corporations.
With respect to individuals and certain other non-corporate U.S. Holders, dividends may constitute “qualified dividend income” that is subject to tax at the lower applicable capital gains rates provided that (i) the ADSs or ordinary shares on which the dividends are paid are readily tradable on an established securities market in the United States, or, in the event that we are deemed to be a resident enterprise under the PRC tax law, we are eligible for the benefit of the United States-PRC income tax treaty (the “Treaty”), (ii) we are not a PFIC for either our taxable year in which the dividend was paid or the preceding taxable year, and (iii) certain holding period requirements are met. The ADSs, but not our ordinary shares, are listed on the NYSE so we anticipate that the ADSs should qualify as readily tradable on an established securities market in the United States, although there can be no assurances in this regard. In the event we are deemed to be a mainland China resident enterprise under the EIT Law, we may be eligible for the benefits of the Treaty. If we are eligible for such benefits, dividends we pay on our ordinary shares, regardless of whether such shares are represented by the ADSs, and regardless of whether our ADSs are readily tradable on an established securities market in the United States, would be eligible for the reduced rates of taxation applicable to qualified dividend income. U.S. Holders should consult their tax advisors regarding the availability of the lower capital gains rate applicable to qualified dividend income for dividends paid with respect to the ADSs or ordinary shares.
Dividends will generally be treated as income from foreign sources for United States foreign tax credit purposes and will generally constitute passive category income. In the event that we are deemed to be a mainland China resident enterprise under the EIT Law, a U.S. Holder may be subject to PRC withholding taxes on dividends paid on our ADSs or ordinary shares. Depending on the U.S. Holder’s individual facts and circumstances, a U.S. Holder may be eligible, subject to a number of complex limitations, to claim a foreign tax credit not in excess of any applicable treaty rate in respect of any foreign withholding taxes imposed on dividends received on our ADSs or
151
ordinary shares. A U.S. Holder who does not elect to claim a foreign tax credit for foreign tax withheld may instead claim a deduction, for United States federal income tax purposes, in respect of such withholding, but only for a year in which such holder elects to do so for all creditable foreign income taxes. The rules governing the foreign tax credit are complex and their outcome depends in large part on the U.S. Holder’s individual facts and circumstances. Accordingly, U.S. Holders are urged to consult their tax advisors regarding the availability of the foreign tax credit under their particular circumstances.
As mentioned above, we believe that we were a PFIC for the taxable year ended December 31, 2022, and we will likely be classified as a PFIC for our current taxable year. U.S. Holders are urged to consult their tax advisors regarding the availability of the reduced tax rate on dividends with respect to our ADSs or ordinary shares under their particular circumstances.
Sale or Other Disposition of ADSs or Ordinary Shares
Subject to the discussion below under “Passive Foreign Investment Company Rules,” a U.S. Holder will generally recognize gain or loss upon the sale or other disposition of our ADSs or ordinary shares in an amount equal to the difference between the amount realized upon the disposition and the holder’s adjusted tax basis in such ADSs or ordinary shares. The gain or loss will generally be capital gain or loss. Individuals and other non-corporate U.S. Holders who have held the ADS or ordinary shares for more than one year will generally be eligible for reduced tax rates. The deductibility of a capital loss may be subject to limitations. Any such gain or loss that the U.S. Holder recognizes will generally be treated as U.S.-source income or loss for foreign tax credit limitation purposes, which will generally limit the availability of foreign tax credits.
As described in “Item 10. Additional Information—E. Taxation—People’s Republic of China Taxation,” if we are deemed to be a mainland China resident enterprise under the EIT Law, gains from the disposition of the ADSs or ordinary shares may be subject to mainland China income tax and will generally be U.S.-source, which may limit the ability to receive a foreign tax credit. If a U.S. Holder is eligible for the benefits of the Treaty, such holder may be able to elect to treat such gain as mainland China-source income under the Treaty. Pursuant to recently issued Regulations, however, if a U.S. Holder is not eligible for the benefits of the Treaty or does not elect to apply the Treaty, then such holder may not be able to claim a foreign tax credit arising from any mainland China tax imposed on the disposition of the ADSs or ordinary shares. The rules regarding foreign tax credits and deduction of foreign taxes are complex. U.S. Holders should consult their tax advisors regarding the availability of a foreign tax credit or deduction in light of their particular circumstances, including their eligibility for benefits under the Treaty, and the potential impact of the recently issued Regulations.
As mentioned above, we believe that we were a PFIC for the taxable year ended December 31, 2022, and we will likely be classified as a PFIC for our current taxable year. U.S. Holders are urged to consult their tax advisors regarding the tax considerations of the sale or other disposition of our ADSs or ordinary shares under their particular circumstances.
Passive Foreign Investment Company Rules
As mentioned above, we believe that we were a PFIC for the taxable year ended December 31, 2022, and we will likely be classified as a PFIC for our current taxable year. If we are classified as a PFIC for any taxable year during which a U.S. Holder holds our ADSs or ordinary shares, and unless the U.S. Holder makes a mark-to-market election with respect to ADSs (as described below), the U.S. Holder will generally be subject to special tax rules that have a penalizing effect, regardless of whether we remain a PFIC, on (i) any excess distribution that we make to the U.S. Holder (which generally means any distribution paid during a taxable year that is greater than 125% of the average annual distributions paid in the three preceding taxable years or, if shorter, the U.S. Holder’s holding period for the ADSs or ordinary shares), and (ii) any gain realized on the sale or other disposition, including a pledge, under certain circumstances, of ADSs or ordinary shares. Under these PFIC rules:
152
If we are a PFIC for any taxable year during which a U.S. Holder holds our ADSs or ordinary shares and any of our non-United States subsidiaries is also a PFIC (i.e., a lower-tier PFIC), such U.S. Holder would be treated as owning a proportionate amount (by value) of the shares of the lower-tier PFIC and would be subject to the rules described above on certain distributions by a lower-tier PFIC and a disposition of shares of a lower-tier PFIC even though such U.S. Holder would not receive the proceeds of those distributions or dispositions. U.S. Holders are urged to consult their tax advisors regarding the application of the PFIC rules to any of our subsidiaries.
As an alternative to the foregoing rules, a U.S. Holder of “marketable stock” in a PFIC may make a mark-to-market election with respect to our ADSs, provided that the ADSs are regularly traded on the NYSE. We anticipate that the ADSs should qualify as being regularly traded, but no assurances may be given in this regard. If a U.S. Holder makes this election, the U.S. Holder will generally (i) include as ordinary income for each taxable year the excess, if any, of the fair market value of ADSs held at the end of the taxable year over the adjusted tax basis of such ADSs and (ii) deduct as an ordinary loss the excess, if any, of the adjusted tax basis of such ADSs over the fair market value of such ADSs held at the end of the taxable year, but such deduction will be allowed only to the extent of the amount previously included in income as a result of the mark-to-market election. The U.S. Holder’s adjusted tax basis in the ADSs would be adjusted to reflect any income or loss resulting from the mark-to-market election. If a U.S. Holder makes a mark-to-market election in respect of a corporation classified as a PFIC and such corporation ceases to be classified as a PFIC, the U.S. Holder will not be required to take into account the gain or loss described above during any year that such corporation is not classified as a PFIC. If a U.S. Holder makes a mark-to-market election, any gain such U.S. Holder recognizes upon the sale or other disposition of our ADSs in a year when we are a PFIC will be treated as ordinary income and any loss will be treated as ordinary loss, but such loss will only be treated as ordinary loss to the extent of the net amount previously included in income as a result of the mark-to-market election. In the case of a U.S. Holder who has held ADSs or ordinary shares during any taxable year in respect of which we are or were classified as a PFIC and continues to hold such ADSs or ordinary shares (or any portion thereof) and has not previously made a mark-to-market election, and if such U.S. Holder makes a mark-to-market election, special tax rules may apply relating to purging the PFIC taint of such ADSs or ordinary shares.
Because, as a technical matter, a mark-to-market election cannot be made for any lower-tier PFICs that we may own, a U.S. Holder may continue to be subject to the PFIC rules with respect to its indirect interest in any investments held by us that are treated as an equity interest in a PFIC for United States federal income tax purposes.
We do not intend to provide information necessary for U.S. Holders to make “qualified electing fund” elections which, if available, would result in tax treatment different from the general tax treatment for PFICs described above.
If a U.S. Holder owns our ADSs or ordinary shares during any taxable year that we are a PFIC, the U.S. Holder must generally file an annual report with the Internal Revenue Service, subject to certain limited exceptions. Each U.S. Holder is urged to consult its tax advisor concerning the United States federal income tax consequences of owning and disposing of our ADSs or ordinary shares if we are or become treated as a PFIC, including filing requirements, the possibility of making a mark-to-market election and the unavailability of the qualifying electing fund election.
Not applicable.
153
Not applicable.
We previously filed with the SEC registration statements on Form F-1 under the Securities Act with respect to our initial public offering and our follow-on offering of our ordinary shares represented by ADSs.
We are subject to the periodic reporting and other informational requirements of the Securities Exchange Act of 1934, or the Exchange Act. Under the Exchange Act, we are required to file reports and other information with the SEC. Specifically, we are required to file annually a Form 20-F within four months after the end of each fiscal year, which is December 31. The SEC maintains a website at www.sec.gov that contains reports, proxy and information statements, and other information regarding registrants that make electronic filings with the SEC using its EDGAR system. Copies of reports and other information, when filed, may also be inspected without charge, and may be obtained at prescribed rates at the public reference facilities maintained by the SEC at 100 F Street, N.E., Room 1580, Washington, D.C. 20549. The public may obtain information regarding the Washington, D.C. Public Reference Room by calling the SEC at 1-800-SEC-0330. As a foreign private issuer, we are exempt from the rules under the Exchange Act prescribing the furnishing and content of quarterly reports and proxy statements, and officers, directors and principal shareholders are exempt from the reporting and short-swing profit recovery provisions contained in Section 16 of the Exchange Act.
We will furnish Deutsche Bank Trust Company Americas, the depositary of our ADSs, with our annual reports, which will include a review of operations and annual audited consolidated financial statements prepared in conformity with U.S. GAAP, and all notices of shareholders’ meetings and other reports and communications that are made generally available to our shareholders. The depositary will make such notices, reports and communications available to holders of ADSs and, upon our request, will mail to all record holders of ADSs the information contained in any notice of a shareholders’ meeting received by the depositary from us.
In accordance with NYSE Rule 203.01, we will post this annual report on our website http://ir.autohome.com.cn. In addition, we will provide hardcopies of our annual report to shareholders, including ADS holders, free of charge upon request.
Not applicable.
Not applicable.
ITEM 11 QUANTITATIVE AND QUALITATIVE DISCLOSURES ABOUT MARKET RISK
Interest Rate Risk
Our exposure to interest rate risk primarily relates to the interest income generated by excess cash, which is mostly held in interest-bearing bank deposits and adjustable-rate short-term investments. We have not used derivative financial instruments in our investment portfolio. Interest earning instruments carry a degree of interest rate risk. We have not been exposed to, nor do we anticipate being exposed to, material risks due to changes in market interest rates. However, our future interest income may fall short of expectations due to changes in market interest rates. See “Item 5. Operating and Financial Review and Prospects—B. Liquidity and Capital Resources.”
Foreign Exchange Risk
154
Substantially all of our revenues and expenses are denominated in RMB. We do not believe that we currently have any significant direct foreign exchange risk and have not used any derivative financial instruments to hedge exposure to such risk. Although our exposure to foreign exchange risks should be limited in general, the value of your investment in our ADSs will be affected by the exchange rate between U.S. dollar and RMB because the value of our business is effectively denominated in RMB, while our ADSs will be traded in U.S. dollars.
Any significant appreciation or depreciation of the RMB may however materially affect the value of, and any dividends payable on, our ADSs in U.S. dollars. To the extent that we need to convert U.S. dollars into RMB for our operations, appreciation of the RMB against the U.S. dollar would have an adverse effect on the RMB amount we receive from the conversion. Conversely, if we decide to convert RMB into U.S. dollars for the purpose of making payments for dividends on our ordinary shares or ADSs or for other business purposes, appreciation of the U.S. dollar against the RMB would have a negative effect on the U.S. dollar amounts available to us.
As of December 31, 2022, we had RMB-denominated cash and cash equivalents, restricted cash and short-term investments of RMB17.6 billion, and U.S. dollar-denominated cash and cash equivalents, restricted cash and short-term investments of US$642.6 million. Assuming we had converted RMB17.6 billion into U.S. dollars at the exchange rate of RMB6.8972 for US$1.00 as of December 31, 2022, our U.S. dollar cash balance would have been US$3.2 billion. If the RMB had depreciated by 10% against the U.S. dollar, our U.S. dollar cash balance would have been US$3.0 billion instead.
ITEM 12 DESCRIPTION OF SECURITIES OTHER THAN EQUITY SECURITIES
Not applicable.
Not applicable.
Not applicable.
Fees and Charges Our ADS Holders May Have to Pay
Deutsche Bank Trust Company Americas, the depositary of our ADS program, collects its fees for delivery and surrender of ADSs directly from investors depositing shares or surrendering ADSs for the purpose of withdrawal or from intermediaries acting for them. The principal executive office of the depositary is located at 60 Wall Street, New York, NY 1005, USA. An ADS holder will be required to pay the following service fees to the depositary bank:
|
|
|
|
Service |
|
|
Fees |
|
|
|
|
• Issuance of ADSs, including issuances resulting from a distribution of shares or rights or other property |
|
|
Up to US$0.05 per ADS issued |
• Cancellation of ADSs, including in the case of termination of the deposit agreement |
|
|
Up to US$0.05 per ADS cancelled |
155
• Distribution of cash dividends or other cash distributions |
|
|
Up to US$0.05 per ADS held |
• Distribution of ADSs pursuant to share dividends, free share distributions or exercise of rights |
|
|
Up to US$0.05 per ADS held |
• Distribution of securities other than ADSs or rights to purchase additional ADSs |
|
|
A fee equivalent to the fee that would be payable if securities distributed to the ADS holder had been ordinary shares and the ordinary shares had been deposited for issuance of ADSs |
• Depositary services |
|
|
Up to US$0.05 per ADS held on the applicable record date(s) established by the depositary bank |
• Transfer of ADRs |
|
|
US$1.50 per certificate presented for transfer |
An ADS holder will also be responsible for paying certain fees and expenses incurred by the depositary bank and certain taxes and governmental charges (in addition to any applicable fees, expenses, taxes and other governmental charges payable on the deposited securities represented by any of the ADSs held) such as:
The depositary fees payable upon the issuance and cancellation of ADSs are typically paid to the depositary bank by the brokers (on behalf of their clients) receiving the newly issued ADSs from the depositary bank and by the brokers (on behalf of their clients) delivering the ADSs to the depositary bank for cancellation. The brokers in turn charge these fees to their clients. Depositary fees payable in connection with distributions of cash or securities to ADS holders and the depositary services fee are charged by the depositary bank to the holders of record of ADSs as of the applicable ADS record date.
The depositary fees payable for cash distributions are generally deducted from the cash being distributed or by selling a portion of distributable property to pay the fees. In the case of distributions other than cash (i.e., share dividends, rights), the depositary bank charges the applicable fee to the ADS record date holders concurrent with the distribution. In the case of ADSs registered in the name of the investor (whether certificated or uncertificated in direct registration), the depositary bank sends invoices to the applicable record date ADS holders. In the case of ADSs held in brokerage and custodian accounts (via the Depository Trust Company, or DTC), the depositary bank generally collects its fees through the systems provided by DTC (whose nominee is the registered holder of the ADSs held in DTC) from the brokers and custodians holding ADSs in their DTC accounts. The brokers and custodians who hold their clients’ ADSs in DTC accounts in turn charge their clients’ accounts the amount of the fees paid to the depositary banks.
156
In the event of refusal to pay the depositary fees, the depositary bank may, under the terms of the deposit agreement, refuse the requested service until payment is received or may set off the amount of the depositary fees from any distribution to be made to the ADS holder.
Fees and Other Payments Made by the Depositary to Us
Our depositary has agreed to reimburse us for a portion of certain expenses we incur that are related to establishment and maintenance of the ADR program, including investor relations expenses. There are limits on the amount of expenses for which the depositary will reimburse us, but the amount of reimbursement available to us is not related to the amounts of fees the depositary collects from investors. Further, the depositary has agreed to reimburse us certain fees payable to the depositary by holders of ADSs. Neither we nor the depositary can determine the exact amount to be made available to us because (i) the number of ADSs that will be issued and outstanding, (ii) the level of service fees to be charged to holders of ADSs and (iii) our reimbursable expenses related to the program are not known at this time. In 2022, we did not receive any reimbursement from the depositary.
Conversion between Ordinary Shares and ADSs
Dealings and Settlement of Ordinary Shares in Hong Kong
Our ordinary shares trade on the Hong Kong Stock Exchange in board lots of 100 ordinary shares. Dealings in our ordinary shares on the Hong Kong Stock Exchange will be conducted in Hong Kong dollars.
The transaction costs of dealings in our ordinary shares on the Hong Kong Stock Exchange include:
Investors must settle their trades executed on the Hong Kong Stock Exchange through their brokers directly or through custodians. For an investor who has deposited his or her ordinary shares in his or her stock account or in his or her designated Central Clearing and Settlement System participant’s stock account maintained with the Central Clearing and Settlement System, or CCASS, settlement will be effected in CCASS in accordance with the General Rules of CCASS and CCASS Operational Procedures in effect from time to time. For an investor who holds the
157
physical certificates, settlement certificates and the duly executed transfer forms must be delivered to his or her broker or custodian before the settlement date.
Conversion between Ordinary Shares Trading in Hong Kong and ADSs
In connection with the listing of our ordinary shares on the Hong Kong Stock Exchange, we have established a branch register of members in Hong Kong, or the Hong Kong share register, which will be maintained by our Hong Kong Share Registrar, Computershare Hong Kong Investor Services Limited. Our principal register of members will continue to be maintained by our principal share registrar, Maples Fund Services (Cayman) Limited.
All ordinary shares offered in connection with our listing in Hong Kong are registered on the Hong Kong share register in order to be listed and traded on the Hong Kong Stock Exchange. As described in further detail below, holders of ordinary shares registered on the Hong Kong Share Register will be able to convert these ordinary shares into ADSs, and vice versa.
In connection with our listing in Hong Kong, and to facilitate fungibility and conversion between ADSs and ordinary shares and trading between NYSE and the Hong Kong Stock Exchange, we moved a portion of our issued ordinary shares from our register of members maintained in the Cayman Islands to our Hong Kong share register.
Converting Ordinary Shares Trading in Hong Kong into ADSs
An investor who holds ordinary shares registered in Hong Kong and who intends to convert them to ADSs to trade on NYSE must deposit or have his or her broker deposit the ordinary shares with the depositary’s Hong Kong custodian, Deutsche Bank AG, Hong Kong Branch, Hong Kong, or the custodian, in exchange for ADSs.
A deposit of ordinary shares trading in Hong Kong in exchange for ADSs involves the following procedures:
For ordinary shares deposited in CCASS, under normal circumstances, the above steps generally require two business days. For ordinary shares held outside CCASS in physical form, the above steps may take 14 business days, or more, to complete. Temporary delays may arise. For example, the transfer books of the depositary may from time to time be closed to ADS issuances. The investor will be unable to trade the ADSs until the procedures are completed.
Converting ADSs to Ordinary Shares Trading in Hong Kong
An investor who holds ADSs and who intends to convert his/her ADSs into ordinary shares to trade on the Hong Kong Stock Exchange must cancel the ADSs the investor holds and withdraw ordinary shares from our ADS program and cause his or her broker or other financial institution to trade such ordinary shares on the Hong Kong Stock Exchange.
158
An investor that holds ADSs indirectly through a broker should follow the broker’s procedure and instruct the broker to arrange for cancelation of the ADSs, and transfer of the underlying ordinary shares from the depositary’s account with the custodian within the CCASS system to the investor’s Hong Kong stock account.
For investors holding ADSs directly (not holding through brokers), the following steps must be taken:
For ordinary shares to be received in CCASS, under normal circumstances, the above steps generally require two business days. For ordinary shares to be received outside CCASS in physical form, the above steps may take 14 business days, or more, to complete. The investor will be unable to trade the ordinary shares on the Hong Kong Stock Exchange until the procedures are completed.
Temporary delays may arise. For example, the transfer books of the depositary may from time to time be closed to ADS cancelations. In addition, completion of the above steps and procedures is subject to there being a sufficient number of ordinary shares on the Hong Kong share register to facilitate a withdrawal from the ADS program directly into the CCASS system. We are not under any obligation to maintain or increase the number of ordinary shares on the Hong Kong share register to facilitate such withdrawals.
Depositary Requirements
Before the depositary issues ADSs or permits withdrawal of ordinary shares, the depositary may require:
The depositary may refuse to deliver, transfer, or register issuances, transfers and cancelations of ADSs generally when the transfer books of the depositary or our Hong Kong Share Registrar are closed or at any time if the depositary or we determine it advisable to do so.
All costs attributable to the transfer of ordinary shares to effect a withdrawal from or deposit of ordinary shares into our ADS program will be borne by the investor requesting the transfer. In particular, holders of ordinary shares and ADSs should note that the Hong Kong Share Registrar will charge between HK$2.50 to HK$20, depending on the speed of service (or such higher fee as may from time to time be permitted under the Hong Kong Listing Rules), for each transfer of ordinary shares from one registered owner to another, each share certificate canceled or issued by it and any applicable fee as stated in the share transfer forms used in Hong Kong. In addition, holders of ordinary shares and ADSs must pay up to US$5.00 (or less) per 100 ADSs for each issuance of ADSs and each cancelation of ADSs, as the case may be, in connection with the deposit of ordinary shares into, or withdrawal of ordinary shares from, our ADS program.
159
PART II.
ITEM 13 DEFAULTS, DIVIDEND ARREARAGES AND DELINQUENCIES
None.
ITEM 14 MATERIAL MODIFICATIONS TO THE RIGHTS OF SECURITY HOLDERS AND USE OF PROCEEDS
See “Item 10. Additional Information” for a description of the rights of securities holders, which remain unchanged.
The following “Use of Proceeds” information relates to:
We incurred expenses and paid to others US$12.8 million for underwriting discounts and commissions in connection with our initial public offering. We incurred expenses and paid to others US$5.0 million for underwriting discounts and commissions in connection with our 2014 Offering. We incurred expenses and paid to others HK$66.5 million for underwriting discounts and commissions in connection with our Hong Kong Offering. We received net proceeds of approximately US$142.6 million, US$97.3 million and HK$4,294.9 million from our initial public offering, 2014 Offering and Hong Kong Offering, respectively.
For the period from December 10, 2013, the date that our registration statement on Form F-1 for our initial public offering was declared effective by the SEC, to December 31, 2022, we used an aggregate of approximately US$253.1 million of the net proceeds from our initial public offering, the 2014 Offering and the Hong Kong Offering for payment of establishment of new subsidiaries, investment in joint venture and other strategic investments, payment of dividends, professional fees, insurance fees, compensation to directors and general corporate purposes.
We intend to use the remainder of the proceeds from the offerings listed above for general corporate purposes, including funding potential investments and acquisitions of complementary businesses, assets and technologies.
160
ITEM 15 CONTROLS AND PROCEDURES
Evaluation of Disclosure Controls and Procedures
Our management, with the participation of our chief executive officer and chief financial officer, has performed an evaluation of the effectiveness of our disclosure controls and procedures (as defined in Rule 13a-15(e) under the Exchange Act) as of the end of the period covered by this report, as required by Rule 13a-15(b) under the Exchange Act. Based on that evaluation, our management has concluded that, as of December 31, 2022, our disclosure controls and procedures were effective.
Management’s Annual Report on Internal Control over Financial Reporting
Our management is responsible for establishing and maintaining adequate internal control over financial reporting as defined in Rules 13a-15(f) and 15d-15(f) under the Exchange Act. Internal control over financial reporting is a process designed to provide reasonable assurance regarding the reliability of financial reporting and the preparation of consolidated financial statements in accordance with U.S. GAAP and includes those policies and procedures that (i) pertain to the maintenance of records that, in reasonable detail, accurately and fairly reflect the transactions and dispositions of a company’s assets, (ii) provide reasonable assurance that transactions are recorded as necessary to permit preparation of consolidated financial statements in accordance with generally accepted accounting principles, and that a company’s receipts and expenditures are being made only in accordance with authorizations of a company’s management and directors, and (iii) provide reasonable assurance regarding prevention or timely detection of unauthorized acquisition, use, or disposition of a company’s assets that could have a material effect on the consolidated financial statements. Our management, with the participation of our chief executive officer and chief financial officer, conducted an evaluation of the effectiveness of our company’s internal control over financial reporting as of December 31, 2022 based on criteria established in Internal Control-Integrated Framework issued by the Committee of Sponsoring Organizations of the Treadway Commission (2013 Framework). Based on this evaluation, our management concluded that our internal control over financial reporting was effective as of December 31, 2022.
Because of its inherent limitations, internal control over financial reporting may not prevent or detect misstatements. Also, any evaluation of effectiveness as to future periods is subject to the risks that controls may become inadequate because of changes in conditions, or that the degree of compliance with the policies or procedures may deteriorate.
Attestation Report of the Independent Registered Public Accounting Firm
The effectiveness of our internal control over financial reporting as of December 31, 2022 has been audited by PricewaterhouseCoopers Zhong Tian LLP, our independent registered public accounting firm, as stated in its report included on page F-2 of this annual report.
Changes in Internal Control Over Financial Reporting
There were no changes in our internal control over financial reporting that occurred during the year ended December 31, 2022 that have materially affected, or are reasonably likely to materially affect, our internal control over financial reporting.
ITEM 16A AUDIT COMMITTEE FINANCIAL EXPERT
Our board of directors has determined that Mr. Tianruo Pu is our audit committee financial expert, who is an independent director under the standards set forth in Section 303A of the New York Stock Exchange Listed Company Manual and Rule 10A-3 of the Exchange Act. Mr. Pu is the chairman of our audit committee.
161
ITEM 16B CODE OF ETHICS
Our board of directors has adopted a code of business conduct and ethics that applies to our directors, officers, employees and agents, including certain provisions that specifically apply to our chairman, chief executive officer, chief financial officer, controller, vice presidents and any other persons who perform similar functions for us. We filed our code of business conduct and ethics as Exhibit 99.1 to our registration statement on Form F-1, as amended, which was originally filed with the SEC on November 4, 2013. We subsequently amended the code of business conduct and ethics and filed it as Exhibit 11.1 to our annual report on Form 20-F filed with the SEC on March 31, 2014. We further amended the code of business conduct and ethics on October 31, 2022 and furnished it to the SEC as Exhibit 99.1 to a Form 6-K dated November 3, 2022. We have posted a copy of our code of business conduct and ethics on our website at http://ir.autohome.com.cn
ITEM 16C PRINCIPAL ACCOUNTANT FEES AND SERVICES
The following table sets forth the aggregate fees by categories specified below in connection with certain professional services rendered by PricewaterhouseCoopers Zhong Tian LLP, our independent registered public accounting firm, for the periods indicated. We did not pay any other fees to our independent registered public accounting firm during the periods other than those indicated below.
|
|
For the Year Ended December 31, |
|
|||||||||
|
|
2020 |
|
|
2021 |
|
|
2022 |
|
|||
|
|
(in RMB thousands) |
|
|||||||||
Audit fees(1) |
|
|
8,180 |
|
|
|
17,380 |
|
|
|
11,380 |
|
Tax fees(2) |
|
|
100 |
|
|
|
410 |
|
|
|
140 |
|
Other fees(3) |
|
|
2,200 |
|
|
|
600 |
|
|
|
67 |
|
Notes:
The policy of our audit committee is to preapprove all audit and non-audit services provided by our independent registered public accounting firm, including audit services, tax services and other services as described above, other than those for de minimis services which are approved by the audit committee prior to the completion of the audit. Our audit committee has approved all of our audit fees, tax fees and other fees for the year ended December 31, 2022.
ITEM 16D EXEMPTIONS FROM THE LISTING STANDARDS FOR AUDIT COMMITTEES
Not applicable.
ITEM 16E PURCHASES OF EQUITY SECURITIES BY THE ISSUER AND AFFILIATED PURCHASERS
On November 18, 2021, our board of directors authorized a share repurchase program, under which we may repurchase up to US$200 million of our ADSs over the next 12 months (the “Share Repurchase Program”). The Share Repurchase Program was publicly announced on the same day. On November 3, 2022, our board of directors authorized an extension of the term of the Share Repurchase Program for another twelve months to November 17, 2023.
162
As of March 31, 2023, we had repurchased approximately 3.8 million ADSs under this share repurchase program. The table below is a summary of the shares repurchased by us from November 18, 2021 to March 31, 2023. All shares were repurchased in the open market pursuant to the share repurchase program announced on November 18, 2021.
|
|
Total Number of ADSs Purchased |
|
|
Average Price |
|
|
Total Number of ADSs Purchased as Part of the Publicly Announced Plan |
|
|
Approximate Dollar Value of ADSs that May Yet Be Purchased Under the Plan |
|
|||||
Period |
|
|
|
|
|
|
|
|
|
|
|
|
|
||||
December 1-December 31, 2021 |
|
|
166,067 |
|
|
US$ |
|
29.45 |
|
|
|
166,067 |
|
|
|
195,109,105.50 |
|
January 1-January 31, 2022 |
|
|
61,929 |
|
|
US$ |
|
29.71 |
|
|
|
61,929 |
|
|
|
193,269,117.99 |
|
February 1-February 28, 2022 |
|
|
410,718 |
|
|
US$ |
|
28.07 |
|
|
|
410,718 |
|
|
|
181,738,728.37 |
|
March 1-March 31, 2022 |
|
|
418,105 |
|
|
US$ |
|
27.52 |
|
|
|
418,105 |
|
|
|
170,230,722.13 |
|
April 1-April 30, 2022 |
|
|
257,152 |
|
|
US$ |
|
28.39 |
|
|
|
257,152 |
|
|
|
162,931,018.56 |
|
May 1-May 31, 2022 |
|
|
337,344 |
|
|
US$ |
|
26.91 |
|
|
|
337,344 |
|
|
|
153,852,653.77 |
|
June 1-June 30, 2022 |
|
|
124,872 |
|
|
US$ |
|
34.39 |
|
|
|
124,872 |
|
|
|
149,558,133.80 |
|
July 1-July 31, 2022 |
|
|
107,719 |
|
|
US$ |
|
34.71 |
|
|
|
107,719 |
|
|
|
145,818,917.18 |
|
August 1-August 31, 2022 |
|
|
455,194 |
|
|
US$ |
|
35.10 |
|
|
|
455,194 |
|
|
|
129,839,403.23 |
|
September 1-September 30, 2022 |
|
|
543,645 |
|
|
US$ |
|
32.97 |
|
|
|
543,645 |
|
|
|
111,917,757.83 |
|
October 1-October 31, 2022 |
|
|
627,317 |
|
|
US$ |
|
29.00 |
|
|
|
627,317 |
|
|
|
93,727,225.27 |
|
November 1-November 30, 2022 |
|
|
176,265 |
|
|
US$ |
|
28.16 |
|
|
|
176,265 |
|
|
|
88,762,864.24 |
|
March 1-March 31, 2023 |
|
|
133,580 |
|
|
US$ |
|
29.73 |
|
|
|
133,580 |
|
|
|
84,791,673.38 |
|
Total |
|
|
3,819,907 |
|
|
|
N/A |
|
|
|
3,819,907 |
|
|
|
84,791,673.38 |
|
|
ITEM 16F CHANGE IN REGISTRANT’S CERTIFYING ACCOUNTANT
Not applicable.
ITEM 16G CORPORATE GOVERNANCE
As a Cayman Islands company listed on the New York Stock Exchange, we are subject to the New York Stock Exchange corporate governance listing standards. However, the New York Stock Exchange rules permit a foreign private issuer like us to follow the corporate governance practices of its home country. Pursuant to Sections 303A.01, 303A.04, 303A.05 and 303A.07 of the New York Stock Exchange Listed Company Manual, a company listed on the New York Stock Exchange must have a majority of independent directors, a nominating and corporate governance committee composed entirely of independent directors, and a compensation committee composed entirely of independent directors. We currently follow our home country practice in lieu of these requirements. We may also continue to rely on these and other exemptions available to foreign private issuers in the future. See “Item 3. Key Information—D. Risk Factors—Risks Related to our ADSs and Ordinary Shares—As a company incorporated in the Cayman Islands, we are permitted to adopt certain home country practices in relation to corporate governance matters that differ significantly from the New York Stock Exchange listing standards.”
ITEM 16H MINE SAFETY DISCLOSURE
Not applicable.
163
ITEM 16I DISCLOSURE REGARDING FOREIGN JURISDICTIONS THAT PREVENT INSPECTIONS
In May 2022, we were conclusively listed by the SEC as a Commission-Identified Issuer under the HFCAA, following the filing of our annual report on Form 20-F for the fiscal year ended December 31, 2021. Our auditor, a registered public accounting firm that the PCAOB was unable to inspect or investigate completely in 2021, issued the audit report for us for the fiscal year ended December 31, 2021. On December 15, 2022, the PCAOB issued a report that vacated its December 16, 2021 determination and removed mainland China and Hong Kong from the list of jurisdictions where it is unable to inspect or investigate completely registered public accounting firms. For this reason, we do not expect to be identified as a Commission-Identified Issuer under the HFCAA after we file this annual report on Form 20-F.
As of the date of this annual report, to our knowledge, (i) no governmental entities in the Cayman Islands or in China own shares of Autohome Inc. or our consolidated foreign operating entities including any VIEs, (ii) the governmental entities in China do not have a controlling financial interest in Autohome Inc. or our consolidated foreign operating entities including any VIEs, (iii) none of the members of the board of directors of Autohome Inc. or our consolidated foreign operating entities including any VIEs, is an official of the Chinese Communist Party, and (iv) none of the currently effective memorandum and articles of association (or equivalent organizational document) of Autohome Inc. or our consolidated foreign operating entities including any VIEs contains any charter of the Chinese Communist Party.
ITEM 16J INSIDER TRADING POLICIES
Not applicable.
PART III.
ITEM 17 FINANCIAL STATEMENTS
We have elected to provide financial statements pursuant to Item 18.
ITEM 18 FINANCIAL STATEMENTS
The consolidated financial statements of Autohome Inc. are included at the end of this annual report.
ITEM 19 EXHIBITS
Exhibit Number |
|
Description of Document |
1.1 |
|
|
|
|
|
2.1 |
|
|
|
|
|
2.2 |
|
|
|
|
|
2.3 |
|
|
164
|
|
|
|
|
|
2.4 |
|
|
4.1 |
|
|
|
|
|
4.2 |
|
|
|
|
|
4.3 |
|
|
|
|
|
4.4 |
|
|
|
|
|
4.5 |
|
|
|
|
|
4.6 |
|
|
|
|
|
4.7 |
|
|
|
|
|
4.8 |
|
|
|
|
|
4.9 |
|
|
|
|
|
4.10 |
|
|
|
|
|
4.11 |
|
|
|
|
|
165
4.12 |
|
4.13 |
|
|
|
|
|
4.14 |
|
|
|
|
|
4.15 |
|
|
|
|
|
4.16 |
|
|
|
|
|
4.17 |
|
|
|
|
|
4.18 |
|
|
|
|
|
4.19 |
|
|
|
|
|
4.20 |
|
|
|
|
|
4.21 |
|
|
|
|
|
4.22 |
|
|
|
|
|
4.23 |
|
|
4.24 |
|
166
4.25 |
|
4.26 |
|
|
|
|
|
4.27 |
|
|
|
|
|
4.28 |
|
|
|
|
|
4.29 |
|
|
|
|
|
4.30 |
|
|
|
|
|
4.31 |
|
|
|
|
|
4.32 |
|
|
|
|
|
4.33 |
|
|
|
|
|
4.34 |
|
|
|
|
|
4.35 |
|
|
|
|
|
4.36 |
|
|
4.37 |
|
|
|
|
|
4.38 |
|
|
|
|
|
167
4.39 |
|
|
|
|
|
4.40 |
|
|
|
|
|
4.41 |
|
|
|
|
|
4.42 |
|
|
|
|
|
4.43 |
|
|
|
|
|
4.44 |
|
|
|
|
|
4.45 |
|
|
|
|
|
4.46 |
|
|
|
|
|
4.47 |
|
|
|
|
|
4.48 |
|
|
|
|
|
4.49 |
|
|
|
|
|
4.50 |
|
|
|
|
|
4.51 |
|
|
|
|
|
168
4.52 |
|
|
|
|
|
4.53 |
|
|
|
|
|
4.54 |
|
|
|
|
|
4.55 |
|
|
|
|
|
4.56* |
|
|
|
|
|
4.57* |
|
|
|
|
|
4.58* |
|
|
|
|
|
4.59* |
|
|
|
|
|
4.60* |
|
|
|
|
|
4.61* |
|
|
|
|
|
8.1* |
|
|
|
|
|
11.1 |
|
|
|
|
|
12.1* |
|
|
|
|
|
12.2* |
|
|
|
|
|
13.1** |
|
|
|
|
|
13.2** |
|
|
|
|
|
15.1* |
|
Consent of PricewaterhouseCoopers Zhong Tian LLP, independent registered public accounting firm |
|
|
|
15.2* |
|
|
|
|
|
169
15.3** |
|
|
|
|
|
101.INS* |
|
Inline XBRL Instance Document-this instance document does not appear on the Interactive Data File because its XBRL tags are embedded within the Inline XBRL document |
|
|
|
101.SCH* |
|
Inline XBRL Taxonomy Extension Schema Document |
|
|
|
101.CAL* |
|
Inline XBRL Taxonomy Extension Calculation Linkbase Document |
|
|
|
101.DEF* |
|
Inline XBRL Taxonomy Extension Definition Linkbase Document |
|
|
|
101.LAB* |
|
Inline XBRL Taxonomy Extension Label Linkbase Document |
|
|
|
101.PRE* |
|
Inline XBRL Taxonomy Extension Presentation Linkbase Document |
|
|
|
104 |
|
Cover Page Interactive Data File (embedded within the Inline XBRL document) |
* Filed with this annual report on Form 20-F.
** Furnished with this annual report on Form 20-F.
170
SIGNATURES
The registrant hereby certifies that it meets all of the requirements for filing on Form 20-F and that it has duly caused and authorized the undersigned to sign this annual report on its behalf.
AUTOHOME INC.
|
||
By: |
/s/ Quan Long |
|
|
Name: |
Quan Long |
|
Title: |
Chairman of the Board and Chief Executive Officer |
Date: April 25, 2023
171
AUTOHOME INC.
INDEX TO CONSOLIDATED FINANCIAL STATEMENTS
F-1
Report of Independent Registered Public Accounting Firm
To the Shareholders and Board of Directors of Autohome Inc.
Opinions on the Financial Statements and Internal Control over Financial Reporting
We have audited the accompanying consolidated balance sheets of Autohome Inc. and its subsidiaries (the “Company”) as of December 31, 2022 and 2021, and the related consolidated statements of comprehensive income, changes in shareholders’ equity and cash flows for each of the three years in the period ended December 31, 2022, including the related notes (collectively referred to as the “consolidated financial statements”). We also have audited the Company's internal control over financial reporting as of December 31, 2022, based on criteria established in Internal Control - Integrated Framework (2013) issued by the Committee of Sponsoring Organizations of the Treadway Commission (COSO).
In our opinion, the consolidated financial statements referred to above present fairly, in all material respects, the financial position of the Company as of December 31, 2022 and 2021, and the results of its operations and its cash flows for each of the three years in the period ended December 31, 2022 in conformity with accounting principles generally accepted in the United States of America. Also in our opinion, the Company maintained, in all material respects, effective internal control over financial reporting as of December 31, 2022,based on criteria established in Internal Control - Integrated Framework (2013) issued by the COSO.
Basis for Opinions
The Company's management is responsible for these consolidated financial statements, for maintaining effective internal control over financial reporting, and for its assessment of the effectiveness of internal control over financial reporting, included in Management's Annual Report on Internal Control over Financial Reporting appearing under Item 15. Our responsibility is to express opinions on the Company’s consolidated financial statements and on the Company's internal control over financial reporting based on our audits. We are a public accounting firm registered with the Public Company Accounting Oversight Board (United States) (PCAOB) and are required to be independent with respect to the Company in accordance with the U.S. federal securities laws and the applicable rules and regulations of the Securities and Exchange Commission and the PCAOB.
We conducted our audits in accordance with the standards of the PCAOB. Those standards require that we plan and perform the audits to obtain reasonable assurance about whether the consolidated financial statements are free of material misstatement, whether due to error or fraud, and whether effective internal control over financial reporting was maintained in all material respects.
Our audits of the consolidated financial statements included performing procedures to assess the risks of material misstatement of the consolidated financial statements, whether due to error or fraud, and performing procedures that respond to those risks. Such procedures included examining, on a test basis, evidence regarding the amounts and disclosures in the consolidated financial statements. Our audits also included evaluating the accounting principles used and significant estimates made by management, as well as evaluating the overall presentation of the consolidated financial statements. Our audit of internal control over financial reporting included obtaining an understanding of internal control over financial reporting, assessing the risk that a material weakness exists, and testing and evaluating the design and operating effectiveness of internal control based on the assessed risk. Our audits also included performing such other procedures as we considered necessary in the circumstances. We believe that our audits provide a reasonable basis for our opinions.
Definition and Limitations of Internal Control over Financial Reporting
A company’s internal control over financial reporting is a process designed to provide reasonable assurance regarding the reliability of financial reporting and the preparation of financial statements for external purposes in accordance with generally accepted accounting principles. A company’s internal control over financial reporting includes those policies and procedures that (i) pertain to the maintenance of records that, in reasonable detail, accurately and fairly reflect the transactions and dispositions of the assets of the company; (ii) provide reasonable
F-2
assurance that transactions are recorded as necessary to permit preparation of financial statements in accordance with generally accepted accounting principles, and that receipts and expenditures of the company are being made only in accordance with authorizations of management and directors of the company; and (iii) provide reasonable assurance regarding prevention or timely detection of unauthorized acquisition, use, or disposition of the company’s assets that could have a material effect on the financial statements.
Because of its inherent limitations, internal control over financial reporting may not prevent or detect misstatements. Also, projections of any evaluation of effectiveness to future periods are subject to the risk that controls may become inadequate because of changes in conditions, or that the degree of compliance with the policies or procedures may deteriorate.
Critical Audit Matters
The critical audit matters communicated below are matters arising from the current period audit of the consolidated financial statements that were communicated or required to be communicated to the audit committee and that (i) relate to accounts or disclosures that are material to the consolidated financial statements and (ii) involved our especially challenging, subjective, or complex judgments. The communication of critical audit matters does not alter in any way our opinion on the consolidated financial statements, taken as a whole, and we are not, by communicating the critical audit matters below, providing separate opinions on the critical audit matters or on the accounts or disclosures to which they relate.
Allowance for current expected credit losses on accounts receivable
As described in Notes 2(o) and 4 to the consolidated financial statements, as of December 31, 2022, the gross balance of accounts receivable was RMB2,113.5 million, against which an allowance for current expected credit losses of RMB185.8 million was provided. The allowance is management’s estimate of current expected credit losses. Management estimated the allowance by segmenting accounts receivable into groups based on certain credit risk characteristics and estimated the allowance for credit losses on receivables not sharing similar risk characteristic on an individual basis. The key factors considered when determining the allowances for credit losses include the historical loss experience, lifetime for debt recovery, financial performance of the customers, current and future economic conditions.
The principal considerations for our determination that performing procedures relating to the allowance for current expected credit losses on accounts receivable is a critical audit matter are the significant judgments made by management in estimating the allowance for current expected credit losses. This in turn led to a high degree of auditor judgment, subjectivity and audit effort in performing procedures and evaluating audit evidence obtained relating to management’s judgments about credit risk characteristics and expected loss rates. The audit effort involved the use of professionals with specialized skill and knowledge.
Addressing the matter involved performing procedures and evaluating audit evidence in connection with forming our overall opinion on the consolidated financial statements. These procedures included testing the effectiveness of controls relating to management’s estimate of the allowance for current expected credit losses. These procedures also included, among others, (i) evaluating the appropriateness of the model and methodology; (ii) testing the completeness and accuracy of underlying data used in the model; and (iii) evaluating the reasonableness of significant assumptions used by management, including credit risk characteristics and expected loss rates, consideration of the historical loss experience, lifetime for debt recovery, financial performance of the customers, current and future economic conditions. Professionals with specialized skill and knowledge were used to assist in evaluating the appropriateness of the model and methodology and evaluating the reasonableness of management’s significant assumptions.
The determination of fair value of convertible redeemable noncontrolling interests in TTP Car Inc. (“TTP”)
As described in Notes 2(dd) and 20 to the consolidated financial statements, the Company recorded RMB1,605.6 million convertible redeemable noncontrolling interests in TTP as mezzanine equity as of December 31, 2022. The recorded balance is determined in accordance with the underlying share purchase agreements, based on a combination of issue price, compound interest rates, and fair value. For the determination of fair value, option pricing model was
F-3
used. The major unobservable input used in the option pricing model included equity value of underlying business, which was determined by management using valuation techniques under the combination of income approach and market approach. The significant assumptions used in the valuation included revenue growth rates, operating margin, discount rate and selection of valuation multiples.
The principal considerations for our determination that performing procedures relating to the fair value determination of convertible redeemable noncontrolling interests is a critical audit matter are the significant judgments made by the management when developing the fair value estimate. This in turn led to a high degree of auditor judgment, subjectivity, and audit effort in (i) performing procedures and evaluating audit evidences related to the significant assumptions including revenue growth rates, operating margin, discount rate and selection of valuation multiples to determine the fair value of the convertible redeemable noncontrolling interests, and (ii) the audit effort involved the use of professionals with specialized skill and knowledge.
Addressing the matter involved performing procedures and evaluating audit evidence in connection with forming our overall opinion on the consolidated financial statements. These procedures included testing the effectiveness of internal controls relating to the management’s fair value estimate for the convertible redeemable noncontrolling interests as of December 31, 2022, which included controls over the development of the significant assumptions used in the valuation techniques. These procedures also included, among others, testing the management’s process for developing the fair value estimate of the convertible redeemable noncontrolling interests as of December 31, 2022, which included (i) evaluating the appropriateness of the valuation techniques, (ii) testing the completeness, and accuracy of the underlying data used in the valuation method, (iii) evaluating the reasonableness of significant assumptions used by management including revenue growth rates, operating margin, discount rate, and selection of valuation multiples. Professionals with specialized skill and knowledge were used to assist in evaluating the appropriateness of the Company’s valuation method and reasonableness of management’s significant assumptions.
/s/
April 25, 2023
We have served as the Company’s auditor since 2016.
F-4
AUTOHOME INC.
CONSOLIDATED BALANCE SHEETS
AS OF DECEMBER 31, 2021 AND 2022
(Amounts in thousands of Renminbi (“RMB”) and US dollars (“US$”) except for number of shares and per share data)
|
|
|
|
As of December 31, |
|
|||||||||
|
|
Note |
|
2021 |
|
|
2022 |
|
||||||
|
|
|
|
RMB |
|
|
RMB |
|
|
US$ |
|
|||
ASSETS |
|
|
|
|
|
|
|
|
|
|
|
|||
Current assets: |
|
|
|
|
|
|
|
|
|
|
|
|||
Cash and cash equivalents |
|
|
|
|
|
|
|
|
|
|
|
|||
Restricted Cash |
|
2(h) |
|
|
|
|
|
|
|
|
|
|||
Short-term investments |
|
|
|
|
|
|
|
|
|
|
|
|||
Accounts receivable (net of allowance for doubtful accounts of RMB |
|
4 |
|
|
|
|
|
|
|
|
|
|||
Amounts due from related parties, current |
|
12 |
|
|
|
|
|
|
|
|
|
|||
Prepaid expenses and other current assets |
|
5 |
|
|
|
|
|
|
|
|
|
|||
Total current assets |
|
|
|
|
|
|
|
|
|
|
|
|||
Non-current assets: |
|
|
|
|
|
|
|
|
|
|
|
|||
Restricted cash, non-current |
|
2(h) |
|
|
|
|
|
|
|
|
|
|||
Property and equipment, net |
|
7 |
|
|
|
|
|
|
|
|
|
|||
Intangible assets, net |
|
8, 19 |
|
|
|
|
|
|
|
|
|
|||
Goodwill |
|
19 |
|
|
|
|
|
|
|
|
|
|||
Long-term investments |
|
9 |
|
|
|
|
|
|
|
|
|
|||
Amounts due from related parties, non-current |
|
12 |
|
|
|
|
|
|
|
|
|
|||
Deferred tax assets |
|
6 |
|
|
|
|
|
|
|
|
|
|||
Other non-current assets |
|
10 |
|
|
|
|
|
|
|
|
|
|||
Total non-current assets |
|
|
|
|
|
|
|
|
|
|
|
|||
Total assets |
|
|
|
|
|
|
|
|
|
|
|
|||
LIABILITIES AND EQUITY |
|
|
|
|
|
|
|
|
|
|
|
|||
Current liabilities: |
|
|
|
|
|
|
|
|
|
|
|
|||
Accrued expenses and other payables |
|
11 |
|
|
|
|
|
|
|
|
|
|||
Advance from customers |
|
|
|
|
|
|
|
|
|
|
|
|||
Deferred revenue |
|
|
|
|
|
|
|
|
|
|
|
|||
Income tax payable |
|
|
|
|
|
|
|
|
|
|
|
|||
Amounts due to related parties |
|
12 |
|
|
|
|
|
|
|
|
|
|||
Total current liabilities (including current liabilities of consolidated VIEs without recourse to Autohome WFOE, Chezhiying WFOE or TTP WFOE of RMB |
|
|
|
|
|
|
|
|
|
|
|
|||
Non-current liabilities: |
|
|
|
|
|
|
|
|
|
|
|
|||
Other liabilities |
|
2(s),6 |
|
|
|
|
|
|
|
|
|
|||
Deferred tax liabilities |
|
6, 19 |
|
|
|
|
|
|
|
|
|
|||
Total non-current liabilities (including non-current liabilities of consolidated VIEs without recourse to Autohome WFOE, Chezhiying WFOE or TTP WFOE of RMB |
|
|
|
|
|
|
|
|
|
|
|
|||
Total liabilities (including total liabilities of consolidated VIEs without recourse to Autohome WFOE, Chezhiying WFOE or TTP WFOE of RMB |
|
|
|
|
|
|
|
|
|
|
|
|||
s |
|
13 |
|
|
|
|
|
|
|
|
|
|||
The accompanying notes are an integral part of these consolidated financial statements.
F-5
AUTOHOME INC.
CONSOLIDATED BALANCE SHEETS
AS OF DECEMBER 31, 2021 AND 2022
(Amounts in thousands of Renminbi (“RMB”) and US dollars (“US$”) except for number of shares and per share data)
|
|
|
|
As of December 31, |
|
|||||||||
|
|
Note |
|
2021 |
|
|
2022 |
|
||||||
|
|
|
|
RMB |
|
|
RMB |
|
|
US$ |
|
|||
Mezzanine equity: |
|
|
|
|
|
|
|
|
|
|
|
|||
Convertible redeemable noncontrolling interests |
|
20 |
|
|
|
|
|
|
|
|
|
|||
|
|
|
|
|
|
|
|
|
|
|
|
|||
Shareholders’ equity: |
|
|
|
|
|
|
|
|
|
|
|
|||
Ordinary shares (par value of US$ |
|
2(a),15 |
|
|
|
|
|
|
|
|
|
|||
Additional paid-in capital |
|
|
|
|
|
|
|
|
|
|
|
|||
Treasury stock |
|
15 |
|
|
( |
) |
|
|
( |
) |
|
|
( |
) |
Accumulated other comprehensive income |
|
|
|
|
( |
) |
|
|
|
|
|
|
||
Retained earnings |
|
19 |
|
|
|
|
|
|
|
|
|
|||
Total Autohome Inc. shareholders’ equity |
|
|
|
|
|
|
|
|
|
|
|
|||
Noncontrolling interests |
|
19 |
|
|
( |
) |
|
|
( |
) |
|
|
( |
) |
Total equity |
|
|
|
|
|
|
|
|
|
|
|
|||
Total liabilities, mezzanine equity and equity |
|
|
|
|
|
|
|
|
|
|
|
|||
The accompanying notes are an integral part of these consolidated financial statements.
F-6
AUTOHOME INC.
CONSOLIDATED STATEMENTS OF COMPREHENSIVE INCOME
FOR THE YEARS ENDED DECEMBER 31, 2020, 2021 AND 2022
(Amounts in thousands of Renminbi (“RMB”) and US dollars (“US$”) except for number of shares and per share data, continued)
|
|
|
|
Year ended December 31, |
|
|||||||||||||
|
|
Note |
|
2020 |
|
|
2021 |
|
|
2022 |
|
|||||||
|
|
|
|
RMB |
|
|
RMB |
|
|
RMB |
|
|
US$ |
|
||||
Net revenues: |
|
2(o) |
|
|
|
|
|
|
|
|
|
|
|
|
||||
Media services |
|
|
|
|
|
|
|
|
|
|
|
|
|
|
||||
Leads generation services |
|
|
|
|
|
|
|
|
|
|
|
|
|
|
||||
Online marketplace and others |
|
|
|
|
|
|
|
|
|
|
|
|
|
|
||||
Total net revenues (including related party transactions of RMB |
|
|
|
|
|
|
|
|
|
|
|
|
|
|||||
Cost of revenues (including related party transactions of RMB |
|
14 |
|
|
( |
) |
|
|
( |
) |
|
|
( |
) |
|
|
( |
) |
Gross profit |
|
|
|
|
|
|
|
|
|
|
|
|
|
|
||||
Operating expenses: |
|
|
|
|
|
|
|
|
|
|
|
|
|
|
||||
Sales and marketing expenses |
|
|
|
|
( |
) |
|
|
( |
) |
|
|
( |
) |
|
|
( |
) |
General and administrative expenses (including provision for doubtful accounts of RMB |
|
|
|
|
( |
) |
|
|
( |
) |
|
|
( |
) |
|
|
( |
) |
Product development expenses |
|
|
|
|
( |
) |
|
|
( |
) |
|
|
( |
) |
|
|
( |
) |
Total Operating expenses (including related party transactions of RMB99, |
|
|
|
|
( |
) |
|
|
( |
) |
|
|
( |
) |
|
|
( |
) |
Other operating income, net |
|
2(aa) |
|
|
|
|
|
|
|
|
|
|
|
|
||||
Operating profit |
|
|
|
|
|
|
|
|
|
|
|
|
|
|
||||
Interest and investment income, net (including related party transactions of RMB |
|
19 |
|
|
|
|
|
|
|
|
|
|
|
|
||||
Earnings/(loss) from equity method investments |
|
|
|
|
( |
) |
|
|
|
|
|
( |
) |
|
|
( |
) |
|
Income before income taxes |
|
|
|
|
|
|
|
|
|
|
|
|
|
|
||||
Income tax expense |
|
6 |
|
|
( |
) |
|
|
( |
) |
|
|
|
|
|
|
||
Net income |
|
|
|
|
|
|
|
|
|
|
|
|
|
|
||||
Net (income)/loss attributable to noncontrolling interests |
|
|
|
|
( |
) |
|
|
|
|
|
|
|
|
|
|||
Net income attributable to Autohome Inc. |
|
|
|
|
|
|
|
|
|
|
|
|
|
|
||||
Accretion of mezzanine equity |
|
20 |
|
|
|
|
|
( |
) |
|
|
( |
) |
|
|
( |
) |
|
Accretion attributable to noncontrolling interests |
|
|
|
|
|
|
|
|
|
|
|
|
|
|
||||
Net income attributable to ordinary shareholders |
|
|
|
|
|
|
|
|
|
|
|
|
|
|
||||
Earnings per share for ordinary shares: (Note) |
|
|
|
|
|
|
|
|
|
|
|
|
|
|
||||
Basic |
|
17 |
|
|
|
|
|
|
|
|
|
|
|
|
||||
Diluted |
|
17 |
|
|
|
|
|
|
|
|
|
|
|
|
||||
Earnings per ADS attributable to ordinary |
|
|
|
|
|
|
|
|
|
|
|
|
|
|
||||
Basic |
|
17 |
|
|
|
|
|
|
|
|
|
|
|
|
||||
Diluted |
|
17 |
|
|
|
|
|
|
|
|
|
|
|
|
||||
Weighted average number of shares used to |
|
|
|
|
|
|
|
|
|
|
|
|
|
|
||||
Basic |
|
17 |
|
|
|
|
|
|
|
|
|
|
|
|
||||
Diluted |
|
17 |
|
|
|
|
|
|
|
|
|
|
|
|
||||
Net income |
|
|
|
|
|
|
|
|
|
|
|
|
|
|
||||
Other comprehensive income/(loss) |
|
|
|
|
|
|
|
|
|
|
|
|
|
|
||||
Foreign currency translation adjustments |
|
|
|
|
( |
) |
|
|
( |
) |
|
|
|
|
|
|
||
Comprehensive income |
|
|
|
|
|
|
|
|
|
|
|
|
|
|
||||
Comprehensive (income)/ loss attributable to |
|
|
|
|
( |
) |
|
|
|
|
|
|
|
|
|
|||
Comprehensive income attributable to Autohome Inc. |
|
|
|
|
|
|
|
|
|
|
|
|
|
|
||||
The accompanying notes are an integral part of these consolidated financial statements
F-7
AUTOHOME INC.
CONSOLIDATED STATEMENTS OF CASH FLOWS
FOR THE YEARS ENDED DECEMBER 31, 2020, 2021 AND 2022
(Amounts in thousands of Renminbi (“RMB”) and US dollars (“US$”) except for number of shares and per share data)
|
|
|
|
Year ended December 31, |
|
|||||||||||||
|
|
Note |
|
2020 |
|
|
2021 |
|
|
2022 |
|
|||||||
|
|
|
|
RMB |
|
|
RMB |
|
|
RMB |
|
|
US$ |
|
||||
CASH FLOWS FROM OPERATING ACTIVITIES |
|
|
|
|
|
|
|
|
|
|
|
|
|
|
||||
Net income |
|
|
|
|
|
|
|
|
|
|
|
|
|
|
||||
Adjustments to reconcile net income to net cash from operating activities: |
|
|
|
|
|
|
|
|
|
|
|
|
|
|
||||
Depreciation of property and equipment |
|
|
|
|
|
|
|
|
|
|
|
|
|
|
||||
Amortization of intangible assets |
|
|
|
|
|
|
|
|
|
|
|
|
|
|
||||
Amortization of operating lease assets |
|
|
|
|
|
|
|
|
|
|
|
|
|
|
||||
Gain on disposal of property and equipment |
|
|
|
|
( |
) |
|
|
( |
) |
|
|
( |
) |
|
|
( |
) |
Provision for doubtful accounts |
|
|
|
|
|
|
|
|
|
|
|
|
|
|
||||
(Earnings)/loss from equity method investments |
|
|
|
|
|
|
|
( |
) |
|
|
|
|
|
|
|||
Impairment of long-term investments |
|
|
|
|
|
|
|
— |
|
|
|
|
|
|
|
|||
Fair value change of short-term investments |
|
|
|
|
|
|
|
|
|
|
|
|
|
|
||||
Fair value change of other non-current assets |
|
|
|
|
|
|
|
— |
|
|
|
— |
|
|
|
— |
|
|
Interest income of convertible bond |
|
|
|
|
( |
) |
|
|
— |
|
|
|
— |
|
|
|
— |
|
Share-based compensation |
|
|
|
|
|
|
|
|
|
|
|
|
|
|
||||
Deferred income taxes |
|
|
|
|
( |
) |
|
|
( |
) |
|
|
( |
) |
|
|
( |
) |
Changes in operating assets and liabilities: |
|
|
|
|
|
|
|
|
|
|
|
|
|
|
||||
Accounts receivable |
|
|
|
|
( |
) |
|
|
|
|
|
|
|
|
|
|||
Amounts due from related parties, current |
|
|
|
|
( |
) |
|
|
( |
) |
|
|
|
|
|
|
||
Prepaid expenses and other current assets |
|
|
|
|
( |
) |
|
|
|
|
|
( |
) |
|
|
( |
) |
|
Amounts due from related parties, non-current |
|
|
|
|
( |
) |
|
|
|
|
|
( |
) |
|
|
( |
) |
|
Other non-current assets |
|
|
|
|
( |
) |
|
|
|
|
|
( |
) |
|
|
( |
) |
|
Accrued expenses and other payables |
|
|
|
|
( |
) |
|
|
( |
) |
|
|
|
|
|
|
||
Advance from customers |
|
|
|
|
|
|
|
( |
) |
|
|
( |
) |
|
|
( |
) |
|
Deferred revenue |
|
|
|
|
( |
) |
|
|
|
|
|
( |
) |
|
|
( |
) |
|
Income tax payable |
|
|
|
|
|
|
|
|
|
|
|
|
|
|
||||
Amounts due to related parties |
|
|
|
|
|
|
|
( |
) |
|
|
( |
) |
|
|
( |
) |
|
Other liabilities |
|
|
|
|
|
|
|
( |
) |
|
|
|
|
|
|
|||
Net cash generated from operating activities |
|
|
|
|
|
|
|
|
|
|
|
|
|
|
||||
CASH FLOWS FROM INVESTING ACTIVITIES |
|
|
|
|
|
|
|
|
|
|
|
|
|
|
||||
Purchase of property and equipment |
|
|
|
|
( |
) |
|
|
( |
) |
|
|
( |
) |
|
|
( |
) |
Proceeds from disposal of property and equipment |
|
|
|
|
|
|
|
|
|
|
|
|
|
|
||||
Purchase of intangible assets |
|
|
|
|
( |
) |
|
|
( |
) |
|
|
( |
) |
|
|
( |
) |
Cash consideration paid for the TTP acquisition, net of cash acquired |
|
|
|
|
( |
) |
|
|
( |
) |
|
|
— |
|
|
|
— |
|
Acquisition of equity-method investment |
|
|
|
|
|
|
|
|
|
|
( |
) |
|
|
( |
) |
||
Purchase of short-term investments |
|
|
|
|
( |
) |
|
|
( |
) |
|
|
( |
) |
|
|
( |
) |
Maturity of short-term investments |
|
|
|
|
|
|
|
|
|
|
|
|
|
|
||||
Net cash used in investing activities |
|
|
|
|
( |
) |
|
|
( |
) |
|
|
( |
) |
|
|
( |
) |
CASH FLOWS FROM FINANCING ACTIVITIES |
|
|
|
|
|
|
|
|
|
|
|
|
|
|
||||
Proceeds from exercise of share options |
|
|
|
|
|
|
|
|
|
|
|
|
|
|
||||
Payment of dividends |
|
|
|
|
( |
) |
|
|
( |
) |
|
|
( |
) |
|
|
( |
) |
Proceeds from issuance of ordinary shares |
|
1 |
|
|
— |
|
|
|
|
|
|
— |
|
|
|
— |
|
|
Payments for repurchase of ordinary shares |
|
15 |
|
|
— |
|
|
|
( |
) |
|
|
( |
) |
|
|
( |
) |
Net cash generated from/(used in) financing activities |
|
|
|
|
( |
) |
|
|
|
|
|
( |
) |
|
|
( |
) |
|
Effect of exchange rate changes on cash and cash equivalents and restricted |
|
|
|
|
( |
) |
|
|
( |
) |
|
|
|
|
|
|
||
Net increase/(decrease) in cash and cash equivalents and restricted cash |
|
|
|
|
( |
) |
|
|
|
|
|
( |
) |
|
|
( |
) |
|
Cash and cash equivalents and restricted cash at beginning of year |
|
|
|
|
|
|
|
|
|
|
|
|
|
|
||||
Cash and cash equivalents and restricted cash at end of year |
|
|
|
|
|
|
|
|
|
|
|
|
|
|
||||
Supplemental disclosures of cash flow information: |
|
|
|
|
|
|
|
|
|
|
|
|
|
|
||||
Income taxes paid |
|
|
|
|
|
|
|
|
|
|
|
|
|
|
||||
Purchase of fixed assets included in accrued expenses and other payables |
|
|
|
|
|
|
|
|
|
|
|
|
|
|
||||
Cash paid for operating lease cost |
|
|
|
|
|
|
|
|
|
|
|
|
|
|
||||
Right-of-use assets acquired under operating leases |
|
|
|
|
|
|
|
|
|
|
|
|
|
|
||||
The accompanying notes are an integral part of these consolidated financial statements
F-8
AUTOHOME INC.
CONSOLIDATED STATEMENTS OF CHANGES IN SHAREHOLDERS’ EQUITY
FOR THE YEARS ENDED DECEMBER 31, 2020, 2021 AND 2022
(Amounts in thousands of Renminbi (“RMB”) and US dollars (“US$”) except for number of shares and per share data)
. |
|
Note |
|
Ordinary shares |
|
|
Additional |
|
|
Treasury |
|
|
Accumulated |
|
|
Retained |
|
|
Noncontrolling |
|
|
Total |
|
|||||||||||
|
|
|
|
Shares |
|
|
Amount |
|
|
paid-in |
|
|
stock |
|
|
income |
|
|
earnings |
|
|
interests |
|
|
equity |
|
||||||||
|
|
|
|
Number |
|
|
RMB |
|
|
RMB |
|
|
RMB |
|
|
RMB |
|
|
RMB |
|
|
RMB |
|
|
RMB |
|
||||||||
Balance as of December 31, 2019 |
|
|
|
|
|
|
|
|
|
|
|
|
|
— |
|
|
|
|
|
|
|
|
|
( |
) |
|
|
|
||||||
Net income |
|
|
|
|
— |
|
|
|
— |
|
|
|
— |
|
|
|
— |
|
|
|
— |
|
|
|
|
|
|
|
|
|
|
|||
Other comprehensive loss |
|
|
|
|
— |
|
|
|
— |
|
|
|
— |
|
|
|
— |
|
|
|
( |
) |
|
|
— |
|
|
|
— |
|
|
|
( |
) |
Acquisition of a subsidiary |
|
19 |
|
|
— |
|
|
|
— |
|
|
|
— |
|
|
|
— |
|
|
|
— |
|
|
|
— |
|
|
|
|
|
|
|
||
Dividends declared (US$ |
|
|
|
|
— |
|
|
|
— |
|
|
|
— |
|
|
|
— |
|
|
|
— |
|
|
|
( |
) |
|
|
— |
|
|
|
( |
) |
Exercise and vesting of share-based awards |
|
|
|
|
|
|
|
|
|
|
|
|
|
— |
|
|
|
— |
|
|
|
— |
|
|
|
— |
|
|
|
|
||||
Share-based compensation |
|
|
|
|
— |
|
|
|
— |
|
|
|
|
|
|
— |
|
|
|
— |
|
|
|
— |
|
|
|
— |
|
|
|
|
||
Balance as of December 31, 2020 |
|
|
|
|
|
|
|
|
|
|
|
|
|
— |
|
|
|
|
|
|
|
|
|
|
|
|
|
|||||||
Net income |
|
|
|
|
— |
|
|
|
— |
|
|
|
— |
|
|
|
— |
|
|
|
— |
|
|
|
|
|
|
( |
) |
|
|
|
||
Other comprehensive (loss)/income |
|
|
|
|
— |
|
|
|
— |
|
|
|
— |
|
|
|
— |
|
|
|
( |
) |
|
|
— |
|
|
|
|
|
|
( |
) |
|
Dividends declared (US$ |
|
|
|
|
— |
|
|
|
— |
|
|
|
— |
|
|
|
— |
|
|
|
— |
|
|
|
( |
) |
|
|
— |
|
|
|
( |
) |
Exercise and vesting of share-based awards |
|
|
|
|
|
|
|
|
|
|
|
|
|
— |
|
|
|
— |
|
|
|
— |
|
|
|
— |
|
|
|
|
||||
Share-based compensation |
|
|
|
|
— |
|
|
|
— |
|
|
|
|
|
|
— |
|
|
|
— |
|
|
|
— |
|
|
|
— |
|
|
|
|
||
Issuance of ordinary shares, net of issuance costs |
|
1 |
|
|
|
|
|
|
|
|
|
|
|
— |
|
|
|
— |
|
|
|
— |
|
|
|
— |
|
|
|
|
||||
Repurchase of ordinary shares |
|
15 |
|
|
( |
) |
|
|
— |
|
|
|
— |
|
|
|
( |
) |
|
|
— |
|
|
|
— |
|
|
|
— |
|
|
|
( |
) |
Accretion of redeemable noncontrolling interests |
|
|
|
|
— |
|
|
|
— |
|
|
|
— |
|
|
|
— |
|
|
|
— |
|
|
|
( |
) |
|
|
( |
) |
|
|
( |
) |
Balance as of December 31, 2021 |
|
|
|
|
|
|
|
|
|
|
|
|
|
( |
) |
|
|
( |
) |
|
|
|
|
|
( |
) |
|
|
|
|||||
Net income |
|
|
|
|
— |
|
|
|
— |
|
|
|
— |
|
|
|
— |
|
|
|
— |
|
|
|
|
|
|
( |
) |
|
|
|
||
Other comprehensive income/(loss) |
|
|
|
|
— |
|
|
|
— |
|
|
|
— |
|
|
|
— |
|
|
|
|
|
|
— |
|
|
|
( |
) |
|
|
|
||
Dividends declared (US$ |
|
|
|
|
— |
|
|
|
— |
|
|
|
— |
|
|
|
— |
|
|
|
— |
|
|
|
( |
) |
|
|
— |
|
|
|
( |
) |
Exercise and vesting of share-based awards |
|
|
|
|
|
|
|
|
|
|
|
|
|
— |
|
|
|
— |
|
|
|
— |
|
|
|
— |
|
|
|
|
||||
Share-based compensation |
|
|
|
|
— |
|
|
|
— |
|
|
|
|
|
|
— |
|
|
|
— |
|
|
|
— |
|
|
|
— |
|
|
|
|
||
Adjustment of issuance costs |
|
|
|
|
— |
|
|
|
— |
|
|
|
|
|
|
— |
|
|
|
— |
|
|
|
— |
|
|
|
— |
|
|
|
|
||
Repurchase of ordinary shares |
|
|
|
|
( |
) |
|
|
— |
|
|
|
— |
|
|
|
( |
) |
|
|
— |
|
|
|
— |
|
|
|
— |
|
|
|
( |
) |
Accretion of redeemable noncontrolling interests |
|
|
|
|
— |
|
|
|
— |
|
|
|
— |
|
|
|
— |
|
|
|
— |
|
|
|
( |
) |
|
|
( |
) |
|
|
( |
) |
Balance as of December 31, 2022 |
|
|
|
|
|
|
|
|
|
|
|
|
|
( |
) |
|
|
|
|
|
|
|
|
( |
) |
|
|
|
||||||
Balance as of December 31, 2022, in US$ |
|
|
|
|
|
|
|
|
|
|
|
|
|
( |
) |
|
|
|
|
|
|
|
|
( |
) |
|
|
|
||||||
The accompanying notes are an integral part of these consolidated financial statements
F-9
AUTOHOME INC.
NOTES TO THE CONSOLIDATED FINANCIAL STATEMENTS
FOR THE YEARS ENDED DECEMBER 31, 2020, 2021 AND 2022
Autohome Inc., formerly known as Sequel Limited (together with its subsidiaries, VIEs and VIEs’ subsidiaries is defined as the “Company”), was incorporated under the laws of the Cayman Islands on June 23, 2008. Upon incorporation, the Company was
Autohome Inc. successfully completed its IPO and listing of
On March 15, 2021, Autohome Inc. successfully completed its global offering and the Company’s ordinary shares have been listed on the Hong Kong Stock Exchange. Autohome Inc. issued
As of December 31, 2022, Autohome Inc. had
The Company, through its subsidiaries and VIEs (as disclosed in the table below), is engaged in the provision of media services, leads generation services and online marketplace and others.
F-10
As of December 31, 2022, the following table sets forth the Company’s principal subsidiaries, principal VIEs and VIEs’ subsidiaries:
Entity |
|
Date of |
|
Place of |
|
Percentage of |
|
|
Principal Subsidiaries |
|
|
|
|
|
|
|
|
Cheerbright International Holdings Limited |
|
|
|
|
% |
|||
Autohome Link Inc. |
|
|
|
|
% |
|||
Autohome (Hong Kong) Limited (“Autohome HK”) |
|
|
|
|
% |
|||
Autohome Link Hong Kong Limited |
|
|
|
|
% |
|||
Autohome Media Limited (“Autohome Media”, formerly |
|
|
|
|
% |
|||
TTP Car Inc. (“TTP”) |
|
|
|
|
||||
Auto Pai Ltd. |
|
|
|
|
% |
|||
TTP Car (HK) Limited |
|
|
|
|
% |
|||
Beijing Cheerbright Technologies Co., Ltd. |
|
|
|
|
% |
|||
Autohome Shanghai Advertising Co., Ltd. |
|
|
|
|
% |
|||
Beijing Prbrownies Software Co., Ltd. (formerly known as |
|
|
|
|
% |
|||
Beijing Autohome Technologies Co., Ltd. |
|
|
|
|
% |
|||
Beijing Autohome Advertising Co., Ltd. |
|
|
|
|
% |
|||
Beijing Chezhiying Technology Co., Ltd. |
|
|
|
|
% |
|||
Guangzhou Autohome Advertising Co., Ltd. |
|
|
|
|
% |
|||
Guangzhou Chezhihuitong Advertising Co., Ltd. |
|
|
|
|
% |
|||
Hainan Chezhiyitong Information Technology Co., Ltd. |
|
|
|
|
% |
|||
Tianjin Autohome Software Co., Ltd. |
|
|
|
|
% |
|||
Autohome Zhejiang Advertising Co., Ltd. |
|
|
|
|
% |
|||
Shanghai Chezhitong Information Technology Co., Ltd. |
|
|
|
|
% |
|||
Shanghai Jinpai E-commerce Co., Ltd. (“TTP WFOE”) |
|
|
|
|
% |
|||
|
|
|
|
|
|
|
|
|
Principal VIEs and VIEs’ subsidiaries |
|
Date of |
|
Place of |
|
Percentage of indirect economic interest |
|
|
Beijing Autohome Information Technology Co., Ltd. |
|
|
|
|
% |
|||
Beijing Shengtuo Hongyuan Information Technology |
|
|
|
|
% |
|||
Shanghai Tianhe Insurance Brokerage Co., Ltd. |
|
|
|
|
% |
|||
Shanghai Jinwu Auto Technology Consultant Co., Ltd. |
|
|
|
|
% |
|||
Shanghai Jinyou Auto Technology Consultant Co., Ltd. |
|
|
|
|
% |
|||
Note: Please refer to Note 19 for the disclosure of acquisition.
The Company provides media services, leads generation services and online marketplace and others through its websites and mobile applications. These services are primarily offered to automakers and dealers, and advertising agencies that represent automakers and dealers in the automobile industry, and financial institutions. The Company’s principal geographic market is in mainland China. Autohome Inc. does not conduct any substantive operations of its own but conducts its primary business operations through its principal subsidiaries, VIEs and the VIEs' subsidiaries.
F-11
PRC laws and regulations prohibit or restrict foreign ownership of internet content businesses. To comply with these foreign ownership restrictions, the Company and its subsidiaries operate websites and mobile applications and conduct its business related to internet content services through VIEs. The paid-in capital of the VIEs was funded by the Company’s PRC subsidiaries, Autohome WFOE, Chezhiying WFOE and TTP WFOE, through loans extended to the VIEs’ shareholders (“Nominee Shareholders”). The Company obtained a controlling financial interest in the VIEs and VIEs’ subsidiaries by entering into a series of contractual agreements (the “Contractual Agreements”) through the WFOEs. As a result of the Contractual Agreements, the WFOEs are entitled to substantially all of the economic benefits from the VIEs and VIEs’ subsidiaries and are obligated to absorb all of the VIEs and VIEs’ subsidiaries' expected losses and therefore the Company has determined that it is the primary beneficiary of the VIEs and VIEs’ subsidiaries. Accordingly, the Company has consolidated the VIEs and VIEs’ subsidiaries results of operations and assets and liabilities in the Company’s consolidated financial statements in accordance with US GAAP.
Autohome WFOE entered into a series of contractual agreements with Autohome Information and each of its individual nominee shareholders. The currently effective contractual agreements were entered into in February 2021 by and between Autohome WFOE, Autohome Information, Mr. Quan Long, the Company’s chairman of the Board of Directors and chief executive officer, and Ms. Haiyun Lei.
Chezhiying WFOE also entered into a series of contractual agreements with Shengtuo Hongyuan and each of its individual nominee shareholders. The currently effective contractual agreements were entered into in February 2021 by and between Chezhiying WFOE, Shengtuo Hongyuan, Mr. Quan Long, the Company’s chairman of the Board of Directors and chief executive officer, and Ms. Haiyun Lei.
In the end of December 2020, the Company acquired TTP, its subsidiaries and VIEs, which also conduct its business related to internet content services through VIEs. In August 2015, the then individual nominee shareholder of Shanghai Jinwu, entered into Equity Interest Purchase Agreements and Debt Transfer and Offset Agreements with Weiwei Wang, pursuant to which the then individual nominee shareholder transferred all of its equity interest of Shanghai Jinwu to Weiwei Wang. In August 2015, TTP WFOE, and Shanghai Jinwu and Weiwei Wang, as the individual nominee shareholder of VIE, entered into a series of contractual agreements. In March and May of 2022, Weiwei Wang and Lan Zhang, as the individual nominee shareholders of Shanghai Jinyou, entered into a series of contractual agreements with TTP WFOE.
Despite the lack of technical majority ownership, there exists a parent-subsidiary relationship between the Company and the VIEs through the irrevocable power of attorney agreement, whereby the Nominee Shareholders effectively assigned all of their voting rights underlying their equity interest in the VIEs to the WFOEs. In addition, through the Contractual Agreements the Company demonstrates its ability and intention to continue to exercise the ability to absorb substantially all of the expected losses and majority of the profits of the VIEs through the WFOEs.
The following is a summary of the Contractual Arrangements that the Company, through its WFOEs, entered with the VIEs and their Nominee Shareholders:
Exclusive technical consulting and service agreements
Pursuant to the exclusive technical consulting and service agreements that have been entered into by the WFOEs and the VIEs, the VIEs have engaged the WFOEs as their exclusive provider of technical support and management consulting services. In addition, the WFOEs shall provide the necessary financial support to the VIEs whether or not the VIEs incur any losses, and not request for repayment if the VIEs are unable to do so. The VIEs shall pay to the WFOEs service fees calculated based on such VIE’s revenues reduced by its value-added taxes and surcharges, operating expenses and an appropriate amount of retained profit that is determined pursuant to the Company’s tax planning strategies and relevant tax laws. The service fees can be adjusted by the WFOEs unilaterally. The WFOEs shall exclusively own any intellectual property arising from the performance of these agreements. This agreement has
Loan agreement
Pursuant to the loan agreements between the Nominee Shareholders of the VIEs and the WFOEs, the WFOEs granted interest-free loans for the Nominee Shareholders’ contributions to the VIEs. The term of the loan is indefinite until the WFOEs requests repayment. The manner and timing of the repayment shall be at the sole discretion of the WFOEs and at the WFOEs’ option may be in the form of transferring the VIEs’ equity interest to the WFOEs or their designated persons.
F-12
Exclusive equity option agreements
Pursuant to the exclusive equity option agreements entered into among the Nominee Shareholders of the VIEs, VIEs and the WFOEs, the Nominee Shareholders jointly and severally granted to the WFOEs an option to purchase their equity interests in the VIEs. The purchase price will be offset against the loan repayments under the loan agreements. If the transfer price of the equity interest is greater than the loan amount, the Nominee Shareholders are required to immediately return the received transfer price in excess of the loan amount to the WFOEs or any person designated by the WFOEs. The WFOEs may exercise such option at any time until it has acquired all equity interests of the VIEs or freely transfer the option to any third party and such third party may assume the right and obligations of the option agreement. In addition, dividends and distributions are not permitted without the prior consent of the WFOEs, to the extent there is a dividend or distribution, the Nominee Shareholders will remit the amounts in full to the WFOEs immediately. In the event of liquidation or dissolution of the VIEs, all assets shall be sold to the WFOEs at the lowest selling price permitted by applicable PRC law, and any proceeds from the transfer and any residual interests in the VIEs shall be remitted to the WFOEs immediately. The exclusive equity option agreements have an indefinite term and will terminate at the earlier of i) the date on which all of the equity interests have been transferred to the WFOEs or any person designated by the WFOEs; or ii) the unilateral termination by the WFOEs.
Equity interest pledge agreements
Pursuant to the equity interest pledge agreements entered into between the Nominee Shareholders of the VIEs and the WFOEs, the Nominee Shareholders pledged all of their equity interests in the VIEs to the WFOEs as collateral for all of their payments due to the WFOEs and to secure their obligations under the above agreements. The Nominee Shareholders may not transfer or assign the shares, the rights and obligations in the share pledge agreement or create or permit to create any pledges which may have an adverse effect on the rights or benefits of the VIEs without the WFOE’s preapproval. The WFOE is entitled to transfer or assign in full or in part the shares pledged. In the event of default, the WFOE as the pledgee will be entitled to request immediate repayment of the loan or to dispose of the pledged equity interests through transfer or assignment. There have been no dividends or distributions from inception to date. The equity interest pledge agreements have an indefinite term and will terminate after all the obligations under these agreements have been satisfied in full or the pledged equity interests have been transferred to the WFOEs or their designees.
Power of attorney agreements
Pursuant to the power of attorney agreements, shareholders of the VIEs have given the WFOEs an irrevocable proxy to act on their behalf on all matters pertaining to the VIEs and to exercise all of their rights as shareholders of the VIEs, including the right to attend shareholders’ meetings, to exercise voting rights and to transfer all or a part of his equity interests in the VIEs.
Risk in relation to the VIE Structure
Internet content related businesses are subject to significant restrictions under current PRC laws and regulations. Specifically, foreign investors are not allowed to own more than 50% equity interest in any Internet Content Provider (“ICP”) business.
The Company conducts its operations in China through Contractual Agreements entered into between the WFOEs and VIEs. In 2014, the Company began gradually migrating the advertising service business from the VIEs to the subsidiaries of Autohome Media, a transition that was completed to a substantial extent. If the Company or any of its current or future VIEs or subsidiaries are found in violation of any existing or future laws or regulations, or fail to obtain or maintain any of the required permits or approvals, the relevant PRC regulatory authorities would have broad discretion in dealing with such violations, including levying fines, confiscating the income of Autohome WFOE, Chezhiying WFOE, TTP WFOE and VIEs, revoking their business licenses or operating licenses, shutting down the Company’s servers or blocking the Company’s websites and mobile applications, discontinuing or placing restrictions or onerous conditions on the Company’s operations, requiring the Company to undergo a costly and disruptive restructuring, restricting the Company’s rights to use the proceeds from the offering to finance the Company’s business and operations in China, or enforcement actions that could be harmful to the Company’s business. Any of these actions could cause significant disruption to the Company’s business operations and severely damage the Company’s reputation, which would in turn materially and adversely affect the Company’s business and results of operations. In addition, if the imposition of any of these penalties causes the Company to lose the rights to direct the activities of VIEs or the Company’s right to receive their economic benefits, the Company would no longer be able to consolidate the VIEs.
In addition, if Autohome Information and its subsidiaries, Shengtuo Hongyuan and its subsidiaries, Shanghai Jinwu Shanghai Jinyou or their shareholders fail to perform their obligations under the Contractual Agreements, the Company may have to incur substantial costs
F-13
and expend resources to enforce the Company’s rights under the contracts. The Company may have to rely on legal remedies under PRC law, including seeking specific performance or injunctive relief and claiming damages, which may not be effective. All of these Contractual Agreements are governed by PRC law and provide for the resolution of disputes through arbitration in the PRC. Accordingly, these contracts would be interpreted in accordance with PRC law and any disputes would be resolved in accordance with PRC legal procedures. The legal system in PRC is not as developed as in other jurisdictions, such as United States. As a result, uncertainties in the PRC legal system could limit the Company’s ability to enforce these Contractual Agreements. Under PRC law, rulings by arbitrators are final, parties cannot appeal the arbitration results in courts, and prevailing parties may only enforce the arbitration awards in PRC courts through arbitration award recognition proceedings, which would incur additional expenses and delay. In the event the Company is unable to enforce these Contractual Agreements, the Company may not be able to obtained a controlling financial interest in the VIEs and VIEs’ subsidiaries, and the Company’s ability to conduct its business may be negatively affected.
Based on the advice of the Company’s PRC legal counsel, the corporate structure and Contractual Agreements of the Company’s VIEs and WFOEs in China are in compliance with all existing PRC laws and regulations. Therefore, in the opinion of management, (i) the ownership structure of the Company and the VIEs are in compliance with existing PRC laws and regulations; (ii) the Contractual Agreements with VIEs and their nominee shareholders are valid and binding, and will not result in any violation of PRC laws or regulations currently in effect; and (iii) the Company’s business operations are in compliance with existing PRC law and regulations in all material respects.
The VIEs contributed an aggregate of
Relevant PRC laws and regulations restrict the VIEs from transferring a portion of its net assets to the Company in the form of loans and advances or cash dividends. Please refer to Note 16 for disclosure of restricted net assets.
The following table sets forth the assets, liabilities, results of operations and cash flows of the VIEs and VIEs’ subsidiaries included in the Company’s consolidated balance sheets, consolidated statements of comprehensive income and consolidated statements of cash flows.
|
|
As of December 31, |
|
|||||||||
|
|
2021 |
|
|
2022 |
|
||||||
|
|
RMB |
|
|
RMB |
|
|
US$ |
|
|||
|
|
(in thousands) |
|
|||||||||
Current assets |
|
|
|
|
|
|
|
|
|
|||
Non-current assets |
|
|
|
|
|
|
|
|
|
|||
Total assets |
|
|
|
|
|
|
|
|
|
|||
Accrued expenses and other payables |
|
|
|
|
|
|
|
|
|
|||
Advance from customers |
|
|
|
|
|
|
|
|
|
|||
Deferred revenue |
|
|
|
|
|
|
|
|
|
|||
Inter-company payables |
|
|
|
|
|
|
|
|
|
|||
Total current liabilities |
|
|
|
|
|
|
|
|
|
|||
Other liabilities |
|
|
|
|
|
|
|
|
|
|||
Deferred tax liabilities |
|
|
|
|
|
|
|
|
|
|||
Total non-current liabilities |
|
|
|
|
|
|
|
|
|
|||
Total liabilities |
|
|
|
|
|
|
|
|
|
|||
Net assets |
|
|
|
|
|
|
|
|
|
|||
|
|
Year ended December 31, |
|
|||||||||||||
|
|
2020 |
|
|
2021 |
|
|
2022 |
|
|||||||
|
|
RMB |
|
|
RMB |
|
|
RMB |
|
|
US$ |
|
||||
|
|
(in thousands) |
|
|||||||||||||
Net revenues |
|
|
|
|
|
|
|
|
|
|
|
|
||||
-Third-party revenues |
|
|
|
|
|
|
|
|
|
|
|
|
||||
-Inter-company revenues |
|
|
|
|
|
|
|
|
|
|
|
|
||||
Net (loss)/income |
|
|
|
|
|
( |
) |
|
|
( |
) |
|
|
( |
) |
|
F-14
|
|
Year ended December 31, |
|
|||||||||||||
|
|
2020 |
|
|
2021 |
|
|
2022 |
|
|||||||
|
|
RMB |
|
|
RMB |
|
|
RMB |
|
|
US$ |
|
||||
|
|
(in thousands) |
|
|||||||||||||
Net cash (used in)/generated from operating activities |
|
|
|
|
|
|
|
|
|
|
|
|
||||
Net cash generated/(used in) from investing activities |
|
|
|
|
|
( |
) |
|
|
( |
) |
|
|
( |
) |
|
Net cash generated from financing activities |
|
|
|
|
|
|
|
|
|
|
|
|
||||
The revenue-producing assets that are held by the VIEs comprise of customer relationship, trademarks, websites, domain names, operating license and servers.
The current assets of the VIEs included amounts due from Group companies of RMB
The accompanying consolidated financial statements have been prepared in accordance with U.S. Generally Accepted Accounting Principles (“U.S. GAAP”).
On February 2, 2021, the Company announced that the following proposed resolution submitted for shareholder approval has been adopted and approved as a special resolution at the Company’s extraordinary general meeting of shareholders: All authorized Class A ordinary shares and Class B ordinary shares are re-designated and combined into one single class of ordinary shares, and subsequently each ordinary share is subdivided into four shares, effective as of February 5, 2021 (the “Share Subdivision”). As a result of this variation of share capital, the authorized share capital of Autohome Inc. shall be US$
The consolidated financial statements include the financial statements of the Company, its subsidiaries, the VIEs and VIEs’ subsidiaries for which the Company or subsidiaries of the Company are the primary beneficiaries. All significant inter-company transactions and balances between the Company, its subsidiaries, the VIEs and VIEs’ subsidiaries are eliminated upon consolidation. Results of acquired subsidiaries and VIEs are consolidated from the date on which control is transferred to the Company, or the Company obtains a controlling financial interest in the VIEs and VIEs’ subsidiaries.
The preparation of the consolidated financial statements in conformity with U.S. GAAP requires management to make estimates and assumptions that affect the reported amounts of assets and liabilities and disclosures of contingent assets and liabilities at the date of the consolidated financial statements and the reported amounts of revenues and expenses during the year. Areas where management uses subjective judgment include, but are not limited to: estimation of variable consideration represented by sales rebates related to revenue transactions; initial valuation of the assets acquired and liabilities assumed in a business combination; fair value measurement of short-term investments; depreciation or amortization of long-lived assets and intangible assets; subsequent impairment assessment of
F-15
long-lived assets, intangible assets, goodwill, other non-current assets and long-term investments; provision for expected credit loss for financial assets which are within the scope of ASC 326; accounting for deferred income taxes, assessment of fair value and estimate of forfeitures for share-based awards; and accretion of changes in the redemption value on the preferred shares owned by the noncontrolling shareholders. Changes in facts and circumstances may result in revised estimates. Actual results could differ from those estimates, and as such, differences may be material to the consolidated financial statements.
The functional currency of Autohome Inc., its Cayman subsidiaries and Cheerbright, is the United States dollar (“US$”), whereas the Company’s subsidiaries and VIEs with operations in mainland China, Hong Kong, and other jurisdictions generally use their respective local currencies as their functional currencies as determined based on the criteria of ASC 830, Foreign Currency Matters. The Company uses the RMB as its reporting currency. Transactions denominated in foreign currencies are re-measured into the functional currency at the exchange rates prevailing on the transaction dates. Foreign currency denominated financial assets and liabilities are re-measured at the balance sheet date exchange rate. Exchange gains and losses are included in other operating income, net in the consolidated statements of comprehensive income.
Assets and liabilities of the Company and Company’s subsidiaries, other than the subsidiaries with the functional currency of RMB, are translated into RMB at fiscal year-end exchange rates. Income and expense items are translated at monthly average exchange rates prevailing during the fiscal year.
Amounts in United States dollars (“US$”) are presented for the convenience of the reader and are translated at the noon buying rate of US$1.00 to RMB
Cash and cash equivalents consist of cash on hand, demand deposits, and time deposits placed with banks or other financial institutions which are unrestricted as to withdrawal and use and have original maturities of three months or less.
Short-term investments represent bank deposits and adjustable-rate financial products with original maturities of less than 1 year that are measured at fair value. In accordance with ASC 825, Financial Instruments, for adjustable-rate financial products with the interest rate indexed to performance of underlying assets, the Company elected the fair value method at the date of initial recognition and carried these investments at fair value. Changes in the fair value are reflected in the consolidated statements of comprehensive income as interest and investment income, net. As of December 31, 2022, the Company had an investment in an overdue financial product with fair value below its initial investment, and recognized the loss of RMB
Restricted cash primarily represents cash deposits in a regulatory escrow account related to insurance brokerage services and litigation-related restricted balance.
The following table provides a reconciliation of the amount of cash, cash equivalents, and restricted cash reported within the consolidated balance sheets to the total of the same such amounts shown in the consolidated statements of cash flows:
F-16
|
|
As of December 31, |
|
|||||||||||||
|
|
2020 |
|
|
2021 |
|
|
2022 |
|
|||||||
|
|
RMB |
|
|
RMB |
|
|
RMB |
|
|
US$ |
|
||||
|
|
(in thousands) |
|
|||||||||||||
Amounts shown in Consolidated Balance Sheets: |
|
|
|
|
|
|
|
|
|
|
|
|
||||
Cash and cash equivalents |
|
|
|
|
|
|
|
|
|
|
|
|
||||
Restricted cash |
|
|
|
|
|
|
|
|
|
|
|
|
||||
Total cash, cash equivalents and restricted cash as |
|
|
|
|
|
|
|
|
|
|
|
|
||||
Financial instruments of the Company primarily comprise of cash and cash equivalents, restricted cash, short-term investments, accounts receivable, amounts due from related parties, prepaid expenses and other current assets excluding prepayments and staff advances, other non-current assets excluding operating lease right-of-use assets, accrued expenses and other payables, and amounts due to related parties. The carrying values of these financial instruments excluding other non-current assets approximated their fair values due to the short-term maturity of these instruments.
F-17
ASC topic 820 (“ASC 820”), Fair Value Measurements and Disclosures, establishes a three-tier fair value hierarchy, which prioritizes the inputs used in measuring fair value as follows:
Level 1 – Observable inputs that reflect quoted prices (unadjusted) for identical assets or liabilities in active markets
Level 2 – Include other inputs that are directly or indirectly observable in the marketplace
Level 3 – Unobservable inputs which are supported by little or no market activity
ASC 820 describes three main approaches to measuring the fair value of assets and liabilities: (1) market approach; (2) income approach and (3) cost approach. The market approach uses prices and other relevant information generated from market transactions involving identical or comparable assets or liabilities. The income approach uses valuation techniques to convert future amounts to a single present value amount. The measurement is based on the value indicated by current market expectations about those future amounts. The cost approach is based on the amount that would currently be required to replace an asset.
Property and equipment are stated at cost and are depreciated using the straight-line method over the estimated useful lives of the assets, as follows:
Category |
|
Estimated useful life |
Electronic equipment |
|
|
Office equipment |
|
|
Motor vehicles |
|
|
Software |
|
|
Leasehold improvements |
|
Repair and maintenance costs are charged to expense as incurred, whereas the costs of betterments that extend the useful life of property and equipment are capitalized as additions to the related assets. Retirements, sale and disposals of assets are recorded by removing the cost and accumulated depreciation with any resulting gain or loss reflected in the consolidated statements of comprehensive income.
Intangible assets are carried at cost less accumulated amortization and any recorded impairment. Intangible assets acquired in a business combination were recognized initially at fair value at the date of acquisition. Intangible assets acquired in asset acquisitions are measured based on the cost to the acquiring entity, which generally includes transaction costs. Intangible assets with finite useful lives are amortized using a straight-line method of amortization that reflects the estimated pattern in which the economic benefits of the intangible asset are to be consumed.
Category |
|
Estimated useful life |
Technologies |
|
|
Trademarks |
|
|
Customer relationship |
|
|
Websites |
|
|
Domain names |
|
|
Database |
|
|
Licensing agreements |
|
|
Insurance brokerage license |
|
The Company’s long-term investments consist of equity method investments. Investments in entities in which the Company can exercise significant influence and holds an investment in voting common stock or in-substance common stock (or both) of the investee but does not own a majority equity interest or control are accounted for using the equity method of accounting in accordance with ASC topic 323 (“ASC 323”), Investments-Equity Method and Joint Ventures. Under the equity method, the Company initially records its investments at cost. The Company subsequently adjusts the carrying amount of the investments to recognize the Company’s proportionate share of each equity investee’s net income or loss into earnings after the date of investments. The Company evaluates the equity method investments for impairment under ASC 323. An impairment loss on the equity method investments is recognized in earnings when the decline in value is determined to be other-than-temporary.
F-18
Goodwill represents the excess of the purchase price over the amounts assigned to the fair value of the assets acquired and the liabilities assumed of an acquired business. The Company’s goodwill at December 31, 2021 and 2022 was related to its acquisition of Cheerbright, China Topside and Norstar in June 2008, and its acquisition of TTP in December 2020. In accordance with ASC 350, Goodwill and Other Intangible Assets, recorded goodwill amounts are not amortized, but rather are tested for impairment annually or more frequently if there are indicators of impairment present.
Goodwill is tested for impairment at the reporting unit level on an annual basis (December 31 for the Company) and between annual tests if an event occurs or circumstances change that would more-likely-than-not reduce the fair value of a reporting unit below its carrying value. These events or circumstances include a significant change in stock prices, business environment, legal factors, financial performances, competition, or events affecting the reporting unit. Application of the goodwill impairment test requires judgment, including the identification of reporting units, assignment of assets and liabilities to reporting units, assignment of goodwill to reporting units, and determination of the fair value of each reporting unit. The estimates used to calculate the fair value of a reporting unit change from year to year based on operating results and market conditions. Changes in these estimates and assumptions could materially affect the determination of fair value and goodwill impairment for the reporting unit.
Management has determined that the Company represents the lowest level within the entity at which goodwill is monitored for internal management purposes. Starting from January 1, 2020, the Company adopted ASU 2017-04, which simplifies the accounting for goodwill impairment by eliminating Step 2 from the goodwill impairment test. If the carrying amount of a reporting unit exceeds its fair value, an impairment loss shall be recognized in an amount equal to that excess, versus determining an implied fair value in Step 2 to measure the impairment loss. Management evaluated goodwill for impairment by performing a qualitative assessment at the reporting unit level. Based on an assessment of the qualitative factors, management determined that it is more-likely-than-not that the fair value of the reporting unit is in excess of its carrying amount as of December 31, 2021 and 2022. Therefore,
If the Company reorganizes its reporting structure in a manner that changes the composition of one or more of its reporting units, goodwill is reassigned based on the relative fair value of each of the affected reporting units.
The Company evaluates its long-lived assets or asset group, including intangible assets with finite lives, for impairment whenever events or changes in circumstances (such as a significant adverse change to market conditions that will impact the future use of the assets) indicate that the carrying amount of an asset or a Company of long-lived assets may not be recoverable. When these events occur, the Company evaluates impairment by comparing the carrying amount of the assets to future undiscounted net cash flows expected to result from the use of the assets and their eventual disposition. If the sum of the expected undiscounted cash flow is less than the carrying amount of the assets, the Company would recognize an impairment loss based on the excess of the carrying amount of the asset group over its fair value. No impairment charge was recorded for any of the years presented.
The Company’s revenues are derived from media services, leads generation services and online marketplace and others. Under ASC 606, revenues are recognized when control of the promised goods or services is transferred to the Company’s customers, in an amount that reflects the consideration the Company expects to be entitled to in exchange for those goods or services. The recognition of revenue involves certain management judgments including identification of performance obligations, standalone selling price for each performance obligation, estimation of variable consideration represented by sales rebates, etc. The Company provides rebates to agency companies based on cumulative annual advertising and service volume, and timeliness of their payments, which are accounted for as variable consideration. The Company estimate its obligations under such agreements by applying the most likely amount method, based on an evaluation of the likelihood of the agency companies’ achievement of the advertising and service volume targets, and the timeliness of their payments, after taking into account the agency companies’ purchase trends and history. A refund liability (included in accrued expenses and other payables) is recognized for expected sales rebates payable to agency companies in relation to advertising services provided. The Company recognizes revenue for the amount of fees it receives from its clients, after deducting these sales rebates, and net of VAT collected from customers. The Company believes that there will not be significant changes to its estimates of variable consideration and updates the estimate at each reporting period as actual utilization becomes available.
F-19
The Company determines revenue recognition through the following steps
Media services
Media services revenues mainly include revenues from automaker advertising services and regional marketing campaigns conducted by certain automobile brands’ regional offices. The majority of online advertising service contracts involve multiple deliverables or performance obligations presented on PC and mobile platforms and under different formats such as banner advertisements, links and logos, other media insertions and promotional activities that are delivered over different periods of time. Revenue is allocated among these different deliverables based on their relative standalone selling prices. The Company generally determines the standalone selling price as the observable price of a product or service charged to customers when sold on a standalone basis. Advertising services are primarily delivered based on cost per day (“CPD”) pricing model. For CPD advertising arrangements, revenue is recognized when the corresponding advertisements are published over the stated display period. For cost per thousand impressions (“CPM”) model, revenue is recognized when the advertisements are displayed and based on the number of times that the advertisement has been displayed. For cost-per-click (“CPC”) model, revenue is recognized when the user clicks on the customer-sponsored links and based on the number of clicks.
Leads generation services
Leads generation services primarily include revenues from (i) dealer subscription services, (ii) advertising services sold to individual dealer advertisers, and (iii) used car listing services. Under the dealer subscription services, the Company makes available throughout the subscription period a webpage linked to its websites and mobile applications where the dealers can publish information such as the pricing of their products, locations and addresses and other related information. Usually, advanced payment is made for the dealer subscription services and revenue is recognized over time on a straight-line basis as services are constantly provided over the subscription period. For the advertising services sold to individual dealers, revenue is recognized when the advertising is published over the stated display period. The used car listing services primarily include listing and display of used vehicles, generation of sales leads, etc, through the Company’s platform. The used car platform acts as a user interface that allows potential used car buyers to identify listings that meet their specific requirements and contact the seller. The service fee is charged per the number of displayed days, or quantity of sales leads delivered. Revenue is recognized respectively at a point in time upon the display of vehicles or the delivery of sales leads.
Online marketplace and others
Online marketplace and others revenue primarily consist of revenues related to (i) data products, (ii) new and used vehicle transaction platform, and (iii) auto financing services and others.
For the data products, the Company provides data-driven products and solutions for the automakers and dealers, and recognizes revenue over the service period of data-driven products and solutions by the automakers and dealers.
For the new and used vehicle transaction business, the Company provides platform-based services including facilitation of transactions, transaction-oriented marketing solutions, and generation of sales leads. For the new vehicle transaction, the Company acts as the platform for users to review automotive-related information and inquiry, and facilitates of transaction by delivering sales leads to the automakers. For the used vehicle transaction, the Company acts as a used car consumer-to-business-to-consumer transaction system that facilitates the used car transaction between the sellers and buyers and charge the service fee per each sale. The new and used vehicle transaction revenue is recognized at a point in time when the sales leads are delivered or upon the successful facilitation of transaction.
For the auto-financing business, the Company provides a platform which serves as a bridge to match users and automobile sellers that have auto financing needs with the Company’s cooperative financial institutions that offer a variety of products covering merchant loans, consumer loans, leases and insurance services. The auto-financing service fee is charged on a per sale or lead basis, and the service fee is recognized at a point in time when the sales leads are delivered or upon the successful facilitation of transaction. The company is not involved in providing the loans and has no further obligation once the revenue for the lead has been recognized.
F-20
Contract Balances and Accounts Receivable
Payment terms and conditions vary by contract and service types. However, generally speaking, excluding dealer subscription and used car listing, the rest of service contracts usually require payment within several months of service delivery. The term between billings and when payment is due is not significant and the Company generally does not provide significant financing terms. Timing of revenue recognition may differ from the timing of invoicing to customers. Accounts receivable represent amounts invoiced and revenue recognized prior to invoicing, when the Company has satisfied its performance obligations and has the unconditional right to payment. Non-refundable payments in advance of revenue recognition are recorded as deferred revenue and recognized as revenue along with the fulfillment of performance obligations. Deferred revenue is primarily related to the advanced payment related to dealer subscription services and used car listings under leads generation services. The beginning balance of deferred revenue of RMB
Accounts receivable are carried at net realizable value. Prior to the adoption of ASC 326, an allowance for doubtful accounts is recorded in the period when a loss is probable based on an assessment of specific evidence indicating troubled collection, historical experience, accounts aging and other factors. On January 1, 2020, the Company adopted Accounting Standards Update No. 2016-13, Financial Instruments — Credit Losses (Topic 326): Measurement of Credit Losses on Financial Instruments (“ASC 326”) using the modified retrospective transition method. ASC 326 replaces the existing incurred loss impairment model with a forward-looking current expected credit loss (“CECL”) methodology. The Company estimated the allowance by segmenting accounts receivable into groups based on certain credit risk characteristics and estimated the allowance for credit losses on receivables not sharing similar risk characteristic on an individual basis. The key factors considered when determining the allowances for credit losses include the historical loss experience, lifetime for debt recovery, financial performance of the customers, current and future economic conditions. An accounts receivable balance is written off after all collection effort has ceased.
Practical Expedients and Exemptions
The Company has elected to use the practical expedient to not disclose the remaining performance obligations for contracts that have durations of one year or less. Performance obligations to be recognized over a period in excess of one year are immaterial as of December 31, 2021 and 2022.
The revenue standard requires the Company to recognize an asset for the incremental costs of obtaining a contract with a customer if the benefit of those costs is expected to be longer than one year. The Company has determined that sales commission for sales personnel meet the requirements of capitalization. However, the Company applies a practical expedient to expense these costs as incurred for costs to
Cost of revenues primarily consist of (i) operational costs, (ii) content costs, (iii) bandwidth and Internet Data Center (“IDC”) fees , (iv) tax surcharges and (v) depreciation & amortization expenses and others. Operational costs primarily include the transaction fees incurred on our platform, execution costs of service contracts, salaries and benefits, and share-based compensation expenses of related employees. Content costs are costs directly related to purchasing and producing the professionally-generated content displayed on our websites and mobile applications.
Advertising expenditures which amounted to RMB
Product development expenses consist primarily of employee costs related to personnel involved in the development and enhancement of the Company’s service offerings on its websites and mobile applications, and expenditure for research and development activities. The Company recognizes these costs as expenses when incurred, unless they qualify for capitalization as software development costs. Capitalized software development costs have not been material for the periods presented.
F-21
In February 2016, the Financial Accounting Standards Board (“FASB”) issued Accounting Standards Update No. 2016-02, Leases (“ASU 2016-02”). Further, as a clarification of the new guidance, the FASB issued several amendments and updates. The Company adopted the new lease guidance beginning January 1, 2019 by applying the modified retrospective method to those contracts that are not completed as of January 1, 2019, with the comparative information not being adjusted and continues to be reported under historic accounting standards. There is no impact to retained earnings at adoption.
The Company has elected to utilize the package of practical expedients at the time of adoption, which allows the Company to (1) not reassess whether any expired or existing contracts are or contain leases, (2) not reassess the lease classification of any expired or existing leases, and (3) not reassess initial direct costs for any existing leases. The Company also has elected to utilize the short-term lease recognition exemption and, for those leases that qualified, the Company did not recognize operating lease right-of-use (“ROU”) assets or operating lease liabilities.
The Company determines if an arrangement is a lease and determines the classification of the lease, as either operating or finance, at commencement. The Company has operating leases for office buildings and data centers and has no finance leases as of December 31, 2021 and 2022. Operating lease ROU assets and operating lease liabilities are recognized based on the present value of the lease payments over the lease term at commencement date.
As the Company’s leases do not provide an implicit rate, an incremental borrowing rate is used based on the information available at commencement date, to determine the present value of lease payments. The incremental borrowing rates approximate the rate the Company would pay to borrow in the currency of the lease payments for the weighted-average life of the lease.
The operating lease ROU assets also include any lease payments made prior to lease commencement and exclude lease incentives and initial direct costs incurred if any. Lease terms may include options to extend or terminate the lease when it is reasonably certain that the Company will exercise that option. Lease expense for minimum lease payments is recognized on a straight-line basis over the lease term.
The Company’s lease agreements contain both lease and non-lease components, which are accounted for separately based on their relative standalone price.
As of December 31, 2021 and 2022, the Company recognized the following items related to operating lease in its consolidated balance sheets.
|
|
As of December 31, |
|
|||||||||
|
|
2021 |
|
|
2022 |
|
||||||
|
|
RMB |
|
|
RMB |
|
|
US$ |
|
|||
|
|
(in thousands) |
|
|||||||||
|
|
|
|
|
|
|
|
|
||||
|
|
|
|
|
|
|
|
|
||||
Operating lease liabilities, non-current portion |
|
|
|
|
|
|
|
|
|
|||
Lease cost recognized in the Company’s consolidated statements of comprehensive income is summarized as follows:
|
|
|
Year ended December 31, |
|
|||||||||||||
|
|
|
2020 |
|
|
2021 |
|
|
2022 |
|
|||||||
|
Classification |
|
RMB |
|
|
RMB |
|
|
RMB |
|
|
US$ |
|
||||
|
|
|
(in thousands) |
|
|||||||||||||
Operating lease cost |
|
|
|
|
|
|
|
|
|
|
|
|
|
||||
|
Cost of revenues |
|
|
|
|
|
|
|
|
|
|
|
|
||||
|
Operating expenses |
|
|
|
|
|
|
|
|
|
|
|
|
||||
Cost of other leases with terms less than one year |
|
|
|
|
|
|
|
|
|
|
|
|
|
||||
|
Cost of revenues |
|
|
|
|
|
|
|
|
|
|
|
|
||||
|
Operating expenses |
|
|
|
|
|
|
|
|
|
|
|
|
||||
F-22
Maturities of operating lease liabilities as of December 31, 2022 are as follows:
|
|
Amounts |
|
|||||
|
|
RMB |
|
|
US$ |
|
||
|
|
(in thousands) |
|
|||||
2023 |
|
|
|
|
|
|
||
2024 |
|
|
|
|
|
|
||
2025 |
|
|
|
|
|
|
||
2026 |
|
|
|
|
|
|
||
2027 |
|
|
|
|
|
|
||
Total lease payments |
|
|
|
|
|
|
||
Less imputed interest |
|
|
( |
) |
|
|
( |
) |
Total |
|
|
|
|
|
|
||
As of December 31, 2021 and 2022, the Company’s weighted-average remaining lease term was
As of December 31, 2021 and 2022, the Company does not have any significant operating or finance leases that have not yet commenced. The Company’s lease agreements do not contain any material residual value guarantees or material restrictive covenants.
The Company leased office space and data centers from its related party, Ping An Company for a total amount of RMB
The Company accounts for income taxes using the asset and liability method. Under this method, deferred tax assets and liabilities are determined based on the difference between the financial reporting and tax bases of assets and liabilities using enacted tax rates that will be in effect in the period in which the differences are expected to reverse. The Company records a valuation allowance against deferred tax assets if, based on the weight of available evidence, it is more-likely-than-not that some portion, or all, of the deferred tax assets will not be realized. The effect on deferred taxes of a change in tax rates is recognized in income in the period that includes the enactment date. For reconciliation of tax computed by applying the respective statutory income tax rate to pre-tax income, please see “ TAXATION” under Note 6 to our audited consolidated financial statements.
The Company applies ASC 740, Accounting for Income Taxes, to account for uncertainty in income taxes. ASC 740 prescribes a recognition threshold a tax position is required to meet before being recognized in the financial statements. The Company has elected to classify interest and penalties related to unrecognized tax benefits, if and when required, as part of “income tax expense”, in the consolidated statements of comprehensive income.
Earnings per share are calculated in accordance with ASC 260-10, Earnings per Share: Overall. Basic earnings per share are computed by dividing net income attributable to holders of ordinary shares by the weighted average number of ordinary shares outstanding during the year.
Diluted earnings per ordinary share reflects the potential dilution that could occur if securities to issue ordinary shares were exercised. The dilutive effect of outstanding share-based awards is reflected in the diluted earnings per share by application of the treasury stock method.
Comprehensive income is defined to include all changes in shareholders’ equity except those resulting from investments by owners and distributions to owners. Among other disclosures, ASC 220-10, Comprehensive Income: Overall requires that all items that are required to be recognized under current accounting standards as components of comprehensive income be reported in a financial statement that is displayed with the same prominence as other financial statements. For each of the periods presented, the Company’s comprehensive
F-23
income includes foreign currency translation adjustments and is presented in the consolidated statements of comprehensive income. There have been no reclassifications out of accumulated other comprehensive income to net income for the years presented.
Noncontrolling interests are recognized to reflect the portion of the equity of majority-owned subsidiary which is not attributable, directly or indirectly, to the controlling shareholder. Noncontrolling interests are classified as a separate line item in the equity section of the Company’s consolidated balance sheets and have been separately disclosed in the Company’s consolidated statements of comprehensive income to distinguish the interests from that of the Company.
In accordance with ASC 280-10, Segment Reporting: Overall, the Company’s chief operating decision maker has been identified as the Chief Executive Officer who reviews the consolidated results of operations when making decisions about allocating resources and assessing performance of the Company as a whole; hence, the Company has only
The full-time employees of the Company’s PRC subsidiaries and VIEs are entitled to staff welfare benefits including medical care, housing fund, pension benefits and unemployment insurance, which are governmental mandated defined contribution plans. These entities are required to accrue for these benefits based on certain percentages of the employees’ respective salaries, subject to certain ceilings, in accordance with the relevant PRC regulations, and make cash contributions to the state-sponsored plans out of the amounts accrued. The total expenses for the employee benefits plans were RMB
Share-based awards granted to employees are accounted for under ASC 718, Compensation—Stock Compensation, which requires that share-based awards granted to employees be measured based on the grant date fair value and recognized as compensation expense over the requisite service period (which is generally the vesting period) in the consolidated statements of comprehensive income. The Company has elected to recognize compensation expense using the straight-line method for all share-based awards granted with service conditions that have a graded vesting schedule. For awards with performance condition and multiple service dates, if the performance conditions are all set at inception and independent for each year, each tranche is accounted for as a separate award with its own requisite service period. Compensation cost is recognized over the respective requisite service period separately for each separately-vesting tranche as though each tranche of the award is, in substance, a separate award.
Under ASC 718, an entity can make an accounting policy election to either estimate the number of awards that are expected to vest or account for forfeitures when they occur. The Company has elected to estimate the forfeiture rate at the time of grant and revise, if necessary, in subsequent periods if actual forfeitures differ from initial estimates. The Company recognizes compensation cost for awards with performance conditions if and when the Company concludes that it is probable that the performance condition will be achieved. The Company reassesses the probability of vesting at each reporting period for awards with performance conditions and adjusts compensation cost based on its probability assessment.
Forfeiture rates are estimated based on historical and future expectations of employee turnover rates and are adjusted to reflect future changes in circumstances and facts, if any. Share-based compensation expense is recorded net of estimated forfeitures such that expense is recorded only for those share-based awards that are expected to vest. To the extent the Company revises these estimates in the future, the share-based payments could be materially impacted in the period of revision, as well as in following periods. The Company, with the assistance of an independent third-party valuation firm, determined the fair value of the stock options granted to employees. The binomial option pricing model was applied in determining the estimated fair value of the options granted to employees. Subsequent to the IPO, fair value of the ADS in the US market or ordinary shares in the HK market is the price of the Company’s publicly traded shares.
The Company accounts for a change in any of the terms or conditions of share-based awards as a modification in accordance with ASC subtopic 718-20, Compensation-Stock Compensation: Awards Classified as Equity, whereby the incremental fair value, if any, of a modified award, is recorded as compensation cost on the date of modification for vested awards or over the remaining vesting period
F-24
for unvested awards. The incremental compensation cost is the excess of the fair value of the modified award on the date of modification over the fair value of the original award immediately before the modification.
Value Added Tax (“VAT”) refunds are presented as a component of other operating income, net. For Beijing Prbrownies Software Co., Ltd. (“Beijing Prbrownies”) and Tianjin Autohome Software Co., Ltd. (“Tianjin Autohome”, formerly known as Tianjin Autohome Data Information Technology Co., Ltd.)., they are subject to
Other operating income, net also includes government grants, which primarily represent subsidies and tax refunds for operating a business in certain jurisdictions and fulfilment of specified tax payment obligations. These grants are not subject to any specific requirements and are recorded when received. For the years ended December 31, 2020, 2021 and 2022, RMB
From time to time, the Company is subject to legal proceedings and claims in the ordinary course of business. Liabilities for such contingencies are recorded when it is probable that a liability has been incurred and the amount of the liability can be reasonably estimated.
The Company accounts for its business combinations using the acquisition method of accounting in accordance with ASC 805, Business Combinations. The cost of an acquisition is measured as the aggregate of the acquisition date fair values of the assets transferred and liabilities incurred by the Company to the sellers and equity instruments issued. Transaction costs directly attributable to the acquisition are expensed as incurred. Identifiable assets and liabilities acquired or assumed are measured separately at their fair values as of the acquisition date, irrespective of the extent of any noncontrolling interests. The excess of (i) the total costs of acquisition, fair value of the noncontrolling interests and acquisition date fair value of any previously held equity interest in the acquiree over (ii) the fair value of the identifiable net assets of the acquiree is recorded as goodwill. If the cost of acquisition is less than the fair value of the net assets of the subsidiary acquired, the difference is recognized directly in the consolidated statements of comprehensive income. During the measurement period, which can be up to one year from the acquisition date, the Company may record adjustments to the assets acquired and liabilities assumed with the corresponding offset to goodwill. Upon the conclusion of the measurement period or final determination of the values of assets acquired or liabilities assumed, whichever comes first, any subsequent adjustments are recorded to the consolidated statements of comprehensive loss.
In a business combination achieved in stages, the Company re-measures the previously held equity interest in the acquiree when obtaining control at its acquisition date fair value and the re-measurement gain or loss, if any, is recognized in the consolidated statements of comprehensive income.
For the Company’s majority-owned subsidiaries and consolidated VIEs, a noncontrolling interest is recognized to reflect the portion of their equity which is not attributable, directly or indirectly, to the Company. When the noncontrolling interest is contingently redeemable upon the occurrence of a conditional event, which is not solely within the control of the Company, the noncontrolling interests are classified as mezzanine equity. Consolidated net income on the consolidated statements of comprehensive income includes the net income/loss attributable to noncontrolling interests and mezzanine equity holders when applicable.
The Company’s acquired subsidiary had issued preferred shares to the Company and other shareholders (Note 20), which could be converted into ordinary shares or redeemed by such shareholders upon the occurrence of certain events that are not solely within the control of the entity. Therefore, these preferred shares were accounted for as convertible redeemable noncontrolling interests in the consolidated balance sheets.
F-25
The Company accounts for the changes in accretion to the redemption value in accordance with ASC Topic 480, Distinguishing Liabilities from Equity. The Company accounts for the changes of redemption value over the period from the date of issuance to the earliest redemption date of the noncontrolling interest. According to different share purchase agreements, the accounting measurement varies among different rounds of issued preferred shares, which including (i) a percentage of the issue price, or (ii) the fair value of the underlying convertible redeemable noncontrolling interests or a percentage of the issue price, whichever is higher, and (iii) the fair value of the underlying convertible redeemable noncontrolling interests or the compound annual interests accrued on such convertible redeemable noncontrolling interests, whichever is higher.
For the determination of fair value, option pricing model was used. The major unobservable input used in the option pricing model included equity value of underlying business, which was determined by management using valuation techniques under the combination of income approach and market approach. The significant assumptions used in valuation included revenue growth rate, operating margin, discount rate and selection of valuation multiples.
In June 2022, the FASB issued ASU No. 2022-03, Fair Value Measurement (Topic 820): Fair Value Measurement of Equity Securities Subject to Contractual Sale Restrictions, which clarifies that a contractual restriction on the sale of an equity security is not considered part of the unit of account of the equity security and, therefore, is not considered in measuring fair value. The amendments also clarify that an entity cannot, as a separate unit of account, recognize and measure a contractual sale restriction. This guidance also requires certain disclosures for equity securities subject to contractual sale restrictions. The new guidance is required to be applied prospectively with any adjustments from the adoption of the amendments recognized in earnings and disclosed on the date of adoption. This guidance is effective for the Company for fiscal years beginning after December 15, 2023, and interim periods within those fiscal years. Early adoption is permitted. The Company does not expect that the adoption of this guidance will have a material impact on its financial position, results of operations and cash flows.
Credit risk
Financial instruments that potentially subject the Company to significant concentrations of credit risk consist primarily of cash and cash equivalents, restricted cash, short-term investments and accounts receivable. As of December 31, 2021, and 2022, cash and cash equivalents, restricted cash and short-term investments altogether amounting to RMB
Accounts receivable are typically unsecured and derived from revenue earned from customers, which are exposed to credit risk. The risk is mitigated by the Company’s assessment of its customers’ creditworthiness and its ongoing monitoring process of outstanding balances. The Company maintains reserves for allowance of doubtful accounts and these allowances have generally been within expectations. There was one customer and nil that individually represented greater than 10% of the total accounts receivable as of December 31, 2021 and 2022.
Business, customer, political, social and economic risks
The Company participates in a dynamic high technology industry and believes that changes in any of the following areas could have a material adverse effect on the Company’s future financial position, results of operations or cash flows; changes in the overall demand for services and products; changes in business offerings; epidemic outbreak that may cause disruption to business operation of the Company, its customers and suppliers; competitive pressures due to new entrants; acceptance of the Internet as an effective marketing platform by China’s automotive industry; changes in certain strategic relationships or customer relationships; growth in China’s
F-26
automotive industry, regulatory considerations; and risks associated with the Company’s ability to attract and retain employees necessary to support its growth.
There was
Currency convertibility risk
The Company transacts majority of its business in RMB, which is not freely convertible into foreign currencies. According to the relevant regulations in mainland China, all foreign exchange transactions are required to take place either through the People’s Bank of China (“PBOC”) or other banks authorized to buy and sell foreign currencies at the exchange rates quoted by the PBOC. Approval of foreign currency payments by the PBOC or other institutions requires submitting a payment application form together with suppliers’ invoices, shipping documents and signed contracts.
Most of the cash and cash equivalents and short-term investments held by PRC subsidiaries and the VIEs are denominated in RMB, while a portion of cash and cash equivalents and short-term investments held by PRC subsidiaries and the VIEs are denominated in US$. Cash distributed outside of mainland China by PRC subsidiaries and the VIEs are subject to PRC dividend withholding tax.
Foreign Currency exchange rate risk
Since July 21, 2005, the RMB was permitted to fluctuate within a narrow and managed band against a basket of certain foreign currencies. There was appreciation of
Assets measured at fair value on a recurring basis
|
|
Fair Value Measurement at |
|
|
|
|
|
|
|
|||||||||||
|
|
Quoted Prices |
|
|
Significant |
|
|
Unobservable |
|
|
Fair Value at |
|
||||||||
|
|
RMB |
|
|
RMB |
|
|
RMB |
|
|
RMB |
|
|
US$ |
|
|||||
|
|
(in thousands) |
|
|||||||||||||||||
Cash equivalents |
|
|
|
|
|
|
|
|
|
|
|
|
|
|
|
|||||
Time deposits |
|
|
— |
|
|
|
|
|
|
— |
|
|
|
|
|
|
|
|||
Short-term investments |
|
|
|
|
|
|
|
|
|
|
|
|
|
|
|
|||||
Term deposits |
|
|
— |
|
|
|
|
|
|
— |
|
|
|
|
|
|
|
|||
Adjustable-rate financial products |
|
|
— |
|
|
|
|
|
|
— |
|
|
|
|
|
|
|
|||
Equity investments with readily |
|
|
|
|
|
|
|
|
— |
|
|
|
|
|
|
|
||||
|
|
|
|
|
|
|
|
|
— |
|
|
|
|
|
|
|
||||
F-27
|
|
Fair Value Measurement at |
|
|
|
|
||||||||||
|
|
Quoted Prices |
|
|
Significant |
|
|
Unobservable |
|
|
Fair Value at |
|
||||
|
|
RMB |
|
|
RMB |
|
|
RMB |
|
|
RMB |
|
||||
|
|
(in thousands) |
|
|||||||||||||
Cash equivalents |
|
|
|
|
|
|
|
|
|
|
|
|
||||
Time deposits |
|
|
— |
|
|
|
|
|
|
— |
|
|
|
|
||
Short-term investments |
|
|
|
|
|
|
|
|
|
|
|
|
||||
Term deposits |
|
|
— |
|
|
|
|
|
|
— |
|
|
|
|
||
Adjustable-rate financial products |
|
|
— |
|
|
|
|
|
|
— |
|
|
|
|
||
Equity investments with readily |
|
|
|
|
|
|
|
|
— |
|
|
|
|
|||
|
|
|
|
|
|
|
|
|
— |
|
|
|
|
|||
Other financial instruments
The followings are other financial instruments not measured at fair value in the consolidated balance sheets, but for which the fair value is estimated for disclosure purposes.
Financial assets, including accounts receivable, amounts due from related parties, prepaid expenses and other current assets excluding prepayments and staff advances, and other non-current assets excluding operating lease right-of-use assets, are not measured at fair value in the consolidated balance sheets, and the carrying values approximated fair value due to their short-term maturity. Financial liabilities, including accrued expense and other payables, and amounts due to related parties, are also not measured at fair value in the consolidated balance sheets, and the carrying values approximated fair value due to their short-term maturity.
Assets and liabilities measured at fair value on a non-recurring basis
The Company measures certain assets, including long-term investments, goodwill and intangible assets, at fair value on a non-recurring basis when they are deemed to be impaired (Level 3). The fair values of these assets are determined based on valuation techniques using the best information available, and may include management judgments, future performance projections, etc. An impairment charge to these investments is recorded when the cost of the investment exceeds its fair value and this condition is determined to be other-than-temporary.
Accounts receivable and allowance for credit losses consist of the following:
|
|
As of December 31, |
|
|||||||||
|
|
2021 |
|
|
2022 |
|
||||||
|
|
RMB |
|
|
RMB |
|
|
US$ |
|
|||
|
|
(in thousands) |
|
|||||||||
Accounts receivable |
|
|
|
|
|
|
|
|
|
|||
Allowance for credit losses |
|
|
( |
) |
|
|
( |
) |
|
|
( |
) |
Total |
|
|
|
|
|
|
|
|
|
|||
F-28
The movements in the allowance for credit losses were as follows:
|
|
|
|
|
Year ended December 31, |
|
||||||||||
|
|
2020 |
|
|
2021 |
|
|
2022 |
|
|||||||
|
|
RMB |
|
|
RMB |
|
|
RMB |
|
|
US$ |
|
||||
|
|
(in thousands) |
|
|||||||||||||
Beginning balance |
|
|
|
|
|
|
|
|
|
|
|
|
||||
Additions charged to current expected credit loss |
|
|
|
|
|
|
|
|
|
|
|
|
||||
Reversal |
|
|
( |
) |
|
|
|
|
|
( |
) |
|
|
( |
) |
|
Write off |
|
|
( |
) |
|
|
( |
) |
|
|
( |
) |
|
|
( |
) |
Ending balance |
|
|
|
|
|
|
|
|
|
|
|
|
||||
Prepaid expenses and other current assets consist of the following:
|
|
As of December 31, |
|
|||||||||
|
|
2021 |
|
|
2022 |
|
||||||
|
|
RMB |
|
|
RMB |
|
|
US$ |
|
|||
|
|
(in thousands) |
|
|||||||||
Prepayments |
|
|
|
|
|
|
|
|
|
|||
Rental and other deposits |
|
|
|
|
|
|
|
|
|
|||
Receivables from third-party payment platform |
|
|
|
|
|
|
|
|
|
|||
Interest receivable |
|
|
|
|
|
|
|
|
|
|||
Staff advances |
|
|
|
|
|
|
|
|
|
|||
Other receivables |
|
|
|
|
|
|
|
|
|
|||
|
|
|
|
|
|
|
|
|
|
|||
Prepayments primarily include prepaid VAT and surcharges, prepaid promotional expenses and service fee.
Enterprise income tax
Cayman Islands
Autohome Inc. and certain of its subsidiaries are incorporated in the Cayman Islands and conduct substantially all of its business through its PRC subsidiaries and VIEs. Under the current laws of the Cayman Islands, Autohome Inc. and its subsidiaries are not subject to tax on income or capital gains. In addition, upon payments of dividends by these entities to their shareholders, no Cayman Islands withholding tax will be imposed.
British Virgin Islands
Cheerbright and Auto Pai Ltd. were incorporated in the British Virgin Islands and conducts substantially all of its business through its PRC subsidiaries and VIEs. Under the current laws of the British Virgin Islands, they are not subject to tax on income or capital gains. In addition, upon payments of dividends by these entities to their shareholders, no British Virgin Islands withholding tax will be imposed.
Hong Kong
Autohome (Hong Kong) Limited, Autohome Media, Autohome Link Hong Kong Limited, and TTP Car (HK) Limited were incorporated in Hong Kong. Subsidiaries in Hong Kong are subject to a two-tiered profits tax regime . The profits tax rate for the first HK$
F-29
Mainland China
Autohome WFOE, Chezhiying WFOE, Beijing Autohome Technologies Co., Ltd.(“Beijing Autohome Technologies”), Beijing Prbrownies, Hainan Chezhiyitong Information Technology Co., Ltd. (“Hainan Chezhiyitong”) and Tianjin Autohome are recognized as “High-New Technology Enterprise”(“HNTE”) and are eligible for a
Chezhiying WFOE, Hainan Chezhiyitong and Tianjin Autohome are recognized as software enterprise (“SE”) and are exempt from income tax for the tax year of 2019 and 2020 and enjoyed a 50% reduction in the statutory income tax rate of 25% for the tax year of 2021. Above three entities can continue to enjoy the
Beijing Prbrownies, and Tianjin Autohome were accredited as key software enterprise (“KSE”) under the relevant PRC laws and regulations as well in the tax filing of 2021, which tax rate will continue to apply for so long as it maintains its key software enterprise status during each relevant tax year. Beijing Prbrownies enjoyed a more preferential enterprise tax rate of
Except for the above-mentioned entities, the Company’s remaining PRC subsidiaries and all the VIEs were subject to enterprise income tax at a rate of
The management subsequently assessed and concluded that uncertain preferential tax rates for certain subsidiaries were able to be realized in the year of 2022 and a reversal of RMB
The basic earnings per share effects related to the preferential tax rate were RMB
The New EIT Law also provides that enterprises established under the laws of foreign countries or regions and whose “place of effective management” is located within the PRC are considered PRC tax resident enterprises and subject to PRC income tax at the rate of 25% on worldwide income. The definition of “place of effective management” refers to an establishment that exercises, in substance, overall management and control over the production and business, personnel, accounting, properties, and other aspects of an enterprise. If the Company is deemed as a PRC tax resident, it would be subject to PRC tax under the New EIT Law. The Company has analyzed the applicability of this law and believes that the chance of being recognized as a tax resident enterprise is remote for PRC tax purposes.
The Company's subsidiaries incorporated in other jurisdictions were subject to income tax charges calculated according to the tax laws enacted or substantially enacted in the countries where they operate and generate income.
The Company had minimal operations in jurisdictions other than the PRC. Income/(loss) before income tax expense consists of:
|
|
Year ended December 31, |
|
|||||||||||||
|
|
2020 |
|
|
2021 |
|
|
2022 |
|
|||||||
|
|
RMB |
|
|
RMB |
|
|
RMB |
|
|
US$ |
|
||||
|
|
(in thousands) |
|
|||||||||||||
Mainland China |
|
|
|
|
|
|
|
|
|
|
|
|||||
Non-Mainland China |
|
|
( |
) |
|
|
( |
) |
|
|
|
|
|
|||
|
|
|
|
|
|
|
|
|
|
|
|
|
||||
F-30
The income tax expense/(benefit) is comprised of:
|
|
Year ended December 31, |
|
|||||||||||||
|
|
2020 |
|
|
2021 |
|
|
2022 |
|
|||||||
|
|
RMB |
|
|
RMB |
|
|
RMB |
|
|
US$ |
|
||||
|
|
(in thousands) |
|
|||||||||||||
Current |
|
|
|
|
|
|
|
|
|
|
|
|
||||
Deferred |
|
|
( |
) |
|
|
( |
) |
|
|
( |
) |
|
|
( |
) |
|
|
|
|
|
|
|
|
|
( |
) |
|
|
( |
) |
||
The reconciliation of income tax expense/(benefit) for the years ended December 31, 2020, 2021 and 2022 is as follows:
|
|
Year ended December 31, |
|
|||||||||||||
|
|
2020 |
|
|
2021 |
|
|
2022 |
|
|||||||
|
|
RMB |
|
|
RMB |
|
|
RMB |
|
|
US$ |
|
||||
|
|
(in thousands) |
|
|||||||||||||
Income before income tax expense |
|
|
|
|
|
|
|
|
|
|
|
|
||||
Income tax expense computed at Mainland China statutory tax rates ( |
|
|
|
|
|
|
|
|
|
|
|
|
||||
Non-deductible expenses |
|
|
|
|
|
|
|
|
|
|
|
|
||||
Research and development expenses super-deduction |
|
|
( |
) |
|
|
( |
) |
|
|
( |
) |
|
|
( |
) |
Change in valuation allowances |
|
|
( |
) |
|
|
|
|
|
|
|
|
|
|||
Outside basis difference |
|
|
|
|
|
( |
) |
|
|
( |
) |
|
|
( |
) |
|
Effect of international tax rate difference |
|
|
|
|
|
|
|
|
( |
) |
|
|
( |
) |
||
Effect of preferential tax rate |
|
|
( |
) |
|
|
( |
) |
|
|
( |
) |
|
|
( |
) |
Effect of withholding tax on dividend |
|
|
|
|
|
|
|
|
( |
) |
|
|
( |
) |
||
Other adjustments (Note) |
|
|
( |
) |
|
|
( |
) |
|
|
( |
) |
|
|
( |
) |
Income tax expense/(benefit) |
|
|
|
|
|
|
|
|
( |
) |
|
|
( |
) |
||
F-31
Note:
Deferred tax
The significant components of deferred taxes are as follows:
|
|
As of December 31, |
|
|||||||||
|
|
2021 |
|
|
2022 |
|
||||||
|
|
RMB |
|
|
RMB |
|
|
US$ |
|
|||
|
|
(in thousands) |
|
|||||||||
Deferred tax assets |
|
|
|
|
|
|
|
|
|
|||
Allowance for doubtful accounts |
|
|
|
|
|
|
|
|
|
|||
Accrued staff cost and expenses |
|
|
|
|
|
|
|
|
|
|||
Deferred revenue |
|
|
|
|
|
|
|
|
|
|||
Tax losses |
|
|
|
|
|
|
|
|
|
|||
VAT refund |
|
|
|
|
|
|
|
|
|
|||
Less: Valuation allowances |
|
|
( |
) |
|
|
( |
) |
|
|
( |
) |
Total deferred tax assets |
|
|
|
|
|
|
|
|
|
|||
|
|
|
|
|
|
|
|
|
|
|||
Deferred tax liabilities |
|
|
|
|
|
|
|
|
|
|||
Identifiable intangible assets arising from acquisition |
|
|
|
|
|
|
|
|
|
|||
Intangible assets and internally-developed software |
|
|
|
|
|
|
|
|
|
|||
Outside basis difference and others |
|
|
|
|
|
|
|
|
|
|||
Withholding income tax |
|
|
|
|
|
|
|
|
|
|||
Total deferred tax liabilities |
|
|
|
|
|
|
|
|
|
|||
In assessing the realizability of deferred tax assets, the Company has considered whether it is more-likely-than-not that some portion or all of the deferred tax assets will not be realized. The ultimate realization of deferred tax assets is dependent upon the generation of future taxable income during the periods in which those temporary differences become deductible. The Company records a valuation allowance to reduce deferred tax assets to a net amount that management believes is more-likely-than-not of being realizable based on the weight of all available evidence. The Company recorded valuation allowances against the deferred tax assets of the PRC subsidiaries and VIEs as of December 31, 2021 and 2022, respectively, due to the cumulative tax loss positions and insufficient forecasted future taxable income.
As of December 31, 2022, the Company had net operating losses of approximately RMB
Valuation allowance is provided against deferred tax assets when the Company determines that it is more-likely-than-not that the deferred tax assets will not be utilized in the future.
|
|
Year ended December 31, |
|
|||||||||||||
|
|
2020 |
|
|
2021 |
|
|
2022 |
|
|||||||
|
|
RMB |
|
|
RMB |
|
|
RMB |
|
|
US$ |
|
||||
|
|
(in thousands) |
|
|||||||||||||
Valuation allowance |
|
|
|
|
|
|
|
|
|
|
|
|
||||
Balance at beginning of the year |
|
|
( |
) |
|
|
( |
) |
|
|
( |
) |
|
|
( |
) |
Additions |
|
|
( |
) |
|
|
( |
) |
|
|
( |
) |
|
|
( |
) |
Reversal |
|
|
|
|
|
|
|
|
|
|
|
|
||||
Balance at ending of the year |
|
|
( |
) |
|
|
( |
) |
|
|
( |
) |
|
|
( |
) |
F-32
Deferred tax liabilities arising from undistributed earnings
The Enterprise Income Tax Law also imposes a withholding income tax of
On November 4, 2019, the Company's Board of Directors approved an annual cash dividend policy. Under the policy, starting from 2020, the Company will declare and distribute a recurring cash dividend at an amount equivalent to approximately
As of December 31, 2021 and 2022, the total amount of undistributed earnings from the Company’s PRC subsidiaries and VIEs that are considered to be permanently reinvested was RMB
Property and equipment consist of the following:
|
|
As of December 31, |
|
|||||||||
|
|
2021 |
|
|
2022 |
|
||||||
|
|
RMB |
|
|
RMB |
|
|
US$ |
|
|||
|
|
(in thousands) |
|
|||||||||
At cost: |
|
|
|
|
|
|
|
|
|
|||
Electronic equipment |
|
|
|
|
|
|
|
|
|
|||
Office equipment |
|
|
|
|
|
|
|
|
|
|||
Motor vehicles |
|
|
|
|
|
|
|
|
|
|||
Software |
|
|
|
|
|
|
|
|
|
|||
Leasehold improvements |
|
|
|
|
|
|
|
|
|
|||
|
|
|
|
|
|
|
|
|
|
|||
Less: Accumulated depreciation |
|
|
( |
) |
|
|
( |
) |
|
|
( |
) |
|
|
|
|
|
|
|
|
|
|
|||
Depreciation expense was RMB
F-33
The following tables present the Company’s intangible assets with definite lives as of the respective balance sheet dates:
|
|
December 31, 2022 |
|
|||||||||||||
|
|
Gross Carrying Value |
|
|
Accumulated |
|
|
Net Carrying |
|
|||||||
|
|
RMB |
|
|
RMB |
|
|
RMB |
|
|
US$ |
|
||||
|
|
(in thousands) |
|
|||||||||||||
Technologies |
|
|
|
|
|
( |
) |
|
|
|
|
|
|
|||
Trademarks |
|
|
|
|
|
( |
) |
|
|
|
|
|
|
|||
Customer relationship |
|
|
|
|
|
( |
) |
|
|
|
|
|
|
|||
Websites |
|
|
|
|
|
( |
) |
|
|
|
|
|
|
|||
Domain names |
|
|
|
|
|
( |
) |
|
|
|
|
|
|
|||
Database |
|
|
|
|
|
( |
) |
|
|
|
|
|
|
|||
Licensing agreements |
|
|
|
|
|
( |
) |
|
|
|
|
|
|
|||
Insurance brokerage license |
|
|
|
|
|
( |
) |
|
|
|
|
|
|
|||
|
|
|
|
|
|
( |
) |
|
|
|
|
|
|
|||
|
|
December 31, 2021 |
|
|||||||||
|
|
Gross Carrying Value |
|
|
Accumulated |
|
|
Net Carrying |
|
|||
|
|
RMB |
|
|
RMB |
|
|
RMB |
|
|||
|
|
(in thousands) |
|
|||||||||
Technologies |
|
|
|
|
|
( |
) |
|
|
|
||
Trademarks |
|
|
|
|
|
( |
) |
|
|
|
||
Customer relationship |
|
|
|
|
|
( |
) |
|
|
|
||
Websites |
|
|
|
|
|
( |
) |
|
|
|
||
Domain names |
|
|
|
|
|
( |
) |
|
|
|
||
Database |
|
|
|
|
|
( |
) |
|
|
|
||
Licensing agreements |
|
|
|
|
|
( |
) |
|
|
|
||
Insurance brokerage license |
|
|
|
|
|
( |
) |
|
|
|
||
|
|
|
|
|
|
( |
) |
|
|
|
||
The Company obtained insurance brokerage license in 2017 through acquisition of Shanghai Tianhe Insurance Brokerage Co., Ltd., which was accounted for as asset acquisition. The Company acquired TTP on December 31, 2020 and identified the intangible assets of technologies, trademarks, customer relationship and database (Note 19). The intangible assets are amortized using the straight-line method, which is the Company’s best estimate of how these assets will be economically consumed over their respective estimated useful lives ranging from approximately
The annual estimated amortization expenses for the acquired intangible assets for each of the next five years are as follows:
|
|
2023 |
|
|
2024 |
|
|
2025 |
|
|
2026 |
|
|
2027 |
|
|||||
|
|
RMB |
|
|
RMB |
|
|
RMB |
|
|
RMB |
|
|
RMB |
|
|||||
|
|
(in thousands) |
|
|||||||||||||||||
Amortization expenses |
|
|
|
|
|
|
|
|
|
|
|
|
|
|
|
|||||
As of December 31, 2021 and 2022, the Company holds several equity investments through its subsidiaries or VIEs, all of which were accounted for under the equity method since the Company can exercise significant influence but does not own a majority equity interest in or control them.
F-34
Guangzhou Ping An Consumer Equity Investment Partnership (L.P.)
In January, 2022, the Company entered into a limited partner interest subscription agreement, a limited partnership agreement and certain other auxiliary documents with Ping An Capital Co., Ltd. (the “Fund Manager”), pursuant to which the Company agrees to subscribe for RMB
Hunan Mango Autohome Automobile Sales Co., Ltd. (“Mango JV”)
In May 2015, the Company entered into a shareholder agreement with HappiGo Home Shopping Co. (“HappiGo”) to establish a strategic joint venture, Mango JV, with total capital contribution of RMB
Visionstar Information Technology (Shanghai) Co., Ltd. (“Shanghai Visionstar”)
In July 2017, the Company acquired a
Other investments
The Company also holds several other investments in equity investees.
The carrying amount of all of the equity method investments was RMB
The impairment associated with the equity method investments was immaterial during any of the years presented.
Other non-current assets consist of the following:
|
|
As of December 31, |
|
|||||||||
|
|
2021 |
|
|
2022 |
|
||||||
|
|
RMB |
|
|
RMB |
|
|
US$ |
|
|||
|
|
(in thousands) |
|
|||||||||
Operating lease right-of-use assets |
|
|
|
|
|
|
|
|
|
|||
Others |
|
|
|
|
|
|
|
|
|
|||
|
|
|
|
|
|
|
|
|
|
|||
F-35
The components of accrued expenses and other payables are as follows:
|
|
As of December 31, |
|
|||||||||
|
|
2021 |
|
|
2022 |
|
||||||
|
|
RMB |
|
|
RMB |
|
|
US$ |
|
|||
|
|
(in thousands) |
|
|||||||||
Accrued expenses |
|
|
|
|
|
|
|
|
|
|||
Accrued rebates |
|
|
|
|
|
|
|
|
|
|||
Payroll and welfare payable |
|
|
|
|
|
|
|
|
|
|||
Operating lease liabilities - current portion |
|
|
|
|
|
|
|
|
|
|||
VAT and surcharges payable |
|
|
|
|
|
|
|
|
|
|||
Deposit from customers |
|
|
|
|
|
|
|
|
|
|||
Professional service fees |
|
|
|
|
|
|
|
|
|
|||
Payable for purchase of fixed assets |
|
|
|
|
|
|
|
|
|
|||
Payable for exercise of share-based awards |
|
|
|
|
|
|
|
|
|
|||
Others |
|
|
|
|
|
|
|
|
|
|||
|
|
|
|
|
|
|
|
|
|
|||
Yun Chen became the Company’s controlling shareholder in June 2016 and Yun Chen is a subsidiary of Ping An. Therefore Ping An Group became the Company’s related party since then.
During the years ended December 31, 2020, 2021 and 2022, related party transactions were as follows:
|
|
Year ended December 31, |
|
|||||||||||||
|
|
2020 |
|
|
2021 |
|
|
2022 |
|
|||||||
|
|
RMB |
|
|
RMB |
|
|
RMB |
|
|
US$ |
|
||||
|
|
(in thousands) |
|
|||||||||||||
Services provided to Ping An Group (a) |
|
|
|
|
|
|
|
|
|
|
|
|
||||
Services provided to other related parties |
|
|
— |
|
|
|
— |
|
|
|
— |
|
|
|
— |
|
Net revenues from related parties |
|
|
|
|
|
|
|
|
|
|
|
|
||||
|
|
|
|
|
|
|
|
|
|
|
|
|
||||
Services provided by and assets purchased from |
|
|
|
|
|
|
|
|
|
|
|
|
||||
Services provided by and assets purchased from |
|
|
|
|
|
|
|
|
|
|
|
|
||||
Services provided by related parties |
|
|
|
|
|
|
|
|
|
|
|
|
||||
|
|
|
|
|
|
|
|
|
|
|
|
|
||||
Interest income from Ping An Group |
|
|
|
|
|
|
|
|
|
|
|
|
||||
F-36
As of December 31, 2021 and 2022, balances with related parties were as follows:
|
|
As of December 31, |
|
|||||||||
|
|
2021 |
|
|
2022 |
|
||||||
|
|
RMB |
|
|
RMB |
|
|
US$ |
|
|||
|
|
(in thousands) |
|
|||||||||
Amounts due from related parties, current |
|
|
|
|
|
|
|
|
|
|||
Ping An Group (c) |
|
|
|
|
|
|
|
|
|
|||
|
|
|
|
|
|
|
|
|
|
|||
Amounts due from related parties, non-current |
|
|
|
|
|
|
|
|
|
|||
Ping An Group (c) |
|
|
|
|
|
|
|
|
|
|||
|
|
|
|
|
|
|
|
|
|
|||
Amounts included in “Cash and cash equivalents” (d) |
|
|
|
|
|
|
|
|
|
|||
Amounts included in “Short-term investments” (d) |
|
|
|
|
|
|
|
|
|
|||
Amounts included in “Restricted cash” (d) |
|
|
|
|
|
|
|
|
|
|||
|
|
|
|
|
|
|
|
|
|
|||
Amounts due to related parties |
|
|
|
|
|
|
|
|
|
|||
Ping An Group (e) |
|
|
|
|
|
|
|
|
|
|||
Other related parties |
|
|
|
|
|
|
|
|
|
|||
|
|
|
|
|
|
|
|
|
|
|||
Legal proceedings
From time to time, the Company is subject to legal proceedings and claims in the ordinary course of business. The Company does not believe that any currently pending legal proceeding to which the Company is a party will have a material effect on its business, balance sheets, or results of operations or cash flows.
|
|
Year ended December 31, |
|
|||||||||||||
|
|
2020 |
|
|
2021 |
|
|
2022 |
|
|||||||
|
|
RMB |
|
|
RMB |
|
|
RMB |
|
|
US$ |
|
||||
|
|
(in thousands) |
|
|||||||||||||
|
|
|
|
|
|
|
|
|
|
|
|
|
||||
Operational costs |
|
|
|
|
|
|
|
|
|
|
|
|
||||
Content costs |
|
|
|
|
|
|
|
|
|
|
|
|
||||
Bandwidth and IDC costs |
|
|
|
|
|
|
|
|
|
|
|
|
||||
Tax surcharges |
|
|
|
|
|
|
|
|
|
|
|
|
||||
Depreciation & amortization expenses and others |
|
|
|
|
|
|
|
|
|
|
|
|
||||
|
|
|
|
|
|
|
|
|
|
|
|
|
||||
F-37
As of December 31, 2022, Autohome Inc. had
On November 18, 2021, the Company announced a share repurchase program under which the Company may repurchase up to US$
The Company repurchased
The Company’s ability to pay dividends is primarily dependent on the Company receiving distributions of funds from its subsidiaries. Relevant PRC statutory laws and regulations permit payments of dividends by the Company’s PRC subsidiaries only out of its retained earnings, if any, as determined in accordance with PRC accounting standards and regulations. The results of operations reflected in the consolidated financial statements prepared in accordance with U.S. GAAP differ from those reflected in the statutory financial statements of the Company’s PRC subsidiaries.
Under PRC law, the Company’s PRC subsidiaries are required to provide for certain statutory reserves, namely a general reserve, an enterprise expansion fund and a staff welfare and bonus fund. The subsidiary is required to allocate at least
Appropriations to the enterprise expansion fund and staff welfare and bonus fund are at the discretion of the Board of Directors of the subsidiary. The Company’s VIEs in mainland China are also subject to similar statutory reserve requirements. These reserves can only be used for specific purposes and are not transferable to the Company in the form of loans, advances or cash dividends. As of December 31, 2020, 2021 and 2022, the Company’s PRC subsidiaries and VIEs had appropriated RMB
As a result of these PRC laws and regulations subject to the limit discussed above that require annual appropriations of 10% of after-tax income to be set aside, prior to payment of dividends as general reserve fund, the Company’s PRC subsidiaries and VIEs are restricted in their ability to transfer a portion of their net assets to the Company. As of December 31, 2021 and 2022, the amounts of net assets restricted including the paid-up capital, additional paid-in capital and the statutory reserve funds of the Company’s PRC subsidiaries and the net assets of the VIEs in which the Company has no legal ownership, were RMB
Furthermore, cash transfers from the Company’s PRC subsidiaries to their parent companies outside of China are subject to PRC government control of currency conversion. Shortages in availability of foreign currency may temporarily restrict the ability of the PRC subsidiaries and VIEs to remit sufficient foreign currency to pay dividends or other payments to the Company, or otherwise satisfy their foreign currency denominated obligations.
F-38
Basic and diluted earnings per share for each of the years presented are calculated as follows:
|
|
Year ended December 31, |
|
|||||||||||||
|
|
2020 |
|
|
2021 |
|
|
2022 |
|
|||||||
|
|
RMB |
|
|
RMB |
|
|
RMB |
|
|
US$ |
|
||||
|
|
(in thousands) |
|
|||||||||||||
Basic earnings per share: |
|
|
|
|
|
|
|
|
|
|
|
|
||||
Numerator: |
|
|
|
|
|
|
|
|
|
|
|
|
||||
Net income attributable to ordinary shareholders |
|
|
|
|
|
|
|
|
|
|
|
|
||||
Denominator: |
|
|
|
|
|
|
|
|
|
|
|
|
||||
Weighted average ordinary shares outstanding |
|
|
|
|
|
|
|
|
|
|
|
|
||||
Basic earnings per share |
|
|
|
|
|
|
|
|
|
|
|
|
||||
Diluted earnings per share: |
|
|
|
|
|
|
|
|
|
|
|
|
||||
Numerator: |
|
|
|
|
|
|
|
|
|
|
|
|
||||
Net income attributable to ordinary shareholders |
|
|
|
|
|
|
|
|
|
|
|
|
||||
Denominator: |
|
|
|
|
|
|
|
|
|
|
|
|
||||
Weighted average ordinary shares outstanding |
|
|
|
|
|
|
|
|
|
|
|
|
||||
Dilutive effect of share-based awards |
|
|
|
|
|
|
|
|
|
|
|
|
||||
Weighted average number of shares outstanding-diluted |
|
|
|
|
|
|
|
|
|
|
|
|
||||
Diluted earnings per share |
|
|
|
|
|
|
|
|
|
|
|
|
||||
|
|
|
|
|
|
|
|
|
|
|
|
|
||||
Earnings per ADS |
|
|
|
|
|
|
|
|
|
|
|
|
||||
Net income per ADS – basic (RMB) |
|
|
|
|
|
|
|
|
|
|
|
|
||||
Net income per ADS – diluted (RMB) |
|
|
|
|
|
|
|
|
|
|
|
|
||||
The effects of
In order to provide additional incentives to employees and to promote the success of the Company’s business, the Company adopted a share incentive plan in 2011 (the “2011 Plan”), a share incentive plan in 2013 (the “2013 Plan”), Amended and Restated 2016 Share Incentive Plan (the “2016 Plan”) and 2016 Share Incentive Plan II (the “2016 Plan II”) in 2016, collectively the “Plans”. The Company may grant share-based awards to its employees, directors and consultants to purchase an aggregate of no more than
Following the Share Subdivision and the ADS Ratio Change that became effective on February 5, 2021 as detailed in Note 2(a), each ordinary share was subdivided into
F-39
restricted shares, the weighted average exercise price per share option and the weighted average grant date fair value per restricted share as stated below.
Share options
The following table summarizes the Company’s employee share option activity under the share option plans:
|
|
Number of |
|
|
Weighted average exercise price |
|
|
Weighted average grant date fair value |
|
|
Weighted average remaining contractual term |
|
|
Aggregate |
|
|||||
Outstanding, January 1, 2022 |
|
|
|
|
|
|
|
|
|
|
|
|
|
|
|
|||||
Granted |
|
|
|
|
|
|
|
|
|
|
|
|
|
|
|
|||||
Exercised |
|
|
( |
) |
|
|
|
|
|
|
|
|
|
|
|
|
||||
Forfeited/Cancelled |
|
|
( |
) |
|
|
|
|
|
|
|
|
|
|
|
|
||||
Outstanding, December 31, 2022 |
|
|
|
|
|
|
|
|
|
|
|
|
|
|
|
|||||
Vested and expected to vest at December 31, 2022 |
|
|
|
|
|
|
|
|
|
|
|
|
|
|
|
|||||
Exercisable as of December 31, 2022 |
|
|
|
|
|
|
|
|
|
|
|
|
|
|
|
|||||
The aggregate intrinsic value in the table above is calculated as the difference between the exercise price of the underlying awards and US$
The aggregate fair value of the outstanding options at the grant dates were determined to be RMB
Restricted shares
Restricted shares activity for the year ended December 31, 2022 was as follows:
|
|
Number of |
|
|
Weighted |
|
||
Outstanding, January 1, 2022 |
|
|
|
|
|
|
||
Granted |
|
|
|
|
|
|
||
Vested |
|
|
( |
) |
|
|
|
|
Forfeited/Cancelled |
|
|
( |
) |
|
|
|
|
Outstanding, December 31, 2022 |
|
|
|
|
|
|
||
Expected to vest, December 31, 2022 |
|
|
|
|
|
|
||
The weighted average grant-date fair value of restricted shares granted during the years ended December 31, 2020, 2021 and 2022 was US$
F-40
to unvested restricted shares which are expected to be recognized over a weighted-average period of
The binomial option pricing model was applied in determining the estimated fair value of the options granted to employees. The model requires the input of highly subjective assumptions including the estimated expected stock price volatility and the exercise multiple for which employees are likely to exercise share options. For expected volatilities, the Company has referred to the historical price volatilities of the Company. The exercise multiple is estimated as the ratio of fair value of underlying shares over the exercise price as at the time the option is exercised and is based on a consideration of research study regarding exercise pattern based on historical statistical data. The risk-free rate for periods within the contractual life of the option is based on the U.S. Treasury Bills yield curve in effect at the time of grant. The Company’s management is ultimately responsible for the determination of the estimated fair value of its options. Subsequent to the IPO, fair value of the ordinary shares was the price of the Company’s publicly traded shares.
The Company calculated the estimated fair value of the share-based awards on the respective grant dates using the binomial option pricing model with the following assumptions:
|
|
2020 |
|
2021 |
|
2022 |
|
|
Fair value of ordinary share |
|
US$ |
|
US$ |
|
US$ |
|
|
Risk-free interest rates |
|
|
|
|
||||
Expected exercise multiple |
|
|
|
|
||||
Expected volatility |
|
|
|
|
||||
Expected dividend yield |
|
|
|
|
% |
|||
Weighted average fair value per option granted |
|
US$ |
|
US$ |
|
US$ |
|
|
Share-based compensation expenses relating to options and restricted shares granted to employees recognized for the years ended December 31, 2020, 2021 and 2022 is as follows:
|
|
Year ended December 31, |
|
|||||||||||||
|
|
2020 |
|
|
2021 |
|
|
2022 |
|
|||||||
|
|
RMB |
|
|
RMB |
|
|
RMB |
|
|
US$ |
|
||||
|
|
(in thousands) |
|
|||||||||||||
Cost of revenues |
|
|
|
|
|
|
|
|
|
|
|
|
||||
Sales and marketing expenses |
|
|
|
|
|
|
|
|
|
|
|
|
||||
General and administrative expenses |
|
|
|
|
|
|
|
|
|
|
|
|
||||
Product development expenses |
|
|
|
|
|
|
|
|
|
|
|
|
||||
|
|
|
|
|
|
|
|
|
|
|
|
|
||||
In October 2020, the Company entered into a definitive agreement with TTP, an auction platform for used cars in China. Pursuant to the agreement, the Company committed to make an investment in TTP through subscription of preferred shares of TTP for an aggregate purchase price of US$
The first closing transaction was completed on December 31, 2020, which gave the Company
The acquisition was accounted for as a business combination. The financial position and results of operation of TTP and its subsidiaries were included in the Company’s consolidated financial statements on December 31, 2020. Since the acquisition was effective on the
F-41
last day of the fiscal year, the impact was immaterial to the results of operations for the year ended December 31, 2020. Total purchase price for the acquisition comprised of:
|
|
Amount |
|
|
|
|
RMB |
|
|
|
|
(in thousands) |
|
|
Total Cash consideration |
|
|
|
|
Less: consideration for New Warrant |
|
|
( |
) |
Less: settlement of pre-existing relationship (Revised - Note 1) |
|
|
( |
) |
Purchase consideration |
|
|
|
|
The Company made estimates and judgments in determining the fair value of the assets acquired and liabilities assumed with the assistance from an independent valuation firm. The purchase price allocation as the date of the acquisition is as follows:
|
|
Amount |
|
|
Amortization |
|
|
|
RMB |
|
|
|
|
|
|
(in thousands) |
|
|
|
|
Intangible assets |
|
|
|
|
|
|
- Technologies |
|
|
|
|
||
- Trademarks |
|
|
|
|
||
- Customer relationship |
|
|
|
|
||
- Database |
|
|
|
|
||
Goodwill (Revised -Note 1) |
|
|
|
|
|
|
Net liabilities acquired, excluding intangible assets and the related |
|
|
( |
) |
|
|
Deferred tax liabilities |
|
|
( |
) |
|
|
Noncontrolling interests |
|
|
( |
) |
|
|
Convertible redeemable noncontrolling interests (Note 2) |
|
|
( |
) |
|
|
|
|
|
|
|
|
|
Note 1: The Company corrected the amount of goodwill, retained earnings in equity, interest and investment income, net by revising the previously issued financial statements as of December 31, 2021 and for the year ended December 31, 2020. The correction involved revising an understatement of loss from settlement of a pre-existing relationship in connection with the TTP acquisition in 2020 resulting in a RMB
|
|
For the year ended December 31, 2020 |
|
|
As of December 31, 2021 |
|
||||||||||||||||||
|
|
As Previously Reported |
|
|
Correction |
|
|
As Revised |
|
|
As Previously Reported |
|
|
Correction |
|
|
As Revised |
|
||||||
|
|
RMB |
|
|
RMB |
|
|
RMB |
|
|
RMB |
|
|
RMB |
|
|
RMB |
|
||||||
|
|
(in thousands) |
|
|||||||||||||||||||||
-Interest and investment income, net |
|
|
|
|
|
( |
) |
|
|
|
|
|
|
|
|
|
|
|
|
|||||
-Income before income taxes |
|
|
|
|
|
( |
) |
|
|
|
|
|
|
|
|
|
|
|
|
|||||
-Net income |
|
|
|
|
|
( |
) |
|
|
|
|
|
|
|
|
|
|
|
|
|||||
-Goodwill |
|
|
|
|
|
|
|
|
|
|
|
|
|
|
( |
) |
|
|
|
|||||
-Retained earnings |
|
|
|
|
|
|
|
|
|
|
|
|
|
|
( |
) |
|
|
|
|||||
Note 2: TTP had previously issued preferred shares in several series to certain shareholders, which could be redeemed by such shareholders upon the occurrence of certain events. The outcome of these events is not solely within the control of TTP and, therefore, these preferred shares have been accounted for as convertible redeemable noncontrolling interests.
F-42
The excess of purchase price over net tangible assets and identifiable intangible assets acquired was recorded as goodwill. Goodwill primarily represents the expected synergies from combining the TTP’s resources and experiences in the used car auction industry with the Company’s current business. The goodwill is not expected to be deductible for tax purposes.
|
|
As of December 31, |
|
|||||||||
|
|
2021 |
|
|
2022 |
|
|
2022 |
|
|||
|
|
RMB |
|
|
RMB |
|
|
US$ |
|
|||
|
|
(in thousands) |
|
|||||||||
|
|
|
|
|
|
|
|
|
|
|||
Balance as of January 1 |
|
|
|
|
|
|
|
|
|
|||
Accretion of mezzanine equity |
|
|
|
|
|
|
|
|
|
|||
Balance as of December 31 |
|
|
|
|
|
|
|
|
|
|||
Pursuant to the agreement that was entered into between the Company and TTP (Note 19), after the second closing and conversion of CB, the Company held
As of December 31, 2021 and 2022, TTP had issued
The automotive industry in China was negatively impacted by the COVID-19 pandemic, during which automobile production and the number of purchasers declined due to precautionary government-imposed closures of certain travel and business, the government’s order to delay resumption of service and mass production and the related quarantine measures. The containment efforts led by the government also caused delay in the near-term marketing demand of the Company’s automaker and dealer customers. While substantially all of the restrictions on movement within China had been relaxed in the beginning of 2023, there is great uncertainty as to the future development of the COVID-19 outbreak and its impact on the automotive industry. However, the Company will pay close attention to the development of the COVID-19 pandemic and continue to evaluate the nature and extent of the impact to the Company’s financial condition.
Dividends
On
F-43