UNITED STATES SECURITIES AND EXCHANGE COMMISSION
Washington, D.C. 20549
FORM 10-K
(Mark One)
| Annual report pursuant to Section 13 or 15(d) of the Securities Exchange Act of 1934 | |||||
For the fiscal year ended December 31 , 2023
OR
| Transition report pursuant to Section 13 or 15(d) of the Securities Exchange Act of 1934 | |||||
For the transition period from to
Commission file number 1-12001
(Exact name of registrant as specified in its charter)
| (State or other jurisdiction of incorporation or organization) | (I.R.S. Employer Identification Number) | ||||||||||
| (Address of principal executive offices) | (Zip Code) | ||||||||||
Registrant’s telephone number, including area code: (800 ) 289-7454
Securities registered pursuant to Section 12(b) of the Act:
| Title of each class | Trading Symbol | Name of each exchange on which registered | ||||||
Securities registered pursuant to Section 12(g) of the Act: None
Indicate by check mark whether the Registrant is well known seasoned issuer, as defined in Rule 405 of the Securities Act. Yes ☒ No ☐
Indicate by check mark if the Registrant is not required to file reports pursuant to Section 13 or Section 15(d) of the Act. Yes ☐ No ☒
Indicate by check mark whether the Registrant (1) has filed all reports required to be filed by Section 13 or 15(d) of the Securities Exchange Act of 1934 during the preceding 12 months, and (2) has been subject to such filing requirements for the past 90 days. Yes ☒ No ☐
Indicate by check mark whether the Registrant has submitted electronically every Interactive Data File required to be submitted pursuant to Rule 405 of Regulation S-T (§ 232.405 of this chapter) during the preceding 12 months (or for such shorter period that the registrant was required to submit such files). Yes ☒ No ☐
Indicate by check mark whether the registrant is a large accelerated filer, an accelerated filer, a non-accelerated filer, a smaller reporting company or an emerging growth company. See definitions of “large accelerated filer,” “accelerated filer,” “smaller reporting company” and “emerging growth company” in Rule 12b-2 of the Exchange Act. (Check one):
| ☒ | Accelerated filer | ☐ | ||||||||||||||||||
| Non-accelerated filer | ☐ (Do not check if a smaller reporting company) | Smaller reporting company | ||||||||||||||||||
| Emerging growth company | ||||||||||||||||||||
If an emerging growth company, indicate by check mark if the registrant has elected not to use the extended transition period for complying with any new or revised financial accounting standards provided pursuant to Section 13(a) of the Exchange Act. ☐
Indicate by check mark whether the registrant has filed a report on and attestation to its management’s assessment of the effectiveness of its internal control over financial reporting under Section 404(b) of the Sarbanes-Oxley Act (15 U.S.C. 7262(b)) by the registered public accounting firm that prepared or issued its audit report. ☒
If securities are registered pursuant to Section 12(b) of the Act, indicate by check mark whether the financial statements of the registrant included in the filing reflect the correction of an error to previously issued financial statement. ☐
Indicate by check mark whether any of those error corrections are restatements that required a recovery analysis of incentive-based compensation received by any of the registrant's executive officers during the relevant recovery period pursuant to §240.10D-1(b). ☐
Indicate by check mark whether the Registrant is a shell company (as defined in Rule 12b-2 of the Exchange Act). Yes ☐ No ☒
On February 2, 2024, the Registrant had outstanding 127,781,255 shares of its Common Stock.
The aggregate market value of the Registrant’s voting stock held by non-affiliates at July 2, 2023 was approximately $5.7 billion, based on the closing price per share of Common Stock on June 30, 2023 of $44.23 as reported on the New York Stock Exchange. Shares of Common Stock known by the Registrant to be beneficially owned by directors and officers of the Registrant subject to the reporting and other requirements of Section 16 of the Securities Exchange Act of 1934, as amended (the “Exchange Act”), are not included in the computation. The Registrant, however, has made no determination that such persons are “affiliates” within the meaning of Rule 12b-2 under the Exchange Act.
Documents Incorporated By Reference
Selected portions of the Proxy Statement for the Annual Meeting of Stockholders to be held on May 16, 2024 are incorporated by reference into Part III of this Report.
1
INDEX
| Page Number | |||||
2
PART I
Item 1. Business
The Company
ATI Inc. is a Delaware corporation with its corporate headquarters located at 2021 McKinney Avenue, Suite 1100, Dallas, TX 75201, telephone number (800) 289-7454, Internet website address www.atimaterials.com. Our Internet website and content contained therein or connected thereto are not intended to incorporate into this Annual Report on Form 10-K. References to “ATI,” the “Company,” “the Registrant,” “we,” “our” and “us” and similar terms mean ATI Inc. and its subsidiaries, unless the context otherwise requires.
When used in this Annual Report on Form 10-K, unless the context otherwise requires or unless otherwise specified, any reference to “year” is to the Company’s fiscal year. The Company follows a 4-4-5 or 5-4-4 fiscal calendar, whereby each fiscal quarter consists of thirteen weeks grouped into two four-week months and one five-week month, and its fiscal year ends on the Sunday closest to December 31. Fiscal years 2023, 2022 and 2021 ended on December 31, 2023, January 1, 2023 and January 2, 2022, respectively. All fiscal years presented include 52 weeks of operations. The dates for prior fiscal years have been revised to more precisely reflect the exact day of the year end periods for these fiscal years given our 4-4-5 or 5-4-4 calendar.
Our Business
ATI produces specialty materials, highly differentiated by our materials science expertise and advanced process technologies. Our mission is to solve the world’s challenges through materials science. Our core markets of aerospace & defense represent nearly 60% of total sales, led by products for jet engines. Additionally, we have a strong presence in the energy markets, including specialty energy, oil & gas and downstream processing, as well as the medical and electronics markets. In aggregate, these markets represent almost 85% of our revenue.
We operate in two business segments: High Performance Materials & Components (HPMC) and Advanced Alloys & Solutions (AA&S). The HPMC segment’s primary focus is on maximizing aero-engine materials and components growth, with approximately 85% of its revenue derived from the aerospace & defense markets, including nearly 60% of its revenue from products for commercial jet engines. Commercial aerospace products have been the main source of sales and EBITDA growth for HPMC over the last several years, and are expected to continue to drive HPMC and overall ATI results in the future. Other major HPMC end markets include medical and energy. HPMC produces a wide range of high performance materials, components, and advanced metallic powder alloys. These are made from nickel-based alloys and superalloys, titanium and titanium-based alloys, and a variety of other specialty materials. Capabilities range from cast/wrought and powder alloy development to final production of highly engineered finished components, and 3D-printed aerospace products.
The AA&S segment is focused on delivering high-value flat products primarily to the energy, aerospace, and defense end-markets, which comprise over 60% of its revenue. Other important end markets for AA&S include electronics, medical and automotive. AA&S produces nickel-based alloys, titanium and titanium-based alloys, and specialty alloys in a variety of forms including plate, sheet, and strip products.
Strategic end-use markets for our products include:
Aerospace & Defense. We are a world leader in the production of specialty materials and components for both commercial and military jet engines and airframes supporting customer needs for initial build requirements and for spare parts. Through alloy development, internal growth efforts, and long-term supply agreements on current and next-generation jet engines and airframes, we are well-positioned with a fully qualified asset base to meet the expected multi-year demand growth from the commercial aerospace market.
Typical aerospace applications for nickel-based alloys and superalloys and advanced metallic powders include jet engine disks, blades, vanes, rings, casings and shafts. Nickel-based alloys and superalloys remain extremely strong at high temperatures and resist degradation under extreme conditions. The next-generation jet engines use advanced nickel-based superalloys and metallic powder alloys to enable increased fuel efficiency requirements that require hotter-burning engines. Our specialty materials are also used in the manufacture of aircraft landing gear and structural components.
We are a global industry leader in iso-thermal and hot-die forging technologies for advanced aerospace components. We produce highly sophisticated components that have differing mechanical properties across a single product unit and are highly-resistant to fatigue and temperature effects. Our precision forgings are used for jet engine components, structural components for aircraft, helicopters, space propulsion, and other demanding applications. ATI provides a full range of post-production inspection and machining with the certified quality needed to meet demanding application requirements.
3
Products and components made from titanium and titanium-based alloys, such as jet engine components including disks, blades and vanes, and airframe components such as structural members, landing gears, and hydraulic systems, are critical in aerospace applications. These materials and components possess an extraordinary combination of properties that help to increase jet engine fuel efficiency and product longevity, including superior strength-to-weight ratios, elevated temperature resistance, low coefficient of thermal expansion, and extreme corrosion resistance. Availability of titanium supply continues to be a critical issue across the aerospace & defense supply chain. As such, in fiscal year 2023, we restarted a significant amount of titanium melt capacity in Albany, Oregon with a modest investment and are continuing to invest in additional capacity at this facility, bringing online a fourth furnace in the first half of fiscal year 2024. In addition, we are further investing in additional titanium melt capacity to meet this growing demand with our expansion in Richland, Washington, and we are on track for the first melt in the fourth quarter of fiscal year 2024 at this facility. When our Richland, Washington expansion is at full production in late fiscal year 2025, our total titanium melt capacity is expected to be 80% greater than our fiscal year 2022 titanium melt capacity.
Our specialty materials and components for defense applications include naval nuclear products, military jet engines, fixed wing and rotorcraft products, and armor applications. We expect to increase our sales in government defense applications in future years.
We continuously seek to develop and manufacture innovative new alloys to better serve the needs of the aerospace & defense markets, and several of the alloys we produce have won significant share in the current and next-generation jet engines. ATI’s metallic powder technology delivers alloy compositions and refined microstructures that offer increased performance and longer useful lives in high-temperature aerospace environments, as well as improved efficiency of jet engines. We continue to increase our production capacity for advanced metallic powders for use in next-generation aerospace products, including additive manufacturing applications. In fiscal year 2023, ATI announced that we are establishing a dedicated additive manufacturing and post-processing facility outside Fort Lauderdale, Florida which will allow ATI to tap into significant aerospace and defense demand for additively manufactured laser power bed fusion parts, serving both commercial and defense customers.
Energy. We also serve energy markets, including specialty energy, oil & gas and downstream processing markets.
Our specialty materials are widely used in the global electrical power generation and distribution industries. We believe clean energy needs, expanding environmental policies and the electrification of developing countries will continue to drive demand for our specialty materials and products for use in these industries over the long term.
For electrical power generation, our specialty materials, including corrosion-resistant alloys (CRAs), are used in nuclear, natural gas and other fuel source applications. Our CRAs are used for pipe, tube, and heat exchanger applications in water systems and in pollution control scrubbers. For nuclear power plants, we are an industry pioneer in producing nuclear reactor fuel cladding and structural components utilizing zirconium and hafnium alloys. We are a technology leader for large diameter components used in natural gas land-based turbines for power generation. Our alloys are also used for alternative energy generation, in solar, fuel cell and geothermal applications.
Both of our business segments produce specialty materials that are critical to the oil & gas industry. The environments in which oil & gas can be found in commercial quantities have become more challenging, involving deep offshore wells, high pressure and high temperature conditions in sour wells and unconventional sources. These challenging offshore environments are located further off the continental shelf, including locations in arctic and tropical waters where drilling is more difficult than previously-sourced locations. Our specialty materials, including nickel-based alloys, duplex alloys and other specialty alloys, have the strength and corrosion-resistant properties necessary to meet these challenging operating conditions. We enable our customers’ success in these applications by developing and producing specialty materials for equipment that can operate for up to 30 years in these harsh environments.
Medical. ATI’s advanced specialty materials are used in medical device products that enhance the quality of lives around the world.
Manufacturers of magnetic resonance imaging (MRI) devices rely on our niobium superconducting wire to help produce electromagnetic fields that allow physicians to safely scan the body’s soft tissue. We have a joint technology development agreement with Bruker Energy & Supercon Technologies to advance state-of-the-art niobium-based superconductors, including those used in MRI magnets for the medical industry, and preclinical MRI magnets used in the life-science tools industry.
Our specialty alloys also are used for replacement knees, hips and other prosthetic devices. The use of our alloys in these replacement devices offers the potential for longer product lifespans versus previous implant generations.
Our biocompatible nickel-titanium (nitinol) shape memory alloy is used for stents to support collapsed or clogged blood vessels. Reduced in diameter for insertion, these stents expand post-implant to the original tube-like shape due to the metal’s superelasticity. In addition, our ultra fine diameter (0.002 inch/0.051 mm) titanium wire is used for screens to prevent blood clots from entering critical areas of the body. We have recently announced our strategic partnership with Confluent Medical
4
Technologies (Confluent) whereby Confluent will provide a $50 million investment in our capacity expansion to produce nitinol. As a result of this expansion, we expect to more than triple our production of this life saving alloy by fiscal year 2027.
Electronics. ATI’s materials perform a variety of important roles in the growing consumer electronics market. Nickel alloys and Precision Rolled Strip® (PRS) from Specialty Rolled Products (SRP) and our Asian PRS joint venture support computers and smart phones. The magnetic properties of nickel alloys are used in relay cores, magnets and magnetic shielding, while their thermal expansion is useful in glass-to-metal sealing applications such as monitors. PRS is selected for electronics and communications applications based on corrosion resistance, strength, wear resistance, electrical resistivity or thermal expansion.
In addition, metal precursors – which use chemicals produced by ATI, such as hafnium – have a variety of important applications in consumer and industrial electronics.
Business Segments
Our two business segments accounted for the following percentages of total revenues of $4.17 billion, $3.84 billion, and $2.80 billion for the fiscal years ended December 31, 2023, January 1, 2023, and January 2, 2022, respectively.
| Fiscal Year Ended | ||||||||||||||||||||
| December 31, 2023 | January 1, 2023 | January 2, 2022 | ||||||||||||||||||
| High Performance Materials & Components | 51 | % | 43 | % | 41 | % | ||||||||||||||
| Advanced Alloys & Solutions | 49 | % | 57 | % | 59 | % | ||||||||||||||
Information with respect to our business segments is presented below and in Note 18 of the notes to the consolidated financial statements.
High Performance Materials & Components Segment
Our HPMC segment produces a wide range of high performance specialty materials, parts and components for several major end markets, including the aerospace & defense, medical, and energy markets, with 85% of fiscal year 2023 revenues derived from the aerospace & defense markets. Demand for our products is driven primarily by the commercial aerospace cycle. Large aircraft and jet engines are manufactured by a small number of companies, such as The Boeing Company, Airbus S.A.S. (an Airbus Group company) including the former operations of Bombardier Aerospace, and Embraer (Empresa Brasileira de Aeronáutica S.A.) for airframes. GE Aerospace (a division of General Electric Company), Rolls-Royce plc, Pratt & Whitney (a division of Raytheon Technologies Corporation), Snecma (SAFRAN Group), and various joint ventures manufacture jet engines. These companies, and their suppliers, form a substantial part of our customer base in this business segment. We have long-term agreements (LTAs) in place with most major aerospace market OEMs. The loss of one or more of our customers in the aerospace or defense markets could have a material adverse effect on ATI’s results of operations and financial condition (see Item 1A. Risk Factors).
Within this segment, our products are manufactured from a wide range of advanced materials including metallic powder alloys, made from nickel-based alloys and superalloys, titanium and titanium-based alloys, and a variety of other specialty materials. These materials are made into a variety of product forms that include precision forgings, machined parts and others. We are integrated across these alloy systems in melt, forging, finishing, testing and machining processes. Most of the products in this segment are sold directly to end-use customers, and a substantial portion of our HPMC segment products are sold under multi-year agreements.
Principal competitors in the HPMC segment include: Berkshire Hathaway Inc., for nickel-based alloys and superalloys and specialty steel alloys, titanium and titanium-based alloys, and precision forgings through its ownership of Precision Castparts Corporation and subsidiaries; Howmet Aerospace Inc., for titanium and titanium-based alloys; Carpenter Technology Corporation for legacy nickel-based alloys and superalloys and specialty steel alloys; VSMPO-AVISMA for titanium and titanium-based alloys; and Aubert & Duval for precision forgings.
Advanced Alloys & Solutions Segment
Our AA&S segment produces nickel-based alloys, titanium and titanium-based alloys, and specialty alloys in a variety of forms including plate, sheet, and PRS products. The major end markets for our flat rolled products are energy, aerospace & defense, automotive, and electronics markets. The operations in this segment include our SRP business, our Specialty Alloys & Components business and the Shanghai STAL Precision Stainless Steel Company Limited (STAL) PRS joint venture in China, in which we hold a 60% interest. Segment results also include our 50% interest in the Uniti industrial titanium joint venture and our 50% interest in the A&T Stainless joint venture. On March 9, 2022, we announced the termination of Uniti, and this joint venture is expected to be fully dissolved in the first quarter of fiscal year 2024.
5
Nickel-based alloys, titanium, and stainless sheet products are used in a wide variety of industrial and consumer applications. In fiscal year 2023, approximately 25% of our stainless sheet products by volume were sold to independent service centers, which have slitting, cutting or other processing facilities, with the remainder sold directly to end-use customers.
Nickel-based alloy, titanium, and specialty alloy plate products are primarily used in aerospace & defense, and corrosion and industrial markets. In fiscal year 2023, approximately 40% of our plate products by volume were sold to independent service centers, with the remainder sold directly to end-use customers.
PRS products, which are under 0.015 inches thick, are used by customers to fabricate a variety of products primarily in the automotive and electronics markets. In fiscal year 2023, approximately 90% of these products by volume were sold directly to end-use customers or through our own distribution network, with the remainder sold to independent service centers.
Competitors for nickel-based alloys and superalloys and specialty alloys include Haynes International and VDM Metals GmbH, a subsidiary of Acerinox S.A.
Raw Materials and Supplies
Substantially all raw materials and supplies required in the manufacture of our products are available from more than one supplier, and the sources and availability of raw materials essential to our businesses are currently adequate. The principal raw materials we use in the production of our specialty materials are scrap (including iron-, nickel-, chromium-, titanium-, and molybdenum-bearing scrap), nickel, titanium sponge, zirconium sand and sponge, ferrochromium, ferrosilicon, molybdenum and molybdenum alloys, manganese and manganese alloys, cobalt, niobium, vanadium and other alloying materials. While we enter into raw materials futures contracts from time to time to hedge exposure to price fluctuations, such as for nickel, we cannot be certain that our hedge position adequately reduces exposure. We believe that we have adequate controls to monitor these contracts, but we may not be able to accurately assess exposure to price volatility in the markets for critical raw materials.
Some raw materials, such as nickel, cobalt, and ferrochromium, are available to us and our specialty materials industry competitors primarily from foreign sources. Some of these foreign sources are located in countries that may be subject to unstable political and economic conditions, which could disrupt supplies or affect the price of these materials.
We purchase our nickel requirements principally from producers in Australia, Canada, Norway, and the Dominican Republic. We purchase zirconium raw materials primarily domestically and also from producers in China. Cobalt is purchased primarily from producers in Canada. More than 80% of the world’s reserves of ferrochromium are located in South Africa, Zimbabwe, Albania, and Kazakhstan. Niobium is purchased principally from producers in Brazil, and our titanium sponge comes from sources in Japan and Kazakhstan.
Certain key supplies used in melting and other processing operations, such as graphite electrodes and industrial gases including helium and argon, are from time-to-time limited in availability and may be subject to significant price inflation. We enter into long-term supply contracts where possible to ensure an adequate supply of these products. However, overall industry shortages may impact our operations and scheduling.
Export Sales and Foreign Operations
International sales represent approximately 46% of our total annual sales, with direct export sales by our U.S.-based operations to customers in foreign countries accounting for approximately 36% of our total sales. Our overseas sales, marketing and distribution efforts are aided by our international marketing team or by independent representatives at various locations throughout the world. We believe that at least 50% of ATI’s fiscal year 2023 sales were driven by global markets when we consider exports of our customers.
Our HPMC segment has manufacturing capabilities for precision forging and machining in Poland, primarily serving the aerospace, construction & mining and transportation markets. In fiscal year 2022, the Company completed the sale of its Sheffield, UK operations, which included facilities for melting and re-melting, machining and bar mill operations, and was part of the HPMC segment. Within our AA&S segment, our joint venture in China makes PRS products, which enables us to offer these products more effectively to markets in China and other Asian countries.
Backlog, Seasonality and Cyclicality
Our backlog of confirmed orders was approximately $3.8 billion at December 31, 2023 and $2.9 billion at January 1, 2023. We expect that approximately 70% of confirmed orders on hand at December 31, 2023 will be filled during fiscal year 2024. Our HPMC segment’s backlog of confirmed orders was approximately $3.0 billion at December 31, 2023 and $2.3 billion at January 1, 2023. We expect that approximately 65% of the confirmed orders on hand at December 31, 2023 for this segment will be filled during fiscal year 2024. Our AA&S segment’s backlog of confirmed orders was approximately $0.8 billion at December 31, 2023 and $0.6 billion at January 1, 2023. We expect that approximately 80% the confirmed orders on hand at December 31, 2023 for this segment will be filled during fiscal year 2024.
6
Demand for our products is cyclical over longer periods because specialty materials customers operate in cyclical industries and are subject to changes in general economic conditions and other factors both external and internal to those industries. Historically, the HPMC segment typically has experienced modest seasonal weakness in the third quarter of each fiscal year due to many European customers, particularly in the aerospace supply chain, taking plant outages during this summer period. ATI also typically performs corresponding annual preventative maintenance outages at several facilities during this same period.
Research, Development and Technical Services
We believe that our research and development capabilities give ATI an advantage in developing new products and manufacturing processes that contribute to the long-term profitable growth potential of our businesses. We conduct research and development at our various operating locations both for our own account and, on a limited basis, for customers on a contract basis. Research and development expenditures for the fiscal years ended December 31, 2023, January 1, 2023, and January 2, 2022 included the following:
| Fiscal Year Ended | ||||||||||||||||||||
| (In millions) | December 31, 2023 | January 1, 2023 | January 2, 2022 | |||||||||||||||||
| Company-Funded: | ||||||||||||||||||||
| High Performance Materials & Components | $ | 9.6 | $ | 8.4 | $ | 9.0 | ||||||||||||||
| Advanced Alloys & Solutions | 10.2 | 7.3 | 6.6 | |||||||||||||||||
| Corporate | 0.9 | 0.6 | 0.9 | |||||||||||||||||
| 20.7 | 16.3 | 16.5 | ||||||||||||||||||
| Customer-Funded: | ||||||||||||||||||||
| High Performance Materials & Components | 1.4 | 1.4 | 3.5 | |||||||||||||||||
| Total Research and Development | $ | 22.1 | $ | 17.7 | $ | 20.0 | ||||||||||||||
Our research, development and technical service activities are closely interrelated and are directed toward development of new products, improvement of existing products, cost reduction, process improvement and control, quality assurance and control, development of new manufacturing methods, and improvement of existing manufacturing methods. The increased activity in fiscal year 2023 was largely related to materials and manufacturing methods for products supporting the aerospace & defense markets.
We own hundreds of United States patents, many of which are also filed under the patent laws of other nations. Although these patents, as well as our numerous trademarks, technical information, license agreements, and other intellectual property, have been and are expected to be of value, we believe that the loss of any single such item or technically related group of such items would not materially affect the conduct of our business.
Environmental, Health and Safety Matters
We are subject to various domestic and international environmental laws and regulations that govern the discharge of pollutants and disposal of wastes, and which may require that we investigate and remediate the effects of the release or disposal of materials at sites associated with past and present operations. We could incur substantial cleanup costs, fines, civil or criminal sanctions, third party property damage or personal injury claims as a result of violations or liabilities under these laws or non-compliance with environmental permits required at our facilities. We are currently involved in the investigation and remediation of a number of our current and former sites as well as third party sites.
We consider environmental compliance to be an integral part of our operations. We have a comprehensive environmental management and reporting program that focuses on compliance with applicable federal, state, regional and local environmental laws and regulations. Each operating company has an environmental management system that includes mechanisms for regularly evaluating environmental compliance and managing changes in business operations while assessing environmental impact.
Safety is one of our core values. We strive for a zero injury culture committed to the safety of our people, our products, and the communities in which we operate. Our fiscal year 2023 OSHA Total Recordable Incident Rate was 1.08 per 200,000 hours and our Lost Time Case Rate was 0.27 per 200,000 hours, which we believe to be competitive with world-class performance for our industry. Nearly all of our domestic employees are reporting to an ATI facility that has achieved its OSHAS 45001 certification. We expect that the balance of our operations will be OSHAS 45001 certified by fiscal year 2025.
7
Human Capital Management
We believe that our people and culture are a competitive differentiator. Attracting, developing, and retaining purpose and performance-driven leaders building teams with diverse, empowered and fulfilled employees who want to stay and grow with the company is foundational to our vision. As of December 31, 2023, we employed approximately 7,300 active employees, 15% of whom are located outside the United States across 15 countries.
Our Culture: At the center of our commitment to excellence are our values, which drive how we succeed: Accountability, Integrity, Innovation, Safety & Sustainability, and Teamwork & Respect.
We continuously strive to cultivate and support a highly engaged and productive workforce. We actively seek opportunities for listening and communication by our CEO and other senior executive leaders with our employees. Annually, we conduct a confidential company-wide engagement survey that offers our employees the ability to provide feedback and valuable insight to identify opportunities for improvement and support employee engagement and our overall human capital strategy.
Governance: Our Corporate Guidelines for Business Conduct and Ethics establishes the baseline requirements of our integrity and compliance program and promotes an environment where everyone is treated ethically and with respect. It outlines our pledge to recognize the dignity of each individual, respect each employee, provide compensation and benefits that are competitive, promote self-development through training, and value diversity of perspectives and ideas. Employees complete Business Conduct and Ethics training and, where permitted by law, must also certify each year that they will comply with the Code.
Talent Acquisition and Management: Our performance and development process is integrated in the ATI business strategy, and is a key component to recruiting, hiring, and developing top-performing talent. Our hiring practices include a goal that 80% of position candidate slates include a minimum of 30% diverse candidates. Further, we partner with top academic institutions and external professional organizations to enhance the diversity of our workforce to attract and retain top talent.
We maintain a formal talent review process to work in connection with performance management for systematic career development and succession planning at both the individual employee and organizational levels.
Learning and Development: Developing talent and leaders at all levels of the organization is critical to our long-term success. We have early career, technical, leadership and management development programs as well as broad learning opportunities for our employees to support their career growth and advance their skills. We focus on building inclusive teams through training that reinforces our values and ensure our development programs have diverse representation.
Inclusion and Diversity: Our long tradition of innovation and operational excellence demands the contributions of leaders and team members with a wide array of characteristics, backgrounds, experiences, knowledge, and skills. We believe our business success is intricately tied to cultivating a culture in which all members of our workforce are included and empowered to do their best work.
We recognize the benefits and importance of diversity amongst our board and management. Women comprise 30% of our Board, and 20% of our Directors are racially diverse. More than 40% of the members of our Executive Council are women or minorities.
Compensation and Benefits: We provide market-based competitive compensation through our salary, annual incentive and long-term incentive programs and robust benefits packages that promote the well-being of our employees across all aspects of their lives. Eligible employees are compensated for their contributions to achievement of our goals with both short-term cash incentives and long-term equity-based incentives. We believe the structure of our compensation packages provides the appropriate incentives to attract, retain, and motivate our employees.
Our well-being focus addresses physical, mental, financial, and individual needs, providing benefits and resources to help employees and their families be their best, both personally and professionally. We implemented several campaigns to promote well-being and help provide visibility to resources and available benefits. We offer Employee Assistance Programs with therapy sessions to employees and family members, comprehensive mental health benefits to those enrolled in the U.S. medical plan, virtual mental health options and navigation tools to improve access and speed of care, and preventive/mental health resilience programs.
The Compensation and Leadership Development Committee of our Board is responsible for establishing and administering the policies governing annual compensation and long-term compensation to ensure the policies are designed to align compensation with our overall business strategy and performance to link to the interests of our stockholders. Further, the Committee oversees the Company’s human capital management policies and procedures, including its workforce and professional development and diversity and inclusion initiatives.
8
Labor Relations and Collective Bargaining: Approximately 35% of our workforce is covered by various collective bargaining agreements (CBAs), predominantly with the United Steel, Paper and Forestry, Rubber, Manufacturing, Energy, Allied & Industrial Service Workers International Union, AFL-CIO, CLC (USW). The Company has no significant CBAs that expire in fiscal year 2024.
Available Information
Our Internet website address is www.atimaterials.com. Our annual reports on Form 10-K, quarterly reports on Form 10-Q, current reports on Form 8-K and amendments to those reports filed or furnished pursuant to Section 13(a) or 15(d) of the Securities Exchange Act of 1934, as well as proxy and information statements and other information that we file, are available free of charge through our Internet website as soon as reasonably practicable after we electronically file such material with, or furnish such material to, the United States Securities and Exchange Commission (“SEC”). Our Internet website and the content contained therein or connected thereto are not intended to be incorporated into this Annual Report on Form 10-K. The SEC maintains an Internet website at www.sec.gov, which also contains reports, proxy and information statements and other information that we file electronically with the SEC. We routinely post important information on our website, www.atimaterials.com, in the “Investors” section. We also may use our website as a means of disclosing material, non-public information and for complying with our disclosure obligations under Regulation FD. Accordingly, investors should monitor the Investors section of our website, in addition to following our press releases, SEC filings, public conference calls, presentations and webcasts. The information contained on, or that may be accessed through, our website is not incorporated by reference into, and is not a part of, this document.
Item 1A. Risk Factors
There are inherent risks and uncertainties associated with our business that could adversely affect our operating performance and financial condition. Set forth below are descriptions of those risks and uncertainties that we currently believe to be material, but the risks and uncertainties described are not the only risks and uncertainties that could affect our business. See the discussion under “Forward-Looking Statements” in Item 7. Management’s Discussion and Analysis of Financial Condition and Results of Operations, in this Annual Report on Form 10-K.
RISKS RELATED TO CYCLICAL NATURE OF OUR BUSINESS
Cyclical Demand for Products. The cyclical nature of the industries in which our customers operate causes demand for our products to be cyclical, creating potential uncertainty regarding future profitability. Various changes in general economic conditions may affect the industries in which our customers operate. These changes could include decreases in the rate of consumption or use of our customers’ products due to economic downturns. Other factors that may cause fluctuation in our customers’ positions are changes in market demand, lower overall pricing due to domestic and international overcapacity, currency fluctuations, lower priced imports and increases in use or decreases in prices of substitute materials. As a result of these factors, our profitability has been and may in the future be subject to significant fluctuation.
Risks Associated with the Commercial Aerospace Industry. A significant portion of our sales represent products sold to customers in the commercial aerospace industry. Fulfilling contractual arrangements to provide various products to customers in this industry often involves meeting highly exacting performance requirements and product specifications, and our failure to meet those requirements and specifications on a timely and cost-efficient basis could have a material adverse effect on our results of operations, business and financial condition. The commercial aerospace industry has historically been cyclical due to factors both external and internal to the airline industry. These factors include general economic conditions, airline profitability, consumer demand for air travel, varying fuel and labor costs, changes in projected build rates, price competition, and international and domestic political conditions such as military conflict and the threat of terrorism. The length and degree of cyclical fluctuation are influenced by these factors and therefore are difficult to predict with certainty. Demand for our products is subject to these cyclical trends. Cyclical and event-driven downturns in the commercial aerospace industry have had, and may in the future have, an adverse effect on the prices at which we are able to sell our products, and our results of operations, business and financial condition could be materially adversely affected.
Risks Associated with Cyclicality in General Industrial Markets. Our exposure to general industrial markets is primarily in our AA&S segment, where we have sales to the oil & gas industry, automotive, food equipment & appliances and construction and mining markets. These markets tend to be highly cyclical and subject to volatility as a result of fluctuations in worldwide economic activity and associated demand, changes in applicable regulation, global geopolitical conditions and numerous other factors. Demand for our products, particularly within the AA&S segment, is subject to these trends, and in recent years, our business has at times been negatively impacted by depressed demand from general industrial markets. We expect that these end markets will remain a highly cyclical industry, and future downturns could have an adverse effect on the prices at which we are able to sell our products, and our results of operations, business and financial condition could be materially adversely affected.
9
Product Pricing. From time-to-time, reduced demand, intense competition, and excess manufacturing capacity have resulted in reduced prices, excluding raw material surcharges, for many of our products. These factors have had and may have an adverse impact on our revenues, operating results, and financial condition. Recently, due to inflationary trends, certain critical raw material costs, such as nickel, hafnium, titanium sponge, cobalt, chromium, and molybdenum and scrap containing iron, nickel, titanium, chromium, and molybdenum have been volatile. While we have been able to mitigate some of the adverse impact of volatile raw material costs through various means, including raw material surcharges or indices to customers, rapid changes in raw material costs cause volatility in, and may adversely affect, our results of operations.
We change prices on certain of our products from time-to-time. Our ability to implement price increases is dependent on market conditions, economic factors, raw material costs and availability, competitive factors, operating costs and other factors, some of which are beyond our control. As such, we may be unable to implement price increases to the degree or within the time frame necessary to fully mitigate the impact of inflationary trends or at all, and the benefits of any price increases may be delayed due to long manufacturing lead times and the terms of existing contracts.
Risks Associated with Key Customers. We have long-term contracts with certain of our customers, some of which are subject to renewal, renegotiation, or re-pricing at periodic intervals or upon changes in competitive supply conditions. Our failure to successfully renew, renegotiate or favorably re-price such agreements, or a material deterioration in or termination of these or other key customer relationships, could result in a reduction or loss in customer purchase revenue. Additionally, a significant downturn or deterioration in the business or financial condition or loss of a key customer could negatively impact our business. Our customers may change their business strategies or modify their business relationships with us, including to reduce the amount of our products they purchase or to switch to alternative suppliers, as a result of which our financial condition and results of operations may be adversely affected.
RISKS RELATED TO THE RAW MATERIALS AND SUPPLIES THAT WE USE
Dependence on Critical Raw Materials Subject to Price and Availability Fluctuations. We rely to a substantial extent on third parties to supply certain raw materials that are critical to the manufacture of our products. Purchase prices and availability of these critical items are subject to volatility, and in some cases, we have supply arrangements with only a limited number of suppliers for a given material. At any given time, we may be unable to obtain an adequate supply of these critical raw materials on a timely basis, on price and other terms acceptable to us, or at all. If suppliers increase the price of critical raw materials, we may not have alternative sources of supply. In addition, to the extent that we have quoted prices to customers and accepted customer orders for products prior to purchasing necessary raw materials, or have existing contracts, we may be unable to raise the price of products to cover all or part of the increased cost of the raw materials. The prices for many of the raw materials we use have been volatile during the past several years. Due to the long lead times required to manufacture many of our products, volatility in raw material prices exposes us to cash costs that may not be fully recovered through surcharge and index pricing mechanisms.
The manufacture of some of our products is a complex process and requires long lead times. As a result, we may experience delays or shortages in the supply of raw materials. In particular, we acquire certain important raw materials that we use to produce specialty materials, including nickel, zirconium, niobium, chromium, cobalt, vanadium and titanium sponge, from foreign sources. Some of these sources operate in countries that may be subject to unstable political and economic conditions. These or similar conditions may disrupt supplies or affect the prices of the materials that are necessary to our operations. If unable to obtain adequate and timely deliveries of required raw materials, we may be unable to timely manufacture sufficient quantities of products. This could cause us to lose sales, incur additional costs, delay new product introductions, or suffer harm to our reputation.
The ongoing conflict between Russia and Ukraine may adversely affect our business and results of operations.
Since February 2022, Russia and Ukraine have been engaged in active armed conflict. The length, impact, and outcome of the ongoing conflict and its potential impact on our business is highly volatile and difficult to predict. It has and could continue to cause significant market and other disruptions, including significant volatility in commodity prices and supply of energy resources, instability in financial markets, supply chain interruptions, political and social instability, trade disputes or trade barriers, changes in consumer or purchaser preferences, and increases in cyberattacks and espionage.
Governments in the European Union, the United States, the United Kingdom and other countries have enacted sanctions against Russia and Russian interests. These sanctions include controls on the export, re-export, and in-country transfer in Russia of certain goods, supplies, and technologies, and the imposition of restrictions on doing business with certain state-owned Russian customers and other investments and business activities in Russia. In early March 2022, we announced plans to terminate our Uniti, LLC joint venture with Russian-based VSMPO-AVISMA (Verkhnaya Salda Metallurgical Production Association - Berezniki Titanium-Magnesium Works), the purpose of which was to market and sell a range of commercially pure titanium products. However, conditions in Ukraine and/or existing or future sanctions may disrupt supplies or affect the prices of materials that are necessary to our operations. If unable to obtain adequate and timely deliveries of required raw materials, we
10
may be unable to timely manufacture sufficient quantities of products. This could cause us to lose sales, incur additional costs, delay new product introductions, or suffer harm to our reputation.
Further, the broader consequences of the current conflict between Russia and Ukraine may also have the effect of heightening many other risks disclosed in our public filings, any of which could materially and adversely affect our business and results of operations. Such risks include, but are not limited to, adverse effects on global macroeconomic conditions; increased volatility in the price and demand of oil, natural gas and other commodities, increased exposure to cyberattacks; disruptions in global supply chains; and exposure to foreign currency fluctuations and potential constraints or disruption in the capital markets and our sources of liquidity.
Dependence on Critical Supplies Subject to Price and Availability Fluctuations. We rely on third parties for certain supplies, such as graphite electrodes and industrial gases including helium and argon that are critical to the manufacture of our products. Purchase prices and availability of these critical items are subject to volatility. At any given time, we may be unable to obtain an adequate supply of these critical supplies on a timely basis, on price and other terms acceptable to us, or at all. If suppliers increase the price of these items, we may not have alternative sources of supply. The manufacture of some of our products is a complex process and requires long lead times. As a result, we may experience delays or shortages of critical supplies. If unable to obtain adequate and timely deliveries of required supplies, we may be unable to timely manufacture sufficient quantities of products. This could cause us to lose sales, incur additional costs, delay new product introductions, or suffer harm to our reputation.
Availability of Energy Resources. We rely upon third parties for our supply of energy resources consumed in the manufacture of our products. The prices for and availability of electricity, natural gas, oil and other energy resources are subject to volatile market conditions. These market conditions often are affected by political and economic factors beyond our control. Disruptions in the supply of energy resources could temporarily impair our ability to manufacture products for customers. Further, increases in energy costs, or changes in costs relative to energy costs paid by competitors, has and may continue to adversely affect our profitability. To the extent that these uncertainties cause suppliers and customers to be more cost sensitive, increased energy prices may have an adverse effect on our results of operations and financial condition.
RISKS RELATED TO OUR WORKFORCE
Risks Associated with the Recruitment and Retention of Key Talent and the Sustainability of our Workforce. Our business and manufacturing processes are complex. We require highly skilled personnel with relevant industry and technical experience to effectively operate, and as such, depend on our ability to recruit, retain and motivate our employees. Shortages in skilled labor and other labor market pressures currently are resulting in greater competition for skilled labor and increased labor costs in some instances. If we fail to attract, develop, retain and motivate a sustainable workforce with the skills and in the locations we need to operate and grow our business, our operations could be adversely impacted.
In addition, the loss of key members of management and other personnel could negatively impact our business, and any unplanned turnover, or failure to develop adequate succession plans for key positions, could result in loss of technical or other expertise or institutional knowledge, delay or impede the execution of our strategic plans and priorities and, ultimately, negatively impact our business and results.
Labor Matters. We have approximately 7,300 active employees, of which approximately 15% are located outside the United States. Approximately 35% of our workforce is covered by various CBAs, predominantly with the USW. At various times, our CBAs expire and are subject to renegotiation. Generally, collective bargaining agreements that expire may be terminated after notice by the union. After termination, the union may authorize a strike. A labor dispute, which could lead to a strike, lockout, or other work stoppage by the employees covered by one or more of the collective bargaining agreements, could have a material adverse effect on production at one or more of our facilities and, depending upon the length of such dispute or work stoppage, on our operating results. For example, in fiscal year 2021, the USW engaged in a 3 ½ month strike primarily affecting our AA&S segment operations, and we incurred approximately $63 million in strike-related costs and had lower revenues during this period while we continued to operate affected facilities with replacement workers. There can be no assurance that we will succeed in concluding collective bargaining agreements to replace those that expire.
RISKS RELATED TO INTELLECTUAL PROPERTY, INFORMATION TECHNOLOGY AND SECURITY
Risks Associated with our Intellectual Property. We own valuable intellectual property, including trade secrets, patents, trademarks and copyrights. Our intellectual property protects our investments in technological innovation, research and development, and plays an important role in maintaining our competitive position in the markets we serve. Despite efforts to secure our intellectual property, it may be infringed or misappropriated by our employees, our competitors or other third parties. The pursuit of remedies for infringement or misappropriation of intellectual property is expensive and uncertain. Additionally, our competitors may develop technologies of their own that are similar or superior to our proprietary technologies, or design
11
around our patents, to lawfully avoid our intellectual property rights. A failure to sufficiently secure or successfully enforce our intellectual property rights could adversely affect our business and competitive position.
Risks Associated with Digital Technology. Information technology infrastructure is critical to supporting business objectives; failure of our information technology infrastructure to operate effectively could adversely affect our business. If a problem occurs that impairs this infrastructure, the resulting disruption could impede our ability to record or process orders, manufacture and ship in a timely manner, or otherwise carry on business in the normal course. Any such events could cause us to lose customers or revenue and could require us to incur significant expense to remediate. As we integrate, implement and deploy new information technology processes and information infrastructure across our operations, we could experience disruptions in our business that could have an adverse effect on our business, financial condition, results of operations and cash flow.
Cybersecurity Threats. Increased global information technology threats, vulnerabilities, and a rise in sophisticated and targeted international computer crime pose a risk to the security of our systems and networks and the confidentiality, availability and integrity of our data. We believe that ATI faces the threat of such cyberattacks due to the markets we serve, the products we manufacture, the locations of our operations, and global interest in our technology. Due to the evolving nature of cybersecurity threats, the scope and impact of any incident cannot be predicted. We continually work to strengthen our threat countermeasures, safeguard our systems and mitigate potential risks. Despite our efforts to fortify our cybersecurity and protect sensitive information and confidential and personal data, our facilities and systems and those of our third-party service providers may be vulnerable to security breaches. This could lead to disclosure, modification or destruction of proprietary and other key information, production downtimes, operational disruptions, and remediation costs, which in turn could adversely affect our reputation, competitiveness and results of operations.
RISK RELATED TO CLIMATE CHANGE AND OTHER ENVIRONMENTAL MATTERS
Risks Associated with Climate Change.
While the prospect of a lower-carbon economy presents a number of opportunities for our business, the physical impacts of climate change, regulatory efforts to transition to a lower-carbon economy in the regions in which we, our customers and our suppliers operate and the increased focus and evolving views of our various stakeholders on climate change issues could create risks to our business.
Physical Risk. Climate related changes in prevailing weather patterns may impact, among other conditions, changes in sea levels and the propensity for flooding in coastal and other regions, long-term changes in precipitation patterns leading to flooding, drought or deterioration in water quality, and increases in the frequency and severity of significant storms and other weather events and related natural hazards, such as wildfire risk. Although we do not believe that our facilities are currently exposed to significant physical risk as a general matter, our operations have at times been, and could in the future be, impacted by adverse climate-related events, such as, for example, unanticipated periods of extreme cold or heat, acute flooding and wide-spread wildfires such as those experienced in certain regions in the U.S. and elsewhere in recent years. Events such as these could cause damage to critical facilities and equipment, result in significant operational disruption and have meaningfully adverse effects on our employees and the communities in which we operate. Additionally, even to the extent that significant weather events or changes in climate conditions do not directly impact our own facilities and/or operations, our business could be negatively impacted by events or more chronic climate conditions that disrupt or force longer-term changes in operations for our significant customers or suppliers, which could negatively impact the timing or overall volume of demand for our products or the cost and availability of critical raw materials, among other factors. Over time, widespread physical climate changes and risks could drive increases in other operational costs for our business, such as insurance costs.
Regulatory and Other Transition Risks. Increased worldwide focus on climate change has led to legislative and regulatory efforts to combat both potential causes and adverse impacts of climate change. New or more stringent laws and regulations related to greenhouse gas emissions, water usage and other climate change related concerns may adversely affect us, our suppliers and our customers. We have publicly disclosed efforts to reduce the energy intensity, freshwater intake intensity and greenhouse gas (GHG) emission of our operations, working consistently to enhance the environmental sustainability of our business by reducing our reliance on fossil fuel-based energy sources, promoting water reuse and other responsible water management practices, reducing waste and promoting recycling (including extensive use of recycled feedstock in our manufacturing processes) and ensuring our compliance with applicable environmental regulations. Nevertheless, new and evolving laws and regulations could mandate different or more restrictive standards, increase operating costs, require (or cause customers to require that we make) capital investments to transition to low carbon technologies or purchase carbon credits, or otherwise adversely impact our ongoing operations. Our suppliers may face similar challenges and incur additional compliance costs that are passed on to us. These direct and indirect costs may adversely impact our results.
12
Market and Reputational Risks. Technology to support the transition to lower-carbon operations within the timeframe that could be required by future regulation or expected in the future by our customers may not be available at the scale necessary to support our operations, in a timely or cost-effective manner, or at all. It is possible that, over time, due to both regulatory action and/or changing customer and societal norms and expectations regarding the causes and importance of climate change issues, demand for products in one or more of our significant end markets could decline or, if we fail to keep pace with changing demand and technological advancement, shift in favor of products that we do not produce. If we fail to appropriately adapt to the expectations of our customers or other stakeholders, fail to achieve or properly report progress toward our environmental sustainability goals and targets or otherwise are perceived as failing to adequately address climate change concerns, the resulting negative perceptions could adversely affect our business, reputation and access to capital.
Risks Associated with Other Environmental Compliance Matters. We are subject to various domestic and international environmental laws and regulations that govern the discharge of pollutants and disposal of wastes, and which may require that we investigate and remediate the effects of the release or disposal of materials at sites associated with past and present operations. We could incur substantial cleanup costs, fines and civil or criminal sanctions, third party property damage or personal injury claims as a result of violations or liabilities under these laws or non-compliance with environmental permits required at our facilities. We are currently involved in the investigation and remediation of a number of our current and former sites as well as third party sites. We also could be subject to future laws and regulations that govern greenhouse gas emissions and various matters related to climate change and other air emissions, which could increase our operating costs. With respect to proceedings brought under the federal Superfund laws, or similar state statutes, we have been identified as a potentially responsible party (PRP) at 43 of such sites, excluding those at which we believe we have no future liability. Our involvement is limited or de minimis at approximately 20 of these sites, the potential loss exposure with respect to 16 individual sites is not considered to be material, and the potential loss exposure on the remaining seven sites could be material. We are a party to various cost-sharing arrangements with other PRPs at many of the sites. The terms of the cost-sharing arrangements are subject to non-disclosure agreements as confidential information. Nevertheless, the cost-sharing arrangements generally require all PRPs to post financial assurance of the performance of the obligations or to pre-pay into an escrow or trust account their share of anticipated site-related costs. In addition, the Federal government, through various agencies, is a party to several such arrangements.
We believe that we operate our businesses in compliance in all material respects with applicable environmental laws and regulations. However, from time-to-time, we are a party to lawsuits and other proceedings involving alleged violations of, or liabilities arising from, environmental laws. When our liability is probable and we can reasonably estimate our costs, we record environmental liabilities in our financial statements. In many cases, we are not able to determine whether we are liable or if liability is probable or to reasonably estimate the loss or range of loss. Estimates of our liability remain subject to additional uncertainties, including the nature and extent of site contamination, available remediation alternatives, the extent of corrective actions that may be required, and the participation number and financial condition of other PRPs, as well as the extent of their responsibility for the remediation. We intend to adjust our accruals to reflect new information as appropriate. Future adjustments could have a material adverse effect on our results of operations in a given period, but we cannot reliably predict the amounts of such future adjustments. At December 31, 2023, our reserves for environmental matters totaled approximately $13 million. Based on currently available information, we do not believe that there is a reasonable possibility that a loss exceeding the amount already accrued for any of the sites with which we are currently associated (either individually or in the aggregate) will be an amount that would be material to a decision to buy or sell our securities. Future developments, administrative actions or liabilities relating to environmental matters, however, could have a material adverse effect on our financial condition or results of operations.
OTHER OPERATIONAL AND STRATEGIC RISKS
Risks Associated with Disruptions to our Manufacturing Processes. The manufacture of many of our products is a highly exacting and complex process. If we encounter disruptions to our manufacturing processes due to equipment malfunction, failure to follow specific protocols, specifications and procedures, supply chain interruptions, natural disasters, health pandemics, labor unrest, or otherwise, it could have an adverse impact on our ability to fulfill orders or on product quality or performance which could result in significant costs to and liability for us that could have a material adverse effect on our business, financial condition or results of operations, as well as negative publicity and damage to our reputation, which could adversely impact product demand and customer relationships. Additionally, our operations depend on the continued and efficient functioning of our facilities, including critical equipment. If our operations, particularly one of our manufacturing facilities, were to be materially disrupted for any reason, we may be unable to effectively meet our obligations to or demand from our customers, which could adversely affect our financial performance.
Export Sales and International Trade Matters. We believe that export sales will continue to account for a significant percentage of our future revenues. We also import certain raw materials that are important to our business, including nickel, zirconium, niobium, chromium, cobalt, vanadium and titanium sponge, among others. Risks associated with such international
13
trade include, among others: political and economic instability, including weak conditions in the world’s economies; accounts receivable collection; export controls; trade sanctions; changes in legal and regulatory requirements; policy changes affecting the markets for our products; changes in tax laws; and exchange rate fluctuations (which may affect sales to international customers and the value of profits earned on export sales when converted into dollars). Any of these factors could materially adversely affect our results for the period in which they occur.
Additionally, changes in international trade duties and other aspects of international trade policy, both in the U.S. and abroad, could materially impact our business. Moreover, tariffs, or other changes in U.S. trade policy, have resulted in and may continue to trigger, retaliatory actions by affected countries. Certain foreign governments have instituted or considered imposing trade sanctions on certain U.S. goods, or taking action to deny U.S. companies access to critical raw materials, in response to U.S. trade actions. A “trade war” of this nature or other governmental action related to tariffs or international trade agreements or policies has the potential to adversely impact demand for our products, our costs, customers, suppliers and/or the U.S. economy or certain sectors thereof and, thus, to adversely impact our businesses.
Risks Associated with Strategic Capital Projects and Maintenance Activities. From time to time, we undertake strategic capital projects in order to enhance, expand and/or upgrade our facilities and operational capabilities. Our ability to achieve the anticipated increased revenues or otherwise realize acceptable returns on these investments or other strategic capital projects that we may undertake is subject to a number of risks, many of which are beyond our control, including a variety of market, operational, permitting, and labor-related factors. In addition, the cost to implement any given strategic capital project ultimately may prove to be greater than originally anticipated. If we are not able to achieve the anticipated results from the implementation of any of our strategic capital projects, or if we incur unanticipated implementation costs or delays, our results of operations and financial position may be materially adversely affected. Additionally, we periodically undertake maintenance activities, routine or otherwise, involving facilities and pieces of equipment that are key to our operations, and it is possible that unanticipated maintenance needs, or unanticipated circumstances arising in connection with planned maintenance activities could result in equipment outages that are longer, or costs that exceed, those originally anticipated. Significant repair delays or unanticipated costs associated with these activities could have a negative impact on our results of operations and financial condition.
Risks Associated with Current or Future Litigation and Claims. A number of lawsuits, claims and proceedings have been or may be asserted against us relating to the conduct of our currently and formerly owned businesses, including those pertaining to product liability, patent infringement, commercial disputes, government contracting, employment matters, employee and retiree benefits, taxes, environmental matters, health and safety and occupational disease, and stockholder and corporate governance matters. Due to the uncertainties of litigation, we can give no assurance that we will prevail on all claims made against us in the lawsuits that we currently face or that additional claims will not be made against us in the future. While the outcome of litigation cannot be predicted with certainty, and some of these lawsuits, claims or proceedings may be determined adversely to us, we do not believe that the disposition of any such pending matters is likely to have a material adverse effect on our financial condition or liquidity, although the resolution in any reporting period of one or more of these matters could have a material adverse effect on our results of operations for that period. Also, we can give no assurance that any other claims brought in the future will not have a material effect on our financial condition, liquidity or results of operations.
Risks Associated with Insurance Coverage. We have maintained various forms of insurance, including insurance covering claims related to our properties and risks associated with our operations. Our existing property and liability insurance coverages contain exclusions and limitations on coverage. From time-to-time, in connection with renewals of insurance, we have experienced additional exclusions and limitations on coverage, larger self-insured retentions and deductibles, and significantly higher premiums. As a result, in the future our insurance coverage may not cover claims to the extent that it has in the past and the costs that we incur to procure insurance may increase significantly, either of which could have an adverse effect on our results of operations.
Risks Associated with Acquisition and Disposition Strategies. We intend to continue to strategically position our businesses to improve our ability to compete. Strategies we employ to accomplish this may include seeking new or expanding existing specialty market niches for our products, expanding our global presence, acquiring businesses complementary to existing strengths, and continually evaluating the performance and strategic fit of our existing business units. From time-to-time, management holds discussions with management of other companies to explore acquisitions, joint ventures, and other business combination opportunities as well as possible business unit dispositions. As a result, the relative makeup of the businesses comprising our Company is subject to change. Acquisitions, joint ventures, and other business combinations involve various inherent risks, such as: assessing accurately the value, strengths, weaknesses, contingent and other liabilities and potential profitability of acquisition or other transaction candidates; the potential loss of key personnel of an acquired business; our ability to achieve identified financial and operating synergies, growth or other benefits anticipated to result from an acquisition or other transaction; and unanticipated changes in business and economic conditions affecting an acquisition or other transaction. International acquisitions and other transactions could be affected by export controls, exchange rate fluctuations, domestic and foreign political conditions, changes in tax laws and a deterioration in domestic and foreign economic conditions.
14
Risks Associated with Government Contracts. Some of our operating units perform contractual work directly or indirectly for the U.S. Government, which requires compliance with laws and regulations relating to the performance of Government contracts. Various claims (whether based on U.S. Government or Company audits and investigations or otherwise) could be asserted against us related to our U.S. Government contract work. Depending on the circumstances and the outcome, such proceedings could result in fines, penalties, compensatory and treble damages or the cancellation or suspension of payments under one or more U.S. Government contracts. Under government regulations, a company, or one or more of its operating divisions or units, can also be suspended or debarred from government contracts based on the results of investigations.
Risks Related to Wide-Spread Public Health Crises. The COVID-19 pandemic, including governmental and other actions taken or restrictions imposed to contain its spread and impact, subjected our operations, financial performance and financial condition to a number of risks. In general, our facilities continued to operate throughout the pandemic with federal and state government approvals because our facilities were deemed essential and critical. However, we experienced, and may again in the context of future similar events experience, the temporary shut-down of facilities. The significant macroeconomic impact of the COVID-19 pandemic and the measures designed to contain its spread also negatively impacted several of the Company’s most significant end markets, and our sales to customers in those markets. Additionally, in the context of the COVID-19 pandemic or any future similar event, one or more of our suppliers may not have the materials, capacity, or capability to supply products that we require according to our schedule and specifications. In that case, we may need to seek alternate suppliers, which may be more expensive, may not be available or may result in delays in shipments to us and subsequently to our customers, each of which would affect our business, results of operations, financial condition and/or cash flows. The possibility exists that there could be ongoing impacts to our operations and financial results as a result of COVID-19 or a similar future pandemic, and the ultimate breadth and duration of these trends and their impact on our business is difficult to predict.
Political and Social Turmoil. The war on terrorism as well as political and social turmoil could put pressure on economic conditions in the United States and worldwide. These political, social and economic conditions could make it difficult for us, our suppliers, and our customers to forecast accurately and plan future business activities, and could adversely affect the financial condition of our suppliers and customers and affect customer decisions as to the amount and timing of purchases from us. As a result, our business, financial condition and results of operations could be materially adversely affected.
RISKS ASSOCIATED WITH OUR INDEBTEDNESS; OTHER FINANCIAL AND FINANCIAL ACCOUNTING RISKS
Risks Associated with Indebtedness. Our substantial indebtedness could adversely affect our business, financial condition or results of operations and prevent us from fulfilling our obligations under our outstanding indebtedness. As of December 31, 2023, our total consolidated indebtedness was approximately $2.2 billion. Our subsidiaries had the ability to borrow an additional approximately $530 million under our revolving credit facility as of December 31, 2023. This substantial level of indebtedness increases the risk that we may be unable to generate enough cash to pay amounts due in respect of our indebtedness. Our substantial indebtedness could have important consequences to our stockholders and significant effects on our business. For example, it could:
•make it more difficult for us to satisfy our obligations with respect to our outstanding indebtedness;
•increase our vulnerability to general adverse economic and industry conditions;
•require us to dedicate a substantial portion of our cash flow from operations to payments on our indebtedness, thereby reducing the availability of our cash flow to fund working capital, capital expenditures, our strategic growth initiatives and development efforts and other general corporate purposes;
•limit our flexibility in planning for, or reacting to, changes in our business and the industry in which we operate;
•restrict us from taking advantage of business opportunities;
•place us at a competitive disadvantage compared to our competitors that have less indebtedness; and
•limit our ability to borrow additional funds for working capital, capital expenditures, acquisitions, debt service requirements, execution of our business strategy or other general corporate purposes.
A portion of our indebtedness, including amounts outstanding currently or in the future under our ABL, bear interest at variable rates and, accordingly, subject our business to risk, particularly in a rising interest rate environment. In addition, the agreements that govern our current indebtedness contain, and the agreements that may govern any future indebtedness that we may incur may contain, financial and other restrictive covenants that could limit our ability to engage in activities that may be in our long-term best interests. Our failure to comply with those covenants could result in an event of default that, if not cured or waived, could result in the acceleration of all of our debt.
15
Risks Associated with Retirement Benefits. On October 17, 2023, we purchased group annuity contacts from an insurer covering approximately 85% of our U.S. qualified defined benefit plan obligations. Under these contracts, we transferred the pension obligations and associated assets for the significant majority of our remaining plan participants to the selected insurance company. Using our long-term weighted average expected rate of return on pension plan assets and other actuarial assumptions, we do not expect to have any significant minimum cash funding requirements to our pension plan for at least the next ten years. However, these estimates are based on various assumptions and are subject to significant uncertainty, including with respect to the performance of our pension trust assets, and our expectations therefore could prove to be inaccurate. Significantly lower than expected returns on our pension assets could result in otherwise unanticipated pension contribution obligations in the future. Depending on the timing and amount, a requirement that we fund the U.S. qualified defined benefit pension plan could have a material adverse effect on our results of operations and financial condition.
Goodwill or Long-Lived Asset Impairments. We have various long-lived assets that are subject to impairment testing. We review the recoverability of goodwill annually, or more frequently whenever significant events or changes in circumstances indicate that the recorded goodwill of a reporting unit may be below that reporting unit’s fair value. Our businesses operate in highly cyclical industries, such as commercial aerospace and oil & gas, and as such, our estimates of future cash flows, market demand, the cost of capital, and forecasted growth rates and other factors may fluctuate, which may lead to changes in estimated fair value and, therefore, impairment charges in future periods. For the fiscal year 2023 annual goodwill impairment evaluation, both of our reporting units with goodwill had fair values that were in excess of carrying value. Additionally, we have a significant amount of property, plant and equipment and acquired intangible assets that may be subject to impairment testing, depending on factors such as market conditions, the demand for our products, and facility utilization levels. Any determination requiring the impairment of a significant portion of goodwill or other long-lived assets has had, and may in the future have, a negative impact on our financial condition and results of operations.
Internal Controls Over Financial Reporting. Because of its inherent limitations, internal control over financial reporting may not prevent or detect misstatements. Also, projections of any evaluation of effectiveness to future periods are subject to the risk that controls may become inadequate because of changes in conditions, or that the degree of compliance with the policies or procedures may deteriorate.
Risks Associated with Our Guidance and Other Targets and Expectations. From time to time, we may announce earnings guidance and other future targets or goals for our business. Such information, which consists of forward-looking statements, is based on our then current expectations, estimates, forecasts and projections about the operating environment, economies and markets in which we operate. Future targets and goals reflect our beliefs and assumptions and our perception of historical trends, then current conditions and expected future developments, as well as other factors appropriate in the circumstances. As such, while sometime presented with numerical specificity, earnings guidance and other statements regarding our future targets and goals are inherently speculative in nature and subject to significant business, economic, competitive and other uncertainties and contingencies regarding future events, including the risks discussed herein. Our actual results can, and likely will, be different, and those differences could be material. There can be no assurance that any targets or goals established by us will be accomplished at the levels or by the dates targeted, if at all. Failure to achieve our targets or goals may have a material adverse effect on our business, financial condition, results of operations or the market price of our securities.
Item 1B. Unresolved Staff Comments
None.
Item 1C. Cybersecurity
The Company and its Board recognize the critical significance that cybersecurity has to our operations and the need to continually assess cybersecurity risk and evolve our response in the face of a rapidly and ever-changing environment. We face a range of increasing and evolving cybersecurity threats common to industrial operations and other enterprises, which continue to grow in frequency and scope. See Item 1A, Risk Factors, “Cybersecurity Threats.”
The programs and procedures we have implemented to mitigate our exposure to these threats focus on preventing cybersecurity incidents, preserving the confidentiality, security and availability of the information that we generate or collect and store, and effectively responding to cybersecurity incidents if they occur.
Our Comprehensive Program
We take a comprehensive, standards-driven approach to our cybersecurity through an enterprise-wide cybersecurity program aligned with the National Institute on Standards and Technology’s Cybersecurity Framework. Our program includes an extensive set of systems, network and application-level controls that protect our corporate data and systems. Our Chief Digital and Information Officer (“CDIO”) and our Chief Information Security Officer (“CISO”), each of whom have extensive cybersecurity training and expertise and more than 20 years and 14 years of information technology and cybersecurity
16
experience, respectively, hold primary responsibility within management for assessing, monitoring and managing our cybersecurity risks and program. They are supported by a dedicated, enterprise-wide cybersecurity team that, with the assistance of third-party providers, monitors our program and controls, as well as available cybersecurity intelligence, on a continuous basis to ensure that, as an organization, we are informed of emerging risks, identify specific threats and potential incidents, and promptly escalate the evaluation and management of identified incidents as appropriate. Components of our comprehensive program include, among others:
•Technical Safeguards. We deploy technical safeguards that are designed to protect the Company’s information systems from cybersecurity threats, including firewalls, intrusion prevention and detection systems, anti-malware functionality and access controls, which are evaluated through vulnerability assessments and cybersecurity threat intelligence.
•Third-Party Risk Management. We maintain a risk-based approach to identifying and overseeing cybersecurity risks presented by third parties.
•Program Assessments. We engage in regular assessments and testing of our policies and procedures, including efforts such as audits and similar assessments, tabletop exercises, threat modeling, vulnerability testing and other procedures focused on evaluating program effectiveness. Additionally, we periodically engage third parties to perform assessments of our cybersecurity measures, including information security maturity assessments and independent reviews of our information security control environment and operating effectiveness.
•Education and Awareness. We conduct a regular program of enterprise-wide communication and training regarding cybersecurity threats and the policies and procedures we have implemented in response. These programs are designed to elevate threat awareness within the Company and equip our employees with the knowledge and access to resources that they need to appropriately respond to and address the cybersecurity risks that we face.
•Incident Response and Recovery. We maintain extensive incident response and recovery plans and procedures that provide a documented framework for handling high severity security incidents. These plans ensure the appropriate escalation, evaluation, management and reporting of cybersecurity incidents in a prompt and appropriately cross-functional manner, facilitating coordination across multiple parts of the Company, and are the subject of regular table- top breach simulations and other exercises and evaluations.
•Insurance Coverage. We maintain a cybersecurity risk insurance policy to protect the Company against computer-related incidents and losses.
We have not experienced any operational or financial impact as a result of any cybersecurity incident or the cybersecurity risk that we face, and at this time, while the threat of a cybersecurity incident is always present, we view our comprehensive mitigation strategies and procedures as appropriately calibrated safeguards against any material impact to our results of operation and financial condition as a result of a cybersecurity incident and believe that we are prepared to appropriately mitigate and respond to such an incident, should it occur.
Governance
Our Board is actively engaged in the oversight of our digital technology risk management and cybersecurity programs. As part of its program of regular oversight, the Audit and Risk Committee oversees ATI’s digital technology and cybersecurity risk. The regular review and assessment of the Company’s cybersecurity program and related policies, standards, processes and practices is a fully integrated component of the Company’s overall enterprise risk management program, and at least quarterly as a key component of each regularly scheduled meeting, the Committee receives regular reports from our CDIO on the Company’s cybersecurity risk profile, the functioning of its cybersecurity program, including with reference to key performance indicators and other specific, quantitative measures, and other digital technology risks.
Item 2. Properties
Our principal domestic facilities for our HPMC segment include melting operations and production facilities that perform processing and finishing operations. Domestic melting operations are located in Monroe and Bakers, NC, and Richland, WA (vacuum induction melting, vacuum arc re-melt, electro-slag re-melt, plasma melting, electron beam melting). Production of high performance materials, most of which are in long product form, takes place at our domestic facilities in Monroe and Bakers, NC, Richburg, SC, and Oakdale, PA. Our production of highly engineered forgings and machined components takes place at facilities in Cudahy, Appleton and Coon Valley, WI, East Hartford, CT, and Irvine, CA. Metal alloy-based additive manufacturing for the aerospace & defense industries takes place in New Britain, CT, and will begin to take place in fiscal year 2024 in our newly leased facility in Fort Lauderdale, Florida.
Within the AA&S segment, our production of zirconium, hafnium, niobium and related specialty alloys takes place at facilities located in Millersburg, OR and Huntsville, AL. Nickel melting operations are located in Lockport, NY (vacuum induction melting, vacuum arc re-melt, and electro-slag re-melt), and titanium melting operations are located in Albany, OR (vacuum arc
17
re-melt). Our principal AA&S locations for melting flat-rolled specialty materials are located in Brackenridge and Latrobe, PA. Hot-rolling is performed at our domestic facilities in Brackenridge and Washington, PA. Finishing of our flat-rolled products takes place at our domestic facilities located in Vandergrift, Washington, Rochester, Monaca, and Zelienople, PA, and in New Bedford, MA. Additionally, the AA&S segment will benefit from the expanded capabilities at our new Pageland, SC location. Substantially all of our properties are owned.
We also own or lease facilities in a number of foreign countries, including France, Germany, the United Kingdom, Poland, and the People’s Republic of China. We own highly engineered forging and machining operations in Stalowa Wola, Poland. Through our STAL joint venture, we operate facilities for finishing PRS products in the Xin-Zhuang Industrial Zone, Shanghai, China.
Our corporate headquarters in Dallas, TX and employee resource center in Pittsburgh, PA are leased.
Although our facilities vary in terms of age and condition, we believe that they have been well maintained and are in sufficient condition for us to carry on our activities. See Item 7. “Management’s Discussion and Analysis of Financial Condition and Results of Operations” for further discussion of these impacts.
Item 3. Legal Proceedings
From time to time, we become involved in various lawsuits, claims and proceedings relating to the conduct of our current and formerly owned businesses, including those pertaining to product liability, environmental, health and safety matters and occupational disease (including as each relates to alleged asbestos exposure), as well as patent infringement, commercial, government contracting, construction, employment, employee and retiree benefits, taxes, environmental, and stockholder and corporate governance matters. While we cannot predict the outcome of any lawsuit, claim or proceeding, our management believes that the disposition of any pending matters is not likely to have a material adverse effect on our financial condition or liquidity. The resolution in any reporting period of one or more of these matters, including those described above, however, could have a material adverse effect on our results of operations for that period.
Information relating to legal proceedings is included in Note 21. Commitments and Contingencies of the Notes to Consolidated Financial Statements and incorporated herein by reference.
Item 4. Mine Safety Disclosures
Not applicable.
PART II
Item 5. Market for the Registrant’s Common Equity, Related Stockholder Matters and Issuer Purchases of Equity Securities
Common Stock Prices
Our common stock is traded on the New York Stock Exchange (symbol ATI). At February 2, 2024, there were 1,861 record holders of ATI Inc. common stock. We do not currently pay a quarterly dividend. The payment of dividends and the amount of such dividends depends upon matters deemed relevant by our Board of Directors, such as our results of operations, financial condition, cash requirements, future prospects, any limitations imposed by law, credit agreements or senior securities, and other factors deemed relevant and appropriate. Our Asset Based Lending (ABL) Credit Facility restricts our ability to pay dividends in certain circumstances. For more information on the restrictions under our ABL facility, see Note 16 of Item 8. “Financial Statements and Supplementary Data.”
18
Sales of Equity Securities
Set forth below is information regarding our stock repurchases during the fourth quarter of fiscal year 2023, comprised of shares repurchased by ATI under the $75 million repurchase program authorized by our Board of Directors in April 2023 and shares repurchased by ATI from employees to satisfy employee-owed taxes on share-based compensation. In November 2023, our Board of Directors authorized the repurchase of an additional $150 million of ATI stock. No shares were repurchased under this new program in the fourth quarter of fiscal year 2023.
Fiscal Period | Total Number of Shares (or Units) Purchased (a) | Average Price Paid per Share (or Unit) (b) (c) | Total Number of Shares (or Units) Purchased as Part of Publicly Announced Plans or Programs | Maximum Number (or Approximate Dollar Value) of Shares (or Units) that May Yet Be Purchased Under the Plans or Programs | ||||||||||||||||||||||
| October 2-29, 2023 | 531 | $ | 40.56 | — | $ | 30,000,006 | ||||||||||||||||||||
| October 30-November 26, 2023 | 705,070 | $ | 42.69 | 702,787 | $ | — | ||||||||||||||||||||
| November 27-December 31, 2023 | — | $ | — | — | $ | 150,000,000 | ||||||||||||||||||||
| Total | 705,601 | $ | 42.69 | 702,787 | $ | 150,000,000 | ||||||||||||||||||||
(a) Includes shares repurchased by ATI from employees to satisfy employee-owed taxes on share-based compensation.
(b) Share repurchases are inclusive of amounts for any relevant commissions.
(c) Excludes excise taxes incurred on share repurchases.
Cumulative Total Stockholder Return
The graph set forth below shows the cumulative total stockholder return (i.e., price change plus reinvestment of dividends) on our common stock from December 31, 2018 through December 31, 2023, as compared to the S&P 500 Index, the S&P MidCap 400 Industrials Index and the Russell 2000 Index. The graph assumes that $100 was invested on December 31, 2018. The stock performance information included in this graph is based on historical results and is not necessarily indicative of future stock price performance.
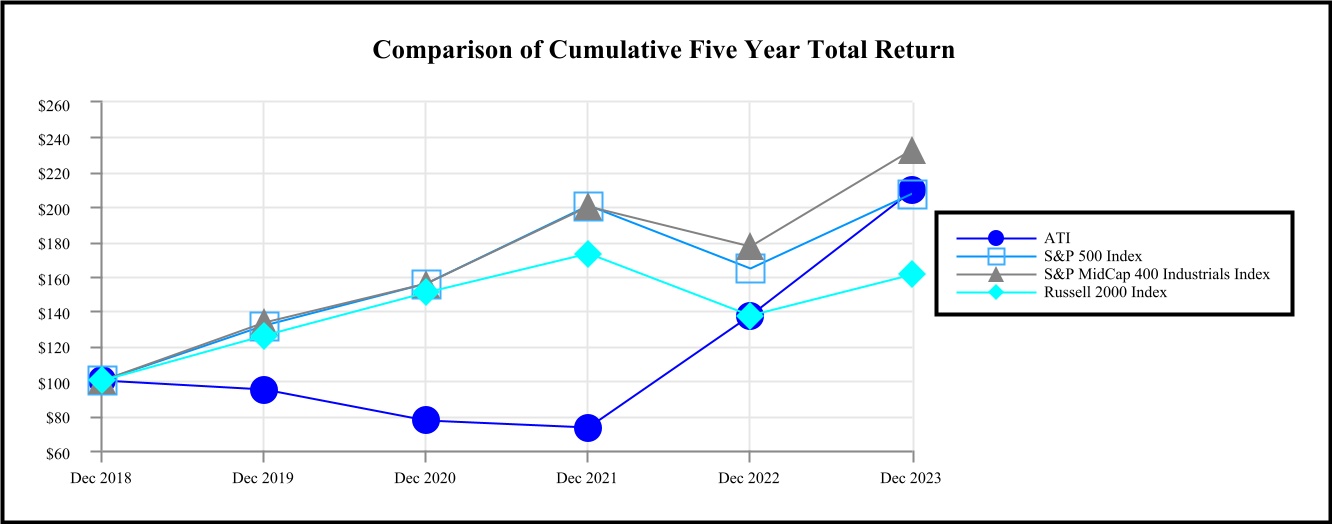
| Company / Index | Dec 2018 | Dec 2019 | Dec 2020 | Dec 2021 | Dec 2022 | Dec 2023 | ||||||||||||||||||||||||||||||||
| ATI | 100.00 | 94.90 | 77.03 | 73.17 | 137.16 | 208.87 | ||||||||||||||||||||||||||||||||
| S&P 500 Index | 100.00 | 131.49 | 155.68 | 200.37 | 164.08 | 207.21 | ||||||||||||||||||||||||||||||||
| S&P MidCap 400 Industrials Index | 100.00 | 133.55 | 155.57 | 199.82 | 176.84 | 232.43 | ||||||||||||||||||||||||||||||||
| Russell 2000 Index | 100.00 | 125.53 | 150.58 | 172.90 | 137.56 | 160.85 | ||||||||||||||||||||||||||||||||
| Source: Standard & Poor’s | ||||||||||||||||||||||||||||||||||||||
Item 6. [Reserved]
19
Item 7. Management’s Discussion and Analysis of Financial Condition and Results of Operations
Certain statements contained in this Management’s Discussion and Analysis of Financial Condition and Results of Operations are forward-looking statements. Actual results or performance could differ materially from those encompassed within such forward-looking statements as a result of various factors, including those described below. Net income and net income per share amounts referenced below are attributable to ATI Inc. and Subsidiaries.
During the fourth quarter of fiscal year 2023, we voluntarily changed the method of accounting for recognizing actuarial gains and losses for our defined benefit pension plans. See Note 1 of the Notes to the Consolidated Financial Statements for further explanation. This change has been applied to all pension plans on a retrospective basis for all prior periods presented.
ATI Overview
ATI is a global manufacturer of technically advanced specialty materials and complex components. Our largest markets are aerospace & defense, representing nearly 60% of total sales, led by products for jet engines. Additionally, we have a strong presence in the energy markets, including specialty energy, oil & gas and downstream processing, as well as the medical and electronics markets. In aggregate, these markets represent almost 85% of our revenue. ATI is a market leader in manufacturing differentiated products that require our materials science capabilities and unique process technologies, including our new product development competence.
We operate in two business segments: High Performance Materials & Components (HPMC) and Advanced Alloys & Solutions (AA&S). The HPMC segment’s primary focus is on maximizing aero-engine materials and components growth, with approximately 85% of its revenue derived from the aerospace & defense markets including nearly 60% of its revenue from products for commercial jet engines. Commercial aerospace products have been the main source of sales and EBITDA growth for HPMC over the last several years and are expected to continue to drive HPMC and overall ATI results in the future. Other major HPMC end markets include medical and energy. HPMC produces a wide range of high performance materials, components, and advanced metallic powder alloys. These are made from nickel-based alloys and superalloys, titanium and titanium-based alloys, and a variety of other specialty materials. Capabilities range from cast/wrought and powder alloy development to final production of highly engineered finished components, and 3D-printed aerospace products.
The AA&S segment is focused on delivering high-value flat products primarily to the energy, aerospace, and defense end-markets, which comprise over 60 % of its revenue. Other important end markets for AA&S include electronics, medical and automotive. AA&S produces nickel-based alloys, titanium and titanium-based alloys, and specialty alloys in a variety of forms including plate, sheet, and strip products.
Overview of Fiscal Year 2023 Financial Performance
Sales in fiscal year 2023 increased 9%, to $4.2 billion, while gross profit increased 12%, to $803 million, compared to fiscal year 2022, reflecting significant increased demand for commercial aerospace products despite softness in general industrial end markets. Results for fiscal years 2023 and 2022 included $104 million and $29 million, respectively, of net pre-tax charges as further described in the Results of Operations section below. The Company’s net income for fiscal year 2023 was $410.8 million, or $2.81 per share. ATI Adjusted EBITDA for fiscal year 2023 was $634.6 million, or 15.2% of sales, compared to $612.8 million, or 16.0% of sales, for fiscal year 2022. See further explanation below for non-GAAP definitions and calculations.
Revenues in our largest end markets, aerospace & defense, increased $601 million, or 32%, compared to fiscal year 2022, and represented 59% of our fiscal year 2023 sales. International sales, including both U.S. exports and foreign sales from our foreign manufacturing operations, were $1.9 billion in fiscal year 2023 and represented 46% of total sales.
A summary of our results is as follows:
| Fiscal Year | ||||||||||||||||||||
| (Dollars in millions, except per share amounts) | 2023 | 2022* | 2021* | |||||||||||||||||
| Sales | $ | 4,173.7 | $ | 3,836.0 | $ | 2,799.8 | ||||||||||||||
| Gross profit | $ | 802.6 | $ | 714.2 | $ | 333.2 | ||||||||||||||
| Gross profit % of sales | 19.2 | % | 18.6 | % | 11.9 | % | ||||||||||||||
| Operating income | $ | $ | $ | |||||||||||||||||
| Income before income taxes | $ | 295.2 | $ | 354.6 | $ | 233.4 | ||||||||||||||
| Net income attributable to ATI | $ | 410.8 | $ | 323.5 | $ | 184.6 | ||||||||||||||
| Diluted net income attributable to ATI per common share | $ | 2.81 | $ | 2.23 | $ | 1.32 | ||||||||||||||
*Fiscal years ended January 1, 2023 and January 2, 2022 reflect the change in accounting principle as described in Note 1 of the Notes to the Consolidated Financial Statements.
20
Our major accomplishments during fiscal year 2023 include the following:
•ATI delivered strong results for fiscal year 2023 as demand for our differentiated materials accelerates. We finished the year strong with the highest quarterly revenue for fiscal year 2023 in the fourth quarter, marking the sixth quarter in a row exceeding $1 billion and the highest quarterly revenue since the second quarter of fiscal year 2019. Sales to the aerospace and defense markets reached 59% of our sales for the full fiscal year 2023, up 10 percentage points over the prior year, as we are progressing quickly towards our goal of 65% of sales to these markets.
•Growth in the aerospace and defense markets drove strong results in our HPMC segment, with sales up 29% and HPMC EBITDA up 43% in fiscal year 2023 compared to fiscal year 2022. EBITDA margins in this segment improved by 200 basis points to 20.5% in fiscal year 2023. Full fiscal year 2023 commercial airframe product sales in this segment were up 90% year over year, reflecting the strong demand for our materials as the aerospace ramp continues.
•Sales of titanium products reached 17% of total sales in fiscal year 2023, up from 11% in the prior year, as these products remain a focal point across the aerospace & defense industry. We restarted a significant amount of titanium melt capacity in Albany, OR in fiscal year 2023, and we are on track for the first melt in the fourth quarter of fiscal year 2024 at our Richland, Washington facility. When our Richland, Washington expansion is at full production in late fiscal year 2025, our total titanium melt capacity is expected to be 80% greater than our fiscal year 2022 titanium melt capacity.
•We generated cash flow of $85.9 million from operating activities in fiscal year 2023, despite making contributions of $272 million to our U.S. qualified defined benefit pension plans. Continued efforts to focus on operational improvements are positively impacting the inventory intensity of our business and alleviating the required investment of managed working capital in our growing business. Managed working capital as a percent of sales was 31.1% as of December 31, 2023. We ended the year with $744 million of cash on hand and over $1 billion of total liquidity including the undrawn capacity under our asset-based lending facility.
•In the fourth quarter, we transferred approximately 85% of our U.S. qualified defined benefit pension plan obligations and related assets to a third-party insurance company through the purchase of group annuity contracts. Under these contracts, we transferred the pension obligations and associated assets for approximately 8,200 plan participants to the selected insurance company. After these actions, our U.S. qualified defined benefit pension plan includes approximately 1,980 participants. In addition, as of December 31, 2023, our U.S. qualified defined benefit pension plan is 114% funded on a financial reporting basis. As a result, based on current actuarial assumptions, we are not anticipating any significant required cash contributions in at least the next ten years. Our consolidated net pension liability, inclusive of obligations related to our qualified and nonqualified defined benefit pension plans, was $9 million, or 97% funded on a financial reporting basis, a significant improvement compared to a $219 million liability, or 88% funded position, at January 1, 2023.
•We repurchased 2 million shares of ATI stock for $85 million in fiscal year 2023, using all the remaining $150 million and $75 million under the plans approved by our Board of Directors in fiscal years 2022 and 2023, respectively. In addition, in November 2023, our Board of Directors authorized the repurchase of an additional $150 million of ATI stock.
•In August 2023, we issued $425 million aggregate principal amount of 7.25% Senior Notes due 2030 (2030 Notes). The net proceeds from this issuance were used to fund ATI’s U.S. qualified defined benefit pension plan in order to facilitate the pension derisking strategy discussed above.
Results of Operations
Fiscal Year 2023 Compared to Fiscal Year 2022
Results for fiscal year 2023 included sales of $4.17 billion and income before tax of $295.2 million, compared to sales of $3.84 billion and income before tax of $354.6 million in fiscal year 2022. Our gross profit was $802.6 million, or 19.2% of sales, an $88 million increase compared to fiscal year 2022. Our results for fiscal year 2023 reflect a significant increase in demand for commercial aerospace products despite softness in general industrial end markets. Gross profit in fiscal year 2022 included $34 million of benefits from management actions to access available grants and other forms of COVID-19 relief available from previously-enacted U.S. legislation.
Results for fiscal year 2023 included $104.3 million of net pre-tax charges, which consisted of the following:
•$0.6 million loss on the sale of our Northbrook, IL operations.
•$35.2 million of restructuring and other charges, consisting of $11.5 million of start up costs, $14.1 million primarily for asset write-offs associated with the restructuring of our European operations and the closure of our Robinson, PA
21
operations, $1.9 million of costs associated with an unplanned outage at our Lockport, NY melt facility, and $7.7 million of severance-related charges primarily for the restructuring of our European operations and involuntary reductions across ATI’s domestic operations in conjunction with our continued transformation.
•$41.7 million pension settlement loss associated with actions taken as part of our pension derisking strategy. On October 17, 2023, we completed a voluntary cash out for term vested employees and annuity buyouts covering 8,200 U.S. qualified defined benefit pension plan participants.
•$26.8 million of pension remeasurement losses for the immediate recognition in earnings of the actuarial gains/losses from the remeasurement of the projected benefit obligation and plan assets for defined benefit pension plans in accordance with our newly adopted accounting principle. These losses are from the remeasurements of these plans in the fourth quarter of fiscal year 2023.
Results for fiscal year 2022 also included $27.9 million of net pre-tax charges which consisted of the following:
• $105.4 million in losses, net, primarily associated with the sale of the Sheffield, UK business which was sold in May 2022 for a $112.2 million loss. This loss was partially offset by a gain on the sale of our Pico Rivera, CA operations.
• $23.7 million of costs associated with restructuring and other charges, consisting of a $28.5 million charge associated with the settlement of litigation related to the 2016 idling of the Rowley, UT titanium sponge facility, partially offset by severance-related reserve reductions based on changes in planned operating rates and revised workforce estimates.
•$100.3 million of pension remeasurement gains from the annual remeasurement of these plans in the fourth quarter of fiscal year 2022.
•$0.9 million of credits associated with restructuring activities at the A&T Stainless joint venture.
All of these items discussed are excluded from segment EBITDA and are included in operating income on the consolidated statements of operations, with the exception of the pension related gains and losses in fiscal years 2023 and 2022 as well as the litigation charge and the restructuring credit for the A&T Stainless joint venture in fiscal year 2022. Operating income was $466.4 million for fiscal year 2023, compared to $316.1 million for fiscal year 2022.
Nonoperating items included $79.7 million in nonoperating retirement benefit expense in fiscal year 2023, compared to income of $138.4 million in the prior year. Nonoperating retirement benefit expense/income includes the $41.7 million pension settlement loss in fiscal year 2023, as well as a $26.8 million pension remeasurement loss and $100.3 million pension remeasurement gain in fiscal years 2023 and 2022, respectively, discussed above. Other (nonoperating) income/expense in fiscal year 2022 includes the $28.5 million litigation charge and $0.9 million of credits associated with restructuring activities at the A&T Stainless joint venture discussed above. Other (nonoperating) income/expense in fiscal year 2022 also includes a $9.9 million benefit from the A&T Stainless joint venture’s settlement of Section 232 claims, which is included in AA&S segment results.
Results in fiscal year 2023 included a $128.2 million income tax benefit. As of December 31, 2023, we determined that we were no longer in a three year cumulative loss position and a substantial portion of our income tax valuation allowances were no longer required, resulting in a $140.3 million discrete tax benefit. Results for fiscal year 2022 included $15.5 million of income tax expense, primarily attributable to the Company’s foreign operations and state income tax expense associated with states that limit net operating loss utilization. Net income attributable to ATI was $410.8 million, or $2.81 per share, in fiscal year 2023, compared to $323.5 million, or $2.23 per share, for fiscal year 2022.
Adjusted EBITDA was $634.6 million, or 15.2% of sales, for fiscal year 2023, and $612.8 million, or 16.0% of sales, for fiscal year 2022. EBITDA and Adjusted EBITDA are measures utilized by ATI that we believe are useful to investors because these measures are commonly used to analyze companies on the basis of operating performance, leverage and liquidity. Furthermore, analogous measures are used by industry analysts to evaluate operating performance. EBITDA and Adjusted EBITDA are non-GAAP measures and are not intended to represent, and should not be considered more meaningful than, or as alternatives to, a measure of operating performance as determined in accordance with U.S. generally accepted accounting principles (U.S. GAAP). We categorically define EBITDA as income from continuing operations before interest and income taxes, plus depreciation and amortization, goodwill impairment charges and debt extinguishment charges. We categorically define Adjusted EBITDA as EBITDA excluding significant non-recurring charges or credits, restructuring charges/credits, strike related costs, long-lived asset impairments, pension remeasurement gains and losses, and other postretirement/pension curtailment and settlement gains and losses. EBITDA and Adjusted EBITDA are not intended to be measures of free cash flow for management’s discretionary use, as they do not consider certain cash requirements such as interest payments, tax payments and capital expenditures. See the Financial Condition and Liquidity section of Management’s Discussion and Analysis for a reconciliation of amounts reported under U.S. GAAP to these non-GAAP measures.
22
Fiscal Year 2022 Compared to Fiscal Year 2021
Results for fiscal year 2022 included sales of $3.84 billion and income before tax of $354.6 million, compared to sales of $2.80 billion and income before tax of $233.4 million in fiscal year 2021. Our gross profit in fiscal year 2022 was $714.2 million, or 18.6% of sales, a $381 million increase compared to fiscal year 2021, as the momentum in our core markets drove profitable growth across the enterprise. Results in fiscal year 2022 included $34 million of benefits from management actions to access available grants and other forms of COVID-19 relief available from previously-enacted U.S. legislation. These benefits included $17 million of a $22 million grant under the Aviation Manufacturing Jobs Protection (AMJP) program for our operations in the HPMC segment, which helped fund ongoing wage and benefit costs for a six-month period through May 2022, and $17 million in employee retention credits applicable across all of ATI’s domestic operations, largely for preserving jobs throughout the global pandemic-related economic downturn. Results for fiscal year 2022 also included $27.9 million of net pre-tax charges which consisted of the following:
•$105.4 million in losses, net, primarily associated with the sale of the Sheffield, UK business which was sold in May 2022 for a $112.2 million loss. This business is reported as part of the HPMC segment through the date of sale and had sales of $36 million and a net loss before tax of $7 million in fiscal year 2021. This loss was partially offset by a gain on the sale of our Pico Rivera, CA operations.
•$23.7 million of costs associated with restructuring and other charges, consisting of a $28.5 million charge associated with the settlement of litigation related to the 2016 idling of the Rowley, UT titanium sponge facility, partially offset by severance-related reserve reductions based on changes in planned operating rates and revised workforce estimates.
•$100.3 million of pension remeasurement gains from the annual remeasurement of these plans in the fourth quarter of fiscal year 2022.
•$0.9 million of credits associated with restructuring activities at the A&T stainless joint venture.
Results for fiscal year 2021 included $107.7 million of net pre-tax benefits which consisted of the following:
•$65.5 million debt extinguishment charge related to the redemption of our $500 million of 5.875% Senior Notes due 2023 (2023 notes).
•$63.2 million of strike-related costs arising from the 3 ½ month work stoppage by the USW, following expiration of a CBA, which began in March 2021, and predominantly impacted AA&S segment operations. A new CBA was ratified in July 2021. Strike-related costs primarily consisted of overhead costs recognized in the period due to below normal operating rates, higher costs for outside conversion activities, and signing bonuses for represented employees following CBA ratification.
•$64.9 million retirement benefit settlement gain for a plan termination that eliminated certain postretirement medical benefit liabilities as a result of the new USW CBA.
•$13.8 million gain on the sale of our Flowform Products business, which was sold for $55 million in cash in August 2021. This business is reported as part of the HPMC segment through the date of sale. Flowform Products’ sales were $26 million in fiscal year 2020.
•$10.5 million of net credits for restructuring and other charges, consisting of $11.3 million of restructuring credits primarily for a reduction in severance-related reserves based on changes in planned operating rates and revised workforce reduction estimates, partially offset by $0.8 million for inventory valuation reserves classified in cost of sales on the consolidated statement of operations.
•$147.2 million of pension remeasurement gains from the annual remeasurement of these plans in the fourth quarter of fiscal year 2021.
All of these items discussed above are excluded from segment EBITDA. The net loss on sale of the businesses in fiscal year 2022, restructuring charges/credits and strike-related costs are included in operating income on the consolidated statements of operations, which was $316.1 million for fiscal year 2022, compared to $117.6 million for fiscal year 2021.
Nonoperating items included $138.4 million in nonoperating retirement benefit income in fiscal year 2022, compared to income of $260.0 million in the prior year, reflecting the $100.3 million and $147.2 million of pension remeasurement gains in fiscal years 2022 and 2021, respectively, and the $64.9 million retirement benefit settlement gain in fiscal year 2021. Other (nonoperating) income/expense in fiscal year 2022 includes a $28.5 million litigation settlement charge discussed above partially offset by a $9.9 million benefit from the A&T Stainless joint venture’s settlement of Section 232 claims, which is included in AA&S segment results. Other (nonoperating) income/expense in fiscal year 2021 includes a $65.5 million debt extinguishment charge and the $13.8 million gain on the sale of the Flowform Products business discussed above.
23
Results for fiscal year 2022 included $15.5 million of income tax expense, primarily attributable to the Company’s foreign operations and state income tax expense associated with states that limit net operating loss utilization. ATI continued to maintain a valuation allowance on its U.S. deferred tax assets in fiscal year 2022. Results for fiscal year 2021 include $26.8 million of income tax expense, primarily for $15.5 million in discrete tax effects related to the retirement benefit settlement gain. Net income attributable to ATI was $323.5 million, or $2.23 per share, in fiscal year 2022, compared to a net income attributable to ATI of $184.6 million, or $1.32 per share, for fiscal year 2021.
Adjusted EBITDA was $612.8 million, or 16.0% of sales, for fiscal year 2022, and $366.5 million, or 13.1% of sales, for fiscal year 2021. EBITDA and Adjusted EBITDA are measures utilized by ATI that we believe are useful to investors because these measures are commonly used to analyze companies on the basis of operating performance, leverage and liquidity. Furthermore, analogous measures are used by industry analysts to evaluate operating performance. EBITDA and Adjusted EBITDA are non-GAAP measures and are not intended to represent, and should not be considered more meaningful than, or as alternatives to, a measure of operating performance as determined in accordance with U.S. generally accepted accounting principles (U.S. GAAP). We categorically define EBITDA as income from continuing operations before interest and income taxes, plus depreciation and amortization, goodwill impairment charges and debt extinguishment charges. We categorically define Adjusted EBITDA as EBITDA excluding significant non-recurring charges or credits, restructuring charges/credits, strike related costs, long-lived asset impairments, pension remeasurement gains and losses, and other postretirement/pension curtailment and settlement gains and losses. EBITDA and Adjusted EBITDA are not intended to be measures of free cash flow for management’s discretionary use, as they do not consider certain cash requirements such as interest payments, tax payments and capital expenditures. See the Financial Condition and Liquidity section of Management’s Discussion and Analysis for a reconciliation of amounts reported under U.S. GAAP to these non-GAAP measures.
Results by Business Segment
During fiscal year 2023, we operated in two business segments, HPMC and AA&S, and management evaluates financial results on this basis. Full fiscal year 2023 HPMC sales increased 29% compared to fiscal year 2022, as sales to the aerospace & defense markets in the HPMC segment were 36% higher than fiscal year 2022, due to improvements in the commercial aerospace market. Full fiscal year 2023 AA&S sales decreased 6% reflecting softness in general industrial end markets, offset by a 24% increase in the aerospace & defense markets. Full fiscal year 2022 HPMC sales increased 42% compared to fiscal year 2021, as a 58% increase in the aerospace and defense market sales was partially offset by a 17% decrease in sales to energy markets. Full fiscal year 2022 AA&S sales increased 33% compared to fiscal year 2021 reflecting the benefits of the transformation and the strength of the aerospace and defense markets.
24
Total segment EBITDA was $710.2 million, or 17.0% of sales, in fiscal year 2023, compared to total segment EBITDA of $678.7 million, or 17.7% of sales, in fiscal year 2022 and $417.1 million, or 14.9% of sales, in fiscal year 2021. Our measure of segment EBITDA, which we use to analyze the performance and results of our business segments, categorically excludes all effects of income taxes, depreciation and amortization, corporate expenses, net interest expense, closed operations and other expenses, charges for goodwill and asset impairments, restructuring and other charges, strike-related costs, pension remeasurement gains/losses, debt extinguishment charges and gains or losses on asset sales and sales of businesses. Results on our management basis of reporting were as follows (in millions):
| Fiscal Year Ended | ||||||||||||||||||||
| December 31, | January 1, | January 2, | ||||||||||||||||||
| 2023 | 2023* | 2022* | ||||||||||||||||||
| Sales: | ||||||||||||||||||||
| High Performance Materials & Components | $ | 2,120.2 | $ | 1,641.2 | $ | 1,155.1 | ||||||||||||||
| Advanced Alloys & Solutions | 2,053.5 | 2,194.8 | 1,644.7 | |||||||||||||||||
| Total external sales | $ | 4,173.7 | $ | 3,836.0 | $ | 2,799.8 | ||||||||||||||
| EBITDA: | ||||||||||||||||||||
| High Performance Materials & Components | $ | 433.6 | $ | 303.4 | $ | 170.3 | ||||||||||||||
| % of Sales | 20.5 | % | 18.5 | % | 14.7 | % | ||||||||||||||
| Advanced Alloys & Solutions | 276.6 | 375.3 | 246.8 | |||||||||||||||||
| % of Sales | 13.5 | % | 17.1 | % | 15.0 | % | ||||||||||||||
| Total segment EBITDA | 710.2 | 678.7 | 417.1 | |||||||||||||||||
| % of Sales | 17.0 | % | 17.7 | % | 14.9 | % | ||||||||||||||
| Corporate expenses | (62.3) | (60.3) | (53.7) | |||||||||||||||||
| Closed operations and other income (expenses) | (13.3) | (5.6) | 3.1 | |||||||||||||||||
| Total ATI Adjusted EBITDA | 634.6 | 612.8 | 366.5 | |||||||||||||||||
| Depreciation & amortization | (146.1) | (142.9) | (143.9) | |||||||||||||||||
| Interest expense, net | (92.8) | (87.4) | (96.9) | |||||||||||||||||
| Restructuring and other credits (charges) | (31.4) | (23.7) | 10.5 | |||||||||||||||||
| Strike related costs | — | — | (63.2) | |||||||||||||||||
| Retirement benefit settlement gain (loss) | (41.7) | — | 64.9 | |||||||||||||||||
| Pension remeasurement gain (loss) | (26.8) | 100.3 | 147.2 | |||||||||||||||||
| Joint venture restructuring credit | — | 0.9 | — | |||||||||||||||||
| Debt extinguishment charge | — | — | (65.5) | |||||||||||||||||
| Gains (losses) on asset sales and sale of business, net | (0.6) | (105.4) | 13.8 | |||||||||||||||||
| Income before income taxes | $ | 295.2 | $ | 354.6 | $ | 233.4 | ||||||||||||||
*Fiscal years ended January 1, 2023 and January 2, 2022 reflect the change in accounting principle as described in Note 1 of the Notes to the Consolidated Financial Statements.
As part of managing the performance of our business, we focus on controlling Managed Working Capital, which we define as gross accounts receivable, short-term contract assets and gross inventories, less accounts payable and short-term contract liabilities. We exclude the effects of inventory valuation reserves and reserves for uncollectible accounts receivable when computing this non-GAAP performance measure, which is not intended to replace Working Capital or to be used as a measure of liquidity. We assess Managed Working Capital performance as a percentage of the prior three months annualized sales to evaluate the asset intensity of our business. In fiscal year 2023, Managed Working Capital increased to 31.1% of annualized total ATI sales compared to 30.1% of annualized sales at January 1, 2023. The Managed Working Capital increase was impacted by increased inventory levels in fiscal year 2023 as a result of additional melt capacity coming on line and increased production levels. The $106.7 million increase in overall managed working capital in fiscal year 2023 is detailed in the table below. Days sales outstanding, which measures actual collection timing for accounts receivable, improved by 7% as of December 31, 2023 compared to fiscal year 2022. Gross inventory turns as of December 31, 2023 remained consistent with January 1, 2023 as continued efforts to focus on operational improvements are positively impacting the inventory intensity of our business and alleviating the required investment of managed working capital in our growing business.
25
The computations of Managed Working Capital at December 31, 2023 and January 1, 2023 reconciled to the financial statement line items as computed under U.S. GAAP, were as follows.
| (In millions) | December 31, 2023 | January 1, 2023 | ||||||||||||
| Accounts receivable | $ | 625.0 | $ | 579.2 | ||||||||||
| Short-term contract assets | 59.1 | 64.1 | ||||||||||||
| Inventory | 1,247.5 | 1,195.7 | ||||||||||||
| Accounts payable | (524.8) | (553.3) | ||||||||||||
| Short-term contract liabilities | (163.6) | (149.1) | ||||||||||||
| Subtotal | 1,243.2 | 1,136.6 | ||||||||||||
| Allowance for doubtful accounts | 3.2 | 7.7 | ||||||||||||
| Inventory reserves | 75.5 | 70.9 | ||||||||||||
| Managed working capital | $ | 1,321.9 | $ | 1,215.2 | ||||||||||
| Annualized prior 3 months sales | $ | 4,255.8 | $ | 4,041.9 | ||||||||||
| Managed working capital as a % of annualized sales | 31.1 | % | 30.1 | % | ||||||||||
| December 31, 2023 change in managed working capital | $ | 106.7 | ||||||||||||
Comparative information for our overall revenues (in millions) by end market, including divested businesses prior to sale, and their respective percentages of total revenues is as follows:
| Fiscal Year | ||||||||||||||||||||||||||||||||||||||
| Market | 2023 | 2022 | 2021 | |||||||||||||||||||||||||||||||||||
| Aerospace & Defense: | ||||||||||||||||||||||||||||||||||||||
| Jet Engines- Commercial | $ | 1,333.5 | 32 | % | $ | 1,063.5 | 28 | % | $ | 517.2 | 19 | % | ||||||||||||||||||||||||||
| Airframes- Commercial | 739.4 | 18 | % | 468.9 | 12 | % | 262.7 | 9 | % | |||||||||||||||||||||||||||||
| Defense | 401.9 | 9 | % | 341.2 | 9 | % | 352.8 | 13 | % | |||||||||||||||||||||||||||||
| Total Aerospace & Defense | 2,474.8 | 59 | % | 1,873.6 | 49 | % | 1,132.7 | 41 | % | |||||||||||||||||||||||||||||
| Energy: | ||||||||||||||||||||||||||||||||||||||
| Oil & Gas | 414.6 | 10 | % | 476.7 | 13 | % | 332.3 | 12 | % | |||||||||||||||||||||||||||||
| Specialty Energy | 273.2 | 7 | % | 276.6 | 7 | % | 259.6 | 9 | % | |||||||||||||||||||||||||||||
| Total Energy | 687.8 | 17 | % | 753.3 | 20 | % | 591.9 | 21 | % | |||||||||||||||||||||||||||||
| Automotive | 210.7 | 5 | % | 302.1 | 8 | % | 305.1 | 11 | % | |||||||||||||||||||||||||||||
| Medical | 176.9 | 4 | % | 163.1 | 4 | % | 131.5 | 5 | % | |||||||||||||||||||||||||||||
| Construction/Mining | 162.9 | 4 | % | 176.4 | 5 | % | 122.2 | 4 | % | |||||||||||||||||||||||||||||
| Electronics | 159.9 | 4 | % | 200.0 | 5 | % | 215.1 | 8 | % | |||||||||||||||||||||||||||||
| Food Equipment & Appliances | 71.9 | 2 | % | 158.5 | 4 | % | 153.1 | 5 | % | |||||||||||||||||||||||||||||
| Other | 228.8 | 5 | % | 209.0 | 5 | % | 148.2 | 5 | % | |||||||||||||||||||||||||||||
| Total | $ | 4,173.7 | 100 | % | $ | 3,836.0 | 100 | % | $ | 2,799.8 | 100 | % | ||||||||||||||||||||||||||
26
Comparative information for our major products, including divested businesses prior to sale, based on their percentages of revenues is as follows. Hot-Rolling and Processing Facility (HRPF) conversion service sales in the AA&S segment are excluded from this presentation.
| Fiscal Year | ||||||||||||||||||||
| 2023 | 2022 | 2021 | ||||||||||||||||||
| Nickel-based alloys and specialty alloys | 49 | % | 52 | % | 43 | % | ||||||||||||||
| Precision forgings, castings and components | 17 | % | 15 | % | 16 | % | ||||||||||||||
| Titanium and titanium-based alloys | 17 | % | 11 | % | 12 | % | ||||||||||||||
| PRS products | 10 | % | 14 | % | 19 | % | ||||||||||||||
| Zirconium and related alloys | 7 | % | 8 | % | 10 | % | ||||||||||||||
| Total | 100 | % | 100 | % | 100 | % | ||||||||||||||
Sales by geographic area (in millions), including divested businesses prior to sale, and as a percentage of total sales, were as follows:
| Fiscal Year | ||||||||||||||||||||||||||||||||||||||
| 2023 | 2022 | 2021 | ||||||||||||||||||||||||||||||||||||
| United States | $ | 2,250.8 | 54 | % | $ | 2,218.6 | 58 | % | $ | 1,534.9 | 55 | % | ||||||||||||||||||||||||||
| Europe | 1,051.0 | 25 | % | 785.2 | 20 | % | 475.1 | 17 | % | |||||||||||||||||||||||||||||
| Asia | 591.9 | 14 | % | 641.6 | 17 | % | 593.8 | 21 | % | |||||||||||||||||||||||||||||
| Canada | 111.0 | 3 | % | 87.4 | 2 | % | 75.9 | 3 | % | |||||||||||||||||||||||||||||
| Other | 169.0 | 4 | % | 103.2 | 3 | % | 120.1 | 4 | % | |||||||||||||||||||||||||||||
| Total sales | $ | 4,173.7 | 100 | % | $ | 3,836.0 | 100 | % | $ | 2,799.8 | 100 | % | ||||||||||||||||||||||||||
Information with respect to our business segments follows.
High Performance Materials & Components
| Fiscal Year | Fiscal Year | Fiscal Year | ||||||||||||||||||||||||||||||
| (In millions) | 2023 | % Change | 2022 | % Change | 2021 | |||||||||||||||||||||||||||
| Sales to external customers | $ | 2,120.2 | 29 | % | $ | 1,641.2 | 42 | % | $ | 1,155.1 | ||||||||||||||||||||||
| Segment EBITDA | $ | 433.6 | 43 | % | $ | 303.4 | 78 | % | $ | 170.3 | ||||||||||||||||||||||
| Segment EBITDA as a percentage of sales | 20.5 | % | 18.5 | % | 14.7 | % | ||||||||||||||||||||||||||
| International sales as a percentage of sales | 56.8 | % | 54.7 | % | 50.5 | % | ||||||||||||||||||||||||||
Our HPMC segment produces a wide range of high performance materials, including titanium and titanium-based alloys, nickel- and cobalt-based alloys and superalloys, advanced powder alloys and other specialty materials, in long product forms such as ingot, billet, bar, rod, wire, shapes and rectangles, and seamless tubes, plus precision forgings, components, and machined parts.
Fiscal Year 2023 Compared to Fiscal Year 2022
Sales of $2.12 billion for the HPMC segment in fiscal year 2023 increased 29% compared to fiscal year 2022, reflecting increasing commercial aerospace demand. Sales to the commercial aerospace market increased 39%, reflecting a 29% increase in commercial jet engines and 90% increase in airframe sales. Sales to the energy markets decreased 30%, due to both lower oil and gas and specialty energy sales.
27
Comparative information for our HPMC segment revenues (in millions) by market, the respective percentages of overall segment revenues for the fiscal years 2023 and 2022, and the percentage change in revenues by market for fiscal year 2023 is as follows:
| Fiscal Year | ||||||||||||||||||||||||||||||||||||||
| Market | 2023 | 2022 | Change | |||||||||||||||||||||||||||||||||||
| Aerospace & Defense: | ||||||||||||||||||||||||||||||||||||||
| Jet Engines- Commercial | $ | 1,255.3 | 59 | % | $ | 975.7 | 59 | % | $ | 279.6 | 29 | % | ||||||||||||||||||||||||||
| Airframes- Commercial | 350.6 | 17 | % | 184.1 | 11 | % | 166.5 | 90 | % | |||||||||||||||||||||||||||||
| Defense | 181.0 | 8 | % | 158.2 | 10 | % | 22.8 | 14 | % | |||||||||||||||||||||||||||||
| Total Aerospace & Defense | 1,786.9 | 84 | % | 1,318.0 | 80 | % | 468.9 | 36 | % | |||||||||||||||||||||||||||||
| Energy: | ||||||||||||||||||||||||||||||||||||||
| Oil & Gas | 10.6 | 1 | % | 35.0 | 2 | % | (24.4) | (70) | % | |||||||||||||||||||||||||||||
| Specialty Energy | 93.9 | 4 | % | 113.6 | 7 | % | (19.7) | (17) | % | |||||||||||||||||||||||||||||
| Total Energy | 104.5 | 5 | % | 148.6 | 9 | % | (44.1) | (30) | % | |||||||||||||||||||||||||||||
| Medical | 102.6 | 5 | % | 73.2 | 4 | % | 29.4 | 40 | % | |||||||||||||||||||||||||||||
| Construction/Mining | 35.0 | 2 | % | 34.1 | 2 | % | 0.9 | 3 | % | |||||||||||||||||||||||||||||
| Other | 91.2 | 4 | % | 67.3 | 5 | % | 23.9 | 36 | % | |||||||||||||||||||||||||||||
| Total | $ | 2,120.2 | 100 | % | $ | 1,641.2 | 100 | % | $ | 479.0 | 29 | % | ||||||||||||||||||||||||||
We utilize LTAs for our specialty materials, including powders, parts and components, with certain of our customers, including several aerospace market OEMs, to reduce their supply uncertainty. These LTAs, which are expected to drive HPMC’s growth trajectory for the next several years, cover sales of ATI’s specialty materials, parts and components used in both next-generation and legacy aircraft platforms, including jet engines. Our LTAs include a titanium products supply agreement for aircraft airframes and structural components with The Boeing Company (Boeing), which was extended in fiscal year 2021. This LTA covers value-added titanium products and provides opportunity for greater use of ATI’s next generation and advanced titanium alloys in both long product and flat-rolled product forms. The agreement includes both long-product forms that are manufactured within the HPMC segment, and a significant amount of plate products that are manufactured utilizing assets of both the HPMC and AA&S segments. Revenues and profits associated with these titanium products covered by the Boeing LTA are included primarily in the results for the HPMC segment.
We have LTAs with GE Aviation and Snecma (Safran) to supply premium titanium alloys, nickel-based alloys, and vacuum-melted specialty alloys products for commercial and military jet engine applications. In addition, we have LTAs with Rolls-Royce plc for the supply of disc-quality mill products and precision forgings for commercial jet engine applications. We also supply products to other important parts of the aviation market such as helicopters and rotary engine fixed wing aircraft.
New airframe designs contain a larger percentage of titanium alloys, and the jet engines that power them use newer nickel-based alloys and titanium-based alloys, in both cases for improved performance and more economical operating costs, compared to legacy airframe and engine designs. Boeing and Airbus continue to have multi-year backlogs of orders for both legacy models and next-generation aircraft, and there are over 28,000 jet engines with firm orders (Aero Engine News, December 2023). Due to manufacturing cycle times, demand for our specialty materials leads the deliveries of new aircrafts by approximately 6 to 12 months.
Use of these newer materials, particularly for jet engine applications, is expected to continue to increase for several years, with strong growth expected in powder metal alloys, including increased usage of iso-thermal forging and additive manufacturing production processes.
In addition, as our specialty materials are used in rotating components of jet engines, demand for our products for spare parts is impacted by aircraft flight activity and engine refurbishment requirements of U.S. and foreign aviation regulatory authorities. As the number of aircraft in service increases, the need for our materials associated with engine refurbishment is expected to increase.
28
Comparative information for HPMC’s major product categories based on their percentages of the segment’s overall revenue is as follows:
| Fiscal Year | ||||||||||||||
| 2023 | 2022 | |||||||||||||
| High-Value Products | ||||||||||||||
| Nickel-based alloys and specialty alloys | 44 | % | 49 | % | ||||||||||
| Precision forgings, castings and components | 33 | % | 34 | % | ||||||||||
| Titanium and titanium-based alloys | 22 | % | 17 | % | ||||||||||
| PRS products | 1 | % | — | % | ||||||||||
| Total High-Value Products | 100 | % | 100 | % | ||||||||||
HPMC segment EBITDA for fiscal year 2023 increased 43% to $433.6 million, or 20.5% of sales, compared to $303.4 million, or 18.5% of sales, in fiscal year 2022. Strength in the HPMC segment continues to be driven by increased volumes on higher margin next-generation commercial aerospace platforms. Results in fiscal year 2022 include $27.5 million of benefits from the AMJP program and employee retention credits.
HPMC results for fiscal year 2023, which included the highest quarterly EBITDA margins in the third quarter of fiscal year 2023 since prior to the COVID-19 pandemic, reflect improving operating leverage from higher production volumes as the aerospace and defense markets continue to grow. We are seeing an ongoing improvement in demand in many of our key end markets, most notably in commercial aerospace. Increasing demand for travel benefits ATI, and we believe we are well positioned to capture this growth in the future. We are investing in additional capacity to meet growing demand, including our recently announced expansion in Richland, Washington, so that we are well-positioned to capitalize on market opportunities. We also continue to invest and adjust work-flow processes to de-bottleneck our critical operations. As we closed out fiscal year 2023, backlog and customer agreements continued to build, putting this segment in a position to grow in fiscal year 2024 as we continue to deliver through LTAs and emergent market opportunities. We believe that our HPMC segment is well-positioned for profitable growth from the ramp in commercial aerospace demand, especially in jet engine platforms where LTAs provide significant growth and share gains for ATI on next-generation airplanes and the jet engines that power them.
Fiscal Year 2022 Compared to Fiscal Year 2021
Sales of $1.64 billion for the HPMC segment in fiscal year 2022 increased 42% compared to fiscal year 2021. Sales to the aerospace & defense markets, which were 80% of fiscal year 2022 HPMC sales, were 58% higher, reflecting an 89% increase in commercial aerospace sales, partially offset by a 29% decrease in defense sales. Sales of next generation jet engine products represented 54% of total fiscal year 2022 HPMC jet engine product sales and were 131% higher than fiscal year 2021 levels. In May 2022, we sold our Sheffield, UK operations, which included facilities for melting and re-melting, machining and bar mill operations, and had $36 million in sales in fiscal year 2021. This business was reported as part of the HPMC segment through the date of sale.
29
Comparative information for our HPMC segment revenues (in millions) by market, the respective percentages of overall segment revenues for the fiscal years 2022 and 2021, and the percentage change in revenues by market for fiscal year 2022 is as follows:
| Fiscal Year | ||||||||||||||||||||||||||||||||||||||
| Market | 2022 | 2021 | Change | |||||||||||||||||||||||||||||||||||
| Aerospace & Defense: | ||||||||||||||||||||||||||||||||||||||
| Jet Engines- Commercial | $ | 975.7 | 59 | % | $ | 480.9 | 42 | % | $ | 494.8 | 103 | % | ||||||||||||||||||||||||||
| Airframes- Commercial | 184.1 | 11 | % | 132.8 | 11 | % | 51.3 | 39 | % | |||||||||||||||||||||||||||||
| Defense | 158.2 | 10 | % | 221.8 | 19 | % | (63.6) | (29) | % | |||||||||||||||||||||||||||||
| Total Aerospace & Defense | 1,318.0 | 80 | % | 835.5 | 72 | % | 482.5 | 58 | % | |||||||||||||||||||||||||||||
| Energy: | ||||||||||||||||||||||||||||||||||||||
| Oil & Gas | 35.0 | 2 | % | 42.2 | 3 | % | (7.2) | (17) | % | |||||||||||||||||||||||||||||
| Specialty Energy | 113.6 | 7 | % | 136.1 | 12 | % | (22.5) | (17) | % | |||||||||||||||||||||||||||||
| Total Energy | 148.6 | 9 | % | 178.3 | 15 | % | (29.7) | (17) | % | |||||||||||||||||||||||||||||
| Medical | 73.2 | 4 | % | 60.3 | 5 | % | 12.9 | 21 | % | |||||||||||||||||||||||||||||
| Construction/Mining | 34.1 | 2 | % | 24.0 | 2 | % | 10.1 | 42 | % | |||||||||||||||||||||||||||||
| Other | 67.3 | 5 | % | 57.0 | 6 | % | 10.3 | 18 | % | |||||||||||||||||||||||||||||
| Total | $ | 1,641.2 | 100 | % | $ | 1,155.1 | 100 | % | $ | 486.1 | 42 | % | ||||||||||||||||||||||||||
Comparative information for HPMC’s major product categories based on their percentages of the segment’s overall revenue is as follows:
| Fiscal Year | ||||||||||||||
| 2022 | 2021 | |||||||||||||
| High-Value Products | ||||||||||||||
| Nickel-based alloys and specialty alloys | 49 | % | 43 | % | ||||||||||
| Precision forgings, castings and components | 34 | % | 38 | % | ||||||||||
| Titanium and titanium-based alloys | 17 | % | 19 | % | ||||||||||
| Total High-Value Products | 100 | % | 100 | % | ||||||||||
HPMC segment EBITDA for fiscal year 2022 increased 78% to $303.4 million, or 18.5% of sales, compared to $170.3 million, or 14.7% of sales, in fiscal year 2021, reflecting an improved product mix and benefits from increased operating levels. Stronger operating margins reflect higher sales of next-generation jet engine products and higher facility utilization levels. HPMC’s full fiscal year 2022 sales associated with next-generation platforms were in line with full fiscal year 2019 deliveries. Results in fiscal year 2022 include $27.5 million of benefits from the AMJP program and employee retention credits, partially offset by labor and other costs related to ramp readiness. Strike-related costs of $3.5 million were excluded from HPMC fiscal year 2021 results.
Advanced Alloys & Solutions
| Fiscal Year | Fiscal Year | Fiscal Year | ||||||||||||||||||||||||||||||
| (In millions) | 2023 | % Change | 2022 | % Change | 2021 | |||||||||||||||||||||||||||
| Sales to external customers | $ | 2,053.5 | (6) | % | $ | 2,194.8 | 33 | % | $ | 1,644.7 | ||||||||||||||||||||||
| Segment EBITDA | $ | 276.6 | (26) | % | $ | 375.3 | 52 | % | $ | 246.8 | ||||||||||||||||||||||
| Segment EBITDA as a percentage of sales | 13.5 | % | 17.1 | % | 15.0 | % | ||||||||||||||||||||||||||
| International sales as a percentage of sales | 35.0 | % | 32.8 | % | 41.4 | % | ||||||||||||||||||||||||||
Fiscal Year 2023 Compared to Fiscal Year 2022
Sales of $2.05 billion for the AA&S segment in fiscal year 2023 decreased 6% compared to fiscal year 2022, reflecting softness in general industrial end markets. Sales to the aerospace & defense markets increased 24%, with a 25% increase in sales of commercial aerospace products, due to a significant increase in commercial airframe demand for various flat-rolled product forms.
30
Comparative information for our AA&S segment revenues (in millions) by market, the respective percentages of overall segment revenues, for the fiscal years 2023 and 2022, and the percentage change in revenues by market for fiscal year 2023 is as follows:
| Fiscal Year | ||||||||||||||||||||||||||||||||||||||
| Market | 2023 | 2022 | Change | |||||||||||||||||||||||||||||||||||
| Aerospace & Defense: | ||||||||||||||||||||||||||||||||||||||
| Jet Engines- Commercial | 78.2 | 4 | % | 87.8 | 4 | % | (9.6) | (11) | % | |||||||||||||||||||||||||||||
| Airframes- Commercial | 388.8 | 19 | % | 284.8 | 13 | % | 104.0 | 37 | % | |||||||||||||||||||||||||||||
| Defense | 220.9 | 11 | % | 183.0 | 8 | % | 37.9 | 21 | % | |||||||||||||||||||||||||||||
| Total Aerospace & Defense | 687.9 | 34 | % | 555.6 | 25 | % | 132.3 | 24 | % | |||||||||||||||||||||||||||||
| Energy: | ||||||||||||||||||||||||||||||||||||||
| Oil & Gas | 404.0 | 20 | % | 441.7 | 20 | % | (37.7) | (9) | % | |||||||||||||||||||||||||||||
| Specialty Energy | 179.3 | 8 | % | 163.0 | 8 | % | 16.3 | 10 | % | |||||||||||||||||||||||||||||
| Total Energy | 583.3 | 28 | % | 604.7 | 28 | % | (21.4) | (4) | % | |||||||||||||||||||||||||||||
| Automotive | 186.1 | 9 | % | 290.9 | 13 | % | (104.8) | (36) | % | |||||||||||||||||||||||||||||
| Electronics | 156.8 | 8 | % | 197.6 | 9 | % | (40.8) | (21) | % | |||||||||||||||||||||||||||||
| Construction/Mining | 127.9 | 6 | % | 142.3 | 7 | % | (14.4) | (10) | % | |||||||||||||||||||||||||||||
| Medical | 74.3 | 4 | % | 89.9 | 4 | % | (15.6) | (17) | % | |||||||||||||||||||||||||||||
| Food Equipment & Appliances | 71.9 | 3 | % | 158.3 | 7 | % | (86.4) | (55) | % | |||||||||||||||||||||||||||||
| Other | 165.3 | 8 | % | 155.5 | 7 | % | 9.8 | 6 | % | |||||||||||||||||||||||||||||
| Total | $ | 2,053.5 | 100 | % | $ | 2,194.8 | 100 | % | $ | (141.3) | (6) | % | ||||||||||||||||||||||||||
Our AA&S segment produces zirconium and related alloys including hafnium and niobium, nickel-based alloys, titanium and titanium-based alloys, and specialty alloys in a variety of forms including plate, sheet, and PRS products. AA&S also provides hot-rolling conversion services at its HRPF, including carbon steel products under several LTAs.
Comparative information for the AA&S segment’s major product categories, based on their percentages of revenue are presented in the following table. HRPF conversion service sales are excluded from this presentation.
| Fiscal Year | ||||||||||||||
| 2023 | 2022 | |||||||||||||
| Nickel-based alloys and specialty alloys | 54 | % | 54 | % | ||||||||||
| PRS products | 19 | % | 25 | % | ||||||||||
| Zirconium and related alloys | 15 | % | 14 | % | ||||||||||
| Titanium and titanium-based alloys | 12 | % | 7 | % | ||||||||||
| Total | 100 | % | 100 | % | ||||||||||
Segment EBITDA was $276.6 million, or 13.5% of sales, a 26% decrease from segment EBITDA of $375.3 million, or 17.1% of sales, in fiscal year 2022. A stronger mix of titanium mill products was offset by weaker demand for PRS products and higher retirement benefit expense, which contributed to the margin decline year over year. The fiscal year 2022 segment EBITDA includes a $9.9 million benefit from the A&T Stainless joint venture’s settlement of Section 232 tariff claims and $6.8 million of employee retention credits.
With the AA&S business transformation and footprint consolidation complete, we believe we are well positioned for future growth. We expect margin expansion for this segment in fiscal year 2024 with a richer sales mix, recovery in industrial demand and improving operating performance. Sales of commercial airframe flat-form products in the AA&S segment are projected to increase over the longer term due in part to the repositioning of the commercial aerospace supply chain in response to the Russia/Ukraine conflict. With our titanium melt shop in Albany, Oregon fully operational in the third quarter of fiscal year 2023, we are well positioned to capitalize on the aerospace ramp. The modest investment to restart this facility in Albany, Oregon has helped significantly expand our titanium melt capacity. With customer commitments for ATI titanium being so strong, we are continuing to invest in additional capacity at this facility, bringing online a fourth furnace. We are on-track to ramp capacity of the fourth furnace in the first half of fiscal year 2024, reaching a full run-rate in the second half of fiscal year 2024. We continue to right-size our costs to offset the demand softness in markets other than aerospace & defense. While
31
availability of raw materials for our melting processes remains adequate during the ongoing Russia/Ukraine conflict, changes in raw material prices may cause variability in profit margins based on the timing of index pricing mechanisms.
Fiscal Year 2022 Compared to Fiscal Year 2021
Sales of $2.19 billion for the AA&S segment in fiscal year 2022 increased 33% compared to fiscal year 2021. The fiscal year 2021 period included impacts from a labor strike that ended in mid-July 2021, which reduced sales in that period. The segment had increased sales to almost all end markets, including an 87% increase in aerospace & defense market sales. In July 2022, ATI announced a new LTA with GKN Aerospace for titanium sheet and plate products for commercial and military airframes. Energy markets sales also increased 46% for both specialty energy and oil & gas applications. Fiscal year 2022 sales of nickel based alloys and specialty steels increased by 67% compared to fiscal year 2021. Additionally, fiscal year 2022 sales of titanium and titanium-based alloys increased by 41% compared to fiscal year 2021.
Comparative information for our AA&S segment revenues (in millions) by market, the respective percentages of overall segment revenues, for the fiscal years 2022 and 2021, and the percentage change in revenues by market for fiscal year 2022 is as follows:
| Fiscal Year | ||||||||||||||||||||||||||||||||||||||
| Market | 2022 | 2021 | Change | |||||||||||||||||||||||||||||||||||
| Energy: | ||||||||||||||||||||||||||||||||||||||
| Oil & Gas | $ | 441.7 | 20 | % | $ | 290.1 | 18 | % | $ | 151.6 | 52 | % | ||||||||||||||||||||||||||
| Specialty Energy | 163.0 | 8 | % | 123.5 | 7 | % | 39.5 | 32 | % | |||||||||||||||||||||||||||||
| Total Energy | 604.7 | 28 | % | 413.6 | 25 | % | 191.1 | 46 | % | |||||||||||||||||||||||||||||
| Aerospace & Defense: | ||||||||||||||||||||||||||||||||||||||
| Jet Engines- Commercial | 87.8 | 4 | % | 36.3 | 2 | % | 51.5 | 142 | % | |||||||||||||||||||||||||||||
| Airframes- Commercial | 284.8 | 13 | % | 129.9 | 8 | % | 154.9 | 119 | % | |||||||||||||||||||||||||||||
| Defense | 183.0 | 8 | % | 131.0 | 8 | % | 52.0 | 40 | % | |||||||||||||||||||||||||||||
| Total Aerospace & Defense | 555.6 | 25 | % | 297.2 | 18 | % | 258.4 | 87 | % | |||||||||||||||||||||||||||||
| Automotive | 290.9 | 13 | % | 296.4 | 18 | % | (5.5) | (2) | % | |||||||||||||||||||||||||||||
| Electronics | 197.6 | 9 | % | 213.9 | 13 | % | (16.3) | (8) | % | |||||||||||||||||||||||||||||
| Food Equipment & Appliances | 158.3 | 7 | % | 153.0 | 10 | % | 5.3 | 3 | % | |||||||||||||||||||||||||||||
| Construction/Mining | 142.3 | 7 | % | 98.2 | 6 | % | 44.1 | 45 | % | |||||||||||||||||||||||||||||
| Medical | 89.9 | 4 | % | 71.2 | 4 | % | 18.7 | 26 | % | |||||||||||||||||||||||||||||
| Other | 155.5 | 7 | % | 101.2 | 6 | % | 54.3 | 54 | % | |||||||||||||||||||||||||||||
| Total | $ | 2,194.8 | 100 | % | $ | 1,644.7 | 100 | % | $ | 550.1 | 33 | % | ||||||||||||||||||||||||||
Comparative information for the AA&S segment’s major product categories, based on their percentages of revenue are presented in the following table. HRPF conversion service sales are excluded from this presentation.
| Fiscal Year | ||||||||||||||
| 2022 | 2021 | |||||||||||||
| Nickel-based alloys and specialty alloys | 54 | % | 44 | % | ||||||||||
| PRS products | 25 | % | 33 | % | ||||||||||
| Zirconium and related alloys | 14 | % | 17 | % | ||||||||||
| Titanium and titanium-based alloys | 7 | % | 6 | % | ||||||||||
| Total | 100 | % | 100 | % | ||||||||||
Segment EBITDA was $375.3 million, or 17.1% of sales, a 52% increase from segment EBITDA of $246.8 million, or 15.0% of sales, in fiscal year 2021. Results reflect a stronger product mix of nickel-alloy mill products as we completed our exit from production of standard stainless products. Increased sales of exotic materials from our Specialty Alloys & Components business and improved operating performance also drove AA&S segment EBITDA margin growth. The fiscal year 2022 segment EBITDA includes a $9.9 million benefit from the A&T Stainless joint venture’s settlement of Section 232 tariff claims and $6.8 million of employee retention credits, partially offset by labor and other costs related to ramp readiness. Strike related
32
costs of $59.7 million, primarily related to lower productivity and utilization levels, were excluded from AA&S segment fiscal year 2021 results.
Corporate Expenses
Corporate expenses, which are primarily included in selling and administrative expenses in the statement of operations, were $62.3 million in fiscal year 2023 compared to $60.3 million in fiscal year 2022 and $53.7 million in fiscal year 2021. Increased expenses in fiscal years 2023 and 2022 compared to fiscal year 2021 reflect business transformation initiatives and higher incentive compensation costs.
Closed Operations and Other Expenses
Closed operations and other expenses are presented primarily in selling and administrative expenses in the consolidated statements of operations, and include legal, environmental, retirement benefit and insurance obligations associated with closed operations. Closed operations and other expenses were $13.3 million in fiscal year 2023, compared to $5.6 million of expense in fiscal year 2022 and $3.1 million of income in fiscal year 2021. The increase in fiscal year 2023 reflects higher retirement benefit expense and higher insurance costs associated with an outstanding insurance claim involving our captive insurance company compared to prior year periods.
Depreciation and Amortization
The following table shows depreciation & amortization for the relevant periods by each business segment. Depreciation expense in fiscal year 2023 includes $3.8 million of accelerated depreciation of fixed assets related to the restructuring of our European operations and the closure of our Robinson, PA operations.
| Fiscal Year | ||||||||||||||||||||
| (In millions) | 2023 | 2022 | 2021 | |||||||||||||||||
| Depreciation and amortization: | ||||||||||||||||||||
| High Performance Materials & Components | $ | 71.1 | $ | 68.3 | $ | 75.0 | ||||||||||||||
| Advanced Alloys & Solutions | 67.9 | 67.4 | 64.5 | |||||||||||||||||
| Other | 7.1 | 7.2 | 4.4 | |||||||||||||||||
| $ | 146.1 | $ | 142.9 | 143.9 | ||||||||||||||||
Interest Expense, Net
Interest expense, net of interest income and interest capitalization, was $92.8 million in fiscal year 2023, compared to $87.4 million in fiscal year 2022 and $96.9 million in fiscal year 2021. The increase in fiscal year 2023 compared to fiscal year 2022 reflects the issuance of the 2030 Notes during the third quarter of fiscal year 2023. The decrease in interest expense in fiscal year 2022 compared to fiscal year 2021 was in part due to the conversion of $82.5 million of the 4.75% Convertible Senior Notes due 2022 (2022 Notes) to 5.7 million shares of ATI stock on the July 1, 2022 maturity date of the 2022 Notes. Further, interest expense is presented net of interest income of $13.0 million in fiscal year 2023, $4.7 million in fiscal year 2022 and $0.7 million in fiscal year 2021. Interest expense in fiscal years 2023, 2022 and 2021 was reduced by $13.5 million, $5.1 million and $4.3 million, respectively, related to interest capitalization on major strategic capital projects.
Restructuring and Other Charges/Credits
For the year ended December 31, 2023, restructuring and other charges were $31.4 million, which are excluded from segment results. These charges include $7.7 million of severance-related restructuring charges and $23.7 million of charges included within cost of sales on the consolidated statements of operations. The $7.7 million of severance-related restructuring charges represent severance for the involuntary reduction of approximately 110 employees primarily for the restructuring of our European operations and across ATI’s domestic operations in conjunction with the continued transformation. The $23.7 million of charges within cost of sales include $11.5 million of start-up costs, $1.9 million of costs associated with an unplanned outage at our Lockport, NY facility, and $10.3 million primarily for asset write-offs for the restructuring of our European operations and the closure of our Robinson, PA operations. Cash payments associated with prior restructuring programs were $2.3 million in fiscal year 2023. Of the $15.2 million of remaining reserves associated with these restructuring actions as of December 31, 2023, $10.9 million are expected to be paid within the next fiscal year.
33
For the fiscal year ended January 1, 2023, restructuring and other charges were $23.7 million, which are excluded from segment results. These charges consisted primarily of $28.5 million of costs associated with the settlement of litigation related to the 2016 idling of the Rowley, UT titanium sponge facility, partially offset by $4.8 million of restructuring credits for reductions in severance-related reserves related to approximately 110 employees based on changes in planned operating rates and revised workforce estimates.
For the fiscal year ended January 2, 2022, restructuring and other charges were a net credit of $10.5 million, which is excluded from segment results. This $10.5 million net credit consisted primarily of $11.3 million of restructuring credits on the consolidated statement of operations, reflecting a $12.0 million reduction in severance-related reserves for approximately 350 employees based on changes in planned operating rates and revised workforce reduction estimates, partially offset by $0.7 million of other costs related to facility idlings and a $0.8 million charge for inventory valuation reserves, classified in cost of sales on the consolidated statement of operations, primarily related to excess raw material and work in process inventory at the idled Albany, OR primary titanium facility.
In addition, the A&T Stainless joint venture recorded a $1.8 million credit in fiscal year 2022 for the reversal of restructuring reserves as a result of revised estimates, and ATI recognized a $0.9 million credit in fiscal year 2022 for its equity method share of these reversals. These charges are excluded from segment operating results.
Strike Related Costs
Strike related costs were $63.2 million in fiscal year 2021, of which $59.7 million were excluded from AA&S segment EBITDA and $3.5 million were excluded from HPMC segment EBITDA. These items primarily consisted of overhead costs recognized in the period due to below-normal operating rates, higher costs for outside conversion activities, and signing bonuses for represented employees.
Pension Remeasurement Gains and Losses
During the fourth quarter of fiscal year 2023, we voluntarily changed the method of accounting for recognizing actuarial gains and losses for our defined benefit pension plans. Under the accounting method change, remeasurement of projected benefit obligation and plan assets for defined benefit pension plans are immediately recognized in earnings through net periodic pension benefit cost. Therefore, as a result of the remeasurements of these plans in the fourth quarter of each fiscal year, we recognized a $26.8 million pension remeasurement loss in fiscal year 2023 and $100.3 million and $147.2 million of pension remeasurement gains in fiscal years 2022 and 2021, respectively, which is excluded from segment EBITDA and recorded in nonoperating retirement benefit income/expense on the consolidated statements of operations.
Retirement Benefit Settlement Gains and Losses
On October 17, 2023, we completed a voluntary cash out for term vested employees and a large annuity buyout related to approximately 8,200 U.S. qualified defined benefit pension plan participants. As a result of the annuity buyout, ATI recognized a $41.7 million pretax settlement loss, which is excluded from segment EBITDA and recorded in nonoperating retirement benefit income/expense on the consolidated statement of operations.
ATI’s fiscal year 2021 results include a $64.9 million retirement benefit settlement gain related to a plan termination that eliminated certain postretirement medical benefit liabilities. This was effective upon the July 2021 ratification of the new USW CBA. This gain, which is recorded in nonoperating retirement benefit income/expense on the consolidated statement of operations and is excluded from segment EBITDA, was comprised of $43.0 million of long-term postretirement benefit liabilities as of July 2021 and $21.9 million of amounts recorded in accumulated other comprehensive income at that date.
Debt Extinguishment Charge
In fiscal year 2021, ATI recognized a $65.5 million debt extinguishment charge on the redemption of the 5.875% Senior Notes due 2023 (2023 Notes), which included a $64.5 million cash make-whole payment related to the early extinguishment of the 2023 Notes as required by the applicable indenture, and a $1.0 million charge for deferred debt issue costs.
34
Gains/Loss on Asset Sales and Sale of Business, Net
Loss on asset sales and sales of businesses for fiscal year 2023 is related to a $0.6 million loss on the sale of our Northbrook, IL operations, which is excluded from segment EBITDA.
On May 12, 2022, we completed the sale of our Sheffield, UK operations and recognized a loss in fiscal year 2022 on sale of $112.2 million. The Sheffield, UK operations were previously part of the Specialty Materials business in the HPMC segment. The loss on sale is reported in loss on asset sales and sales of businesses, net, on the consolidated statement of operations and is excluded from HPMC segment results. The loss includes $26.8 million related to the UK defined benefit pension plan, of which $26.1 million was reported as a net pension asset but which was in a deficit funding position for UK statutory reporting purposes, and $0.7 million in accumulated other comprehensive loss on the consolidated ATI balance sheet. The loss also includes $20.0 million of cumulative translation adjustment foreign exchange losses since ATI’s acquisition of these operations in 1998.
Also in fiscal year 2022, we completed the sale of the Pico Rivera, CA operations as part of the strategy to exit standard stainless products. We received cash proceeds of $6.2 million on the sale of these assets. We recognized a $6.8 million pretax gain on sale, including de-recognizing certain lease liabilities, which is reported in loss on asset sales and sales of businesses, net, on the consolidated statement of operations and is excluded from AA&S segment results.
In fiscal year 2021, we completed the sale of our Flowform Products business within the HPMC segment for $55.0 million, and recognized a $13.8 million gain. This gain is recorded in nonoperating income/expense on the consolidated statement of operations and is excluded from segment EBITDA.
Income Taxes
Since fiscal year 2020, ATI’s U.S. operations were in a three-year cumulative loss position, limiting the ability to utilize future projections as verifiable sources of income when analyzing the need for a valuation allowance. This cumulative loss continued until fiscal year 2023 when ATI exited the three-year cumulative loss position and we concluded it was appropriate to consider future projections as a source of income when analyzing the need for a valuation allowance.
In fiscal year 2023, the income tax benefit of $128.2 million was associated with the valuation allowance due to the current year income for the U.S. operations and an additional benefit of $140.3 million was recorded related to the valuation allowance release associated with ATI’s ability to utilize projections for future income. We continue to have minimal cash tax requirements in the U.S. due to the ongoing benefits of net operating loss tax carryforwards.
Results in fiscal years 2022 and 2021 include impacts from income taxes that differ from applicable standard tax rates, primarily related to income tax valuation allowances. The provision for income taxes for fiscal year 2022 was $15.5 million, which was primarily related to our profitable PRS joint venture in China. The provision for income taxes for fiscal year 2021 was $26.8 million, which was primarily attributable to the $15.5 million in discrete tax effects related to the postretirement medical benefits gain discussed above, in accordance with ATI’s accounting policy for recognizing deferred tax amounts stranded in accumulated other comprehensive income.
In 2021, the Organization for Economic Co-operation and Development (OECD) released guidance relating to a 15% global minimum tax known as Pillar Two Tax. Various governments are in the process of enacting the Pillar Two Tax. We are in the process of assessing the tax effects of Pillar Two for the various jurisdictions in which we operate and if triggered will treat the cost as a period cost. Currently, we believe that the enactment of Pillar Two will not materially impact our effective tax rate or cash flow, but we will continue to monitor and evaluate as countries release legislation, which could change our current assessment.
Financial Condition and Liquidity
We have an Asset Based Lending (ABL) Credit Facility, which is collateralized by the accounts receivable and inventory of our operations. The ABL facility also provides us with the option of including certain machinery and equipment as additional collateral for purposes of determining availability under the facility. The ABL facility, which matures in September 2027, includes a $600 million revolving credit facility, a letter of credit sub-facility of up to $200 million, a $200 million term loan (ABL Term Loan), and a swing loan facility of up to $60 million. The ABL Term Loan can be prepaid in increments of $25 million if certain minimum liquidity conditions are satisfied. In addition, we have the right to request an increase of up to $300 million under the revolving credit facility for the duration of the ABL.
As of December 31, 2023, there were no outstanding borrowings under the revolving credit portion of the ABL, and $31.7 million was utilized to support the issuance of letters of credit. There were average revolving credit borrowings of $13 million
35
bearing an average annual interest rate of 6.5% under the ABL during fiscal year 2023. There were no revolving credit borrowings under the ABL during fiscal year 2022.
The ABL Term Loan has an interest rate of 2.0% above adjusted Secured Overnight Financing Rate (SOFR). The applicable interest rate for revolving credit borrowings under the ABL facility includes interest rate spreads based on available borrowing capacity that range between 1.25% and 1.75% for SOFR-based borrowings and between 0.25% and 0.75% for base rate borrowings.
The ABL facility contains a financial covenant whereby we must maintain a fixed charge coverage ratio of not less than 1.00:1.00 after an event of default has occurred and is continuing or if the undrawn availability under the ABL revolving credit portion of the facility is less than the greater of (i) 10% of the then applicable maximum loan amount under the revolving credit portion of the ABL and the outstanding ABL Term Loan balance, or (ii) $60.0 million. We were in compliance with the fixed charge coverage ratio as of December 31, 2023. On September 9, 2022, the Company amended and restated the ABL and costs associated with entering into this amendment were $2.4 million, and are being amortized to interest expense over the term of the facility ending September 2027, along with $1.7 million of unamortized deferred costs previously recorded for the ABL.
In August 2023, we issued $425 million aggregate principal amount of 7.25% Senior Notes due 2030 (2030 Notes). Underwriting fees and other third-party expenses for the issuance of the 2030 Notes were $6.2 million, and are being amortized to interest expense over the 7-year term of the 2030 Notes. Net proceeds were $418.8 million from this issuance, of which $222 million was used to fund ATI’s U.S. qualified defined benefit pension plan in order to facilitate a pension derisking strategy (see below for further explanation), and the remaining proceeds were used for liquidity and general corporate purposes.
During the second quarter of fiscal year 2022, $82.5 million of the 2022 Notes were converted into 5.7 million shares of ATI common stock, with the remaining $1.7 million of outstanding principal balance paid in cash for notes that were not converted.
On September 14, 2021, ATI issued $325 million aggregate principal amount of 4.875% Senior Notes due 2029 (2029 Notes) and $350 million aggregate principal amount of 5.125% Senior Notes due 2031 (2031 Notes). Underwriting fees and other third-party expenses for the issuance of the 2029 and 2031 Notes were each $4.7 million, and are being amortized to interest expense over the 8-year and 10-year terms of the 2029 and 2031 Notes, respectively. Total combined net proceeds of $665.7 million from both of these issuances were primarily used to fund the full redemption of the $500 million aggregate principal amount outstanding of the 2023 Notes on October 14, 2021, including a make-whole payment and accrued interest, resulting in a $65.5 million debt extinguishment charge, which includes a $64.5 million cash make-whole payment related to the early extinguishment of the 2023 Notes and a $1.0 million charge for the remaining unrecognized portion of the 2023 Notes deferred debt issue costs.
At December 31, 2023, we had $744 million of cash and cash equivalents, and available additional liquidity from the undrawn capacity under the ABL facility of approximately $530 million, for total liquidity of approximately $1.3 billion. We expect to have minimal cash tax requirements in the U.S. in fiscal year 2024 due to the ongoing benefits of net operating loss tax carryforwards.
During fiscal year 2021, we received approximately $53 million in cash, net of transaction costs and net working capital adjustments, for the sale of the Flowform Products business.
In the first quarter of fiscal year 2023, we made $50 million in voluntary cash contributions to our U.S. qualified defined benefit pension plans to improve the plans’ funded position, and in the third quarter of fiscal year 2023, we made an additional $222 million in voluntary cash contributions to our U.S. qualified defined benefit pension plan to facilitate our pension derisking strategy. In October 2023, we purchased group annuity contracts from an insurer covering approximately 85% of our U.S. qualified defined benefit pension plan obligations. Under these contracts, we transferred the pension obligations and associated assets for approximately 8,200 plan participants to the selected insurance company. After these actions, our U.S. qualified defined benefit plan includes approximately 1,980 participants. Based on current actuarial assumptions, we are not required to make any contributions to our pension plan during fiscal year 2024. Using our long-term weighted average expected rate of return on pension plan assets and other actuarial assumptions, we do not expect to have any significant minimum cash funding requirements to the defined benefit pension plan for at least the next ten years. However, these funding estimates are subject to significant uncertainty including the actual pension trust assets’ fair value, and the discount rates used to measure pension liabilities.
In February 2022 and April 2023, our Board of Directors authorized the repurchase of up to $150 million and $75 million, respectively, of ATI stock. In fiscal year 2023, ATI used $85.2 million to repurchase 2.0 million shares of its common stock under both programs. In fiscal year 2022, ATI used $139.9 million to repurchase 5.2 million shares of its common stock under the $150 million program. As of December 31, 2023, the total share repurchase authorization under these two programs was utilized. In November 2023, our Board of Directors authorized the repurchase of an additional $150 million of ATI stock. Repurchases under these programs were or may be made in the open market or in privately negotiated transactions, with the amount and timing of repurchases depending on market conditions and corporate needs. Open market repurchases are structured to occur within the pricing and volume requirements of SEC Rule 10b-18. The Company’s ongoing stock repurchase
36
programs do not obligate the Company to repurchase any specific number of shares and may be modified, suspended, or terminated at any time by the Company’s Board of Directors without prior notice.
We believe that internally generated funds, current cash on hand and available borrowings under the ABL facility will be adequate to meet our liquidity needs. We do not expect to pay any significant U.S. federal or state income taxes in fiscal year 2024 due to net operating loss carryforwards. If we needed to obtain additional financing using the credit markets, the cost and the terms and conditions of such borrowings may be influenced by our credit rating. In addition, we regularly review our capital structure, various financing alternatives and conditions in the debt and equity markets in order to opportunistically enhance our capital structure. In connection therewith, we may seek to refinance or retire existing indebtedness, incur new or additional indebtedness or issue equity or equity-linked securities, in each case, depending on market and other conditions. We have no off-balance sheet arrangements as defined in Item 303(a)(4) of SEC Regulation S-K.
In managing our overall capital structure, we focus on the ratio of net debt to Adjusted EBITDA, which we use as a measure of our ability to repay our incurred debt. We define net debt as the total principal balance of our outstanding indebtedness excluding deferred financing costs, net of cash, at the balance sheet date. See the explanations above for our definitions of Adjusted EBITDA and EBITDA, which are non-GAAP measures and are not intended to represent, and should not be considered more meaningful than, or as alternatives to, a measure of operating performance as determined in accordance with U.S. GAAP. Our ratio of net debt to Adjusted EBITDA (Adjusted EBITDA Leverage Ratio) measures net debt at the balance sheet date to Adjusted EBITDA as calculated on the trailing twelve-month period from this balance sheet date.
Our Debt to Adjusted EBITDA Leverage Ratio and Net Debt to Adjusted EBITDA Leverage ratio worsened in fiscal year 2023 compared to fiscal year 2022, largely due to higher debt balances resulting from the issuance of the 2030 Notes in fiscal year 2023 to facilitate our pension derisking strategy. The reconciliations of our Adjusted EBITDA Leverage Ratios to the balance sheet and income statement amounts as reported under U.S. GAAP are as follows:
| December 31, 2023 | January 1, 2023* | |||||||||||||
| Net income attributable to ATI | $ | 410.8 | $ | 323.5 | ||||||||||
| Net income attributable to noncontrolling interests | 12.6 | 15.6 | ||||||||||||
| Net income | 423.4 | 339.1 | ||||||||||||
| Interest expense | 92.8 | 87.4 | ||||||||||||
| Depreciation and amortization | 146.1 | 142.9 | ||||||||||||
| Income tax provision (benefit) | (128.2) | 15.5 | ||||||||||||
| Pension remeasurement loss (gain) | 26.8 | (100.3) | ||||||||||||
| Retirement benefit settlement loss | 41.7 | — | ||||||||||||
| Restructuring and other charges | 31.4 | 23.7 | ||||||||||||
| Joint venture restructuring credit | — | (0.9) | ||||||||||||
| Loss on asset sales and sale of business | 0.6 | 105.4 | ||||||||||||
| Adjusted EBITDA | $ | 634.6 | $ | 612.8 | ||||||||||
| Debt | $ | 2,179.6 | $ | 1,748.0 | ||||||||||
| Add: Debt issuance costs | 19.6 | 17.2 | ||||||||||||
| Total debt | 2,199.2 | 1,765.2 | ||||||||||||
| Less: Cash | (743.9) | (584.0) | ||||||||||||
| Net debt | $ | 1,455.3 | $ | 1,181.2 | ||||||||||
| Debt to Adjusted EBITDA | 3.47 | 2.88 | ||||||||||||
| Net Debt to Adjusted EBITDA | 2.29 | 1.93 | ||||||||||||
*Fiscal year ended January 1, 2023 reflects the change in accounting principle as described in Note 1 of the Notes to the Consolidated Financial Statements.
37
Cash Flow
Cash provided by operations was $85.9 million, $224.9 million and $16.1 million in fiscal years 2023, 2022 and 2021, respectively. Decreased cash from operations in fiscal year 2023 as compared to fiscal year 2022, resulted primarily from $272 million in contributions to the U.S. defined benefit pension plans in fiscal year 2023 as well as higher accounts receivable and inventory balances due to increased operating levels. Working capital balances, and consequently cash from operations, can fluctuate throughout any operating period based upon the timing of receipts from customers and payments to vendors. However, we actively manage our working capital to ensure the required flexibility to meet our strategic objectives. Other significant fiscal year 2023 operating cash flow items included payment of fiscal year 2022 annual incentive compensation. Increased cash from operations in fiscal year 2022 as compared to fiscal year 2021, resulted from our ongoing efforts to improve efficiency around accounts receivable and inventory levels despite significantly higher sales and operating levels in most operations. Increased business volumes and expenditures attributable to strategic capital projects contributed to higher accounts payable balances at January 1, 2023. Other significant fiscal year 2022 operating cash flow items included $50 million in contributions to the U.S. defined benefit pension plans, payment of fiscal year 2021 annual incentive compensation and receipt of $8.5 million for repayment of working capital advances from A&T Stainless.
Cash used in investing activities was $193.2 million in fiscal year 2023, reflecting $200.7 million in capital expenditures primarily related to AA&S transformation projects and various HPMC growth projects. We expect to fund our capital expenditures with cash on hand and cash flow generated from our operations and, if needed, by using a portion of the ABL facility. Cash used in investing activities was $126.7 million in fiscal year 2022, reflecting $130.9 million in capital expenditures primarily related to AA&S transformation projects.
Cash provided by financing activities in fiscal year 2023 was $267.2 million, and included $418.8 million of net proceeds from the issuance of the 2030 Notes during the third quarter of fiscal year 2023, partially offset by $85.2 million of payments for the repurchase of 2.0 million shares of ATI stock under our repurchase programs authorized by our Board of Directors and $16.0 million in dividend payments to the 40% noncontrolling interest in our PRS joint venture in China. Cash used in financing activities in fiscal year 2022 was $201.9 million, and consisted primarily of $139.9 million toward the repurchase of ATI shares and $34.0 million in dividend payments to the 40% noncontrolling interest in our PRS joint venture in China.
At December 31, 2023, cash and cash equivalents on hand totaled $743.9 million, a $159.9 million increase from fiscal year-end 2022. Cash and cash equivalents held by our foreign subsidiaries was $141.7 million at December 31, 2023, of which $75.3 million was held by our PRS joint venture in China.
Contractual Obligations
A summary of required payments under financial instruments (excluding accrued interest) and other commitments are presented below.
| (In millions) | Total | Less than 1 year | 1-3 years | 4-5 years | After 5 years | |||||||||||||||||||||||||||
| Contractual Cash Obligations | ||||||||||||||||||||||||||||||||
| Total Debt including Finance Leases (A) | $ | 2,199.2 | $ | 31.9 | $ | 483.8 | $ | 574.9 | $ | 1,108.6 | ||||||||||||||||||||||
| Interest on Debt (B) | 616.0 | 118.1 | 208.4 | 158.2 | 131.3 | |||||||||||||||||||||||||||
| Operating Lease Obligations (C) | 88.1 | 17.0 | 27.6 | 18.6 | 24.9 | |||||||||||||||||||||||||||
| Other Long-term Liabilities | 104.0 | — | 56.0 | 28.9 | 19.1 | |||||||||||||||||||||||||||
| Pension and OPEB Obligations (D) | 257.9 | 32.1 | 56.2 | 51.3 | 118.3 | |||||||||||||||||||||||||||
| Unconditional Purchase Obligations | ||||||||||||||||||||||||||||||||
| Raw Materials (E) | 1,127.4 | 605.8 | 408.1 | 113.5 | — | |||||||||||||||||||||||||||
| Capital expenditures | 86.1 | 85.4 | 0.7 | — | — | |||||||||||||||||||||||||||
| Other (F) | 43.9 | 27.4 | 14.5 | 2.0 | — | |||||||||||||||||||||||||||
| Total | $ | 4,522.6 | $ | 917.7 | $ | 1,255.3 | $ | 947.4 | $ | 1,402.2 | ||||||||||||||||||||||
| Other Financial Commitments | ||||||||||||||||||||||||||||||||
| Lines of Credit (G) | $ | 658.1 | $ | 58.1 | $ | — | $ | 600.0 | $ | — | ||||||||||||||||||||||
| Guarantees | $ | 13.4 | ||||||||||||||||||||||||||||||
(A)Amounts exclude $68 million for certain finance lease contracts the Company has agreed to enter into. See Note 11, Leases for further information.
38
(B)Amounts include contractual interest payments using the interest rates in effect as of December 31, 2023 applicable to the Company’s ABL Term Loan due 2027, the 2025 Convertible Notes, the Allegheny Ludlum 6.95% Debentures due 2025, the 2027 Notes, the 2029 Notes, the 2030 Notes and the 2031 Notes.
(C)Amounts include operating lease obligations at their undiscounted value. These obligations are presented in other current liabilities and other long-term liabilities on the consolidated balance sheets at their discounted value, using applicable interest rates. See Note 11, Leases for further information.
(D)Based on current actuarial studies, amounts include payments for the next 10 years, which are not significant, to defined benefit pension plans, assuming the expected long-term returns on pension assets are achieved. Projections of minimum required payments to the U.S. qualified defined benefit pension plan are subject to significant uncertainty based on a number of factors including actual pension plan asset returns, changes in estimates of participant longevity, and changes in interest rates. Amounts also include actuarial projections of payments under other post-employment benefit plans for the next 10 years. In most retiree healthcare plans, our contributions are capped based on the cost as of a certain date. See Note 14, Retirement Benefits for further information.
(E)We have contracted for physical delivery for certain of our raw materials to meet a portion of our needs. These contracts are based upon fixed or variable price provisions. We used current market prices as of December 31, 2023, for raw material obligations with variable pricing.
(F)We have various contractual obligations that extend through fiscal year 2028 for services involving production facilities and administrative operations. Our purchase obligation as disclosed represents the estimated termination fees payable if we were to exit these contracts.
(G)At December 31, 2023, there was $5.0 million drawn under foreign credit agreements. Drawn amounts on the U.S. facility were $31.7 million utilized for standby letters of credit under the $600 million ABL facility, which renew annually. These standby letters of credit are used to support: $22.0 million in workers’ compensation and general insurance arrangements, $5.4 million related to environmental matters and $4.3 million for performance assurances.
Commitments and Contingencies
At December 31, 2023, our reserves for environmental remediation obligations totaled approximately $13 million, of which $7 million was included in other current liabilities. These reserves included estimated probable future costs of: $3 million for federal Superfund and comparable state-managed sites; $7 million for formerly owned or operated sites for remediation or indemnification obligations; $2 million for owned or controlled sites at which our operations have been or plan to be discontinued; and $1 million for sites utilized by the Company in its ongoing operations. We continue to evaluate whether we may be able to recover a portion of future costs for environmental liabilities from third parties and to pursue such recoveries where appropriate. The timing of expenditures depends on a number of factors that vary by site. ATI expects that it will expend present accruals over many years and that remediation of all sites with which it has been identified will be completed within thirty years.
At December 31, 2023, we had recognized asset retirement obligations (AROs) of $18 million related to landfill closures, decommissioning costs, facility leases and conditional AROs associated with manufacturing activities using what may be characterized as potentially hazardous materials.
Based on currently available information, it is reasonably possible that the costs for active matters may exceed our recorded reserves by as much as $17 million. However, future investigation or remediation activities may result in the discovery of additional hazardous materials, potentially higher levels of contamination than discovered during prior investigation, and may impact costs of the success or lack thereof in remedial solutions. Therefore, future developments, administrative actions or liabilities relating to environmental matters could have a material adverse effect on the ATI’s consolidated financial condition or results of operations.
Labor Matters
We have no significant CBAs that expire in fiscal year 2024. Approximately 1,100 USW-represented employees engaged in a 3 ½ month strike in mid-2021, following the expiration of a CBA, primarily affecting operations in the AA&S segment. In July 2021, we announced that a new four-year labor agreement with the USW through February 28, 2025 was ratified, ending the strike.
Retirement Benefits
All of ATI’s defined benefit pension plans are closed to new entrants, and at most ATI operations with pension participants, the plans are frozen for all future benefit accruals, with less than 800 participants still accruing benefit service. Additionally, all of the remaining collectively-bargained defined benefit retiree health care plans at ATI’s operations are now closed to new
39
entrants, with cost caps in place for these obligations. As a result of these actions, ATI’s retirement savings and other postretirement benefit programs have largely transitioned to a defined contribution structure. From fiscal years 2013 to 2022, five annuity buyouts of retired participants and two voluntary cash out programs of deferred participants during this period helped to reduce the total participants in ATI’s U.S. qualified defined benefit pension plans by more than 60%. During the fourth quarter of fiscal year 2023, we purchased group annuity contracts from an insurer covering approximately 85% of our U.S. qualified defined benefit pension plan obligations. Under these contracts, we transferred the pension obligations and associated assets for approximately 8,200 plan participants to the selected insurance company. To facilitate this pension derisking strategy, we completed a voluntary cash out for term vested employees and contributed $222 million to our pension plan in the third quarter of fiscal year 2023, to fully fund remaining pension liabilities ahead of this annuity transaction. After these actions, our U.S. qualified defined benefit pension plan includes approximately 1,980 participants.
At December 31, 2023, our defined benefit pension plans were approximately 97% funded in accordance with generally accepted accounting principles, and were remeasured at that date using a 5.60% discount rate to measure the projected benefit obligation. For ERISA funding purposes, discount rates used to measure pension liabilities for U.S. qualified defined benefit plans are calculated on a different basis using an IRS-determined segmented yield curve. Funding requirements are also affected by IRS-determined mortality assumptions, which may differ from those used under accounting standards. Based on current actuarial assumptions, we are not required to make any contributions to our pension plan during fiscal year 2024, and we are not required to make any significant contributions for at least the next ten years. However, these estimates are subject to significant uncertainty, including the performance of our pension trust assets and the discount rates used to measure pension liabilities. Pension trust asset performance for both our accounting and ERISA funding calculations is determined using the market value of plan assets at the end of each year.
Critical Accounting Policies
The accompanying consolidated financial statements have been prepared in conformity with United States generally accepted accounting principles. When more than one accounting principle, or the method of its application, is generally accepted, management selects the principle or method that is most appropriate in our specific circumstances. Application of these accounting principles requires our management to make estimates about the future resolution of existing uncertainties; as a result, actual results could differ from these estimates. In preparing these consolidated financial statements, management has made its best estimates and judgments of the amounts and disclosures included in the financial statements giving due regard to materiality.
Asset Impairment
We monitor the recoverability of the carrying value of our long-lived assets. An impairment charge is recognized when the expected net undiscounted future cash flows from an asset’s use (including any proceeds from disposition) are less than the asset’s carrying value, and the asset’s carrying value exceeds its fair value. Changes in the expected use of a long-lived asset group, and the financial performance of the long-lived asset group and its operating segment, are evaluated as indicators of possible impairment. Future cash flow value may include appraisals for property, plant and equipment, land and improvements, future cash flow estimates from operating the long-lived assets, and other operating considerations.
As of April 3, 2022, our Sheffield, UK operations were classified as held for sale, and the terms of sale resulted in indicators of impairment in the long-lived assets of this disposal group. A $22.3 million long-lived asset impairment charge was recorded in the first quarter of fiscal year 2022, reported as part of the $112.2 million loss on sale of this business for the fiscal year ended January 1, 2023. This long-lived asset impairment charge was determined using the held for sale framework and represents Level 1 information in the fair value hierarchy.
Goodwill is reviewed annually in the fourth quarter of each fiscal year for impairment or more frequently if impairment indicators arise. Other events and changes in circumstances may also require goodwill to be tested for impairment between annual measurement dates. At December 31, 2023, the Company had $227.2 million of goodwill on its consolidated balance sheet, all of which relates to the HPMC segment.
For our annual goodwill impairment evaluation performed in the fourth quarter of fiscal year 2023, quantitative goodwill assessments were performed for the two HPMC reporting units with goodwill. Fair values were determined by using a quantitative assessment that includes discounted cash flow and multiples of cash earnings valuation techniques, plus valuation comparisons to recent public sale transactions of similar businesses, if any, which represents Level 3 unobservable information in the fair value hierarchy. These impairment assessments and valuation methods require us to make estimates and assumptions regarding revenue growth, changes in working capital and capital expenditures, selling prices and profitability that drive cash flows, and the WACC. Many of these assumptions are determined by reference to market participants we have identified. For example, our WACC used in our discounted cash flow assessments was 12.0% and long-term growth rates ranged from 3% to 3.5%. The estimated effect of a 0.50% change in the WACC would result in a 10% change in the fair value of the Forged
40
Products reporting unit. Although we believe that the estimates and assumptions used were reasonable, actual results could differ from those estimates and assumptions.
The $227.2 million of goodwill remaining as of December 31, 2023 on our consolidated balance sheet is comprised of $161.2 million at the Forged Products reporting unit and $66.0 million at the Specialty Materials reporting unit. For our annual goodwill impairment evaluation performed in the fourth quarter of fiscal year 2023, the Specialty Materials reporting unit had a fair value that was significantly in excess of carrying value. The Forged Products reporting unit had a fair value that exceeded carrying value by approximately 60% for the fiscal year 2023 annual assessment, which increased compared to the annual evaluation for fiscal year 2022. As a result, no impairments were determined to exist from the annual goodwill impairment evaluation for the fiscal years ended December 31, 2023, January 1, 2023 or January 2, 2022. In order to validate the reasonableness of the estimated fair values of the reporting units as of the valuation date, a reconciliation of the aggregate fair values of all reporting units to market capitalization was performed using a reasonable control premium. In addition, no indicators of impairment were observed in fiscal years 2023 or 2022 associated with any of our long-lived assets.
Income Taxes
The provision for income taxes includes deferred taxes resulting from temporary differences in income for financial and tax purposes using the liability method. Such temporary differences result primarily from differences in the carrying value of assets and liabilities. Future realization of deferred income tax assets requires sufficient taxable income within the carryback and/or carryforward period available under tax law. On a quarterly basis, we evaluate the realizability of our deferred tax assets.
The evaluation includes the consideration of all available evidence, both positive and negative, regarding the estimated future reversals of existing taxable temporary differences, estimated future taxable income exclusive of reversing temporary differences and carryforwards, historical taxable income in prior carryback periods if carryback is permitted, and potential tax planning strategies which may be employed to prevent an operating loss or tax credit carryforward from expiring unused. In situations where a three-year cumulative loss condition exists, accounting standards limit the ability to consider projections of future results as positive evidence to assess the realizability of deferred tax assets. Valuation allowances are established when it is estimated that it is more likely than not that the tax benefit of the deferred tax asset will not be realized.
Since fiscal year 2020, ATI’s U.S. operations were in a three-year cumulative loss position, limiting the ability to utilize future projections as verifiable sources of income when analyzing the need for a valuation allowance. Results in fiscal years 2021 and 2022 include impacts from income taxes that differ from applicable standard tax rates, primarily related to these income tax valuation allowances. This cumulative loss continued until fiscal year 2023 when ATI exited the three-year cumulative loss position and we concluded it was appropriate to consider future projections as a source of income when analyzing the need for a valuation allowance. We determined that valuation allowances on net deferred tax asset balances for federal and certain state jurisdictions are no longer required. Certain individual tax attributes still require a valuation allowance based on expected utilization. At December 31, 2023, our deferred tax asset valuation allowance was $60.3 million. In fiscal year 2023, ATI recorded a tax benefit associated with the valuation allowance due to the current year income for the U.S. operations and an additional benefit was recorded related to the valuation allowance release associated with ATI’s ability to utilize projections for future income. In addition, we have $24.1 million of valuation allowances on amounts recorded in other comprehensive loss on the consolidated balance sheet as of December 31, 2023.
Retirement Benefits
We have defined contribution retirement plans or benefit pension plans covering substantially all of our employees. We also sponsor several postretirement plans covering certain hourly and salaried employees and retirees. These plans provide health care and life insurance benefits for eligible employees. Company contributions to defined contribution retirement plans are generally based on a percentage of eligible pay or based on hours worked, and are funded with cash. All of ATI’s defined benefit pension plans are closed to new entrants, and at most ATI operations with pension participants the plans are frozen for all future benefit accruals, with less than 800 participants still accruing benefit service. Additionally, all of the remaining, collectively bargained defined benefit retiree health care plans at ATI’s operations are closed to new entrants, with cost caps in place for these obligations. As a result of these actions, ATI’s retirement savings and other postretirement benefit programs have largely transitioned to a defined contribution structure.
Under U.S. generally accepted accounting principles, amounts recognized in financial statements for defined benefit pension plans are determined on an actuarial basis, rather than as contributions are made to the plan. A significant element in determining our pension income or expense in accordance with the accounting standards is the expected investment return on plan assets. In establishing the expected return on plan investments, which is reviewed annually in the fourth quarter, we take into consideration input from our third-party pension plan asset managers and actuaries regarding the types of securities the plan assets are invested in, how those investments have performed historically, and expectations for how those investments will perform in the future. Our weighted average expected long-term return on pension plan investments was initially 6.57% in
41
fiscal year 2023, and 5.80% upon remeasurement as of October 17, 2023, following the large annuity buyout of retirees. The expected long-term rate of return on pension plan investments for fiscal year 2024 will be 5.80%. We apply the assumed rate of return to the market value of plan assets at the end of the previous year. This produces the expected return on plan assets that is included in annual pension expense for the current year. The actual returns on pension plan assets for the last five fiscal years have been 2.0% for 2023, (14.5)% for 2022, 12.4% for 2021, 15.2% for 2020, and 15.1% for 2019. The effect of increasing, or lowering, the expected return on pension plan investments by 0.25% would result in additional pre-tax annual income, or expense, of approximately $1 million. The cumulative difference between the expected return and the actual return on plan assets is immediately recognized in earnings through net periodic pension benefit cost within nonoperating retirement benefit expense on the consolidated statements of operations when pension plans are remeasured annually in the fourth quarter or on an interim basis as triggering events require remeasurement. This immediate recognition is in accordance with the accounting standards and is a result of our change in accounting principle in the fourth quarter of fiscal year 2023 as discussed in Note 1 to the Consolidated Financial Statements. The amount of expected return on plan assets can vary significantly from year-to-year since the calculation is dependent on the market value of plan assets as of the end of the preceding year. U.S. generally accepted accounting principles allow companies to calculate the expected return on pension assets using either an average of fair market values of pension assets over a period not to exceed five years, which reduces the volatility in reported pension income or expense, or their fair market value at the end of the previous year. However, the U.S. Securities and Exchange Commission currently does not permit companies to change from the fair market value at the end of the previous year methodology, which is the methodology that we use, to an averaging of fair market values of plan assets methodology. As a result, our results of operations and those of other companies, including companies with which we compete, may not be comparable due to these different methodologies in calculating the expected return on pension investments.
In accordance with accounting standards, we determine the discount rate used to value pension plan liabilities as of the last day of our fiscal year. The discount rate reflects the current rate at which the pension liabilities could be effectively settled. In estimating this rate, we receive input from our actuaries regarding the rates of return on high quality, fixed-income investments with maturities matched to the expected future retirement benefit payments. Based on this assessment, we established a discount rate of 5.60% for valuing the pension liabilities as of December 31, 2023, and for determining the pension expense for fiscal year 2024. We had previously assumed a discount rate of 5.55% at the end of fiscal year 2022, which changed to 6.40% upon the remeasurement as of October 17, 2023, following the large annuity buyout of retirees, and 2.95% at the end of fiscal year 2021. The estimated effect of changing the discount rate by 0.50% would decrease pension liabilities in the case of an increase in the discount rate or increase pension liabilities in the case of a decrease in the discount rate, by approximately $20 million. Such a change in the discount rate would have an insignificant impact to pension expense. The effect on pension liabilities for changes to the discount rate, as well as the net effect of other changes in actuarial assumptions and experience, are immediately recognized in earnings through net periodic pension benefit cost within nonoperating retirement benefit expense on the consolidated statements of operations when pension plans are remeasured annually in the fourth quarter or on an interim basis as triggering events require remeasurement. This immediate recognition is in accordance with the accounting standards and is a result of our change in accounting principle in the fourth quarter of fiscal year 2023 as discussed in Note 1 to the Consolidated Financial Statements.
With respect to our postretirement plans, under most of the plans, our contributions towards retiree medical premiums are capped based upon the cost as of certain dates, thereby creating a defined contribution. In accordance with U.S. generally accepted accounting standards, postretirement expenses recognized in financial statements associated with defined benefit plans are determined on an actuarial basis, rather than as benefits are paid. We use actuarial assumptions, including the discount rate and the expected trend in health care costs, to estimate the costs and benefit obligations for these plans. The discount rate, which is determined annually at the end of each fiscal year, is developed based upon rates of return on high quality, fixed-income investments. At the end of fiscal year 2023, we determined the rate to be 5.40%, compared to a 5.45% discount rate in fiscal year 2022, and a 2.80% discount rate in fiscal year 2021. The estimated effect of changing the discount rate by 0.50% would decrease postretirement obligations in the case of an increase in the discount rate or increase postretirement obligations in the case of a decrease in the discount rate, by approximately $7 million. Such a change in the discount rate would have an insignificant impact to postretirement benefit expense. Based upon predictions of continued significant medical cost inflation in future years, the annual assumed rate of increase in the per capita cost of covered benefits of health care plans is 7.2% in 2024 and is assumed to gradually decrease to 4.0% in the year 2048 and remain level thereafter. Assumed health care cost trend rates can have a significant effect on the benefit obligation for health care plans, however, the Company’s contributions for most of its retiree health plans are capped based on a fixed premium amount, which limits the impact of future health care cost increases.
Forward-Looking Statements
From time-to-time, the Company has made and may continue to make “forward-looking statements” within the meaning of the Private Securities Litigation Reform Act of 1995. Certain statements in this report relate to future events and expectations and, as such, constitute forward-looking statements. Forward-looking statements include those containing such words as
42
“anticipates,” “believes,” “estimates,” “expects,” “would,” “should,” “will,” “will likely result,” “forecast,” “outlook,” “projects,” and similar expressions. Such forward-looking statements are based on management’s current expectations and include known and unknown risks, uncertainties and other factors, many of which the Company is unable to predict or control, that may cause our actual results or performance to materially differ from any future results or performance expressed or implied by such statements. Various of these factors are described in Item 1A, Risk Factors, of this Annual Report on Form 10-K and will be described from time-to-time in the Company filings with the SEC, including the Company’s Annual Reports on Form 10-K and the Company’s subsequent reports filed with the SEC on Form 10-Q and Form 8-K, which are available on the SEC’s website at www.sec.gov and on the Company’s website at www.atimetals.com. We assume no duty to update our forward-looking statements.
Item 7A. Quantitative and Qualitative Disclosures About Market Risk
As part of our risk management strategy, we utilize derivative financial instruments, from time to time, to hedge our exposure to changes in energy and raw material prices, foreign currencies, and interest rates. We monitor the third-party financial institutions that are our counterparty to these financial instruments on a daily basis and diversify our transactions among counterparties to minimize exposure to any one of these entities. Fair values for derivatives were measured using exchange-traded prices for the hedged items including consideration of counterparty risk and ATI’s credit risk. Our exposure to volatility in interest rates is presently not material, as nearly all of our debt is at fixed interest rates.
Volatility of Interest Rates. We may enter into derivative interest rate contracts to maintain a reasonable balance between fixed- and floating-rate debt. ATI has a $50 million floating-for-fixed interest rate swap which converts a portion of the ABL Term Loan to a 4.21% fixed rate. The swap matures in June 2024. We designated the interest rate swap as a cash flow hedge of our exposure to the variability of the payment of interest on a portion of its ABL Term Loan borrowings. The ineffective portion at hedge inception, determined from the fair value of the swap immediately prior to amendment in July 2019, was amortized to interest expense over the initial ABL Term Loan swap maturity date of January 12, 2021. Any gain or loss associated with this hedging arrangement is included in interest expense. At December 31, 2023, the net mark-to-market valuation of the outstanding interest rate swap was an unrealized pre-tax gain of $0.7 million, comprised of $0.7 million in prepaid expenses and other current assets on the balance sheet.
Volatility of Energy Prices. Energy resources markets are subject to conditions that create uncertainty in the prices and availability of energy resources. The prices for and availability of electricity, natural gas, oil and other energy resources are subject to volatile market conditions. These market conditions often are affected by political and economic factors beyond our control. Increases in energy costs, or changes in costs relative to energy costs paid by competitors, have and may continue to adversely affect our profitability. To the extent that these uncertainties cause suppliers and customers to be more cost sensitive, increased energy prices may have an adverse effect on our results of operations and financial condition. We use approximately 6 to 8 million MMBtu’s of natural gas annually, depending upon business conditions, in the manufacture of our products. These purchases of natural gas expose us to risk of higher gas prices. For example, a hypothetical $1.00 per MMBtu increase in the price of natural gas would result in increased annual energy costs of approximately $6 to $8 million. We use several approaches to minimize any material adverse effect on our financial condition or results of operations from volatile energy prices. These approaches include incorporating an energy surcharge on many of our products and using financial derivatives or physical hedges to reduce exposure to energy price volatility.
At December 31, 2023, the outstanding financial derivatives used to hedge our exposure to energy cost volatility included natural gas hedges. At December 31, 2023, we hedged approximately 75% of our annual forecasted domestic requirements for natural gas for fiscal year 2024 and approximately 35% for fiscal year 2025. At December 31, 2023, the net mark-to-market valuation of the outstanding natural gas hedges was an unrealized pre-tax loss of $6.6 million, comprised of $0.1 million in other assets, $5.6 million in other current liabilities and $1.1 million in other long-term liabilities on the balance sheet. For the year ended December 31, 2023, the effects of natural gas hedging activity increased cost of sales by $7.5 million.
Volatility of Raw Material Prices. We use raw materials surcharge and index mechanisms to offset the impact of increased raw material costs; however, competitive factors in the marketplace can limit our ability to institute such mechanisms, and there can be a delay between the increase in the price of raw materials and the realization of the benefit of such mechanisms. For example, in fiscal year 2023 we used approximately 70 million pounds of nickel; therefore a hypothetical change of $1.00 per pound in nickel prices would result in increased costs of approximately $70 million. While we enter into raw materials futures contracts from time-to-time to hedge exposure to price fluctuations, such as for nickel, we cannot be certain that our hedge position adequately reduces exposure. We believe that we have adequate controls to monitor these contracts, but we may not be able to accurately assess exposure to price volatility in the markets for critical raw materials.
The majority of our products are sold utilizing raw material surcharges and index mechanisms. However, as of December 31, 2023, we had entered into financial hedging arrangements, primarily at the request of our customers, related to firm orders, for an aggregate amount of approximately 4 million pounds of nickel with hedge dates through fiscal year 2024. The aggregate
43
notional amount hedged is approximately 6% of a single year’s estimated nickel raw material purchase requirements. These derivative instruments are used to hedge the variability of a selling price that is based on the London Metals Exchange (LME) index for nickel, as well as to hedge the variability of the purchase cost of nickel based on this LME index. Any gain or loss associated with these hedging arrangements is included in sales or cost of sales, depending on whether the underlying risk being hedged was the variable selling price or the variable raw material cost, respectively. At December 31, 2023, the net mark-to-market valuation of our outstanding raw material hedges was an unrealized pre-tax loss of $7.5 million, comprised of $7.5 million in other current liabilities on the balance sheet.
Foreign Currency Risk. Foreign currency exchange contracts are used, from time-to-time, to limit transactional exposure to changes in currency exchange rates. We sometimes purchase foreign currency forward contracts that permit us to sell specified amounts of foreign currencies expected to be received from our export sales for pre-established U.S. dollar amounts at specified dates. In addition, we may also hedge forecasted capital expenditures and designate cash balances held in foreign currencies as hedges of forecasted foreign currency transactions. At December 31, 2023, we had no significant outstanding foreign currency forward contracts.
44
Item 8. Financial Statements and Supplementary Data
Report of Independent Registered Public Accounting Firm
To the Stockholders and the Board of Directors of ATI Inc.
Opinion on the Financial Statements
We have audited the accompanying consolidated balance sheets of ATI Inc. and subsidiaries (the Company) as of December 31, 2023 and January 1, 2023, the related consolidated statements of operations, comprehensive income (loss), cash flows and statements of changes in consolidated equity for each of the three years in the period ended December 31, 2023, and the related notes (collectively referred to as the “consolidated financial statements”.) In our opinion, the consolidated financial statements present fairly, in all material respects, the financial position of the Company at December 31, 2023 and January 1, 2023, and the results of its operations and its cash flows for each of the three years in the period ended December 31, 2023, in conformity with U.S. generally accepted accounting principles.
We also have audited, in accordance with the standards of the Public Company Accounting Oversight Board (United States) (PCAOB), the Company's internal control over financial reporting as of December 31, 2023, based on criteria established in Internal Control—Integrated Framework issued by the Committee of Sponsoring Organizations of the Treadway Commission (2013 framework), and our report dated February 23, 2024 expressed an unqualified opinion thereon.
Change in Accounting Principle
As discussed in Note 1 to the consolidated financial statements, the Company changed its method of accounting for recognizing actuarial gains and losses for its defined benefit pension plans during the year ended December 31, 2023. The Company adopted this change on a retrospective basis.
Basis for Opinion
These financial statements are the responsibility of the Company's management. Our responsibility is to express an opinion on the Company’s financial statements based on our audits. We are a public accounting firm registered with the PCAOB and are required to be independent with respect to the Company in accordance with the U.S. federal securities laws and the applicable rules and regulations of the Securities and Exchange Commission and the PCAOB.
We conducted our audits in accordance with the standards of the PCAOB. Those standards require that we plan and perform the audit to obtain reasonable assurance about whether the financial statements are free of material misstatement, whether due to error or fraud. Our audits included performing procedures to assess the risks of material misstatement of the financial statements, whether due to error or fraud, and performing procedures that respond to those risks. Such procedures included examining, on a test basis, evidence regarding the amounts and disclosures in the financial statements. Our audits also included evaluating the accounting principles used and significant estimates made by management, as well as evaluating the overall presentation of the financial statements. We believe that our audits provide a reasonable basis for our opinion.
Critical Audit Matter
The critical audit matter communicated below is a matter arising from the current period audit of the financial statements that was communicated or required to be communicated to the audit committee and that: (1) relates to accounts or disclosures that are material to the financial statements and (2) involved our especially challenging, subjective or complex judgments. The communication of the critical audit matter does not alter in any way our opinion on the consolidated financial statements, taken as a whole, and we are not, by communicating the critical audit matter below, providing a separate opinion on the critical audit matter or on the accounts or disclosures to which it relates.
45
| Goodwill impairment assessment - Forged Products reporting unit | |||||
| Description of the Matter | At December 31, 2023, the Company had $227.2 million of goodwill on its consolidated balance sheet. As discussed in Note 1 to the consolidated financial statements, goodwill is reviewed annually for impairment, or more frequently if impairment indicators arise. The assessment of goodwill for impairment requires a comparison of the fair value of each reporting unit that has goodwill associated with its operations to its carrying amount, including goodwill. If the Company’s carrying amount of a reporting unit exceeds its fair value, an impairment loss would be measured as the excess of the carrying value over the calculated fair value. Auditing the Company’s annual goodwill impairment test for the Forged Products reporting unit was complex because the estimation of fair value involves subjective management assumptions, specifically the weighted-average cost of capital assumption and a complex valuation methodology, such as the discounted cash flow. Changes in this assumption can have a material effect on the determination of fair value. | ||||
| How We Addressed the Matter in Our Audit | We obtained an understanding, evaluated the design and tested the operating effectiveness of controls over the Company’s goodwill impairment evaluation process, including controls over management’s review of the assumption described above. Our audit procedures to test management’s impairment evaluation of the Forged Products reporting unit included, among others, assessing the valuation methodology, the assumption discussed above, and the underlying data used to develop the assumption. Where appropriate, we evaluated whether changes to the market inputs and other factors would affect the assumption. We also assessed the historical accuracy of management’s estimates and performed independent sensitivity analyses. We involved our valuation specialists to assist us in evaluating the methodology and auditing the assumption used to calculate the estimated fair value of the Forged Products reporting unit. | ||||
/s/ Ernst & Young LLP
We have served as the Company’s auditor since 1996.
February 23, 2024
46
ATI Inc. and Subsidiaries
Consolidated Statements of Operations
(In millions, except per share amounts)
| Fiscal Year Ended | ||||||||||||||||||||
| December 31, 2023 | January 1, 2023* | January 2, 2022* | ||||||||||||||||||
| Sales | $ | $ | $ | |||||||||||||||||
| Cost of sales | ||||||||||||||||||||
| Gross profit | ||||||||||||||||||||
| Selling and administrative expenses | ||||||||||||||||||||
| Restructuring charges (credits) | ( | ( | ||||||||||||||||||
| Loss on asset sales and sales of businesses, net | ||||||||||||||||||||
| Operating income | ||||||||||||||||||||
| Nonoperating retirement benefit income (expense) | ( | |||||||||||||||||||
| Interest expense, net | ( | ( | ( | |||||||||||||||||
| Debt extinguishment charge | ( | |||||||||||||||||||
| Other income (loss), net | ( | |||||||||||||||||||
| Income before income taxes | ||||||||||||||||||||
| Income tax provision (benefit) | ( | |||||||||||||||||||
| Net income | ||||||||||||||||||||
| Less: Net income attributable to noncontrolling interests | ||||||||||||||||||||
| Net income attributable to ATI | $ | $ | $ | |||||||||||||||||
| Basic net income attributable to ATI per common share | $ | $ | $ | |||||||||||||||||
| Diluted net income attributable to ATI per common share | $ | $ | $ | |||||||||||||||||
*Fiscal years ended January 1, 2023 and January 2, 2022 reflect a change in accounting principle, as described in Note 1 of the Notes to the Consolidated Financial Statements.
The accompanying notes are an integral part of these statements.
47
ATI Inc. and Subsidiaries
Consolidated Statements of Comprehensive Income (Loss)
(In millions)
| Fiscal Year Ended | ||||||||||||||||||||
| December 31, 2023 | January 1, 2023* | January 2, 2022* | ||||||||||||||||||
| Net income | $ | $ | $ | |||||||||||||||||
| Currency translation adjustment | ||||||||||||||||||||
| Unrealized net change arising during the period | ( | ( | ||||||||||||||||||
| Reclassification adjustment included in net income | ||||||||||||||||||||
| Total | ( | ( | ||||||||||||||||||
| Derivatives | ||||||||||||||||||||
| Net derivatives gain (loss) on hedge transactions | ( | |||||||||||||||||||
| Reclassification to net income of net realized loss (gain) | ( | ( | ||||||||||||||||||
| Income taxes on derivative transactions | ( | |||||||||||||||||||
| Total | ( | |||||||||||||||||||
| Postretirement benefit plans | ||||||||||||||||||||
| Actuarial gain/loss | ||||||||||||||||||||
| Amortization of net actuarial loss | ||||||||||||||||||||
| Net gain (loss) arising during the period | ( | |||||||||||||||||||
| Prior service cost | ||||||||||||||||||||
| Amortization to net income of net prior service credits | ( | ( | ( | |||||||||||||||||
| Settlement loss (gain) included in net income | ( | |||||||||||||||||||
| Income taxes on postretirement benefit plans | ( | |||||||||||||||||||
| Total | ||||||||||||||||||||
| Other comprehensive income (loss), net of tax | ( | |||||||||||||||||||
| Comprehensive income | ||||||||||||||||||||
| Less: Comprehensive income (loss) attributable to noncontrolling interests | ( | |||||||||||||||||||
| Comprehensive income attributable to ATI | $ | $ | $ | |||||||||||||||||
*Fiscal years ended January 1, 2023 and January 2, 2022 reflect a change in accounting principle, as described in Note 1 of the Notes to the Consolidated Financial Statements.
The accompanying notes are an integral part of these statements.
48
ATI Inc. and Subsidiaries
Consolidated Balance Sheets
| (In millions, except share and per share amounts) | December 31, 2023 | January 1, 2023* | ||||||||||||
| Assets | ||||||||||||||
| Cash and cash equivalents | $ | $ | ||||||||||||
| Accounts receivable, net | ||||||||||||||
| Short-term contract assets | ||||||||||||||
| Inventories, net | ||||||||||||||
| Prepaid expenses and other current assets | ||||||||||||||
| Total Current Assets | ||||||||||||||
| Property, plant and equipment, net | ||||||||||||||
| Goodwill | ||||||||||||||
| Other assets | ||||||||||||||
| Total Assets | $ | $ | ||||||||||||
| Liabilities and Stockholders’ Equity | ||||||||||||||
| Accounts payable | $ | $ | ||||||||||||
| Short-term contract liabilities | ||||||||||||||
| Short-term debt and current portion of long-term debt | ||||||||||||||
| Other current liabilities | ||||||||||||||
| Total Current Liabilities | ||||||||||||||
| Long-term debt | ||||||||||||||
| Accrued postretirement benefits | ||||||||||||||
| Pension liabilities | ||||||||||||||
| Other long-term liabilities | ||||||||||||||
| Total Liabilities | ||||||||||||||
| Equity: | ||||||||||||||
| ATI Stockholders’ Equity: | ||||||||||||||
Preferred stock, par value $ | ||||||||||||||
Common stock, par value $ | ||||||||||||||
| Additional paid-in capital | ||||||||||||||
| Retained loss | ( | ( | ||||||||||||
Treasury stock: | ( | ( | ||||||||||||
| Accumulated other comprehensive loss, net of tax | ( | ( | ||||||||||||
| Total ATI Stockholders’ Equity | ||||||||||||||
| Noncontrolling Interests | ||||||||||||||
| Total Stockholders’ Equity | ||||||||||||||
| Total Liabilities and Stockholders’ Equity | $ | $ | ||||||||||||
*Fiscal year ended January 1, 2023 reflects a change in accounting principle, as described in Note 1 of the Notes to the Consolidated Financial Statements.
The accompanying notes are an integral part of these statements.
49
ATI Inc. and Subsidiaries
Consolidated Statements of Cash Flows
(In millions)
| Fiscal Year Ended | ||||||||||||||||||||
| December 31, 2023 | January 1, 2023* | January 2, 2022* | ||||||||||||||||||
| Operating Activities: | ||||||||||||||||||||
| Net income | $ | $ | $ | |||||||||||||||||
| Adjustments to reconcile net income to net cash provided by operating activities: | ||||||||||||||||||||
| Depreciation and amortization | ||||||||||||||||||||
| Share-based compensation | ||||||||||||||||||||
| Deferred taxes | ( | ( | ||||||||||||||||||
| Debt extinguishment charge | ||||||||||||||||||||
| Gain from disposal of property, plant and equipment, net | ( | ( | ( | |||||||||||||||||
| Net loss (gain) from sales of businesses | ( | |||||||||||||||||||
| Non-cash impairment charges | ||||||||||||||||||||
| Change in operating assets and liabilities: | ||||||||||||||||||||
| Pension plan contributions | ( | ( | ( | |||||||||||||||||
| Retirement benefits | ( | ( | ||||||||||||||||||
| Accounts receivable | ( | ( | ( | |||||||||||||||||
| Inventories | ( | ( | ( | |||||||||||||||||
| Accounts payable | ( | |||||||||||||||||||
| Accrued income taxes | ( | ( | ||||||||||||||||||
| Accrued liabilities and other | ( | ( | ||||||||||||||||||
| Cash provided by operating activities | ||||||||||||||||||||
| Investing Activities: | ||||||||||||||||||||
| Purchases of property, plant and equipment | ( | ( | ( | |||||||||||||||||
| Proceeds from disposal of property, plant and equipment | ||||||||||||||||||||
| Proceeds from sales of businesses, net of transaction costs | ( | |||||||||||||||||||
| Other | ||||||||||||||||||||
| Cash used in investing activities | ( | ( | ( | |||||||||||||||||
| Financing Activities: | ||||||||||||||||||||
| Borrowings on long-term debt | ||||||||||||||||||||
| Payments on long-term debt and finance leases | ( | ( | ( | |||||||||||||||||
| Net borrowings (payments) under credit facilities | ( | ( | ||||||||||||||||||
| Debt issuance costs | ( | ( | ||||||||||||||||||
| Debt extinguishment charge | ( | |||||||||||||||||||
| Purchase of treasury stock | ( | ( | ||||||||||||||||||
| Sale to noncontrolling interests | ||||||||||||||||||||
| Dividends paid to noncontrolling interests | ( | ( | ||||||||||||||||||
| Shares repurchased for income tax withholding on share-based compensation | ( | ( | ( | |||||||||||||||||
| Cash provided by (used in) financing activities | ( | |||||||||||||||||||
| Increase (decrease) in cash and cash equivalents | ( | |||||||||||||||||||
| Cash and cash equivalents at beginning of year | ||||||||||||||||||||
| Cash and cash equivalents at end of year | $ | $ | $ | |||||||||||||||||
*Fiscal years ended January 1, 2023 and January 2, 2022 reflect a change in accounting principle, as described in Note 1 of the Notes to the Consolidated Financial Statements.
Amounts presented on the Consolidated Statements of Cash Flows may not agree to the corresponding changes in consolidated balance sheet items due to the accounting for purchases and sales of businesses and the effects of foreign currency translation.
The accompanying notes are an integral part of these statements.
50
ATI Inc. and Subsidiaries
Statements of Changes in Consolidated Equity
| ATI Stockholders | ||||||||||||||||||||||||||||||||||||||||||||
| (In millions) | Common Stock | Additional Paid-In Capital | Retained Earnings (Loss) | Treasury Stock | Accumulated Other Comprehensive Income (Loss) | Non- controlling Interests | Total Equity | |||||||||||||||||||||||||||||||||||||
| Balance, January 3, 2021 | $ | $ | $ | $ | $ | ( | $ | $ | ||||||||||||||||||||||||||||||||||||
| Net income | — | — | — | — | ||||||||||||||||||||||||||||||||||||||||
| Other comprehensive income | — | — | — | — | ||||||||||||||||||||||||||||||||||||||||
| — | ( | — | — | — | ( | |||||||||||||||||||||||||||||||||||||||
| Cumulative effect of change in accounting principle | — | — | ( | — | — | |||||||||||||||||||||||||||||||||||||||
| Employee stock plans | — | — | ( | — | — | |||||||||||||||||||||||||||||||||||||||
| Balance, January 2, 2022* | $ | $ | $ | ( | $ | ( | $ | ( | $ | $ | ||||||||||||||||||||||||||||||||||
| Net income | — | — | — | — | ||||||||||||||||||||||||||||||||||||||||
| Other comprehensive income (loss) | — | — | — | — | ( | |||||||||||||||||||||||||||||||||||||||
| Purchase of treasury stock | — | — | — | ( | — | — | ( | |||||||||||||||||||||||||||||||||||||
| Conversion of convertible notes | ( | — | — | |||||||||||||||||||||||||||||||||||||||||
| Dividends paid to noncontrolling interest | — | — | — | — | — | ( | ( | |||||||||||||||||||||||||||||||||||||
| Sales of subsidiary shares to noncontrolling interest | — | — | — | — | — | |||||||||||||||||||||||||||||||||||||||
| Employee stock plans | ( | — | — | |||||||||||||||||||||||||||||||||||||||||
| Balance, January 1, 2023* | $ | $ | $ | ( | $ | ( | $ | ( | $ | $ | ||||||||||||||||||||||||||||||||||
| Net income | — | — | — | — | ||||||||||||||||||||||||||||||||||||||||
| Other comprehensive loss | — | — | — | — | ( | ( | ( | |||||||||||||||||||||||||||||||||||||
| Purchase of treasury stock | — | — | — | ( | — | — | ( | |||||||||||||||||||||||||||||||||||||
| Dividends paid to noncontrolling interest | — | — | — | — | — | ( | ( | |||||||||||||||||||||||||||||||||||||
| Employee stock plans | — | ( | — | — | ||||||||||||||||||||||||||||||||||||||||
| Balance, December 31, 2023 | $ | $ | $ | ( | $ | ( | $ | ( | $ | $ | ||||||||||||||||||||||||||||||||||
*Fiscal years ended January 1, 2023 and January 2, 2022 reflect a change in accounting principle, as described in Note 1 of the Notes to the Consolidated Financial Statements.
The accompanying notes are an integral part of these statements.
51
Notes to Consolidated Financial Statements
Note 1. Summary of Significant Accounting Policies
Principles of Consolidation and Reporting
The consolidated financial statements include the accounts of ATI Inc. and its subsidiaries. The financial results of majority-owned joint ventures are consolidated into the Company’s operating results and financial position, with the minority ownership interest recognized in the consolidated statement of operations as net income attributable to noncontrolling interests, and as equity attributable to the noncontrolling interests within total stockholders’ equity. The results for the Shanghai STAL Precision Stainless Steel Company Limited (STAL) are reported on a one month lag. Investments in which the Company exercises significant influence, but which it does not control (generally a 20% to 50% ownership interest) are accounted for under the equity method of accounting, whereby ATI’s carrying value of the equity method investment on the consolidated balance sheet is the capital investment and any undistributed profit or loss. The investments are classified in other (noncurrent) assets on the consolidated balance sheet. The profit or loss attributable to ATI from equity method investments is included in the consolidated statements of operations as a component of Other (non-operating) income (expense). See Note 7 for further explanation of the Company’s joint ventures. Intercompany accounts and transactions have been eliminated. Unless the context requires otherwise, “ATI” and the “Company” refer to ATI Inc. and its subsidiaries.
Fiscal Year
Risks and Uncertainties and Use of Estimates
The Company markets its products to a diverse customer base, principally throughout the United States. No single customer accounted for more than 10% of sales for any year presented. The major end markets for ATI’s products are customers in the aerospace & defense, energy, automotive, construction and mining, food equipment and appliances, and medical markets.
At December 31, 2023, ATI has approximately 7,300 active employees, of which approximately 15 % are located outside the United States. Approximately 35 % of ATI’s workforce is covered by various collective bargaining agreements (CBAs), predominantly with the United Steel, Paper and Forestry, Rubber, Manufacturing, Energy, Allied & Industrial Service Workers International Union, AFL-CIO, CLC (USW). The Company’s CBA with the USW involving approximately 1,100 active full- time represented employees located primarily within the Advanced Alloys & Solutions (AA&S) segment operations, as well as a number of inactive employees, expired on February 28, 2021. USW-represented employees continued to work under the terms of the expired CBA until March 30, 2021 when they engaged in a strike. On July 14, 2021, ATI announced that a new four-year labor agreement with the USW was ratified, ending the strike. The Company has no significant CBAs that expire in fiscal year 2024.
Change in Accounting Principle
During the fourth quarter of fiscal year 2023, the Company voluntarily changed the method of accounting for recognizing actuarial gains and losses for its defined benefit pension plans. Under the accounting method change, remeasurement of projected benefit obligation and plan assets for defined benefit pension plans are immediately recognized in earnings through net periodic pension benefit cost within nonoperating retirement benefit expense on the consolidated statements of operations, with pension plans to be remeasured annually in the fourth quarter or on an interim basis as triggering events require remeasurement. Prior to this accounting method change, the Company deferred the recognition of these gains and losses in accumulated other comprehensive loss on the consolidated balance sheet. The accumulated actuarial gains/losses were then amortized into net periodic benefit costs within nonoperating retirement benefit expense on the consolidated statement of operations over the average expected remaining life of plan participants. While the historical accounting principle was acceptable, we believe that the current accounting policy is preferable because it provides a better representation of the
52
operating results of the Company and the economic performance of plan assets in relation to the measurement of its benefit obligations for the period. The change in accounting will more clearly reflect the current period impact of the Company’s pension asset investment strategy to readers of the financial statements.
The following table reflects the effect of the change in the accounting principle on the consolidated financial statements:
| For the Fiscal Year Ending December 31, 2023 | As Computed Under Previous Policy | As Reported under New Policy | Effect of Accounting Change | |||||||||||||||||
| (dollars in millions, except per share data) | ||||||||||||||||||||
| Statement of Operations | ||||||||||||||||||||
| Nonoperating retirement benefit expense | $ | ( | $ | ( | $ | |||||||||||||||
| Income (loss) before income taxes | $ | ( | $ | $ | ||||||||||||||||
| Income tax benefit | $ | ( | $ | ( | $ | |||||||||||||||
| Net income (loss) | $ | ( | $ | $ | ||||||||||||||||
| Net income (loss) attributable to ATI | $ | ( | $ | $ | ||||||||||||||||
| Basic net income (loss) per common share | $ | ( | $ | $ | ||||||||||||||||
| Diluted net income (loss) per common share | $ | ( | $ | $ | ||||||||||||||||
| Statement of Comprehensive Income (Loss) | ||||||||||||||||||||
| Net income (loss) | $ | ( | $ | $ | ||||||||||||||||
| Postretirement benefit plans | ||||||||||||||||||||
| Actuarial gain/ loss | ||||||||||||||||||||
| Amortization of net actuarial loss | $ | $ | $ | ( | ||||||||||||||||
| Net loss arising during the period | $ | ( | $ | ( | $ | |||||||||||||||
| Settlement loss included in net income (loss) | $ | $ | $ | ( | ||||||||||||||||
| Income taxes on postretirement benefits | $ | $ | $ | ( | ||||||||||||||||
| Total | $ | $ | $ | ( | ||||||||||||||||
| Other comprehensive income (loss), net of tax | $ | $ | ( | $ | ( | |||||||||||||||
| Balance Sheet | ||||||||||||||||||||
| Retained loss | $ | ( | $ | ( | $ | |||||||||||||||
| Accumulated other comprehensive income (loss), net of tax | $ | $ | ( | $ | ( | |||||||||||||||
| Statement of Cash Flows | ||||||||||||||||||||
| Operating Activities: | ||||||||||||||||||||
| Net income (loss) | $ | ( | $ | $ | ||||||||||||||||
| Adjustments to reconcile net income (loss) to net cash provided by operating activities: | ||||||||||||||||||||
| Deferred taxes | $ | ( | $ | ( | $ | |||||||||||||||
| Change in operating assets and liabilities: | ||||||||||||||||||||
| Retirement benefits | $ | $ | $ | ( | ||||||||||||||||
| Statements of Changes in Consolidated Equity | ||||||||||||||||||||
| Retained Loss | ||||||||||||||||||||
| Net income (loss) | $ | ( | $ | $ | ||||||||||||||||
| Balance, December 31, 2023 | $ | ( | $ | ( | $ | |||||||||||||||
| Accumulated Other Comprehensive Income (Loss) | ||||||||||||||||||||
| Other comprehensive income (loss) | $ | $ | ( | $ | ( | |||||||||||||||
| Balance, December 31, 2023 | $ | $ | ( | $ | ( | |||||||||||||||
| Total Equity | ||||||||||||||||||||
| Net income (loss) | $ | ( | $ | $ | ||||||||||||||||
| Other comprehensive income (loss) | $ | $ | ( | $ | ( | |||||||||||||||
53
| For the Fiscal Year Ending January 1, 2023 | As Computed Under Previous Policy | As Reported under New Policy | Effect of Accounting Change | |||||||||||||||||
| (dollars in millions, except per share data) | ||||||||||||||||||||
| Statement of Operations | ||||||||||||||||||||
| Loss on asset sales and sales of businesses, net | $ | $ | $ | ( | ||||||||||||||||
| Operating income | $ | $ | $ | |||||||||||||||||
| Nonoperating retirement benefit income (expense) | $ | ( | $ | $ | ||||||||||||||||
| Income before income taxes | $ | $ | $ | |||||||||||||||||
| Net income | $ | $ | $ | |||||||||||||||||
| Net income attributable to ATI | $ | $ | $ | |||||||||||||||||
| Basic net income per common share | $ | $ | $ | |||||||||||||||||
| Diluted net income per common share | $ | $ | $ | |||||||||||||||||
| Statement of Comprehensive Income (Loss) | ||||||||||||||||||||
| Net income | $ | $ | $ | |||||||||||||||||
| Postretirement benefit plans | ||||||||||||||||||||
| Actuarial gain/loss | ||||||||||||||||||||
| Amortization of net actuarial loss | $ | $ | $ | ( | ||||||||||||||||
| Net gain arising during the period | $ | $ | $ | ( | ||||||||||||||||
| Settlement loss included in net income | $ | $ | $ | ( | ||||||||||||||||
| Total | $ | $ | $ | ( | ||||||||||||||||
| Other comprehensive income, net of tax | $ | $ | $ | ( | ||||||||||||||||
| Balance Sheet | ||||||||||||||||||||
| Retained earnings (loss) | $ | $ | ( | $ | ( | |||||||||||||||
| Accumulated other comprehensive loss, net of tax | $ | ( | $ | ( | $ | |||||||||||||||
| Statement of Cash Flows | ||||||||||||||||||||
| Operating Activities: | ||||||||||||||||||||
| Net income | $ | $ | $ | |||||||||||||||||
| Adjustments to reconcile net income to net cash provided by operating activities: | ||||||||||||||||||||
| Net loss from sales of businesses | $ | $ | $ | ( | ||||||||||||||||
| Change in operating assets and liabilities: | ||||||||||||||||||||
| Retirement benefits | $ | $ | ( | $ | ( | |||||||||||||||
| Statements of Changes in Consolidated Equity | ||||||||||||||||||||
| Retained Earnings (Loss) | ||||||||||||||||||||
| Net income | $ | $ | $ | |||||||||||||||||
| Balance, January 1, 2023 | $ | $ | ( | $ | ( | |||||||||||||||
| Accumulated Other Comprehensive Income (Loss) | ||||||||||||||||||||
| Other comprehensive income | $ | $ | $ | ( | ||||||||||||||||
| Balance, January 1, 2023 | $ | ( | $ | ( | $ | |||||||||||||||
| Total Equity | ||||||||||||||||||||
| Net income | $ | $ | $ | |||||||||||||||||
| Other comprehensive income | $ | $ | $ | ( | ||||||||||||||||
54
| For the Fiscal Year Ending January 2, 2022 | As Computed Under Previous Policy | As Reported under New Policy | Effect of Accounting Change | |||||||||||||||||
| (dollars in millions, except per share data) | ||||||||||||||||||||
| Statement of Operations | ||||||||||||||||||||
| Nonoperating retirement benefit income | $ | $ | $ | |||||||||||||||||
| Income before income taxes | $ | $ | $ | |||||||||||||||||
| Net income (loss) | $ | ( | $ | $ | ||||||||||||||||
| Net income (loss) attributable to ATI | $ | ( | $ | $ | ||||||||||||||||
| Basic net income (loss) per common share | $ | ( | $ | $ | ||||||||||||||||
| Diluted net income (loss) per common share | $ | ( | $ | $ | ||||||||||||||||
| Statement of Comprehensive Income (Loss) | ||||||||||||||||||||
| Net income (loss) | $ | ( | $ | $ | ||||||||||||||||
| Postretirement benefit plans | ||||||||||||||||||||
| Actuarial gain/loss | ||||||||||||||||||||
| Amortization of net actuarial loss | $ | $ | $ | ( | ||||||||||||||||
| Net gain arising during the period | $ | $ | $ | ( | ||||||||||||||||
| Total | $ | $ | $ | ( | ||||||||||||||||
| Other comprehensive income, net of tax | $ | $ | $ | ( | ||||||||||||||||
| Balance Sheet | ||||||||||||||||||||
| Retained earnings (loss) | $ | $ | ( | $ | ( | |||||||||||||||
| Accumulated other comprehensive loss, net of tax | $ | ( | $ | ( | $ | |||||||||||||||
| Statement of Cash Flows | ||||||||||||||||||||
| Operating Activities: | ||||||||||||||||||||
| Net income (loss) | $ | ( | $ | $ | ||||||||||||||||
| Change in operating assets and liabilities: | ||||||||||||||||||||
| Retirement benefits | $ | ( | $ | ( | $ | ( | ||||||||||||||
| Statements of Changes in Consolidated Equity | ||||||||||||||||||||
| Retained Earnings (Loss) | ||||||||||||||||||||
| Net income (loss) | $ | ( | $ | $ | ||||||||||||||||
| Cumulative effect of change in accounting principle | $ | $ | ( | $ | ( | |||||||||||||||
| Balance, January 2, 2022 | $ | $ | ( | $ | ( | |||||||||||||||
| Accumulated Other Comprehensive Income (Loss) | ||||||||||||||||||||
| Other comprehensive income | $ | $ | $ | ( | ||||||||||||||||
| Cumulative effect of change in accounting principle | $ | $ | $ | |||||||||||||||||
| Balance, January 2, 2022 | $ | ( | $ | ( | $ | |||||||||||||||
| Total Equity | ||||||||||||||||||||
| Net income (loss) | $ | ( | $ | $ | ||||||||||||||||
| Other comprehensive income | $ | $ | $ | ( | ||||||||||||||||
55
Cash and Cash Equivalents
Cash equivalents are highly liquid investments that are readily convertible to cash with original maturities of three months or less.
Accounts Receivable
Accounts receivable are presented net of a reserve for doubtful accounts of $3.2 million and $7.7 million at December 31, 2023 and January 1, 2023, respectively. Trade credit is extended based upon evaluations of each customer’s ability to perform its obligations, which are updated periodically. The Company’s accounts receivable reserves are determined based on expected credit losses. Amounts are written-off against the reserve in the period it is determined that the receivable is uncollectible.
Inventories
Inventories are stated at the lower of cost (first-in, first-out (FIFO) and average cost methods) or net realizable value. Costs include direct material, direct labor and applicable manufacturing and engineering overhead, and other direct costs. The term net realizable value is defined as estimated selling price in the ordinary course of business, less reasonably predictable costs of completion, disposal and transportation.
The Company evaluates product lines on a quarterly basis to identify inventory carrying values that exceed estimated net realizable value. The calculation of a resulting reserve, if any, is recognized as an expense in the period that the need for the reserve is identified. It is the Company’s general policy to write-down to scrap value any inventory that is identified as slow-moving or aged more than twelve months, subject to sales, backlog and anticipated order considerations. In some instances this aging criterion is up to twenty-four months. Inventory valuation reserves also include amounts pertaining to intercompany profit elimination between different subsidiaries.
Long-Lived Assets
Property, plant and equipment are recorded at cost, including capitalized interest, and include long-lived assets acquired under finance leases. Depreciation is primarily recorded using the straight-line method. The Company periodically reviews estimates of useful life and production capacity assigned to new and in service assets. Significant enhancements, including major maintenance activities that extend the lives of property and equipment, are capitalized. Costs related to repairs and maintenance are charged to expense in the period incurred. The cost and related accumulated depreciation of property and equipment retired or disposed of are removed from the accounts and any related gains or losses are included in income.
The Company monitors the recoverability of the carrying value of its long-lived assets. An impairment charge is recognized when an indicator of impairment occurs and the expected net undiscounted future cash flows from an asset’s use (including any proceeds from disposition) are less than the asset’s carrying value and the asset’s carrying value exceeds its fair value. If an impairment loss is recognized, the adjusted carrying value of the long-lived asset is its new cost basis and this new cost basis is depreciated over the remaining useful life of the asset. Assets to be disposed of by sale are stated at the lower of their fair values or carrying amounts and depreciation is no longer recognized.
Leases
The Company classifies leases as either operating or financing, and records a right-of-use (ROU) asset and a lease liability on the consolidated balance sheets as further discussed below. The lease liability is equal to the present value of the minimum lease payments for the term of the lease, including any optional renewal periods determined to be reasonably certain to be exercised, using the discount rate determined at lease commencement. This discount rate is the rate implicit in the lease, if known; otherwise, the incremental borrowing rate (IBR) for the expected lease term is used. The Company’s IBRs approximate the rate the Company would have to pay to borrow on a collateralized basis over a similar term at lease inception. The ROU asset is equal to the initial measurement of the lease liability plus any lease payments made to the lessor at or before the commencement date and any unamortized initial direct costs incurred by the lessee, less any unamortized lease incentives received. The Company has elected to not separate lease components from non-lease components for all asset classes, and has made an accounting policy election to apply the short-term exception, which does not require the capitalization of leases with terms of 12 months or less.
The Company has lease contracts for real property and machinery and equipment. At inception of a contract, the Company determines whether the contract is or contains a lease. If the Company has a right to obtain substantially all of the economic benefits from the use of the identified asset and the right to direct the use of the asset, then the contract contains a lease. Several of the Company’s real property lease contracts include options to extend the lease term, and the Company reassesses the likelihood of renewal on at least an annual basis. In addition, several real property leases include variable lease payments, for items such as common area maintenance and utilities, which are expensed as incurred as variable lease expense.
56
There are two types of leases: operating leases and finance leases. Lease classification is determined at lease commencement. A finance lease exists when specific criteria are met that indicate that all the risk and rewards related to the leased assets are transferred to the lessee. All other leases not meeting the finance lease criteria are classified as operating leases. Operating lease expense is recognized on a straight-line basis on the consolidated statement of operations. Finance leases have front-loaded expense recognition which is reported as amortization expense and interest expense on the consolidated statement of operations. ROU assets for operating leases are classified in , and ROU assets for finance leases are classified in on the consolidated balance sheet. For operating leases, short-term lease liabilities are classified in , and long-term lease liabilities are classified in on the consolidated balance sheet. For finance leases, short-term lease liabilities are classified in , and long-term lease liabilities are classified in on the consolidated balance sheet. On the cash flow statement, payments for operating leases are classified as operating activities. Payments for finance leases are classified as a financing activity, with the exception of the interest component of the payment which is classified as an operating activity.
Goodwill
Goodwill is reviewed annually for impairment, or more frequently if impairment indicators arise. The review for goodwill impairment requires a comparison of the fair value of each reporting unit that has goodwill associated with its operations with its carrying amount, including goodwill. If this comparison reflects impairment, then the loss would be measured as the excess of the carrying value over the calculated fair value.
Generally accepted accounting principles provide the option to qualitatively assess goodwill for impairment before completing a quantitative assessment. Under the qualitative approach, if, after assessing the totality of events or circumstances, including both macroeconomic, industry and market factors, and entity-specific factors, the Company determines it is likely (more likely than not) that the fair value of a reporting unit is greater than its carrying amount, then the quantitative impairment analysis is not required. The quantitative assessment may be performed each year for a reporting unit at the Company’s option without first performing a qualitative assessment. The Company’s quantitative assessment of goodwill for possible impairment includes estimating the fair market value of a reporting unit which has goodwill associated with its operations using discounted cash flow and multiples of cash earnings valuation techniques, plus valuation comparisons to recent public sale transactions of similar businesses, if any. These impairment assessments and valuation methods require the Company to make estimates and assumptions regarding revenue growth, changes in working capital and capital expenditures, selling prices and profitability that drive cash flows, and the weighted average cost of capital. Many of these assumptions are determined by reference to market participants identified by the Company. Although management believes that the estimates and assumptions used were reasonable, actual results could differ from those estimates and assumptions.
Other events and changes in circumstances may also require goodwill to be tested for impairment between annual measurement dates. While a decline in stock price and market capitalization is not specifically cited as a goodwill impairment indicator, a company’s stock price and market capitalization should be considered in determining whether it is more likely than not that the fair value of a reporting unit is less that its carrying value. Additionally, a significant decline in a company’s stock price may suggest that an adverse change in the business climate may have caused the fair value of one or more reporting units to fall below carrying value. A sustained decline in market capitalization below book value may be determined to require an interim goodwill impairment review.
Environmental
Costs that mitigate or prevent future environmental contamination or extend the life, increase the capacity or improve the safety or efficiency of property utilized in current operations are capitalized. Other costs that relate to current operations or an existing condition caused by past operations are expensed. Environmental liabilities are recorded when the Company’s liability is probable and the costs are reasonably estimable, but generally not later than the completion of the feasibility study or the Company’s recommendation of a remedy or commitment to an appropriate plan of action. The accruals are reviewed periodically and, as investigations and remediations proceed, adjustments of the accruals are made to reflect new information as appropriate. Accruals for losses from environmental remediation obligations are not discounted to their present value. The accruals are not reduced by possible recoveries from insurance carriers or other third parties, but do reflect allocations among potentially responsible parties (PRPs) at Federal Superfund sites or similar state-managed sites after an assessment is made of the likelihood that such parties will fulfill their obligations at such sites and after appropriate cost-sharing or other agreements are entered. The measurement of environmental liabilities by the Company is based on currently available facts, present laws and regulations, and current technology. Such estimates take into consideration the Company’s prior experience in site investigation and remediation, the data concerning cleanup costs available from other companies and regulatory authorities, and the professional judgment of the Company’s environmental experts in consultation with outside environmental specialists, when necessary.
57
Foreign Currency Translation
Assets and liabilities of international operations are translated into U.S. dollars using fiscal year-end exchange rates, while revenues and expenses are translated at average exchange rates during the period. The resulting net translation adjustments are recorded as a component of accumulated other comprehensive income (loss) in stockholders’ equity.
Sales Recognition
The following is the Company’s accounting policy as it relates to Accounting Standards Codification Topic 606 (ASC 606), Contracts with Revenue from Customers. This guidance provides a five-step analysis of transactions to determine when and how revenue is recognized, and requires an entity to recognize revenue to depict the transfer of promised goods or services to customers in an amount that reflects the consideration to which the entity expects to be entitled in exchange for those goods or services.
The following is the Company’s accounting policy as it relates to the five-step analysis for revenue recognition:
1.Identify the contract: The Company has determined that the contract with the customer is established when the customer purchase order is accepted or acknowledged. Long-term agreements (LTAs), which typically extend multiple years, are used by the Company and certain of its customers for its specialty materials, in the form of mill products, powders, parts and components, to reduce their supply uncertainty. While these LTAs generally define commercial terms including pricing, termination clauses and other contractual requirements, they do not represent the contract with the customer.
2.Identify the performance obligation in the contract: When the Company accepts or acknowledges the customer purchase order, the type of good or service is defined on a line by line basis. Individual performance obligations are established by virtue of the individual line items identified on the sales order acknowledgment at the time of issuance. Generally, the Company’s revenue relates to the sale of goods and contains a single performance obligation for each distinct good. Conversion services that transform customer-owned inventory to a different dimension, product form, and/or changed mechanical properties are classified as “goods”.
3.Determine the transaction price: Pricing is also defined on a sales order acknowledgment on a line item basis and includes an estimate of variable consideration when required by the terms of the individual customer contract. Variable consideration is when the selling price of the good is not known or is subject to adjustment under certain conditions. Types of variable consideration may include volume discounts, customer rebates and surcharges. ATI also provides assurances that goods or services will meet the product specifications contained within the acknowledged customer contract. As such, returns and refunds reserves are estimated based upon past product line history or, at certain locations, on a claim by claim basis.
4.Allocate the transaction price to the performance obligation: Since a customer contract generally contains only one performance obligation, this step of the analysis is generally not applicable to the Company.
5.Recognize revenue when or as the performance obligation is satisfied: Performance obligations generally occur at a point in time and are satisfied when control passes to the customer. For most transactions, control passes at the time of shipment in accordance with agreed upon delivery terms. On occasion, shipping and handling charges occur after the customer obtains control of the good. When this occurs, the shipping and handling services are considered activities to fulfill the promise to transfer the good.
Certain customer agreements involving production of parts and components require revenue to be recognized over time due to there being no alternative use for the product without significant economic loss and an enforceable right to payment including a normal profit margin from the customer in the event of contract termination. The Company uses an input method for determining the amount of revenue, and associated standard cost, to recognize over-time revenue, cost and gross margin for these customer agreements. The input methods used for these agreements include costs incurred and labor hours expended, both of which give an accurate representation of the progress made toward complete satisfaction of that particular performance obligation.
Contract assets are recognized when ATI’s conditional right to consideration for goods or services have transferred to the customer. A conditional right indicates that additional performance obligations associated with the contract are yet to be satisfied. Contract assets are assessed separately for impairment purposes. If ATI’s right to consideration from the customer is unconditional, this asset is accounted for as a receivable and presented separately from other contract assets. A right is unconditional if nothing other than the passage of time is required before payment of that consideration is due. Performance obligations that are recognized as revenue at a point-in-time and are billed to the customer are recognized as accounts
58
receivable. Payment terms vary from customer to customer depending upon credit worthiness, prior payment history and other credit considerations.
Contract costs are the incremental costs of obtaining and fulfilling a contract (i.e., costs that would not have been incurred if the contract had not been obtained) to provide goods and services to customers. Contract costs for ATI largely consist of design and development costs for molds, dies and other tools that ATI will own and that will be used in producing the products under the supply arrangement. Contract costs are classified as non-current assets and amortized to expense on a systematic and rational basis over a period consistent with the transfer to the customer of the goods or services to which the asset relates.
Contract liabilities are recognized when ATI has received consideration from a customer to transfer goods or services at a future point in time when the Company performs under the contract. Elements of variable consideration discussed above may be recorded as contract liabilities. In addition, progress billings and advance payments from customers for costs incurred to date are also reported as contract liabilities.
Research and Development
Research, development and technical service activities are closely interrelated and are directed toward development of new products, improvement of existing products, cost reduction, process improvement and control, quality assurance and control, development of new manufacturing methods, and improvement of existing manufacturing methods. Research and development costs are expensed as incurred. Company funded research and development costs were $20.7 million in fiscal year 2023, $16.3 million in fiscal year 2022, and $16.5 million in fiscal year 2021. Customer funded research and development costs were $1.4 million in fiscal year 2023, $1.4 million in fiscal year 2022, and $3.5 million in fiscal year 2021.
Government Assistance
The Company enters into agreements with U.S. federal agencies, U.S. state and local governments, and foreign governments that provide financial assistance and incentives supporting both new capital projects to expand and enhance manufacturing capabilities and also to sustain and maintain existing operations. Depending on the nature of the government program, the financial impacts may be recorded as a reduction to cost of sales through direct offset of labor and overhead costs or lower depreciation expense, or as a reduction of selling, general and administrative expenses for property tax abatement or other similar categories. Benefits from government assistance are recognized as the activities are incurred, subject to ongoing assessments of meeting other relevant terms such as employment or expenditure levels.
In November 2021, ATI entered into an agreement with the U.S. Department of Transportation under the Aviation Manufacturing Jobs Protection (AMJP) program for a grant of up to $22.2 million. The receipt of the award was primarily conditioned upon the Company committing to not furlough or lay off a defined group of employees in the High Performance Materials & Components (HPMC) segment operations during the six-month period of performance between November 2021 and May 2022. The AMJP grant benefit was recognized over the six-month performance period as a reduction to cost of sales in proportion to the compensation expense that the award was intended to defray, with $16.6 million recognized in fiscal year 2022 operating results. Cash receipts from the AMJP program were $11.0 million in fiscal year 2022, and this program is now completed.
ATI is a party to various U.S. states’ economic development incentive programs that provide economic benefits in the forms of property tax relief or cash payments to offset capital expenditures. These programs generally include requirements for levels of capital spending and/or employment to qualify for the government assistance. For the fiscal years ended December 31, 2023 and January 1, 2023, these state-level programs reduced selling, general and administrative expenses by $1.4 million and $1.6 million, respectively, and cash receipts were $3.4 million and $2.8 million, respectively. Receivables for ongoing programs are $1.2 million and $3.7 million as of December 31, 2023 and January 1, 2023, respectively.
Stock-based Compensation
The Company accounts for stock-based compensation transactions, such as nonvested restricted stock or stock units and performance equity awards, using fair value. Compensation expense for an award is estimated at the date of grant and is recognized over the requisite service period. Compensation expense is adjusted for equity awards that do not vest because service or performance conditions are not satisfied. However, compensation expense already recognized on plans which vest based solely on the attainment of market conditions, such as total shareholder return measures, is not adjusted based on the award attainment status at the end of the measurement period. Compensation expense is adjusted for estimated forfeitures over the award measurement period.
59
Income Taxes
The provision for, or benefit from, income taxes includes deferred taxes resulting from temporary differences in income for financial and tax purposes using the liability method. Such temporary differences result primarily from differences in the carrying value of assets and liabilities. Future realization of deferred income tax assets requires sufficient taxable income within the carryback and/or carryforward period available under tax law.
The Company evaluates on a quarterly basis whether, based on all available evidence, it is probable that the deferred income tax assets are realizable. Valuation allowances are established when it is estimated that it is more likely than not that the tax benefit of the deferred tax asset will not be realized. The evaluation includes the consideration of all available evidence, both positive and negative, regarding the estimated future reversals of existing taxable temporary differences, estimated future taxable income exclusive of reversing temporary differences and carryforwards, historical taxable income in prior carryback periods if carryback is permitted, and potential tax planning strategies which may be employed to prevent an operating loss or tax credit carryforward from expiring unused. The verifiable evidence such as future reversals of existing temporary differences and the ability to carryback are considered before the subjective sources such as estimated future taxable income exclusive of temporary differences and tax planning strategies.
It is the Company’s policy to classify interest and penalties recognized on underpayment of income taxes as income tax expense. It is also the Company’s policy to recognize deferred tax amounts stranded in accumulated other comprehensive income (AOCI), which result from tax rate differences on changes in AOCI balances, as an element of income tax expense in the period that the related balance sheet item associated with the AOCI balance ceases to exist. In the case of derivative financial instruments accounted for as hedges, or marketable securities, ATI uses the portfolio method where the stranded deferred tax amount is recognized when all items of a particular category, such as cash flow hedges of a particular risk such as a foreign currency hedge, are settled. In the case of defined benefit pension and other postretirement benefit plans, the stranded deferred tax balance is recognized as an element of income tax expense in the period the benefit plan is extinguished or divested.
Net Income Per Common Share
Basic and diluted net income per share are calculated by dividing the net income available to common stockholders by the weighted average number of common shares outstanding during the fiscal year. Diluted amounts assume the issuance of common stock for all potentially dilutive share equivalents outstanding. The calculations of all diluted income/loss per share figures for a period exclude the potentially dilutive effect of dilutive share equivalents if there is a net loss since the inclusion in the calculation of additional shares in the net loss per share would result in a lower per share loss and therefore be anti-dilutive.
New Accounting Pronouncements Adopted
In August 2020, the Financial Accounting Standards Board (FASB) issued new accounting guidance related to accounting for convertible instruments. Under this new guidance, embedded conversion features are no longer separated from the host contract for convertible instruments with conversion features that are not required to be accounted for as derivatives, or that do not result in substantial premiums accounted for as paid-in capital. As such, a convertible debt instrument will be accounted for as a single liability measured at its amortized cost, as long as no other features require bifurcation and recognition as derivatives. By removing those separation models, the reported interest rate of convertible debt instruments typically will be closer to the coupon interest rate. The new guidance also addresses how convertible instruments are accounted for in the diluted earnings per share calculation, requiring the if-converted method, and requires enhanced disclosures about the terms of convertible instruments and contracts in an entity’s own equity. This new guidance was effective for the Company in fiscal year 2022, with early adoption permitted.
The Company early adopted this new accounting guidance related to accounting for convertible instruments effective January 4, 2021 using the modified transition approach with the cumulative effect recognized as an adjustment to the opening balance of retained earnings. This new guidance was applicable to the Company’s 3.5 45.4 million and stockholders’ equity decreased by the same amount, representing the net impact of two adjustments: (1) the $49.8 million value of the embedded conversion, which is net of allocated offering costs, previously classified in additional paid-in capital in stockholders’ equity, and (2) a $4.4 million increase to retained earnings for the cumulative effect of adoption primarily related to the non-cash interest expense recorded in fiscal year 2020 for the amortization of the portion of the 2025 Convertible Notes allocated to stockholders’ equity. Prospectively, the reported interest expense for the 2025 Convertible Notes no longer included the non-cash interest expense of the equity component as required under prior accounting standards and is closer to the 3.5
60
previously applied the if-converted method to the 2025 Convertible Notes given ATI’s flexibility to settle conversions of the 2025 Convertible Notes in cash, shares of ATI’s common stock or a combination thereof, at ATI’s election.
In September 2022, the FASB issued new accounting guidance related to disclosures about supplier finance programs. Supplier finance programs allow a buyer to offer its suppliers the option for access to payment in advance of an invoice due date, which is paid by a third-party finance provider or intermediary on the basis of invoices that the buyer has confirmed as valid. This new guidance requires a buyer in a supplier finance program to disclose sufficient information about the program to allow a user of financial statements to understand the program’s nature, activity during the period, changes from period to period, and potential magnitude, using both qualitative and quantitative information about its supplier finance programs. This new guidance, with the exception of disclosures on rollforward information, is effective for the Company in fiscal year 2023. The Company adopted this new accounting guidance effective January 2, 2023. The rollforward information disclosures are effective for the Company in fiscal year 2024, with early adoption permitted. The Company did not early adopt this guidance. The adoption of these changes did not have an impact on the Company’s consolidated financial statements other than disclosure requirements which are included in Note 9.
Pending Accounting Pronouncements
In November 2023, the FASB issued new accounting guidance related to segment reporting disclosures. This guidance requires additional disclosures on an annual and interim basis of segment information, including significant segment expenses that are regularly provided to the chief operating decision maker (CODM) and the presentation and composition of other segment items, which is the difference between segment revenue less segment expenses and the measure of segment profit or loss. The guidance also requires that all current segment disclosures required on an annual basis be provided on an interim basis and requires disclosure of the title and position of the CODM and how the CODM uses the reported measure of segment profit or loss in assessing performance and allocating resources. This guidance does not change how an entity identifies its reportable segments. This new guidance for annual disclosures will be effective for the Company for fiscal year 2024 and for interim disclosures will be effective for the Company for fiscal year 2025. The guidance must be applied retrospectively and early adoption is permitted. The Company does not expect to early adopt this guidance and does not expect these changes to have an impact on the Company’s consolidated financial statements other than disclosure requirements.
61
Note 2. Revenue from Contracts with Customers
Disaggregation of Revenue
The Company operates in two business segments: High Performance Materials & Components (HPMC) and Advanced Alloys & Solutions (AA&S). Revenue is disaggregated within these two business segments by diversified global markets, primary geographical markets, and diversified products. Comparative information of the Company’s overall revenues (in millions) by global and geographical markets for the fiscal years ended December 31, 2023, January 1, 2023 and January 2, 2022 is as follows:
| Fiscal Year | ||||||||||||||||||||||||||||||||||||||
| (in millions) | 2023 | 2022 | 2021 | |||||||||||||||||||||||||||||||||||
| HPMC | AA&S | Total | HPMC | AA&S | Total | HPMC | AA&S | Total | ||||||||||||||||||||||||||||||
| Diversified Global Markets: | ||||||||||||||||||||||||||||||||||||||
| Aerospace & Defense: | ||||||||||||||||||||||||||||||||||||||
| Jet-Engines- Commercial | $ | $ | $ | $ | $ | $ | $ | $ | $ | |||||||||||||||||||||||||||||
| Airframes- Commercial | ||||||||||||||||||||||||||||||||||||||
| Defense | ||||||||||||||||||||||||||||||||||||||
| Total Aerospace & Defense | $ | $ | $ | $ | $ | $ | $ | $ | $ | |||||||||||||||||||||||||||||
| Energy: | ||||||||||||||||||||||||||||||||||||||
| Oil & Gas | ||||||||||||||||||||||||||||||||||||||
| Specialty Energy | ||||||||||||||||||||||||||||||||||||||
| Total Energy | ||||||||||||||||||||||||||||||||||||||
| Automotive | ||||||||||||||||||||||||||||||||||||||
| Medical | ||||||||||||||||||||||||||||||||||||||
| Construction/Mining | ||||||||||||||||||||||||||||||||||||||
| Electronics | ||||||||||||||||||||||||||||||||||||||
| Food Equipment & Appliances | ||||||||||||||||||||||||||||||||||||||
| Other | ||||||||||||||||||||||||||||||||||||||
| Total | $ | $ | $ | $ | $ | $ | $ | $ | $ | |||||||||||||||||||||||||||||
| Fiscal Year | ||||||||||||||||||||||||||||||||||||||
| (in millions) | 2023 | 2022 | 2021 | |||||||||||||||||||||||||||||||||||
| HPMC | AA&S | Total | HPMC | AA&S | Total | HPMC | AA&S | Total | ||||||||||||||||||||||||||||||
| Primary Geographical Market: | ||||||||||||||||||||||||||||||||||||||
| United States | $ | $ | $ | $ | $ | $ | $ | $ | $ | |||||||||||||||||||||||||||||
| China | ||||||||||||||||||||||||||||||||||||||
| United Kingdom | ||||||||||||||||||||||||||||||||||||||
| Germany | ||||||||||||||||||||||||||||||||||||||
| France | ||||||||||||||||||||||||||||||||||||||
| Mexico | ||||||||||||||||||||||||||||||||||||||
| Rest of World | ||||||||||||||||||||||||||||||||||||||
| Total | $ | $ | $ | $ | $ | $ | $ | $ | $ | |||||||||||||||||||||||||||||
62
Comparative information of the Company’s major products based on their percentages of sales is included in the following table. HRPF conversion service sales in the AA&S segment are excluded from this presentation.
| Fiscal Year | ||||||||||||||||||||||||||||||||||||||
| 2023 | 2022 | 2021 | ||||||||||||||||||||||||||||||||||||
| HPMC | AA&S | Total | HPMC | AA&S | Total | HPMC | AA&S | Total | ||||||||||||||||||||||||||||||
| Diversified Products: | ||||||||||||||||||||||||||||||||||||||
| Nickel-based alloys and specialty alloys | % | % | % | % | % | % | % | % | % | |||||||||||||||||||||||||||||
| Precision forgings, castings and components | % | % | % | % | % | % | % | % | % | |||||||||||||||||||||||||||||
| Titanium and titanium-based alloys | % | % | % | % | % | % | % | % | % | |||||||||||||||||||||||||||||
| Precision rolled strip | % | % | % | % | % | % | % | % | % | |||||||||||||||||||||||||||||
| Zirconium and related alloys | % | % | % | % | % | % | % | % | % | |||||||||||||||||||||||||||||
| Total | % | % | % | % | % | % | % | % | % | |||||||||||||||||||||||||||||
The Company maintains a backlog of confirmed orders totaling $3.8 billion, $2.9 billion and $2.1 billion at December 31, 2023, January 1, 2023 and January 2, 2022, respectively. Due to the structure of the Company’s LTAs, 70 % of this backlog at December 31, 2023 represented booked orders with performance obligations that will be satisfied within the next twelve months. The backlog does not reflect any elements of variable consideration.
Accounts Receivable
As of December 31, 2023 and January 1, 2023, accounts receivable with customers were $628.2 million and $586.9 million, respectively. The following represents the rollforward of accounts receivable - reserve for doubtful accounts for the fiscal years ended December 31, 2023, January 1, 2023 and January 2, 2022:
| (in millions) | |||||
| Accounts Receivable - Reserve for Doubtful Accounts | |||||
| Balance as of January 3, 2021 | $ | ||||
| Expense to increase the reserve | |||||
| Write-off of uncollectible accounts | ( | ||||
| Balance as of January 2, 2022 | |||||
| Expense to increase the reserve | |||||
| Write-off of uncollectible accounts | ( | ||||
| Balance as of January 1, 2023 | |||||
| Expense to increase the reserve | |||||
| Write-off of uncollectible accounts | ( | ||||
| Balance as of December 31, 2023 | $ | ||||
Contract balances
The following represents the rollforward of contract assets and liabilities for the fiscal years ended December 31, 2023, January 1, 2023 and January 2, 2022:
| (in millions) | |||||||||||
| Contract Assets | |||||||||||
| Fiscal Year | |||||||||||
| Short-term | 2023 | 2022 | 2021 | ||||||||
| Balance as of beginning of fiscal year | $ | $ | $ | ||||||||
| Recognized in current year | |||||||||||
| Reclassified to accounts receivable | ( | ( | ( | ||||||||
| Reclassification to/from contract liability | ( | ( | |||||||||
| Balance as of period end | $ | $ | $ | ||||||||
63
| (in millions) | |||||||||||
| Contract Liabilities | |||||||||||
| Fiscal Year | |||||||||||
| Short-term | 2023 | 2022 | 2021 | ||||||||
| Balance as of beginning of fiscal year | $ | $ | $ | ||||||||
| Recognized in current year | |||||||||||
| Amounts in beginning balance reclassified to revenue | ( | ( | ( | ||||||||
| Current year amounts reclassified to revenue | ( | ( | ( | ||||||||
| Divestiture | ( | ||||||||||
| Other | ( | ||||||||||
| Reclassification to/from long-term and contract asset | |||||||||||
| Balance as of period end | $ | $ | $ | ||||||||
| Fiscal Year | |||||||||||
| Long-term (a) | 2023 | 2022 | 2021 | ||||||||
| Balance as of beginning of fiscal year | $ | $ | $ | ||||||||
| Recognized in current year | |||||||||||
| Reclassification to/from short-term | ( | ( | ( | ||||||||
| Balance as of period end | $ | $ | $ | ||||||||
(a) Long-term contract liabilities are included in Other long-term liabilities on the consolidated balance sheets.
Contract costs for obtaining and fulfilling a contract were $8.1 million and $7.3 million as of December 31, 2023 and January 1, 2023, respectively, which are reported in other long-term assets on the consolidated balance sheets. Amortization expense for the fiscal years ended December 31, 2023, January 1, 2023 and January 2, 2022 of these contract costs was $1.2 million, $1.0 million, and $1.0 million, respectively.
Note 3. Inventories
Inventories at December 31, 2023 and January 1, 2023 were as follows (in millions):
| Fiscal Year | ||||||||||||||
| 2023 | 2022 | |||||||||||||
| Raw materials and supplies | $ | $ | ||||||||||||
| Work-in-process | ||||||||||||||
| Finished goods | ||||||||||||||
| Inventory valuation reserves | ( | ( | ||||||||||||
| Total inventories, net | $ | $ | ||||||||||||
Note 4. Property, Plant and Equipment
Property, plant and equipment at December 31, 2023 and January 1, 2023 was as follows:
| Fiscal Year | ||||||||||||||
| (In millions) | 2023 | 2022 | ||||||||||||
| Land | $ | $ | ||||||||||||
| Buildings | ||||||||||||||
| Equipment and leasehold improvements | ||||||||||||||
| Accumulated depreciation and amortization | ( | ( | ||||||||||||
| Total property, plant and equipment, net | $ | $ | ||||||||||||
64
Construction in progress at December 31, 2023 and January 1, 2023 was $305.9 million and $262.1 million, respectively. Capital expenditures on the consolidated statement of cash flows for the fiscal years ended December 31, 2023 and January 1, 2023 exclude $41.9 million and $38.3 million, respectively, of incurred but unpaid capital expenditures that were included in property, plant and equipment and accrued at December 31, 2023 and January 1, 2023, respectively. Depreciation and amortization for the fiscal years ended December 31, 2023, January 1, 2023 and January 2, 2022 was as follows:
| Fiscal Year | ||||||||||||||||||||
| (In millions) | 2023 | 2022 | 2021 | |||||||||||||||||
| Depreciation of property, plant and equipment | $ | $ | $ | |||||||||||||||||
| Software and other amortization | ||||||||||||||||||||
| Total depreciation and amortization | $ | $ | $ | |||||||||||||||||
Note 5. Goodwill and Other Intangible Assets
At December 31, 2023 and January 1, 2023, the Company had $227.2 million of goodwill on its consolidated balance sheet, all of which relates to the HPMC segment.
The Company performs its annual goodwill impairment evaluations in the fourth quarter of each fiscal year. The $227.2 million of goodwill as of December 31, 2023 on the Company’s consolidated balance sheet is comprised of $161.2 million at the Forged Products reporting unit and $66.0 million at the Specialty Materials reporting unit. For the Company’s annual goodwill impairment evaluation in fiscal year 2023, quantitative goodwill assessments were performed for these two HPMC reporting units with goodwill. This quantitative fair value assessment includes discounted cash flow and multiples of cash earnings valuation techniques, plus valuation comparisons to recent public sale transactions of similar businesses, if any, which represents Level 3 unobservable information in the fair value hierarchy. These impairment assessments and valuation methods require the Company to make estimates and assumptions regarding revenue growth, changes in working capital and capital expenditures, selling prices and profitability that drive cash flows, and the weighted average cost of capital. Many of these assumptions are determined by reference to market participants the Company has identified. For example, the weighted average cost of capital used in the discounted cash flow assessment was 12.0 % and the long-term growth rates ranged from 3 % to 3.5 %. In order to validate the reasonableness of the estimated fair values of the reporting units as of the valuation date, a reconciliation of the aggregate fair values of all reporting units to market capitalization was performed using a reasonable control premium. Although the Company believes that the estimates and assumptions used were reasonable, actual results could differ from those estimates and assumptions. The Specialty Materials reporting unit had a fair value that was significantly in excess of carrying value. The Forged Products reporting unit had a fair value that exceeded carrying value by approximately 60 % for the fiscal year 2023 annual assessment, which increased compared to the annual evaluation for fiscal year 2022. No
No indicators of impairment were observed in fiscal years 2023, 2022 and 2021 associated with any of the Company’s long-lived assets. Accumulated goodwill impairment losses as of December 31, 2023, January 1, 2023 and January 2, 2022 were $528.0
Other intangible assets, which are included in Other assets on the accompanying consolidated balance sheets as of December 31, 2023 and January 1, 2023 were as follows:
| December 31, 2023 | January 1, 2023 | |||||||||||||||||||||||||
| (in millions) | Gross carrying amount | Accumulated amortization | Gross carrying amount | Accumulated amortization | ||||||||||||||||||||||
| Technology | $ | $ | ( | $ | $ | ( | ||||||||||||||||||||
| Customer relationships | ( | ( | ||||||||||||||||||||||||
| Trademarks | ( | ( | ||||||||||||||||||||||||
| Total amortizable intangible assets | $ | $ | ( | $ | $ | ( | ||||||||||||||||||||
Amortization expense related to intangible assets was approximately $7 million for the fiscal year ended December 31, 2023 and $8 7
65
Note 6. Divestitures
On May 12, 2022, the Company completed the sale of its Sheffield, UK operations, which included facilities for melting and re-melting, machining and bar mill operations, and was part of the Specialty Materials business in the HPMC segment. A $112.2 million loss on sale of the Sheffield operations is reported in loss on asset sales and sales of businesses, net, on the consolidated statement of operations for fiscal year 2022, and is excluded from HPMC segment results. The loss includes $26.8 million related to the UK defined benefit pension plan, of which $26.1 million was reported as a net pension asset but which was in a deficit funding position for UK statutory reporting purposes, and $0.7 million in accumulated other comprehensive loss on the consolidated ATI balance sheet. The loss also includes $20.0 million of cumulative translation adjustment foreign exchange losses since ATI’s acquisition of these operations in 1998. The Company received proceeds, net of transaction costs, of $0.3 million in fiscal year 2022, which is reported as an investing activity on the consolidated statement of cash flows. In fiscal year 2021, the Sheffield operations had external sales of $36 million, with over 80 % of its sales to energy markets, primarily oil & gas, and had a net loss before tax of $7 million.
The Company completed the sale of the Pico Rivera, CA operations, as part of the strategy to exit standard stainless products, on January 31, 2022. The Company received cash proceeds of $6.2 million on the sale of these assets in fiscal year 2022. The Company recognized a $6.8 million pretax gain on sale, including de-recognizing certain lease liabilities, which is reported in loss on asset sales and sales of businesses, net, on the consolidated statement of operations in fiscal year 2022 and is excluded from AA&S segment results.
Note 7. Joint Ventures
The financial results of majority-owned joint ventures are consolidated into the Company’s operating results and financial position, with the minority ownership interest recognized in the consolidated statement of operations as net income attributable to noncontrolling interests, and as equity attributable to the noncontrolling interests within total stockholders’ equity. Investments in which the Company exercises significant influence, but which it does not control (generally a 20% to 50% ownership interest) are accounted for under the equity method of accounting. Stockholders’ equity includes undistributed earnings of investees accounted for under the equity method of accounting of approximately $0.7 million at December 31, 2023.
Majority-Owned Joint Ventures
STAL:
The Company has a 60 % interest in the Chinese joint venture known as STAL. The remaining 40 % interest in STAL is owned by China Baowu Steel Group Corporation Limited, a state authorized investment company whose equity securities are publicly traded in the People’s Republic of China. STAL is part of ATI’s AA&S segment, and manufactures Precision Rolled Strip® (PRS) stainless products mainly for the electronics and automotive markets located in Asia. Cash and cash equivalents held by STAL as of December 31, 2023 were $75.3 million.
Next Gen Alloys LLC:
The Company has a 51 % interest in Next Gen Alloys LLC, a joint venture with GE Aviation for the development of a new meltless titanium alloy powder manufacturing technology. Next Gen Alloys LLC funds its development activities through the sale of shares to the two joint venture partners, and in the first quarter of fiscal year 2022 the Company received $0.9 million from sales of noncontrolling interests to its joint venture partner, which is reported as a financing activity on the consolidated statements of cash flows. Cash and cash equivalents held by this joint venture as of December 31, 2023 were $1.0 million.
66
Equity Method Joint Ventures
A&T Stainless:
The Company has a 50 50 % joint venture interest in A&T Stainless in fiscal year 2018 for $17.5 million, of which $12.0 million had been received by ATI through January 2, 2022. ATI received the remaining $5.5 million from Tsingshan in the fourth quarter of fiscal year 2022, which is reported as a financing activity on the consolidated statement of cash flows. The A&T Stainless operations included the Company’s previously-idled direct roll and pickle (DRAP) facility in Midland, PA. ATI provided hot-rolling conversion services to A&T Stainless using the AA&S segment’s Hot-Rolling and Processing Facility. ATI accounts for the A&T Stainless joint venture under the equity method of accounting.
In late March 2018, ATI filed for an exclusion from the Section 232 tariffs on behalf of A&T Stainless, which imported semi- finished stainless slab products from Indonesia. In April 2019, the Company learned that this exclusion request was denied by the U.S. Department of Commerce. ATI filed new requests on behalf of A&T Stainless for exclusion from the Section 232 tariffs in October 2019. These requests were denied by the U.S. Department of Commerce in the second quarter of fiscal year 2020, and the 25% tariff remained in place. Due to repeated tariff exclusion denials, the DRAP facility was idled in an orderly shut down process that was completed in fiscal year 2020. ATI’s share of the A&T Stainless results were losses of $1.8 million and $0.9 million for the fiscal years ended December 31, 2023 and January 2, 2022, respectively, and were income of $9.1 million for the fiscal year ended January 1, 2023, which are included within other income/expense, net, on the consolidated statements of operations. In April 2022, ATI and A&T Stainless entered into a settlement agreement with the United States pursuant to which the United States, without admitting liability, agreed to refund a substantial portion of the Section 232 tariffs previously paid by A&T Stainless. As a result of the settlement agreement, A&T Stainless recorded tariff refunds and accrued interest of approximately $19.7 million, which was recognized as income by the joint venture in fiscal year 2022. ATI’s share of the A&T Stainless results for the fiscal year ended January 1, 2023 included ATI’s $9.9 million share of this tariff refund and accrued interest. AA&S segment results in fiscal years 2023 and 2021 include equity method recognition of A&T Stainless operating losses of $1.8 million and $0.9 million, respectively, and in fiscal year 2022 include equity method recognition of A&T Stainless operating income of $8.2 million. In fiscal year 2022, A&T Stainless reversed $1.8 million of previously-recognized charges for contractual termination benefits as a result of revised estimates and ATI’s share of this credit for termination benefits in fiscal year 2022 was excluded from AA&S segment results.
As of December 31, 2023, ATI had net receivables from A&T Stainless for working capital advances and administrative services of $1.5 million, of which $0.5 million was reported in prepaid expenses and other current assets and $1.0 million in other long-term assets on the consolidated balance sheet. As of January 1, 2023, ATI had net receivables from A&T Stainless for working capital advances and administrative services of $3.2 million, of which $0.4 million was reported in prepaid expenses and other current assets and $2.8 million in other long-term assets on the consolidated balance sheet.
Uniti:
ATI had a 50 % interest in the industrial titanium joint venture known as Uniti LLC (Uniti), with the remaining 50 % interest held by VSMPO, a Russian producer of titanium, aluminum, and specialty steel products. On March 9, 2022, the Company announced the termination of Uniti, and this joint venture is expected to be fully dissolved in the first quarter of fiscal year 2024. No impairments were recorded as a result of the decision to terminate the Uniti joint venture. Uniti was accounted for under the equity method of accounting. ATI’s share of Uniti’s income was $0.2 million in fiscal year 2023, $4.4 million in fiscal year 2022, and $1.0 million in fiscal year 2021, which is included in AA&S segment’s operating results, and within other income/expense, net, on the consolidated statements of operations. Sales to Uniti, which are included in ATI’s consolidated statements of operations, were $4.9 million in fiscal year 2023, $45.0 million in fiscal year 2022, and $45.8 million in fiscal year 2021. Accounts receivable from Uniti was $4.5 million at January 1, 2023.
67
Note 8. Asset Retirement Obligations
The Company maintains reserves where a legal obligation exists to perform an asset retirement activity and the fair value of the liability can be reasonably estimated. These asset retirement obligations (AROs) include liabilities where the timing and (or) method of settlement may be conditional on a future event, that may or may not be within the control of the entity. At December 31, 2023, the Company had recognized AROs of $18.3 million related to landfill closures, decommissioning costs, facility leases and conditional AROs associated with manufacturing activities using what may be characterized as potentially hazardous materials.
Estimates of AROs are evaluated annually in the fourth quarter, or more frequently if material new information becomes known. Accounting for asset retirement obligations requires significant estimation and in certain cases, the Company has determined that an ARO exists, but the amount of the obligation is not reasonably estimable. The Company may determine that additional AROs are required to be recognized as new information becomes available.
Changes in asset retirement obligations for the years ended December 31, 2023 and January 1, 2023 were as follows:
| Fiscal Year | ||||||||||||||
| (In millions) | 2023 | 2022 | ||||||||||||
| Balance at beginning of fiscal year | $ | $ | ||||||||||||
| Accretion expense | ||||||||||||||
| Payments | ( | ( | ||||||||||||
| Balance at end of fiscal year | $ | $ | ||||||||||||
Note 9. Supplemental Financial Statement Information
Cash and cash equivalents at December 31, 2023 and January 1, 2023 were as follows:
| Fiscal Year | ||||||||||||||
| (In millions) | 2023 | 2022 | ||||||||||||
| Cash | $ | $ | ||||||||||||
| Other short-term investments | ||||||||||||||
| Total cash and cash equivalents | $ | $ | ||||||||||||
Other current liabilities included salaries, wages and other employee-related liabilities of $102.3 million and $100.8 million at December 31, 2023 and January 1, 2023, respectively, and accrued interest of $23.7 million and $11.8 million at December 31, 2023 and January 1, 2023, respectively.
Other income (expense) for the fiscal years ended December 31, 2023, January 1, 2023, and January 2, 2022 was as follows:
| Fiscal Year | ||||||||||||||||||||
| (in millions) | 2023 | 2022 | 2021 | |||||||||||||||||
| Rent, royalty income and other income | $ | $ | $ | |||||||||||||||||
| Gains from disposal of property, plant and equipment, net | ||||||||||||||||||||
| Net equity income (loss) on joint ventures (See Note 7) | ( | |||||||||||||||||||
| Gain on sales of businesses, net (See Note 6) | ||||||||||||||||||||
| Joint venture restructuring credit (charge) (See Note 7) | ||||||||||||||||||||
| Litigation settlement (See Note 21) | ( | |||||||||||||||||||
| Other | ||||||||||||||||||||
| Total other income (expense), net | $ | $ | ( | $ | ||||||||||||||||
Supplier Financing
68
Note 10. Debt
Debt at December 31, 2023 and January 1, 2023 was as follows:
| Fiscal Year | ||||||||||||||
| (In millions) | 2023 | 2022 | ||||||||||||
ATI Inc. | $ | $ | ||||||||||||
ATI Inc. | ||||||||||||||
ATI Inc. | ||||||||||||||
ATI Inc. | ||||||||||||||
ATI Inc. | ||||||||||||||
Allegheny Ludlum | ||||||||||||||
| ABL Term Loan | ||||||||||||||
| U.S. revolving credit facility | ||||||||||||||
| Foreign credit agreements | ||||||||||||||
| Finance leases and other | ||||||||||||||
| Debt issuance costs | ( | ( | ||||||||||||
| Total short-term and long-term debt | ||||||||||||||
| Short-term debt and current portion of long-term debt | ||||||||||||||
| Total long-term debt | $ | $ | ||||||||||||
(a)The payment obligations of these debentures issued by Allegheny Ludlum, LLC are fully and unconditionally guaranteed by ATI.
Interest expense was $105.8 million in fiscal year 2023, $92.1 million in fiscal year 2022, and $97.6 million in fiscal year 2021. Interest expense was reduced by $13.5 million, $5.1 million, and $4.3 million, in fiscal years 2023, 2022, and 2021, respectively, from interest capitalization on capital projects. Interest and commitment fees paid were $114.7 million in fiscal year 2023, $92.8 million in fiscal year 2022, and $97.5 million in fiscal year 2021. Net interest expense includes interest income of $13.0 million in fiscal year 2023, $4.7 million in fiscal year 2022, and $0.7 million in fiscal year 2021.
Scheduled principal payments during the next five fiscal years are $31.9 million in 2024, $465.3 million in 2025, $18.5 million in 2026, $565.3 million in 2027, and $9.6 million in 2028. See Note 11, Leases, for the portion of these scheduled principal payments that are related to finance leases.
Debt Extinguishment Charge
In October 2021, ATI recognized a $65.5 million debt extinguishment charge on the redemption of its 5.875 % Senior Notes due 2023 (2023 Notes), which included a $64.5 million cash make-whole payment related to the early extinguishment of the 2023 Notes as required by the applicable indenture, and a $1.0 million charge for deferred debt issue costs, as further discussed below.
2030 Notes
In August 2023, ATI issued $425 million aggregate principal amount of 7.25 % Senior Notes due 2030 (2030 Notes). Interest on the 2030 Notes is payable semi-annually in arrears at a rate of 7.25 % per year. The 2030 Notes will mature on August 15, 2030. Net proceeds were $418.8 million from this issuance, of which $222 million was used to fund ATI’s U.S. qualified defined benefit pension plan in order to facilitate a pension derisking strategy (see Note 14), and the remaining proceeds were used for liquidity and general corporate purposes. Underwriting fees and other third-party expenses for the issuance of the 2030 Notes were $6.2 million, and are being amortized to interest expense over the 7-year term of the 2030 Notes. The 2030 Notes are unsecured and unsubordinated obligations of the Company and equally ranked with all of its existing and future senior unsecured debt. The 2030 Notes restrict the Company’s ability to create certain liens, to enter into sale leaseback transactions, guarantee indebtedness and to consolidate or merge all, or substantially all, of its assets. The Company has the option to redeem the 2030 Notes, as a whole or in part, at any time or from time to time, on at least 15 days, but not more than 60 days, prior notice to the holders of the Notes at redemption prices specified in the 2030 Notes. The 2030 Notes are subject to repurchase upon the occurrence of a change in control repurchase event (as defined in the 2030 Notes) at a repurchase price in cash equal to 101 % of the aggregate principal amount of the Notes repurchased, plus any accrued and unpaid interest on the 2030 Notes repurchased.
69
2029 and 2031 Notes
On September 14, 2021, ATI issued $325 million aggregate principal amount of 4.875 350 million aggregate principal amount of 5.125 4.875 5.125 665.7 million from both of these issuances were primarily used to fund the full redemption of the $500 million aggregate principal amount outstanding of the 2023 Notes on October 14, 2021, including a make-whole payment and accrued interest, resulting in a $65.5 million debt extinguishment charge.
Underwriting fees and other third-party expenses for the issuance of the 2029 and 2031 Notes were $4.7 8-year and 10-year terms of the 2029 and 2031 Notes, respectively. The 2029 and 2031 Notes are unsecured and unsubordinated obligations of the Company and equally ranked with all of its existing and future senior unsecured debt. The 2029 and 2031 Notes restrict the Company’s ability to create certain liens, to enter into sale leaseback transactions, guarantee indebtedness and to consolidate or merge all, or substantially all, of its assets. The Company has the option to redeem the 2029 and 2031 Notes, as a whole or in part, at any time or from time to time, on at least 15 days, but not more than 60 days, prior notice to the holders of the Notes at redemption prices specified in the 2029 and 2031 Notes. The 2029 and 2031 Notes are subject to repurchase upon the occurrence of a change in control repurchase event (as defined in the 2029 and 2031 Notes) at a repurchase price in cash equal to 101 % of the aggregate principal amount of the Notes repurchased, plus any accrued and unpaid interest on the 2029 or 2031 Notes repurchased, as applicable.
2025 Convertible Notes
As of December 31, 2023, the Company had $291.4 million aggregate principal amount of 3.5 864 million and $590 million, respectively, based on the quoted market price, which is classified in Level 1 of the fair value hierarchy. The 2025 Convertible Notes have a 3.5 4.2 2.9 million and $4.8 million at December 31, 2023 and January 1, 2023, respectively. Interest expense on the 2025 Convertible Notes was as follows:
| Fiscal Year | |||||||||||||||||
| (in millions) | 2023 | 2022 | 2021 | ||||||||||||||
| Contractual coupon rate | $ | $ | $ | ||||||||||||||
| Amortization of debt issuance costs | |||||||||||||||||
| Total interest expense | $ | $ | $ | ||||||||||||||
Currently, and prior to the 41st scheduled trading day immediately preceding the maturity date, the Company may redeem all or any portion of the 2025 Convertible Notes, at its option, at a redemption price equal to 100 % of the principal amount thereof, plus any accrued and unpaid interest if the last reported sale price of ATI’s common stock has been at least 130 % of the conversion price then in effect for at least 20 trading days (whether or not consecutive) during any 30 consecutive trading day period (including the last trading day of such period) ending on the trading day immediately preceding the date on which ATI provides written notice of redemption.
The initial conversion rate for the 2025 Convertible Notes is 64.5745 shares of ATI common stock per $1,000 principal amount of the 2025 Convertible Notes, equivalent to an initial conversion price of approximately $15.49 per share (18.8 million shares). Prior to the close of business on the business day immediately preceding March 15, 2025, the 2025 Convertible Notes will be convertible at the option of the holders of 2025 Convertible Notes only upon the satisfaction of specified conditions and during certain periods. Thereafter, until the close of business on the second scheduled trading day immediately preceding the maturity date, the 2025 Convertible Notes will be convertible at the option of holders of 2025 Convertible Notes at any time regardless of these conditions. Conversions of the 2025 Convertible Notes may be settled in cash, shares of ATI’s common stock or a combination thereof, at ATI’s election.
Holders of the 2025 Convertible Notes may require ATI to repurchase their 2025 Convertible Notes upon the occurrence of certain events that constitute a fundamental change under the indenture governing the 2025 Convertible Notes at a purchase price equal to 100 % of the principal amount thereof, plus any accrued and unpaid interest to, but excluding, the fundamental change repurchase date. In connection with certain corporate events or if ATI issues a notice of redemption, it will, under
70
certain circumstances, increase the conversion rate for holders who elect to convert their 2025 Convertible Notes in connection with such corporate event or during the relevant redemption period.
In connection with the pricing of the 2025 Convertible Notes, ATI entered into privately negotiated capped call transactions with certain of the initial purchasers or their respective affiliates. The capped call transactions are expected generally to reduce potential dilution to ATI’s common stock upon any conversion of the 2025 Convertible Notes and/or offset any cash payments ATI is required to make in excess of the principal amount of converted 2025 Convertible Notes, as the case may be, with such reduction and/or offset subject to a cap based on the cap price. The cap price of the capped call transactions initially is approximately $19.76 per share, and is subject to adjustments under the terms of the capped call transactions.
2022 Convertible Notes
In fiscal year 2022, $82.5 million of the 2022 Convertible Senior Notes were converted into 5.7 million shares of ATI common stock, with the remaining $1.7 million of outstanding principal balance paid in cash for notes that were not converted at the July 1, 2022 maturity date. The conversion rate for the 2022 Convertible Notes was 69.2042 shares of ATI common stock per $1,000 principal amount of the 2022 Convertible Notes, equivalent to a conversion price of $14.45 per share.
Interest on the 2022 Convertible Notes at the 4.75 % cash coupon rate was payable semi-annually in arrears on each January 1 and July 1. Including amortization of deferred issuance costs, the effective interest rate was 5.4 Interest expense on the 2022 Convertible Notes was as follows:
| Fiscal Year | ||||||||||||||
| (in millions) | 2022 | 2021 | ||||||||||||
| Contractual coupon rate | $ | $ | ||||||||||||
| Amortization of debt issuance costs | ||||||||||||||
| Total interest expense | $ | $ | ||||||||||||
2023 Notes
The 5.875 % stated interest rate payable on the 2023 Notes was subject to adjustment in the event of changes in the credit ratings on the 2023 Notes by either Moody’s or Standard & Poor’s. Each notch of credit rating downgrade from the credit ratings in effect when the 2023 Notes were issued in July 2013 increased interest expense by 0.25 % on the 2023 Notes, up to a maximum 4 notches by each of the two rating agencies, or a total 2.0 % potential interest rate change up to 7.875 %. The annual interest rate on the 2023 Notes was at the maximum 7.875 % from February 2016 until their redemption in October 2021 as discussed above.
Credit Agreements
The Company has an Asset Based Lending (ABL) Credit Facility, which is collateralized by the accounts receivable and inventory of the Company’s operations. The ABL facility also provides the Company with the option of including certain machinery and equipment as additional collateral for purposes of determining availability under the facility. The ABL facility, which matures in September 2027, includes a $600 million revolving credit facility, a letter of credit sub-facility of up to $200 million, a $200 million term loan (ABL Term Loan), and a swing loan facility of up to $60 million. The ABL Term Loan has an interest rate of 2.0 % above adjusted Secured Overnight Financing Rate (SOFR) and can be prepaid in increments of $25 million if certain minimum liquidity conditions are satisfied. In addition, the Company has the right to request an increase of up to $300 million under the revolving credit facility for the duration of the ABL. The Company has a $50 million floating-for-fixed interest rate swap which converts a portion of the ABL Term Loan to a 4.21 % fixed interest rate. The swap matures in June 2024.
The applicable interest rate for revolving credit borrowings under the ABL facility includes interest rate spreads based on available borrowing capacity that range between 1.25 % and 1.75 % for SOFR-based borrowings and between 0.25 % and 0.75 % for base rate borrowings. The ABL facility contains a financial covenant whereby the Company must maintain a fixed charge coverage ratio of not less than 1.00 :1.00 after an event of default has occurred and is continuing or if the undrawn availability under the ABL revolving credit portion of the facility is less than the greater of (i) 10 % of the then applicable maximum loan amount under the revolving credit portion of the ABL and the outstanding ABL Term Loan balance, or (ii) $60.0 million. The Company was in compliance with the fixed charge coverage ratio as of December 31, 2023. Additionally, the Company must demonstrate minimum liquidity specified by the facility during the 90-day period immediately preceding the stated maturity date of its 3.5 6.95
71
owned subsidiary, Allegheny Ludlum LLC. The ABL also contains customary affirmative and negative covenants for credit facilities of this type, including limitations on the Company’s ability to incur additional indebtedness or liens or to enter into investments, mergers and acquisitions, dispositions of assets and transactions with affiliates, some of which are more restrictive, at any time during the term of the ABL when the Company’s fixed charge coverage ratio is less than 1.00 :1.00 and its undrawn availability under the revolving portion of the ABL is less than the greater of (a) $120 million or (b) 20 % of the sum of the maximum loan amount under the revolving credit portion of the ABL and the outstanding ABL Term Loan balance. On September 9, 2022, the Company amended and restated the ABL and costs associated with entering into this amendment were $2.4 million, and are being amortized to interest expense over the term of the facility ending September 2027, along with $1.7 million of unamortized deferred costs previously recorded for the ABL.
As of December 31, 2023, there were no outstanding borrowings under the revolving portion of the ABL, and $31.7 million was utilized to support the issuance of letters of credit. There were average revolving credit borrowings of $13 million bearing an average annual interest rate of 6.5 % under the ABL during fiscal year 2023. There were no revolving credit borrowings under the ABL during fiscal year 2022. The Company also has foreign credit facilities, primarily in China, that total $58 million based on December 31, 2023 foreign exchange rates, under which $5.0 million and $19.4 million was drawn as of December 31, 2023 and January 1, 2023, respectively.
The Company has no off-balance sheet financing relationships as defined in Item 303(a)(4) of SEC Regulation S-K, with variable interest entities, structured finance entities, or any other unconsolidated entities. At December 31, 2023, the Company had not guaranteed any third-party indebtedness.
Note 11. Leases
The following represents the components of lease cost and other information for both operating and financing leases for the fiscal years 2023, 2022 and 2021:
| ($ in millions) | Fiscal Year | |||||||||||||
| 2023 | 2022 | 2021 | ||||||||||||
| Lease Cost | ||||||||||||||
| Finance Lease Cost: | ||||||||||||||
| Amortization of right of use asset | $ | $ | $ | |||||||||||
| Interest on lease liabilities | ||||||||||||||
| Operating lease cost | ||||||||||||||
| Short-term lease cost | ||||||||||||||
| Variable lease cost | ||||||||||||||
| Sublease income | ( | ( | ||||||||||||
| Total lease cost | $ | $ | $ | |||||||||||
| Other information | ||||||||||||||
| Cash paid for amounts included in the measurement of lease liabilities | ||||||||||||||
| Operating cash flows from finance leases | $ | $ | $ | |||||||||||
| Operating cash flows from operating leases | $ | $ | $ | |||||||||||
| Financing cash flows from finance leases | $ | $ | $ | |||||||||||
| Right of use assets obtained in exchange for new finance lease liabilities | $ | $ | $ | |||||||||||
| Right of use assets obtained in exchange for new operating lease liabilities | $ | $ | $ | |||||||||||
| Weighted average remaining lease term - finance leases | ||||||||||||||
| Weighted average remaining lease term - operating leases | ||||||||||||||
| Weighted average discount rate - finance leases | % | % | % | |||||||||||
| Weighted average discount rate - operating leases | % | % | % | |||||||||||
72
The following table reconciles future minimum undiscounted rental commitments for operating leases to the operating lease liabilities recorded on the consolidated balance sheet as of December 31, 2023 (in millions):
| Fiscal Year | December 31, 2023 | |||||||
| 2024 | $ | |||||||
| 2025 | ||||||||
| 2026 | ||||||||
| 2027 | ||||||||
| 2028 | ||||||||
| 2029 and thereafter | ||||||||
| Total undiscounted lease payments | $ | |||||||
| Present value adjustment | ( | |||||||
| Operating lease liabilities | $ | |||||||
The following table reconciles future minimum undiscounted rental commitments for finance leases to the finance lease liabilities recorded on the consolidated balance sheet as of December 31, 2023 (in millions):
| Fiscal Year | December 31, 2023 | |||||||
| 2024 | $ | |||||||
| 2025 | ||||||||
| 2026 | ||||||||
| 2027 | ||||||||
| 2028 | ||||||||
| 2029 and thereafter | ||||||||
| Total undiscounted lease payments | $ | |||||||
| Present value adjustment | ( | |||||||
| $ | ||||||||
Note 12. Derivative Financial Instruments and Hedging
As part of its risk management strategy, the Company, from time-to-time, utilizes derivative financial instruments to manage its exposure to changes in raw material prices, energy costs, foreign currencies, and interest rates. In accordance with applicable accounting standards, the Company accounts for most of these contracts as hedges.
The Company sometimes uses futures and swap contracts to manage exposure to changes in prices for forecasted purchases of raw materials, such as nickel, and natural gas. Under these contracts, which are generally accounted for as cash flow hedges, the price of the item being hedged is fixed at the time that the contract is entered into and the Company is obligated to make or receive a payment equal to the net change between this fixed price and the market price at the date the contract matures.
The majority of ATI’s products are sold utilizing raw material surcharges and index mechanisms. However, as of December 31, 2023, the Company had entered into financial hedging arrangements primarily at the request of its customers, related to firm orders, for an aggregate notional amount of approximately 4 million pounds of nickel with hedge dates through fiscal year 2024. The aggregate notional amount hedged is approximately 6 % of a single year’s estimated nickel raw material purchase requirements. These derivative instruments are used to hedge the variability of a selling price that is based on the London Metals Exchange (LME) index for nickel, as well as to hedge the variability of the purchase cost of nickel based on this LME index. Any gain or loss associated with these hedging arrangements is included in sales or cost of sales, depending on whether the underlying risk being hedged was the variable selling price or the variable raw material cost, respectively.
73
At December 31, 2023, the outstanding financial derivatives used to hedge the Company’s exposure to energy cost volatility included natural gas cost hedges. At December 31, 2023, the company hedged approximately 75 % of the Company’s annual forecasted domestic requirements for natural gas for fiscal year 2024 and approximately 35 % for fiscal year 2025.
While the majority of the Company’s direct export sales are transacted in U.S. dollars, foreign currency exchange contracts are used, from time-to-time, to limit transactional exposure to changes in currency exchange rates for those transactions denominated in a non-U.S. currency. The Company sometimes purchases foreign currency forward contracts that permit it to sell specified amounts of foreign currencies expected to be received from its export sales for pre-established U.S. dollar amounts at specified dates. In addition, the Company may also hedge forecasted capital expenditures and designate cash balances held in foreign currencies as hedges of forecasted foreign currency transactions. At December 31, 2023, the Company had no significant outstanding foreign currency forward contracts.
The Company may enter into derivative interest rate contracts to maintain a reasonable balance between fixed- and floating-rate debt. The Company has a $50 million floating-for-fixed interest rate swap that matures in June 2024 which converts a portion of the ABL Term Loan to a 4.21 % fixed rate. The Company designated the interest rate swap as a cash flow hedge of the Company’s exposure to the variability of the payment of interest on a portion of its ABL Term Loan borrowings. The ineffective portion at hedge inception, determined from the fair value of the swap immediately prior to amendment in July 2019, was amortized to interest expense over the initial ABL Term Loan swap maturity date of January 12, 2021.
There are no credit risk-related contingent features in the Company’s derivative contracts, and the contracts contained no provisions under which the Company has posted, or would be required to post, collateral. The counterparties to the Company’s derivative contracts were substantial and creditworthy commercial banks that are recognized market makers. The Company controls its credit exposure by diversifying across multiple counterparties and by monitoring credit ratings and credit default swap spreads of its counterparties. The Company also enters into master netting agreements with counterparties when possible.
The fair values of the Company’s derivative financial instruments are presented below, representing the gross amounts recognized which are not offset by counterparty or by type of item hedged. All fair values for these derivatives were measured using Level 2 information as defined by the accounting standard hierarchy, which includes quoted prices for similar assets or liabilities in active markets, quoted prices for identical or similar assets or liabilities in markets that are not active, and inputs derived principally from or corroborated by observable market data.
| (In millions) | December 31, 2023 | January 1, 2023 | ||||||||||||||||||
| Asset derivatives | Balance sheet location | |||||||||||||||||||
| Derivatives designated as hedging instruments: | ||||||||||||||||||||
| Interest rate swap | Prepaid expenses and other current assets | $ | $ | |||||||||||||||||
| Foreign exchange contracts | Prepaid expenses and other current assets | |||||||||||||||||||
| Natural gas contracts | Prepaid expenses and other current assets | |||||||||||||||||||
| Nickel and other raw material contracts | Prepaid expenses and other current assets | |||||||||||||||||||
| Interest rate swap | Other assets | |||||||||||||||||||
| Natural gas contracts | Other assets | |||||||||||||||||||
| Nickel and other raw material contracts | Other assets | |||||||||||||||||||
| Total derivatives designated as hedging instruments | ||||||||||||||||||||
| Total asset derivatives | $ | $ | ||||||||||||||||||
| Liability derivatives | Balance sheet location | |||||||||||||||||||
| Derivatives designated as hedging instruments: | ||||||||||||||||||||
| Natural gas contracts | Other current liabilities | $ | $ | |||||||||||||||||
| Nickel and other raw material contracts | Other current liabilities | |||||||||||||||||||
| Natural gas contracts | Other long-term liabilities | |||||||||||||||||||
| Total derivatives designated as hedging instruments | ||||||||||||||||||||
| Total liability derivatives | $ | $ | ||||||||||||||||||
Assuming market prices remain constant with those at December 31, 2023, a pre-tax loss of $12.3 million is expected to be recognized over the next 12 months.
For derivative financial instruments that are designated as cash flow hedges, the gain or loss on the derivative is reported as a component of other comprehensive income (OCI) and reclassified into earnings in the same period or periods during which the
74
Activity with regard to derivatives designated as cash flow hedges for the fiscal years ended December 31, 2023 and January 1, 2023 were as follows (in millions):
Derivatives in Cash Flow Hedging Relationships | Amount of Gain (Loss) Recognized in OCI on Derivatives | Amount of Gain (Loss) Reclassified from Accumulated OCI into Income (a) | ||||||||||||||||||||||||
| Fiscal Year | ||||||||||||||||||||||||||
| 2023 | 2022 | 2023 | 2022 | |||||||||||||||||||||||
| Nickel and other raw material contracts | $ | ( | $ | $ | $ | |||||||||||||||||||||
| Natural gas contracts | ( | ( | ||||||||||||||||||||||||
| Foreign exchange contracts | ||||||||||||||||||||||||||
| Interest rate swap | ( | |||||||||||||||||||||||||
| Total | $ | ( | $ | $ | ( | $ | ||||||||||||||||||||
(a)The gains (losses) reclassified from accumulated OCI into income related to the derivatives, with the exception of the interest rate swap, are presented in sales and cost of sales in the same period or periods in which the hedged item affects earnings. The gains (losses) reclassified from accumulated OCI into income on the interest rate swap are presented in interest expense in the same period as the interest expense on the ABL Term Loan is recognized in earnings.
The disclosures of gains or losses presented above for nickel and other raw material contracts and foreign currency contracts do not take into account the anticipated underlying transactions. Since these derivative contracts represent hedges, the net effect of any gain or loss on results of operations may be fully or partially offset.
Note 13. Fair Value of Financial Instruments
The estimated fair value of financial instruments at December 31, 2023 was as follows:
| Fair Value Measurements at Reporting Date Using | ||||||||||||||||||||||||||
| (In millions) | Total Carrying Amount | Total Estimated Fair Value | Quoted Prices in Active Markets for Identical Assets (Level 1) | Significant Observable Inputs (Level 2) | ||||||||||||||||||||||
| Cash and cash equivalents | $ | $ | $ | $ | ||||||||||||||||||||||
| Derivative financial instruments: | ||||||||||||||||||||||||||
| Debt (a) | ||||||||||||||||||||||||||
75
The estimated fair value of financial instruments at January 1, 2023 was as follows:
| Fair Value Measurements at Reporting Date Using | ||||||||||||||||||||||||||
| (In millions) | Total Carrying Amount | Total Estimated Fair Value | Quoted Prices in Active Markets for Identical Assets (Level 1) | Significant Observable Inputs (Level 2) | ||||||||||||||||||||||
| Cash and cash equivalents | $ | $ | $ | $ | ||||||||||||||||||||||
| Derivative financial instruments: | ||||||||||||||||||||||||||
| Assets | ||||||||||||||||||||||||||
| Liabilities | ||||||||||||||||||||||||||
| Debt (a) | ||||||||||||||||||||||||||
In accordance with accounting standards, fair value is defined as the exchange price that would be received for an asset or paid to transfer a liability (an exit price) in the principal or most advantageous market for the asset or liability in an orderly transaction between market participants at the measurement date. Accounting standards established three levels of a fair value hierarchy that prioritizes the inputs used to measure fair value. This hierarchy requires entities to maximize the use of observable inputs and minimize the use of unobservable inputs. The three levels of inputs used to measure fair value are as follows:
Level 1 – Quoted prices in active markets for identical assets or liabilities.
Level 2 – Observable inputs other than quoted prices included in Level 1, such as quoted prices for similar assets and liabilities in active markets; quoted prices for identical or similar assets and liabilities in markets that are not active; or other inputs that are observable or can be corroborated by observable market data.
Level 3 – Unobservable inputs that are supported by little or no market activity and that are significant to the fair value of the assets and liabilities. This includes certain pricing models, discounted cash flow methodologies and similar techniques that use significant unobservable inputs.
The availability of observable market data is monitored to assess the appropriate classification of financial instruments within the fair value hierarchy. Changes in economic conditions or model-based valuation techniques may require the transfer of financial instruments from one fair value level to another. In such instances, the transfer is reported at the beginning of the reporting period.
The following methods and assumptions were used by the Company in estimating the fair value of its financial instruments:
Cash and cash equivalents: Fair values were determined using Level 1 information.
Derivative financial instruments: Fair values for derivatives were measured using exchange-traded prices for the hedged items. The fair value was determined using Level 2 information, including consideration of counterparty risk and the Company’s credit risk.
Short-term and long-term debt: The fair values of the 2025 Convertible Notes, the Allegheny Ludlum 6.95 % Debentures due 2025, the 2027 Notes, the 2029 Notes, 2030 notes (after issuance in the third quarter of fiscal year 2023) and the 2031 Notes were determined using Level 1 information. The fair values of other short-term and long-term debt were determined using Level 2 information.
Note 14. Retirement Benefits
The Company has defined contribution retirement plans or defined benefit pension plans covering substantially all employees. Company contributions to defined contribution retirement plans are generally based on a percentage of eligible pay or based on hours worked. Benefits under the defined benefit pension plans are generally based on years of service and/or final average pay. The Company also sponsors several postretirement plans covering certain collectively-bargained salaried and hourly employees. The plans provide health care and life insurance benefits for eligible retirees. In most retiree health care plans, Company contributions towards premiums are capped based on the cost as of a certain date, thereby creating a defined contribution.
76
In the fourth quarter of fiscal year 2023, the Company voluntarily changed the method of accounting for recognizing actuarial gains and losses for the defined benefit pension plans. See Note 1 for amounts recognized related to this change. The information within this Note has been revised to reflect the change in accounting principle for current and prior periods.
ATI instituted several initiatives over a multi-year period as part of its retirement benefit liability derisking strategy. Future benefit accruals for all participants in the U.S. defined benefit pension plans other than those subject to a CBA were frozen at the end of fiscal year 2014, and subsequently CBAs were negotiated to close these plans to new entrants. As a result of these actions, the Company has completely closed all defined benefit pension plans to new entrants, and has substantially limited the number of employees still accruing benefit service to less than 800 participants. Additionally, all of ATI’s remaining collectively-bargained, capped defined benefit retiree health care plans are closed to new entrants. These liability management actions have transitioned ATI’s retirement benefit and other postretirement benefit programs largely to a defined contribution structure. From fiscal years 2013 to 2022, five annuity buyouts of retired participants and two voluntary cash out programs of deferred participants during this period helped to reduce the total participants in ATI’s U.S. qualified defined benefit pension plans by more than 60 %. During the fourth quarter of fiscal year 2023, the Company purchased group annuity contracts from an insurer covering approximately 85 % of the Company’s U.S. qualified defined benefit pension plan obligations. Under these contracts, the Company transferred the pension obligations and associated assets for approximately 8,200 plan participants to the selected insurance company. To facilitate this pension derisking strategy, the Company completed a voluntary cash out for term vested employees and contributed $222 million to its pension plan in the third quarter of fiscal year 2023, to fully fund remaining pension liabilities ahead of this annuity transaction. After these actions, the Company’s U.S. qualified defined benefit pension plan includes approximately 1,980 participants.
Costs for defined contribution retirement plans were $38.8 million in fiscal year 2023, $31.1 million in fiscal year 2022, and $20.4 million in fiscal year 2021. Company contributions to these defined contribution plans are funded with cash. In fiscal year 2022, the Company implemented certain plan design changes to the ATI 401(k) Savings Plan which decreased the qualified non-elective contribution percentage and increased the Company match contribution percentage. Other postretirement benefit costs for a defined contribution plan under the terms of a CBA were $1.0 no costs for this plan in fiscal year 2021.
The components of pension and other postretirement benefit expense for the Company’s defined benefit plans included the following:
| Pension Benefits | Other Postretirement Benefits | |||||||||||||||||||||||||||||||||||||
| Fiscal Year | ||||||||||||||||||||||||||||||||||||||
| (In millions) | 2023 | 2022 Revised | 2021 Revised | 2023 | 2022 | 2021 | ||||||||||||||||||||||||||||||||
| Service cost—benefits earned during the year | $ | $ | $ | $ | $ | $ | ||||||||||||||||||||||||||||||||
| Interest cost on benefits earned in prior years | ||||||||||||||||||||||||||||||||||||||
| Expected return on plan assets | ( | ( | ( | |||||||||||||||||||||||||||||||||||
| Amortization of prior service cost (credit) | ( | ( | ( | |||||||||||||||||||||||||||||||||||
| Amortization of net actuarial loss | ||||||||||||||||||||||||||||||||||||||
| Recognized actuarial loss (gain)- mark to market | ( | ( | ||||||||||||||||||||||||||||||||||||
| Settlement loss (gain) | ( | |||||||||||||||||||||||||||||||||||||
| Total retirement benefit expense (income) | $ | $ | ( | $ | ( | $ | $ | $ | ( | |||||||||||||||||||||||||||||
In the fourth quarter of fiscal year 2023, the Company voluntarily changed the method of accounting for recognizing actuarial gains and losses for its defined benefit pension plans. Under the accounting method change, remeasurement of projected benefit obligation and plan assets for defined benefit pension plans are immediately recognized in earnings through net periodic pension benefit cost from remeasurements annually in the fourth quarter and on an interim basis due to triggering events that require remeasurement. This resulted in an actuarial loss of $26.8 million in fiscal year 2023 and actuarial gains of $100.3 million and $147.2 million in fiscal years 2022 and 2021, respectively, within nonoperating retirement benefit income/expense on the consolidated statements of operations.
On October 17, 2023, the Company completed a voluntary cash out for term vested employees and a large annuity buyout related to approximately 8,200 U.S. qualified defined benefit pension plan participants. As a result of the annuity buyout, ATI recognized a $41.7 million pretax settlement loss, which is recorded in nonoperating retirement benefit income/expense on the consolidated statement of operations.
On May 12, 2022, the Company completed the sale of its Sheffield, UK operations (see Note 6). As a result of this sale, ATI recognized a $0.7 million settlement loss, which is recorded in loss on asset sales and sales of businesses, net, on the
77
consolidated statement of operations, related to the amount in accumulated other comprehensive loss for the UK defined benefit pension plan that transferred as part of the sale. Pension liabilities and assets for this UK defined benefit pension plan that were removed as a result of this divestiture are included below in the tables of changes in benefit obligations and changes in plan assets, respectively.
On July 14, 2021, ATI announced that a new four-year labor agreement with the USW was ratified (see Note 1 for further discussion). As a result of this new CBA, ATI recognized a $64.9 million pretax settlement gain, which is recorded in nonoperating retirement benefit income/expense on the consolidated statement of operations, related to a plan termination that eliminated certain postretirement medical benefit liabilities, comprised of $43.0 million of long-term postretirement benefit liabilities as of July 2021 and $21.9 million of amounts recorded in accumulated other comprehensive income at that date. Discrete tax effects related to this event were $15.5 million of income tax expense (see Note 17 for further discussion).
Actuarial assumptions used to develop the components of defined benefit pension expense and other postretirement benefit expense were as follows:
| Pension Benefits | Other Postretirement Benefits | |||||||||||||||||||||||||||||||||||||
| Fiscal Year | ||||||||||||||||||||||||||||||||||||||
| 2023 | 2022 | 2021 | 2023 | 2022 | 2021 | |||||||||||||||||||||||||||||||||
| Discount rate (a) | % | % | % | % | % | |||||||||||||||||||||||||||||||||
| Rate of increase in future compensation levels | % | |||||||||||||||||||||||||||||||||||||
| Weighted average expected long-term rate of return on assets (a) | % | % | % | % | % | |||||||||||||||||||||||||||||||||
(a) Pension expense for fiscal year 2023 was initially measured at a 5.55 % discount rate and 6.57 % weighted average expected long-term rate of return on assets. The U.S. qualified pension plans were remeasured using a 6.40 % weighted average discount rate and 5.80 % weighted average expected long-term rate of return on assets as of October 17, 2023, following the large annuity buyout of retirees.
Actuarial assumptions used for the valuation of defined benefit pension and other postretirement benefit obligations at the end of the respective periods were as follows:
| Pension Benefits | Other Postretirement Benefits | |||||||||||||||||||||||||
| Fiscal Year | ||||||||||||||||||||||||||
| 2023 | 2022 | 2023 | 2022 | |||||||||||||||||||||||
| Discount rate | % | % | % | % | ||||||||||||||||||||||
| Rate of increase in future compensation levels | % | % | ||||||||||||||||||||||||
A reconciliation of the funded status for the Company’s defined benefit pension and other postretirement benefit plans at December 31, 2023 and January 1, 2023 was as follows:
| Pension Benefits | Other Postretirement Benefits | |||||||||||||||||||||||||
| Fiscal Year | ||||||||||||||||||||||||||
| (In millions) | 2023 | 2022 | 2023 | 2022 | ||||||||||||||||||||||
| Change in benefit obligations: | ||||||||||||||||||||||||||
| Benefit obligation at beginning of fiscal year | $ | $ | $ | $ | ||||||||||||||||||||||
| Service cost | ||||||||||||||||||||||||||
| Interest cost | ||||||||||||||||||||||||||
| Benefits paid | ( | ( | ( | ( | ||||||||||||||||||||||
| Subsidy received | ||||||||||||||||||||||||||
| Divestiture | ( | |||||||||||||||||||||||||
| Effect of currency rates | ( | |||||||||||||||||||||||||
| Net actuarial (gains) losses – discount rate change | ( | ( | ( | |||||||||||||||||||||||
| – other | ( | ( | ||||||||||||||||||||||||
| Plan settlement | ( | |||||||||||||||||||||||||
| Benefit obligation at end of fiscal year | $ | $ | $ | $ | ||||||||||||||||||||||
78
Actuarial effects of changes in discount rates are separately identified in the preceding table.
| Pension Benefits | Other Postretirement Benefits | |||||||||||||||||||||||||
| Fiscal Year | ||||||||||||||||||||||||||
| (In millions) | 2023 | 2022 | 2023 | 2022 | ||||||||||||||||||||||
| Change in plan assets: | ||||||||||||||||||||||||||
| Fair value of plan assets at beginning of fiscal year | $ | $ | $ | $ | ||||||||||||||||||||||
| Actual returns on plan assets and plan expenses | ( | ( | ||||||||||||||||||||||||
| Employer contributions | ||||||||||||||||||||||||||
| Divestiture | ( | |||||||||||||||||||||||||
| Effect of currency rates | ( | |||||||||||||||||||||||||
| Plan settlement | ( | |||||||||||||||||||||||||
| Benefits paid | ( | ( | ||||||||||||||||||||||||
| Fair value of plan assets at end of fiscal year | $ | $ | $ | $ | ||||||||||||||||||||||
On October 17, 2023, the Company completed a voluntary cash out for term vested employees and a large annuity buyout related to approximately 8,200 U.S. qualified defined benefit pension plan participants. These actions resulted in a reduction in the benefit obligations and plan assets of $1.35 billion.
| Assets (liabilities) recognized in the consolidated balance sheets: | ||||||||||||||||||||||||||
| Pension Benefits | Other Postretirement Benefits | |||||||||||||||||||||||||
| Fiscal Year | ||||||||||||||||||||||||||
| 2023 | 2022 | 2023 | 2022 | |||||||||||||||||||||||
| Current assets | $ | $ | $ | $ | ||||||||||||||||||||||
| Noncurrent assets | ||||||||||||||||||||||||||
| Current liabilities | ( | ( | ( | ( | ||||||||||||||||||||||
| Noncurrent liabilities | ( | ( | ( | ( | ||||||||||||||||||||||
| Total amount recognized | $ | ( | $ | ( | $ | ( | $ | ( | ||||||||||||||||||
Changes to accumulated other comprehensive loss related to pension and other postretirement benefit plans in fiscal years 2023 and 2022 were as follows:
| Pension Benefits | Other Postretirement Benefits | |||||||||||||||||||||||||
| Fiscal Year | ||||||||||||||||||||||||||
| (In millions) | 2023 | 2022 Revised | 2023 | 2022 | ||||||||||||||||||||||
| Beginning of year accumulated other comprehensive loss | $ | ( | $ | ( | $ | ( | $ | ( | ||||||||||||||||||
| Amortization of net actuarial loss | ||||||||||||||||||||||||||
| Amortization of prior service cost (credit) | ( | ( | ||||||||||||||||||||||||
| Settlement loss | ||||||||||||||||||||||||||
| Remeasurements | ( | |||||||||||||||||||||||||
| End of year accumulated other comprehensive loss | $ | ( | $ | ( | $ | ( | $ | ( | ||||||||||||||||||
| Net change in accumulated other comprehensive loss | $ | $ | $ | $ | ||||||||||||||||||||||
Amounts included in accumulated other comprehensive loss at December 31, 2023 and January 1, 2023 were as follows:
| Pension Benefits | Other Postretirement Benefits | |||||||||||||||||||||||||
| Fiscal Year | ||||||||||||||||||||||||||
| (In millions) | 2023 | 2022 Revised | 2023 | 2022 | ||||||||||||||||||||||
| Prior service (cost) credit | $ | ( | $ | ( | $ | $ | ||||||||||||||||||||
| Net actuarial loss | ( | ( | ||||||||||||||||||||||||
| Accumulated other comprehensive loss | ( | ( | ( | ( | ||||||||||||||||||||||
| Deferred tax effect | ||||||||||||||||||||||||||
| Accumulated other comprehensive loss, net of tax | $ | ( | $ | ( | $ | ( | $ | ( | ||||||||||||||||||
79
Amounts in accumulated other comprehensive loss presented above do not include any effects of deferred tax asset valuation allowances. See Note 15 for further discussion on deferred tax asset valuation allowances.
Retirement benefit expense for fiscal year 2024 for defined benefit plans is estimated to be approximately $21 million, comprised of $6 million for pension expense and $15 million of expense for other postretirement benefits. For other postretirement benefits, the net actuarial loss is recognized in the consolidated statement of operations using a corridor method. For both pension and other postretirement benefits, prior service cost (credit) amortization is recognized in level amounts over the expected service of the active membership as of the amendment effective date. Amounts in accumulated other comprehensive loss that are expected to be recognized as components of net periodic benefit cost in fiscal year 2024 are:
| (In millions) | Pension Benefits | Other Postretirement Benefits | Total | |||||||||||||||||
| Amortization of prior service cost (credit) | $ | $ | ( | $ | ( | |||||||||||||||
| Amortization of net actuarial loss | ||||||||||||||||||||
| Amortization of accumulated other comprehensive loss | $ | $ | $ | |||||||||||||||||
The accumulated benefit obligation for all defined benefit pension plans was $283.1 million and $1,716.8 million at December 31, 2023 and January 1, 2023, respectively. Additional information for pension plans with accumulated benefit obligations and projected benefit obligations in excess of plan assets:
| Pension Benefits | ||||||||||||||
| Fiscal Year | ||||||||||||||
| (In millions) | 2023 | 2022 | ||||||||||||
| Projected benefit obligation | $ | $ | ||||||||||||
| Accumulated benefit obligation | $ | $ | ||||||||||||
| Fair value of plan assets | $ | $ | ||||||||||||
Cash contributions to ATI’s U.S. qualified defined benefit pension plans were $272 million in fiscal year 2023, $50 million in fiscal year 2022 and $67 million in fiscal year 2021. The Company funds the U.S. defined benefit pension plans in accordance with the Employee Retirement Income Security Act of 1974, as amended, and the Internal Revenue Code. The Company has no required cash contributions to its U.S. qualified defined benefit pension plan in fiscal year 2024. In addition, for fiscal year 2024, the Company expects approximately $6 million of payments for U.S. nonqualified pension benefits.
The following table summarizes expected benefit payments from the Company’s various pension and other postretirement defined benefit plans through fiscal year 2033, and also includes estimated Medicare Part D subsidies projected to be received during this period based on currently available information. Pension benefit payments for the U.S. qualified defined benefit pension plan are made from pension plan assets.
| (In millions) | ||||||||||||||||||||
| Fiscal Year | Pension Benefits | Other Postretirement Benefits | Medicare Part D Subsidy | |||||||||||||||||
| 2024 | $ | $ | $ | |||||||||||||||||
| 2025 | ||||||||||||||||||||
| 2026 | ||||||||||||||||||||
| 2027 | ||||||||||||||||||||
| 2028 | ||||||||||||||||||||
| 2029-2033 | ||||||||||||||||||||
The annual assumed rate of increase in the per capita cost of covered benefits (the health care cost trend rate) for health care plans was 7.2 % in 2024 and is assumed to gradually decrease to 4.0 % in the year 2048 and remain at that level thereafter. Assumed health care cost trend rates can have a significant effect on the amounts reported for the health care plans, however, the Company’s contributions for most of its retiree health plans are capped based on a fixed premium amount, which limits the impact of future health care cost increases.
80
The fair values of the Company’s pension plan assets are determined using net asset value (NAV) as a practical expedient, or by information categorized in the fair value hierarchy level based on the inputs used to determine fair value, as further discussed in Note 13. The fair values at December 31, 2023 were as follows:
| (In millions) | Quoted Prices in Active Markets for Identical Assets | Significant Observable Inputs | Significant Unobservable Inputs | |||||||||||||||||||||||||||||
| Asset category | Total | NAV | (Level 1) | (Level 2) | (Level 3) | |||||||||||||||||||||||||||
| Equity securities: | ||||||||||||||||||||||||||||||||
| U.S. equities | $ | $ | $ | $ | $ | |||||||||||||||||||||||||||
| International equities | ||||||||||||||||||||||||||||||||
| Fixed income and cash equivalents | ||||||||||||||||||||||||||||||||
| Private equity | ||||||||||||||||||||||||||||||||
| Alternative investments- hedge funds, real estate and other | ||||||||||||||||||||||||||||||||
| Total assets | $ | $ | $ | $ | $ | |||||||||||||||||||||||||||
The fair values of the Company’s pension plan assets at January 1, 2023 were as follows:
| (In millions) | Quoted Prices in Active Markets for Identical Assets | Significant Observable Inputs | Significant Unobservable Inputs | |||||||||||||||||||||||||||||
| Asset category | Total | NAV | (Level 1) | (Level 2) | (Level 3) | |||||||||||||||||||||||||||
| Equity securities: | ||||||||||||||||||||||||||||||||
| U.S. equities | $ | $ | $ | $ | $ | |||||||||||||||||||||||||||
| International equities | ||||||||||||||||||||||||||||||||
| Fixed income and cash equivalents | ||||||||||||||||||||||||||||||||
| Private equity | ||||||||||||||||||||||||||||||||
| Alternative investments- hedge funds, real estate and other | ||||||||||||||||||||||||||||||||
| Total assets | $ | $ | $ | $ | $ | |||||||||||||||||||||||||||
A financial instrument’s categorization within the valuation hierarchy is based upon the lowest level of input that is significant to the fair value measurement. Investments in U.S. and International equities, and Fixed Income are predominantly held in common/collective trust funds and registered investment companies. Some of these investments are publicly traded securities and are classified as Level 1, while others are public investment vehicles valued using the NAV provided by the administrator of the fund. The NAV is based on the value of the underlying assets owned by the fund, minus its liabilities, and then divided by the number of shares outstanding. These investments are not classified in the fair value hierarchy. In addition, some fixed income instruments are investments in debt instruments that are valued using external pricing vendors and are classified within Level 2 of the fair value hierarchy.
Private equity investments include both Direct Funds and Fund-of-Funds. Direct Funds are investments in Limited Partnership (LP) interests. Fund-of-Funds are investments in private equity funds that invest in other private equity funds or LPs. Fair value of these investments is determined utilizing net asset values, and are not classified in the fair value hierarchy.
Alternative investments include hedge fund and real estate investments that are made as a limited partner in funds managed by a general partner. Fair value of these investments is determined utilizing net asset values, and are not classified in the fair value hierarchy.
For certain investments which have formal financial valuations reported on a one-quarter lag, fair value is determined utilizing net asset values adjusted for subsequent cash flows, estimated financial performance and other significant events.
For fiscal year 2024, the expected long-term rate of return on defined benefit pension assets is 5.80 %. In developing expected long-term rate of return assumptions, the Company evaluated input from its third party pension plan asset managers and actuaries, including reviews of their asset class return expectations and long-term inflation assumptions. An expected long-term rate of return is based on expected asset allocations within ranges for each investment category and projected annual compound returns. The Company’s actual, weighted average returns on pension assets for the last five fiscal years have been 2.0 % for 2023, (14.5 )% for 2022, 12.4 % for 2021, 15.2 % for 2020, and 15.1 % for 2019.
81
The ATI Pension Plan (the Plan), the Company’s remaining U.S. qualified defined benefit pension plan, continues to invest in a diversified portfolio consisting of an array of asset classes that attempts to maintain the Plan’s funded status while maximizing returns and minimizing volatility. These asset classes may include U.S. domestic equities, non-U.S. developed market equities, emerging market equities, hedge funds, private equity, traditional fixed income consisting of long government/credit and alternative credit, and real estate. The Company continually monitors the investment results of these asset classes and its fund managers, and explores other potential asset classes for possible future investment.
The ability to redeem investments at year-end are based on the type of investment and the agreements with fund managers. Generally, the Company’s fixed income and equity investments are readily redeemable with limited restrictions. The ability to redeem investments in hedge funds can vary significantly. Managers may require longer notice periods and may limit the amount able to be redeemed in a period (e.g., month or quarter) to a percent of the overall investment. Investments in private equity are not redeemable at ATI’s option. Distributions are based on the sale of the underlying investments in the fund, subject to the terms in each fund agreement.
The target asset allocations for ATI Pension Plan for fiscal year 2024, by major investment category, are:
| Asset category | Target asset allocation range | |||||||
| Equities | ||||||||
| Fixed income and cash equivalents | ||||||||
| Private equity and other | ||||||||
As of December 31, 2023, the Company’s pension plan had outstanding commitments to invest up to $7 million in global debt securities and $33 million in private equity investments. These commitments are expected to be satisfied through the reallocation of pension trust assets while maintaining investments within the target asset allocation ranges.
The Company contributes to several multiemployer defined benefit pension plans under collective bargaining agreements that cover certain of its union-represented employees. The risks of participating in such plans are different from the risks of single-employer plans, in the following respects:
a.Assets contributed to a multiemployer plan by one employer may be used to provide benefits to employees of other participating employers.
b.If a participating employer ceases to contribute to the plan, the unfunded obligations of the plan may be borne by the remaining participating employers.
c.If the Company ceases to have an obligation to contribute to the multiemployer plan in which it had been a contributing employer, it may be required to pay to the plan an amount based on the underfunded status of the plan and on the history of the Company’s participation in the plan prior to the cessation of its obligation to contribute. The amount that an employer that has ceased to have an obligation to contribute to a multiemployer plan is required to pay to the plan is referred to as a withdrawal liability.
82
The Company’s participation in multiemployer plans for the fiscal years ended December 31, 2023, January 1, 2023 and January 2, 2022 is reported in the following table.
| Pension Protection Act Zone Status (1) | FIP / RP Status Pending / Implemented (2) | in millions | Expiration Dates of Collective Bargaining Agreements | |||||||||||||||||||||||||||||||||||||||||||||||||||||
| EIN / Pension Plan Number | Company Contributions | Surcharge Imposed (3) | ||||||||||||||||||||||||||||||||||||||||||||||||||||||
| Fiscal Year | Fiscal Year | |||||||||||||||||||||||||||||||||||||||||||||||||||||||
| Pension Fund | 2023 | 2022 | 2023 | 2022 | 2021 | |||||||||||||||||||||||||||||||||||||||||||||||||||
| Steelworkers Western Independent Shops Pension Plan | 90-0169564 / 001 | N/A | $ | $ | $ | 2/28/2025 | ||||||||||||||||||||||||||||||||||||||||||||||||||
| Boilermakers-Blacksmiths National Pension Trust | 48-6168020 / 001 | Yes | 9/30/2026 | |||||||||||||||||||||||||||||||||||||||||||||||||||||
| IAM National Pension Fund | 51-6031295 / 002 | Yes | Various between 2024-2028 (4) | |||||||||||||||||||||||||||||||||||||||||||||||||||||
| Total contributions | $ | $ | $ | |||||||||||||||||||||||||||||||||||||||||||||||||||||
(1)The most recent Pension Protection Act Zone Status is based on information provided to ATI and other participating employers by each plan, as certified by the plan’s actuary. A plan in the “deep red” zone had been determined to be in “critical and declining status”, based on criteria established by the Internal Revenue Code (Code), and is in critical status (as defined by the “red” zone) and is projected to become insolvent (run out of money to pay benefits) within 15 years (or within 20 years if a special rule applies). A plan in the “red” zone had been determined to be in “critical status”, based on criteria established by the Code, and is generally less than 65% funded. A plan in the “yellow” zone has been determined to be in “endangered status”, based on criteria established under the Code, and is generally less than 80% funded. A plan in the “green” zone has been determined to be neither in “critical status” nor in “endangered status”, and is generally at least 80% funded. Additionally, a plan may voluntarily place itself into a rehabilitation plan.
In April 2019, the Company received notification from the IAM National Pension Fund (IAM Fund) that its’ actuary certified the IAM Fund as “endangered status” for the plan year beginning January 1, 2019, and that the IAM Fund was voluntarily placing itself in “red” zone status and implementing a rehabilitation plan. In April 2020, 2021, 2022, and 2023 the Company received notification from the IAM Fund that it was certified by its actuary as being in “red” zone status for the plan years beginning January 1, 2020, 2021 and 2022. A contribution surcharge was imposed as of June 1, 2019 in addition to the contribution rate specified in the applicable collective bargaining agreements. The contribution surcharge remains in effect, and ends when an employer begins contributing under a collective bargaining agreement that includes terms consistent with the rehabilitation plan.
In April 2019, the Company received notifications from the Boilermakers-Blacksmiths National Pension Trust (Blacksmiths Trust) that it was certified by its actuary as being in “red” zone status for the plan year beginning January 1, 2019. A rehabilitation plan was adopted for the Blacksmiths Trust, and the Company and the Blacksmiths union agreed to adopt the rehabilitation plan in 2019 prior to a contribution surcharge being imposed. In April 2020 and 2021, the funding status improved for the Blacksmiths Trust as it was certified by its actuary as being in the “yellow” zone for the plan years beginning January 1, 2020 and 2021. In April 2022, the funding status further improved to being in the “green” zone for the plan year beginning January 1, 2022. In April 2023, the Blacksmiths Trust was certified by its actuary as being in “red” zone status for the plan years beginning January 1, 2023. A rehabilitation plan has been adopted for the Blacksmiths Trust, and the Company and the Blacksmiths union agreed to adopt the rehabilitation plan in 2023 prior to a contribution surcharge being imposed.
(2)The “FIP / RP Status Pending / Implemented” column indicates whether a Funding Improvement Plan, as required under the Code by plans in the “yellow” zone, or a Rehabilitation Plan, as required under the Code to be adopted by plans in the “red” or “deep red” zones, is pending or has been implemented as of the end of the plan year that ended in 2023.
(3)The “Surcharge Imposed” column indicates whether ATI’s contribution rate for 2023 included an amount in addition to the contribution rate specified in the applicable collective bargaining agreement, as imposed by a plan in “critical status” or “critical and declining status”, in accordance with the requirements of the Code.
(4)The Company is party to five separate bargaining agreements that require contributions to this plan. Expiration dates of these collective bargaining agreements range between April 26, 2024 and July 14, 2028.
83
Note 15. Accumulated Other Comprehensive Income (Loss)
The changes in AOCI by component, net of tax, for the fiscal years ended December 31, 2023, January 1, 2023 and January 2, 2022 were as follows (in millions):
| Post- retirement benefit plans Revised | Currency translation adjustment | Derivatives | Deferred Tax Asset Valuation Allowance Revised | Total Revised | |||||||||||||||||||||||||||||||||||||||||||
| Balance, January 3, 2021 | $ | ( | $ | ( | $ | $ | ( | $ | ( | ||||||||||||||||||||||||||||||||||||||
| Cumulative effect of change in accounting principle | (a) | (a) | |||||||||||||||||||||||||||||||||||||||||||||
| OCI before reclassifications | ( | ||||||||||||||||||||||||||||||||||||||||||||||
| Amounts reclassified from AOCI | (b) | ( | (c) | (e) | ( | (f) | |||||||||||||||||||||||||||||||||||||||||
| Net current-period OCI | ( | ||||||||||||||||||||||||||||||||||||||||||||||
| Balance, January 2, 2022 | ( | ( | ( | ||||||||||||||||||||||||||||||||||||||||||||
| OCI before reclassifications | ( | ||||||||||||||||||||||||||||||||||||||||||||||
| Amounts reclassified from AOCI | (b) | (d) | (e) | ( | (f) | ||||||||||||||||||||||||||||||||||||||||||
| Net current-period OCI | ( | ||||||||||||||||||||||||||||||||||||||||||||||
| Balance, January 1, 2023 | ( | ( | ( | ||||||||||||||||||||||||||||||||||||||||||||
| OCI before reclassifications | ( | ( | ( | ||||||||||||||||||||||||||||||||||||||||||||
| Amounts reclassified from AOCI | (b) | (c) | (e) | (f) | |||||||||||||||||||||||||||||||||||||||||||
| Net current-period OCI | ( | ( | |||||||||||||||||||||||||||||||||||||||||||||
| Balance, December 31, 2023 | $ | ( | $ | ( | $ | ( | $ | $ | ( | ||||||||||||||||||||||||||||||||||||||
| Attributable to noncontrolling interests: | |||||||||||||||||||||||||||||||||||||||||||||||
| Balance, January 3, 2021 | $ | $ | $ | $ | $ | ||||||||||||||||||||||||||||||||||||||||||
| OCI before reclassifications | |||||||||||||||||||||||||||||||||||||||||||||||
| Amounts reclassified from AOCI | (c) | ||||||||||||||||||||||||||||||||||||||||||||||
| Net current-period OCI | |||||||||||||||||||||||||||||||||||||||||||||||
| Balance, January 2, 2022 | |||||||||||||||||||||||||||||||||||||||||||||||
| OCI before reclassifications | ( | ( | |||||||||||||||||||||||||||||||||||||||||||||
| Amounts reclassified from AOCI | (c) | ||||||||||||||||||||||||||||||||||||||||||||||
| Net current-period OCI | ( | ( | |||||||||||||||||||||||||||||||||||||||||||||
| Balance, January 1, 2023 | |||||||||||||||||||||||||||||||||||||||||||||||
| OCI before reclassifications | ( | ( | |||||||||||||||||||||||||||||||||||||||||||||
| Amounts reclassified from AOCI | (c) | ||||||||||||||||||||||||||||||||||||||||||||||
| Net current-period OCI | ( | ( | |||||||||||||||||||||||||||||||||||||||||||||
| Balance, December 31, 2023 | $ | $ | $ | $ | $ | ||||||||||||||||||||||||||||||||||||||||||
(a)In the fourth quarter of fiscal year 2023, the Company voluntarily changed its method of accounting for recognizing actuarial gains and losses for our defined benefit pension plans. See Note 1 for amounts recognized related to this change. The information within this Note has been revised to reflect the change in accounting principle for current and prior periods.
(b)Amounts were included in net periodic benefit cost for pension and other postretirement benefit plans (see Note 14) and/or loss on asset sales and sales of businesses, net, as part of the loss on sale of the Sheffield, UK operations (see Note 6).
(c)No amounts were reclassified to earnings.
(d)Amounts were included in loss on asset sales and sales of businesses, net, as part of the loss on sale of the Sheffield, UK operations (see Note 6).
(e)Amounts related to derivatives are included in sales, cost of goods sold or interest expense in the period or periods the hedged item affects earnings (see Note 12).
84
Other comprehensive income (loss) amounts (OCI) reported above by category are net of applicable income tax expense (benefit) for each year presented. Income tax expense (benefit) on OCI items is recorded as a change in a deferred tax asset or liability. Amounts recognized in OCI include the impact of any deferred tax asset valuation allowances, when applicable. Foreign currency translation adjustments, including those pertaining to noncontrolling interests, are generally not adjusted for income taxes as they relate to indefinite investments in non-U.S. subsidiaries.
Reclassifications out of AOCI for the fiscal years ended December 31, 2023, January 1, 2023 and January 2, 2022 were as follows:
| Amount reclassified from AOCI (d) | |||||||||||||||||||||||||||||||||||
| Fiscal year ended | |||||||||||||||||||||||||||||||||||
Details about AOCI Components (In millions) | December 31, 2023 | January 1, 2023 | January 2, 2022 | Affected line item in the consolidated statement of operations | |||||||||||||||||||||||||||||||
| Postretirement benefit plans Revised | |||||||||||||||||||||||||||||||||||
| Prior service credit | $ | (a) | $ | (a) | $ | (a) | |||||||||||||||||||||||||||||
| Actuarial losses | ( | (a) | ( | (a) | ( | (a) | |||||||||||||||||||||||||||||
| Settlement gain (loss) | ( | (a) | ( | (b) | (a) | ||||||||||||||||||||||||||||||
| ( | (d) | ( | (d) | (d) | Total before tax | ||||||||||||||||||||||||||||||
| ( | ( | Tax provision (benefit) (e) | |||||||||||||||||||||||||||||||||
| $ | ( | $ | ( | $ | Net of tax | ||||||||||||||||||||||||||||||
| Currency translation adjustment | (d) | ( | (b,d) | (d) | |||||||||||||||||||||||||||||||
| Derivatives | |||||||||||||||||||||||||||||||||||
| Nickel and other raw material contracts | $ | (c) | $ | (c) | $ | (c) | |||||||||||||||||||||||||||||
| Natural gas contracts | ( | (c) | (c) | (c) | |||||||||||||||||||||||||||||||
| Foreign exchange contracts | (c) | (c) | (c) | ||||||||||||||||||||||||||||||||
| Interest rate swap | (c) | ( | (c) | ( | (c) | ||||||||||||||||||||||||||||||
| ( | (d) | (d) | (d) | Total before tax | |||||||||||||||||||||||||||||||
| ( | Tax provision (benefit) (e) | ||||||||||||||||||||||||||||||||||
| $ | ( | $ | $ | Net of tax | |||||||||||||||||||||||||||||||
(a)Amounts are included in nonoperating retirement benefit expense (see Note 14).
(b)Amounts in fiscal year 2022 were included in loss on asset sales and sales of businesses, net, as part of the loss on sale of the Sheffield, UK operations (see Note 6).
(c)Amounts related to derivatives, with the exception of the interest rate swap, are included in sales or cost of goods sold in the period or periods the hedged item affects earnings. Amounts related to the interest rate swap are included in interest expense in the same period as the interest expense on the ABL Term Loan is recognized in earnings (see Note 12).
(d)For pretax items, positive amounts are income and negative amounts are expense in terms of the impact to net income. Tax effects are presented in conformity with ATI’s presentation in the consolidated statements of operations.
(e)These amounts exclude the impact of any deferred tax asset valuation allowances, when applicable, including recognition of stranded balances (see Note 17 for further explanation).
85
Note 16. Stockholders’ Equity
Preferred Stock
Authorized preferred stock may be issued in one or more series, with designations, powers and preferences as shall be designated by the Board of Directors. At December 31, 2023, there were no shares of preferred stock issued.
Dividends
Under the ABL facility, there is no limit on dividend declarations or payments provided that the undrawn availability, after giving effect to a particular dividend payment, is at least the greater of $120 million and 20 % of the total facility size, after giving effect to any repayment of term loans, and no event of default under the ABL facility has occurred and is continuing or would result from paying the dividend. In addition, there is no limit on dividend declarations or payments if the undrawn availability is less than the greater of $120 million and 20 % of the total facility size, after giving effect to any repayment of term loans, but more than the greater of $75 million and 12.5 % of the total facility size, after giving effect to any repayment of term loans, if (i) no event of default has occurred and is continuing or would result from paying the dividend, (ii) the Company demonstrates to the administrative agent that, prior to and after giving effect to the payment of the dividend (A) the undrawn availability, as measured both at the time of the dividend payment and as an average for the 60 consecutive day period immediately preceding the dividend payment, is at least the greater of $75 million and 12.5 % of the total facility size, after giving effect to any repayment of term loans, and (B) the Company maintains a fixed charge coverage ratio of at least 1.00 :1.00 , as calculated in accordance with the terms of the ABL facility.
Share-based Compensation
In May 2022, the Company’s stockholders approved the ATI Inc. 2022 Incentive Plan (the “2022 Incentive Plan”). Following adoption, all new share-based compensation awards are being made under the 2022 Incentive Plan. Shares previously remaining available for grant under prior incentive plans, or which become available for award due to the forfeiture or cancellation of prior awards under those prior plans, are available for award under the 2022 Incentive Plan. Outstanding grants previously made under prior incentive plans remain in effect in accordance with relevant terms.
Awards earned under the Company’s share-based incentive compensation programs are paid with shares held in treasury or newly issued shares depending on the level of treasury shares held. At December 31, 2023, 5.4 million shares of common stock were available for future awards under the 2022 Incentive Plan. The general terms of each arrangement granted under the 2022 Incentive Plan, and predecessor plans, the method of estimating fair value for each arrangement, and award activity is reported below.
The Company’s share-based incentive compensation program consists of both service-based and performance/market-based awards. These awards convey participants the right to receive shares of ATI common stock if the service conditions, and performance or market requirements, of the awards are attained.
Service-based awards:
Restricted share units (RSUs) are rights to receive shares of Company stock when the award vests. The RSUs generally vest over three years based on employment service, with one-third of the award vesting on each of the first, second and third anniversaries of the grant date. RSU awards to non-employee directors vest in one year. No dividends are accumulated or paid on the RSUs. The fair value of the RSU award is measured based on the stock price at the grant date.
86
Compensation expense related to RSU awards was $14.5 million in fiscal year 2023, $13.4 million in fiscal year 2022, and $14.3 million in fiscal year 2021. Approximately $8.7 million of unrecognized fair value compensation expense relating to restricted stock units is expected to be recognized through fiscal year 2026, with $6.6 million expected to be recognized in fiscal year 2024, including estimates of service period forfeitures. Activity under the Company’s RSU awards for the fiscal years ended December 31, 2023, January 1, 2023, and January 2, 2022 was as follows:
| Fiscal Year | ||||||||||||||||||||||||||||||||||||||
| (Shares in thousands, $ in millions) | 2023 | 2022 | 2021 | |||||||||||||||||||||||||||||||||||
| Number of shares/units | Weighted Average Grant Date Fair Value | Number of shares/units | Weighted Average Grant Date Fair Value | Number of shares | Weighted Average Grant Date Fair Value | |||||||||||||||||||||||||||||||||
| Nonvested, beginning of fiscal year | $ | $ | $ | |||||||||||||||||||||||||||||||||||
| Granted | ||||||||||||||||||||||||||||||||||||||
| Vested | ( | ( | ( | ( | ( | ( | ||||||||||||||||||||||||||||||||
| Forfeited | ( | ( | ( | ( | ( | ( | ||||||||||||||||||||||||||||||||
| Nonvested, end of fiscal year | $ | $ | $ | |||||||||||||||||||||||||||||||||||
Performance condition awards:
The Company awarded performance share units (PSUs) with performance requirements through fiscal year 2020. These PSU award opportunities, the last of which vested at the conclusion of its applicable three-year performance period on January 1, 2023, were determined at a target number of units, and the number of shares awarded was based on attainment of two ATI financial performance metrics. PSU awards through fiscal year 2020 are accounted for as performance condition plans with service vesting requirements, with compensation expense during the performance period recognized based on estimates of attaining the performance criteria, including estimated forfeitures. The metrics for PSU awards granted in fiscal years 2019 and 2020 measured (1) net income attributable to ATI and (2) return on capital employed, over a three-year performance period with a threshold attainment of 25 % and a maximum attainment of 200 % of the target financial performance metrics and target share units, measured over the applicable three-year performance period. For certain senior executives, the number of PSUs to be awarded based on the performance criteria was modified up or down by up to 20 % based on the Company’s relative total shareholder return (TSR) over the performance measurement period (“TSR Modifier”), but not above the maximum number of PSUs to be vested. The TSR Modifier measured the return of the Company’s stock price (including assumed dividend reinvestment, if any) at the end of the performance period as compared to the stock prices (including assumed dividend reinvestment, if any) of a group of industry peers. The fair value of the PSU award was measured based on the stock price at the grant date, including the effect of the TSR Modifier. The fair value of the TSR Modifier was determined by using Monte Carlo simulations of stock price correlation, projected dividend yields and other variables over a three-year time horizon matching the TSR performance measurement period. Expense recognition varied with the level of performance achieved.
Market condition awards:
The Company awarded PSUs with market requirements in fiscal years 2021, 2022 and 2023. These PSU award opportunities are determined at a target number of share units, and the number of shares awarded is based on TSR, representing the measured return of the Company’s stock price (including assumed dividend reinvestment, if any) at the end of the three year period as compared to the stock prices (including assumed dividend reinvestment, if any) of a group of industry peers. The fiscal year 2021, 2022 and 2023 PSU awards are accounted for as a market condition plan with service vesting requirements, with expense recognized over the service period without regard to the level of TSR attainment or shares awarded. The actual number of shares awarded at the end of the measurement period may range from a minimum of zero to a maximum of two times target. For the fiscal year 2021 and 2022 awards, TSR is determined over eight distinct quarterly periods as measured from January 1 of the grant year of the award through the end of each quarterly period starting with the first quarter ending in the second year following the grant of the award. For the 2023 awards, TSR is determined over four distinct quarterly periods as measured from January 1 of the grant year of the award through the end of each quarterly period starting with the first quarter ending in the third year following the grant of the award; earned payouts from each TSR measurement period are averaged to determine the final payout at the conclusion of the three-year period. The fair value for this award was determined by using Monte Carlo simulations of stock price correlation, projected dividend yields and other variables over the three-year time horizon matching the TSR measurement period.
In fiscal year 2022, the Company awarded a new one-time grant of PSUs with market requirements, called the Breakout Performance Award (BPA). In fiscal year 2023, 46,046 additional share units under the fiscal year 2022 BPA were awarded to new members of senior management and 4,807 shares were issued due to retirement vesting. The BPA has a target number of
87
share units, and the number of shares awarded is based on the absolute return on the Company’s stock during a four-year measurement period. The service vesting requirements of the BPA award are four years for one half of the award and five years for the remaining half. The BPA award is accounted for as a market condition plan with service vesting requirements, with expense recognized over the service periods without regard to the level of absolute return attainment or shares awarded. The actual number of BPA shares awarded at the end of the measurement period may range from a minimum of zero to a maximum of three times target. The fair value for this award was determined by using Monte Carlo simulations of stock price correlation, projected dividend yields and other variables over the four-year time horizon matching the BPA measurement period.
At December 31, 2023, a maximum of 4.8 million shares have been reserved for issuance for all PSU awards. The Company recognized $14.6 million, $12.6 million and $6.8 million of compensation expense in fiscal years 2023, 2022 and 2021, respectively, for all PSU awards. Forfeited share units in fiscal years 2023, 2022 and 2021 were 19,863 , 159,298 , and 71,801 , respectively, with a weighted average grant date fair value of $0.5 million, $3.4 million, and $1.7 million, respectively.
The fair value of each PSU award, the target share units awarded and projected future compensation expense to be recognized for these awards, including actual and estimated forfeitures at December 31, 2023 was as follows:
| (Shares in thousands, $ in millions) | ||||||||||||||||||||||||||
| PSU Award Performance Period | Award Fair Value | December 31, 2023 Unrecognized Compensation Expense | Compensation Expense Expected to be Recognized in the next 12 months | Target Share Units | ||||||||||||||||||||||
| Fiscal Year 2021-2023 | $ | $ | $ | |||||||||||||||||||||||
| Fiscal Year 2022-2024 | $ | |||||||||||||||||||||||||
| Fiscal Year 2023-2025 | $ | |||||||||||||||||||||||||
| Fiscal Year 2022-2025 BPA | $ | |||||||||||||||||||||||||
| Total | $ | $ | ||||||||||||||||||||||||
Note 17. Income Taxes
Income (loss) before income taxes for the Company’s U.S. and non-U.S. operations was as follows:
| Fiscal Year | ||||||||||||||||||||
| (In millions) | 2023 | 2022 Revised | 2021 Revised | |||||||||||||||||
| U.S. | $ | $ | $ | |||||||||||||||||
| Non-U.S. | ( | |||||||||||||||||||
| Income before income taxes | $ | $ | $ | |||||||||||||||||
88
The income tax provision (benefit) was as follows:
| Fiscal Year | ||||||||||||||||||||
| (In millions) | 2023 | 2022 | 2021 | |||||||||||||||||
| Current: | ||||||||||||||||||||
| Federal | $ | $ | $ | |||||||||||||||||
| State | ( | |||||||||||||||||||
| Foreign | ||||||||||||||||||||
| Total | ||||||||||||||||||||
| Deferred: | ||||||||||||||||||||
| Federal | ( | ( | ||||||||||||||||||
| State | ( | ( | ||||||||||||||||||
| Foreign | ( | ( | ( | |||||||||||||||||
| Total | ( | ( | ||||||||||||||||||
| Income tax provision (benefit) | $ | ( | $ | $ | ||||||||||||||||
The following is a reconciliation of income taxes computed at the statutory U.S. Federal income tax rate to the actual effective income tax provision (benefit):
| Fiscal Year | ||||||||||||||||||||
| (In millions) | 2023 | 2022 Revised | 2021 Revised | |||||||||||||||||
| Taxes computed at the federal rate | $ | $ | $ | |||||||||||||||||
| Goodwill | ||||||||||||||||||||
| State and local income taxes, net of federal tax benefit | ||||||||||||||||||||
| Valuation allowance | ( | ( | ( | |||||||||||||||||
| Repatriation of foreign earnings (GILTI ) | ||||||||||||||||||||
| Divestiture | ||||||||||||||||||||
| Recognition of stranded deferred tax balance | ||||||||||||||||||||
| Foreign earnings taxed at different rate | ||||||||||||||||||||
| Withholding taxes | ||||||||||||||||||||
| Preferential tax rate | ( | ( | ( | |||||||||||||||||
| Other | ( | ( | ( | |||||||||||||||||
| Income tax provision (benefit) | $ | ( | $ | $ | ||||||||||||||||
The Company’s income tax expense has been impacted by the effects of valuation allowances on federal and state deferred tax assets for fiscal years 2021 through 2023. The Company recognizes deferred tax assets to the extent it believes these deferred tax assets are more likely than not to be realized. Valuation allowances are established when it is estimated that it is more likely than not the tax benefit of the deferred tax asset will not be realized. In making such determination, the Company considers all available evidence, both positive and negative, regarding the estimated future reversals of existing taxable temporary differences, estimated future taxable income exclusive of reversing temporary differences and carryforwards, historical taxable income in prior carryback periods if carryback is permitted, and potential tax planning strategies which may be employed to prevent an operating loss or tax credit carryforward from expiring unused. The verifiable evidence such as future reversals of existing temporary differences and the ability to carryback are considered before the subjective sources such as estimated future taxable income exclusive of temporary differences and tax planning strategies. In situations where a three-year cumulative loss position exists, the ability to consider projections of future results as positive evidence to assess the realizability of deferred tax assets is subjective. If the Company determines that it would not be able to realize its deferred tax assets in the future in excess of their recorded net amount, an adjustment to the deferred tax asset valuation allowance would result.
Since fiscal year 2020, ATI’s U.S. operations were in a three-year cumulative loss position, limiting the ability to utilize future projections as verifiable sources of income when analyzing the need for a valuation allowance. This cumulative loss continued until fiscal year 2023 when ATI exited the three-year cumulative loss position and the Company concluded it was appropriate to consider future projections as a source of income when analyzing the need for a valuation allowance.
89
In fiscal year 2023, ATI recorded a tax benefit associated with the valuation allowance due to the current year income for the U.S. operations and a $140.3 million additional benefit was recorded related to the valuation allowance release associated with ATI’s ability to utilize projections for future income.
Revised fiscal years 2022 and 2021 results reflect the voluntary change, as discussed in Note 1, in the method of accounting for recognizing actuarial gains and losses for defined benefit pension plans whereby gains or losses from the remeasurement of the projected benefit obligation and plan assets for these pension plans are immediately recognized in earnings. These gains and losses were historically recognized in AOCI which included a full valuation allowance offset in AOCI. Overall, the underlying liability associated with pension did not change with this accounting policy change, therefore the deferred tax asset did not change for each year, only the reclassification of taxes recorded changed from AOCI on the consolidated balance sheet to the consolidated statement of operations. Given the full valuation allowance offset, there was no impact to earnings from this reclassification in prior years.
In fiscal year 2022, ATI recorded a tax benefit associated with the valuation allowance due to the current year income for the U.S. operations. As a result of the current year income, ATI utilized net operating loss carryovers which in turn resulted in a release of the corresponding valuation allowance on the operating loss deferred tax assets.
The provision for income taxes for the fiscal year ended January 1, 2023, is mainly attributable to the Company’s foreign operations and state income tax expense associated with states that limit net operating loss utilization. On May 12, 2022, the Company sold its Sheffield, UK operations which resulted in a pre-tax loss of $112.2 million (see Note 6 for further explanation) for which the benefit was disallowed for tax purposes, resulting in a $23.0 million tax expense impact as shown in the effective tax rate reconciliation table above.
In fiscal year 2021, ATI incurred tax expense associated with the valuation allowance due to the postretirement medical benefit settlement gain along with the U.S. operations plus permanent adjustments (goodwill and Global Intangible Low-Taxed Income (GILTI)) being a loss.
The provision for income taxes for the fiscal year ended January 2, 2022 is mainly attributable to the $15.5 million in discrete tax effects related to the postretirement medical benefits settlement gain discussed in Note 14, in accordance with ATI’s accounting policy for recognizing deferred tax amounts stranded in AOCI. This $15.5 million is presented within two lines in the above table, $11.6 million within valuation allowance and $3.9 million on the recognition of stranded deferred tax balance line which represents the difference between current and historical tax rates in AOCI. The $11.6 million has two components: $5.2 million of additional required valuation allowance on ATI’s net deferred tax assets following the reduction of deferred tax liabilities in AOCI associated with the recognition of the AOCI portion of the retirement benefit settlement gain of $21.9 million, and $6.4 million of “trapped” valuation allowances remaining in AOCI from prior periods that are now recognized upon extinguishment of the retirement benefit plan (see Notes 14 and 15).
In fiscal year 2021, the Company allocated $12.2 million of the goodwill from ATI’s Forged Products reporting unit to the sale of Flowform Products (see Note 6 for further explanation) which was non-deductible for tax purposes, resulting in a $2.6 million expense included as a reconciling item in the table above.
The Company also maintained valuation allowances on deferred tax amounts recorded in AOCI in fiscal years 2023, 2022 and 2021 of $24.1 million, $23.9 million, and $5.1 million, respectively, which are not reflected in the preceding table reconciling amounts recognized in the income tax provision (benefit) recorded in the statement of operations (see Note 15).
Additionally, the Tax Cuts and Jobs Act (Tax Act) requires a current year inclusion in U.S. federal taxable income of certain earnings of controlled foreign corporations, commonly referred to as GILTI. In fiscal years 2023 and 2021, the amount of GILTI represents a full inclusion due to ATI’s net operating loss utilization and inability to utilize GILTI credits when taxable income is zero. In fiscal year 2022, due to the loss on the sale of the Sheffield operations, there is no current year inclusion. The Company has elected to recognize GILTI liabilities as an element of income tax expense in the period incurred.
In the fourth quarter of fiscal year 2021, the Company was granted a preferential tax rate related to the PRS joint venture operations in China for tax years 2021 through 2023. The preferential tax rate is 15%, compared to the statutory rate of 25%. As of December 31, 2023, the preferential tax rate has expired, and the Company will prospectively utilize the 25% statutory tax rate pending a ruling by the Chinese government on a new preferential rate tax application which will be filed in 2024.
90
Deferred income taxes result from temporary differences in the recognition of income and expense for financial and income tax reporting purposes, and differences between the fair value of assets acquired in business combinations accounted for as purchases for financial reporting purposes and their corresponding tax bases. Deferred income taxes represent future tax benefits or costs to be recognized when those temporary differences reverse. The categories of assets and liabilities that have resulted in differences in the timing of the recognition of income and expense at December 31, 2023 and January 1, 2023 were as follows:
| Fiscal Year | ||||||||||||||
| (In millions) | 2023 | 2022 | ||||||||||||
| Deferred income tax assets | ||||||||||||||
| Net operating loss tax carryovers | $ | $ | ||||||||||||
| Pensions | ||||||||||||||
| Postretirement benefits other than pensions | ||||||||||||||
| Tax credits | ||||||||||||||
| Research and development | ||||||||||||||
| Inventory valuation | ||||||||||||||
| Other items | ||||||||||||||
| Gross deferred income tax assets | ||||||||||||||
| Valuation allowance for deferred tax assets | ( | ( | ||||||||||||
| Total deferred income tax assets | ||||||||||||||
| Deferred income tax liabilities | ||||||||||||||
| Basis of property, plant and equipment | ||||||||||||||
| Inventory valuation | ||||||||||||||
| Basis of amortizable intangible assets | ||||||||||||||
| Other items | ||||||||||||||
| Total deferred tax liabilities | ||||||||||||||
| Net deferred tax asset (liability) | $ | $ | ( | |||||||||||
Changes in the valuation allowance for deferred tax assets in fiscal year 2023 in the above table compared to fiscal year 2022 include the following:
•$198.8 million of valuation allowance recorded as income tax benefit and included in the reconciliation of the current year income tax provision and $7.8 million of a benefit related to current year activity is recorded on the state and local income tax line within the rate reconciliation above.
•Reductions in the valuation allowance related to the benefit in AOCI of $0.2 million (as discussed in Note 15).
In fiscal year 2023, the deferred tax liability related to inventory changed from a deferred tax liability to a deferred tax asset. This change is related to the recognition of the deferred tax liability associated with the accounting policy change from the LIFO inventory cost method adopted by the Company during the fourth quarter of fiscal year 2021, which for tax purposes is recognized over four years versus one year for book purposes.
91
The following summarizes the carryforward periods for the tax attributes related to NOLs and credits by jurisdiction.
| ($ in millions, U.S. and U.K. NOL amounts are pre-tax and all other items are after-tax) | |||||||||||||||||
| Jurisdiction | Attribute | Amount | Expiration Period | Amount expiring within 5 years | Amount expiring in 5-20 years | ||||||||||||
| U.S. | NOL | $ | 20 years | $ | $ | ||||||||||||
| U.S. | NOL | $ | Indefinite | $ | $ | ||||||||||||
| U.S. | Foreign Tax Credit | $ | 10 years | $ | $ | ||||||||||||
| U.S. | Research and Development Credit | $ | 20 years | $ | $ | ||||||||||||
| State | NOL | $ | Various | $ | $ | ||||||||||||
| State | NOL | $ | Indefinite | $ | $ | ||||||||||||
| State | Credits | $ | Various | $ | $ | ||||||||||||
| U.K. | NOL | $ | Indefinite | $ | $ | ||||||||||||
| Poland | Economic Zone Credit | $ | 7 years | $ | $ | ||||||||||||
Income taxes paid and amounts received as refunds were as follows:
| Fiscal Year | ||||||||||||||||||||
| (In millions) | 2023 | 2022 | 2021 | |||||||||||||||||
| Income taxes paid | $ | $ | $ | |||||||||||||||||
| Income tax refunds received | ( | ( | ( | |||||||||||||||||
| Income taxes paid, net | $ | $ | $ | |||||||||||||||||
Deferred taxes of $7.7 million have been recorded for foreign withholding taxes on earnings expected to be repatriated to the U.S. The Company does not intend to distribute previously taxed earnings resulting from the one-time transition tax under the Tax Act, and has not recorded any deferred taxes related to such amounts. The remaining excess of the amount for financial reporting over the tax basis of investments in foreign subsidiaries is indefinitely reinvested, and the determination of any deferred tax liability on this amount is not practicable.
Uncertain tax positions are recorded using a two-step process based on (1) determining whether it is more-likely-than-not the tax positions will be sustained on the basis of the technical merits of the position and (2) for those positions that meet the more-likely-than-not recognition threshold, the Company records the largest amount of the tax benefit that is more than 50 percent likely to be realized upon ultimate settlement with the related tax authority. The changes in the liability for unrecognized income tax benefits for the fiscal years ended December 31, 2023, January 1, 2023 and January 2, 2022 were as follows:
| Fiscal Year | ||||||||||||||||||||
| (In millions) | 2023 | 2022 | 2021 | |||||||||||||||||
| Balance at beginning of fiscal year | $ | $ | $ | |||||||||||||||||
| Increases in prior period tax positions | ||||||||||||||||||||
| Decreases in prior period tax positions | ( | |||||||||||||||||||
| Increases in current period tax positions | ||||||||||||||||||||
| Expiration of the statute of limitations | ( | ( | ( | |||||||||||||||||
| Balance at end of fiscal year | $ | $ | $ | |||||||||||||||||
For fiscal years ended December 31, 2023, January 1, 2023 and January 2, 2022, the liability includes $7.2 million, $7.8 million and $12.3 million, respectively, of unrecognized tax benefits that are classified within deferred income taxes as a reduction of NOL carryforwards and other tax attributes. The total estimated unrecognized tax benefit that, if recognized, would affect ATI’s effective tax rate is approximately $1.7 million. At this time, the Company believes that it is reasonably possible that approximately $0.5 million of the estimated unrecognized tax benefits as of December 31, 2023 will be recognized within the next twelve months based on the expiration of statutory review periods.
The Company recognizes accrued interest and penalties related to uncertain tax positions as income tax expense. The amounts accrued for interest and penalty charges for the fiscal years 2023, 2022 and 2021 were not significant. At December 31, 2023 and January 1, 2023, the accrued liabilities for interest and penalties related to unrecognized tax benefits were $1.3 million and $1.4 million, respectively.
92
The Company, and/or one of its subsidiaries, files income tax returns in the U.S. federal jurisdiction and in various state and foreign jurisdictions. A summary of tax years that remain subject to examination, by major tax jurisdiction, is as follows:
| Jurisdiction | Earliest Year Open to Examination | |||||||
| U.S. Federal | 2020 | |||||||
| States: | ||||||||
| Pennsylvania | 2020 | |||||||
| Foreign: | ||||||||
| China | 2020 | |||||||
| Poland | 2017 | |||||||
| United Kingdom | 2021 | |||||||
Note 18. Business Segments
The Company operates under two business segments: High Performance Materials & Components (HPMC) and Advanced Alloys & Solutions (AA&S).
HPMC is comprised of the Specialty Materials and Forged Products businesses, as well as the ATI Europe distribution operations. Approximately 85 % of its revenue is derived from the aerospace & defense markets including nearly 60 % of its revenue from products for commercial jet engines. Other major HPMC end markets include medical and energy. HPMC produces a wide range of high performance materials, components, and advanced metallic powder alloys. These are made from nickel-based alloys and superalloys, titanium and titanium-based alloys, and a variety of other specialty materials. Capabilities range from cast/wrought and powder alloy development to final production of highly engineered finished components, and 3D-printed aerospace products.
The AA&S segment includes the Specialty Alloys & Components business, the Specialty Rolled Products business, the 60 %-owned STAL PRS joint venture, and the Uniti and A&T Stainless 50 60 % of its revenue. Other important end markets for AA&S include electronics, medical and automotive. AA&S produces nickel-based alloys, titanium and titanium-based alloys, and specialty alloys in a variety of forms including plate, sheet, and strip products.
The measure of segment EBITDA categorically excludes income taxes, depreciation and amortization, corporate expenses, net interest expense, closed operations and other expenses, charges for goodwill and asset impairments, restructuring and other charges, strike related costs, pension remeasurement gains/losses, debt extinguishment charges and gains or losses on asset sales and sales of businesses. Management believes segment EBITDA, as defined, provides an appropriate measure of controllable operating results at the business segment level.
Intersegment sales are generally recorded at full cost or market. Common services are allocated on the basis of estimated utilization.
93
| Fiscal Year | ||||||||||||||||||||
| (In millions) | 2023 | 2022 | 2021 | |||||||||||||||||
| Total sales: | ||||||||||||||||||||
| High Performance Materials & Components | $ | $ | $ | |||||||||||||||||
| Advanced Alloys & Solutions | ||||||||||||||||||||
| Total sales | ||||||||||||||||||||
| Intersegment sales: | ||||||||||||||||||||
| High Performance Materials & Components | ||||||||||||||||||||
| Advanced Alloys & Solutions | ||||||||||||||||||||
| Total intersegment sales | ||||||||||||||||||||
| Sales to external customers: | ||||||||||||||||||||
| High Performance Materials & Components | ||||||||||||||||||||
| Advanced Alloys & Solutions | ||||||||||||||||||||
| Total sales to external customers | $ | $ | $ | |||||||||||||||||
Total international sales were $1,922.9 million in fiscal year 2023, $1,617.4 million in fiscal year 2022, and $1,264.9 million in fiscal year 2021. Of these amounts, sales by operations in the United States to customers in other countries were $1,498.7 million in fiscal year 2023, $1,217.9 million in fiscal year 2022, and $846.3 million in fiscal year 2021.
| Fiscal Year | ||||||||||||||||||||
| (In millions) | 2023 | 2022 Revised | 2021 Revised | |||||||||||||||||
| EBITDA: | ||||||||||||||||||||
| High Performance Materials & Components | $ | $ | $ | |||||||||||||||||
| Advanced Alloys & Solutions | ||||||||||||||||||||
| Total segment EBITDA | ||||||||||||||||||||
| Corporate expenses | ( | ( | ( | |||||||||||||||||
| Closed operations and other income (expenses) | ( | ( | ||||||||||||||||||
| Depreciation & amortization | ( | ( | ( | |||||||||||||||||
| Interest expense, net | ( | ( | ( | |||||||||||||||||
| Restructuring and other credits (charges) (See Note 19) | ( | ( | ||||||||||||||||||
| Strike related costs | ( | |||||||||||||||||||
| ( | ||||||||||||||||||||
| ( | ||||||||||||||||||||
| Joint venture restructuring credit (See Note 7) | ||||||||||||||||||||
| Debt extinguishment charge (See Note 10) | ( | |||||||||||||||||||
| Gain (loss) on asset sales and sale of business, net | ( | ( | ||||||||||||||||||
| Income before income taxes | $ | $ | $ | |||||||||||||||||
Beginning in 2020, the U.S. government enacted various relief packages in response to the COVID-19 pandemic. Results for the fiscal year ended January 1, 2023 include $34 million related to this government sponsored COVID relief in segment EBITDA. HPMC segment results for fiscal year 2022 include $27 million of benefits from the AMJP Program and employee retention credits, and AA&S segment results for fiscal year 2022 include $7 million in employee retention credits.
Corporate expenses are primarily classified as selling and administrative expenses in the consolidated statement of operations, and consist of salaries and benefits, incentive compensation, facility leases and other costs of ATI’s corporate functions.
Closed operations and other expenses are primarily presented in selling and administrative expenses in the consolidated statements of operations. These items included costs at closed facilities, including legal matters, environmental, real estate and other facility costs, and changes in foreign currency remeasurement impacts primarily related to ATI’s European Treasury Center operation. Closed operations and other expenses in fiscal year 2023 reflect higher retirement benefit expense and higher insurance costs associated with an outstanding insurance claim involving our captive insurance company compared to prior year periods.
94
Depreciation expense in fiscal year 2023 includes $3.8 million of accelerated depreciation of fixed assets related to the restructuring of our European operations and the closure of our Robinson, PA operations.
During the fiscal year ended January 2, 2022, the Company recorded $63.2 million in strike related costs, of which $59.7 million were excluded from AA&S segment EBITDA and $3.5 million were excluded from HPMC segment EBITDA. These items primarily consisted of overhead costs recognized in the period due to below-normal operating rates, higher costs for outside conversion activities, and ongoing benefit costs for striking employees.
Loss on asset sales and sales of businesses for fiscal year 2023 is related to a $0.6 million loss on the sale of the Company’s Northbrook, IL operations, for which no proceeds were received but $0.3 million of transaction costs were paid and reported as an investing activity on the consolidated statement of cash flows. Gain (loss) on asset sales and sales of businesses, net, for fiscal year 2022 relate to a $112.2 million loss on the sale of the Company’s Sheffield, UK operations, partially offset by a $6.8 million gain from the sale of assets from the Pico Rivera, CA operations. The $13.8 million gain on asset sales in fiscal year 2021 consists of a gain on the sale of the Company’s Flowform Products business. See Note 6 for further explanation regarding the sale of business transactions in fiscal years 2022 and 2021.
Certain additional information regarding the Company’s business segments is presented below:
| Fiscal Year | ||||||||||||||||||||
| (In millions) | 2023 | 2022 | 2021 | |||||||||||||||||
| Depreciation and amortization: | ||||||||||||||||||||
| High Performance Materials & Components | $ | $ | $ | |||||||||||||||||
| Advanced Alloys & Solutions | ||||||||||||||||||||
| Other | ||||||||||||||||||||
| Total depreciation and amortization | $ | $ | $ | |||||||||||||||||
| Capital expenditures: | ||||||||||||||||||||
| High Performance Materials & Components | $ | $ | $ | |||||||||||||||||
| Advanced Alloys & Solutions | ||||||||||||||||||||
| Corporate | ||||||||||||||||||||
| Total capital expenditures | $ | $ | $ | |||||||||||||||||
| Fiscal Year | ||||||||||||||||||||
| Identifiable assets: | 2023 | 2022 | 2021 | |||||||||||||||||
| High Performance Materials & Components | $ | $ | $ | |||||||||||||||||
| Advanced Alloys & Solutions | ||||||||||||||||||||
| Corporate: | ||||||||||||||||||||
| Deferred Taxes | ||||||||||||||||||||
| Cash and cash equivalents and other | ||||||||||||||||||||
| Total assets | $ | $ | $ | |||||||||||||||||
| Fiscal Year | Fiscal Year | Fiscal Year | ||||||||||||||||||||||||||||||||||||
| ($ in millions) | 2023 | Percent of total | 2022 | Percent of total | 2021 | Percent of total | ||||||||||||||||||||||||||||||||
| Total assets: | ||||||||||||||||||||||||||||||||||||||
| United States | $ | % | $ | % | $ | % | ||||||||||||||||||||||||||||||||
| China | % | % | % | |||||||||||||||||||||||||||||||||||
| United Kingdom | % | % | % | |||||||||||||||||||||||||||||||||||
| Other | % | % | % | |||||||||||||||||||||||||||||||||||
| Total Assets | $ | % | $ | % | $ | % | ||||||||||||||||||||||||||||||||
95
Note 19. Restructuring and other charges
For the fiscal year ended December 31, 2023, restructuring and other charges were $31.4 million and include $7.7 million of severance-related restructuring charges and $23.7 million of charges included within cost of sales on the consolidated statements of operations. The $7.7 million of severance-related restructuring charges represent severance for the involuntary reduction of approximately 110 employees primarily for the restructuring of the European operations and across ATI’s domestic operations in conjunction with the continued transformation. The $23.7 million of charges within cost of sales include $11.5 million of start up costs, $1.9 million of costs associated with an unplanned outage at our Lockport, NY facility, and $10.3 million primarily for asset write-offs for the restructuring of our European operations and the closure of our Robinson, PA operations.
For the fiscal year ended January 1, 2023, restructuring and other charges were $23.7 million, which included a $28.5 million charge for a litigation settlement (see Note 21), partially offset by $4.8 million of restructuring credits for reductions in severance-related reserves related to approximately 110 employees based on changes in planned operating rates and revised workforce estimates.
For the fiscal year ended January 2, 2022, restructuring and other charges were a net benefit of $10.5 million, which primarily included $11.3 million of reversals of previously-recognized restructuring charges separately classified on the consolidated statement of operations, as well as an $0.8 million charge for inventory valuation reserves classified in cost of sales on the consolidated statement of operations related to the fiscal year 2020 idling of the Albany, OR primary titanium facility. Restructuring items in fiscal year 2021 include a $12.0 million reduction in severance-related reserves related to approximately 350 employees based on changes in planned operating rates and revised workforce reduction estimates, partially offset by $0.7 million of other costs related to facility idlings.
Restructuring reserves for severance cost activity is as follows:
| Severance and Employee | |||||||||||
| Benefit Costs | |||||||||||
| December 31, 2023 | January 1, 2023 | January 2, 2022 | |||||||||
| Beginning of fiscal year balance | $ | $ | $ | ||||||||
| Additions/(Adjustments) | ( | ( | |||||||||
| Payments | ( | ( | ( | ||||||||
| End of fiscal year balance | $ | $ | $ | ||||||||
96
Note 20. Per Share Information
The following table sets forth the computation of basic and diluted net income per common share:
(In millions, except per share amounts)
| Fiscal Year | ||||||||||||||||||||
| 2023 | 2022 Revised | 2021 Revised | ||||||||||||||||||
| Numerator: | ||||||||||||||||||||
| Numerator for basic net income per common share - | ||||||||||||||||||||
| Net income attributable to ATI | $ | $ | $ | |||||||||||||||||
| Effect of dilutive securities: | ||||||||||||||||||||
| Numerator for diluted net income per common share - | ||||||||||||||||||||
| Net income attributable to ATI after assumed conversions | $ | $ | $ | |||||||||||||||||
| Denominator: | ||||||||||||||||||||
| Denominator for basic net income per common share—weighted average shares | ||||||||||||||||||||
| Effect of dilutive securities: | ||||||||||||||||||||
| Share-based compensation | ||||||||||||||||||||
| Denominator for diluted net income per common share—adjusted weighted average shares and assumed conversions | ||||||||||||||||||||
| Basic net income attributable to ATI per common share | $ | $ | $ | |||||||||||||||||
| Diluted net income attributable to ATI per common share | $ | $ | $ | |||||||||||||||||
Common stock that would be issuable upon the assumed conversion of the 2025 Convertible Notes, and the 2022 Convertible Notes prior to their maturity, and other option equivalents and contingently issuable shares are excluded from the computation of contingently issuable shares, and therefore, from the denominator for diluted earnings per share, if the effect of inclusion is anti-dilutive. The 2022 Convertible Notes were converted as of June 30, 2022 (see Note 10 for further explanation). There were no
In February 2022 and April 2023, the Company’s Board of Directors authorized the repurchase of up to $150 million and $75 million, respectively, of ATI stock. In fiscal year 2023, ATI used $85.2 million to repurchase 2.0 million shares of its common stock under both programs. In fiscal year 2022, ATI used $139.9 million to repurchase 5.2 million shares of its common stock under the $150 million program. In addition, in November 2023, the Company’s Board of Directors authorized the repurchase of an additional $150 million of ATI stock. Effective January 2, 2023, the Company’s share repurchases are subject to a 1% excise tax as a result of the Inflation Reduction Act of 2022. Excise taxes incurred in fiscal year 2023 on share repurchases represent direct costs of the repurchase and are recorded as part of the cost basis of the shares within treasury stock. The cost of share repurchases for fiscal year 2023 of $85.8 million differs from the repurchases of common stock amounts in the consolidated statements of cash flows due to these excise taxes. Repurchases under these programs were or may be made in the open market or in privately negotiated transactions, with the amount and timing of repurchases depending on market conditions and corporate needs. Open market repurchases are structured to occur within the pricing and volume requirements of SEC Rule 10b-18. The Company’s ongoing stock repurchase programs do not obligate the Company to repurchase any specific number of shares and may be modified, suspended, or terminated at any time by the Company’s Board of Directors without prior notice.
Note 21. Commitments and Contingencies
Future minimum rental commitments under leases are disclosed in Note 11. Commitments for expenditures on property, plant and equipment at December 31, 2023 were approximately $86.1 million.
The Company is subject to various domestic and international environmental laws and regulations that govern the discharge of pollutants and disposal of wastes, and which may require that it investigate and remediate the effects of the release or disposal of materials at sites associated with past and present operations. The Company could incur substantial cleanup costs, fines, and civil or criminal sanctions, third party property damage or personal injury claims as a result of violations or liabilities under
97
these laws or noncompliance with environmental permits required at its facilities. The Company is currently involved in the investigation and remediation of a number of its current and former sites, as well as third party sites.
Environmental liabilities are recorded when the Company’s liability is probable and the costs are reasonably estimable. In many cases, however, the Company is not able to determine whether it is liable or, if liability is probable, to reasonably estimate the loss or range of loss. Estimates of the Company’s liability remain subject to additional uncertainties, including the nature and extent of site contamination, available remediation alternatives, the extent of corrective actions that may be required, and the number, participation, and financial condition of other potentially responsible parties (PRPs). The Company adjusts its accruals to reflect new information as appropriate. Future adjustments could have a material adverse effect on the Company’s consolidated results of operations in a given period, but the Company cannot reliably predict the amounts of such future adjustments.
At December 31, 2023, the Company’s reserves for environmental remediation obligations totaled approximately $13 million, of which $7 million was included in . The reserve includes estimated probable future costs of $3 million for federal Superfund and comparable state-managed sites; $7 million for formerly owned or operated sites for which the Company has remediation or indemnification obligations; $2 million for owned or controlled sites at which Company operations have been or plan to be discontinued; and $1 million for sites utilized by the Company in its ongoing operations. The Company continues to evaluate whether it may be able to recover a portion of future costs for environmental liabilities from third parties and to pursue such recoveries where appropriate.
Based on currently available information, it is reasonably possible that the costs for active matters may exceed the Company’s recorded reserves by as much as $17 million. Future investigation or remediation activities may result in the discovery of additional hazardous materials, potentially higher levels of contamination than discovered during prior investigation, and may impact costs associated with the success or lack thereof in remedial solutions. Therefore, future developments, administrative actions or liabilities relating to environmental matters could have a material adverse effect on the Company’s consolidated financial condition or results of operations.
The timing of expenditures depends on a number of factors that vary by site. The Company expects that it will expend present accruals over many years and that remediation of all sites with which it has been identified will be completed within thirty years.
A number of other lawsuits, claims and proceedings have been or may be asserted against the Company relating to the conduct of its currently and formerly owned businesses, including those pertaining to product liability, environmental, health and safety matters and occupational disease (including as each relates to alleged asbestos exposure), as well as patent infringement, commercial, government contracting, construction, employment, employee and retiree benefits, taxes, environmental, and stockholder and corporate governance matters. While the outcome of litigation cannot be predicted with certainty, and some of these lawsuits, claims or proceedings may be determined adversely to the Company, management does not believe that the disposition of any such pending matters is likely to have a material adverse effect on the Company’s financial condition or liquidity, although the resolution in any reporting period of one or more of these matters could have a material adverse effect on the Company’s consolidated results of operations for that period.
ATI Titanium LLC (ATI Titanium), a subsidiary of ATI Inc., was party to a lawsuit captioned US Magnesium, LLC v. ATI Titanium LLC (Case No. 2:17-cv-00923-DB) and filed in federal district court in Salt Lake City, UT, pertaining to a Supply and Operating Agreement between US Magnesium LLC (USM) and ATI Titanium entered into in 2006 (the Supply Agreement). In 2016, ATI Titanium notified USM that it would suspend performance under the Supply Agreement in reliance on certain terms and conditions included in the Supply Agreement. USM subsequently filed a claim challenging ATI Titanium’s right to suspend performance under the Supply Agreement. ATI Titanium and USM reached a litigation settlement in fiscal year 2022 for $28.5 million, which is reported within other (nonoperating) expense on the consolidated statement of operations and was paid in the fiscal year ended January 1, 2023.
98
Note 22. Quarterly Financial Data (Unaudited)
The following selected quarterly operating results for each quarter of fiscal years 2023 and 2022 have been revised to reflect the voluntary change in accounting method as described in Note 1.
Quarterly financial data for fiscal years 2023 and 2022 was as follows:
| Quarter Ended | ||||||||||||||||||||||||||
| (In millions except share and per share amounts) | April 2, 2023 | July 2, 2023 | October 1, 2023 | December 31, 2023 | ||||||||||||||||||||||
| Fiscal Year 2023 - | ||||||||||||||||||||||||||
| Sales | $ | $ | $ | $ | ||||||||||||||||||||||
| Operating income | ||||||||||||||||||||||||||
| Net income | ||||||||||||||||||||||||||
| Net income attributable to ATI | ||||||||||||||||||||||||||
| Basic income attributable to ATI per common share* | $ | $ | $ | $ | ||||||||||||||||||||||
| Diluted income attributable to ATI per common share* | $ | $ | $ | $ | ||||||||||||||||||||||
| Quarter Ended | ||||||||||||||||||||||||||
| April 3, 2022 | July 3, 2022 | October 2, 2022 | January 1, 2023 | |||||||||||||||||||||||
| Fiscal Year 2022- | ||||||||||||||||||||||||||
| Sales | $ | $ | $ | $ | ||||||||||||||||||||||
| Operating income | ||||||||||||||||||||||||||
| Net income | ||||||||||||||||||||||||||
| Net income attributable to ATI | ||||||||||||||||||||||||||
| Basic income attributable to ATI per common share* | $ | $ | $ | $ | ||||||||||||||||||||||
| Diluted income attributable to ATI per common share* | $ | $ | $ | $ | ||||||||||||||||||||||
The comparability of the Company’s quarterly financial results during fiscal years 2023 and 2022 was impacted by certain items, as follows:
First quarter of fiscal year 2023 results include a $1.2 million pre-tax ($1.1 million, net of tax) charge for costs to restart the Company’s titanium operations in Albany, OR.
Second quarter of fiscal year 2023 results include pre-tax charges totaling $10.6 million ($10.2 million, net of tax), which include $4.5 million for start-up costs, $2.7 million of severance-related restructuring charges, $2.8 million primarily for asset write-offs related to the closure of our Robinson, PA operation, and $0.6 million for the loss on the sale of the Company’s Northbrook, IL operation.
Third quarter of fiscal year 2023 results include pre-tax net charges totaling $4.2 million ($4.0 million, net of tax), which include $2.8 million for start-up costs and $1.9 million of costs associated with an unplanned outage at the Company’s Lockport, NY melt facility, partially offset by a $0.5 million credit for restructuring charges, primarily related to lowered severance-related reserves based on changes in planned operating rates and revised workforce reduction estimates.
Fourth quarter of fiscal year 2023 results include net pre-tax charges totaling $88.3 million ($84.7 million, net of tax), which include $3.0 million for start-up costs, $5.5 million of severance-related restructuring charges, $11.3 million for inventory and asset write-offs related to the restructuring of the Company’s European operations, $26.8 million for a pension plan remeasurement loss, and $41.7 million for a pension plan settlement loss. Fourth quarter of fiscal year 2023 results also include a $140.3 million discrete tax benefit primarily related to the reversal of a portion of deferred tax valuation allowances due to exiting the three-year cumulative loss condition for U.S. Federal and state jurisdictions at fiscal year-end 2023.
99
First quarter of fiscal year 2022 results include net pre-tax net charges totaling $25.8 million ($25.8 million, net of tax), which include an $8.6 million litigation reserve for the case of US Magnesium, LLC v. ATI Titanium LLC and a $25.1 million partial loss on the sale of the Company’s Sheffield, UK operations, partially offset by a $1.1 million credit for restructuring charges, primarily related to lowered severance-related reserves based on changes in planned operating rates and revised workforce reduction estimates and a $6.8 million gain on the sale of the Company’s Pico Rivera, CA operations.
Second quarter of fiscal year 2022 results include net pre-tax net charges totaling $85.8 million ($85.9 million, net of tax), which include an $87.1 million loss on the sale of our Sheffield, UK operations, which was completed in the second quarter of fiscal year 2022, partially offset by a $1.3 million credit for restructuring charges, primarily related to lowered severance-related reserves based on changes in planned operating rates and revised workforce reduction estimates.
Third quarter of fiscal year 2022 results include pre-tax net charges totaling $17.3 million ($16.3 million, net of tax), which include a $19.9 million litigation reserve, partially offset by a $2.6 million credit for restructuring charges, primarily related to lowered severance-related reserves based on changes in planned operating rates and revised workforce reduction estimates.
Fourth quarter of fiscal year 2022 results include a $100.3 million pre-tax and net of tax pension plan remeasurement gain.
Below reflects the quarterly impact of the change in accounting principle on our quarterly financial data presented:
| (dollars in millions, except per share data) | As Computed Under Previous Policy | As Reported Under New Policy | Effect of Accounting Change | |||||||||||||||||
| Three months ended April 2, 2023 | ||||||||||||||||||||
| Net income | $ | $ | $ | |||||||||||||||||
| Net income attributable to ATI | $ | $ | $ | |||||||||||||||||
| Basic income attributable to ATI per common share* | $ | $ | $ | |||||||||||||||||
| Diluted income attributable to ATI per common share* | $ | $ | $ | |||||||||||||||||
| Three months ended July 2, 2023 | ||||||||||||||||||||
| Net income | $ | $ | $ | |||||||||||||||||
| Net income attributable to ATI | $ | $ | $ | |||||||||||||||||
| Basic income attributable to ATI per common share* | $ | $ | $ | |||||||||||||||||
| Diluted income attributable to ATI per common share* | $ | $ | $ | |||||||||||||||||
| Three months ended October 1, 2023 | ||||||||||||||||||||
| Net income | $ | $ | $ | |||||||||||||||||
| Net income attributable to ATI | $ | $ | $ | |||||||||||||||||
| Basic income attributable to ATI per common share* | $ | $ | $ | |||||||||||||||||
| Diluted income attributable to ATI per common share* | $ | $ | $ | |||||||||||||||||
| Three months ended December 31, 2023 | ||||||||||||||||||||
| Net income (loss) | $ | ( | $ | $ | ||||||||||||||||
| Net income (loss) attributable to ATI | $ | ( | $ | $ | ||||||||||||||||
| Basic income (loss) attributable to ATI per common share* | $ | ( | $ | $ | ||||||||||||||||
| Diluted income (loss) attributable to ATI per common share* | $ | ( | $ | $ | ||||||||||||||||
100
| (dollars in millions, except per share data) | As Computed Under Previous Policy | As Reported Under New Policy | Effect of Accounting Change | |||||||||||||||||
| Three months ended April 3, 2022 | ||||||||||||||||||||
| Net income | $ | $ | $ | |||||||||||||||||
| Net income attributable to ATI | $ | $ | $ | |||||||||||||||||
| Basic income attributable to ATI per common share* | $ | $ | $ | |||||||||||||||||
| Diluted income attributable to ATI per common share* | $ | $ | $ | |||||||||||||||||
| Three months ended July 3, 2022 | ||||||||||||||||||||
| Operating income (loss) | $ | ( | $ | $ | ||||||||||||||||
| Net income (loss) | $ | ( | $ | $ | ||||||||||||||||
| Net income (loss) attributable to ATI | $ | ( | $ | $ | ||||||||||||||||
| Basic income (loss) attributable to ATI per common share* | $ | ( | $ | $ | ||||||||||||||||
| Diluted income (loss) attributable to ATI per common share* | $ | ( | $ | $ | ||||||||||||||||
| Three months ended October 2, 2022 | ||||||||||||||||||||
| Net income | $ | $ | $ | |||||||||||||||||
| Net income attributable to ATI | $ | $ | $ | |||||||||||||||||
| Basic income attributable to ATI per common share* | $ | $ | $ | |||||||||||||||||
| Diluted income attributable to ATI per common share* | $ | $ | $ | |||||||||||||||||
| Three months ended January 1, 2023 | ||||||||||||||||||||
| Net income | $ | $ | $ | |||||||||||||||||
| Net income attributable to ATI | $ | $ | $ | |||||||||||||||||
| Basic income attributable to ATI per common share* | $ | $ | $ | |||||||||||||||||
| Diluted income attributable to ATI per common share* | $ | $ | $ | |||||||||||||||||
Item 9. Changes in and Disagreements with Accountants on Accounting and Financial Disclosure
Not applicable.
Item 9A. Controls and Procedures
(a) Evaluation of Disclosure Controls and Procedures.
In accordance with Securities Exchange Act Rules 13-1-15(e) and 15d-15(e), our management, under the supervision of our Chief Executive Officer and Chief Financial Officer, conducted an evaluation of the effectiveness of the design and operation of our disclosure controls and procedures as of the end of the period covered by this Annual Report on Form 10-K. Based on that evaluation, the Chief Executive Officer and Chief Financial Officer concluded that our disclosure controls and procedures were effective as of December 31, 2023.
(b) Management’s Report on Internal Control over Financial Reporting.
Management is responsible for establishing and maintaining adequate internal control over financial reporting for the Company. Internal control over financial reporting is defined in Rules 13a-15(f) and 15d-15(f) promulgated under the Securities Exchange Act of 1934, as amended, as a process designed by, or under the supervision of, the company’s principal executive and principal financial officers and effected by the company’s board of directors, management and other personnel, to provide reasonable assurance regarding the reliability of financial reporting and the preparation of financial statements for external purposes in accordance with generally accepted accounting principles and includes those policies and procedures that:
101
Pertain to the maintenance of records that in reasonable detail accurately and fairly reflect the transactions and dispositions of the assets of the company;
Provide reasonable assurance that transactions are recorded as necessary to permit preparation of financial statements in accordance with generally accepted accounting principles, and that receipts and expenditures of the company are being made only in accordance with authorizations of management and directors of the company; and
Provide reasonable assurance regarding prevention or timely detection of unauthorized acquisition, use or disposition of the company’s assets that could have a material effect on the financial statements.
Because of its inherent limitations, internal control over financial reporting may not prevent or detect misstatements. Projections of any evaluation of effectiveness to future periods are subject to the risk that controls may become inadequate because of changes in conditions, or that the degree of compliance with the policies or procedures may deteriorate.
Internal control over financial reporting cannot provide absolute assurance of achieving financial reporting objectives because of its inherent limitations. Internal control over financial reporting is a process that involves human diligence and compliance and is subject to lapses in judgment and breakdowns resulting from human failures. Internal control over financial reporting can also be circumvented by collusion or improper management override. Because of such limitations, there is a risk that material misstatements may not be prevented or detected on a timely basis by internal control over financial reporting. However, these inherent limitations are known features of the financial reporting process. Therefore, it is possible to design into the process safeguards to reduce, though not eliminate, this risk.
The Company’s management assessed the effectiveness of the Company’s internal control over financial reporting as of December 31, 2023. In making this assessment, the Company’s management used the criteria set forth by the Committee of Sponsoring Organizations of the Treadway Commission (2013 framework) (COSO) in Internal Control-Integrated Framework.
Based on that assessment, the Chief Executive Officer and Chief Financial Officer concluded as of December 31, 2023, the Company’s internal control over financial reporting was effective based on those criteria.
The Company’s independent registered public accounting firm that audited the consolidated financial statements included in this Annual Report issued an attestation report on effectiveness of the Company’s internal control over financial reporting as of December 31, 2023.
(c) Changes to Internal Control over Financial Reporting.
There were no changes to our internal control over financial reporting that occurred during the fiscal quarter ended December 31, 2023 that have materially affected, or are reasonably likely to materially affect, our internal control over financial reporting.
Management’s Certifications
The certifications of the Company’s Chief Executive Officer and Chief Financial Officer required by the Sarbanes-Oxley Act are included as Exhibits 31 and 32 to this Annual Report on Form 10-K. In addition, in fiscal year 2023, the Company’s Chief Executive Officer provided to the New York Stock Exchange the annual CEO certification pursuant to Section 303A regarding the Company’s compliance with the New York Stock Exchange’s corporate governance listing standards.
102
Report of Independent Registered Public Accounting Firm
To the Stockholders and the Board of Directors of ATI Inc.
Opinion on Internal Control Over Financial Reporting
We have audited ATI Inc. and subsidiaries’ internal control over financial reporting as of December 31, 2023, based on criteria established in Internal Control—Integrated Framework issued by the Committee of Sponsoring Organizations of the Treadway Commission (2013 framework) (the COSO criteria). In our opinion, ATI Inc. and subsidiaries (the Company) maintained, in all material respects, effective internal control over financial reporting as of December 31, 2023, based on the COSO criteria.
We also have audited, in accordance with the standards of the Public Company Accounting Oversight Board (United States) (PCAOB), the consolidated balance sheets of the Company as of December 31, 2023 and January 1, 2023, the related consolidated statements of operations, comprehensive income (loss), cash flows and statements of changes in consolidated equity for each of the three years in the period ended December 31, 2023, and the related notes and our report dated February 23, 2024 expressed an unqualified opinion thereon.
Basis for Opinion
The Company’s management is responsible for maintaining effective internal control over financial reporting and for its assessment of the effectiveness of internal control over financial reporting included in the accompanying Management’s Report on Internal Control over Financial Reporting. Our responsibility is to express an opinion on the Company’s internal control over financial reporting based on our audit. We are a public accounting firm registered with the PCAOB and are required to be independent with respect to the Company in accordance with the U.S. federal securities laws and the applicable rules and regulations of the Securities and Exchange Commission and the PCAOB.
We conducted our audit in accordance with the standards of the PCAOB. Those standards require that we plan and perform the audit to obtain reasonable assurance about whether effective internal control over financial reporting was maintained in all material respects.
Our audit included obtaining an understanding of internal control over financial reporting, assessing the risk that a material weakness exists, testing and evaluating the design and operating effectiveness of internal control based on the assessed risk, and performing such other procedures as we considered necessary in the circumstances. We believe that our audit provides a reasonable basis for our opinion.
Definition and Limitations of Internal Control Over Financial Reporting
A company’s internal control over financial reporting is a process designed to provide reasonable assurance regarding the reliability of financial reporting and the preparation of financial statements for external purposes in accordance with generally accepted accounting principles. A company’s internal control over financial reporting includes those policies and procedures that (1) pertain to the maintenance of records that, in reasonable detail, accurately and fairly reflect the transactions and dispositions of the assets of the company; (2) provide reasonable assurance that transactions are recorded as necessary to permit preparation of financial statements in accordance with generally accepted accounting principles, and that receipts and expenditures of the company are being made only in accordance with authorizations of management and directors of the company; and (3) provide reasonable assurance regarding prevention or timely detection of unauthorized acquisition, use, or disposition of the company’s assets that could have a material effect on the financial statements.
Because of its inherent limitations, internal control over financial reporting may not prevent or detect misstatements. Also, projections of any evaluation of effectiveness to future periods are subject to the risk that controls may become inadequate because of changes in conditions, or that the degree of compliance with the policies or procedures may deteriorate.
/s/ Ernst & Young LLP
Pittsburgh, Pennsylvania
February 23, 2024
103
Item 9B. Other Information
Rule 10b5-1 Plan Elections
During the quarterly period ended December 31, 2023, Timothy J. Harris entered into a pre-arranged stock trading plan on November 14, 2023 , which provides for the potential sale of up to 12,650 shares of the Company’s Common Stock between February 12, 2024 and November 8, 2024.
This trading plan was entered into during an open insider trading window and is intended to satisfy the affirmative defense criteria articulated by Rule 10b5-1(c) under the Securities Exchange Act of 1934, as amended, as well as the Company’s policies and procedures pertaining to transactions in Company securities.
Item 9C. Disclosure Regarding Foreign Jurisdictions that Prevent Inspections
Not applicable.
PART III
Item 10. Directors and Executive Officers of the Registrant
The information concerning our directors required by this item is incorporated and made part hereof by reference to the material appearing under the heading “Our Corporate Governance” and “Election of Directors” and the information concerning our executive officers required by this item is incorporated and made part hereof by reference to the material appearing under the heading “Members of ATI's Executive Management,” in the ATI Proxy Statement for the 2024 Annual Meeting of Stockholders (the “2024 Proxy Statement”), which will be filed with the Securities and Exchange Commission, pursuant to Regulation 14A, not later than 120 days after the end of the fiscal year. Information concerning the Audit and Risk Committee and its financial expert required by this item is incorporated and made part hereof by reference to the material appearing under the heading “Our Corporate Governance-Board Information- Board Committees” in the 2024 Proxy Statement.
ATI has adopted Corporate Guidelines for Business Conduct and Ethics that apply to all employees including its principal executive officer or principal financial and accounting officer, or persons performing similar functions. The Corporate Guidelines for Business Conduct and Ethics as well as the charters for the Company’s Audit and Risk, Nominating and Governance, Personnel and Compensation, and Technology Committees, as well as periodic and current reports filed with the SEC, are available through the Company’s website at http://www.atimaterials.com and are available in print free of charge to any shareholder upon request. To obtain a copy, contact the Corporate Secretary, ATI Inc., 2021 McKinney Avenue, Dallas, Texas 75201 (telephone: 800-289-7454). The Company intends to post on its website any waiver from or amendment to the guidelines that apply to the Company’s Principal Executive Officer or Principal Financial and Accounting Officer (or persons performing similar functions) that relate to elements of the code of ethics identified by the Securities and Exchange Commission in Item 406(b) of Regulation S-K.
Item 11. Executive Compensation
Information required by this item is incorporated by reference to “Our Corporate Governance- Director Compensation,” “Executive Compensation” and “Compensation Committee Interlocks and Insider Participation” as set forth in the 2024 Proxy Statement.
104
Item 12. Security Ownership of Certain Beneficial Owners and Management and Related Stockholder Matters
Information relating to the ownership of equity securities by certain beneficial owners and management is incorporated by reference to “Stock Ownership Information” as set forth in the 2024 Proxy Statement.
Equity Compensation Plan Information
Information about our equity compensation plans at December 31, 2023 was as follows:
| (a) | ||||||||||||||||||||
| (In thousands, except per share amounts) | Number of Shares to be Issued Upon Exercise of Outstanding Options, Warrants and Rights (1) | Weighted Average Exercise Price of Outstanding Options, Warrants and Rights (2) | Number of Shares Remaining Available for Future Issuance Under Equity Compensation Plans (3) (excluding securities reflected in column (a)) | |||||||||||||||||
| Equity Compensation Plans Approved by Shareholders | $ | 5,094 | $ | — | $ | 5,360 | ||||||||||||||
| Equity Compensation Plans Not Approved by Shareholders | — | — | — | |||||||||||||||||
| Total | 5,094 | $ | — | $ | 5,360 | |||||||||||||||
(1)Includes stock-settled equity awards previously granted under the ATI Inc. 2022 Incentive Plan (the “2022 Incentive Plan”) and prior incentive plans. Amounts reflected for performance share unit awards represent the maximum number of shares that could be awarded at the conclusion of the applicable performance cycle.
(2)Outstanding stock-settled awards are not included in this calculation.
(3)Represents shares available for issuance under the 2022 Incentive Plan (which provides for the issuance of stock options, stock appreciation rights, restricted shares, restricted stock units, performance and other stock-based awards). See Note 16. Stockholders’ Equity for a discussion of the Company’s stock-based compensation plans.
Item 13. Certain Relationships and Related Transactions, and Director Independence
Information required by this item is incorporated by reference to “Related Party Transactions” and “Our Corporate Governance- Board Information- Board Composition and Independence” as set forth in the 2024 Proxy Statement.
Item 14. Principal Accountant Fees and Services
Information required by this item is incorporated by reference to “Ratification of Selection of Independent Auditors” as set forth in the 2024 Proxy Statement.
PART IV
Item 15. Exhibits, Financial Statements and Financial Statement Schedules
(a) Financial Statements, Financial Statement Schedules and Exhibits:
(1) Financial Statements
The following consolidated financial statements and report are filed as part of this report under Item 8 – “Financial Statements and Supplementary Data”:
Consolidated Statements of Operations — Fiscal Years Ended December 31, 2023, January 1, 2023, and January 2, 2022
Consolidated Statements of Comprehensive Income (Loss) — Fiscal Years Ended December 31, 2023, January 1, 2023 and January 2, 2022
Consolidated Statements of Cash Flows — Fiscal Years Ended December 31, 2023, January 1, 2023, and January 2, 2022
Statements of Changes in Consolidated Equity — Fiscal Years Ended December 31, 2023, January 1, 2023, and January 2, 2022
105
The report of ATI’s independent registered public accounting firm (PCAOB ID: 42 ) with respect to the above-referenced financial statements and their report on internal control over financial reporting are included in Item 8 and Item 9A of this Form 10-K. Their consent appears as Exhibit 23.1 of this Form 10-K.
(2) Financial Statement Schedules
All schedules set forth in the applicable accounting regulations of the Securities and Exchange Commission either are not required under the related instructions or are not applicable and, therefore, have been omitted.
(3) Exhibits
Exhibits required to be filed by Item 601 of Regulation S-K are listed below. Documents not designated as being incorporated herein by reference are filed herewith. The paragraph numbers correspond to the exhibit numbers designated in Item 601 of Regulation S-K.
EXHIBIT INDEX
106
| Exhibit No. | Description | |||||||
| 4.12 | ||||||||
| 4.13 | ||||||||
| 4.14 | ||||||||
| 4.15 | ||||||||
| 10.1 | ||||||||
| 10.2 | ||||||||
| 10.3 | ||||||||
| 10.4 | ||||||||
| 10.5 | ||||||||
| 10.6 | ||||||||
| 10.7 | ||||||||
| 10.8 | ||||||||
| 10.9 | ||||||||
| 10.10 | ||||||||
| 10.11 | ||||||||
| 10.12 | ||||||||
| 10.13 | ||||||||
| 10.14 | ||||||||
| 10.15 | ||||||||
| 10.16 | ||||||||
| 10.17 | ||||||||
| 10.18 | ||||||||
107
| Exhibit No. | Description | |||||||
| 10.19 | Amendment No. 2, dated as of September 9, 2022, to First Amended and Restated Revolving Credit, Term Loan, Delayed Draw Term Loan and Security Agreement, dated as of September 30, 2019, by and among the borrowers party thereto, the Company and other guarantors party thereto, the lenders party thereto, and PNC Bank, National Association, as Lender and Agent (incorporated by reference to Exhibit 10.1 to the Registrant’s Quarterly Report on Form 10-Q for the quarter ended June 30, 2023 (File No. 1-12001). | |||||||
| 10.20 | ||||||||
| 18.1 | ||||||||
| 21.1 | ||||||||
| 23.1 | ||||||||
| 31.1 | ||||||||
| 31.2 | ||||||||
| 32.1 | ||||||||
| 97.1 | ||||||||
| 101.INS | Inline XBRL Instance Document - the instance document does not appear in the Interactive Data File because its XBRL tags are embedded within the Inline XBRL document. | |||||||
| 101.SCH | Inline XBRL Taxonomy Extension Schema Document. | |||||||
| 101.CAL | Inline XBRL Taxonomy Extension Calculation Linkbase Document. | |||||||
| 101.DEF | Inline XBRL Taxonomy Extension Definition Linkbase Document. | |||||||
| 101.LAB | Inline XBRL Taxonomy Extension Label Linkbase Document. | |||||||
| 101.PRE | Inline XBRL Taxonomy Extension Presentation Linkbase Document. | |||||||
| 104 | Cover Page Interactive Data File - the cover page interactive data file does not appear in the Interactive Data File because its XBRL tags are embedded within the Inline XBRL document. | |||||||
* Management contract or compensatory plan or arrangement required to be filed as an Exhibit to this Report.
Certain instruments defining the rights of holders of long-term debt of the Company and its subsidiaries have been omitted from the Exhibits in accordance with Item 601(b)(4)(iii) of Regulation S-K. A copy of any omitted document will be furnished to the Commission upon request.
Item 16. Form 10-K Summary
Not applicable.
108
SIGNATURES
Pursuant to the requirements of Section 13 or 15(d) of the Securities Exchange Act of 1934, the Registrant has duly caused this Report to be signed on its behalf by the undersigned, thereunto duly authorized.
| ATI INC. | ||||||||||||||
| Date: | February 23, 2024 | By | /s/ Robert S. Wetherbee | |||||||||||
| Robert S. Wetherbee | ||||||||||||||
| Board Chair and Chief Executive Officer | ||||||||||||||
Pursuant to the requirements of the Securities Exchange Act of 1934, this report has been signed below by the following persons on behalf of the Registrant and in the capacities and as of the 23rd day of February, 2024.
| /s/ Robert S. Wetherbee | /s/ Donald P. Newman | |||||||
Robert S. Wetherbee Board Chair and Chief Executive Officer (Principal Executive Officer) | Donald P. Newman Executive Vice President, Finance and Chief Financial Officer (Principal Financial and Accounting Officer) | |||||||
| /s/ Leroy M. Ball | /s/ J. Brett Harvey | |||||||
Leroy M. Ball Director | J. Brett Harvey Director | |||||||
| /s/ Herbert J. Carlisle | /s/ David P. Hess | |||||||
Herbert J. Carlisle Director | David P. Hess Director | |||||||
| /s/ Carolyn Corvi | /s/ Marianne Kah | |||||||
Carolyn Corvi Director | Marianne Kah Director | |||||||
| /s/ James C. Diggs | /s/ David J. Morehouse | |||||||
James C. Diggs Director | David J. Morehouse Director | |||||||
| /s/ Kimberly A. Fields | /s/ Ruby Sharma | |||||||
Kimberly A. Fields Director | Ruby Sharma Director | |||||||
109