As filed with the Securities and Exchange Commission on 25 April 2024
UNITED STATES SECURITIES AND EXCHANGE COMMISSION Washington, D.C. 20549 |
FORM 20-F
REGISTRATION STATEMENT PURSUANT TO SECTION 12(B) OR 12(G) OF THE SECURITIES EXCHANGE ACT OF 1934 | |
OR | |
ANNUAL REPORT PURSUANT TO SECTION 13 OR 15(D) OF THE SECURITIES EXCHANGE ACT OF 1934 OR | |
TRANSITION REPORT PURSUANT TO SECTION 13 OR 15(D) OF THE SECURITIES EXCHANGE ACT OF 1934 OR | |
SHELL COMPANY REPORT PURSUANT TO SECTION 13 OR 15(D) OF THE SECURITIES EXCHANGE ACT OF 1934 |
FOR THE FINANCIAL YEAR ENDED 31 DECEMBER 2023
Commission file number: 001-41815
(Exact Name of Registrant as Specified in its Charter)
(Jurisdiction of Incorporation or Organisation)
(Address of Principal Executive Offices)
E-mail: (Name, Telephone, E-mail and/or Facsimile number and Address of Company Contact Person) |
Securities registered pursuant to Section 12(b) of the Act:
Title of each class | Trading Symbols | Name of each exchange on which registered |
Securities registered pursuant to Section 12(g) of the Act:
None
Securities for which there is a reporting obligation pursuant to Section 15(d) of the Act:
None
Indicate the number of outstanding shares of each of the issuer’s classes of capital or common stock as of the close of the period covered by the
annual report:
Ordinary Shares of $1.00 each |
Indicate by check mark if the registrant is a well-known seasoned issuer, as defined in Rule 405 of the Securities Act. | ||
If this report is an annual or transition report, indicate by check mark if the registrant is not required to file reports pursuant to Section 13 or 15(d) of the Securities Exchange Act of 1934. | Yes ☐ | |
Indicate by check mark whether the registrant (1) has filed all reports required to be filed by Section 13 or 15(d) of the Securities Exchange Act of 1934 during the preceding 12 months (or for such shorter period that the registrant was required to file such reports), and (2) has been subject to such filing requirements for the past 90 days. | ||
Indicate by check mark whether the registrant has submitted electronically every Interactive Data File required to be submitted pursuant to Rule 405 of Regulation S-T (§232.405 of this chapter) during the preceding 12 months (or for such shorter period that the registrant was required to submit such files). | ||
Indicate by check mark whether the registrant is a large accelerated filer, an accelerated filer, a non-accelerated filer, or an emerging growth company. See definition of “large accelerated filer”, “accelerated filer,” and “emerging growth company” in Rule 12b-2 of the Exchange Act. | ||
Check one: | Accelerated filer ☐ | Non-accelerated filer ☐ | Emerging growth company | |||||
If an emerging growth company that prepares its financial statements in accordance with U.S. GAAP, indicate by check mark if the registrant has elected not to use
the extended transition period for complying with any new or revised financial accounting standards† provided pursuant to Section 13(a) of the Exchange Act. ☐
† The term “new or revised financial accounting standard” refers to any update issued by the Financial Accounting Standards Board to its Accounting Standards
Codification after April 5, 2012.
Indicate by check mark whether the registrant has filed a report on and attestation to its management’s assessment of the effectiveness of its internal control over
financial reporting under Section 404(b) of the Sarbanes-Oxley Act (15 U.S.C. 7262(b)) by the registered public accounting firm that prepared or issued its audit
report.☒
If securities are registered pursuant to Section 12(b) of the Act, indicate by check mark whether the financial statements of the registrant included in the filing reflect the correction of an error to previously issued financial statements. | |
Indicate by check mark whether any of those error corrections are restatements that required a recovery analysis of incentive-based compensation received by any of the registrant’s executive officers during the relevant recovery period pursuant to §240.10D-1(b). |
Indicate by check mark which basis of accounting the registrant has used to prepare the financial statements included in this filing: | U.S. GAAP ☐ |
If “Other” has been checked in response to the previous question, indicate by check mark which financial statement item the registrant has elected to follow. | Item 17 ☐ Item 18 ☐ | |
If this is an annual report, indicate by check mark whether the registrant is a shell company (as defined in Rule 12b-2 of the Exchange Act). | Yes ☐ |
TABLE OF CONTENTS | |||
Page | |||
Item 1: | |||
Item 2: | |||
Item 3: | |||
3A. | [Reserved] | ||
3B. | |||
3C. | |||
3D. | |||
Item 4: | |||
4A. | |||
4B. | |||
4C. | |||
4D. | |||
Item 4A: | |||
Item 5: | |||
5A. | |||
5B. | |||
5C. | |||
5D. | |||
5E. | |||
Item 6: | |||
6A. | Directors and senior management | ||
6B. | |||
6C. | |||
6D. | |||
6E. | |||
6F. | |||
Item 7: | |||
7A. | |||
7B. | |||
7C. | |||
Item 8: | |||
8A. | |||
Legal proceedings | |||
8B. | |||
4
Item 9: | |||||
9A. | |||||
9B. | |||||
9C. | |||||
9D. | |||||
9E. | |||||
9F. | |||||
Item 10: | |||||
10A. | |||||
10B. | |||||
10C. | |||||
10D. | |||||
10E. | |||||
10F. | |||||
10G. | |||||
10H. | |||||
10I. | |||||
10J. | |||||
Item 11: | |||||
Item 12: | |||||
12A. | |||||
12B. | |||||
12C. | |||||
12D. | |||||
12D.3 | |||||
12D.4 | |||||
Item 13: | |||||
Item 14: | |||||
Item 15: | |||||
Item 16A: | |||||
Item 16B: | |||||
Item 16C: | |||||
Item 16D: | |||||
Item 16E: | |||||
Item 16F: | |||||
Item 16G: | |||||
Item 16H: | |||||
Item 16I: | |||||
Item 16J: | |||||
Item 16K: | Cybersecurity | ||||
Item 17: | |||||
Item 18: | |||||
Item 19: | E-1 | ||||
5
PRESENTATION OF INFORMATION
Corporate restructuring
On 12 May 2023, AngloGold Ashanti Limited announced the intention to implement a corporate restructuring to reorganise its
operations under a new parent company, AngloGold Ashanti plc, incorporated in England and Wales and tax resident in the
United Kingdom (UK), with a primary listing of its ordinary shares on the New York Stock Exchange (NYSE). On 18 August 2023,
the shareholders of AngloGold Ashanti Limited approved the corporate restructuring, which was implemented through the issue
of ordinary shares of AngloGold Ashanti plc in exchange for the existing ordinary shares of AngloGold Ashanti Limited.
On 25 September 2023, the Group completed its corporate restructuring with the commencement of trading of the ordinary
shares of AngloGold Ashanti plc on the NYSE, maintaining the ticker symbol AU. Trading in the AngloGold Ashanti Limited
American Depositary Shares (ADSs) on the NYSE ceased at the close of market on 22 September 2023 and the AngloGold
Ashanti Limited ADS programme was terminated with effect from 25 September 2023. AngloGold Ashanti remains committed to
the Johannesburg Stock Exchange (JSE) and A2X Market (A2X) in South Africa and the Ghana Stock Exchange (GSE) in Ghana
on which it has maintained secondary listings. The ordinary shares of AngloGold Ashanti plc were listed on the JSE and A2X on
20 September 2023, maintaining the ticker symbol ANG. The ordinary shares and Ghanaian Depositary Shares of AngloGold
Ashanti plc were listed on the GSE, maintaining the ticker symbols AGA and AAD, respectively, on 26 September 2023.
On 27 June 2023, AngloGold Ashanti Limited voluntarily delisted from the Australian Securities Exchange (ASX).
Upon completion of the corporate restructuring, AngloGold Ashanti plc became the listed UK parent company of the Group and
the successor issuer to AngloGold Ashanti Limited. The previous South African parent company of the Group, AngloGold Ashanti
Limited, became a direct, wholly-owned subsidiary of AngloGold Ashanti plc and was renamed AngloGold Ashanti (Pty) Ltd.
AngloGold Ashanti Holdings plc, the Isle of Man company holding all of the Group’s operations and assets located outside South
Africa, also became a direct, wholly-owned subsidiary of AngloGold Ashanti plc.
Upon completion of the corporate restructuring, the Group’s global headquarters were moved to Denver, Colorado in the United
States. The Company’s registered office and principal executive office are located in the United Kingdom. The Group also retains
a substantial corporate office in Johannesburg, South Africa.
AngloGold Ashanti plc
In this annual report on Form 20-F, unless the context otherwise requires, references to AngloGold, AngloGold Ashanti, AGA, the
company, the Company, we, us, our, the group and the Group are references to (i) prior to the implementation of the corporate
restructuring, AngloGold Ashanti Limited including, as appropriate, subsidiaries and associate companies of AngloGold Ashanti
Limited and (ii) subsequent to the implementation of the corporate restructuring, AngloGold Ashanti plc including, as appropriate,
subsidiaries and associate companies of AngloGold Ashanti plc.
IFRS financial statements
As a company incorporated in the United Kingdom, AngloGold Ashanti prepares annual audited consolidated financial
statements and unaudited consolidated half-year financial statements in accordance with IFRS Accounting Standards as issued
by the International Accounting Standards Board (IASB). These financial statements are distributed to shareholders and are
submitted to the NYSE, JSE as well as the GSE.
Explanatory note
General
Prior to the filing of this annual report on Form 20-F, in connection with the preparation of its consolidated financial statements as
of and for the financial year ended 31 December 2023, the Company, as successor issuer to AngloGold Ashanti Limited
(currently known as AngloGold Ashanti (Pty) Ltd), concluded that AngloGold Ashanti Limited’s previously issued audited
consolidated financial statements as of and for the financial year ended 31 December 2022, included in the annual report on
Form 20-F for the financial year ended 31 December 2022 filed by AngloGold Ashanti Limited with the U.S. Securities and
Exchange Commission (the “SEC”) on 17 March 2023 (the “2022 Form 20-F”) (the “Original Full-Year 2022 Financial
Statements”) contained an error in the calculation of the net deferred tax asset with regard to the Obuasi mine. Additionally, the
Company also identified other errors which were not considered material to (i) the Original Full-Year 2022 Financial Statements
and (ii) AngloGold Ashanti Limited’s previously issued audited consolidated financial statements as of and for the financial year
ended 31 December 2021, included in the annual report on Form 20-F for the financial year ended 31 December 2021 filed by
AngloGold Ashanti Limited with the SEC on 30 March 2022 (the “Original Full-Year 2021 Financial Statements”).
6
Non-reliance
As previously reported, on 21 February 2024, the Audit and Risk Committee of the board of directors of the Company (the “Audit
and Risk Committee”), based on the recommendation of, and after consultation with, the Company’s management, concluded
that (i) the Original Full-Year 2022 Financial Statements and (ii) AngloGold Ashanti Limited’s previously issued unaudited
condensed consolidated interim financial statements as of and for the six-month period ended 30 June 2023, included in a report
on Form 6-K filed by AngloGold Ashanti Limited with the SEC on 4 August 2023 (the “Half-Year 2023 Form 6-K”) (the “Original
Half-Year 2023 Financial Statements”), should no longer be relied upon.
Impact of the restatements
The Audit and Risk Committee evaluated the effect of these prior period errors and determined that the Company needed to
restate the Original Full-Year 2022 Financial Statements and would restate the Original Full-Year 2021 Financial Statements, in
both cases in accordance with IFRS Accounting Standards. The aggregate restatement due to the error related to the reported
amount of the net deferred tax asset with regard to the Obuasi mine resulted in a reduction in profit for the financial year ended
31 December 2022 by $49 million. The restatement due to the other immaterial errors which were also corrected resulted in a
reduction in profit for the financial year ended 31 December 2022 by $16 million and a reduction in profit for the financial year
ended 31 December 2021 by $8 million. The restatements had no impact on the Group’s debt, the financial maintenance
covenants in its credit facilities or its statement of cash flows. Furthermore, certain other information has also been adjusted to
reflect the effects of the corporate restructuring. For further information on the restatements, including the impact thereof on each
financial statement line item, see “Item 18: Financial Statements—Note 1—Statement of Compliance—1.3 Restatements”.
Items restated in this filing
The Company’s management believes it is preferable to present the restated Original Full-Year 2022 Financial Statements
together with the Company’s audited consolidated financial statements as of and for the financial year ended 31 December 2023
in this annual report on Form 20-F. The Company believes this will allow readers to review more easily all pertinent data in a
single document and therefore does not plan to amend the 2022 Form 20-F. Separately, the Company will present the restated
Original Half-Year 2023 Financial Statements in an amendment to the Half-Year 2023 Form 6-K.
Controls and procedures considerations
As previously reported, as a result of the errors described above and the related restatements, the Company’s management has
identified a material weakness in the Company’s internal control over financial reporting. In addition, the Company’s
management has identified two additional material weaknesses in the Company’s internal control over financial reporting. The
Company’s management has accordingly concluded that the Company’s internal control over financial reporting was not effective
as of 31 December 2023 and its disclosure controls and procedures were similarly not effective as of 31 December 2023. The
Company’s management has identified remediation plans to address each material weakness. For a further discussion of the
material weaknesses in the Company’s internal control over financial reporting and related plans of remediation, see “Item 15:
Controls and Procedures”.
Currency
AngloGold Ashanti presents its consolidated financial statements in United States dollars.
In this annual report on Form 20-F, references to US dollar, dollar, USD, US$ or $ are to the lawful currency of the United States,
references to € or Euro are to the lawful currency of the European Union, references to ARS or Argentinean peso are to the
lawful currency of Argentina, references to AUD, Australian dollar or A$ are to the lawful currency of Australia, references to BRL
or Brazilian real are to the lawful currency of Brazil, references to TZS or Tanzanian shilling are to the lawful currency of the
United Republic of Tanzania, references to Ghanaian cedi, GHS, cedi or Gh¢ are to the lawful currency of Ghana, references to
CDF or Congolese franc are to the lawful currency of the Democratic Republic of the Congo, references to rand, ZAR or R are to
the lawful currency of the Republic of South Africa, references to GBP, British pounds or £ are to the lawful currency of the United
Kingdom, references to Canadian dollar, CAD or C$ are to the lawful currency of Canada and references to Colombian peso or
COP are to the lawful currency of Colombia.
Non-GAAP financial measures
From time to time AngloGold Ashanti may publicly disclose certain “Non-GAAP” financial measures in the course of its financial
presentations, earnings releases, earnings conference calls and otherwise.
In this annual report on Form 20-F, AngloGold Ashanti presents the financial items “total cash costs”, “total cash costs per
ounce”, “all-in sustaining costs”, “all-in sustaining costs per ounce”, “all-in costs”, “all-in costs per ounce”, “average gold price
received per ounce”, “sustaining capital expenditure” and “non-sustaining capital expenditure”, which have been determined
using industry guidelines and practices and are not measures under IFRS. An investor should not consider these items in
isolation or as alternatives to cost of sales, gold income, capital expenditure or any other measure of financial performance
7
presented in accordance with IFRS or as an indicator of the Group’s performance. The Group uses certain Non-GAAP
performance measures and ratios in managing the business and may provide users of this financial information with additional
meaningful comparisons between current results and results in prior operating periods. Non-GAAP financial measures should be
viewed in addition to, and not as an alternative to, the reported operating results or any other measure of performance prepared
in accordance with IFRS. In addition, the presentation of these measures may not be comparable to similarly titled measures that
other companies use. See “Glossary of selected terms—Financial terms—Total cash costs”, “Glossary of selected terms—
Financial terms—All-in sustaining costs”, “Glossary of selected terms—Financial terms—All-in costs”, “Glossary of selected
terms—Financial terms—Average gold price received per ounce”, “Glossary of selected terms—Financial terms—Sustaining
capital (expenditure)” and “Glossary of selected terms—Financial terms—Non-sustaining capital (expenditure)” for definitions.
During 2018, the World Gold Council (“WGC”), an industry body, published a revised Guidance Note on “all-in sustaining costs”
and “all-in costs” metrics, which gold mining companies can use to supplement their overall Non-GAAP disclosure. The WGC
worked closely with its members (including AngloGold Ashanti) to develop these Non-GAAP measures which are intended to
provide further transparency into the full cost associated with producing gold. It is expected that these metrics, in particular, the
“all-in sustaining cost” and “all-in cost” metrics which AngloGold Ashanti provides herein, will be helpful to investors,
governments, local communities and other stakeholders in understanding the economics of gold mining. “Total cash costs” is
calculated in accordance with the guidelines of the Gold Institute industry standard and industry practice and is a Non-GAAP
measure. The Gold Institute, which has been incorporated into the National Mining Association, is a non-profit international
association of miners, refiners, bullion suppliers and manufacturers of gold products, which developed a uniform format for
reporting total cash costs on a per ounce basis. The guidance was first adopted in 1996 and revised in November 1999.
While the Gold Institute provided definitions for the calculation of “total cash costs” and the WGC published a revised Guidance
Note on “all-in sustaining costs” and “all-in costs” metrics during 2018, the calculation of “total cash costs”, “total cash costs per
ounce”, “all-in sustaining costs”, “all-in sustaining costs per ounce”, “all-in costs” and “all-in costs per ounce” may vary
significantly among gold mining companies, and by themselves do not necessarily provide a basis for comparison with other gold
mining companies. However, AngloGold Ashanti believes that “total cash costs”, “all-in sustaining costs” and “all-in costs” in total
by mine and per ounce by mine as well as “average gold price received per ounce”, “sustaining capital expenditure” and “non-
sustaining capital expenditure” are useful indicators to investors and management as they provide:
•an indication of profitability, efficiency and cash flows;
•the trend in costs as the mining operations mature over time on a consistent basis; and
•an internal benchmark of performance to allow for comparison against other mines, both within the Group and at other gold
mining companies.
Management prepares its internal management reporting documentation, for use and decision making by the Chief Operating
Decision Maker (CODM), on an attributable basis. The key metrics are based on the attributable ounces, gold income, “total cash
costs”, “all-in costs”, “all-in sustaining costs”, “sustaining capital expenditure” and “non-sustaining capital expenditure” from each
operation and as a consequence includes AngloGold Ashanti’s share of the “total cash costs”, “all-in costs”, “all-in sustaining
costs”, “sustaining capital expenditure” and “non-sustaining capital expenditure” of its joint ventures that are accounted for under
the equity method. In a capital intensive industry, this basis allows management to make operating and resource allocation
decisions on a comparable basis between mining operations irrespective of whether they are consolidated or accounted for
under the equity method. This basis of calculating the metrics, where costs should be reported on the same basis as sales (i.e., if
sales are reported on an attributable basis, then costs should be reported on an attributable basis), is also consistent with the
WGC’s Guidance Note on “all-in sustaining costs” and “all-in costs” metrics.
Although AngloGold Ashanti has shareholder rights and board representation commensurate with its ownership interests in its
equity-accounted joint ventures and review the underlying operating results including “total cash costs”, “all-in costs”, “all-in
sustaining costs”, “sustaining capital expenditure” and “non-sustaining capital expenditure” with them at each reporting period, it
does not have direct control over their operations or resulting revenue and expenses, nor does it have a proportionate legal
interest in each financial statement line item. AngloGold Ashanti’s use of “total cash costs”, “all-in costs”, “all-in sustaining costs”,
“sustaining capital expenditure” and “non-sustaining capital expenditure” on an attributable basis, is not intended to imply that it
has any such control or proportionate legal interest, but rather to reflect the Non-GAAP measures on a basis consistent with its
internal and external segmental reporting.
A reconciliation of cost of sales as included in the Company’s audited financial statements to “all-in sustaining costs”, “all-in
sustaining costs per ounce”, “all-in costs”, “all-in costs per ounce”, “total cash costs” and “total cash costs per ounce” for each of
the three years in the period ended 31 December 2023 is presented on a total (subsidiaries/joint ventures) and segment basis
herein. In addition, the Company has provided detail of the attributable ounces of gold produced and sold by mine for each of
those periods herein. A reconciliation of gold income as included in the Company’s audited financial statements to “average gold
price received per ounce” for each of the three years in the period ended 31 December 2023 is presented on a total
(subsidiaries/joint ventures) basis herein. A reconciliation of capital expenditure as included in the Company’s audited financial
statements to “sustaining capital expenditure” and “non-sustaining capital expenditure” for each of the three years in the period
ended 31 December 2023 is presented on a total (subsidiaries/joint ventures) and segment basis herein. See “Item 5A:
Operating Results—Non-GAAP analysis—Reconciliations” for reconciliations.
8
Shares and shareholders
In this annual report on Form 20-F, references to ordinary shares, ordinary shareholders, equity shareholders and shareholders/
members, should be read as common stock, common stockholders and stockholders, respectively, and vice versa.
9
CERTAIN FORWARD-LOOKING STATEMENTS
Certain statements contained in this annual report on Form 20-F, other than statements of historical fact, including, without
limitation, those concerning the economic outlook for the gold mining industry, expectations regarding gold prices, production,
total cash costs, all-in sustaining costs, all-in costs, cost savings and other operating results, return on equity, productivity
improvements, growth prospects and outlook of AngloGold Ashanti’s operations, individually or in the aggregate, including the
achievement of project milestones, commencement and completion of commercial operations of certain of AngloGold Ashanti’s
exploration and production projects and the completion of acquisitions, dispositions or joint venture transactions, AngloGold
Ashanti’s liquidity and capital resources and capital expenditures, the consequences of the COVID-19 pandemic and the
outcome and consequences of any potential or pending litigation or regulatory proceedings or environmental, health and safety
issues, are forward-looking statements regarding AngloGold Ashanti’s financial reports, operations, economic performance and
financial condition.
These forward-looking statements or forecasts are not limited to historical facts, but rather reflect our current beliefs and
expectations concerning future events and generally may be identified by the use of forward-looking words, phrases and
expressions such as “believe”, “expect”, “aim”, “anticipate”, “intend”, “foresee”, “forecast”, “predict”, “project”, “estimate”, “likely”,
“may”, “might”, “could”, “should”, “would”, “seek”, “plan”, “scheduled”, “possible”, “continue”, “potential”, “outlook”, “target” or other
similar words, phrases, and expressions; provided that the absence thereof does not mean that a statement is not forward-
looking. Similarly, statements that describe our objectives, plans or goals are or may be forward-looking statements.
These forward-looking statements or forecasts involve known and unknown risks, uncertainties and other factors that may cause
AngloGold Ashanti’s actual results, performance, actions or achievements to differ materially from the anticipated results,
performance, actions or achievements expressed or implied in these forward-looking statements. Although AngloGold Ashanti
believes that the expectations reflected in such forward-looking statements and forecasts are reasonable, no assurance can be
given that such expectations will prove to have been correct. Accordingly, results, performance, actions or achievements could
differ materially from those set out in the forward-looking statements as a result of, among other factors, changes in economic,
social, political and market conditions, including related to inflation or international conflicts, the success of business and
operating initiatives, changes in the regulatory environment and other government actions, including environmental approvals,
fluctuations in gold prices and exchange rates, the outcome of pending or future litigation proceedings, any supply chain
disruptions, any public health crises, pandemics or epidemics (including the COVID-19 pandemic), the failure to maintain
effective internal control over financial reporting or effective disclosure controls and procedures, the inability to remediate one or
more material weaknesses, or the discovery of additional material weaknesses, in the Company’s internal control over financial
reporting, and other business and operational risks and challenges and other factors, including mining accidents. For a
discussion of such risk factors, refer to “Item 3D: Risk Factors” and elsewhere in this annual report on Form 20-F. These factors
are not necessarily all of the important factors that could cause AngloGold Ashanti’s actual results, performance, actions or
achievements to differ materially from those expressed in any forward-looking statements. Other unknown or unpredictable
factors could also have material adverse effects on AngloGold Ashanti’s future results, performance, actions or achievements.
Consequently, readers are cautioned not to place undue reliance on forward-looking statements.
AngloGold Ashanti undertakes no obligation to update publicly or release any revisions to these forward-looking statements to
reflect events or circumstances after the date of this annual report on Form 20-F or to reflect the occurrence of unanticipated
events, except to the extent required by applicable law. All subsequent written or oral forward-looking statements attributable to
AngloGold Ashanti or any person acting on its behalf are qualified by the cautionary statements herein.
10
GLOSSARY OF SELECTED TERMS
Financial terms
2028 notes: The $750 million aggregate principal amount of 3.375 percent notes due 2028. |
2030 notes: The $700 million aggregate principal amount of 3.750 percent notes due 2030. |
2040 notes: The $300 million aggregate principal amount of 6.50 percent notes due 2040. |
All-in costs: “All-in costs” is a Non-GAAP measure comprising “all-in sustaining costs” including additional costs which reflect the varying costs of producing gold over the life-cycle of a mine including costs incurred at new operations and costs related to growth projects at existing operations, which are expected to increase production. “All-in costs per ounce” ($/oz) is arrived at by dividing the US dollar value of this cost metric by the ounces of gold sold. |
All-in sustaining costs (AISC): “All-in sustaining costs” is a Non-GAAP measure which is an extension of the existing “total cash costs” metric and incorporates all costs related to sustaining production and in particular, recognises sustaining capital expenditures associated with developing and maintaining gold mines. In addition, this metric includes the cost associated with Corporate Office structures that support these operations, the community and environmental rehabilitation costs attendant with responsible mining and any exploration and evaluation cost associated with sustaining current operations. “All-in sustaining costs per ounce” ($/oz) is arrived at by dividing the US dollar value of this cost metric by the ounces of gold sold. |
Attributable basis: The Group’s share of gold ounces, gold income, capital expenditure and other items, based on its ownership interest. |
Average gold price received per ounce ($/oz): “Average gold price received per ounce” is a Non-GAAP measure which gives an indication of revenue earned per ounce of gold sold and includes gold income and realised non-hedge derivatives in its calculation and serves as a benchmark of performance against the market spot gold price. This metric is calculated by dividing attributable gold income (price received) by attributable ounces of gold sold. |
Average number of employees: The monthly average number of production and non-production employees and contractors employed during the year, where contractors are defined as individuals who have entered into a fixed-term contract of employment with a group company or subsidiary. Employee numbers of joint ventures represent the Group’s attributable share. |
Capital or total capital (expenditure): Total capital expenditure on tangible assets. |
Effective tax rate: Current and deferred taxation charge for the year as a percentage of profit before taxation. |
Free cash flow: “Free cash flow” is a Non-GAAP measure and, as calculated and reported by AngloGold Ashanti, includes cash inflow from operating activities, less cash outflow from investing activities and after finance costs, adjusted to exclude once-off acquisitions, disposals and corporate restructuring costs, and movements in restricted cash. |
Market spot gold price: The price of gold traded at any given moment on the Over-The-Counter (OTC) wholesale market of which the transaction will be settled in two business days’ time. |
Non-sustaining capital (expenditure): “Non-sustaining capital (expenditure)” is a Non-GAAP measure comprising capital expenditure incurred at new operations and capital expenditure related to ‘major projects’ at existing operations where these projects will materially increase production. |
Ounces of gold produced: The attributable number of gold ounces produced by the Group. |
Ounces of gold sold: The attributable number of gold ounces sold by the Group. |
Price received per ounce ($/oz): The attributable gold income including realised non-hedge derivatives divided by attributable ounces of gold sold. |
Rated bonds: The 2028 notes, the 2030 notes and the 2040 notes. |
Region: Defines the operational management divisions within AngloGold Ashanti, namely Africa (DRC, Ghana, Guinea and Tanzania), Australia and the Americas (Argentina and Brazil and projects in the United States and Colombia). |
Related party: Parties are considered related if one party has the ability to control the other party or exercise significant influence over the other party in making financial and operating decisions or if such parties are under common control. |
Significant influence: The ability, directly or indirectly, to participate in, but not exercise control over, the financial and operating policy decision of an entity so as to obtain economic benefit from its activities. |
11
Sustaining capital (expenditure): “Sustaining capital (expenditure)” is a Non-GAAP measure comprising capital expenditure incurred to sustain and maintain existing assets at their current productive capacity in order to achieve constant planned levels of productive output and capital expenditure to extend useful lives of existing production assets. This includes replacement of vehicles, plant and machinery, Mineral Reserve development, deferred stripping and capital expenditure related to financial benefit initiatives, safety, health and the environment. |
Total cash costs: “Total cash costs” is a Non-GAAP measure and, as calculated and reported by AngloGold Ashanti, include costs for all mining, processing, onsite administration costs, royalties and production taxes, as well as contributions from by- products, but exclude amortisation of tangible, intangible and right of use assets, rehabilitation costs and other non-cash costs, retrenchment costs, corporate administration, marketing and related costs, capital costs and exploration costs. “Total cash costs per ounce” ($/oz) is calculated by dividing attributable total cash costs by attributable ounces of gold produced. |
Weighted average number of ordinary shares: The number of ordinary shares in issue at the beginning of the year, increased by shares issued during the year, weighted on a time basis for the period during which they have participated in the income of the Group, and increased by share options that are virtually certain to be exercised. |
12
Currencies
$, US$, USD, US dollar or dollar | United States dollar |
ARS or Argentinean peso | Argentinean peso |
A$, AUD or Australian dollar | Australian dollar |
BRL or Brazilian real | Brazilian real |
£, GBP or British pound | British pound |
C$, CAD or Canadian dollar | Canadian dollar |
COP or Colombian peso | Colombian peso |
CDF or Congolese franc | Congolese franc |
€ or Euro | European euro |
GHS, Gh¢, Ghanaian cedi or cedi | Ghanaian cedi |
TZS or Tanzanian shilling | Tanzanian shilling |
ZAR, R, South African rand or rand | South African rand |
13
Mining terms
By-products: Any potentially economic or saleable products that emanate from the core process of producing gold or copper, including silver, molybdenum and sulphuric acid. |
Carbon-in-leach (CIL): Gold is leached from a slurry of ore where cyanide and carbon granules are added to the same agitated tanks. The gold loaded carbon granules are separated from the slurry and treated in an elution circuit to remove the gold. |
Carbon-in-pulp (CIP): Gold is leached conventionally from a slurry of ore with cyanide in agitated tanks. The leached slurry then passes into the CIP circuit where activated carbon granules are mixed with the slurry and gold is adsorbed on to the activated carbon. The gold-loaded carbon is separated from the slurry and treated in an elution circuit to remove the gold. |
Comminution: Comminution is the crushing and grinding of ore to make gold available for physical or chemical separation (see also “Milling”). |
Contained gold or Contained copper: The total gold or copper content (tonnes multiplied by grade) of the material being described. |
Cut-off grade: Cut-off grade is the grade (i.e., the concentration of metal or mineral in rock) that determines the destination of the material during mining. For purposes of establishing “prospects of economic extraction,” the cut-off grade is the grade that distinguishes material deemed to have no economic value (it will not be mined in underground mining or if mined in surface mining, its destination will be the waste dump) from material deemed to have economic value (its ultimate destination during mining will be a processing facility). Other terms used in similar fashion as cut-off grade include net smelter return, pay limit, and break-even stripping ratio. |
Depletion: The decrease in the quantity of ore in a deposit or property resulting from extraction or production. |
Development: The process of accessing an orebody through shafts and/or tunneling in underground mining operations. |
Development stage property: A development stage property is a property that has Mineral Reserve disclosed, but no material extraction. |
Diorite: An igneous rock formed by the solidification of molten material (magma). |
Doré: Impure alloy of gold and silver produced at a mine to be refined to a higher purity. |
Economically viable: Economically viable, when used in the context of Mineral Reserve determination, means that the Qualified Person has determined, using a discounted cash flow analysis, or has otherwise analytically determined, that extraction of the Mineral Reserve is economically viable under reasonable investment and market assumptions. |
Electrowinning: A process of recovering gold from solution by means of electrolytic chemical reaction into a form that can be smelted easily into gold bars. |
Elution: Recovery of the gold from the activated carbon into solution before zinc precipitation or electrowinning. |
Exploration results: Exploration results are data and information generated by mineral exploration programmes (i.e., programmes consisting of sampling, drilling, trenching, analytical testing, assaying, and other similar activities undertaken to locate, investigate, define or delineate a mineral prospect or mineral deposit) that are not part of a disclosure of Mineral Resource or Mineral Reserve. A registrant must not use exploration results alone to derive estimates of tonnage, grade, and production rates, or in an assessment of economic viability. |
Exploration stage property: An exploration stage property is a property that has no Mineral Reserve disclosed. |
Exploration target: An exploration target is a statement or estimate of the exploration potential of a mineral deposit in a defined geological setting where the statement or estimate, quoted as a range of tonnage and a range of grade (or quality), relates to mineralisation for which there has been insufficient exploration to estimate a Mineral Resource. |
Feasibility study: A feasibility study is a comprehensive technical and economic study of the selected development option for a mineral project, which includes detailed assessments of all applicable modifying factors, as defined by this section, together with any other relevant operational factors, and detailed financial analyses that are necessary to demonstrate, at the time of reporting, that extraction is economically viable. The results of the study may serve as the basis for a final decision by a proponent or financial institution to proceed with, or finance, the development of the project. A feasibility study is more comprehensive, and with a higher degree of accuracy, than a pre-feasibility study. It must contain mining, infrastructure, and process designs completed with sufficient rigour to serve as the basis for an investment decision or to support project financing. The confidence level in the results of a feasibility study is higher than the confidence level in the results of a pre-feasibility study. Terms such as full, final, comprehensive, bankable, or definitive feasibility study are equivalent to a feasibility study. |
Flotation: Concentration of gold and gold-hosting minerals into a small mass by various techniques (e.g. collectors, frothers, agitation, air-flow) that collectively enhance the buoyancy of the target minerals, relative to unwanted gangue, for recovery into an over-flowing froth phase. |
14
Gold produced or Gold production: Refined gold in a saleable form derived from the mining process. |
Grade: The quantity of ore contained within a unit weight of mineralised material generally expressed in grams per metric tonne (g/t) or ounce per short tonne for gold bearing material or Percentage copper (%Cu) for copper bearing material. |
Greenschist: A schistose metamorphic rock whose green colour is due to the presence of chlorite, epidote or actinolite. |
Indicated Mineral Resource: An Indicated Mineral Resource is that part of a Mineral Resource for which quantity and grade or quality are estimated on the basis of adequate geological evidence and sampling. The level of geological certainty associated with an Indicated Mineral Resource is sufficient to allow a Qualified Person to apply modifying factors in sufficient detail to support mine planning and evaluation of the economic viability of the deposit. Because an Indicated Mineral Resource has a lower level of confidence than the level of confidence of a Measured Mineral Resource, an Indicated Mineral Resource may only be converted to a Probable Mineral Reserve. |
Inferred Mineral Resource: An Inferred Mineral Resource is that part of a Mineral Resource for which quantity and grade or quality are estimated on the basis of limited geological evidence and sampling. The level of geological uncertainty associated with an Inferred Mineral Resource is too high to apply relevant technical and economic factors likely to influence the prospects of economic extraction in a manner useful for evaluation of economic viability. Because an Inferred Mineral Resource has the lowest level of geological confidence of all Mineral Resource, which prevents the application of the modifying factors in a manner useful for evaluation of economic viability, an Inferred Mineral Resource may not be considered when assessing the economic viability of a mining project, and may not be converted to a Mineral Reserve. |
Initial assessment (also known as concept study, scoping study, conceptual study and preliminary economic assessment): An initial assessment is a preliminary technical and economic study of the economic potential of all or parts of mineralisation to support the disclosure of Mineral Resource. The initial assessment must be prepared by a Qualified Person and must include appropriate assessments of reasonably assumed technical and economic factors, together with any other relevant operational factors, that are necessary to demonstrate at the time of reporting that there are reasonable prospects for economic extraction. An initial assessment is required for disclosure of Mineral Resource but cannot be used as the basis for disclosure of Mineral Reserve. |
Leaching: Dissolution of gold from crushed or milled material, including reclaimed slime, prior to adsorption on to activated carbon or direct zinc precipitation. |
Life-of-mine (LOM): Number of years for which an operation is planning to mine and treat ore, and is taken from the current mine plan. |
Measured Mineral Resource: A Measured Mineral Resource is that part of a Mineral Resource for which quantity and grade or quality are estimated on the basis of conclusive geological evidence and sampling. The level of geological certainty associated with a Measured Mineral Resource is sufficient to allow a Qualified Person to apply modifying factors, as defined in this section, in sufficient detail to support detailed mine planning and final evaluation of the economic viability of the deposit. Because a Measured Mineral Resource has a higher level of confidence than the level of confidence of either an Indicated Mineral Resource or an Inferred Mineral Resource, a Measured Mineral Resource may be converted to a Proven Mineral Reserve or to a Probable Mineral Reserve. |
Metallurgical plant: A processing plant constructed to treat ore and extract gold or copper in the case of Quebradona (and, in some cases, valuable by-products). |
Metallurgical recovery factor (MetRF): A measure of the efficiency in extracting gold, silver or copper from the ore. |
Milling: A process of reducing broken ore to a size at which concentrating or leaching can be undertaken (see also “Comminution”). |
Mine call factor (MCF): The ratio, expressed as a percentage, of the total quantity of recovered and unrecovered mineral product after processing with the amount estimated in the ore based on sampling. The ratio of contained gold delivered to the metallurgical plant divided by the estimated contained gold of ore mined based on sampling. |
Mineralisation: The process or processes by which a mineral or minerals are introduced into rock, resulting in a potentially valuable deposit. |
Mineral deposit: A mineral deposit is a concentration (or occurrence) of material of possible economic interest in or on the earth’s crust. |
Mineral Reserve: A Mineral Reserve is an estimate of tonnage and grade or quality of Indicated and Measured Mineral Resource that, in the opinion of the Qualified Person, can be the basis of an economically viable project. More specifically, it is the economically mineable part of a Measured or Indicated Mineral Resource, which includes diluting materials and allowances for losses that may occur when the material is mined or extracted. Mineral Reserve is subdivided in order of increasing confidence into Probable Mineral Reserve and Proven Mineral Reserve. Mineral Reserve is aggregated from the Proven and Probable Mineral Reserve categories. A Measured Mineral Resource may be converted to either a Proven Mineral Reserve or a Probable Mineral Reserve depending on uncertainties associated with modifying factors that are taken into account in the conversion from Mineral Resource to Mineral Reserve. The Mineral Reserve tonnages and grades are estimated and reported as delivered to plant (i.e., the point where material is delivered to the processing facility). |
15
Mineral Resource: A Mineral Resource is a concentration or occurrence of material of economic interest in or on the Earth's crust in such form, grade or quality, and quantity that there are reasonable prospects for economic extraction. A Mineral Resource is a reasonable estimate of mineralisation, taking into account relevant factors such as cut-off grade, likely mining dimensions, location or continuity, that, with the assumed and justifiable technical and economic conditions, is likely to, in whole or in part, become economically extractable. It is not merely an inventory of all mineralisation drilled or sampled. Mineral Resource is subdivided and must be so reported, in order of increasing confidence in respect of geoscientific evidence, into Inferred, Indicated or Measured categories. The Mineral Resource tonnages and grades are reported in situ and stockpiled material is reported as broken material. |
Mining recovery factor (MRF): This factor reflects a mining efficiency factor relating to the recovery of material during the mining process and is the variance between the tonnes called for in the mining design and what the plant receives. It is expressed in both a grade and tonnage number. |
Modifying Factors: Modifying factors are the factors that a Qualified Person must apply to Indicated and Measured Mineral Resource and then evaluate in order to establish the economic viability of Mineral Reserve. A Qualified Person must apply and evaluate modifying factors to convert Measured and Indicated Mineral Resource to Proven and Probable Mineral Reserve. These factors include, but are not restricted to: mining; processing; metallurgical; infrastructure; economic; marketing; legal; environmental compliance; plans, negotiations, or agreements with local individuals or groups; and governmental factors. The number, type and specific characteristics of the modifying factors applied will necessarily be a function of and depend upon the mineral, mine, property, or project. |
Open pit mining: An excavation made at the surface of the ground for the purpose of extracting minerals, inorganic and organic, from their natural deposits, which excavation is open to the surface. |
Ounce (oz) (troy): Used in imperial statistics. A kilogram is equal to 32.1507 ounces. A troy ounce is equal to 31.1035 grams. |
Pay limit: The grade of a unit of ore at which the revenue from the recovered mineral content of the ore is equal to the sum of total cash costs, closure costs, Mineral Reserve development and stay-in-business capital. This grade is expressed as an in- situ value in grams per tonne or ounces per short ton (before dilution and mineral losses). |
Precipitate: The solid product formed when a change in solution chemical conditions results in conversion of some pre- dissolved ions into solid state. |
Preliminary feasibility study (pre-feasibility study): is a comprehensive study of a range of options for the technical and economic viability of a mineral project that has advanced to a stage where a Qualified Person has determined (in the case of underground mining) a preferred mining method, or (in the case of surface mining) a pit configuration, and in all cases has determined an effective method of mineral processing and an effective plan to sell the product. A pre-feasibility study includes a financial analysis based on reasonable assumptions, based on appropriate testing, about the modifying factors and the evaluation of any other relevant factors that are sufficient for a Qualified Person to determine if all or part of the Indicated and Measured Mineral Resource may be converted to Mineral Reserve at the time of reporting. The financial analysis must have the level of detail necessary to demonstrate, at the time of reporting, that extraction is economically viable. A pre-feasibility study is less comprehensive and results in a lower confidence level than a feasibility study. A pre-feasibility study is more comprehensive and results in a higher confidence level than an initial assessment. |
Probable Mineral Reserve: A Probable Mineral Reserve is the economically mineable part of an Indicated and, in some cases, a Measured Mineral Resource. |
Production stage property: A production stage property is a property with material extraction of Mineral Reserve. |
Productivity: An expression of labour productivity based on the ratio of ounces of gold produced per month to the total number of employees in mining operations. |
Proven Mineral Reserve: A Proven Mineral Reserve is the economically mineable part of a Measured Mineral Resource and can only result from conversion of a Measured Mineral Resource. |
Qualified Person: A Qualified Person, in respect of the Company's material properties, is an individual who is (1) a mineral industry professional with at least five years of relevant experience in the type of mineralisation and type of deposit under consideration and in the specific type of activity that person is undertaking on behalf of the registrant; and (2) an eligible member or licensee in good standing of a recognised professional organisation at the time the technical report is prepared. Regulation S-K 1300 details further recognised professional organisations and also relevant experience. |
Quartz: A hard mineral consisting of silica dioxide found widely in all rocks. |
Recovered grade: The recovered mineral content per unit of ore treated. |
Reef: A gold-bearing horizon, sometimes a conglomerate band, that may contain economic levels of gold. Reef can also be any significant or thick gold bearing quartz vein. |
Refining: The final purification process of a metal or mineral. |
Regulation S-K 1300: Subpart 1300 of Regulation S-K (17 CFR § 229.1300) which contains the SEC’s mining property disclosure requirements for mining registrants. |
16
Rehabilitation: The process of reclaiming land disturbed by mining to allow an appropriate post-mining use. Rehabilitation standards are defined by country-specific laws, including but not limited to the US Bureau of Land Management, the US Forest Service, and the relevant Australian mining authorities, and address among other issues, ground and surface water, topsoil, final slope gradient, waste handling and re-vegetation issues. |
Resource modification factor (RMF): This factor is applied when there is an historic reconciliation discrepancy in the Mineral Resource model (e.g. between the Mineral Resource model tonnage and the grade control model tonnage). It is expressed in both a grade and tonnage number. |
Scats: Within the metallurgical plants, scats is a term used to describe ejected ore or other uncrushable / grinding media arising from the milling process. This, typically oversize material (ore), is ejected from the mill and stockpiled or re-crushed via a scats retreatment circuit. Retreatment of scats is aimed at fracturing the material such that it can be returned to the mills and processed as with the other ores to recover the gold locked up within this oversize material. |
Seismic event: A sudden inelastic deformation within a given volume of rock that radiates detectable seismic energy. |
Shaft: A vertical or subvertical excavation used for accessing an underground mine; for transporting personnel, equipment and supplies; for hoisting ore and waste; for ventilation and utilities; and/or as an auxiliary exit. |
Smelting: A pyro-metallurgical operation in which gold precipitate from electro-winning or zinc precipitation is further separated from impurities. |
Stoping: The process of excavating ore underground. |
Stripping ratio: The ratio of waste tonnes to ore tonnes mined calculated as total tonnes mined less ore tonnes mined divided by ore tonnes mined. |
Tailings: Finely ground rock of low residual value from which valuable minerals have been extracted. |
Tonnage: Quantity of material measured in tonnes. |
Tonne: Used in metric statistics. Equal to 1,000 kilograms. |
Total recordable injury frequency rate (TRIFR): The total number of recordable injuries and fatalities that occurs per million hours worked. |
Underground mining: The extraction of rocks, minerals and industrial materials, other than coal, oil and gas, from the earth by developing entries or shafts from the surface to the seam or deposit before recovering the product by underground extraction methods. |
Waste: Material that contains insufficient mineralisation for consideration for future treatment and, as such, is discarded. |
Yield: The amount of valuable mineral or metal recovered from each unit mass of ore expressed as grams per metric tonne. |
Zinc precipitation: Zinc precipitation is the chemical reaction using zinc dust that converts gold in solution to a solid form for smelting into unrefined gold bars. |
17
Abbreviations
° | Degree |
% | Percentage |
%Cu | Percentage copper |
$ | United States dollar |
$/oz | United States dollar per ounce |
$/lb | United States dollar per pound |
3D | Three-dimensional space |
A2X | A2X Markets |
AAIL | AngloGold Ashanti (Iduapriem) Limited |
AARL | Anglo American Research Laboratories |
AC | Aircore drilling |
ACU | Australian Credit Unit |
ADR | American Depositary Receipt |
ADS | American Depositary Share |
AFIP | Argentinean Tax Authority |
Ag | Silver |
AGA | AngloGold Ashanti plc |
AGA Mineração | AngloGold Ashanti Córrego do Sítio Mineração |
AGAC | AngloGold Ashanti Colombia S.A.S. |
AGAG | AngloGold Ashanti (Ghana) Limited |
AGAH | AngloGold Ashanti Holdings plc |
AGANA | AngloGold Ashanti North America Inc. |
AGM | Annual General Meeting |
AISC | All-in sustaining costs |
ANLA | Colombian National Environmental Licencing Authority |
ANM | Brazilian National Mining Agency or Colombian Mining Authority (as applicable) |
ASX | Australian Securities Exchange |
Au | Gold |
AusIMM | The Australasian Institute of Mining and Metallurgy |
B-BBEE | Broad-Based Black Economic Empowerment |
B2Gold | B2Gold Corp. |
Barrick | Barrick Gold Corporation |
BBSY | Bank Bill Swap Bid Rate |
BEE | Black Economic Empowerment |
BEng | Bachelor of Engineering |
BIF | Banded iron formation |
BIOX | Bacterial oxidation |
BLM | United States Federal Bureau of Land Management |
BMRR | State of Nevada Division of Environmental Protection’s Bureau of Mining Regulation and Reclamation |
bn | Billion |
B2Gold | B2Gold Corp. |
Board | Company’s board of directors |
BSc | Bachelor of Science |
BSc Eng | Bachelor of Science in Engineering |
BSc Hons | Bachelor of Science Honours |
CCD | Counter Current Decant system in thickeners |
CDI | Chess Depositary Interests |
CdS | Córrego do Sítio |
CEO | Chief Executive Officer |
CFO | Chief Financial Officer |
CGU | Cash Generating Unit |
CHESS | Clearing House Electronic Settlement System |
CIL | Carbon-in-leach |
CIP | Carbon-in-pulp |
Coeur Sterling | Coeur Sterling, Inc. |
CompCo | AngloGold Ashanti plc Compensation and Human Resources Committee |
Corvus Gold | Corvus Gold Inc. |
18
COSO | Committee of Sponsoring Organisations of the Treadway Commission |
CPI | Consumer Prices index |
CSD | Central Securities Depository |
CTC | Contributed tax capital |
Cu | Copper |
CVSA | Cerro Vanguardia S.A. |
Cyanisorb | Cyanide Recovery Plant |
DCE | Declaração de Condição de Estabilidade |
DCO | Declaração de Conformidade e Operacionalidade |
DCP | Disclosure controls and procedures |
DD | Diamond drilling |
DEI | Declaration of Environmental Impact |
D&I | Diversity and Inclusion |
DIAN | Colombian Tax Office |
DMRE | South African Department of Mineral Resources and Energy |
Dodd-Frank Act | United States Dodd-Frank Wall Street Reform and Consumer Protection Act of 2010, as amended |
DRC | Democratic Republic of the Congo |
DSP | Deferred Share Plan |
DTC | The Depository Trust Company |
ECSA | The Engineering Council of South Africa |
EHS | Environmental, health and safety |
EIA | Environmental Impact Assessment |
EPS | Enhanced Production Scheduler |
ERP | Enterprise resource planning |
ESG | Environmental, social and governance |
EU | European Union |
EU GDPR | General Data Protection Regulation (Regulation (EU) 2016/679) |
EVP/COO | Executive Vice President/Chief Operating Officer |
Exchange Act | United States Securities Exchange Act of 1934, as amended |
ExCom | Executive Committee |
EY | Ernst & Young Inc. |
E4V | Exploring for value |
FAusIMM | Fellow of the Australasian Institute of Mining and Metallurgy |
FCA | UK Financial Conduct Authority |
FMA | Argentinean Federal Mining Agreement |
FMSHRC | United States Federal Mine Safety and Health Review Commission |
Fomicruz SE | Fomento Minero de Santa Cruz Sociedad del Estado |
FP | Full Asset Potential Programme |
FPI | Foreign Private Issuer |
FS | Feasibility Study |
FTSE | Financial Times Stock Exchange |
FVTOCI | Fair value through other comprehensive income |
FVTPL | Fair value through profit or loss |
G or g | Grams |
g/t | Grams per metric tonne |
GCL | Gramalote Colombia Limited |
GDPR | EU General Data Protection Regulation |
GFW | Galinheiro Footwall |
GGB | Geita Greenstone Belt |
GGM | Geita Gold Mine |
GGML | Geita Gold Mine Limited |
Ghana EPA | Ghana Environmental Protection Agency |
GhDS | Ghanaian Depositary Share |
GHG | Greenhouse gas |
GSE | Ghana Stock Exchange |
GISTM | Global Industry Standard on Tailings Management |
GJ | Gigajoule |
GMM Act | Ghanaian Minerals and Mining Act, 2006 (Act 703), as amended |
19
Gold Fields | Gold Fields Limited |
GRA | Ghana Revenue Authority |
GRI | Global Reporting Initiative |
GRIDCo | Ghana Grid Company Limited |
GSSA | Geological Society of South Africa |
H2O-CO2 | Water-carbon dioxide |
HDSA | Historically disadvantaged South Africans |
HME | Heavy mobile equipment |
HMRC | His Majesty’s Revenue and Customs |
IASB | International Accounting Standards Board |
ICE | Intercontinental Exchange |
ICFR | Internal control over financial reporting |
ICMM | International Council on Mining & Metals |
ID&E | Inclusion, Diversity and Equity |
IFRS | International Financial Reporting Standards as issued by the IASB |
IIRC | International Integrated Reporting Council |
IMF | International Monetary Fund |
Iron Quadrangle | Quadrilátero Ferrífero |
IRS | United States Internal Revenue Services |
iSIMS | Integrated Sustainability Information Management System |
IT | Information technology |
ITGC | Information Technology General Controls |
JORC | Australasian Code for Reporting Exploration Results, Mineral Resources and Ore Reserves |
JSE | JSE Limited (Johannesburg Stock Exchange) |
JV | Joint venture |
KCD | Karagba, Chauffeur and Durba |
King IV | The King Report on Corporate Governance for South Africa, 2016 |
Kg or kg | Kilograms |
Km or km | Kilometres |
Km2 | Square kilometres |
Koz | Thousand ounces |
ktpa | Kilometric tonnes per annum |
kV | Kilovolt |
LBMA | London Bullion Market Association |
LHOS | Long Hole Open Stoping |
LIBOR | London Interbank Offer Rate |
LOM | Life-of-mine |
LOS | Longitudinal Open Stoping |
LRS | Longitudinal Retreat Stoping |
LUC | Localised Uniform Conditioning |
M or m | Metre or million, depending on the context |
m3 | Cubic metre |
m3/s | Cubic metre per second |
MAusIMM | Member of the Australasian Institute of Mining and Metallurgy |
MBC | Mining and Building Contractors Limited |
MCF | Mine call factor |
MCQ | Minera de Cobre Quebradona S.A.S. B.I.C. |
MEM | Tanzanian Ministry of Minerals |
MGSSA | Member of the Geological Society of South Africa |
MetRF | Metallurgical recovery factor |
Mine Act | United States Federal Mine Safety and Health Act of 1977, as amended |
Mlb | Million pounds |
MME | Brazilian Ministry of Mines and Energy |
Mo | Molybdenum |
MoI | Memorandum of Incorporation |
Moto | Moto Goldmines Limited |
Moz | Million ounces |
MPhil | Master of Philosophy |
20
MPRDA | South African Mineral and Petroleum Resources Development Act, No. 28 of 2002, as amended |
MPRDAA | South African Mineral and Petroleum Resources Development Amendment Act, No. 49 of 2008, as amended |
MPTRO | South African Mineral and Petroleum Titles Registration Office |
MRF | Mining recovery factor |
mRL | Metres relative level |
MSc | Master of Science |
MSG | Mineração Serra Grande Sociedade Anônima |
MSHA | United States Department of Labor's Mine Safety and Health Administration |
MSO | Datamine Mineable Shape Optimiser |
MSR | Minimum Shareholding Requirement |
Mt | Million tonnes |
Mtpa | Million tonnes per annum |
MW | Megawatt |
NCROE | Normalised Cash Return on Equity |
NED | Non-Executive Director |
NEMA | South African National Environmental Management Act, No. 107 of 1998, as amended |
NGER | Australian National Greenhouse and Energy Reporting |
NGO | Non-governmental organisation |
NHIL | Ghanaian National Health Insurance Levy |
NIHL | Noise-induced hearing loss |
NSR | Net Smelter Return |
Northern Star Resources | Northern Star Resources Limited |
NYSE | New York Stock Exchange |
OLD | Occupational lung diseases |
OTC | Over-The-Counter |
Oz or oz | Ounces |
oz/t | Ounces per tonne |
PASEA | PTP (AGAG) Smoke Effect Association |
PCAOB | United States Public Company Accounting Oversight Board |
PFIC | Passive foreign investment company |
PMMC | Precious Minerals Marketing Company Ltd |
POPIA | South African Protection of Personal Information Act, No. 4 of 2013, as amended |
POX | Pressure oxidation |
Pr.Sci.Nat | Professional Natural Scientist of the South African Council for Natural Scientific Professions |
PSP | Performance Share Plan |
PTP | Pompora Treatment Plant |
PwC | PricewaterhouseCoopers Inc. |
QA/QC | Quality Assurance/Quality Control |
QKNA | Quantitative Kriging Neighbourhood Analysis |
Randgold | Randgold Resources Limited |
RC | Reverse circulation |
RCubed | Resource and Reserve Reporting System |
Remco | AngloGold Ashanti Limited Remuneration and Human Resources Committee |
RenGold | Renaissance Exploration Inc. |
RM SME | Registered Member of the Society for Mining, Metallurgy and Exploration |
RMF | Resource modification factor |
ROM | Run of mine |
RRLT | Mineral Resource and Mineral Reserve Leadership Team |
RRSC | Mineral Resource and Mineral Reserve Steering Committee |
S | Sulphur |
SA Companies Act | South African Companies Act, No. 71 of 2008, as amended |
SACNASP | South African Council for Natural Scientific Professions |
SAG | Société AngloGold Ashanti de Guinée S.A. |
SAG mills | Semi-Autogenous Grinding mills |
SA Income Tax Act | South African Income Tax Act, No. 58 of 1962, as amended |
SAMREC | South African Code for the Reporting of Exploration Results, Mineral Resources and Mineral Reserves 2016 edition |
SARB | South African Reserve Bank |
SARS | South African Revenue Service |
21
SASB | Sustainability Accounting Standards Board |
SBB | South Brasilia Belt |
SCB | Standard Chartered Bank Ghana PLC |
SDG | Sustainable development goals |
SDRT | Stamp Duty Reserve Tax |
SEC | United States Securities and Exchange Commission |
Securities Act | United States Securities Act of 1933, as amended |
SES | Social, ethics and sustainability |
SME | Society for Mining, Metallurgy and Exploration |
SMS | Short messaging system |
SMU | Selective mining unit |
SOFR | Secured Overnight Financing Rate |
SOKIMO | Société Minière de Kilo-Moto S.A. |
SOX | United States Sarbanes-Oxley Act of 2002, as amended |
STT | Securities transfer tax |
SW | Southwest |
SWNVF | Southwestern Nevada volcanic field |
T or t | Tonnes |
TANESCO | Tanzania Electric Supply Company Limited |
TCFD | Task Force on Climate-related Financial Disclosures |
TOS | Transverse Open Stoping |
Tpa or tpa | Tonnes per annum |
Tpd or tpd | Tonnes per day |
TRA | Tanzania Revenue Authority |
TRIFR | Total recordable injury frequency rate |
TSF | Tailings storage facility |
TSR | Total Shareholder Return |
UC | Uniform Conditioning |
UHDF | Underhand drift and fill (mining method) |
UK | United Kingdom |
UK Companies Act | UK Companies Act 2006, as amended |
UK GDPR | EU GDPR as implemented in the law of England and Wales by the European Union (Withdrawal) Act 2018, as amended |
UNCITRAL | United Nations Commission on International Trade Law |
UNECA | United Nations Economic Commission for Africa |
UNGC | United Nations Global Compact |
UNGP | United Nations Guiding Principles for Business and Human Rights |
UNSDGs | United Nations Sustainable Development Goals |
US/U.S./USA/United States | United States of America |
UTM | Universal Transverse Mercator |
VAT | Value added tax |
VPSHR | Voluntary Principles on Security and Human Rights |
WGC | World Gold Council |
XBRL | eXtensible Business Reporting Language (including in-line XBRL, i-XBRL) |
Note: Rounding of figures in this annual report on Form 20-F may result in computational discrepancies
22
PART I
ITEM 1: IDENTITY OF DIRECTORS, SENIOR MANAGEMENT AND ADVISORS
Not applicable.
ITEM 2: OFFER STATISTICS AND EXPECTED TIMETABLE
Not applicable.
ITEM 3: KEY INFORMATION
3A.[Reserved]
3B.CAPITALISATION AND INDEBTEDNESS
Not applicable.
3C.REASONS FOR THE OFFER AND USE OF PROCEEDS
Not applicable.
23
3D.RISK FACTORS
This section describes many of the risks that could affect AngloGold Ashanti. There may, however, be additional risks currently
unknown to AngloGold Ashanti as well as other risks, currently believed to be immaterial, that could turn out to be material.
Additional risks may arise or become material subsequent to the date of this document. These risks, either individually or
collectively, could significantly affect the Group’s business, operational and financial results and the price of its securities.
SUMMARY OF RISK FACTORS
1.Risks Related to AngloGold Ashanti’s Industry
•AngloGold Ashanti is increasingly expected to operate in a sustainable manner and to provide benefits and mitigate
adverse impacts to communities affected by its operations. Failure to do so can result in legal suits, additional costs to
address social or environmental impacts of operations, investor disinvestment, and loss of “social licence to operate”, and
could adversely impact AngloGold Ashanti’s reputation and financial condition.
•AngloGold Ashanti is subject to risks related to the development of existing and new mining projects that may adversely
affect its results of operations and profitability.
•AngloGold Ashanti is subject to extensive and rapidly changing environmental, health and safety laws and regulations.
Failure to comply with these requirements could result in enforcement proceedings, claims, suspension of operations,
community protest and/or additional capital or operating expenditures that could adversely impact AngloGold Ashanti’s
financial condition or reputation.
•Compliance with tailings management requirements and standards, and potential liabilities in the event of a failure to
timely comply with these requirements or an incident involving a tailings storage facility, could adversely impact AngloGold
Ashanti’s financial condition, results of operations and reputation.
•AngloGold Ashanti’s ability to replace Mineral Reserve is subject to uncertainty and risks inherent in exploration, technical
and economic pre-feasibility and feasibility studies and other project evaluation activities as well as competition within the
industry for exploration, development and operational projects which meet AngloGold Ashanti’s investment criteria.
•Mining is inherently hazardous and the related risks of events that cause disruptions to AngloGold Ashanti’s mining
operations may adversely impact the environment or the health, safety or security of our workers or the local community,
production, cash flows and overall profitability.
•Mining operations and projects are vulnerable to supply chain disruptions such that operations and development projects
could be adversely affected by shortages of, as well as extended lead times to deliver, strategic spares, critical
consumables, mining equipment or metallurgical plant.
•AngloGold Ashanti’s operations are vulnerable to infrastructure constraints.
•AngloGold Ashanti faces strong competition and industry consolidation.
2.Risks Related to AngloGold Ashanti’s Operations and Business
•AngloGold Ashanti’s mineral deposits, Mineral Reserve and mining operations are located in countries where political, tax
and economic laws and policies may change rapidly and unpredictably and such changes and policies may adversely
affect both the terms of its mining concessions, as well as its ability to conduct operations in certain countries.
•The prevalence of occupational health diseases and other diseases and the potential costs and liabilities related thereto
may have an adverse effect on the business and results of operations of AngloGold Ashanti.
•AngloGold Ashanti’s inability to retain its senior management may have an adverse effect on its business.
•AngloGold Ashanti competes with mining and other companies for key human resources with critical skills and its inability
to retain key personnel could have an adverse effect on its business.
•Increased labour costs could have a material adverse effect on AngloGold Ashanti’s results of operations and financial
condition.
•The use of contractors at certain of the Company’s operations may expose AngloGold Ashanti to delays or suspensions in
mining activities and increased mining costs.
•AngloGold Ashanti’s Mineral Reserve, deposits and mining operations are located in countries that face instability, public
health and security risks that may adversely affect both the terms of its mining concessions, as well as its ability to
conduct operations in certain countries.
•Labour unrest, activism and disruptions (including protracted stoppages) could have a material adverse effect on
AngloGold Ashanti’s results of operations and financial condition.
•Artisanal and illegal mining occurs on AngloGold Ashanti’s properties, which can disrupt the Company’s business, have
adverse environmental, health, safety and security impacts, and expose the Company to liability.
•AngloGold Ashanti’s mining rights in the countries in which it operates could be altered, suspended or cancelled for a
variety of reasons, including breaches in its obligations in respect of such mining rights.
•Title to AngloGold Ashanti’s properties may be uncertain and subject to challenge.
24
3.Risks Related to AngloGold Ashanti’s Corporate and Financing Structure and Strategy
•AngloGold Ashanti expects to have significant financing requirements.
•Sales of large quantities of AngloGold Ashanti’s ordinary shares, or the perception that these sales may occur or other
dilution of the Company’s equity, could adversely affect the prevailing market price of the Company’s securities.
•AngloGold Ashanti may not pay dividends or make similar payments to shareholders in the future.
•Certain factors may affect AngloGold Ashanti’s ability to support the carrying amount of its property, plant and equipment,
intangible assets and goodwill on the balance sheet. If the carrying amount of its assets is not recoverable, AngloGold
Ashanti may be required to recognise an impairment charge, which could be significant.
•AngloGold Ashanti does not have full management control over some of its significant joint ventures and other projects. If
the operators of these joint ventures or projects do not manage these effectively and efficiently, the Company’s
investment in these joint ventures or projects could be adversely affected and its reputation could be harmed.
•Any downgrade of credit ratings assigned to AngloGold Ashanti’s debt securities could increase future interest costs and
adversely affect the availability of new financing.
•The level of AngloGold Ashanti’s indebtedness could adversely impact its business.
•Any acquisition or acquisitions that AngloGold Ashanti may complete may expose the Company to new geographic,
political, legal, social, operating, financial and geological risks.
•The occurrence of events for which AngloGold Ashanti is not insured or for which its insurance is inadequate may
adversely affect cash flows and overall profitability.
4.Market Risks
•The price of gold, AngloGold Ashanti’s principal product, and other commodity market price fluctuations could adversely
affect the profitability of operations.
•Foreign exchange fluctuations could have a material adverse effect on AngloGold Ashanti’s results of operations and
financial condition.
•The profitability of mining companies’ operations and the cash flows generated by these operations are significantly
affected by fluctuations in input production prices, many of which are linked to the prices of oil and steel.
•Fluctuations in the exchange rate of currencies may reduce the market value of AngloGold Ashanti’s securities, as well as
the market value of any dividends or distributions paid by the Company.
•Global political and economic conditions could adversely affect the profitability of operations.
•Energy cost increases and power fluctuations and stoppages could adversely impact AngloGold Ashanti’s results of
operations and financial condition.
•Inflation may have a material adverse effect on results of operations.
5.Other Regulatory and Legal Risks
•Failure to comply with laws, regulations, standards and contractual obligations, breaches in governance processes or
fraud, bribery and corruption may lead to regulatory penalties, loss of licences or permits, negative effects on AngloGold
Ashanti’s reported financial results, and adversely affect its reputation.
•AngloGold Ashanti is subject to the risk of litigation, the causes and costs of which are uncertain.
•Compliance with “conflict minerals” and “responsible gold” legislation and standards could result in significant costs.
•AngloGold Ashanti’s operations are subject to various climate change-related physical risks which may adversely impact
its production activities, mine sites and personnel and/or result in resource shortages or environmental damages.
•Compliance with emerging climate change-related requirements, including stricter regulations and the potential imposition
of carbon taxes or greenhouse gas (“GHG”) emissions cap-and-trade schemes or the elimination of related subsidies,
could result in significant additional costs and expose AngloGold Ashanti to additional liabilities.
•Increasing scrutiny and changing expectations from AngloGold Ashanti’s stakeholders, including communities,
governments and NGOs as well as investors, lenders and other market participants, with respect to AngloGold Ashanti’s
Environmental, Social and Governance (“ESG”) performance and policies may impact AngloGold Ashanti’s reputation,
result in additional costs to meet the expectations of stakeholders, hinder access to capital or expose AngloGold Ashanti
to additional risks, including disinvestment and litigation.
•Transfers of AngloGold Ashanti ordinary shares may be subject to stamp duty or SDRT in the United Kingdom, which
would increase the cost of dealing in AngloGold Ashanti ordinary shares.
•AngloGold Ashanti’s inability to maintain effective disclosure controls and procedures and an effective system of internal
control over financial reporting can be expected to negatively impact its ability to accurately and timely report its financial
results and other material disclosures or otherwise cause it to fail to meet its reporting obligations, which could have a
material adverse effect on its operations, investor confidence in its business and the reliability of its financial statements,
and the trading price of AngloGold Ashanti’s ordinary shares.
•Breaches in cybersecurity and violations of data protection laws may adversely impact or disrupt AngloGold Ashanti’s
business.
•U.S. securities laws do not require AngloGold Ashanti to disclose as much information to investors as a U.S. issuer is
required to disclose, and investors may receive less information about the Company than they might otherwise receive
from a comparable U.S. company.
25
Risks Related to AngloGold Ashanti’s Industry
AngloGold Ashanti is increasingly expected to operate in a sustainable manner and to provide benefits and mitigate
adverse impacts to communities affected by its operations. Failure to do so can result in legal suits, additional costs to
address social or environmental impacts of operations, investor disinvestment, and loss of “social licence to operate”,
and could adversely impact AngloGold Ashanti’s reputation and financial condition.
As a result of public concern about the perceived ill effects of economic globalisation and resource extraction activities,
businesses in general and large multinational mining corporations in particular face increasing public scrutiny of their activities.
The cost of measures and other issues relating to the sustainable development and operation of mining projects could place
significant demands on personnel resources, could increase capital and operating costs and could have an adverse impact on
AngloGold Ashanti’s reputation, results of operations and financial condition.
Mining companies are under increasing pressure to demonstrate that, whilst they seek a satisfactory return on investment for
shareholders, other social partners, including employees, host communities and more broadly, the countries in which they
operate, also benefit from their commercial activities. Such pressures tend to be particularly targeted towards companies whose
activities are perceived to have, or have, a high impact on their social and physical environment. Social media and other web-
based tools to share user-generated content further increase the potential scope and force of public scrutiny. Adverse publicity in
cases where companies are perceived as failing to create sufficient social and economic benefit may result in reputational
damage, active community opposition, allegations of human rights abuses, legal suits and investor disinvestment.
Mining projects are often located at or near existing towns and villages, natural waterways and other infrastructure or natural
resources. As the impacts of dust generation, waste storage, water pollution or water shortages may be directly adverse to those
communities, poor environmental management practices, whether actual or perceived, or, in particular, adverse changes in the
supply or quality of water, can result in community protest, regulatory sanctions or ultimately in the withdrawal of, or failure to
obtain, community and government support for company operations. For example, following a 2017 popular consultation in the
Colombian municipality of Cajamarca in the Tolima department, which hosts the Company’s La Colosa exploration site,
AngloGold Ashanti’s management suspended much of the current fieldwork around the project until the related environmental
permits are granted. Similarly, in the Colombian town of Piedras in the Tolima department, which is not located in the immediate
vicinity of the La Colosa exploration site, AngloGold Ashanti also contested a 2013 popular consultation which attempted to ban
all mining activities in the area. Subsequently, the Colombian Constitutional Court has decided that local municipalities or regions
do not have authority to veto mining activities through popular consultations. See “Item 8A: Legal Proceedings—Colombia”. If
AngloGold Ashanti is unsuccessful in securing community support for its projects, or groups opposed to mining successfully
pursue similar or other legal mechanisms to attempt to block exploration or extraction activities, there could be an adverse
impact on AngloGold Ashanti’s reputation, its ability to develop its mining concessions, and its results of operations and financial
condition.
In addition, as AngloGold Ashanti has a long history of mining operations in certain regions, issues may arise regarding historical,
as well as potential future, environmental or health impacts in those areas. For example, certain parties, including non-
governmental organisations (“NGOs”), community groups and institutional investors, could raise concerns and even threaten or
commence litigation relating to air pollution or surface and groundwater quality, among other issues, in the area surrounding the
Company’s mines or exploration sites. See “Item 8A: Legal Proceedings”.
Disputes with surrounding communities may also affect mining operations, particularly where they result in restrictions of access
to supplies and to mining operations. The miners’ access to land may be subject to the rights or asserted rights of various
community stakeholders, including indigenous people. Access to land and land use is of critical importance to the Company for
exploration and mining, as well as for ancillary infrastructure. In some cases, AngloGold Ashanti has had difficulty gaining access
to new land because of perceived poor community compensation practices. For example, compensation remains a significant
area of concern at Siguiri in Guinea and Geita in Tanzania. Delays in projects as well as increased costs attributable to a lack of
community support can translate directly into a decrease in the value of a project or into an inability to bring the project to
production. Where consultation with stakeholders is statutorily or otherwise mandated and relations do not remain amicable,
disputes may lead to reduced access to properties or delays in operations.
AngloGold Ashanti is subject to risks related to the development of existing and new mining projects that may
adversely affect its results of operations and profitability.
Development of AngloGold Ashanti’s existing and new mining projects may be subject to unexpected problems, costs and delays
that could impact the Company’s ability to develop or operate the relevant project as planned. For example, constraints on the
supply of mining and processing equipment, increases in capital and operating costs, or reduced availability of consistent skilled
labour, utilities, transportation and/or appropriate smelting and refining arrangements could result in delays in completing
projects.
26
AngloGold Ashanti may prove unable to successfully operate existing mine sites or to develop potential exploration sites due to,
for example, social and community opposition, litigation and governmental regulatory or administrative proceedings, changes in
applicable regulations or other requirements, the classification of land covered by mining titles as an environmentally-protected
area, ore body grades, the inability of any such project to meet AngloGold Ashanti’s investment hurdle rate, and delays that could
result in the expiry of permits. For example, in January 2024, the Colombian government adopted rules which empower it to
issue specific resolutions declaring environmental protected areas, on a temporary basis, which would result in the restriction,
and possibly prohibition, of mining activities in those areas. Any impact on the Company’s projects in Colombia can only be
determined in light of any specific resolutions declaring environmental protected areas, if issued in the future, including the
geographical coverage and scope of restrictions provided in such resolutions. See “Item 4B: Business Overview—The
Regulatory Environment Enabling AngloGold Ashanti to Mine—Americas—Colombia”. See also “—AngloGold Ashanti is subject
to extensive and rapidly changing environmental, health and safety laws and regulations. Failure to comply with these
requirements could result in enforcement proceedings, claims, suspension of operations, community protest and/or additional
capital or operating expenditures that could adversely impact AngloGold Ashanti’s financial condition or reputation”. The remote
location of many mining properties, delays in obtaining or failure to obtain necessary environmental and other governmental
permits and approvals, the impact of public health crises, epidemics or pandemics (for example the COVID-19 pandemic) as well
as third-party legal challenges to individual mining projects and broader social or political opposition to mining may increase the
cost, timing and complexity of mine development and construction. For example, in December 2019, AngloGold Ashanti applied
for the required environmental authorisations to develop the Quebradona project in Colombia. In November 2021, the National
Environmental Licensing Authority of Colombia (Autoridad Nacional de Licencias Ambientales or “ANLA”) officially notified
AngloGold Ashanti of its decision to ‘archive’ the environmental licence application relating to the Quebradona project. ANLA
neither denied nor granted the licence, but deemed that the information provided by AngloGold Ashanti was not sufficient for this
authority to make a substantive decision, and the archiving decision was confirmed on appeal in April 2022. AngloGold Ashanti is
in the process of preparing a new Environmental Impact Assessment in connection with its environmental licence application for
the project, which is currently expected to be submitted to ANLA in 2027.
Accordingly, AngloGold Ashanti’s future development activities may not result in the expansion or replacement of current
production, or one or more new production sites or facilities may not be developed as planned or may be less profitable than
anticipated or even be loss-making. A failure in the Company’s ability to develop and operate mining projects in accordance with,
or in excess of, expectations could negatively impact its results of operations, as well as its financial condition and prospects.
AngloGold Ashanti is subject to extensive and rapidly changing environmental, health and safety laws and regulations.
Failure to comply with these requirements could result in enforcement proceedings, claims, suspension of operations,
community protest and/or additional capital or operating expenditures that could adversely impact AngloGold Ashanti’s
financial condition or reputation.
AngloGold Ashanti’s operations are subject to extensive and rapidly changing environmental, health and safety laws and
regulations in the various jurisdictions in which it operates. These regulations, as well as international standards for the industry,
establish limits and conditions on the Company’s ability to conduct its operations and govern, among other things, extraction,
use, conservation and discharge of water; air emissions (including dust control and GHGs); mine and dam safety; regulatory and
community reporting; clean-up of contamination; land use and conservation of protected areas; protection of threatened and
endangered species; rehabilitation and closure of mined land; worker health and safety and community health; and the
generation, transportation, storage and disposal of solid and hazardous wastes, such as reagents, radioactive materials and
mine tailings.
The cost of compliance with environmental, health and safety laws and regulations is expected to continue to be significant to
AngloGold Ashanti. From time to time, new or updated laws, regulations and standards are introduced and may be more
stringent than those to which AngloGold Ashanti is currently subject, including with respect to tailings management and TSFs.
See “—Compliance with tailings management requirements and standards, and potential liabilities in the event of a failure to
timely comply with these requirements or an incident involving a tailings storage facility, could adversely impact AngloGold
Ashanti’s financial condition, results of operations and reputation”. Should compliance with these laws, regulations and standards
require a material increase in expenditures or material changes or interruptions to operations or production, including as a result
of any incident or failure to comply with applicable regulations, the Company’s results of operations and financial condition could
be adversely affected. For example, AngloGold Ashanti expects to incur approximately $50 to $60 million in capital expenditure
and operating costs during 2024-2029 in connection with the treatment and disposal of a quantity of legacy arsenic trioxide waste
located at the Obuasi mine. AngloGold Ashanti could also incur fines, penalties and other sanctions, clean-up costs and third-
party claims for personal injury or property damage, suffer reputational damage, or be required to install costly pollution control
equipment or to modify or suspend operations, as a result of actual or alleged violations of environmental, health and safety laws
and regulations or the terms of AngloGold Ashanti’s permits. For example, in 2022, AngloGold Ashanti was informed of two
incidents involving potentially unauthorised cutting of vegetation, one by a subtenant in 2020 and the other by a contractor in
2021, at the La Colosa project near Cajamarca. Cortolima, the regional environmental authority in the Tolima department, has
opened a formal environmental investigation. At this time, there are no actions against the company or individuals regarding the
incident involving the contractor. With respect to the incident involving the subtenant, Cortolima issued a resolution pressing
charges against AGA and, in 2023, AGA opposed the charges in its answer to Cortolima’s resolution. The matter is still pending.
27
In some of the jurisdictions in which AngloGold Ashanti operates, the government may enforce a total or partial shutdown of
facilities, including TSFs, or other aspects of mining operations, to conduct investigations into the cause of safety or
environmental incidents involving those facilities or at those operations. See “—Compliance with tailings management
requirements and standards, and potential liabilities in the event of a failure to timely comply with these requirements or an
incident involving a tailings storage facility, could adversely impact AngloGold Ashanti’s financial condition, results of operations
and reputation.” AngloGold Ashanti’s reputation could be damaged by any significant governmental investigation or enforcement
action for non-compliance with health and safety laws, regulations or standards. Any of these factors could have a material
adverse effect on AngloGold Ashanti’s results of operations and financial condition.
Failure to comply with applicable environmental, health and safety laws and regulations may also result in the suspension or
revocation of operating permits. For example, in Colombia, AngloGold Ashanti’s core mining concession contracts provide that
the Colombian mining authority, having regard to due process, could declare the underlying concession void if the Company
repeatedly or continually breaches applicable environmental laws or regulations or engages in acts of corruption or other serious
misconduct. In the event the concession is voided, AngloGold Ashanti could be required to abandon the relevant project and,
depending on the severity of the violations or misconduct, the Colombian mining authority may cancel its other existing mining
concession contracts. Pending proposals for new mining concession contracts could also be cancelled and the Company could
be banned from doing business with the Colombian government for a period of five years.
AngloGold Ashanti’s ability to obtain and maintain permits and to successfully operate in particular communities may be
adversely impacted by real or perceived effects on the environment or human health and safety associated with AngloGold
Ashanti’s or other mining companies’ activities. For example, in Colombia, various plaintiffs, including certain governmental
authorities and various associations that represent local communities, brought legal proceedings against AngloGold Ashanti in
order to stop exploration, development and mining activities in certain areas in which its exploration projects are located, due to
environmental concerns. For instance, a consolidated class action with respect to the La Colosa project is currently pending
before the Council of State of Colombia (the highest court for administrative matters) with respect to the impact of the project on
the environment. If AngloGold Ashanti does not prevail before the Council of State, it may have to perform one or more technical
studies in relation to the La Colosa project, which if they were to conclude that a “threat” to the environment exists, could result in
the suspension of certain development activities or even the abandonment of the project. See “Item 8A: Legal Proceedings—
Colombia”.
Environmental impacts arising in connection with AngloGold Ashanti’s operations could lead to the imposition of legal obligations,
including the remediation of environmental contamination, claims for property damage and personal injury from adjacent
communities and restrictions on mining operations. For example, temporary gold processing stoppages after environmental
incidents, such as pipeline failures or deficiencies in water management systems, have occurred previously at AngloGold
Ashanti’s operations. Leaks or discharges of hazardous materials could result in liabilities for clean-up or personal injury that may
not be covered by insurance. The Company has identified groundwater contamination plumes at certain of its operations that
have occurred primarily as the result of seepage from surface operations and facilities, including tailings storage facilities and
waste rock piles, or from sulphide or other substances in local rock formations which are exposed to water. In addition, closure of
a mine could trigger or accelerate regulatory or other obligations, including to conduct environmental rehabilitation activities and/
or to address historical impacts on environmental quality in the area surrounding the mine. Costs incurred by AngloGold Ashanti
in excess of its existing provisions for such matters, or on a more accelerated or compressed timeline than currently anticipated,
could have a material adverse impact on AngloGold Ashanti’s results of operations and financial condition.
In addition, the use of hazardous materials in metallurgical processing remains under continued scrutiny. As there are few, if any,
effective substitutes for such materials in the process for extracting gold from the ore, any ban or material restrictions on the use
of such materials in mining operations in the jurisdictions where AngloGold Ashanti conducts its operations could adversely affect
the Company’s results of operations and financial condition.
AngloGold Ashanti’s operations are heavily dependent upon access to substantial volumes of water for use in the mining and
extractive processes and typically are subject to water-use permits or rights to abstract water from certain natural sources that
govern usage and require, among other things, that mining operations maintain certain water quality upon discharge. Water
supply, quality and usage are areas of focus and potential concern across all of AngloGold Ashanti’s operations, including with
respect to the Company’s mining operations in Ghana and Brazil, its mine development projects in Nevada, as well as its mine
development project at Quebradona in Colombia. Any failure by AngloGold Ashanti to secure access to suitable water supplies,
or achieve and maintain compliance with applicable requirements of the permits or rights, could result in curtailment or halting of
production at the affected operations. Incidents of water pollution or shortage can, in certain cases, lead to community protest
and ultimately to the withdrawal of community and government support for AngloGold Ashanti’s operations. A failure by
AngloGold Ashanti to comply with water contamination related directives may result in further, more stringent, directives being
issued against AngloGold Ashanti, which may, in some cases, result in a temporary or partial shutdown of some of the
Company’s operations.
Mining companies are required by law to close their operations at the end of the mine life and rehabilitate the impacted areas.
Estimates of the total ultimate closure, reclamation and rehabilitation costs for gold mining operations are significant and based
principally on life-of-mine profiles, changing inflation and discount rate assumptions, changing infrastructure and facilities design
28
and current legal and regulatory requirements that may change materially. Environmental liabilities are accrued when they
become known, are probable and can be reasonably estimated. Increasingly, regulators are seeking security in the form of cash
collateral or bank guarantees in respect of environmental obligations. See “Item 4B: Business Overview—The Regulatory
Environment Enabling AngloGold Ashanti to Mine”.
AngloGold Ashanti’s provisions for decommissioning and for restoration (excluding joint ventures and discontinued operations)
totaled $625 million in 2023, $578 million in 2022, and $673 million in 2021. Costs associated with rehabilitating land disturbed
by mining processes and addressing environmental, health, safety and community issues are estimated and financial provision
made based upon current available information based on AngloGold Ashanti’s commitments, applicable environmental legislation
or agreements with governments. Estimates notably relate to discount rates, which may vary due to changes in global economic
and political risk conditions and assumptions, each of which is subject to change and certain changes may not be reasonably
foreseen, and mine plans, which may change in line with variations in cash flows, designs of tailings storage facilities and
methodologies used to compute liabilities (including as a result of a request from environmental regulatory authorities). As such,
estimates may be insufficient and further costs may be identified at any stage that may exceed the provisions that AngloGold
Ashanti has made. Any underestimated or unidentified rehabilitation costs would reduce earnings and could materially and
adversely affect AngloGold Ashanti’s asset values, earnings and cash flows. Further, sudden changes in a life-of-mine plan or the
accelerated closure of a mine may give rise to the recognition of additional liabilities that are not anticipated.
Environmental laws, regulations and standards are continually changing and are generally becoming more stringent. Changes to
AngloGold Ashanti’s environmental compliance obligations or operating requirements could adversely affect its operations, rate
of production and revenue. Variations in laws and regulations, assumptions made to estimate liabilities, standards or operating
procedures, more stringent emission or pollution thresholds or controls, or the occurrence of unanticipated conditions, may
require operations to be suspended or permanently closed, and could increase AngloGold Ashanti’s expenses and provisions.
These expenses and provisions could adversely affect AngloGold Ashanti’s results of operations and financial condition.
Compliance with tailings management requirements and standards, and potential liabilities in the event of a failure to
timely comply with these requirements or an incident involving a tailings storage facility, could adversely impact
AngloGold Ashanti’s financial condition, results of operations and reputation.
Mining and mineral processing operations generate waste rock and tailings. The impact of managing related solid and hazardous
materials, including dust and residual chemicals and metals, or a breach, leak, or other failure of a waste rock facility or TSF,
including any associated dam, can be significant. An incident at AngloGold Ashanti’s operations could result, among other things,
in the voluntary or mandatory shutdown of a TSF, enforcement, obligations to remediate environmental contamination, negative
press coverage, and claims for property or natural resources damages and personal injury by adjacent communities. For
example, in March 2022, due to a failure of pump equipment at the Cuiabá mine, there was a spill of tailings slurry that reached
the Cuiabá stream in Sabará. The relevant local, state and federal authorities were notified, as well as the community in the
vicinity of the mine, and corrective actions were taken. Following the incident, the Minas Gerais State Public Prosecutor’s Office
filed a civil action against AngloGold Ashanti alleging environmental and socio-economic damages to the community and
requesting an injunction suspending operations at the mine pending an independent technical audit of the TSF structure.
Settlement of the state’s action required AngloGold Ashanti to engage an independent technical auditor to prepare assessment
reports certifying the stability of certain surface operations and environmental controls and to pay approximately $1.4 million for
socio-environmental projects and environmental education in the municipality of Sabará and to donate land to a federal
organisation for conservation purposes. Incidents at other mining companies’ operations could also result in governmental action
to tighten regulatory requirements and restrict certain mining activities, in particular with respect to TSFs. See “—AngloGold
Ashanti is subject to extensive and rapidly changing environmental, health and safety laws and regulations. Failure to comply
with these requirements could result in enforcement proceedings, claims, suspension of operations, community protest and/or
additional capital or operating expenditures that could adversely impact AngloGold Ashanti’s financial condition or reputation.”
and also “Item 4B: Business Overview—Sustainability and Environmental, Social and Governance (“ESG”) Matters”.
In recent years, environmental licensing processes for mining companies have become more stringent, and especially those
involving TSFs in Brazil. Brazilian authorities, both at the federal and state levels, have generally increased scrutiny of mining
operations in Brazil, and of TSFs in particular, and have adopted strict laws and regulations applicable to the approval, licensing,
construction, management, closure and decharacterisation (or “descaracterização”, which generally means that the structure no
longer serves its primary purpose of acting as a tailings containment) of TSFs in Brazil. It is likely that there will be further
changes in federal and state legislation and regulation, as well as much more intense scrutiny and control of, as well as
increased costs associated with inspecting, maintaining and constructing TSFs. For example, in 2019, the federal Brazilian
National Mining Agency (“ANM”) issued a resolution which, among other things, prohibits the upstream method for the
construction or heightening of tailings dams throughout the national territory of Brazil and requires existing upstream TSFs to be
decharacterised. As a result, the Serra Grande tailings dam in the state of Goiás is currently required to be decharacterised by
15 September 2025. With respect to downstream (or “centerline”) TSFs, a federal law adopted in 2020 requires companies, to
the extent that communities are located in the self-rescue zone of those TSFs, to (i) deactivate and decharacterise the structure,
(ii) relocate the population, with reparations, or (iii) reinforce the stability of the structure. Decharacterisation of those TSFs will be
required at the end of the life of the mine. All of the TSFs operated by AngloGold Ashanti in Brazil have communities located in
self-rescue zones. As of 31 December 2022, AngloGold Ashanti had fully transitioned to dry-stacking operations for tailings
29
storage at each location in Brazil. Total expenditures in 2023 to deactivate and decharacterise existing structures amounted to
approximately $16 million. Total expenditures for work required to comply with TSF-related requirements during the period
2024-2027 are expected to be material but, based on preliminary estimates to date, AngloGold Ashanti anticipates that annual
expenditures during that period will decline over time. See “Item 4B: Business Overview—The Regulatory Environment Enabling
AngloGold Ashanti to Mine—Americas—Brazil” and “Item 4B: Business Overview—Sustainability and Environmental, Social and
Governance (“ESG”) Matters”.
In addition, an ANM resolution that became effective in February 2022 established new criteria for the operational management
of TSF structures, changed the criteria related to the risk classification of TSF structures and emergency levels and set new
criteria for the suspension, embargo (order to stop operations) and interdiction of TSF activities. Operators of TSFs were
mandated to conduct and submit risk assessments to the ANM by December 2022 and are required to update those risk
assessments every two years. Operators are also required to periodically obtain certifications from external consultants of the
geotechnical stability of TSF structures and the adequacy of emergency response plans. As of the date hereof, all of AngloGold
Ashanti’s TSFs in Brazil have received certification by external consultants of on-site emergency response plans (Declaração de
Conformidade e Operacionalidade (“DCO”)) as well as certification by external consultants of geotechnical stability (Declaração
de Condição de Estabilidade (“DCE”)) consistent with the new standards; in addition, the DCO for CdS I is still pending approval
by the ANM. In addition, at the Calcinados TSF, a risk assessment conducted in December 2022 with oversight from external
consultants, as required by Brazilian regulations, concluded that additional buttressing should be completed to align the TSF’s
post liquefaction factor of safety with international standards currently considered best practice. Engineering and geotechnical
work was conducted by external consultants in 2023 to evaluate other potential options for alignment of the Calcinados TSF with
international standards, which concluded in April 2024 that additional buttressing will not be required. Tailings deposition at the
Calcinados TSF, as well as processing of gold concentrate at the Queiroz plant, which services the Cuiabá mine complex
(composed of the Cuiabá and Lamego mines), is suspended until the decharacterisation plan for the Calcinados TSF is updated,
and any related future construction work, if required, is complete and a pending legal proceeding with respect to the related
Cocoruto TSF is resolved.
Additionally, public prosecutors have been pursuing an active role in the enforcement of new state and federal laws and
regulations by way of legal action against several mining companies to compel compliance with these new rules. For example, a
lawsuit against one of the Company’s Brazilian subsidiaries in the state of Goiás in respect of the Serra Grande tailings dam is
currently pending appeal. While particular lawsuits may be settled or resolved in favour of the Company, the outcome of such
lawsuits generally cannot be predicted. If any future lawsuits of a similar nature are resolved adversely to AngloGold Ashanti,
such outcome may result in additional and accelerated operating or capital costs for the Company, including costs exceeding its
current provisions for decharacterising its TSFs in Brazil, which may adversely affect AngloGold Ashanti’s financial condition and
results of operations. See “Item 8A: Legal Proceedings—Brazil”. In addition, it is believed that communities will increasingly seek
engagement and information with respect to the adequacy of the safety measures in place to protect them from TSF-related
incidents.
In addition, a new Global Industry Standard on Tailings Management (“GISTM”) was established in August 2020 by a panel
composed of industry and non-governmental organization (“NGO”) experts. AngloGold Ashanti has committed to conform with
the GISTM at all of its TSFs by August 2025. Failure, or perceived failure, to achieve such commitment, or higher than expected
costs to achieve conformity with the GISTM, could adversely impact AngloGold Ashanti’s financial condition or reputation.
AngloGold Ashanti’s ability to replace Mineral Reserve is subject to uncertainty and risks inherent in exploration,
technical and economic pre-feasibility and feasibility studies and other project evaluation activities as well as
competition within the industry for exploration, development and operational projects which meet AngloGold Ashanti’s
investment criteria.
AngloGold Ashanti must continually replace Mineral Reserve depleted by mining and production to maintain or increase
production levels in the long term. This process includes exploration activities that are speculative in nature. The ability of
AngloGold Ashanti to sustain or increase its present levels of gold production depends in part on the success of its exploration
activities and related projects and it may be unable to sustain or increase such production levels.
Project studies and exploration activities necessary to determine the current or future viability of a mining operation, including the
estimation of tonnages, grades and metallurgical characteristics of the ore, are often unproductive and unpredictable. Such
activities often require substantial expenditure on exploration drilling to establish the presence, extent and grade (metal content)
of mineralised material. Following, and in parallel with, ongoing exploration activities AngloGold Ashanti undertakes project
studies to estimate the technical and economic viability of mining projects and to determine appropriate mining methods and
metallurgical recovery processes. For example, during 2023, AngloGold Ashanti completed a feasibility study at North Bullfrog
and a pre-feasibility study is currently underway at the Expanded Silicon project.
Once mineralisation is discovered, it may take several years to determine whether an adequate Mineral Reserve exists, during
which time the economic viability of the project may change due to fluctuations in factors that affect both revenue and costs,
including:
•prevailing and anticipated prices of metals and other commodities, including gold, silver and copper;
•prevailing and anticipated local or foreign currency exchange rates;
30
•the required return on investment as based on the cost and availability of capital;
•applicable regulatory requirements, including those relating to environmental or health and safety matters;
•recovery rates of gold and other metals from the ore; and
•capital expenditure and cash operating costs (which may be impacted by inflation).
These estimates depend on assumptions available during the particular project phase. Mineral Reserve estimates are not
precise calculations and depend on the interpretation of limited information on the location, shape and continuity of the mineral
occurrence and on available current and historical sampling results. Estimates are appropriate for the level of the study and
further exploration and project studies may result in new data becoming available that may change previous or historical Mineral
Reserve estimates and impact the technical and economic viability of production from the project. Changes in the forecast prices
of commodities, exchange rates, production costs or recovery rates may change the economic status of Mineral Reserve
resulting in revisions to previous or historical Mineral Reserve estimates. These revisions in Mineral Reserve estimates as well
as changes in life-of-mine estimates could also impact depreciation and amortisation rates, asset carrying values and/or
estimates for closure, restoration and environmental rehabilitation costs.
AngloGold Ashanti undertakes annual revisions to its Mineral Reserve estimates based upon ongoing exploration and production
results, depletion, new geological/geotechnical information, model revisions, revised mine planning, and fluctuations in
production, forecasts of commodity prices, economic assumptions and operating and other costs as well as asset sales and
acquisitions. These factors may result in reductions in Mineral Reserve estimates, which could adversely affect life-of-mine plans
and consequently the total value of AngloGold Ashanti’s mining asset base. Mineral Reserve restatements could negatively affect
the Company’s results of operations, as well as its financial condition and prospects.
Due to a declining rate of discovery of new gold Mineral Reserve in recent years, AngloGold Ashanti faces intense competition
for the acquisition of exploration, development and operational projects which meet AngloGold Ashanti’s investment criteria.
From time to time, AngloGold Ashanti evaluates the acquisition of a Mineral Reserve, development properties or operating
mines, either as stand-alone assets or as part of existing companies. For example, AngloGold Ashanti increased its mining
properties in the Beatty district of southern Nevada through its acquisition of Corvus Gold Inc. in January 2022 and Coeur
Sterling, Inc. in November 2022. Furthermore in January 2024, AngloGold Ashanti completed the acquisition of an 11.7% interest
in G2 Goldfields Inc., which owns exploration properties located in Guyana. AngloGold Ashanti’s decision to acquire properties is
based on a variety of factors, including historical operating results, estimates and assumptions regarding the extent of the
existing or potential Mineral Reserve, cash and other operating costs, gold prices, projected economic returns and evaluations of
existing or potential liabilities associated with the relevant property and its operations and how these factors may change in the
future. Other than historical operating results, these factors are uncertain and could have an impact on revenue, cash and other
operating costs, as well as the process used to estimate the relevant Mineral Reserve.
As a result of these uncertainties and declining grades, AngloGold Ashanti’s exploration and acquisitions may not result in the
expansion or replacement of current production, the maintenance of its existing Mineral Reserve net of production or yield an
increase in Mineral Reserve. AngloGold Ashanti’s results of operations and financial condition are directly related to the success
of its exploration and acquisition efforts and the ability to replace or increase the existing Mineral Reserve as it is depleted. If
AngloGold Ashanti is not able to maintain or increase its Mineral Reserve, its results of operations as well as its financial
condition and prospects could be adversely affected.
Mining is inherently hazardous and the related risks of events that cause disruptions to AngloGold Ashanti’s mining
operations may adversely impact the environment or the health, safety or security of our workers or the local
community, production, cash flows and overall profitability.
Gold mining operations are subject to risks of hazards and other events that may adversely impact AngloGold Ashanti’s ability to
produce gold and meet production and cost targets. These hazards and events include, but are not limited to:
•accidents or incidents, including due to human error, during exploration, production, drilling, blasting or transportation
resulting in injury, disease, loss of life or damage to equipment or infrastructure;
•air, land and water pollution;
•social or community disputes or interventions;
•security, environmental or safety incidents, including as the result of the activities of artisanal or illegal miners;
•surface or underground fires or explosions;
•labour force disputes and disruptions;
•loss of information integrity or data;
•mechanical failure or breakdowns and ageing infrastructure;
•failure of unproven or evolving technologies;
•unusual or unexpected geological formations, ground conditions, including lack of mineable face length and ore-pass
blockages;
•fall-of-ground accidents in underground operations;
•cave-ins, sinkholes, subsidence, rock falls, rock bursts or landslides;
•failure of mining pit slopes, heap-leach facilities, water or solution dams, waste stockpiles and tailings facility walls;
•flooding or inundation of mine pits;
31
•safety-related stoppages;
•seismic activity; and
•other natural phenomena, such as floods, droughts or weather conditions, potentially exacerbated by climate change.
For example, at Siguiri, during the second quarter of 2023, there was a carbon-in-leach (“CIL”) tank failure in its processing plant,
which had an adverse impact on gold production and total operating costs at the mine. Furthermore, at Obuasi, during the third
quarter of 2023, some underground mining equipment was lost as a result of a fall-of-ground incident in one of the mine’s high-
grade stopes. The challenges experienced due to poor ground conditions in some of the higher-grade stopes at Obuasi had an
adverse impact on gold production and total operating costs at the mine and led the Company to undertake a trial of the
underhand drift and fill (“UHDF”) mining method in select areas at Obuasi. The UHDF mining method is a more selective mining
method suited to challenging ground conditions often associated with higher grade areas. Any of these or other hazards or
events could, individually or in the aggregate, have a material adverse effect on AngloGold Ashanti’s results of operations and
financial condition.
Mining operations and projects are vulnerable to supply chain disruptions such that operations and development
projects could be adversely affected by shortages of, as well as extended lead times to deliver, strategic spares, critical
consumables, mining equipment or metallurgical plant.
AngloGold Ashanti’s operations and development projects could be adversely affected by both shortages and long lead times to
deliver strategic spares, critical consumables, mining equipment and metallurgical plant, as well as transportation delays. Import
restrictions, such as those imposed by the Argentinean government from 2011 to 2015, can also delay the delivery of parts and
equipment. In the past, AngloGold Ashanti and other gold mining companies experienced shortages in critical consumables,
particularly as production capacity in the global mining industry expanded in response to increased demand for commodities.
AngloGold Ashanti has also experienced increased delivery times for these items. Shortages in essential commodities, including,
for example, ammonium nitrate, have resulted in unanticipated price increases and production delays and shortfalls, resulting in
both increased operating costs and capital expenditure necessary to maintain and develop mining operations.
Individually, AngloGold Ashanti and other mining companies have limited influence over manufacturers and suppliers of these
items. In certain cases, there are a limited number of suppliers for certain strategic spares, critical consumables, mining
equipment or metallurgical plant who command superior bargaining power relative to AngloGold Ashanti. AngloGold Ashanti
could at times face limited supply or increased lead time in the delivery of such items.
AngloGold Ashanti’s procurement policy is to source mining, processing equipment and consumables from suppliers that meet its
corporate values and ethical standards. Although AngloGold Ashanti monitors and assesses suppliers on their governance
conduct, there is a risk that the Company may fail to identify actual instances of unethical conduct by those suppliers or other
activities that are inconsistent with its values and standards. In certain locations, where a limited number of suppliers meet these
standards, additional strain is placed on the supply chain, thereby increasing the cost of supply and delivery times. In addition,
AngloGold Ashanti’s efforts to monitor supply chain activities, including freight and logistics routes, and its engagement with its
suppliers to identify disruptions on its ability to source materials or equipment or otherwise impact its operations, may not be
sufficient to avoid disruptions that could have a material adverse effect on AngloGold Ashanti’s business or operations.
Furthermore, supply chains and rates can be impacted by natural disasters, such as earthquakes, severe weather, such as
storms, heavy rainfall and other impacts that may be increasing due to climate change, as well as other phenomena that include
unrest, strikes, theft and fires. For example, in February 2013, a fire destroyed the heavy mining equipment stock of spares and
components at the Geita gold mine in Tanzania. If AngloGold Ashanti experiences shortages, or increased lead times in the
delivery of strategic spares, critical consumables, mining equipment or processing plants, AngloGold Ashanti might be forced to
suspend some of its operations and its results of operations and financial condition could be adversely impacted.
Similarly, an outbreak of infectious diseases, a pandemic or other public health threat, such as the outbreak of the SARS-CoV-2
virus responsible for COVID-19 or an outbreak of the Ebola, Marburg or monkeypox virus, or a fear of any of the foregoing, could
adversely impact AngloGold Ashanti’s operations by causing supply chain delays and disruptions, import restrictions or shipping
disruptions, as well as operational shutdowns (including as part of government-mandated containment measures). For example,
the Siguiri mine in Guinea has been impacted by several Ebola virus outbreaks since 2014 in Western Africa, with the most
recent outbreak detected in Guinea in early 2021, which continued until the summer of that year. Other serious disease
outbreaks detected included an outbreak of Ebola reported in 2021 in Uganda, which had the potential to spill over country
borders to AngloGold Ashanti’s operations in the neighbouring DRC and Tanzania. There was additionally an outbreak of
Marburg reported in Tanzania in March 2023, which continued until June 2023. See “—AngloGold Ashanti’s Mineral Reserve,
deposits and mining operations are located in countries that face instability, public health and security risks that may adversely
affect both the terms of its mining concessions, as well as its ability to conduct operations in certain countries”. Furthermore, in
response to the COVID-19 outbreak, several governments imposed significant restrictions on the movement of goods, services
and persons (including travel), including nationwide lockdowns of businesses and their citizens (quarantine) and even temporary
suspension of mining activities. Such disruptions and other manufacturing and logistical restraints could result in extended lead
times in supply and distribution networks, as well as the exercise of force majeure measures, the impacts of which could
32
eventually result in stoppage of mining operations. They could also result in the need to increase inventories on long lead time
items and critical consumables and spares which may lead to an increase in working capital. In addition, restrictions in travel,
including air travel, and border access may impact AngloGold Ashanti’s ability to source and transport goods and services
required to operate mines, transport gold doré to refineries and ship refined gold from refineries as well as increase the cost.
AngloGold Ashanti cannot guarantee that its crisis management measures will be adequate, that the supply chain and operations
will not be adversely affected by future epidemic or pandemic outbreaks (such as outbreaks of COVID-19, Ebola, Marburg or
monkeypox) or that there would be no related consequences, such as severe food shortages and social impact. Export
restrictions related to any epidemic or pandemic (including as a result of government regulation and prevention measures) could
similarly adversely impact AngloGold Ashanti’s financial condition and results of operations.
AngloGold Ashanti’s operations are vulnerable to infrastructure constraints.
Mining, processing, development and exploration activities depend on adequate infrastructure. Reliable rail, ports, roads,
bridges, power sources, power transmission facilities and water supply are critical to AngloGold Ashanti’s business operations
and affect capital and operating costs. These infrastructures and services are often provided by third parties whose operational
activities are outside the control of the Company.
Interferences in the maintenance or provision of infrastructure, including unusual weather phenomena, sabotage and social
unrest could impede AngloGold Ashanti’s ability to deliver its products on time and adversely affect its business, results of
operations and financial condition.
Establishing infrastructure for AngloGold Ashanti’s development projects requires significant resources, identification of adequate
sources of raw materials and supplies, and necessary cooperation from national and regional governments, none of which can
be assured.
AngloGold Ashanti has operations or potential development projects in countries where government-provided infrastructure is
inadequate and regulatory regimes for access to infrastructure are uncertain, which could adversely impact the efficient operation
and expansion of its business. AngloGold Ashanti may not secure and maintain access to adequate infrastructure in the future, or
it may not do so on reasonable terms which may adversely affect AngloGold Ashanti’s business, results of operations and
financial condition.
AngloGold Ashanti faces strong competition and industry consolidation.
The mining industry is competitive in all of its phases. AngloGold Ashanti competes with other mining companies and individuals
for the acquisition of mining and exploration assets, for mining claims and leases on exploration properties, as well as for
specialised equipment, components and supplies necessary for exploration, development and mining of the relevant mining or
exploration asset. These competitors may have greater financial resources, operational experience and technical capabilities
than AngloGold Ashanti and may also be lower on the industry cost curve or have lower cost of capital and better access to
scarce capital than AngloGold Ashanti. Competition may increase AngloGold Ashanti’s cost of acquiring suitable claims,
properties and assets, which could have a material adverse effect on its financial condition and results of operations.
Further, industry consolidation may lead to increased competition due to lesser availability of mining and exploration assets. A
number of transactions have been completed in the gold mining industry in recent years. In this regard, some of AngloGold
Ashanti’s competitors have made acquisitions or entered into business combinations, joint ventures, partnerships or other
strategic relationships.For example, Barrick Gold Corporation (“Barrick”) completed its merger with Randgold Resources Limited
in January 2019 and Newmont Corporation (formerly Newmont Mining Corporation) completed its business combination with
Goldcorp Inc. in April 2019. In February 2022, Agnico Eagle Mines Limited (“Agnico”) completed its business combination with
Kirkland Lake Gold Ltd. In March 2023, Pan American Silver Corporation completed its acquisition of Yamana Gold Inc.
(“Yamana”) following the sale by Yamana of certain of its assets to Agnico. In November 2023, Newmont Corporation completed
its acquisition of Newcrest Mining Limited. Similar consolidations in the form of acquisitions, business combinations, joint
ventures, partnerships or other strategic relationships may continue in the future. The companies or alliances resulting from
these transactions or any further consolidation involving AngloGold Ashanti’s competitors may benefit from greater economies of
scale as well as significantly larger, more diversified, lower cost and higher quality asset bases than AngloGold Ashanti. In
addition, following such transactions certain of AngloGold Ashanti’s competitors may decide to sell specific mining assets
increasing the availability of such assets in the market, which could adversely impact any sale process that AngloGold Ashanti
may undertake at the same time, including such sales processes taking longer to complete or not completing at all or not
realising the full value of the assets being disposed of. Such developments may adversely affect AngloGold Ashanti’s business,
operating results and financial condition.
Risks Related to AngloGold Ashanti’s Operations and Business
AngloGold Ashanti’s mineral deposits, Mineral Reserve and mining operations are located in countries where political,
tax and economic laws and policies may change rapidly and unpredictably and such changes and policies may
33
adversely affect both the terms of its mining concessions, as well as its ability to conduct operations in certain
countries.
Based on the Company’s past experience, political, tax and economic laws and policies in countries in which AngloGold Ashanti
operates can change rapidly. Examples include the foreign currency regulations that were imposed from 2011 to 2015 and since
September 2019 in Argentina and the ban on gold ore exports announced by the Tanzanian government in March 2017. As
mining assets are fixed and largely immovable, the adverse impacts of such changes may be unavoidable and immediate.
Any existing and new mining, exploration operations and projects that AngloGold Ashanti carries out are subject to various
national and local laws, policies and regulations governing the ownership, prospecting, development and mining of Mineral
Reserve, taxation and royalties, exchange controls, import and export duties and restrictions, investment approvals, employee
and social community relations and other matters.
In many of the countries in which AngloGold Ashanti operates, there is an ongoing focus by governments seeking greater
economic benefit and increased financial and social benefits from extractive industries and mining in particular. This entails the
review of mining codes and stability agreements, which were in many cases designed under particular economic conditions, and
the formulation or amendment of laws, policies and regulations relating to issues such as mineral rights and asset ownership,
royalties, taxation and taxation disputes, “windfall” or “super” taxation, non-recovery of taxation refunds, import and export duties,
currency transfers, restrictions on foreign currency holdings and repatriation of earnings. The laws, policies and regulations are
increasingly uncertain, changing and generally require progressively higher payments to governments, notably in the form of
increased royalties and taxes, mandated beneficiation, export levies and increasing or retaining state or national ownership of
resources (including by way of free-carried interests in mining companies for governments). For example, the royalty rate
applicable to gold increased from 2.5 percent to 3.5 percent in 2018 in the DRC and from four percent to six percent in Tanzania
in 2017. In particular, changes to the fiscal terms governing AngloGold Ashanti’s operations may have a material adverse impact
on its results of operations or financial condition, threaten the viability of existing operations, and discourage future investments
in certain jurisdictions. This may therefore have an adverse impact on AngloGold Ashanti’s ability to access new assets and
potentially reduce future growth opportunities.
For example, in July 2017, the government of Tanzania enacted new legislation which purports to make a number of changes to
the operating environment for Tanzania’s extractive industries, including its mining sector. These changes include, among other
things, (i) listing requirements; (ii) an increase in the rate of revenue royalties from four to six percent and a one percent
clearance fee; and (iii) a right for the Government of Tanzania to (a) renegotiate existing mining agreements at its discretion, (b)
receive a non-dilutable, free-carried interest of no less than 16 percent in all mining projects, and (c) acquire up to 50 percent of
the shares of the mining company commensurate with the total tax expenditure incurred by the Government in favour of the
mining company. The government of Tanzania enacted further legislation regarding state participation in 2022. See “Item 4B:
Business Overview—The Regulatory Environment Enabling AngloGold Ashanti to Mine—Africa Region—Tanzania”. Any future
amendments to the mining codes of the countries in which AngloGold Ashanti operates or attempts to renegotiate its existing
mining conventions in such countries could have further adverse effects on its financial condition and results of operations.
Another example were the amendments to the fiscal mining regime in Ghana introduced in 2012 by the government of Ghana
which, among other things, increased the corporate taxation and royalty rates. In this regard, AngloGold Ashanti (Ghana) Limited
negotiated in relation to the Obuasi mine a new development agreement (the “Obuasi DA”) and a new tax concession agreement
(the “Obuasi TCA”) with the government of Ghana. As a result of the parliamentary ratification of the Obuasi DA and Obuasi TCA
in June 2018, the 2004 Ghana Stability Agreement ceased to apply to the Obuasi mine but continued to apply to the Iduapriem
mine until it expired in April 2019. See “Item 4B: Business Overview—The Regulatory Environment Enabling AngloGold Ashanti
to Mine—Africa Region—Ghana”. Any future amendments to the Ghanaian mining regime, negotiation of new agreements, or
attempts or failures to renegotiate existing agreements on the same favourable conditions or at all may have a material adverse
effect on AngloGold Ashanti’s results of operations or financial condition.
In addition, some of AngloGold Ashanti’s mineral deposits and mining and exploration operations are located in countries that are
experiencing social and political instability as well as economic uncertainty. For example, in Guinea, a military coup in September
2021, during which the president was detained, resulted in political instability. Furthermore, political instability and related events
in Mali led to the president formally resigning in August 2020 after being detained by a group of soldiers, which was followed by a
second military coup in May 2021. The political instability in Mali may negatively affect AngloGold Ashanti’s ability to consummate
the disposal of its interests in the Yatela joint venture, including the terms, fulfilment of conditions precedent or timing thereof.
See “Item 4B: Business Overview—The Regulatory Environment Enabling AngloGold Ashanti to Mine—Africa Region—Mali”. In
countries experiencing social and political instability as well as economic uncertainty, there is a risk that political influence may
delay or hinder strategic imperatives for cost rationalisation especially in the areas of procurement and labour reductions. In
addition, allegations of corruption in Brazil, the DRC and Guinea against top political and industry leaders have increased
political instability and distrust. Efforts at political and economic reforms in Brazil and such other countries may lead to increased
instability. Furthermore, elections in the countries in which AngloGold Ashanti operates may be accompanied by social, political
and economic uncertainty and instability. The high levels of unemployment, poverty and inequality remain in each of these
countries, further increasing the risk of social instability that will continue to negatively impact their economies, business and the
mining industry.
34
Mining is a long-term activity and assets may be located in jurisdictions with elevated risk. Political instability and the resulting
unstable business environment in such countries in which companies operate may discourage future investment in those
jurisdictions, and may have an adverse impact on AngloGold Ashanti’s ability to access new assets, potentially reducing growth
opportunities.
AngloGold Ashanti is subject to an uncertain tax environment. See “Item 18: Financial Statements—Note 9 Taxation”. Increased
taxes are expected in most countries of operation. Changes in tax laws could result in higher tax expense and payments and
could materially impact AngloGold Ashanti’s tax receivables and liabilities as well as deferred tax assets and deferred tax
liabilities. In addition, the uncertain tax environment in some regions in which AngloGold Ashanti operates could limit its ability to
enforce its rights. As a global company, AngloGold Ashanti conducts its business in countries subject to complex tax rules, which
may be interpreted in different ways. The interpretation and application of tax rules by tax authorities and courts in the countries
in which the Company operates may be uncertain and unpredictable and could result in higher tax expense and payments than
anticipated, even if such tax exposure is considered to be remote by the Company. Further interpretations or developments of
tax regimes may affect the Company’s tax liabilities, return on investments and business operations. AngloGold Ashanti is
regularly the subject of tax audits in its various jurisdictions of operation. In Tanzania, the Tanzania Revenue Authority (“TRA”)
has been raising audit findings during the past decade on various tax matters in relation to fiscal years 2009 to 2022. A total
amount of $369 million was in dispute as of 31 December 2023 (2022: $318 million), including adjusted tax assessments relating
to the 2022 tax year, which were received in January 2024 totaling $44 million. AngloGold Ashanti has challenged those audit
findings through the applicable administrative and judicial processes. These matters are at different stages of appeal, including
before two administrative bodies, the Tax Revenue Appeals Board and the Tax Revenue Appeals Tribunal, and the Court of
Appeal of Tanzania. In March 2020, the Tax Revenue Appeals Board found in favour of the TRA in a tax dispute relating to
AngloGold Ashanti’s tax assessment for fiscal year 2012. AngloGold Ashanti appealed this decision to the Tax Revenue Appeals
Board. In Colombia, the Colombian tax authorities (Dirección de Impuestos y Aduanas Nacionales) challenged AngloGold
Ashanti’s tax treatment of exploration expenditure in relation to fiscal years 2010, 2011, 2013 and 2014, resulting in claims for
additional taxes as well as interest and penalties. During 2022, the Council of State of Colombia ruled against the Company in
respect of certain of these lawsuits. The Company’s other lawsuits are still pending before the Colombian courts awaiting final
judgement. See “Item 8A: Legal Proceedings—Tax matters”. In addition, governmental authorities, whether tax, judicial or other,
may also issue claims against the Company or its operations, which may be unfounded and without merit, involving substantial
penalties and interest. For example, in the DRC, during 2022, Kibali Goldmines S.A., which owns and operates the Kibali gold
mine, received several claims from the DRC customs authorities (Direction Générale des Douanes et Accises) (the “DRC
Customs Authority”) covering a number of customs duties issues. The DRC Customs Authority claimed, among other things, that
incorrect import duty tariffs have been applied to the import of certain consumables for the Kibali gold mine. The outstanding
claims, including substantial penalties and interest, total $93 million (AngloGold Ashanti’s attributable share: $42 million). For
further information on the status of this matter, see “Item 18: Financial Statements—Note 16—Investments in associates and
joint ventures”. In addition, in February 2024, Kibali Goldmines S.A. received value added tax (“VAT”) assessments from the
DRC fiscal authorities amounting to $152 million (AngloGold Ashanti’s attributable share: $68 million) (including penalties)
covering the period 2019 to 2022. For further information on the status of this matter, see “Item 18: Financial Statements (Kibali
(Jersey) Limited)—Note 27—Subsequent events”. Kibali Goldmines S.A. is of the opinion that such claims are unfounded and
without merit. AngloGold Ashanti’s inability to resolve these and other tax disputes favourably or to enforce its rights, may have a
material adverse impact on its financial performance, cash flow and results of operations.
In Guinea, DRC and Tanzania, AngloGold Ashanti is due refunds of input tax and fuel duties which have remained outstanding
for periods longer than those provided for in the respective statutes. In Tanzania, AngloGold Ashanti calculates that net overdue
recoverable input tax, fuel duties and appeal deposits (after discounting provisions) of $204 million (2022: $196 million) (including
$153 million (2022: $153 million) of VAT input credit refunds) were owed to AngloGold Ashanti as of 31 December 2023 and held
by the Tanzanian government and it is not certain if and when AngloGold Ashanti will be refunded these amounts. See “Item 4B:
Business Overview—The Regulatory Environment Enabling AngloGold Ashanti to Mine—Africa Region—Tanzania”. In the DRC,
AngloGold Ashanti calculates that its attributable share of the net recoverable VAT balance (including recoverable fuel duty and
after discounting provisions) owed to it by the DRC government amounted to $60 million (2022: $86 million) at 31 December
2023. In December 2023, a new agreement was reached with the DRC government for the reimbursement of a portion of the
refundable VAT, which resulted in VAT refunds of $34 million attributable to AngloGold Ashanti as at 31 December 2023.
However, uncertainty remains regarding the timing and level of cash receipts and offsets against other taxes for purposes of the
recovery of AngloGold Ashanti’s remaining VAT receivables in the DRC. See “Item 4B: Business Overview—The Regulatory
Environment Enabling AngloGold Ashanti to Mine—Africa Region—Democratic Republic of the Congo (DRC)”. Similarly, as a
general matter, it is not certain when or whether AngloGold Ashanti will be refunded all tax-related amounts due from any other
government.
The countries in which AngloGold Ashanti operates may also introduce export restrictions, exchange controls, impose restrictions
to source materials and services locally, or impose other similar restrictions that hinder foreign companies’ operations within such
countries as well as adversely affect their results of operations and financial condition. For example, in March 2017, the
Tanzanian government announced an immediate ban on gold, silver, copper and nickel ore exports, in an attempt to ensure that
mineral value-addition activities would be carried out in-country. Further, in 2018, the DRC government imposed new exchange
control rules, as part of its reform of the DRC’s mining code, which resulted in AngloGold Ashanti’s inability to repatriate cash
35
from its DRC operations. The Company’s attributable share of the outstanding cash balances awaiting repatriation from the DRC
amounted to $51 million (2022: $40 million) at 31 December 2023. In this respect, AngloGold Ashanti’s temporary or permanent
inability to repatriate cash from the countries in which AngloGold Ashanti operates could have a material adverse effect on the
Company’s results of operations and financial condition. See “Item 4B: Business Overview—The Regulatory Environment
Enabling AngloGold Ashanti to Mine—Africa Region—Democratic Republic of the Congo (DRC)”.
Additionally, from 2011 to 2015, the Argentinean government introduced stricter exchange controls and related protracted
approval processes which limited the Company’s ability to repatriate dividends from its Argentinean subsidiaries. In September
2018, export duties were re-imposed by the Argentinean government, which were set at eight percent for certain goods, including
doré bars and gold alloys. AngloGold Ashanti’s net export duty receivables (after discounting provisions) in Argentina amounted
to $4 million (2022: $9 million) at 31 December 2023. The devaluation of the Argentinean peso during December 2023 had a
material adverse impact on the receivable amount. These re-imposed export duties, if not compensated with other tax
reductions, affect the tax stability guarantee granted to Cerro Vanguardia S.A. (“CVSA”) and could have a material adverse
impact on the Company’s results of operations and financial condition. Furthermore, in September 2019, the Argentinean
government re-established foreign exchange and export controls. CVSA had a cash balance equivalent to $89 million
(2022: $116 million) at 31 December 2023. The cash balance is available to be paid to AngloGold Ashanti’s offshore ($47 million
(equivalent)) and onshore ($4 million (equivalent)) investment holding companies in the form of declared dividends. Applications
have been made to the Argentinean Central Bank to approve the purchase of U.S. dollars in order to distribute offshore
dividends, most of which remain pending. In addition, increased socio-political tensions and hyper-inflation over the past few
years have greatly increased the country risk which in turn has lowered the potential future earnings of AngloGold Ashanti’s
investment in CVSA. Argentina’s economy continues to suffer from a persistent recession coupled with high inflation (211.4
percent in 2023) and widespread unemployment (an estimate of approximately 5.7 percent in 2023). See “Item 4B: Business
Overview—The Regulatory Environment Enabling AngloGold Ashanti to Mine—Americas—Argentina”.
If, in one or more of the countries in which it operates, AngloGold Ashanti were not able to obtain or maintain necessary permits,
authorisations or agreements to implement planned projects or continue its operations under conditions or within timeframes that
make such plans and operations economically viable, or if the applicable legal, ownership, fiscal (including all royalties and
duties), exchange control, employment, environmental and social laws or regimes change materially, or if the governing political
authorities change resulting in amendments to such laws and regimes, this could have a material adverse effect on AngloGold
Ashanti’s operating results, financial condition, and, in extreme situations, on the viability of an operation. See “—AngloGold
Ashanti’s mining rights in the countries in which it operates could be altered, suspended or cancelled for a variety of reasons,
including breaches in its obligations in respect of such mining rights” and “Item 4B: Business Overview—The Regulatory
Environment Enabling AngloGold Ashanti to Mine”.
The prevalence of occupational health diseases and other diseases and the potential costs and liabilities related thereto
may have an adverse effect on the business and results of operations of AngloGold Ashanti.
The primary areas of focus in respect of occupational health of employees within the Company’s operations are noise-induced
hearing loss and occupational lung diseases (“OLD”), which include pulmonary diseases such as tuberculosis from various
causes and silicosis in individuals exposed to silica dust, and which require active dust management strategies in underground
operations. If the costs associated with providing occupational health services, implementing dust control measures or supplying
protective equipment increase significantly beyond anticipated or budgeted amounts, this could have an adverse effect on
AngloGold Ashanti’s results of operations and financial condition. Actual and alleged health and safety incidents or breaches of
standards may also adversely impact the Company’s reputation.
In South Africa, AngloGold Ashanti has historically been subject to numerous claims, including class action litigation with respect
to alleged OLD with two certified industry-wide classes, i.e., a Silicosis Class and a Tuberculosis Class. The settlement
agreement in relation to this silicosis and tuberculosis class action came into effect in December 2019, following the approval of
the settlement by the High Court in Johannesburg in July 2019. As a result, a trust (Tshiamiso Trust) was established for a
minimum of 13 years responsible for making payments to eligible beneficiaries. The amount of monetary compensation will vary
depending on the nature and seriousness of the disease. As of 31 December 2023, AngloGold Ashanti has recorded a provision
of $17 million (2022: $35 million and 2021: $50 million) to cover the estimated settlement costs and related expenditure of the
silicosis litigation. Although significant judgement was applied in estimating the costs incurred to settle the silicosis and
tuberculosis class action claim, the final costs and related expenditure may differ from current cost estimates. In addition, even
though management believes the assumptions are appropriate, changes in the assumptions may materially affect the provision
and final costs of settlement. For example, the final settlement costs and related expenditure may be higher than the recorded
provision depending on various factors, such as, among other things, potential changes in the settlement terms, differences in
the number and profile of eligible claimants actually compensated compared to current estimates and fluctuations in foreign
exchange rates. There can be no assurance that ultimately this matter will not result in losses in excess of the recorded
provision, which may have a material adverse effect on AngloGold Ashanti’s financial position. The sale of the Company’s South
African operating assets and liabilities to Harmony did not include the silicosis obligation relating to South African employees,
which was retained by AngloGold Ashanti. For further information, see “Item 18: Financial Statements—Note 23—Environmental
Rehabilitation and Other Provisions—Significant Accounting Judgements and Estimates—Provision for silicosis”.
36
AngloGold Ashanti also faces certain risks in dealing with HIV/AIDS and with tropical disease outbreaks such as malaria, and
other diseases which may have an adverse effect on its results of operations and financial condition. Malaria and other tropical
diseases pose significant health risks at all of the Company’s operations in Central, West and East Africa where such diseases
may assume epidemic proportions because of ineffective national control programmes. Malaria is a major cause of ill-health and
mortality in young children and pregnant women in these areas but also gives rise to fatalities and absenteeism in adult men.
Other conditions such as heart disease, chronic diseases, mental health conditions and obesity are also of increasing incidence
and concern. Such diseases impair the health of workers and negatively affect productivity and profitability as a result of workers’
diminished focus or skill, absenteeism, treatment costs and allocated resources. Any current or future medical programme may
not be successful in preventing or reducing the infection rate among AngloGold Ashanti’s employees or in affecting consequent
illness or mortality rates. AngloGold Ashanti may incur significant costs in addressing these issues in the future, which could also
adversely impact the Company’s results of operations and financial condition.
AngloGold Ashanti may face additional health care challenges as a result of other public health crises, pandemics or epidemics,
which may significantly impair the health or mobility of the Company’s labour force and, as a result, AngloGold Ashanti’s ability to
maintain its production levels or operations. Uncertainties remain with respect to the possibility of the emergence, or the re-
emergence, of infectious diseases (such as COVID-19, Ebola, Marburg or monkeypox) that may lead to excessive absenteeism
in, or travel restrictions impacting, the Company’s workforce and may lead to operational disruptions, including a halt or
significant slowdown in mining operations. A curtailment or suspension at AngloGold Ashanti’s mining operations in certain or all
regions due to full or partial shutdowns, either those requested or mandated by governmental authorities or otherwise elected by
the Company, including for safety or staffing reasons, may have a material adverse impact on AngloGold Ashanti’s results of
operations and financial condition.
In South Africa, AngloGold Ashanti retained the legal and financial obligations in respect of a historical post-retirement medical
scheme for certain employees and their dependents following the sale of the Company’s South African operating assets and
liabilities to Harmony. AngloGold Ashanti’s responsibility extends to South African employees who historically qualified for such
scheme (which was discontinued about two decades ago) and who were either not transferred to Harmony in connection with the
asset sale but remained employed by the Company as of the consummation of the sale or who had retired prior to the
completion of the transaction. As of 31 December 2023, AngloGold Ashanti has recorded a provision of approximately $59 million
(2022: $66 million and 2021: $71 million) to cover the estimated contribution costs of the post-retirement medical scheme for
such current and retired employees. In the event that the required contribution costs ultimately exceed the estimates on which
the recorded provision is based, the additional costs incurred by the Company may have a material adverse effect on AngloGold
Ashanti’s financial position. For further information, see “Item 18: Financial Statements—Note 24—Provision for pension and
post-retirement benefits”.
AngloGold Ashanti’s inability to retain its senior management may have an adverse effect on its business.
AngloGold Ashanti’s success depends largely upon the continued service of its senior management, including its chief executive
officer, its chief financial officer, the executive officers at each of its business divisions, the general managers at its mines and
other senior managers. The departure of one or more members of AngloGold Ashanti’s senior management may have an
adverse effect on its business, results of operations and financial condition. In addition, the loss of one or more members of the
senior management team, coupled with any reduced attractiveness of the gold mining sector, could lead to the departures of
other members of the management team. The inability of AngloGold Ashanti to retain its senior management could disrupt its
operations, and have a material adverse impact on its business, results of operations and financial condition.
AngloGold Ashanti competes with mining and other companies for key human resources with critical skills and its
inability to retain key personnel could have an adverse effect on its business.
AngloGold Ashanti competes on a global basis with mining and other companies to attract and retain key human resources at all
levels with the appropriate technical skills and operating and managerial experience necessary to operate and supervise its
business. This is exacerbated by the global shortage of persons with critical mining skills, including geologists, mining engineers,
metallurgists and skilled artisans. Furthermore, the often remote locations of mining operations may make the mining industry
unattractive to potential employees. The significant decrease in enrolments in higher education programmes focused on mining
qualifications globally may also have an adverse impact on the future supply of employees with critical mining skills. Changes in
taxation and the regulatory environment where AngloGold Ashanti operates may also impact the Company’s ability to attract and
retain key personnel, especially those from abroad.
For example, despite the scale of mining activities in many African countries, recruitment of skilled personnel has been
challenging as the local development of critical skills struggles to match an increasing demand. Recruitment remains difficult due
to university offerings and other training institution offerings often not well-suited to the specific needs of the mining industry, as
well as other factors such as language barriers and low literacy skills. Furthermore, local workers with critical skills, such as
jumbo operators and tele-remote bogger operators from the DRC, Ghana and Tanzania are increasingly being targeted for
expatriate opportunities across the continent. In addition, it has become increasingly difficult to secure work permits for
AngloGold Ashanti’s expatriate workforce in Tanzania as a result of the Tanzanian government’s efforts to promote the
employment of Tanzanian citizens. Difficulties in obtaining such non-citizen work permits due to increased pressure for
37
localisation of labour, if continuing, may have an adverse impact on the Company’s operations in Tanzania. Similar impacts may
occur elsewhere, including in the DRC, Ghana and Guinea. Certain jurisdictions, such as Ghana, have also adopted local
content and local participation policies.
Other regions experience similar challenges. For example, while there is a high concentration of specialised and skilled mining
workers in Australia and Brazil, there is significant competition for such personnel in those markets. Additionally, the Company
may incur significant costs to develop talent, capacity and expertise across its global operations. Despite AngloGold Ashanti’s
investments, the Company may not be able to retain and attract sufficient skilled and experienced employees in all areas of the
business. Should it fail to do so or lose any of its key personnel with critical skills, business and growth prospects may be harmed
and this could have an adverse impact on AngloGold Ashanti’s results of operations and financial condition.
Increased labour costs could have a material adverse effect on AngloGold Ashanti’s results of operations and financial
condition.
Labour costs represent a substantial proportion of the Company’s total operating costs and at many operations in the Americas,
constitute approximately 35 to 40 percent of the operations’ operating costs. Absent any simultaneous increase in productivity,
any change to the Company’s wage agreements or other factors that could increase labour costs may have a material adverse
effect on AngloGold Ashanti’s results of operations and financial condition.
AngloGold Ashanti’s results may be further impaired if the Company incurs penalties for failing to meet standards set by labour
laws regarding workers’ rights or incurs costs to comply with new labour laws, rules and regulations. For example, Ghanaian law
contains broad provisions requiring mining companies to recruit and train Ghanaian personnel and to use the services of
Ghanaian companies. Penalties and compliance costs, as well as increased costs due to laws and regulations less favourable to
employers, could have a material adverse effect on the Company’s results of operations and financial condition.
The use of contractors at certain of the Company’s operations may expose AngloGold Ashanti to delays or
suspensions in mining activities and increased mining costs.
AngloGold Ashanti uses contractors at certain of its operations to mine and deliver ore to processing plants as well as for other
purposes. At mines employing mining contractors, contracting costs represent a significant proportion of the total operating costs
of these operations.
AngloGold Ashanti’s operations could be disrupted, resulting in additional costs and liabilities, if the mining contractors at affected
mines have financial difficulties, or if a dispute arises in renegotiating a contract, or if there is a delay in replacing an existing
contractor and its operating equipment to meet business needs at expected cost levels. Increases in contract mining rates, in the
absence of associated productivity increases, may also have an adverse impact on the Company’s results of operations and
financial condition. In addition, restrictions on travel imposed by governments as a result of any emerging outbreak of infectious
diseases, a pandemic or other public health threat, such as Ebola or COVID-19, may prevent mining contractors and other
employees from reaching AngloGold Ashanti’s mining sites which could have an adverse effect on the operations of the affected
mines.
In the past we have experienced disputes with our contractors after the termination of the contractual relationship or the sale of
the applicable mine and any such disputes may also arise in the future.
In addition, AngloGold Ashanti’s reduced control over those aspects of operations which are the responsibility of contractors,
their failure to comply with applicable legal, human rights and regulatory requirements, or their inability to manage their workforce
or provide high quality services or a high level of productivity could adversely affect AngloGold Ashanti’s reputation, results of
operations and financial condition, and may result in the Company’s incurrence of liability to third parties due to the actions of
contractors.
AngloGold Ashanti’s Mineral Reserve, deposits and mining operations are located in countries that face instability,
public health and security risks that may adversely affect both the terms of its mining concessions, as well as its ability
to conduct operations in certain countries.
Some of AngloGold Ashanti’s mineral deposits and mining and exploration operations are located in countries that are
experiencing political and economic instability and other uncertainty.
Certain of the countries in which AngloGold Ashanti has mineral deposits or mining or exploration operations, including the DRC,
Guinea, Ghana, Tanzania, Colombia and Brazil, have in the past experienced, and in certain cases continue to experience, a
difficult security environment. In particular, various illegal groups active in regions in which the Company is present may pose a
credible threat of organised crime, military repression, terrorism, civil unrest and disturbances, sabotage, extortion and
kidnapping, which could have an adverse effect on its operations in these and other regions.
38
Attacks on mining companies (for example, attacks targeting gold rooms where smelted gold bars are stored before being
transported to other facilities) have also been occurring over the last couple of years, especially in South America and Africa, and
the risk of future attacks remains a threat and could adversely affect the Company’s activities.
Intrusions onto AngloGold Ashanti’s tenement and operational areas, including artisanal and illegal mining-related activities in
particular, continue to be a challenge. The most significant security challenges remain in Guinea, Ghana and Tanzania, in areas
where there is endemic poverty, high levels of unemployment and an increased level of organisation and funding of criminal
activity. See “—Artisanal and illegal mining occurs on AngloGold Ashanti’s properties, which can disrupt the Company’s
business, have adverse environmental, health, safety and security impacts, and expose the Company to liability”. If the security
environment surrounding AngloGold Ashanti’s operations that are most exposed to these challenges deteriorates, employee,
third party and community member injuries and fatalities could also increase. Any such increase could disrupt the Company’s
operations in certain mines and adversely affect its reputation, results of operations and financial condition. In some instances,
risk assessments categorise threats as serious enough to require resorting to public security forces, such as national police or
military units on a near-permanent basis. In the event that continued invasions in any of the Company’s countries of operations
compromise the Company’s security or business principles, AngloGold Ashanti may withdraw from any such countries on a
temporary or permanent basis. This could have a material adverse impact on AngloGold Ashanti’s results of operations and
financial condition.
Furthermore, AngloGold Ashanti continues to experience strained relationships with certain of its host communities. AngloGold
Ashanti operates in several regions where poverty, unemployment and the lack of access to alternative livelihoods mean that the
creation and distribution of economic benefit from mining operations is a significant area of focus for community and government.
AngloGold Ashanti has also been publicly accused of inadequate resettlement practices at its Siguiri operation in Guinea by local
and international NGOs, which poses reputational risk.
In addition, infectious diseases, such as COVID-19, Ebola, Marburg or monkeypox, are also a threat to the stability of some of
the countries in which AngloGold Ashanti operates, where limited local health infrastructure weakens governments’ ability to
manage and contain outbreaks effectively, in particular prolonged or sustained outbreaks. AngloGold Ashanti operates mines in
regions that have experienced serious infectious disease outbreaks of public health concern and resulting deaths. For example,
an Ebola outbreak was detected in early 2021 in Guinea, which continued until the summer of 2021. The DRC also experienced
an outbreak of the Ebola virus at the end of 2021 and during the summer of 2022. In September 2022, Uganda, which borders
Tanzania and the DRC, countries in which AngloGold Ashanti operates, declared an outbreak of Ebola that lasted until January
2023. Tanzania also experienced an outbreak of Marburg disease between March 2023 and June 2023. Depending on the
nature and severity of the outbreak, national or state governments in some countries could declare a state of emergency
empowering such governments to take actions or impose restrictions to contain any outbreak that otherwise would not be
permitted under the applicable legal and regulatory framework. Governments could also impose certain restrictions on travel or
business activities as protective measures, including nationwide lockdowns (quarantine), which may disrupt, and have disrupted
in the case of COVID-19, the Company’s activities and operations and even lead, and have led in the case of COVID-19, to a full
or partial shutdown of the Company’s mining operations in those countries. Any such emergency governmental action may have
a material adverse effect on AngloGold Ashanti’s operating and financial results, which may result in a negative impact on the
Company’s cash flows, funding requirements and overall liquidity.
Labour unrest, activism and disruptions (including protracted stoppages) could have a material adverse effect on
AngloGold Ashanti’s results of operations and financial condition.
AngloGold Ashanti’s employees in Ghana, Guinea, Tanzania, Brazil and Argentina are highly unionised and unions are active at
some of the Company’s other operations. Trade unions working with communities and NGOs, therefore, have a significant
impact on the general labour relations environment, including labour relations at an operational level and operational stability at
times. Unions are characterised by their robust engagement with the Company, both in the context of existing collective
bargaining structures to improve and advance conditions of employment, and in the context of changing economic conditions,
downsizing and downscaling of operations. These factors expose the Company’s operations to potential strike action and work
stoppages. Any future labour unrest and disruptions could have a material adverse effect on AngloGold Ashanti’s results of
operations and financial condition. For example, at Siguiri in Guinea, local community protests related to employment demands,
in addition to incursions by artisanal and small-scale miners, caused sporadic mining disruptions in November 2023.
Unions are also increasingly affiliated to global union federations and championing broader political, economic and social issues
such as GHG emissions, environmental issues, health and safety, human rights, job losses, unemployment and restructuring,
gender and inclusion issues, and migrant labour, as rallying points. Rolling mass action, picketing, protests and community
involvement may create safety, security and related risks to the Company and its assets. Future disruptions, strikes, and protest
actions cannot be excluded and may have a material adverse effect on the Company’s results of operations and financial
condition, especially if these actions have a long duration. Furthermore, IndustriALL, representing more than 50 million workers
globally, is expected to continue its attempts to enter into a global framework agreement with mining and resource companies. A
global framework agreement will expose AngloGold Ashanti to the risk of standardisation and equalisations of labour terms and
conditions across the Group, irrespective of the peculiar conditions applicable in the various jurisdictions in which the Group
operates. Any labour unrest and disruptions caused by such international trade unions could have a material adverse effect on
AngloGold Ashanti’s results of operations and financial condition.
39
Artisanal and illegal mining occurs on AngloGold Ashanti’s properties, which can disrupt the Company’s business,
have adverse environmental, health, safety and security impacts, and expose the Company to liability.
Artisanal and illegal miners are active on, or adjacent to, at least eight of AngloGold Ashanti’s properties, which at times may lead
to interference with the Company’s operations and can result in conflicts that present a security threat to property as well as a
threat to human safety and life. AngloGold Ashanti’s operations and projects affected and potentially at risk by artisanal and/or
illegal small-scale mining are mainly situated in Guinea, Ghana, Tanzania and Brazil. Artisanal and illegal small-scale mining is
associated with a number of negative impacts, including environmental degradation, flouting of land rights, poor safety practices,
erosion of civil society, human rights abuse and funding of conflict. The environmental, social, safety and health impacts of
artisanal mining are frequently attributed to formal mining activity, and it is often assumed that artisanally-mined gold is
channelled through large-scale mining operators, even though artisanal and large-scale miners have distinct supply and
distribution chains. These misconceptions have a negative impact on the reputation of the industry.
The activities of the illegal miners, which include theft and shrinkage, could cause damage to AngloGold Ashanti’s properties, as
well as impacts to surface water, pollution, disruptions to previously rehabilitated areas, underground fires, or, as the result of
security interventions or poor safety practices by the illegal miners, personal injury or death, for which AngloGold Ashanti could
potentially be held responsible. Illegal mining could also result in the depletion of mineral deposits, potentially making the future
mining of such deposits uneconomical. The presence of illegal miners could lead to project delays and disputes regarding the
development or operation of commercial gold deposits. In addition, illegal mining could lead to an increase in the level of
organisation and funding of criminal activity around some of the Company’s operations. The most significant security challenges
have occurred in Guinea, Ghana and Tanzania in areas where there is endemic poverty and high levels of unemployment. These
conditions may increase expectations and demands to relinquish land for other economic development, or to support host
communities through, for example, the formalisation of artisanal mining activities.
More generally, illegal mining and theft could also result in lost gold Mineral Reserve, mine stoppages, and have other material
adverse effects on AngloGold Ashanti’s results of operations or financial condition.
AngloGold Ashanti’s mining rights in the countries in which it operates could be altered, suspended or cancelled for a
variety of reasons, including breaches in its obligations in respect of such mining rights.
AngloGold Ashanti’s right to own and develop Mineral Reserve and deposits is governed by the laws and regulations of the
jurisdictions in which the mineral properties are located. See “Item 4B: Business Overview—The Regulatory Environment
Enabling AngloGold Ashanti to Mine”. Currently, a significant portion of AngloGold Ashanti’s Mineral Reserve and deposits are
located in countries where mining rights could be suspended or cancelled should it breach its obligations in respect of these
rights.
In each of the countries in which AngloGold Ashanti operates, the formulation or implementation of government policies on
certain issues may be unpredictable. This may include changes in laws relating to mineral rights, ownership of mining assets and
the right to prospect and mine, and in extreme cases, nationalisation, expropriation or nullification of existing concessions,
licences, permits, agreements and contracts.
Any existing and new mining and exploration operations and projects are subject to various national and local laws, policies and
regulations governing the ownership and the right to prospect or mine or develop proposed projects. For more details on the
risks surrounding ownership of mining assets, see “—Title to AngloGold Ashanti’s properties may be uncertain and subject to
challenge” and “—AngloGold Ashanti’s mineral deposits, Mineral Reserve and mining operations are located in countries where
political, tax and economic laws and policies may change rapidly and unpredictably and such changes and policies may
adversely affect both the terms of its mining concessions, as well as its ability to conduct operations in certain countries”.
Project implementation delays could result in licences not being renewed and the loss of mining rights. Some of AngloGold
Ashanti’s mining concessions, authorisations, licences and permits are subject to expiry, limitations on renewal and various other
risks and uncertainties. For example, in Tanzania, the application for the renewal of our special mining licence, which was filed in
July 2023, is currently pending. Similarly, in Guinea, a renewal request for our mining concession, which was filed in February
2022, is also pending.
In addition, any dispute with governments or other stakeholders, including labour unions, involving one of AngloGold Ashanti’s
operations, as a result of rationalisation efforts or otherwise, could negatively affect AngloGold Ashanti’s relationship with such
government or stakeholders in respect of other operations within the same country, which could result in adverse consequences,
including unfavourable regulatory action, claims and labour disputes. Such adverse consequences could be exacerbated due to
the holding Company structure of AngloGold Ashanti’s subsidiaries in some of the countries in which it operates.
In Colombia, a government agency grants exclusive concession contracts for exploration and development which contain
specified timelines for the completion of the various phases of a mining project. The Company must comply with these timelines
unless performance is suspended, for example, due to force majeure or these timelines are extended or modified. If AngloGold
Ashanti does not comply with the specified timelines for the completion of the various phases of a mining project, it may be found
40
in breach of its concession contract or mining licence and such breach could constitute grounds for the mining authority to
terminate such concession contract or mining licence. Force majeure was declared at the La Colosa project by the Colombian
mining authority, stopping all activities, pending issuance of permits required to continue the next phase of operations. During the
period when force majeure is in force, the specified timelines for completing the various phases of the mining project under the
concession contract are suspended. The force majeure has been extended multiple times and is now expected to expire in June
2024, after which such declaration will once more need to be extended in case the relevant permits have not been granted.
However, there can be no guarantee that such declaration, if required to be extended, will be extended at that time. Force
majeure generally remains in force as long as the underlying circumstances which led to its declaration persist. See also “Item
4B: Business Overview—The Regulatory Environment Enabling AngloGold Ashanti to Mine—Americas—Colombia”.
AngloGold Ashanti’s insurance does not cover most losses caused by the risks described in this section. See “—The occurrence
of events for which AngloGold Ashanti is not insured or for which its insurance is inadequate may adversely affect cash flows and
overall profitability”.
If AngloGold Ashanti is not able to obtain or maintain necessary permits, authorisations or agreements to prospect or mine or to
implement planned projects, or continue its operations, or comply with all laws, regulations or requirements, or do so within
timeframes that make such plans and operations economically viable, or if the laws impacting the Company’s ownership of its
mineral rights or the right to prospect or mine change materially, or if governments increase their ownership in the mines or
nationalise them, AngloGold Ashanti’s results of operations and financial condition could be adversely affected. In addition, such
challenges and difficulties may negatively affect the outcome of the Company’s project studies, which could, in some cases, lead
to a reduction in its Mineral Resource and Mineral Reserve, which may be significant.
AngloGold Ashanti may also prove unable to deliver on production targets, including in potentially critical areas, as well as on the
timely, cost-effective and successful execution, including ramping-up, of key capital projects. For example, Colombia is an
untested jurisdiction for the Company, so permitting, licensing, stakeholder expectations and demands and other external factors,
including with respect to the Quebradona project, could affect timelines and cause capital overruns. Unforeseen difficulties,
delays or costs may adversely affect the successful implementation of the Company’s business strategy and projects, and such
strategy and projects may not result in the anticipated benefits, which could have a material adverse effect on its results of
operations, financial condition and prospects.
Title to AngloGold Ashanti’s properties may be uncertain and subject to challenge.
AngloGold Ashanti has operations in several countries where ownership of land is uncertain and where disputes may arise in
relation to ownership. Certain of AngloGold Ashanti’s properties may be subject to the rights or the asserted rights of various
community stakeholders, including indigenous people. The presence of those stakeholders or any legal challenges by such
stakeholders to AngloGold Ashanti’s title to its properties may have a material adverse impact on its ability to develop or operate
its mining interests. Title legislation is complex and difficult to predict and disputes or failure to maintain title could negatively
affect the business results of new or existing projects.
For example, in Australia, the Native Title Act 1993 (Cth) provides for the establishment and recognition of native title under
certain circumstances. Once a native title claim is registered, the native title party has a right to negotiate prior to the grant of
certain mining tenements within the native title claim area. Registration of a native title claim, or a determination of native title,
does not affect operations on mining tenements that were validly granted prior to the registration of the native title claim, although
registered or determined native title holders will ordinarily have a right to claim compensation from the relevant Commonwealth
or State government in respect of the impact of the tenement on their property rights. However, in the state of Western Australia,
the Mining Act 1978 (WA) provides that an applicant for the grant of, or the holder of, a mining tenement is responsible for native
title compensation, if determined to be payable, to native title holders. Separately, in Australia, the Nangaanya-ku native title
claim group initiated legal proceedings before the Federal Court of Australia against the state of Western Australia claiming that
the consolidated mining lease for Tropicana (M39/1096) is invalid due to an alleged failure by the state of Western Australia to
comply with certain procedural requirements of the Native Title Act 1993 (Cth) during the consolidation process. AngloGold
Ashanti was joined as a party to such legal proceedings for the sole purpose of responding to the claim regarding the validity of
the Tropicana mining lease. A decision on this matter is currently pending. See “Item 4B: Business Overview—The Regulatory
Environment Enabling AngloGold Ashanti to Mine—Australia”.
Title to AngloGold Ashanti’s properties, particularly undeveloped ones, may also be defective or subject to challenge. Title
insurance generally is not available, and title review does not necessarily preclude third parties from contesting ownership. The
precise area and location of the Company’s claims may be in doubt and concessions granted under various titles in a single area
may turn out not to be perfectly contiguous, leaving title to areas between concessions open to challenge. Accordingly,
AngloGold Ashanti’s mineral properties may be subject to prior unregistered liens, agreements, transfers or claims, including
native land claims, and title may be affected by, among other things, undetected defects. Further, title to the Company’s
properties depends in some cases upon compliance with complex statutes and regulations, including those imposing periodic
claim maintenance requirements. Failure to strictly comply with these requirements could invalidate the Company’s title to such
properties, and such defects may not be readily curable.
41
Risks Related to AngloGold Ashanti’s Corporate and Financing Structure and Strategy
AngloGold Ashanti expects to have significant financing requirements.
AngloGold Ashanti’s existing board-approved development projects and exploration initiatives as well as its potential
development projects will require significant funding. The Company’s capital expenditure plans and requirements are subject to a
number of risks, contingencies and other factors, some of which are beyond its control, including volatile or sustained lower gold
prices, and therefore the actual future capital expenditure and investments may differ significantly from the current planned
amounts.
As a result, new sources of capital may be needed to help meet the funding requirements of these developments, and to fund
ongoing business activities. AngloGold Ashanti’s ability to further raise and service significant new sources of capital will be a
function of macroeconomic conditions, the condition of the financial markets, future gold prices, the Company’s operational
performance and operating cash flow and debt position, among other factors. AngloGold Ashanti’s ability to raise further debt,
equity or quasi-equity financing in the future and the cost of such financing will depend on, among other factors, its prevailing
credit rating, which may be affected by the Company’s ability to maintain its outstanding debt and financial ratios at levels
acceptable to the credit ratings agencies, its business prospects, risks relating to the countries in which it operates and other
factors. As a result, in the event of depressed gold prices, unanticipated operating or financial challenges, any dislocation in
financial markets (including due to the impact of public health crises, epidemics or pandemics) or new funding limitations,
AngloGold Ashanti’s ability to pursue new business opportunities on reasonable terms, invest in existing and new projects, fund
its ongoing business activities, exit projects and retire or service outstanding debt and pay dividends could be significantly
constrained, all of which could adversely impact the Company’s results of operations and financial condition.
Sales of large quantities of AngloGold Ashanti’s ordinary shares, or the perception that these sales may occur or other
dilution of the Company’s equity, could adversely affect the prevailing market price of the Company’s securities.
The bulk of AngloGold Ashanti’s ordinary shares are held by a relatively small number of investors. According to information
available to the Company, AngloGold Ashanti’s three largest shareholders beneficially owned approximately 32 percent of
AngloGold Ashanti’s ordinary shares at 31 December 2023. Subject to applicable securities laws, holders of AngloGold Ashanti’s
ordinary shares may decide to sell them at any time. As a result, the market price of the Company’s securities could fall if large
quantities of ordinary shares are sold in the public market, if there is disinvestment by certain types or groupings of investors, or
if there is the perception in the marketplace that such sales could occur.
The market price of the Company’s ordinary shares could also fall as a result of any future offerings AngloGold Ashanti makes of
its ordinary shares, or securities exchangeable or exercisable for the Company’s ordinary shares, or the perception in the
marketplace that these offerings might occur. AngloGold Ashanti may make such offerings, including offerings of additional share
rights or similar securities, at any time or from time to time in the future and such offerings could adversely affect the prevailing
market price of the Company’s securities.
AngloGold Ashanti may not pay dividends or make similar payments to shareholders in the future.
AngloGold Ashanti pays cash dividends only if there are sufficient funds available for that purpose. Fund availability depends
upon many factors, including the amount of cash available, taking into account AngloGold Ashanti’s capital expenditure on
existing infrastructure and exploration and other projects.Under English law, a public company is only entitled to pay a dividend
or otherwise make a distribution to its shareholders: (i) if the company has sufficient distributable reserves (on a standalone
basis) (such distributable reserves demonstrated by reference to a set of accounts drawn to a specific date); (ii) if at the time the
dividend is paid or other distribution is made, the amount of its net assets is not less than the aggregate of its called-up share
capital and non-distributable reserves; and (iii) if and to the extent that the distribution does not reduce the amount of those net
assets to less than such aggregate.
Given these factors, including the capital and investment needs of AngloGold Ashanti, and the board of directors’ discretion to
declare a dividend (including the amount and timing thereof), cash dividends may not be paid in the future.
Certain factors may affect AngloGold Ashanti’s ability to support the carrying amount of its property, plant and
equipment, intangible assets and goodwill on the balance sheet. If the carrying amount of its assets is not recoverable,
AngloGold Ashanti may be required to recognise an impairment charge, which could be significant.
AngloGold Ashanti reviews and tests the carrying amount of its assets when events or changes in circumstances suggest that
the carrying amount may not be recoverable. The Company values individual mining assets at the lowest level for which cash
flows are identifiable and independent of cash flows of other mining assets and liabilities.
If there are indications that impairment may have occurred, AngloGold Ashanti prepares estimates of a recoverable amount for
each group of assets. Expected future cash flows are inherently uncertain and could materially change over time. Recoverable
amounts are significantly affected by Mineral Reserve and production estimates, together with economic factors such as spot
42
and consensus gold prices and currency exchange rates, as well as discount rates and estimates of costs to produce Mineral
Reserve and future capital expenditure. Estimated rehabilitation and closure costs could also materially affect the Company’s
financial performance and could result in the need to recognise an impairment charge.
If any of these uncertainties occur, either alone or in combination, management could be required to recognise an impairment,
which could have a material adverse effect on the Company’s results of operations and financial condition. For example, during
2022, AngloGold Ashanti recognised impairment losses (net of taxation) of $151 million, $57 million and $48 million in respect of
its CdS mine, Cuiabá mine and Serra Grande mine, respectively. During 2023, AngloGold Ashanti recognised further impairment
losses (net of taxation) of $32 million, $17 million and $90 million in respect of its CdS mine, Cuiabá mine and Serra Grande
mine, respectively, as well as impairment losses (net of taxation) of $25 million in respect of the Gramalote project (in which it
sold its entire 50% indirect interest in September 2023).
AngloGold Ashanti does not have full management control over some of its significant joint ventures and other
projects. If the operators of these joint ventures or projects do not manage these effectively and efficiently, the
Company’s investment in these joint ventures or projects could be adversely affected and its reputation could be
harmed.
AngloGold Ashanti’s joint venture at Kibali in the DRC is managed by the Company’s joint venture partner Barrick Gold
Corporation (“Barrick”) following the completion of the merger between Randgold Resources Limited and Barrick in January
2019. In addition, certain of AngloGold Ashanti’s existing or proposed joint ventures and projects could be managed by the
relevant joint venture or project partner. For example, in March 2023, AngloGold Ashanti announced that it intends to form a joint
venture with Gold Fields Limited related to the neighbouring Iduapriem and Tarkwa mines located in Ghana and that if the
proposed joint venture is implemented it will be managed by Gold Fields Limited
As AngloGold Ashanti is not the operator of these non-managed joint ventures or projects, the Company cannot ensure that
these joint ventures or projects are operated, particularly on a day-to-day basis, in compliance with the standards that AngloGold
Ashanti applies to its other operations. If these joint ventures or projects are not operated effectively or efficiently, including as a
result of weaknesses in the policies, procedures and controls implemented by AngloGold Ashanti’s joint venture or project
partners, the Company’s investment in the relevant joint venture or project could be adversely affected. In addition, negative
publicity associated with operations that are ineffective or inefficiently operated, particularly relating to any resulting accidents or
environmental incidents, could harm the Company’s reputation and therefore its prospects and potentially its financial condition.
Furthermore, any failure of joint venture or project partners to meet their obligations to AngloGold Ashanti or to third parties, or
any disputes with respect to the parties’ respective rights and obligations, could have a material adverse impact on AngloGold
Ashanti’s results of operations and financial condition. For example, with respect to the Kibali project in the DRC, AngloGold
Ashanti and Barrick retain equal representation, with neither party holding a deciding vote, on the board of the company that has
overall management control of the joint venture and all major management decisions for this project, including approval of the
budget, require board approval. If a dispute arises between AngloGold Ashanti and Barrick with respect to the Kibali project and
the parties are unable to amicably resolve such dispute, it may be difficult for the parties to make strategic decisions relating to
the project affected by such dispute, the day-to-day operations and the development of such project may be adversely affected
and AngloGold Ashanti may have to participate in proceedings to resolve the dispute, which could adversely affect the
Company’s results of operations and financial condition.
AngloGold Ashanti’s joint venture or project partners may have economic or business interests or goals that are not consistent
with the Company’s or may, as a result of financial or other difficulties, be unable or unwilling to fulfill their obligations under the
joint venture or other project agreements. Disputes between AngloGold Ashanti and its joint venture or project partners may lead
to legal action, including litigation between the Company and its joint venture or project partners. For example, a joint venture or
project partner could decide to sell its shares in the joint venture or project in breach of any pre-emptive rights which the
Company may have under the relevant joint venture or other project agreement. Such disputes could adversely affect the
operation of the joint venture or project, may prevent the realisation of the joint venture’s or project’s goals and could adversely
affect AngloGold Ashanti’s investment in the joint venture or project or harm the Company’s reputation. There is no assurance
that AngloGold Ashanti’s joint venture or project partners will continue their relationship with the Company in the future or that the
Company will be able to achieve its financial or strategic objectives relating to such joint ventures or projects.
Any downgrade of credit ratings assigned to AngloGold Ashanti’s debt securities could increase future interest costs
and adversely affect the availability of new financing.
An actual, anticipated or unexpected negative development of AngloGold Ashanti’s results of operations or cash flows, country
risk, financial metrics, or an increase in its net debt position could result in a deterioration of the Company’s credit ratings.
AngloGold Ashanti’s ratings are influenced inter alia by the location of its domicile and its operations. Furthermore, AngloGold
Ashanti operates in a number of jurisdictions which have a deteriorating credit quality and rating. Any downgrade of AngloGold
Ashanti or any jurisdiction in which the Company has significant operations by any rating agency could increase the Company’s
cost of capital, reduce its investor base and have a material adverse effect on AngloGold Ashanti’s business, results of
operations and financial condition.
43
The level of AngloGold Ashanti’s indebtedness could adversely impact its business.
At 31 December 2023, AngloGold Ashanti had total borrowings of $2.239 billion (2022: $1.983 billion and 2021: $1.909 billion),
excluding all leases. See “Item 18: Financial Statements—Note 22—Borrowings”.
AngloGold Ashanti’s indebtedness could have a material adverse effect on its flexibility to conduct business. For example, the
Company may be required to use a large portion of its cash flow from operations to pay the principal and interest on its debt,
which will reduce funds available to finance existing operations and the development of new organic growth opportunities and
potential acquisitions. In addition, under the terms of the Company’s borrowing facilities from its banks, AngloGold Ashanti is
obliged to meet certain financial and other covenants. AngloGold Ashanti’s ability to continue to meet these covenants and to
service its debt will depend on its future financial performance, which will be affected by its operating performance as well as by
financial and other factors, including in particular the gold price, certain of which are beyond its control.
Should the cash flow from operations be insufficient, AngloGold Ashanti could breach its financial and other covenants. Covenant
breaches, if interpreted as events of default under one or more debt agreements, could allow lenders to accelerate payment of
such debt. Any such acceleration could result in the acceleration of indebtedness under other financial instruments. As a result,
the Company may be required to refinance all or part of the existing debt, use existing cash balances, issue additional equity or
sell assets. However, the Company may be unable to sell assets on reasonable or profitable terms as and when necessary.
Additionally, AngloGold Ashanti cannot be sure that it will be able to refinance its debt on commercially reasonable terms, if at all.
AngloGold Ashanti’s ability to access the bank, public debt or equity capital markets on an efficient basis may be constrained by
dislocation in the credit markets or capital and liquidity constraints in the banking, debt or equity markets at the time of issuance.
For example, the outbreak of the SARS-CoV-2 virus responsible for COVID-19, which reached pandemic proportions, the
geopolitical tensions and war between Russia and Ukraine and the recent inflationary pressures in the world economy led to
disruption and volatility in financial and capital markets. Any prolonged dislocations in financial and capital markets could impact
the Company’s ability to refinance its debt on commercially reasonable terms, if at all, and could as a result have a material
adverse effect on the Company’s funding requirements and overall liquidity.
Any acquisition or acquisitions that AngloGold Ashanti may complete may expose the Company to new geographic,
political, legal, social, operating, financial and geological risks.
AngloGold Ashanti may pursue the acquisition of assets, properties or companies, which may include producing, development as
well as advanced stage exploration assets or properties. Any such acquisition may change the scale of the Company’s business
and operations and may expose it to new geographic, geological, political, social, operating, financial, fiscal, legal, regulatory and
contractual risks as well as jurisdictions which have a deteriorating credit quality and rating. For example, there may be a
significant change in the legal, regulatory and fiscal framework applicable to the Company after it has completed a relevant
transaction; commodity prices may also significantly change after the Company has committed to complete the transaction and
established the purchase price or share exchange ratio; a material ore body may prove below expectations; AngloGold Ashanti
may have more stringent criteria to recognise Mineral Reserve than any acquired business, which may lead to an amount of
Mineral Reserve being recognised by the Company that is lower than the amount determined by such acquired business prior to
the relevant acquisition; AngloGold Ashanti may have difficulty integrating and assimilating the operations and personnel of any
acquired companies, realising anticipated synergies and maximising the financial and strategic position of the combined
enterprise, and maintaining uniform standards, policies and controls; the integration may disrupt the Company’s ongoing
business and its relationships with employees, suppliers and contractors; and the acquisition may divert management’s attention
from AngloGold Ashanti’s day-to-day business. Furthermore, the Company operates and acquires businesses in different
countries, with different regulatory, business and operating cultures, which may exacerbate the risks described in this section. In
addition, the acquired business may have undetected liabilities which may be significant.
In the event that AngloGold Ashanti chooses to raise debt capital to finance any acquisition, its level of indebtedness will be
increased. Should the Company choose to use equity as consideration for an acquisition, existing shareholders may suffer
dilution. Alternatively, the Company may choose to finance any acquisition with its existing cash resources, which could decrease
its ability to fund future capital expenditures and to service its debt.
AngloGold Ashanti may not be successful in overcoming these risks or any other problems encountered in connection with
acquisitions. Failure by AngloGold Ashanti to implement its acquisition strategy or to integrate acquired businesses successfully
could have material adverse effects on its growth, financial performance and results of operations.
The occurrence of events for which AngloGold Ashanti is not insured or for which its insurance is inadequate may
adversely affect cash flows and overall profitability.
AngloGold Ashanti maintains insurance to protect against events which could have a significant adverse effect on its operations
and profitability. This insurance is maintained in amounts that the Company believes to be reasonable depending upon the
circumstances surrounding each identified risk. However, damage and third-party claims arising from catastrophic events may
44
exceed the limit of liability covered under these insurance policies. Furthermore, AngloGold Ashanti’s insurance does not cover
all potential risks associated with its business and may exclude certain parts of its business. For example, there are specific
exclusions for third-party and public liability insurance cover with respect to certain of the Company’s TSFs. AngloGold Ashanti
may elect not to insure certain risks due to the high premia or for various other reasons, including an assessment that the risks
are remote. For example, while AngloGold Ashanti’s insurance programme includes coverage for cyber-related crimes and
incidents as part of the global insurance programme, such coverage is limited due to its relatively high cost and the sophisticated
nature of cyber-crime. AngloGold Ashanti’s insurance coverage also contains customary exclusions for acts of war and terrorism.
In order to reduce or maintain the cost of its insurance programme, AngloGold Ashanti may in some instances retain a portion of
the financial loss associated with an insurable event. These financial losses could be significant and could have an adverse
effect on its financial condition.
Insurance for certain risks in particular, such as loss of title to mineral property, political risks in certain jurisdictions,
environmental pollution, or other hazards resulting from exploration and production, is not generally available to mining
companies on acceptable terms. The availability and cost of insurance coverage can vary considerably from year to year as a
result of events beyond the Company’s control or as a result of previous claims. This can result in higher premia and periodically
being unable to maintain the levels or types of insurance the Company typically carries.
The failure to obtain adequate insurance could impair the Company’s ability to continue to operate in the normal course of its
business. This could adversely impact its cash flows, results of operations and financial condition.
Market Risks
The price of gold, AngloGold Ashanti’s principal product, and other commodity market price fluctuations could
adversely affect the profitability of operations.
AngloGold Ashanti’s revenues are primarily derived from the sale of gold and, to a lesser extent, silver and sulphuric acid. The
market prices for these commodities fluctuate significantly. These fluctuations are caused by numerous factors beyond the
Company’s control. For example, the market price of gold may change for a variety of reasons, including:
•speculative positions taken by investors or traders in gold;
•monetary policies announced or implemented by central banks, including the U.S. Federal Reserve, such as changes in
interest rates;
•changes in the demand for gold as an investment;
•changes in the demand for gold used in jewellery and for other industrial uses, including as a result of prevailing economic
conditions;
•changes in the supply of gold from production, divestment, scrap and hedging;
•financial market expectations regarding interest rates and the rate of inflation;
•the strength of the U.S. dollar (the currency in which gold trades internationally) relative to other currencies;
•actual or anticipated sales or purchases of gold by central banks and the International Monetary Fund (“IMF”);
•gold hedging and unwinding of hedging by gold producers;
•global or regional political or economic events; and
•the cost of gold production in major gold-producing countries.
The market price of gold has been and continues to be significantly volatile. During 2023, the market spot gold price traded
between a low of $1,810 per ounce and a high of $2,077 per ounce. Between 1 January 2024 and 19 April 2024, the market spot
gold price traded between a low of $1,984 per ounce and a high of $2,432 per ounce. On 19 April 2024, the market spot gold
price was $2,400 per ounce. In addition to protracted declines, the price of gold is also often subject to sharp, short-term
changes. For example, the market spot gold price decreased from a high of $1,674 per ounce on 6 March 2020 to a low of
$1,470 per ounce on 19 March 2020 in the midst of a wider market dislocation related to the COVID-19 pandemic and despite
the alleged investor perception of gold as a relatively safe haven in periods of market volatility.
Any sharp or prolonged fluctuations in the price of gold can have a material adverse impact on the Company’s profitability and
financial condition.
In addition, any announcements or proposals by central banks, such as the U.S. Federal Reserve, or any of its board members
or regional presidents or other similar officials in other major economies, may materially and adversely affect the price of gold
and, as a result, AngloGold Ashanti’s financial condition and results of operations.
Events that affect the supply and demand of gold may have an impact on the price of gold. Demand for gold is also significantly
impacted by trends in China and India, which account for the highest gold consumption worldwide. Government policies in these
countries or other large gold-importing countries could adversely affect demand for, and consequently prices of, gold and, as a
result, may adversely affect AngloGold Ashanti’s financial condition and results of operations.
45
Furthermore, the shift in demand from physical gold to gold-related investments and speculative instruments may exacerbate the
volatility of the gold price. Slower consumption of physical gold, resulting from a move toward gold-tracking investments or
otherwise, may have an adverse impact on global demand for, and prices of, gold.
A sustained period of significant gold price volatility may adversely affect the Company’s ability to evaluate the feasibility of
undertaking new capital projects or the continuity of existing operations, to meet its operational targets or to make other long-
term strategic decisions. Lower and more volatile gold prices, together with other factors, have led AngloGold Ashanti in the past
and may lead AngloGold Ashanti in the future to alter its expansion and development strategy and consider ways to align its
asset portfolio to take account of such expectations and trends. As a result, the Company may decide to curtail or temporarily or
permanently shut down certain of its exploration and production operations, which may be difficult and costly to effect. A
sustained decrease in the price of gold could also have a material adverse effect on AngloGold Ashanti’s financial condition and
results of operations, as it may be unable to quickly adjust its cost structure to reflect the reduced gold price environment. Mines
with marginal headroom may be subject to decreases in value that are not temporary, which may result in impairment losses.
See “—Certain factors may affect AngloGold Ashanti’s ability to support the carrying amount of its property, plant and equipment,
intangible assets and goodwill on the balance sheet. If the carrying amount of its assets is not recoverable, AngloGold Ashanti
may be required to recognise an impairment charge, which could be significant”. The market value of gold inventory may be
reduced, and marginal stockpile and heap leach inventories may be written down to net realisable value or may not be
processed further as it may not be economically viable at lower gold prices. In addition, AngloGold Ashanti is obliged to meet
certain financial covenants under the terms of its borrowing facilities and its ability to continue to meet these covenants could be
adversely affected by a further sustained decrease in the price of gold. The use of lower gold prices in Mineral Reserve estimates
or life-of-mine plans from those prices used previously to determine Mineral Reserve or life-of-mine plans could also result in
material impairments of the Company’s investment in mining properties or a reduction in its Mineral Reserve estimates and
corresponding restatements of its Mineral Reserve and increased amortisation, reclamation and closure charges. Whilst, from
time to time, AngloGold Ashanti may enter, and has in the past entered, into gold price hedges on an ad hoc basis on a portion of
its production, the Company does not systematically do so. In addition, even when AngloGold Ashanti enters into gold price
hedges, there is no certainty that such hedges will adequately protect the Company against gold price volatility.
The price of silver has also experienced significant fluctuations in past years. During 2023, the silver price varied between a low
of $20 per ounce and a high of $26 per ounce. On 19 April 2024, the price of silver was $29 per ounce.
Factors affecting the price of silver include investor demand, physical demand for silver bars, industrial and retail off-take, and
silver coin minting.
If revenue from sales of gold, silver or sulphuric acid falls below their respective cost of production for an extended period,
AngloGold Ashanti may experience losses and curtail or suspend some or all of its exploration projects and existing operations or
sell underperforming assets. Declining commodities prices, including gold, copper and silver, may also force a reassessment of
the feasibility of a particular project or projects, which could cause substantial delays or interrupt operations until the
reassessment can be completed.
Foreign exchange fluctuations could have a material adverse effect on AngloGold Ashanti’s results of operations and
financial condition.
Gold is principally a U.S. dollar-priced commodity and most of AngloGold Ashanti’s revenues are realised in, or linked to, U.S.
dollars, whilst cost of sales are partly incurred in the local currency where the relevant operation is located. Given AngloGold
Ashanti’s global operations and local foreign exchange regulations, some of its funds are held in local currencies, such as the
Brazilian real, Argentinean peso, Australian dollar, Ghanaian cedi and the South African rand. The weakness of the U.S. dollar
against local currencies results in higher cost of sales and other costs in U.S. dollar terms. Conversely, the strengthening of the
U.S. dollar lowers local cost of sales and other costs in U.S. dollar terms.
Exchange rate movements may have a material impact on AngloGold Ashanti’s operating results. For example, based on
average exchange rates in 2023, the Company estimates that a one percent strengthening of all of the Brazilian real,
Argentinean peso, Australian dollar, Ghanaian cedi and the South African rand against the U.S. dollar, other factors remaining
equal, would have resulted in an increase in cost of sales and total cash costs per ounce of approximately $17 million and $7 per
ounce, respectively. As a result of the sale of its remaining South African operations as well as its recent corporate
redomiciliation, AngloGold Ashanti’s exposure to fluctuations in the strength of the South African rand has been reduced.
The profitability of mining companies’ operations and the cash flows generated by these operations are significantly
affected by fluctuations in input production prices, many of which are linked to the prices of oil and steel.
Fuel, energy and consumables, including diesel, heavy fuel oil, chemical reagents, explosives, tyres, steel and mining equipment
used or consumed in mining operations form a significant part of the operating costs and capital expenditure of any mining
company.
46
AngloGold Ashanti has no influence over the cost of these consumables, many of which are linked to some degree to the price of
oil and steel. Whilst, from time to time, AngloGold Ashanti may implement, and has in the past implemented, financial derivatives
intended to reduce exposure to changes in the oil price, such input cost protection strategies may not always be successful, and
any of the Company’s diesel consumption not covered by these derivatives will continue to be subject to market fluctuations.
The price of oil has fluctuated between $71 and $99 per barrel of Brent Crude oil in 2023. During the year, as a result of
geopolitical tensions, such as the war between Russia and Ukraine, and the more recent conflict in the Middle East, the oil price
has been volatile. As of 19 April 2024, the price of oil was at $87 per barrel of Brent Crude oil.
AngloGold Ashanti estimates that for each $5.00 per barrel rise or fall in the oil price, other factors remaining equal and excluding
the effect of any oil hedging arrangements entered into by the Company, cost of sales and total cash costs per ounce of all its
operations change by approximately $3 million or $1.30 per ounce, respectively. During July 2022, AngloGold Ashanti entered
into forward contracts for a total of 999,000 barrels of Brent Crude oil for the period from January 2023 to December 2023 that
would be cash settled on a monthly basis against the contract price. This comprised approximately 40 percent of the Company’s
total anticipated 2023 consumption. The average price achieved on the forward contracts was $89.20 per barrel of Brent Crude
oil. For the year ended 31 December 2023, AngloGold Ashanti recorded a realised loss of $7 million and a reversal of the prior
year unrealised loss of $6 million in respect of these oil derivatives. There were no open contracts at the end of December 2023.
The cost of sales and total cash costs per ounce of certain of the Company’s mines, particularly Siguiri, Geita, Iduapriem and
Tropicana, which are more dependent on fuel, are most sensitive to changes in the price of oil. Even when fuel prices are in
decline, expected savings may be partly offset by increases in governments’ fixed fuel levies or the introduction of new levies.
Furthermore, the price of steel has also been volatile. Steel is used in the manufacture of most forms of fixed and mobile mining
equipment, which is a relatively large contributor to the operating costs and capital expenditure of a mine. The price of steel has
fluctuated between a low of $660 and a high of $1,180 per tonne in 2023. On 19 April 2024, the price of flat hot rolled coil (North
American Domestic FOB) was $843 per tonne.
Fluctuations in oil and steel prices have a significant impact on operating costs and capital expenditure estimates and, in the
absence of other economic fluctuations, could result in significant changes in the total expenditure estimates for new mining
projects or render certain projects non-viable, which could have a material adverse impact on the Company’s results of
operations and financial condition.
Fluctuations in the exchange rate of currencies may reduce the market value of AngloGold Ashanti’s securities, as well
as the market value of any dividends or distributions paid by the Company.
AngloGold Ashanti will declare dividends and other distributions, if any, in U.S. dollars. As a result, exchange rate movements
affect the British pound, the South African rand and the Ghanaian cedi value of these dividends, as well as of any other
distributions paid by the relevant depositary to holders of the Company’s securities. Moreover, since the Company’s securities
are denominated in U.S. dollars, and any dividends to be paid in respect of them are expected to be declared in U.S. dollars, an
investment in the Company’s securities by a person whose principal currency is not the U.S. dollar likely exposes the
shareholder or investor to foreign currency risk.
Furthermore, unless the rights attaching to or terms of issue of the relevant shares say otherwise, the Company’s articles of
association allow for dividends and any other money payable in respect of a share to be paid in any currency at the discretion of
the board of directors using an exchange rate selected by the directors for any currency conversions required. If, and to the
extent that, AngloGold Ashanti opts to declare dividends and distributions in any currency other than U.S. dollars, exchange rate
movements will affect the U.S. dollar value of such dividends or distributions. This may reduce the value of the Company’s
securities to investors. Additionally, the market value of AngloGold Ashanti’s securities as expressed in Ghanaian cedis, U.S.
dollars and South African rands will fluctuate in part as a result of foreign exchange fluctuations.
Global political and economic conditions could adversely affect the profitability of operations.
AngloGold Ashanti’s operations and performance depend significantly on worldwide economic conditions. Despite signs of
economic recovery in certain geographic markets, global economic conditions remain fragile with significant uncertainty
regarding recovery prospects, levels of recovery and long-term economic growth effects.
Disruptions to international credit markets and financial systems have caused in the past, and may cause in the future, a loss of
investor confidence resulting in widening credit spreads, a lack of price transparency, increased credit losses and tighter credit
conditions. Any economic recovery may remain limited in geographic scope. A significant risk also remains that this recovery
could be slow or that the global economy could quickly fall back into an even deeper and longer lasting recession or even a
depression.
Global economic turmoil, or the expectation that economic turmoil could worsen, could have follow-on effects on AngloGold
Ashanti’s business that include inflationary cost pressures, interest rate fluctuations and commodity market fluctuations. The
COVID-19 pandemic resulted in disruption and volatility in global financial markets and capital markets and a significant
47
decrease in global economic activity, which had an adverse effect on worldwide demand for gold and adversely affected the
profitability of the Company’s operations. Further deterioration in economic conditions, as a result of a pandemic or otherwise,
could lead to a further or prolonged decline in demand for gold and negatively impact AngloGold Ashanti’s business, and any
such negative impact may be material. See also “—The prevalence of occupational health diseases and other diseases and the
potential costs and liabilities related thereto may have an adverse effect on the business and results of operations of AngloGold
Ashanti”.
Furthermore, the geopolitical tensions and war between Russia and Ukraine and the retaliatory measures that have been taken,
and could be taken in the future, by the United States, the European Union (“EU”), the United Kingdom, NATO and other
jurisdictions, as well as the more recent conflict in the Middle East, have created global security concerns that could result in a
regional or global conflict and otherwise have a lasting impact on regional and global economies, any or all of which could
adversely affect AngloGold Ashanti’s business.
Other factors that could negatively affect AngloGold Ashanti’s financial results and results of operations include, for example:
•the insolvency of key suppliers or contractors, which could result in contractual breaches and a supply chain breakdown;
•the insolvency of one or more joint venture partners, which could result in contractual breaches and disruptions at the
operations of the Company’s joint ventures;
•changes in other income and expense, which could vary materially from expectations, depending on gains or losses realised
on the sale or exchange of financial instruments and impairment charges that may be incurred with respect to investments;
•a reduction in the availability of credit, which may make it more difficult for the Company to obtain financing for its operations
and capital expenditures or make that financing more costly;
•exposure to the liquidity and insolvency risks of the Company’s lenders and customers; and
•impairment of the carrying value of operations in AngloGold Ashanti’s financial statements.
In addition to the potentially adverse impact on the profitability of the Company’s operations, any deterioration in or increased
uncertainty regarding global economic conditions may increase volatility or negatively impact the market value of AngloGold
Ashanti’s securities.
Energy cost increases and power fluctuations and stoppages could adversely impact the AngloGold Ashanti’s results
of operations and financial condition.
Increasing global demand for energy, concerns about nuclear power and the limited growth of new supply are impacting the price
and supply of energy. The transition of emerging markets to higher energy consumption, actual and proposed pricing or taxation
of GHG emissions, the war between Russia and Ukraine as well as the more recent conflict in the Middle East, among other
factors, could result in increased demand or constrained supply and sharply escalating oil and energy prices. For example, in
Colombia, over the past five years there has been a significant increase in power costs due to supply constraints. Additionally,
the hostilities between Russia and Ukraine triggered the imposition of various sanctions by the United States, the EU, the United
Kingdom and other jurisdictions against Russia. These and any additional sanctions or export controls, as well as
countermeasures taken by Russia or other jurisdictions, led to a sharp increase in oil and energy prices, given Russia’s role as a
major global exporter of crude oil and natural gas, which adversely impacted the Company’s results of operations and financial
condition. This risk will be further exacerbated if the oil and energy prices return to such an elevated level or increase further.
Electricity sourced from fossil fuel based generation is currently used for most of AngloGold Ashanti’s business and safety-critical
operations, including cooling, hoisting and dewatering. Loss of power can therefore impact production and employee safety, and
prolonged outages could lead to flooding of workings and ore sterilisation. AngloGold Ashanti’s mining operations are
substantially dependent upon a mix of electrical power generated by local power utilities and by own power generation plants
situated at some of its operations. The unreliability of local power utilities in some of the countries in which AngloGold Ashanti
operates could have a material adverse effect on the Company’s operations, as large amounts of power are required for
ventilation, exploration, development, extraction, processing and other mining activities on the Company’s properties. For
example, in Tanzania, government policies put increased pressure on companies to utilise the national grid, which could
adversely impact the Company’s mining operations in the country due to potential power quality issues.
Certain of AngloGold Ashanti’s mining operations depend on supplies of fuel delivered by road which have been disrupted in the
past and may be disrupted again in the future. Any such disruptions could negatively impact operating costs and cash flows from
these operations. For example, in December 2023, Guinea’s fuel supply distribution within the country was impacted due to an
oil terminal blast that damaged fuel tanks and pipelines at the main oil terminal handling fuel imports, creating widespread
shortages of fuel in the country.
Inflation may have a material adverse effect on results of operations.
Many of AngloGold Ashanti’s operations are located in countries that have experienced high rates of inflation during certain
periods and inflationary pressures have been exacerbated by geopolitical tensions and supply constraints resulting in increases
in energy and other input commodity costs. It is possible that significantly higher future inflation in the countries in which the
Company operates may result in an increase in operational costs in local currencies (without a concurrent devaluation of the
local currency of operations against the U.S. dollar or an increase in the U.S. dollar price of gold). This could have a material
48
adverse effect on the Company’s results of operations and financial condition. Significantly higher and sustained inflation, with a
consequent increase in operational costs, could result in the rationalisation (including closure) of higher-cost mines or projects.
Furthermore, when inflation reaches highly inflationary levels in a country in which the Company operates, social unrest and
union activity may increase, which in turn may have an adverse effect on AngloGold Ashanti’s operational costs and results of
operation in that country.
Of particular concern is the increasing inflation rate in Argentina which was recorded at 193 percent in 2023, 95 percent in 2022,
51 percent in 2021, 36 percent in 2020, and 54 percent in 2019. Hyper-inflationary reporting will be reflected in the financial
statements of the Company’s local subsidiaries. However, hyper-inflationary movements are not reflected in the Group’s
consolidated financial statements as AngloGold Ashanti’s local Argentinean subsidiary is deemed to have a U.S. dollar functional
currency.
Other Regulatory and Legal Risks
Failure to comply with laws, regulations, standards and contractual obligations, breaches in governance processes or
fraud, bribery and corruption may lead to regulatory penalties, loss of licences or permits, negative effects on
AngloGold Ashanti’s reported financial results, and adversely affect its reputation.
AngloGold Ashanti’s operations must comply with the U.S. Foreign Corrupt Practices Act, the UK Bribery Act and similar anti-
corruption and anti-bribery laws of the jurisdictions in which AngloGold Ashanti operates. There has been a substantial increase
in the global enforcement of these laws and an increased focus on the actions of mining companies. Any violation of such laws
could result in significant criminal or civil sanctions. Conversely, in certain circumstances, strict compliance with anti-bribery laws
may conflict with certain local customs and practices. Since AngloGold Ashanti operates globally in multiple jurisdictions,
including those with less developed political and regulatory environments, and within numerous and complex frameworks, its
governance and compliance processes may not prevent potential breaches of law, accounting principles or other governance or
customary practices.
AngloGold Ashanti’s Code of Business Principles and Ethics, Business Integrity Group Policy and Anti-Bribery and Anti-
Corruption Group Standard, among other policies, standards and guidance, and training thereon may not prevent instances of
unethical or unlawful behaviour, including bribery or corruption. They also may not guarantee compliance with legal and
regulatory requirements and may fail to enable management to detect breaches of such requirements.
Sanctions for failure by the Company or others acting on its behalf to comply with these laws, regulations, standards and
contractual obligations could include fines, penalties, resignation or removal of officers, imprisonment of officers, litigation, and
loss of operating licences or permits, suspensions of operations and negative effects on AngloGold Ashanti’s reported financial
results and may damage its reputation. Such sanctions could have a material adverse impact on the Company’s financial
condition and results of operations.
AngloGold Ashanti is subject to the risk of litigation, the causes and costs of which are uncertain.
AngloGold Ashanti is subject to litigation, arbitration and other legal proceedings arising in the normal course of business and
may be involved in disputes that may result in litigation. The causes of potential future litigation cannot be known and may arise
from, among other things, business activities, environmental, health and safety concerns, share price volatility or failure to
comply with disclosure obligations. The results of litigation cannot be predicted with certainty but could include costly damage
awards or settlements, fines, and the loss of licences, concessions, or rights, among other things. See “Item 8A: Legal
Proceedings”.
In the event of a dispute, AngloGold Ashanti may not be successful in establishing the jurisdiction of the courts in England and
Wales and/or may be subject to the jurisdiction of courts outside of England and Wales. An adverse or arbitrary decision of a
foreign court could have a material adverse impact on AngloGold Ashanti’s financial performance, cash flow and results of
operation.
For example, in Colombia, AngloGold Ashanti is involved in a consolidated class action lawsuit in relation to its La Colosa project
seeking to stop the Company from conducting exploration, development and mining activities in certain areas, in which this
exploration project is located, due to environmental concerns. See “Item 8A: Legal Proceedings—Colombia”.
Should AngloGold Ashanti be unable to resolve disputes favourably or to enforce its rights, this may have a material adverse
impact on its financial performance, cash flow and results of operations.
Compliance with “conflict minerals” and “responsible gold” legislation and standards could result in significant costs.
Stringent standards relating to “conflict minerals” and “responsible” gold including, but not limited to, the U.S. Dodd-Frank Act,
the EU Regulation 2017/821 on supply chain due diligence obligations for EU importers of gold originating from conflict-affected
and high-risk areas, the OECD Due Diligence Guidelines for Responsible Supply Chains of Minerals from Conflict-Affected and
49
High-Risk Areas, the World Gold Council Conflict-Free Gold Standard and the London Bullion Market Association Responsible
Gold Guidance have been introduced. Any such legislation and standards may result in significant costs to ensure and
demonstrate compliance (particularly where standards change rapidly or lack certainty due to court challenges) and may
complicate the sale of gold emanating from certain areas. The complexities of the gold supply chain, especially as they relate to
“scrap” or recycled gold, and the fragmented and often unregulated supply of artisanal and small-scale mined gold are such that
there may be significant uncertainties at each stage in the chain as to the provenance of the gold. As a result of the uncertainties
in the process, the costs of due diligence and audit, or the reputational risks of defining their product or a constituent part as
containing a “conflict mineral” may be too burdensome for the Company’s customers. Accordingly, manufacturers may decide to
switch supply sources or to substitute gold with other minerals not covered by the initiatives. This could have a material negative
impact on the gold industry, including on AngloGold Ashanti’s results of operations and financial condition.
AngloGold Ashanti’s operations are subject to various climate change-related physical risks which may adversely
impact its production activities, mine sites and personnel and/or result in resource shortages or environmental
damages.
AngloGold Ashanti’s operations are exposed to a number of physical risks resulting from climate change, such as changes in
rainfall rates or patterns leading to increased water stress or floods, rising sea levels, higher temperatures, fires and severe
weather events such as tropical cyclones. These events or conditions could disrupt the Company’s mining, transport and supply
chain operations, mineral processing and environmental rehabilitation efforts, create resource or energy shortages, damage the
Company’s property or equipment and increase on-site health and safety risks due to, for example, erosion and geotechnical
instability. For example, in January 2022, the state of Minas Gerais in Brazil was impacted by heavy rains, which resulted in 145
municipalities declaring an emergency. Thousands of people were forced out of their homes and evacuated from the affected
areas, and more than 120 roads were blocked. The impacts were particularly severe in several of the cities where AngloGold
Ashanti operates and where its employees reside, which resulted in the operations at Córrego do Sítio being temporarily partially
stopped. Extreme rainfall events are also an increasingly significant risk for AngloGold Ashanti’s Australian operations. For
example, in March 2024, significant rains, and subsequent flooding in the area where the Tropicana mine is located, resulted in
the temporary suspension of mining and processing operations. The 370-kilometer-long Tropicana access road, which is used to
transport supplies of fuel, consumables and reagents to the site, was closed for approximately three and a half weeks due to
flooding in several areas. When reagent supplies were exhausted the processing plant was taken offline for approximately one
week. Open pit mining was suspended for approximately three weeks, and underground mining was suspended for six days. A
significant increase in rainfall also has the potential to adversely impact normal TSF operating procedures, as well AngloGold
Ashanti’s ability to operate processing plants in the event it is unable to discharge process water due to insufficient capacity in
the receiving TSF pool. In contrast, increasing water stress at some of AngloGold Ashanti’s operations in Africa could in the
future, negatively impact the Company’s ability to successfully implement its environmental rehabilitation programmes and/or to
suppress dust from its operations. These events or conditions also could have adverse effects on AngloGold Ashanti’s workforce
and on the communities around its mines, such as an increased risk of food insecurity, drinking water scarcity, access to power
and prevalence of disease.
In 2020, AngloGold Ashanti completed climate change-related physical risk assessments for all of its operated assets as well as
the Quebradona project. While the assessments indicated that many of the identified physical climate risks were already included
in the risk management strategy for these sites, AngloGold Ashanti may not have identified all potential risks or all the potential
impacts of such risks. Events or conditions that are catastrophic, or are otherwise not adequately addressed by AngloGold
Ashanti’s adaptation and risk management strategies, could have a material adverse effect on its production activities, assets,
results of operations and financial condition.
Compliance with emerging climate change-related requirements, including stricter regulations and the potential
imposition of carbon taxes or greenhouse gas (“GHG”) emissions cap-and-trade schemes or the elimination of related
subsidies, could result in significant additional costs and expose AngloGold Ashanti to additional liabilities.
GHGs are emitted directly by AngloGold Ashanti’s operations as well as by external utilities from which AngloGold Ashanti
purchases electricity. As a result of commitments made at the UN Climate Change Conference in Durban, South Africa in
December 2011, certain members of the international community negotiated a treaty at the Conference of the Parties of the UN
Framework Convention on Climate Change in Paris in December 2015 (the “Paris Agreement”). The Paris Agreement, which
came into force in November 2016, requires countries that are signatories to the Paris Agreement to set targets for GHG
emissions reductions. In order to meet national reduction commitments, including a goal of “net zero” GHG emissions or carbon
neutrality by 2050 set by numerous jurisdictions, it is likely that various countries will implement or adopt additional measures
addressing GHG emissions, including stricter GHG emissions limits and/or some form of carbon pricing, in the future. In 2021,
AngloGold Ashanti committed to the International Council on Mining & Metals (“ICMM”) target of achieving net zero Scope 1 and
Scope 2 GHG emissions by 2050. Additionally, in partnership with value chain partners, AngloGold Ashanti expects to continue to
work on Scope 3 GHG emissions accounting and to explore opportunities, where feasible, to address Scope 3 GHG emissions
consistent with its commitment, as a member of the ICMM, to set Scope 3 GHG emissions reduction targets. In 2022, AngloGold
Ashanti announced a 2030 reduction target to achieve a 30% absolute reduction in its Scope 1 and 2 GHG emissions, as
compared to 2021 GHG emissions, through a combination of renewable energy projects, fleet electrification and lower-emission
power sources, the capital cost for which is currently anticipated to be approximately $1.1 billion (of which $350 million is
expected to be funded over that period by AngloGold Ashanti and the remaining $750 million through third-party funding,
including from providers of renewable energy infrastructure).
50
Carbon pricing refers to various initiatives that seek to internalise the social or environmental cost of carbon on industries by
imposing taxes, cap-and-trade schemes and/or elimination of free credits for GHG emissions. As governments continue to set
aggressive decarbonisation targets to meet the commitments made as a result of the Paris Agreement, carbon pricing systems
have been and are likely to continue to be implemented in jurisdictions where AngloGold Ashanti operates including, for example,
Australia’s Safeguard Mechanism and Ghana’s Emissions Levy Act. Such measures could require AngloGold Ashanti to reduce
its direct GHG emissions or energy use or to incur significant costs for GHG emissions allowances or taxes, including as a result
of costs or taxes passed on by electricity utilities which supply the Company’s operations. AngloGold Ashanti could also incur
significant costs associated with capital equipment to reduce GHG emissions, as well as GHG monitoring and reporting and
other obligations to comply with applicable requirements. Such measures could drive up the costs of capital goods, energy and
other utility costs that are critical inputs to the Company’s mining operations. Certain countries, including Australia and Brazil,
have passed or are considering GHG trading or tax schemes and/or other regulation of GHG emissions, although the precise
impact on AngloGold Ashanti’s operations cannot yet be determined.
AngloGold Ashanti’s ability to implement changes to decarbonise its operations varies across its portfolio. In regions which
currently rely more on fossil fuels for energy, such as the Company’s mines in Australia and Tanzania, mandated GHG reductions
and/or carbon pricing measures could have a material adverse effect on AngloGold Ashanti’s production activities, results of
operations and financial condition. See also “Item 4B: Business Overview—Sustainability and Environmental, Social and
Governance (“ESG”) Matters”.
Additionally, a number of regulators are adopting or considering new environmental disclosure rules. For example, in March
2024, the U.S. Securities and Exchange Commission (“SEC”) adopted final rules under SEC Release No.34-99678 and No.
33-11275, The Enhancement and Standardization of Climate-Related Disclosures for Investors (the “Final Rules”), which will
require registrants to provide certain climate-related information in their registration statements and annual reports. While the
SEC stayed the effectiveness of the Final Rules in April 2024 and it is uncertain if or when compliance will be mandated, a
number of other jurisdictions are also mandating disclosure of climate-related risks and effects. These recently enacted and
proposed regulations may impose meaningful costs and demand significant attention from management, all of which could affect
AngloGold Ashanti’s business and our results of operations.
While AngloGold Ashanti believes that gold’s well-demonstrated roles as a risk hedge and portfolio diversifier will continue to
support investment demand for gold, even in an environment of uncertainty and heightened market volatility from climate change
and the transition to a lower-carbon global economy, a sustained economic downturn or disruptions in certain industrial sectors
where gold is integral to manufacturing, including electronic devices such as phones, computers and global positioning systems
as well as jewellery, could reduce the demand for its product and, consequently, have an adverse impact on its production,
financial condition and results of operations.
Increasing scrutiny and changing expectations from AngloGold Ashanti’s stakeholders, including communities,
governments and NGOs as well as investors, lenders and other market participants, with respect to AngloGold
Ashanti’s ESG performance and policies may impact AngloGold Ashanti’s reputation, result in additional costs to meet
the expectations of stakeholders, hinder access to capital or expose AngloGold Ashanti to additional risks, including
disinvestment and litigation.
Companies across all industries are facing increasing scrutiny related to ESG issues, including their internal ESG policies and
governance practices. Investor advocacy groups, certain institutional investors, investment funds, lenders and other market
participants are increasingly focused on ESG-related matters and in recent years have placed increasing importance on the
environmental and social costs and impact of their investments. The increased focus and activism related to ESG and similar
matters may hinder access to capital, as investors and lenders may decide to reallocate capital or to not commit capital as a
result of their assessment of a company’s ESG practices. In addition, host communities, as well as certain governmental and
non-governmental actors, are increasingly focused on a company’s ability to operate in a sustainable manner and to mitigate
related risks, as well as the public commitments and quantitative metrics used to demonstrate performance and track progress.
For AngloGold Ashanti, this includes, in particular, the safe operation of its mines, mitigating its impact to local environments and
communities affected by its operations and reducing GHG emissions in line with the Company’s voluntary commitments. If
AngloGold Ashanti’s performance fails, or is perceived to fail, to meet internal or adopted external ESG standards, or AngloGold
Ashanti otherwise fails to satisfy stakeholder expectations with respect to its commitments and performance, regardless of
whether there is a legal requirement to do so, such failure could result in reputational damage to and litigation against the
Company and its business, financial condition, and/or stock price could be materially and adversely affected.
In particular, AngloGold Ashanti faces increasing pressures from stakeholders, who are increasingly focused on climate change,
to prioritise energy efficiency in its operations, reduce its carbon footprint and improve water and other resource consumption, as
well as to be transparent about how climate-related risks and opportunities are managed throughout the supply chain to foster
and promote business resiliency, accountability and stakeholder value. AngloGold Ashanti has implemented numerous initiatives
to reduce its GHG emissions by installing new technology, such as heat pumps and underground cooling and water treatment
systems, reducing power consumption and improving energy efficiency. AngloGold Ashanti has also made certain voluntary
commitments to take future actions, including to achieve net zero Scope 1 and 2 GHG emissions by 2050, and to achieve a 30%
absolute reduction in Scope 1 and 2 GHG emissions by 2030 (as compared to a 2021 baseline). Additionally, in partnership with
value chain partners, AngloGold Ashanti expects to continue to work on Scope 3 GHG emissions accounting and to explore
opportunities, where feasible, to address Scope 3 GHG emissions consistent with its commitment, as a member of the ICMM, to
51
set Scope 3 GHG emissions reduction targets. AngloGold Ashanti continues to enhance its governance around climate-related
risks and opportunities, including implementing the action plans of its Climate Change Strategy, which was approved by its board
in November 2021. Nevertheless, AngloGold Ashanti may be required to implement even more stringent ESG practices or
standards to meet the expectations of existing and future stakeholders and, if the Company fails to achieve these objectives or to
adhere to internal or adopted external standards, or is perceived to be insufficiently committed to addressing ESG concerns
across all of its operations and activities, the Company’s reputation and brand image could be damaged, it could lose the trust of
its stakeholders (including governments, NGOs, investors, customers and employees) or be subject to litigation brought by those
stakeholders, and its business, financial condition and results of operations could be adversely impacted.
In January 2024, along with other ICMM member companies, AngloGold Ashanti voluntarily committed to a new Nature Position
Statement containing five overarching objectives that support a nature positive future by 2030, expanding on the previous
existing ICMM biodiversity commitments. Pursuit of the new commitments are expected to be spread over the operational life of
operations and may require material investment of resources, including financial, specialist and technological resources. Failure
to achieve these commitments, whether actual or as perceived by the Company’s stakeholders, may pose reputational and
disinvestment risks to the Company.
Transfers of AngloGold Ashanti ordinary shares may be subject to stamp duty or SDRT in the United Kingdom, which
would increase the cost of dealing in AngloGold Ashanti ordinary shares.
Stamp duty and/or stamp duty reserve tax (“SDRT”) are generally imposed in the United Kingdom on certain transfers of
chargeable securities (which include shares in companies incorporated in the United Kingdom) at a rate of 0.5 percent of the
consideration paid for the transfer. Certain transfers of shares (a) to, or to a nominee or an agent for, a person whose business is
or includes the provision of clearance services (including DTC or its nominees) (a “Clearance Service”); or (b) to, or to a nominee
or an agent for, a person whose business is or includes issuing depositary receipts (a “Depositary Receipt System”), are charged
at a higher rate of 1.5 percent.
Pursuant to arrangements that AngloGold Ashanti has entered into with DTC, AngloGold Ashanti ordinary shares are currently
eligible to be held in book-entry form through the facilities of DTC. Based on the Company’s understanding that DTC has not
made an election under section 97A(1) of the UK Finance Act 1986, transfers of AngloGold Ashanti ordinary shares held in book-
entry form through DTC should not attract a charge to UK stamp duty or SDRT.
A transfer of AngloGold Ashanti ordinary shares (a) from within the DTC system out of DTC, (b) on sale of the AngloGold Ashanti
ordinary shares outside of DTC, or (c) in connection with a redeposit of AngloGold Ashanti ordinary shares into DTC, may be
liable to UK stamp duty or SDRT. See “Item 10E: Taxation—United Kingdom Taxation—UK Tax Consequences of Holding
AngloGold Ashanti’s Ordinary Shares”.
It is possible that the United Kingdom may amend its laws applicable to UK stamp duty or SDRT, or enact new laws in this field,
which could have a material adverse effect on the cost of trading in, or issuing, AngloGold Ashanti ordinary shares.
AngloGold Ashanti’s inability to maintain effective disclosure controls and procedures and an effective system of
internal control over financial reporting can be expected to negatively impact its ability to accurately and timely report
its financial results and other material disclosures or otherwise cause it to fail to meet its reporting obligations, which
could have a material adverse effect on its operations, investor confidence in its business and the reliability of its
financial statements, and the trading price of AngloGold Ashanti’s ordinary shares.
Internal control over financial reporting is a process designed to provide reasonable assurance regarding the reliability of
financial reporting and the preparation of AngloGold Ashanti’s financial statements for external purposes in accordance with IFRS
Accounting Standards as issued by the International Accounting Standards Board (“IASB”). Disclosure controls and procedures
are designed to ensure that information required to be disclosed by a company in reports that it files or submits under the U.S.
Securities Exchange Act of 1934, as amended (the “Exchange Act”) is recorded, processed, summarised and reported within the
time periods specified in the rules and forms of the SEC. These disclosure controls and procedures include without limitation,
controls and procedures designed to ensure that information required to be disclosed by the Company in reports that it files or
submits under the Exchange Act is accumulated and communicated to the Company’s management, including its chief executive
officer and chief financial officer, as appropriate to allow timely decisions regarding disclosure. See “Item 15: Controls and
Procedures”.
The Company has identified material weaknesses that caused its disclosure controls and procedures and its internal control over
financial reporting to be ineffective as of 31 December 2023. Because one of the material weaknesses also existed as of 31
December 2022, the Company also determined that its disclosure controls and procedures and its internal control over financial
reporting were not effective as of 31 December 2022. This particular material weakness also led to a restatement of the
Company’s consolidated financial statements for the financial year ended 31 December 2022 included in this annual report on
Form 20-F as described in “Item 18: Financial Statements—Note 1—Statement of Compliance—1.3 Restatements—1.3.2 Prior
period error in the calculation of a net deferred tax asset with respect to the Obuasi mine and other restatements”.
52
As of the date of this annual report on Form 20-F, the identified material weaknesses have not been remediated and accordingly
the Company’s disclosure controls and procedures and its internal control over financial reporting remain ineffective. The
Company’s management is actively engaged in the planning for, and implementation of, remediation efforts to address the
material weaknesses but there can be no assurance those efforts will be successful. Additionally, the Company has incurred and
expects to continue to incur additional expenses and to spend significant management time and resources in complying with
testing requirements and working to establish effective disclosure controls and procedures and internal control over financial
reporting.
A material weakness is a deficiency, or a combination of deficiencies, in internal control over financial reporting such that there is
a reasonable possibility that a material misstatement of a company’s annual or interim financial statements will not be prevented
or detected on a timely basis. As such, if the Company does not remediate this material weaknesses in a timely manner, or if
additional material weaknesses are discovered, they may adversely affect the Company’s ability to record, process, summarise
and report financial information timely and accurately and, as a result, the Company’s financial statements may contain material
misstatements or omissions. Additionally, the Company’s internal control environment and remediation efforts do not provide
absolute assurance with regard to timely detection or prevention of control deficiencies and thus do not insulate the Company
from the possibility of future failures to meet its financial reporting obligations.
It is possible that additional control deficiencies could be identified by the Company’s management or by its independent
registered public accounting firm in the future or may occur without being identified. Such a failure could require the Company to
again incur the challenges and expenses associated with remediation, result in regulatory scrutiny, investigations, enforcement
actions or litigation, cause investors to lose confidence in the Company’s reported financial condition and have a negative effect
on the trading price of AngloGold Ashanti’s ordinary shares, lead to a default or event of default under the Company’s
indebtedness, reduce the Company’s ability to obtain debt, equity or quasi-equity financing or increase the cost of any such
financing, and otherwise have a material adverse effect on its business, financial condition, results of operations and cash flows.
Breaches in cybersecurity and violations of data protection laws may adversely impact or disrupt AngloGold Ashanti’s
business.
AngloGold Ashanti maintains global information, digital technology and communication networks and applications to support its
business activities. AngloGold Ashanti outsources several digital technology functions and applications to third-party vendors and
these engagements may have an impact on the overall cybersecurity position of the Company. The primary company systems
managed by third-party vendors include, cloud infrastructure, data centre management, server/personal computing support,
enterprise resource planning business applications, email and digital documents and the Cyber Security Operations Centre.
AngloGold Ashanti must continuously monitor the solutions implemented to support its global digital technology and
communication networks and applications to maintain a suitable and well-managed environment. There can be no assurance
that these efforts will always be successful. See “Item 16K: Cybersecurity”.
The sophistication and magnitude of cybersecurity incidents are increasing and include malicious software, ransomware and
other attempts to gain unauthorised access to data and other electronic security and protected information breaches that could
lead to production downtimes, operational delays, safety incidents, the compromising of confidential or otherwise protected
information, destruction or corruption of data, other manipulation or improper use of AngloGold Ashanti’s systems and networks.
Continuous cyber breaches via third-party solutions have also become increasingly frequent.
Digital technology security processes may not prevent future malicious actions, denial-of-service attacks, or fraud, which could
result in the corruption of operating systems, theft of commercially sensitive data, misappropriation of funds and business and
operational disruption. AngloGold Ashanti’s insurance programme includes limited coverage for cyber-related crimes and
incidents as part of the global insurance programme and there can be no assurance that any cybersecurity incident will be
adequately covered by insurance, if at all. Any cybersecurity attacks of breaches could significantly disrupt AngloGold Ashanti's
business operations and cause the Company to suffer financial losses, including the cost of remedial actions, the loss of
business or customers, and reputational harms.
The interpretation and application of consumer and data protection laws in England and Wales, the United States and elsewhere
are evolving. It is possible that these laws may be interpreted and applied in a manner that is inconsistent with AngloGold
Ashanti’s data practices. Complying with these various laws is essential and could cause the Company to incur substantial costs
or require it to change its business practices in a manner adverse to its business. For example, the penalties for failure to comply
with the South African Protection of Personal Information Act, No. 4 of 2013 (“POPIA”) are severe and may include an
administrative fine of up to R10 million or imprisonment of up to ten years. Enforcement of the General Data Protection
Regulation (Regulation (EU) 2016/679) (“EU GDPR”) may lead to administrative fines of up to €20 million, or four percent, of a
company’s total worldwide annual turnover of the preceding financial year, whichever is higher. The EU GDPR was implemented
in the law of England and Wales by the European Union (Withdrawal) Act 2018 (the “UK GDPR”), which may require a fine of up
to £17,500,000, or four percent, of the total worldwide annual turnover of the preceding financial year, whichever is higher.
Furthermore, both the EU GDPR and the UK GDPR have a scope that extends beyond the borders of the European Union and
the United Kingdom, respectively, and therefore do not only affect EU or UK operations.
53
U.S. securities laws do not require AngloGold Ashanti to disclose as much information to investors as a U.S. issuer is
required to disclose, and investors may receive less information about the Company than they might otherwise receive
from a comparable U.S. company.
AngloGold Ashanti is currently subject to the periodic reporting requirements of the SEC and the New York Stock Exchange that
apply to “foreign private issuers”. The periodic disclosure required of foreign private issuers under applicable rules is more limited
than the periodic disclosure required of U.S. issuers. Accordingly, there may be less publicly available information concerning
AngloGold Ashanti than there is for U.S. public companies as long as the Company avails itself of the exemptions afforded to
foreign private issuers. For example, AngloGold Ashanti currently has a half-yearly reporting cycle and does not publish reviewed
financial statements and analyses of operating and financial results for the quarters ended 31 March and 30 September of each
year. In addition, AngloGold Ashanti is not required to file or furnish periodic reports and financial statements with the SEC as
frequently or as promptly as U.S. companies whose securities are registered under the Exchange Act. As a result, investors will
also receive less timely financial reports than they otherwise might receive from a comparable U.S. company or from certain of
the Company’s peers in the industry. This may have an adverse impact on investors’ ability to make decisions about their
investment in AngloGold Ashanti.
54
ITEM 4: INFORMATION ON THE COMPANY
4A.HISTORY AND DEVELOPMENT OF THE COMPANY
GROUP INFORMATION
The Group was initially formed in June 1998 with the consolidation of the gold mining interests of Anglo American plc and it
underwent a business combination with Ashanti Goldfields Company Limited in April 2004.
On 25 September 2023, the Group completed a corporate restructuring whereby its operations were reorganised under a new
parent company, AngloGold Ashanti plc, incorporated in England and Wales and tax resident in the United Kingdom, with a
primary listing of its ordinary shares on the NYSE. Upon completion of the corporate restructuring, AngloGold Ashanti plc
became the listed UK parent company of the Group and the successor issuer to AngloGold Ashanti Limited. The previous South
African parent company of the Group, AngloGold Ashanti Limited, became a direct, wholly-owned subsidiary of AngloGold
Ashanti plc and was renamed AngloGold Ashanti (Pty) Ltd. AngloGold Ashanti Holdings plc, the Isle of Man company holding all
of the Group’s operations and assets located outside South Africa, also became a direct, wholly-owned subsidiary of AngloGold
Ashanti plc.
CURRENT PROFILE
AngloGold Ashanti plc (Registration No. 14654651; LEI No. 2138005YDSA7A82RNU96) was incorporated as a private limited
company under the laws of England and Wales on 10 February 2023 and was re-registered as a public limited company and
changed its name to AngloGold Ashanti plc on 22 June 2023 for the purposes of carrying out the corporate restructuring. On 25
September 2023, upon completion of the corporate restructuring, AngloGold Ashanti plc became the parent company of the
Group. The Company operates under the UK Companies Act 2006, as amended (the “UK Companies Act”).
The Company’s legal and commercial name is AngloGold Ashanti plc. Its registered office is located at 4th Floor, Communications
House, South Street, Staines-upon-Thames, Surrey, TW18 4PR, United Kingdom. The Company’s principal executive office is
located at 4th Floor, Communications House, South Street, Staines-upon-Thames, Surrey, TW18 4PR, United Kingdom. The
general telephone number is +44 (0) 203 968 3320 and the internet address is https://www.anglogoldashanti.com. No material
on the AngloGold Ashanti website forms any part of, or is incorporated by reference into, this annual report on Form 20-F.
References herein to the Company’s website shall not be deemed to cause such incorporation.
Upon completion of the corporate restructuring, the Group’s global headquarters were moved to Denver, Colorado in the United
States (at 6363 S. Fiddlers Green Circle, Suite 1000, Greenwood Village, CO 80111, United States of America), but the
Company’s registered office and principal executive office remain located at 4th Floor, Communications House, South Street,
Staines-upon-Thames, Surrey, TW18 4PR, United Kingdom. AngloGold Ashanti’s agent for service of process in the United
States is AngloGold Ashanti North America Inc., 6363 S. Fiddlers Green Circle, Suite 1000, Greenwood Village, CO 80111,
United States of America.
While AngloGold Ashanti’s primary listing is on the NYSE, the Company also maintains secondary listings on the JSE and A2X in
South Africa and the GSE in Ghana. On 27 June 2023, AngloGold Ashanti voluntarily delisted from the ASX in Australia.
The SEC maintains a public internet site that contains AngloGold Ashanti’s filings with the SEC and reports, proxy and
information statements, and other information regarding issuers that file electronically with the SEC (http://www.sec.gov).
HISTORY AND SIGNIFICANT DEVELOPMENTS
Below are highlights of key corporate activities from 1998:
1998
•Formation of AngloGold Limited through the consolidation of East Rand Gold and Uranium Company Limited; Eastvaal Gold
Holdings Limited; Southvaal Holdings Limited; Free State Consolidated Gold Mines Limited; Elandsrand Gold Mining
Company Limited; H.J. Joel Gold Mining Company Limited and Western Deep Levels Limited into a single, focused,
independent gold mining company. Vaal Reefs Exploration and Mining Company Limited (Vaal Reefs), the vehicle for the
consolidation, changed its name to AngloGold Limited and increased its authorised share capital, effective 30 March 1998.
1998-2004
•Expansion of AngloGold Limited’s operations outside of South Africa.
2004
•Conclusion of the business combination with Ashanti Goldfields Company Limited, at which time the Company changed its
name to AngloGold Ashanti Limited.
55
2007
•Sale by Anglo American plc of 69,100,000 ordinary shares of AngloGold Ashanti, thereby reducing Anglo American’s
shareholding in AngloGold Ashanti from 41.7 percent to 16.6 percent.
2009
•Sale by Anglo American plc of its remaining shareholding in AngloGold Ashanti to Paulson & Co. Inc.
2012
•Acquisition of the remaining 50 percent interest in Serra Grande in Brazil for $215 million.
•Acquisition of 100 percent of First Uranium (Proprietary) Limited for $335 million.
2013
•Commission of two new gold projects — Tropicana and Kibali — in the second half of 2013.
2015
•Sale of the Cripple Creek & Victor gold mine in Colorado, USA for $819 million.
2017
•South Africa region restructured — TauTona mine placed on orderly closure.
2018
•Completion of the sales of the Moab Khotsong and Kopanang mines in South Africa for $300 million and $9 million,
respectively.
2020
•Sale of the remaining South African producing assets and related liabilities to Harmony for $200 million plus deferred
consideration based on future production at the Mponeng mine.
•Completion of the sales of the Sadiola and Morila mines in Mali for cash proceeds of $25 million and $1 million, respectively.
2022
•Acquisition of the remaining 80.5 percent interest in Corvus Gold Inc. (“Corvus Gold”), in Nevada, USA for a cash
consideration of $365 million.
•Acquisition of 100 percent of Coeur Sterling, Inc. (“Coeur Sterling”), in Nevada, USA for a cash consideration of $152 million.
2023
•On 16 March 2023, AngloGold Ashanti and Gold Fields Limited (“Gold Fields”) announced that they have agreed the key
terms of a proposed joint venture in Ghana between Gold Fields' Tarkwa and AngloGold Ashanti's neighbouring Iduapriem
Mines.
•On 25 August 2023, AngloGold Ashanti announced it placed the Córrego do Sítio (CdS) mine in Brazil’s Minas Gerais state
on care and maintenance.
•On 25 September 2023, the Group completed a corporate restructuring whereby its operations were reorganised under a new
parent company, AngloGold Ashanti plc, incorporated in England and Wales and tax resident in the United Kingdom, with a
primary listing of its ordinary shares on the NYSE.
•On 29 September 2023, AngloGold Ashanti completed the sale of its entire 50 percent indirect interest in the Gramalote
Project to B2Gold Corp. for a total consideration of up to $60 million (of which $20 million has been received and the balance
remains dependent on project construction and certain production milestones).
2024 YTD
•On 19 January 2024, AngloGold Ashanti completed its acquisition of an 11.7% interest in G2 Goldfields Inc., a Canadian gold
mining company with exploration properties in Guyana, South America, for a consideration of approximately C$22.1 million.
CAPITAL EXPENDITURE AND DIVESTITURES
For information concerning the Company’s principal capital expenditures currently in progress, including the distribution of these
investments geographically and the method of financing, refer to “Item 4B: Business Overview—AngloGold Ashanti Global
Operations: 2023”, “Item 5A: Operating Results—Comparison of capital expenditure in 2023, 2022 and 2021” and “Item 5B:
Liquidity and Capital Resources”.
For information concerning the Company’s divestitures, including the sale of the entire 50 percent indirect interest in the
Gramalote Project to B2Gold Corp. on 29 September 2023, refer to “Item 5: Operating and Financial Review and Prospects—
Overview”.
56
4B.BUSINESS OVERVIEW
AngloGold Ashanti plc (AngloGold Ashanti) is an independent, global gold mining company with a diverse portfolio of operations,
projects and exploration activities across nine countries on four continents. While gold is our principal product, we also produce
silver (Argentina) and sulphuric acid (Brazil) as by-products. We have projects in Colombia, including the Quebradona mine that
is expected to produce both gold and copper, and in the United States, and we are also continuing exploration activities in the
United States. The Group is headquartered in Denver, Colorado in the United States. The Company’s registered office and
principal executive office are located in the UK. The Group also retains a substantial corporate office in Johannesburg, South
Africa.
PRODUCTS
AngloGold Ashanti’s main product is gold. Once mined, the gold ore is processed into doré (unrefined gold bars) on site and then
dispatched to precious metals refineries for refining to a purity of at least 99.5 percent, in accordance with the standards of ‘good
delivery’ as determined by the London Bullion Market Association (LBMA). This refined gold is then sold directly to bullion banks.
By-products of our gold mining operations, often a function of local geological characteristics, include silver in Argentina and
sulphuric acid in Brazil.
OPERATIONS
We have developed a high-quality, well-diversified asset portfolio, including production from ten operations in seven countries
(Argentina, Australia, Brazil, Ghana, Guinea, the DRC and Tanzania) supported by greenfields projects in the United States and
Colombia along with a focused global exploration programme. Our portfolio comprises long-life, operating assets with differing
ore body types, located in key gold-producing regions around the world.
Our operations and projects are grouped regionally as follows:
•Africa (DRC, Ghana, Guinea and Tanzania);
•Americas (Argentina and Brazil, and projects in the United States and Colombia); and
•Australia (Australia).
EXPLORATION
Our exploration programme is focused on creating significant value for the Company’s stakeholders by providing long-term
optionality and improving the quality of our asset portfolio.
Greenfields and brownfields exploration takes place in both established and new gold-producing regions through managed and
non-managed joint arrangements, strategic alliances and wholly-owned ground holdings. AngloGold Ashanti’s discoveries
include La Colosa and Quebradona (Nuevo Chaquiro) in Colombia and Silicon in Nevada, USA.
GOLD MARKET
According to the World Gold Council (WGC), total gold demand in 2023 (including over-the-counter (OTC) investment) was the
highest on record and saw an annual average market spot gold price of $1,942 per ounce. Demand for gold rose three percent to
4,899 tonnes in 2023 due to significant OTC investment and stock flows. Demand for gold in investment decreased 15 percent,
demand for bars and coin decreased by three percent, technology saw a decline of four percent and jewellery consumption held
steady at 2,093 tonnes even in the very high gold price environment.
Central banks net purchasing in the fourth quarter of 2023 was 229 tonnes with full year buying at 1,037 tonnes.
For more information, see “Item 5A: Operating Results—Introduction”.
57
COMPETITION
As gold mining is a mature and regulated industry, and very significant volumes of gold and gold derivatives trade in the world
markets independent of gold mine supply, AngloGold Ashanti does not consider that competition for sales plays any role in its
operations as a gold producer. For more information on a geographical analysis of gold income by destination, refer to “Item 18:
Financial Statements—Note 2—Segmental Information”.
However, gold producers do compete against each other for acquisition of mining assets, exploration opportunities and human
resources. See “Item 3D: Risk Factors—AngloGold Ashanti faces strong competition and industry consolidation”.
SEASONALITY
Subject to other factors and unforeseen circumstances, in the first quarter gold production is generally lower than gold production
during the rest of the year as a result of the ramp-up of operations after annual holiday production declines.
RAW MATERIALS
AngloGold Ashanti uses chemicals, including cyanide and lime, in the production of gold. These chemicals are available from a
large number of suppliers and do not represent a material portion of the Company’s costs. We are not currently experiencing any
supply shortages on critical consumables utilised in the production of gold across our global operations. In addition, our stocking
strategies account for potential lead time variation and supply constraints, thus minimising the risk of changes in the
marketplace. While commodity pricing is subject to volatility over time, our contractual terms limit future changes. Oil and energy
prices are important costs for the Company’s business. During 2023, as a result of geopolitical tensions, such as the war
between Russia and Ukraine, and the more recent conflict in the Middle East, the oil price has been volatile. The higher cost for
basic commodities used in our host countries and communities, and as key production inputs, could impact the costs of our raw
materials.
STRATEGY
The overall aim of our strategy is to generate sustainable cash flow improvements and returns over the longer term and, in so
doing, to create and preserve value for all our stakeholders.
We have five key strategic focus areas which enable us to deliver on our overall strategy. They guide decision-making and are
aimed at generating increased cash flows; extending mine lives; creating an organic pipeline of economically viable orebodies;
and enhancing our social licence to operate.
Strategic focus areas
AngloGold Ashanti’s five strategic focus areas are set out below:
•Prioritise people, safety, health and sustainability. This strategic focus area embodies our corporate ethos and
encompasses our sustainability performance. It underpins our business strategy and the delivery of sustained, long-term
value creation and is aligned with our values and responsibilities as a corporate citizen. This strategic focus area covers our
employees, their safety, health and wellbeing, the diversity of our employee base, and also our sustainability performance,
which encompasses our social and environmental responsibilities.
•Maintain financial flexibility. We aim to ensure our balance sheet is able to meet our core funding needs.
•Optimise overhead costs and capital expenditure. We aim to optimise efficiencies and cost effectiveness, improve
productivity and ensure that all spending decisions are thoroughly scrutinised and optimally structured.
•Improve portfolio quality. We aim to enhance the quality of our operating portfolio through initiatives such as our Full Asset
Potential (“FP”) review programme to ensure optimal mine performance. We are flexible in delivering on our mine plans,
allowing for optimised results, as we progress our projects to more than replace production with a growing Mineral Reserve
and Mineral Resource base.
•Maintain long-term optionality. As part of focused and responsible management of our Mineral Resource and Mineral
Reserve, our exploration programme and related planning is vital in optimising the operating lives of our portfolio. Through
continued exploration and the acquisition of properties that fit with our business and offer Mineral Reserve potential, we aim
to add to the long-term sustainability of AngloGold Ashanti.
INTELLECTUAL PROPERTY
AngloGold Ashanti, as a group, is not dependent on intellectual property (including patents or licences), industrial, commercial or
financial contracts (including contracts with customers or suppliers) or new manufacturing processes for the conduct of its
business as a whole.
58
THE REGULATORY ENVIRONMENT ENABLING ANGLOGOLD ASHANTI TO MINE
AngloGold Ashanti’s rights to own and develop Mineral Reserve and deposits are governed by the laws and regulations of the
jurisdictions in which these mineral properties are located.
AngloGold Ashanti is subject to a wide range of laws and regulations governing all aspects of its operations, including with
respect to environmental protection, reclamation, exploration, development, production, taxes, immigration, labour standards and
employment issues, occupational health, mine safety, dam safety, toxic substances and wastes, securities and foreign corrupt
practices. AngloGold Ashanti has made, and expects to make in the future, significant expenditures to comply with these laws
and regulations. Non-compliance can result in violations and legal claims, as well as substantial fines, penalties, reputational
damage and delays in or suspension of day-to-day operations. Pending or proposed changes to existing laws and regulations, as
well as any proposed or contemplated new laws or regulations, could also have significant impacts on AngloGold Ashanti’s
business and results of operations, the extent of which cannot always be predicted.
There are in some cases certain restrictions on AngloGold Ashanti’s ability to independently move assets out of certain countries
in which it has operations, or transfer assets within the Group, without the prior consent of the local government or minority
shareholders involved.
For more information on the risks and uncertainties associated with AngloGold Ashanti’s mining rights, see “Item 3D: Risk
Factors”, in particular the risk factors entitled “AngloGold Ashanti’s mining rights in the countries in which it operates could be
altered, suspended or cancelled for a variety of reasons, including breaches in its obligations in respect of such mining rights”,
“Failure to comply with laws, regulations, standards and contractual obligations, breaches in governance processes or fraud,
bribery and corruption may lead to regulatory penalties, loss of licences or permits, negative effects on AngloGold Ashanti’s
reported financial results, and adversely affect its reputation”, “Title to AngloGold Ashanti’s properties may be uncertain and
subject to challenge”, “AngloGold Ashanti’s mineral deposits, Mineral Reserve, and mining operations are located in countries
where political, tax and economic laws and policies may change rapidly and unpredictably and such changes and policies may
adversely affect both the terms of its mining concessions, as well as its ability to conduct operations in certain countries” and
“AngloGold Ashanti’s Mineral Reserve, deposits and mining operations are located in countries that face instability and security
risks that may adversely affect both the terms of its mining concessions, as well as its ability to conduct operations in certain
countries”.
SOUTH AFRICA
As part of the South African asset sale, AngloGold Ashanti Limited sold its remaining three mining rights in South Africa to
Golden Core Trade and Invest (Pty) Ltd (“Golden Core”) and Harmony Gold Mining Company Limited pursuant to a sale
agreement concluded on or about 12 February 2020, as amended and restated from time to time (the “SA Sale Agreement”).
These mining rights relate to operations in the West Wits area.
General laws relating to mining
The MPRDA
The Mineral and Petroleum Resources Development Act, No. 28 of 2002 (the “MPRDA”) came into effect on 1 May 2004. The
objectives of the MPRDA are, amongst other things, to allow for state sovereignty over all mineral and petroleum resources in the
country, to promote economic growth and the development of these resources and to expand opportunities for the historically
disadvantaged and to ensure security of tenure for the respective operations concerning prospecting, exploration, mining and
production. By virtue of the provisions of the MPRDA, the state ensures that holders of mining and prospecting rights contribute
to the socioeconomic development of the areas in which they operate. The Mineral and Petroleum Resources Development
Amendment Act, No. 49 of 2008 (the “MPRDAA”) became effective on 7 June 2013. On 23 April 2004, the Minister of Mineral
Resources and Energy (the “MRE Minister”) published, under the terms of the MPRDA, the Mineral and Petroleum Resources
Development Regulations in order to implement the provisions of the MPRDA and MPRDAA. These implementation regulations
were amended on 27 March 2020.
The mining charter
Since 2004, a series of mining charters have been adopted in South Africa with the main purpose of transferring part of the
ownership of mining assets to black or historically disadvantaged South Africans (“HDSAs”) within a certain time period. Such
mining charters also set targets for, amongst other things, the advancement of HDSAs into management positions, the
employment of women, procurement of goods and services from HDSA-owned companies, training, community development
and the upgrading of mine housing. In 2004, the Broad-Based Socio-Economic Empowerment Charter for the South African
Mining Industry, 2004 was published and, in September 2018, the Broad-Based Socio-Economic Empowerment Charter for the
Mining and Minerals Industry, 2018 (the “2018 Mining Charter”) was published, repealing all prior mining charters. In September
2021, the High Court of South Africa (Gauteng Division) held that the 2018 Mining Charter is a policy document and does not,
per se, bind holders of mining titles. The High Court also set aside various provisions of the 2018 Mining Charter. In November
2021, the South African Department of Mineral Resources and Energy (“DMRE”) informed the parliamentary portfolio committee
59
on mineral resources and energy that it does not intend to appeal the outcome of the judgement, but instead will consider steps
to achieve the empowerment objectives through legislative amendments to the MPRDA.
The B-BBEE Act
The Broad-Based Black Economic Empowerment Act, No. 53 of 2003 (the “B-BBEE Act”) is a law of general application in
respect of Broad-Based Black Economic Empowerment (“B-BBEE”) and enables the Minister of Trade and Industry to drive B-
BBEE across all sectors of the economy. In 2014, the Broad-Based Black Economic Empowerment Amendment Act, No. 46 of
2013 (the “B-BBEE Amendment Act”) came into effect amending the B-BBEE Act to provide a framework of principles, strategies
and guidelines aimed at promoting the broad-based socio-economic empowerment of HDSAs across the South African economy
and society in the form of ownership, management, employment equity, skills development, preferential procurement, enterprise
development and socio-economic development.
Environmental laws relating to mining
The National Environmental Management Act, No. 107 of 1998, as amended (the “NEMA”) includes provisions to deal with
environmental regulation of mining and prospecting, which provisions are administered by the MRE Minister. Pursuant to section
24N(8) of NEMA, directors of a company are jointly and severally liable for any negative impact on the environment, whether
advertently or inadvertently caused by the company they represent, including damage, degradation and pollution.
From an environmental perspective, given the wide scope of the statutory duty of care in South African environmental law,
erstwhile land owners may be held liable for historic contamination by the regulatory authorities. The “polluter pays” principle in
South Africa enables the competent authority to seek recourse against various responsible parties based on their historical or
current relationship to the source and receptor of degradation or pollution. The duty of care also applies retroactively to
significant pollution or degradation that occurred before the entry into force of NEMA (i.e., 29 January 1999), as well as
significant pollution or degradation that arises or is likely to arise at a different time from the actual activity that caused the
contamination (e.g., latent or residual impact) or arises through an act or activity of a person that exacerbates pre-existing
contamination. The authorities can also seek compensation in respect of clean-up measures that it is required to take on behalf
of the responsible parties and apportion liability amongst the responsible parties, which could technically include a historic
landowner or mining company that caused the pollution. Although the purchasers of AngloGold Ashanti Limited’s assets in South
Africa have contractually assumed all environmental liability associated with its former South African operations and agreed to
indemnify AngloGold Ashanti Limited for the same, there remains a risk, at least theoretically, of statutory liability to the state.
AngloGold Ashanti’s rights and permits
Pursuant to the SA Sale Agreement, AngloGold Ashanti Limited and Golden Core executed a notarial deed of cession of the
mining rights with DMRE references GP 30/5/1/2/2/01 MR and GP 30/5/1/2/2/248 MR to transfer and cede these mining rights to
Golden Core (the “Deed of Cession”). On 14 June 2021, the Deed of Cession was registered at the Mineral and Petroleum Titles
Registration Office (the “MPTRO”).
With respect to the mining right held under DMRE reference GP 30/5/1/2/2/11 MR, AngloGold Ashanti Limited and Golden Core
agreed to make an application in terms of section 102 of the MPRDA at the DMRE after the closing date of the SA Sale
Agreement requesting, among other matters, the incorporation of this mining right into the mining right with DMRE reference GP
30/5/1/2/2/01 MR (the “Harmony Consolidation Application”). AngloGold Ashanti Limited also executed a notarial conditional
deed of abandonment pursuant to which it conditionally abandoned this mining right in terms of section 56(f) of the MPRDA (the
“Deed of Abandonment”) on condition that ministerial consent is granted in respect of the Harmony Consolidation Application.
The Harmony Consolidation Application, which was submitted to the DMRE on 17 January 2022, is still pending. On the date of
the grant of the Harmony Consolidation Application, AngloGold Ashanti Limited will cease to be a holder of any mining rights in
South Africa. Once the transaction has been fully implemented, the general laws relating to mining outlined above will no longer
be applicable to the Company, other than the statutory duty of care in terms of NEMA as described above.
AFRICA REGION
Democratic Republic of the Congo (DRC)
General laws relating to mining
The mining industry in the DRC is primarily regulated by Law No. 007/2002 dated 11 July 2002 (the “2002 DRC Code”), as
amended and supplemented by Law No. 18/001 dated 9 March 2018 (the “Reformed DRC Mining Code”) and Decree No.
038/2003 dated 26 March 2003, as amended and supplemented by Decree No. 18/024 dated 8 June 2018 (the “Reformed DRC
Mining Regulations”).
With respect to the application of the Reformed DRC Mining Code and Reformed DRC Mining Regulations, Kibali Goldmines
S.A. (“Kibali Goldmines”) has reserved and continues reserving its rights, including, without limitation, its stability rights under,
among other legal sources, the 2002 DRC Code. Discussions with the DRC government on these issues and the possible
60
application of incentives that may be available under the Reformed DRC Mining Code and Reformed DRC Mining Regulations, in
particular under article 220 of the Reformed DRC Mining Code which provides that the Prime Minister of the DRC may grant a
number of incentives to provinces with infrastructure deficits to encourage economic development from mining resources, are
ongoing.
Companies holding mining titles issued prior to the entry into force of the Reformed DRC Mining Code and Reformed DRC
Mining Regulations have claims to a ten-year stability provision in accordance with prior mining legislation. Notwithstanding the
adoption of the new regulatory regime, their rights with respect to such stability provision are reserved.
The Reformed DRC Mining Code grants the DRC Minister of Mines the authority to grant, refuse, suspend or terminate mineral
rights, subject to conditions set out in the Reformed DRC Mining Code. Mineral rights may be granted in the form of exploration
permits for an initial period of five years renewable once for a further five-year period or in the form of exploitation permits which
are granted for an initial period of 25 years, renewable several times for 15-year periods until the end of the mine’s life. Prior to
commencing exploration work, the holder of an exploration permit must submit for approval a mitigation and rehabilitation plan
pursuant to which it must undertake to carry out certain mitigation measures of the impact of its activities on the environment, as
well as rehabilitation measures. Exploitation permits are granted upon successful completion of exploration and satisfaction of
certain requirements, including approval of a feasibility study, an environmental and social impact study and an environmental
and social management plan. The holder of an exploitation permit is required to commence development and mine construction
within three years of the grant of such permit. Failure to do so may lead to forfeiture of the exploitation permit. To protect and
enforce rights acquired under an exploration or exploitation permit, the Reformed DRC Mining Code provides, depending on the
nature of the dispute or controversy, administrative, judicial and national or international arbitral recourses.
Mining companies are required to grant a free-carried and non-contributory participation to the DRC government. The DRC
government’s free participation was originally set at five percent, which was increased to ten percent in respect of exploitation
permits issued after the entry into force of the Reformed DRC Mining Code. All mining companies are required to grant an
additional five percent free-carried participation to the DRC government upon each renewal of their exploitation permit. Under the
Reformed DRC Mining Code, a ten percent local contributory participation is also mandatory for exploitation permits issued after
its entry into force.
Tax laws relating to mining
The Reformed DRC Mining Code sets out an exclusive and comprehensive tax and customs regime that is applicable to mining
activities. Mining title holders are subject, amongst other things, to a corporate income tax of 30 percent, a windfall tax of 50
percent (subject to certain prerequisites) and are required to pay mining royalties to the DRC government. The royalty rate
applicable to gold has been set at 3.5 percent. Mining title holders are also required to contribute a minimum of 0.3 percent of
total turnover to community development.
The standard rate of VAT is 16 percent and is applicable to all mining companies. In the DRC, Kibali Goldmines is due certain
refunds of VAT which, to date, remain outstanding. AngloGold Ashanti calculates that its attributable share of the net recoverable
VAT balance (including recoverable fuel duty and after discounting provisions) owed to it by the DRC government amounted to
$60 million as of 31 December 2023. In December 2023, a new agreement was reached with the DRC government for the
reimbursement of a portion of the refundable VAT, which resulted in VAT refunds of $34 million attributable to AngloGold Ashanti
as of 31 December 2023. However, uncertainty remains regarding the timing and level of cash receipts and offsets against other
taxes for purposes of the recovery of AngloGold Ashanti’s remaining VAT receivables in the DRC.
The Reformed DRC Mining Code also provides for a level of fiscal stability. A stability clause stipulates that existing tax, customs
and exchange control provisions applicable to mining activities are guaranteed to remain unchanged for a period of five years
from the enactment of the Reformed DRC Mining Code.
Foreign exchange control regime
The Reformed DRC Mining Code imposed new exchange control rules requiring that mining title holders repatriate onshore 60
percent of sale revenues received during the investment amortisation period and 100 percent once the investment amortisation
is completed.
During 2023, AngloGold Ashanti repatriated $180 million from its operations in the DRC, in the form of dividends from Kibali
(Jersey) Limited. Kibali (Jersey) Limited received such cash from Kibali Goldmines in the form of loan repayments (net of bank
fees) (AngloGold Ashanti’s attributable share: $131 million) and dividends (net of withholding taxes) (AngloGold Ashanti’s
attributable share: $49 million). Our attributable share of the outstanding cash balances awaiting repatriation from the DRC
amounted to $51 million as of 31 December 2023. The cash is fully available for the operational requirements of Kibali
Goldmines. The cash and cash equivalents held at Kibali Goldmines are subject to various steps before they can be distributed
to Kibali (Jersey) Limited and are held across four banks in the DRC, including two domestic banks.
61
AngloGold Ashanti’s rights and permits
AngloGold Ashanti holds a significant stake in the Kibali gold mine which is located in the north-eastern part of the DRC. The
Kibali gold mine is owned by Kibali Goldmines which is a joint venture between Barrick Gold Corporation (45 percent), AngloGold
Ashanti (45 percent) and Société Minière de Kilo-Moto S.A. (“SOKIMO”) (10 percent) which represents the interest of the DRC
government. AngloGold Ashanti and Barrick Gold Corporation each have a 50 percent interest in Kibali (Jersey) Limited which
holds their respective 45 percent interest in Kibali Goldmines.
The Kibali gold project is operated by Barrick Gold Corporation and comprises ten exploitation permits, of which seven expire in
2029 and three in 2030. Those exploitation permits (11447, 11467, 11468, 11469, 11470, 11471, 11472, 5052, 5073 and 5088)
cover an area of approximately 1,836 km2 in the Moto goldfields.
Ghana
General laws relating to mining
Control of minerals and mining companies
The Constitution of Ghana as well as the Minerals and Mining Act, 2006 (Act 703) (the “GMM Act”) provide that all minerals in
Ghana in their natural state are the property of the State and title to them is vested in the President on behalf of and in trust for
the people of Ghana, with rights of reconnaissance, prospecting, recovery and associated land usage being granted under
licence or lease. The grant of a mining lease by the Ghana Minister of Lands and Natural Resources (the “LNR Minister”) upon
the advice of the Minerals Commission is subject to parliamentary ratification unless the mining lease falls into a class of
transactions exempted by the Ghanaian Parliament. The LNR Minister has the power to object to a person becoming or
remaining a controller of a company which has been granted a mining lease if the LNR Minister believes, on reasonable grounds,
that the public interest would be prejudiced by the person concerned becoming, or remaining, a controller.
Stability and development agreements
The GMM Act provides for stability and development agreements. Stability agreements guarantee for a period of 15 years certain
terms and conditions (mainly fiscal) to which a company’s operations are subject. Development agreements may be granted to a
mineral right holder that proposes to invest over $500 million in its mineral operations in Ghana. The GMM Act permits stability
provisions to be incorporated into development agreements. Stability and development agreements are subject to parliamentary
ratification. In January 2020, it was proposed that the GMM Act be amended by abolishing development agreements and
shortening the maximum term of stability agreements from 15 years to five years (with a possible extension for a further five
years). If the GMM Act were amended along these lines, such amendments would not apply retroactively and would therefore not
have an impact on existing development agreements, including the Obuasi Development Agreement (as described below).
Those amendments to the GMM Act have not yet been adopted.
Ghana Stability Agreement
In 2004, following the implementation of the business combination between AngloGold Limited and Ashanti Goldfields Company
Limited, AngloGold Limited and the Government of Ghana signed a stability agreement (the “Ghana Stability Agreement”)
governing certain aspects of the fiscal and regulatory framework within which the Company would operate in Ghana for a period
of 15 years. In June 2018, the Ghana Stability Agreement ceased to apply to the Obuasi mine because of the parliamentary
ratification of a new development agreement and a new tax concession agreement in relation to that mine (as described below).
The Ghana Stability Agreement continued to apply to the Iduapriem mine until it expired in April 2019. Since then, AngloGold
Ashanti (Iduapriem) Limited (“AGA Iduapriem”) no longer benefits from the Ghana Stability Agreement. AGA Iduapriem benefits
from certain concessions under two deeds of warranty, including exemptions from withholding taxes on dividends, interest and
payments for foreign services, and allowable deductions.
Obuasi Development Agreement
AngloGold Ashanti (Ghana) Limited (“AGA Ghana”) negotiated a new development agreement in relation to the Obuasi mine (the
“Obuasi DA”) with the Government of Ghana. On 21 June 2018, the Ghanaian Parliament ratified the Obuasi DA which contains
stability terms as provided for in stability agreements. The Obuasi DA confers a number of rights and obligations on AGA Ghana
with respect to the Obuasi mine, including, among other matters, (i) the stabilisation of the fiscal and regulatory framework
(except for enactments promoting the use of Ghanaian goods and services) for a period of ten years (subject to a potential
extension for five additional years); (ii) the right to hold up to 80 percent of proceeds received from exporting minerals in foreign
currencies outside of Ghana; (iii) obligation to give preference to materials and goods made in Ghana as well as services
provided by Ghanaians; and (iv) the right to peaceful enjoyment and protection against expropriation.
62
Obuasi Tax Concession Agreement
Fiscal terms, which would ordinarily form part of a single stabilisation document, were separated from the Obuasi DA. Hence a
separate tax concession agreement in relation to the Obuasi mine (the “Obuasi TCA”) was signed with the Government. On 21
June 2018, the Ghanaian Parliament ratified the Obuasi TCA with a concession period until 31 December 2027. The Obuasi TCA
contains a number of tax concessions for AGA Ghana with respect to the Obuasi mine, including, among other matters, (i) a
corporate income tax rate of 32.5 percent or such lower rates as may be fixed by law (instead of the current statutory rate of 35
percent); (ii) exemption of certain transactions from capital gains tax; (iii) a sliding scale royalty rate ranging from three percent to
five percent for a price ranging from $1,300 up to $2,000 and above per ounce (instead of the current flat rate of five percent);
and (iv) certain VAT exemptions and refunds.
Government’s Golden Share
Section 60(1) of the GMM Act provides that the Government of Ghana can require a mining company to issue to the Republic of
Ghana for no consideration a special share (a “Golden Share”). A Golden Share in AGA Ghana was issued to the Government of
Ghana and the Obuasi DA confirms that the Government’s rights with respect to its Golden Share apply only in respect of AGA
Ghana’s assets and operations in Ghana. The Golden Share confers certain rights on the Government in respect of AGA Ghana.
For example, written consent of the holder of the Golden Share is required for, among other matters, (i) any amendment of the
rights and restrictions in respect of the Golden Share; (ii) the voluntary winding-up or voluntary liquidation of AGA Ghana; (iii) the
disposal of any mining lease held by AGA Ghana; and (iv) the disposal of all or substantially all of the assets of AGA Ghana. The
holder of the Golden Share does not have the right to participate in the profits or assets of AGA Ghana (by way of dividend or
other capital issuances), but is entitled to attend any general meeting of shareholders.
Tax laws relating to mining
Currently, the main tax laws in Ghana include the following acts and regulations, which have been frequently amended over the
years:
•Income Tax Act, 2015 (Act 896) (as amended) and Income Tax Regulations, 2016 (L.I. 2244);
•Customs Act, 2015 (Act 891) (as amended) and Customs Regulations, 2016 (L.I. 2248);
•Value Added Tax, 2013 (Act 870) (as amended) and Value Added Tax Regulations, 2016 (L.I. 2243);
•Revenue Administration Act, 2016 (Act 915) (as amended); and
•Exemptions Act, 2022 (Act 1083).
The Income Tax Act, 2015 (Act 896) ringfences and taxes income derived from mining operations at the rate of 35 percent. The
Obuasi TCA for AGA Ghana provides for a stabilised income tax rate of 32.5 percent. AGA Iduapriem currently pays income tax
at the rate of 35 percent.
Furthermore, mining companies must pay ground rent and royalties. Ground rent is payable annually and is calculated based on
the number of cadastral units of land held. Royalties are calculated as a percentage of total revenue from minerals obtained by
the mining company. The Government of Ghana currently applies a five percent royalty rate to mining companies who have not
agreed a different royalty rate under an agreement with the State. AGA Ghana pays royalties on a sliding scale ranging between
three percent and five percent as provided for by the Obuasi TCA. AGA Iduapriem pays royalties at a rate of five percent.
The provision of goods and services is liable to value added tax (“VAT”) at a revised rate of 15 percent. In addition, there are
separate levies, including a 2.5 percent National Health Insurance Levy (“NHIL”), a 2.5 percent Ghana Education Trust Fund
Levy (“GetFund Levy”) and a one percent COVID-19 Levy. By virtue of the Obuasi TCA, AGA Ghana is exempt from the payment
of the NHIL and GetFund Levy. In addition, while AGA Ghana is technically exempt from the payment of the COVID-19 Levy (as
it became operational subsequent to the effective date of the Obuasi DA), the Company decided to pay the COVID-19 Levy
voluntarily. AGA Iduapriem is not exempt from any of these levies.
In addition, the Growth and Sustainability Levy Act, 2023 (Act 1095) (the “GSL Act”) introduced a Growth and Sustainability Levy
(“GSL”) on certain companies and institutions for the 2023, 2024 and 2025 years of assessment. With respect to mining
companies, the non-deductible GSL is charged at a rate of one percent of gross production. While the GSL Act states that the
GSL applies to the specified companies or institutions despite any exemption applicable to such company or institution, AGA
Ghana believes this is incompatible with the Obuasi TCA. AGA Iduapriem is subject to payment of the GSL.
The Emissions Levy Act, 2023 (Act 1112) (the “Emissions Levy Act”) was promulgated at the end of 2023 and imposes,
beginning 1 February 2024, a levy on carbon dioxide equivalent emissions produced by specified industrial sectors, including
mining, of GHS 100 (Ghanaian cedis) per tonne per month. At AGA Iduapriem, costs incurred in connection with the Emissions
Levy Act are not expected to be material to AngloGold Ashanti. The Emissions Levy Act will not apply to AGA Ghana because,
under the Obuasi DA, AGA Ghana is stabilised against the adverse effects of, or obligations imposed by, any new laws.
The Exemptions Act, 2022 (Act 1083) (“Exemptions Act”) defines the scope of tax exemptions that may be granted under
Ghanaian law, and sets out the administrative process for obtaining a tax exemption. The Exemptions Act required a person with
the benefit of an existing tax exemption to apply to the Ghana Minister of Finance by 11 March 2023 in order to continue to
63
benefit from that tax exemption. The requirement to apply to the Minister of Finance does not affect AGA Ghana (as, by virtue of
the Obuasi DA, AGA Ghana is stabilized against the adverse effects of, or obligations imposed by, any new laws). By contrast,
AGA Iduapriem is subject to the provisions of the Exemptions Act.
Environmental laws relating to mining
Mining companies are required, under the GMM Act, Environmental Assessment Regulations, 1999 (L.I. 1652), Environmental
Protection (Mining in Forest Reserves) Regulations, 2022 (L.I. 2462) and Water Use Regulations, 2001 (L.I. 1692), to obtain all
necessary approvals from the Environmental Protection Agency (the “Ghana EPA”) and, in appropriate cases, the Water
Resources Commission, the Forestry Commission and/or the Minerals Commission before undertaking mining operations. This
includes undergoing an environmental impact assessment process and, following the issuance of the environmental permit,
periodically preparing (i) environmental management plans, which include details of the likely impacts of mining operations on
the environment and local communities, as well as a comprehensive plan and timetable for actions to mitigate and remediate any
adverse effects of the mining operations, and (ii) annual environmental reports in respect of their businesses, for submission to
the Ghana EPA. The Minerals and Mining (Health, Safety and Technical) Regulations, 2012 (L.I. 2182) also impose further
obligations to obtain the necessary permits from the Inspectorate Division of the Minerals Commission for the operation of mines.
The environmental permits of AGA Ghana (for the Obuasi redevelopment project and for the construction and operation of
tailings and water infrastructure projects) are valid until June 2024. The environmental permits for AGA Iduapriem in connection
with (i) gold mining and processing and (ii) construction and operation of a tailings storage facility (“TSF”) expire in August 2024
and June 2024, respectively. The renewal process for the AGA Iduapriem and AGA Ghana environmental permits, which was
commenced in advance of the expiry of the permits, is underway.
Environmental laws in Ghana also require mining operators to rehabilitate land negatively impacted by mining operations
according to an environmental cost reclamation plan agreed with the Ghana EPA. The environmental cost reclamation plan
includes two cost estimates, namely the cost of rehabilitating the mining area at the end of the life of the mine as well as the cost
of rehabilitating the mine as at the date of the reclamation plan. These estimates are reviewed annually and updated every two
years. Each mining company is typically required to secure a percentage (typically between 50 percent and 100 percent) of the
estimated rehabilitation costs by posting reclamation bonds underwritten by banks and restricted cash. The terms of each
reclamation bond are determined by a reclamation security agreement between that company and the Ghana EPA. Both AGA
Ghana and AGA Iduapriem have bank guarantees in place for environmental reclamation liabilities as well as escrow accounts
with joint signatories from the Ghana EPA. The bank guarantees for each of AGA Iduapriem and AGA Ghana have recently been
renewed; the bank guarantees for AGA Ghana will now expire in December 2024, and the bank guarantees for AGA Iduapriem
will expire in October 2024.
Foreign exchange, export and other rules
Retention of foreign earnings
Pursuant to Section 30 of the GMM Act, a mining company may retain a percentage of its foreign exchange earnings to satisfy its
external payment obligations. The Obuasi mine is permitted to retain 80 percent of its foreign exchange earnings in an offshore
foreign exchange account, whereas the Iduapriem mine is allowed to retain up to 75 percent. In addition, the Company has
permission from the Bank of Ghana to retain and use U.S. dollars outside of Ghana to fulfil payment obligations to the
Company’s hedge counterparties which cannot be met from the cash resources of its treasury company.
Rules regarding the export of gold and diamonds
The Bank of Ghana introduced new measures to regulate and monitor the export of gold and diamonds from Ghana in 2015.
From September 2015, all exports of gold and diamonds must be carried out through the Precious Minerals Marketing Company
Ltd (“PMMC”), except where the exporter is the holder of a licence that permits it to export directly. The Ghana Revenue Authority
(Customs Division) only permits gold to be exported by a licensed gold exporter who has a completed Form FEX A4 bearing
Bank of Ghana’s embossment. The export measures do not apply to AngloGold Ashanti because the Company holds a licence
granted by the LNR Minister to sell and export its production.
Local assaying and refinement policies
In November 2016, the Ministry of Lands and Natural Resources issued a ministerial directive appointing the PMMC as
designated laboratory for assaying in Ghana. The directive requests all persons holding export licences for gold to submit all gold
to be exported to the PMMC for assay before export. Mining businesses, including AngloGold Ashanti, acting through the Ghana
Chamber of Mines were opposed to this directive due to its potential negative impact on mining companies in the region. As a
result, the Chamber initiated proceedings to reverse or modify the directive. Following discussions in respect of the mining
industry’s concerns, the Chamber and Government agreed on the modalities for implementing the national assaying policy and it
was introduced in February 2018 following a one-month pilot among certain mining companies. Subsequently, in June 2019, the
LNR Minister released a statement reiterating the Government of Ghana’s plans to locally refine 30 percent of the gold produced
in the country. Discussions between the Ghana Chamber of Mines and the Government of Ghana’s economic management team
64
in 2019 led to the Chamber agreeing to consider the proposal and for the parties to discuss detailed modalities to ensure that a
move to locally refined gold does not become detrimental to the mining industry.
Local content and local participation policy
Mining companies must submit a detailed programme for the recruitment and training of Ghanaians with a view to achieving
“localisation”, which is the replacement of expatriate personnel in a company’s Ghanaian operations by Ghanaian personnel. In
addition, mining companies must give preference to Ghanaian products and personnel, to the maximum extent possible,
consistent with safety, efficiency and economies. The national localisation policy has been set out in the Minerals and Mining
(Local Content and Local Participation) Regulations, 2020 (L.I. 2431), which impose an obligation on mining companies to
procure goods and services with Ghanaian content to the maximum extent possible in accordance with the objective of
developing Ghanaian participation in the mining industry value chain.
The Government’s election to purchase gold
In June 2021, the Bank of Ghana launched a “Domestic Gold Purchase Programme” through which the Bank of Ghana intends
to purchase refined gold from AGA Ghana, AGA Iduapriem and other large-scale mining companies through voluntary
arrangements pursuant to the Bank of Ghana Act, 2002 (Act 612). The LNR Minister indicated in November 2022 that the
Government of Ghana intended to exercise its statutory right of pre-emption pursuant to the GMM Act to compel large-scale
mining companies to sell 20 percent of their Ghana gold production and/or the resultant refined gold to the Bank of Ghana in
exchange for Ghanaian cedis. While the Government of Ghana had not exercised its statutory right of pre-emption as prescribed
in the GMM Act as at 19 April 2024, each of AGA Ghana and AGA Iduapriem has already executed voluntary gold purchase
agreements with the Bank of Ghana to sell up to 20 percent of their annual gold production for 2024 to the Bank of Ghana.
AngloGold Ashanti’s rights and permits
Obuasi
The Obuasi mine originally held four contiguous mining leases, namely, the Obuasi, Binsere 1, Binsere 2 and Binsere 3 Mining
Leases. The Obuasi Mining Lease was granted by the Government of Ghana on 5 March 1994, covering an area of
approximately 338 km2 in the Amansie East and Adansi West districts of the Ashanti region, for a term of 30 years from the date
of the agreement. The Binsere Mining Leases were granted on 9 April 1998, covering an area of 140 km2, for a term of 30 years
from the date of the agreement. All leases in respect of the Obuasi mine had been duly ratified in accordance with Ghanaian law.
In March 2007, the Government of Ghana agreed to extend the term of the Obuasi Mining Lease for a further term of 30 years.
The amended Obuasi Mining Lease was also ratified by Parliament on 23 October 2008. The Obuasi Mining Lease will expire in
March 2054 and the Binsere Mining Leases in April 2028. The mining leases are renewable. On 3 March 2016, the Minerals
Commission approved AGA Ghana’s application to surrender approximately 273.54 km2 of the area to the Government of Ghana,
reducing the combined area under AGA Ghana’s lease areas to 201.46 km2. The remaining parcel of land that will be subject to
the mining lease is situated within various villages and townships in the region but excludes the municipality of Obuasi. On 15
January 2021, the Minerals Commission approved AGA Ghana’s application to surrender a further 60.24 km2 of lease area,
thereby reducing the total lease area to 141.22 km2 under three mining leases, namely, the Obuasi Mining Lease (87.48 km2),
the Binsere 1 Mining Lease (29.03 km2) and the Binsere 2 Mining Lease (24.71 km2). These mining leases are covered by the
Obuasi DA and Obuasi TCA.
Iduapriem
The Iduapriem mine operates under four different mining leases, namely, the Iduapriem Mining Lease (LVB1539/89) (36.47 km2),
the Ajopa Mining Lease (LVB/WR326/09) (46.12 km2), the Teberebie Mining Lease (LVB3722H/92) (28.53 km2) and the Ajopa
South Mining Lease (LR#1109/1999) (28.10 km2). On 17 February 2020, the mining leases were extended for a further period of
15 years and such leases will now expire in February 2035. All leases in respect of the Iduapriem mine have been duly ratified in
accordance with Ghanaian law.
Guinea
General laws relating to mining
In Guinea, the mining industry is primarily regulated by Law L/2011/006/CNT dated 9 September 2011 as amended by Law
L/2013/053/CNT dated 8 April 2013 and promulgated by Decree D/2013/075/PRG/SGG dated 17 April 2013 (together, the
“Guinea Mining Code”).
The Guinea Mining Code is implemented by various decrees and orders, including Decree D/2014/015/PRG/SGG adopting a
model of mining convention, dated 17 January 2014, Order A/2016/1584/MMG/SGG related to the administration’s capacities for
the management of integrated mining projects (PARCA-GPI) and its steering committee, dated 6 June 2016, and Decree
D/2016/163/PRG/SGG on the national agency for the development of mining infrastructures (ANAIM), dated 13 June 2016.
65
In 2017, Decree D/2017/285/PRG/SGG was adopted, which sets forth the conditions for the constitution and management of the
Local Development Fund (“Fodel”), as well as Joint Order A/2017/6326/MMG/MATD/SGG, which sets forth the conditions for the
use, management and control of the Fodel. Together, these set forth the use of the mining companies’ financial contribution to
the development of the local communities and the rules applying to the Fodel, which was created under the Guinea Mining Code.
On 13 July 2018, a Joint Order A/2018/5212/MEF/MMG/MB/MATD/SGG was issued, which regulates the use, management and
monitoring of the resources allocated to local authorities pursuant to article 165 of the Guinea Mining Code. In 2019, an inter-
ministerial committee was created to supervise and control the Fodel through the adoption of Joint Order AC/2019/089/MMG/
MATD/SGG setting out the conditions for the constitution, powers and management of said inter-ministerial committee. On 6
September 2019, Decree D/2019/263/PRG/SGG was issued, which sets forth local content requirements in the framework of the
implementation of public and private projects in Guinea. On 27 May 2021, Order A/2021/1229/MMG/SGG was issued to
establish the Steering Committee for local content in the mining sector. On 21 October 2022, Law L/2022/010/CNT, dated 22
September 2022, setting up the legal framework for local content in public and private projects was enacted (the “Local Content
Act”). In particular, the Local Content Act regulates local employment, procurement of goods and services, and subcontracting
requirements. As the Local Content Act does not expressly repeal the provisions of Decree D/2019/263/PRG/SGG, those
provisions remain in force to the extent that they do not conflict with the Local Content Act.
On 16 June 2020, a new procedure for the export of gold by mining companies was enacted through the adoption of Decree
D/2020/113/PRG/SGG, which sets out, amongst other things: (i) when the industrial production tax referred to in article 161-1 of
the Guinea Mining Code shall be paid, and (ii) the process to be followed to export gold bullion.
On 27 April 2021, a Joint Order AC/2021/824/MMG/BCRG/SGG was issued establishing the fees and costs charged by the
Guinean mining authorities and the Guinean Central Bank in connection with the administrative procedures for the export of gold
by industrial and semi-industrial companies.
AngloGold Ashanti’s rights and permits
The Group’s Guinean subsidiary, Société AngloGold Ashanti de Guinée S.A. (“SAG”), has title to the Siguiri mine in the form of a
mining concession, originally granted by virtue of Presidential Decree D/97/171/PRG/SGG, dated 4 August 1997, for a period of
25 years (the “Mining Concession”). The Mining Concession covers exploration and mining for gold, silver, diamonds and
associated ores, and was originally covered by a mining convention entered into with the Republic of Guinea in 1993 and
amended in 2005. On 28 June 2016, SAG and the Government of Guinea concluded a revised and consolidated mining
convention (Convention de Base Révisée et Consolidée) (the “Revised Mining Convention”) which encompasses a renewal of
the term of the original mining convention and other amendments necessary to support an expansion project to extend the life of
the Siguiri mine (the “Expansion”). In compliance with the provisions of the Guinea Mining Code, the Revised Mining Convention
was ratified by the Guinean National Assembly (Law L/2016/N°067/AN dated 30 December 2016, promulgated by Decree
D/2017/015/PRG/SGG dated 24 January 2017), submitted to the Guinean Supreme Court which rendered a favourable opinion
(Judgement N°AC 005 dated 16 January 2017), and ratified by the President of the Republic of Guinea (Decree D/2017/021/
PRG/SGG dated 24 January 2017), following which it replaced the original mining convention and became effective on 24
January 2017. While the Mining Concession expired on 4 August 2022, a renewal request had been filed prior to its expiry in
accordance with the provisions of the Revised Mining Convention on 1 February 2022.
Key elements of the Revised Mining Convention include the following:
•a duration of 25 years, expiring on 23 January 2042, subject to further renewal if mining operations continue;
•the term of the Mining Concession is aligned with the term of the Revised Mining Convention since the Republic of
Guinea committed to maintain the Mining Concession for the entire duration of the Revised Mining Convention;
•SAG’s operations remain governed by the 1995 Guinea Mining Code (the prior mining code) and are only subject to the
provisions of the Guinea Mining Code to the extent they are expressly set out in the Revised Mining Convention;
•the stability of the customs and tax regime is guaranteed for the entire initial term of the Revised Mining Convention,
and subject to certain conditions being met, any renewal period(s);
•the Republic of Guinea holds a 15 percent free-carried/non-contributory interest;
•the Republic of Guinea is entitled to a royalty on gold of five percent based on a spot gold price as per LBMA fixing (PM)
up until the date of steady state commercial production of the first phase of the Expansion, after which the royalty rate
applicable to gold will vary depending on threshold prices as per LBMA fixing (PM), namely: three percent if the gold
price is $1,300 or less, five percent, if above $1,300 and up to $2,000 and seven percent if above $2,000;
•SAG benefits from five-year income tax holiday from the beginning of steady state commercial production of the first
phase of the Expansion, after which the income tax rate is set at a maximum of 30 percent;
•a local development tax of 0.4 percent is payable on the sale price for gold and silver received by SAG up until 31
December 2027, after which it will be increased to 0.6 percent;
•salaries of expatriate employees are subject to a ten percent income tax;
•goods imported into Guinea for purposes related to the construction and commissioning of the first phase of the
Expansion are exempt from all customs taxes and duties; and
•SAG is committed to adopting and progressively implementing a plan for the effective rehabilitation of the mining areas
disturbed or affected by its operations.
66
The Mining Concession covers an area divided into four blocks totalling approximately 1,495 km2. SAG has the exclusive right to
explore and mine in any part of the concession area for the duration of the Revised Mining Convention. The Revised Mining
Convention also grants SAG the option to secure certain land rights over additional areas currently covered by exploration
permits, but to which SAG may need access for purposes of establishing roads or storage of tailings. Pursuant to the Revised
Mining Convention, the Mining Concession can be renewed for one or more period(s) that cannot exceed ten years each as long
as the Revised Mining Convention is in force.
The Revised Mining Convention is subject to early termination if the parties formally and expressly agree to it, if the last of the
mining title held by SAG expires or is relinquished without any renewal application having been filed, if all project activities are
voluntarily suspended for a continuous period of 12 months or are permanently abandoned by SAG, or if SAG goes into
voluntary liquidation or is placed into liquidation by a court of competent jurisdiction.
Mali
General laws relating to mining
The mining industry in Mali is primarily regulated by Law No. 2023-040 of 29 August 2023 enacting the new mining code of the
Republic of Mali (the “New Mali Mining Code”). The New Mali Mining Code provides for an implementation decree which has not
yet been issued as at 19 April 2024. In the absence of a new implementation decree, the Government of Mali is likely to apply the
implementation decree of the previous Mali mining code to the extent its provisions do not conflict with the provisions of the New
Mali Mining Code. As a result, it is expected that Decree No. 2020-0177/PT-RM dated 12 November 2020 implementing the
previous Mali mining code and Decree No. 2020-0288/PM-RM enacting the new model mining convention referred to therein, will
continue to apply for the time being.
The New Mali Mining Code provides that ongoing and valid exploitation permits remain governed by the law under which they
were originally issued for their remaining duration, it being understood that the tax and customs regime applicable to the mining
operations previously carried out by AngloGold Ashanti entities in Mali (as further described below) is governed by the provisions
on tax and customs contained in their mining conventions (conventions d’établissement). In this regard, the transitory rules of the
New Mali Mining Code specify that mining conventions in force remain valid until the expiry of the underlying exploitation permit.
Any renewal of such exploitation permit must be fully compliant with the provisions of the New Mali Mining Code.
Exploration and prospecting activities are carried out under exploration authorisations (autorisation d’exploration) or exploration
permits (permis de recherche), which give their holder the exclusive right to carry out exploration activities over a given area.
Exploration authorisations are granted by the Mining Administration (Administration chargée des Mines) for a non-renewable
period of three months, while exploration permits are granted by Ministerial Order for a period of three years renewable twice for
additional 3-year periods. Applications for exploration authorisations and exploration permits must contain various documents
attesting to the financial and technical capacity of the applicant as well as a detailed works and costs programme.
A large scale permit exploitation permit (permis d’exploitation de grande mine) is required to mine a deposit located within the
area of an exploration permit and grants the holder an exclusive right to exploit the named substances and proceed with the
processing and commercialisation of the substances extracted within its perimeter. Large scale exploitation permits are granted
by decree of the Head of Government for a maximum period of 12 years renewable for ten year-periods until depletion of the
deposits. An application must be submitted to the Mining Administration (Administration chargée des Mines) and must contain
various documents attesting to the financial and technical capacity of the applicant, a feasibility study, a detailed environmental
study in respect of the impact of the project on the environment, an environmental permit, a closure and rehabilitation plan as
well as a community development plan. As soon as the large scale exploitation permit is granted, the permit holder must
incorporate a company under the laws of Mali and assign the permit for free to this company. The State will have a ten percent
free-carried interest in the company. This interest will be converted into priority shares and the State’s participation will not be
diluted in case of an increase in capital. In addition, the company is required to ensure that private Malian investors are offered
the possibility to acquire five percent of their capital.
All mining titles mentioned above (save for the exploration authorisation) require a mining convention (convention
d’établissement) to be signed by the State and the titleholder defining their rights and obligations, the duration of which is 20
years.
AngloGold Ashanti’s rights and permits
Historically, AngloGold Ashanti had interests in the Morila, Sadiola and Yatela gold mines, all of which were governed by mining
conventions (conventions d’établissement) covering exploration, mining, treatment and marketing in a comprehensive document.
These documents include general provisions regarding exploration (work programme, fiscal and customs framework) and
exploitation (formation of a local limited liability mining company, State interest, fiscal and customs framework governing
construction and exploitation phases, exchange controls, marketing of the product, accounting regime, training programmes for
local labour, protection of the environment, reclamation, safety, hygiene and dispute settlement). The Morila and Sadiola gold
mines were sold in November and December 2020, respectively.
67
In April 2017, Société d’Exploitation des Mines d’Or de Yatela S.A. (“Yatela”), the company operating the Yatela gold mine, began
the implementation of a closure plan in order to relinquish the property. In February 2019, AngloGold Ashanti and its joint venture
partner IAMGOLD Corporation announced an agreement to sell each of their 40 percent interests in Yatela to the Government of
Mali, which holds the remaining 20 percent interest. Completion of the transaction is subject to the fulfilment or waiver of a
number of conditions precedent and has been delayed several times since 2019 due to political instability and related events in
Mali as well as the COVID-19 pandemic. Yatela’s exploitation permit covers approximately 212 km2. Yatela has a 30-year permit
which expires in 2030.
Tanzania
General laws relating to mining
Tanzania Mining Act and Tanzania Mining Regulations
Mineral rights in the United Republic of Tanzania are principally governed by the Mining Act, Chapter 123 (R.E. 2019), as
amended (the “Tanzania Mining Act”) and the Mining Regulations, 2018 (the “Tanzania Mining Regulations”). The Tanzania
Mining Act and the Tanzania Mining Regulations came into force in November 2010 followed by amendments to the Tanzania
Mining Act in 2017 and subsequent amendments to the Tanzania Mining Regulations in 2018, 2019 and 2022. The Mining (Local
Content) Regulations were amended and came into force on 23 September 2022. Those amendments, together with an
Executive Order, introduced, among other matters, (i) the Tanzania Mining Commission; (ii) local content requirements in
employment and for procurement of goods and services; (iii) Mining Licence requirements of five percent of a licencee’s equity to
be held by Tanzanians, with at least 80 percent of its managerial positions to be held by Tanzanians and 100 percent of non-
managerial and other positions to be held by Tanzanians, in addition to the shareholding of the Government of Tanzania pursuant
to Section 10 of the Tanzania Mining Act (i.e., free-carried interest); and (iv) regulations for the government warehousing of
minerals prior to export/sale.
Minimum shareholding and public offering
In 2016, the Mining (Minimum Shareholding and Public Offering) Regulations, 2016, as amended, was adopted. The regulations
set out the requirement to sell shares to Tanzanian nationals, by way of a public offering and listing on the Dar es Salaam Stock
Exchange, which will apply to companies that are carrying out large scale mining operations. The regulations also require all
existing holders of a special mining licence to list a minimum of 30 percent of their shares on either the Main Investment Market
or the Enterprise Growth Market Segment of the Dar es Salaam Stock Exchange within six months of the regulations coming into
force, which was on 24 February 2017. However, the Company believes the listing requirement conflicts with the mining
development agreement. In September 2020, the Government of Tanzania published the Mining (Minimum Shareholding and
Public Offering) (Amendment) Regulations, 2020, which exempts companies holding special mining licences from local listing
requirements if such mining company has entered into an agreement with the Government of Tanzania that provides for a non-
dilutable free-carried interest in such mining company and an economic benefits sharing arrangement.
Arbitration
Along with other major mining companies, AngloGold Ashanti’s subsidiaries are seeking a constructive dialogue with the
Government of Tanzania to gain assurances that the Geita gold mine will not be affected by recent legal and fiscal changes
adopted by the Government in light of their mining development agreements which guarantee (i) fiscal and regulatory stability,
and (ii) an agreement between all parties before material legal and regulatory changes are made. As a precautionary step to
safeguard its interests, AngloGold Ashanti commenced international arbitration proceedings against the Government of Tanzania
in connection with the enactment of this legislation in July 2017. Declaratory relief is sought in accordance with the terms of the
Company’s existing mining development agreement to preserve its and its shareholders’ rights and interests in the Geita gold
mine. AngloGold Ashanti is seeking confirmation from the Government of Tanzania that, as a result of its existing mining
development agreement, the Company does not fall within the scope of the new mining legislation that includes, among other
things, (i) listing requirements; (ii) an increase in the rate of revenue royalties from four to six percent and a one percent
clearance fee; and (iii) a right for the Government of Tanzania to (a) re-negotiate existing mining agreements at its discretion, (b)
receive a non-dilutable, free-carried interest of no less than 16 percent in all mining projects, and (c) acquire up to 50 percent of
the shares of the mining company commensurate with the total tax expenditure incurred by the Government in favour of the
mining company. AngloGold Ashanti can provide no assurance that the new mining legislation, including the listing requirements,
will not apply to its operations in Tanzania and the outcome of the arbitration action may have a material adverse impact on the
Company’s results of operations and financial condition. See also “Item 8A: Legal Proceedings—Tanzania”.
Categories of mineral right licences
Ownership of and control over minerals on, in or under the land vest in the President of the United Republic of Tanzania. No
person is allowed to prospect for minerals or carry on mining operations except pursuant to the authority of a mineral right
licence granted, or deemed to have been granted, under the Tanzania Mining Act or its predecessor acts. To enable a company
to prospect or mine, the Tanzania Mining Commission (“MC”) initially grants an exclusive prospecting licence. Upon presentation
of a feasibility study, together with certain other environmental, social and financial assurances, the MC may then grant a form of
68
licence for mining. Three categories of licences can be applied for under the Tanzania Mining Act: licences for exploration,
licences for mining, and licences for ancillary activities. Licences for exploration include prospecting licences and gemstone
prospecting licences. Licences for mining include special mining licences (if the proposed capital investment is equal to at least
$100 million), mining licences (if the proposed capital investment is equal to between $100,000 and $100 million) and primary
mining licences (reserved for Tanzanian citizens).
A prospecting licence grants the holder the exclusive right to prospect in the area covered by the licence for all minerals within
the class of minerals applied for. An application for a prospecting licence is made to the Mining Commission and the licence,
once granted, is valid for an initial term of four years. After the initial term, the licence is renewable for a further period of three
years, with no option for renewal thereafter. Upon renewal, 50 percent of the area covered by the licence must be relinquished.
Mining is mainly carried out through either a mining licence or a special mining licence, both of which confer on the holder the
exclusive right to conduct mining operations in or on the area covered by the licence. A special mining licence is granted for the
shorter of either the estimated life of the ore body indicated in the feasibility study report or such period as the applicant may
request. The holder of a special mining licence may apply for renewal of its licence at any time but no later than one year before
the expiry of the licence and such renewal shall not be for a period exceeding the estimate life of the remaining ore body. Special
mining licences have certain fiscal and other advantages over mining licences, as the holder of a special mining licence may
enter into a mining development agreement with the Government of Tanzania to guarantee the fiscal stability of a long-term
mining project and make special provision for the payment of royalties, taxes, fees and other fiscal imposts. A special mining
licence holder may, in certain circumstances, amend the programme of the mining operations agreed with the MC.
Tax laws relating to mining
Currently, the main tax laws in Tanzania comprise the Finance Act, 2015 (No. 16), which came into force on 1 July 2015, the
Finance Act, 2017 (No. 4), which came into force on 1 July 2017, and currently the Finance Act, 2022 (No. 5), which came into
force on 1 July 2022. All tax laws impose and revise certain taxes, duties, levies and fees. Among other provisions, inspection or
clearance fees on the exportation or domestic use of minerals were introduced. Such exportation or domestic use is restricted
unless such minerals have been inspected or cleared at the mining areas, ports, airports, border or posts and the clearing fee of
one percent of the gross value of the minerals has been paid by the exporter or any other person in possession thereof. Local
government levies and environmental management fees and charges apply as well.
Effective 20 July 2017, the Value Added Tax Act, 2014 (No. 5) (the “VAT Act”) was amended in order to restrict VAT relief for VAT
input tax paid by mining companies on goods and services. Prior to the enactment of this amendment to the VAT Act, mining
companies were entitled to 100 percent VAT relief in respect of the goods and services they purchased. The amendment
prohibits refunds for VAT input tax incurred on a series of raw products, including the exportation of “raw minerals”.
Subsequently, the Tanzania Revenue Authority (“TRA”) denied our applications for VAT input credit refunds, which amounted to a
total of $153 million (after discounting provisions) as of 31 December 2023, covering the period from July 2017 onwards, on the
basis that all of the gold doré that we export constitutes “raw minerals” for purposes of the VAT Act. In response, the Company
filed formal notices of objection with the TRA stating that the exportation of gold doré is, in its view, not covered by the restriction
since doré does not fall within the category of “raw minerals” as used in the VAT Act. On 22 February 2019, the Tanzania Mining
Act was amended to introduce a definition for “raw minerals” which supports our interpretation that gold doré is excluded from the
prohibition. On 1 July 2020, the Finance Act, 2020 (No. 8), amended the VAT Act, without retrospective effect, in order to remove
the restrictions on VAT input tax credits for the exportation of “raw minerals” as well as a series of other raw products. This recent
amendment confirms the technical basis for VAT input tax recovery for mineral exporters from July 2020 onwards. VAT claims
from July 2020 onwards are subject to verification procedures by the TRA before any refunds will be received. In 2023, the
Company was able to offset $73 million of verified VAT claims (from July 2020 onwards) against its corporate tax liability in
Tanzania. Discussions with the TRA are ongoing to resolve our historical claims for VAT input credit refunds for the period from
July 2017 to June 2020.
Natural resources, export and other rules
Natural resources legislation
In Tanzania, two laws in respect of natural resources came into force in July 2017: the Natural Wealth and Resources Contracts
(Review and Re-negotiation of Unconscionable Terms) Act, 2017 (No. 6) (the “Unconscionable Terms Act”) and the Natural
Wealth and Resources (Permanent Sovereignty) Act, 2017 (No. 5) (the “Permanent Sovereignty Act” and together with the
Unconscionable Terms Act, the “Natural Resources Laws”). Implementing regulations were published in January 2020. The
Natural Resources Laws provide that Tanzania has sovereignty over its natural resources and that all arrangements or
agreements that relate to “natural wealth and resources” are subject to review by the National Assembly to ensure that they are
in the interests of the people of Tanzania. As a result of such review, all unconscionable terms as interpreted in accordance with
the law may be re-negotiated or expunged from the agreement. In addition, under the laws, disputes over natural wealth and
resources are not subject to any proceedings in any foreign court or tribunal. As a result, investors are restricted from accessing
international dispute resolution mechanisms. Accordingly, companies are now required to adopt Tanzanian law and local dispute
resolution in all mining agreements. As such, all disputes are handled by Tanzanian judicial bodies or any other Tanzania
government body vested with powers to resolve disputes. In addition, to ensure that the Government and the people of Tanzania
69
obtain an equitable stake in the exploitation of mining resources, all project earnings must be retained in Tanzanian banks.
Investors are also prevented from freely exporting raw minerals and repatriating funds.
Section 6 of the Unconscionable Terms Act specifically provides that where there is an unconscionable term, the National
Assembly may pass a resolution for re-negotiation of the agreement whereupon the Government shall serve notice to the
investor to re-negotiate the term or agreement. The Government and the particular investor have 90 days from the notice date to
re-negotiate the term or agreement. If both parties fail to revise the unconscionable term, the term will be deemed removed from
the agreement. A term is considered “unconscionable” under the Unconscionable Terms Act if, among other grounds, the
requirements or provisions of the agreement restrict the right of the state to exercise authority over foreign investment within the
country, and in accordance with the laws of Tanzania, are inequitable and onerous to the state, secure preferential treatment
designed to create a separate legal regime to be applied discriminatorily for the benefit of a particular investor, deprive the
people of Tanzania of the economic benefits derived from subjecting natural wealth and resources to beneficiation in the country,
or subject the state to the jurisdiction of foreign laws and foreign courts or tribunals.
State participation
On 23 September 2022, the Mining (State Participation) Regulations, 2022 (the “SPR 2022”) came into force. The SPR 2022
required every mining licence or special mining licence holder to give notice to the MC to initiate negotiations to enable the
Government of Tanzania to acquire a shareholding in the mining operation by 23 December 2022. On 9 December 2022, the
Company notified the MC that it had already initiated negotiations with the Government of Tanzania prior to the coming into force
of the SPR 2022. The Government’s equity interest must consist of a non-dilutable free-carried interest in the mining operation
ranging between 16 percent and 50 percent depending, in part, on the quantification of tax expenditures enjoyed by the mining
entity during its establishment and on the extent of Government development of public infrastructure servicing the mining
operation. The free-carried interest shares (the “FCI shares”) will be regarded as preferred shares and will entitle the
Government to a dividend. Further, the FCI shares give the Government the right to appoint two directors (out of five) of the
company engaged in the mining operation and the right to approve at least two suitable persons to the top executive
management of the company engaged in the mining operation as may be agreed in the shareholders agreement. Any other
management positions created by the company engaged in the mining operation shall be shared with the Government on a ratio
of 3:1. The SPR 2022 also provides for the non-deductibility of royalty payments in the calculation of corporate income tax.
Local participation policy
On 15 September 2015, the Non-Citizens (Employment Regulation) Act, 2015 (No. 1) (the “Non-Citizens Act”) came into force
which vests powers concerning work permits with the Labour Commissioner. Therefore, non-citizens wishing to be employed in
the country are required to apply and be granted a work permit before applying for a residence permit. Before granting the work
permit, the Labour Commissioner must be satisfied that all efforts have been explored to acquire a local expert. Further, the
company is required to submit a succession plan to both the Labour Commissioner and the MC which sets out a well-articulated
plan for the transfer of the non-citizen’s knowledge and expertise to Tanzanian citizens. Moreover, the Commissioner General of
Immigration is required to take into consideration conditions of the work permit issued by the Labour Commissioner when
granting a residence permit.
The Tanzania Investment Act No. 10 of 2022
On 2 December 2022, the Tanzania Investment Act, 2022 (No. 10) (the “Investment Act”) came into force. The Investment Act
restores the right to international arbitration and grants foreign investors access to settle disputes with the Tanzania Investment
Centre or the Government of Tanzania through arbitration. Pursuant to the Investment Act, parties to a dispute may agree to the
use of a local or foreign arbitration venue.
AngloGold Ashanti’s rights and permits
The Geita gold mine is located in the Lake Victoria goldfields of the Mwanza region of Tanzania. AngloGold Ashanti has
concluded a mining development agreement with the Ministry of Minerals on 24 June 1999 and was issued a special mining
licence (SML45/99) covering approximately 196 km2 for a period of 25 years, which expires on 26 August 2024. The application
for the renewal of the special mining licence (SML45/99) was filed with the MC on 13 July 2023 and is currently pending. On 9
October 2014, an addendum to the mining development agreement was entered into ratifying, among other matters, an increase
in the royalty rate from three percent to four percent with effect from 1 May 2012. In March 2020, Geita Gold Mining Limited
received the consent of the Minister of Minerals to change the mining method under its special mining licence from open pit to
underground method, subject to the requisite terms and conditions. Within the special mining licence area, there are also seven
primary mining licences of approximately 0.63 km2 in total which belong to third parties. Furthermore, AngloGold Ashanti holds
prospecting licences covering (i) an area of 23 km2 in the immediate vicinity of its special mining licence area, and (ii) an area of
649 km2 located in the Dodoma, Singida and Shinyanga regions, but none of these areas contain any Mineral Reserve. All
licences are in good standing.
70
AUSTRALIA
General laws relating to mining
In Australia, with a few exceptions, all onshore minerals are owned by the Crown. The respective Minister for each state and
territory is responsible for administering the relevant mining legislation enacted by the states and territories. Native title legislation
applies to certain mining tenements within Australia. Australia recognises and protects a form of native title that reflects the
entitlement of Aboriginal people to their traditional lands in accordance with their traditional custom and laws. Should native title
claims or determinations exist, certain native title processes and procedures will apply under the Native Title Act 1993 (Cth) (the
“Native Title Act”) before the tenure is granted. Tenure may be granted subject to conditions relating to native title rights. In the
mining context, native title matters are managed as part of the tenement grant process. If disputes arise in relation to the grant of
a particular tenement, they can be referred to the National Native Title Tribunal, established under the Native Title Act, for
resolution. Native title legislation also provides a framework for compensation to be paid for acts that affect native title rights and
interests. Ordinarily, the relevant Commonwealth or State government is liable to pay compensation for acts attributable to it.
However, in the state of Western Australia, the Mining Act 1978 (WA) provides that an applicant for the grant of, or the holder of,
a mining tenement is responsible for native title compensation, if determined to be payable, to native title holders.
Federal, state and territory Aboriginal and non-Aboriginal heritage laws operate in parallel to the native title legislation. State and
territory heritage laws exist predominantly for the purposes of managing the impact of developments on sites, objects and areas
of heritage significance. In Western Australia, impacts to Aboriginal heritage are once again regulated by the Aboriginal Heritage
Act 1972 (WA) (“AH Act”) since the Aboriginal Cultural Heritage Act 2021 (WA) was repealed on 15 November 2023. The AH Act
establishes a framework for the protection of “Aboriginal sites” in Western Australia. Where it is not possible for development
plans to avoid damaging or altering any Aboriginal site, the land owner must submit written notice to the Aboriginal Cultural
Heritage Committee ("ACH Committee") identifying that use of the land is required for a purpose which would likely result in a
breach of the AH Act without ministerial consent. The competent minister will consider the recommendation of the ACH
Committee and decide whether to consent to the use of the land which is the subject of the notice. Where an area of heritage
significance is placed on the national or world heritage registers, federal approval processes may also apply. To date, there has
not been any significant impact on any of AngloGold Ashanti’s tenure due to native title or heritage legislation.
AngloGold Ashanti’s operating properties are located in the state of Western Australia where tenure is issued under, and mining
operations are governed by, the Mining Act 1978 (WA). The most common forms of tenure in Western Australia are exploration
and prospecting licences, mining leases, miscellaneous licences and general purpose leases. In most Australian states, if the
holder of an exploration licence establishes indications of an economic mineral deposit in the area covered by the exploration
licence and complies with the conditions of the grant, the holder of the exploration licence has a priority right against all others to
be granted a mining lease which gives the holder exclusive mining rights with respect to minerals on the property.
It is possible for an individual or entity to own an area of land (including for infrastructure purposes) and for another individual or
entity to be granted the right to explore for or mine any minerals located on or under the surface of the same area. The maximum
initial term of a mining lease in Western Australia is 21 years and the holder has the right to renew the lease for an additional 21
years. Subsequent renewals are granted at the discretion of the respective state or territory’s minister responsible for mining
rights. In Western Australia, mining leases can only be assigned with the prior written consent of the minister.
Tax laws relating to mining
Government royalties are payable by the holder of mining tenure in respect of minerals obtained from the relevant area of land at
the rates specified in the relevant legislation in each state or territory. The royalty on gold production in Western Australia is
payable quarterly at a fixed rate of 2.5 percent of the royalty value of gold metal produced. The royalty value is calculated by
multiplying the amount of gold produced during a given month by the average gold spot price for that month. In addition, the
holder of a mining tenement is required to pay annual rent in respect of the tenement. In Western Australia there is a minimum
annual expenditure requirement for prospecting and exploration licences and mining leases. Exemptions from the expenditure
requirement can be obtained if certain conditions are satisfied.
Environmental laws relating to mining
Mining tenements will be granted with endorsements and conditions relating to protection of the environment. Exploration and
mining operations may also require separate approval from the state, territory or federal environment minister, which may require
completion of an environmental impact assessment (including a public consultation period) pursuant to applicable environmental
protection legislation prior to commencement. Further, a works “construction” approval and an operating licence under the
relevant environmental protection legislation in the state or territory may also be required for certain mine processing or mining-
related operations. In Western Australia, legislation removing the distinction between “works approvals” and “licences” is
expected to enter into force in 2024 such that, following the effective date, only a “licence” will be required for “prescribed
activities”, which include relevant works and operations on a mining lease, and not a separate “works approval”. Depending on
the jurisdiction, additional approvals may be required for the removal of native vegetation within the tenement, and the taking and
use of water for exploration and mining operations.
71
AngloGold Ashanti’s rights and permits
AngloGold Ashanti has been granted 21-year term mining leases with rights of renewal to all of its mining areas in Australia,
including its proportionate share of joint venture operations and accordingly it has, together with its joint venture partners where
applicable, the exclusive right to mine in those areas. Both the Group and its joint venture partners are fully authorised to conduct
operations in accordance with relevant laws and regulations. The mining leases and rights of renewal cover the current life-of-
mine at AngloGold Ashanti’s operations in Australia.
At Sunrise Dam, one mining lease (M39/1116) covers the deposit and mine infrastructure (approximately 7,808 hectares) and
another mining lease (M39/1117) covers the water extraction infrastructure used to supply the operation with water
(approximately 1,768 hectares). Both leases are currently in good standing, with expiry dates in 2038. Both mining leases are
within an area which is the subject of the Nyalpa Pirniku native title determination, which determination was made by the Federal
Court of Australia on 31 October 2023. In relation to the area of M39/1116 and M39/1117, the native title rights and interests are
non-exclusive in nature. The determination records that these mining leases prevail over native title.
The Butcher Well joint venture has security of tenure for all current exploration licences and for the contiguous mining leases that
covers its Mineral Resource. There are three mining leases: mining lease (M39/165) which covers 602.35 hectares with expiry
date in 2030, mining lease (M39/166) which covers 990 hectares with expiry date in 2030 and mining lease (M39/230) which
covers 446.4 hectares with expiry date in 2032. These mining leases are also within the area of the Nyalpa Pirniku native title
determination (see above). In relation to the area of M39/165, M39/166 and M39/230, the native title rights and interests are non-
exclusive in nature. The determination records that these mining leases prevail over native title.
At Tropicana, the deposit is situated upon a single mining lease (M39/1096) covering approximately 27,228 hectares, which is
currently in good standing, with an expiry date in 2036. This mining lease is wholly surrounded by an area which is the subject of
the Nangaanya-ku Part A native title determination, which determination was made by the Federal Court of Australia on 29
November 2021, although the determination excludes M39/1096 itself. In relation to the area surrounding M39/1096, the native
title rights and interests are exclusive in nature. M39/1096 itself is subject to Part B of the Nangaanya-ku native title claim, which
is pending determination of the remaining issues by the Federal Court of Australia.
AngloGold Ashanti Australia Limited is also conducting early stage exploration activities in Queensland under the Mineral
Resources Act 1989 (QLD). AngloGold Ashanti holds 26 exploration permits covering 606,103 hectares. Each permit is granted
with an initial term of five years, renewable for two further periods of not more than five years each.
AMERICAS
Argentina
General laws relating to mining and land ownership
Mining regime
The Argentinean Mining Code governs mining activity in the country. Special regimes exist for hydrocarbons and nuclear
minerals. In the case of most minerals, the Argentinean Mining Code establishes that the owner of the land is not the owner of
the mineral rights; these are held by the national or provincial governments (depending on the location of the minerals). The
national or provincial government, as applicable, is required by the Argentinean Mining Code to grant whomever discovers a new
mine title to the mining concession.
The Argentinean Mining Code regulates exploration permits as well as mining concessions, or exploitation rights. Exploration
permits grant their holders exclusivity rights to any mineral discoveries, including those made by a third party within the
exploration area covered by the permit. Exploration permits are limited in time and as to the extent of the exploration area, are
subject to the payment of a single-time fee, and also require a minimum exploration work programme and schedule to keep the
permit in force. Priority for receiving a mining concession is given to the registered discoverer of the mine, which holds the
exploration permit. Once the application for a mine has been submitted, the applicant may commence works and must submit a
legal survey of the units requested for the new mine. The application and the legal survey may be opposed by third parties
following specific proceedings set forth in the Argentinean Mining Code. Approval and registration of the legal survey by the
provincial mining authority constitutes formal title to the mining concession.
Holders of mining concessions must comply with three main conditions: payment of an annual fee, investment of a minimum
amount of capital, and the carrying out of a reasonable level of exploitation. Failure to do so could lead to forfeiture of the mining
concession, which would then revert back to the Province.
In addition to the Argentinean Mining Code, between 1993 and 1995, Argentina implemented several federal laws to offer foreign
companies attractive incentives for exploration and mining in Argentina, the Mining Investment Law (Law No. 24, 196), as
amended (the “Mining Investment Law”), and related legal provisions being the most important one. Such incentives include,
72
among other matters, import duty exemptions, accelerated depreciation of fixed assets, a three percent cap on provincial
royalties set at pit-head value on the mineral extracted, value added tax refunds for exploration-related expenses incurred by
companies registered under the Mining Investment Law, and, subject to the filing of a feasibility study for the relevant mining
project, a 30-year stability as to the tax burden on the project and the customs and foreign exchange regimes and duties. Cerro
Vanguardia S.A. (“CVSA”) obtained its tax, customs and foreign exchange stability certificate in 1996.
Glacier Law
On 30 September 2010, the National Law on Minimum Requirements for the Protection of Glaciers (Law No. 26, 639) (the
“Glacier Law”) was enacted in Argentina, banning new mining exploration and exploitation activities on glaciers and “peri-glacial”
areas. The Glacier Law establishes a broad definition of “peri-glacial” areas that, together with glacial areas, must be surveyed
by an existing national government agency specifically appointed to this end every five years. The area where the Cerro
Vanguardia project is located does not include any glaciers or peri-glacial areas according to the inventory of glaciers which was
published in June 2018.
Rural Land Law
On 27 December 2011, the Argentinean National Congress passed a law on the Regime for Protection of National Domain over
Ownership, Possession or Tenure of Rural Land (Law No. 26, 737) (the “Rural Land Law”) which implemented a set of rules
restricting the ownership of rural land by foreigners (including foreign individuals or any kind of legal entity controlled by foreign
individuals or legal entities). The main restrictions are as follows: (i) foreigners cannot own in the aggregate more than 15
percent of the entire rural land of Argentina, the same cap being applicable to each Province and Municipality; (ii) foreigners will
not be allowed to purchase more than 1,000 hectares in the so-called “zona núcleo”, which comprises the main agricultural areas
of central Argentina or an “equivalent” surface depending on the location of the land and its productive potential; and (iii)
foreigners will not be allowed to buy land that contains, or is adjacent to, relevant and permanent water bodies (such as rivers
and lakes). Although exploration permits and mining concessions are not the subject matter of the restrictions placed by the
Rural Land Law, certain rights granted to foreign mining companies under the Argentinean Mining Code may be restricted by this
new law. For example, the right that holders of mining concessions currently have to force the surface owner to sell the land to
the holder of the mining concession might be restricted if the concession holder is a foreign individual or a legal entity controlled
by foreigners.
The Rural Land Law was repealed by means of Emergency Decree No. 70/2023 (Decreto de Necesidad y Urgencia) (“DNU”) on
29 December 2023 and its provisions are therefore no longer in force. The DNU remains valid as long as it is not rejected by
both Houses of the Argentinean National Congress or declared unconstitutional by an Argentinean court. However, even if the
DNU is subsequently rejected or overturned, any rights acquired or legal acts carried out during its effectiveness will remain
valid.
Federal Mining Agreement
On 13 June 2017, the national government and the provinces in whose territories the main mining projects of Argentina are
located, signed the New Federal Mining Agreement (“FMA”). The purpose of the FMA is, amongst other things, to increase
provincial revenues from the mining industry by creating legal entities owned by provincial governments that would work in
association with private mining companies. This scheme is not new in Argentina and it has been used by some provincial
governments, amongst them the Santa Cruz Province (through Fomicruz), in which the Cerro Vanguardia project is located. The
FMA also contemplates other forms of revenues such as the formation of special trusts to be funded by mining companies to
finance education, health and other programmes. Additionally, the FMA included setting forth mining royalties up to three percent
of the gross value of commercialised minerals, without any deductions other than VAT. As the FMA has not yet been converted
into law by the National Congress, its provisions are neither binding nor enforceable.
In Argentina, the current regulatory regime of royalty payments is expected to change and several different options and payment
thresholds have been discussed. In December 2012, the Santa Cruz Province changed the mining royalty from one percent to
three percent calculated at pit-head value of the mineral extracted thus bringing it to the cap of the Mining Investment Law.
Foreign exchange and export rules
Foreign exchange controls
On 1 September 2019, by means of Executive Decree No. 609/2019 (the “Export Controls Decree”), the Argentinean national
government reinstated foreign exchange and export controls. The Export Controls Decree and related regulations of the Central
Bank of Argentina, among other measures, impose the obligation of Argentinean residents to transfer to Argentina and/or sell for
Argentinean pesos in the Argentinean foreign exchange market (mercado de cambios) the countervalue (contravalor) from their
exports of goods within a specified period as well as limit the ability of both Argentinean and non-Argentinean residents to
acquire foreign currency in the Argentinean foreign exchange market and to transfer such foreign currency to and from Argentina.
The export of goods is regulated by the Consolidated Text on “Foreign Trade and Exchange” issued by the Argentinean Central
73
Bank (as amended from time to time) which establishes the specific regulatory requirements to implement the measures adopted
by the national government in this area.
From 1 January 2023, Argentinean residents, such as CVSA, must comply with certain supplementary provisions in order to
access the foreign exchange market without prior approval of the Argentinean Central Bank, unless an exception applies. In
general, access to the foreign exchange market for the payment of dividends to non-resident shareholders is subject to prior
approval from the Argentinean Central Bank, unless certain requirements are complied with.
CVSA had a cash balance equivalent to $89 million at 31 December 2023. The cash balance is available to be paid to AngloGold
Ashanti’s offshore ($47 million (equivalent)) and onshore ($4 million (equivalent)) investment holding companies in the form of
declared dividends. Applications have been made to the Argentinean Central Bank to approve the purchase of U.S. dollars in
order to distribute offshore dividends related to the 2019, 2020 and 2021 financial years of $23 million (equivalent) to AngloGold
Ashanti. During the second half of 2023, CVSA submitted a new application to the Argentinean Central Bank to approve the
purchase of U.S. dollars in order to distribute additional offshore dividends of $24 million (equivalent) for the declared dividends
related to the 2022 financial year. Also, under a special regime established for dividend payments, a new petition to distribute a
portion of the offshore dividends applied for, in the amount of $45 million (equivalent), was submitted to the Argentinean Central
Bank during the third quarter of 2023. During 2023, AngloGold Ashanti did not receive any offshore dividends from CVSA. While
the remaining approvals are pending, the cash remains fully available for CVSA’s operational and exploration requirements.
Export duties
On 21 December 2019, the National Law on Social Solidarity and Productive Reactivation (Law No. 27, 541) (the “Solidarity
Law”) was enacted. The Solidarity Law granted the national government power until 31 December 2021 to impose export duties
which may not exceed certain caps. For example, the Solidarity Law provides that export duties on mining exports cannot
exceed eight percent of the taxable value or official FOB price. On 2 October 2020, the national government published Decree
No. 785/2020 (the “Export Duties Decree”) which sets an export duty rate of eight percent for certain goods, including doré bars
and gold alloys, and revoked the provisions of Decree No. 793/2018 which had previously set the export duty at 12 percent ad
valorem. While the Export Duties Decree was set to expire at the end of 2021, on 31 December 2021, the national government
published Decree No. 908/2021, extending the deadline of export duties on certain goods, including doré bars and gold alloys,
until 31 December 2023. A new bill has been submitted by the national government to the Argentinean National Congress to
maintain export duties on certain goods, including doré bars and gold alloys, but it is currently unclear which rate is being
considered. Until a new bill has been formally adopted, there are no export duties on doré bars and gold alloys. Any export
duties, if not compensated with other tax reductions, affect the tax stability guarantee granted to CVSA in 1996 in light of the fact
that at the time export duties were zero percent.
On 26 February 2019, the Argentinean tax and mining authorities published a resolution (RC 4428/2019) establishing an
administrative procedure to be followed to obtain the reimbursement or compensation of federal taxes paid in excess of the total
tax burden provided for by the applicable tax stability guarantee (the “2019 Procedure”). CVSA initiated the 2019 Procedure to
claim compensation for the export duties it paid in 2018, 2019 and 2020 as export duties are not contemplated by its tax stability
guarantee. Prior to the publication of RC 4428/2019, CVSA had already submitted to the tax authorities claims for reimbursement
of the export duties it paid from 2008 to 2015.
Pursuant to the 2019 Procedure, the National Mining Secretariat issued favorable opinions regarding CVSA’s claims in respect of
fiscal years 2018 and 2019, which amounted to approximately $0.4 million and $1.4 million, respectively, as of 31 December
2023. These claims are currently under review by the relevant customs authorities. On 14 July 2021, CVSA submitted its claim in
respect of fiscal year 2020, which amounted to approximately $2.7 million as of 31 December 2023. The National Mining
Secretary has not yet issued an opinion regarding this claim.
Furthermore, CVSA has requested the tax authorities to apply the 2019 Procedure in respect of its historical claims for fiscal
years 2008 to 2015 during which the imposition of export duties also exceeded CVSA’s total tax burden under its tax stability
guarantee. However, these claims, which amounted to approximately $0.7 million as of 31 December 2023, are still being
reviewed under the rules to challenge export duties instead of the 2019 Procedure. CVSA has appealed the application of those
rules and a decision on this issue is pending.
On 9 June 2022, the Argentinean tax and mining authorities published a resolution (RC 5205/2022) establishing a new
administrative procedure to be followed to obtain the reimbursement or compensation of federal taxes paid in excess of the total
tax burden provided for by the applicable tax stability guarantee (the “2022 Procedure”). This 2022 Procedure replaces the 2019
Procedure established by RC 4428/2019. The Argentinean tax and mining authorities have requested CVSA to update its claims
in respect of fiscal years 2018 and 2019 to the 2022 Procedure, which CVSA is currently in the process of doing.
On 20 September 2022, CVSA submitted its claim for compensation for the export duties and income tax for the payment of
dividends to its foreign shareholders in respect of fiscal year 2021, which amounted to approximately $2.3 million as of 31
December 2023, pursuant to the 2022 Procedure. In addition, on 4 October 2023, CVSA submitted its claim for compensation for
the export duties and income tax for the payment of dividends to its foreign shareholders in respect of fiscal year 2022, which
74
amounted to approximately $3.4 million as of 31 December 2023, pursuant to the 2022 Procedure. These claims are currently
under review by the National Mining Secretary.
In total, AngloGold Ashanti’s net export duty receivables (after discounting provisions) in Argentina amounted to $4 million as of
31 December 2023.
Environmental laws relating to mining
Any mining company wishing to commence or modify any mining-related activity, as defined by the Argentinean Mining Code,
including prospecting, exploration, exploitation, development, preparation, extraction, and storage of mineral substances, as well
as property abandonment or mine closure activity, is required to prepare and submit to the competent provincial environmental
authority an Environmental Impact Assessment (“EIA”) prior to commencing the work. Each EIA is required to describe the nature
of the proposed work, its potential risk to the environment, and the measures that will be taken to mitigate that risk. If accepted
by the competent authority, the EIA is used as the basis to create a Declaration of Environmental Impact (“DEI”) to which the
mining company is required to adhere during the mining-related activity at issue. The DEI is required to be updated at least on a
biannual basis. Sanctions and penalties for non-compliance with the DEI are outlined in the Environmental Protection section of
the Argentinean Mining Code, and may include warnings, fines, suspension of quality certifications, obligations to restore the
environment, temporary or permanent closure of activities, and withdrawal of authorisation to conduct mining-related activities.
AngloGold Ashanti’s rights and permits
The mining concession holder of Cerro Vanguardia, the Company’s operation in Argentina, is AngloGold Ashanti’s partner,
Fomento Minero de Santa Cruz S.E. (“Fomicruz”), which is wholly owned by the Santa Cruz Province. On 27 December 1996,
Fomicruz entered into a usufruct agreement whereby CVSA was granted an irrevocable right to exploit the Cerro Vanguardia
deposit (encompassing an area of approximately 543 km2) for a 40-year period. The mining licence (402642/CV/97), which
covers the full Mineral Reserve, expires on 26 December 2036. CVSA is a corporation incorporated in Argentina indirectly
controlled by AngloGold Ashanti (92.5 percent), with Fomicruz as minority shareholder (7.5 percent). On 14 August 1996, CVSA
obtained its tax, customs and foreign exchange stability certificate, which expires in 2026.
Brazil
General laws relating to mining and land ownership
The Brazilian Constitution of 1988 states that, for purposes of exploration and exploitation, deposits and other Mineral Resources
constitute property separate from the soil and belong to the Federal Union. Exploration and exploitation of such Mineral
Resources may take place only with the Federal Union’s concession and in such a way as to protect the national interest.
Federal law sets out civil, penal and administrative sanctions for conduct and activities deemed harmful to the environment.
In Brazil, the National Mining Agency (“ANM”) is the state body within the Mines and Energy Ministry (“MME”) that is responsible
for: (i) the registration of mining titles, (ii) the grant of authorisations and concessions, (iii) the supervision of mining activities and
mining titleholders, and (iv) the issuance of supplementary rules in relation to mining activity.
Under the current Brazilian Mining Code, there are two kinds of mines: (i) claimstake mines (minas manifestadas), for which
rights were acquired before 1934 and exist independently of any mining licence or authorisation from the Federal Government
and for which the Mineral Resources constitute property of the landowner, and (ii) granted mines, which are those that rely on
grants from the Federal Government for mineral exploration or exploitation (pursuant to the Brazilian Constitution of 1988).
AngloGold Ashanti’s operations in Brazil consist of both claimstake mines and granted mines.
Mining activities in granted mines must be performed in two defined stages: (i) exploration, which entails defining and evaluating
the deposit and determining the feasibility of exploitation, and (ii) exploitation, which involves coordinating operations aimed at
the industrial exploitation of the mineral deposit, from the extraction of useful minerals to their processing. Exploration
authorisations issued by the ANM are valid for one to three years. One extension can be obtained automatically as long as it is
justified. For more than one extension, the extension request will have to satisfy specific legal requirements. In contrast,
exploitation rights, once granted, are valid for the lifetime of the deposit, provided the mining titleholder complies with all legal
requirements. Pursuant to these requirements, for example, titleholders must (i) start work on mineral exploitation within six
months from the date of publication of the Exploitation Concession, (ii) continue their mining activities until the mineral deposit
has been exhausted, in accordance with the Economic Exploitation Plan (Plano de Aproveitamento Econômico) approved by the
ANM, and (iii) refrain from suspending mining activities without prior notice to the ANM.
Tax laws relating to mining
During the exploration period, the mining titleholder has to pay an Annual Rate per Hectare (Taxa Annual por Hectare or “TAH”),
subject to a maximum value set by law. In the exploitation period, regardless of the legal regime governing the project (whether
claimstake or granted mines), the mining titleholder has to pay the Financial Compensation for Exploiting Mineral Resources
75
(Compensação Financeira pela Exploração Mineral or “CFEM”). The CFEM which is 1.5 percent for gold is currently calculated
based on revenues.
At the end of 2011 and the beginning of 2012, the states of Minas Gerais, Pará, Amapá and Mato Grosso do Sul each created a
new “inspection and control” tax (duty) on extraction and exploration activities as well as on the use of Mineral Resource carried
out in those states. In the state of Minas Gerais, gold ore and silver ore are exempted from the collection of this new duty. At the
end of 2020, the state of Goiás created a new “inspection and control” tax (duty) on extraction and exploration activities carried
out in this state, which currently still needs to be implemented. The constitutionality of these “inspection and control” taxes was
upheld by the Supreme Court of Brazil on 1 August 2022.
In December 2023, the National Congress adopted a comprehensive tax reform in Brazil which replaced five separate
consumption taxes with a dual VAT system (i.e., one charged by the federal authorities and the other at a regional level). In
addition, a selective tax was introduced targeting goods and services that are considered harmful to the environment and health.
With respect to the extractive sector, it is expected that such selective tax will not exceed one percent of the market value of the
goods, regardless of its destination. The full implementation of the new tax regime, including the selective tax, is expected at a
later stage.
Environmental laws relating to mining
In recent years, Brazilian authorities, both at the federal and state levels, have generally increased scrutiny of mining operations,
and of TSFs in particular, and have adopted strict laws and regulations applicable to the approval, licensing, construction,
management, closure, decommissioning and decharacterisation (or “descaracterização”, which generally means that the
structure no longer serves its primary purpose of acting as a tailings containment) of TSFs in Brazil.
At the federal level, a 2019 resolution adopted by the ANM (ANM Resolution No. 13/19) prohibited the upstream method for the
construction or heightening of tailings dams throughout the national territory of Brazil and required operators to cease all storage
and disposal activities at such TSFs (known as “deactivation” or “desativação”). Operators were further required to
decharacterise such TSFs by the applicable compliance date (i.e., by 2022 to 2027, depending on the capacity volume). In
addition, Federal Law No. 14.066/20, adopted in October 2020, also imposed requirements on companies to decharacterise
upstream TSFs by February 2022, with extensions to the original compliance deadline permitted by consent of the ANM based
on the technical plan for decharacterisation. Serra Grande submitted timely requests to obtain an extension of the compliance
deadline until 2025 in line with the timeline set forth in ANM Resolution No. 13/19 and, in May 2022, the ANM issued a technical
note allowing the extension until 2025. As a result, the Serra Grande tailings dam in the state of Goiás is currently required to be
decharacterised by 15 September 2025; however, Serra Grande will apply to the ANM for an additional extension, which request
will be subject to review by the ANM. The Serra Grande mine has ceased hydraulic deposition at the TSF and migrated to dry-
stacking operations.
With respect to downstream (or “centerline”) TSFs, Federal Law No. 14.066/20 also required companies, to the extent that
communities are located in the self-rescue zone of those TSFs, to implement one of the following measures for such structures:
either (i) the structure must be deactivated and decharacterised, (ii) the population must be relocated, with reparations for loss of
cultural heritage, or (iii) reinforcement works that guarantee the effective stability of the structure must be carried out, by decision
of the public authorities, taking into account the previous nature of the dam in relation to the occupation and technical-financial
viability of the alternatives. Even if reinforcement works are completed, decharacterisation of those TSFs will be required at the
end of the life of the mine. All of the TSFs operated by AngloGold Ashanti in Brazil have communities located in self-rescue
zones.
At the state level, the state legislator in the state of Minas Gerais has also adopted laws, as well as several related decrees, with
respect to TSF safety which are required to be implemented in conjunction with the federal requirements.
As of 31 December 2022, AngloGold Ashanti had fully transitioned to dry-stacking operations for tailings storage at each location
in Brazil. Total expenditures in 2023 to deactivate and decharacterise existing structures amounted to approximately $16 million.
Total expenditures for work required to comply with TSF-related requirements during the period 2024-2027 are expected to be
material but, based on preliminary estimates to date, AngloGold Ashanti anticipates that annual expenditures during that period
will decline over time. Neither ANM Resolution No. 95/22 (see below) nor Federal Law No. 14.066/20 requires removal of all
tailings material in connection with the decharacterisation of TSFs.
In addition, ANM Resolution No. 95/22, which became effective in February 2022, established new criteria for the operational
management of TSF structures, changed the criteria related to the risk classification of TSF structures and emergency levels and
set new criteria for the suspension, embargo (order to stop operations) and interdiction of TSF activities. Operators of TSFs were
mandated to conduct and submit risk assessments to the ANM by December 2022 and are required to update those risk
assessments every two years. Operators are also required to periodically obtain certifications from external consultants of the
geotechnical stability of TSF structures and the adequacy of emergency response plans. As of the date hereof, all of AngloGold
Ashanti’s TSFs in Brazil have received certification by external consultants of on-site emergency response plans (Declaração de
Conformidade e Operacionalidade (“DCO”)) as well as certification by external consultants of geotechnical stability (Declaração
de Condição de Estabilidade (“DCE”)) consistent with the new standards; in addition, the DCO for CdS I is still pending approval
76
by the ANM. In addition, at the Calcinados TSF, a risk assessment conducted in December 2022 with oversight from external
consultants, as required by Brazilian regulations, concluded that additional buttressing should be completed to align the TSF’s
post liquefaction factor of safety with international standards currently considered best practice. Engineering and geotechnical
work was conducted by external consultants in 2023 to evaluate other potential options for alignment of the Calcinados TSF with
international standards, which concluded in March 2024 that additional buttressing will not be required. Tailings deposition at the
Calcinados TSF, as well as processing of gold concentrate at the Queiroz plant, which services the Cuiabá mine complex
(composed of the Cuiabá and Lamego mines), is suspended until the decharacterisation plan for the Calcinados TSF is updated,
and any related future construction work, if required, is complete, and a pending legal proceeding with respect to the related
Cocoruto TSF is resolved. Mining of ore continues at Serra Grande and the Cuiabá mine complex, except at CdS which was
placed on care and maintenance in August 2023.
The Company’s operations in Brazil are also subject to ANM resolutions relating to administrative sanctions for non-compliance
with mining and dam safety regulations which significantly increased the potential amount of applicable fines and penalties. ANM
resolutions also set forth guidelines related to the active and passive monitoring of TSFs following decharacterisation of such
TSFs and new technical criteria to be considered in connection with the construction of new TSFs.
AngloGold Ashanti’s rights and permits
At AGA Mineraçao, Cuiabá has a series of ANM mining concessions and exploration permits. Cuiabá’s mining concessions
include mining concession No. 000.323/1973 (covering an area of 3,661.52 hectares), mining concession No. 830.937/1979
(covering an area of 433.60 hectares) and mining concession No. 831.027/1980 (covering an area of 382.42 hectares). Cuiabá
has requested the ANM to consolidate these three mining concessions in a single mining group concession No. 931.006/2022
(4,477.54 hectares), which request is currently pending.
Lamego has a series of ANM mining concessions and exploration permits. Lamego’s mining concessions include mining
concession No. 830.720/1981 (covering an area of 577.14 hectares), mining concession No. 831.554/1983 (covering an area of
462.09 hectares) and mining concession No. 832.238/2003 (covering an area of 583.45 hectares). These three individual mining
concessions are consolidated in a single mining group concession No. 932.710/2017 (1,622.68 hectares).
Córrego do Sítio (“CdS”) has a series of ANM mining concessions and exploration permits. CdS’s mining concessions include
mining concession No. 001.463/1963 (covering an area of 198.05 hectares), mining concession No. 002.429/1935 (covering an
area of 794.43 hectares), mining concession No. 002.887/1936 (covering an area of 1,221.11 hectares), mining concession No.
830.129/1982 (covering an area of 460.13 hectares), mining concession No. 830.351/1979 (covering an area of 920.56
hectares), mining concession No. 830.353/1979 (covering an area of 859.22 hectares), mining concession No. 830.767/1981
(covering an area of 1,000.00 hectares), mining concession No. 830.943/1979 (covering an area of 556.37 hectares) and mining
concession No. 833.472/2003 (covering an area of 7.57 hectares). These nine individual mining concessions are consolidated in
a single mining group concession No. 930.065/2018 (6.017,44 hectares). In August 2023, the Company placed the CdS mine on
care and maintenance.
At Serra Grande, the Company has a series of concessions and exploration permits. Serra Grande’s mining concessions include
mining concession No. 002.286/1935 (covering an area of 4,206.92 hectares), mining concession No. 860.352/1979 (covering an
area of 947.04 hectares), mining concession No. 860.824/1979 (covering an area of 1,000.06 hectares), mining concession No.
860.746/2005 (covering an area of 88.31 hectares), mining concession No. 862.103/1994 (covering an area of 125.37 hectares)
and mining concession No. 804.366/1975 (covering an area of 196.05 hectares). These six individual mining concessions are
consolidated in a single mining group concession No. 960.658/1987 (6,563.75 hectares).
All of the Company’s mining concessions in Brazil are currently active, in good legal and operational standing, and free of
liabilities and/or major obligations. Brazilian mining concessions remain valid up to the depletion of the Mineral Reserve and
Mineral Resource pursuant to the Economic Exploitation Plan approved by the ANM and in accordance with the required
environmental permits, and as a result do not have an explicit expiry date.
Colombia
General laws relating to mining and land ownership
General regime
The Colombian Constitution declares that the sub-soil and the non-renewable natural resources located within the Colombian
territory are the property of the Colombian State. The underlying principle of Colombian mining legislation for the granting of
mining concession contracts over free areas is first in time, first in law. Mining activities are regulated by the Colombian Mining
Code, Act 685, 2001.
The filing of an exploration and exploitation proposal triggers a right of preference to obtain rights over the targeted area,
provided it is available. Such area cannot exceed 10,000 hectares. Upon receipt of a proposal, the relevant government agency
77
determines whether another proposal or contract already governs the area. If there are no pre-existing claims, the government
agency grants the applicant a “free area”.
With respect to land ownership, a mining concession in Colombia does not grant the rights over the surface required to develop a
mining project. Therefore, in order to develop a mining project, it is required to acquire and secure access to the land (soil). This
can be achieved in several ways, such as (i) purchase of the land, (ii) a transit easement, (iii) a mining easement, and (iv) the
special acquisition process or expropriation.
Concession contract
As the sub-soil and the non-renewable natural resources located within the Colombian territory are property of the Colombian
State, the Colombian Mining Authority (Agencia Nacional de Minería) grants the authorisation to explore and exploit minerals
through a concession contract.
Such concessions allow concessionaires to conduct the studies, works and facilities necessary to establish the existence of
minerals and to organise their exploitation. Upon being awarded a mining concession, a company must take out an insurance
policy to cover the costs associated with potential environmental damage as well as breaches of its mining obligations. It may
then proceed with exploration activities. Once the exploration phase is complete, the concessionaire files a new plan regarding
proposed works and facilities. With the award of the mining concession or tenement contract, there are specified timelines for the
completion of the various phases of a mining project, e.g. exploration, construction, exploitation. The company must comply with
these timelines unless performance is suspended, for example, due to force majeure or these timelines are extended or
modified. A grant of force majeure is for one year and must be renewed on an annual basis. If the company does not comply with
the specified timelines for the completion of the various phases of a mining project, the mining authority may revoke the
company's concession contracts or mining licences. As a general matter, any company that wishes to obtain a renewal of its
concession contract must be up to date in all its legal and contractual obligations and must present a new plan of works and
facilities to be implemented after the contract is renewed.
PINES programme
In 2013, the national government instituted the PINES programme designed to aid promoting certain projects that are deemed to
have a national interest. This designation provides for greater oversight from the national government. Both of our current
advanced exploration projects (La Colosa and Quebradona) were considered of national strategic interest. Currently,
Quebradona remains in the PINES programme, but La Colosa was temporarily removed as such (until the force majeure is over).
Tax laws relating to mining
From the moment the concession contract is registered with the Mining Register, the concessionaire has several financial
obligations, including the payment of (i) a surface fee during the exploration, construction and assembly stage and (ii) royalties.
Once exploration is complete and the mining infrastructure in place, the concessionaire must begin paying royalties to the
Colombian government, consisting of a percentage of the primary product and sub-products being exploited. The percentage of
the royalty depends on the regulation in force when the concession contract is registered. In the case of the Quebradona project,
the deposit mainly consists of copper followed by gold and silver. There is a five percent royalty for copper on the production
value at the mine’s or well’s edge (i.e., when extracted from the subsoil). In case of gold and silver, a royalty of four percent on
the production valued at the mine’s or well’s edge (i.e., when extracted from the subsoil) was established.
Furthermore, Colombian law establishes that once the environmental licence is granted the concessionaire must invest one
percent of the project’s value to benefit the basins covered by the environmental licence.
Environmental laws relating to mining
In order to obtain an authorisation to carry out a mining project, a company must prepare an Environmental Impact Study (“EIA”)
for approval by the National Environmental Licensing Authority of Colombia (Autoridad Nacional de Licencias Ambientales or
“ANLA”). Global environmental licences are granted for the entire life of the project and cover all phases: construction, assembly,
operation, maintenance, dismantling, final restoration, abandonment and/or termination. Construction and assembly permits
(Plan de Trabajos y Obras or “PTO”) are granted by the mining authority with jurisdiction over the project.
In Colombia, the mining authority has the discretion to declare the underlying concession void if the specific company which
holds the concession breaches applicable environmental laws or regulations. If the mining authority were to exercise such
discretion, a company whose concession was voided would be required to abandon its projects and all of its other existing
mining concession contracts. Pending proposals for new mining concession contracts would also be cancelled and the company
would be banned from doing business with the Colombian government for a period of five years. As a result, the company would
be unable to conduct any mining exploration or development activities during such period. However, this would not affect other
78
subsidiaries of the company operating in Colombia, if those concession contracts are held singularly or in concert with joint
venture partners.
Mining activity is prohibited in national parks, regional parks, protected forest reserves, paramos (included in Act 1753,
introduced in 2015) and wetlands, pursuant to the Ramsar Convention on Wetlands of International Importance. Some forest
reserves are not “protected” but are set aside for active forestry purposes and the concessionaire must obtain a specific permit to
partially and temporarily change the use of the soil before pursuing exploration activities. In addition, Resolution 1987/2016,
passed by the national government in late 2016, identifies areas that the Ministry of the Environment has determined to be
“paramos” areas, or paramos transition areas. In these areas there are limitations on industrial or commercial work being
performed, including mining. The regulation also specifies a process to determine what work, if any, can be performed in a
paramos-designated area.
On 30 January 2024, the Colombian Ministry of Environment and Sustainable Development issued Decree No. 044, which
empowers the national government to issue specific resolutions declaring environmental protected areas, on a temporary basis,
which would result in the restriction, and possibly prohibition, of mining activities in those areas. Once declared, an
environmental protected area will remain in place for a period of up to five years (with one extension possible) while technical
studies regarding the conservation value of the area are conducted by the relevant authorities. Based on the results of those
studies, the relevant authorities are required to decide whether to convert the area to a permanent environmental protected area
or to withdraw the temporary designation as an environmental protected area and the related restrictions. During the period of
such review, no mining-related concessions may be granted for an environmental protected area. Decree No. 044 requires the
issuance of specific resolutions by the national government declaring environmental protected areas and, as a result, does not in
and of itself have an impact on any of the Company’s projects in Colombia. Any impact on the Company’s projects in Colombia
can only be determined in light of any specific resolutions declaring environmental protected areas, if issued in the future,
including the geographical coverage and scope of restrictions provided in such resolutions.
AngloGold Ashanti’s rights and permits
The La Colosa project managed by AngloGold Ashanti Colombia S.A.S. (“AGA Colombia”) remains in force majeure due to
delays in granting environmental permits by national and local environmental authorities, thereby preventing AGA Colombia from
undertaking further exploration activities. The most recent one-year grant of force majeure, during which time the specified
timelines for completing the various phases of the mining project under the concession contract are suspended, will expire on 22
June 2024. AGA Colombia applied for a mining area integration (consolidation) of its concession contracts related to La Colosa,
in respect of which AGA Colombia was not in compliance with some of the specified timelines. The application for mining area
integration (consolidation) was approved in March 2017, which remedied the non-compliance of each consolidated concession
and reset the specified timelines. La Colosa now has a single integrated mining concession contract (EIG-163) which covers a
total area of 9,210 hectares and expires on 28 February 2037.
Minera de Cobre Quebradona S.A.S. B.I.C. (“MCQ”) which manages the Quebradona project, obtained the integration of
concession agreement 5881 in October 2016 and registered in December 2016. As a result, MCQ was granted the exclusive
right to explore, take ownership and dispose of the mineral reserves (ore) extracted from the concession area. MCQ has the right
to request an extension of up to 30 years, at least two years before the expiration of the operating period. This extension is not
automatic, and the request must be filed with new technical, economic, environmental and social studies that demonstrate the
status of the mineral resources. Concession contract 5881 initially covered a total area of 7,593 hectares, which was reduced to
4,881.89 hectares by the relevant mining authority (Secretaría de Minas de Antioquia) on 4 March 2022. It will expire in May
2037 and is currently in its eighth year of the integrated exploration phase. In September 2021, the permits for the construction
and mining operation were approved by the relevant mining authority (Secretaría de Minas de Antioquia). On 4 November 2021,
ANLA officially notified AngloGold Ashanti of its decision to ‘archive’ the environmental licence application relating to the
Quebradona project. ANLA has neither denied nor granted the licence, but deemed that the information provided by AngloGold
Ashanti is not enough for this authority to take a substantive decision. On 18 November 2021, AngloGold Ashanti appealed the
archiving decision in order to secure further details on the specific additional information ANLA requires to make a determination.
ANLA denied the appeal on 29 April 2022 and the archiving decision was confirmed. AngloGold Ashanti is in the process of
preparing a new Environmental Impact Assessment for the Quebradona project, which is expected to be submitted to ANLA in
2027 in connection with its environmental licence application.
On 18 September 2023, AngloGold Ashanti, agreed to sell its entire 50% indirect interest in the Gramalote project to B2Gold and
the transaction closed on 29 September 2023. The Gramalote project was organised as a joint operation between AngloGold
Ashanti (through AGA Colombia Holdings Limited and AngloGold Ashanti Holdings plc) and B2Gold (through B2Gold Corp. and
Graminvest Ventures Limited).
79
United States of America (Nevada)
General laws relating to mining and land ownership
General regime
Mineral and surface rights in the United States are owned by private parties, state governments or the federal government. The
majority of land utilised for precious metals exploration, development and mining in the western United States is owned by the
federal government. The right to mine on such federal land in western states is governed by the U.S. General Mining Law of
1872, as amended (the “General Mining Law”), as well as relevant state statutes and regulations. The General Mining Law
allows mining claims on certain federal lands after proper compliance with claim location and maintenance requirements.
Mineral exploration activities in Nevada are also generally subject to applicable federal, state, and local permitting requirements,
but the specific regulatory authorisations required for the Company’s activities are based on the nature and location of the
exploratory work. Several of the Company’s Nevada exploration operations are currently conducted under what is generally
referred to under federal law as a notice-level operation subject to 43 CFR § 3809.21, while projects that are more advanced
require additional permitting, including a Plan of Operations approved by the federal Bureau of Land Management (“BLM”). The
State of Nevada Division of Environmental Protection’s Bureau of Mining Regulation and Reclamation (“BMRR”) also regulates
mining within the state of Nevada. However, exploration projects of five acres or less on federal land, the scope of a notice-level
operation under federal law, are exempt from BMRR regulation. Certain of the Company’s early-stage exploration activities fall
within this exemption.
The Company is currently engaged in exploration activities on certain of its unpatented claims that include, but are not limited to,
geological and spectral mapping, surface geochemical sampling, geophysical surveying and RC and/or diamond drilling.
Potential regulatory changes
Over the years, the U.S. Congress has considered a number of proposed amendments to the General Mining Law and other
federal statutes relating to mining. Among the significant features contained in previously proposed legislation were a production
royalty obligation, new and more stringent environmental standards and conditions, additional reclamation requirements,
extensive new procedural steps which would likely result in extended permitting timelines, and granting counties and other
entities the ability to petition the U.S. Secretary of the Interior to make certain areas unavailable for the location of unpatented
mining claims. In June 2020, former President Trump signed an executive order directing certain federal agencies to streamline
the review processes associated with permitting of infrastructure and natural resources projects. Many of those policies have
subsequently been rescinded by the Biden administration. While certain other executive orders may favorably affect the timing of
our permit and project approvals, the impact is yet to be determined and remains uncertain. There are currently bills related to
the permitting of mines being debated and considered by both houses of the U.S. Congress. The proposed changes to the
permitting process are generally viewed as favorable for mining. It is not possible, however, to determine whether any proposed
changes will actually be enacted in any form during the current session or future sessions of the U.S. Congress.
AGA is currently unaware of any other new federal or state legislative or regulatory changes that have been enacted that would
adversely affect its current exploration programmes. On 12 September 2023, the Interagency Working Group on Mining Laws,
Regulations, and Permitting led by the U.S. Department of the Interior released its final report on “Recommendations to Improve
Mining on Public Lands”. Many of the recommendations in that report, if eventually enacted, would complicate and delay the
mining process in the United States. It is not possible to determine at this point which, if any, of the recommendations will be
enacted by the current or future administrations. Further, based on two decisions in federal court (Rosemont and Thacker Pass),
BLM has modified its procedures addressing the review and approval of permit applications as they relate to companies utilising
mining claims for non-mining, ancillary uses such as waste rock facilities. The new procedures and rules, while potentially adding
additional steps to the permitting process, are not expected to materially increase either the time required to obtain a permit or
the cost of permitting. If any requirements, standards or conditions are adopted in the future that impose additional or new
obligations or costs on AGA in connection with our exploration or extraction activities in the United States, the Company’s
operations in Nevada could be adversely affected.
AngloGold Ashanti’s rights and permits
In Nevada, the Company’s wholly-owned subsidiaries hold a significant number of mining claims on federal lands. This includes
6,691 claims (covering approximately 138,000 acres) in the vicinity of Beatty, Nevada, which cover a number of different projects
and deposits, including the Expanded Silicon project, the North Bullfrog project, the Mother Lode project, and the Sterling mine.
Although the Sterling mine is currently in care and maintenance status, it remains subject to complex permitting and regulatory
requirements, including compliance with relevant provisions of the U.S. Federal Mine Safety and Health Act of 1977 and
oversight by the U.S. Department of Labor’s Mine Safety and Health Administration (“MSHA”).
80
MINE SITE REHABILITATION AND CLOSURE
Closure planning, an integral part of operations
All mining operations eventually cease. An integral aspect of operating AngloGold Ashanti’s mines is ongoing planning for site
closure and, where feasible, implementation of concurrent rehabilitation, together with an estimation of associated liability costs
and the placement of adequate financial provisions and assurances to cover these costs.
AngloGold Ashanti integrates mine closure planning throughout the mine life cycle as follows:
•Exploration stage: developing a plan and programme for cessation and closure of exploration activities in a manner that
complies with local laws and AngloGold Ashanti’s mine closure planning standard.
•Project phase: developing conceptual closure plans and cost estimates for all projects and including them in project
feasibility studies, designs and evaluations.
•Operational phase: developing and periodically updating mine closure plans and cost estimates with increasing levels of
detail and confidence over the operational phase as part of the business planning process. Closure plan updates take
into account operational conditions, planning and regulatory requirements as well as advances in technology and
international industry good practice (e.g., the ICMM Integrated Mine Closure Good Practice Guide). Concurrent
rehabilitation, which is carried out while a mine is still operational, is a good practice that serves to decrease the final
rehabilitation and closure work as well as the ultimate liability.
•Closure period: implementing the final closure plan starting at cessation of operations through a period of
decommissioning, dismantling and rehabilitation until management of the site is largely limited to monitoring and
maintenance.
The Company’s group mine closure planning standard stipulates that closure planning must be undertaken in consultation with
relevant stakeholders. In the course of these consultations, different issues are raised which require site-specific solutions. Each
mine closure plan includes a social transition plan which seeks to minimise impacts and maximise opportunities for local
communities, including with respect to human resource, social infrastructure, mine infrastructure and socio-economic
development issues with the aim of enhancing the self-sustainability of mine communities after mine closure.
Provisions for decommissioning and restoration costs are made when there is a present obligation, it is probable that expenditure
on decommissioning and restoration work will be required and the cost can be estimated within a reasonable range of possible
outcomes. These costs are based on currently available facts, technology expected to be available at the time of the
rehabilitation, laws and regulations presently or virtually certain to be enacted and previous experience in the rehabilitation of
mine sites.
Decommissioning costs and restoration costs are provided at the present value of the expenditures expected to settle the
obligation, using estimated cash flows based on current prices. Estimates are discounted at a pre-tax rate that reflects current
market assessments of the time value of money.
Total provisions for decommissioning and for environmental restoration activities (excluding joint ventures) increased by $47
million from $578 million in 2022 to $625 million in 2023. This increase was mainly due to changes in estimates resulting from
changes in discount rates, changes in global economic assumptions, changes in mine plans resulting in a change in cash flows
as well as changes in the designs for closure of TSFs.
SUSTAINABILITY AND ENVIRONMENTAL, SOCIAL AND GOVERNANCE (“ESG”) MATTERS
AngloGold Ashanti’s sustainability approach is fundamental to how the Company operates its business, as well as its ability to
create long-term value for its shareholders, employees and social partners through safely and responsibly exploring, mining and
marketing its products. Sustainability and safety are integrated into the Company’s business and operations at all levels through
various frameworks, standards and policies, and the Company measures its performance in achieving its goals against its
sustainability and other ESG metrics, as well as its engagement with stakeholders.
AngloGold Ashanti’s board of directors, assisted by the Social, Ethics and Sustainability Committee (“SES Committee”), has
ultimate responsibility over environmental, safety, health and ethical matters and for the integration of sustainability objectives
into AngloGold Ashanti’s business. This includes oversight of the Company’s stakeholder engagement framework and structures,
which apply to investors, employees, governments, suppliers and communities, at every stage of its business from exploration to
mine closure. Group Corporate Affairs and Sustainability is responsible for development of management systems and supports
the Company’s general managers in the day-to-day implementation of its sustainability strategy.
AngloGold Ashanti maintains a set of policies and procedures to guide the Company in acting as a responsible corporate citizen,
including the Code of Business Principles and Ethics which sets requirements for the implementation of key corporate policies
and guidelines and applies to all management and employees, and in maintaining compliance with applicable environmental,
health and safety (“EHS”) laws. In 2023, AngloGold Ashanti continued with the implementation of the Integrated Sustainability
Information Management System (“iSIMS”), in order to improve internal reporting and better integrate, manage and monitor
sustainability activities with respect to its broader business. This common management and reporting application for all
81
sustainability disciplines, from safety, health and security to community and environmental management, is expected to help
provide timely information in each of these areas, and to facilitate transparency and decision-making in the Company’s
processes and practices.
AngloGold Ashanti’s ESG reporting is informed by an annual assessment of its key ESG issues. This process is aligned with
guidance published by the Sustainability Accounting Standards Board (“SASB”) and the Global Reporting Initiative (“GRI”)
Standards. The assessment is annually reviewed by AngloGold Ashanti’s senior leadership, as well as the SES Committee, and
is approved by the board. In addition, AngloGold Ashanti’s ESG reporting is informed by the United Nations Sustainable
Development Goals (“SDGs”), the Accountability AA1000 Stakeholder Management Standard and the Recommendations of the
Task Force on Climate-related Financial Disclosures, the latter having been adopted as an integral part of the Company’s
Climate Change Strategy. The Company’s ESG reporting is also aligned with the sustainable Development Framework of the
International Council on Mining and Metals (“ICMM”), of which AngloGold Ashanti is a member.
Significant EHS requirements and ESG risks and trends affecting the Company’s mining and processing operations are
described below.
EHS Regulatory Compliance
AngloGold Ashanti is subject to extensive EHS laws and regulations in the various jurisdictions in which the Company operates.
These requirements govern, among other things, extraction, use, conservation and discharge of water; air emissions (including
dust control and greenhouse gases (“GHGs”)); mine and dam safety; regulatory and community reporting; clean-up of
contamination; land use and conservation of protected areas; protection of threatened and endangered species; rehabilitation
and closure of mined land; worker health and safety and community health; and the generation, transportation, storage and
disposal of solid and hazardous wastes, such as reagents, radioactive materials and mine tailings. Environmental laws and
regulations applicable to the Company’s operations, including the requirements contained in environmental permits, are
generally becoming more restrictive.
Capital and operating costs to comply with EHS laws and regulations have been, and are expected to continue to be, significant
to AngloGold Ashanti. In addition, AngloGold Ashanti could incur fines, penalties and other sanctions, environmental clean-up
costs, and third-party claims for personal injury or property or natural resources damages; suffer reputational damage; and be
required to install costly pollution control equipment or to modify or suspend facilities, such as TSFs, or operations, as a result of
actual or alleged violations of, or liabilities under, EHS laws and regulations. Failure to comply with applicable EHS laws and
regulations may also result in the suspension or revocation of permits and, in some jurisdictions, the right to mine a given
concession. AngloGold Ashanti’s ability to obtain and maintain permits and other approvals and to successfully operate near host
communities may be adversely impacted by real or perceived effects on the environment or human health and safety associated
with AngloGold Ashanti’s or other mining companies’ activities. In addition, unknown environmental hazards may exist at the
Company’s properties which may have been caused by previous owners or operators.
Water Management
AngloGold Ashanti’s operations are heavily dependent upon access to substantial volumes of water for use in the mining and
extractive processes and typically are subject to water-use permits or rights to extract water from certain natural sources. In
addition to governing usage, these permits or rights typically require, among other things, that mining operations maintain certain
water quality upon discharge. Water supply, quality and usage are areas of concern across all of the Company’s operations,
including with respect to the Company’s mining operations in Ghana and Brazil, its mine development projects in Nevada and its
mine development project at Quebradona in Colombia. A failure by the Company to secure access to suitable water supplies, or
achieve and maintain compliance with applicable requirements of the permits or rights, could result in curtailment or halting of
production at the affected operations. Incidents of water pollution or shortage can, in certain cases, result in community protest
and ultimately lead to the withdrawal of community and government support for AngloGold Ashanti’s operations. A failure by the
Company to comply with water contamination-related directives may result in additional or more stringent directives being issued
against the Company, which may, in some cases, result in a temporary or partial shutdown of some of the Company’s operations.
Where feasible, the Company operates a “closed loop” system which recycles the water used in its operations without
discharging it to the environment. In some areas, however, such as Ghana and Brazil, high levels of rainfall and surface water
runoff mean that a closed loop system is not feasible and that discharges, after water treatment where necessary, must take
place.
Waste Management
During open-pit mining, large volumes of soil and/or rock (overburden) are mined to expose the ore body. Similarly, waste rock is
mined during drilling and developing access to underground ore bodies. Overburden and waste rock typically contain sub-
economic levels of gold and are deposited at large waste rock facilities. Mine tailings are the process waste generated once
grinding and extraction of gold from the ore is completed in the milling process and are typically deposited in large tailing storage
facilities (“TSFs”) specifically designed for this purpose.
82
The impact of dust generation, breach, leak or other failure of a waste rock facility or TSF, including any associated dam, can be
significant, and the Company therefore monitors such facilities closely in accordance with the Company’s internal standards,
independent review, national and other applicable regulatory requirements, industry standards and commitments made to local
communities. Past, occasional but well-publicised, failures of third-party TSFs and the potential impacts of any such failures in
the future, have generally resulted in strict regulations for these facilities in many of the jurisdictions in which the Company
operates. A safety or environmental incident at the Company’s operations could result, among other things, in enforcement,
including mandatory shutdown of a TSF and related facilities, obligations to remediate environmental contamination, negative
press coverage and claims for property or natural resources damages and personal injury by adjacent communities. Incidents at
other mining companies’ operations could result in governmental action to tighten regulatory requirements for mine operators
generally and to restrict certain mining activities, in particular with respect to TSFs.
For example, in recent years there has been considerable regulatory scrutiny in Brazil and other areas on mining operations
generally and, in some jurisdictions, new and more stringent requirements applicable to the approval, licensing, construction,
management, closure and decommissioning of TSFs have been enacted. For further information on the regulatory framework
governing TSFs in Brazil, see “Item 4B: Business Overview—The Regulatory Environment Enabling AngloGold Ashanti to Mine
—Americas—Brazil”.
In addition, a new Global Industry Standard on Tailings Management (“GISTM”) was established in August 2020 by a panel
composed of industry and non-governmental organisation (“NGO”) experts. AngloGold Ashanti has committed to conform with
the GISTM at all of its TSFs by August 2025, and the costs related to meeting such standard are not expected to be material to
AngloGold Ashanti.
In addition, AngloGold Ashanti could incur liabilities or material costs to manage solid and hazardous waste generated by its
mining activities, including dust and residual chemicals and metals. For example, AngloGold Ashanti expects to incur
approximately $50 million to $60 million in capital expenditure and operating costs during 2024-2029 in connection with treatment
and disposal of a quantity of legacy arsenic trioxide waste located at the Obuasi mine.
Groundwater Impacts and Environmental Remediation
As AngloGold Ashanti or its predecessors have a long history of mining operations in certain regions, issues may arise regarding
historical, as well as potential future, environmental or health impacts in those areas, for which AGA, as the current owner/
operator, may be legally responsible. For example, AngloGold Ashanti has identified groundwater contamination plumes at
certain of its operations. Numerous scientific, technical and legal studies have been undertaken to assist in determining the
magnitude of the impact and to find sustainable remediation solutions. Based on those studies as well as discussion with
regulators, the Company has taken steps, including monitored natural attenuation and phyto-technologies, to address soil and
groundwater contamination, including at the Geita mine in Tanzania, where Phase 1 of an in-situ remediation project to address
sulfate in groundwater commenced operations in late 2022. Work undertaken in 2023 and early 2024 yielded encouraging results
and technical, scientific and financial assessments are ongoing to determine whether to expand the in-situ remediation zone.
Subject to the completion of site-specific trials and potential technologies being confirmed as viable remediation techniques, no
reliable estimate can be made at this time for these obligations. Should these obligations be significant, this could have a
material adverse impact upon AngloGold Ashanti’s results and its financial condition.
Climate Change and GHG Regulation
At AngloGold Ashanti, climate change is a board of directors-level governance issue, overseen primarily by the SES Committee
as well as the Audit and Risk Committee which oversees assurance. AngloGold Ashanti’s Climate Change Strategy, which was
approved by the board of directors in November 2021, seeks to embed the management of physical, regulatory and transition
climate change-related risks, as well as climate change-related opportunities, into the Company’s strategic and operational
planning processes.
In 2021, AngloGold Ashanti committed to the International Council on Mining & Metals (“ICMM”) target of achieving net zero
Scope 1 and Scope 2 GHG emissions by 2050. In 2022, AngloGold Ashanti announced its commitment to achieve a 30 percent
absolute reduction in Scope 1 and 2 GHG emissions by 2030 (as compared to a 2021 baseline). Additionally, in partnership with
value chain partners, AngloGold Ashanti expects to continue to work on Scope 3 GHG emissions accounting and to explore
opportunities, where feasible, to address Scope 3 GHG emissions consistent with its commitment, as a member of the ICMM, to
set Scope 3 GHG emissions reduction targets.
In 2023, AngloGold Ashanti advanced its collective understanding of the various approaches to applying scenario analyses and
began efforts to quantify certain climate-related risk on its business plans. Having laid the groundwork for this in 2023, work on
developing the financial models is expected to be progressed during 2024 with a goal to inform its scenario analysis approach
moving forward.
In December 2015, certain members of the international community negotiated a treaty at the Conference of the Parties of the
UN Framework Convention on Climate Change in Paris (the “Paris Agreement”). The Paris Agreement, which came into force on
83
4 November 2016, requires developed countries that are signatories to set targets for GHG emissions reductions. As a result,
measures designed to limit or reduce GHG emissions, both mandatory and voluntary, have been, and are expected to be,
implemented at national or regional levels in various countries.
New regulatory requirements, or changes required to effectively transition to a low-carbon economy, could require AngloGold
Ashanti to reduce its direct GHG emissions or energy use, change its fuel mix or incur significant costs for GHG emissions
permits or taxes, including for those costs or taxes passed on by electricity utilities which supply the Company’s operations.
AngloGold Ashanti could also incur significant costs associated with capital equipment, GHG monitoring and reporting and other
obligations to comply with applicable requirements. The most likely source of these obligations is through nation state-level
implementation of new emissions or financial obligations pursuant to evolving climate change regulatory regimes.
For example, in 2010, Brazil launched the National Climate Change Policy, which established a voluntary national GHG
reduction target of 36.1 percent to 38.9 percent below the projected emissions in 2020 for “business as usual”. The policy
required the development of sector-specific plans in order to meet the target and provided for a Brazilian GHG trading scheme,
which is yet to be designed. While Brazil is not yet requiring mandatory GHG emissions reporting at the national level, some
state environmental agencies have requested companies to voluntarily submit GHG emissions management plans. However, the
states of Goiás and Minas Gerais (in which AngloGold Ashanti operates) do not currently require GHG emissions management
plans for mining projects. In 2015, Brazil announced, in connection with its commitments under the Paris Agreement, economy-
wide absolute mitigation targets providing for a 37 percent reduction in GHG emissions by 2025, as compared to 2005, and a
goal to reduce GHG emissions by 43 percent by 2030 compared to 2005 levels.
In Ghana, the Emissions Levy Act, 2023 (Act 1112) (the “Emissions Levy Act”) was promulgated at the end of 2023 and imposes,
beginning 1 February 2024, a levy on carbon dioxide equivalent emissions produced by specified industrial sectors, including
mining, of GHS 100 (Ghanaian cedis) per tonne per month. At AGA Iduapriem, costs incurred in connection with the Emissions
Levy Act are not expected to be material to AngloGold Ashanti. The Emissions Levy Act will not apply to AGA Ghana because,
under the Obuasi Development Agreement, AGA Ghana is stabilised against the adverse effects of, or obligations imposed by,
any new laws.
In addition, in Australia, the national Safeguard Mechanism sets legislated limits, known as baselines, on the GHG emissions of
certain facilities that emit GHGs above a certain threshold amount, including the Tropicana and Sunrise Dam mines. These
baselines gradually decline on a trajectory consistent with achieving Australia’s GHG emission reduction targets of 43% below
2005 levels by 2030, and net zero GHG emissions by 2050. Covered facilities that emit GHGs above the applicable baseline are
required to purchase Australian Credit Units (“ACUs”) equivalent to the excess emissions. The Safeguard Mechanism, which
first came into force in 2016, was amended in 2023 to implement production-adjusted baselines for covered facilities based on
GHG intensity factors which are specific to the industry and the commodity.
Both Sunrise Dam and Tropicana are expected to apply for a GHG emissions intensity determination prior to the deadline of 30
April 2024, which is required to set a production-adjusted baseline for each of the covered facilities. The cost for ACUs is
currently not expected to be material to AngloGold Ashanti.
In addition to more stringent requirements and commitments, AngloGold Ashanti’s operations are subject to a number of physical
risks from climate change, such as changes in rainfall rates or patterns resulting in floods or droughts, reduced water availability,
higher temperatures and extreme weather events. Such events or conditions, particularly including flooding or inadequate water
supplies, could disrupt mining and transport operations, mineral processing and rehabilitation efforts, create resource or energy
shortages or damage the Company’s property or equipment and increase health and safety risks on site. In consultation with
external consultants, physical climate risk assessments were undertaken for all operations using current climate models for the
business and various decarbonisation scenarios and climate adaptation plans were outlined. These physical climate risks were
further reviewed and refined in 2023.
Occupational Safety and Health
AngloGold Ashanti is subject to a variety of laws and regulations in each of the jurisdictions where the Company operates that
are designed to protect and improve the safety and health of employees. In some of the jurisdictions in which AngloGold Ashanti
operates, the government enforces compulsory shutdowns of operations to enable investigations into the cause of accidents and
introduce corrective measures at those operations.
Safety remains a priority for AngloGold Ashanti and a focus of AngloGold Ashanti’s long-term sustainability approach, as well as
the Company’s continuing efforts to manage the risks inherent to its operations, to model critical controls and to strengthen safety
protocols and preventative measures. AngloGold Ashanti has made significant strides in improving safety. In 2023, there was a
13 percent reduction in year-on-year Total Recordable Injury Frequency Rate (“TRIFR”) to 1.09 injuries per million hours worked,
and no fatalities, for the second consecutive year, at any of the mines operated by AngloGold Ashanti.
AngloGold Ashanti’s Group Health and Safety Strategy, which is updated every three years, seeks to integrate operational risk
management and key performance indicators at all levels of the organisation and maintain alignment with global health and
safety standards. An in-person health and safety strategy workshop was held in 2023 to plan the focus areas for the next three
84
years. The SES Committee oversees the implementation of the Group Health and Safety Strategy. All operations, remain
certified to ISO 45001:2018.
Community Health and Tropical Diseases
AngloGold Ashanti is also subject to health and safety regulations relating to occupational disease. The primary areas of focus in
respect of occupational health of employees within the Company’s operations are noise-induced hearing loss (“NIHL”) and
occupational lung diseases (“OLD”). OLD includes occupational tuberculosis and silicosis in individuals exposed to silica dust.
Silicosis has been particularly prevalent in South Africa and has also arisen at the Company’s Africa region and Brazilian
operations, albeit to a far lesser extent. AngloGold Ashanti provides occupational health services to its employees at its
occupational health centres, clinics, and through outsourced service centres. The Company continues to expand preventative
occupational hygiene initiatives, such as implementing various control measures to prevent hazardous exposures and providing
employees with Personal Protective Equipment. In 2023, the Company finalised a major health hazard management standard to
facilitate systematic implementation of preventative critical controls and compliance company requirements at AGA operations
and projects.
In 2019, the Johannesburg High Court approved the settlement of existing silicosis and tuberculosis class actions against
AngloGold Ashanti and other gold mining companies in South Africa. The sale of the Company’s South African operating assets
and liabilities in 2020 did not include the silicosis or tuberculosis settlement obligations relating to former South African
employees, which were retained by AngloGold Ashanti. For further information, see “Item 18: Financial Statements—Note 23—
Environmental Rehabilitation and Other Provisions—Significant Accounting Judgements and Estimates—Provision for Silicosis”.
In addition to OLD, HIV and AIDS and associated diseases remain major health care challenges faced by AngloGold Ashanti’s
Africa region operations. AngloGold Ashanti continues to implement programmes to help those infected with HIV and prevent
new infections from spreading.
Malaria and other tropical diseases also pose health risks at all of the Company’s operations in Central, West and East Africa
where such diseases may assume epidemic proportions because of ineffective national control programmes. Malaria is a major
cause of ill-health in young children and pregnant women and can also give rise to deaths and absenteeism in adults. All
affected Company operations in Africa have malaria control programmes in place. The Ghana Obuasi malaria control annual
programme activities have been completed in 16 districts of Ghana as planned for 2023 and a new cycle of indoor residual
spraying will commence in 2024 in partnership with the Global Fund and the Ghana Department of Health.
The COVID-19 pandemic was declared over by the World Health Organization in 2023, and it is now considered an established
and ongoing disease entity. As a result, it has been integrated into the Company’s long-term infectious disease risk management
strategy which is part of the overall health risk management systems and processes. Nevertheless, AngloGold Ashanti continued
to direct resources for close surveillance and maintenance of controls against COVID-19 or any other infectious disease
outbreak that may arise in its areas of operation. In 2023, there were outbreaks of Marburg virus reported in Tanzania as well as
an outbreak of Ebola virus reported in Uganda which borders the DRC and Tanzania, where AngloGold Ashanti operates. There
were no cases of Ebola or Marburg reported at AGA operations and no disruptions resulting from these outbreaks in 2023.
The emergence of COVID-19, in conjunction with the Company’s experience with Ebola in Guinea in recent years, led the
Company to take steps to better integrate broad health risk management beyond occupational health into its overall business
strategy, which contributed to productivity as well as the social licence to operate and improved various prevention and risk
management protocols in place to address the potential risk of an epidemic or pandemic. The Company continues to collaborate
with local stakeholders and authorities to ensure health system preparedness and effective responses in the event of health
emergencies and crisis.
In addition to seeking to eliminate harmful occupational exposures and disease, the Company endeavors to optimise physical
and mental wellbeing and fitness for duty, minimise non-communicable diseases associated with lifestyle as well as contribute to
health system strengthening, local skill development and overall community development in the jurisdictions in which it operates.
Impairments to the mental and physical health of workers can negatively affect productivity and profitability as a result of workers’
diminished focus or skill, absenteeism, treatment costs and allocated resources. As part of AngloGold Ashanti’s continuing
efforts, the Company is working on implementing the newly updated health, hygiene and wellbeing standards based on identified
major health hazards or risks which include gender, cultural and other applicable diversity considerations for risk management
and controls.
Inclusion, Diversity and Equity (“ID&E”)
With more than 30,000 employees (including contractor workforce) on five continents, AngloGold Ashanti believes that having an
inclusive workplace culture and a diverse workforce is important to continuing to retain and attract talent to maintain
competitiveness and the long-term sustainability of its business. In addition, the Company strives to have a workforce that
represents the societies in which AngloGold Ashanti operates in connection with maintaining its social license to operate.
85
AngloGold Ashanti’s ID&E approach is aligned to several of the UNSDGs (SDGs 5, 8 and 10) and the United Nations Global
Compact (“UNGC”). The Company has developed an ID&E Framework which aims to foster the empowerment of all staff,
irrespective of race, gender, ethnicity, religion and sexual orientation and has established a Global Inclusion and Diversity
Strategy with Business Unit specific priorities and actions for the next three years to ensure that relevant progress is made for a
more inclusive and equitable cultural experience. This global strategy was informed by internal learning and ID&E efforts since
2021. Leadership teams are also responsible for meeting defined diversity targets which are part of AngloGold Ashanti’s
incentive programme and progress toward such targets is reported periodically to the Compensation and Human Resources
Committee.
Human Rights and Indigenous Peoples
Our values are underpinned by a respect for human rights and are enshrined in our Sustainability Policy and Human Rights
Standard. AngloGold Ashanti is committed to the United Nations Guiding Principles (“UNGPs”) and other international initiatives,
including the UNGC and the Voluntary Principles on Security and Human Rights (“VPSHR”). We work to ensure that our broader
governance is human rights-compliant, recognise our responsibility to respect human rights with regard to all our operations and
communities, and respect the laws of the countries in which we operate.
We are also aligned with the ICMM Position Statement on Indigenous Peoples and the International Finance Corporation’s
Performance Standard 7 on Indigenous Peoples.
86
ANGLOGOLD ASHANTI GLOBAL FOOTPRINT: 2023
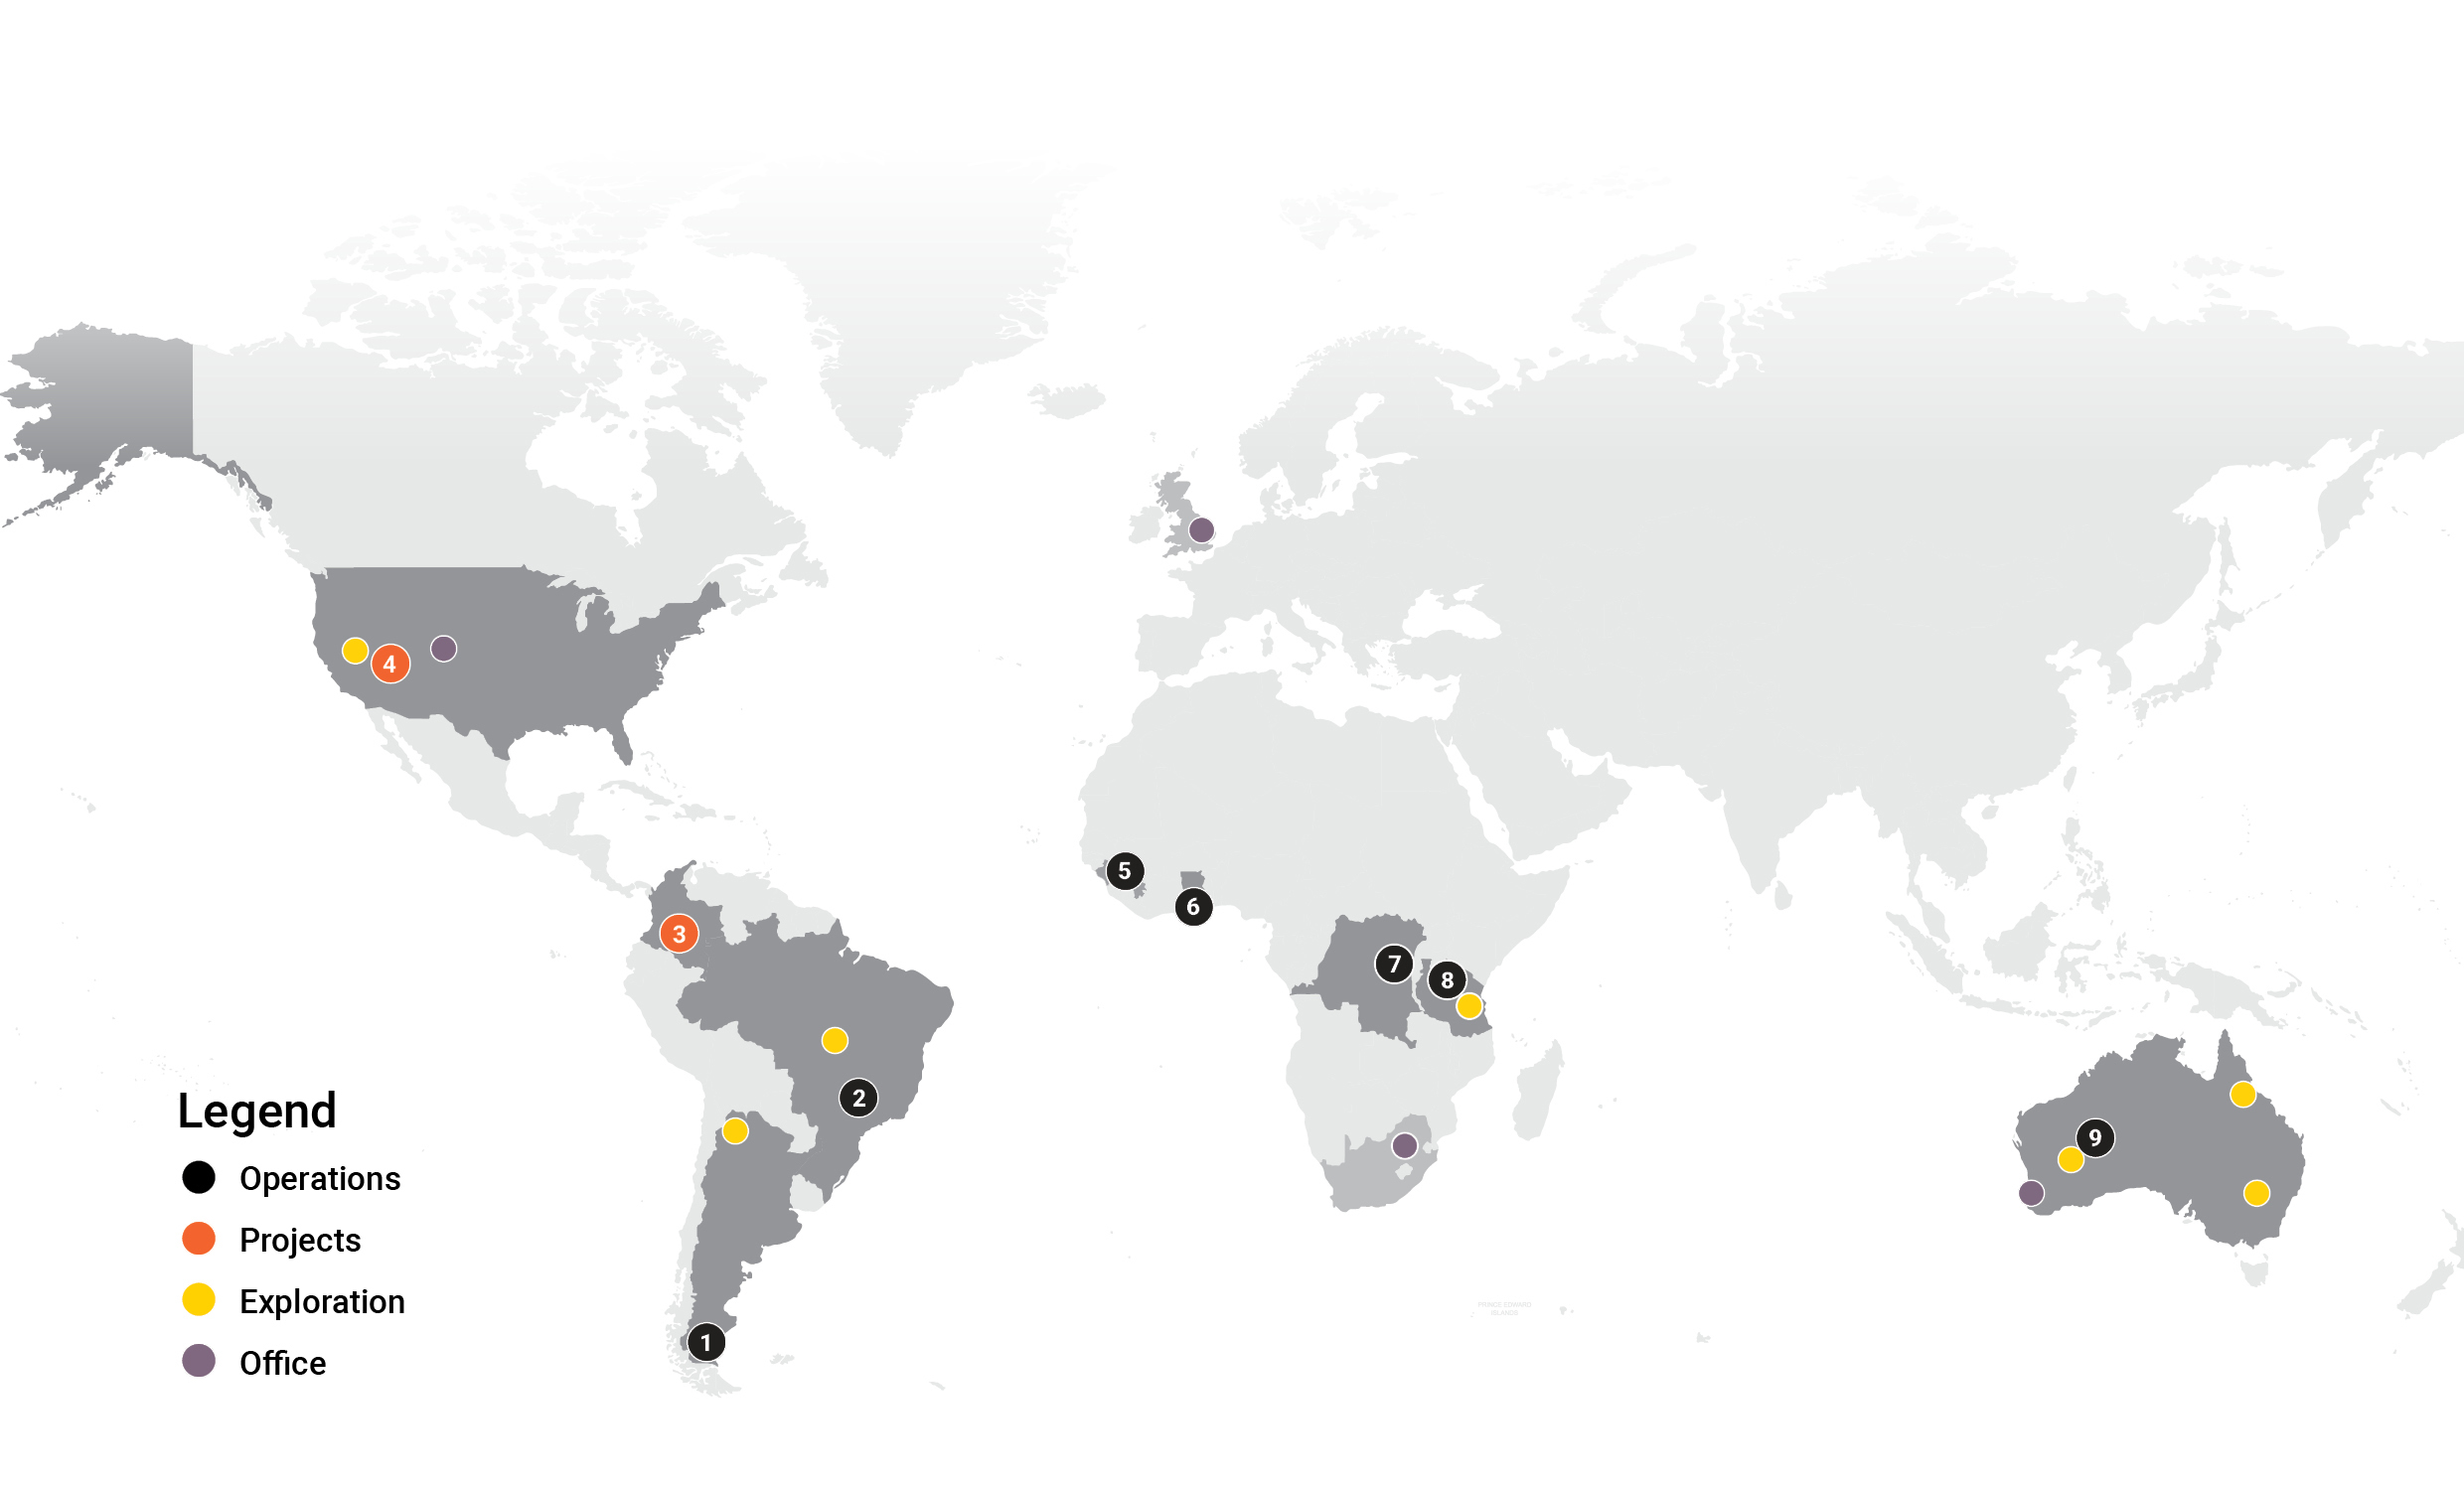
Operations and projects
Americas | Africa | Australia | |
1. Argentina Cerro Vanguardia (92.5%) 2. Brazil AGA Mineração Serra Grande Projects 3. Colombia La Colosa Quebradona 4. United States of America Expanded Silicon (1) North Bullfrog (2) Mother Lode Sterling (3) | 5. Guinea Siguiri (85%) 6. Ghana Iduapriem Obuasi 7. Democratic Republic of the Congo (DRC) Kibali (45%) (4) 8. Tanzania Geita | 9. Australia Sunrise Dam Butcher Well (70%) Tropicana (70%) |
Notes
(1) An Inferred Mineral Resource was declared for the first time at the Merlin deposit in the Expanded Silicon project as of 31 December 2023.
(2) A Mineral Reserve was declared for the first time at North Bullfrog as of 31 December 2023.
(3) Sterling includes the Crown Block.
(4) Kibali is operated by Barrick Gold Corporation (“Barrick”).
87
OPERATING PERFORMANCE
Group description
AngloGold Ashanti is an independent global gold mining company with a diverse high-quality portfolio of operations, projects and
exploration activities. The Group is headquartered in Denver, Colorado in the United States. The Company’s registered office
and principal executive office are located in the UK. The Group also retains a substantial corporate office in Johannesburg, South
Africa.
In 2023, our portfolio of ten operations in seven countries includes long-life operating assets with differing ore body types located
in key gold-producing regions around the world. These operating assets were supported by greenfields projects in Colombia and
the United States and a focused global exploration programme, including exploration in the United States.
Our operations and projects are grouped into the following regions: Africa, Americas and Australia.
AngloGold Ashanti’s operations and joint arrangements employed, on average, 33,658 people (including contractors) in 2023
(2022: 32,594).
Performance
Production, cost of sales and all-in sustaining costs
In 2023, AngloGold Ashanti produced attributable 2.593 million ounces of gold (2022: 2.672 million ounces), excluding the
Córrego do Sítio (“CdS”) operation (that was placed on care and maintenance in August 2023), as well as 4.4 million ounces of
silver (2022: 3.2 million ounces) and 9 tonnes of sulphuric acid (2022: 352 tonnes) as by-products. See “Item 5A: Operating
Results—Key factors affecting results—Comparison of gold production in 2023 with 2022” and “Item 5A: Operating Results—Key
factors affecting results—Comparison of gold production in 2022 with 2021”.
In 2023, AngloGold Ashanti’s cost of sales was $3.5 billion for subsidiaries (2022: $3.4 billion) and $372 million for equity-
accounted joint venture operations (2022: $342 million), and all-in sustaining cost was $1,628 per ounce for subsidiaries (2022:
$1,396 per ounce) and $951 per ounce for equity-accounted joint venture operations (2022: $979 per ounce). See “Item 5A:
Operating Results—Comparison of operating performance on a segment basis in 2023 with 2022—Cost of sales” and “Item 5A:
Operating Results—Comparison of operating performance on a segment basis in 2023 with 2022—All-in sustaining costs per
ounce”.
Mineral Reserve
The AngloGold Ashanti gold Mineral Reserve decreased from 28.8 million ounces at 31 December 2022 to 28.1 million ounces at
31 December 2023. Additions of 2.5 million ounces to the gold Mineral Reserve included 2.0 million ounces from exploration and
modelling changes and 0.5 million ounces due to other impacts. The 2.0 million ounces from exploration and modelling changes
included the first-time reporting of the North Bullfrog gold Mineral Reserve of 1.0 million ounces after the successful completion
and approval of a feasibility study. Reductions included depletion of 2.9 million ounces and economic assumptions of 0.3 million
ounces. As a result, the net year-on-year gold Mineral Reserve reduction was 0.7 million ounces. The gold Mineral Reserve at 31
December 2023 was estimated using a gold price of $1,400 per ounce, unless otherwise stated (2022: $1,400 per ounce). See
“Item 4D: Property, Plants and Equipment—Mineral Resource and Mineral Reserve—Mineral Reserve—Gold”.
The AngloGold Ashanti copper Mineral Reserve remained unchanged at 1.47 million tonnes (3,250 million pounds) at 31
December 2023 as compared to 31 December 2022, as a feasibility study optimisation is still ongoing and no additional
exploration has been completed at Quebradona. The copper Mineral Reserve at 31 December 2023 was estimated using a
copper price of $2.90 per pound (2022: $2.90 per pound). See “Item 4D: Property, Plants and Equipment—Mineral Resource
and Mineral Reserve—Mineral Reserve—Copper”.
Capital expenditure
Capital expenditure, including equity-accounted joint ventures, in 2023 amounted to $1,127 million (2022: $1,118 million).
Safety
No fatal occupational safety incidents at any of the mines operated by the Company were recorded for 2023. The TRIFR was
1.09 per million hours worked in 2023 (2022: 1.26 per million hours worked).
Full Asset Potential Review Programme
The Full Asset Potential (“FP”) review programme aims to achieve a step-change in AngloGold Ashanti’s operating and cost
performance in 2024. It included a comprehensive three-month assessment of each of the Company’s mine sites, which covered
88
every aspect of an operation. There was significant advancement on the FP programme, with assessments completed at all sites
in 2023 (except at Obuasi, which is still ramping up production). The FP programme has started to deliver productivity and cost
benefits.
Operational Excellence
Operational Excellence is the continued efforts to maximise value from our assets.
AFRICA REGION
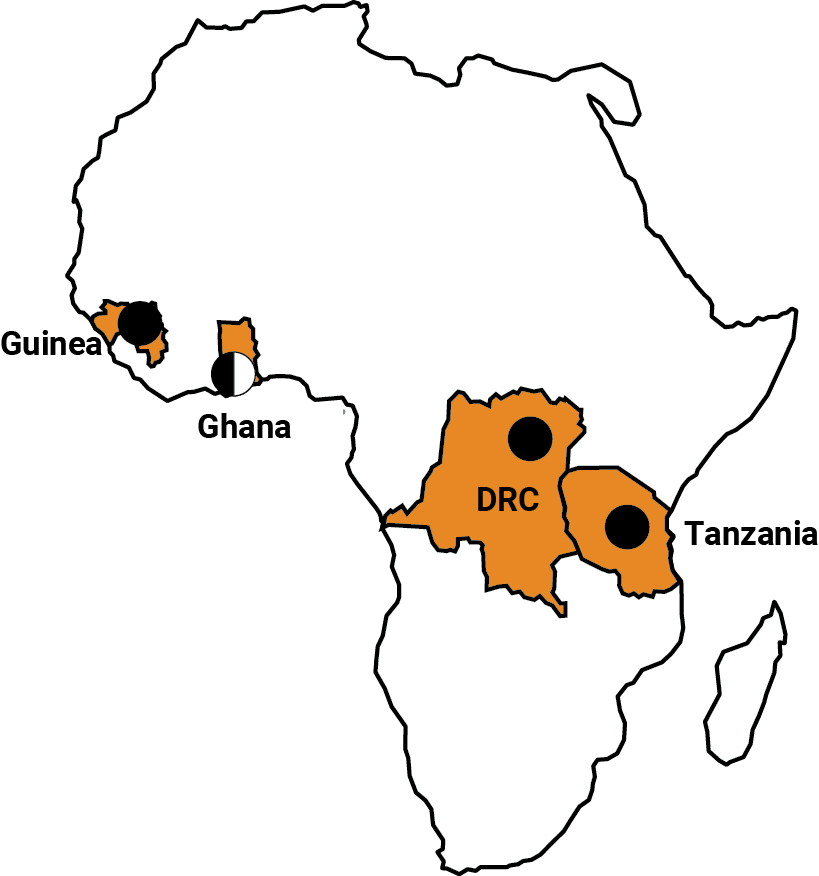 |
Africa is currently home to five of our operations, with one – Kibali – managed by Barrick Gold Corporation. These operations,
which contributed 59 percent or 1.5 million ounces to total annual group production in 2023, are in Ghana (Iduapriem and
Obuasi), Guinea (Siguiri), Tanzania (Geita) and the DRC (Kibali).
Attributable gold production (000oz) | Average number of employees | ||
Subsidiary operations | |||
Ghana | |||
Iduapriem | 268 | 2,359 | |
Obuasi | 224 | 5,376 | |
Guinea | |||
Siguiri (Attr. 85%) | 221 | 4,277 | |
Tanzania | |||
Geita | 485 | 6,839 | |
Joint venture operations | |||
Democratic Republic of the Congo | |||
Kibali (Attr. 45%) | 343 | 2,883 | |
89
Africa Region - Key Statistics
Unit | 2023 | 2022 | 2021 | ||||
Restated | Restated | ||||||
Subsidiary operations | |||||||
Tonnes treated/milled (1) | Mt | 21.5 | 21.8 | 21.3 | |||
Pay limit | oz/t | 0.048 | 0.044 | 0.035 | |||
g/t | 1.640 | 1.516 | 1.193 | ||||
Recovered grade | oz/t | 0.051 | 0.054 | 0.045 | |||
g/t | 1.73 | 1.86 | 1.54 | ||||
Gold production (attributable) | 000oz | 1,198 | 1,298 | 1,054 | |||
Cost of sales | $m | 1,739 | 1,666 | 1,302 | |||
Total cash costs per ounce (2) | $/oz | 1,121 | 1,023 | 991 | |||
All-in sustaining costs per ounce (2) | $/oz | 1,563 | 1,291 | 1,264 | |||
Capital expenditure (3) | $m | 625 | 486 | 434 | |||
Safety | |||||||
Number of fatalities | 0 | 0 | 1 | ||||
TRIFR | Per million hours worked | 0.39 | 0.33 | 0.61 | |||
People | |||||||
Average number of employees: Total | 18,851 | 17,076 | 14,806 | ||||
Permanent employees | 6,296 | 5,780 | 5,619 | ||||
Contractors | 12,555 | 11,296 | 9,187 |
Unit | 2023 | 2022 | 2021 | ||||
Joint venture operations | |||||||
Tonnes treated/milled | Mt | 3.7 | 3.5 | 3.5 | |||
Pay limit | oz/t | 0.048 | 0.054 | 0.048 | |||
g/t | 1.650 | 1.850 | 1.652 | ||||
Recovered grade | oz/t | 0.084 | 0.087 | 0.095 | |||
g/t | 2.89 | 2.98 | 3.25 | ||||
Gold production (attributable) | 000oz | 343 | 337 | 365 | |||
Cost of sales | $m | 372 | 342 | 350 | |||
Total cash costs per ounce (2) | $/oz | 802 | 725 | 647 | |||
All-in sustaining costs per ounce(2) | $/oz | 951 | 979 | 856 | |||
Capital expenditure (attributable) | $m | 85 | 90 | 72 | |||
People | |||||||
Average number of employees: Total | 2,883 | 2,731 | 2,454 | ||||
Permanent employees | 1,014 | 957 | 860 | ||||
Contractors | 1,869 | 1,774 | 1,594 |
(1)Includes surface and dump tonnes milled. Comparative figures have been restated.
(2) Total cash costs per ounce” and “all-in sustaining costs per ounce” are non-GAAP financial measures. For further information on these non-GAAP financial
measures, see “Item 5A: Operating Results—Non-GAAP analysis”.
(3) 100 percent (not attributable).
90
Performance summary
For more information regarding production performance in the Africa region, refer to “Item 5A: Operating Results—Key factors
affecting results—Comparison of gold production in 2023 with 2022”.
For more information regarding operating performance in the Africa region, refer to “Item 5A: Operating Results—Comparison of
operating performance on a segment basis in 2023 with 2022”.
For more information regarding capital expenditure in the Africa region, refer to “Item 5A: Operating Results—Comparison of
capital expenditure in 2023, 2022 and 2021—Comparison of capital expenditure in 2023 with 2022”.
Safety performance maintained in 2023; there were no occupational fatalities at any of the mines operated by the Company and
a TRIFR of 0.39 per million hours worked was recorded (2022: 0.33 per million hours worked).
Regional community investment totalled $12.60 million (2022: $10.19 million) in 2023.
All operations are certified under the ISO 45001 (health and safety) and ISO 14001 (environmental management). All operations
except for Obuasi are certified under the Cyanide Code. Obuasi completed its third-party certification audit in 2023 and has been
recommended for certification and awaits confirmation by the International Cyanide Management Institute.
The FP programme initiatives implemented at Geita lifted underground tonnes mined from Nyankanga supported by higher
backfill volumes. The volume of open pit tonnes mined improved in the second half of 2023, once new equipment was mobilised.
Plant throughput and recoveries continued to exceed FP targets.
Obuasi update
Phase 3 of the Obuasi redevelopment project, which relates primarily to capital expenditure to refurbish and return to service
existing infrastructure around the KMS shaft, as well as to service the mine in deeper production areas, continued to progress in
2023.
In 2023, the project achieved the following milestones: upgrading and licensing both the KMS Rock and Man Winders for
operations with Ghanaian mining authorities; completing installation of two new shaft pipe columns increasing dewatering
capacity by 200 litres per second; completing the KMS shaft down to 51-level; and completing mining of a new ore pass between
the operational mine and 4,100 level rail.
91
THE AMERICAS
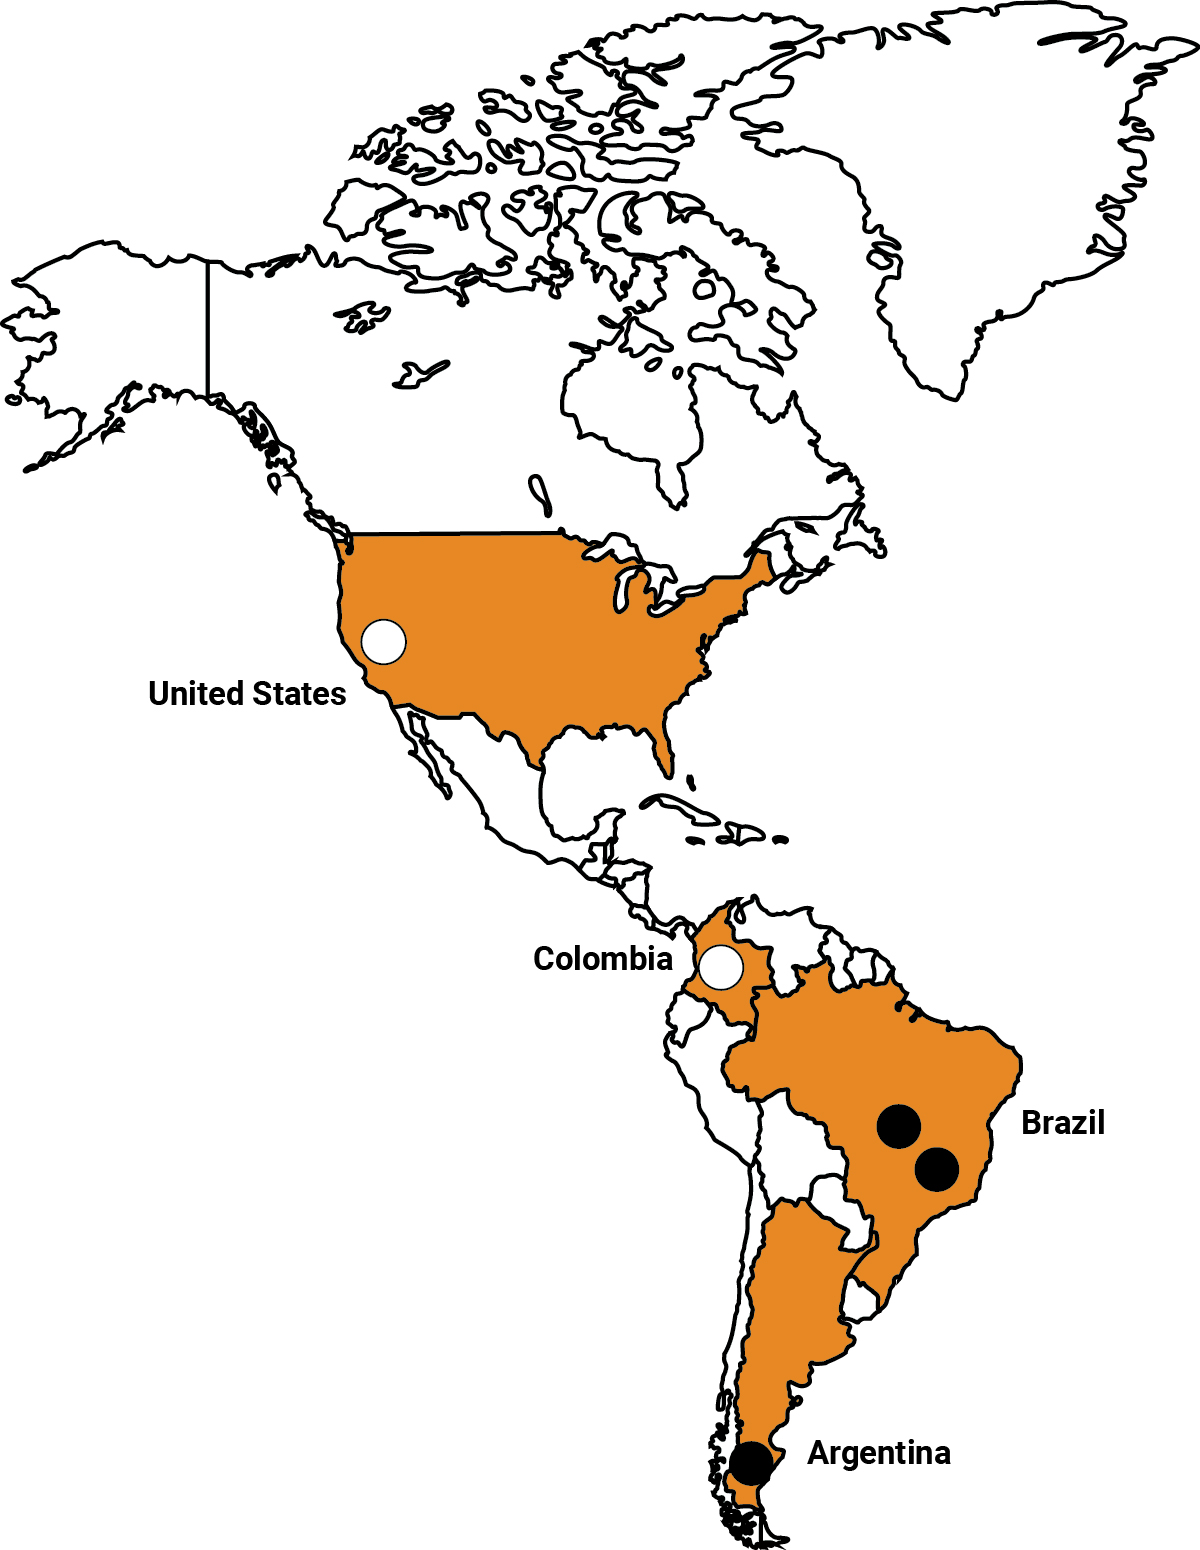 |
The Americas hosts three of our operations – one in Argentina and two in Brazil – as well as greenfields projects in Colombia and
a significant new greenfields development in Nevada in the United States.
Attributable gold production (000oz) | Average number of employees | ||
Operations | |||
Argentina | |||
Cerro Vanguardia (Attr. 92.5%) | 152 | 1,841 | |
Brazil | |||
AGA Mineração (1) | 252 | 4,887 | |
Serra Grande | 86 | 1,837 |
92
Americas - Key Statistics
Unit | 2023 | 2022 | 2021 | ||||
Restated | Restated | ||||||
Operation | |||||||
Tonnes treated/milled (1) | Mt | 5.5 | 5.9 | 5.9 | |||
Pay limit | oz/t | 0.11 | 0.10 | 0.10 | |||
g/t | 3.75 | 3.52 | 3.49 | ||||
Recovered grade (1) | oz/t | 0.080 | 0.077 | 0.073 | |||
g/t | 2.74 | 2.62 | 2.51 | ||||
Gold production (attributable) (1) | 000oz | 490 | 499 | 481 | |||
Silver production (attributable) | Moz | 4.0 | 3.2 | 3.4 | |||
Cost of sales | $m | 931 | 913 | 822 | |||
Total cash costs per ounce (1) (2) | $/oz | 1,124 | 957 | 831 | |||
All-in sustaining costs per ounce (1) (2) | $/oz | 1,713 | 1,555 | 1,457 | |||
Capital expenditure (3) | $m | 281 | 339 | 398 | |||
Safety | |||||||
Number of fatalities | 0 | 0 | 1 | ||||
TRIFR | Per million hours worked | 2.11 | 2.33 | 3.55 | |||
People | |||||||
Average number of employees: Total | 8,565 | 9,498 | 9,972 | ||||
Permanent employees | 5,519 | 6,093 | 6,452 | ||||
Contractors | 3,046 | 3,405 | 3,520 |
(1) Adjusted to exclude the Córrego do Sítio (“CdS”) operation that was placed on care and maintenance in August 2023. CdS produced 42,000 ounces, 70,000
ounces and 78,000 ounces for the years ended 31 December 2023, 2022 and 2021, respectively.
(2) “Total cash costs per ounce” and “all-in sustaining costs per ounce” are non-GAAP financial measures. For further information on these non-GAAP financial
measures, see “Item 5A: Operating Results—Non-GAAP analysis”.
(3) 100 percent (not attributable) and includes Projects in Colombia and USA.
Performance summary
For more information regarding production performance in the Americas region, refer to “Item 5A: Operating Results—Key
factors affecting results—Comparison of gold production in 2023 with 2022”.
For more information regarding operating performance in the Americas region, refer to “Item 5A: Operating Results—Comparison
of operating performance on a segment basis in 2023 with 2022”.
For more information regarding capital expenditure in the Americas region, refer to “Item 5A: Operating Results—Comparison of
capital expenditure in 2023, 2022 and 2021—Comparison of capital expenditure in 2023 with 2022”.
Safety performance improved in 2023; there were no occupational fatalities and the TRIFR improved to 2.11 per million hours
worked (2022: 2.33 per million hours worked).
Regional community investment amounted to $5.01 million (2022: $6.4 million) in 2023.
All operations in the Americas maintained their certification in terms of International Cyanide Management Code, ISO 45000
(health and safety) and ISO 14001 (environmental management) in 2023.
The FP programme at Cerro Vanguardia highlighted the importance of open-pit waste movement. The site focused on driving up
the truck payload to reduce unit costs. The installation of sideboards on truck bodies assisted in increasing the average payload,
from around 78 tonnes to 88 tonnes across the 90-tonne truck fleet.
The focus of the FP programme at Cuiabá in 2023 was to reduce mining dilution. The site implemented several quality assurance
and control routines before and after blasting, including an integrated review of geology and operations, which helped to improve
the overall drilling and blasting quality. In addition, development profiles were reviewed as were the designs of the support
required in various underground areas. Overall, these measures contributed to a significant improvement in mining dilution in
2023 (versus 2022 performance). This performance has now stabilised around the 2024 target.
As part of the FP programme’s focus on improving the volumes of underground ore at Serra Grande, a maintenance review and
a revised approach resulted in trucks being changed out to alleviate what was a significant deficiency in availability.
93
CdS update
The Córrego do Sítio (“CdS”) mine in Brazil’s Minas Gerais state was placed on care and maintenance in August 2023 following
a sustained period of challenging operating results characterised by poor gold production and costs that were well above the
gold price.
Nevada strategy
In Nevada, during 2023, the Company approved the feasibility study at North Bullfrog and local, state and federal permitting
processes are underway along with detailed engineering work, key recruitment and operational readiness planning. The Merlin
pre-feasibility study is expected to continue in 2024, focusing on mining, processing and infrastructure trade-off studies. Infill and
extension drilling will continue along with hydrogeological, geotechnical and metallurgical testing.
AUSTRALIA
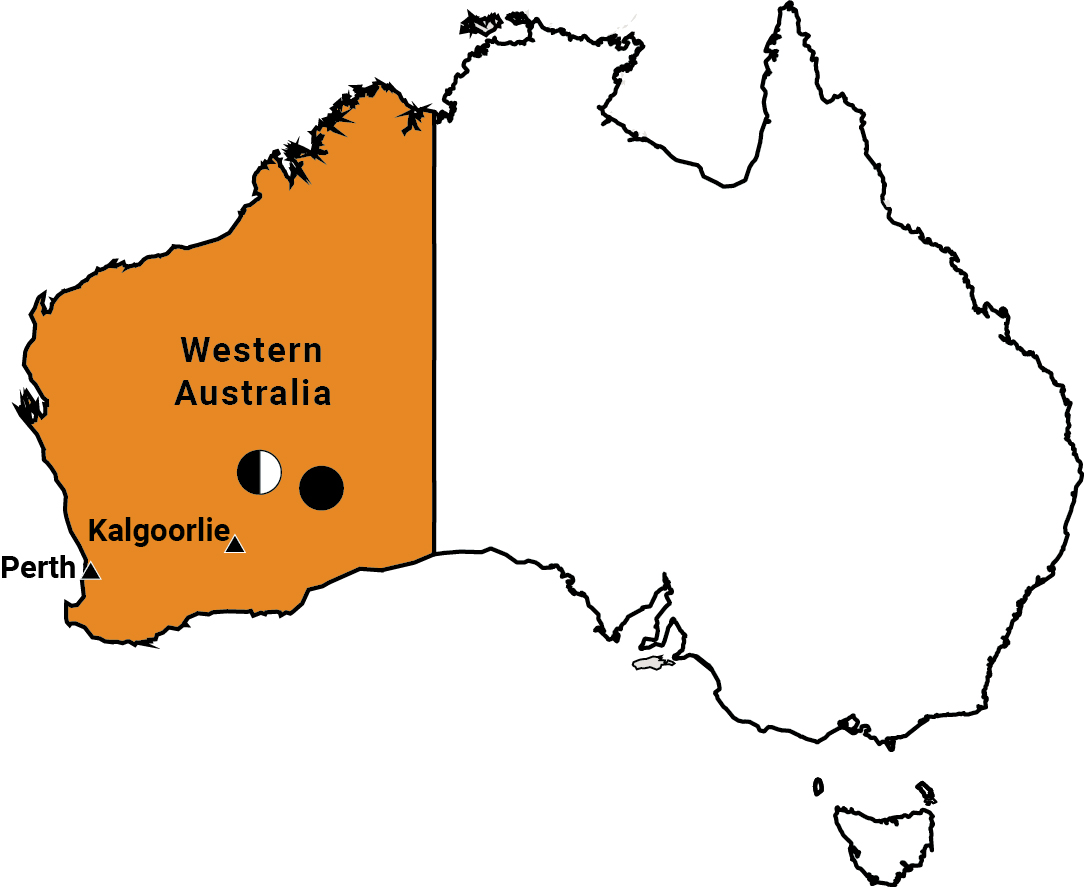 |
Attributable gold production (000oz) | Average number of employees | ||
Operations | |||
Australia | |||
Sunrise Dam | 252 | 763 | |
Tropicana (Attr. 70%) | 310 | 978 |
The two AngloGold Ashanti operations in Australia are Sunrise Dam and Tropicana, both of which are in the north-eastern
goldfields in the state of Western Australia. Sunrise Dam is wholly owned. We have a 70 percent holding in, and manage,
Tropicana. Regis Resources Limited, our partner in Tropicana, holds the balance (30 percent) through its subsidiary AFB
Resources Pty Limited. Sunrise Dam includes the Butcher Well project, which is a joint venture between AngloGold Ashanti (70
percent) and Northern Star Resources (30 percent).
94
Australia - Key Statistics
Unit | 2023 | 2022 | 2021 | ||||
Operation | |||||||
Tonnes treated/milled | Mt | 10.5 | 10.7 | 10.5 | |||
Pay limit | oz/t | 0.06 | 0.05 | 0.06 | |||
g/t | 1.92 | 1.69 | 1.89 | ||||
Recovered grade | oz/t | 0.050 | 0.050 | 0.047 | |||
g/t | 1.66 | 1.56 | 1.47 | ||||
Gold production (attributable) | 000oz | 562 | 538 | 494 | |||
Cost of sales | $m | 867 | 783 | 740 | |||
Total cash costs per ounce (1) | $/oz | 1,251 | 1,157 | 1,196 | |||
All-in sustaining costs per ounce(1) | $/oz | 1,487 | 1,345 | 1,500 | |||
Capital expenditure (attributable) | $m | 135 | 202 | 185 | |||
Safety | |||||||
Number of fatalities | 0 | 0 | 0 | ||||
TRIFR | Per million hours worked | 3.20 | 3.82 | 6.59 | |||
People | |||||||
Average number of employees: Total | 1,741 | 1,532 | 1,332 | ||||
Permanent employees | 347 | 314 | 288 | ||||
Contractors | 1,394 | 1,218 | 1,044 |
(1)“Total cash costs per ounce” and “all-in sustaining costs per ounce” are non-GAAP financial measures. For further information on these non-GAAP financial
measures, see “Item 5A: Operating Results—Non-GAAP analysis”.
Performance summary
For more information regarding production performance in the Australia region, refer to “Item 5A: Operating Results—Key factors
affecting results—Comparison of gold production in 2023 with 2022”.
For more information regarding operating performance in the Australia region, refer to “Item 5A: Operating Results—Comparison
of operating performance on a segment basis in 2023 with 2022”.
For more information regarding capital expenditure in the Australia region, refer to “Item 5A: Operating Results—Comparison of
capital expenditure in 2023, 2022 and 2021—Comparison of capital expenditure in 2023 with 2022”.
Safety performance improved in 2023; there were no occupational fatalities and a TRIFR of 3.20 per million hours worked was
recorded (2022: 3.82 per million hours worked).
Regional community investment amounted to $0.85 million (2022: $0.98 million) in 2023.
Sunrise Dam and Tropicana certification under the Cyanide Code, ISO 45000 (health and safety) and ISO 14001 (environmental
management) were renewed during 2023.
Sunrise Dam realised the benefits of the FP programme in 2023. A focus on improving jumbo performance, along with better
spatial compliance and efficiencies from the new fleet management system, lifted underground tonnes mined by 10 percent to
2.66 million tonnes for 2023.
95
EXPLORATION REVIEW
Our exploration covers greenfields and brownfields exploration programmes to support sustainability and growth of our business.
Greenfields exploration aims to discover large, high-value Mineral Resources that will eventually lead to the development of new
gold mines. Brownfields exploration focuses on delivering value through accretive additions at existing mines, as well as driving
development of future mines at our advanced projects.
Greenfields exploration
In 2023, $40.8 million was spent on greenfields exploration. Our greenfields exploration tenements cover over 12,400km2 of
highly prospective ground in five countries: Australia, Argentina, Brazil, Tanzania, and the United States.
Americas
In the United States, 6,608 million of diamond drilling was completed at the Midnight Star and CR projects in Nevada. Further
targets remain to be tested at both projects. One additional project (Lucille) was added to the greenfields Nevada portfolio during
2023 and three projects are waiting for permits from the relevant government agencies.
In Brazil, stream sediment sampling continued to define new districts in the South Brasilia Belt (“SBB”) terrane. Infill stream
sediment and soil sampling at SBB defined targets at the Claro project, which are ready for drill testing.
In Argentina, a 3,500km heliborne magnetic survey was completed at the Organullo project in Salta Province. Greenfields
exploration at Organullo is managed by AGA under an option agreement with Latin Metals. At the 100% El Cori project,
environmental surveys were completed and drilling permits were submitted over four drill targets.
Africa
In Tanzania, greenfields exploration was restarted and field activities began at three projects located in the Shinyanga and
Singida regions.
Australia
During 2023, greenfields exploration was carried out in the Laverton district of Western Australia, in northern Queensland and in
New South Wales. The Laverton exploration has focused on the advanced Corvette prospect.
In Queensland, 4,264m of diamond drilling returned low-level anomalous results from Muldiva. Reconnaissance mapping, rock
chip sampling and soil sampling was completed at several early-stage targets in the Chillagoe district. Field reconnaissance took
place on the Connors and Auburn Arc tenements in the New England terrane.
Mud-rotary and diamond drilling (30 holes for 5,143m) was completed at the Macquarie Arc project in New South Wales, which is
under an option agreement with Inflection Resources to test for porphyry-related copper-gold mineralisation. The drilling returned
alteration assemblages indicative of a near-porphyry environment at the Duck Creek, Myallmundi and Trangie projects.
Brownfields exploration
In 2023, our brownfield exploration teams at operations across the globe completed 558km of capital and 291km of expensed
drilling at a total cost of $82.8 million and $65.3 million, respectively. These costs are attributable to AngloGold Ashanti and
include the Kibali JV, as well as Córrego do Sítio (CdS), which was placed on care and maintenance in August 2023.
Additionally, 129km of drilling was completed at the Nevada projects for a total cost of $73.9 million, principally at the Merlin
deposit of the Expanded Silicon project. This has delivered exceptional results and supported the declaration of a significant first
time 9.1 million ounces Inferred Mineral Resource, as well as further definition and expansion of the mineralisation.
Africa
Geita
Exploration drilling programmes for 2023 completed a total of 147km drilling.
Capitalised drilling to support development and definition of Mineral Resource took place across all operational areas and at the
Geita Hill Underground project. Infill drilling generally confirmed existing models and at Geita Hill notably increased resolution of
orebody characteristics and geometries within underground blocks 1 and 2.
Expensed drilling included testing for extensions of the main deposits, as well as at exploration targets within the Nyamulilima
region and along the central district. Drilling to the southern margin of the Nyamulilima open pit supported expansion potential
96
and showed underground potential at depth. The Kalondwa Hill programmes in the central district included infill of the main
orezones, as well as establishing mineralisation continuity along both western and northwestern trends.
Kibali
Drilling of KCD down-plunge continued, with programmes supporting potential extensions of the 5000, 9000 and 11000 lodes.
Recent drilling to the northwest of KCD supports an emerging mineralised corridor parallel to KCD that has potential for both
underground and open pit targets.
At Agbarabo-Rhino, drilling of the high-grade Rhino oreshoot down-plunge and lateral continuity of Agbarabo lenses supports
underground potential, with shallow mineralisation at Rhino showing open pit potential close to the Kibali plant.
Drilling at Oere supports extension of mineralisation down-plunge, highlighting an underground opportunity and raising the
possibility for further blind high-grade shoots in the KZ North area. In KZ South, ongoing drill testing at Zambula has returned
promising results that support open pit potential of this target.
Obuasi
In all, 40km of exploration drilling was completed in 2023. Underground drilling was focused on improving confidence in the
Mineral Resource at Block 8 and Block 10 ahead of mining, as well as probing and extending the known mineralisation in these
areas. Good continuity of the Obuasi fissure was noted from the Block 10 programmes and at Block 8, testing of the East Lode
system refined the models and identified additional multi-splayed lodes east of the known system.
Surface drilling took place at CVS and Cote d’Or, with the Cote d’Or drilling aiming to test multiple lodes and infill the Mineral
Resource to further assess potential to serve as an additional and independent underground mining area.
Iduapriem
Some 11km of exploration drilling were completed, focused on capitalised infill at Block 3 west and Block 4 to support the mine
plan and add operational flexibility. The drilling programmes delivered good results that supported definition and expansion of the
Mineral Resource.
Regional exploration activities continued across the mining lease with reconnaissance mapping and soil geochemical sampling
at several targets.
Siguiri
During 2023, exploration activities included 93km of drilling across blocks 1, 2 and 3. In Block 1, infill continued at Kami and
Bidini, with delineation of potential extensions at Kami, Kozan, Seguelen and Balato pits. Good potential upside of the oxide in
the Kami East area was demonstrated by several encouraging results. Reconnaissance drilling tested several targets within the
block.
In Block 2, infill at Saraya pit was accompanied by reconnaissance drilling at several targets to identify potential for continued
mining operations in the block. In Block 3, drilling at Kounkoun was completed to infill the Mineral Resource and support the
advancing project studies, delivering several significant intersections that confirmed the robust and relatively high-grade
mineralisation of this deposit. Drilling further supported geometallurgical studies and infrastructure planning.
Americas
Nevada Projects, USA
Drilling in the eastern Beatty District took place at Silicon and Merlin with up to twelve rigs in operation. Drilling has been focused
on the Mineral Resource delineation programme at Merlin, which has returned good results that support and enhance the
modelled mineralisation and continue to show significant upside potential. Drilling also supported technical studies to inform the
Expanded Silicon project.
At the North Bullfrog project in the western Beatty District, activities were mainly restricted to drilling support for hydrogeological
and geotechnical studies. However, a risk amelioration drill programme to support a Measured Mineral Resource was completed
within the Sierra Blanca pit design and informed an updated model.
Colombia Projects
No exploration drilling took place at the projects. At Quebradona, a re-logging programme was initiated to enhance geological
models based on improved differentiation of certain lithologies and is ongoing. Limited geotechnical drilling was completed and
core sampling was further undertaken to support technical studies.
AGA Mineração, Brazil
At Cuiabá-Lamego, a total of 158km exploration drilling was completed. Drilling at Cuiabá took place between levels 21 and 23
for the Fonte Grande Sul and Serrotinho orebodies, with significant intercepts supporting improvements and additions to the
mineralisation model. Drilling of the Narrow Veins between levels 17 and 21 also delivered good results, particularly down-plunge
at Balancão.
97
The secondary orebodies (VQZ, Galinheiro Footwall, and Viana) continued to show promising results from drilling between levels
15 and 21, most notably from the high-grade quartz vein lenses of the VQZ both within the core of the Cuiabá fold and in the
footwall of the Serrotinho orebody.
Drilling at Lamego focused on Carruagem, with numerous results that refined and extended the modelled mineralisation. Drilling
also took place at the Queimada and Arco da Velha orebodies.
At the Descoberto regional prospect, a surface drilling programme was completed and an induced polarisation programme is
ongoing. Surface channel sampling was completed at the Lamego AVOx prospect.
Prior to being placed on care and maintenance in August 2023, a total of 46km drilling was completed at Córrego do Sítio (CdS)
across several surface and underground areas of CdS I and II. Subsequent work has focused on ensuring that exploration
activities to date are well documented.
Serra Grande, Brazil
Capitalised and expensed drilling programmes completed a total of 71km drilling with a strong focus on infill and confirmatory
drilling to support the mine plan, notably at Inga, Mangaba, Pequizão, and Limoeiro. Several of these programmes also served to
target infill and testing of upside potential in adjacent orebodies close to mine infrastructure.
Cerro Vanguardia, Argentina
A total of 78km of exploration drilling was completed at Cerro Vanguardia, with drilling mainly directed at delineating the Mineral
Resource and testing extensions of veins within the mining lease.
Promising assays results were returned from partially covered and/or blind veins at Dora, Doriana, Jani and El Lazo targets. Late
in the year, an extensive trenching and channel sampling campaign was undertaken across numerous veins to support drill
targeting.
A reconnaissance programme at the Cóndor tenement drilled several target structures, while at the Claudia JV, drilling was
completed over the Io vein and successfully defined extensions under cover. Reconnaissance mapping and sampling was also
undertaken at several targets across the Claudia JV area.
Australia
Sunrise Dam
Exploration drilling programmes completed a total of 92km during 2023. Drilling was primarily concentrated in Frankie, Astro-
Flamingo, and Vogue, with the objective of bolstering Mineral Resource to support mining operations. These areas returned
numerous significant intercepts and contributed to ounce additions across several categories. The Frankie programme notably
led to a major improvement in the modelling of high-grade ore shoots.
Surface drilling mainly tested near-surface targets at Pink Lady and Wilga West, as well as drilling to support an upgrade of the
planned Neville open pit to Indicated Mineral Resource.
Tropicana
Brownfields exploration at Tropicana executed a total of 98km of drilling. Regional drilling programmes were impacted in the
second half of the year by temporary access constraints, resulting in near-mine programmes being brought forward.
Capitalised exploration focused on Boston Shaker, Havana and Tropicana underground drilling, with results that generally
confirmed and enhanced existing models. Near-mine expensed drill programmes delivered significant results from targets testing
depth extensions and high-grade plunges to underground lodes at Boston Shaker and Havana South.
Regional expensed exploration drilling yielded significant results along Tropicana’s northern corridor. Drilling south of the mine at
Bushwacker also returned encouraging intercepts. Drone-based geophysical surveys were also completed to support exploration
targeting along the Angel Eyes-Double Vision (northern corridor), Madras and Sanpan-Sazerac trends.
PROJECTS
Quebradona
For more information regarding Quebradona, refer to “Item 4B: Business Overview—The Regulatory Environment Enabling
AngloGold Ashanti to Mine—Americas—Colombia—AngloGold Ashanti’s rights and permits”.
Gramalote
On 18 September 2023, AngloGold Ashanti, agreed to sell its entire 50% indirect interest in the Gramalote project to B2Gold
Corp for a total consideration of up to $60 million. The transaction closed on 29 September 2023, and AngloGold Ashanti
received a cash payment of $20 million on 5 October 2023, with the balance dependent on project construction and production
milestones that the Gramalote project reaches.
98
4C.ORGANISATIONAL STRUCTURE
GROUP STRUCTURE
AngloGold Ashanti’s operations are divided into the following regions:
•Africa — operations in Ghana, Guinea and Tanzania and a joint venture operation in the DRC;
•Australia — operations in Australia; and
•Americas — operations in Argentina and Brazil, exploration and development projects in the United States and exploration
projects in Colombia.
The above regions correspond to AngloGold Ashanti’s business segments.
Day-to-day management of the Group is entrusted to AngloGold Ashanti’s executive management team, chaired by the
Chief Executive Officer. See “Item 6: Directors, Senior Management and Employees”.
Support is provided to the executive management team in managing AngloGold Ashanti’s corporate activities at both the central
and local levels.
SUBSIDIARIES
AngloGold Ashanti plc has investments in principal subsidiaries and joint venture interests, see “Item 19: Exhibits—Exhibit 19.8
List of AngloGold Ashanti plc subsidiaries” for details.
On 16 March 2023, AngloGold Ashanti and Gold Fields announced that they have agreed the key terms of a proposed joint
venture in Ghana between Gold Fields' Tarkwa and AngloGold Ashanti's neighbouring Iduapriem Mines (the “Proposed Joint
Venture”). There can be no certainty that the parties will enter into a definitive agreement with respect to the Proposed Joint
Venture or about the timing, terms and conditions of any such definitive agreement. Implementation of the Proposed Joint
Venture is subject to, among other matters, reaching agreement with the Government of Ghana regarding the Proposed Joint
Venture, conclusion of confirmatory due diligence and securing all requisite regulatory approvals.
99
4D.PROPERTY, PLANTS AND EQUIPMENT
Locations of properties
Americas | Africa | Australia | |
1. Argentina Cerro Vanguardia (92.5%) 2. Brazil AGA Mineração Serra Grande Projects 3. Colombia La Colosa Quebradona 4. United States of America Expanded Silicon (1) North Bullfrog (2) Mother Lode Sterling (3) | 5. Guinea Siguiri (85%) 6. Ghana Iduapriem Obuasi 7. Democratic Republic of the Congo (DRC) Kibali (45%) (4) 8. Tanzania Geita | 9. Australia Sunrise Dam Butcher Well (70%) Tropicana (70%) |
Notes:
(1) An Inferred Mineral Resource was declared for the first time at the Merlin deposit in the Expanded Silicon project as of 31 December 2023.
(2) A Mineral Reserve was declared for the first time at North Bullfrog as of 31 December 2023.
(3) Sterling includes the Crown Block.
(4) Kibali is operated by Barrick Gold Corporation (“Barrick”).
The locations of AngloGold Ashanti’s properties are shown above. Percentages indicate the ownership interest held by
AngloGold Ashanti. All operations are 100 percent wholly-owned unless otherwise indicated.
Overview of mining properties and operations
The overview for each mining property is disclosed below and includes information on the following items:
•Location of the properties;
•For each material property, locality maps showing the location of such properties as well as infrastructure and licences;
•Type and amount of ownership interests;
•Identity of the operator or operators;
•Titles, mineral rights, leases or options and acreage involved;
•Stages of the properties (exploration, development or production);
•Key permit conditions;
•Mine types and mineralisation styles; and
•Processing plants and other available facilities.
100
Refer to “Item 5A: Operating Results—Key factors affecting results—Comparison of gold production in 2023 with 2022” and “Item
5A: Operating Results—Key factors affecting results—Comparison of gold production in 2022 with 2021” for the aggregate
annual production for each of the Company’s mining properties during each of the fiscal years ended 31 December 2023, 2022
and 2021. For more information about AngloGold Ashanti’s mines, including a summary of the Company’s titles, mining rights,
leases and licences with acreage, refer to “Item 4B: Business Overview—The Regulatory Environment Enabling AngloGold
Ashanti to Mine”.
The mining property information stated herein was prepared in compliance with Subpart 1300 of Regulation S-K (17 CFR
§229.1300) (“Regulation S-K 1300”), which contains the SEC’s mining property disclosure requirements for mining registrants.
AngloGold Ashanti has developed a process to determine which properties are material to its business or financial condition for
purposes of the individual property disclosure requirements of Item 1304 of Regulation S-K (17 CFR § 229.1304). The key
considerations taken into account by AngloGold Ashanti in its materiality assessment include (i) certain quantitative factors such
as contribution to the Mineral Resource and Mineral Reserve, actual and planned production and Net Present Value, as well as
(ii) certain qualitative factors, which are assessed in the context of the Company’s overall business and financial condition. The
materiality assessment covers all of the Company’s mining properties (regardless of the stage of the mining property) and all of
its mining and related activities from exploration through extraction, and is reviewed by the Company on an annual basis.
Based on the above considerations, AngloGold Ashanti has determined that, as of 31 December 2023, its material properties for
purposes of Regulation S-K 1300 are Geita, Kibali, Obuasi and the Merlin deposit in the Expanded Silicon project. With respect
to Obuasi, an updated Technical Report Summary (effective date: 31 December 2023) has been prepared by the relevant
Qualified Persons, and is filed as Exhibit 19.15.7 hereto. With respect to the Merlin deposit in the Expanded Silicon project, a
Technical Report Summary (effective date: 31 December 2023) has been prepared by the relevant Qualified Person, and is filed
for the first time as Exhibit 19.15.10 hereto. With respect to Kibali and Geita, AngloGold Ashanti has determined that, as of 31
December 2023, (i) there have not been any material changes to the Mineral Resource or Mineral Reserve reported in the
Technical Report Summaries for these properties (which were first filed as exhibits to AngloGold Ashanti’s annual report on Form
20-F for the fiscal years ended 31 December 2021 and 31 December 2022, respectively), and (ii) all material assumptions and
information pertaining to the disclosure of the Mineral Resource and Mineral Reserve for Kibali and Geita remain current in all
material respects, based on all facts and circumstances, both quantitative and qualitative. As a result, the previously filed
Technical Report Summaries for Kibali (effective date: 31 December 2021) and Geita (effective date: 31 December 2022) are re-
filed as Exhibits 19.15.8 and 19.15.5, respectively, hereto.
AngloGold Ashanti’s operating mines are all accessible by road, although for some, personnel access is better achieved by air.
AngloGold Ashanti’s exploration programmes are based on consistent standards and processes across its portfolio and are
guided by peer review. Part of AngloGold Ashanti’s investment strategy is focused on exploration drilling and Mineral Reserve
development to grow the Mineral Resource and by converting these, the Company allows for expansion of the Mineral Reserve.
The process involves identifying the best group of drill targets and prioritising those that have the highest potential for success to
be advanced first. Greenfields exploration aims to discover large, high-value Mineral Resource, which will eventually lead to the
development of new gold mines. Brownfields exploration focuses on delivering value through accretive additions to the Mineral
Reserve at existing mines as well as new discoveries in defined areas around operations.
This annual report on Form 20-F is not being submitted in support of the disclosure of exploration results and therefore no
disclosure of drilling or sample results is provided. AngloGold Ashanti has elected not to provide drilling results for its operating
mines as drilling at its brownfields operations is generally intended to provide incremental additions, or conversions to already
reported Mineral Resource and therefore they are not seen as material. While drilling at the Company’s brownfields operations
increases confidence in its Mineral Resource as well as adds life-of-mine (“LOM”) extensions, the incremental additions that
occur on a yearly basis are not material to that operation or the Company as a whole. In cases where the drilling projects are
supporting a non-sustaining addition, these projects are commented on. In the Company’s major greenfields projects, if any
single drill result is considered material and may change the reported Mineral Resource significantly then it is reported. Refer to
“Item 4B: Business Overview—Exploration review”.
AFRICA
AngloGold Ashanti has five mining operations within the Africa region:
•Kibali Gold Mine in the Democratic Republic of the Congo (“DRC”), a joint venture (“JV”) between AngloGold Ashanti (45
percent), Barrick Gold Corporation (“Barrick”) (following its merger with Randgold Resources Limited (“Randgold”)) (45
percent), and Société Minière de Kilo-Moto S.A. (“SOKIMO”), a state-owned gold mining company (10 percent);
•Iduapriem Gold Mine (“Iduapriem”) and Obuasi Gold Mine (“Obuasi”) in Ghana;
•Siguiri Gold Mine (“Siguiri”) in Guinea, co-owned by AngloGold Ashanti (85 percent) and the government of Guinea (15
percent); and
•Geita Gold Mine (“GGM” or “Geita”) in Tanzania.
Mining is from both open pit and underground, with Obuasi being an underground mine, Iduapriem and Siguiri being open pit
mines, and Kibali and Geita being a combination of open pit and underground mines.
101
DRC
KIBALI
The Company has determined that, as of 31 December 2023, Kibali continues to be a material property for purposes of
Regulation S-K 1300. For additional information, refer to the Technical Report Summary for Kibali (effective date: 31 December
2021) filed as Exhibit 19.15.8 hereto.
Property description
Kibali is a joint venture co-owned by AngloGold Ashanti (45 percent), Barrick (45 percent), and SOKIMO (10 percent). SOKIMO
is wholly-owned by the DRC government. The metallurgical plant comprises a twin-circuit sulphide and oxide plant with
conventional carbon-in-leach (“CIL”), including gravity recovery as well as a float and ultra-fine grind circuit. Barrick operates the
mine, which comprises both open pit and underground operations.
Kibali is a gold mining, processing and exploration project. Operations currently focus on open pit and underground mining. The
mine was originally developed and operated by Randgold. Following the completion of the merger of Randgold and Barrick in
2019, Barrick became the operator at Kibali for both exploration and mining. Kibali is currently a production stage property.
Location
Kibali is located in the northeastern part of the DRC near the international borders with Uganda and South Sudan. The mine is
located adjacent to the village of Doko, which is located to the west of the lease area. Kibali is approximately 210km by road from
Arua and immediately north of the district capital of Watsa. The operational area falls within the administrative territory of Watsa
in Haut-Uélé province.
Mineralisation style
Gold deposits of the Kibali district are classified as Archaean orogenic gold deposits. At Kibali, the gold deposits are largely
hosted in siliciclastic rocks, banded iron formations (“BIFs”) and chert that were deformed, altered and transposed during several
events. This occurred at or near greenschist metamorphic conditions. Ore-forming H2O-CO2-rich fluids migrated along a linked
network of gently northeast-dipping shears and north-northeast plunging fold axes that are commonly referred to as the KZ
Trend. The auriferous KZ Trend is a complexly deformed fault system specifically developed along the boundary between the
younger sedimentary basin in the west of the belt that juxtaposes the older rocks to the east. Mineralisation occurred during the
later stages of subsequent regional deformation which resulted in inversion of the basin and the development of reverse faults
and folds. Ongoing deformation during hydrothermal activity resulted in the development of lodes in a variety of related structural
settings within the KZ Trend.
History
On 15 October 2009, AngloGold Ashanti acquired a 50 percent indirect interest in Moto Goldmines Limited (“Moto”) through a JV
with Randgold, with Moto holding a 70 percent stake in Kibali and the DRC parastatal SOKIMO holding the remaining 30 percent
stake. On 21 December 2009, Randgold and AngloGold Ashanti increased their JV interest in Kibali to 90 percent, while
SOKIMO retained a 10 percent holding. On 2 January 2019, Randgold merged with Barrick, and the JV is now held by the
combined company, trading as Barrick.
Legal aspects and tenure
Refer to “Item 4B: Business Overview—The Regulatory Environment Enabling AngloGold Ashanti to Mine—Africa Region—
Democratic Republic of the Congo (DRC)—AngloGold Ashanti’s rights and permits”.
Mining method
The operation comprises both open pit and underground mining. Open pit mining is carried out using conventional drill, blast,
load and haul surface mining methods. From 2024 onwards, open pit production will come from the Sessenge, Sessenge SW,
Aerodrome, Pamao, Gorumbwa, Megi-Marakeke-Sayi, Kalimva-Ikamva (including Ikamva East), Oere, Pakaka, Rhino, Mengu
Hill, and Karagba, Chauffeur and Durba (“KCD”) deposits. Open pit mining is conducted by contractor Kibali Mining Services, a
local subsidiary of DTP Terrassement, using either free-dig or conventional drill, blast, load and haul methods.
For the underground operation, longitudinal and transverse longitudinal stoping methods with paste backfill are the nominated
mining methods. The Kibali KCD underground mine is designed to extract the KCD deposit directly beneath the KCD open pit. A
50m crown pillar separates the pit bottom from the top of the underground mine. The first gold was poured in September 2013
from the open pit operations and development of the underground mine commenced in the same year. Stoping commenced in
2015 and production has continued to ramp up since 2022. Initial production was truck hauled by a twin decline to surface. In
2017, the haulage shaft (740m deep) and materials handling system was commissioned. From 2018 onwards, underground ore
has predominantly been hoisted up the shaft. The decline to surface will continue to be used to haul some of the shallower zones
and to supplement shaft haulage.
102
Processing plants and other available facilities
Infrastructure in the DRC is generally poor as a result of limited investment in maintenance, upgrades and extensions of the road
networks established during colonial times. The mine site is located within 160km of the border with Uganda and all transport
links take place through Uganda to Kenya or Tanzania. Access by air to Kibali involves a commercial flight to Entebbe in Uganda
followed by a charter flight to Doko airport, situated on the mine property. The Doko airstrip was upgraded by Kibali and is
equipped with runway lights and precision approach path indicator lights. For the number of persons employed at the mine, refer
to “Item 4B: Business Overview—Operating Performance—Africa Region”.
Kibali is a large-scale gold mining operation, with a number of sources of ore, that has been in operation since 2013. The
physical condition of the equipment, facilities, and infrastructure at Kibali is in good working order, with the mine investing heavily
in maintaining and upgrading its assets to ensure that they remain reliable and efficient. Surface infrastructure associated with
the overall Kibali operation includes a processing plant, tailings storage facility (“TSF”), camp, airstrip, underground shaft,
workshops and offices. Power to the mine is self-generated by a combination of hydroelectric and diesel generators. The primary
source of raw water supply is rain and spring water catchments with top-up from a borehole system and a final backup from the
Kibali River. Raw water is collected and stored in the raw water dam, which has a storage capacity of 16,000m3. The
underground mine has also been extensively developed, with the construction of both shaft and portal and strategically placed
development drives that access and further explore the gold-bearing ore.
The “Property, Plant, and Equipment” as of 31 December 2023, including lease assets, buildings and mine infrastructure, mining
assets, mineral rights and dumps, decommissioning assets, capitalised exploration costs and deferred stripping, had a carrying
value of $971 million (reported as attributable; 45 percent owned by AngloGold Ashanti).
Mineral processing
The current processing plant can treat both oxide and fresh sulphide material and uses flotation with ultra-fine grind of the
flotation concentrate, a treatment that is required for the sulphide ore type before leaching. Kibali has a processing operation
capable of at least 7.2Mtpa throughput. The ore is blended using both KCD underground ore plus ore sourced from satellite open
pits at Kibali.
Mineral Resource
The below table, prepared in accordance with Table 1 to Paragraph (d)(1) of Item 1304 of Regulation S-K, summarises the gold
Mineral Resource (exclusive of Mineral Reserve) for Kibali at the end of the fiscal year ended 31 December 2023, based on a
gold price estimate of $1,700/oz, unless otherwise stated.
Mineral Resource | Category | Tonnes | Grade | Contained Gold | |
at 31 December 2023 | million | g/t | tonnes | Moz | |
Kibali (45 percent) | Measured | 5.79 | 3.65 | 21.15 | 0.68 |
Indicated | 18.11 | 2.83 | 51.20 | 1.65 | |
Measured & Indicated | 23.90 | 3.03 | 72.35 | 2.33 | |
Inferred | 8.82 | 2.79 | 24.57 | 0.79 | |
Notes:
Rounding of numbers may result in computational discrepancies in the Mineral Resource tabulations. All figures are expressed on an attributable basis unless
otherwise indicated. The Mineral Resource estimates with respect to our material properties have been prepared by the Qualified Persons (employed by
AngloGold Ashanti unless stated otherwise). The net difference between the Mineral Resource at the end of the last completed fiscal year and the preceding
fiscal year is detailed in the table below. To reflect that figures are not precise calculations and that there is uncertainty in their estimation, AngloGold Ashanti
reports tonnage, grade and content for gold to two decimals. All ounces are Troy ounces. “Moz” refers to million ounces.
1.All disclosure of Mineral Resource is exclusive of Mineral Reserve. The Mineral Resource exclusive of Mineral Reserve is defined as the inclusive Mineral
Resource less the Mineral Reserve before dilution and other factors are applied.
2.Mineral Resource attributable to AngloGold Ashanti’s percentage interest shown.
3.The Mineral Resource tonnages and grades are reported in situ and stockpiled material is reported as broken material.
4.“Tonnes” refers to a metric tonne which is equivalent to 1,000 kilograms.
5.Operated by Barrick. AngloGold Ashanti has recognised that in preparing this information, the Qualified Persons have relied on information provided by
Barrick. Based on a gold price of $1,700/oz. AngloGold Ashanti has determined that there is no material change to the Mineral Resource reported in the
2021 Technical Report Summary for Kibali (effective date: 31 December 2021) filed as Exhibit 19.15.8 hereto if this updated gold price of $1,700/oz is used
(instead of $1,500/oz, the gold price used to estimate the Mineral Resource in 2021).
6.Property currently in a production stage.
7.In 2023, a metallurgical recovery factor range from 75.9% to 90.9% (varying according to area) was applied to the open pit and stockpile, and a metallurgical
recovery factor of 90% was applied to the underground.
8.In 2023, a cut-off grade range from 0.55g/t to 0.89g/t was applied to the open pit (varying according to rock type), a cut-off grade range from 0.51g/t to 0.56g/
t was applied to the stockpiles (varying according to area), and a cut-off grade of 1.50g/t was applied to the underground.
Year-on-year changes in Mineral Resource - Moz
at 31 December 2023 | Kibali | |||
Category | Measured | Indicated | Total Measured and Indicated | Inferred |
Previous Year | 0.74 | 1.88 | 2.62 | 1.11 |
Exploration and Methodology | 0.08 | (0.15) | (0.07) | (0.32) |
Economic Assumptions | (0.07) | (0.05) | (0.12) | — |
Other | (0.07) | (0.03) | (0.10) | — |
103
at 31 December 2023 | Kibali | |||
Category | Measured | Indicated | Total Measured and Indicated | Inferred |
Acquisition / Disposal | — | — | — | — |
Current Year | 0.68 | 1.65 | 2.33 | 0.79 |
Net Difference | (0.06) | (0.23) | (0.29) | (0.32) |
% Difference | (8) | (12) | (11) | (29) |
Notes:
All figures are expressed on an attributable basis unless otherwise indicated. AngloGold Ashanti has recognised that in preparing this information, the Qualified
Persons have relied on information provided by Barrick.
The decrease in Measured and Indicated Mineral Resource and Inferred Mineral Resource was mainly driven by exploration and
methodology changes as well as other changes which included the creation of new stope exclusion solids to remove
unrecoverable blocks around mined out areas (where both secondary and primary areas are mined). There was also a decrease
in the Mineral Resource for the Pamao Main pit due to a lower cut-off grade used in the Mineral Reserve.
Estimation
Mineral Resource estimation is undertaken by Barrick in-house technical experts or by approved external consultants. The
results of both diamond drilling (“DD”) and reverse circulation (“RC”) drilling are used in the estimation process. 3D mineralised
envelopes are established using grade and geology, and these are then statistically verified to confirm their validity for use in
grade estimation. Appropriate domaining of homogeneous zones is conducted whereby high-grade central core areas are
modelled separately from the lower-grade surrounding halos. Volumes are filled with block model cells and interpolated for
density, rock type and grade – the latter using ordinary kriging.
Grade top cuts and restricted searches are applied to drill hole data to prevent the spread of high-grades during the estimation
process. Drill hole spacing is used to guide the Mineral Resource classification. The open pit Mineral Resource is quoted within a
limiting shell. The underground Mineral Resource is constrained by the application of optimised mineable Mineral Resource
shapes, which applies reasonable mineability constraints including a minimum mining width, a reasonable distance from current
or planned development, and a measure of assumed profitability at the related Mineral Resource cut-off grade.
Mineral Reserve
The below table, prepared in accordance with Table 2 to Paragraph (d)(1) of Item 1304 of Regulation S-K, summarises the gold
Mineral Reserve for Kibali at the end of the fiscal year ended 31 December 2023, based on a gold price estimate of $1,300/oz,
unless otherwise stated.
Mineral Reserve | Category | Tonnes | Grade | Contained Gold | |
at 31 December 2023 | million | g/t | tonnes | Moz | |
Kibali (45 percent) | Proven | 13.82 | 3.44 | 47.58 | 1.53 |
Probable | 33.36 | 2.92 | 97.40 | 3.13 | |
Total | 47.18 | 3.07 | 144.98 | 4.66 | |
Notes:
Rounding of numbers may result in computational discrepancies in the Mineral Reserve tabulations. All figures are expressed on an attributable basis unless
otherwise indicated. The Mineral Reserve estimates with respect to our material properties have been prepared by the Qualified Persons (employed by AngloGold
Ashanti unless stated otherwise). The net difference between the Mineral Reserve at the end of the last completed fiscal year and the preceding fiscal year is detailed
in the table below. To reflect that figures are not precise calculations and that there is uncertainty in their estimation, AngloGold Ashanti reports tonnage, grade and
content for gold to two decimals. All ounces are Troy ounces. “Moz” refers to million ounces.
1.Mineral Reserve attributable to AngloGold Ashanti’s percentage interest shown.
2.The Mineral Reserve tonnages and grades are estimated and reported as delivered to the plant (i.e., the point where material is delivered to the processing
facility).
3.“Tonnes” refers to a metric tonne which is equivalent to 1,000 kilograms.
4.Operated by Barrick. AngloGold Ashanti has recognised that in preparing this information, the Qualified Persons have relied on information provided by
Barrick. Open Pits and underground were based on a gold price of $1,300/oz. In 2023, the Pamao pit shell and cut-off grade was determined based on a
gold price of $1,700/oz, but financially evaluated and found to be profitable at a gold price of $1,300/oz (supporting the 2023 Mineral Reserve declaration).
This is exceptional and is driven by the need to create space for in pit tailings, further saving on capital costs. AngloGold Ashanti has determined that there is
no material change to the Mineral Reserve reported in the 2021 Technical Report Summary for Kibali (effective date: 31 December 2021) filed as Exhibit
19.15.8 hereto if this updated gold price of $1,300/oz is used (instead of $1,200/oz, the gold price used to estimate the Mineral Reserve in 2021).
5.Property currently in a production stage.
6.In 2023, a metallurgical recovery factor range from 75.9% to 90.9% (varying according to area) was applied to the open pit and stockpile, and a metallurgical
recovery factor of 90% was applied to the underground.
7.In 2023, an average cut-off grade of 0.80g/t was applied to the open pit, a cut-off grade of 0.55g/t was applied to the stockpile, and a cut-off grade of 1.96g/t
was applied to the underground.
104
Year-on-year changes in Mineral Reserve - Moz
at 31 December 2023 | Kibali | ||
Category | Proven | Probable | Total |
Previous Year | 1.62 | 2.95 | 4.57 |
Depletion | (0.12) | (0.28) | (0.40) |
Exploration and Methodology | 0.02 | 0.38 | 0.40 |
Economic Assumptions | — | 0.08 | 0.08 |
Other | 0.02 | — | 0.02 |
Acquisition / Disposal | — | — | — |
Current Year | 1.53 | 3.13 | 4.66 |
Net Difference | (0.09) | 0.18 | 0.09 |
% Difference | (5) | 6 | 2 |
Notes:
All figures are expressed on an attributable basis unless otherwise indicated. AngloGold Ashanti has recognised that in preparing this information, the Qualified
Persons have relied on information provided by Barrick.
The increase in Mineral Reserve was mainly due to exploration success at 11000 and 9000 Lodes underground, plus Rhino,
Sessenge, Mengu Hill and Ikamva open pits, and a decrease in the cut-off grade used for Pamao Main pit, which was partially
offset by depletion.
Estimation
The open pit Mineral Reserve shell optimisations were run on the Mineral Resource models. The process incorporated the
mining layout, operating factors, stripping ratio, relevant cut-off grades and modifying factors for reporting the Mineral Reserve.
A cut-off grade analysis of $1,300/oz was used to determine a cut-off grade of 1.96g/t for the underground mine. Longitudinal
and transverse longhole open stoping methods with paste backfill are the current preferred mining methods. Underground stope
designs were updated from the previously reported Mineral Reserve using the latest Mineral Resource models. Modifying factors
for planned and unplanned rock dilution, backfill dilution and ore loss were applied to obtain the reported Mineral Reserve.
Metallurgical, environmental, social, legal, marketing and economic factors were adequately considered in the Kibali feasibility
study and have been updated as the project has developed.
Map showing Kibali planned infrastructure and licences
Below is a map that shows Kibali infrastructure and licences, with the total mining lease area insert shown in the top right corner.
The coordinates of the mine, as represented by the plant, are depicted on the map and are in the geographic coordinate system.
105
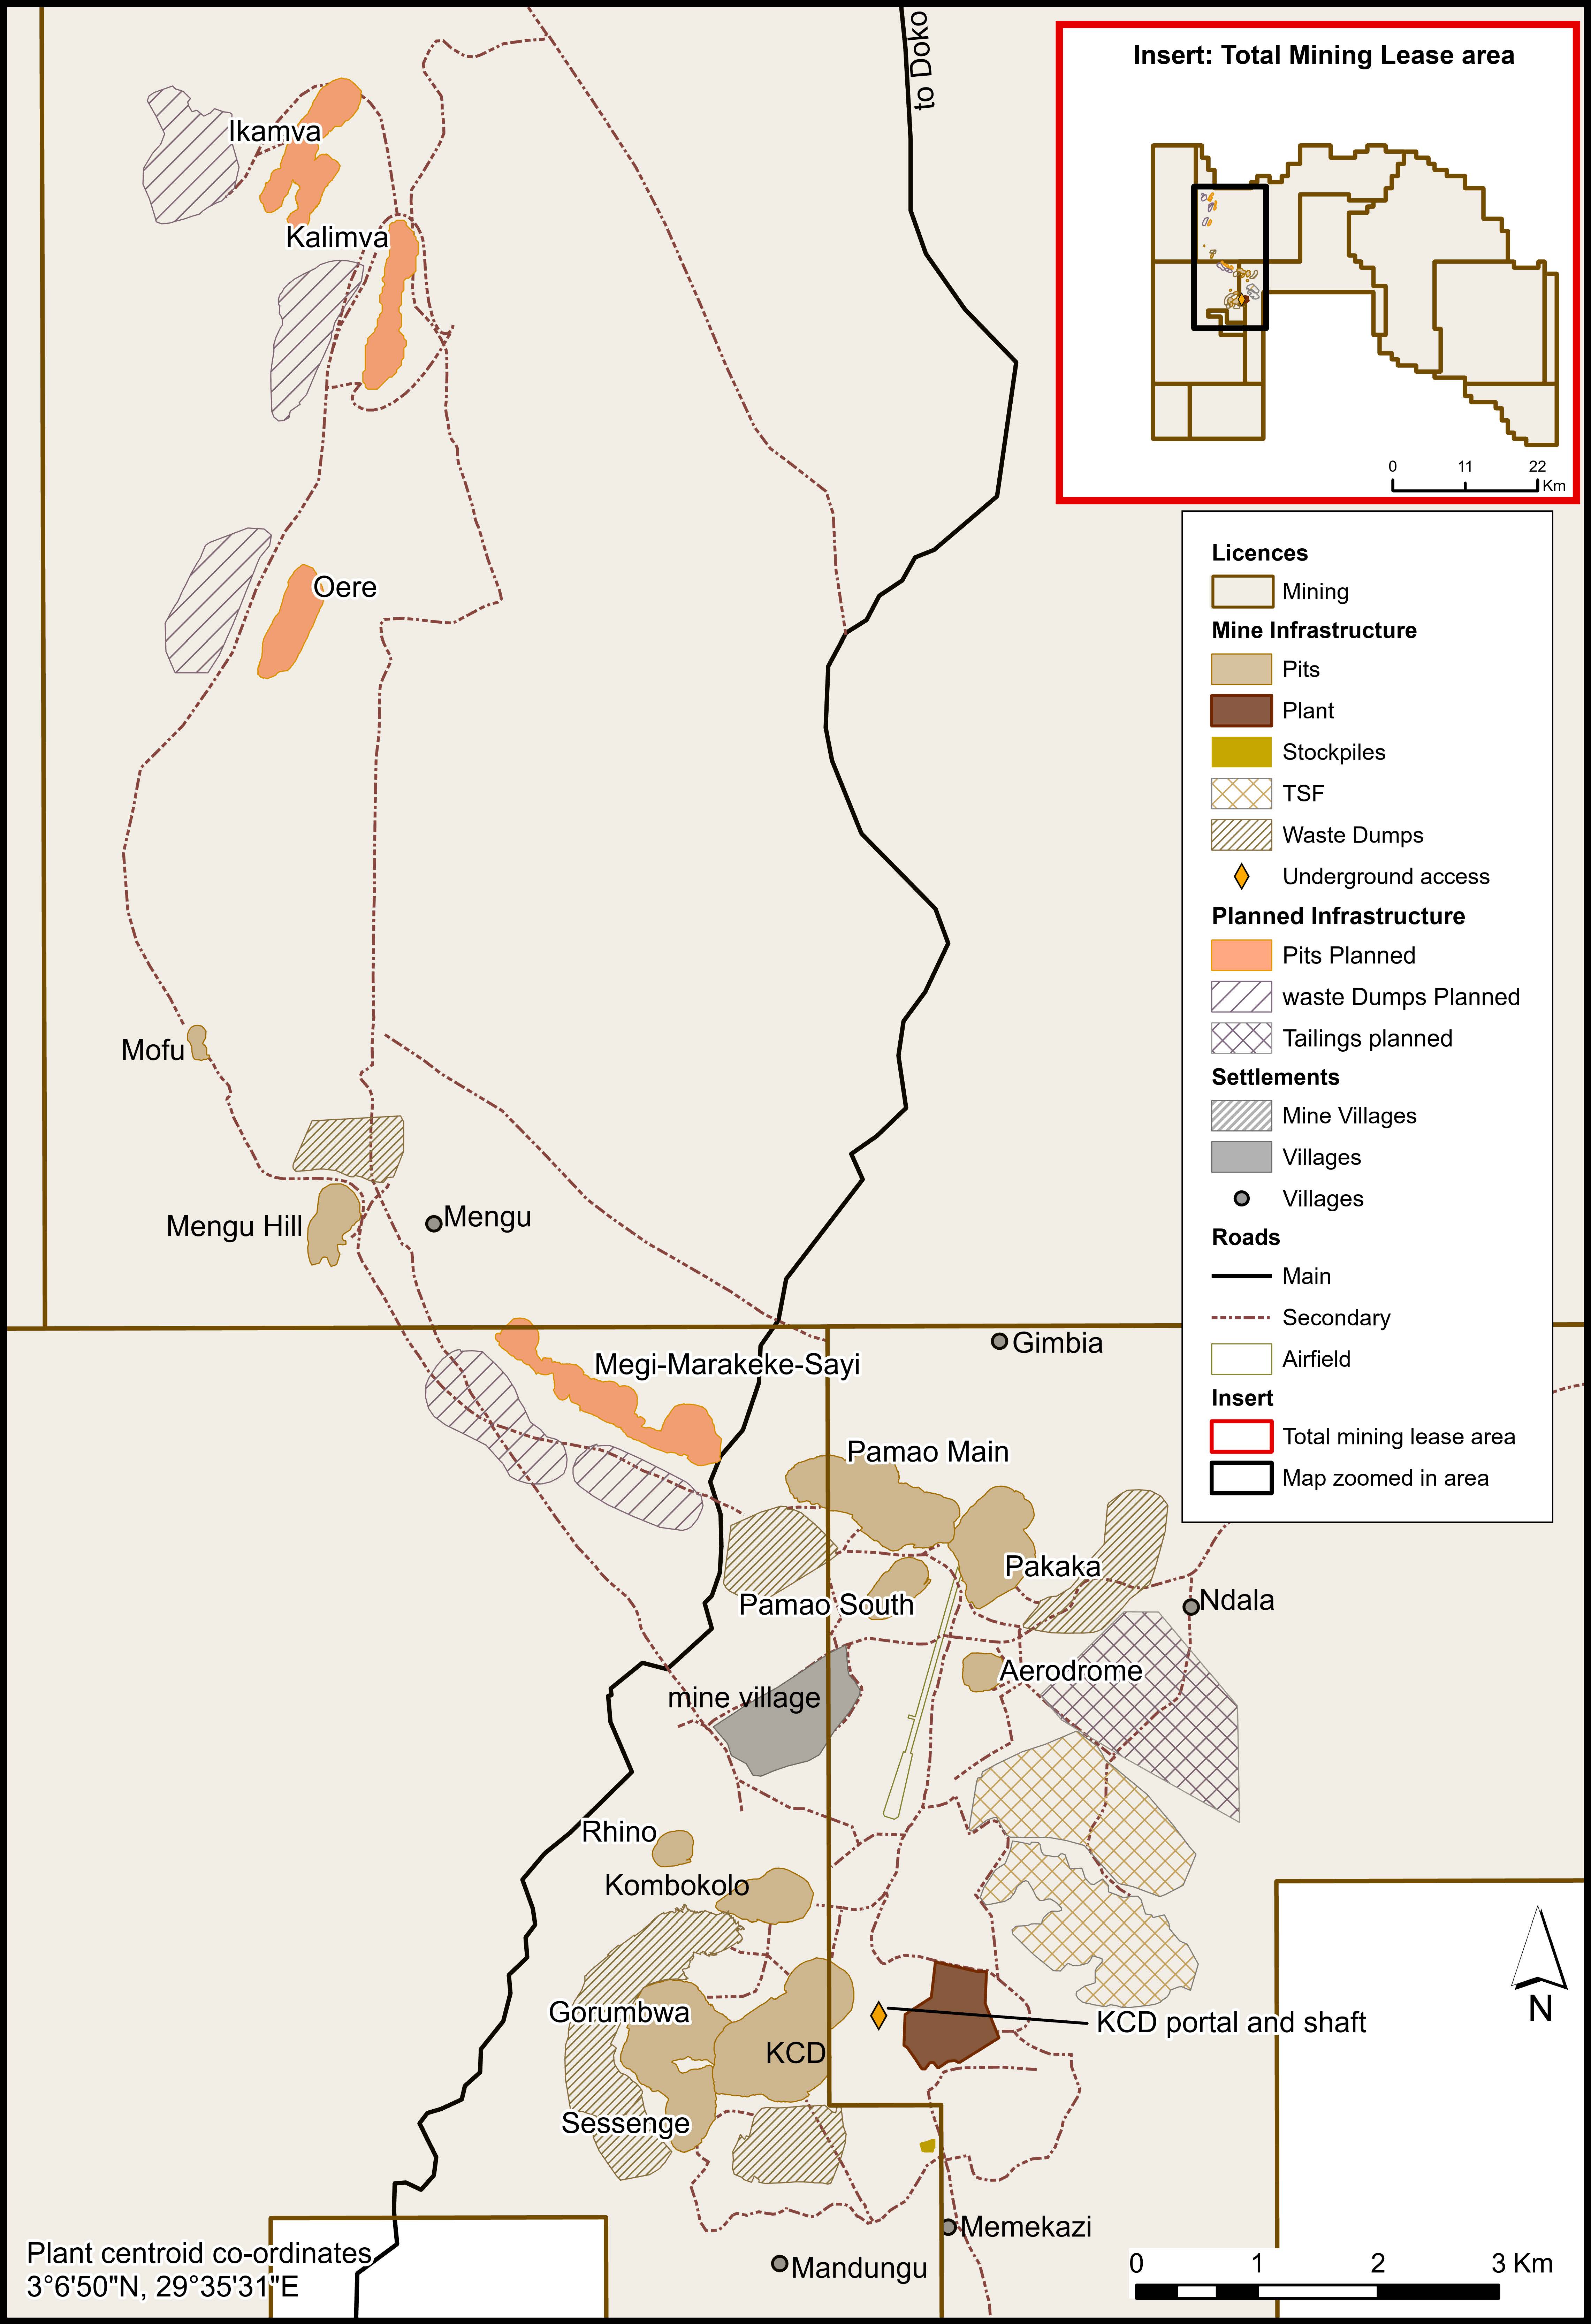
GHANA
AngloGold Ashanti has two mines in Ghana. Obuasi and Iduapriem are both wholly-owned and operated by AngloGold Ashanti.
Obuasi is an underground mine operating at depths of up to 1,500m with a continuous history of mining dating back to the
1890s. Iduapriem is an open pit mine.
Obuasi is located in the Ashanti region of southern Ghana, approximately 60km south of Kumasi. Mining was temporarily
suspended at the end of 2014 while a series of economic studies progressed. Obuasi underground development restarted in the
106
first half of 2019, with the first gold produced in December 2019. The ramp-up of the redevelopment project was delayed by the
temporary stoppage of underground activities after a fall of ground incident in May 2021. Production remained suspended for
several months to allow for reviews and investigations, but slowly resumed in the latter part of 2021.
Iduapriem is located in western Ghana, some 85km from the coast and south of Obuasi, near the town of Tarkwa.
OBUASI
The Company has determined that, as of 31 December 2023, Obuasi continues to be a material property for purposes of
Regulation S-K 1300. For additional information, refer to the Technical Report Summary for Obuasi (effective date: 31 December
2023) filed as Exhibit 19.15.7 hereto.
Property description
Obuasi is wholly-owned by AngloGold Ashanti and is a production stage property. The mine is an underground operation, and it
has been in operation since 1897 (more than 120 years). It has been operated by AngloGold Ashanti since 2004.
Location
The mine is in the municipality of Obuasi, in the Ashanti region of Ghana, about 240km northwest of the capital, Accra, and 60km
south of Kumasi.
Mineralisation style
Geologically, Obuasi is in the Ashanti belt on the eastern margin of the Pre-Cambrian West African craton. This craton consists of
Lower Proterozoic volcanic and flysch sediments which make up the Birimian system, overlain in part by the molasse sediments
of the Middle Proterozoic Tarkwaian. The Ashanti belt is the most prominent of the five Birimian Supergroup gold belts found in
Ghana.
Gold mineralisation is associated with shear zones and pervasive silica, carbonate and sulphide hydrothermal alteration which
occur in tightly folded Lower Birimian schists, phyllites, meta-greywackes, and tuffs, along the eastern limb of the Kumasi
anticlinorium. They are found near the contact with harder metamorphosed and metasomatically altered intermediate to basic
upper Birimian volcanics. There are two broad styles of gold mineralisation including free milling quartz vein gold and sulphide-
rich, disseminated and refractory gold which form alteration haloes around the quartz vein lodes. Sulphide mineralisation is
dominated by arsenopyrite and quartz mineralisation, which is associated with spatially variable, but exceptionally high-grade
visible gold in quartz veins.
History
Obuasi has a long mining history dating back to 1897. It has been owned and operated by various operators during this time.
The current operator became involved in 2004 following the merger of former AngloGold Limited of South Africa and the Ashanti
Goldfields Company Limited of Ghana. However, for several years leading up to 2014, the mine began to struggle due to ailing
infrastructure and outdated methodologies. The Company realised that significant rationalisation and/or replacement of current
infrastructure would be necessary to enable the delivery of better utilisation and productivity metrics.
In 2014, a feasibility study commenced that considered the optimum mining methodology and schedules for the underground
mine, based on modern mechanised mining methods and refurbishment of underground, surface and process plant
infrastructure. During this time, Obuasi operated in a limited operating phase with underground activities essentially restricted to
the continued development of the Obuasi deeps decline and underground infill drilling. The limited operating phase was brought
to a halt after an incursion by illegal miners on Obuasi’s concession in February 2016, at which point the mine was placed under
care and maintenance. However, the study continued and in 2017, a favourable feasibility study was completed and indicated a
strong technical and economic case with an anticipated 20-year LOM. In 2018, approval was received from the AngloGold
Ashanti board and the government of Ghana to proceed with the project.
The redevelopment project began in late 2018 and first gold was poured during the fourth quarter of 2019. Phase 1 of the
redevelopment project was completed by the end of September 2020, and the mine began commercial production on 1 October
2020. Phase 2 of the redevelopment project, which focused on construction and mine development, was completed in 2021.
Phase 3 of the redevelopment project to develop the infrastructure necessary to support the planned ramp-up in production is
currently ongoing.
Legal aspects and tenure
Refer to “Item 4B: Business Overview—The Regulatory Environment Enabling AngloGold Ashanti to Mine—Africa Region—
Ghana—AngloGold Ashanti’s rights and permits”.
Mining method
Obuasi is an underground operation, utilising both vertical shafts and declines as main access routes to the underground
workings. The mine has seen extensive historical mining activities with varying applications of different mining methods to date.
The current LOM design employs mostly the Long Hole Open Stoping (“LHOS”) mining method for ore extraction. LHOS is a
highly selective and productive method of mining that can be employed for orebodies of varying thicknesses and dips. The main
distinct variations of the LHOS used at Obuasi are longitudinal retreat stoping (“LRS”), and transverse open stoping (“TOS”). The
107
blind upper stoping is a form of LRS or TOS used for partial sill pillar recovery. Obuasi is currently undertaking a trial of the
Underhand Drift and Fill (“UHDF”) mining method, which is a more selective mining method in following the local variations to the
orebody and is considered to provide greater control on excavation stability, with reduced dilution and increased mining recovery
outcomes. If successful, the UHDF mining method will be incorporated into future mine designs, in particular in high-grade areas
at depth in challenging ground conditions.
Processing plants and other available facilities
All significant surface activities, including ore processing, environmental management and community engagement are carried
out by Obuasi staff. Existing infrastructure includes a 2.2Mtpa processing plant with flotation and bacterial oxidation (“BIOX”),
extensive underground development, hoisting shafts and associated infrastructure, mine ventilation and refrigeration facilities,
emergency standby power and water reticulation, office complexes, workshops, and company housing estates. Power is
supplied to the mine by the Volta River Authority and Ghana Grid Company Limited (“GRIDCo”). The mine is authorised by the
Ghanaian Water Resources Commission to extract water from the Jimi Dam, which is treated for domestic use. Additionally,
underground water is extracted for operational purposes. There is a focus mine development plan supported by the existing
infrastructure, and ongoing upgrades of critical underground infrastructure to sustain the operations. The mine can be accessed
by paved road network from Kumasi and by road or chartered air transport from the capital, Accra. For the number of persons
employed at the mine, refer to “Item 4B: Business Overview—Operating Performance—Africa Region”.
The “Property, Plant, and Equipment” as of 31 December 2023, including buildings and mine infrastructure, mining assets,
decommissioning assets and assets under construction, had a carrying value of $1,162 million.
Mineral processing
The plant is configured for both conventional and flash flotation and BIOX treatment which is required for the refractory sulphide
ore. The gravity gold recovery system is also integrated with Knelson concentrators and inline leach reactors.
Mineral Resource
The below table, prepared in accordance with Table 1 to Paragraph (d)(1) of Item 1304 of Regulation S-K, summarises the gold
Mineral Resource (exclusive of Mineral Reserve) for Obuasi at the end of the fiscal year ended 31 December 2023, based on a
gold price estimate of $1,750/oz for both the underground and open pit Mineral Resource, unless otherwise stated.
Mineral Resource | Category | Tonnes | Grade | Contained Gold | |
at 31 December 2023 | million | g/t | tonnes | Moz | |
Obuasi | Measured | 3.47 | 7.77 | 26.97 | 0.87 |
Indicated | 28.83 | 6.95 | 200.23 | 6.44 | |
Measured & Indicated | 32.30 | 7.03 | 227.20 | 7.30 | |
Inferred | 35.37 | 8.48 | 299.94 | 9.64 | |
Notes:
Rounding of numbers may result in computational discrepancies in the Mineral Resource tabulations. All figures are expressed on an attributable basis unless
otherwise indicated. The Mineral Resource estimates with respect to our material properties have been prepared by the Qualified Persons (employed by
AngloGold Ashanti unless stated otherwise). The net difference between the Mineral Resource at the end of the last completed fiscal year and the preceding
fiscal year is detailed in the table below. To reflect that figures are not precise calculations and that there is uncertainty in their estimation, AngloGold Ashanti
reports tonnage, grade and content for gold to two decimals. All ounces are Troy ounces. “Moz” refers to million ounces.
1.All disclosure of Mineral Resource is exclusive of Mineral Reserve. The Mineral Resource exclusive of Mineral Reserve is defined as the inclusive Mineral
Resource less the Mineral Reserve before dilution and other factors are applied.
2.“Tonnes” refers to a metric tonne which is equivalent to 1,000 kilograms.
3.The Mineral Resource tonnages and grades are reported in situ and stockpiled material is reported as broken material.
4.Property currently in a production stage.
5.Based on a gold price of $1,750/oz.
6.In 2023, a metallurgical recovery factor of 88% was applied to the underground.
7.In 2023, a cut-off grade of 1.07g/t was applied to the open pit, and a cut-off grade range from 3.79g/t to 4.49g/t (varying according to area) was applied to
the underground.
Year-on-year changes in Mineral Resource - Moz
at 31 December 2023 | Obuasi | |||
Category | Measured | Indicated | Total Measured and Indicated | Inferred |
Previous Year | 0.53 | 5.39 | 5.92 | 10.87 |
Exploration and Methodology | 0.11 | 0.67 | 0.78 | 0.64 |
Economic Assumptions | (0.03) | (0.31) | (0.34) | (0.83) |
Other | 0.25 | 0.69 | 0.94 | (1.04) |
Acquisition / Disposal | — | — | — | — |
Current Year | 0.87 | 6.44 | 7.30 | 9.64 |
Net Difference | 0.33 | 1.05 | 1.38 | (1.23) |
% Difference | 63 | 19 | 23 | (11) |
Notes:
All figures are expressed on an attributable basis unless otherwise indicated.
108
Exploration drilling, underground model updates and the remodelling of the Anyinam open pit resulted in an increase in the
Measured, Indicated and Inferred Mineral Resource, which was partially offset by an increase in operating costs. Void
management is ongoing and has resulted in the net restoration of previously unmineable stopes for Measured and Indicated
Mineral Resource, which was offset by a net sterilisation of stopes in the Inferred Mineral Resource.
Estimation
The estimation technique is ordinary kriging and the primary estimation unit size is 20m x 5m x 15m. This estimation unit size is
representative of the underground mining units and is considered appropriate given the style of mineralisation and mining
methods. Compositing by length is employed and the influence of extreme grades is restricted by grade capping. Sample
spacing is highly variable across the deposit and ranges from 10m x 10m (for grade control areas) up to 200m x 200m (for
exploration targets). However, for the Mineral Resource, the maximum extrapolation from data points is 100m. Any areas beyond
this are not classified and are considered to be upside potential rather than Mineral Resource.
Mineral Reserve
The below table, prepared in accordance with Table 2 to Paragraph (d)(1) of Item 1304 of Regulation S-K, summarises the gold
Mineral Reserve for Obuasi at the end of the fiscal year ended 31 December 2023, based on a gold price estimate of $1,400/oz,
unless otherwise stated.
Mineral Reserve | Category | Tonnes | Grade | Contained Gold | |
at 31 December 2023 | million | g/t | tonnes | Moz | |
Obuasi | Proven | 3.79 | 10.12 | 38.40 | 1.23 |
Probable | 19.03 | 9.60 | 182.63 | 5.87 | |
Total | 22.83 | 9.68 | 221.03 | 7.11 | |
Notes:
Rounding of numbers may result in computational discrepancies in the Mineral Reserve tabulations. All figures are expressed on an attributable basis unless
otherwise indicated. The Mineral Reserve estimates with respect to our material properties have been prepared by the Qualified Persons (employed by AngloGold
Ashanti unless stated otherwise). The net difference between the Mineral Reserve at the end of the last completed fiscal year and the preceding fiscal year is detailed
in the table below. To reflect that figures are not precise calculations and that there is uncertainty in their estimation, AngloGold Ashanti reports tonnage, grade and
content for gold to two decimals. All ounces are Troy ounces. “Moz” refers to million ounces.
1.“Tonnes” refers to a metric tonne which is equivalent to 1,000 kilograms.
2.The Mineral Reserve tonnages and grades are estimated and reported as delivered to the plant (i.e., the point where material is delivered to the processing
facility).
3.Property currently in a production stage.
4.Based on a gold price of $1,400/oz.
5.In 2023, a metallurgical recovery factor of 88% was applied to the underground.
6.In 2023, a cut-off grade range from 4.74g/t to 5.61g/t was applied to the underground (varying according to area).
Year-on-year changes in Mineral Reserve - Moz
at 31 December 2023 | Obuasi | ||
Category | Proven | Probable | Total |
Previous Year | 1.37 | 6.32 | 7.70 |
Depletion | (0.28) | (0.02) | (0.30) |
Exploration and Methodology | 0.02 | 0.13 | 0.14 |
Economic Assumptions | (0.07) | (0.51) | (0.58) |
Other | 0.20 | (0.05) | 0.15 |
Acquisition / Disposal | — | — | — |
Current Year | 1.23 | 5.87 | 7.11 |
Net Difference | (0.14) | (0.45) | (0.59) |
% Difference | (10) | (7) | (8) |
Notes:
All figures are expressed on an attributable basis unless otherwise indicated.
The decrease in the Mineral Reserve was mainly due to an increase in sustaining capital expenditure and operating costs,
depletion and changes in the mining recovery factor. This decrease was partially offset by exploration and methodology changes
due to new drilling information in Sansu, Block 8L and Block 10 as well as interpretation.
109
Estimation
The Mineral Reserve estimation considers mining criteria for the economic cut-off grade and minimum mining width for the
anticipated mining method. All design and scheduling work is undertaken to an applicable level of detail by mine planning
engineers in consultation with other technical specialists using Datamine Studio UGTM and Enhanced Production SchedulerTM
(“EPS”) software.
The cut-off grade parameters used include projected mining, processing, and general and administrative costs. A Mineral
Reserve gold price of $1,400/oz was used. The cut-off grade also considers the metallurgical recovery factor (88 percent applied
for all blocks), mining dilution and recovery, tonne-kilometre haulage cost from all blocks, as well as the backfill type.
Stopes are designed using the Datamine Mineable Shape OptimiserTM (“MSO”) Software where the outputs are further optimised
by manual edits. The stope shapes are generated at section intervals of 15m to 20m based on geotechnical guidance for each
block. The MSO allows the class field to be assigned to each stope generated. The mine design is reviewed taking into
consideration the updated stope shapes, existing development and future infrastructure need. A LOM plan is generated which
considers fleet and infrastructure capacities. All mining blocks are designed for the LHOS mining method. The Mineral Reserve is
reported from the LOM plan and only includes Measured and Indicated Mineral Resource.
110
Map showing Obuasi planned infrastructure and licences
Below is a map that shows the location, infrastructure and mining licence area for Obuasi. The coordinates of the mine, as
represented by the plant, are depicted on the map and are in the geographic coordinate system.
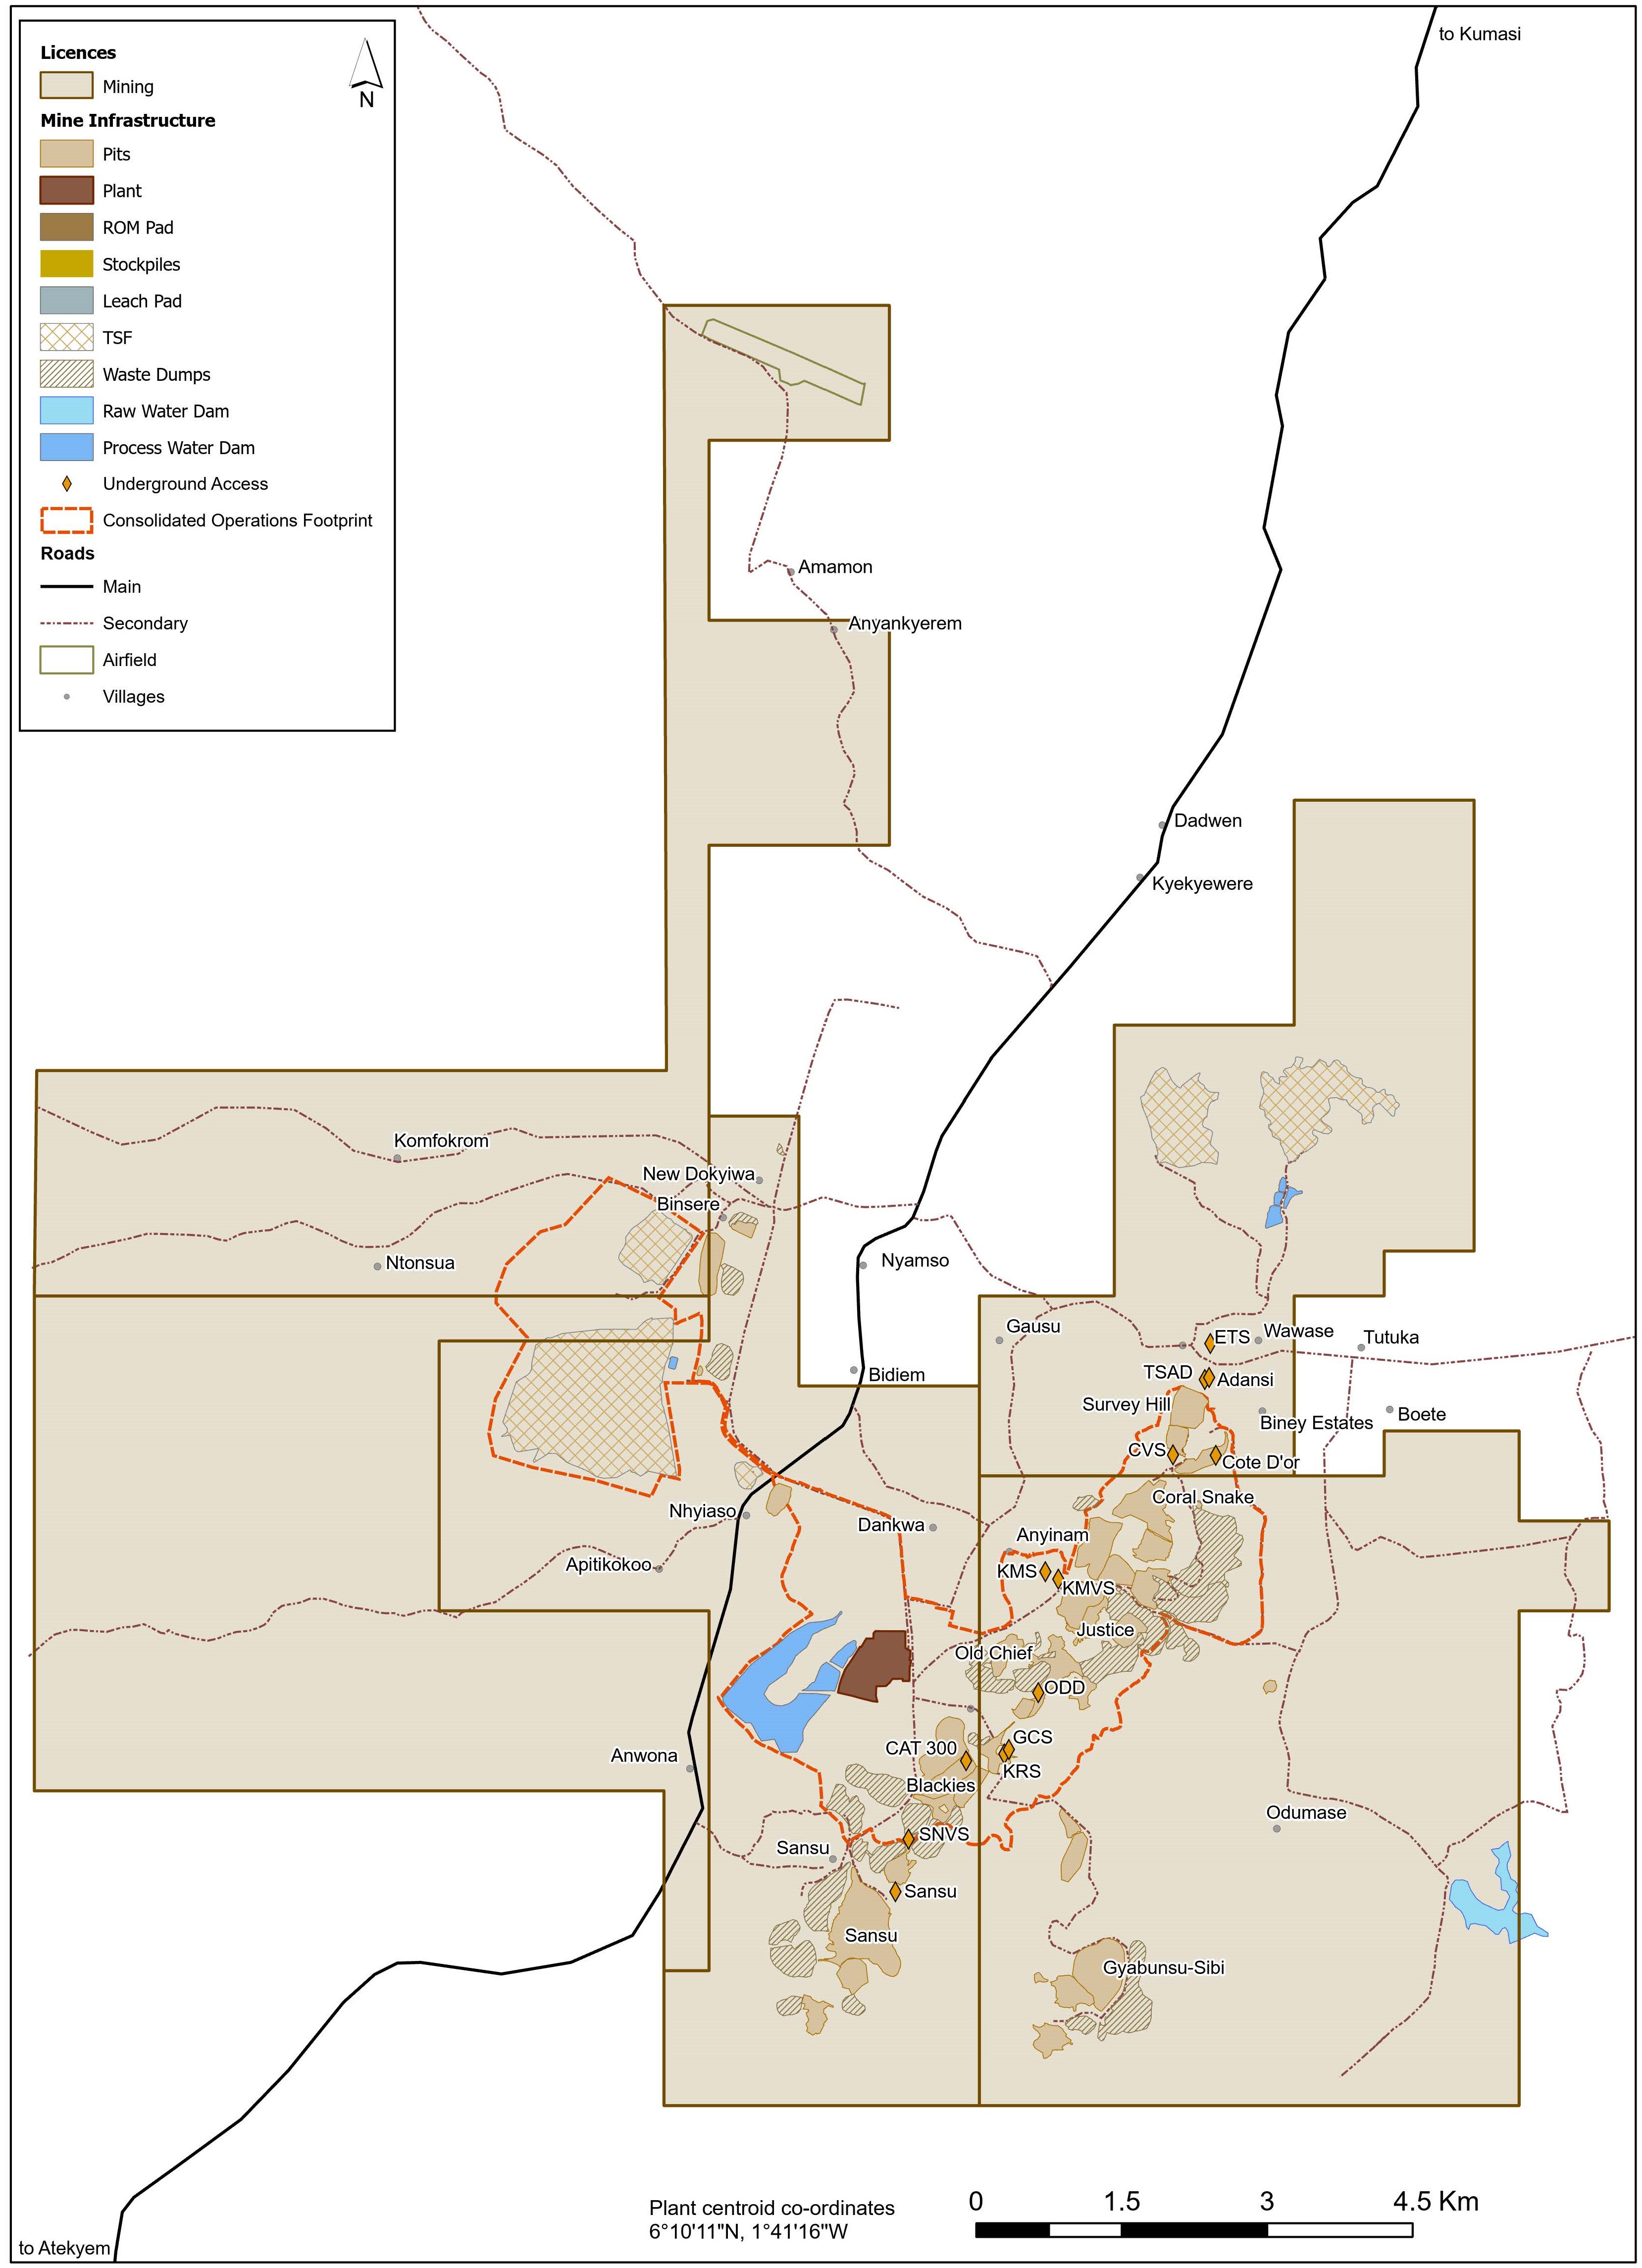
111
IDUAPRIEM
Property description
Iduapriem mine is wholly-owned and operated by AngloGold Ashanti and a production stage property. The mine is a multiple
open pit operation that currently sources ore from the Block 5, Ajopa, and Blocks 7 and 8 pits. In March 2023, AngloGold Ashanti
and Gold Fields announced that they have agreed the key terms of a proposed joint venture in Ghana between Gold Fields’
Tarkwa and AngloGold Ashanti’s neighbouring Iduapriem mines. Negotiations with the government of Ghana are currently
ongoing. There can be no certainty that the parties will enter into a definitive agreement with respect to the proposed joint
venture or about the timing, terms and conditions of any such definitive agreement. Implementation of the proposed joint venture
is subject to, among other matters, reaching agreement with the government of Ghana regarding the proposed joint venture,
conclusion of confirmatory due diligence and securing all requisite regulatory approvals. Consequently, the Mineral Resource
and Mineral Reserve for Iduapriem are reported on the basis of a stand-alone Iduapriem mine.
Location
The mine is located in the western region of Ghana, some 70km north of the coastal city of Takoradi and approximately 10km
southwest of the town of Tarkwa. The Iduapriem mine is bordered to the north by Gold Fields Ghana Limited (Tarkwa Mine) and
to the east by the Ghana Manganese Company Limited (a manganese mine in existence since the 1920s).
Mineralisation style
There are four recognised conglomerate reefs namely A, B, C and D, which are equivalent to the Tarkwaian Sub-basal, Basal (or
Main), Middle (or West), and Breccia Reefs, respectively. The B and C Reefs are oligomictic and consist of well-sorted
conglomerates and have been mined underground in some areas more than a century ago. The A and D Reefs have a lower
gold tenor and are polymictic, containing both well-rounded and angular fragments. Gold is found within the matrix that binds the
pebbles together. The gold content is a function of the size and amount (packing) of quartz pebbles present within a
conglomeratic unit. The gold is fine-grained, particulate and free-milling.
Legal aspects and tenure
Refer to “Item 4B: Business Overview—The Regulatory Environment Enabling AngloGold Ashanti to Mine—Africa Region—
Ghana—AngloGold Ashanti’s rights and permits”.
Processing plants and other available facilities
Surface infrastructure associated with Iduapriem’s operation includes a primary crusher, overland conveyor, CIL processing plant
next to the main office building, a TSF and four camp areas for contractors and company employees. Tarkwa town is also
adjacent to the tenement. Power is supplied to the mine by the Volta River Authority and GRIDCo.
Mineral processing
The current processing plant treats free-milling material from open pit mining, by a conventional crush with a semi-autogenous
ball milling circuit and cyanide leach. Iduapriem operates a three-stage crushing circuit consisting of a Metso Superior MKIII
primary gyratory crusher, two GP550 gyratory crushers for secondary crushing and two CH660 Sandvik tertiary crushers. The
Iduapriem treatment plant has two semi-autogenous grinding mills (“SAG mills”) and two ball mills which run in two parallel
circuits, each with a SAG mill and a ball mill. The second ball mill, a new thickener, a cluster of cyclones and a Knelson
concentrator were commissioned in March 2009. In July 2017, three of the four leach tanks were converted into CIL tanks by
introducing carbon into the each of the tanks with the installation of inter-tank screens and carbon recovery screens. Carbon for
elution is harvested from one of the leach tanks to the acid wash column, and the carbon recovery screen underflow is pumped
back to the leach tanks.
GUINEA
SIGUIRI
Property description
Siguiri is AngloGold Ashanti’s only operation in the Republic of Guinea. The mine is co-owned by AngloGold Ashanti (85 percent)
and the government of Guinea (15 percent). The mine is a conventional open pit operation situated in the Siguiri district in the
northeast of Guinea.
Siguiri is a production stage property, operated by AngloGold Ashanti. Gold-bearing ore is mined from several pits (generally
three pits at any one time). Mining occurs primarily at Kami and Bidini pits in Block 1, as well as Saraya pit in Block 2, and a
satellite pit was reopened at Foulata in the fourth quarter of 2023 to account for a shortfall in production.
Location
Siguiri is located approximately 850km north-northeast of Conakry, 25km northwest of the town of Siguiri and 220km southeast
of the Malian capital Bamako, near the Malian border.
Mineralisation style
Siguiri is situated in the northern part of the Siguiri Basin of Guinea, and is underlain by Lower Proterozoic rocks of the Birimian
metasedimentary and volcano-sedimentary formations. Primary gold mineralisation occurs in all three lithostratigraphic units of
112
the Siguiri region, although most of the known mineralisation is found in the central and more competent Fatoya Formation. In
some deposits, the mineralisation shows strong lithological control and is preferentially developed in coarser-grained units with
higher fracture or vein densities than fine-grained rocks. Mineralised veins are more intensely developed along major structural
trends, with quartz-carbonate-sulphide veining developed along structures. Some of these structures have developed as
incipient faults and are represented by discrete stockworks of mineralised quartz-carbonate veins occurring along a trend instead
of clearly defined continuous structures.
Legal aspects and tenure
Refer to “Item 4B: Business Overview—The Regulatory Environment Enabling AngloGold Ashanti to Mine—Africa Region—
Guinea—AngloGold Ashanti’s rights and permits”.
Processing plants and other available facilities
Siguiri includes a processing plant, a TSF, and other infrastructure such as a mine village, a water supply system, roads, power
supply by on-site generators and communications systems. Additional infrastructure includes on-site offices, accommodation and
workshops to support remote mining. Power to the mine is self-generated using heavy fuel oil.
The town of Siguiri can be accessed via a small airfield and a well-paved road that connects Siguiri to Bamako in the north and
Kouroussa in the south. Access to the mine via roads and to Siguiri is easily passable through most of the year, although some
secondary roads are seasonal with limited access during the wet season. While Siguiri encounters encroachment of villages
onto, and artisanal and small-scale mining invasion in, its mining areas as well as increasing community demands and
expectations, mitigation plans are in place to significantly reduce the impact of these issues.
Mineral processing
The mined ore is processed using a hybrid CIL circuit plant and can treat 50 percent hard ore post-commissioning of a new ball
mill and three-stage crushing plant in 2019. Unit operations include comminution, leaching, carbon adsorption and desorption,
smelting and tailings disposal. Further modification of three leach tanks to CIL tanks was carried out in the fourth quarter of 2020,
giving a total of seven tanks in the hybrid circuit. The combination plant treats up to 50 percent fresh rock and 50 percent soft
ore, with a total throughput of 11.6Mtpa. The recovery of Bidini, which has been impacted by the presence of carbonaceous ore
and the performance of the combination plant to achieve the required mill throughput and recovery, could have an impact on the
economic extraction of the estimated Mineral Resource and Mineral Reserve until the plant stabilises. There are mitigation plans
in place to address any TSF capacity issues and the mine is also doing further optimisation work. A CIL tank failure was
experienced in the processing plant in May 2023, which led to a loss in production. All seven CIL tanks were assessed and
processing at the plant returned to full capacity at the beginning of November 2023.
TANZANIA
GEITA
The Company has determined that, as of 31 December 2023, Geita continues to be a material property for purposes of
Regulation S-K 1300. For additional information, refer to the Technical Report Summary for Geita (effective date: 31 December
2022) filed as Exhibit 19.15.5 hereto.
Property description
Geita (“GGM”), one of AngloGold Ashanti’s flagship mines, is located in northwestern Tanzania, in the Lake Victoria goldfields of
the Mwanza region, about 120km from Mwanza and 4km west of the town of Geita. The Geita gold deposits are mined as a
multiple open pit and underground operation, with ore production from Star and Comet, Nyankanga and Geita Hill underground
mines, and from Nyamulilima open pit. The mine is currently serviced by a CIL processing plant with an annual capacity of 5.2Mt.
GGM is wholly-owned and operated by AngloGold Ashanti. GGM currently has three underground mines (Star and Comet,
Nyankanga and Geita Hill) and one open pit (Nyamulilima Cuts 1, 2 and 3) which is in production since 2021. The property is
currently in a production stage.
Location
GGM is located approximately 1,200km from the main Tanzanian business centre of Dar es Salaam. It falls within the Lake Zone
of northwestern Tanzania, approximately 120km west of Mwanza and 4km west of the town of Geita. The mining lease area falls
within the Archaean Sukumaland Greenstone Belt of the Lake Victoria goldfields.
Mineralisation style
Geita is hosted in the Geita Greenstone Belt, which is a northern segment of the Sukumaland Greenstone Belt, located in the
north-western part of the Tanzania Craton and south of Lake Victoria. Gold mineralisation occurred late in the tectonic history of
the greenstone belt, synchronous with the development of brittle-ductile shear zones. Mineralisation is dominantly sulphide
replacement of magnetite-rich layers in ironstone, with local replacement of ferromagnesian phases and magnetite in the diorite
intrusions. Primary gold mineralisation is associated with the intersection of the brittle-ductile shear zones and pre-existing fold
hinges, with higher grade concentrations associated with banded iron formation lithologies and with diorite dyke and sill contacts.
113
History
Gold mineralisation is reported to be first discovered in the Geita district in 1898 by a German prospector. A regional survey by a
Kenyan company, Saragura Prospecting Syndicate, followed in 1930. The first mine was developed in 1934, and between 1936
and 1966, Geita was the largest gold mine in East Africa, producing 1Moz of gold from underground operations.
In 1996, Ashanti Goldfields Company Limited acquired the Geita tenure through the acquisition of Cluff Resources, and acquired
the Kukuluma and Matandani in 1998 from Samax Resources Limited. In December 2000, Ashanti Goldfields Company Limited
reached an agreement to sell a 50 percent interest in Geita to AngloGold Limited for $324 million. AngloGold Limited added its
neighbouring Nyamulilima Hill deposits into the JV company. In 2004, the merger of AngloGold Limited and Ashanti Goldfields
Company Limited resulted in the operation being wholly run by the combined company AngloGold Ashanti.
GGM commenced open pit mining in 1999, with open pit mining at Nyankanga between 1999 and 2020, at Geita Hill between
2001 and 2019, at Kukuluma and Matandani between 2002 and 2007, and at Star and Comet between 2007 and 2014. In 2015,
a decision was taken to go underground at Star and Comet, and the underground development started in 2016. In 2017, the
Nyankanga underground operation commenced. In late 2020, the Geita Hill underground operation commenced and reached full
production in mid-2023 in Geita Hill West. In April 2021, the Nyamulilima open pit commenced operations, with Cut 1 completed
in 2023 and Cut 2 advancing.
Legal aspects and tenure
Refer to “Item 4B: Business Overview—The Regulatory Environment Enabling AngloGold Ashanti to Mine—Africa Region—
Tanzania—AngloGold Ashanti’s rights and permits”.
Mining method
Mining at Geita uses both open pit and underground mining methods. The Nyamulilima open pit commenced production in April
2021 and reached full production during 2022. Open pit mining is by conventional truck and shovel methods, where production
mining equipment is operated by GGM with Capital Mining Services Tanzania Limited providing production and grade control
drilling services, and Orica providing blasting and explosives services. Underground mining commenced at Star and Comet in
2016 and subsequently at Nyankanga in 2017, and most recently Geita Hill in 2020. Star and Comet underground has
successfully transitioned to owner mining and the mining contractor African Underground Mining Services is used at Nyankanga
and Geita Hill for underground development and stoping. The underground mining method is a combination of LOS and TOS.
Cemented aggregate fill backfill is used at Nyankanga to fill the primary stopes and allows for the mining of secondary stopes.
Ore is hauled from the Nyamulilima open pit (22km) and from Star and Comet (17km), Nyankanga (4km) and Geita Hill (2km)
underground operations to the central run-of-mine (“ROM”) pad by the Geita surface mining fleet.
Processing plants and other available facilities
Surface infrastructure associated with the overall Geita operation includes a 5.2Mtpa CIL processing plant, a TSF, a camp, an
airstrip, service bays, fuel depots, open pit and underground workshops and offices, contractor yards, backfill plants and
explosives suppliers. Power to the mine is self-generated at Geita with a 40MW power plant using diesel generators, however,
there is planned construction of a 33kV hydropower station by Tanzania Electric Supply Company Limited (“TANESCO”). The
mine is permitted to extract water by pumping approximately 25,000m3 of raw water from Lake Victoria per day. In addition, there
is sustainable use of raw water through recycling of the process water. The physical condition of the equipment, facilities, and
infrastructure at GGM is generally considered to be in good working order. The mine has invested heavily in maintaining and
upgrading its assets to ensure they remain reliable and efficient. The underground development of the mine has also been
extensively developed, with the construction of a number of portals, declines and strategically placed development drives that
access and further explore the gold-bearing ore. Overall, the GGM is a well-established operation implementing fit-for-purpose
technologies once proven in the market. For the number of persons employed at the mine, refer to “Item 4B: Business Overview
—Operating Performance—Africa Region”.
The “Property, Plant, and Equipment” as of 31 December 2023, including lease assets, buildings and mine infrastructure, mining
assets, capitalised exploration costs, decommissioning assets, assets under construction and deferred stripping, had a carrying
value of $537 million.
Mineral processing
Geita’s ore processing method is a conventional CIL process with a throughput capacity of 5.2Mtpa. The circuit contains a
primary gyratory crusher, secondary and tertiary crushers, a SAG mill, a ball mill and 12 leach tanks. This is coupled with a
gravity circuit using two Knelson concentrators. In planning the plant feed blend material, hardness grade, oxide and sulphide
content are considered in order to optimise throughput and recovery.
Mineral Resource
The below table, prepared in accordance with Table 1 to Paragraph (d)(1) of Item 1304 of Regulation S-K, summarises the gold
Mineral Resource (exclusive of Mineral Reserve) for Geita at the end of the fiscal year ended 31 December 2023, based on a
gold price estimate of $1,750/oz, unless otherwise stated.
114
Mineral Resource | Category | Tonnes | Grade | Contained Gold | |
at 31 December 2023 | million | g/t | tonnes | Moz | |
Geita | Measured | 8.96 | 2.59 | 23.20 | 0.75 |
Indicated | 37.00 | 2.32 | 85.87 | 2.76 | |
Measured & Indicated | 45.95 | 2.37 | 109.07 | 3.51 | |
Inferred | 30.90 | 2.83 | 87.49 | 2.81 | |
Notes:
Rounding of numbers may result in computational discrepancies in the Mineral Resource tabulations. All figures are expressed on an attributable basis unless
otherwise indicated. The Mineral Resource estimates with respect to our material properties have been prepared by the Qualified Persons (employed by AngloGold
Ashanti unless stated otherwise). The net difference between the Mineral Resource at the end of the last completed fiscal year and the preceding fiscal year is
detailed in the table below. To reflect that figures are not precise calculations and that there is uncertainty in their estimation, AngloGold Ashanti reports tonnage,
grade and content for gold to two decimals. All ounces are Troy ounces. “Moz” refers to million ounces.
1.All disclosure of Mineral Resource is exclusive of Mineral Reserve. The Mineral Resource exclusive of Mineral Reserve is defined as the inclusive Mineral
Resource less the Mineral Reserve before dilution and other factors are applied.
2.“Tonnes” refers to a metric tonne which is equivalent to 1,000 kilograms.
3.The Mineral Resource tonnages and grades are reported in situ and stockpiled material is reported as broken material.
4.Property currently in a production stage.
5.Based on a gold price of $1,750/oz.
6.In 2023, a metallurgical recovery factor of 90.40% was applied to the open pit, a metallurgical recovery factor range from 91.07% to 91.63% (varying according to
area) was applied to the stockpile, and a metallurgical recovery factor range from 76.40% to 92.30% (varying according to area) was applied to the underground.
7.In 2023, a cut-off grade range from 0.60g/t to 1.40g/t (varying according to area) was applied to the open pit, and a cut-off grade range from 0.88g/t to 2.58g/
t (varying according to area) was applied to the underground.
Year-on-year changes in Mineral Resource - Moz
at 31 December 2023 | Geita | |||
Category | Measured | Indicated | Total Measured and Indicated | Inferred |
Previous Year | 0.24 | 2.63 | 2.88 | 3.08 |
Exploration and Methodology | 0.29 | (0.08) | 0.21 | (0.34) |
Economic Assumptions | 0.22 | 0.22 | 0.43 | 0.08 |
Other | — | (0.01) | (0.01) | — |
Acquisition / Disposal | — | — | — | — |
Current Year | 0.75 | 2.76 | 3.51 | 2.81 |
Net Difference | 0.51 | 0.13 | 0.63 | (0.26) |
% Difference | 210 | 5 | 22 | (9) |
Notes:
All figures are expressed on an attributable basis unless otherwise indicated.
The increase in Measured and Indicated Mineral Resource was mainly due to the addition relating to exploration as a result of
accelerated drilling activities at Geita Hill and Nyankanga underground as well as favourable cost reductions which led to a drop
in the cut-off grade. The decrease in the Inferred Mineral Resource was mainly due to Mineral Resource conversion and
methodology reductions, partially offset by favourable cost reductions which led to a drop in the cut-off grade.
Estimation
For the open pits, mineralisation boundaries for the individual deposits are defined from detailed logging of all geological drill
holes. This information is validated and then geological wireframes are interpreted to create a 3D geological model. The
geological model is subsequently used in conjunction with an appropriately dimensioned block model. Ordinary kriging is used to
interpolate values into block models, and uniform conditioning (“UC”) and localised uniform conditioning (“LUC”) methods are
used to generate a recoverable Mineral Resource block model, which estimates the proportion of ore that occurs above the
Mineral Resource cut-off grade assuming a specified selective mining unit (“SMU”). The open pit Mineral Resource is reported
within a $1,750/oz optimised pit shell and above the calculated mineralised waste cut-off grade per pit.
For the underground Mineral Resource, the geological model is generated in the same way as for the open pits. However, a
high-grade wireframe is delineated within the broader, lower-grade mineralised envelope. In this instance, all geological controls
are adhered to when determining this domain. Ordinary kriging models are then constructed within the low- and high-grade
domains, and numerous validation exercises are completed to ensure robust estimates are achieved. The underground Mineral
Resource is reported inside a MSO volume generated using a unique underground cut-off grade for each deposit.
The ultimate open pit designs are used as the limiting boundaries between the open pits and underground during model
compilation. The underground stopes and development are evaluated using the ordinary kriging block models and the open pit
designs are evaluated using the LUC block models.
Stockpiled material above mineralised waste cut-off grade is included in the Mineral Resource.
115
Mineral Reserve
The below table, prepared in accordance with Table 2 to Paragraph (d)(1) of Item 1304 of Regulation S-K, summarises the gold
Mineral Reserve for Geita at the end of the fiscal year ended 31 December 2023, based on a gold price estimate of $1,400/oz,
unless otherwise stated.
Mineral Reserve | Category | Tonnes | Grade | Contained Gold | |
at 31 December 2023 | million | g/t | tonnes | Moz | |
Geita | Proven | 14.27 | 1.01 | 14.45 | 0.46 |
Probable | 40.25 | 2.21 | 89.09 | 2.86 | |
Total | 54.52 | 1.90 | 103.53 | 3.33 | |
Notes:
Rounding of numbers may result in computational discrepancies in the Mineral Reserve tabulations. All figures are expressed on an attributable basis unless
otherwise indicated. The Mineral Reserve estimates with respect to our material properties have been prepared by the Qualified Persons (employed by AngloGold
Ashanti unless stated otherwise). The net difference between the Mineral Reserve at the end of the last completed fiscal year and the preceding fiscal year is detailed
in the table below. To reflect that figures are not precise calculations and that there is uncertainty in their estimation, AngloGold Ashanti reports tonnage, grade and
content for gold to two decimals. All ounces are Troy ounces. “Moz” refers to million ounces.
1.“Tonnes” refers to a metric tonne which is equivalent to 1,000 kilograms.
2.The Mineral Reserve tonnages and grades are estimated and reported as delivered to the plant (i.e., the point where material is delivered to the processing
facility).
3.Property currently in a production stage.
4.Based on a gold price of $1,400/oz.
5.In 2023, a metallurgical recovery factor of 90.40% was applied to the open pit, a metallurgical recovery factor range from 91.07% to 91.63% (varying
according to area) was applied to the stockpile, and a metallurgical recovery factor range from 76.40% to 92.30% (varying according to area) was applied to
the underground.
6.In 2023, a cut-off grade of 1.00g/t was applied to the open pit, a cut-off grade range from 0.70g/t to 0.80g/t (varying according to area) was applied to the
stockpile, and a cut-off grade range from 2.05g/t to 2.87g/t (varying according to area) was applied to the underground.
Year-on-year changes in Mineral Reserve - Moz
at 31 December 2023 | Geita | ||
Category | Proven | Probable | Total |
Previous Year | 0.31 | 3.25 | 3.57 |
Depletion | 0.08 | (0.64) | (0.56) |
Exploration and Methodology | — | (0.25) | (0.25) |
Economic Assumptions | 0.08 | 0.31 | 0.39 |
Other | (0.01) | 0.19 | 0.19 |
Acquisition / Disposal | — | — | — |
Current Year | 0.46 | 2.86 | 3.33 |
Net Difference | 0.15 | (0.39) | (0.24) |
% Difference | 49 | (12) | (7) |
Notes:
All figures are expressed on an attributable basis unless otherwise indicated.
The decrease in the Mineral Reserve was mainly due to depletion and revised Mineral Resource models in the open pit, partially
offset by additions due to exploration success at Nyankanga and Star and Comet, improvement in processing and rehandling
costs as well as contractor rates, together with open pit operational changes.
Estimation
The Mineral Resource models are used as the basis for Mineral Reserve estimation. Input parameters for estimating the Mineral
Reserve include gold price, mining dilution and recovery, geotechnical information, stay-in-business capital expenditure,
operating costs, metallurgical recovery, processing capacity and mining equipment capacities.
Appropriate Mineral Reserve cut-off grades are applied and optimised pit shells are generated for the open pit sources. Pit
designs are then done on selected shells and signed off by all relevant parties to ensure compliance to specifications.
Underground designs are completed and evaluated. These designs are incorporated into the production and treatment
scheduling stages to yield ore tonnes and grades. Financial evaluations are completed for production and treatment schedules to
check the cash flow analysis from the estimated Mineral Reserve.
The Mineral Reserve for Geita’s operating and prospective pits, as well as underground mine areas is estimated using updated
economic factors, latest Mineral Resource models, geological, geotechnical, mining engineering and metallurgical parameters.
Environmental, sociopolitical, legal and regulatory factors are also considered.
116
Map showing Geita planned infrastructure and licences
Below is a map that shows the location, infrastructure and mining license area for Geita. The coordinates of the mine, as
represented by the plant, are depicted on the map and are in the geographic coordinate system.
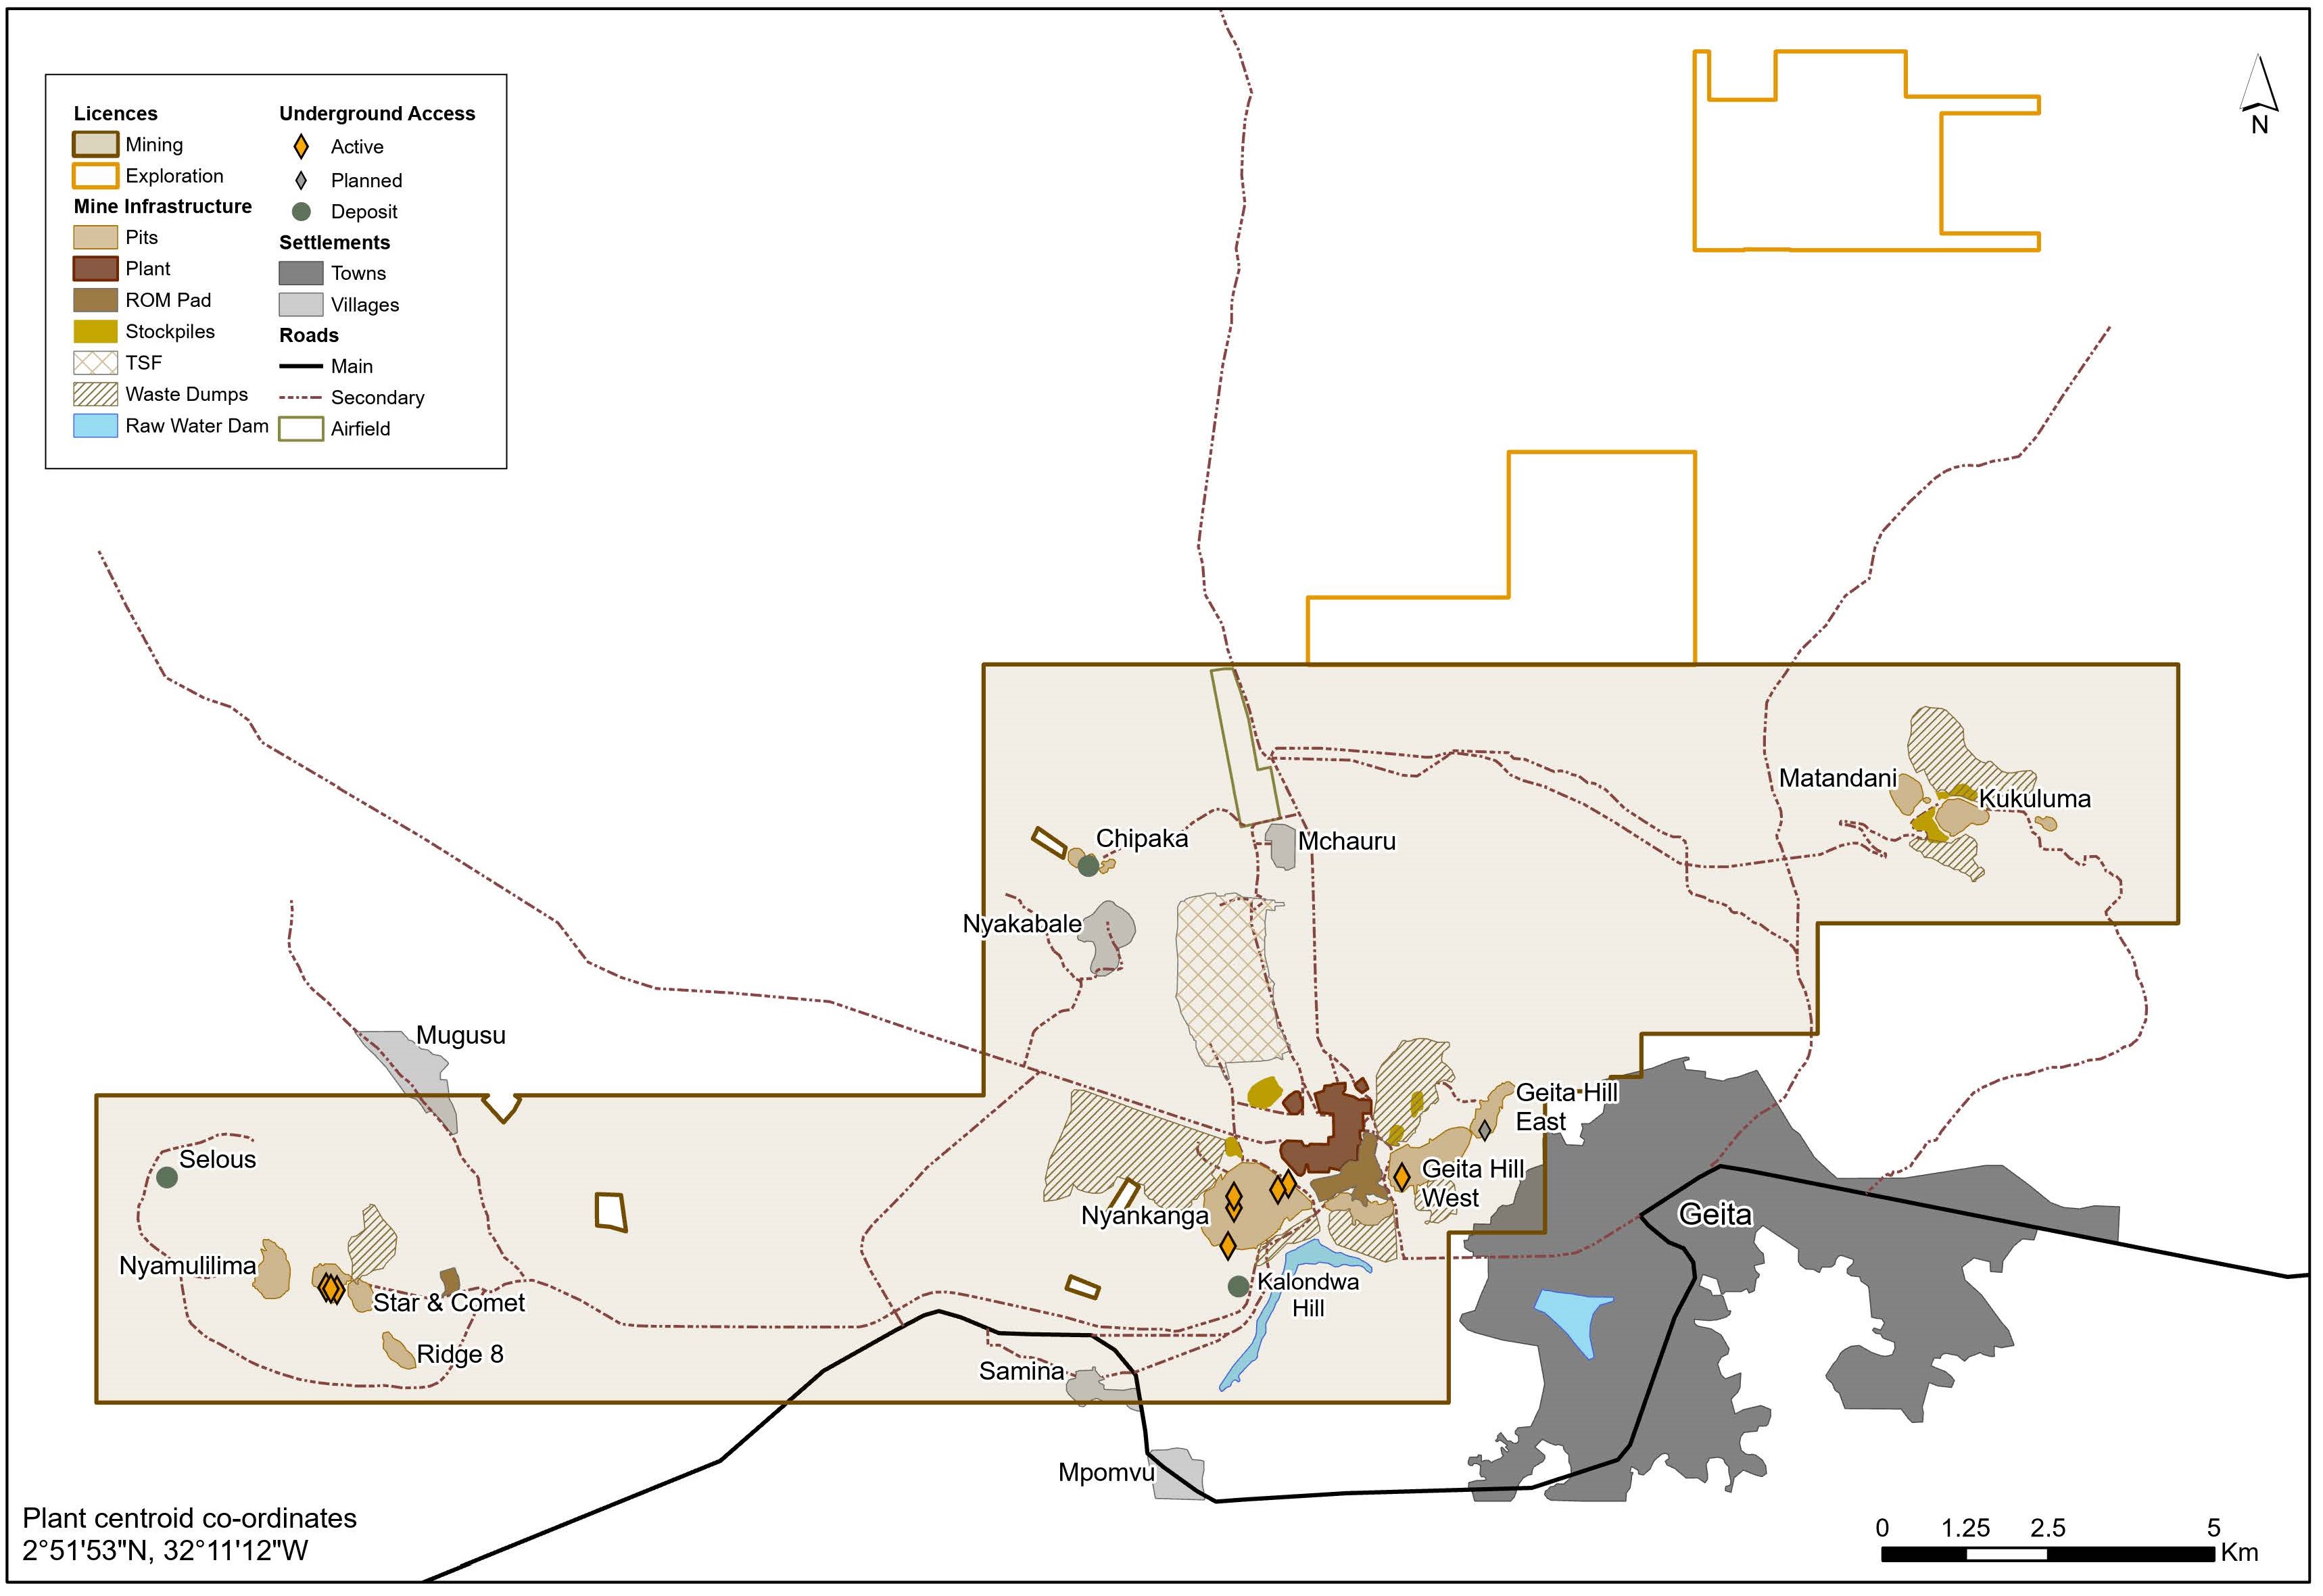
AMERICAS
The Americas region includes the mining jurisdictions Brazil and Argentina, in which AngloGold Ashanti has three operations. In
Argentina, the Company has one mining operation: the Cerro Vanguardia Mine, co-owned by AngloGold Ashanti (92.5 percent)
and Fomento Minero de Santa Cruz Sociedad del Estado (“Fomicruz SE”) (7.5 percent). In Brazil, the Company has two mining
operations: (i) the AngloGold Ashanti Córrego do Sítio Mineração operations (“AGA Mineração”) which include the Cuiabá,
Lamego and Córrego do Sítio (“CdS”) mines, and (ii) Mineração Serra Grande S.A. (“Serra Grande”).
ARGENTINA
CERRO VANGUARDIA
Property description
Cerro Vanguardia, a production stage gold-silver operation, is the Company’s sole operation in Argentina. The mine is operated
by Cerro Vanguardia S.A. (“CVSA”), which is a company formed by AngloGold Ashanti (92.5 percent) and Fomicruz SE, a state-
owned company operating in the province of Santa Cruz (7.5 percent). The climate is semi-arid and although snow does occur,
winter is mild and exploration activities are normally possible all year round. Cerro Vanguardia operates multiple small open pits
with high stripping ratios and multiple narrow-vein underground mines located within the property and mined simultaneously.
Cerro Vanguardia has been in operation for more than 20 years. Silver is produced as a by-product.
Location
Cerro Vanguardia is located in the Santa Cruz province, southern Patagonia, Argentina, approximately 110km north-northwest of
the coastal town of Puerto San Julián. Access to the area is by aircraft from Buenos Aires to Comodoro Rivadavia (380km) or Rio
Gallegos (510km) and then by road to the mine site.
Mineralisation style
Cerro Vanguardia is in the core of the 60,000km2 Deseado Massif, one of the most extensive volcanic complexes in southern
Patagonia. The Deseado Massif is deposited over Paleozoic low-grade metamorphic basement rocks. The mineralisation is
concentrated in steeply-dipping quartz veins that cut the flat-lying ignimbrites and volcanoclastic rocks. The Cerro Vanguardia
district contains more than 100 gold and silver-bearing epithermal veins for a cumulative exposed vein strike extension of more
than 240km, of which 55 veins are currently known to contain economic gold and silver mineralisation. The veins at Cerro
117
Vanguardia consist mainly of quartz and adularia and contain minor electrum, native gold, silver sulphides and native silver as
fine-grained disseminations.
Legal aspects and tenure
Refer to “Item 4B: Business Overview—The Regulatory Environment Enabling AngloGold Ashanti to Mine—Americas—
Argentina—AngloGold Ashanti’s rights and permits”.
Processing plants and other available facilities
Infrastructure for Cerro Vanguardia is mostly located on-site. It includes a camp site with a capacity of 1,300 people, a Merrill
Crowe plant, heap leaching facilities, cyanide recycling plant, mine laboratory, maintenance facilities, warehouses and sewage
processing plant. Four natural gas power generators, fed by a 40km long pipeline, provide electricity to the operation. Natural
gas is also used for heating. Mine office facilities are located in the main mining area.
Dewatering supplies water for use both as processing water and camp consumption. Due to the particular features of the mine,
and in order to optimise hauling, all pits have local, single or multiple waste dumps. The TSF is located in and is contained by a
natural depression.
Mineral processing
The metallurgical plant has a daily capacity estimated at 3,500tpd (1.2Mtpa), with gold and silver grade of around 4.0g/t and
110g/t, respectively. The plant comprises the following stages: crushing, milling, conventional leaching in tanks, counter current
decant system in thickeners (“CCD circuit”), a CIL process, acid wash, elution, conventional Merrill Crowe process to recover
gold and silver with metallic zinc, and a cyanide recovery plant (“Cyanisorb”). The tailings go directly to a conventional TSF, with
a reclaim water system for the plant.
In addition to the processing plant there is a heap leach pad, with an annual capacity of 1.75Mtpa, and gold and silver grades of
around 0.6g/t and 20g/t, respectively. The pregnant solution from this process goes directly to the CCD circuit in the process
plant and to the Merrill Crowe process for gold and silver recovery.
BRAZIL
AngloGold Ashanti’s operations in Brazil comprise AGA Mineração in the Quadrilátero Ferrífero (Iron Quadrangle), Minas Gerais
state and Serra Grande in the Goiás state. AGA Mineração consists of several operations, namely Cuiabá, Lamego, and CdS.
Ore from the Cuiabá and Lamego underground mines is processed at the Cuiabá gold plant. The concentrate produced is
transported by aerial ropeway to the Queiroz plant for processing and refining. The Queiroz hydrometallurgical plant also
produces sulphuric acid as a by-product. Tailings deposition at the Calcinados TSF, as well as processing of gold concentrate at
the Queiroz plant, which services the Cuiabá mine complex (composed of the Cuiabá and Lamego mines), is currently
suspended. Refer to “Item 4B: Business Overview—The Regulatory Environment Enabling AngloGold Ashanti to Mine—
Americas—Brazil—Environmental laws relating to mining”.
CdS consists of open pit and underground mines. The oxide ore mined is treated by heap leach and a pressure leaching plant
treats sulphide ore. The distance from the main underground mine to the metallurgical plant is around 15km. The property was
placed on care and maintenance in August 2023.
Serra Grande comprises three mechanised underground mines, Mina III, Mina Nova and Mina Palmeiras, and an open pit as
well as a dedicated metallurgical plant.
AGA MINERAÇÃO
AGA Mineração encompasses mining operations at Cuiabá, Lamego and CdS. The AGA Mineração mining complex is located in
southeastern Brazil in the state of Minas Gerais. Operations are 30km from the capital of the state (Belo Horizonte) in the case of
Cuiabá and Lamego, and approximately 100km in the case of CdS.
AGA MINERAÇÃO - CÓRREGO DO SÍTIO
Property description
CdS is wholly-owned by AngloGold Ashanti. It began operations in 1989 and consists of multiple open pit (conventional bench
mining) and underground mines (mainly using sub-level stoping). The property was placed on care and maintenance in August
2023.
Location
The CdS complex is located in the municipalities of Santa Bárbara and Barão de Cocais, that are located 100km east of the city
of Belo Horizonte in the state of Minas Gerais, in the southeast of Brazil. These operations are included in an important mining
district referred to as the Iron Quadrangle, the second biggest Brazilian area for the production of iron, gold and manganese.
Mineralisation style
The CdS gold deposit is located in the eastern part of the lower to middle greenschist facies of the Rio das Velhas Archaean, in
the Iron Quadrangle region, on the southern margin of the São Francisco Craton in Brazil. CdS is an orogenic gold deposit
118
hosted in intensely deformed clastic, volcanoclastic, carbonaceous schists and metagreywackes in an approximately 30km
northeast-southwest striking shear zone. Hydrothermal alteration phases associated with the mineralisation are dominated by
sericite and carbonate.
The CdS I, II and III, gold deposits and associated targets are located in a gold trend that extends for approximately 14km in a
north-easterly direction, from Grota Funda (CdS I) in the south to Anomalia (CdS III) in the north, which developed in a
compressional tectonic regime. Gold is associated with quartz and fine grained acicular arsenopyrite. The main gold targets and
deposits are distributed over three trends, namely the CdS Trend and the Cristina Trend hosted in metasedimentary rocks, and
the Donana Trend hosted in BIF.
Legal aspects and tenure
Refer to “Item 4B: Business Overview—The Regulatory Environment Enabling AngloGold Ashanti to Mine—Americas—Brazil—
AngloGold Ashanti’s rights and permits”.
Processing plants and other available facilities
CdS infrastructure consists of the sulphide plant at CdS II (used to process refractory sulphide material), and the heap leach
plant at CdS I (for oxide ore mined by open pit). The site also has a TSF for the sulphide plant, a neutralised tailings deposit for
the oxide material and numerous waste dumps for the open pit mines at CdS I. For further information on the regulatory
framework governing TSFs in Brazil, see “Item 4B: Business Overview—The Regulatory Environment Enabling AngloGold
Ashanti to Mine—Americas—Brazil”.
Ancillary facilities comprise a water treatment facility, effluent treatment facilities, equipment workshops, laboratory, warehouses,
explosives and accessories magazines, fuel stations, electric substations as well as offices, medical clinic, mess rooms, dressing
rooms, bathrooms, storerooms, garage, fuel stations, a centre of environmental studies, nursery and other facilities required to
operate the mine.
Water is primarily sourced from recycling the underground mine water and supplementary water catchment wells. The power for
the operations is supplied and purchased on the open market. Good communication infrastructure is available in the area.
Mineral processing
There are two metallurgical plants at CdS: the heap leach plant for oxide ore and the sulphide plant. The sulphide process
consists of crushing, grinding and gravity concentration, flotation, thickening, pressure oxidation (POX autoclave), CIL extraction,
elution, neutralisation, electrowinning and dry stack tailings. The sulphide plant and POX circuit have a capacity of 900ktpa. The
heap leaching process consists of crushing, agglomeration, stacking, leaching, adsorption, elution and electrowinning, with
capacity of 860ktpa.
AGA MINERAÇÃO - CUIABÁ
Property description
Cuiabá is an underground operation (mainly using sub-level long hole open stoping) that is wholly-owned by AngloGold Ashanti,
within one of the most important metallogenetic provinces in Brazil, known as the Iron Quadrangle. This region is an important
producer of iron ore, manganese and gold in Brazil. The property is currently in a production stage and operated by AGA
Mineração.
Location
Cuiabá is located 30km to the east of Belo Horizonte in the state of Minas Gerais, in the southeast of Brazil.
Mineralisation style
The Cuiabá mine is located in the Iron Quadrangle, which is a geotectonic unit on the southern edge of the São Francisco
Craton, comprising Archaean and Proterozoic terrains, and bordered by Neoproterozoic mobile belts. From a regional viewpoint,
the Cuiabá mine is located in the eastern extension of the Serra do Curral inverted homocline, located on the northeastern edge
of the Iron Quadrangle. The mine lithostratigraphy consists of an intermediate metavolcanic sedimentary sequence of the
greenstone belt type and is hosted in the Nova Lima Group at the bottom of the Rio das Velhas Supergroup.
Gold mineralisation is associated with sulphides and quartz veins in BIF and volcanic sequences. Structural control and fluid flow
are the most important factors for gold mineralisation with a common association between large-scale shear zones and their
associated structures. Where BIF is mineralised, the ore appears strongly stratiform due to the selective sulphidation of the iron-
rich layers. Steeply plunging shear zones tend to control the ore shoots, which commonly plunge parallel to intersections
between the shears and other structures. Mineralisation is hosted in the limbs of a fold system.
Legal aspects and tenure
Refer to “Item 4B: Business Overview—The Regulatory Environment Enabling AngloGold Ashanti to Mine—Americas—Brazil—
AngloGold Ashanti’s rights and permits”.
119
Processing plants and other available facilities
The metallurgical plants (Cuiabá gold plant and Queiroz plant) are connected by an aerial ropeway. Power to the Cuiabá mine
and the Cuiabá gold plant is provided by a 230kV transmission line from the grid. Power to the Queiroz plant is supplied by
Cemig, a state-owned company, as well as by a set of small hydropower plants (Rio de Peixe hydroelectric complex). The Rio de
Peixe hydroelectric complex, which is directly connected to the Queiroz plant, consists of a set of seven small hydropower plants
that generate energy from three dams (Ingleses, Miguelo and Codorna) and is currently on care and maintenance. The Cuiabá
mine has a shaft system (846m deep) for production and personnel transport, the current nominal airflow capacity for which is
1,035m3/s, of which 320m3/s are refrigerated. Tailings deposition is at one of four sites located at Cuiabá, Calcinados, Rapaunha
and Cocuruto. Refer to “Item 4B: Business Overview—The Regulatory Environment Enabling AngloGold Ashanti to Mine—
Americas—Brazil” for further information on, and current operating status of, the Company’s TSFs in Brazil.
Mineral processing
Cuiabá and Lamego mines feed the Cuiabá gold (crushing, milling and flotation) and Queiroz (roaster, carbon circuit and
refinery) plants. At the Cuiabá gold plant, ore is crushed and milled followed by flotation and filtration to produce a concentrate
(32 percent sulphur), which is transported by an aerial ropeway to Queiroz for further treatment. Approximately 30 percent of gold
is recovered through a gravity circuit at the Cuiabá gold plant. The concentrate, transported by aerial ropeway, is received at the
Queiroz plant which is located in Nova Lima and comprises the refractory ore circuit (from Cuiabá or Lamego) with facilities for
pyrometallurgy and hydrometallurgy. The concentrate is roasted and the calcine proceeds to a carbon-in-pulp (“CIP”) with Merrill
Crowe circuits for further refining. The sulphide gas is captured for processing at the acid plant. Sulphuric acid is produced as a
by-product. However, as a result of the temporary suspension of operations at the Queiroz plant due to restrictions on tailings
disposal in the associated TSFs (other than Cuiabá), the gold concentrate produced at the Cuiabá gold plant is being sold to
third parties. Refer to “Item 4B: Business Overview—The Regulatory Environment Enabling AngloGold Ashanti to Mine—
Americas—Brazil” for further information on, and current operating status of, the Company’s TSFs in Brazil.
AGA MINERAÇÃO - LAMEGO
Property description
Lamego is an underground operation (mainly using sub-level long hole open stoping) that is wholly-owned by AngloGold Ashanti,
within one of the most important metallogenetic provinces in Brazil, known as the Iron Quadrangle. This region is an important
producer of iron ore, manganese and gold in Brazil. The property is currently in a production stage and operated by AGA
Mineração.
Location
Lamego is located 30km to the east of Belo Horizonte in the state of Minas Gerais, in the southeast of Brazil.
Mineralisation style
The Lamego mine is located in the Iron Quadrangle, which is a geotectonic unit on the southern edge of the São Francisco
Craton, comprising Archaean and Proterozoic terrains, and bordered by Neoproterozoic mobile belts. From a regional viewpoint,
the Lamego mine is located in the eastern extension of the Serra do Curral inverted homocline, located on the northern edge of
the Iron Quadrangle.
Gold mineralisation is characterised by orebodies associated with two horizons of chemical sedimentary rocks: BIF and
metachert, with shear zones containing abundant quartz veinlets. The proportions of these lithotypes vary substantially from one
deposit to another. In the BIF, sulphide mineralisation is associated with gold, while in the metachert it is associated with quartz
veins. The gold occurs either as native gold or in sulphides. Lamego has a similar rock assemblage to Cuiabá, but with higher
structural complexity. The mineralised BIF is more structurally deformed and contains more silica when compared to Cuiabá,
which reacted less with the hydrothermal fluid.
Legal aspects and tenure
Refer to “Item 4B: Business Overview—The Regulatory Environment Enabling AngloGold Ashanti to Mine—Americas—Brazil—
AngloGold Ashanti’s rights and permits”.
Processing plants and other available facilities
Lamego operates as a satellite mine to the Cuiabá mine. Ore is transported to surface via ramps where it is crushed, stockpiled
and transported daily to the Cuiabá gold plant, where it is blended with Cuiabá ore on the ROM pad.
The metallurgical plants (Cuiabá gold plant and Queiroz plant) are connected by an aerial ropeway. Power to the Lamego mine is
provided by two 13.8kV powerlines from Cemig, a state-owned company. Power to the Queiroz plant is supplied by Cemig as
well as by a set of small hydropower plants (Rio de Peixe hydroelectric complex). The Rio de Peixe hydroelectric complex, which
is directly connected to the Queiroz plant, consists of a set of seven small hydropower plants that generate energy from three
dams (Ingleses, Miguelo and Codorna) and is currently on care and maintenance. Tailings deposition is at one of four sites
located at Cuiabá, Calcinados, Rapaunha and Cocuruto. Refer to “Item 4B: Business Overview—The Regulatory Environment
Enabling AngloGold Ashanti to Mine—Americas—Brazil” for further information on, and current operating status of, the
Company’s TSFs in Brazil.
Lamego has a natural water supply system and a plant for water and sewage treatment.
120
Mineral processing
Cuiabá and Lamego mines feed the Cuiabá gold (crushing, milling and flotation) and Queiroz (roaster, carbon circuit and
refinery) plants. At the Cuiabá gold plant, ore is crushed and milled followed by flotation and filtration to produce a concentrate
(32 percent sulphur), which is transported by an aerial ropeway to Queiroz for further treatment. Approximately 30 percent of gold
is recovered through a gravity circuit at the Cuiabá gold plant. The concentrate, transported by aerial ropeway, is received at the
Queiroz plant which is located in Nova Lima and comprises the refractory ore circuit (from Cuiabá or Lamego) with facilities for
pyrometallurgy and hydrometallurgy. The concentrate is roasted and the calcine proceeds to a CIP with Merrill Crowe circuits for
further refining. The sulphide gas is captured for processing at the acid plant. Sulphuric acid is produced as a by-product.
However, as a result of the temporary suspension of operations at the Queiroz plant due to restrictions on tailings disposal in the
associated TSFs (other than Cuiabá), the gold concentrate produced at the Cuiabá gold plant is being sold to third parties. Refer
to “Item 4B: Business Overview—The Regulatory Environment Enabling AngloGold Ashanti to Mine—Americas—Brazil” for
further information on, and current operating status of, the Company’s TSFs in Brazil.
SERRA GRANDE
Property description
Mineração Serra Grande S.A. (“MSG” or “Serra Grande”) is wholly-owned and operated by AngloGold Ashanti and is located in
the northwest of the state of Goiás, in central Brazil. It operates three underground mines (using sub-level stoping (bottom-up
and top-down), cut-and-fill and room-and-pillar mining methods) and one open pit mine. The property is currently in a production
stage.
Location
Serra Grande is located 5km south of the town of Crixás, 420km from the Brazilian capital, Brasília and approximately 350km
from the state capital of Goiás, Goiánia. The employment of approximately 1,000 people in this largely rural area makes mining
the principal economic activity in the region.
Mineralisation style
The Serra Grande gold deposit is an orogenic mesothermal deposit, associated with the development of shear zones that belong
to the Upper Archaean Crixás Group. Gold mineralisation is associated with metasediments and metavolcanics from the Ribeirão
das Antas and Rio Vermelho Formations respectively. The Crixás Greenstone Belt is surrounded by granitic gneiss terrains from
the Ribeirão das Antas and Caiamar complexes and metasedimentary rocks from the Santa Terezinha Group, which is part of
the Goiás magmatic arc. Mineralisation at Serra Grande is associated with quartz veins and massive to disseminated sulphides
in metasedimentary, metavolcanoclastic and metabasalt rocks, with variable degrees of hydrothermal alteration developed over
orogenic stacked thrust layers (duplexes).
Legal aspects and tenure
Refer to “Item 4B: Business Overview—The Regulatory Environment Enabling AngloGold Ashanti to Mine—Americas—Brazil—
AngloGold Ashanti’s rights and permits”.
Processing plants and other available facilities
Serra Grande operates a single TSF, to support the LOM production. The water used in metallurgical processing comes from the
underground mines. The state road GO-337 passes close to the operation providing access for logistics. The power for the mine
is supplied by a 69kV power line by Equatorial Energia S.A., a private Goias-state energy company. Refer to “Item 4B: Business
Overview—The Regulatory Environment Enabling AngloGold Ashanti to Mine—Americas—Brazil” for further information on, and
current operating status of, the Company’s TSFs in Brazil, including the Serra Grande tailings dam.
Mineral processing
The metallurgical plant has the capacity to process 1.5Mtpa, combining CIL and gravimetric circuits. The ore is blended to feed
the crushing circuit, which has a capacity of 4,100tpd. There are two mills in operation, and 20 leach tanks with a capacity of
4,800m3 divided between pre-liming and cyanidation stages. Approximately 45 percent of gold is captured in the parallel gravity
circuit. The tailings are filtered and stacked in piles. The rest of the gold is recovered by the CIL process to form the doré that is
sent to Nova Lima for refining. The total gold recovery is approximately 93 percent.
AUSTRALIA
AngloGold Ashanti operates two mines and has one project in Western Australia.
Sunrise Dam, wholly-owned by AngloGold Ashanti, is located 205km north-northeast of Kalgoorlie and 55km south of Laverton.
Tropicana is a joint operation between AngloGold Ashanti (70 percent and the operator), and AFB Resources Pty Limited (30
percent), a subsidiary of Regis Resources Limited. Tropicana is located 200km east of Laverton and 330km east-northeast of
Kalgoorlie in Western Australia.
121
The Butcher Well project is a joint venture between AngloGold Ashanti (70 percent) and Northern Star Resources Limited
(“Northern Star Resources”) (30 percent). The project is managed by AngloGold Ashanti. Butcher Well is located 20km
southwest of the Sunrise Dam mine and is considered to be a potential satellite operation.
SUNRISE DAM
Property description
Sunrise Dam is a production stage property with an active underground and open pit mine that is wholly-owned and operated by
AngloGold Ashanti. AngloGold Ashanti conducts brownfield exploration activities on the site.
Location
Sunrise Dam is approximately 205km north-northeast of Kalgoorlie and 55km south of Laverton in Western Australia.
Mineralisation style
Sunrise Dam is a mesothermal gold deposit located in the Archaean greenstone belts of Western Australia. The deposit is
complex and structurally controlled with multiple ore zones displaying differing characteristics, from ductile shear zones to brittle
stockwork complexes to intrusive hosted mineralisation. Mineralisation is typically hosted within quartz-carbonate veins with
varying quantities of pyrite and arsenopyrite. Strong alteration of the country host rock is common proximal to controlling
structures.
Legal aspects and tenure
Refer to “Item 4B: Business Overview—The Regulatory Environment Enabling AngloGold Ashanti to Mine—Australia—
AngloGold Ashanti’s rights and permits”.
Processing plants and other available facilities
All required infrastructure is in place including a fully functional camp, process plant, tailings facility, gas pipeline, power plant and
electrical reticulation, offices, airstrip and road system. The underground infrastructure caters for all ventilation and dewatering
needs with provisions made in the budget for extensions and upgrades.
Mineral processing
Processing at Sunrise Dam is via a conventional three-stage crushing / two-stage milling, CIL circuit, with a pyrite flotation and
ultrafine grinding circuit commissioned in 2018. The gravity circuit recovers approximately 30 percent of the gold, with the CIL
circuit, AcaciaTM reactor and Anglo American Research Laboratories (“AARL”) elution used to recover the remainder.
Electrowinning recovers gold from the Acacia reactor and is eluted to produce gold doré. Plant throughput at Sunrise Dam is
approximately 4.1Mtpa.
BUTCHER WELL
Property description
Butcher Well is a joint venture between AngloGold Ashanti (70 percent) and Northern Star Resources (30 percent). Butcher Well
encompasses two tenement packages, Butcher Well and Lake Carey, covering approximately 339.56km2. AngloGold Ashanti
also holds a significant tenement package adjacent to the Northern Star joint venture properties.
The project is in the exploration stage in the early stages of study, with no Mineral Reserve declared. An Inferred Mineral
Resource is stated, which has been the focus of a conceptual study. As the project is still in a concept study phase, no mining
has taken place. Both open pit and underground mining options (using conventional open cut, drill and blast and transverse
longhole open stoping, respectively) are being explored.
Location
The Butcher Well project is located in the Laverton district of Western Australia, 20km southwest of AngloGold Ashanti’s Sunrise
Dam mine and 180km northeast of Kalgoorlie. Butcher Well is considered as a potential satellite operation to Sunrise Dam.
The Sunrise Dam airstrip is approximately 70km by road from the project, with a travel time of approximately 90 minutes on the
road on the circumference of the southern part of Lake Carey. Lake Carey is a large salt lake that covers a part of the western
project area, with Sunrise Dam located to the east of the lake and the Butcher Well project located on the western shore.
Mineralisation style
The Butcher Well Mineral Resource is an orogenic-style gold system hosted within the Laverton Greenstone Belt. The
mineralisation is hosted within a basalt and is spatially associated with syenite dykes. Gold mineralisation within fresh rock
principally occurs within steeply dipping north-south trending panels. Supergene gold dispersion and enrichment broadens the
mineralised envelope within the near-surface saprolitic material. Much of this material has been previously exploited in shallow
open pits.
Legal aspects and tenure
Refer to “Item 4B: Business Overview—The Regulatory Environment Enabling AngloGold Ashanti to Mine—Australia—
AngloGold Ashanti’s rights and permits”.
122
Processing plants and other available facilities
Power is likely to be generated on-site via diesel generators. Water can be sourced from the existing flooded pits or bores. Ore
material will be trucked to Sunrise Dam via existing secondary roads.
Mineral processing
Ore from Butcher Well will be processed at AngloGold Ashanti’s Sunrise Dam processing plant. Processing at Sunrise Dam is via
a conventional three-stage crushing, two-stage milling CIL circuit, with a pyrite flotation and ultrafine grinding circuit
commissioned in 2018. The gravity circuit recovers approximately 30 percent of the gold, with the CIL circuit and AARL elution
used to recover the remainder. Electrowinning recovers gold from the Acacia reactor and eluate to produce gold doré. Plant
throughput at Sunrise Dam is 4.1Mtpa, and Butcher Well ore will supplement ore production from the Sunrise Dam underground
mine to maintain the mill throughput.
TROPICANA
Property description
Tropicana mine is a production stage property. Several open pits have been developed along the strike extent of the ore body,
named from north to south: Boston Shaker, Tropicana, Havana and Havana South. Underground mines are also in operation
beneath the Boston Shaker and Tropicana open pits with a Mineral Reserve declared for the Havana underground. The project is
a joint operation between AngloGold Ashanti (70 percent), as operator, and AFB Resources (Pty) Limited, a subsidiary of Regis
Resources Limited (30 percent).
Location
Tropicana is located 330km northeast of Kalgoorlie and 200km east of Laverton, Western Australia.
Mineralisation style
The Tropicana deposit is hosted in an Archaen quartz-feldspathic gneiss within a major tectonic suture zone between the Yilgarn
Craton and the Albany-Fraser Orogen. Mineralisation is associated with a strong hydrothermal alteration assemblage of biotite-
sericite-pyrite, which post-dates peak graulite facies metamorphism. Gold is found within the pyrite.
Legal aspects and tenure
Refer to “Item 4B: Business Overview—The Regulatory Environment Enabling AngloGold Ashanti to Mine—Australia—
AngloGold Ashanti’s rights and permits”.
Processing plants and other available facilities
All surface infrastructure facilities are in place and operational. The underground infrastructure caters for all ventilation and
dewatering needs with provisions made in the budget for extensions and upgrades. The processing plant and TSF are operating
well, consistent with design specifications. The infrastructure includes, but is not limited to water supply, processing plant, mine,
dewatering infrastructure, TSF, workshops, camp facilities and airstrips. Power is supplied to the mine by on-site gas and diesel
power stations, and natural gas is supplied via an APA Operations (Pty) Limited pipeline. In June 2023, the Company entered
into an agreement with an independent power producer to construct, operate and integrate 62MW of clean energy into its
existing 54MW gas fired power system. The implementation of this renewable energy project is currently in progress. In addition,
underground development and production is ongoing.
Mineral processing
The processing plant has a capacity of 9.4Mtpa. The crushing circuit consists of a primary gyratory crusher, feeding a set of
secondary cone crushers and tertiary rolls crushers. A 14MW and 6MW ball mill in parallel completes the grinding circuit. A CIL
circuit is used to extract the gold from the ore, and a standard AARL elution and recovery systems is used to form gold doré bars.
The power provider, Kalgoorlie Power Systems, has built a dedicated power station consisting of a combination of diesel and gas
powered generators with a capacity of 48.5MW.
PROJECTS
The projects in Colombia form a significant contribution to AngloGold Ashanti’s Mineral Resource and comprise two projects: La
Colosa and Minera de Cobre Quebradona (“Quebradona”). Mineral Reserve was declared for the first time at Quebradona in
2018. AngloGold Ashanti completed the sale of its entire 50 percent indirect interest in the Gramalote project to B2Gold Corp. in
September 2023.
The projects in Nevada in the United States include North Bullfrog, Expanded Silicon, Mother Lode and Sterling (which includes
the Crown Block deposits of SNA, Secret Pass and Daisy). As of 31 December 2023, Mineral Reserve was declared for the first
time at North Bullfrog and an Inferred Mineral Resource was declared for the first time at the Merlin deposit in the Expanded
Silicon project.
COLOMBIA
AngloGold Ashanti Colombia has two greenfields projects: La Colosa and Quebradona.
123
The La Colosa project is wholly-owned and managed by AngloGold Ashanti. It is located in the Department of Tolima, 150km
west of Bogotá, and 30km west of the major town of Ibagué.
The Quebradona project is wholly-owned and managed by AngloGold Ashanti and comprises the Nuevo Chaquiro deposit, a
significant copper-gold porphyry. The Quebradona project is situated in the Middle Cauca region of Colombia, in the Department
of Antioquia, 90km southwest of Medellín.
LA COLOSA
Property description
La Colosa is wholly-owned and managed by AngloGold Ashanti. La Colosa is an exploration stage project with no Mineral
Reserve declared. However, open pit mining (with potentially some underground mining) is the preferred mining method.
The La Colosa project is currently at an early project stage and a number of possible technical options have been identified, all of
which are capital intensive. It is currently in force majeure due to delays in granting environmental permits by national and local
environmental authorities and, as a result, the project remains on hold. The most recent one year grant of force majeure, during
which time the specified timelines for completing the various phases of the mining project under the concession contract are
suspended, will expire on 22 June 2024.
Location
The project is located 150km west of Bogotá, and 30km west of the major town of Ibagué, which is the capital of the Tolima
Department. Ibagué is the location of local government entities monitoring the project.
Mineralisation style
La Colosa is a large porphyry gold deposit located on the eastern flank of the Central Cordillera of Colombia. Mineralisation is
exposed on the surface. The La Colosa site contains an intrusive complex with two magmatic centers known as the La Colosa
and San Antonio porphyry stocks, hosted by schistose country rocks. The complex is present over a map area of 3.5km2 and
includes a series of porphyry intrusions with compositions ranging from diorite to tonalite. The predominant type of hydrothermal
alteration in the early porphyries is moderately intense potassic alteration. Pyrite is the most abundant sulphide, followed by
pyrrhotite, which is commonly found close to the contacts with the country rocks. Gold mineralisation at La Colosa occurs
predominantly as native gold and electrum. Sub-microscopic gold has been observed in sulphides (pyrite, due to its abundance)
and iron oxide (magnetite-hematite).
Legal aspects and tenure
Refer to “Item 4B: Business Overview—The Regulatory Environment Enabling AngloGold Ashanti to Mine—Americas—
Colombia—AngloGold Ashanti’s rights and permits”.
Processing plants and other available facilities
Currently, the project has field infrastructure that supports access to the Mineral Resource with roads, accommodation, and office
and surface infrastructure for pre-logging and organisation of the drilling core. There is a core shed facility in the city of Ibagué
where geological and geotechnical logging was performed in the past.
Mineral processing
The project is currently at an early stage. However, flotation of sulphide ore is being considered as a treatment option.
QUEBRADONA
Property description
The Quebradona project is wholly-owned and managed by AngloGold Ashanti and comprises the Nuevo Chaquiro deposit, a
significant copper-gold porphyry. The project was previously a joint venture between AngloGold Ashanti and B2Gold. It
completed a conceptual study in 2016 as well as a pre-feasibility study in 2018, which supported first-time reporting of a Mineral
Reserve. Quebradona will be a copper mine with gold and silver as by-products and is at a development stage. The preferred
mining method is sub-level caving to extract the mineral deposit from underground.
When B2Gold’s participation dropped below five percent during 2019, AngloGold Ashanti became the 100 percent owner and
manager of the project. B2Gold will be entitled to a royalty equal to two percent of the net profit generated from the sale of any
mineral product by the project.
Location
The Quebradona project is situated in the Middle Cauca region of Colombia, in the Department of Antioquia, 90km southwest
(104km commute via the national highway) of Medellín, the capital of the Antioquia Department.
Mineralisation style
Five main targets have been identified in the exploration work, namely Nuevo Chaquiro, Aurora, Tenedor, Isabela, and La Sola.
Nuevo Chaquiro is the most advanced and the sole mineral deposit considered in the feasibility study and licensing process.
Nuevo Chaquiro, a significant copper-gold porphyry-style mineralised system, is one of three known porphyry centres on the
124
property and has been the focus of exploration activities since the beginning of 2011 with more than 75km of drilling.
Quebradona will be a copper mine with gold and silver as by-products.
Legal aspects and tenure
Refer to “Item 4B: Business Overview—The Regulatory Environment Enabling AngloGold Ashanti to Mine—Americas—
Colombia—AngloGold Ashanti’s rights and permits”.
Processing plants and other available facilities
The Quebradona project site is close to an existing national highway, as well as state and rural roads, and high or medium
voltage power infrastructure. The planned underground infrastructure consists of twin adits to access the orebody and number of
internal vertical ore passes that gravity feeds to the main ore transfer level. The material will be transferred to a centralised
(underground) crusher by load and haul dump vehicles.
Crushed material will then be transferred downhill to surface via a 6km conveyor, through a dedicated adit to a single coarse ore
stockpile. Processing and filtered tailings storage activities will be carried out on surface, and final copper concentrate will be
loaded in containers and trucked to an existing main port.
Mineral processing
Feasibility study test work confirmed that the ore will be treated by a typical porphyry copper flotation circuit producing copper
and gold concentrate from the processing of approximately 6.2Mtpa of underground ore over a 22-year operating period. Ore
extracted from the sub-level cave is crushed underground where tramp metal is removed before loading onto the underground
conveyor system for delivery to the surface processing coarse ore stockpile with a 24-hour live capacity (approximately 21,300t).
The feasibility study proposes a processing circuit that includes primary crushing underground, secondary crushing, high
pressure grinding rolls, ball milling, rougher-scavenger flotation for all elements (copper, gold, silver as well as pyrite), followed
by regrinding of the concentrate and cleaning using a mix of column and mechanically agitated cells. The majority of the pyrite in
the ore reports to the cleaner circuit tails and will be stored in a lined and eventually sealed impoundment within the TSF to avoid
any potential acid rock drainage from the bulk high volume rougher tails. Molybdenum is present in the ore and is not planned for
recovery in the initial stages of production.
UNITED STATES OF AMERICA (NEVADA)
All projects are wholly-owned by AngloGold Ashanti. North Bullfrog is a development stage property and Expanded Silicon,
Mother Lode and Sterling are exploration stage properties. North Bullfrog and Mother Lode were acquired through the acquisition
of Corvus Gold Inc. (“Corvus Gold”) in January 2022. Sterling, which includes the Crown Block deposits of SNA, Secret Pass
and Daisy, was acquired through the acquisition of Coeur Sterling, Inc. (“Coeur Sterling”) in November 2022.
North Bullfrog, Mother Lode and Sterling declared Mineral Resource for the first time in 2022. The addition of the North Bullfrog
project as well as the Mother Lode and Sterling projects into the AngloGold Ashanti North America portfolio, together with the
Expanded Silicon project and other exploration targets, provides the opportunity to develop a world-class operational cluster
within the Beatty district in Nevada.
The North Bullfrog project is the most advanced of AngloGold Ashanti’s projects within the Beatty district. AngloGold Ashanti’s
board approved the feasibility study for the North Bullfrog project in the fourth quarter of 2023 and a Mineral Reserve at North
Bullfrog was declared for the first time as of 31 December 2023.
A first-time Mineral Resource for the Silicon open pit at the Expanded Silicon project was declared in 2021. The Expanded
Silicon project completed an initial assessment incorporating the Silicon and Merlin deposits during the fourth quarter of 2023
and a Mineral Resource was declared for the Merlin deposit in the Expanded Silicon project for the first time as of 31 December
2023.
NORTH BULLFROG
Property description
The North Bullfrog project is a development stage property wholly-owned and managed by AngloGold Ashanti. AngloGold
Ashanti acquired North Bullfrog as part of the Corvus Gold acquisition in January 2022. The proposed mining method is
conventional open pit mining.
Location
The North Bullfrog project is located approximately 14km northwest of the town of Beatty in Nye County, Nevada, USA. The
project is within the Bullfrog Hills sub-district, of the Bullfrog Hills-Bare Mountains District. The Bullfrog Hills-Bare Mountains
District is an historic mining centre that produced approximately 3Moz of gold and 4Moz of silver, primarily from the Barrick-
owned Bullfrog pit.
Mineralisation style
The project lays within the Walker Lane mineral belt and the Southwestern Nevada Volcanic Field (“SWNVF”). The regional
stratigraphy includes a basement of Late Proterozoic to Late Paleozoic metamorphic and sedimentary rocks. The North Bullfrog
125
project is a combination of four mineralised deposits comprised of YellowJacket, Sierra Blanca, Jolly Jane, and Mayflower. The
YellowJacket deposit is a very continuous high-grade vein within the moderate-grade stockwork mineralisation. The other three
deposits are low to medium-grade.
Gold mineralisation at North Bullfrog is primarily hosted in the middle Miocene Sierra Blanca tuff. Two styles of precious metal
epithermal mineralisation are present at the project: high-grade, structurally controlled fissure veins and associated stockwork
zones, and low-grade disseminated or replacement deposits within altered volcanic rocks. Two district-scale north striking normal
faults are the dominant structural features in the project area, but several smaller-scale faults between them are important
controls for distribution of hydrothermal alteration and gold mineralisation.
Legal aspects and tenure
Refer to “Item 4B: Business Overview—The Regulatory Environment Enabling AngloGold Ashanti to Mine—Americas—United
States of America (Nevada)—AngloGold Ashanti’s rights and permits”.
Processing plants and other available facilities
Currently, there is minimal infrastructure on-site, as it is an exploration area. Current access roads are unsealed and will require
upgrading prior to commencing the project. The North Bullfrog project is in Nevada, which has several large mining operations
currently in production, and as such provides access to all required major mining and processing equipment. The transport
infrastructure in Nevada is very well established and maintained.
The town of Beatty and urban centres in the region such as Pahrump and Las Vegas offer infrastructure and services that can
support the operation.
Mineral processing
Processing will include heap leaching of lower grade oxide ores that have demonstrated amenability to this process during
metallurgical characterisation programmes. Higher grade material containing some coarse gold will be processed in a mill. The
leached tails from the mill will be dewatered and combined with heap leach material delivered from the mine. The processing
infrastructure will include a heap leach pad, an oxide mill, and a combined facility for collecting gold on carbon and producing
gold/silver doré in an on-site refinery. The leach pad will be built in two phases and will include ponds to collect gold and silver
bearing solution and run-off from the heap leach pad. The mill will include a three-stage crushing circuit, ball mill, gravity
concentrators with intensive leach, agitated leach tanks, and horizontal vacuum belt filters for dewatering the leached tails.
EXPANDED SILICON
The Company has determined that, as of 31 December 2023, the Merlin deposit within the Expanded Silicon project is a material
property for purposes of Regulation S-K 1300. For additional information, refer to the Technical Report Summary for the Merlin
deposit (effective date: 31 December 2023) filed as Exhibit 19.15.10 hereto.
Property description
The Expanded Silicon project is an exploration stage property wholly-owned and managed by AngloGold Ashanti. Mineral
Resource conversion drilling was a focus during 2023, which supported an updated initial assessment incorporating the Silicon
and Merlin deposits. The nature of the Expanded Silicon project mineralisation lends itself to conventional large scale open pit
mining. No Mineral Reserve has been declared at Expanded Silicon.
Location
The Expanded Silicon project is located approximately 12km east of the town of Beatty in Nye County, Nevada, USA. The project
is within the Bare Mountains sub-district, of the Bullfrog Hills-Bare Mountains District.
Mineralisation style
The project resides within the southern extension of the Walker Lane trend and overlies the far-western margins of the SWNVF.
The SWNVF comprises an overlapping complex of calderas (Timber Mountain-Oasis Valley caldera complex) about 30km
northeast of Silicon, that developed between 15 and 11 million years ago.
The geology of the Expanded Silicon project comprises a stack of ignimbrite sheets, cut by complex listric faulting. Mineralisation
occurred approximately 11.6 million years ago in the hiatus between large-scale ignimbrite events, in apparent association with
rhyolitic volcanism. There is both a strong structural and stratigraphic control to the mineralisation, most likely resulting from at
least two separate mineralisation events.
History
A substantial portion of the Expanded Silicon was first acquired by AngloGold Ashanti through an earn-in option agreement with
the owners of the property at the time, Renaissance Exploration Inc. (“RenGold”), which was signed on 21 June 2017. The
agreement gave AngloGold Ashanti an option to acquire a 100 percent interest in the project through payments totalling $3
million to RenGold over a period of three years. This option was fully exercised on 3 June 2020, with RenGold maintaining a one
percent net smelter return on a defined area of interest.
126
In November 2022, AngloGold Ashanti acquired Coeur Sterling. Through this transaction, AngloGold Ashanti gained control of
the C-Horst claims, which largely consolidated the Expanded Silicon land package.
An initial assessment was completed in September 2021 and supported the first-time reporting of a Mineral Resource for the
Silicon deposit. The Expanded Silicon project completed an initial assessment incorporating the Silicon and Merlin deposits
during the fourth quarter of 2023 and a Mineral Resource was declared for the Merlin deposit in the Expanded Silicon project for
the first time as of 31 December 2023.
Legal aspects and tenure
Refer to “Item 4B: Business Overview—The Regulatory Environment Enabling AngloGold Ashanti to Mine—Americas—United
States of America (Nevada)—AngloGold Ashanti’s rights and permits”.
Mining method
The Expanded Silicon project is generally a large low-grade deposit, with a smaller high-grade core (expanding at depth). The
nature of the mineralisation lends itself to conventional large scale open pit mining. Conventional drill and blast will be followed
by conventional load and haul, using a combination of large-scale rope shovels and rigid body dump trucks. The mineralised
material mined will be transported to the process area, where it will be either tipped directly into the crusher or stockpiled to be
fed at a later time.
Processing plants and other available facilities
The Expanded Silicon project area currently has minimal infrastructure on site, as it is an exploration area. However, the project
area is amenable to establishing infrastructure such as site access and facilities for processing and mining activities. Current
access roads are unsealed and will require upgrading prior to commencing the project. Water requirements will be drawn from
the Amargosa and Crater Flats Basins, subject to permitting. Power is expected to be provided by a new transmission line
interconnected at Valley Electric Association’s Beatty substation. Water will be supplied from new wells. The scope of the
Expanded Silicon project is similar to several large mining operations currently in production, and existing suppliers are well
established in Nevada to support mining and processing operations. The transport infrastructure in Nevada is very well
established and maintained. The town of Beatty and urban centres in the region such as Pahrump and Las Vegas offer
infrastructure and services that can support the operation. Average number of employees is estimated at 708 personnel for the
mining operation.
The “Property, Plant, and Equipment” as of 31 December 2023, including buildings, mineral rights and dumps and assets under
construction, had a carrying value of $276 million.
Mineral processing
Mineralised rock from the Merlin and Silicon open pits will be processed in an oxide mill or on a heap leach pad with tertiary
crushing. Mineralised material will be delivered to a primary crusher located near the open pit mine. Crushed rock will be
conveyed to a coarse ore stockpile that will feed higher grade material to a grinding circuit or lower grade material to a secondary
and tertiary crushing circuit. Ground material will be processed in a conventional CIL circuit. Tails will be filtered and placed in a
dedicated impoundment for tailings. Crushed material will be placed on a permanent heap leach pad. Loaded carbon produced
from either the heap leach pad or the CIL circuit will be processed in common desorption and regeneration equipment. Gold doré
will be produced in an on-site facility and sold to a third-party refinery.
Mineral Resource
The below table, prepared in accordance with Table 1 to Paragraph (d)(1) of Item 1304 of Regulation S-K, summarises the gold
Mineral Resource (exclusive of Mineral Reserve) for Merlin open pit at the end of the fiscal year ended 31 December 2023,
based on a gold price estimate of $1,750/oz, unless otherwise stated.
Mineral Resource | Category | Tonnes | Grade | Contained Gold | |
at 31 December 2023 | million | g/t | tonnes | Moz | |
Merlin | Measured | — | — | — | — |
Indicated | — | — | — | — | |
Measured & Indicated | — | — | — | — | |
Inferred | 283.88 | 0.99 | 281.60 | 9.05 | |
Notes:
Rounding of numbers may result in computational discrepancies in the Mineral Resource tabulations. All figures are expressed on an attributable basis unless
otherwise indicated. The Mineral Resource estimates with respect to our material properties have been prepared by the Qualified Persons (employed by
AngloGold Ashanti unless stated otherwise). The net difference between the Mineral Resource at the end of the last completed fiscal year and the preceding
fiscal year is detailed in the table below. To reflect that figures are not precise calculations and that there is uncertainty in their estimation, AngloGold Ashanti
reports tonnage, grade and content for gold to two decimals. All ounces are Troy ounces. “Moz” refers to million ounces.
1.All disclosure of Mineral Resource is exclusive of Mineral Reserve. The Mineral Resource exclusive of Mineral Reserve is defined as the inclusive Mineral
Resource less the Mineral Reserve before dilution and other factors are applied.
2.“Tonnes” refers to a metric tonne which is equivalent to 1,000 kilograms.
3.The Mineral Resource tonnages and grades are reported in situ.
4.Property currently in an exploration stage.
5.Based on a gold price of $1,750/oz.
127
6.In 2023, a metallurgical recovery factor of 94% for gold and 22% for silver was applied for mill material, and a metallurgical recovery factor of 70% for gold
and 12% for silver was applied for crushed heap leach material.
7.In 2023, a cut-off grade of 0.137g/t for gold was applied to the Merlin open pit.
Year-on-year changes in Mineral Resource - Moz
at 31 December 2023 | Merlin | |||
Category | Measured | Indicated | Total Measured and Indicated | Inferred |
Previous Year | — | — | — | — |
Exploration and Methodology | — | — | — | 9.05 |
Economic Assumptions | — | — | — | — |
Other | — | — | — | — |
Acquisition / Disposal | — | — | — | — |
Current Year | — | — | — | 9.05 |
Net Difference | — | — | — | 9.05 |
% Difference | — | — | — | 100 |
Notes:
All figures are expressed on an attributable basis unless otherwise indicated.
An Inferred Mineral Resource was declared for the first time as of 31 December 2023 after the successful completion of an initial
assessment based on exploration success.
Estimation
The estimation of the Mineral Resource considers mineral domains defined as high-grade, mid-grade, and low-grade to respect
the gold and silver drill hole assay data within the context of the interpreted lithological, alteration and structural modelling.
For gold, the high-grade domain defines mineralisation of approximately greater than 2g/t, the mid-grade domain is
approximately between 0.5 and 2g/t, and the low-grade is approximately between 0.07 and 0.5g/t. For silver, the high-grade
domain defines mineralisation of approximately greater than 150g/t, the mid-grade domain is approximately between 50 and
150g/t, and the low-grade is approximately between 6 and 50g/t. Gold assay values were capped based on the defined mineral
domains at 50g/t, 10g/t and 6g/t, respectively, for high-grade, mid-grade and low-grade. Silver assay values were capped based
on the defined mineral domains at 1,000g/t, 200g/t and 80g/t, respectively, for high-grade, mid-grade and low-grade. Composites
of 3 metres were generated for gold and silver respecting the boundaries of the mineral domains and coded to the domain in
which they are contained.
Mineral Reserve
No Mineral Reserve has been declared at Expanded Silicon.
Map showing a portion of the Beatty district mining claims
Depicted below are the locations of the Mother Lode, SNA, Secret Pass, Daisy, and Sterling deposits, together with the currently
proposed open pits for the Silicon and Merlin deposits. Potential surface infrastructure locations have also been identified; these
are subject to change based on continued evaluation of mineralisation within the relevant lands, potential development options,
and other relevant factors. The coordinates of this area, as represented by the Merlin pit, are depicted on the map and are in the
geographic coordinate system.
128
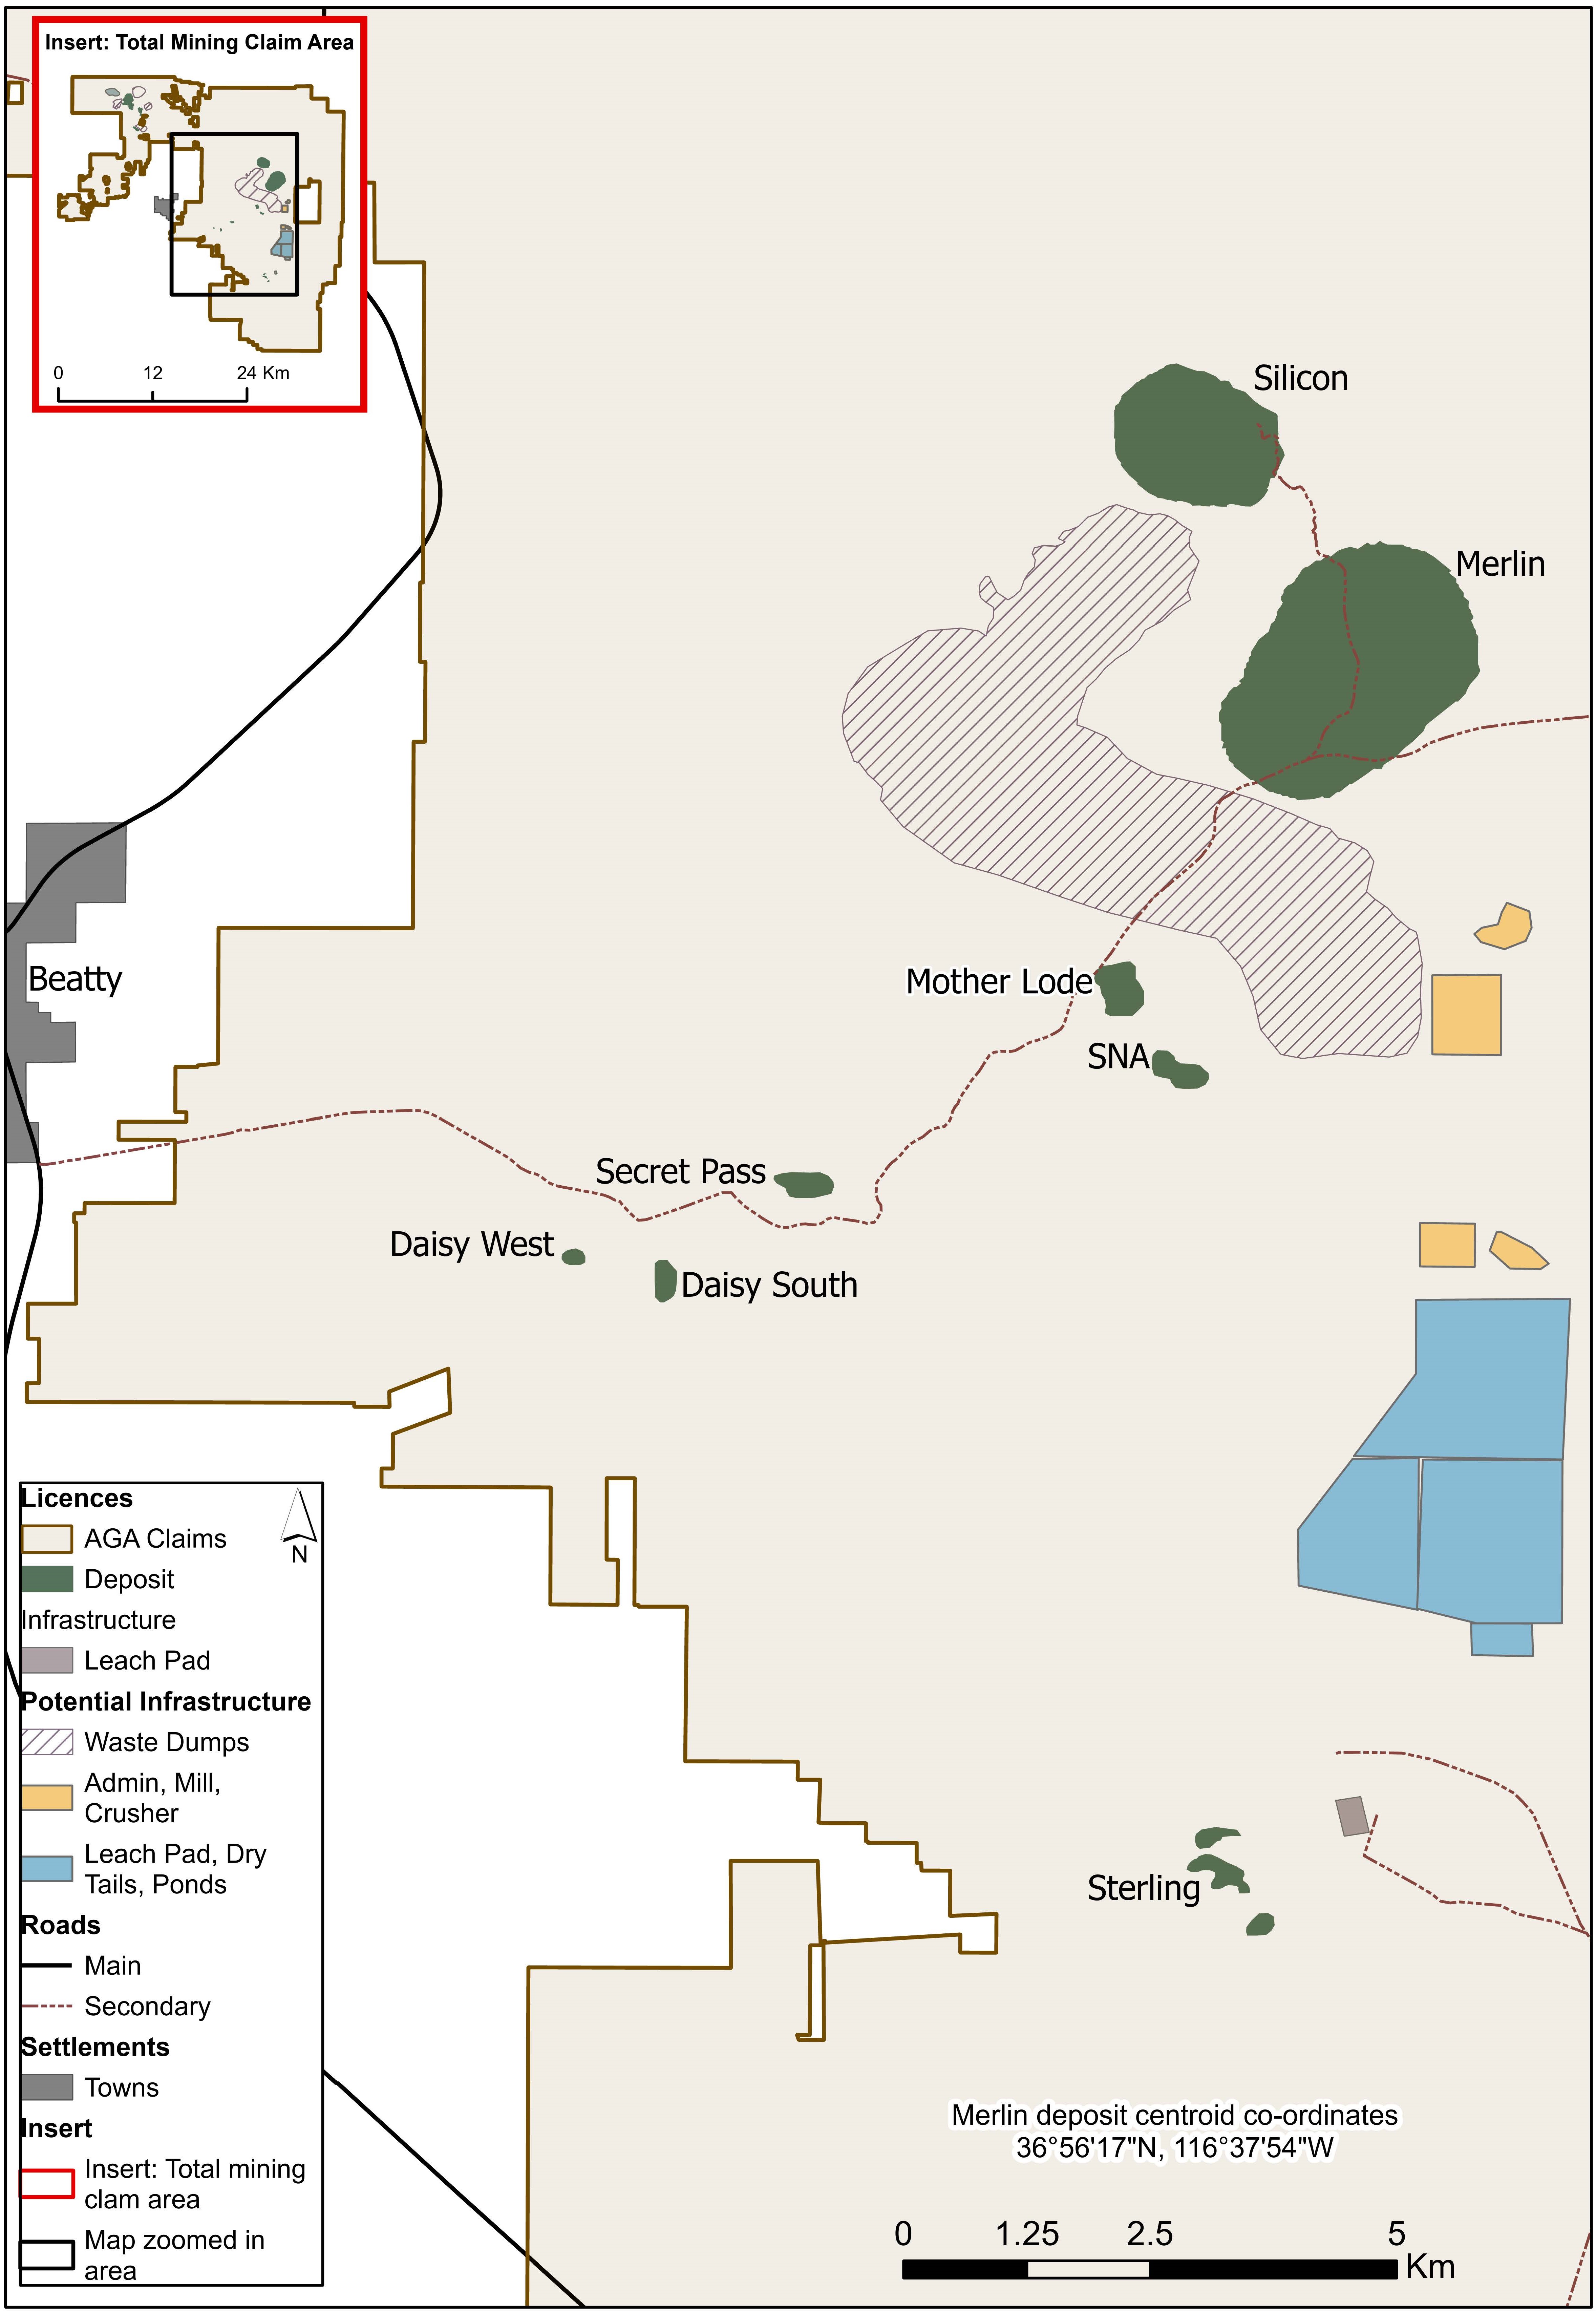
129
MOTHER LODE
Property description
The Mother Lode project is an exploration stage property wholly-owned and managed by AngloGold Ashanti. A preliminary
economic assessment was completed by Corvus Gold in 2020, resulting in the declaration of a Mineral Resource. AngloGold
Ashanti acquired Mother Lode as part of the Corvus Gold acquisition in January 2022. The Mother Lode gold deposits contain
mineralisation at or near the surface that is suitable for open pit mining methods. No Mineral Reserve has been declared at
Mother Lode.
Location
The Mother Lode project is located approximately 10km east of the town of Beatty in Nye County, Nevada, USA. The project is
within the Bare Mountains sub-district, of the Bullfrog Hills-Bare Mountains District.
Mineralisation style
The Mother Lode project consists of structurally and stratigraphically-controlled disseminated gold mineralisation hosted primarily
in rhyolite porphyry dykes, sedimentary rocks of Joshua Hollow, and to a lesser degree, Paleozoic sedimentary rocks. The
primary structural control feeding mineralisation at Mother Lode is a series of north-trending, 50° to 70° west-dipping rhyolite
dyke-filled structures. Mineralisation is both semi-tabular and highly irregular as fluids ascended along dyke-filled structures in
the underlying Paleozoic rocks through the Tertiary unconformity and expanded upward into the Tertiary section. Mineralising
fluids appear to have bled out laterally away from mineralised dykes into favourable permeable lithologies and secondary
structures.
Legal aspects and tenure
Refer to “Item 4B: Business Overview—The Regulatory Environment Enabling AngloGold Ashanti to Mine—Americas—United
States of America (Nevada)—AngloGold Ashanti’s rights and permits”.
Processing plants and other available facilities
The Mother Lode project area currently has minimal infrastructure on-site, as it is an exploration area with a reclaimed
overburden facility and a small open pit. Current access roads are unsealed and will require upgrading prior to commencing the
project. The Mother Lode project is in Nevada, which has several large mining operations currently in production, and as such
provides access to all required major mining and processing equipment. The transport infrastructure in Nevada is very well
established and maintained.
The town of Beatty and urban centres in the region such as Pahrump and Las Vegas offer infrastructure and services that can
support the operation.
Mineral processing
Previous operations included crushing and heap leaching of oxide ores from the Mother Lode pit. Mineralised material from the
expanded pit will be processed either without crushing on a heap leach pad (oxidised material) or in a mill using agitated tank
bio-oxidation and cyanidation (sulphide). Although the sulphide mineral samples responded well to this method, additional work
will need to be done to ensure that bio-oxidation is the most appropriate pre-oxidation process for this project.
STERLING
Property description
The Sterling project is wholly-owned and managed by AngloGold Ashanti. AngloGold Ashanti acquired Sterling as part of the
Coeur Sterling acquisition in November 2022. Sterling includes the Sterling Mine, a mining property currently on care and
maintenance. It also includes the Crown Block deposits of SNA, Secret Pass and Daisy and the tenements surrounding those
properties, which are all in exploration stage. The elevation of the property is around 1,200m, on the lower, eastern slopes of
Bare Mountain. The local terrain is characterised by rounded or craggy ridges separated by ephemeral washes. The northern
“Crown” strip comprises the general area of Fluorspar Canyon. No Mineral Reserve has been declared at Sterling.
Open pit mining of the Sterling mine deposit began in 1980 and continued until 1989. Underground mining began in 1980 and
proceeded until mid-1997 when market conditions impacted profitability. The Crown deposits contain mineralisation at or near the
surface that is suitable for open pit mining methods.
The Mineral Resource is based on estimates that contain inherent risk and depend upon geological interpretation and statistical
inferences drawn from drilling and sampling analyses. Based on uncertainty due to geological interpretation from widespread drill
hole information, an Inferred Mineral Resource confidence was applied to all of the Sterling Mineral Resource. Further Mineral
Resource drilling and appropriate analyses will be required to upgrade the confidence to an Indicated Mineral Resource.
Location
The Sterling property is situated in southern Nye County, Nevada, near the town of Beatty, about 185 km northwest of Las
Vegas. The project is within the Bare Mountains sub-district, of the Bullfrog Hills-Bare Mountains District. The Secret Pass, SNA
and Daisy deposits of the Crown Block in the Sterling project are located 6km east of the town of Beatty. The remaining deposits
of the Sterling project are located 14km southeast of the town of Beatty.
130
Mineralisation style
The Sterling deposits are characterised as either epithermal deposits (Secret Pass) like the North Bullfrog and Silicon deposits or
sediment-hosted deposits (Daisy, Sterling, and SNA). Oxidised gold appears to be controlled by thrust domains and steep north-
striking faults in these deposits.
Legal aspects and tenure
Refer to “Item 4B: Business Overview—The Regulatory Environment Enabling AngloGold Ashanti to Mine—Americas—United
States of America (Nevada)—AngloGold Ashanti’s rights and permits”.
Processing plants and other available facilities
Sterling is accessible by road from Las Vegas, a distance of 185km via U.S. Highway 95. A good secondary, 13km long gravel
road turns off the north side of the highway at mile 45.9, 24km southeast of the town of Beatty. Las Vegas is the nearest major
airport. The Sterling mine site contains office, maintenance and storage facilities to support care and maintenance activities.
Power is supplied to the office and maintenance facility with small local generator sets. Water is supplied from a well located
about 4 km from the administration building.
The town of Beatty and urban centres in the region such as Pahrump and Las Vegas offer infrastructure and services that can
support the operation.
Mineral processing
Previous processing included heap leaching the oxidised Sterling mine ore. After mine production ceased, the heap leach pad
continued to be turned over until October 2001, with additional ore from a low-grade stockpile added in early 2001. Gold recovery
continued until August 2002 when a final strip was carried out. Mineralised material from the Crown deposits will be processed
either without crushing on a heap leach pad (oxidised material) or in a mill using agitated tank bio-oxidation and cyanidation
(sulphide material).
MINERAL RESOURCE AND MINERAL RESERVE
The Mineral Resource and Mineral Reserve stated herein were prepared in compliance with Regulation S-K 1300, which
contains the SEC’s mining property disclosure requirements for mining registrants. Mineral Resource and Mineral Reserve are
estimates that contain inherent risk and depend upon geological interpretation and statistical inferences drawn from drilling and
sampling analysis, which may prove to be unreliable. For additional information on the risks and uncertainties associated with
AngloGold Ashanti’s mining properties, refer to “Item 3D: Risk Factors”.
Price assumptions
The Mineral Resource and Mineral Reserve are based on the use of economic assumptions which provide a reasonable basis
for establishing the prospects of economic extraction for the Mineral Resource, and for establishing the expected price for the
Mineral Reserve. These economic assumptions are based on the Company’s assessment of multiple factors, which include long-
range commodity price trends, consensus exchange rate and price forecasts, historic price averages, impacts on inflation and
the resulting high-interest rate environment. AngloGold Ashanti selects a Mineral Reserve price to fit into its strategy of including
a margin in the mine planning process. The resultant plan is then valued at a higher business planning price. The Mineral
Resource price assumptions are based on approximately 20 to 25 percent premium over the Mineral Reserve price assumptions.
Gold price
The following gold prices were used as the basis for estimation, unless otherwise stated:
Gold price(1) | Local prices of gold(1) | ||||
Australia | Brazil | Argentina | Colombia | ||
$/oz | AUD/oz | BRL/oz | ARS/oz | COP/oz | |
Mineral Reserve | |||||
2023 | 1,400 | 1,931 | 7,744 | 490,000 | 7,377,559 |
2022 | 1,400 | 1,919 | 7,830 | 208,000 | 4,261,380 |
Mineral Resource | |||||
2023 | 1,750 | 2,447 | 9,309 | 612,500 | 8,422,242 |
2022 | 1,750 | 2,416 | 9,401 | 253,500 | 6,076,725 |
Copper price
The following copper prices(2) were used as the basis for estimation:
131
Copper price(1)(2) | Local price of copper(1)(2) | |
$/lb | COP/lb | |
Mineral Reserve | ||
2023 | 2.90 | 9,302 |
2022 | 2.90 | 9,302 |
Mineral Resource | ||
2023 | 3.50 | 12,451 |
2022 | 3.50 | 12,451 |
Notes:
(1) Considered over the period 2013 to 2023
(2) Only applicable to the Quebradona project
The Mineral Resource, as reported, is exclusive of the Mineral Reserve component before dilution and other factors are applied.
Mineral Resource and Mineral Reserve estimates are reported at 31 December 2023 and are net of 2023 production depletion.
MINERAL RESOURCE
Gold
The AngloGold Ashanti gold Measured and Indicated Mineral Resource decreased from 60.6Moz at 31 December 2022 to
59.9Moz at 31 December 2023. Additions included exploration and modelling changes of 1.5Moz. Reductions included the sale
of Gramalote of 2.0Moz and economic assumptions of 0.2Moz. As a result, the net year-on-year gold Measured and Indicated
Mineral Resource reduction was 0.7Moz.
The AngloGold Ashanti gold Inferred Mineral Resource increased from 40.8Moz at 31 December 2022 to 46.4Moz at 31
December 2023. Additions included exploration and modelling changes of 8.7Moz. The additions were partially offset by
reductions which included the sale of Gramalote of 0.6Moz, changes in economic assumptions of 1.3Moz and other factors of
1.2Moz. As a result, the net year-on-year gold Inferred Mineral Resource addition was 5.6Moz. The gold Inferred Mineral
Resource included for the first time the Inferred Mineral Resource of 9.1Moz declared at the Merlin deposit in the Expanded
Silicon project after the successful completion and approval of an initial assessment.
The gold Mineral Resource at 31 December 2023 was estimated using a gold price of $1,750/oz, unless otherwise stated (2022:
$1,750/oz). Refer to the gold Mineral Resource table below, prepared in accordance with Table 1 (Summary Mineral Resource)
to Paragraph (b) of Item 1303 of Regulation S-K.
Copper
The AngloGold Ashanti copper Mineral Resource remained unchanged at 1.32Mt (2,902Mlb) Measured and Indicated Mineral
Resource and 1.47Mt (3,231Mlb) Inferred Mineral Resource at 31 December 2023 as compared to 31 December 2022, as a
feasibility study optimisation is still ongoing and no additional exploration has been completed at Quebradona.
The copper Mineral Resource at 31 December 2023 was estimated using a copper price of $3.50/lb (2022: $3.50/lb). Refer to the
copper Mineral Resource table below, prepared in accordance with Table 1 (Summary Mineral Resource) to Paragraph (b) of
Item 1303 of Regulation S-K.
MINERAL RESERVE
Gold
The AngloGold Ashanti gold Mineral Reserve decreased from 28.8Moz at 31 December 2022 to 28.1Moz at 31 December 2023.
Additions of 2.5Moz to the gold Mineral Reserve included 2.0Moz from exploration and modelling changes and 0.5Moz due to
other impacts. The 2.0Moz from exploration and modelling changes included the first-time reporting of the North Bullfrog gold
Mineral Reserve of 1.0Moz after the successful completion and approval of a feasibility study. Reductions included depletion of
2.9Moz and economic assumptions of 0.3Moz. As a result, the net year-on-year gold Mineral Reserve reduction was 0.7Moz.
The gold Mineral Reserve at 31 December 2023 was estimated using a gold price of $1,400/oz, unless otherwise stated (2022:
$1,400/oz). Refer to the gold Mineral Reserve table below, prepared in accordance with Table 2 (Summary Mineral Reserve) to
Paragraph (b) of Item 1303 of Regulation S-K.
132
Copper
The AngloGold Ashanti copper Mineral Reserve remained unchanged at 1.47Mt (3,250Mlb) at 31 December 2023 as compared
to 31 December 2022, as a feasibility study optimisation is still ongoing and no additional exploration has been completed at
Quebradona.
The copper Mineral Reserve at 31 December 2023 was estimated using a copper price of $2.90/lb (2022: $2.90/lb).Refer to the
copper Mineral Reserve table below, prepared in accordance with Table 2 (Summary Mineral Reserve) to Paragraph (b) of Item
1303 of Regulation S-K.
133
The below summary table is prepared in accordance with Table 1 to Paragraph (b) of Item 1303 of Regulation S-K - Summary Mineral Resource for gold at the end
of the fiscal year ended 31 December 2023, based on an estimated gold price of $1,750/oz, unless otherwise stated.
Mineral Resource (1) | At 31 December 2023 | |||||||||||||||
Measured | Indicated | Total Measured and Indicated | Inferred | |||||||||||||
Gold | Tonnes (3) | Grade | Contained Gold | Tonnes (3) | Grade | Contained Gold | Tonnes (3) | Grade | Contained Gold | Tonnes (3) | Grade | Contained Gold | ||||
Million | g/t | Tonnes | Moz | Million | g/t | Tonnes | Moz | Million | g/t | Tonnes | Moz | Million | g/t | Tonnes | Moz | |
Africa Region | 19.20 | 3.79 | 72.78 | 2.34 | 265.74 | 2.09 | 555.40 | 17.86 | 284.94 | 2.20 | 628.18 | 20.20 | 186.68 | 2.94 | 549.03 | 17.65 |
Democratic Republic of the Congo | 5.79 | 3.65 | 21.15 | 0.68 | 18.11 | 2.83 | 51.20 | 1.65 | 23.90 | 3.03 | 72.35 | 2.33 | 8.82 | 2.79 | 24.57 | 0.79 |
Kibali (45%)(2)(9)(13) | 5.79 | 3.65 | 21.15 | 0.68 | 18.11 | 2.83 | 51.20 | 1.65 | 23.90 | 3.03 | 72.35 | 2.33 | 8.82 | 2.79 | 24.57 | 0.79 |
Ghana | 4.45 | 6.39 | 28.43 | 0.91 | 82.22 | 3.36 | 276.30 | 8.88 | 86.67 | 3.52 | 304.73 | 9.80 | 59.95 | 5.59 | 335.40 | 10.78 |
Iduapriem(13) | 0.98 | 1.50 | 1.47 | 0.05 | 53.39 | 1.42 | 76.06 | 2.45 | 54.37 | 1.43 | 77.53 | 2.49 | 24.58 | 1.44 | 35.46 | 1.14 |
Obuasi(4)(13) | 3.47 | 7.77 | 26.97 | 0.87 | 28.83 | 6.95 | 200.23 | 6.44 | 32.30 | 7.03 | 227.20 | 7.30 | 35.37 | 8.48 | 299.94 | 9.64 |
Guinea | — | — | — | — | 128.41 | 1.11 | 142.03 | 4.57 | 128.41 | 1.11 | 142.03 | 4.57 | 87.01 | 1.17 | 101.57 | 3.27 |
Siguiri (85%)(2)(13) | — | — | — | — | 128.41 | 1.11 | 142.03 | 4.57 | 128.41 | 1.11 | 142.03 | 4.57 | 87.01 | 1.17 | 101.57 | 3.27 |
Tanzania | 8.96 | 2.59 | 23.20 | 0.75 | 37.00 | 2.32 | 85.87 | 2.76 | 45.95 | 2.37 | 109.07 | 3.51 | 30.90 | 2.83 | 87.49 | 2.81 |
Geita(5)(13) | 8.96 | 2.59 | 23.20 | 0.75 | 37.00 | 2.32 | 85.87 | 2.76 | 45.95 | 2.37 | 109.07 | 3.51 | 30.90 | 2.83 | 87.49 | 2.81 |
Americas Region | 16.57 | 4.13 | 68.36 | 2.20 | 35.82 | 2.99 | 107.02 | 3.44 | 52.39 | 3.35 | 175.38 | 5.64 | 53.72 | 3.90 | 209.66 | 6.74 |
Argentina | 5.50 | 2.62 | 14.43 | 0.46 | 13.80 | 2.49 | 34.35 | 1.10 | 19.30 | 2.53 | 48.78 | 1.57 | 3.92 | 3.15 | 12.34 | 0.40 |
Cerro Vanguardia (92.5%)(2)(13) | 5.50 | 2.62 | 14.43 | 0.46 | 13.80 | 2.49 | 34.35 | 1.10 | 19.30 | 2.53 | 48.78 | 1.57 | 3.92 | 3.15 | 12.34 | 0.40 |
Brazil | 11.07 | 4.87 | 53.94 | 1.73 | 22.02 | 3.30 | 72.66 | 2.34 | 33.09 | 3.83 | 126.60 | 4.07 | 49.80 | 3.96 | 197.32 | 6.34 |
AGA Mineração - Córrego do Sítio(15) | 3.03 | 3.31 | 10.04 | 0.32 | 7.80 | 3.16 | 24.66 | 0.79 | 10.83 | 3.20 | 34.70 | 1.12 | 20.45 | 3.94 | 80.56 | 2.59 |
AGA Mineração - Cuiabá(13) | 3.39 | 8.31 | 28.20 | 0.91 | 3.22 | 6.08 | 19.60 | 0.63 | 6.62 | 7.22 | 47.81 | 1.54 | 10.99 | 5.49 | 60.30 | 1.94 |
AGA Mineração - Lamego(13) | 1.12 | 3.57 | 4.01 | 0.13 | 2.64 | 2.25 | 5.94 | 0.19 | 3.76 | 2.64 | 9.95 | 0.32 | 2.37 | 2.24 | 5.32 | 0.17 |
Serra Grande(13) | 3.51 | 3.33 | 11.69 | 0.38 | 8.36 | 2.69 | 22.45 | 0.72 | 11.88 | 2.87 | 34.14 | 1.10 | 16.00 | 3.20 | 51.15 | 1.64 |
Australia Region | 26.75 | 1.69 | 45.27 | 1.46 | 29.43 | 1.85 | 54.44 | 1.75 | 56.18 | 1.77 | 99.71 | 3.21 | 46.16 | 2.40 | 110.84 | 3.56 |
Sunrise Dam(13) | 15.49 | 1.89 | 29.35 | 0.94 | 18.82 | 1.87 | 35.23 | 1.13 | 34.31 | 1.88 | 64.58 | 2.08 | 24.86 | 2.27 | 56.36 | 1.81 |
Butcher Well (70%)(2)(11) | — | — | — | — | — | — | — | — | — | — | — | — | 2.83 | 3.69 | 10.46 | 0.34 |
Tropicana (70%)(2)(13) | 11.26 | 1.41 | 15.92 | 0.51 | 10.61 | 1.81 | 19.22 | 0.62 | 21.87 | 1.61 | 35.13 | 1.13 | 18.46 | 2.38 | 44.02 | 1.42 |
Projects | 69.48 | 0.46 | 32.19 | 1.03 | 1,181.90 | 0.79 | 928.03 | 29.84 | 1,251.38 | 0.77 | 960.22 | 30.87 | 917.59 | 0.63 | 574.19 | 18.46 |
Colombia | 45.15 | 0.37 | 16.93 | 0.54 | 982.40 | 0.79 | 776.20 | 24.96 | 1,027.55 | 0.77 | 793.13 | 25.50 | 523.83 | 0.43 | 225.50 | 7.25 |
Gramalote (50%)(2)(10)(11) | — | — | — | — | — | — | — | — | — | — | — | — | — | — | — | — |
La Colosa(7)(11) | — | — | — | — | 833.49 | 0.87 | 726.31 | 23.35 | 833.49 | 0.87 | 726.31 | 23.35 | 217.89 | 0.71 | 154.86 | 4.98 |
Quebradona(8)(12) | 45.15 | 0.37 | 16.93 | 0.54 | 148.91 | 0.34 | 49.89 | 1.60 | 194.06 | 0.34 | 66.82 | 2.15 | 305.94 | 0.23 | 70.64 | 2.27 |
United States of America | 24.33 | 0.63 | 15.26 | 0.49 | 199.49 | 0.76 | 151.82 | 4.88 | 223.82 | 0.75 | 167.08 | 5.37 | 393.76 | 0.89 | 348.69 | 11.21 |
North Bullfrog(12) | — | — | — | — | 42.02 | 0.31 | 12.91 | 0.42 | 42.02 | 0.31 | 12.91 | 0.42 | 30.58 | 0.26 | 8.03 | 0.26 |
Silicon(11) | — | — | — | — | 121.56 | 0.87 | 105.90 | 3.40 | 121.56 | 0.87 | 105.90 | 3.40 | 36.03 | 0.70 | 25.23 | 0.81 |
Merlin(6)(11) | — | — | — | — | — | — | — | — | — | — | — | — | 283.88 | 0.99 | 281.60 | 9.05 |
Mother Lode(8)(11) | 24.33 | 0.63 | 15.26 | 0.49 | 35.91 | 0.92 | 33.01 | 1.06 | 60.24 | 0.80 | 48.28 | 1.55 | 9.86 | 0.55 | 5.39 | 0.17 |
Sterling(14)(16) | — | — | — | — | — | — | — | — | — | — | — | — | 33.41 | 0.85 | 28.43 | 0.91 |
AngloGold Ashanti Total | 132.00 | 1.66 | 218.60 | 7.03 | 1,512.89 | 1.09 | 1,644.88 | 52.88 | 1,644.89 | 1.13 | 1,863.48 | 59.91 | 1,204.15 | 1.20 | 1,443.71 | 46.42 |
134
Notes:
Rounding of numbers may result in computational discrepancies in the Mineral Resource tabulations. The Mineral Resource estimates with respect to our material properties have been prepared by the Qualified
Persons (employed by AngloGold Ashanti unless stated otherwise). The net difference between the Mineral Resource at the end of the last completed fiscal year and the preceding fiscal year (if applicable) is
detailed for material properties in this annual report. To reflect that figures are not precise calculations and that there is uncertainty in their estimation, AngloGold Ashanti reports tonnage, grade and content for
gold to two decimals. All ounces are Troy ounces. “Moz” refers to million ounces. The Mineral Resource tonnages and grades are reported in situ and stockpiled material is reported as broken material.
(1)All disclosure of Mineral Resource is exclusive of Mineral Reserve. The Mineral Resource exclusive of Mineral Reserve is defined as the inclusive Mineral Resource less the Mineral Reserve before
dilution and other factors are applied.
(2) Mineral Resource attributable to AngloGold Ashanti’s percentage interest shown.
(3) “Tonnes” refers to a metric tonne which is equivalent to 1,000 kilograms.
(4) In 2023, a cut-off grade of 1.07g/t was applied to the open pit, and a cut-off grade range from 3.79g/t to 4.49g/t (varying according to area) was applied to the underground. In 2023, a metallurgical
recovery factor of 88% was applied to the underground.
(5)In 2023, a cut-off grade range from 0.60g/t to 1.40g/t (varying according to area) was applied to the open pit, and a cut-off grade range from 0.88g/t to 2.58g/t (varying according to area) was applied to
the underground. In 2023, a metallurgical recovery factor of 90.40% was applied to the open pit, a metallurgical recovery factor range from 91.07% to 91.63% (varying according to area) was applied to
the stockpile, and a metallurgical recovery factor range from 76.40% to 92.30% (varying according to area) was applied to the underground.
(6)An Inferred Mineral Resource was declared for the first time at the Merlin deposit in the Expanded Silicon project as of 31 December 2023. In 2023, a cut-off grade of 0.137g/t for gold was applied to the
Merlin open pit. In 2023, a metallurgical recovery factor of 94% for gold and 22% for silver was applied for mill material, and a metallurgical recovery factor of 70% for gold and 12% for silver was
applied for crushed heap leach material.
(7) Property currently in force majeure. Based on a gold price of $1,400/oz.
(8) Based on a gold price of $1,500/oz.
(9)Operated by Barrick Gold Corporation (“Barrick”). AngloGold Ashanti has recognised that in preparing this information, the Qualified Persons have relied on information provided by Barrick. Based on a
gold price of $1,700/oz. In 2023, a cut-off grade range from 0.55g/t to 0.89g/t was applied to the open pit (varying according to rock type), a cut-off grade range from 0.51g/t to 0.56g/t was applied to the
stockpiles (varying according to area), and a cut-off grade of 1.50g/t was applied to the underground. In 2023, a metallurgical recovery factor range from 75.9% to 90.9% (varying according to area) was
applied to the open pit and stockpile, and a metallurgical recovery factor of 90% was applied to the underground.
(10) Managed by B2Gold Corp. (“B2Gold”). Based on a gold price of $1,800/oz. AngloGold Ashanti sold its entire 50% indirect interest in the Gramalote project to B2Gold in September 2023.
(11) Property currently in an exploration stage.
(12) Property currently in a development stage.
(13) Property currently in a production stage.
(14) Based on a gold price of $1,700/oz.
(15) The Córrego do Sítio (“CdS”) operation was placed on care and maintenance in August 2023.
(16)The Sterling project includes the Sterling mine, a mining property currently on care and maintenance, and the Crown Block deposits of SNA, Secret Pass and Daisy and the tenements surrounding the
properties which are all in exploration stage.
The below summary table is prepared in accordance with Table 1 to Paragraph (b) of Item 1303 of Regulation S-K - Summary Mineral Resource for copper at the
end of the fiscal year ended 31 December 2023, based on an estimated copper price of $3.50/lb.
Mineral Resource (1) | At 31 December 2023 | |||||||||||||||
Measured | Indicated | Total Measured and Indicated | Inferred | |||||||||||||
Copper | Tonnes (2) | Grade | Contained Copper | Tonnes (2) | Grade | Contained Copper | Tonnes (2) | Grade | Contained Copper | Tonnes (2) | Grade | Contained Copper | ||||
Million | %Cu | Tonnes Million | Pounds Million | Million | %Cu | Tonnes Million | Pounds Million | Million | %Cu | Tonnes Million | Pounds Million | Million | %Cu | Tonnes Million | Pounds Million | |
Americas Region | 45.15 | 0.69 | 0.31 | 684 | 148.91 | 0.68 | 1.01 | 2,218 | 194.06 | 0.68 | 1.32 | 2,902 | 305.94 | 0.48 | 1.47 | 3,231 |
Colombia | 45.15 | 0.69 | 0.31 | 684 | 148.91 | 0.68 | 1.01 | 2,218 | 194.06 | 0.68 | 1.32 | 2,902 | 305.94 | 0.48 | 1.47 | 3,231 |
Quebradona(3) | 45.15 | 0.69 | 0.31 | 684 | 148.91 | 0.68 | 1.01 | 2,218 | 194.06 | 0.68 | 1.32 | 2,902 | 305.94 | 0.48 | 1.47 | 3,231 |
AngloGold Ashanti Total | 45.15 | 0.69 | 0.31 | 684 | 148.91 | 0.68 | 1.01 | 2,218 | 194.06 | 0.68 | 1.32 | 2,902 | 305.94 | 0.48 | 1.47 | 3,231 |
Notes:
Rounding of numbers may result in computational discrepancies in the Mineral Resource tabulations. To reflect that figures are not precise calculations and that there is uncertainty in their estimation,
AngloGold Ashanti reports tonnage and grade to two decimals and content for copper with no decimals. “Mlb” refers to million pounds. The Mineral Resource tonnages and grades are reported in situ
and stockpiled material is reported as broken material.
(1) All disclosure of Mineral Resource is exclusive of Mineral Reserve. The Mineral Resource exclusive of Mineral Reserve is defined as the inclusive Mineral Resource less the Mineral Reserve
before dilution and other factors are applied.
(2) “Tonnes” refers to a metric tonne which is equivalent to 1,000 kilograms.
(3) Property currently in a development stage.
135
The below summary table is prepared in accordance with Table 2 to Paragraph (b) of Item 1303 of Regulation S-K - Summary Mineral Reserve for gold at the end
of the fiscal year ended 31 December 2023, based on an estimated gold price of $1,400/oz, unless otherwise stated.
Mineral Reserve | At 31 December 2023 | |||||||||||
Proven | Probable | Total Mineral Reserve | ||||||||||
Gold | Tonnes (2) | Grade | Contained Gold | Tonnes (2) | Grade | Contained Gold | Tonnes (2) | Grade | Contained Gold | |||
Million | g/t | Tonnes | Moz | Million | g/t | Tonnes | Moz | Million | g/t | Tonnes | Moz | |
Africa Region | 50.40 | 2.26 | 114.03 | 3.67 | 211.37 | 2.30 | 486.05 | 15.63 | 261.77 | 2.29 | 600.08 | 19.29 |
Democratic Republic of the Congo | 13.82 | 3.44 | 47.58 | 1.53 | 33.36 | 2.92 | 97.40 | 3.13 | 47.18 | 3.07 | 144.98 | 4.66 |
Kibali (45%)(1)(5)(8) | 13.82 | 3.44 | 47.58 | 1.53 | 33.36 | 2.92 | 97.40 | 3.13 | 47.18 | 3.07 | 144.98 | 4.66 |
Ghana | 10.09 | 4.41 | 44.47 | 1.43 | 61.98 | 3.88 | 240.59 | 7.74 | 72.07 | 3.96 | 285.06 | 9.17 |
Iduapriem(8) | 6.29 | 0.97 | 6.07 | 0.20 | 42.95 | 1.35 | 57.96 | 1.86 | 49.25 | 1.30 | 64.03 | 2.06 |
Obuasi(8)(10) | 3.79 | 10.12 | 38.40 | 1.23 | 19.03 | 9.60 | 182.63 | 5.87 | 22.83 | 9.68 | 221.03 | 7.11 |
Guinea | 12.21 | 0.62 | 7.53 | 0.24 | 75.78 | 0.78 | 58.97 | 1.90 | 87.99 | 0.76 | 66.50 | 2.14 |
Siguiri (85%)(1)(8) | 12.21 | 0.62 | 7.53 | 0.24 | 75.78 | 0.78 | 58.97 | 1.90 | 87.99 | 0.76 | 66.50 | 2.14 |
Tanzania | 14.27 | 1.01 | 14.45 | 0.46 | 40.25 | 2.21 | 89.09 | 2.86 | 54.52 | 1.90 | 103.53 | 3.33 |
Geita(8)(11) | 14.27 | 1.01 | 14.45 | 0.46 | 40.25 | 2.21 | 89.09 | 2.86 | 54.52 | 1.90 | 103.53 | 3.33 |
Americas Region | 7.38 | 3.52 | 25.96 | 0.83 | 17.06 | 3.15 | 53.74 | 1.73 | 24.44 | 3.26 | 79.70 | 2.56 |
Argentina | 2.09 | 3.26 | 6.82 | 0.22 | 7.21 | 1.91 | 13.76 | 0.44 | 9.30 | 2.21 | 20.58 | 0.66 |
Cerro Vanguardia (92.5%)(1)(3)(8) | 2.09 | 3.26 | 6.82 | 0.22 | 7.21 | 1.91 | 13.76 | 0.44 | 9.30 | 2.21 | 20.58 | 0.66 |
Brazil | 5.28 | 3.62 | 19.14 | 0.62 | 9.85 | 4.06 | 39.99 | 1.29 | 15.14 | 3.91 | 59.13 | 1.90 |
AGA Mineração - Córrego do Sítio(9) | 0.84 | 3.10 | 2.62 | 0.08 | 2.01 | 4.42 | 8.89 | 0.29 | 2.86 | 4.03 | 11.50 | 0.37 |
AGA Mineração - Cuiabá(4)(8) | 1.67 | 5.10 | 8.51 | 0.27 | 3.91 | 4.99 | 19.52 | 0.63 | 5.58 | 5.02 | 28.03 | 0.90 |
AGA Mineração - Lamego(4)(8) | 0.36 | 3.27 | 1.17 | 0.04 | 0.86 | 3.53 | 3.03 | 0.10 | 1.22 | 3.45 | 4.19 | 0.13 |
Serra Grande(8) | 2.41 | 2.84 | 6.84 | 0.22 | 3.07 | 2.79 | 8.56 | 0.28 | 5.48 | 2.81 | 15.40 | 0.49 |
Australia Region | 25.33 | 1.27 | 32.23 | 1.04 | 23.36 | 2.10 | 49.07 | 1.58 | 48.69 | 1.67 | 81.30 | 2.61 |
Sunrise Dam(8)(12) | 10.53 | 1.50 | 15.81 | 0.51 | 5.72 | 2.89 | 16.56 | 0.53 | 16.25 | 1.99 | 32.37 | 1.04 |
Tropicana (70%)(1)(8) | 14.81 | 1.11 | 16.42 | 0.53 | 17.64 | 1.84 | 32.51 | 1.05 | 32.44 | 1.51 | 48.93 | 1.57 |
Projects | — | — | — | — | 191.94 | 0.58 | 111.89 | 3.60 | 191.94 | 0.58 | 111.89 | 3.60 |
Colombia | — | — | — | — | 120.01 | 0.67 | 80.83 | 2.60 | 120.01 | 0.67 | 80.83 | 2.60 |
Quebradona(3)(6)(7) | — | — | — | — | 120.01 | 0.67 | 80.83 | 2.60 | 120.01 | 0.67 | 80.83 | 2.60 |
United States of America | — | — | — | — | 71.93 | 0.43 | 31.05 | 1.00 | 71.93 | 0.43 | 31.05 | 1.00 |
North Bullfrog(3)(7)(13) | — | — | — | — | 71.93 | 0.43 | 31.05 | 1.00 | 71.93 | 0.43 | 31.05 | 1.00 |
AngloGold Ashanti Total | 83.11 | 2.07 | 172.22 | 5.54 | 443.73 | 1.58 | 700.75 | 22.53 | 526.84 | 1.66 | 872.97 | 28.07 |
Notes:
Rounding of numbers may result in computational discrepancies in the Mineral Reserve tabulations. The Mineral Reserve estimates with respect to our material properties have been prepared by the Qualified
Persons (employed by AngloGold Ashanti unless stated otherwise). The net difference between the Mineral Reserve at the end of the last completed fiscal year and the preceding fiscal year (if applicable) is
detailed for material properties in this annual report. To reflect that figures are not precise calculations and that there is uncertainty in their estimation, AngloGold Ashanti reports tonnage, grade and content for
gold to two decimals. All ounces are Troy ounces. “Moz” refers to million ounces. The Mineral Reserve tonnages and grades are estimated and reported as delivered to plant (i.e., the point where material is
delivered to the processing facility).
(1) Mineral Reserve attributable to AngloGold Ashanti’s percentage interest shown.
(2) “Tonnes” refers to a metric tonne which is equivalent to 1,000 kilograms.
(3) The Mineral Reserve contains 17.2Moz of silver for Cerro Vanguardia, 28.1Moz of silver for Quebradona and 3.3Moz of silver for North Bullfrog to be recovered as a by-product.
136
(4) The Mineral Reserve contains 0.23 million tonnes of sulphur to be recovered as a by-product for AGA Mineração - Cuiabá and Lamego, contingent upon the recommencement of operations at the
Queiroz plant.
(5)Operated by Barrick. AngloGold Ashanti has recognised that in preparing this information, the Qualified Persons have relied on information provided by Barrick. Open Pits and underground were based
on a gold price of $1,300/oz. In 2023, the Pamao pit shell and cut-off grade was determined based on a gold price of $1,700/oz, but financially evaluated and found to be profitable at a gold price of
$1,300/oz (supporting the 2023 Mineral Reserve declaration). This is exceptional and is driven by the need to create space for in pit tailings, further saving on capital costs. In 2023, an average cut-off
grade of 0.80g/t was applied to the open pit, a cut-off grade of 0.55g/t was applied to the stockpile, and a cut-off grade of 1.96g/t was applied to the underground. In 2023, a metallurgical recovery factor
range from 75.9% to 90.9% (varying according to area) was applied to the open pit and stockpile, and a metallurgical recovery factor of 90% was applied to the underground.
(6) Based on a gold price of $1,200/oz.
(7) Property currently in a development stage.
(8) Property currently in a production stage.
(9) The CdS operation was placed on care and maintenance in August 2023.
(10) In 2023, a cut-off grade range from 4.74g/t to 5.61g/t was applied to the underground (varying according to area). In 2023, a metallurgical recovery factor of 88% was applied to the underground.
(11)In 2023, a cut-off grade of 1.00g/t was applied to the open pit, a cut-off grade range from 0.70g/t to 0.80g/t (varying according to area) was applied to the stockpile, and a cut-off grade range from
2.05g/t to 2.87g/t (varying according to area) was applied to the underground. In 2023, a metallurgical recovery factor of 90.40% was applied to the open pit, a metallurgical recovery factor range from
91.07% to 91.63% (varying according to area) was applied to the stockpile, and a metallurgical recovery factor range from 76.40% to 92.30% (varying according to area) was applied to the
underground.
(12) Based on a gold price of AUD2,100/oz.
(13) A Mineral Reserve was declared for the first time at North Bullfrog as of 31 December 2023. Based on a gold price of $1,600/oz.
The below summary table is prepared in accordance with Table 2 to Paragraph (b) of Item 1303 of Regulation S-K - Summary Mineral Reserve for copper at the
end of the fiscal year ended 31 December 2023, based on an estimated copper price of $2.90/lb.
Mineral Reserve | At 31 December 2023 | |||||||||||
Proven | Probable | Total Mineral Reserve | ||||||||||
Copper | Tonnes (1) | Grade | Contained Copper | Tonnes (1) | Grade | Contained Copper | Tonnes (1) | Grade | Contained Copper | |||
Million | %Cu | Tonnes Million | Pounds Million | Million | %Cu | Tonnes Million | Pounds Million | Million | %Cu | Tonnes Million | Pounds Million | |
Americas Region | — | — | — | — | 120.01 | 1.23 | 1.47 | 3,250 | 120.01 | 1.23 | 1.47 | 3,250 |
Colombia | — | — | — | — | 120.01 | 1.23 | 1.47 | 3,250 | 120.01 | 1.23 | 1.47 | 3,250 |
Quebradona(2)(3) | — | — | — | — | 120.01 | 1.23 | 1.47 | 3,250 | 120.01 | 1.23 | 1.47 | 3,250 |
AngloGold Ashanti Total | — | — | — | — | 120.01 | 1.23 | 1.47 | 3,250 | 120.01 | 1.23 | 1.47 | 3,250 |
Notes:
Rounding of numbers may result in computational discrepancies in the Mineral Reserve tabulations. To reflect that figures are not precise calculations and that there is uncertainty in their estimation, AngloGold
Ashanti reports tonnage and grade to two decimals and content for copper with no decimals. “Mlb” refers to million pounds. The reference point for the Mineral Reserve is the point of delivery to the process
plant. The Mineral Reserve tonnages and grades are estimated and reported as delivered to plant (i.e., the point where material is delivered to the processing facility).
(1) “Tonnes” refers to a metric tonne which is equivalent to 1,000 kilograms.
(2) The Mineral Reserve contains 28.1Moz of silver to be recovered as a by-product.
(3) Property currently in a development stage.
137
BY-PRODUCTS
Several by-products are expected to be recovered as a result of processing of the gold Mineral Reserve and copper Mineral
Reserve. These include 0.23Mt of sulphur from Brazil, 17.16Moz of silver from Argentina, 28.10Moz of silver from Colombia and
3.34Moz of silver from Nevada, USA. Molybdenum, at present, is not planned for recovery at Quebradona. The Quebradona
process plant has been designed to treat underground ore and to produce copper concentrate with provision of space in the
plant site for a molybdenum plant in the future.
CORPORATE GOVERNANCE
AngloGold Ashanti has an established Mineral Resource and Mineral Reserve Leadership Team (“RRLT”) that is responsible for
setting and overseeing its Mineral Resource and Mineral Reserve group standard, and for ensuring that it meets the Company’s
goals and objectives while complying with all relevant regulatory codes.
AngloGold Ashanti makes use of a web-based group reporting database called the Resource and Reserve Reporting System
(“RCubed”) for the compilation and authorisation of Mineral Resource and Mineral Reserve reporting. It is a fully integrated
system for the reporting and reconciliation of Mineral Resource and Mineral Reserve that supports various regulatory reporting
requirements, including the SEC reporting requirements under Regulation S-K 1300. AngloGold Ashanti uses RCubed to ensure
a documented chain of responsibility exists from the technical experts at the operations to the Company’s RRLT.
The Investment Committee of the Company’s board of directors (“board”) reviews the Mineral Resource and Mineral Reserve
and makes a recommendation to the board, which provides the final approval for the publication of the Mineral Resource and
Mineral Reserve estimates. On 31 March 2024, the AngloGold Ashanti plc Investment Committee ceased to exist and, with effect
from 1 April 2024, its duties and responsibilities were assumed by the AngloGold Ashanti plc board.
AngloGold Ashanti has developed and implemented a rigorous system of internal and external reviews aimed at providing
assurance in respect of Mineral Resource and Mineral Reserve estimates. In 2023, the following operations and projects were
subject to an external review on the basis that each operation or project will be reviewed by an independent third-party on
average once every three years:
•Mineral Resource and Mineral Reserve at Siguiri;
•Mineral Reserve at North Bullfrog project.
No material risks were identified following completion of these external reviews. Certificates of sign-off were received for the
operations and projects audited to state that the applicable Mineral Resource and Mineral Reserve estimates are reported in
accordance with Regulation S-K 1300 as well as AngloGold Ashanti’s internal group standard and guidelines.
In addition, numerous internal Mineral Resource and Mineral Reserve process reviews were completed by suitably qualified
technical experts from within AngloGold Ashanti and no significant deficiencies were identified. The Mineral Resource and
Mineral Reserve governance framework is underpinned by appropriate Mineral Resource management processes and protocols
that ensure adequate corporate governance. These procedures have been developed to be compliant with the guiding principles
of the U.S. Sarbanes-Oxley Act of 2002 (“SOX”).
AngloGold Ashanti has also developed an enterprise-wide risk management tool that provides consistent and reliable data that
allows for visibility of risks and actions across the group. This tool is used to facilitate, control and monitor material risks to the
Mineral Resource and Mineral Reserve, thus ensuring that the appropriate risk management and mitigation plans are in place.
If the Qualified Persons or technical experts involved in the estimation of Mineral Resource or Mineral Reserve feel that their
technical advice has been ignored which may represent a risk to the Mineral Resource or Mineral Reserve to be published, they
are obliged to inform the RRLT in writing. In addition, AngloGold Ashanti’s “Speak-up” programme can also be used if the
Qualified Persons or technical experts deem they may be compromised in the process.
QUALIFIED PERSONS
The information in this annual report on Form 20-F relating to Mineral Resource and Mineral Reserve on AngloGold Ashanti’s
material properties is based on information compiled by, or under the supervision of, Qualified Persons, as defined in Regulation
S-K 1300. All Qualified Persons were employed by AngloGold Ashanti at the time of preparing the Technical Report Summaries
in respect of AngloGold Ashanti’s material properties filed as exhibits hereto. However, one of the Qualified Persons who
provided the information for the Technical Report Summary (effective date: 31 December 2021) in respect of Kibali is no longer
employed by AngloGold Ashanti and is currently employed by Barrick, which has a 45 percent interest in Kibali. Mr. Richard
Peattie has provided an updated consent to the use of his name, or any quotation from, or summarisation of, the Technical
Report Summary (effective date: 31 December 2021) prepared by him in this annual report on Form 20-F, and to the filing of the
Technical Report Summary (effective date: 31 December 2021) as an exhibit hereto. All Qualified Persons have sufficient
experience relevant to the style of mineralisation and the type of deposit under consideration, and relevant to the activity which
they are undertaking. AngloGold Ashanti has recognised that in preparing the information with respect to Kibali, the Qualified
Persons have relied on information provided by Barrick. The legal tenure of each material property has been verified to the
satisfaction of the accountable Qualified Person and all of the Mineral Reserve has been confirmed to be covered by the
required mining permits or there exists a realistic expectation that these permits will be issued. The Qualified Persons have
138
provided consent to the inclusion of the Mineral Resource and Mineral Reserve information in this annual report on Form 20-F, in
the form and context in which it appears, as well as the public filing of the Technical Report Summary for each respective
material mining property filed as exhibits hereto.
List of Qualified Persons
Responsibility | Qualified Person | Professional organisation | Membership number | Relevant experience | Qualification |
Kibali Mineral Resource | Richard Peattie (1) | FAusIMM | 301029 | 27 years | MPhil (Geostatistics) |
Kibali Mineral Reserve | Romulo Sanhueza | MAusIMM | 211794 | 26 years | BSc Eng (Mining) |
Obuasi Mineral Resource | Eric Kofi Owusu Acheampong | MAusIMM | 220644 | 26 years | MSc (Mineral Resource Evaluation), BSc (Geological Engineering) |
Obuasi Mineral Reserve | Douglas Atanga | MAusIMM | 334391 | 15 years | BSc (Mining Engineering) |
Geita Mineral Resource | Damon Elder | MAusIMM | 208240 | 27 years | BSc Hons (Geology) |
Geita Mineral Reserve | Duan Campbell | ECSA | 202101953 | 21 years | BEng (Mining) |
Merlin Mineral Resource | Jay Olcott | RM SME | 4173430 | 20 years | BSc (Geology) |
Notes:
All Qualified Persons were employed by AngloGold Ashanti at the time of preparing the Technical Report Summaries in respect of AngloGold Ashanti’s material
properties.
(1) The Qualified Person who provided the information for the Technical Report Summary (effective date: 31 December 2021) in respect of Kibali Mineral Resource is
no longer employed by AngloGold Ashanti and is currently employed by Barrick.
Accordingly, the Chairperson of the RRLT, Mrs. TM Flitton, Vice President Resource and Reserve, Master of Engineering
(Mining), Bachelor of Science (Honours, Geology), RM SME, Pr.Sci.Nat (SACNASP), FGSSA, assumes responsibility for the
Mineral Resource and Mineral Reserve processes for AngloGold Ashanti. Mrs. TM Flitton has 22 years’ experience in mining with
11 years directly leading and managing Mineral Resource and Mineral Reserve reporting. She is employed full-time by
AngloGold Ashanti and can be contacted at the following address: 112 Oxford Road, Houghton Estate, Johannesburg, 2198,
South Africa. Mrs. TM Flitton consents to the inclusion of the Mineral Resource and Mineral Reserve information in this annual
report, in the form and context in which it appears in the narrative disclosure and in the exhibits filed hereto.
GENERAL CONSIDERATIONS
The following considerations should be noted in respect of the information in this “Item 4D: Property, Plants and
Equipment”:
•All figures are expressed on an attributable basis unless otherwise indicated;
•All disclosure of Mineral Resource is exclusive of Mineral Reserve before dilution and other factors are applied;
•Unless otherwise stated, $ or dollar refers to U.S. dollars;
•Group and Company are used interchangeably;
•Mine, operation, business unit and property are used interchangeably;
•Rounding of numbers may result in computational discrepancies;
•To reflect that figures are not precise calculations and that there is uncertainty in their estimation, AngloGold Ashanti reports
tonnage, grade and content for gold to two decimals and content for copper with no decimals;
•Metric tonnes (t) are used throughout this annual report and all ounces are Troy ounces;
•Abbreviations used in this annual report include: gold– Au, copper – Cu, silver – Ag, Sulphur – S, molybdenum – Mo;
•Internal controls are discussed in the “—Corporate Governance” section above as well as in the “—Mineral Resource and
Mineral Reserve Internal Controls Disclosure” section below;
•Maps presented for material properties in this Item 4D show infrastructure, licences and coordinates of the property, as
represented by the plant (or stated otherwise), in the geographic coordinate system.
Refer to the “Glossary of selected terms—Mining terms” for terminology and definitions used in Mineral Resource and Mineral
Reserve reporting under Regulation S-K 1300. In addition, the Mineral Resource exclusive of Mineral Reserve is defined as the
inclusive Mineral Resource less the Mineral Reserve before dilution and other factors are applied. The exclusive Mineral
Resource consists of one or more of the following components:
•The open pit Mineral Resource between the Mineral Reserve open pit design shell and the Mineral Resource open pit shell
defined by the Mineral Resource criteria;
•The underground Mineral Resource that lies outside the underground mine design used to generate the Mineral Reserve but
within conceptual mineable stope shapes;
•Measured and Indicated Mineral Resource inside the Mineral Reserve open pit design that does not meet the Mineral
Reserve criteria and has not been incorporated as dilution within the Mineral Reserve;
139
•Inferred Mineral Resource inside the Mineral Reserve open pit design or underground mine design that has not been
incorporated as dilution within the Mineral Reserve;
•Mineral Resource for which technical studies to generate a Mineral Reserve have not yet been completed, or for which
economics support a Mineral Resource but do not meet Mineral Reserve criteria; and
•Stockpiles, or tailings dams, that contain mineralised material that qualifies as a Mineral Resource, but not as a Mineral
Reserve, to which Mineral Resource criteria and reasonable prospects for economic extraction principles have been applied.
All reports of Mineral Resource must satisfy the requirement that there are reasonable prospects for economic extraction,
regardless of the classification of the Mineral Resource. Portions of a deposit that do not have reasonable prospects for
economic extraction are not included in a Mineral Resource. The Mineral Resource is estimated using all relevant drilling and
sampling information along with a detailed geological model.
The geological models are based on combinations of core and/or chip logging, mapping, geophysics, geochemistry and
geological understanding and have been developed for each deposit. Most of our deposits have been the subject of research by
third-party specialists in the relevant class of deposit.
The grade estimation for each deposit has been developed over the life of the mine, and is constantly reviewed in terms of grade
control information and reconciliation with the metallurgical plant. In general, the open pits and shallow underground mines use
kriging with post processing by Uniform Conditioning (“UC”) or Localised Uniform Conditioning (“LUC”) to generate a recoverable
Mineral Resource model where appropriate.
In order to comply with the economic requirement of the definition of Mineral Resource, all our Mineral Resource is constrained
at an upside price, with all other parameters being kept the same as used for estimation of the Mineral Reserve. In the
underground mines, scoping studies are conducted on all coherent blocks of ground that lie above the calculated Mineral
Resource cut-off grade. These studies include all cost and capital requirements to access the block. In the case of open pit
operations, pit optimisations are conducted at the Mineral Resource price and all material outside these shells is excluded from
the Mineral Resource unless it is potentially mineable from underground.
It is the opinion of AngloGold Ashanti that the Mineral Resource represents a realistic view of an upside potential to the Mineral
Reserve. In interpreting the Mineral Resource it is critical to factor in the following:
•That there is a reasonable expectation of economic extraction;
•The Mineral Resource is quoted in situ and has not been corrected for dilution, mining losses or recovery; and
•Many of the areas lying in the exclusive Mineral Resource are currently being actively drilled and are the subject of economic
and technical studies. It can, however, not be assumed at this stage that the Company has intent to mine these areas.
The Inferred Mineral Resource category is intended to cover situations in which a mineral concentration or occurrence has been
identified and limited measurements and sampling have been completed, but in which the data are insufficient to allow the
geological or grade continuity to be interpreted with confidence. While it would be reasonable to expect that the majority of
Inferred Mineral Resource would upgrade to Indicated Mineral Resource with continued exploration, due to the uncertainty of
Inferred Mineral Resource, it should not be assumed that such upgrading will always occur.
In order to reduce this risk, AngloGold Ashanti limits the use of Inferred Mineral Resource in its Mineral Reserve estimation
process but the Inferred Mineral Resource is included in the pit shell or underground extraction shape determination. As such the
Inferred Mineral Resource may influence the extraction shape. The quoted Mineral Reserve from these volumes includes only
the converted Measured and Indicated Mineral Resource and no Inferred Mineral Resource is converted to Mineral Reserve. The
cash flow analysis does not include the Inferred Mineral Resource in demonstrating the economic viability of the Mineral
Reserve.
AngloGold Ashanti requires that the Mineral Reserve that is an outcome of this process is generated at a minimum of a pre-
feasibility study level that demonstrates the viability of the project and meets the Company’s investment requirements. This study
must be signed off at the appropriate executive level in order to demonstrate an intent on the part of the Company to proceed to
the feasibility study level.
MINERAL RESOURCE AND MINERAL RESERVE INTERNAL CONTROLS DISCLOSURE
AngloGold Ashanti has internal controls for documenting the information supporting the Mineral Resource and Mineral Reserve
estimates, describing the methods used, and ensuring the validity of the estimates. Information that is utilised to compile the
Mineral Resource and Mineral Reserve in this annual report is prepared and reviewed by the relevant Qualified Persons at each
property. The Company has a tiered internal review process whereby the Mineral Resource and Mineral Reserve is reviewed by
the relevant Qualified Persons at a regional and corporate level prior to publication. Each property has an external Mineral
Resource and Mineral Reserve audit on a three-year rolling basis, and matters raised during these audits are systematically
addressed through the submission of formal audit responses from each respective property. The progress in addressing these
issues is then meticulously monitored and tracked.
140
AngloGold Ashanti’s Mineral Reserve is an outcome of the Company’s business planning process which runs annually. This
process operates within a comprehensive framework where all inputs, including costs and capital requirements, are generated by
the operation, and reviewed at a regional and corporate level within the Company, thereby providing confidence in the estimates.
The Mineral Resource and Mineral Reserve Reporting group standard sets the minimum requirements that must be followed for
the public reporting of Mineral Resource and Mineral Reserve to ensure timely compliance with, and accountability to, the
relevant regulatory requirements. The RRLT updates the internal group standard and guidelines for the reporting of the Mineral
Resource and Mineral Reserve which provide direction and best practice for the reporting of the Mineral Resource and Mineral
Reserve to allow for consistency and transparency across the Company in the processes followed.
A group-wide Mineral Resource to production reconciliation system is also in place whereby the Mineral Resource mined each
month is reconciled all the way to the produced gold doré. Oversight for this process is handled at the group level. A
comprehensive sample and assay QA/QC process is in place, and our laboratories are inspected frequently by on-site teams.
141
ITEM 4A:UNRESOLVED STAFF COMMENTS
Not applicable.
142
ITEM 5: OPERATING AND FINANCIAL REVIEW AND PROSPECTS
The following discussion provides information that management believes is relevant to an assessment and understanding of the
consolidated financial condition and results of operations of AngloGold Ashanti plc under IFRS as at and for the three years
ended 31 December 2023, 2022 and 2021. Upon completion of the corporate restructuring in September 2023, AngloGold
Ashanti plc became the listed UK parent company of the Group and the successor issuer to AngloGold Ashanti Limited. See
“Presentation of information—Corporate restructuring” for additional information.
The financial results in this “Item 5: Operating and Financial Review and Prospects” have been restated for the two years in the
period ended 31 December 2022 due to certain errors. Certain other information has also been adjusted to reflect the effects of
the corporate restructuring. See “Presentation of information—Explanatory note” and “Item 18: Financial Statements—Note 1—
Statement of Compliance—1.3 Restatements” for further information on the restatements.
This item should be read in conjunction with the Company’s consolidated financial statements and the notes thereto which are
included under Item 18 of this annual report on Form 20-F.
Overview
AngloGold Ashanti is a global gold mining company. Upon completion of the corporate restructuring, the Group’s global
headquarters were moved to Denver, Colorado in the United States. The Company’s registered office and principal executive
office are located in the UK. The Group also retains a substantial corporate office in Johannesburg, South Africa. AngloGold
Ashanti’s main product is gold. For the year ended 31 December 2023, AngloGold Ashanti reported an attributable gold
production of approximately 2.29 million ounces from subsidiaries (of which 42,000 ounces from CdS) and 0.34 million ounces
from equity-accounted joint ventures. As part of extracting gold the Company also produces silver and sulphuric acid as by-
products. By-product revenue amounted to $102 million in 2023 (2022: $113 million; 2021: $126 million) out of total revenue from
product sales of $4,582 million in 2023 (2022: $4,501 million; 2021: $4,029 million). See “Item 18: Financial Statements—Note 3
—Revenue from Product Sales” for additional information. The Company sells its products on world markets.
AngloGold Ashanti has ten continuing mining operations in the following regions: Africa (the Democratic Republic of the Congo
(“DRC”), Ghana, Guinea, and Tanzania), Australia and the Americas (Argentina and Brazil) comprising open-pit and underground
mines, which are supported by global exploration activities. In addition, AngloGold Ashanti has greenfields projects located in
Colombia and Nevada, USA. In August 2023, AngloGold Ashanti placed its CdS operation on care and maintenance. On 18
September 2023, AngloGold Ashanti agreed to sell its entire 50% indirect interest in the Gramalote project to B2Gold Corp. for a
total consideration of up to $60 million. The transaction closed on 29 September 2023, and AngloGold Ashanti received a cash
payment of $20 million on 5 October 2023, with the balance dependent on project construction and production milestones that
the Gramalote project reaches. For more information on the Company’s business and operations, see “Item 4B: Business
Overview”.
Under the new Operating Model, the manner in which the financial results are reported to the chief operating decision maker and
the composition of the operating segments continue to be reported per geographical region (Africa, Australia and the Americas).
In addition, the Projects segment was introduced, which comprises all the major non-sustaining capital projects with the potential
to be developed into operating entities. AngloGold Ashanti’s segmental information is described in “Item 18: Financial Statements
—Note 2—Segmental Information”.
At 31 December 2023, the Company reported, on an attributable basis, Measured and Indicated Mineral Resource(1) for gold of
approximately 57.59 million ounces in subsidiaries and 2.33 million ounces in equity-accounted joint ventures. At 31 December
2023, the Company reported, on an attributable basis, Inferred Mineral Resource(1) for gold of approximately 45.63 million
ounces in subsidiaries and 0.79 million ounces in equity-accounted ventures. At 31 December 2023, the Company reported, on
an attributable basis, Proven and Probable Mineral Reserve for gold of approximately 23.41 million ounces in subsidiaries and
4.66 million ounces in equity-accounted joint ventures. At 31 December 2023, the Company reported, on an attributable basis,
Measured and Indicated Mineral Resource(1) for copper of 2,902 million pounds and Inferred Mineral Resource(1) for copper of
3,231 million pounds. At 31 December 2023, the Company reported, on an attributable basis, Probable Mineral Reserve for
copper of 3,250 million pounds. For further information on the Company’s Mineral Resource and Mineral Reserve, see “Item 4D:
Property, Plants and Equipment”.
AngloGold Ashanti’s costs and expenses consist primarily of total operating costs, amortisation, corporate administration, other
expenses, and exploration and evaluation costs. Total operating costs include operating costs (such as salaries and wages,
consumable stores, explosives, reagents, logistics, fuel, power, water, contractors’ costs, services and other charges) and
royalties paid. The Company’s mining operations consist of deep-level underground mines as well as open-pit operations, both of
which are labour intensive, therefore salaries and wages are a significant component of total operating costs.
(1) The Mineral Resource exclusive of Mineral Reserve is defined as the inclusive Mineral Resource less the Mineral Reserve before dilution and other factors are
applied. See “Item 4D: Property, Plants and Equipment”.
143
5A:OPERATING RESULTS
Introduction
Stock markets rebounded strongly in the fourth quarter of 2023 amid falling inflation levels in all major economies and the
signals from central banks that interest rates will start to fall in the first half of 2024. Commodities remained under pressure,
where crude oil fell over 16 percent in the fourth quarter of 2023 amid concerns over slowing global economy after historic
speed of interest rate hikes.
Total gold demand in 2023 (including over-the-counter (OTC) investment) was the highest on record and increased by three
percent to 4,899 tonnes due to significant OTC investment and stock flows.
Central banks net purchasing in the fourth quarter of 2023 was 229 tonnes with full year buying at 1,037 tonnes, falling just 45
tonnes short of the 2022 record.
In 2023, demand for gold in investment decreased 15 percent and annual bar and coin investment saw a decrease of three
percent year-on-year as divergent trends in key Western and Eastern markets offset one another. In 2023, gold jewellery
consumption held steady at 2,093 tonnes even in the high gold price environment.
Despite a recovery in the fourth quarter of 2023, annual demand for gold in technology in 2023 declined by four percent year-
on-year and electronics demand mirrored the four percent annual decline in the broader sector.
In 2023, annual mine production increased one percent year-on-year although this remains below the record high seen in
2018. Full year recycled gold supply increased by nine percent in 2023 and in the aggregate total supply of gold increased by
three percent year-on-year.
For the 2023 year, the average market spot gold price was $1,942 per ounce, gold income of the Company was $4,480 million
and the average gold price received by the Company was $1,928 per ounce. The market spot gold price increased by 13
percent over 2023, starting on 2 January 2023 at approximately $1,823 per ounce and ending on 29 December 2023 at
approximately $2,062 per ounce. Management uses the market spot gold price and the average gold price received to monitor
the performance of the gold price and its effect on the Company’s results. It gives an investor insight into the performance of
the gold price and its impact on company results.
144
Key factors affecting results
Gold prices
AngloGold Ashanti’s operating results are directly related to the market spot gold price, which can fluctuate widely and is
affected by numerous factors beyond its control, including investment, jewellery and industrial demand (particularly in China
and India), expectations with respect to the rate of inflation, the strength of the US dollar (the currency in which the price of
gold is generally quoted) and of other currencies, interest rates, actual or expected gold sales and purchases by central banks
and the International Monetary Fund (“IMF”), global or regional political or economic events or conditions, and production and
cost levels in major gold-producing regions.
The current demand for and supply of gold may affect gold prices, but not necessarily in the same manner as current supply
and demand affects the prices of other commodities. The supply of gold consists of a combination of new production and
fabricated gold held by governments, public and private financial institutions, industrial organisations and private individuals.
As the global gold production in any single year constitutes a small portion of the total potential supply of gold, short-term
variations in current production do not necessarily have a significant impact on the supply of gold or on its price.
The market for gold bullion bar, the Company’s primary product, is generally limited to the bullion banks. The number of these
banks has declined over the last decade. Additionally, due to the diversity and depth of the total gold market, the bullion banks
do not possess significant pricing power.
The price of gold is often subject to sharp, short-term changes. The shift in gold demand from physical demand to investment
and speculative demand may exacerbate the volatility of gold prices.
Yearly average market spot gold prices have changed during the three years under review as follows:
•2021 - $1,798 per ounce
•2022 - $1,802 per ounce
•2023 - $1,942 per ounce
Gold income of the Company has changed during the three years under review as follows:
•2021 - $3,903 million
•2022 - $4,388 million
•2023 - $4,480 million
Yearly average gold prices received by the Company have changed during the three years under review as follows:
•2021 - $1,796 per ounce
•2022 - $1,793 per ounce
•2023 - $1,928 per ounce
Gold income of the Company marginally increased by $92 million, or two percent, from $4,388 million in 2022 to $4,480 million
in 2023. The average gold price received by the Company increased by $135 per ounce, from $1,793 per ounce for the year
ended 31 December 2022 to $1,928 per ounce for the year ended 31 December 2023. The average market spot gold price
increased by $140 per ounce, from $1,802 per ounce for the year ended 31 December 2022 to $1,942 per ounce for the year
ended 31 December 2023.
The market spot gold price opened the year on 2 January 2023 at $1,823 per ounce (compared to $1,801 per ounce on 3
January 2022). The market spot gold price in 2023 has been subject to volatile short-term swings, with a year high of $2,077
per ounce on 27 December 2023 and a year low of $1,810 per ounce on 24 February 2023. The average market spot gold
price for 2023 was $1,942 per ounce. The market spot gold price at closing on 29 December 2023 was $2,062 per ounce
(compared to $1,824 per ounce on 30 December 2022). Between 1 January 2024 and 19 April 2024, the market spot gold
price traded between a low of $1,984 per ounce and a high of $2,432 per ounce. On 19 April 2024, the market spot gold price
was $2,400 per ounce.
If income from gold sales falls for an extended period below the Company’s total operating costs at its operations, AngloGold
Ashanti could determine that it is not economically feasible to continue production at some or all of its operations. Declining
gold prices may also force a reassessment of the feasibility of a particular exploration or development project or projects, and
could lead to the curtailment or suspension of such projects. A sustained decrease in gold prices may force the Company to
change its dividend payment policy, reduce expenditures and undertake measures to address its cost base. In addition, the
use of lower gold prices in Mineral Reserve and Mineral Resource estimates and life-of-mine plans could result in material
write downs of the Company’s investment in mining properties and increase amortisation, environmental rehabilitation and
mine closure charges.
During the first quarter of 2023, AngloGold Ashanti entered into zero-cost collars for a total of approximately 136,000 ounces of
gold for the period from February 2023 to December 2023 in order to manage gold price downside risk associated with Cuiabá
145
partially transitioning to gold concentrate sales and the high cost associated with CdS. During the second quarter of 2023,
AngloGold Ashanti entered into zero-cost collars for a total of approximately 47,000 ounces of gold for the period from January
2024 to June 2024. During the fourth quarter of 2023, AngloGold Ashanti entered into zero-cost collars for a total of
approximately 300,000 ounces of gold for the period from January 2024 to December 2024 in order to manage gold price
downside risk of the high costs associated with the Brazilian operations. For the year ended 31 December 2023, AngloGold
Ashanti recorded a realised gain of $2 million in respect of these gold derivatives. At 31 December 2023, the mark-to-market
value of the remaining open positions was an unrealised loss of $15 million.
Gold production levels
In addition to gold prices, AngloGold Ashanti’s gold income in any year is also influenced by its level of gold production. Gold
production levels are in turn influenced by grades, tonnages mined and processed through the plant, and metallurgical
recoveries. Attributable gold production (including joint ventures) fluctuated between 2021 to 2023, from 2.47 million ounces (of
which 78,000 ounces from CdS) in 2021 to 2.74 million ounces (of which 70,000 ounces from CdS) in 2022 to 2.63 million
ounces (of which 42,000 ounces from CdS) in 2023. In August 2023, AngloGold Ashanti placed its CdS operation on care and
maintenance. For more information on the Company’s business and operations, see “Item 4B: Business Overview”.
Public health crises, pandemics or epidemics
The COVID-19 pandemic resulted in disruption and volatility in global financial markets and capital markets and a significant
decrease in global economic activity, which had an adverse effect on worldwide demand for gold and adversely affected the
profitability of the Company’s operations. Further deterioration in economic conditions, as a result of a public health crisis,
pandemic or epidemic (including the COVID-19 pandemic) or otherwise, could lead to a further or prolonged decline in
demand for gold and negatively impact AngloGold Ashanti’s business, and any such negative impact may be material.
Geopolitical tensions
The geopolitical tensions and war between Russia and Ukraine and the retaliatory measures that have been taken, and could
be taken in the future, by the United States, the EU, the United Kingdom, NATO and other jurisdictions, as well as the more
recent conflict in the Middle East, have created global security concerns that could result in a regional or global conflict and
otherwise have a lasting impact on regional and global economies, any or all of which could adversely affect AngloGold
Ashanti’s business. See “Item 3D: Risk Factors—Global political and economic conditions could adversely affect the
profitability of operations”.
Climate change and other environmental factors
Rising temperatures, changing rainfall patterns, flooding, drought and severe weather conditions believed to be caused or
exacerbated by climate change remain growing concerns for businesses, investors, broader society and governments. This
has led to increased pressure on companies, including those in the mining sector, to reduce greenhouse gas (“GHG”)
emissions consistent with national commitments made by numerous countries under the Paris Agreement, to promote
responsible corporate practices, including with respect to the mitigation of climate-related risks, and to increase transparency
about the risks and opportunities of transitioning to a low-carbon economy. Pressure from governments, investors and broader
society for mining companies to improve environmental stewardship and, specifically, to reduce GHG emissions, both in terms
of absolute emissions and in intensity of emissions per tonne mined, is likely to increase in the future.
In 2021, AngloGold Ashanti committed to the International Council on Mining & Metals (“ICMM”) target of achieving net zero
Scope 1 and Scope 2 GHG emissions by 2050. Additionally, in partnership with value chain partners, AngloGold Ashanti
expects to continue to work on Scope 3 GHG emissions accounting and to explore opportunities, where feasible, to address
Scope 3 GHG emissions consistent with its commitment, as a member of the ICMM, to set Scope 3 GHG emissions reduction
targets. In 2022, AngloGold Ashanti announced a 2030 reduction target to achieve a 30% absolute reduction in its Scope 1
and 2 GHG emissions by 2030, as compared to 2021 GHG emissions, through a combination of renewable energy projects,
fleet electrification and lower-emission power sources, the capital cost for which is currently anticipated to be approximately
$1.1 billion (of which $350 million is expected to be funded over that period by AngloGold Ashanti and the remaining $750
million through third-party funding, including from providers of renewable energy infrastructure).
See “Item 3D: Risk Factors—Compliance with emerging climate change-related requirements, including stricter regulations
and the potential imposition of carbon taxes or greenhouse gas (“GHG”) emissions cap-and-trade schemes or the elimination
of related subsidies, could result in significant additional costs and expose AngloGold Ashanti to additional liabilities” and “Item
4B: Business Overview—Sustainability and Environmental, Social and Governance (“ESG”) Matters—Climate Change and
GHG Regulation”.
146
Foreign exchange fluctuations
Total operating costs in all business segments are partially incurred in local currency where the relevant operation is located.
US dollar denominated total operating costs and net income tend to be adversely impacted by local currency strength and
favourably impacted by local currency weakness, assuming there are no other offsetting factors. AngloGold Ashanti’s financial
results can be influenced significantly by the fluctuations in the exchange rate of the Brazilian real, the Australian dollar, and, to
a lesser extent, the Argentinean peso and other local currencies against the US dollar. As set out below, during the year ended
31 December 2023, the Brazilian real strengthened against the US dollar and the Australian dollar and Argentinean peso
weakened, which collectively had an unfavourable impact on AngloGold Ashanti’s US dollar denominated total operating costs.
Average annual exchange rates to the US dollar | 2023 | 2022 | 2021 | ||
Brazilian real | 5.00 | 5.16 | 5.40 | ||
Australian dollar | 1.51 | 1.44 | 1.33 | ||
Argentinean peso | 293.67 | 130.87 | 95.21 |
In 2023, the Company derived 48 percent (41 percent including joint ventures) of its revenues from Brazil, Australia and
Argentina, and incurred 48 percent (44 percent including joint ventures) of its total operating costs in Brazil, Australia and
Argentina. Based on average exchange rates in 2023, the Company estimates that an average one percent strengthening of
all of the Brazilian real, Argentinean peso, Australian dollar, Ghanaian cedi and the South African rand against the US dollar,
other factors remaining equal and excluding the effect of any foreign exchange hedging arrangements entered into by the
Company, would have resulted in an increase in cost of sales and total cash costs per ounce of approximately $17 million and
$7 per ounce, respectively.
Certain exchange controls were in force in emerging markets in which the Company operates during the period under review,
including, for example in Argentina. In the case of Argentina, although the exchange rate of the Argentinean peso is primarily
market determined, its value at any time may not be considered a true reflection of the underlying value while exchange
controls exist. It is not possible to predict whether or when the Argentinean government will relax exchange controls or the
future value of the Argentinean peso. See “Item 4B: Business Overview—The Regulatory Environment Enabling AngloGold
Ashanti To Mine—Americas—Argentina—Foreign exchange and export rules—Foreign exchange controls”.
Total operating costs and effects of inflation
Total operating costs include operating costs (such as salaries and wages, consumable stores, explosives, reagents, logistics,
fuel, power, water, contractors’ costs, services and other charges) and royalties paid. The mining industry continues to
experience price increases for costs of inputs used in the production of gold, which leads to higher total operating costs
reported by many gold producers.
AngloGold Ashanti is unable to control the prices at which it sells its gold. Accordingly, in the event of significant inflation in
Brazil, Argentina or Australia, without a concurrent devaluation of the local currency or an increase in the price of gold, there
could be a material adverse effect upon the Company’s results and financial condition. See “Item 3D: Risk Factors—Inflation
may have a material adverse effect on results of operations”.
At 31 December 2023, AngloGold Ashanti employs globally on average approximately 33,658 people, including contractors,
most of whom are members of trade unions, particularly in Africa and the Americas. Salaries and wages account for a
significant component of local total operating costs and are impacted by annual wage increases.
Energy costs, comprising power, fuel and lubricants, are another material component of total operating costs. Due to the
remote location of some of its mines in Africa, AngloGold Ashanti uses fuel to generate power and uses fuel and lubricants at
its mines to run its fleet and processing plants. The price of Brent Crude oil has increased from $71 per barrel in 2021 to $97
per barrel in 2022 and decreased to $84 per barrel in 2023, a $13, or an 18 percent per barrel increase over the three-year
period. AngloGold Ashanti estimates that for each $5.00 per barrel rise or fall in the oil price, other factors remaining equal and
excluding the effect of any oil hedging arrangements entered into by the Company, cost of sales and total cash costs per
ounce of all its operations change by approximately $3 million or $1.30 per ounce, respectively. During July 2022, AngloGold
Ashanti entered into forward contracts for a total of 999,000 barrels of Brent Crude oil for the period from January 2023 to
December 2023 that would be cash settled on a monthly basis against the contract price. This comprised approximately 40
percent of the Company’s total anticipated 2023 consumption. The average price achieved on the forward contracts was
$89.20 per barrel of Brent Crude oil. For the year ended 31 December 2023, AngloGold Ashanti recorded a realised loss of $7
million and a reversal of the prior year unrealised loss of $6 million in respect of these oil derivatives. There were no open
contracts at the end of December 2023. The cost of sales and total cash costs per ounce of certain of the Company’s mines,
particularly Siguiri, Geita, Iduapriem and Tropicana, which are more dependent on fuel, are most sensitive to changes in the
price of oil. During the year, as a result of geopolitical tensions, such as the war between Russia and Ukraine, and the more
recent conflict in the Middle East, the oil price has been volatile and, as of 19 April 2024, the price of oil was at $87 per barrel
147
of Brent Crude oil. See “Item 3D: Risk Factors—The profitability of mining companies’ operations and the cash flows
generated by these operations are significantly affected by fluctuations in input production prices, many of which are linked to
the prices of oil and steel”.
AngloGold Ashanti has no influence over the cost of most consumable stores. Furthermore, there has also been volatility in the
price of steel, used in the manufacture of most forms of fixed and mobile mining equipment, which is a relatively large
contributor to the operating costs and capital expenditure of a mine. Fluctuations in oil and steel prices as well as cost
increases in respect of labour, explosives, cyanide and other production inputs have a significant impact on operating costs
and capital expenditure.
Royalties paid (excluding joint ventures), which are generally calculated as a percentage of revenue, increased over the past
three years from $162 million in 2021 to $185 million in 2022 to $190 million in 2023, a 17 percent increase over the three-year
period, primarily due to the increase in the average gold price received per ounce, gold production and royalty rates. Royalties
are likely to continue to vary in the coming years due to the variations in the gold prices and the fact that in a number of
jurisdictions host governments increasingly seek to obtain a higher share of revenue by increasing the royalty rates for gold
mines.
Environmental rehabilitation costs
Total provisions for decommissioning and for environmental restoration activities (excluding joint ventures) totalled $673 million
in 2021, $578 million in 2022, and $625 million in 2023. During 2022, the provisions for decommissioning and restoration
decreased by $95 million mainly due to changes in estimates resulting from changes in discount rates, changes in global
economic assumptions, changes in mine plans resulting in a change in cash flows as well as changes in the designs for
closure of tailings storage facilities (“TSFs”). During 2023, the provisions for decommissioning and restoration increased by
$47 million largely due to the recognition of a change in estimates resulting from changes in discount rates, changes in global
economic assumptions, changes in mine plans resulting in a change in cash flows as well as changes in the designs for
closure of TSFs. See also “Item 4B: Business Overview—Regulatory Environment Enabling AngloGold Ashanti to Mine”, “Item
4B: Business Overview—Mine Site Rehabilitation and Closure” and “Item 4B: Business Overview—Sustainability and
Environmental, Social and Governance (“ESG”) Matters”.
Amortisation of assets
Amortisation of tangible assets increased during the 2021 to 2023 period by $166 million, or 40 percent, from $413 million in
2021 to $579 million in 2023, largely due to the Obuasi redevelopment project continuing to ramp up to full production and
higher deferred stripping at Iduapriem.
Amortisation of right of use assets increased during the 2021 to 2023 period by $15 million, or 24 percent, from $63 million in
2021 to $78 million in 2023, mainly due to additional lease contracts entered into at the Brazilian operations and at the Geita
mine.
Amortisation of intangible assets decreased during the 2021 to 2023 period by $2 million, or 67 percent, from $3 million in
2021 to $1 million in 2023.
Exploration and evaluation costs
The Company has expensed exploration expenditure during the years ended 31 December 2021, 2022 and 2023 in order to
replenish depleting Mineral Reserve and bring new ore bodies into pre-feasibility or feasibility. The expensed exploration costs
incurred over the last three fiscal years amounted to $164 million in 2021, $205 million in 2022 and $254 million in 2023.
Exploration expenditure increased during 2023 mainly due to an increase in greenfields exploration in Nevada, USA.
Corporate administration, marketing and related expenses
The corporate administration, marketing and related expenses incurred amounted to $73 million in 2021, $79 million in 2022
and $94 million in 2023. The year-on-year increase in 2023 of $15 million, or 19 percent, was mainly due to the allocation of
technical services costs to corporate costs following the implementation of the new Operating Model and an increase in audit
fees with the change to new auditors. This increase was partially offset by an overall average 13 percent weakening of local
currencies (in particular, the South African rand) against the US dollar.
Net impairment, derecognition of assets and profit (loss) on disposal
For all of the AngloGold Ashanti Group’s cash generating units (“CGUs”) where indicators of impairment or reversal of
impairment have been identified, the recoverable amounts of the CGUs were determined. With the exception of Serra Grande
and the Córrego do Sítio mining complex (“CdS”) in Brazil, as well as Gramalote in Colombia, the recoverable amounts
exceeded the carrying amounts of the CGUs, and management has considered the sensitivity of the impairment calculations to
148
various key inputs and assumptions such as the gold price and exchange rates and concluded that reasonably possible
changes to these key inputs and assumptions applied would not result in any impairment loss or the reversal of a previous
impairment loss to be recognised.
For a discussion of the Group’s impairment calculations, see “Item 18: Financial Statements—Note 12—Tangible Assets—Net
Impairment, Derecognition of Assets and Profit (Loss) on Disposal”.
Corporate restructuring costs
Corporate restructuring costs incurred over the last three fiscal years amounted to nil in 2021, an expense of $14 million in
2022 and an expense of $314 million in 2023. The significant increase during 2023 was largely due to taxes associated with
the corporate restructuring to reorganise the Group’s operations under a new parent company and other transaction costs.
Other (expenses) income
Other (expenses) income incurred over the last three fiscal years amounted to an expense of $136 million in 2021, an expense
of $12 million in 2022 and an expense of $104 million in 2023. The significant increase during 2023 compared to 2022 was
largely due to an increase in the care and maintenance cost of $52 million (mainly relating to the CdS and Cuiabá mines), an
increase in environmental provisions for legacy TSFs of $51 million (mainly as a result of new legislation in Brazil relating to
emergency response and safety management for TSFs) and an increase in retrenchment and related costs of $15 million
(mainly in Brazil), partially offset by other movements of $26 million (mainly relating to deferred stripping and an insurance
claim at Siguiri).
Taxation
Taxation decreased over the period 2021 to 2023 from an expense of $311 million in 2021 to an expense of $285 million in
2023. The decrease in taxation over the period 2021 to 2023 was largely due to lower profit before taxation in Brazil and higher
capital allowances on capital expenditure in Tanzania. This decrease was partially offset by an increase in deferred tax which
was mainly due to higher deferred tax liabilities and lower deferred tax assets raised on tax losses in Ghana.
Taxation is likely to continue to be volatile in the coming years, due to fluctuations in gold price and gold production.
Comparison of gold production in 2023 with 2022
In 2023, gold production of subsidiaries (on an attributable basis) was 2,292,000 ounces (of which 42,000 ounces from CdS), a
decrease of 113,000 ounces, or five percent, compared with gold production of 2,405,000 ounces (of which 70,000 ounces
from CdS) in 2022. Gold production was lower year-on-year mainly due to lower ore tonnes processed and lower recovered
grades. Excluding CdS, gold production of subsidiaries (on an attributable basis) decreased by 85,000 ounces, or four percent,
from 2,335,000 ounces in 2022 to 2,250,000 ounces in 2023.
In 2023, gold production of joint ventures (on an attributable basis) was 343,000 ounces, a marginal increase of 6,000 ounces,
or two percent, compared with gold production of 337,000 ounces in 2022. Gold production was marginally higher year-on-
year mainly due to higher ore tonnes processed, partially offset by lower grades mined. The Kibali mine in the DRC was the
only operating asset that was a joint venture in 2023.
In the Africa region – subsidiaries, gold production (on an attributable basis) decreased by 100,000 ounces, or eight percent,
from 1,298,000 ounces in 2022 to 1,198,000 ounces in 2023. This decrease was mainly due to lower gold production from
Siguiri, Geita and Obuasi, partially offset by higher gold production from Iduapriem. Gold production at Iduapriem increased by
20,000 ounces, or eight percent, from 248,000 ounces in 2022 to 268,000 ounces in 2023. Gold production was higher year-
on-year mainly due to higher grades mined as the mine accessed higher grade ore tonnes from Teberebie Cut 2 compared to
2022, partially offset by lower ore tonnes processed as the site commissioned the new TSF. Gold production at Obuasi
decreased by 26,000 ounces, or ten percent, from 250,000 ounces in 2022 to 224,000 ounces in 2023. Gold production was
lower year-on-year mainly due to lower grades mined and poor ground conditions in some of the higher-grade stopes, partially
offset by higher ore tonnes processed. Obuasi is currently undertaking a trial of the underhand cut and fill mining method in
high-grade areas. This is a more selective mining method suited to challenging ground conditions often associated with higher
grades. Gold production at Siguiri (on an attributable basis) decreased by 58,000 ounces, or 21 percent, from 279,000 ounces
in 2022 to 221,000 ounces in 2023. Gold production was lower year-on-year mainly due to lower ore tonnes processed due to
the CIL tank failure during the second quarter of 2023, which impacted metallurgical recoveries, and lower grades mined. Gold
production was further adversely impacted by community protests in relation to additional employment opportunities. These
protests have since subsided. Gold production at Geita decreased by 36,000 ounces, or seven percent, from 521,000 ounces
in 2022 to 485,000 ounces in 2023. Gold production was lower year-on-year mainly due to lower ore tonnes processed on the
back of a planned mill shutdown in the first half of 2023 and lower grades mined.
149
In the Africa region – joint ventures, gold production at Kibali (on an attributable basis) marginally increased by 6,000 ounces,
or two percent, from 337,000 ounces in 2022 to 343,000 ounces in 2023. Gold production was marginally higher year-on-year
mainly due to higher ore tonnes processed, partially offset by lower grades mined.
In the Americas region, gold production (on an attributable basis) decreased by 37,000 ounces, or seven percent, from
569,000 ounces (of which 70,000 ounces from CdS) in 2022 to 532,000 ounces (of which 42,000 ounces from CdS) in 2023.
This decrease was mainly due to lower gold production from Cerro Vanguardia, AGA Mineração and Serra Grande. Excluding
CdS, gold production in the Americas region (on an attributable basis) marginally decreased by 9,000 ounces, or two percent,
from 499,000 ounces in 2022 to 490,000 ounces in 2023. Gold production at AGA Mineração decreased by 17,000 ounces, or
five percent, from 311,000 ounces (of which 70,000 ounces from CdS) in 2022 to 294,000 ounces (of which 42,000 ounces
from CdS) in 2023. Gold production was lower year-on-year mainly due to lower ore tonnes processed and the CdS mine
being placed on care and maintenance in August 2023, partially offset by higher recovered grades at the Cuiabá mine. During
2023, Cuiabá produced 252,000 ounces, which comprised 83,000 ounces of gravimetric gold and 169,000 ounces of gold-in-
concentrate. Excluding CdS, gold production at AGA Mineração increased by 11,000 ounces, or five percent, from 241,000
ounces in 2022 to 252,000 ounces in 2023. Gold production at Serra Grande marginally decreased by 2,000 ounces, or two
percent, from 88,000 ounces in 2022 to 86,000 ounces in 2023. Gold production was marginally lower year-on-year mainly due
to lower ore tonnes processed, partially offset by higher recovered grades. Gold production at Cerro Vanguardia (on an
attributable basis) decreased by 18,000 ounces, or 11 percent, from 170,000 ounces in 2022 to 152,000 ounces in 2023. Gold
production was lower year-on-year mainly due to a combination of lower ore tonnes processed and lower grades mined.
In the Australia region, gold production (on an attributable basis) increased by 24,000 ounces, or four percent, from 538,000
ounces in 2022 to 562,000 ounces in 2023. This increase was mainly due to higher gold production from Sunrise Dam and
Tropicana. Gold production at Sunrise Dam increased by 20,000 ounces, or nine percent, from 232,000 ounces in 2022 to
252,000 ounces in 2023. Gold production was higher year-on-year mainly due to higher grades mined, partially offset by lower
ore tonnes processed. Gold production at Tropicana (on an attributable basis) marginally increased by 4,000 ounces, or one
percent, from 306,000 ounces in 2022 to 310,000 ounces in 2023. Gold production was marginally higher year-on-year mainly
due to higher grades mined, partially offset by lower ore tonnes processed.
Comparison of gold production in 2022 with 2021
In 2022, gold production of subsidiaries (on an attributable basis) was 2,405,000 ounces (of which 70,000 ounces from CdS),
an increase of 298,000 ounces, or 14 percent, compared with gold production of 2,107,000 ounces (of which 78,000 ounces
from CdS) in 2021. Gold production was higher year-on-year mainly due to a ten percent increase in recovered grades and the
resumption of stoping activities at Obuasi during 2022, following the temporary suspension of underground stoping activities in
2021 following a sill pillar incident in May 2021. The improving grade profile following the reinvestment programme across the
portfolio was a key driver of the overall gold production increase. For 2022, COVID-19 had a marginal estimated direct impact
of 19,000 ounces on the Company’s gold production. By comparison, for 2021, the direct impact of COVID-19 on the
Company’s gold production was estimated at 47,000 ounces. Excluding CdS, gold production of subsidiaries (on an
attributable basis) increased by 306,000 ounces, or 15 percent, from 2,029,000 ounces in 2021 to 2,335,000 ounces in 2022.
In 2022, gold production of joint ventures (on an attributable basis) was 337,000 ounces, a decrease of 28,000 ounces, or
eight percent, compared with gold production of 365,000 ounces in 2021. Gold production was lower year-on-year mainly due
to lower grades recovered, partially offset by a marginal increase in ore volumes processed. The Kibali mine in the DRC was
the only operating asset that was a joint venture in 2022.
In the Africa region – subsidiaries, gold production (on an attributable basis) increased by 244,000 ounces, or 23 percent, from
1,054,000 ounces in 2021 to 1,298,000 ounces in 2022. This increase was mainly due to higher gold production from Obuasi,
Iduapriem, Siguiri and Geita. Gold production at Iduapriem increased by 46,000 ounces, or 23 percent, from 202,000 ounces
in 2021 to 248,000 ounces in 2022. Gold production was higher year-on-year mainly due to higher ore volumes processed,
further supported by higher grades recovered as the mine accesses ore tonnes from Block 5 and Teberebie Cut 2a compared
to Block 5 and the drawdown from stockpiles in 2021. Gold production at Obuasi increased by 142,000 ounces, or 131
percent, from 108,000 ounces in 2021 to 250,000 ounces in 2022. Gold production was higher year-on-year mainly due to the
resumption of stoping activities during 2022 following the temporary suspension of underground stoping activities in 2021
following a sill pillar incident in May 2021, as well as the continued ramp-up of the operations. Gold production at Siguiri (on an
attributable basis) increased by 21,000 ounces, or eight percent, from 258,000 ounces in 2021 to 279,000 ounces in 2022.
Gold production was higher year-on-year mainly due to higher recovered grades, partially offset by lower ore volumes
processed (as a result of local community protests related to employment demands which led to mining disruptions and the
temporary suspension of mining activities during the month of July 2022). Gold production at Geita increased by 35,000
ounces, or seven percent, from 486,000 ounces in 2021 to 521,000 ounces in 2022. Gold production was higher year-on-year
mainly due to higher ore volumes processed as well as higher recovered grades.
In the Africa region – joint ventures, gold production at Kibali (on an attributable basis) decreased by 28,000 ounces, or eight
percent, from 365,000 ounces in 2021 to 337,000 ounces in 2022. Gold production was lower year-on-year mainly due to
lower grades recovered, partially offset by a marginal increase in ore volumes processed.
150
In the Americas region, gold production (on an attributable basis) marginally increased by 10,000 ounces, or two percent, from
559,000 ounces (of which 78,000 ounces from CdS) in 2021 to 569,000 ounces (of which 70,000 ounces from CdS) in 2022.
This marginal increase was mainly due to higher gold production from Serra Grande and Cerro Vanguardia, partially offset by
lower gold production from AGA Mineração. Excluding CdS, gold production in the Americas region (on an attributable basis)
increased by 18,000 ounces, or four percent, from 481,000 ounces in 2021 to 499,000 ounces in 2022. Gold production at
AGA Mineração decreased by 20,000 ounces, or six percent, from 331,000 ounces (of which 78,000 ounces from CdS) in
2021 to 311,000 ounces (of which 70,000 ounces from CdS) in 2022. Gold production was lower year-on-year mainly due to
lower ore volumes processed, partially offset by higher grades recovered. In addition, extreme weather, including heavy rainfall
and widespread flooding in the state of Minas Gerais in Brazil in January 2022, negatively impacted gold production. More
than 100 municipalities declared an emergency, thousands of people were forced out of their homes and evacuated from the
affected areas, and more than 120 roads were blocked. The impacts were particularly severe in several of the cities where
AngloGold Ashanti operates and where its employees reside, which resulted in the operations at CdS being temporarily
partially stopped. Excluding CdS, gold production at AGA Mineração decreased by 12,000 ounces, or five percent, from
253,000 ounces in 2021 to 241,000 ounces in 2022. Gold production at Serra Grande increased by 5,000 ounces, or six
percent, from 83,000 ounces in 2021 to 88,000 ounces in 2022. Gold production was higher year-on-year mainly due to higher
recovered grades resulting from changes to the geological model, partially offset by lower ore volumes processed. Gold
production during 2021 was negatively impacted by COVID-19 related restrictions and stabilisation challenges during the
conversion of the TSFs to dry-stacking operations to comply with legal requirements in Brazil, which were not repeated in
2022. Gold production at Cerro Vanguardia (on an attributable basis) increased by 25,000 ounces, or 17 percent, from 145,000
ounces in 2021 to 170,000 ounces in 2022. Gold production was higher year-on-year mainly due to a combination of higher
ore volumes processed, higher recovered grades and fewer COVID-19 related limitations and restrictions that affected the
mine’s ability to operate at full capacity.
In the Australia region, gold production (on an attributable basis) increased by 44,000 ounces, or nine percent, from 494,000
ounces in 2021 to 538,000 ounces in 2022. This increase was mainly due to higher gold production from Sunrise Dam and
Tropicana. Gold production at Sunrise Dam marginally increased by 3,000 ounces, or one percent, from 229,000 ounces in
2021 to 232,000 ounces in 2022. Gold production was marginally higher year-on-year mainly due to higher recovered grades,
partially offset by lower ore volumes processed following COVID-19 related production challenges. Gold production at
Tropicana (on an attributable basis) increased by 41,000 ounces, or 15 percent, from 265,000 ounces in 2021 to 306,000
ounces in 2022. Gold production was higher year-on-year mainly due to a combination of higher ore volumes processed from
the Boston Shaker open pit and underground mine and higher recovered grades as well as the adverse impact of the wall
failure in the Boston Shaker open pit in June 2021, which delayed higher grade ore delivery, and which was not repeated
during 2022.
Comparison of financial performance in 2023, 2022 and 2021
Financial performance of AngloGold Ashanti | Year ended 31 December | ||||
(in $ millions) | 2023 | 2022 | 2021 | ||
Restated | Restated | ||||
Revenue from product sales | 4,582 | 4,501 | 4,029 | ||
Cost of sales | (3,541) | (3,366) | (2,859) | ||
Total of all other (expenses) income | (1,185) | (824) | (466) | ||
Share of associates and joint ventures’ profit (loss) | 207 | 161 | 245 | ||
Taxation | (285) | (221) | (311) | ||
Profit (loss) for the period | (222) | 251 | 638 | ||
Net profit (loss) attributable to equity shareholders | (235) | 233 | 614 | ||
Net profit (loss) attributable to non-controlling interests | 13 | 18 | 24 | ||
151
Comparison of total cost of sales in 2023, 2022 and 2021
The following table presents cost of sales for the AngloGold Ashanti Group for the three-year period ended 31 December 2023:
Cost of sales for AngloGold Ashanti | Year ended 31 December | ||||
(in $ millions) | 2023 | 2022 | 2021 | ||
Restated | Restated | ||||
Total cost of sales | 3,541 | 3,366 | 2,859 | ||
Inventory change | 12 | 30 | (6) | ||
Amortisation of tangible assets | (579) | (555) | (413) | ||
Amortisation of intangible assets | (1) | (1) | (3) | ||
Amortisation of right of use assets | (78) | (81) | (63) | ||
Retrenchment costs | (4) | (6) | (2) | ||
Environmental rehabilitation and other non-cash costs | (21) | — | (38) | ||
Total operating costs | 2,870 | 2,753 | 2,334 | ||
Comparison of financial performance in 2023 with 2022
Our gold income is materially impacted by price and volume variances. All of our costs are impacted by the consequences of
average exchange rate movements.
Exchange fluctuations in, and the average exchange rates for, the Brazilian real, Australian dollar, Argentinean peso and other
local currencies have effects on the various components that make up our costs based on the level of local procurement of
each of these costs. For a discussion of the effect of foreign exchange fluctuations on our financial results, see “Item 5A:
Operating Results—Key factors affecting results—Foreign exchange fluctuations”.
Revenue from product sales
Revenue from product sales (excluding equity-accounted joint ventures) marginally increased by $81 million, or two percent,
from $4,501 million in 2022 to $4,582 million in 2023, mainly as a result of an increase in gold income, partially offset by a
decrease in by-product revenue. Gold income (excluding equity-accounted joint ventures) marginally increased by $92 million,
or two percent, from $4,388 million in 2022 to $4,480 million in 2023. This marginal increase was mainly due to an increase in
the average gold price received per ounce, partially offset by a decrease in ounces of gold sold. The average gold price
received per ounce increased by $135 per ounce, from $1,793 per ounce during 2022 to $1,928 per ounce in 2023, which
resulted in an increase in gold income of $318 million. Gold sold decreased by 112,000 ounces, or five percent, from
2,385,000 ounces in 2022 to 2,273,000 ounces in 2023, which resulted in a decrease in gold income of $226 million. By-
product revenue (excluding equity-accounted joint ventures) decreased by $11 million, or ten percent, from $113 million in
2022 to $102 million in 2023, mainly due to a decrease in revenue from sulphuric acid.
Revenue from product sales from the Africa operations (excluding equity-accounted joint ventures) marginally increased by
$15 million, or one percent, from $2,388 million in 2022 to $2,403 million in 2023, mainly as a result of an increase in gold
income. Gold income (excluding equity-accounted joint ventures) marginally increased by $15 million, or one percent, from
$2,385 million in 2022 to $2,400 million in 2023. This marginal increase was mainly due to an increase in the average gold
price received per ounce, partially offset by lower ounces of gold sold. The increase in the average gold price received per
ounce of $135 per ounce resulted in an increase in gold income of $189 million. Gold sold decreased by 87,000 ounces, or
seven percent, from 1,281,000 ounces in 2022 to 1,194,000 ounces in 2023, which resulted in a decrease in gold income of
$174 million. Except for Iduapriem, there was a decrease in gold production across all Africa operations in 2023 when
compared to 2022. For a discussion of the decrease in gold production at the Africa operations during 2023, see “Item 5A:
Operating Results—Key factors affecting results—Comparison of gold production in 2023 with 2022”. By-product revenue
(excluding equity-accounted joint ventures) of $3 million in 2023 remained unchanged from $3 million in 2022.
Revenue from product sales from the Americas operations decreased by $48 million, or four percent, from $1,142 million in
2022 to $1,094 million in 2023, mainly as a result of a decrease in gold income and by-product revenue. Gold income
decreased by $37 million, or four percent, from $1,036 million in 2022 to $999 million in 2023. This decrease was mainly due
to lower ounces of gold sold, partially offset by an increase in the average gold price received per ounce. Gold sold decreased
by 43,000 ounces, or eight percent, from 565,000 ounces in 2022 to 522,000 ounces in 2023, which resulted in a decrease in
gold income of $79 million. There was a decrease in gold production at Cerro Vanguardia and Serra Grande, partially offset by
an increase in gold production at AngloGold Ashanti Mineração. For a discussion of the decrease in gold production at the
Americas operations during 2023, see “Item 5A: Operating Results—Key factors affecting results—Comparison of gold
production in 2023 with 2022”. The increase in the average gold price received per ounce of $135 per ounce resulted in an
152
increase in gold income of $42 million. By-product revenue decreased by $11 million, or ten percent, from $106 million in 2022
to $95 million in 2023, mainly due to a decrease in sulphuric acid revenue from lower sulphuric acid production in Brazil.
Revenue from product sales from the Australia operations increased by $114 million, or 12 percent, from $971 million in 2022
to $1,085 million in 2023, mainly as a result of an increase in gold income. Gold income increased by $114 million, or 12
percent, from $967 million in 2022 to $1,081 million in 2023. This increase was mainly due to an increase in the average gold
price received per ounce and higher ounces of gold sold. The increase in the average gold price received per ounce of $135
per ounce resulted in an increase in gold income of $82 million. Gold sold increased by 18,000 ounces, or three percent, from
539,000 ounces in 2022 to 557,000 ounces in 2023, which resulted in an increase in gold income of $32 million. There was an
increase in gold production at Tropicana and at Sunrise Dam. For a discussion of the increase in gold production at the
Australia operations during 2023, see “Item 5A: Operating Results—Key factors affecting results—Comparison of gold
production in 2023 with 2022”. By-product revenue of $4 million in 2023 remained unchanged from $4 million in 2022.
Cost of sales
Cost of sales increased by $175 million, or five percent, from $3,366 million in 2022 to $3,541 million in 2023. This increase
was primarily due to an increase in operating costs of $112 million, or four percent, from $2,568 million in 2022 to $2,680
million in 2023, an increase in amortisation of tangible assets by $24 million, or four percent, from $555 million in 2022 to $579
million in 2023, an increase in environmental rehabilitation and other non-cash costs by $21 million, from nil in 2022 to $21
million in 2023, an inventory change of $18 million, or 60 percent, from a credit of $30 million in 2022 to a credit of $12 million
in 2023 and an increase in royalties paid by $5 million, or three percent, from $185 million in 2022 to $190 million in 2023. This
increase was partially offset by a decrease in amortisation of right of use assets by $3 million, or four percent, from $81 million
in 2022 to $78 million in 2023 and a decrease in retrenchment costs by $2 million, or 33 percent, from $6 million in 2022 to $4
million in 2023.
For a discussion of cost of sales on a segment basis during 2023, see “Item 5A: Operating Results—Comparison of operating
performance on a segment basis in 2023 with 2022—Cost of sales”.
Total operating costs
Total operating costs increased by $117 million, or four percent, from $2,753 million in 2022 to $2,870 million in 2023. This
increase was primarily due to an increase in operating costs and royalties paid. Total operating costs include operating costs
(such as salaries and wages, consumable stores, explosives, reagents, logistics, fuel, power, water, contractors’ costs,
services and other charges) and royalties paid.
Operating costs increased by $112 million, or four percent, from $2,568 million in 2022 to $2,680 million in 2023, primarily due
to higher labour and contractors’ costs, commodity prices, logistics costs, consumable stores, services and other charges,
partially offset by lower fuel costs. The strengthening of the Brazilian real against the US dollar contributed to the increase in
operating costs, which was partially offset by the weakening of local currencies against the US dollar in Australia and
Argentina.
Royalties paid, which are generally calculated as a percentage of revenue, increased by $5 million, or three percent, from
$185 million in 2022 to $190 million in 2023. This increase was primarily due to an increase in the average gold price received
per ounce, partially offset by a decrease in gold sales across all mining operations with the exception of Iduapriem and Sunrise
Dam.
Retrenchment costs
Retrenchment costs included in cost of sales decreased by $2 million, or 33 percent, from $6 million in 2022 to $4 million in
2023.
Environmental rehabilitation and other non-cash costs
Environmental rehabilitation and other non-cash costs increased by $21 million, from nil in 2022 to $21 million in 2023. This
increase was mainly due to the recognition of changes in estimates resulting from changes in discount rates, changes in global
economic assumptions, changes in mine plans resulting in a change in cash flows as well as changes in the designs for
closure of TSFs.
Amortisation of tangible, intangible and right of use assets
Amortisation of tangible, intangible and right of use assets expense increased by $21 million, or three percent, from $637
million in 2022 to $658 million in 2023.
153
Amortisation of tangible assets increased by $24 million, or four percent, from $555 million in 2022 to $579 million in 2023.
This increase was mainly due to higher amortisation at Iduapriem (mainly due to higher gold production combined with higher
deferred stripping amortisation at Teberebie Cut 2c which commenced in 2023) and at Obuasi (mainly due to the mining fleet
and Mineral Reserve development amortisation as the assets were transferred from being under construction to Mineral
Reserve development assets in 2023 and the Obuasi redevelopment project continuing to ramp up to full production), partially
offset by lower amortisation at Siguiri (mainly due to lower gold production), at Geita (mainly due to lower Mineral Reserve
development amortisation as a result of the implementation of a Full Asset Potential initiative), at Serra Grande (mainly due to
lower gold production) and at CdS (mainly due to reduction in asset cost due to the impairment that occurred during 2022 and
2023).
Amortisation of intangible assets of $1 million in 2023 remain unchanged from $1 million in 2022.
Amortisation of right of use assets decreased by $3 million, or four percent, from $81 million in 2022 to $78 million in 2023.
This decrease was mainly due to lower amortisation at AGA Mineração mainly due to the impact of impairments that occurred
during 2022 and 2023.
Inventory change
Inventory change was a credit of $30 million in 2022, compared to a credit of $12 million in 2023, which represents a change of
$18 million. This change was primarily due to the lower unsold gold and gold processed volumes at all operations except
Tropicana. This was further impacted by an increase in the cost of inventory due to higher gold production costs.
Net impairment, derecognition of assets and profit (loss) on disposal
Net impairment, derecognition of assets and profit (loss) on disposal was a loss of $315 million in 2022 as compared to a loss
of $221 million in 2023, which represents a change of $94 million. Net impairment, derecognition of assets and profit (loss) on
disposal in 2023 was mainly due to the impairment of the CdS mining complex of $47 million (gross of taxation), the
impairment of Serra Grande of $105 million (gross of taxation), the net impairment of Cuiabá of $15 million (gross of taxation),
the impairment of Gramalote of $25 million (gross of taxation) and loss on asset derecognitions in Brazil of $40 million during
2023, partially offset by profit on asset derecognitions in Siguiri of $5 million and profit on disposal of properties held in Brazil
of $6 million during 2023. For further information on the impairment losses in Brazil during 2023, refer to “Item 18: Financial
Statements—Note 12—Tangible Assets—Net Impairment, Derecognition of Assets and Profit (Loss) on Disposal”.
Corporate restructuring costs
Corporate restructuring costs increased by $300 million, from $14 million in 2022 to $314 million in 2023. The significant
increase during 2023 was largely due to taxes associated with the corporate restructuring to reorganise the Group’s operations
under a new parent company and other transaction costs.
Other (expenses) income
Other (expenses) income increased by $92 million, from an expense of $12 million in 2022 to an expense of $104 million in
2022. The significant increase during 2023 compared to 2022 was largely due to an increase in the care and maintenance cost
of $52 million (mainly relating to the CdS mine and the Queiroz metallurgical plant), an increase in environmental provisions for
legacy TSFs of $51 million (mainly as a result of new legislation in Brazil relating to emergency response and safety
management for TSFs) and an increase in retrenchment and related costs of $15 million (mainly in Brazil), partially offset by
other movements of $26 million (mainly relating to deferred stripping and an insurance claim at Siguiri).
Finance costs and unwinding of obligations
Finance costs increased by $12 million, or ten percent, from $119 million in 2022 to $131 million in 2023, mainly due to higher
finance costs from borrowings compared to 2022. Unwinding of obligations decreased by $4 million, or 13 percent, from $30
million in 2022 to $26 million in 2023, mainly due to the unwinding of long-term receivables reclassified to finance income in
2023, partially offset by higher unwinding on the environmental rehabilitation provisions.
Share of associates and joint ventures’ profit
Share of associates and joint ventures’ profit increased by $46 million, or 29 percent, from a profit of $161 million in 2022 to a
profit of $207 million in 2023, mainly as a result of an increase in equity earnings of $42 million at Kibali due to higher revenues
and $4 million at Rand Refinery (Pty) Limited.
154
Taxation
A taxation expense of $285 million was recorded in 2023, compared to a taxation expense of $221 million in 2022, which
represents a $64 million, or 29 percent, increase. Current tax in 2023 amounted to an expense of $217 million, compared to an
expense of $231 million in 2022, which represents a $14 million, or six percent, decrease. The decrease in current tax was
mainly due to higher capital allowances on capital expenditure in Tanzania. Deferred tax in 2023 amounted to an expense of
$68 million, compared to a deferred tax credit of $10 million in 2022, which represents a $78 million increase. The increase in
deferred tax was mainly due to higher deferred tax liabilities and lower deferred tax assets raised on tax losses in Ghana.
Comparison of financial performance in 2022 with 2021
Our gold income is materially impacted by price and volume variances. All of our costs are impacted by the consequences of
average exchange rate movements.
Exchange fluctuations in, and the average exchange rates for, the Brazilian real, Australian dollar and, to a lesser extent, the
Argentinean peso and other local currencies have effects on the various components that make up our costs based on the
level of local procurement of each of these costs. For a discussion of the effect of foreign exchange fluctuations on our
financial results, see “Item 5A: Operating Results—Key factors affecting results—Foreign exchange fluctuations”.
Revenue from product sales
Revenue from product sales (excluding equity-accounted joint ventures) increased by $472 million, or 12 percent, from $4,029
million in 2021 to $4,501 million in 2022, mainly as a result of an increase in gold income, partially offset by a decrease in by-
product revenue. Gold income (excluding equity-accounted joint ventures) increased by $485 million, or 12 percent, from
$3,903 million in 2021 to $4,388 million in 2022. This increase was mainly due to an increase in ounces of gold sold, partially
offset by a decrease in the average gold price received per ounce. Gold sold increased by 269,000 ounces, or 13 percent,
from 2,116,000 ounces in 2021 to 2,385,000 ounces in 2022, which resulted in an increase in gold income of $491 million. The
average gold price received per ounce decreased by $3 per ounce, from $1,796 per ounce during 2021 to $1,793 per ounce in
2022, which resulted in a decrease in gold income of $6 million. By-product revenue (excluding equity-accounted joint
ventures) decreased by $13 million, or ten percent, from $126 million in 2021 to $113 million in 2022, mainly due to a decrease
in revenue from silver.
Revenue from product sales from the Africa operations (excluding equity-accounted joint ventures) increased by $400 million,
or 20 percent, from $1,988 million in 2021 to $2,388 million in 2022, mainly as a result of an increase in gold income. Gold
income (excluding equity-accounted joint ventures) increased by $400 million, or 20 percent, from $1,985 million in 2021 to
$2,385 million in 2022. This increase was mainly due to higher ounces of gold sold, partially offset by a decrease in the
average gold price received per ounce. Gold sold increased by 221,000 ounces, or 21 percent, from 1,060,000 ounces in 2021
to 1,281,000 ounces in 2022, which resulted in an increase in gold income of $403 million. There was an increase in gold
production across all Africa operations in 2022 when compared to 2021. For a discussion of the increase in gold production at
the Africa operations during 2022, see “Item 5A: Operating Results—Key factors affecting results—Comparison of gold
production in 2022 with 2021”. The decrease in the average gold price received per ounce of $3 per ounce resulted in a
decrease in gold income of $3 million. By-product revenue (excluding equity-accounted joint ventures) of $3 million in 2022
remained unchanged from $3 million in 2021.
Revenue from product sales from the Americas operations decreased by $5 million, from $1,147 million in 2021 to $1,142
million in 2022, mainly as a result of a decrease in by-product revenue, partially offset by an increase in gold income. Gold
income marginally increased by $8 million, or one percent, from $1,028 million in 2021 to $1,036 million in 2022. This marginal
increase was mainly due to higher ounces of gold sold, partially offset by a decrease in the average gold price received per
ounce. Gold sold marginally increased by 4,000 ounces, or one percent, from 561,000 ounces in 2021 to 565,000 ounces in
2022, which resulted in an increase in gold income of $10 million. There was an increase in gold production at Cerro
Vanguardia and Serra Grande, partially offset by a decrease in gold production at AngloGold Ashanti Mineração. For a
discussion of the increase in gold production at the Americas operations during 2022, see “Item 5A: Operating Results—Key
factors affecting results—Comparison of gold production in 2022 with 2021”. The decrease in average gold price received per
ounce of $3 per ounce resulted in a decrease in gold income of $2 million. By-product revenue decreased by $13 million, or 11
percent, from $119 million in 2021 to $106 million in 2022, mainly due to a decrease in silver revenue from lower silver
production in Argentina.
Revenue from product sales from the Australia operations increased by $77 million, or nine percent, from $894 million in 2021
to $971 million in 2022, mainly as a result of an increase in gold income. Gold income increased by $77 million, or nine
percent, from $890 million in 2021 to $967 million in 2022. This increase was mainly due to higher ounces of gold sold,
partially offset by a decrease in the average gold price received per ounce. Gold sold increased by 44,000 ounces, or nine
percent, from 495,000 ounces in 2021 to 539,000 ounces in 2022, which resulted in an increase in gold income of $79 million.
There was an increase in gold production at Tropicana which was partially offset by a decrease in gold production at Sunrise
Dam. For a discussion of the increase in gold production at the Australia operations during 2022, see “Item 5A: Operating
Results—Key factors affecting results—Comparison of gold production in 2022 with 2021”. The decrease in the average gold
155
price received per ounce of $3 per ounce resulted in a decrease in gold income of $2 million. By-product revenue of $4 million
in 2022 remained unchanged from $4 million in 2021.
Cost of sales
Cost of sales increased by $507 million, or 18 percent, from $2,859 million in 2021 to $3,366 million in 2022. This increase was
primarily due to an increase in operating costs of $396 million, or 18 percent, from $2,172 million in 2021 to $2,568 million in
2022, an increase in amortisation of tangible assets by $142 million, or 34 percent, from $413 million in 2021 to $555 million in
2022, an increase in amortisation of right of use assets by $18 million, or 29 percent, from $63 million in 2021 to $81 million in
2022 and an increase in royalties paid by $23 million, or 14 percent, from $162 million in 2021 to $185 million in 2022, mainly
due to higher ounces sold. This increase was partially offset by a decrease in environmental rehabilitation and other non-cash
costs by $38 million, from $38 million in 2021 to nil in 2022, an inventory change of $36 million, from a charge of $6 million in
2021 to a credit of $30 million in 2022, and a decrease in amortisation of intangible assets by $2 million, or 67 percent, from $3
million in 2021 to $1 million in 2022.
For a discussion of cost of sales on a segment basis during 2022, see “Item 5A: Operating Results—Comparison of operating
performance on a segment basis in 2022 with 2021—Cost of sales”.
Total operating costs
Total operating costs increased by $419 million, or 18 percent, from $2,334 million in 2021 to $2,753 million in 2022. This
increase was primarily due to an increase in operating costs and royalties paid. Total operating costs include operating costs
(such as salaries and wages, consumable stores, explosives, reagents, logistics, fuel, power, water, contractors’ costs,
services and other charges) and royalties paid.
Operating costs increased by $396 million, or 18 percent, from $2,172 million in 2021 to $2,568 million in 2022, primarily due
to higher labour and contractors’ costs, commodity prices, logistics costs, consumable stores, services and other charges as
well as higher fuel and power costs. Higher labour and contractors’ costs were mainly due to the resumption of stoping
activities during 2022 at Obuasi, following the temporary suspension of underground mining activities in 2021 following a sill
pillar incident in May 2021. At Geita, with the acceleration of the heavy mobile equipment (“HME”) fleet rebuilds as the open pit
mine expanded, higher underground contractors’ costs were incurred. Higher labour and contractors’ costs were also due to
shortages of critical skills at certain operations. Higher commodity costs were mainly due to an increase in the prices of steel,
support and construction materials, explosives, timber and reagents. Higher fuel and power costs were mainly due to the
increase in the average price of Brent Crude oil, which increased from $71 per barrel in 2021 to $97 per barrel in 2022, a $26,
or a 37 percent, per barrel increase. The strengthening of the Brazilian real against the US dollar contributed to the increase in
operating costs, which was partially offset by the weakening of local currencies against the US dollar in Australia and
Argentina.
Royalties paid, which are generally calculated as a percentage of revenue, increased by $23 million, or 14 percent, from $162
million in 2021 to $185 million in 2022. This increase was primarily due to an increase in ounces of gold sold across all mining
operations with the exception of Sunrise Dam, AGA Mineração and Kibali. This increase was partially offset by a decrease in
the average gold price received per ounce.
Retrenchment costs
Retrenchment costs included in cost of sales increased by $4 million, from $2 million in 2021 to $6 million in 2022.
Environmental rehabilitation and other non-cash costs
Environmental rehabilitation and other non-cash costs decreased by $38 million, from $38 million in 2021 to nil in 2022. This
decrease was mainly due to changes in discount rates due to changes in global economic assumptions, changes in mine
plans resulting in a change in cash flows, changes in designs for closure of TSFs, including new legal requirements for our
TSFs in Brazil relating to emergency response and safety management for TSFs, and changes in the methodology used to
calculate such estimates in response to comments from environmental regulatory authorities.
Amortisation of tangible, intangible and right of use assets
Amortisation of tangible, intangible and right of use assets expense increased by $158 million, or 33 percent, from $479 million
in 2021 to $637 million in 2022.
Amortisation of tangible assets increased by $142 million, or 34 percent, from $413 million in 2021 to $555 million in 2022.
This increase was mainly due to higher amortisation at Iduapriem (mainly due to higher gold production combined with higher
deferred stripping amortisation at Teberebie Cut 2a which commenced in 2022), at Tropicana (mainly due to higher deferred
156
stripping amortisation due to mining and depletion of different ore bodies and increased capital additions, as well as higher
Mineral Reserve development), at Serra Grande (mainly due to higher gold production), at Obuasi (mainly due to higher gold
production, the reset of the useful life for the mining fleet and the Obuasi redevelopment project continuing to ramp up to full
production), at Geita (mainly due to the useful life reset done in 2022 for Mineral Reserve development and heavy mining
equipment coming into production), at Cerro Vanguardia (mainly due to lower reserves at the end of 2022 as compared to the
end of 2021 and higher deferred stripping amortisation) and at Siguiri (mainly due to higher gold production), partially offset by
lower amortisation at CdS (mainly due to lower gold production and reduction in asset cost due to the impairment that occurred
during 2022) and at Sunrise Dam (mainly due to a decrease in Mineral Reserve development due to strategy focusing on
exploration activities).
Amortisation of intangible assets decreased by $2 million, or 67 percent, from $3 million in 2021 to $1 million in 2022, mainly
due to lower software and licence expenditure at Obuasi as compared to 2021.
Amortisation of right of use assets increased by $18 million, or 29 percent, from $63 million in 2021 to $81 million in 2022,
mainly due to additional lease contracts for heavy mobile equipment entered into at AGA Mineração, Serra Grande and Geita.
Inventory change
Inventory change was a charge of $6 million in 2021, compared to a credit of $30 million in 2022, which represents a change
of $36 million. This change was primarily due to lower cost of unsold gold at Obuasi of $16 million as a result of timing of
shipments, lower cost at Siguiri of $5 million and at Geita of $7 million due to an increase in gold on hand, lower cost at the
Australian operations of $3 million due to timing of gold pours and shipments, lower amortisation of inventories at the Brazil
operations resulting from the suspension of tailings disposal and processing plant effluents treatment of $3 million, and lower
amortisation of inventories at Cerro Vanguardia due to a higher volume of gold in process of $5 million. This change was
partially offset by an increased cost due to higher sales and higher gold production in 2022 at Cerro Vanguardia of $3 million.
Net impairment, derecognition of assets and profit (loss) on disposal
Net impairment, derecognition of assets and profit (loss) on disposal was a profit of $11 million in 2021 as compared to a loss
of $315 million in 2022, which represents a change of $326 million. Net impairment, derecognition of assets and profit (loss) on
disposal was mainly due to the impairment of the CdS mining complex of $189 million (gross of taxation), the impairment of
Serra Grande of $56 million (gross of taxation), the impairment of Cuiabá of $70 million (gross of taxation) and loss on asset
derecognitions at Siguiri, Obuasi and Geita of $4 million during 2022, partially offset by profit on disposal of properties held in
Brazil of $4 million during 2022. For further information on the impairment losses in Brazil during 2022, refer to “Item 18:
Financial Statements—Note 12—Tangible Assets—Net Impairment, Derecognition of Assets and Profit (Loss) on Disposal”.
Corporate restructuring costs
Corporate restructuring costs increased by $14 million, from nil in 2021 to $14 million in 2022. The increase during 2022 was
mainly as a result of higher due diligence project costs during 2022.
Other (expenses) income
Other (expenses) income decreased by $124 million, or 91 percent, from an expense of $136 million in 2021 to an expense of
$12 million in 2022. This decrease during 2022 compared to 2021 was largely due to care and maintenance activities of $45
million incurred in 2021 at the Obuasi mine during the voluntary suspension of underground mining between May and October
2021 following a sill pillar incident, retrenchment and related costs of $18 million incurred in 2021 as part of the transition to the
new Operating Model and bond settlement costs of $24 million incurred in 2021 related to the tender offer for, and subsequent
redemption of, the $750 million aggregate principal amount of 5.125% notes due 2022, none of which were repeated in 2022.
The non-occurrence of the aforementioned costs in 2022 contributed to a decrease in cost of $87 million. Further decreases in
other expenses were primarily due to the lower cost of legacy TSFs, mainly at Obuasi, and lower VAT and other duties
expensed.
Finance costs and unwinding of obligations
Finance costs increased by $9 million, or eight percent, from $110 million in 2021 to $119 million in 2022, mainly due to a
decrease in capitalisation of interest against the Obuasi redevelopment project, lower finance costs from borrowings and
higher amortisation fees as compared to 2021. Unwinding of obligations increased by $24 million, from $6 million in 2021 to
$30 million in 2022, mainly due to an increase in unwinding of other indirect taxes at Geita and non-current receivables at
Siguiri as well as higher unwinding on the environmental rehabilitation provisions.
157
Share of associates and joint ventures’ profit
Share of associates and joint ventures’ profit decreased by $84 million, or 34 percent, from a profit of $245 million in 2021 to a
profit of $161 million in 2022, mainly as a result of a decrease in equity earnings of $75 million at Kibali due to lower revenues
and higher legal and debt novation fees, and $9 million at Rand Refinery (Pty) Limited.
Taxation
A taxation expense of $221 million was recorded in 2022, compared to a taxation expense of $311 million in 2021, which
represents a $90 million, or 29 percent, decrease. Current tax in 2022 amounted to an expense of $231 million, compared to
an expense of $248 million in 2021, which represents a $17 million, or seven percent, decrease. The decrease in current tax
was mainly due to lower pre-tax profit in Brazil. Deferred tax in 2022 amounted to a deferred tax income of $10 million,
compared to an expense of $63 million in 2021, which represents a $73 million change. The change in deferred tax was mainly
due to higher deferred tax assets raised on tax losses in Ghana and higher impairments in Brazil.
158
Comparison of capital expenditure in 2023, 2022 and 2021
The following table presents capital expenditure data for the AngloGold Ashanti Group for the three-year period ended
31 December 2023:
Capital expenditure data for subsidiaries and joint ventures | Year ended 31 December | |||||
(in $ millions) | 2023 | 2022 | 2021 | |||
Subsidiaries (1) | 1,042 | 1,028 | 1,028 | |||
Sustaining capital expenditure (2) | 842 | 708 | 717 | |||
Non-sustaining capital expenditure (3) | 200 | 320 | 311 | |||
Equity-accounted joint ventures | 85 | 90 | 72 | |||
Sustaining capital expenditure | 52 | 71 | 61 | |||
Non-sustaining capital expenditure | 33 | 19 | 11 | |||
(1) At CdS, total capital expenditure amounted to $21 million, $55 million and $60 million for the years ended 31 December 2023, 2022 and 2021, respectively.
(2) At CdS, sustaining capital expenditure amounted to $19 million, $55 million and $60 million for the years ended 31 December 2023, 2022 and 2021,
respectively.
(3) At CdS, non-sustaining capital expenditure amounted to $2 million for the year ended 31 December 2023 and nil for each of the years ended 31 December 2023
and 2022.
Comparison of capital expenditure in 2023 with 2022
Capital expenditure of subsidiaries marginally increased by $14 million, or one percent, from $1,028 million in 2022 to $1,042
million in 2023. This marginal increase was mainly due to an increase of $134 million in sustaining capital expenditure and a
decrease of $120 million in non-sustaining capital expenditure. Capital expenditure of joint ventures decreased by $5 million,
or six percent, from $90 million in 2022 to $85 million in 2023. This decrease was mainly due to a decrease of $19 million in
sustaining capital expenditure and an increase of $14 million in non-sustaining capital expenditure. The Kibali mine in the DRC
was the only operating asset that was a joint venture in 2023. Excluding CdS, capital expenditure of subsidiaries increased by
$48 million, or five percent, from $973 million in 2022 to $1,021 million in 2023.
In Africa – subsidiaries, capital expenditure increased by $139 million, or 29 percent, from $486 million in 2022 to $625 million
in 2023. At Iduapriem in Ghana, capital expenditure decreased by $4 million, from $146 million in 2022 to $142 million in 2023,
mainly due to lower waste stripping at Teberebie Cut 2c and lower non-sustaining capital expenditure for work relating to
buttressing the TSF, partially offset by higher waste stripping activities at Block 5 and Ajopa. At Obuasi in Ghana, capital
expenditure increased by $55 million, from $159 million in 2022 to $214 million in 2023, mainly due to the mining fleet
acquisition and an increase in Mineral Reserve development and underground infrastructure development, partially offset by
lower expenditure on Phase 3 of the Obuasi redevelopment project. At Siguiri in Guinea, capital expenditure increased by $51
million, from $27 million in 2022 to $78 million in 2023, mainly due to higher waste stripping activities at Bidini and Saraya,
increased sustaining capital expenditure to restore plant operations following the CIL tank failure, extend the life of the TSF to
2037 and transition to an owner mining operation model (instead of using contractors) to improve productivity. At Geita in
Tanzania, capital expenditure increased by $37 million, from $154 million in 2022 to $191 million in 2023, mainly due to an
increase in sustaining capital expenditure primarily as a result of an increase in waste stripping, the TSF lift and the Tanesco
national power grid connection project, partially offset by lower non-sustaining capital expenditure mainly due to the
Nyamulilima open pit being commissioned during 2022.
In Africa – joint ventures, capital expenditure at Kibali in the DRC decreased by $5 million, from $90 million in 2022 to $85
million in 2023, mainly due to lower waste stripping and Mineral Reserve development costs capitalised, partially offset by
higher non-sustaining capital expenditure on exploration, the cyanide recovery plant and a solar energy project.
In the Americas, capital expenditure decreased by $68 million, or 21 percent, from $322 million in 2022 to $254 million in 2023.
At AGA Mineração in Brazil, capital expenditure decreased by $75 million, from $199 million in 2022 to $124 million in 2023,
mainly due to the continuing suspension of gold concentrate processing activities at the Queiroz metallurgical plant, the CdS
mine being placed on care and maintenance in August 2023 and lower investment in TSF projects. At Serra Grande in Brazil,
capital expenditure decreased by $2 million, from $57 million in 2022 to $55 million in 2023, mainly due to lower TSF
expenditure. At Cerro Vanguardia in Argentina, capital expenditure increased by $9 million, from $66 million in 2022 to $75
million in 2023, mainly due to higher expenditure on the heap leaching expansion and higher waste stripping capital
expenditure compared to 2022. Excluding CdS, capital expenditure in the Americas decreased by $34 million, or 13 percent,
from $267 million in 2022 to $233 million in 2023. Excluding CdS, capital expenditure at AGA Mineração decreased by $41
million, or 28 percent, from $144 million in 2022 to $103 million in 2023.
In Australia, capital expenditure decreased by $67 million, or 33 percent, from $202 million in 2022 to $135 million in 2023. At
Sunrise Dam in Australia, capital expenditure decreased by $3 million, from $50 million in 2022 to $47 million in 2023, mainly
159
due to lower sustaining capital expenditure and lower underground development expenditure. At Tropicana in Australia, capital
expenditure decreased by $65 million, from $152 million in 2022 to $87 million in 2023, mainly due to lower non-sustaining
capital expenditure from decreased waste mining in the Havana cutback project during 2023. At Australia other, capital
expenditure increased by $1 million, from nil in 2022 to $1 million in 2023, mainly due to higher exploration equipment
expenditure.
In Projects, capital expenditure increased by $10 million, or 59 percent, from $17 million in 2022 to $27 million in 2023. Capital
expenditure for the Colombian projects decreased by $5 million, or 31 percent, from $16 million in 2022 to $11 million in 2023,
mainly due to the Gramalote project which was sold in September 2023. Capital expenditure for the Nevada projects increased
by $15 million, from $1 million in 2022 to $16 million in 2023, mainly due to the capital expenditure incurred on the new
Corporate Office in Denver and the purchase of land.
Comparison of capital expenditure in 2022 with 2021
Capital expenditure of subsidiaries of $1,028 million in 2022 remain unchanged from $1,028 million in 2021. A decrease of $9
million in sustaining capital expenditure was offset by an increase of $9 million in non-sustaining capital expenditure. Capital
expenditure of joint ventures increased by $18 million, or 25 percent, from $72 million in 2021 to $90 million in 2022. This
increase was mainly due to an increase of $10 million in sustaining capital expenditure and an increase of $8 million in non-
sustaining capital expenditure. The Kibali mine in the DRC was the only operating asset that was a joint venture in 2022.
Excluding CdS, capital expenditure of subsidiaries increased by $5 million, or less than one percent, from $968 million in 2021
to $973 million in 2022.
In Africa – subsidiaries, capital expenditure increased by $52 million, or 12 percent, from $434 million in 2021 to $486 million in
2022. At Iduapriem in Ghana, capital expenditure increased by $41 million, from $105 million in 2021 to $146 million in 2022,
mainly due to waste stripping at Cut 2 and increased non-sustaining capital expenditure for work relating to buttressing the
TSF, partially offset by lower pre-stripping activities. At Obuasi in Ghana, capital expenditure decreased by $9 million, from
$168 million in 2021 to $159 million in 2022, mainly due to lower non-sustaining capital expenditure as construction of Phase 2
of the Obuasi redevelopment project was completed at the end of December 2021. Phase 3 of the Obuasi redevelopment
project, which relates principally to capital expenditure to refurbish existing infrastructure around the KMS Shaft, as well as to
service the mine in deeper production areas, continued to progress. At Siguiri in Guinea, capital expenditure decreased by $11
million, from $38 million in 2021 to $27 million in 2022, mainly due to lower non-sustaining capital expenditure at Block 2
during 2022, partially offset by an increase in sustaining capital expenditure. At Geita in Tanzania, capital expenditure
increased by $31 million, from $123 million in 2021 to $154 million in 2022, mainly due to an increase in sustaining capital
expenditure, partially offset by lower non-sustaining capital expenditure. Sustaining capital expenditure increased mainly due
to an increase in deferred stripping and higher Mineral Reserve development expenditure as the underground portal
development at Geita Hill East progressed according to plan. Lower non-sustaining capital expenditure was mainly due to the
Nyamulilima open pit being commissioned during 2022.
In Africa – joint ventures, capital expenditure at Kibali in the DRC increased by $18 million, from $72 million in 2021 to $90
million in 2022, mainly due to increased sustaining capital expenditure on the cyanide recovery plant and increased non-
sustaining exploration expenditure.
In the Americas, capital expenditure decreased by $24 million, or seven percent, from $346 million in 2021 to $322 million in
2022. In Brazil, AngloGold Ashanti completed the conversion of existing TSFs to dry-stacking facilities at all mine sites, in a
market characterised by increased competition for skills and engineering resources due to the COVID-19 pandemic and the
industry-wide requirements to meet regulatory deadlines relating to TSFs. Capital expenditures required in 2022 to implement
this new technology amounted to approximately $83 million. At AGA Mineração in Brazil, capital expenditure increased by $4
million, from $195 million in 2021 to $199 million in 2022, mainly due to higher sustaining capital expenditure for mine
development costs and continuing expenditure on TSFs to meet regulatory requirements. At Serra Grande in Brazil, capital
expenditure decreased by $25 million, from $82 million in 2021 to $57 million in 2022, mainly due to lower mine development
expenditure offset by higher TSF expenditure. At Cerro Vanguardia in Argentina, capital expenditure decreased by $3 million,
from $69 million in 2021 to $66 million in 2022, mainly due to lower expenditure on TSF embankment raise and lower deferred
stripping capital expenditure compared to 2021. Excluding CdS, capital expenditure in the Americas decreased by $19 million,
or seven percent, from $286 million in 2021 to $267 million in 2022. Excluding CdS, capital expenditure at AGA Mineração
increased by $9 million, or seven percent, from $135 million in 2021 to $144 million in 2022.
In Australia, capital expenditure increased by $17 million, or nine percent, from $185 million in 2021 to $202 million in 2022. At
Sunrise Dam in Australia, capital expenditure decreased by $12 million, from $62 million in 2021 to $50 million in 2022, mainly
due to non-sustaining capital expenditure incurred on the Golden Delicious open pit growth project having been commissioned
in 2021 and not repeated in 2022. At Tropicana in Australia, capital expenditure increased by $30 million, from $122 million in
2021 to $152 million in 2022, mainly due to increased non-sustaining capital expenditure for increased waste mining in the
Havana cutback project during 2022. At Australia other, capital expenditure decreased by $1 million, from $1 million in 2021 to
nil in 2022, mainly due to lower exploration equipment expenditure.
160
In Projects, capital expenditure decreased by $35 million, or 67 percent, from $52 million in 2021 to $17 million in 2022. At
Quebradona in Colombia, capital expenditure decreased by $28 million, from $33 million in 2021 to $5 million in 2022, mainly
due to the higher capitalisation of land and feasibility study costs for the growth project in 2021. At Gramalote in Colombia,
capital expenditure decreased by $9 million, from $19 million in 2021 to $10 million in 2022, mainly due to the purchase of the
La Cascada property in 2021 and higher feasibility study costs of the growth project in 2021. During 2022, there was no capital
expenditure at La Colosa in Colombia. In Nevada, USA, capital expenditure increased by $1 million, from nil in 2021 to $1
million in 2022, mainly due to pre-feasibility studies, and purchase of light motor vehicles and land.
At the Corporate Office in Johannesburg, capital expenditure decreased by $10 million, from $11 million in 2021 to $1 million in
2022, mainly due to expenditure on new furniture and computer equipment in connection with the relocation of the Corporate
Office to a new building having been incurred in 2021 and not being repeated in 2022.
Comparison of operating performance on a segment basis for 2023, 2022 and 2021
The Company produces gold as its primary product and does not have distinct divisional segments in terms of principal
business activity, but manages its business on the basis of different geographic segments. Therefore, information regarding
separate geographic segments is provided.
Gold income
(in millions) | Year ended 31 December | ||||||||||
2023 | 2022 | 2021 | |||||||||
$ | percent | $ | percent | $ | percent | ||||||
Geographical analysis of gold income by origin is as follows: | |||||||||||
Africa | 3,068 | 69 | 2,981 | 68 | 2,644 | 68 | |||||
Australia | 1,081 | 24 | 967 | 22 | 890 | 23 | |||||
Americas | 999 | 22 | 1,036 | 24 | 1,028 | 26 | |||||
5,148 | 4,984 | 4,562 | |||||||||
Less: Associates and equity-accounted joint ventures included above | (668) | (15) | (596) | (14) | (659) | (17) | |||||
4,480 | 100 | 4,388 | 100 | 3,903 | 100 | ||||||
Assets
(in millions) | Year ended 31 December | ||||||||||
2023 | 2022 | 2021 | |||||||||
$ | percent | $ | percent | $ | percent | ||||||
Restated | Restated | ||||||||||
Geographical analysis of assets by origin is as follows: | |||||||||||
Africa | 4,414 | 54 | 4,035 | 50 | 4,231 | 53 | |||||
Australia | 942 | 12 | 960 | 12 | 1,034 | 13 | |||||
Americas | 1,254 | 15 | 1,395 | 18 | 1,573 | 20 | |||||
Projects | 833 | 10 | 872 | 11 | 313 | 4 | |||||
Other, including non-gold producing subsidiaries | 732 | 9 | 751 | 9 | 856 | 10 | |||||
Total assets | 8,175 | 100 | 8,013 | 100 | 8,007 | 100 | |||||
Non-GAAP analysis
In this annual report on Form 20-F, AngloGold Ashanti presents the financial items “total cash costs”, “total cash costs per
ounce”, “all-in sustaining costs”, “all-in sustaining costs per ounce”, “all-in costs”, “all-in costs per ounce”, “average gold price
received per ounce”, “sustaining capital expenditure” and “non-sustaining capital expenditure”, which have been determined
using industry guidelines and practices and are not measures under IFRS. An investor should not consider these items in
isolation or as alternatives to cost of sales, gold income, capital expenditure or any other measure of financial performance
presented in accordance with IFRS or as an indicator of the Group’s performance. The Group uses certain Non-GAAP
161
performance measures and ratios in managing the business and may provide users of this financial information with additional
meaningful comparisons between current results and results in prior operating periods. Non-GAAP financial measures should
be viewed in addition to, and not as an alternative to, the reported operating results or any other measure of performance
prepared in accordance with IFRS. In addition, the presentation of these measures may not be comparable to similarly titled
measures that other companies use. See “Presentation of information—Non-GAAP financial measures” for additional
information about the use of Non-GAAP financial measures and “—Reconciliations” below for reconciliations. Refer to
“Glossary of selected terms—Financial terms—Total cash costs”, “Glossary of selected terms—Financial terms—All-in
sustaining costs”, “Glossary of selected terms—Financial terms—All-in costs”, “Glossary of selected terms—Financial terms—
Average gold price received per ounce”, “Glossary of selected terms—Financial terms—Sustaining capital (expenditure)” and
“Glossary of selected terms—Financial terms—Non-sustaining capital (expenditure)” for definitions.
The following table presents selected total operating data for the AngloGold Ashanti Group for the three-year period ended 31
December 2023:
Operating data for AngloGold Ashanti operations - Total | Year ended 31 December | ||||
2023 | 2022 | 2021 | |||
Restated | Restated | ||||
Cost of sales (million US dollars) - Subsidiaries | 3,541 | 3,366 | 2,859 | ||
Cost of sales (million US dollars) - Subsidiaries excluding CdS(2) | 3,437 | 3,203 | 2,710 | ||
Cost of sales (million US dollars) - Joint Ventures | 372 | 342 | 350 | ||
All-in sustaining costs per ounce ($/oz) - Subsidiaries(1) | 1,652 | 1,439 | 1,441 | ||
All-in sustaining costs per ounce ($/oz) - Subsidiaries excluding CdS (1) (2) | 1,628 | 1,396 | 1,408 | ||
All-in sustaining costs per ounce ($/oz) - Joint Ventures(1) | 951 | 979 | 856 | ||
All-in costs per ounce ($/oz) - Subsidiaries(1) | 1,895 | 1,658 | 1,695 | ||
All-in costs per ounce ($/oz) - Subsidiaries excluding CdS(1) (2) | 1,855 | 1,617 | 1,666 | ||
All-in costs per ounce ($/oz) - Joint Ventures(1) | 1,074 | 1,075 | 900 | ||
Total cash costs per ounce ($/oz) - Subsidiaries(1) | 1,174 | 1,066 | 1,017 | ||
Total cash costs per ounce ($/oz) - Subsidiaries excluding CdS(1) (2) | 1,154 | 1,040 | 1,001 | ||
Total cash costs per ounce ($/oz) - Joint Ventures(1) | 802 | 725 | 647 | ||
(1)“All-in sustaining costs per ounce”, “all-in costs per ounce” and “total cash costs per ounce” are non-GAAP financial measures. For a detailed reconciliation of
“all-in sustaining costs per ounce”, “all-in costs per ounce” and “total cash costs per ounce” for the Company’s total operations (subsidiaries/joint ventures) for
each of the three years in the period ended 31 December 2023, refer to the relevant “AngloGold Ashanti operations - Total” tables below.
(2)Adjusted to exclude the Córrego do Sítio (CdS) operation that was placed on care and maintenance in August 2023.
Comparison of operating performance on a segment basis in 2023 with 2022
Cost of sales
In Africa - Subsidiaries, cost of sales increased by $73 million, or four percent, from $1,666 million in 2022 to $1,739 million in
2023. This increase was largely due to the higher open pit and underground ore tonnes mined as well as higher operating
costs related to labour, contractors, commodity prices, consumable stores and services and higher amortisation of tangible
assets.
At Iduapriem in Ghana, cost of sales increased by $73 million, or 23 percent, from $314 million in 2022 to $387 million in 2023.
Cost of sales at Iduapriem increased year-on-year mainly due to higher amortisation of tangible assets as a result of higher
gold production and waste stripping at Teberebie Cut 2b which commenced in 2023, as well as higher operating costs relating
to labour, contractors and explosives, higher royalties paid and higher environmental rehabilitation provisions due to inflation
and changes in discount rates (due to changes in global economic assumptions) used in calculating environmental
rehabilitation and other non-cash costs, partially offset by favourable ore stockpile movements.
At Obuasi in Ghana, cost of sales increased by $47 million, or 18 percent, from $266 million in 2022 to $313 million in 2023.
Cost of sales at Obuasi increased year-on-year mainly due to increased stoping activities during 2023 as the mine continued
to ramp up. Amortisation of heavy mobile equipment increased mainly due to mining fleet and Mineral Reserve development
amortisation as the assets were transferred from being under construction to Mineral Reserve development assets in 2023.
Royalties paid were higher due to a higher average gold price received per ounce in 2023. This increase in cost of sales was
partially offset by favourable ore stockpile movements.
At Siguiri in Guinea, cost of sales decreased by $19 million, or four percent, from $492 million in 2022 to $473 million in 2023.
Cost of sales at Siguiri decreased year-on-year mainly due to lower operating costs as a result of the transition to an owner
mining operation model (instead of using contractors) and royalties paid, lower environmental rehabilitation and other non-cash
162
costs and lower amortisation of tangible assets due to lower gold production, partially offset by unfavourable ore stockpile
movements.
At Geita in Tanzania, cost of sales decreased by $28 million, or five percent, from $594 million in 2022 to $566 million in 2023.
Cost of sales at Geita decreased year-on-year mainly due to favourable ore stockpile movements, lower environmental
rehabilitation and other non-cash costs and lower Mineral Reserve development amortisation. Mineral Reserve development
amortisation decreased mainly due to the implementation of a Full Asset Potential initiative relating to mine planning and
operational efficiencies.
In Africa - Joint Ventures, cost of sales increased by $30 million, or nine percent, from $342 million in 2022 to $372 million in
2023. This increase was mainly due to higher operating costs relating to oil and commodity prices related to diesel and reagent
consumption costs, higher royalties paid and higher amortisation of tangible assets, partially offset by favourable ore stockpile
movements. The Kibali mine in the DRC was the only operating asset in Africa - Joint Ventures in 2023.
In the Americas, cost of sales marginally increased by $18 million, or two percent, from $913 million in 2022 to $931 million in
2023. This marginal increase was mainly due to higher operating costs relating to labour, contractors, consumable stores and
services and an average three percent strengthening of the Brazilian real against the US dollar. This increase was partially
offset by lower operating costs due to the continuing suspension of gold concentrate processing activities at the Queiroz
metallurgical plant and the CdS mine being placed on care and maintenance in August 2023 as well as an average 124
percent weakening of the Argentinean peso against the US dollar. Excluding CdS, cost of sales in the Americas increased by
$77 million, or ten percent, from $750 million in 2022 to $827 million in 2023.
At AGA Mineração in Brazil, cost of sales decreased by $24 million, or five percent, from $477 million in 2022 to $453 million in
2023. Cost of sales at AGA Mineração decreased year-on-year mainly due to lower royalties paid, lower amortisation of
tangible assets due to the impact of impairments recognised in 2022 and 2023 as well as lower operating costs due to the
continuing suspension of gold concentrate processing activities at the Queiroz metallurgical plant and the CdS mine being
placed on care and maintenance in August 2023, partially offset by higher operating costs relating to labour, contractors and
consumable stores, additional costs to produce and sell gold-in-concentrate, additional operating costs related to TSF
management and an average three percent strengthening of the Brazilian real against the US dollar. Excluding CdS, cost of
sales at AGA Mineração increased by $35 million, or 11 percent, from $314 million in 2022 to $349 million in 2023.
At Serra Grande in Brazil, cost of sales increased by $7 million, or four percent, from $162 million in 2022 to $169 million in
2023. Cost of sales at Serra Grande increased year-on-year mainly due to higher operating costs related to labour,
contractors, additional technical services and an average three percent strengthening of the Brazilian real against the US
dollar and unfavourable ore stockpile movements, partially offset by lower amortisation of tangible assets due to lower gold
production.
At Cerro Vanguardia in Argentina, cost of sales increased by $34 million, or 12 percent, from $273 million in 2022 to $307
million in 2023. Cost of sales at Cerro Vanguardia increased year-on-year mainly due to higher operating costs related to
labour, fuel, power, explosives and services, an increase in environmental rehabilitation and other non-cash costs and
unfavourable ore stockpile movements. This increase was partially offset by an average 124 percent weakening of the
Argentinean peso against the US dollar.
In the Americas other segment, cost of sales increased by $1 million, or 100 percent, from $1 million in 2022 to $2 million in
2023.
In Australia, cost of sales increased by $84 million, or 11 percent, from $783 million in 2022 to $867 million in 2023. This
increase was mainly due to higher operating costs related to labour, contractors, power (due to the increase in the price of gas)
and consumable stores and royalties paid (which increased mainly due to an increase in the ounces of gold sold and a higher
average gold price received per ounce in 2023). This increase was partially offset by an average five percent weakening of the
Australian dollar against the US dollar and a decrease in environmental rehabilitation and other non-cash costs.
At Sunrise Dam in Australia, cost of sales increased by $28 million, or eight percent, from $371 million in 2022 to $399 million
in 2023. Cost of sales at Sunrise Dam increased year-on-year primarily due to higher operating costs related to labour and
consumable stores, partially offset by favourable ore stockpile movements and an average five percent weakening of the
Australian dollar against the US dollar.
At Tropicana in Australia, cost of sales increased by $56 million, or 15 percent, from $382 million in 2022 to $438 million in
2023. Cost of sales at Tropicana increased year-on-year mainly due to higher waste stripping costs and higher mining costs
related to drilling and blasting and an increase in environmental rehabilitation and other non-cash costs. This increase was
partially offset by favourable ore stockpile movements and an average five percent weakening of the Australian dollar against
the US dollar.
163
Overall, the subsidiaries’ cost of sales increased by $175 million, or five percent, from $3,366 million in 2022 to $3,541 million
in 2023. For a discussion of the breakdown of cost of sales during 2023, see “Item 5A: Operating Results—Comparison of
financial performance in 2023 with 2022—Cost of sales”. Excluding CdS, the subsidiaries’ cost of sales increased by $234
million, or seven percent, from $3,203 million in 2022 to $3,437 million in 2023.
All-in sustaining costs per ounce
In Africa - Subsidiaries, all-in sustaining costs increased by $272 per ounce, or 21 percent, from $1,291 per ounce in 2022 to
$1,563 per ounce in 2023. This increase was mainly due to an increase in cost of sales, an increase in sustaining capital
expenditure and a decrease in ounces of gold sold. For a discussion of the increase in cost of sales in Africa - Subsidiaries
during 2023, see “Item 5A: Operating Results—Comparison of operating performance on a segment basis in 2023 with 2022—
Cost of sales”. For a discussion of capital expenditure in Africa - Subsidiaries during 2023, see “Item 5A: Operating Results—
Comparison of capital expenditure in 2023, 2022 and 2021—Comparison of capital expenditure in 2023 with 2022”. Sustaining
capital expenditure in Africa - Subsidiaries increased as the region continued to implement its reinvestment programme. At
Iduapriem in Ghana, sustaining capital expenditure increased year-on-year mainly due to higher waste stripping expenditure in
Block 5 and Ajopa, partially offset by lower waste stripping at Teberebie Cut 2c. At Obuasi in Ghana, sustaining capital
expenditure increased year-on-year mainly due to the mining fleet acquisition and an increase in underground infrastructure
development. At Siguiri in Guinea, sustaining capital expenditure increased year-on-year mainly due to higher waste stripping
activities at Bidini and Saraya, increased sustaining capital expenditure to restore plant operations following the CIL tank
failure, extend the life of the TSF to 2037 and transition to an owner mining operation model (instead of using contractors) to
improve productivity. At Geita in Tanzania, sustaining capital expenditure increased year-on-year mainly due to an increase in
waste stripping, the TSF lift and the Tanesco national power grid connection project. Gold sold in Africa - Subsidiaries
decreased by 87,000 ounces, or seven percent, from 1,281,000 ounces in 2022 to 1,194,000 ounces in 2023. This decrease
was largely due to lower gold production across all operations in Africa other than Iduapriem. For a discussion of the decrease
in gold production at the Africa operations (excluding Kibali) during 2023, see “Item 5A: Operating Results—Key factors
affecting results—Comparison of gold production in 2023 with 2022”.
In Africa - Joint Ventures, all-in sustaining costs decreased by $28 per ounce, or three percent, from $979 per ounce in 2022 to
$951 per ounce in 2023. This decrease was mainly due to lower sustaining capital expenditure and an increase in ounces of
gold sold, partially offset by higher cost of sales. For a discussion of the increase in cost of sales in Africa - Joint Ventures
during 2023, see “Item 5A: Operating Results—Comparison of operating performance on a segment basis in 2023 with 2022—
Cost of sales”. For a discussion of capital expenditure in Africa – Joint Ventures during 2023, see “Item 5A: Operating Results
—Comparison of capital expenditure in 2023, 2022 and 2021—Comparison of capital expenditure in 2023 with 2022”.
Sustaining capital expenditure in Africa - Joint Ventures decreased year-on-year mainly due to lower waste stripping and
Mineral Reserve development costs capitalised. Gold sold in Africa - Joint Ventures increased by 11,000 ounces, or three
percent, from 332,000 ounces in 2022 to 343,000 ounces in 2023. This increase was mainly due to higher gold production
from Kibali. For a discussion of the increase in gold production at Kibali during 2023, see “Item 5A: Operating Results—Key
factors affecting results—Comparison of gold production in 2023 with 2022”. The Kibali mine in the DRC was the only
operating asset in Africa - Joint Ventures in 2023.
In the Americas, all-in sustaining costs increased by $92 per ounce, or five percent, from $1,718 per ounce in 2022 to $1,810
per ounce in 2023. Excluding CdS, all-in sustaining costs in the Americas increased by $158 per ounce, or ten percent, from
$1,555 per ounce in 2022 to $1,713 per ounce in 2023. This increase was mainly due to an increase in cost of sales and a
decrease in ounces of gold sold, partially offset by a decrease in sustaining capital expenditure. For a discussion of the
increase in cost of sales in the Americas during 2023, see “Item 5A: Operating Results—Comparison of operating performance
on a segment basis in 2023 with 2022—Cost of sales”. For a discussion of capital expenditure in the Americas during 2023,
see “Item 5A: Operating Results—Comparison of capital expenditure in 2023, 2022 and 2021—Comparison of capital
expenditure in 2023 with 2022”. Excluding CdS, sustaining capital expenditure in the Americas decreased year-on-year as the
region had lower investment in TSF projects in 2023 as compared to 2022. Excluding CdS, at AGA Mineração in Brazil,
sustaining capital expenditure decreased year-on-year mainly due to the lower investment in TSF projects. At Serra Grande in
Brazil, sustaining capital expenditure decreased year-on-year mainly due to lower TSF expenditure. At Cerro Vanguardia in
Argentina, sustaining capital expenditure increased year-on-year mainly due to higher expenditure on heap leaching
expansion and higher waste stripping capital expenditure compared to 2022. Excluding CdS, gold sold in the Americas
decreased by 17,000 ounces, or three percent, from 496,000 ounces in 2022 to 479,000 ounces in 2023. This decrease was
mainly due to lower gold production from Serra Grande and Cerro Vanguardia, partially offset by higher gold production from
AGA Mineração. For a discussion of the decrease in gold production at the Americas operations during 2023, see “Item 5A:
Operating Results—Key factors affecting results—Comparison of gold production in 2023 with 2022”.
In Australia, all-in sustaining costs increased by $142 per ounce, or 11 percent, from $1,345 per ounce in 2022 to $1,487 per
ounce in 2023. This increase was mainly due to an increase in cost of sales and sustaining capital expenditure, partially offset
by an increase in ounces of gold sold. For a discussion of the increase in cost of sales in Australia during 2023, see “Item 5A:
Operating Results—Comparison of operating performance on a segment basis in 2023 with 2022—Cost of sales”. For a
discussion of capital expenditure in Australia during 2023, see “Item 5A: Operating Results—Comparison of capital
expenditure in 2023, 2022 and 2021—Comparison of capital expenditure in 2023 with 2022”. Sustaining capital expenditure
164
increased in Australia year-on-year mainly due to higher stripping and pre-stripping expenditure. At Sunrise Dam in Australia,
sustaining capital expenditure decreased year-on-year mainly due to lower Mineral Reserve development. At Tropicana in
Australia, sustaining capital expenditure increased year-on-year mainly due to higher stripping and pre-stripping expenditure.
Gold sold in Australia increased by 18,000 ounces, or three percent, from 539,000 ounces in 2022 to 557,000 ounces in 2023.
This increase was mainly due to higher gold production at Sunrise Dam and Tropicana. For a discussion of the increase in
gold production at the Australia operations during 2023, see “Item 5A: Operating Results—Key factors affecting results—
Comparison of gold production in 2023 with 2022”.
Overall, the subsidiaries’ all-in sustaining costs increased by $213 per ounce, or 15 percent, from $1,439 per ounce in 2022 to
$1,652 per ounce in 2023. Excluding CdS, the subsidiaries’ all-in sustaining costs increased by $232, or 17 percent, from
$1,396 per ounce in 2022 to $1,628 per ounce in 2023. This increase was mainly due to an increase in cost of sales and
sustaining capital expenditure and a decrease in ounces of gold sold. For a discussion of the increase in cost of sales for the
subsidiaries during 2023, see “Item 5A: Operating Results—Comparison of operating performance on a segment basis in 2023
with 2022—Cost of sales”. For a discussion of capital expenditure for the subsidiaries during 2023, see “Item 5A: Operating
Results—Comparison of capital expenditure in 2023, 2022 and 2021—Comparison of capital expenditure in 2023 with 2022”.
Excluding CdS, sustaining capital expenditure for the subsidiaries increased year-on-year mainly due to higher waste stripping
expenditure at Iduapriem, Siguiri, Geita, Cerro Vanguardia and Tropicana, the mining fleet acquisition at Obuasi, increased
capital expenditure to restore plant operations following the CIL tank failure at Siguiri, the TSF lift and the Tanesco national
power grid connection project at Geita, partially offset by decreased capital expenditure resulting from lower investment in TSF
projects at AGA Mineração. Excluding CdS, gold sold for the subsidiaries decreased by 86,000 ounces, or four percent, from
2,316,000 ounces in 2022 to 2,230,000 ounces in 2023. This decrease was mainly due to lower gold production from Obuasi,
Siguiri, Geita, Serra Grande and Cerro Vanguardia, partially offset by higher gold production from Iduapriem, AGA Mineração,
Sunrise Dam and Tropicana. For a discussion of the decrease in gold production for the subsidiaries during 2023, see “Item
5A: Operating Results—Key factors affecting results—Comparison of gold production in 2023 with 2022”.
All-in costs per ounce
In Africa - Subsidiaries, all-in costs increased by $262 per ounce, or 18 percent, from $1,434 per ounce in 2022 to $1,696 per
ounce in 2023. This increase was mainly due to an increase in all-in sustaining costs and a decrease in ounces of gold sold,
partially offset by lower non-sustaining capital expenditure. For a discussion of capital expenditure in Africa - Subsidiaries
during 2023, see “Item 5A: Operating Results—Comparison of capital expenditure in 2023, 2022 and 2021—Comparison of
capital expenditure in 2023 with 2022”. At Iduapriem in Ghana, non-sustaining capital expenditure decreased year-on-year
mainly due to less work relating to buttressing the TSF as compared to 2022. At Obuasi in Ghana, Phase 3 of the Obuasi
redevelopment project, which relates principally to capital expenditure to refurbish existing infrastructure around the KMS
Shaft, as well as to service the mine in deeper production areas, continued to progress. Non-sustaining capital expenditure at
Obuasi was lower mainly due to different project scopes and cash flows. At Geita in Tanzania, the Nyamulilima open pit was
commissioned in 2022 with no further non-sustaining capital expenditure in 2023. For a discussion of the increase in all-in
sustaining costs and the decrease in ounces of gold sold in Africa - Subsidiaries during 2023, see “Item 5A: Operating Results
—Comparison of operating performance on a segment basis in 2023 with 2022—All-in sustaining costs per ounce”.
In Africa - Joint Ventures, all-in costs decreased by $1 per ounce, or less than one percent, from $1,075 per ounce in 2022 to
$1,074 per ounce in 2023. This decrease was mainly due to a decrease in all-in sustaining costs and higher ounces of gold
sold, partially offset by higher non-sustaining capital expenditure. For a discussion of capital expenditure in Africa - Joint
Ventures during 2023, see “Item 5A: Operating Results—Comparison of capital expenditure in 2023, 2022 and 2021—
Comparison of capital expenditure in 2023 with 2022”. Non-sustaining capital expenditure in Africa - Joint Ventures increased
year-on-year mainly due to higher non-sustaining capital expenditure on exploration, the cyanide recovery plant and the solar
project. For a discussion of the decrease in all-in sustaining costs and the increase in ounces of gold sold in Africa - Joint
Ventures during 2023, see “Item 5A: Operating Results—Comparison of operating performance on a segment basis in 2023
with 2022—All-in sustaining costs per ounce”. The Kibali mine in the DRC was the only operating asset in Africa - Joint
Ventures in 2023.
In the Americas, all-in costs increased by $301 per ounce, or 17 percent, from $1,775 per ounce in 2022 to $2,076 per ounce
in 2023. Excluding CdS, all-in costs in the Americas increased by $306 per ounce, or 19 percent, from $1,603 per ounce in
2022 to $1,909 per ounce in 2023. This increase was mainly due to an increase in all-in sustaining costs, lower ounces of gold
sold and an increase in closure and social responsibility costs. For a discussion of the increase in all-in sustaining costs and
the decrease in ounces of gold sold in the Americas during 2023, see “Item 5A: Operating Results—Comparison of operating
performance on a segment basis in 2023 with 2022—All-in sustaining costs per ounce”.
In Australia, all-in costs marginally decreased by $19 per ounce, or one percent, from $1,631 per ounce in 2022 to $1,612 per
ounce in 2023. This marginal decrease was mainly due to lower non-sustaining capital expenditure and higher ounces of gold
sold, partially offset by higher all-in sustaining costs. For a discussion of capital expenditure in Australia during 2023, see “Item
5A: Operating Results—Comparison of capital expenditure in 2023, 2022 and 2021—Comparison of capital expenditure in
2023 with 2022”. Non-sustaining capital expenditure decreased year-on-year mainly due to lower non-sustaining capital
expenditure at Tropicana from decreased waste mining in the Havana cutback project during 2023. For a discussion of the
165
increase in all-in sustaining costs and the increase in ounces of gold sold in Australia during 2023, see “Item 5A: Operating
Results—Comparison of operating performance on a segment basis in 2023 with 2022—All-in sustaining costs per ounce”.
Overall, the subsidiaries’ all-in costs increased by $237 per ounce, or 14 percent, from $1,658 per ounce in 2022 to $1,895 per
ounce in 2023. Excluding CdS, the subsidiaries’ all-in costs increased by $238, or 15 percent, from $1,617 per ounce in 2022
to $1,855 per ounce in 2023. This increase was mainly due to an increase in all-in sustaining costs and a decrease in ounces
of gold sold, partially offset by lower non-sustaining capital expenditure. For a discussion of capital expenditure for the
subsidiaries during 2023, see “Item 5A: Operating Results—Comparison of capital expenditure in 2023, 2022 and 2021—
Comparison of capital expenditure in 2023 with 2022”. Excluding CdS, non-sustaining capital expenditure decreased year-on-
year mainly due to lower non-sustaining capital expenditure at Tropicana from decreased waste mining in the Havana cutback
project during 2023 and at Iduapriem mainly due to less work relating to buttressing the TSF as compared to 2022. For a
discussion of the increase in all-in sustaining costs and the decrease in ounces of gold sold for the subsidiaries during 2023,
see “Item 5A: Operating Results—Comparison of operating performance on a segment basis in 2023 with 2022—All-in
sustaining costs per ounce”.
Total cash costs per ounce
The currency of Brazil was, on average, stronger against the US dollar during 2023 as compared to 2022, which negatively
impacted total cash costs per ounce for 2023. This negative impact was partially offset by the currencies of Argentina and
Australia being, on average, weaker against the US dollar during 2023 as compared to 2022. Total Comparison of gold
production in 2023 with 2022 was lower as compared to 2022, which negatively impacted total cash costs per ounce for 2023.
For a discussion of gold production during 2023, see “Item 5A: Operating Results—Key factors affecting results—Comparison
of gold production in 2023 with 2022”.
In Africa - Subsidiaries, total cash costs increased by $98 per ounce, or ten percent, from $1,023 per ounce in 2022 to $1,121
per ounce in 2023. This increase was mainly due to a 100,000 ounce decrease in gold production.
At Iduapriem in Ghana, total cash costs decreased by $27 per ounce, or three percent, from $970 per ounce in 2022 to $943
per ounce in 2023. Total cash costs per ounce decreased year-on-year mainly due to higher gold production and favourable
ore stockpile movements, partially offset by higher royalties paid (due to the higher average gold price received per ounce).
At Obuasi in Ghana, total cash costs increased by $200 per ounce, or 22 percent, from $914 per ounce in 2022 to $1,114 per
ounce in 2023. Total cash costs per ounce increased year-on-year mainly due to lower gold production, partially offset by
favourable ore stockpile movements.
At Siguiri in Guinea, total cash costs increased by $331 per ounce, or 25 percent, from $1,319 per ounce in 2022 to $1,650 per
ounce in 2023. Total cash costs per ounce increased year-on-year mainly due to lower gold production and unfavourable ore
stockpile movements, partially offset by lower royalties paid.
At Geita in Tanzania, total cash costs increased by $40 per ounce, or four percent, from $944 per ounce in 2022 to $984 per
ounce in 2023. Total cash costs per ounce increased year-on-year mainly due to lower gold production and higher mining
costs resulting from an increase in open-pit mining at Nyamulilima and underground mining at Nyankanga, as well as an
increase in backfilling at Star and Comet and Nyankanga underground mines. This increase was partially offset by favourable
ore stockpile movements.
In Africa - Joint Ventures, total cash costs increased by $77 per ounce, or 11 percent, from $725 per ounce in 2022 to $802 per
ounce in 2023. This increase was mainly due to higher total operating costs as a result of higher labour and contractors’ costs,
commodity prices, logistics costs, consumable stores, services, other charges, fuel costs and royalties paid, partially offset by
cost reduction initiatives in both underground and open-pit mining and a 6,000 ounce increase in gold production. The Kibali
mine in the DRC was the only operating asset in Africa - Joint Ventures in 2023.
In the Americas, total cash costs increased by $133 per ounce, or 12 percent, from $1,078 per ounce in 2022 to $1,211 per
ounce in 2023. Excluding CdS, total cash costs in the Americas increased by $167 per ounce, or 17 percent, from $957 per
ounce in 2022 to $1,124 per ounce in 2023. This increase was mainly due to lower by-product revenue, higher operating costs
relating to labour, contractors, consumable stores and additional technical services, an average three percent strengthening of
the Brazilian real against the US dollar, additional costs to produce and sell gold-in-concentrate, additional operating costs
related to TSF management and a 9,000 ounce decrease in gold production. This increase was partially offset by an average
124 percent weakening of the Argentinean peso against the US dollar and lower royalties paid.
At AGA Mineração in Brazil, total cash costs increased by $122 per ounce, or 11 percent, from $1,088 per ounce in 2022 to
$1,210 per ounce in 2023. Excluding CdS, total cash costs at AGA Mineração increased by $200 per ounce, or 24 percent,
from $841 per ounce in 2022 to $1,041 per ounce in 2023. Excluding CdS, total cash costs per ounce were higher year-on-
year mainly due to lower by-product revenue as sulphuric acid sales remained suspended pending resumption of operation
from the Queiroz metallurgical plant, higher operating costs relating to labour, contractors and consumable stores, an average
166
three percent strengthening of the Brazilian real against the US dollar, additional costs to produce and sell gold-in-concentrate
and additional operating costs related to TSF management. This increase was partially offset by lower royalties paid.
At Serra Grande in Brazil, total cash costs increased by $143 per ounce, or 11 percent, from $1,355 per ounce in 2022 to
$1,498 per ounce in 2023. Total cash costs per ounce increased year-on-year mainly due to marginally lower gold production,
unfavourable ore stockpile movements as well as increases in operating costs relating to labour, contractors, additional
technical services and an average three percent strengthening of the Brazilian real against the US dollar.
At Cerro Vanguardia in Argentina, total cash costs increased by $132 per ounce, or 14 percent, from $913 per ounce in 2022
to $1,045 per ounce in 2023. Total cash costs per ounce were higher year-on-year mainly due to cost increases related to
labour, fuel, power, explosives and services, higher consumption of materials and services as well as unfavourable ore
stockpile movements. This increase was partially offset by higher by-product income, an average 124 percent weakening of
the Argentinean peso against the US dollar and capitalised stripping costs.
In Australia, total cash costs increased by $94 per ounce, or eight percent, from $1,157 per ounce in 2022 to $1,251 per ounce
in 2023, mainly due to higher waste stripping costs and higher mining costs related to labour, consumable stores and drilling
and blasting, partially offset by favourable ore stockpile movements, an average five percent weakening of the Australian dollar
against the US dollar and a 24,000 ounce increase in gold production.
At Sunrise Dam in Australia, total cash costs decreased by $84 per ounce, or six percent, from $1,402 per ounce in 2022 to
$1,318 per ounce in 2023. Total cash costs per ounce were lower year-on-year primarily due to higher gold production and
favourable gold in process movements as well as an average five percent weakening of the Australian dollar against the US
dollar, partially offset by higher royalties paid as well as higher labour and consumable stores costs.
At Tropicana in Australia, total cash costs increased by $224 per ounce, or 25 percent, from $881 per ounce in 2022 to $1,105
per ounce in 2023. Total cash costs per ounce increased year-on-year mainly due to higher waste stripping costs and higher
mining costs related to drilling and blasting, partially offset by favourable ore stockpile movements and an average five percent
weakening of the Australian dollar against the US dollar.
Overall, the subsidiaries’ total cash costs increased by $108 per ounce, or 10 percent, from $1,066 per ounce in 2022 to
$1,174 per ounce in 2023. Excluding CdS, the subsidiaries’ total cash costs increased by $114, or 11 percent, from $1,040 per
ounce in 2022 to $1,154 per ounce in 2023. This increase was mainly due to an 85,000 ounce decrease in gold production and
higher total operating costs as a result of higher labour and contractors costs, commodity prices, logistics costs, power costs,
consumable stores, services, other charges and royalties paid, the strengthening of the Brazilian real against the US dollar,
higher waste stripping costs at Tropicana in line with plan, as well as additional costs related to Brazil and the CIL tank failure
at Siguiri. This increase was partially offset by the weakening of the Australian dollar and the Argentinean peso against the US
dollar, lower fuel cost and favourable ore stockpile movements.
Comparison of operating performance on a segment basis in 2022 with 2021
Cost of sales
In Africa - Subsidiaries, cost of sales increased by $364 million, or 28 percent, from $1,302 million in 2021 to $1,666 million in
2022. This increase was largely due to higher operating costs related to labour, contractors, commodity prices, logistics,
consumable stores, services, other charges, fuel and power, higher royalties paid and higher amortisation of tangible assets.
Higher commodity costs were mainly due to an increase in the prices of steel, support and construction materials, explosives,
timber and reagents. Higher fuel and power costs were mainly due to the increase in the average price of Brent Crude oil,
which increased from $71 per barrel in 2021 to $97 per barrel in 2022, a $26, or a 37 percent, per barrel increase. COVID-19
continued to present challenges within the overall logistics sector resulting in higher cost of transportation, warehousing and
inventory prices, but to a lesser extent than in 2021. This increase in cost of sales was partially offset by lower environmental
rehabilitation and other non-cash costs and inventory changes in 2022 as compared to 2021.
At Iduapriem in Ghana, cost of sales increased by $76 million, or 32 percent, from $238 million in 2021 to $314 million in 2022.
Cost of sales at Iduapriem increased year-on-year mainly due to higher amortisation of tangible assets as a result of higher
gold production and higher capital expenditure in 2022. This increase in cost of sales was partially offset by lower
environmental rehabilitation and other non-cash costs in 2022.
At Obuasi in Ghana, cost of sales increased by $102 million, or 62 percent, from $164 million in 2021 to $266 million in 2022.
Cost of sales at Obuasi increased year-on-year mainly due to the resumption of stoping activities during 2022, following the
temporary suspension of underground stoping activities in 2021 following a sill pillar incident in May 2021. Amortisation of
heavy mobile equipment increased mainly due to the reset of the useful life of the mining fleet and Mineral Reserve
development amortisation increased as the assets were transferred from being under construction to Mineral Reserve
development assets in 2022. Royalties paid were higher due to higher ounces of gold sold in 2022. Phase 3 of the Obuasi
redevelopment project, which relates principally to capital expenditure to refurbish existing infrastructure around the KMS
167
Shaft, as well as to service the mine in deeper production areas, continued to progress. This increase in cost of sales was
partially offset by lower environmental rehabilitation and other non-cash costs, and favourable gold inventory movements due
to the lower cost of unsold gold with the timing of gold shipments.
At Siguiri in Guinea, cost of sales increased by $80 million, or 19 percent, from $412 million in 2021 to $492 million in 2022.
Cost of sales at Siguiri increased year-on-year mainly due to higher operating costs related to fuel and an average seven
percent strengthening of the Guinean franc against the US dollar. This increase in cost of sales was partially offset by lower
environmental rehabilitation and other non-cash costs.
At Geita in Tanzania, cost of sales increased by $106 million, or 22 percent, from $488 million in 2021 to $594 million in 2022.
Cost of sales at Geita increased year-on-year mainly due to higher operating costs related to fuel, increased engineering costs
from the acceleration of HME fleet rebuilds as the open pit mine expanded, as well as higher underground contractors’ costs
and higher royalties paid. Mineral Reserve development amortisation increased mainly due to a variation in the expenditure
pattern which did not occur in 2021. Amortisation of leases increased mainly due to contract modifications in 2022.
Amortisation of tangible assets increased mainly due to a reset of the amortisation drivers early in 2022. This increase in cost
of sales was partially offset by lower inventory costs.
In Africa - Joint Ventures, cost of sales marginally decreased by $8 million, or two percent, from $350 million in 2021 to $342
million in 2022. This marginal decrease was mainly due to lower amortisation of tangible assets, favourable ore stockpile
movements and lower royalties paid due to a decrease in ounces sold, partially offset by higher fuel costs. The Kibali mine in
the DRC was the only operating asset in Africa - Joint Ventures in 2022.
In the Americas, cost of sales increased by $91 million, or 11 percent, from $822 million in 2021 to $913 million in 2022. This
increase was mainly due to higher operating costs related to labour and contractors’ costs, commodity prices, logistics costs,
consumable stores, services and other charges, power and fuel cost, higher amortisation of tangible and right of use assets
and higher write down of inventory, and an average four percent strengthening of the Brazilian real against the US dollar.
Royalties paid were higher mainly due to an increase in ounces of gold sold in 2022 as compared to 2021.The higher labour
and contractors’ costs were mainly due to cost increases resulting from challenges relating to shortages of critical skills. Higher
commodity costs were mainly due to an increase in the prices of steel, support and construction materials, explosives, timber
and reagents. COVID-19 continued to present challenges within the overall logistics sector resulting in higher cost of
transportation, warehousing and inventory prices, but to a lesser extent than in 2021. Higher fuel and power costs were mainly
due to the increase in the price of Brent Crude oil. This increase in cost of sales was partially offset by lower environmental
rehabilitation and other non-cash costs, inventory changes as well as an average 37 percent weakening of the Argentinean
peso against the US dollar in 2022, as compared to 2021. Excluding CdS, cost of sales in the Americas increased by $77
million, or 11 percent, from $673 million in 2021 to $750 million in 2022.
At AGA Mineração in Brazil, cost of sales increased by $42 million, or ten percent, from $435 million in 2021 to $477 million in
2022. Cost of sales at AGA Mineração increased year-on-year mainly due to higher operating costs relating to commodity
prices (oil, iron ore and construction materials), services, fuel, power and labour, and a higher write down of inventory, as well
as an average four percent strengthening of the Brazilian real against the US dollar. Excluding CdS, cost of sales at AGA
Mineração increased by $28 million, or ten percent, from $286 million in 2021 to $314 million in 2022.
At Serra Grande in Brazil, cost of sales increased by $39 million, or 32 percent, from $123 million in 2021 to $162 million in
2022. Cost of sales at Serra Grande increased year-on-year mainly due to higher operating costs relating to commodity prices,
labour, consumable stores, fuel and power as well as activity changes primarily caused by various production challenges
encountered during 2022. Cost of sales was further increased by an average four percent strengthening of the Brazilian real
against the US dollar.
At Cerro Vanguardia in Argentina, cost of sales increased by $12 million, or five percent, from $261 million in 2021 to $273
million in 2022. Cost of sales at Cerro Vanguardia increased year-on-year mainly due to higher operating costs related to
salary increases, fuel costs and higher materials consumption (such as fuel, explosives, and spare parts) because of higher
tonnes mined. This increase was partially offset by an average 37 percent weakening of the Argentinean peso against the US
dollar, and favourable inventory change movements.
In the Americas other segment, cost of sales decreased by $2 million, or 67 percent, from $3 million in 2021 to $1 million in
2022.
In Australia, cost of sales increased by $43 million, or six percent, from $740 million in 2021 to $783 million in 2022. This
increase was mainly due to higher operating costs related to labour, contractors, commodity prices, logistics costs,
consumable stores, services and other charges, and power and fuel costs, higher amortisation of tangible assets, and higher
royalties paid mainly due to an increase in ounces of gold sold in 2022 as compared to 2021. The higher labour and
contractors’ costs were mainly due to cost increases resulting from challenges with shortages of critical skills. Higher
commodity costs were mainly due to an increase in the prices of steel, support and construction materials, explosives, timber
and reagents. COVID-19 continued to present challenges within the overall logistics sector resulting in higher cost of
168
transportation, warehousing and inventory prices, but to a lesser extent than in 2021. Higher fuel and power costs were mainly
due to the increase in the price of Brent Crude oil. This increase in cost of sales was partially offset by lower environmental
rehabilitation and other non-cash costs, and an average eight percent weakening of the Australian dollar against the US dollar
in 2022, as compared to 2021.
At Sunrise Dam in Australia, cost of sales marginally increased by $7 million, or two percent, from $364 million in 2021 to $371
million in 2022. Cost of sales at Sunrise Dam marginally increased year-on-year primarily due to higher operating costs
relating to contractors (mainly higher cost of labour due to critical skill shortages), fuel and mining costs. This increase was
partially offset by a lower cost of gold inventory changes due to timing of gold pours and shipments.
At Tropicana in Australia, cost of sales increased by $36 million, or ten percent, from $346 million in 2021 to $382 million in
2022. Cost of sales at Tropicana increased year-on-year mainly due to higher operating costs relating to contractors (mainly
higher cost of labour due to critical skill shortages), consumable stores, service costs, fuel and power, gold inventory changes,
royalties paid and higher Mineral Reserve development and deferred stripping amortisation. This increase was partially offset
by lower environmental rehabilitation and other non-cash costs and favourable ore stockpile movements.
Overall, the subsidiaries’ cost of sales increased by $507 million, or 18 percent, from $2,859 million in 2021 to $3,366 million in
2022. For a discussion of the breakdown of cost of sales during 2022, see “Item 5A: Operating Results—Comparison of
financial performance in 2022 with 2021—Cost of sales”. Excluding CdS, the subsidiaries’ cost of sales increased by $493
million, or 18 percent, from $2,710 million in 2021 to $3,203 million in 2022.
All-in sustaining costs per ounce
In Africa - Subsidiaries, all-in sustaining costs marginally increased by $27 per ounce, or two percent, from $1,264 per ounce in
2021 to $1,291 per ounce in 2022. This marginal increase was mainly due to an increase in cost of sales and an increase in
sustaining capital expenditure, partially offset by an increase in ounces of gold sold. For a discussion of the increase in cost of
sales in Africa - Subsidiaries during 2022, see “Item 5A: Operating Results—Comparison of operating performance on a
segment basis in 2022 with 2021—Cost of sales”. For a discussion of capital expenditure in Africa - Subsidiaries during 2022,
see “Item 5A: Operating Results—Comparison of capital expenditure in 2023, 2022 and 2021—Comparison of capital
expenditure in 2022 with 2021”. Sustaining capital expenditure in Africa - Subsidiaries increased as the region continued to
implement its reinvestment programme. At Iduapriem in Ghana, sustaining capital expenditure decreased year-on-year mainly
due to lower pre-stripping expenditure in Cut 2. At Obuasi in Ghana, sustaining capital expenditure increased year-on-year
mainly due to the ongoing progress of Phase 3 of the Obuasi redevelopment project, which relates principally to capital
expenditure to refurbish existing infrastructure around the KMS Shaft, as well as to service the mine in deeper production
areas. At Geita, sustaining capital expenditure increased year-on-year mainly due to higher deferred stripping activities and
Mineral Reserve development capital expenditure. Gold sold in Africa - Subsidiaries increased by 221,000 ounces, or 21
percent, from 1,060,000 ounces in 2021 to 1,281,000 ounces in 2022. The increase was largely due to higher gold production
across all operations in Africa - Subsidiaries. For a discussion of the increase in gold production at the Africa - Subsidiaries
operations during 2022, see “Item 5A: Operating Results—Key factors affecting results—Comparison of gold production in
2022 with 2021”.
In Africa - Joint Ventures, all-in sustaining costs increased by $123 per ounce, or 14 percent, from $856 per ounce in 2021 to
$979 per ounce in 2022. This increase was mainly due to an increase in sustaining capital expenditure and lower ounces of
gold sold, partially offset by lower cost of sales. For a discussion of the decrease in cost of sales in Africa - Joint Ventures
during 2022, see “Item 5A: Operating Results—Comparison of operating performance on a segment basis in 2022 with 2021—
Cost of sales”. For a discussion of capital expenditure in Africa - Joint Ventures during 2022, see “Item 5A: Operating Results
—Comparison of capital expenditure in 2023, 2022 and 2021—Comparison of capital expenditure in 2022 with 2021”.
Sustaining capital expenditure in Africa - Joint Ventures increased year-on-year mainly due to higher expenditure on the
cyanide recovery plant. Gold sold in Africa - Joint Ventures decreased by 35,000 ounces, or ten percent, from 367,000 ounces
in 2021 to 332,000 ounces in 2022. The decrease was mainly due to lower gold production from Kibali. For a discussion of the
decrease in gold production at Kibali during 2022, see “Item 5A: Operating Results—Key factors affecting results—
Comparison of gold production in 2022 with 2021”. The Kibali mine in the DRC was the only operating asset in Africa - Joint
Ventures in 2022.
In the Americas, all-in sustaining costs increased by $131 per ounce, or eight percent, from $1,587 per ounce in 2021 to
$1,718 per ounce in 2022. Excluding CdS, all-in sustaining costs in the Americas increased by $98 per ounce, or seven
percent, from $1,457 per ounce in 2021 to $1,555 per ounce in 2022. This increase was mainly due to an increase in cost of
sales, partially offset by lower sustaining capital expenditure and higher ounces of gold sold. For a discussion of the increase
in cost of sales in the Americas during 2022, see “Item 5A: Operating Results—Comparison of operating performance on a
segment basis in 2022 with 2021—Cost of sales”. For a discussion of capital expenditure in the Americas during 2022, see
“Item 5A: Operating Results—Comparison of capital expenditure in 2023, 2022 and 2021—Comparison of capital expenditure
in 2022 with 2021”. Sustaining capital expenditure in the Americas decreased year-on-year as the region had lower investment
in TSF projects in 2022 as compared to 2021. Excluding CdS, at AGA Mineração in Brazil, sustaining capital expenditure
increased year-on-year mainly due to higher Mineral Reserve development expenditures. At Serra Grande in Brazil,
169
sustaining capital expenditure decreased year-on-year mainly due to lower TSF expenditures, partially offset by higher Mineral
Reserve development expenditures. At Cerro Vanguardia in Argentina, sustaining capital expenditure decreased year-on-year
mainly due to lower expenditure on TSFs in 2022, partially offset by higher deferred stripping capital and Mineral Reserve
development expenditures in 2022. Excluding CdS, gold sold in the Americas increased by 14,000 ounces, or three percent,
from 482,000 ounces in 2021 to 496,000 ounces in 2022. This increase was mainly due to higher gold production from Serra
Grande and Cerro Vanguardia, partially offset by lower gold production from AGA Mineração. For a discussion of the increase
in gold production at the Americas operations during 2022, see “Item 5A: Operating Results—Key factors affecting results—
Comparison of gold production in 2022 with 2021”.
In Australia, all-in sustaining costs decreased by $155 per ounce, or ten percent, from $1,500 per ounce in 2021 to $1,345 per
ounce in 2022. This decrease was mainly due to lower sustaining capital expenditure and an increase in ounces of gold sold,
partially offset by an increase in cost of sales. For a discussion of the increase in cost of sales in Australia during 2022, see
“Item 5A: Operating Results—Comparison of operating performance on a segment basis in 2022 with 2021—Cost of sales”.
For a discussion of capital expenditure in Australia during 2022, see “Item 5A: Operating Results—Comparison of capital
expenditure in 2023, 2022 and 2021—Comparison of capital expenditure in 2022 with 2021”. Sustaining capital expenditure
decreased in Australia year-on-year mainly due to lower stripping and pre-stripping expenditure. At Sunrise Dam in Australia,
sustaining capital expenditure increased year-on-year mainly due to the camp extension. At Tropicana in Australia, sustaining
capital expenditure decreased year-on-year mainly due to lower deferred stripping and pre-stripping expenditure due to mining
different ore bodies and at different phases to 2021. Gold sold in Australia increased by 44,000 ounces, or nine percent, from
495,000 ounces in 2021 to 539,000 ounces in 2022. This increase was mainly due to higher gold production at Sunrise Dam
and Tropicana. For a discussion of the increase in gold production at the Australia operations during 2022, see “Item 5A:
Operating Results—Key factors affecting results—Comparison of gold production in 2022 with 2021”.
Overall, the subsidiaries’ all-in sustaining costs marginally decreased by $2 per ounce, or less than one percent, from $1,441
per ounce in 2021 to $1,439 per ounce in 2022. Excluding CdS, the subsidiaries’ all-in sustaining costs marginally decreased
by $12, or one percent, from $1,408 per ounce in 2021 to $1,396 per ounce in 2022. This marginal decrease was mainly due
to an increase in ounces of gold sold, partially offset by an increase in cost of sales. For a discussion of the increase in cost of
sales for the subsidiaries during 2022, see “Item 5A: Operating Results—Comparison of operating performance on a segment
basis in 2022 with 2021—Cost of sales”. Excluding CdS, gold sold for the subsidiaries increased by 279,000 ounces, or 14
percent, from 2,037,000 ounces in 2021 to 2,316,000 ounces in 2022. This increase was mainly due to higher gold production
from Obuasi, Iduapriem, Siguiri, Geita, Serra Grande, Cerro Vanguardia, Sunrise Dam and Tropicana, partially offset by lower
gold production from Kibali and AGA Mineração. For a discussion of the increase in gold production for the subsidiaries during
2022, see “Item 5A: Operating Results—Key factors affecting results—Comparison of gold production in 2022 with 2021”.
All-in costs per ounce
In Africa - Subsidiaries, all-in costs decreased by $82 per ounce, or five percent, from $1,516 per ounce in 2021 to $1,434 per
ounce in 2022. This decrease was mainly due to an increase in gold sold, lower non-sustaining capital expenditure and lower
care and maintenance costs, partially offset by higher all-in sustaining costs. For a discussion of capital expenditure in Africa -
Subsidiaries during 2022, see “Item 5A: Operating Results—Comparison of capital expenditure in 2023, 2022 and 2021—
Comparison of capital expenditure in 2022 with 2021”. At Obuasi in Ghana, Phase 3 of the Obuasi redevelopment project,
which relates principally to capital expenditure to refurbish existing infrastructure around the KMS Shaft, as well as to service
the mine in deeper production areas, continued to progress. Care and maintenance activities of $45 million incurred in 2021 at
the Obuasi mine during the voluntary suspension of underground mining between May and October 2021 following a sill pillar
incident were not repeated in 2022. Non-sustaining capital expenditure at Obuasi was lower mainly due to different project
scopes and cash flows. This decrease was largely offset by higher non-sustaining capital expenditure at Iduapriem in Ghana
mainly due to increased TSF investment in 2022. For a discussion of the increase in all-in sustaining costs and the increase in
ounces of gold sold in Africa - Subsidiaries during 2022, see “Item 5A: Operating Results—Comparison of operating
performance on a segment basis in 2022 with 2021—All-in sustaining costs per ounce”.
In Africa - Joint Ventures, all-in costs increased by $175 per ounce, or 19 percent, from $900 per ounce in 2021 to $1,075 per
ounce in 2022. This increase was mainly due to an increase in all-in sustaining costs and higher non-sustaining capital
expenditure, and lower gold sold. For a discussion of capital expenditure in Africa - Joint Ventures during 2022, see “Item 5A:
Operating Results—Comparison of capital expenditure in 2023, 2022 and 2021—Comparison of capital expenditure in 2022
with 2021”. Non-sustaining capital expenditure in Africa - Joint Ventures increased year-on-year mainly due to higher non-
sustaining capital expenditure on exploration. For a discussion of the increase in all-in sustaining costs and the decrease in
ounces of gold sold in Africa - Joint Ventures during 2022, see “Item 5A: Operating Results—Comparison of operating
performance on a segment basis in 2022 with 2021—All-in sustaining costs per ounce”. The Kibali mine in the DRC was the
only operating asset in Africa - Joint Ventures in 2022.
In the Americas, all-in costs increased by $140 per ounce, or nine percent, from $1,635 per ounce in 2021 to $1,775 per ounce
in 2022. Excluding CdS, all-in costs in the Americas increased by $108 per ounce, or seven percent, from $1,495 per ounce in
2021 to $1,603 per ounce in 2022. This increase was mainly due to higher all-in sustaining costs, partially offset by higher
ounces of gold sold. For a discussion of the increase in all-in sustaining costs and the increase in ounces of gold sold in the
170
Americas during 2022, see “Item 5A: Operating Results—Comparison of operating performance on a segment basis in 2022
with 2021—All-in sustaining costs per ounce”.
In Australia, all-in costs decreased by $94 per ounce, or five percent, from $1,725 per ounce in 2021 to $1,631 per ounce in
2022. This decrease was mainly due to lower all-in sustaining costs, lower non-sustaining exploration and study costs relating
to growth deposits at Sunrise Dam and Tropicana, and higher ounces of gold sold, partially offset by higher non-sustaining
capital expenditure. For a discussion of capital expenditure in Australia during 2022, see “Item 5A: Operating Results—
Comparison of capital expenditure in 2023, 2022 and 2021—Comparison of capital expenditure in 2022 with 2021”. Non-
sustaining capital expenditure in Australia increased year-on-year mainly due to higher non-sustaining capital expenditure at
Tropicana from increased waste mining in the Havana cutback project during 2022. For a discussion of the decrease in all-in
sustaining costs and the increase in ounces of gold sold in Australia during 2022, see “Item 5A: Operating Results—
Comparison of operating performance on a segment basis in 2022 with 2021—All-in sustaining costs per ounce”.
Overall, the subsidiaries’ all-in costs marginally decreased by $37 per ounce, or two percent, from $1,695 per ounce in 2021 to
$1,658 per ounce in 2022. Excluding CdS, the subsidiaries’ all-in costs decreased by $49, or three percent, from $1,666 per
ounce in 2021 to $1,617 per ounce in 2022. This decrease was mainly due to a decrease in all-in sustaining costs and an
increase in ounces of gold sold. For a discussion of the decrease in all-in sustaining costs and the increase in ounces of gold
sold for the subsidiaries during 2022, see “Item 5A: Operating Results—Comparison of operating performance on a segment
basis in 2022 with 2021—All-in sustaining costs per ounce”.
Total cash costs per ounce
The currencies of Argentina and Australia were, on average, weaker against the US dollar during 2022 as compared to 2021,
which positively impacted total cash costs per ounce for 2022. This positive impact was partially offset by the currency of Brazil
being, on average, stronger against the US dollar during 2022 as compared to 2021. Total gold production in 2022 was higher
as compared to 2021, which positively impacted total cash costs per ounce for 2022. For a discussion of gold production
during 2022, see “Item 5A: Operating Results—Key factors affecting results—Comparison of gold production in 2022 with
2021”.
In Africa - Subsidiaries, total cash costs increased by $32 per ounce, or three percent, from $991 per ounce in 2021 to $1,023
per ounce in 2022. This increase was mainly due to higher operating costs related to labour, contractors, commodity prices,
consumable stores, services, other charges, fuel and power and higher royalties paid, partially offset by a 244,000 ounce
increase in gold production.
At Iduapriem in Ghana, total cash costs decreased by $111 per ounce, or ten percent, from $1,081 per ounce in 2021 to $970
per ounce in 2022. Total cash costs per ounce decreased year-on-year mainly due to higher gold production and favourable
ore stockpile movements, partially offset by an increase in fuel costs and higher royalties paid.
At Obuasi in Ghana, total cash costs decreased by $198 per ounce, or 18 percent, from $1,112 per ounce in 2021 to $914 per
ounce in 2022. Total cash costs per ounce decreased year-on-year mainly due to higher gold production.
At Siguiri in Guinea, total cash costs increased by $119 per ounce, or ten percent, from $1,200 per ounce in 2021 to $1,319
per ounce in 2022. Total cash costs per ounce increased year-on-year mainly due to higher fuel costs and an average seven
percent strengthening of the Guinean franc against the US dollar, partially offset by an increase in gold production.
At Geita in Tanzania, total cash costs increased by $122 per ounce, or 15 percent, from $822 per ounce in 2021 to $944 per
ounce in 2022. Total cash costs per ounce increased year-on-year mainly due to higher fuel costs, increased engineering costs
from heavy mining equipment maintenance as the open-pit mine expanded, as well as higher underground contractors’ costs
and higher royalties paid. This increase was partially offset by higher gold production.
In Africa - Joint Ventures, total cash costs increased by $78 per ounce, or 12 percent, from $647 per ounce in 2021 to $725 per
ounce in 2022. This increase was mainly due to lower gold production and higher fuel costs, partially offset by favourable ore
stockpile movements and lower royalties paid. The Kibali mine in the DRC was the only operating asset in Africa - Joint
Ventures in 2022.
In the Americas, total cash costs increased by $157 per ounce, or 17 percent, from $921 per ounce in 2021 to $1,078 per
ounce in 2022. Excluding CdS, total cash costs in the Americas increased by $126 per ounce, or 15 percent, from $831 per
ounce in 2021 to $957 per ounce in 2022. This increase was mainly due to higher fuel costs and consumable stores, lower by-
product revenue, unfavourable movements in inventories and an average four percent strengthening of the Brazilian real
against the US dollar, partially offset by an average 37 percent weakening of the Argentinean peso against the US dollar and a
10,000 ounce increase in gold production.
At AGA Mineração in Brazil, total cash costs increased by $230 per ounce, or 27 percent, from $858 per ounce in 2021 to
$1,088 per ounce in 2022. Excluding CdS, total cash costs at AGA Mineração increased by $166 per ounce, or 25 percent,
171
from $675 per ounce in 2021 to $841 per ounce in 2022. Excluding CdS, total cash costs per ounce were higher year-on-year
mainly due to lower gold production, higher fuel costs, lower by-product revenue, unfavourable movement in inventories, repair
costs incurred in the second half of 2022 due to extreme weather earlier in 2022, and an average four percent strengthening of
the Brazilian real against the US dollar.
At Serra Grande in Brazil, total cash costs increased by $163 per ounce, or 14 percent, from $1,192 per ounce in 2021 to
$1,355 per ounce in 2022. Total cash costs per ounce increased year-on-year mainly due to higher fuel costs, higher royalties
paid and an average four percent strengthening of the Brazilian real against the US dollar, partially offset by higher gold
production.
At Cerro Vanguardia in Argentina, total cash costs marginally increased by $19 per ounce, or two percent, from $894 per
ounce in 2021 to $913 per ounce in 2022. Total cash costs per ounce were marginally higher year-on-year mainly due to
higher fuel costs, higher materials consumption (such as fuel, explosives, and spare parts) as a result of higher tonnes mined
and lower by-product revenue due to lower silver sales. This increase was partially offset by higher gold production and an
average 37 percent weakening of the Argentinean peso against the US dollar.
In Australia, total cash costs decreased by $39 per ounce, or three percent, from $1,196 per ounce in 2021 to $1,157 per
ounce in 2022, primarily due to a 44,000 ounce increase in gold production and an average eight percent weakening of the
Australian dollar against the US dollar, partially offset by an increase in fuel and mining costs.
At Sunrise Dam in Australia, total cash costs increased by $81 per ounce, or six percent, from $1,321 per ounce in 2021 to
$1,402 per ounce in 2022. Total cash costs per ounce were higher year-on-year primarily due to higher fuel and mining costs,
partially offset by an average eight percent weakening of the Australian dollar against the US dollar and favourable ore
stockpile movements.
At Tropicana in Australia, total cash costs decreased by $106 per ounce, or 11 percent, from $987 per ounce in 2021 to $881
per ounce in 2022. Total cash costs per ounce decreased year-on-year mainly due to higher gold production, lower mining
costs related to an increase in ore mining volumes in the Boston Shaker open pit and underground mine, favourable ore
stockpile movements and an average eight percent weakening of the Australian dollar against the US dollar, partially offset by
higher fuel costs and higher royalties paid.
Overall, the subsidiaries’ total cash costs increased by $49 per ounce, or five percent, from $1,017 per ounce in 2021 to
$1,066 per ounce in 2022. Excluding CdS, the subsidiaries’ total cash costs increased by $39, or four percent, from $1,001 per
ounce in 2021 to $1,040 per ounce in 2022. This increase was mainly due to higher operating costs related to fuel,
consumable stores, mining and contractors, lower by-product revenue, unfavourable movements in inventories and higher
royalties paid, partially offset by a 306,000 ounce increase in gold production.
Reconciliations
Average gold price received per ounce
A reconciliation of gold income as included in the Company’s audited financial statements to “average gold price received per
ounce” for each of the three years in the period ended 31 December 2023 is presented on a total (subsidiaries/joint ventures)
basis in the table below.
Average gold price received per ounce for AngloGold Ashanti | Year ended 31 December | ||||||
2023 | 2022 | 2021 | |||||
Subsidiaries | Joint Ventures | Subsidiaries | Joint Ventures | Subsidiaries | Joint Ventures | ||
Gold income (million US dollars) | 4,480 | 668 | 4,388 | 596 | 3,903 | 659 | |
Realised gain on non-hedge derivatives | 2 | — | — | — | — | — | |
Adjusted for non-controlling interests (million US dollars) | (99) | — | (112) | — | (103) | — | |
4,383 | 668 | 4,276 | 596 | 3,800 | 659 | ||
Attributable gold sold - oz (000) | 2,273 | 343 | 2,385 | 332 | 2,116 | 367 | |
Average gold price received per ounce ($/oz) | 1,928 | 1,948 | 1,793 | 1,795 | 1,796 | 1,797 | |
172
Sustaining capital expenditure and non-sustaining capital expenditure
A reconciliation of capital expenditure as included in the Company’s audited financial statements to “sustaining capital
expenditure” and “non-sustaining capital expenditure” for each of the three years in the period ended 31 December 2023 is
presented on a total (subsidiaries/joint ventures) and segment basis in the tables below.
All-in sustaining costs, all-in costs and total cash costs per ounce
A reconciliation of cost of sales as included in the Company’s audited financial statements to “all-in sustaining costs”, “all-in
sustaining costs per ounce”, “all-in costs”, “all-in costs per ounce”, “total cash costs” and “total cash costs per ounce” for each
of the three years in the period ended 31 December 2023 is presented on a total (subsidiaries/joint ventures) and segment
basis in the tables below. In addition, the Company has provided detail of the attributable ounces of gold produced and sold by
mine for each of those periods below.
173
For the year ended 31 December 2023 | ||||||||||||||
(in US dollar million, except as otherwise noted) | ||||||||||||||
AFRICA | AUSTRALIA | |||||||||||||
Corporate and other(5) | Kibali | Other | Joint Ventures | Iduapriem | Obuasi | Siguiri | Geita | Africa other | Subsidiaries | Sunrise Dam | Tropicana | Australia other | Australia | |
All-in sustaining costs | ||||||||||||||
Cost of sales per segmental information(4) | 4 | 372 | — | 372 | 387 | 313 | 473 | 566 | — | 1,739 | 399 | 438 | 30 | 867 |
By-product revenue | — | (2) | — | (2) | — | (1) | — | (2) | — | (3) | (1) | (3) | — | (4) |
Realised other commodity contracts | 7 | — | — | — | — | — | — | — | — | — | — | — | — | — |
Amortisation of tangible, intangible and right of use assets | (5) | (99) | — | (99) | (129) | (61) | (39) | (91) | — | (320) | (58) | (104) | (1) | (163) |
Adjusted for decommissioning and inventory amortisation | — | 1 | — | 1 | — | — | — | (1) | — | (1) | (1) | — | — | (1) |
Corporate administration, marketing and related expenses | 92 | — | — | — | — | — | — | — | — | — | — | — | — | — |
Lease payment sustaining | 2 | 2 | — | 2 | 3 | — | — | 26 | — | 29 | 16 | 11 | 1 | 28 |
Sustaining exploration and study costs | — | — | — | — | — | 2 | 6 | 12 | (1) | 19 | 2 | 1 | — | 3 |
Total sustaining capital expenditure | 1 | 52 | — | 52 | 96 | 148 | 74 | 162 | — | 480 | 47 | 50 | 1 | 98 |
All-in sustaining costs | 101 | 326 | — | 326 | 357 | 401 | 514 | 672 | (1) | 1,943 | 404 | 393 | 31 | 828 |
Adjusted for non-controlling interests and non-gold producing companies(1) | — | — | — | — | — | — | (77) | — | — | (77) | — | — | — | — |
All-in sustaining costs adjusted for non-controlling interest and non- gold producing companies | 101 | 326 | — | 326 | 357 | 401 | 437 | 672 | (1) | 1,866 | 404 | 393 | 31 | 828 |
All-in sustaining costs | 101 | 326 | — | 326 | 357 | 401 | 514 | 672 | (1) | 1,943 | 404 | 393 | 31 | 828 |
Non-sustaining capital expenditure | — | 33 | — | 33 | 46 | 66 | 4 | 29 | — | 145 | — | 37 | — | 37 |
Non-sustaining lease payments | — | — | — | — | — | — | — | 2 | — | 2 | — | — | — | — |
Non-sustaining exploration and study costs | — | 1 | — | 1 | — | — | 7 | 9 | 1 | 17 | 5 | 6 | 22 | 33 |
Care and maintenance | — | — | — | — | — | — | — | — | — | — | — | — | — | — |
Closure and social responsibility costs not related to current operations | 5 | 7 | 1 | 8 | (1) | (4) | — | 1 | 1 | (3) | 1 | (1) | (1) | (1) |
Other provisions | 1 | — | — | — | — | — | — | — | — | — | — | — | — | — |
All-in costs | 107 | 367 | 1 | 368 | 402 | 463 | 525 | 713 | 1 | 2,104 | 410 | 435 | 52 | 897 |
Adjusted for non-controlling interests and non-gold producing companies(1) | — | — | — | — | — | — | (79) | — | — | (79) | — | — | — | — |
All-in costs adjusted for non-controlling interest and non-gold producing companies | 107 | 367 | 1 | 368 | 402 | 463 | 446 | 713 | 1 | 2,025 | 410 | 435 | 52 | 897 |
Gold sold - oz (000)(2) | — | 343 | — | 343 | 268 | 226 | 221 | 479 | — | 1,194 | 256 | 301 | — | 557 |
All-in sustaining cost per ounce - $/oz(3) | — | 951 | — | 951 | 1,329 | 1,777 | 1,976 | 1,403 | — | 1,563 | 1,583 | 1,304 | — | 1,487 |
All-in cost per ounce - $/oz(3) | — | 1,069 | — | 1,074 | 1,500 | 2,050 | 2,020 | 1,488 | — | 1,696 | 1,603 | 1,446 | — | 1,612 |
(1) Adjusting for non-controlling interest of items included in calculation, to disclose the attributable portions only. | ||||||||||||||
(2) Attributable portion. | ||||||||||||||
(3) In addition to the operational performances of the mines, “all-in sustaining cost per ounce”, “all-in cost per ounce” and “total cash costs per ounce” are affected by fluctuations in the currency exchange rate. AngloGold Ashanti reports “all-in sustaining cost per ounce” and “all-in cost per ounce” calculated to the nearest US dollar amount and gold sold in ounces. AngloGold Ashanti reports “total cash costs per ounce” calculated to the nearest US dollar amount and gold produced in ounces. | ||||||||||||||
(4) Refer to “Item 18: Financial Statements—Note 2—Segmental Information”. | ||||||||||||||
(5) Corporate includes non-gold producing subsidiaries. | ||||||||||||||
(6) Adjusted to exclude the Córrego do Sítio (CdS) operation which was placed on care and maintenance in August 2023. | ||||||||||||||
Rounding of figures may result in computational discrepancies.
174
For the year ended 31 December 2023 | |||||||||||||
(in US dollar million, except as otherwise noted) | |||||||||||||
AMERICAS | Adjusted to exclude the Córrego do Sítio operation | ||||||||||||
Cerro Vanguardia | AngloGold Ashanti Mineração | Serra Grande | Americas other | Americas | Projects | Joint Ventures | Subsidiaries | Córrego do Sítio | AngloGold Ashanti Mineração(6) | Americas(6) | Subsidiaries(6) | ||
All-in sustaining costs | |||||||||||||
Cost of sales per segmental information(4) | 307 | 453 | 169 | 2 | 931 | — | 372 | 3,541 | 104 | 349 | 827 | 3,437 | |
By-product revenue | (93) | (2) | — | — | (95) | — | (2) | (102) | — | (2) | (95) | (102) | |
Realised other commodity contracts | — | — | — | — | — | — | — | 7 | — | — | — | 7 | |
Amortisation of tangible, intangible and right of use assets | (39) | (88) | (43) | — | (170) | — | (99) | (658) | (6) | (82) | (164) | (652) | |
Adjusted for decommissioning and inventory amortisation | 1 | (3) | — | — | (2) | (1) | 1 | (5) | — | (3) | (2) | (5) | |
Corporate administration, marketing and related expenses | — | — | — | — | — | 2 | — | 94 | — | — | — | 94 | |
Lease payment sustaining | — | 33 | 8 | (1) | 40 | 1 | 2 | 100 | 7 | 26 | 33 | 93 | |
Sustaining exploration and study costs | 6 | 1 | — | 1 | 8 | 2 | — | 32 | — | 1 | 8 | 32 | |
Total sustaining capital expenditure | 75 | 122 | 55 | — | 252 | 11 | 52 | 842 | 19 | 103 | 233 | 823 | |
All-in sustaining costs | 257 | 516 | 189 | 2 | 964 | 15 | 326 | 3,851 | 124 | 392 | 840 | 3,727 | |
Adjusted for non-controlling interests and non-gold producing companies(1) | (19) | — | — | — | (19) | — | — | (96) | — | — | (19) | (96) | |
All-in sustaining costs adjusted for non-controlling interest and non-gold producing companies | 238 | 516 | 189 | 2 | 945 | 15 | 326 | 3,755 | 124 | 392 | 821 | 3,631 | |
All-in sustaining costs | 257 | 516 | 189 | 2 | 964 | 15 | 326 | 3,851 | 124 | 392 | 840 | 3,727 | |
Non-sustaining capital expenditure | — | 2 | — | — | 2 | 16 | 33 | 200 | 2 | — | — | 198 | |
Non-sustaining lease payments | — | 2 | — | — | 2 | — | — | 4 | 2 | — | — | 2 | |
Non-sustaining exploration and study costs | 7 | 6 | 1 | 1 | 15 | 158 | 1 | 223 | 3 | 3 | 12 | 220 | |
Care and maintenance | — | 49 | — | — | 49 | 3 | — | 52 | 34 | 15 | 15 | 18 | |
Closure and social responsibility costs not related to current operations | — | 62 | 10 | 1 | 73 | — | 8 | 74 | 4 | 58 | 69 | 70 | |
Other provisions | — | — | — | — | — | — | — | 1 | — | — | — | 1 | |
All-in costs | 264 | 637 | 200 | 4 | 1,105 | 192 | 368 | 4,405 | 169 | 468 | 936 | 4,236 | |
Adjusted for non-controlling interests and non-gold producing companies(1) | (20) | — | — | — | (20) | — | — | (99) | — | — | (20) | (99) | |
All-in costs adjusted for non-controlling interest and non-gold producing companies | 244 | 637 | 200 | 4 | 1,085 | 192 | 368 | 4,306 | 169 | 468 | 916 | 4,137 | |
Gold sold - oz (000)(2) | 151 | 285 | 86 | — | 522 | — | 343 | 2,273 | 43 | 242 | 479 | 2,230 | |
All-in sustaining cost per ounce - $/oz(3) | 1,581 | 1,807 | 2,198 | — | 1,810 | — | 951 | 1,652 | 2,894 | 1,615 | 1,713 | 1,628 | |
All-in cost per ounce - $/oz(3) | 1,616 | 2,231 | 2,325 | — | 2,076 | — | 1,074 | 1,895 | 3,949 | 1,927 | 1,909 | 1,855 | |
175
For the year ended 31 December 2023 | |||||||||||||
(in US dollar million, except as otherwise noted) | |||||||||||||
AFRICA | AUSTRALIA | ||||||||||||
Corporate and other(5) | Kibali | Joint Ventures | Iduapriem | Obuasi | Siguiri | Geita | Africa other | Subsidiaries | Sunrise Dam | Tropicana | Australia other | Australia | |
Total cash costs | |||||||||||||
Cost of sales per segmental information(4) | 4 | 372 | 372 | 387 | 313 | 473 | 566 | — | 1,739 | 399 | 438 | 30 | 867 |
- By-product revenue | — | (2) | (2) | — | (1) | — | (2) | — | (3) | (1) | (3) | — | (4) |
- Inventory change | — | 2 | 2 | (2) | 4 | 1 | 5 | (1) | 7 | (6) | 14 | — | 8 |
- Amortisation of tangible assets | (3) | (98) | (98) | (126) | (61) | (39) | (68) | — | (294) | (43) | (97) | — | (140) |
- Amortisation of right of use assets | (1) | (1) | (1) | (3) | — | — | (23) | — | (26) | (15) | (7) | (1) | (23) |
- Amortisation of intangible assets | (1) | — | — | — | — | — | — | — | — | — | — | — | — |
- Environmental rehabilitation and other non-cash costs | 1 | 2 | 2 | (3) | (6) | (6) | (1) | — | (16) | (1) | (2) | (1) | (4) |
- Retrenchment costs | — | — | — | — | — | — | — | — | — | — | — | — | — |
Total cash costs | — | 275 | 275 | 253 | 249 | 429 | 477 | (1) | 1,407 | 333 | 343 | 28 | 704 |
Adjusted for non-controlling interests and non-gold producing companies (1) | — | — | — | — | — | (64) | — | — | (64) | — | — | — | — |
Total cash costs adjusted for non-controlling interests and non-gold producing companies | — | 275 | 275 | 253 | 249 | 365 | 477 | (1) | 1,343 | 333 | 343 | 28 | 704 |
Gold produced - oz (000)(2) | — | 343 | 343 | 268 | 224 | 221 | 485 | — | 1,198 | 252 | 310 | — | 562 |
Total cash costs per ounce - $/oz(3) | — | 802 | 802 | 943 | 1,114 | 1,650 | 984 | — | 1,121 | 1,318 | 1,105 | — | 1,251 |
176
For the year ended 31 December 2023 | |||||||||||||
(in US dollar million, except as otherwise noted) | |||||||||||||
AMERICAS | Adjusted to exclude the Córrego do Sítio operation | ||||||||||||
Cerro Vanguardia | AngloGold Ashanti Mineração | Serra Grande | Americas other | Americas | Projects | Joint Ventures | Subsidiaries | Córrego do Sítio | AngloGold Ashanti Mineração(6) | Americas(6) | Subsidiaries(6) | ||
Total cash costs | |||||||||||||
Cost of sales per segmental information(4) | 307 | 453 | 169 | 2 | 931 | — | 372 | 3,541 | 104 | 349 | 827 | 3,437 | |
- By-product revenue | (93) | (2) | — | — | (95) | — | (2) | (102) | — | (2) | (95) | (102) | |
- Inventory change | (2) | (2) | — | 1 | (3) | — | 2 | 12 | (2) | — | (1) | 14 | |
- Amortisation of tangible assets | (39) | (66) | (37) | — | (142) | — | (98) | (579) | (3) | (63) | (139) | (576) | |
- Amortisation of right of use assets | — | (22) | (6) | — | (28) | — | (1) | (78) | (3) | (19) | (25) | (75) | |
- Amortisation of intangible assets | — | — | — | — | — | — | — | (1) | — | — | — | (1) | |
- Environmental rehabilitation and other non-cash costs | (1) | (4) | 3 | (1) | (3) | — | 2 | (22) | (3) | (1) | — | (19) | |
- Retrenchment costs | — | (2) | (1) | (1) | (4) | — | — | (4) | — | (2) | (4) | (4) | |
Total cash costs | 172 | 355 | 128 | 1 | 656 | — | 275 | 2,767 | 93 | 262 | 563 | 2,674 | |
Adjusted for non-controlling interests and non-gold producing companies (1) | (13) | — | — | — | (13) | — | — | (77) | — | — | (13) | (77) | |
Total cash costs adjusted for non-controlling interests and non-gold producing companies | 159 | 355 | 128 | 1 | 643 | — | 275 | 2,690 | 93 | 262 | 550 | 2,597 | |
Gold produced - oz (000)(2) | 152 | 294 | 86 | — | 532 | — | 343 | 2,292 | 42 | 252 | 490 | 2,250 | |
Total cash costs per ounce - $/oz(3) | 1,045 | 1,210 | 1,498 | — | 1,211 | — | 802 | 1,174 | 2,217 | 1,041 | 1,124 | 1,154 | |
177
For the year ended 31 December 2022 | ||||||||||||||
(in US dollar million, except as otherwise noted) | ||||||||||||||
AFRICA | AUSTRALIA | |||||||||||||
Corporate and other(5) | Kibali | Other | Joint Ventures | Iduapriem | Obuasi | Siguiri | Geita | Africa other | Subsidiaries | Sunrise Dam | Tropicana | Australia other | Australia | |
All-in sustaining costs | ||||||||||||||
Cost of sales per segmental information(4) | 4 | 342 | — | 342 | 314 | 266 | 492 | 594 | — | 1,666 | 371 | 382 | 30 | 783 |
By-product revenue | — | (1) | — | (1) | (1) | (1) | — | (1) | — | (3) | (1) | (3) | — | (4) |
Realised other commodity contracts | ||||||||||||||
Amortisation of tangible, intangible and right of use assets | (4) | (95) | — | (95) | (80) | (40) | (54) | (102) | — | (276) | (54) | (117) | (1) | (172) |
Adjusted for decommissioning and inventory amortisation | — | — | — | — | — | — | — | — | — | — | — | 1 | — | 1 |
Corporate administration, marketing and related expenses | 79 | — | — | — | — | — | — | — | — | — | — | — | — | — |
Lease payment sustaining | 2 | 8 | — | 8 | 4 | — | 1 | 22 | — | 27 | 12 | 11 | 1 | 24 |
Sustaining exploration and study costs | — | — | — | — | 2 | — | 5 | 8 | — | 15 | 1 | 1 | — | 2 |
Total sustaining capital expenditure | 1 | 71 | — | 71 | 81 | 79 | 23 | 111 | — | 294 | 50 | 41 | — | 91 |
All-in sustaining costs | 82 | 325 | — | 325 | 320 | 304 | 467 | 632 | — | 1,723 | 379 | 316 | 30 | 725 |
Adjusted for non-controlling interests and non-gold producing companies(1) | — | — | — | — | — | — | (70) | — | — | (70) | — | — | — | — |
All-in sustaining costs adjusted for non-controlling interest and non- gold producing companies | 82 | 325 | — | 325 | 320 | 304 | 397 | 632 | — | 1,653 | 379 | 316 | 30 | 725 |
All-in sustaining costs | 82 | 325 | — | 325 | 320 | 304 | 467 | 632 | — | 1,723 | 379 | 316 | 30 | 725 |
Non-sustaining capital expenditure | — | 19 | — | 19 | 65 | 80 | 4 | 43 | — | 192 | — | 111 | — | 111 |
Non-sustaining lease payments | — | — | — | — | — | — | — | 3 | — | 3 | — | — | — | — |
Non-sustaining exploration and study costs | — | 2 | — | 2 | 1 | — | 7 | 5 | — | 13 | 18 | 6 | 19 | 43 |
Care and maintenance | — | — | — | — | — | — | — | — | — | — | — | — | — | — |
Closure and social responsibility costs not related to current operations | 7 | 10 | 1 | 11 | 1 | (23) | — | — | — | (22) | — | — | — | — |
Other provisions | 14 | — | — | — | — | — | — | — | — | — | — | — | — | — |
All-in costs | 103 | 356 | 1 | 357 | 387 | 361 | 478 | 683 | — | 1,909 | 397 | 433 | 49 | 879 |
Adjusted for non-controlling interests and non-gold producing companies(1) | — | — | — | — | — | — | (72) | — | — | (72) | — | — | — | — |
All-in costs adjusted for non-controlling interest and non-gold producing companies | 103 | 356 | 1 | 357 | 387 | 361 | 406 | 683 | — | 1,837 | 397 | 433 | 49 | 879 |
Gold sold - oz (000)(2) | — | 332 | — | 332 | 247 | 241 | 278 | 515 | — | 1,281 | 228 | 311 | — | 539 |
All-in sustaining cost per ounce - $/oz(3) | — | 979 | — | 979 | 1,299 | 1,264 | 1,428 | 1,227 | — | 1,291 | 1,666 | 1,014 | — | 1,345 |
All-in cost per ounce - $/oz(3) | — | 1,072 | — | 1,075 | 1,570 | 1,499 | 1,461 | 1,325 | — | 1,434 | 1,746 | 1,391 | — | 1,631 |
(1) Adjusting for non-controlling interest of items included in calculation, to disclose the attributable portions only. | ||||||||||||||
(2) Attributable portion. | ||||||||||||||
(3) In addition to the operational performances of the mines, “all-in sustaining cost per ounce”, “all-in cost per ounce” and “total cash costs per ounce” are affected by fluctuations in the currency exchange rate. AngloGold Ashanti reports “all-in sustaining cost per ounce” and “all-in cost per ounce” calculated to the nearest US dollar amount and gold sold in ounces. AngloGold Ashanti reports “total cash costs per ounce” calculated to the nearest US dollar amount and gold produced in ounces. | ||||||||||||||
(4) Refer to “Item 18: Financial Statements—Note 2—Segmental Information”. | ||||||||||||||
(5) Corporate includes non-gold producing subsidiaries. | ||||||||||||||
(6) Adjusted to exclude the Córrego do Sítio (CdS) operation which was placed on care and maintenance in August 2023. | ||||||||||||||
Rounding of figures may result in computational discrepancies.
178
For the year ended 31 December 2022 | |||||||||||||
(in US dollar million, except as otherwise noted) | |||||||||||||
AMERICAS | Adjusted to exclude the Córrego do Sítio operation | ||||||||||||
Cerro Vanguardia | AngloGold Ashanti Mineração | Serra Grande | Americas other | Americas | Projects | Joint Ventures | Subsidiaries | Córrego do Sítio | AngloGold Ashanti Mineração(6) | Americas(6) | Subsidiaries(6) | ||
All-in sustaining costs | |||||||||||||
Cost of sales per segmental information(4) | 273 | 477 | 162 | 1 | 913 | — | 342 | 3,366 | 163 | 314 | 750 | 3,203 | |
By-product revenue | (75) | (31) | — | — | (106) | — | (1) | (113) | — | (31) | (106) | (113) | |
Realised other commodity contracts | |||||||||||||
Amortisation of tangible, intangible and right of use assets | (39) | (106) | (40) | — | (185) | — | (95) | (637) | (24) | (82) | (161) | (613) | |
Adjusted for decommissioning and inventory amortisation | 6 | — | (1) | — | 5 | — | — | 6 | (3) | 3 | 8 | 9 | |
Corporate administration, marketing and related expenses | — | — | — | — | — | — | — | 79 | — | — | — | 79 | |
Lease payment sustaining | — | 32 | 4 | — | 36 | 1 | 8 | 90 | 8 | 24 | 28 | 82 | |
Sustaining exploration and study costs | 3 | 1 | — | — | 4 | — | — | 21 | — | 1 | 4 | 21 | |
Total sustaining capital expenditure | 66 | 199 | 57 | — | 322 | — | 71 | 708 | 55 | 144 | 267 | 653 | |
All-in sustaining costs | 234 | 572 | 182 | 1 | 989 | 1 | 325 | 3,520 | 199 | 373 | 790 | 3,321 | |
Adjusted for non-controlling interests and non-gold producing companies(1) | (18) | — | — | — | (18) | — | — | (88) | — | — | (18) | (88) | |
All-in sustaining costs adjusted for non-controlling interest and non-gold producing companies | 216 | 572 | 182 | 1 | 971 | 1 | 325 | 3,432 | 199 | 373 | 772 | 3,233 | |
All-in sustaining costs | 234 | 572 | 182 | 1 | 989 | 1 | 325 | 3,520 | 199 | 373 | 790 | 3,321 | |
Non-sustaining capital expenditure | — | — | — | — | — | 17 | 19 | 320 | — | — | — | 320 | |
Non-sustaining lease payments | — | — | — | — | — | — | — | 3 | — | — | — | 3 | |
Non-sustaining exploration and study costs | 1 | 9 | 3 | 1 | 14 | 113 | 2 | 183 | 6 | 3 | 8 | 177 | |
Care and maintenance | — | — | — | — | — | — | — | — | — | — | — | — | |
Closure and social responsibility costs not related to current operations | — | 16 | 2 | — | 18 | — | 11 | 3 | 3 | 13 | 15 | — | |
Other provisions | — | — | — | — | — | — | — | 14 | — | — | — | 14 | |
All-in costs | 235 | 597 | 187 | 2 | 1,021 | 131 | 357 | 4,043 | 208 | 389 | 813 | 3,835 | |
Adjusted for non-controlling interests and non-gold producing companies(1) | (18) | — | — | — | (18) | — | — | (90) | — | — | (18) | (90) | |
All-in costs adjusted for non-controlling interest and non-gold producing companies | 217 | 597 | 187 | 2 | 1,003 | 131 | 357 | 3,953 | 208 | 389 | 795 | 3,745 | |
Gold sold - oz (000)(2) | 166 | 310 | 89 | — | 565 | — | 332 | 2,385 | 69 | 241 | 496 | 2,316 | |
All-in sustaining cost per ounce - $/oz(3) | 1,301 | 1,841 | 2,053 | — | 1,718 | — | 979 | 1,439 | 2,887 | 1,543 | 1,555 | 1,396 | |
All-in cost per ounce - $/oz(3) | 1,309 | 1,923 | 2,102 | — | 1,775 | — | 1,075 | 1,658 | 3,016 | 1,611 | 1,603 | 1,617 | |
179
For the year ended 31 December 2022 | |||||||||||||
(in US dollar million, except as otherwise noted) | |||||||||||||
AFRICA | AUSTRALIA | ||||||||||||
Corporate and other(5) | Kibali | Joint Ventures | Iduapriem | Obuasi | Siguiri | Geita | Africa other | Subsidiaries | Sunrise Dam | Tropicana | Australia other | Australia | |
Total cash costs | |||||||||||||
Cost of sales per segmental information(4) | 4 | 342 | 342 | 314 | 266 | 492 | 594 | — | 1,666 | 371 | 382 | 30 | 783 |
- By-product revenue | — | (1) | (1) | (1) | (1) | — | (1) | — | (3) | (1) | (3) | — | (4) |
- Inventory change | — | 3 | 3 | 3 | 6 | 4 | 7 | (1) | 19 | 8 | (5) | — | 3 |
- Amortisation of tangible assets | (3) | (93) | (93) | (77) | (39) | (53) | (77) | — | (246) | (43) | (109) | — | (152) |
- Amortisation of right of use assets | (1) | (2) | (2) | (3) | — | (1) | (25) | — | (29) | (11) | (8) | (1) | (20) |
- Amortisation of intangible assets | — | — | — | — | (1) | — | — | — | (1) | — | — | — | — |
- Environmental rehabilitation and other non-cash costs | — | (4) | (4) | 4 | (2) | (8) | (7) | — | (13) | 2 | 12 | (1) | 13 |
- Retrenchment costs | — | — | — | — | — | — | — | — | — | — | — | (1) | (1) |
Total cash costs | — | 245 | 245 | 240 | 229 | 434 | 491 | (1) | 1,393 | 326 | 269 | 27 | 622 |
Adjusted for non-controlling interests and non-gold producing companies (1) | — | — | — | — | — | (65) | — | — | (65) | — | — | — | — |
Total cash costs adjusted for non-controlling interests and non-gold producing companies | — | 245 | 245 | 240 | 229 | 369 | 491 | (1) | 1,328 | 326 | 269 | 27 | 622 |
Gold produced - oz (000)(2) | — | 337 | 337 | 248 | 250 | 279 | 521 | — | 1,298 | 232 | 306 | — | 538 |
Total cash costs per ounce - $/oz(3) | — | 725 | 725 | 970 | 914 | 1,319 | 944 | — | 1,023 | 1,402 | 881 | — | 1,157 |
180
For the year ended 31 December 2022 | |||||||||||||
(in US dollar million, except as otherwise noted) | |||||||||||||
AMERICAS | Adjusted to exclude the Córrego do Sítio operation | ||||||||||||
Cerro Vanguardia | AngloGold Ashanti Mineração | Serra Grande | Americas other | Americas | Projects | Joint Ventures | Subsidiaries | Córrego do Sítio | AngloGold Ashanti Mineração(6) | Americas(6) | Subsidiaries(6) | ||
Total cash costs | |||||||||||||
Cost of sales per segmental information(4) | 273 | 477 | 162 | 1 | 913 | — | 342 | 3,366 | 163 | 314 | 750 | 3,203 | |
- By-product revenue | (75) | (31) | — | — | (106) | — | (1) | (113) | — | (31) | (106) | (113) | |
- Inventory change | 9 | 1 | (1) | (1) | 8 | — | 3 | 30 | (2) | 3 | 10 | 32 | |
- Amortisation of tangible assets | (39) | (79) | (36) | — | (154) | — | (93) | (555) | (19) | (60) | (135) | (536) | |
- Amortisation of right of use assets | — | (27) | (4) | — | (31) | — | (2) | (81) | (5) | (22) | (26) | (76) | |
- Amortisation of intangible assets | — | — | — | — | — | — | — | (1) | — | — | — | (1) | |
- Environmental rehabilitation and other non-cash costs | 2 | (1) | (1) | — | — | — | (4) | — | (2) | 1 | 2 | 2 | |
- Retrenchment costs | (2) | (2) | (1) | — | (5) | — | — | (6) | — | (2) | (5) | (6) | |
Total cash costs | 168 | 338 | 119 | — | 625 | — | 245 | 2,640 | 135 | 203 | 490 | 2,505 | |
Adjusted for non-controlling interests and non-gold producing companies (1) | (13) | — | — | — | (13) | — | — | (78) | — | — | (13) | (78) | |
Total cash costs adjusted for non-controlling interests and non-gold producing companies | 155 | 338 | 119 | — | 612 | — | 245 | 2,562 | 135 | 203 | 477 | 2,427 | |
Gold produced - oz (000)(2) | 170 | 311 | 88 | — | 569 | — | 337 | 2,405 | 70 | 241 | 499 | 2,335 | |
Total cash costs per ounce - $/oz(3) | 913 | 1,088 | 1,355 | — | 1,078 | — | 725 | 1,066 | 1,946 | 841 | 957 | 1,040 | |
181
For the year ended 31 December 2021 | ||||||||||||||
(in US dollar million, except as otherwise noted) | ||||||||||||||
AFRICA | AUSTRALIA | |||||||||||||
Corporate and other(5) | Kibali | Other | Joint Ventures | Iduapriem | Obuasi | Siguiri | Geita | Africa other | Subsidiaries | Sunrise Dam | Tropicana | Australia other | Australia | |
All-in sustaining costs | ||||||||||||||
Cost of sales per segmental information(4) | (5) | 350 | — | 350 | 238 | 164 | 412 | 488 | — | 1,302 | 364 | 346 | 30 | 740 |
By-product revenue | — | (2) | — | (2) | (1) | — | (1) | (1) | — | (3) | (1) | (3) | — | (4) |
Realised other commodity contracts | — | — | — | — | — | — | — | — | — | — | — | — | — | — |
Amortisation of tangible, intangible and right of use assets | (3) | (105) | — | (105) | (19) | (22) | (49) | (75) | — | (165) | (60) | (88) | (2) | (150) |
Adjusted for decommissioning and inventory amortisation | — | 1 | — | 1 | 1 | — | — | 1 | — | 2 | 1 | 1 | — | 2 |
Corporate administration, marketing and related expenses | 73 | — | — | — | — | — | — | — | — | — | — | — | — | — |
Lease payment sustaining | 3 | 9 | — | 9 | 2 | — | 1 | 19 | — | 22 | 13 | 12 | — | 25 |
Sustaining exploration and study costs | — | — | — | — | 1 | — | 3 | 4 | — | 8 | — | — | — | — |
Total sustaining capital expenditure | 11 | 61 | — | 61 | 103 | 46 | 18 | 65 | — | 232 | 47 | 82 | 1 | 130 |
All-in sustaining costs | 79 | 314 | — | 314 | 325 | 188 | 384 | 501 | — | 1,398 | 364 | 350 | 29 | 743 |
Adjusted for non-controlling interests and non-gold producing companies(1) | — | — | — | — | — | — | (58) | — | — | (58) | — | — | — | — |
All-in sustaining costs adjusted for non-controlling interest and non- gold producing companies | 79 | 314 | — | 314 | 325 | 188 | 326 | 501 | — | 1,340 | 364 | 350 | 29 | 743 |
All-in sustaining costs | 79 | 314 | — | 314 | 325 | 188 | 384 | 501 | — | 1,398 | 364 | 350 | 29 | 743 |
Non-sustaining capital expenditure | — | 11 | — | 11 | 2 | 122 | 20 | 58 | — | 202 | 15 | 40 | — | 55 |
Non-sustaining lease payments | — | — | — | — | — | — | — | 2 | — | 2 | — | — | — | — |
Non-sustaining exploration and study costs | — | 2 | — | 2 | 3 | 2 | 2 | 1 | — | 8 | 27 | 8 | 21 | 56 |
Care and maintenance | — | — | — | — | — | 45 | — | — | — | 45 | — | — | — | — |
Closure and social responsibility costs not related to current operations | 4 | 3 | — | 3 | — | 10 | — | — | — | 10 | — | — | — | — |
Other provisions | 1 | — | — | — | — | — | — | 3 | — | 3 | — | — | — | — |
All-in costs | 84 | 330 | — | 330 | 330 | 367 | 406 | 565 | — | 1,668 | 406 | 398 | 50 | 854 |
Adjusted for non-controlling interests and non-gold producing companies(1) | — | — | — | — | — | — | (61) | — | — | (61) | — | — | — | — |
All-in costs adjusted for non-controlling interest and non-gold producing companies | 84 | 330 | — | 330 | 330 | 367 | 345 | 565 | — | 1,607 | 406 | 398 | 50 | 854 |
Gold sold - oz (000)(2) | — | 367 | — | 367 | 201 | 114 | 258 | 487 | — | 1,060 | 231 | 264 | — | 495 |
All-in sustaining cost per ounce - $/oz(3) | — | 856 | — | 856 | 1,619 | 1,653 | 1,267 | 1,029 | — | 1,264 | 1,573 | 1,326 | — | 1,500 |
All-in cost per ounce - $/oz(3) | — | 898 | — | 900 | 1,642 | 3,229 | 1,340 | 1,161 | — | 1,516 | 1,757 | 1,506 | — | 1,725 |
(1) Adjusting for non-controlling interest of items included in calculation, to disclose the attributable portions only. | ||||||||||||||
(2) Attributable portion. | ||||||||||||||
(3) In addition to the operational performances of the mines, “all-in sustaining cost per ounce”, “all-in cost per ounce” and “total cash costs per ounce” are affected by fluctuations in the currency exchange rate. AngloGold Ashanti reports “all-in sustaining cost per ounce” and “all-in cost per ounce” calculated to the nearest US dollar amount and gold sold in ounces. AngloGold Ashanti reports “total cash costs per ounce” calculated to the nearest US dollar amount and gold produced in ounces. | ||||||||||||||
(4) Refer to “Item 18: Financial Statements—Note 2—Segmental Information”. | ||||||||||||||
(5) Corporate includes non-gold producing subsidiaries. | ||||||||||||||
(6) Adjusted to exclude the Córrego do Sítio (CdS) operation which was placed on care and maintenance in August 2023. | ||||||||||||||
Rounding of figures may result in computational discrepancies.
182
For the year ended 31 December 2021 | |||||||||||||
(in US dollar million, except as otherwise noted) | |||||||||||||
AMERICAS | Adjusted to exclude the Córrego do Sítio operation | ||||||||||||
Cerro Vanguardia | AngloGold Ashanti Mineração | Serra Grande | Americas other | Americas | Projects | Joint Ventures | Subsidiaries | Córrego do Sítio | AngloGold Ashanti Mineração(6) | Americas(6) | Subsidiaries(6) | ||
All-in sustaining costs | |||||||||||||
Cost of sales per segmental information(4) | 261 | 435 | 123 | 3 | 822 | — | 350 | 2,859 | 149 | 286 | 673 | 2,710 | |
By-product revenue | (93) | (26) | — | — | (119) | — | (2) | (126) | — | (26) | (119) | (126) | |
Realised other commodity contracts | — | — | — | — | — | — | — | — | — | — | — | — | |
Amortisation of tangible, intangible and right of use assets | (27) | (108) | (25) | (1) | (161) | — | (105) | (479) | (29) | (79) | (132) | (450) | |
Adjusted for decommissioning and inventory amortisation | — | (4) | — | — | (4) | — | 1 | — | (1) | (3) | (3) | 1 | |
Corporate administration, marketing and related expenses | — | — | — | — | — | — | — | 73 | — | — | — | 73 | |
Lease payment sustaining | — | 15 | 4 | 1 | 20 | — | 9 | 70 | 2 | 13 | 18 | 68 | |
Sustaining exploration and study costs | 1 | 1 | — | — | 2 | — | — | 10 | 1 | — | 1 | 9 | |
Total sustaining capital expenditure | 69 | 193 | 82 | — | 344 | — | 61 | 717 | 60 | 133 | 284 | 657 | |
All-in sustaining costs | 211 | 506 | 184 | 3 | 904 | — | 314 | 3,124 | 182 | 324 | 722 | 2,942 | |
Adjusted for non-controlling interests and non-gold producing companies(1) | (16) | — | — | — | (16) | — | — | (74) | — | — | (16) | (74) | |
All-in sustaining costs adjusted for non-controlling interest and non-gold producing companies | 195 | 506 | 184 | 3 | 888 | — | 314 | 3,050 | 182 | 324 | 706 | 2,868 | |
All-in sustaining costs | 211 | 506 | 184 | 3 | 904 | — | 314 | 3,124 | 182 | 324 | 722 | 2,942 | |
Non-sustaining capital expenditure | — | 2 | — | — | 2 | 52 | 11 | 311 | — | 2 | 2 | 311 | |
Non-sustaining lease payments | — | — | — | — | — | — | — | 2 | — | — | — | 2 | |
Non-sustaining exploration and study costs | 1 | 11 | 4 | 1 | 17 | 72 | 2 | 153 | 8 | 3 | 9 | 145 | |
Care and maintenance | — | — | — | — | — | — | — | 45 | — | — | — | 45 | |
Closure and social responsibility costs not related to current operations | — | 7 | 2 | 1 | 10 | — | 3 | 24 | 2 | 5 | 8 | 22 | |
Other provisions | — | — | — | — | — | — | — | 4 | — | — | — | 4 | |
All-in costs | 212 | 526 | 190 | 5 | 933 | 124 | 330 | 3,663 | 192 | 334 | 741 | 3,471 | |
Adjusted for non-controlling interests and non-gold producing companies(1) | (16) | — | — | — | (16) | — | — | (77) | — | — | (16) | (77) | |
All-in costs adjusted for non-controlling interest and non-gold producing companies | 196 | 526 | 190 | 5 | 917 | 124 | 330 | 3,586 | 192 | 334 | 725 | 3,394 | |
Gold sold - oz (000)(2) | 144 | 334 | 83 | — | 561 | — | 367 | 2,116 | 79 | 255 | 482 | 2,037 | |
All-in sustaining cost per ounce - $/oz(3) | 1,353 | 1,519 | 2,220 | — | 1,587 | — | 856 | 1,441 | 2,322 | 1,267 | 1,457 | 1,408 | |
All-in cost per ounce - $/oz(3) | 1,362 | 1,582 | 2,283 | — | 1,635 | — | 900 | 1,695 | 2,445 | 1,311 | 1,495 | 1,666 | |
183
For the year ended 31 December 2021 | |||||||||||||
(in US dollar million, except as otherwise noted) | |||||||||||||
AFRICA | AUSTRALIA | ||||||||||||
Corporate and other(5) | Kibali | Joint Ventures | Iduapriem | Obuasi | Siguiri | Geita | Africa other | Subsidiaries | Sunrise Dam | Tropicana | Australia other | Australia | |
Total cash costs | |||||||||||||
Cost of sales per segmental information(4) | (5) | 350 | 350 | 238 | 164 | 412 | 488 | — | 1,302 | 364 | 346 | 30 | 740 |
- By-product revenue | — | (2) | (2) | (1) | — | (1) | (1) | — | (3) | (1) | (3) | — | (4) |
- Inventory change | — | (1) | (1) | 1 | (10) | (1) | (1) | — | (11) | (3) | 3 | — | — |
- Amortisation of tangible assets | (1) | (100) | (100) | (17) | (21) | (48) | (55) | — | (141) | (49) | (80) | — | (129) |
- Amortisation of right of use assets | (1) | (5) | (5) | (2) | — | (1) | (20) | — | (23) | (11) | (8) | (1) | (20) |
- Amortisation of intangible assets | (1) | — | — | — | (1) | — | — | — | (1) | — | — | (1) | (1) |
- Environmental rehabilitation and other non-cash costs | — | (5) | (5) | (1) | (12) | 2 | (12) | — | (23) | 3 | 3 | (1) | 5 |
- Retrenchment costs | — | — | — | — | — | — | — | — | — | — | — | — | — |
Total cash costs | (8) | 237 | 237 | 218 | 120 | 363 | 399 | — | 1,100 | 303 | 261 | 27 | 591 |
Adjusted for non-controlling interests and non-gold producing companies (1) | — | — | — | — | — | (55) | — | — | (55) | — | — | — | — |
Total cash costs adjusted for non-controlling interests and non-gold producing companies | (8) | 237 | 237 | 218 | 120 | 308 | 399 | — | 1,045 | 303 | 261 | 27 | 591 |
Gold produced - oz (000)(2) | — | 365 | 365 | 202 | 108 | 258 | 486 | — | 1,054 | 229 | 265 | — | 494 |
Total cash costs per ounce - $/oz(3) | — | 647 | 647 | 1,081 | 1,112 | 1,200 | 822 | — | 991 | 1,321 | 987 | — | 1,196 |
184
For the year ended 31 December 2021 | |||||||||||||
(in US dollar million, except as otherwise noted) | |||||||||||||
AMERICAS | Adjusted to exclude the Córrego do Sítio operation | ||||||||||||
Cerro Vanguardia | AngloGold Ashanti Mineração | Serra Grande | Americas other | Americas | Projects | Joint Ventures | Subsidiaries | Córrego do Sítio | AngloGold Ashanti Mineração(6) | Americas(6) | Subsidiaries(6) | ||
Total cash costs | |||||||||||||
Cost of sales per segmental information(4) | 261 | 435 | 123 | 3 | 822 | — | 350 | 2,859 | 149 | 286 | 673 | 2,710 | |
- By-product revenue | (93) | (26) | — | — | (119) | — | (2) | (126) | — | (26) | (119) | (126) | |
- Inventory change | 7 | (3) | 1 | — | 5 | — | (1) | (6) | (1) | (2) | 6 | (5) | |
- Amortisation of tangible assets | (27) | (94) | (21) | — | (142) | — | (100) | (413) | (27) | (67) | (115) | (386) | |
- Amortisation of right of use assets | — | (14) | (4) | (1) | (19) | — | (5) | (63) | (2) | (12) | (17) | (61) | |
- Amortisation of intangible assets | — | — | — | — | — | — | — | (3) | — | — | — | (3) | |
- Environmental rehabilitation and other non-cash costs | (8) | (12) | — | — | (20) | — | (5) | (38) | (6) | (6) | (14) | (32) | |
- Retrenchment costs | (1) | (1) | — | — | (2) | — | — | (2) | — | (1) | (2) | (2) | |
Total cash costs | 139 | 285 | 99 | 2 | 525 | — | 237 | 2,208 | 113 | 172 | 412 | 2,095 | |
Adjusted for non-controlling interests and non-gold producing companies (1) | (10) | — | — | — | (10) | — | — | (65) | — | — | (10) | (65) | |
Total cash costs adjusted for non-controlling interests and non-gold producing companies | 129 | 285 | 99 | 2 | 515 | — | 237 | 2,143 | 113 | 172 | 402 | 2,030 | |
Gold produced - oz (000)(2) | 145 | 331 | 83 | — | 559 | — | 365 | 2,107 | 78 | 253 | 481 | 2,029 | |
Total cash costs per ounce - $/oz(3) | 894 | 858 | 1,192 | — | 921 | — | 647 | 1,017 | 1,447 | 675 | 831 | 1,001 | |
185
For the year ended 31 December 2023 | ||||||||||||||
(in US dollar million, except as otherwise noted) | ||||||||||||||
AFRICA | AUSTRALIA | |||||||||||||
Corporate and other(5) | Kibali | Other | Joint Ventures | Iduapriem | Obuasi | Siguiri | Geita | Africa other | Subsidiaries | Sunrise Dam | Tropicana | Australia other | Australia | |
Capital expenditure | ||||||||||||||
Sustaining capital expenditure | 1 | 52 | — | 52 | 96 | 148 | 74 | 162 | — | 480 | 47 | 50 | 1 | 98 |
Non-sustaining capital expenditure | — | 33 | — | 33 | 46 | 66 | 4 | 29 | — | 145 | — | 37 | — | 37 |
Total capital expenditure | 1 | 85 | — | 85 | 142 | 214 | 78 | 191 | — | 625 | 47 | 87 | 1 | 135 |
AMERICAS | Adjusted to exclude the Córrego do Sítio operation | ||||||||||||
Cerro Vanguardia | AngloGold Ashanti Mineração | Serra Grande | Americas other | Americas | Projects | Joint Ventures | Subsidiaries | Córrego do Sítio | AngloGold Ashanti Mineração(6) | Americas(6) | Subsidiaries(6) | ||
Capital expenditure | |||||||||||||
Sustaining capital expenditure | 75 | 122 | 55 | — | 252 | 11 | 52 | 842 | 19 | 103 | 233 | 823 | |
Non-sustaining capital expenditure | — | 2 | — | — | 2 | 16 | 33 | 200 | 2 | — | — | 198 | |
Total capital expenditure | 75 | 124 | 55 | — | 254 | 27 | 85 | 1,042 | 21 | 103 | 233 | 1,021 | |
186
For the year ended 31 December 2022 | ||||||||||||||
AFRICA | AUSTRALIA | |||||||||||||
Corporate and other(5) | Kibali | Other | Joint Ventures | Iduapriem | Obuasi | Siguiri | Geita | Africa other | Subsidiaries | Sunrise Dam | Tropicana | Australia other | Australia | |
Capital expenditure | ||||||||||||||
Sustaining capital expenditure | 1 | 71 | — | 71 | 81 | 79 | 23 | 111 | — | 294 | 50 | 41 | — | 91 |
Non-sustaining capital expenditure | — | 19 | — | 19 | 65 | 80 | 4 | 43 | — | 192 | — | 111 | — | 111 |
Total capital expenditure | 1 | 90 | — | 90 | 146 | 159 | 27 | 154 | — | 486 | 50 | 152 | — | 202 |
AMERICAS | Adjusted to exclude the Córrego do Sítio operation | ||||||||||||
Cerro Vanguardia | AngloGold Ashanti Mineração | Serra Grande | Americas other | Americas | Projects | Joint Ventures | Subsidiaries | Córrego do Sítio | AngloGold Ashanti Mineração(6) | Americas(6) | Subsidiaries(6) | ||
Capital expenditure | |||||||||||||
Sustaining capital expenditure | 66 | 199 | 57 | — | 322 | — | 71 | 708 | 55 | 144 | 267 | 653 | |
Non-sustaining capital expenditure | — | — | — | — | — | 17 | 19 | 320 | — | — | — | 320 | |
Total capital expenditure | 66 | 199 | 57 | — | 322 | 17 | 90 | 1,028 | 55 | 144 | 267 | 973 | |
187
For the year ended 31 December 2021 | ||||||||||||||
(in US dollar million, except as otherwise noted) | ||||||||||||||
AFRICA | AUSTRALIA | |||||||||||||
Corporate and other(5) | Kibali | Other | Joint Ventures | Iduapriem | Obuasi | Siguiri | Geita | Africa other | Subsidiaries | Sunrise Dam | Tropicana | Australia other | Australia | |
Capital expenditure | ||||||||||||||
Sustaining capital expenditure | 11 | 61 | — | 61 | 103 | 46 | 18 | 65 | — | 232 | 47 | 82 | 1 | 130 |
Non-sustaining capital expenditure | — | 11 | — | 11 | 2 | 122 | 20 | 58 | — | 202 | 15 | 40 | — | 55 |
Total capital expenditure | 11 | 72 | — | 72 | 105 | 168 | 38 | 123 | — | 434 | 62 | 122 | 1 | 185 |
AMERICAS | Adjusted to exclude the Córrego do Sítio operation | ||||||||||||
Cerro Vanguardia | AngloGold Ashanti Mineração | Serra Grande | Americas other | Americas | Projects | Joint Ventures | Subsidiaries | Córrego do Sítio | AngloGold Ashanti Mineração(6) | Americas(6) | Subsidiaries(6) | ||
Capital expenditure | |||||||||||||
Sustaining capital expenditure | 69 | 193 | 82 | — | 344 | — | 61 | 717 | 60 | 133 | 284 | 657 | |
Non-sustaining capital expenditure | — | 2 | — | — | 2 | 52 | 11 | 311 | — | 2 | 2 | 311 | |
Total capital expenditure | 69 | 195 | 82 | — | 346 | 52 | 72 | 1,028 | 60 | 135 | 286 | 968 | |
188
5B.LIQUIDITY AND CAPITAL RESOURCES
In the board’s opinion, AngloGold Ashanti’s working capital is sufficient to meet the Company’s present requirements.
Comparison of cash flows in 2023 with 2022
Cash flows from operating activities
Cash flows from operating activities decreased by $833 million, or 46 percent, from $1,804 million in 2022 to $971 million in
2023. This decrease in cash flows from operating activities was mainly due to a decrease in dividends received from joint
ventures and an increase in payments to suppliers and employees as a result of higher gold production costs. This decrease was
partially offset by an increase in receipts from customers as a result of an increase in the average gold price received per ounce,
lower taxation paid due to lower profit before taxation in Brazil, lower provisional tax payments in Australia, and favourable
working capital movements.
Net cash outflow from operating working capital items amounted to $93 million in 2023, compared with an outflow of $140 million
in 2022. The outflow from operating working capital in 2023 mainly related to an increase in inventories and an increase in trade,
other receivables and other assets, partially offset by an increase in trade, other payables and provisions.
Cash flows from operating activities were also impacted by movements in the lock-up of value added tax (“VAT”) at Geita in
Tanzania as well as foreign exchange controls and export duties at Cerro Vanguardia in Argentina. In Tanzania, net overdue
recoverable VAT input credit refunds (after discounting provisions) remained unchanged at $153 million in 2023 when compared
to 2022, as a result of offsetting verified VAT claims of $73 million against corporate tax payments in 2023 and revaluation and
discounting adjustments of $8 million, fully offset by new claims of $81 million submitted to the Tanzania Revenue Authority
(“TRA”) during 2023. AngloGold Ashanti expects to continue offsetting verified VAT claims against corporate taxes. See “Item 4B:
Business Overview—The Regulatory Environment Enabling AngloGold Ashanti to Mine—Africa—Tanzania”. In Argentina, the net
export duty receivables (after discounting provisions) decreased by $5 million, or 56 percent, from $9 million at 31 December
2022 to $4 million at 31 December 2023. In addition, Cerro Vanguardia’s cash balance decreased by $27 million (equivalent), or
23 percent, from $116 million (equivalent) at 31 December 2022 to $89 million (equivalent) at 31 December 2023. While the
approvals of the Argentinean Central Bank to purchase US dollars to distribute offshore dividends to AngloGold Ashanti are
pending, the cash remains fully available for Cerro Vanguardia’s operational and exploration requirements. See “Item 4B:
Business Overview—The Regulatory Environment Enabling AngloGold Ashanti to Mine—Americas—Argentina”.
Dividends received from joint ventures decreased by $514 million, or 74 percent, from $694 million in 2022 to $180 million in
2023. In this connection, cash flows from operating activities were impacted by the level of cash repatriation from, and
movements in the VAT lock-up at, the Kibali joint venture in the DRC. During 2023, AngloGold Ashanti’s cumulative cash receipts
from the Kibali joint venture, in the form of dividends from Kibali (Jersey) Limited, amounted to $180 million. Kibali (Jersey)
Limited received such cash from Kibali Goldmines S.A. in the form of loan repayments (net of bank fees) (AngloGold Ashanti’s
attributable share: $131 million) and dividends (net of withholding taxes) (AngloGold Ashanti’s attributable share: $49 million).
AngloGold Ashanti’s attributable share of the outstanding cash balances awaiting repatriation from the DRC increased by $11
million, or 28 percent, from $40 million at 31 December 2022 to $51 million at 31 December 2023. The cash is fully available for
the operational requirements of Kibali Goldmines S.A. In addition, Kibali Goldmines S.A. is due certain refunds of VAT which, to
date, remain outstanding. During 2023, AngloGold Ashanti recovered VAT refunds of $34 million attributable to it from its
operations in the DRC. AngloGold Ashanti’s attributable share of the net recoverable VAT balance (including recoverable fuel
duty and after discounting provisions) owed to AngloGold Ashanti by the DRC government decreased by $26 million, or 30
percent, from $86 million at 31 December 2022 to $60 million at 31 December 2023. See “Item 4B: Business Overview—The
Regulatory Environment Enabling AngloGold Ashanti to Mine—Africa—Democratic Republic of the Congo (DRC)”.
Net taxation paid decreased by $54 million, or 40 percent, from $134 million in 2022 to $80 million in 2023. This decrease in net
taxation paid was mainly due to lower profit before taxation in Brazil and lower provisional tax payments in Australia.
Cash flows from investing activities
Cash flows from investing activities amounted to a net outflow of $897 million in 2023, $564 million, or 39 percent, lower than an
outflow of $1,461 million in 2022. This decrease in outflow from investing activities was largely due to the acquisition of assets
(Corvus Gold Inc. (“Corvus Gold”) and Coeur Sterling, Inc. (“Coeur Sterling”)) for $517 million during 2022, proceeds from the
disposal of Gramalote of $20 million received during 2023 and higher interest income mainly due to higher interest rates received
during 2023.
Cash flows from financing activities
Cash flows from financing activities in 2023 amounted to a net outflow of $87 million, which is a change of $236 million from an
outflow of $323 million in 2022. This decrease in outflow was mainly due to higher net proceeds from borrowings and lower
dividends paid, partially offset by an increase in repayment of lease liabilities and finance costs.
189
Cash outflows from share securities tax on redomicile and reorganisation increased by $19 million, from nil in 2022 to $19 million
in 2023. This increase was mainly due to the payment of $19 million in South African securities transfer tax in connection with the
corporate restructuring.
Cash inflows from proceeds from borrowings increased by $77 million, from $266 million in 2022 to $343 million in 2023. In 2023,
AngloGold Ashanti drew the remaining undrawn commitments of $50 million under the $65 million 2022 Siguiri RCF (as defined
below), partially drew a further $43 million on the $289 million 2021 Geita RCF (as defined below) and partially drew $250 million
on the $1.4 billion 2022 multi-currency RCF (as defined below).
Cash outflows from repayment of borrowings decreased by $97 million, from $184 million in 2022 to $87 million in 2023. In 2023,
AngloGold Ashanti repaid $37 million under the $1.4 billion 2022 multi-currency RCF and $50 million under the $65 million 2022
Siguiri RCF.
Finance costs paid increased by $13 million, from $109 million in 2022 to $122 million in 2023. This increase was mainly due to
higher interest paid on the $289 million 2021 Geita RCF, the $65 million 2022 Siguiri RCF and the $1.4 billion 2022 multi-
currency RCF due to higher utilisation of these revolving credit facilities in 2023 and lower capitalised interest in 2023 compared
to 2022.
Other borrowing costs decreased by $10 million, from $11 million in 2022 to $1 million in 2023. The other borrowing costs paid in
2023 mainly related to the transaction costs to extend the maturity of the $1.4 billion 2022 multi-currency RCF by one year from 9
June 2027 to 9 June 2028.
Dividends paid decreased by $96 million, from $203 million in 2022 to $107 million in 2023. Dividends paid to non-controlling
interests decreased by $6 million, from $22 million in 2022 to $16 million in 2023. These dividends were paid by our non-wholly
owned subsidiaries CVSA and Siguiri to their respective non-AGA related shareholders. During 2023, the Company declared and
paid a dividend of $91 million to its shareholders, compared to a dividend of $181 million in 2022.
Comparison of cash flows in 2022 with 2021
Cash flows from operating activities
Cash flows from operating activities increased by $536 million, or 42 percent, from $1,268 million in 2021 to $1,804 million in
2022. This increase in cash flows from operating activities was mainly due to an increase in dividends received from joint
ventures, an increase in receipts from customers as a result of an increase in gold production, as well as lower taxation paid due
to lower profit before taxation in Australia, Brazil, Argentina and Tanzania. This increase was partially offset by an increase in
payments to suppliers and employees as a result of higher gold production costs, and unfavourable working capital movements.
Net cash outflow from operating working capital items amounted to $140 million in 2022, compared with an inflow of $56 million
in 2021. The outflow from operating working capital in 2022 mainly related to an increase in inventories and an increase in trade,
other receivables and other assets, partially offset by an increase in trade, other payables and provisions.
Cash flows from operating activities were also impacted by movements in the lock-up of value added tax (“VAT”) at Geita in
Tanzania as well as foreign exchange controls and export duties at Cerro Vanguardia in Argentina. In Tanzania, net overdue
recoverable VAT input credit refunds (after discounting provisions) increased by $14 million, or ten percent, from $139 million in
2021 to $153 million in 2022, as a result of new claims submitted to the Tanzania Revenue Authority (“TRA”) during 2022 and
despite offsetting verified VAT claims of $45 million against corporate tax payments in 2022. See “Item 4B: Business Overview—
The Regulatory Environment Enabling AngloGold Ashanti to Mine—Africa—Tanzania”. In Argentina, the net export duty
receivables (after discounting provisions) decreased by $10 million, or 53 percent, from $19 million at 31 December 2021 to $9
million at 31 December 2022. In addition, Cerro Vanguardia’s cash balance decreased by $23 million (equivalent), or 17 percent,
from $139 million (equivalent) at 31 December 2021 to $116 million (equivalent) at 31 December 2022. While the approvals of
the Argentinean Central Bank to purchase US dollars to distribute offshore dividends to AngloGold Ashanti are pending, the cash
remains fully available for Cerro Vanguardia’s operational and exploration requirements. See “Item 4B: Business Overview—The
Regulatory Environment Enabling AngloGold Ashanti to Mine—Americas—Argentina”.
Dividends received from joint ventures increased by $463 million, from $231 million in 2021 to $694 million in 2022. In this
connection, cash flows from operating activities were impacted by the level of cash repatriation from, and movements in the VAT
lock-up at, the Kibali joint venture in the DRC. During 2022, AngloGold Ashanti’s cumulative cash receipts from the Kibali joint
venture, in the form of dividends from Kibali (Jersey) Limited, amounted to $694 million. Kibali (Jersey) Limited received such
cash from Kibali Goldmines S.A. in the form of loan repayments (net of bank fees) (AngloGold Ashanti’s attributable share: $658
million) and dividends (net of withholding taxes) (AngloGold Ashanti’s attributable share: $36 million). AngloGold Ashanti’s
attributable share of the outstanding cash balances awaiting repatriation from the DRC decreased by $459 million, or 92 percent,
from $499 million at 31 December 2021 to $40 million at 31 December 2022. The cash is fully available for the operational
requirements of Kibali Goldmines S.A. In addition, Kibali Goldmines S.A. is due certain refunds of VAT which, to date, remain
outstanding. During 2022, AngloGold Ashanti did not recover any VAT offsets and refunds from its operations in the DRC.
AngloGold Ashanti’s attributable share of the net recoverable VAT balance (including recoverable fuel duty and after discounting
190
provisions) owed to AngloGold Ashanti by the DRC government increased by $13 million, or 18 percent, from $73 million at 31
December 2021 to $86 million at 31 December 2022. See “Item 4B: Business Overview—The Regulatory Environment Enabling
AngloGold Ashanti to Mine—Africa—Democratic Republic of the Congo (DRC)”.
Net taxation paid decreased by $182 million, or 58 percent, from $316 million in 2021 to $134 million in 2022. This decrease in
net taxation paid was mainly due to lower profit before taxation in Australia, Brazil, Argentina and Tanzania.
Cash flows from investing activities
Cash flows from investing activities amounted to a net outflow of $1,461 million in 2022, $521 million, or 55 percent, higher than
an outflow of $940 million in 2021. This increase in outflow from investing activities was largely due to the acquisition of assets of
$517 million during 2022 and movements in cash restricted for use, partially offset by higher interest received in Argentina due to
higher cash and cash equivalent balances in 2022. The acquisition of assets mainly consists of the Company’s acquisition of
Corvus Gold and Coeur Sterling during 2022. On 18 January 2022, the Company completed its acquisition of all of the
outstanding stock of Corvus Gold (not already owned by AngloGold Ashanti). The cash consideration paid, including transaction
costs, amounted to $365 million. On 4 November 2022, the Company completed its acquisition of all of the outstanding stock of
Coeur Sterling (a subsidiary of Coeur Mining, Inc.). The cash consideration paid, including transaction costs, amounted to $152
million.
Cash flows from financing activities
Cash flows from financing activities in 2022 amounted to a net outflow of $323 million, which is a change of $133 million from an
outflow of $456 million in 2021. This decrease in outflow was mainly due to lower net repayment of borrowings, finance costs and
dividends paid, partially offset by an increase in repayment of lease liabilities.
Cash inflows from proceeds from borrowings decreased by $556 million, from $822 million in 2021 to $266 million in 2022. In
2021, AngloGold Ashanti Holdings plc issued, at the end of October 2021, the $750 million 2028 notes (as defined below). In
2022, AngloGold Ashanti drew the remaining undrawn commitments under the $150 million 2021 Geita RCF, fully drew on the
$65 million 2022 Siguiri RCF and partially drew on the $1.4 billion 2022 multi-currency RCF.
Cash outflows from repayment of borrowings decreased by $636 million, from $820 million in 2021 to $184 million in 2022. In
2021, AngloGold Ashanti Holdings plc repurchased its $750 million aggregate principal amount of 5.125% notes due 2022 (which
were fully and unconditionally guaranteed by AngloGold Ashanti Limited) (the “2022 notes”) by way of a tender offer in October
2021 followed by a redemption in November 2021. In 2022, AngloGold Ashanti repaid $95 million under, and cancelled, its 2018
unsecured multi-currency syndicated revolving credit facility of $1.4 billion with the Bank of Nova Scotia, as facility agent, and
certain financial institutions party thereto, as lenders (the “2018 multi-currency RCF”) and repaid $35 million under, and
cancelled, its 2016 unsecured Siguiri revolving credit facility of $65 million with Nedbank Limited.
Finance costs paid decreased by $11 million, from $120 million in 2021 to $109 million in 2022. This decrease was mainly due to
lower interest paid on the 2028 notes issued in 2021, compared to the 2022 notes which were repurchased and redeemed in
2021.
Other borrowing costs decreased by $24 million, from $35 million in 2021 to $11 million in 2022. The other borrowing costs paid
in 2021 were for the underwriting fees for the issuance of the 2028 notes as well as the tender offer premium and redemption
premium costs of the 2022 notes. The other borrowing costs paid in 2022 mainly related to the transaction costs of the $1.4
billion 2022 multi-currency RCF.
Dividends paid decreased by $37 million, from $240 million in 2021 to $203 million in 2022. Dividends paid to non-controlling
interests increased by $6 million, from $16 million in 2021 to $22 million in 2022. These dividends were paid by our non-wholly
owned subsidiaries CVSA and Siguiri to their respective non-AGA related shareholders. During 2022, the Company declared and
paid a dividend of $181 million to its shareholders, compared to a dividend of $224 million in 2021.
191
Liquidity
Sources of liquidity
To service the capital commitments and other operational requirements, AngloGold Ashanti is dependent on existing cash
resources, cash generated from operations and borrowings (in the form of bonds and credit facilities).
AngloGold Ashanti intends to finance its capital expenditure, capital lease obligations, other purchase obligations, environmental
rehabilitation expenditures and debt repayment requirements in 2024 from cash on hand, cash flow from operations, existing
credit facilities and, potentially, if deemed appropriate, long-term debt financing and the issuance of equity and equity-linked
instruments. As part of the management of liquidity, funding and interest rate risk, the Group regularly evaluates market
conditions and may enter into transactions, from time to time, to repurchase outstanding debt, pursuant to open market
purchases, privately negotiated transactions, tender offers or other means.
Cash and cash equivalents
AngloGold Ashanti’s cash and cash equivalents (net of bank overdraft) decreased by $151 million, or 14 percent, from $1.106
billion at 31 December 2022 to $955 million at 31 December 2023. At 31 December 2023, 77 percent of the Company’s cash and
cash equivalents were held in US dollars, five percent in Australian dollars, five percent in South African rands, nine percent in
Argentinean pesos and four percent in other currencies. Amounts are converted to US dollars at exchange rates as of 31
December 2023.
Cash generated from operations
Cash generated from operations is subject to operational, market and other risks. Distributions from operations may be subject to
foreign investment, exchange control laws and regulations and the quantity of foreign exchange available in offshore countries.
For example, in accordance with the rules and regulations of the Central Bank of Argentina, cash generated by our Argentinean
operations is held in Argentinean peso and is subject to monetary and exchange policy controls. In addition, distributions from
joint ventures are subject to relevant board approvals. AngloGold Ashanti’s revenues are derived primarily from the sale of gold
produced at its mines. Cash flows from operating activities are therefore the function of gold produced that is sold at a specific
price. The market price of gold can fluctuate widely, which impacts the profitability of the Company’s operations and the cash
flows generated by these operations.
Borrowings
The credit facilities contain financial covenants and other similar undertakings. To the extent that external borrowings are
required, the Company’s covenant performance indicates that existing financing facilities will be available to meet the above
commitments. To the extent that any of the financing facilities mature in the near future, the Company believes that sufficient
measures are in place to ensure that these facilities can be refinanced.
A full analysis of the borrowings as presented on the statement of financial position is included in “Item 18: Financial Statements
—Note 22—Borrowings”.
Bonds
Each of the series of notes described below were issued under the indenture dated as of 28 April 2010, as amended and
supplemented by the first supplemental indenture dated as of 23 September 2023 (as so amended and supplemented), among
AngloGold Ashanti Holdings plc, as issuer, AngloGold Ashanti plc, as successor guarantor to AngloGold Ashanti Limited
(currently known as AngloGold Ashanti (Pty) Ltd), and The Bank of New York Mellon, as trustee.
During April 2010, AngloGold Ashanti Holdings plc issued a rated bond, fully and unconditionally guaranteed by AngloGold
Ashanti plc. The 30-year ($300 million) bond with a semi-annual coupon of 6.50% per annum (the “2040 notes”) will mature on
15 April 2040, unless the Company redeems the bond earlier. See also “Item 10C: Material Contracts—Notes—2040 Notes”.
During October 2020, AngloGold Ashanti Holdings plc issued a rated bond, fully and unconditionally guaranteed by AngloGold
Ashanti plc. The 10-year ($700 million) bond with a semi-annual coupon of 3.750% per annum (the “2030 notes”) will mature on
1 October 2030, unless the Company redeems the bond earlier. See also “Item 10C: Material Contracts—Notes—2030 Notes”.
During October 2021, AngloGold Ashanti Holdings plc issued a rated bond, fully and unconditionally guaranteed by AngloGold
Ashanti plc. The 7-year ($750 million) bond with a semi-annual coupon of 3.375% per annum (the “2028 notes”) will mature on 1
November 2028, unless the Company redeems the bond earlier. See also “Item 10C: Material Contracts—Notes—2028 Notes”.
192
Credit facilities
During December 2021, Geita Gold Mining Limited, as borrower, entered into a three-year unsecured multi-currency revolving
credit facility of $150 million with Nedbank Limited, as underwriter and agent, and certain financial institutions party thereto, as
original banks (the “2021 Geita RCF”). The 2021 Geita RCF consisted of a Tanzanian shilling component capped at the
equivalent of $87 million bearing interest at 12.5% and a US dollar component bearing interest at LIBOR plus 6.7%. On 27
February 2023, the 2021 Geita RCF was amended to, among other matters, increase its size to $289 million and change the
reference rate to Term SOFR. The amended 2021 Geita RCF consists of a Tanzanian shilling component capped at the
equivalent of $160 million bearing interest at the Tanzanian treasury bill rate plus 5% and a US dollar component of $129 million
bearing interest at Term SOFR plus 6.7%. The 2021 Geita RCF will mature during August 2024 or December 2024 depending on
the fulfilment of certain conditions in the facility agreement. As of 31 December 2023, the equivalent of $103 million remained
undrawn under the 2021 Geita RCF (with the equivalent of $123 million being drawn under the TZS portion and $63 million
drawn under the USD portion).
AngloGold Ashanti (Pty) Ltd, as borrower, seeks to renew its corporate overnight facility of ZAR 150 million (the “RMB corporate
overnight facility”) with FirstRand Bank Limited on an annual basis. During October 2021, the RMB corporate overnight facility
was reduced from ZAR 500 million to ZAR 150 million. As of 31 December 2023, the ZAR 150 million RMB corporate overnight
facility was undrawn.
On 9 June 2022, AngloGold Ashanti Holdings plc and AngloGold Ashanti Australia Limited, as borrowers, entered into a new five-
year unsecured multi-currency syndicated revolving credit facility of $1.4 billion (the “2022 multi-currency RCF”) with the Bank of
Nova Scotia, as facility agent, and certain financial institutions party thereto, as lenders. The 2022 multi-currency RCF refinanced
the 2018 multi-currency RCF. The loan consists of (i) a US dollar based facility with interest charged at a margin of 1.45% above
Compounded SOFR adjusted for CAS and (ii) an Australian dollar based facility capped at A$500 million with interest charged at
a margin of 1.45% above BBSY. The applicable margin is subject to a ratings grid. In this regard, the interest margin will reduce if
the Group’s credit rating improves from its current BB+/Baa3 status and will increase if its credit rating worsens. It is expected
that the A$500 million portion of the 2022 multi-currency RCF will be used to fund the working capital and development costs
associated with the Group’s mining operations within Australia without eroding the Group’s headroom under its other facilities
and exposing the Group to foreign exchange gains/losses each quarter. On 24 May 2023, the maturity of the 2022 multi-currency
RCF was extended by one year from 9 June 2027 to 9 June 2028, with the option, upon application, to extend it further by
another year. As of 31 December 2023, the equivalent of $1,150 million remained undrawn under the 2022 multi-currency RCF
(with $250 million being drawn under the USD portion). In addition, as of the date hereof, $300 million was drawn under the USD
portion and the equivalent of $13 million was drawn under the AUD portion of the 2022 multi-currency RCF. See also “Item 10C:
Material Contracts—Multi-currency Revolving Credit Facility”.
On 13 October 2022, Société AngloGold Ashanti de Guinée S.A., as borrower, entered into a three-year unsecured revolving
credit facility of $65 million with Nedbank Limited, as lender (the “2022 Siguiri RCF”). The current interest rate charged is Term
SOFR plus 8%. The Siguiri RCF will mature on 13 October 2025. As of 31 December 2023, the 2022 Siguiri RCF was fully
drawn.
Environmental obligations
Pursuant to environmental regulations in the countries in which AngloGold Ashanti operates, in connection with plans for the
eventual end-of-life of our mines, AngloGold Ashanti is obligated to rehabilitate the lands where such mines are located. In most
cases, AngloGold Ashanti is required to provide financial guarantees for such work, including reclamation bonds or letters of
credit issued by third party entities, independent trust funds or cash reserves maintained by the operation, to the respective
environmental protection agency, or such other government department with responsibility for environmental oversight in the
respective country, to cover all or a portion of the estimated environmental rehabilitation obligations.
In most cases, the environmental obligations expire on completion of the rehabilitation although, in some cases, AngloGold
Ashanti may be required to post bonds for potential events or conditions that could arise after the rehabilitation has been
completed. In Australia, since 2014, AngloGold Ashanti has paid into a Mine Rehabilitation Fund an amount of A$13 million for a
current carrying value of the liability of A$115 million. At Iduapriem, AngloGold Ashanti has provided a bond comprising a cash
component of $12 million with a further bond guarantee amounting to $41 million issued by ABSA Bank Ghana Limited, Standard
Chartered Bank Ghana Ltd, Ecobank Ghana Ltd, United Bank for Africa, FirstRand Bank Ghana Ltd and Stanbic Bank Ghana Ltd
for a current carrying value of the liability of $45 million. At Obuasi, AngloGold Ashanti has provided a bond comprising a cash
component of $22 million with a further bank guarantee amounting to $30 million issued by United Bank for Africa, Stanbic Bank
Ghana Ltd and Standard Chartered Bank Ghana PLC for a current carrying value of the liability of $168 million. In some
circumstances, the Company may be required to post further bonds in due course which will have a consequential income
statement charge for the fees charged by the providers of the reclamation bonds.
Current borrowings
AngloGold Ashanti’s current borrowings increased by $189 million, from $18 million at 31 December 2022 to $207 million at 31
December 2023. See “Item 18: Financial Statements—Note 22—Borrowings”.
193
Non-current borrowings
AngloGold Ashanti’s non-current borrowings increased by $67 million, from $1,965 million at 31 December 2022 to $2,032 million
at 31 December 2023. See “Item 18: Financial Statements—Note 22—Borrowings”.
As at 31 December 2023, AngloGold Ashanti’s total borrowings, including the short-term portion maturing within 2024, was made
up as follows:
$ (million) | |
Unsecured borrowings | 2,239 |
Total borrowings | 2,239 |
Less: Short-term maturities (current borrowings) | 207 |
Total non-current borrowings | 2,032 |
Amounts falling due are scheduled as follows:
$ (million) | |
Within one year | 207 |
Between one and two years | 65 |
Between two and five years | 985 |
After five years | 982 |
Total | 2,239 |
At 31 December 2023, the currencies in which the borrowings were denominated were as follows:
$ (million) | |
United States dollar | 2,113 |
Tanzanian shilling | 126 |
Total | 2,239 |
At 31 December 2023, AngloGold Ashanti had the following undrawn amounts available under its borrowing facilities:
$ (million) | |
FirstRand Bank Limited corporate overnight facility (R150 million) – SA rand | 8 |
Multi-currency syndicated revolving credit facility ($1.4 billion) – US dollar / Australian dollar | 1,150 |
Geita revolving credit facility ($289 million) – US dollar / Tanzanian shilling | 103 |
Siguiri revolving credit facility ($65 million) – US dollar | — |
Total undrawn facilities | 1,261 |
AngloGold Ashanti had no other committed lines of credit as of 31 December 2023.
Due to certain accounting errors as further described in “Item 18: Financial Statements—Note 1—Statement of Compliance—1.3
Restatements—1.3.2 Prior period error in the calculation of a net deferred tax asset with respect to the Obuasi mine and other
restatements”, a technical event of default occurred under the 2022 multi-currency RCF and the 2022 Siguiri RCF as the Group’s
previously issued audited consolidated financial statements as of and for the year ended 31 December 2022 and its previously
issued unaudited condensed consolidated interim financial statements as of and for the six-month period ended 30 June 2023
did not fairly represent the consolidated financial condition of the Group as at the date to which they were drawn up.
In March 2024, the Group received waivers from all of its lenders under those facilities in respect of this technical event of default
and any other breach, default or event of default which occurred or which may occur under or in respect of such facilities as a
result of, or in connection with, those accounting errors. The Company has determined that the restatements do not have the
effect of altering the Company’s compliance with its financial maintenance covenants under such facilities in the periods covered
by the restatements. See “Item 13: Defaults, Dividend Arrearages and Delinquencies” for further information with respect to the
2022 multi-currency RCF. At 19 April 2024, the Group was in compliance with the covenants under those facilities.
See “Item 18: Financial Statements—Note 31—Financial Risk Management Activities—Capital Management” and “Item 10C:
Material Contracts”.
194
At 31 December 2023, lease liabilities were as follows:
$ (million) | |
Non-current | 98 |
Current | 73 |
Total | 171 |
AngloGold Ashanti, through its executive committee, reviews its short-, medium- and long-term funding, treasury and liquidity
requirements and positions monthly.
Supplemental parent guarantor and subsidiary issuer financial information
AngloGold Ashanti Holdings plc (the “Issuer”), a direct wholly-owned subsidiary of AngloGold Ashanti plc (the “Guarantor”), has
issued three series of outstanding debt securities which are each fully and unconditionally guaranteed by the Guarantor (the
“guaranteed debt securities”). The Issuer is a company incorporated under the laws of the Isle of Man that holds all of AngloGold
Ashanti’s operations and assets located outside of South Africa. The guaranteed debt securities outstanding as of 31 December
2023 consisted of:
•a $300 million 30-year bond, with a maturity date of 15 April 2040 and a fixed coupon of 6.500% payable semi-annually (the
“2040 notes”);
•a $750 million 7-year bond, with a maturity date of 1 November 2028 and a fixed coupon of 3.375% payable semi-annually
(the “2028 notes”); and
•a $700 million 10-year bond, with a maturity date of 1 October 2030 and a fixed coupon of 3.750% payable semi-annually
(the “2030 notes”).
The Guarantor fully and unconditionally guarantees the payment of the principal of, premium, if any, and interest on each of the
guaranteed debt securities, including any additional amounts, when and as any such payments become due, whether at maturity,
upon redemption or declaration of acceleration, or otherwise. Each guarantee constitutes unsecured and unsubordinated debt of
the Guarantor and ranks equally with all of its other unsecured and unsubordinated debt from time to time outstanding. Each
guarantee is or will be effectively subordinated to any of the Guarantor’s existing and future secured debt, to the extent of the
value of the assets securing such debt, and structurally subordinated to all of the existing and future liabilities (including trade
payables) of each of the Guarantor’s subsidiaries (other than the Issuer). As at 31 December 2023, all of the debt of the
Guarantor was unsecured. Under the terms of each full and unconditional guarantee, holders of the guaranteed debt securities
will not be required to exercise their remedies against the Issuer before they proceed directly against the Guarantor.
The following summarised financial information reflects, on a combined basis, the assets, liabilities, and results of operations of
the Issuer and the Guarantor (collectively, the “Obligor Group”). Intercompany balances and transactions within the Obligor
Group have been eliminated. Amounts attributable to the Obligor Group’s investment in consolidated subsidiaries that have not
issued or guaranteed the guaranteed debt securities (the “Non-Obligor Subsidiaries”) have been excluded. The Obligor Group’s
amounts due from, amounts due to and transactions with Non-Obligor Subsidiaries have been separately disclosed, if
considered to be material. The summarised financial information below should be read in conjunction with AngloGold Ashanti’s
consolidated financial statements as at and for the year ended 31 December 2023, see “Item 18: Financial Statements”.
195
Income statement information
Obligor Group (1) | |
$ (million) | Year ended 31 December 2023 |
Net intergroup dividends, interest, royalties and fees with Non-Obligor Subsidiaries | 7 |
Loss for the period | (103) |
(1) Upon completion of the corporate restructuring, AngloGold Ashanti plc replaced AngloGold Ashanti Limited as the Guarantor of the Group’s guaranteed debt
securities. AngloGold Ashanti Holdings plc and AngloGold Ashanti plc on a combined basis represent the Obligor Group. The Guarantor’s principal activity is to act as
a holding company for AngloGold Ashanti’s operations and had no revenue, costs or expenses for the year ended 31 December 2023. As a result, revenue, cost of
sales and gross profit are not presented. The principal activity of the Issuer is to act as a holding company for all of AngloGold Ashanti’s operations and assets
located outside of South Africa.
Statement of financial position information
Obligor Group | |
$ (million) | As at 31 December 2023 |
ASSETS | |
Current assets | |
Receivables due from Non-Obligor Subsidiaries | 2,001 |
Receivables due from other related parties | 148 |
Other current assets | 500 |
2,649 | |
Non-current assets | |
Receivables due from other related parties | 358 |
LIABILITIES | |
Current liabilities | |
Payables due to Non-Obligor Subsidiaries | 391 |
Other current liabilities | 86 |
477 | |
Non-current liabilities | 1,967 |
Contractual commitments and contingencies
For a detailed discussion of commitments and contingencies, see “Item 18: Financial Statements—Note 30—Contractual
Commitments and Contingencies”.
At 31 December 2023, capital commitments can be summarised over the periods shown below as follows:
Expiration per period | |||||||||
Commitment | Total amount | Less than 1 year | 1 – 3 years | 4 – 5 years | Over 5 years | ||||
(in millions) | $ | $ | $ | $ | $ | ||||
Capital expenditure (contracted and not yet contracted) (1) | 533 | 445 | 88 | — | — | ||||
(1)There were no commitments through contractual arrangements with equity-accounted joint ventures.
196
To service the above capital commitments and other operational requirements, the Group is dependent on existing cash
resources, cash generated from operations and borrowings (in the form of bonds and credit facilities).
Contractual obligations
At 31 December 2023, AngloGold Ashanti had the following known contractual obligations:
Total | Less than 1 year | 1 – 3 years | 4 – 5 years | More than 5 years | |||||
(in millions) | $ | $ | $ | $ | $ | ||||
Long-term debt obligations including interest(1) | 3,004 | 312 | 248 | 1,167 | 1,277 | ||||
Capital lease obligations | 187 | 75 | 72 | 11 | 29 | ||||
Purchase obligations | |||||||||
- Contracted capital expenditure(2) | 141 | 137 | 4 | — | — | ||||
- Other purchase obligations(3) | 699 | 428 | 194 | 77 | — | ||||
Environmental rehabilitation costs(4) | 759 | 78 | 233 | 103 | 345 | ||||
Provision for silicosis(5) | 24 | 1 | 8 | 10 | 5 | ||||
Pensions and other post-retirement medical obligations(6) | 64 | 8 | 16 | 14 | 26 | ||||
Total | 4,878 | 1,039 | 775 | 1,382 | 1,682 |
(1)Interest calculations are at the rate existing at the year end. Actual rates are set at floating rates for some of the borrowings (Refer to “Item 18: Financial
Statements—Note 22—Borrowings”).
(2)Represents contracted capital expenditure for which contractual obligations exist.
(3)Other purchase obligations represent contractual obligations for mining contract services, purchase of power, supplies, consumable stores, inventories,
explosives and activated carbon.
(4)Pursuant to environmental requirements, AngloGold Ashanti is obligated to close its operations and reclaim and rehabilitate the lands upon which it conducted its
mining and gold recovery operations. The present value of estimated closure costs at existing operating mines as well as mines in various stages of closure are
reflected in this table. Costs are calculated using undiscounted real cash flows, not nominal cash flows. The amount will change from year to year depending on
rehabilitation work undertaken, changes in design and methodology, and new occurrences. For more information on AngloGold Ashanti’s environmental
rehabilitation obligations, see “Item 4B: Business Overview—Mine Site Rehabilitation and Closure” and “Item 4B: Business Overview—Sustainability and
Environmental, Social and Governance (“ESG”) Matters”. Amounts stated include a total estimated liability of $23 million in respect of equity-accounted joint
ventures.
(5) In South Africa, AngloGold Ashanti has been subject to numerous claims, including class action litigation with respect to alleged occupational lung diseases. The
settlement agreement in relation to the silicosis and tuberculosis class action came into effect in December 2019, following the approval of the settlement by the
High Court in Johannesburg in July 2019. As a result, a trust (Tshiamiso Trust) was established for a minimum of 13 years responsible for making payments to
eligible beneficiaries. The amount of monetary compensation will vary depending on the nature and seriousness of the disease. See “Item 3D: Risk Factors—The
prevalence of occupational health diseases and other diseases and the potential costs and liabilities related thereto may have an adverse effect on the business
and results of operations of AngloGold Ashanti”, “Item 4B: Business Overview—Sustainability and Environmental, Social and Governance (“ESG”) Matters” and
“Item 18: Financial Statements—Note 23—Environmental Rehabilitation and Other Provisions—Significant Accounting Judgements and Estimates—Provision for
Silicosis”. Amounts included above are undiscounted.
(6)Represents payments for unfunded plans or plans with insufficient funding. A $35 million reimbursive asset relating to annuities purchase to fund the asset has
been separately recognised.
Off-balance sheet arrangements
AngloGold Ashanti does not engage in off-balance sheet financing activities, and does not have any off-balance sheet debt
obligations, special purpose entities or unconsolidated associates.
Recent developments
Recent developments disclosed in “Item 18: Financial Statements—Note 33—Subsequent Events” include the following details:
Dividend declaration - On 23 February 2024, the directors of AngloGold Ashanti announced the payment of a gross interim
cash dividend per ordinary share of 19 US cents.
Related party transactions
For a detailed discussion of related party transactions, see “Item 7B: Related Party Transactions”.
Recently adopted accounting standards and amendments to published accounting standards
AngloGold Ashanti’s adoption of new accounting standards and amendments to published accounting standards are described in
“Item 18: Financial Statements—Note 1—Statement of Compliance—Accounting Standards, Interpretations and Amendments to
Published Accounting Standards”.
197
Critical accounting policies
AngloGold Ashanti’s accounting policies are described in the relevant notes to “Item 18: Financial Statements” under the heading
“Accounting Policies”.
Use of estimates and making of assumptions
The preparation of the Company’s financial statements requires management to make estimates and assumptions that affect the
reported amounts of assets and liabilities and disclosures of contingent assets and liabilities at the date of the financial
statements and the reported amounts of revenues and expenses during the year.
The more significant areas requiring the use of management estimates and assumptions relate to Mineral Reserve that are the
basis of future cash flow estimates and unit-of-production depreciation, depletion and amortisation calculations; environmental,
reclamation, rehabilitation and closure obligations; asset impairments/reversals (including impairments of goodwill); production
start dates; and write downs of inventory to net realisable value. Other estimates include employee benefit liabilities and
unrecognised tax positions.
The complex or subjective judgements that have the most significant effect on amounts recognised and the sources of estimation
uncertainty where there is a significant risk of material adjustment to the carrying amounts of assets or liabilities in the next
reporting period are continually evaluated and are based on historical experience and other factors, including expectations of
future events that are believed to be reasonable under the circumstances. On an ongoing basis, management evaluates its
estimates and assumptions; however, actual amounts could differ significantly due to the ultimate conclusion of uncertainties.
AngloGold Ashanti’s significant accounting judgements and estimates are described in the relevant notes to “Item 18: Financial
Statements” under the heading “Significant Accounting Judgements and Estimates”.
5C.RESEARCH AND DEVELOPMENT, PATENTS AND LICENSES, ETC.
Research and development expenditure included in the income statement amounted to nil during 2023 and $1 million during
each of 2022 and 2021.
5D.TREND INFORMATION
For a discussion of trends affecting AngloGold Ashanti’s business and operations, see “Item 5A: Operating Results—Key factors
affecting results”.
5E.CRITICAL ACCOUNTING ESTIMATES
Not applicable.
198
ITEM 6: DIRECTORS, SENIOR MANAGEMENT AND EMPLOYEES
On 25 September 2023, the Group completed a corporate restructuring whereby its operations were reorganised under a new
parent company, AngloGold Ashanti plc, incorporated in England and Wales and tax resident in the UK, with a primary listing of
its ordinary shares on the NYSE. Upon completion of the corporate restructuring, AngloGold Ashanti plc became the successor
issuer to AngloGold Ashanti Limited and all members of the AngloGold Ashanti Limited board of directors became members of
the AngloGold Ashanti plc board of directors. The Group’s Executive Committee remained unchanged. The previous South
African parent company of the Group, AngloGold Ashanti Limited, became a direct, wholly-owned subsidiary of AngloGold
Ashanti plc and was renamed AngloGold Ashanti (Pty) Ltd.
6A. DIRECTORS AND SENIOR MANAGEMENT
Directors
As at 19 April 2024, AngloGold Ashanti has a unitary board comprising twelve directors – ten independent non-executive
directors and two executive directors.
Certain information with respect to AngloGold Ashanti’s directors is set forth below:
Name | Age | Position | Month and year first appointed to board of AngloGold Ashanti plc (1)(2)(3) | Year first appointed to board of AngloGold Ashanti Limited (1)(4) | |||
Maria Ramos (5) | 65 | Independent non-executive director and chairperson | September 2023 | 2019 | |||
Rhidwaan Gasant | 64 | Lead independent non-executive director | September 2023 | 2010 | |||
Kojo Busia | 61 | Independent non-executive director | September 2023 | 2020 | |||
Alan Ferguson | 66 | Independent non-executive director | September 2023 | 2018 | |||
Albert Garner | 68 | Independent non-executive director | September 2023 | 2015 | |||
Scott Lawson | 62 | Independent non-executive director | September 2023 | 2021 | |||
Jinhee Magie | 56 | Independent non-executive director | September 2023 | 2023 | |||
Maria Richter (6) | 69 | Independent non-executive director | September 2023 | 2015 | |||
Diana Sands | 58 | Independent non-executive director | September 2023 | 2023 | |||
Jochen Tilk (7) | 60 | Independent non-executive director | September 2023 | 2019 | |||
Alberto Calderon | 64 | Executive director and Chief Executive Officer | February 2023 | 2021 | |||
Gillian Doran | 47 | Executive director and Chief Financial Officer | September 2023 | 2023 |
(1) Month and year of first appointment are shown for the current parent company of the Group (AngloGold Ashanti plc) and year of appointment is shown for the
previous parent company of the Group (AngloGold Ashanti Limited).
(2) Mr. Robert Hayes was initially appointed as a director of AngloGold Ashanti plc in February 2023. He retired from the board of directors of AngloGold Ashanti plc on
25 September 2023 upon completion of the corporate restructuring.
(3) The articles of association of AngloGold Ashanti plc require that at every annual general meeting of shareholders (“AGM”) all directors at the date of the notice
convening the AGM shall retire from office and may offer themselves for reappointment by the shareholders.
(4) On 25 September 2023, upon completion of the corporate restructuring, all directors stepped down as directors of AngloGold Ashanti Limited.
(5) Ms. Maria Ramos has elected not to stand for re-election at the 2024 AGM (scheduled for 28 May 2024).
(6) Ms. Maria Richter has elected not to stand for re-election at the 2024 AGM (scheduled for 28 May 2024).
(7) Mr. Jochen Tilk has been appointed as chairperson of the board of directors with effect from 28 May 2024, subject to his re-election at the 2024 AGM (scheduled
for 28 May 2024).
Maria Ramos (65) | ||
MSc, BCom (Hons), Banker Diploma, Certified Associate of the Institute of Bankers (SA) | ||
Independent Non-Executive Director and Chairperson | ||
Appointed to AngloGold Ashanti plc: 25 September 2023 and as chairperson of the board on the same date | ||
Appointed to AngloGold Ashanti Limited: 1 June 2019 and as chairperson of the board on 5 December 2020 | ||
Board committee memberships: | Nominations and Governance Committee (Chairperson) | |
Maria Ramos is an independent non-executive director of Standard Chartered Plc and serves on the board of Compagnie
Financière Richemont SA. She served as Group chief executive officer of Absa Group (previously Barclays Africa Group
Limited), retiring in 2019. Prior to that she was CEO of Transnet and served as Director General of South Africa’s National
Treasury.
199
She recently served as independent non-executive director on the boards of the Public Investment Corporation and Saudi British
Bank. She also co-chaired the United Nations Secretary General's Task Force on Digital Financing of the Sustainable
Development Goals.
Ms. Ramos has in the past served as a non-executive and independent director on the boards of Sanlam Ltd, Remgro Ltd and
SABMiller Plc. She was a member of the World Economic Forum's International Business Council and member of its executive
committee and its chairperson for two years.
She is a member of the Group of Thirty and serves on the International Advisory Board of the Blavatnik School of Government,
Oxford University.
Ms. Ramos has elected not to stand for re-election at the 2024 AGM.
Rhidwaan Gasant (64) | ||
BCompt (Hons), CA (SA), ACIMA, CGMA, Executive Development Programme | ||
Lead Independent Non-Executive Director | ||
Appointed to AngloGold Ashanti plc: 25 September 2023 | ||
Appointed to AngloGold Ashanti Limited: 12 August 2010 | ||
Board committee memberships: | Audit and Risk Committee Compensation and Human Resources Committee Nominations and Governance Committee Social, Ethics and Sustainability Committee | |
Rhidwaan Gasant was previously the CFO of Engen Limited, and the CEO of Energy Africa Limited. He is currently the
independent non-executive chairman of Growthpoint Properties Limited and chairs the board audit committee of MTN Nigeria
Communications Plc.
Kojo Busia (61) | ||
PhD, MA, BA | ||
Independent Non-Executive Director | ||
Appointed to AngloGold Ashanti plc: 25 September 2023 | ||
Appointed to AngloGold Ashanti Limited: 1 August 2020 | ||
Board committee memberships: | Social, Ethics and Sustainability Committee (Chairperson) Investment Committee Nominations and Governance Committee | |
Kojo Busia has over 25 years of professional experience in African natural resources governance and management working at
both bilateral and multilateral organisations. He is currently co-founding director of Green Africa Minerals FZCo. He recently held
the position of Chief of the Natural Resources Management Section, Technology, Climate Change and Natural Resource
Management Division, at the United Nations Economic Commission for Africa (UNECA).
He previously served as coordinator of the African Mineral Development Centre (AMDC) at the UNECA. Prior to heading the
AMDC, Dr. Busia spent nearly a decade leading the African Peer Review Mechanism Support Section, Governance and Public
Administration Division, also at the UNECA. In addition, Dr. Busia has served on several advisory boards including the
Responsible Mining Foundation Advisory Council, Advisory Director of Global Mining Sustainability, and Mining Indaba’s
Sustainability Advisory Committee. He is a founding director of the Africa Resource Management, Environment and Climate
Change Institute, a think-do-tank recently established in Accra, Ghana.
200
Alan Ferguson (66) | ||
BSc, CA (Scotland) | ||
Independent Non-Executive Director | ||
Appointed to AngloGold Ashanti plc: 25 September 2023 | ||
Appointed to AngloGold Ashanti Limited: 1 October 2018 | ||
Board committee memberships: | Audit and Risk Committee (Chairperson) Compensation and Human Resources Committee Nominations and Governance Committee | |
Alan Ferguson was a former chief financial officer of a number of FTSE-listed entities, including Lonmin Plc. Since 2011 he has
held non-executive directorships on a number of boards including Johnson Matthey, Croda International and Marshall Motors
Holdings where he chaired their audit committees and was the Senior Independent Director. He currently serves on the board of
Harbour Energy, where he chairs the audit committee. In addition, Mr. Ferguson serves as a member of the Business Policy
Panel of the Institute of Chartered Accountants of Scotland and is a member of the leadership team of the UK Audit Committee
Chair's Independent Forum.
Albert Garner (68) | ||
BSE | ||
Independent Non-Executive Director | ||
Appointed to AngloGold Ashanti plc: 25 September 2023 | ||
Appointed to AngloGold Ashanti Limited: 1 January 2015 | ||
Board committee memberships: | Audit and Risk Committee Compensation and Human Resources Committee Investment Committee | |
Albert Garner has extensive experience in capital markets, corporate finance and mergers and acquisitions. He worked with
Lazard Frères & Co. LLC for over 40 years in various leadership positions until his retirement at the end of 2023. He was one of
the most senior bankers at Lazard. He led their special committee practice and corporate finance practice. He also chaired their
fairness opinion committee. Mr. Garner became a general partner in 1989 and was Vice Chair of Investment Banking upon his
retirement in 2023.
Scott Lawson (62) | ||
BSc, Civil Engineering, MBA | ||
Independent Non-Executive Director | ||
Appointed to AngloGold Ashanti plc: 25 September 2023 | ||
Appointed to AngloGold Ashanti Limited: 1 December 2021 | ||
Board committee memberships: | Audit and Risk Committee Investment Committee Social, Ethics and Sustainability Committee | |
Scott Lawson has over 35 years in the mining industry and is an experienced global mining executive who has served in a broad
range of roles. He is the former executive vice president and chief integration officer of Newmont Corporation. Prior to this Mr.
Lawson served as executive vice president and chief technology officer and other executive technical roles for Newmont
Corporation.
Mr. Lawson spent 22 years with Rio Tinto in executive roles with Rio Tinto Alcan, Rio Tinto Technology and Innovation and Rio
Tinto Kennecott. He is the former senior vice president, engineering services at Peabody Energy responsible for global
engineering and technical services support.
201
Jinhee Magie (56) | ||
CPA, CA | ||
Independent Non-Executive Director | ||
Appointed to AngloGold Ashanti plc: 25 September 2023 | ||
Appointed to AngloGold Ashanti Limited: 1 June 2023 | ||
Board committee memberships: | Audit and Risk Committee Investment Committee | |
Jinhee Magie is the former Chief Financial Officer of Lundin Mining Corporation, a Canadian-based international metals
company, having served over 14 years with the company in various roles of increasing responsibility. She is a finance executive
with extensive public company experience in the areas of corporate strategy, capital markets, mergers and acquisitions and
information technology, particularly within the mining industry. Ms. Magie is a corporate director who currently serves on the
boards of Lithium Americas Corp and Star Royalties Limited.
Maria Richter (69) | ||
BA, Juris Doctor | ||
Independent Non-Executive Director | ||
Appointed to AngloGold Ashanti plc: 25 September 2023 | ||
Appointed to AngloGold Ashanti Limited: 1 January 2015 | ||
Board committee memberships: | Compensation and Human Resources Committee (Chairperson) Nominations and Governance Committee Social, Ethics and Sustainability Committee | |
Maria Richter is an experienced non-executive director who has served on a diverse range of US and international company
boards. She previously served on the board of Barclays International, Barclays Bank plc and National Grid plc where she was
the chairperson of the finance committee and member of the audit and nominations committees. She currently sits on the boards
of Rexel Group, France, a global leader in the professional distribution of energy products and services, and Bessemer Trust, a
US wealth management company, and is a member of the audit and nominations committees of Rexel and the remuneration
committee of Bessemer Trust.
During Ms. Richter’s professional career she served in various positions at the former Dewey Ballantine, Prudential, Salomon
Brothers Inc. and Morgan Stanley & Co.
Ms. Richter has elected not to stand for re-election at the 2024 AGM.
Diana Sands (58) | ||
CPA, MBA | ||
Independent Non-Executive Director | ||
Appointed to AngloGold Ashanti plc: 25 September 2023 | ||
Appointed to AngloGold Ashanti Limited: 1 June 2023 | ||
Board committee memberships: | Compensation and Human Resources Committee Social, Ethics and Sustainability Committee | |
Diana Sands brings over 30 years of business experience to her board roles. She serves on the board of publicly held SP+
Corporation, and on the board of privately held Vmo Aircraft Leasing. She also served on the board of PDC Energy, Inc. until it
was acquired by Chevron Corporation. Ms. Sands previously held senior executive finance and governance positions at the
Boeing Company including SVP Office of Internal Governance and Administration which oversaw ethics and investigations,
compliance risk management, internal audit, security, and internal services. She was also corporate controller, and head of
investor relations and financial planning. Previously Ms. Sands worked in the automotive and telecommunications sectors and
started her career as a Certified Public Accountant.
202
Jochen Tilk (60) | ||
Bachelors in Mining Engineering, Masters in Mining Engineering | ||
Independent Non-Executive Director | ||
Appointed to AngloGold Ashanti plc: 25 September 2023 | ||
Appointed to AngloGold Ashanti Limited: 1 January 2019 | ||
Board committee memberships: | Investment Committee (Chairperson) Social, Ethics and Sustainability Committee Nominations and Governance Committee Audit and Risk Committee | |
Jochen Tilk is the former executive chair of Nutrien Inc., a Canadian global supplier of agricultural products and services. He is
the former president and Chief Executive Officer of Potash Corporation. Mr. Tilk, previously spent 25 years with Inmet Mining
Corporation, a Canadian-based, international metals company, with five of those years as the company’s president and chief
executive officer. He is also a director of Emera Inc., a publicly listed energy utility company and vice-chair of the Princess
Margaret Cancer Foundation, a not-for-profit organization.
Subject to his re-election at the 2024 AGM, Mr. Tilk will be appointed Board Chairperson.
Alberto Calderon (64) | ||
PhD, MPhil, MA, Juris Doctor, BA | ||
Chief Executive Officer and Executive Director | ||
Appointed to AngloGold Ashanti plc: 10 February 2023 | ||
Appointed to AngloGold Ashanti Limited: 1 September 2021 | ||
Board committee memberships: | None | |
Alberto Calderon’s executive experience includes leadership roles across the mining, petroleum, and energy sectors. He served
as the chief executive officer of Orica and was also an executive at BHP Group Plc. During his time with BHP Group Plc, Mr.
Calderon held a number of key leadership positions, including group executive and chief executive aluminum, nickel and
corporate development, group executive and chief commercial officer.
Mr. Calderon was also CEO of Cerrejón Coal Company, an integrated thermal coal mine in Colombia, and CEO of the Colombian
oil company, Ecopetrol. Prior to this, Mr. Calderon held senior leadership positions in the International Monetary Fund and the
Colombian government and has been a board member of a range of private, public and non-government organisations.
Gillian Doran (47) | ||
Fellow Member of Association of Chartered Certified Accountants (FCCA) | ||
Chief Financial Officer and Executive Director | ||
Appointed to AngloGold Ashanti plc: 25 September 2023 | ||
Appointed to AngloGold Ashanti Limited: 1 January 2023 | ||
Board committee memberships: | None | |
Gillian Doran brings more than 25 years of experience in finance and commercial roles across a number of industries,
predominantly natural resources and also construction and manufacturing. Prior to joining the Company, Ms. Doran served as
chief financial officer for Rio Tinto’s Global Aluminium division. Ms. Doran’s career at Rio Tinto spanned over 15 years in a
number of senior finance roles within operations, regional business unit and Group headquarters. A seasoned international
executive leader having previously worked and lived in Europe, North America and Australia, Ms. Doran brings to AngloGold
Ashanti deep experience in financial accounting, planning, performance management, investment, transformation and strategy.
Board movements during 2023 and subsequent to year-end
AngloGold Ashanti plc
Upon completion of the corporate restructuring on 25 September 2023, all members of the AngloGold Ashanti Limited board of
directors became members of the AngloGold Ashanti plc board of directors. Mr. Alberto Calderon had already become a member
of the AngloGold Ashanti plc board of directors on 10 February 2023 and all other directors became members of the AngloGold
Ashanti plc board of directors on 25 September 2023. Furthermore, in connection with the corporate restructuring and prior to
203
AngloGold Ashanti plc becoming the parent company of the Group, Mr. Robert Hayes had been appointed as a director of
AngloGold Ashanti plc on 10 February 2023. On 25 September 2023, upon completion of the corporate restructuring, Mr. Robert
Hayes retired from the AngloGold Ashanti plc board of directors.
Effective at or prior to the completion of the corporate restructuring, the board of directors AngloGold Ashanti plc established an
Audit and Risk Committee, a Compensation and Human Resources Committee, a Social, Ethics and Sustainability Committee,
an Investment Committee and a Nominations and Governance Committee with the same membership as the corresponding
AngloGold Ashanti Limited board committees (except for one director stepping down from the Investment Committee following
the corporate restructuring). The functions that these committees perform is specified in their respective charters and their
powers and responsibilities are substantially similar to those of the committees of the AngloGold Ashanti Limited board at or
immediately prior to the completion of the corporate restructuring.
The following changes to the composition of the board of directors of AngloGold Ashanti plc, and its committees, took place
during the period from 25 September 2023, when AngloGold Ashanti plc became the parent company of the Group upon
completion of the corporate restructuring, to 31 December 2023 and subsequent to year-end, or are expected to take place after
the date hereof:
•On 25 September 2023, Ms. Gillian Doran stepped down from the AngloGold Ashanti plc Investment Committee.
•On 8 March 2024, the below changes to the membership of the board of directors of AngloGold Ashanti plc and certain
of its committees were announced:
•Ms. Maria Ramos has elected not to stand for re-election at the 2024 AGM (scheduled for 28 May 2024) and will
retire from the AngloGold Ashanti plc board of directors as chairperson and an independent non-executive director
with effect from 28 May 2024. As a result, Ms. Maria Ramos will also step down from the AngloGold Ashanti plc
Nominations and Governance Committee on the same date.
•Ms. Maria Richter has elected not to stand for re-election at the 2024 AGM (scheduled for 28 May 2024) and will
retire from the AngloGold Ashanti plc board of directors as an independent non-executive director with effect from 28
May 2024. As a result, Ms. Maria Richter will also step down from the AngloGold Ashanti plc Compensation and
Human Resources Committee (of which she is the chairperson), the AngloGold Ashanti plc Nominations and
Governance Committee and the AngloGold Ashanti plc Social, Ethics and Sustainability Committee on the same
date.
•Mr. Jochen Tilk has been appointed as chairperson of the AngloGold Ashanti plc board of directors with effect from
28 May 2024, subject to his re-election at the 2024 AGM (scheduled for 28 May 2024), and as chairperson of the
AngloGold Ashanti plc Nominations and Governance Committee (of which he is currently a member). Mr. Jochen Tilk
will also step down from the AngloGold Ashanti plc Audit and Risk Committee and the AngloGold Ashanti plc Social,
Ethics and Sustainability Committee on the same date.
•Mr. Albert Garner has been appointed as chairperson of the AngloGold Ashanti plc Compensation and Human
Resources Committee with effect from 28 May 2024, subject to his re-election at the 2024 AGM (scheduled for 28
May 2024).
•On 31 March 2024, the AngloGold Ashanti plc Investment Committee ceased to exist and, with effect from 1 April 2024,
its duties and responsibilities were assumed by the AngloGold Ashanti plc board of directors.
The current membership of the AngloGold Ashanti plc board committees as of the date hereof is set out below.
Board Committee | Membership |
Audit and Risk Committee | Alan Ferguson (Chair) Albert Garner Rhidwaan Gasant Scott Lawson Jinhee Magie Jochen Tilk |
Compensation and Human Resources Committee | Maria Richter (Chair) Alan Ferguson Albert Garner Rhidwaan Gasant Diana Sands |
Investment Committee (1) | Jochen Tilk (Chair) Kojo Busia Albert Garner Scott Lawson Jinhee Magie |
204
Nominations and Governance Committee | Maria Ramos (Chair) Kojo Busia Alan Ferguson Rhidwaan Gasant Maria Richter Jochen Tilk |
Social, Ethics and Sustainability Committee | Kojo Busia (Chair) Rhidwaan Gasant Scott Lawson Maria Richter Diana Sands Jochen Tilk |
(1) On 31 March 2024, the AngloGold Ashanti plc Investment Committee ceased to exist and, with effect from 1 April 2024, its duties and responsibilities were
assumed by the AngloGold Ashanti plc board of directors.
The Company’s articles of association require that at every AGM all directors at the date of the notice convening the AGM shall
retire from office and may offer themselves for reappointment by the shareholders. All current directors, other than Ms. Maria
Ramos and Ms. Maria Richter, will offer themselves for reappointment as directors of the Company at the 2024 AGM (scheduled
for 28 May 2024).
AngloGold Ashanti Limited
The following changes to the composition of the board of directors of AngloGold Ashanti Limited, and its committees, took place
during the period from 1 January 2023 to 25 September 2023, when AngloGold Ashanti Limited ceased to be the parent
company of the Group upon completion of the corporate restructuring:
•On 1 January 2023, Ms. Gillian Doran joined the AngloGold Ashanti Limited board of directors as an executive director.
•On 22 February 2023, the below changes to the membership of certain AngloGold Ashanti Limited board committees
became effective:
•Ms. Maria Richter stepped down from the AngloGold Ashanti Limited Audit and Risk Committee and was
appointed as a member of the AngloGold Ashanti Limited Social, Ethics and Sustainability Committee.
•Ms. Maria Ramos stepped down from the AngloGold Ashanti Limited Social, Ethics and Sustainability
Committee.
•Mr. Rhidwaan Gasant stepped down from the AngloGold Ashanti Limited Investment Committee and was
appointed as a member of the AngloGold Ashanti Limited Social, Ethics and Sustainability Committee.
•Ms. Gillian Doran was appointed as a member of the AngloGold Ashanti Limited Investment Committee.
•On 15 May 2023, following shareholder approval at the 2023 AGM, the below changes to the membership of the
AngloGold Ashanti Limited Audit and Risk Committee became effective:
•Mr. Albert Garner and Mr. Scott Lawson were appointed as members of the AngloGold Ashanti Limited Audit
and Risk Committee.
•On 1 June 2023, Ms. Jinhee Magie joined the AngloGold Ashanti Limited board of directors as a non-executive director
and was appointed as a member of the AngloGold Ashanti Limited Audit and Risk Committee and the AngloGold
Ashanti Limited Investment Committee.
•On 1 June 2023, Ms. Diana Sands joined the AngloGold Ashanti Limited board of directors as a non-executive director
and was appointed as a member of the AngloGold Ashanti Limited Remuneration and Human Resources Committee
and the AngloGold Ashanti Limited Social, Ethics and Sustainability Committee.
EXECUTIVE COMMITTEE
AngloGold Ashanti’s executive management team (the “Executive Committee”) currently comprises eight members of whom two
are executive directors. The Executive Committee oversees the day-to-day management of the Group’s activities and is
supported by country and regional management teams as well as by Group corporate functions.
In addition to Mr. Alberto Calderon and Ms. Gillian Doran, the following people are members of the Executive Committee:
Lisa Ali (56)
BSc (Hons) in Chemistry, Analytical Chemistry, Biochemistry; Executive MBA
Chief People Officer
Lisa Ali was appointed as Chief People Officer of the Group and a member of the Executive Committee with effect from 1 April
2022. In this role, Ms. Ali is responsible for Group human resources.
205
Ms. Ali has over 30 years of experience, mostly in the extractive industries. Prior to joining AngloGold Ashanti, Ms. Ali has served
as Chief People and Sustainability Officer at Newcrest Mining Limited, which she joined in 2020. Before that, Ms. Ali was Head of
Transformation at Trinidad Petroleum Holdings Ltd. and its subsidiary companies, and has held several senior positions at BP
International PLC.
Stewart Bailey (50)
Chief Sustainability and Corporate Affairs Officer
Stewart Bailey’s portfolio includes stakeholder relations and the broader ambit of sustainability policy and oversight. He leads a
strong team of specialists covering community and government relations, communications and investor relations, reporting,
environment, security and human rights. Throughout approximately 14 years with AngloGold Ashanti, based both in the US and
South Africa, he has built an in-depth knowledge of the Group, its operations and its stakeholders. He is a former financial
journalist with Bloomberg LP in New York and Johannesburg.
Terry Briggs (51)
BSc (Hons); MEng
Chief Development Officer
Terry Briggs was appointed as Chief Development Officer of the Group and a member of the Executive Committee with effect
from 1 April 2022. His portfolio at AngloGold Ashanti includes Corporate Strategy and Business Development, Global Projects
and Greenfields Exploration, focusing on optimisation and sustainable growth for the Company.
Mr. Briggs has over 25 years of experience, spanning site-based technical and operations management roles at several
underground and open pit base and precious metal operations globally and at all stages of development from start-up to closure.
Prior to joining AngloGold Ashanti, Mr. Briggs spent over a dozen years at Newmont Corporation in various leadership roles in
Technical Services, Corporate Development and Finance, where he played a prominent role in a variety of large-scale
transactions and value-add initiatives.
Mr. Briggs is a representative on various geology and mining industry bodies and has authored several publications on
engineering, geology and exploration. He is also a Fellow of The Australasian Institute of Mining and Metallurgy (FAusIMM).
Marcelo Godoy (52)
PhD Strategic Mine Planning, Masters Geostatistics
Chief Technology Officer
Marcelo Godoy has over 25 years of experience in the mining industry and was previously Senior Vice President, Exploration at
Newmont Corporation where he led the development of numerous innovation programmes, including a world-class orebody risk
management system that delivered a step change in the reliability of production forecasts. Mr. Godoy is a recognised leader in
the field of mine planning under uncertainty and a champion of diversity and inclusion. Prior to joining Newmont, he was Mining
Sector Leader for Golder Associates in South America and a Director at Golder's Global Board of Directors. During his tenure at
Golder Associates, Mr. Godoy managed major mining feasibility studies and reserve compliance audits for the world’s top
producers of base Metals, iron ore and gold.
He brings to AngloGold Ashanti experience in resource modelling, mine planning and project development, as well as a track
record in leading technical teams and introducing technology to drive sustainable competitive advantage.
Richard Jordinson (63)
BSc ACSM
Chief Operating Officer
Richard Jordinson was appointed as Chief Operating Officer with effect from 1 October 2023. Mr. Jordinson joined AngloGold
Ashanti in 2012 as General Manager of Sunrise Dam and subsequently undertook a variety of roles including General Manager
of Geita Gold Mine and Senior Vice President of AngloGold Ashanti’s Ghana-Tanzania Business Unit. He has over 38 years of
industry experience from across the gold, iron ore, nickel, zinc and lead mining sectors. He also brings a proven track record of
adding value to the portfolios he has helped lead by bringing new operations into production on time and on budget and
overseeing complex transitions to underground mining.
Lizelle Marwick (46)
BProc, LLB, LLM
Chief Legal Officer
Lizelle Marwick was appointed as Executive Vice President: General Counsel and Compliance of the Group on 1 July 2020, after
previously serving as Senior Vice President: Deputy General Counsel.
206
She joined AngloGold Ashanti in 2011 establishing and heading up the legal function for the Africa operations. She is familiar
with all aspects of the organisation and well versed on multi-jurisdictional legal work covering a wide range of subjects, with
extensive experience in governance, corporate transactions and government negotiations.
Prior to joining AngloGold Ashanti, Ms. Marwick practiced law at Bowman Gilfillan in South Africa and Herbert Smith in the United
Kingdom. She is admitted as an attorney in South Africa and a solicitor in England and Wales.
Executive Committee movements during 2023 and subsequent to year-end
The following movements to the Executive Committee of the Group took place during the period from 1 January 2023 to
31 December 2023 and subsequent to year-end:
•With effect from 1 January 2023, Ms. Gillian Doran was appointed as Chief Financial Officer and a member of the
Executive Committee of the Group, upon which Mr. Ian Kramer (who had served as Interim Chief Financial Officer)
stepped down from the Executive Committee and resumed his role as Senior Vice President: Group Finance.
•With effect from 30 June 2023, Mr. Ludwig Eybers stepped down as Chief Operating Officer and a member of the
Executive Committee of the Group, upon which Mr. Marcelo Godoy was appointed as Interim Chief Operating Officer
and Mr. Jason May (Senior Vice President: Technical) as Interim Chief Technology Officer. Mr. Ludwig Eybers retired
from the Group in December 2023.
•With effect from 1 October 2023, Mr. Richard Jordinson was appointed as Chief Operating Officer and a member of the
Executive Committee of the Group, upon which Mr. Marcelo Godoy resumed his role of Chief Technology Officer and
Mr. Jason May stepped down from his role of Interim Chief Technology Officer.
MINERAL RESOURCE AND MINERAL RESERVE LEADERSHIP TEAM
Tarryn Flitton (45)
MEng (Mining), BSc (Hons) (Geology), RM SME, Pr.Sci.Nat (SACNASP), FGSSA
Tarryn Flitton, the Chairperson of the AngloGold Ashanti Mineral Resource and Mineral Reserve Leadership Team, has over 22
years’ experience in mining. She has spent eleven years directly leading and managing Mineral Resource and Mineral Reserve
reporting. Ms. Flitton joined AngloGold Ashanti in 2001 and currently holds the position of Vice President: Resource and
Reserve.
207
6B.COMPENSATION
COMPENSATION AND HUMAN RESOURCES COMMITTEE
Compensation and Human Resources Committee
Prior to the completion of the corporate restructuring in September 2023, AngloGold Ashanti Limited had a Remuneration and
Human Resources Committee (the “RemCo”). AngloGold Ashanti plc established the Compensation and Human Resources
Committee (the “CompCo”) with effect from 25 September 2023.
The CompCo will be composed of no less than three (3) board members, absent a temporary vacancy. Each member shall be
“independent” in accordance with applicable law, including the rules and regulations of the SEC (including the independence
requirements of the provisions of Rule 10C-1(b)(1) under the Exchange Act) and the listing standards of the NYSE, taking into
account such additional independence requirements specific to membership on the CompCo as may be required by the listing
standards of the NYSE. CompCo members shall qualify as “Non-Employee Directors” for the purposes of Rule 16b-3 under the
Exchange Act.
The members of the CompCo shall be appointed by a majority vote of the independent directors on the board from among its
members, taking into consideration the recommendations of the Nominations and Governance Committee, and each member
shall serve until such member’s successor is duly appointed and qualified or until such member’s resignation, removal by a
majority vote of the independent directors on the board, or death. The Chairperson of the CompCo (the “CompCo Chair”) shall
be designated by the independent directors on the board.
Any member of the CompCo may resign at any time by delivering a letter of resignation to the Chairperson of the board (the
“Board Chair”) with a copy to the Company Secretary and the CompCo Chair, if applicable; any resignation shall take effect at
the time specified therein, or, if the time when it shall become effective is not specified therein, then it shall take effect
immediately upon receipt by the Board Chair.
The CompCo ensures that the Company structures its compensation plans, policies and programmes as to attract and retain the
best available employees for positions of substantial responsibility within the Company, and provides incentives to ensure
employees perform to the best of their abilities to promote the success of the Company. In reviewing and approving the
Company’s overall compensation programme, the CompCo ensures continuous engagement with the shareholders. The
principal duties and responsibilities of the CompCo are described in “Item 6C: Board practices—Compensation and Human
Resources Committee”.
The CompCo, in discharging its duties, considers such factors as may be required by the listing standards of the NYSE or
applicable rules of the SEC with respect to the independence of its compensation consultants, independent legal, financial and
other advisors (each, a “Compensation Advisor”). Except as expressly provided in the CompCo Charter, the Company’s
organisational documents, or as required by law, regulation or NYSE listing standards, the CompCo shall set its own rules of
procedure.
For the current composition of the CompCo, refer to “Item 6C: Board practices—Compensation and Human Resources
Committee”. The composition of the CompCo remained unchanged following the completion of the corporate restructuring in
September 2023. Changes made to the membership of AngloGold Ashanti Limited’s RemCo prior to the completion of the
corporate restructuring are described in “Item 6A: Directors and senior management—Board movements during 2023 and
subsequent to year-end”.
The meetings of the CompCo are attended by the Chief Executive Officer (CEO), the Chief Financial Officer (CFO), the Chief
People Officer (CPO), the Vice President Performance and Reward and advisors and specialists where required, except when
these parties are conflicted or have a personal financial interest, such as when their own remuneration or benefits are being
discussed.
Directors’ remuneration policy
Directors of AngloGold Ashanti plc have, following the completion of the corporate restructuring, continued to be paid in line with
the remuneration arrangements applied by AngloGold Ashanti Limited prior to the corporate restructuring, subject to any UK legal
requirements. This is consistent with the Company’s commitment to continue to pay in line with the approach followed by
AngloGold Ashanti Limited until the approval by AngloGold Ashanti plc’s shareholders of a directors’ remuneration policy at its
2024 AGM (scheduled for 28 May 2024), subject to any UK legal requirements.
The CompCo has produced a directors’ remuneration policy for AngloGold Ashanti plc, which will be recommended for approval
by shareholders at the 2024 AGM. This directors’ remuneration policy takes into consideration legislation applicable to UK-
incorporated, listed companies and market practices for companies headquartered in the United States.
208
The directors’ remuneration policy is designed to allow AngloGold Ashanti to compete in a global market, with a specific focus on
both US-listed companies and its peers in the global gold mining sector, where the Company strives to retain and remunerate its
employees using fair, robust and appropriate remuneration and to reward its employees for their contributions. Cost management
and shareholder value remain fundamental drivers of the Company’s directors’ remuneration policy.
Linking pay and performance for the Company’s executive directors is important and by having a large portion of executive pay
defined as at-risk pay, the directors’ remuneration policy ensures that executive compensation is aligned with the overall
performance of the Company, the regions in which it operates and its business units. The executive directors have an overriding
focus on social sustainability, including safety, and a significant percentage of variable pay is directly linked to keeping the
Company’s employees safe.
EXECUTIVE DIRECTORS’ AND EXECUTIVE MANAGEMENT REMUNERATION
For the amounts paid and benefits granted by both AngloGold Ashanti Limited and AngloGold Ashanti plc to executive directors
in 2023, see below, and for executive management, see “Item 18: Financial Statements—Note 29—Related Parties—Key
management remuneration”. Remuneration for 2022 has also been shown for comparison.
Single total figure remuneration for the years 2023 and 2022:
Salary | Benefits(2) | Pension | Total fixed pay | DSP cash | DSP shares | DSP total | Buy-out share awards on recruitment (5) | Total variable pay | Total (1) | ||
USD | |||||||||||
A Calderon (3) | 2023 | 1,656,000 | 622,585 | 409,860 | 2,688,445 | 1,493,050 | 2,986,099 | 4,479,149 | — | 4,479,149 | 7,167,594 |
2022 | 1,600,000 | 9,870 | 396,000 | 2,005,870 | 1,694,208 | 3,388,416 | 5,082,624 | — | 5,082,624 | 7,088,494 | |
GA Doran (4) | 2023 | 545,516 | 253,012 | 41,996 | 840,524 | 418,062 | 909,899 | 1,327,961 | 563,005 | 1,890,966 | 2,731,490 |
2022 | — | — | — | — | — | — | — | — | — | — | |
(1)Remuneration for both executive directors has been disclosed for the full 2023 financial year - this includes for both AngloGold Ashanti Limited prior to the
completion of the corporate restructuring and AngloGold Ashanti plc after the completion of the corporate restructuring.
(2)The executive directors were provided with family health insurance, group life insurance, cash in lieu of dividends, and social security. This includes a relocation
allowance of $570,498 for Mr. Alberto Calderon and $205,398 for Ms. Gillian Doran for their relocation to Denver, Colorado, USA. The total value of these benefits
is included above.
(3)While Mr. Alberto Calderon was appointed as an executive director of AngloGold Ashanti plc with effect from 10 February 2023, he did not receive any additional
compensation for his dual-role prior to the completion of the corporate restructuring.
(4)Ms. Gillian Doran was appointed as an executive director and CFO for AngloGold Ashanti Limited with effect from 1 January 2023. She was appointed as an
executive director of AngloGold Ashanti plc with effect from 25 September 2023.
(5)Buy-out awards granted to Ms. Gillian Doran were in respect of incentive arrangements that were forfeited from her previous employer. These awards are deferred
awards which vest at the original vesting dates as the forfeited awards.
As part of the corporate restructuring, Mr. Robert Hayes, was appointed as an executive director of AngloGold Ashanti plc for the
period from 10 February to 25 September 2023. No additional compensation for his director duties was awarded to him while he
held the role of executive director.
For details of the share-based awards and rights to subscribe for ordinary shares in the Company granted to, and exercised by
executive directors and executive management team members, see “Item 6E: Share Ownership—AngloGold Ashanti Deferred
Share Plan” and “Item 6E: Share Ownership—Participation by Executive Directors and Executive Management Team Members
in the AngloGold Ashanti DSP”.
Total reward
When determining remuneration, AngloGold Ashanti considers all elements of short-term and long-term fixed and variable pay,
comprising base salary, benefits, retirement benefits, annual bonus and shares. The approach ensures that it is consistent with
the overall strategic direction of the Company and each employee’s individual performance.
Base pay
A competitive salary is provided to executives to ensure that their experience, skill/contribution and appropriate market
benchmarking are fairly reflected and applied. In 2023, while employed as CEO and executive director by AngloGold Ashanti
Limited, Mr. Alberto Calderon was paid under the terms of three separate contracts with UK, South African and Australian entities
of the Group. In early 2023, the CompCo considered his salary level, which included a market comparison against the peer
comparator group. During this exercise it was noted that most increases at an executive level were both below inflation and the
broader workforce. It was therefore determined to grant him a 3.5% salary increase (below the inflation rates considered for other
employees). At the time of the completion of the corporate restructuring on 25 September 2023, the terms of his employment
were consolidated and governed by a single US contract with AngloGold Ashanti North America Inc., with no change to the value
of his base salary.
209
Ms. Gillian Doran was appointed as an executive director and CFO for AngloGold Ashanti Limited in January 2023. At the time of
her appointment her base pay was governed by the terms of two separate contracts with South African and US entities of the
Group. At the time of the completion of the corporate restructuring on 25 September 2023, she was appointed as an executive
director and CFO of the Company, upon which the terms of her employment were consolidated and governed by a single US
contract with AngloGold Ashanti North America Inc., with no changes to the value of her base salary.
The Company’s executive directors do not receive additional payment of directors’ fees or committee fees.
Variable pay
Currently, the Company operates the AngloGold Ashanti Deferred Share Plan (the “DSP”), which was implemented in October
2023 to replace the DSP previously adopted by AngloGold Ashanti Limited in 2018, although the terms and conditions of DSP
awards for 2023, including the performance criteria, remained the same as before the completion of the corporate restructuring.
The DSP is a single incentive scheme comprising short- and long-term metrics, which rewards performance on an annual basis
against key financial, operational and individual objectives, as well as strategic priorities.
To ensure that variable pay continues to support the Company’s strategy, detailed engagements were held with investors
resulting in the proposed move to a more market-standard variable pay approach. For 2024, the Company will move from the
single incentive plan (DSP) to two separate plans being an annual bonus and a performance-based long-term incentive model,
with transition incentives, as described more in “AngloGold Ashanti Performance Share Plan” below.
For a description of share-based compensation and awards (including cash awards), see “Item 6E: Share Ownership”.
Retirement benefits/pension
Retirement benefits are granted to all executives and employees typically based on their jurisdiction, which determines the plan
and contribution rate. All executives and employees receive retirement benefits under defined contribution plans. See “Item 18:
Financial Statements—Note 7—Employee Benefits” and “Item 18: Financial Statements—Note 24—Provision for Pension and
Post-Retirement Benefits”.
Mr. Calderon is a member of the International Pension Plan, with the Company contributing 24.75% of his base salary to the plan
on a monthly basis. He also maintains his Australian Superannuation benefit, a defined contribution retirement plan, but this has
no company contributions.
Before the completion of the corporate restructuring, Ms. Doran was a member of the International Pension Plan for the South
African portion of her salary and the US Executive Deferral Plan for the US portion of her salary, which provides for a Company
contribution of 12.5% of base salary and cash bonus. Following the completion of the corporate restructuring, she fully moved to
the US Executive Deferral Plan, with a 12.5% company contribution.
Upon completion of the corporate restructuring, the change of control in the US Executive Deferral Plan was triggered for all plan
participants, resulting in a payout of Ms. Doran’s accrued pension contributions to 25 September 2023 to the value of $20,592.
This payout was required under the terms of the plan and US tax law as a result of the corporate restructuring and to avoid the
imposition of a 20% penalty tax.
Other benefits
Both executive directors receive Company-provided healthcare, group life cover for both death and disability, tax services of an
independent tax advisor and their spouses may accompany them on one business class trip per annum paid for by the
Company. During the year, both executive directors relocated to Denver, Colorado, USA. To facilitate this move, they both
received a relocation allowance at the time of their moves (Mr. Calderon - $ 570,498; Ms. Doran - $ 205,398), in line with the
Company’s standard policy applicable at the time of their relocation for globally mobile employees across the business. This
approach provides certainty and a cap on the potential costs of relocation to the Company.
Benchmarking
The Company’s executive employees’ and non-executive directors’ remuneration is evaluated against a global group of
comparator companies. AngloGold Ashanti’s size and complexity as well as each individual executive’s role is reviewed against
the Company’s peer group and benchmarked based on guaranteed and variable pay. Performance (Company and individual) is a
key factor influencing the remuneration of the executive employees.
The Company’s salary benchmarks are generally targeted at the market median of a global market in the Company’s industry.
Where there is a shortage of specialist and/or key technically skilled employees, the Company may offer a salary that is higher
than the benchmark salary.
210
Each executive’s role is individually determined to ensure the best match possible. The comparison is done for the same or
similar roles irrespective of the executive’s location of work. Each component of remuneration (base salary, short-term incentives,
long-term incentives and employee benefits and allowances) is analysed and compared with AngloGold Ashanti’s global peer
group’s market range and the overall package is reviewed accordingly. In all cases, remuneration is evaluated within the context
of the executive’s skills, experience and job performance, which may justify deviations from the benchmark.
Overview of executive management pay
The CompCo is also responsible for oversight of the remuneration of the executive management team. Under English law, the
Company is not required to disclose remuneration details for executive roles other than the executive directors. However, to
provide continuity with previous disclosure made by AngloGold Ashanti Limited, under South African requirements, below is an
overview of the Company’s executive management remuneration outcomes for 2023, and the related incentive structures in
place.
In 2023, in addition to the CEO and the CFO, the executive management team comprised Ms. Lisa Ali, Chief People Officer; Mr.
Stewart Bailey, Chief Sustainability & Corporate Affairs Officer; Mr. Terry Briggs, Chief Development Officer; Mr. Marcelo Godoy,
Chief Technology Officer; Mr. Ludwig Eybers, Chief Operating Officer (retired 30 June 2023); Mr. Richard Jordinson, Chief
Operating Officer (from 1 October 2023); and Ms. Lizelle Marwick, Chief Legal Officer.
Throughout 2023, the Company’s executive management team received a base salary, pension benefits, benefits including
relocation allowances and participated in the DSP. For 2023, the total salary paid for this population was $3.5 million, the total for
pension contributions was $0.5 million, and the total for benefits, relocation allowances and medical insurance was $1.8 million.
The executive management team participated in the DSP, using the same performance scorecard measures and outcomes as
that for executive directors set out below, with a 20% weighting for individual performance.
The target opportunity was 249% of salary, and a maximum opportunity of 150% of target. Based on performance achieved over
2023, the average DSP outcome for this group was 185% of target, resulting in an overall total DSP award of $6.3 million. One
third was paid in cash ($2 million), and two thirds was paid in shares deferred over five years ($4.3 million).
For 2024, the executive management team will transition from the single incentive plan (DSP) to an annual bonus and a
performance-based long-term incentive model, with transition incentives, on the same basis as the executive directors as
described more in “AngloGold Ashanti Performance Share Plan” below.
For a description of share-based compensation and awards (including cash awards), see “Item 6E: Share Ownership”.
211
NON-EXECUTIVE DIRECTORS’ FEES AND ALLOWANCES
The table below details the fees and allowances paid to non-executive directors during 2023 in line with the fee structure as
approved by the shareholders of AngloGold Ashanti Limited, which is summarised below. At the request of the Nominations and
Governance Committee, a full review of non-executive director fees, including shareholding requirements, will be undertaken
during 2024 taking into account the governance frameworks applicable to the Group and market and best practice for US-listed
companies. In addition to their compensation, the non-executive directors receive fees for their participation on board committees
and allowances for travelling internationally to attend board meetings. Non-executive directors do not receive further payments
from the Company.
Director’s fees (1) | Committee fees (2) | Travel allowance | Total | Director’s fees (1) | Committee fees (2) | Travel allowance | Total | |
2023 (USD) | 2022 (USD) | |||||||
Maria Ramos (Chairperson) | 328,800 | 36,375 | 6,250 | 371,425 | 308,800 | 56,000 | 8,750 | 373,550 |
Rhidwaan Gasant (Lead Independent Director) | 177,200 | 89,000 | 6,250 | 272,450 | 166,700 | 104,500 | 10,000 | 281,200 |
Kojo Busia | 136,400 | 78,000 | 38,750 | 253,150 | 125,900 | 86,500 | 26,250 | 238,650 |
Alan Ferguson | 136,400 | 87,500 | 17,500 | 241,400 | 125,900 | 89,000 | 33,750 | 248,650 |
Albert Garner | 136,400 | 62,000 | 16,250 | 214,650 | 125,900 | 50,500 | 13,750 | 190,150 |
Scott Lawson | 136,400 | 62,000 | 18,750 | 217,150 | 125,900 | 50,500 | 18,750 | 195,150 |
Jinhee Magie (3) | 64,700 | 23,500 | 18,750 | 106,950 | - | - | - | - |
Nelisiwe Magubane (4) | - | - | - | - | 95,300 | 30,000 | 8,750 | 134,050 |
Maria Richter | 136,400 | 80,500 | 15,000 | 231,900 | 125,900 | 85,500 | 18,750 | 230,150 |
Diana Sands (3) | 64,700 | 20,000 | 18,750 | 103,450 | - | - | - | - |
Jochen Tilk | 136,400 | 101,500 | 17,500 | 255,400 | 125,900 | 110,000 | 23,750 | 259,650 |
Total | 1,453,800 | 640,375 | 173,750 | 2,267,925 | 1,326,200 | 662,500 | 162,500 | 2,151,200 |
(1)Includes the annual base fee paid to the non-executive directors as well as fees paid for special board meetings.
(2) Includes the fee paid to the individual for their committee membership and committee chairperson role, where applicable, as well as fees paid for special committee
meetings.
(3) Ms. Jinhee Magie and Ms. Diana Sands were appointed as directors with effect from 1 June 2023.
(4) Ms. Nelisiwe Magubane passed away on 30 October 2022 and fees payable prior to this date are shown for 2022.
The table includes fees paid by AngloGold Ashanti Limited prior to the completion of the corporate restructuring on 25 September 2023 and payments made by
AngloGold Ashanti plc after this date.
212
The table below sets out the non-executive director fees that were approved by the shareholders of AngloGold Ashanti Limited in
2023:
USD | |
Board meetings | |
Chairperson allowance | 295,800 |
Lead Independent Director allowance | 163,200 |
Non-executive director allowance | 122,400 |
Additional chairman allowance per special board meeting (1) | 13,000 |
Additional non-executive director allowance per special board meeting (1) | 3,500 |
Committee meetings | |
Chairperson of the Audit and Risk Committee | 35,000 |
Members of the Audit and Risk Committee | 20,000 |
Chairperson of the Remuneration and Human Resources Committee | 35,000 |
Members of the Remuneration and Human Resources Committee | 20,000 |
Chairperson of the Investment Committee | 32,500 |
Members of the Investment Committee | 20,000 |
Chairperson of the Social, Ethics and Sustainability Committee | 32,500 |
Members of the Social, Ethics and Sustainability Committee | 20,000 |
Chairperson of the Nominations and Governance Committee | 32,500 |
Members of the Nominations and Governance Committee | 20,000 |
Additional fee per meeting for ad hoc committee meetings (2) | 3,500 |
Travel allowance for overnight away (3) | 1,250 |
(1) Fees are paid for board meetings that exceed five board meetings annually.
(2) Fees are paid for committee meetings that exceed four committee meetings annually.
(3) In addition to the travel allowance payable, the Company will cover reasonable accommodations and sundry costs.
6C.BOARD PRACTICES
Upon completion of the aforementioned corporate restructuring, AngloGold Ashanti plc became the successor issuer to
AngloGold Ashanti Limited and all members of the AngloGold Ashanti Limited board of directors became members of the
AngloGold Ashanti plc board of directors. The information in this section only relates to the board of directors of AngloGold
Ashanti plc following the completion of the corporate restructuring, unless indicated otherwise.
The Board of Directors
The Company is governed by a unitary board of directors, the composition of which promotes the balance of authority and
precludes any one director from dominating decision-making. The Company’s board membership at year-end comprised twelve
directors, ten independent non-executive directors and two executive directors.
The board is supported by its committees and has delegated certain functions to these committees without abdicating any of its
own responsibilities. This process of formal delegation involves approved and documented charters, which are reviewed
annually. The board currently has the following committees: an Audit and Risk Committee, a Compensation and Human
Resources Committee, a Social, Ethics and Sustainability Committee, an Investment Committee and a Nominations and
Governance Committee. On 31 March 2024, the Investment Committee ceased to exist and, with effect from 1 April 2024, its
duties and responsibilities were assumed by the board of directors.
See “Item 6A: Directors and Senior Management” for information about the composition of the board and directors’ term of office
and month and year of appointment.
213
Appointment and rotation of directors
Several factors, including the requirements of relevant legislation and regulation, best practice recommendations, qualifications
and skills of a prospective board member and the requirements of the Company’s Corporate Governance Guidelines, as well as
regional demographics, are considered in appointing board members. New directors are appointed by the board pursuant to the
recommendations of the Nominations and Governance Committee, which conducts a rigorous assessment of the credentials of
each candidate. A list of the criteria and qualifications for board membership is contained in the Nominations and Governance
Committee Charter.
Pursuant to the Company’s articles of association, shareholders have the right to elect directors by ordinary resolution. The
board is also entitled to appoint directors, either as an extra director or as a replacement for another director although such
director shall retire from office at the next annual general meeting (“AGM”) of shareholders and may offer themselves for
appointment by shareholders by way of ordinary resolution.
At every AGM of the Company all directors at the date of the notice convening the AGM shall retire from office and may offer
themselves for reappointment by the shareholders. The Nominations and Governance Committee considers annually the
eligibility for re-election of directors.
The Company’s articles of association and Corporate Governance Guidelines do not set a mandatory retirement age or term limit
for non-executive directors.
Non-Executive Directors Fees
Prior to the completion of the corporate restructuring, the non-executive directors received fees for their services as directors
which were approved by the shareholders of AngloGold Ashanti Limited. Following the completion of the corporate restructuring,
AngloGold Ashanti will be required to compensate its directors in accordance with a shareholder-approved directors’
remuneration policy, which will be presented to its shareholders at the Company’s first AGM following the corporate restructuring,
i.e., the 2024 AGM (scheduled for 28 May 2024). In the meantime, the Company’s non-executive directors have received and will
continue to receive, until the approval of the new directors’ remuneration policy of AngloGold Ashanti plc, subject to any UK legal
requirements, fees for their services generally consistent with those provided for under the remuneration arrangements approved
by AngloGold Ashanti Limited’s shareholders prior to the completion of the corporate restructuring. The Nominations and
Governance Committee, which has responsibility for making recommendations to the board on non-executive director
remuneration, has requested a full review of how non-executive directors are remunerated in 2024. See “Item 6B: Compensation
—Compensation and Human Resources Committee—Directors’ remuneration policy” and “Item 6B: Compensation—Non-
executive directors’ fees and allowances” for further information.
Service contracts
Non-Executive Directors
Non-executive directors are appointed via letters of appointment which can be terminated with one month’s notice. Continued
appointment is subject to the Company’s articles of association, satisfactory performance, election by shareholders at each
AGM, the relevant statutory provisions and an annual review of performance.
Executive Committee
New service contracts were adopted for the executive directors and members of the executive management team upon
completion of the corporate restructuring. No changes were made to the compensation of the executive directors and members
of the executive management team as a result of the corporate restructuring. Any changes were a result of complying with local
law requirements or to reflect current benefits offered in the executives’ home jurisdiction. The service contract of the CEO, Mr.
Alberto Calderon has a defined expiry date of 31 August 2026 or it may expire earlier at 12 months’ notice by either party. The
service contract of the CFO, Ms. Gillian Doran is terminable on six months’ notice by either party. The remaining members of the
executive management team have employment contracts of indefinite term which entitle them to standard group benefits as
defined by their specific geographic location and participation in the Company’s incentive plan.
Members of the executive management team based in South Africa are paid a portion of their remuneration offshore, which is
detailed under a separate contract. This compensation arrangement reflects their global roles and responsibilities and takes into
account offshore business requirements of their roles.
The service contracts for members of the executive management team are reviewed annually and contain change of control
provisions which have been amended in 2024 to align with market practice. The change of control is subject to the following
triggers:
•The acquisition of all or substantially all of AngloGold Ashanti; or
•A number of shareholders holding less than 35 percent of the Company’s issued share capital consorting to gain a
majority of the board and make management decisions; and
•The contracts of executive committee members are either terminated or their role and employment conditions are
curtailed.
214
In the event of a change of control becoming effective, a member of the executive management team will in certain
circumstances be subject to both the notice period and the change of control contract terms. The notice and change of control
periods applied per category of executive (excluding interim appointments) are as follows:
Executive Committee member | Notice Period (2023/2024) | Change of Control (2023) | Change of Control (2024) |
Chief Executive Officer | 12 months | 12 months | 18 months |
Chief Financial Officer | 6 months | 6 months | 12 months |
Other Executive Management team members | 6 months | 6 months | 12 months |
Key activities of the board and committees during 2023
Prior to the completion of the corporate restructuring, the activities of the AngloGold Ashanti plc board of directors related to the
implementation of the corporate restructuring.
Upon completion of the corporate restructuring on 25 September 2023, the activities of the AngloGold Ashanti plc board and its
committees were aimed at promoting the economic stability of the business. This entailed ensuring that its operations were
conducted with due regard to the expectations and needs of stakeholders, the safety and health of employees and communities,
and the development of systems to ensure proper access to and dissemination of credible information.
Board and committee meeting attendance
In 2023, prior to the completion of the corporate restructuring on 25 September 2023, the two-person board of AngloGold Ashanti
plc met four times. Messrs. Alberto Calderon and Robert Hayes, who comprised the full board of AngloGold Ashanti plc prior to
the completion of the corporate restructuring, attended all four meetings. The AngloGold Ashanti plc board of directors had no
board committees prior to completion of the corporate restructuring.
In 2023, prior to the completion of the corporate restructuring on 25 September 2023, directors’ attendance at AngloGold Ashanti
Limited board and committee meetings was as follows:
Board (excluding Independent Board) (1) | Independent Board (2) | Audit and Risk (3) | Investment (3) | Remuneration and Human Resources (3) | Social, Ethics and Sustainability (3) | Nominations and Governance (4) | |
Number of meetings of AngloGold Ashanti Limited in 2023 prior to completion of the corporate restructuring on 25 September 2023 | 12 | 4 | 7 | 4 | 5 | 4 | 7 |
MDC Ramos (5) | 12 | 4 | n/a | n/a | n/a | 1 | 7 |
KOF Busia | 12 | 4 | n/a | 4 | n/a | 4 | 7 |
A Calderon | 10 | n/a | n/a | n/a | n/a | n/a | n/a |
GA Doran (6) | 12 | n/a | n/a | 3 | n/a | n/a | n/a |
AM Ferguson | 12 | 4 | 7 | n/a | 5 | n/a | 7 |
AH Garner (7) | 11 | 4 | 4 | 4 | 5 | n/a | n/a |
R Gasant (8) | 12 | 4 | 7 | 1 | 4 | 3 | 7 |
SP Lawson (7) | 12 | 4 | 4 | 4 | n/a | 4 | n/a |
J Magie (9) | 4 | 0 | 3 | 1 | n/a | n/a | n/a |
MC Richter (10) | 12 | 4 | 1 | n/a | 5 | 3 | 7 |
D Sands (9) | 4 | 0 | n/a | n/a | 1 | 1 | n/a |
JE Tilk | 10 | 3 | 6 | 3 | n/a | 3 | 7 |
(1) During 2023, prior to completion of the corporate restructuring, the AngloGold Ashanti Limited board held five scheduled board meetings (including its annual
strategy session) and seven special board meetings covering matters relating to the corporate restructuring of the Group which completed on 25 September
2023.
(2) During 2023, prior to completion of the corporate restructuring, the AngloGold Ashanti Limited board held four meetings of independent directors to consider
various matters relating to the corporate restructuring of the Group which completed on 25 September 2023. These meetings have been shown separately from
other board meetings and are in addition to the 12 board meetings.
(3)All board committees, other than the Nominations and Governance Committee, held at least four scheduled meetings during the year, including one meeting
focused on the 2022 year-end reports. Other special meetings were held by the Audit and Risk Committee and Remuneration and Human Resources Committee
as required.
215
(4)During 2023, the Nominations and Governance Committee held three scheduled meetings and four special Nominations and Governance Committee meetings,
mainly relating to the search for two additional independent non-executive directors which resulted in the appointment of Ms. Jinhee Magie and Ms. Diana Sands.
In addition to these meetings, members of the Nominations and Governance Committee participated in interviews with potential new board directors – these
interviews are not included in the table above.
(5)Ms. Maria Ramos stepped down as a member of the Social, Ethics and Sustainability Committee on 22 February 2023.
(6)Ms. Gillian Doran was appointed as a member of the Investment Committee on 22 February 2023 and stepped down from it on 25 September 2023 upon
completion of the corporate restructuring.
(7) Mr. Al Garner and Mr. Scott Lawson were appointed as members of the Audit and Risk Committee on 15 May 2023.
(8)Mr. Rhidwaan Gasant stepped down as a member of the Investment Committee and was appointed as a member of the Social, Ethics and Sustainability
Committee on 22 February 2023.
(9)Ms. Jinhee Magie and Ms. Diana Sands were appointed as directors and took up their roles with relevant committees with effect from 1 June 2023.
(10)Ms. Maria Richter stepped down as a member of the Audit and Risk Committee and was appointed as a member of the Social, Ethics and Sustainability
Committee on 22 February 2023.
In 2023, upon completion of the corporate restructuring on 25 September 2023, directors’ attendance at AngloGold Ashanti plc
board and committee meetings was as follows:
Board | Audit and Risk | Investment | Compensation and Human Resources | Social, Ethics and Sustainability | Nominations and Governance | |
Number of meetings of AngloGold Ashanti plc in 2023 subsequent to completion of the corporate restructuring on 25 September 2023 | 1 | 2 | 1 | 1 | 1 | 1 |
MDC Ramos | 1 | n/a | n/a | n/a | n/a | 1 |
KOF Busia | 1 | n/a | 1 | n/a | 1 | 1 |
A Calderon | 1 | n/a | n/a | n/a | n/a | n/a |
GA Doran | 1 | n/a | n/a | n/a | n/a | n/a |
AM Ferguson | 1 | 2 | n/a | 1 | n/a | 1 |
AH Garner | 1 | 1 | 1 | 1 | n/a | n/a |
R Gasant | 1 | 2 | n/a | 1 | 1 | 1 |
SP Lawson | 1 | 2 | 1 | n/a | 1 | n/a |
J Magie | 1 | 2 | 1 | n/a | n/a | n/a |
MC Richter | 1 | n/a | n/a | 1 | 1 | 1 |
D Sands | 1 | n/a | n/a | 1 | 1 | n/a |
JE Tilk | 1 | 2 | 1 | n/a | 1 | 1 |
Where directors have been unable to attend meetings due to illness or conflicts in their schedules, they have received and
reviewed the materials for that meeting and have been given the opportunity to relay their comments in advance, and follow up
with the relevant Chairman of the meeting if necessary.
Audit and Risk Committee
The Audit and Risk Committee of AngloGold Ashanti plc comprises six independent non-executive directors.
The current members of the AngloGold Ashanti plc Audit and Risk Committee as of the date hereof are:
Audit and Risk Committee Members | AM Ferguson (Chairman and independent NED) |
AH Garner (Independent NED) | |
R Gasant (Independent NED) | |
SP Lawson (Independent NED) | |
J Magie (Independent NED) | |
JE Tilk (Independent NED) |
216
NED - Non-Executive Director
Number of meetings held by AngloGold Ashanti Limited Audit and Risk Committee in 2023 prior to completion of the corporate restructuring on 25 September 2023 | Seven |
Number of meetings held by AngloGold Ashanti plc Audit and Risk Committee in 2023 subsequent to completion of the corporate restructuring on 25 September 2023 | Two |
The Audit and Risk Committee’s duties are set out in its board-approved charter, the adequacy of which is reviewed at least
annually. The principal duties and responsibilities of the Audit and Risk Committee include, among others:
•to oversee and monitor the integrity of annual and other financial statements and financial information provided to
shareholders and others;
•to oversee and monitor compliance with legal, regulatory and public disclosure requirements;
•to oversee and monitor the independent registered public accounting firm (the “independent auditors”) including their
qualifications, independence and appointment;
•to oversee and monitor the performance of the independent auditors;
•to oversee and monitor the Company’s systems of internal controls, including the internal audit function;
•to oversee and monitor the auditing, accounting and financial reporting process generally;
•to oversee and monitor the Company’s financial risk exposures and risk management;
•to periodically review the effectiveness of the Company’s finance function;
•to establish procedures for (i) the receipt, retention and treatment of complaints received by the Company regarding,
among others, accounting, internal accounting controls or auditing matters and (ii) the confidential, anonymous
submission by employees of the Company or any subsidiary or affiliate of the Company whose financial information is
included in the Company’s financial statements of concerns regarding, among others, questionable accounting or
auditing matters; and
•to monitor and review the Company’s cybersecurity programme and discuss with management any material
cybersecurity incidents, as well as the Company’s cybersecurity threats, vulnerabilities, defences and planned
responses.
Proceedings and Performance Review
The Chief Financial Officer; Senior Vice President: Finance; Chief Legal Officer; Senior Vice President: Group Internal Audit; Vice
President: Group Tax; Vice President: SOX Compliance; Head of Group Risk; Senior Vice President: Digital Technology; Vice
President: Group Compliance; the external auditors, as well as other assurance providers regularly attend committee meetings in
an ex officio capacity and provide responses to questions raised by committee members during meetings. The Audit and Risk
Committee meets periodically with management, internal audit, and external audit in separate executive sessions to discuss any
matters that the Audit and Risk Committee or any of these groups believe should be discussed privately. The Audit and Risk
Committee meets separately with internal audit at least once every quarter, generally at each scheduled quarterly meeting.
In September 2023, the Group completed its corporate restructuring. The Company plans to conduct an external effectiveness
review of the board and its committees, including the Audit and Risk Committee, during the second half of 2024. The
Nominations and Governance Committee together with the board of directors plans to review the effectiveness of the board and
its committees regularly thereafter.
Compensation and Human Resources Committee
The Compensation and Human Resources Committee of AngloGold Ashanti plc (“CompCo”) comprises five independent non-
executive directors.
217
The current members of the AngloGold Ashanti plc CompCo as of the date hereof are:
Compensation and Human Resource Committee Members | MC Richter (Chairperson and independent NED) |
AM Ferguson (Independent NED) | |
A Garner (Independent NED) | |
R Gasant (Independent NED) | |
D Sands (Independent NED) | |
Other individuals who regularly attended meetings (attended by invitation or if needed to contribute pertinent insights and information) | A Calderon (CEO) |
GA Doran (CFO) | |
L Ali (Chief People Officer) | |
A Sidat representing Deloitte LLP (Independent adviser to the CompCo) | |
EM Mabuza (VP: Performance and Reward) | |
CM van Dyk (Remuneration and Benefits Consultant) |
NED - Non-Executive Director
Number of meetings held by AngloGold Ashanti Limited Remuneration and Human Resources Committee in 2023 prior to completion of the corporate restructuring on 25 September 2023 | Five |
Number of meetings held by AngloGold Ashanti plc Compensation and Human Resources Committee in 2023 subsequent to completion of the corporate restructuring on 25 September 2023 | One |
The CompCo activities were reviewed upon completion of the corporate restructuring and are governed by the Compensation
Committee Charter (the current version of which was approved by the board of directors of AngloGold Ashanti plc in February
2024). The principal duties and responsibilities of the CompCo include, among others:
•to carry out the responsibilities delegated by the board relating to the review and determination of the performance
objectives and outcomes, compensation (fixed and variable), and benefits of executives including the CEO, CFO and
members of the Executive Committee;
•to approve or recommend, as applicable, compensation and incentive plans and programmes;
•to oversee the Company’s human resources and development of human capital strategy;
•to review and approve (or make recommendations to the board regarding approval when appropriate) any employment
agreements, consulting arrangements, severance or retirement arrangements or change-in-control agreements and
similar provisions covering any current or former executive officer of the Company;
•to ensure that the Company structures its compensation plans, policies and programmes as to attract and retain the
best available personnel for positions of substantial responsibility within the Company, to provide incentives for such
persons to perform to the best of their abilities for the Company and to promote the success of the Company’s business;
•to ensure continuous engagement with the shareholders when reviewing and approving the Company’s overall
compensation programme;
•to consider listing standards of the NYSE or applicable rules of the SEC with respect to the independence of any
remuneration consultant in discharging its duties;
•to periodically review the Company’s directors’ remuneration policy considering whether it provides for fair, responsible
and transparent compensation and whether the Company’s long-term interests are being met;
•to oversee the preparation of, and recommend to the board for approval, a directors’ remuneration policy inclusive of
adoption or amendment of equity compensation plans and programmes that require shareholder approval;
•to oversee the implementation and administration of the compensation programmes;
•to periodically determine stock ownership guidelines for the CEO and other senior executives of the Company and
monitor compliance with such guidelines;
•to develop, implement and maintain a clawback policy, oversee any such recovery efforts and oversee disclosures
regarding the Company’s clawback policy;
•to consider and discuss with the board the results of the most recent non-binding advisory shareholder vote on
executive compensation and the most recent shareholder binding vote on the Company’s directors’ remuneration policy.
•to oversee regulatory compliance with respect to compensation matters; and
•to review, oversee and, where appropriate, approve the Company’s human resources policies and strategies aimed at
supporting the attainment of the Company’s global objectives and achieving a globally competitive workforce.
See “Item 6B: Compensation—Compensation and Human Resources Committee—Compensation and Human Resources
Committee” for further information.
218
Remuneration Consultants
When appropriate, the CompCo obtains advice from independent remuneration consultants. These consultants are employed
directly by the CompCo and engage directly with them to ensure independence. Deloitte LLP (“Deloitte”) was appointed as the
independent remuneration adviser by AngloGold Ashanti Limited with effect from May 2022, selected after a detailed tender
process and have been retained as advisers by AngloGold Ashanti plc.
Deloitte is a member of the Company’s Remuneration Consulting Group and, as such, operates under the Code of Conduct in
relation to executive remuneration consulting. During 2023, the CompCo reviewed the advice provided by Deloitte and confirmed
that it has been objective and independent. The CompCo also determined that the Deloitte partner who provides remuneration
advice to it does not have any connections with the Company that may impact their independence.
During 2023, Deloitte provided advice to the CompCo on a range of remuneration topics including market updates, advice on
share incentive schemes, annual reporting and legislative and governance guidance. The Deloitte consultants attended all
CompCo meetings. Deloitte provided the Company with unrelated advice and consultancy in respect of salary benchmarking,
performance metric setting, communication plans and annual reporting. In addition, Deloitte also provided technical accounting
advisory services, as well as other employee and tax-related services to the Group during 2023.
The CompCo also made use of the services and output of Mercer LLC, who provided global survey data and analysis primarily
around salary benchmarking for both executive and non-executive pay.
219
6D.EMPLOYEES
The average number of attributable employees (including contractors) in the AngloGold Ashanti Group for each of the last three
financial years was:
2023* | 2022 | 2021 | |||
Africa | 21,734 | 19,807 | 17,260 | ||
Australia | 1,741 | 1,532 | 1,332 | ||
Americas | 8,565 | 9,498 | 9,972 | ||
Other, including corporate and non-gold producing subsidiaries | 1,618 | 1,757 | 1,997 | ||
Total | 33,658 | 32,594 | 30,561 |
*The approximate number of contractors employed on average during 2023 was 19,615.
Labour relations and collective bargaining
At AngloGold Ashanti, we continuously endeavor to build and maintain constructive relations with our employees and their union
representatives, which are underpinned by our Company values.
A global Employee Relations Standard, which we expect to finalise and approve in 2024, will govern employee and labour
relations and enable an effective mechanism for communication and participation for our employees.
Employees in Australia, Colombia and the United States are not unionised. However, the Company ensures that we have
appropriate relations with our employees in these countries through compliance with labour legislation in these countries, fair
company policies and procedures and promoting healthy relationships through effective line management practices. The
Company does not seek to restrict the right to freedom of association or collective bargaining at any of our operations.
All employees in the Australian Region (including all employees in global teams employed through the Australian business unit)
are engaged on individual common law contracts. Union membership amongst private sector employees continues to fall in
Australia, with approximately 8.2 percent of private sector employees reporting union membership in 2023. The annual consumer
price index in Australia rose to 4.1 percent in 2023. This was factored into our annual salary review process, however, the
primary driver of salary growth in the Australian resources industry is labour market demand.
Employees covered by collective bargaining agreements | |
Argentina | 90 percent |
Brazil | 100 percent |
Ghana | 84 percent |
Guinea | 95 percent |
Tanzania | 88 percent |
Wage negotiations were concluded successfully at all sites in Ghana, Tanzania and Guinea, and within the official inflation
ranges. It is noted that unions are building the high inflationary demands faced by employees into their wage demands.
In Africa, there were no labour incidents that stopped our operations in 2023.
In Brazil, all three collective agreements (Nova Lima/Sabará, Santa Bárbara and Crixás) were signed with the unions and
implemented effective August 2023. The country experienced a lower inflation rate of 3.53 percent in 2023 compared to 10.12
percent in 2022. Negotiations were mainly around the implementation of the care and maintenance process at the Córrego do
Sítio operations, and downsizes in Queiroz and Nova Lima. A special strategy was required to include these considerations into
the yearly collective negotiation to mitigate any business interruption.
In Argentina, due to the continued increase in inflation, negotiations with the unions at CVSA took place on a monthly basis from
the third quarter of 2023 onwards (as opposed to on a quarterly basis previously). Inflation in 2023 was 211.4% in Argentina.
Full time employees receive a number of benefits not afforded to contractor employees. These include retirement,
accommodation for select employees, production and safety related bonus schemes, and reasonable and fair conditions of
services in addition to resultant benefits emanating from collective bargaining.
The minimum notice period regarding operational changes varies from country to country.
220
6E.SHARE OWNERSHIP
MINIMUM SHAREHOLDING REQUIREMENT FOR EXECUTIVE DIRECTORS AND EXECUTIVE MANAGEMENT
The CompCo is of the opinion that share ownership by the executive directors and members of the executive management
team demonstrates their commitment to AngloGold Ashanti’s success and serves to reinforce alignment between executive and
shareholder interests. AngloGold Ashanti Limited introduced a minimum shareholder requirement (“MSR”) for executive
directors in 2013 that continues to be applied for AngloGold Ashanti plc as per the table below:
Role | Within three years of appointment/from introduction of MSR | Within six years of appointment/from introduction of MSR | Holding requirement | Post-termination holding effective 1 January 2022 |
CEO | 150% of net annual base salary | 300% of net annual base salary | Throughout employment as a director or an executive officer | The post-termination MSR will be required based on the MSR policy at the time of termination. Should the executive depart (or no longer serve as a director or executive management team member before they have achieved the MSR, all vested shares allocated effective 1 January 2022 onwards from the Company’s share incentive scheme will be held for one-year post-termination. The holding will be up to their required MSR. |
CFO | 125% of net annual base salary | 250% of net annual base salary | ||
Executive Management Team | 100% of net annual base salary | 200% of net base salary | ||
The following count towards an individual MSR: •Shares purchased on the market, either directly or indirectly. •Vested shares from AngloGold Ashanti’s share incentive schemes. | ||||
The table below summarises each executive director and executive committee member’s accomplishment of the MSR. As of
31 December 2023, the interests of directors and executive management in the ordinary shares of the Company did not
individually or in the aggregate exceed one percent of the Company’s issued ordinary share capital.
Executive | Ordinary shares owned as at 31 December 2022 | Ordinary shares owned as at 31 December 2023 | Vested and unexercised DSP share awards as at 31 December 2023 | Unvested DSP shares awards as at 31 December 2023 (4) | Unvested buy out share awards as at 31 December 2023 (4) | Six-year target achievement date | MSR holding as at 31 December 2023 as a percentage of net base pay |
Executive Directors | |||||||
Alberto Calderon (1) | 26,370 | 26,080 | 8,320 | 224,933 | - | September 2027 | 56% |
Gillian Doran (2) | - | 5,582 | - | - | 22,956 | January 2029 | 32% |
Other Members of Executive Management | |||||||
Lisa Ali | - | 24,790 | - | 48,669 | - | April 2028 | 151% |
Stewart Bailey | 13,039 | 8,982 | 70,372 | 120,388 | - | January 2025 | 325% |
Terry Briggs | - | 13,567 | - | 31,540 | 25,409 | April 2028 | 118% |
Marcelo Godoy | 32,643 | 57,525 | - | 69,202 | 21,470 | October 2027 | 322% |
Richard Jordinson (3) | - | - | - | 51,025 | - | October 2029 | 0% |
Lizelle Marwick | - | - | 55,871 | 88,229 | - | July 2026 | 164% |
(1) Mr. Alberto Calderon had a compulsory sale of 290 securities after the delisting of the Company from the Australian Securities Exchange (ASX). | ||||
(2) Appointed executive director with effect from 1 January 2023 and the three-year MSR achievement is due in January 2026. | ||||
(3) Appointed executive officer with effect from 1 October 2023 and the three-year MSR achievement is due in October 2026. | ||||
(4) Unvested awards are not considered when calculating the MSR. | ||||
221
MINIMUM SHAREHOLDING REQUIREMENT FOR NON-EXECUTIVE DIRECTORS
The non-executive directors have a minimum shareholding policy which requires them to hold shares in AngloGold Ashanti
equivalent to 150% of their annual base fee. Normally non-executive directors are expected to meet this guideline within the
later of four years of appointment and the adoption of the minimum shareholding policy, or any increase in fee level, with
progress towards half of the guideline expected after two years. If a decline in the share price causes a non-executive director
to fall below the MSR based on the prevailing market price, the non-executive director is not required to purchase further
shares although the non-executive director must refrain from disposing of any shares until compliance has been achieved.
This minimum shareholding policy was introduced by AngloGold Ashanti Limited in 2022 and a similar policy has been adopted
by AngloGold Ashanti plc. Since the completion of the corporate restructuring, responsibility for reviewing this minimum
shareholding policy has been with the Nominations and Governance Committee. As noted above, a full review of non-executive
director fees, including MSRs, will be undertaken during 2024, taking into account the governance frameworks applicable to the
Group and market and best practice for US-listed companies.
In the interests of transparency the following table illustrates the level of compliance of the non-executive directors with this
MSR.
Shares held (Ordinary shares) | Minimum shareholding requirement | |||
31 December 2022 | 31 December 2023 | Four-year target achievement date | MSR holding as at 31 December 2023 as a percentage of annual base fee (3) | |
Maria Ramos (Chairperson) | - | 4,000 | February 2028 | 25% |
Rhidwaan Gasant (Lead Independent director) | - | - | February 2028 | 0% |
Kojo Busia | 2,000 | 4,000 | February 2028 | 63% |
Alan Ferguson | 5,000 | 5,000 | February 2028 | 76% |
Albert Garner | 22,500 | 30,000 | February 2028 | 458% |
Scott Lawson | 2,830 | 2,830 | February 2028 | 43% |
Jinhee Magie (1) | n/a | 5,000 | February 2028 | 76% |
Maria Richter (2) | 11,300 | 11,300 | February 2028 | 173% |
Diana Sands (1) | n/a | 3,000 | February 2028 | 46% |
Jochen Tilk | 2,800 | 2,800 | February 2028 | 43% |
(1) Ms. Jinhee Magie and Ms. Diana Sands were appointed as directors of AngloGold Ashanti Limited on 1 June 2023.
(2) 1,000 shares are held indirectly by Ms. Maria Richter’s husband.
(3) For the purpose of the MSR, shares are valued on the basis of the greater of a) the original purchase price, b) the share price on the date on which this minimum
shareholding policy was adopted (being 21 February 2024), and c) the prevailing market price on 31 December each year.
ANGLOGOLD ASHANTI DEFERRED SHARE PLAN
The Deferred Share Plan (“DSP”) was implemented by AngloGold Ashanti Limited in 2018 as a single incentive scheme
comprising short- and long-term metrics. The DSP is applicable to eligible employees of AngloGold Ashanti plc. Non-executive
directors are not eligible to participate in the DSP. Upon completion of the corporate restructuring, the DSP was carried over to
AngloGold Ashanti plc; 2023 was the final year that this plan applied. Details of the revised approach to incentives for 2024 are
set out below, see “AngloGold Ashanti Performance Share Plan”.
The DSP award is payable in cash and, where applicable (depending on stratum level), in either deferred cash or deferred
shares, vesting equally over either a two-, three-, or five-year period.
The total incentive is determined based on a combination of Company and individual performance measures, which are
defined annually with weightings applied to each measure. Each metric is weighted and has a threshold, target and stretch
achievement level assigned, based on the Company budget and the desired stretch targets for the year.
At the end of each financial year, the performance of each of the Company, the CEO, the CFO and executive management
team is assessed by the CompCo and the board against the defined metrics to determine the quantum of the cash portion and
the quantum of the deferred portion as a percentage of base salary based on on-target achievement:
222
Cash | Shares | Total Incentive | |
Level | On-Target Achievement | ||
CEO | 100% | 200% | 300% |
CFO | 85% | 185% | 270% |
Executive Management Team | 75% | 174% | 249% |
CEO means Chief Executive Officer.
CFO means Chief Financial Officer.
The graphs below illustrate the threshold, on-target and stretch for the DSP scheme and performance measure weightings
(Company and individual) as a percentage of base salary:
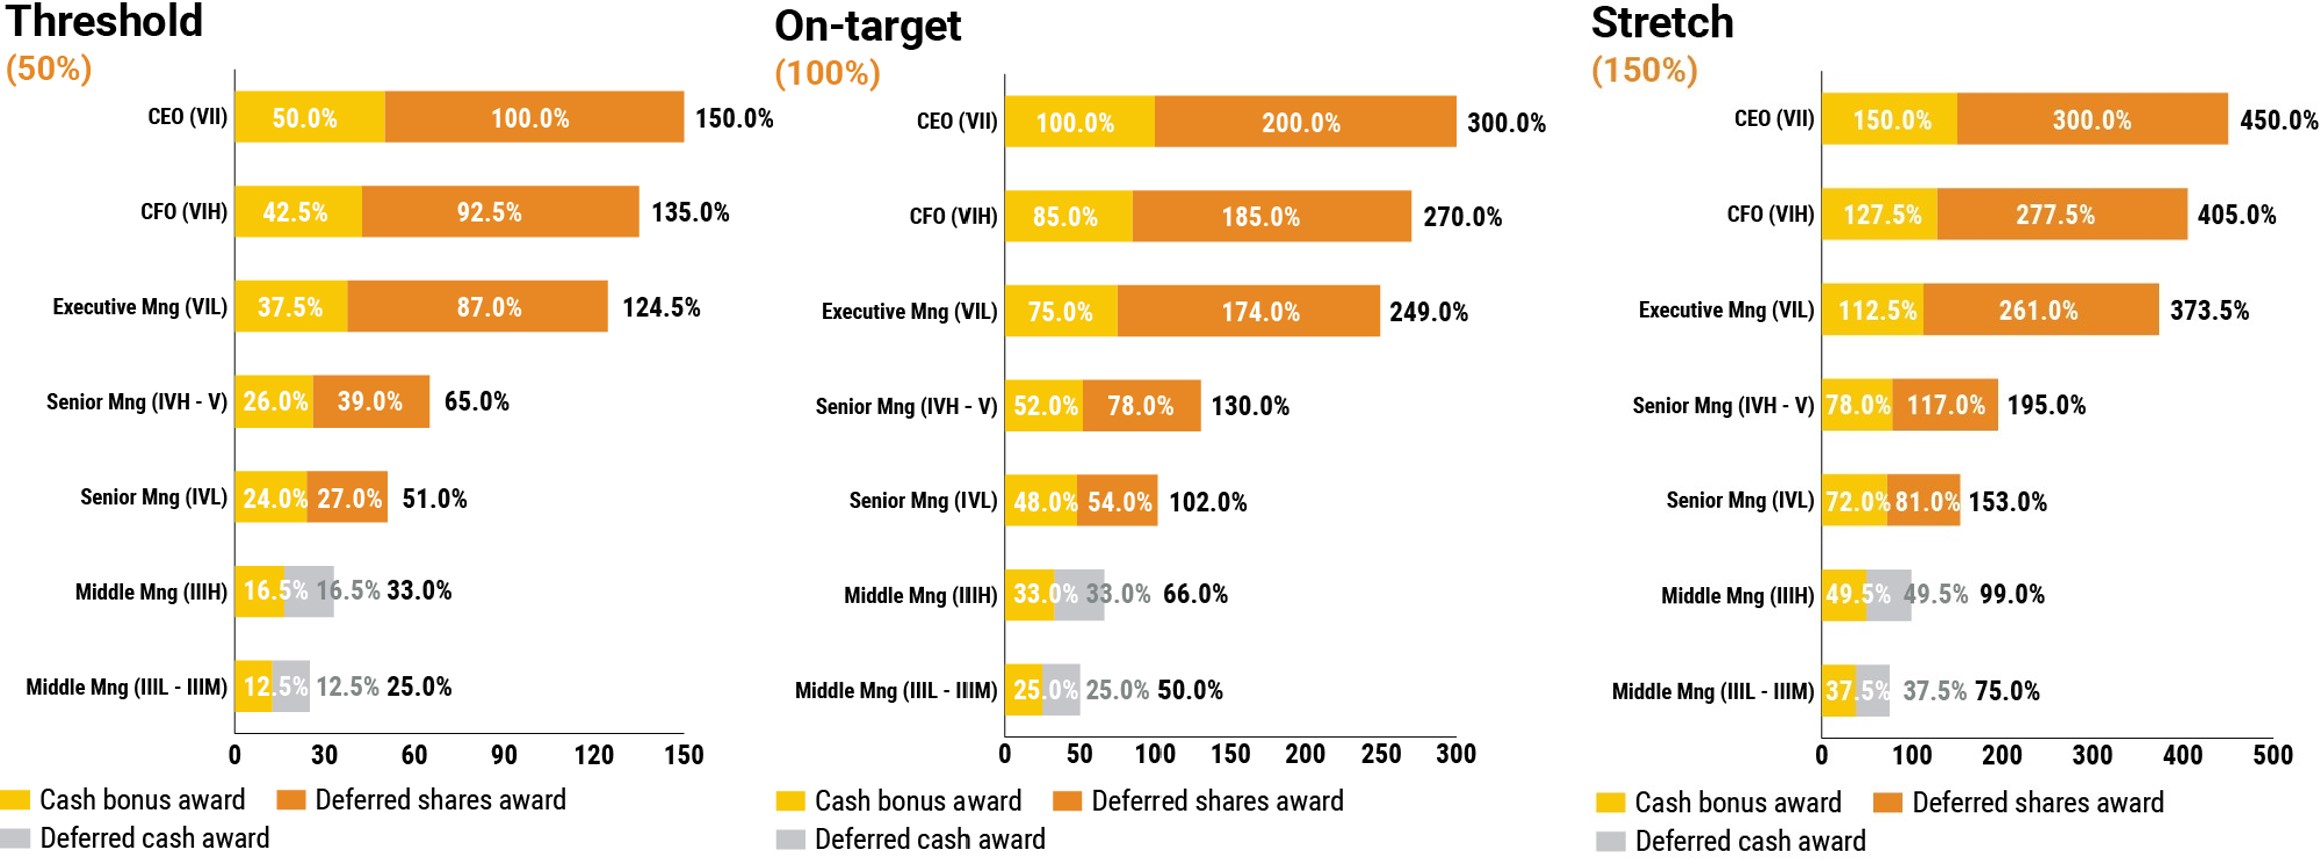
Company metrics are relative total shareholder return, normalised cash return on equity, production, all-in sustaining costs,
total cash costs, mineral reserve additions pre-depletion, mineral resource additions pre-depletion, TRIFR, major hazard
control verification compliance, health, environment, community, gender diversity and talent development and deployment
metrics.
Company and individual performance measures are assessed over each financial year, with the exception of certain Company
measures that are measured over a trailing three-year basis.
The CompCo approved the 2023 DSP Company performance achievement of 75.20% of target. The Company reported record
safety performance with an industry-leading TRIFR and made significant strategic progress through the year. However, relative
TSR performance was marginally below the threshold performance level and production and costs measures were below the
on-target levels. The overall outcomes for both the CEO, Mr. Alberto Calderon and the CFO, Ms. Gillian Doran are below the
on-target level.
223
The table below summarises the performance measures, their weightings, and performance against those metrics applicable to
the DSP for 2023:
2023 | |||||||
DSP performance measure | Target Weighting | Threshold measures (50% of target) | Target measures (100%) | Stretch measures (150% of target) | Performance | Achievement | |
Financial measures | Relative total shareholder return (measured in US$) | 20% | Median TSR of comparators | Halfway between median and upper quartile | Upper quartile TSR of comparators | <2% below threshold | 0.00% |
Normalised cash return on equity (nCROE) | 15% | $ COE (7%) | $ COE +6% (13%) | $ COE +12% (19%) | 15.74% | 18.43% | |
Production (1) | 15% | 2,552 Moz | 2,694 Moz | 2,766 Moz | 2,633 Moz | 11.80% | |
Total cash cost (1) | 10% | $1,130/oz | $1,089/oz | $1,050/oz | $1,125 | 5.64% | |
All-in sustaining costs (1) | 5% | $1,531/oz | $1,484/oz | $1,437/oz | $1,560 | 0.00% | |
Future optionality | Mineral Reserve additions (pre- depletion, asset sales, mergers and acquisitions) | 5.5% | Plus 1.4Moz | Plus 2.7Moz | Plus 4.1Moz | 2.19Moz | 4.42% |
Mineral Resource additions (2) (pre-depletion, asset sales, mergers and acquisitions) | 5.5% | Plus 3.5Moz | Plus 7.1Moz | Plus 10.6Moz | 9.89Moz | 7.69% | |
Safety measures | Total Recordable Injury Frequency Rate (TRIFR) | 4% | 2.5% performance improvement (1.67) | ≥5% performance improvement (1.62) | ≥7.5% performance improvement (1.58) | 1.09 | 12.00% |
Major hazard control verification compliance | 4% | 90% critical control verification compliance | 95% critical control verification compliance | 100% critical control verification compliance | 100.00% | ||
Health, environment and community | Health: Reduction in workforce exposed to high respirable crystalline silica dust | 2.5% | 8% reduction | 13% reduction | 20% reduction | 21.80% | 12.22% |
Environment: Greenhouse gas emissions management | 7.5% | 110% of budgeted carbon emission intensity (36.337) | 100% of budgeted carbon emission intensity (33.034) | 95% of budgeted carbon emission intensity (31.382) | 34.826 | ||
Community: Business disruptions as a result of community unrest | 2% | 2 | 1 | 0 | 0 | ||
People | Gender diversity | 2% | 20% female representation | 23% female representation | 26% female representation | 17.43% | 3.00% |
Talent development and deployment | 2% | 40% | 50% | 80% | 89.00% | ||
Total (% of target) | 75.20% | ||||||
(1) Targets were adjusted to cater for CdS that was placed on care and maintenance on 25 August 2023.
(2) Mineral Resource inclusive of Mineral Reserve before dilution and other factors are applied.
224
Comparator group ranking and achievements for the relative TSR metric for 2023
Relative TSR was measured on a three-year trailing average based against seven peers (Agnico Eagle Ltd, Barrick Gold Corp,
Gold ETF, Gold Fields Ltd, Kinross Gold Corp, Newcrest Mining Ltd and Newmont Mining Corp). For the three-year period to
31 December 2023, AngloGold Ashanti was ranked fifth and was therefore positioned <2% below threshold; therefore, the
achievement was calculated at 0%, as it is below threshold.
During 2023, management assessed the CdS mine in Brazil, and in August made the decision to place it on care and
maintenance in the interests of protecting long-term shareholder value. While CdS was included in the assessment at the start
of the period, it was excluded from the point at which it was placed on care and maintenance in line with typical market
practice. This resulted in a small upward adjustment of 1.76% of target due to minor changes to the production and total cash
costs.
For a discussion of the impact of the accounting restatement described in “Item 18: Financial Statements—Note 1—Statement
of Compliance—1.3 Restatements—1.3.2 Prior period error in the calculation of a net deferred tax asset with respect to the
Obuasi mine and other restatements”, see “Item 6F: Disclosure of a Registrant’s Action to Recover Erroneously Awarded
Compensation”.
225
Impact on Executive Directors
CEO: Key Objectives and Achievements for 2023:
Scorecard | Weighting | Comments |
Health, Safety, Environment and Community Safety (10%) Health, Environment and Community (10%) | 20% | •TRIFR improved by 13% to a record 1.09 per million hours worked in 2023 – significantly below the 2022 ICMM member average of 2.66. Lost Time Injury Frequency Rate (LTIFR) improved by 26% to 0.48 per million hours worked in 2023. The number of High-Potential Incidents (HPIs) improved by 11% to 63 in 2023. The Company recorded a second consecutive fatality-free year at Company-operated mines. •Clear climate strategy developed and being implemented in connection with project evaluation ahead of investment decision. Reportable environment incident rate in 2023 – 66% lower than in 2022. •Honouring legacy projects in South Africa where AngloGold Ashanti will invest $10 million over five years in various education and rural development projects. |
Financial and production Achievement against budget production in ounces (5%), total cash cost/oz (5%) and AISC/oz (5%) | 15% | Performance including the normalising for CdS (only for the period that it was in care and maintenance September – December 2023): •Production (000oz) – Actual 2023: 2,633 (Budget 2023 – 2,694) •Total cash cost ($/oz) – Actual 2023: 1,125 (Budget 2023 – 1,089) •All-in sustaining costs ($/oz) – Actual 2023: 1,560 (Budget 2023 – 1,484) |
Competitiveness and growth •Significantly advance Full Asset Potential Programme: implement related measures to close the gap on four to five operations during the following 24 months (20%). •Build major projects for the Company’s long-term future. | 40% | Full Asset Potential Programme: •Our Full Asset Potential programme continued to build momentum in 2023 with ~$200 million in incremental EBITDA against the FY 2022 period delivered in 2023 (Obuasi is excluded as it continues to ramp up). A Management Investment Committee was introduced to improve overall governance around capital expenditure ensuring rigorous discipline in capital investment and external contract awards. Growth and capital projects: •Significant achievements have been made across the portfolio. Most notably the Company made an important new gold discovery in the United States, declaring a gold Inferred Mineral Resource of 9.1Moz at an average grade of 0.99g/t, at the Merlin deposit, in the Expanded Silicon project, in Nevada. This is the largest new discovery in the United States in more than a decade. |
Individual KPIs •Embed new values, culture and effective talent management. •Effective stakeholder management. | 25% | •Led the global launch of refreshed values and continued to reinforce expectations with leaders and employees on all site visits during the year. •Extensive engagement undertaken with analysts, shareholders, and potential investors across major capital markets, covering 70% in all of shareholder funds, in planned engagements during the year. •Met with senior members of governments in jurisdictions in which the Company operates to discuss operations and projects pertinent to their countries, and met with members of the US Senate, Colorado’s state government and business associations to discuss the Group’s establishment of corporate headquarters in the state of Colorado and its plans for capital investments in the United States. •Good progress on internal succession plans with clear development paths. |
Total | 100% | |
226
CEO: Performance incentive outcome 2023 | ||
2023 DSP performance outcome | Weighting | DSP award |
Financial performance targets | ||
Relative total shareholder return | 20.00% | —% |
Normalised cash return on equity (nCROE) | 15.00% | 18.43% |
Production | 15.00% | 11.80% |
Total cash costs | 10.00% | 5.64% |
All-in sustaining costs | 5.00% | —% |
Mineral Reserve pre-depletion | 5.50% | 4.42% |
Mineral Resource additions pre-depletion | 5.50% | 7.69% |
Safety measures | 8.00% | 12.00% |
Health, Environment and Community | 12.00% | 12.22% |
Core value: People | 4.00% | 3.00% |
Total % for Company performance | 100.00% | 75.20% |
x | ||
Organisational performance weighting | 80.00% | |
= | ||
A - Organisational performance weighted outcome | 60.16% | |
Individual performance results | ||
Actual individual targets and strategic objectives are not disclosed in order to maintain commercial confidentiality in competitive markets | ||
Individual performance weighting | 20.00% | |
x | ||
Performance rating award correlation | 150.00% | |
B - DSP opportunity based on individual performance | 30.00% | |
Total % of DSP pay opportunity (A+B) | 90.16% | |
x | ||
On-target total cash bonus opportunity (as % of base pay) | 100% | |
On-target total deferred share award opportunity (as % of base pay) | 200% | |
= | ||
Final cash bonus result (as % of base pay) | 90.16% | |
Final deferred share result (as % of base pay) | 180.32% | |
Base pay as at 31 December 2023 | x $1,656,000 | |
= | ||
Annual cash portion of DSP | $1,493,050 | |
Annual deferred share portion of DSP (to vest over five years) | $2,986,099 | |
Total 2023 deferred share plan award | $4,479,149 | |
227
CFO: Key Objectives and Achievements for 2023:
Scorecard | Weighting | Comments |
Leadership and stakeholder engagement | 10% | •Maintained effective relationships with all relevant internal and external shareholders, and stakeholders including banks, equity and debt investors, ratings agencies, auditors, joint venture partners and executive management. •Effectively supported the Company’s operations and functions by leading teams to deliver performance. •Continued to provide input in shaping execution of the Company’s strategy while providing appropriate guidance on financial performance. |
Projects | 10% | •Successful delivery of corporate restructuring and transition, which is the move to a UK domicile and New York Stock Exchange primary listing. Executed the project in line with planned accounting, treasury, and tax outcomes. •Successful on-boarding of the Company’s new auditors, PwC. |
Liquidity, credit ratings and balance sheet management | 15% | •Maintained a strong balance sheet as a key focus for the year, which included repaying the drawdown on the $1.4 billion 2022 multi-currency revolving credit facility for the payment of the corporate restructuring transaction shortly after year-end. •Engaged three ratings agencies on the Company’s strategy (including the corporate restructuring), operational performance, and cost initiatives which resulted in ratings being maintained by all three credit ratings agencies. •Successfully completed the transition and accountability of the budget process, as well as building a targeted business analysis team that resulted in a new structure which provides effective insights, analysis and robust governance for shaping the Company’s strategy. •Targeted focus on cash conversion and working capital management yielding strong free cash flow performance for the full year. |
Cost discipline and cash preservation measures | 35% | •Implemented a rigorous performance management framework providing executive and operational leadership with accurate, timely and transparent reporting focused on optimising business requirements. •Maintained focus on optimising costs and capital expenditure. •Continued to enhance supply chain processes by conducting a review of external contracts in each asset aiming to identify opportunities for cost optimisation as well as minimising value leakage. |
Governance and risk management | 20% | •Demonstrated clear expectations for the controls and governance environment, including setting up the Management Investment Committee structure to manage capital approval and allocation processes. •Embedded a strong governance and compliance culture by learning through internal audit findings and focusing on building effective control structures. |
People | 10% | •Successfully embedded new Company values and culture framework by being actively involved in the launch of the Company’s new corporate values as well as displaying appropriate role model behaviours for all employees. •Effective implementation of talent and succession management outcomes focused on creating a balance between recruiting the right external talent and developing internal talent for key roles. •Continued to advocate for developing females in mining by promoting female talent and providing appropriate mentorship. |
Total | 100% |
228
CFO: Performance incentive outcome 2023 | ||
2023 DSP performance outcome | Weighting | DSP award |
Financial performance targets | ||
Relative total shareholder return | 20.00% | —% |
Normalised cash return on equity (nCROE) | 15.00% | 18.43% |
Production | 15.00% | 11.80% |
Total Cash Costs | 10.00% | 5.64% |
All-in sustaining costs | 5.00% | —% |
Mineral Reserve pre-depletion | 5.50% | 4.42% |
Mineral Resource additions pre-depletion | 5.50% | 7.69% |
Safety measures | 8.00% | 12.00% |
Health, Environment and Community | 12.00% | 12.22% |
Core value: People | 4.00% | 3.00% |
Total % for Company performance | 100.00% | 75.20% |
x | ||
Organisational performance weighting | 80.00% | |
= | ||
A - Organisational performance weighted outcome | 60.16% | |
Individual performance results | ||
Actual individual targets and strategic objectives are not disclosed in order to maintain commercial confidentiality in competitive markets | ||
Individual performance weighting | 20.00% | |
x | ||
Performance rating award correlation | 150.00% | |
= | ||
B - DSP opportunity based on individual performance | 30.00% | |
Total % of DSP pay opportunity (A+B) | 90.16% | |
x | ||
On-target total cash bonus opportunity (as % of base pay) | 85.00% | |
On-target total deferred share award opportunity (as % of base pay) | 185.00% | |
= | ||
Final cash bonus result (as % of base pay) | 76.64% | |
Final deferred share result (as % of base pay) | 166.80% | |
Base pay as at 31 December 2023 | x $545,516 | |
= | ||
Annual cash portion of DSP | $418,062 | |
Annual deferred share portion of DSP (to vest over five years) | $909,899 | |
Total 2023 deferred share plan award | $1,327,961 | |
229
PARTICIPATION BY EXECUTIVE DIRECTORS AND EXECUTIVE MANAGEMENT TEAM MEMBERS IN THE
ANGLOGOLD ASHANTI DSP
For details of the share-based awards and rights to subscribe for ordinary shares in the Company granted to, and exercised by,
executive directors and executive management team members on an aggregate basis during the year ended
31 December 2023 through 19 April 2024, see below.
Number of unvested awards and movement during the reporting period | ||||||||||
DSP awards | Balance at 1 January | Granted | Vested, deemed settled | Forfeited / Lapsed | Balance at 31 December | Fair value of granted awards (1) | Fair value of vested awards (2) | Fair value of unvested awards at 31 December (3) | ||
Executive Directors | USD ‘000 | |||||||||
Alberto Calderon | 2023 | 41,601 | 191,652 | 8,320 | 224,933 | 3,388 | 140 | 4,204 | ||
2022 | - | 41,601 | - | - | 41,601 | 924 | - | 808 | ||
Gillian Doran | 2023 | - | - | - | - | - | - | - | - | |
2022 | - | - | - | - | - | - | - | - | ||
Total executive directors | 2023 | 41,601 | 191,652 | 8,320 | - | 224,933 | 3,388 | 140 | 4,204 | |
2022 | - | 41,601 | - | - | 41,601 | 924 | - | 808 | ||
Executive management | ||||||||||
Lisa Ali | 2023 | - | 48,669 | - | - | 48,669 | 860 | - | 910 | |
2022 | - | - | - | - | - | - | - | - | ||
Stewart Bailey | 2023 | 98,452 | 46,873 | 24,937 | - | 120,388 | 829 | 418 | 2,250 | |
2022 | 90,037 | 33,127 | 24,712 | - | 98,452 | 735 | 544 | 1,912 | ||
Terry Briggs | 2023 | - | 31,540 | - | - | 31,540 | 558 | - | 589 | |
2022 | - | - | - | - | - | - | - | - | ||
Marcelo Godoy | 2023 | 10,180 | 61,058 | 2,036 | - | 69,202 | 1,080 | 34 | 1,293 | |
2022 | - | 10,180 | - | - | 10,180 | 226 | - | 198 | ||
Richard Jordinson | 2023 | 41,757 | 25,317 | 16,049 | - | 51,025 | 448 | 269 | 954 | |
2022 | - | - | - | - | - | - | - | - | ||
Lizelle Marwick | 2023 | 60,592 | 43,442 | 15,805 | - | 88,229 | 768 | 265 | 1,649 | |
2022 | 41,821 | 28,814 | 10,043 | - | 60,592 | 640 | 222 | 1,177 | ||
Total executive management | 2023 | 210,981 | 256,899 | 58,827 | - | 409,053 | 4,543 | 986 | 7,645 | |
2022 | 131,858 | 72,121 | 34,755 | - | 169,224 | 1,601 | 766 | 3,287 | ||
Notes | ||||||||||
(1) The fair value of granted awards represents the value of awards, calculated using a five business day volume weighted average share price prior to grant date, 24 February 2023. | ||||||||||
(2) The fair value of vested awards represents the value deemed received on settlement date. | ||||||||||
(3) The fair value of unvested awards is calculated using the closing share price as at 31 December. | ||||||||||
230
Number of unvested awards and movement during the reporting period | ||||||||||
Sign-on share awards | Balance at 1 January | Granted | Vested, deemed settled | Forfeited / Lapsed | Balance at 31 December | Fair value of granted awards (1) | Fair value of vested awards (2) | Fair value of unvested awards at 31 December (3) | ||
Executive Directors | USD '000 | |||||||||
Gillian Doran | 2023 | - | 31,844 | 8,888 | - | 22,956 | 563 | 155 | 429 | |
2022 | - | - | - | - | - | - | - | - | ||
Total Executive Directors | 2023 | - | 31,844 | 8,888 | - | 22,956 | 563 | 155 | 429 | |
2022 | - | - | - | - | - | - | - | - | ||
Executive management | ||||||||||
Lisa Ali | 2023 | 23,896 | - | 23,896 | - | - | - | 585 | - | |
2022 | - | 44,233 | 20,337 | - | 23,896 | 837 | 271 | 464 | ||
Terry Briggs | 2023 | 47,004 | - | 21,595 | - | 25,409 | - | 529 | 475 | |
2022 | - | 47,004 | - | - | 47,004 | 890 | - | 913 | ||
Marcelo Godoy | 2023 | 59,044 | - | 37,574 | - | 21,470 | - | 644 | 401 | |
2022 | 107,353 | - | 48,309 | - | 59,044 | - | 1,195 | 1,147 | ||
Total executive management | 2023 | 129,944 | - | 83,065 | - | 46,879 | - | 1,758 | 876 | |
2022 | 107,353 | 91,237 | 68,646 | - | 129,944 | 1,727 | 1,466 | 2,524 | ||
Notes | ||||||||||
(1) The fair value of granted awards represents the value of awards, calculated using a five business day volume weighted average share price prior to grant date. The share awards were granted on start date and will vest over a 2 or 3 year period in equal tranches in accordance with the JSE Listing requirements. | ||||||||||
(2) The fair value of the vested awards represents the value received on settlement date. | ||||||||||
(3) The fair value of unvested awards is calculated using the closing share price as at 31 December. | ||||||||||
231
PARTICIPATION BY EMPLOYEES IN THE ANGLOGOLD ASHANTI DSP
For details of the share-based awards and rights to subscribe for ordinary shares in the Company granted to, and exercised
by, employees on an aggregate basis during the year to 31 December 2023, see “Item 18: Financial Statements—Note 8—
Share—Based Payments”.
ANGLOGOLD ASHANTI PERFORMANCE SHARE PLAN
As described above, to ensure that variable pay continues to support the Company’s strategy, detailed engagements were
held with investors resulting in the proposed move to a more market-standard variable pay approach. For 2024, the Company
will move from the single incentive plan (DSP) to the Performance Share Plan (“PSP”), comprising two separate plans, an
annual bonus and a performance-based long-term incentive.
•Annual bonus – a simple cash bonus based on short-term objectives covering both Company and individual performance.
•Performance-based long-term incentive – annual grants of share awards that vest after three years if forward-looking
performance objectives are met. These objectives will be directly linked to the execution of the Company’s strategic
ambitions and creation of shareholder value. The share awards will vest at the end of the three-year performance period
(rather than vesting annually over five years in equal tranches, as they do under the current DSP).
Importantly, the new structure will maintain the on-target opportunities from the current DSP approved by shareholders. In
particular, for the CEO, the current on-target incentive opportunity is 300% of salary, with up to 100% of salary delivered in
cash and 200% of salary delivered in deferred shares. Under the proposed approach, subject to modification as described
below, the structure will be an annual bonus with an on-target opportunity of 100% of salary, and a performance-based long-
term incentive with an on-target opportunity of 200% of salary.
Under the PSP, the maximum vesting level will be set at 200% of target opportunity levels (DSP is set at 150% of target
opportunity). This reflects the forward-looking nature of the targets and typical market practice for US-listed companies.
Outcomes at the top-end would require significant outperformance of expectations.
In moving from the backward-looking performance periods under the DSP, to the forward-looking performance assessment of
the PSP, the CompCo was aware of the need to manage the transition in a balanced and fair way for management and
shareholders, with no gaps or overlaps in the performance periods that apply under the PSP, and no increase or decrease in
target remuneration opportunity for participants.
Therefore, as the 2023 DSP award was made based on multi-year performance over the period 2021 to 2023 and the first PSP
award will be granted in 2024, subject to performance over the period 2024 to 2026, transition arrangements needed to be put
in place to ensure that proper incentives were in place to achieve the Company’s performance goals over the next two years
(i.e., 2024-2025), since the PSP will not provide for a payout until 2026.
It is proposed that this will be achieved by granting two separate transition incentive awards in respect of these periods. These
awards will be of equal value to the relative TSR element of the DSP (i.e., a target opportunity of 48% of salary for the CEO
and 43% of salary for the CFO), and will be measured in accordance with the TSR vesting schedule and peer groups used
under the DSP. These awards will be delivered one third in cash and two thirds in shares, which will vest after three years. No
transition arrangements will be put in place for the other three-year look back metrics of the DSP scorecard.
In order to ensure that overall incentive opportunities remain appropriate, the target bonus and PSP opportunity for 2024 and
2025 awards will be reduced so that the total target remuneration remains unchanged.
The CompCo believes that this approach provides a fair and balanced structure, which means management will be incentivised
to deliver strong performance for the Company’s shareholders throughout the transition period.
232
6F. DISCLOSURE OF A REGISTRANT’S ACTION TO RECOVER ERRONEOUSLY AWARDED
COMPENSATION
As noted in “Item 18: Financial Statements—Note 1—Statement of Compliance—1.3 Restatements—1.3.2 Prior period error in
the calculation of a net deferred tax asset with respect to the Obuasi mine and other restatements”, in early 2024, the Company
was required to prepare an accounting restatement. The Company conducted an analysis regarding whether recovery would be
required in accordance with the Company’s Dodd-Frank compliant clawback policy and NYSE listing standards. This analysis
was limited to the Company’s 2023 DSP since it was the only incentive-based compensation that is subject to recovery at this
time. Of the five financial metrics that determined 2023 DSP payouts, the Company determined that two (total cash costs and
production) were not affected by the restatement and a third (NCROE) would have resulted in a greater level of achievement
under the 2023 DSP if based on the restated financial information. Of the remaining two metrics (relative TSR and all-in
sustaining costs), the level of achievement had been below the threshold level, so there were no amounts earned in respect of
those metrics that would potentially be subject to recovery. Therefore, the Company concluded that recovery of erroneously
awarded compensation was not required as a result of the restatement described in “Item 18: Financial Statements—Note 1—
Statement of Compliance—1.3 Restatements—1.3.2 Prior period error in the calculation of a net deferred tax asset with respect
to the Obuasi mine and other restatements”.
In addition, the adjustments described in “Item 18: Financial Statements—Note 1—Statement of Compliance—1.3 Restatements
—1.3.1 Corporate restructuring” were merely to reflect the effects of the corporate restructuring and not due to the material
noncompliance of the Company with any financial reporting requirement, and therefore did not require the recovery of
compensation under the Company’s Dodd-Frank compliant clawback policy or NYSE listing standards.
233
ITEM 7: MAJOR SHAREHOLDERS AND RELATED PARTY TRANSACTIONS
Overview
Description of AngloGold Ashanti plc’s share capital
AngloGold Ashanti plc’s share capital currently consists of one class of stock: ordinary shares with a par value of US$1.00 each. At 31 December
2023, the issued share capital of AngloGold Ashanti plc consisted of 419,729,856 ordinary shares. All the issued ordinary shares of AngloGold
Ashanti plc are fully paid and are not subject to any further calls or assessments by AngloGold Ashanti plc.
The movements in the issued ordinary share capital of AngloGold Ashanti plc in 2023, subsequent to the completion of the corporate
restructuring on 25 September 2023, are described in the below table.
Number of Ordinary Shares | US$ | |||
At 25 September 2023 | 419,685,792 | 419,685,792 | ||
Issued after 25 September 2023: | ||||
Exercise of options by participants in the AngloGold Ashanti plc Deferred Share Plan | 44,064 | 44,064 | ||
At 31 December 2023 | 419,729,856 | 419,729,856 | ||
On 4 December 2023, AngloGold Ashanti plc issued 419,724,213 bonus shares and, shortly thereafter on 6 December 2023,
cancelled such bonus shares, resulting in their nominal value being credited to AngloGold Ashanti plc's distributable reserve
account.
During the period from 1 January 2024 to and including 19 April 2024, 451,937 ordinary shares were issued at a nominal issue
price of $1.00 per share, resulting in 420,181,793 ordinary shares being in issue at 19 April 2024.
The movements in the ordinary issued share capital of AngloGold Ashanti Limited in 2023, prior to the completion of the
corporate restructuring on 25 September 2023, are described in the below table.
Number of Ordinary Shares | Rand | ||
At 1 January 2023 | 418,600,473 | 104,650,118 | |
Issued after 1 January 2023: | |||
Exercise of options by participants in the AngloGold Ashanti Share Incentive Schemes | 1,085,319 | 271,330 | |
At 24 September 2023 | 419,685,792 | 104,921,448 | |
234
7A.MAJOR SHAREHOLDERS
According to information available to the Company, the following are the only shareholders holding, directly or indirectly, in
excess of five percent of the issued ordinary share capital of the Company:
Ordinary Shares Held At | ||||||||||||
31 December 2023 (2) | 31 December 2022 (3) | 31 December 2021 (3) | ||||||||||
Shareholder (1) | Number of Ordinary Shares | Percent Voting Rights (4) | Number of Ordinary Shares | Percent Voting Rights (5) | Number of Ordinary Shares | Percent Voting Rights (6) | ||||||
Public Investment Corporation of South Africa | 74,537,976 (7) | 17.76 | 65,834,877 (7) | 15.73 | 54,567,818 (7) | 13.07 | ||||||
BlackRock, Inc. | 34,192,912 (8) | 8.15 | 28,084,210 (9) | 6.71 | 26,872,096 (10) | 6.44 | ||||||
Van Eck Associates Corporation | 25,813,417 (7) | 6.15 | 23,586,972 (11) | 5.63 | n/a (7) | n/a | ||||||
Coronation Holdings | n/a (7) | n/a | n/a (7) | n/a | 37,322,250 (7) | 8.94 | ||||||
(1) Shares may not necessarily reflect the beneficial shareholder.
(2) Relates to the ordinary shares of AngloGold Ashanti plc.
(3) Relates to the ordinary shares of AngloGold Ashanti Limited.
(4) Based upon the total number of ordinary shares issued, which at 31 December 2023, amounted to 419,729,856 ordinary shares of AngloGold Ashanti plc.
(5) Based upon the total number of ordinary shares issued, which at 31 December 2022, amounted to 418,600,473 ordinary shares of AngloGold Ashanti Limited.
(6) Based upon the total number of ordinary shares issued, which at 31 December 2021, amounted to 417,501,452 ordinary shares of AngloGold Ashanti Limited.
(7) Based on management’s analysis of available sources of information.
(8) Based solely on the Schedule 13G filed on February 2, 2024, by BlackRock, Inc., a Delaware corporation.
(9) Based solely on the Schedule 13G filed on February 1, 2023, by BlackRock, Inc., a Delaware corporation.
(10) Based solely on the Schedule 13G filed on February 7, 2022, by BlackRock, Inc., a Delaware corporation.
(11) Based solely on the Schedule 13G filed on February 14, 2023, by Van Eck Associates Corporation, a Delaware corporation.
All ordinary shareholders have the same voting rights.
As at 31 December 2023, there were 108 holders of record of AngloGold Ashanti plc ordinary shares. Of these holders, 101 had
registered addresses in the United States and held a total of 419,729,160 ordinary shares, or 99.99 percent of the total
outstanding ordinary shares. The shares held by Cede & Co. as record holder are held for underlying beneficial holders holding
in “street name”. As a result, the number of holders of record or registered holders in the United States is not representative of
the number of beneficial holders or of the residence of beneficial holders.
Insofar as is known to AngloGold Ashanti, there was no person who, directly or indirectly, jointly or severally, exercised or could
exercise control over AngloGold Ashanti, nor is AngloGold Ashanti aware of any arrangements which might result in a change in
control of AngloGold Ashanti.
235
7B.RELATED PARTY TRANSACTIONS
AngloGold Ashanti’s related party transactions are described in “Item 18: Financial Statements—Note 29—Related Parties”.
236
7C.INTERESTS OF EXPERTS AND COUNSEL
Not applicable.
237
ITEM 8: FINANCIAL INFORMATION
238
8A.CONSOLIDATED FINANCIAL STATEMENTS AND OTHER FINANCIAL INFORMATION
See “Item 18: Financial Statements”.
239
LEGAL PROCEEDINGS
There is no material proceeding in which a director, officer or affiliate of AngloGold Ashanti is either a party adverse or has a
material interest adverse to the Company.
In addition to the proceedings described below, the Company becomes involved, from time to time, in various claims, legal
proceedings and complaints incidental to the ordinary course of its business.
TAX MATTERS
•The State of Minas Gerais v. Mineração Serra Grande S.A. (MSG): In Brazil, MSG received a tax assessment in October
2003 from the State of Minas Gerais related to VAT on gold bullion transfers. The tax administrators rejected MSG’s appeal
against the assessment, which amounted to approximately $5.2 million. MSG appealed the dismissal of the case to the
State Court of Minas Gerais, where the matter is currently pending.
•Brazilian tax authorities v. AngloGold Ashanti Córrego do Sítio Mineração SA and Mineração Serra Grande S.A.
(MSG): AngloGold Ashanti’s subsidiaries in Brazil, including AGA Mineração (formerly AngloGold Ashanti Brasil Mineração
Ltda) and MSG, are involved in various disputes with the Brazilian tax authorities. These disputes date back as far as 2007
and involve federal tax assessments including income tax, royalties, social contributions, VAT and annual property tax.
Collectively, the total possible amount involved across all tax disputes in Brazil is approximately $53.5 million, which include
VAT claims and social security payments of $42.0 million.
•Colombian Tax Office (DIAN) v. AngloGold Ashanti Colombia S.A.S. (AGAC): Since 2013, AGAC received various
notices from the DIAN that it disagreed with AGAC’s tax treatment of exploration expenditure in its 2010, 2011, 2013 and
2014 income tax returns and its 2011 equity tax return. However, AGAC believes that the DIAN has applied the tax
legislation incorrectly and subsequently filed lawsuits before the Administrative Court of Cundinamarca (the trial court for tax
litigation) challenging each of the DIAN’s rulings in respect of those tax returns. In 2018, the Administrative Court of
Cundinamarca denied AGAC’s arguments with respect to the 2010 and 2011 tax litigation. AGAC subsequently appealed
these judgments to the Council of State of Colombia (the highest court for tax matters). In 2022, the Council of State ruled
against AGAC upon appeal. The Council of State ordered AGAC to pay $34 million of additional taxes (which included
interest) in respect of the 2010 and 2011 tax returns, but it fully waived any related penalties (which were originally
assessed in the amount of $47 million). In December 2022, a tax reform was adopted in Colombia, enacting changes which
may lead to a reduction of interest charged on outstanding tax obligations in certain circumstances. In February 2023,
AGAC paid $25 million of additional taxes (which included interest) in respect of the 2011 income and equity tax returns,
after taking into account a reduction of $6 million in interest under the tax reform. Following this payment, the 2011 tax
litigation was fully settled. In April 2023, AGAC paid $3 million of additional taxes (which included interest) in full settlement
of the 2010 income tax claim. In February 2024, the Administrative Court of Cundinamarca ruled against AGAC’s tax
treatment of exploration expenditure in respect of its 2013 tax return. In February 2024, AGAC appealed this ruling to the
Council of State for resolution, which may take up to two years to be resolved. AGAC’s lawsuit with respect to its 2014 tax
return is still pending before the Administrative Court of Cundinamarca. The Company has disclosed a contingent liability of
$8 million in respect of the lawsuits with respect to its 2013 and 2014 tax returns (mainly covering related penalties).
Following a judgment of the Council of State in July 2019 holding that duplicate penalties may not be charged, the
Company expects that the remaining balance of $8 million (mainly covering penalties) will likely be waived.
As the Company sold its entire 50% indirect interest in the Gramalote project to B2Gold Corp. on 29 September 2023, it no
longer discloses any contingent liability for the previously reported Gramalote tax litigation. In addition, from 2017 onwards,
the deduction of exploration costs is prohibited following a change in Colombian tax legislation. As a result, exploration
costs have been treated in accordance with the amended tax legislation subsequent to that date.
•Argentina Tax Authority (AFIP) v. Cerro Vanguardia S.A. (CVSA): In July 2013, CVSA received a notification from the
AFIP requesting corrections to the 2007, 2008 and 2009 income tax returns of about $0.1 million relating to the non-
deduction of tax losses previously claimed on hedge contracts. The AFIP is of the view that the financial derivatives could
not be considered as hedge contracts, as hedge contract losses could only be offset against gains derived from the same
kind of hedging contracts. Penalties and interest on the disputed amounts are estimated at a further $0.9 million. CVSA and
AFIP have corresponded on this issue over the past several years, and the Argentinian tax authorities continue to assert
their position regarding the use of the financial derivatives. CVSA filed an appeal with the Tax Court in June 2015, and the
parties submitted their final reports in July 2017. The matter is pending with the Tax Court.
•AngloGold Ashanti (Ghana) Limited (AGAG) withholding tax audits: AGAG received final tax audit reports from the
Ghana Revenue Authority (“GRA”) in which, out of the total liabilities demanded by the GRA, AGA contests an outstanding
amount of $5.1 million in respect of withholding taxes on payments to non-residents during the 2004 to 2011 tax years.
AGAG’s objection to the GRA’s assessment is based on an exemption from withholding tax on payments to non-residents
during the relevant period granted to it by the government of Ghana. In 2013, an initial meeting was held with the
Commissioner-General of the GRA to confirm AGAG’s position on the matter, following which the GRA committed to refer
240
the matter to the Ghanaian Ministry of Finance for advice. As of the date hereof, AGAG has not received a response from
the GRA on this matter.
COLOMBIA
•Santa María-Montecristo and La Colosa class action lawsuits: Class action lawsuits have been filed in relation to each
of AngloGold Ashanti Colombia S.A.S.’s (AGAC) Santa María-Montecristo and La Colosa projects. Each of the two lawsuits
aims to stop exploration and mining in certain restricted areas affected by the projects due to environmental concerns.
In respect of the Santa María-Montecristo class action lawsuit, in September 2011, the Administrative Court of Tolima
granted one of the plaintiffs a preliminary injunction suspending AGAC’s mining concession contracts in relation to this
project. AGAC has challenged this injunction, nevertheless, it remains in place during the course of the court proceedings.
In May 2019, the Administrative Court of Tolima ruled that a technical study be prepared to define the places in which
mining activities could be performed in the Combeima canyon without posing any threat to the water reservoirs of Ibagué,
the capital of the Tolima department. In September 2020, the Council of State of Colombia (the highest court for
administrative matters) on appeal overruled the decision of the Administrative Court of Tolima. The Council of State’s
decision, which is final and not subject to further appeal, determined that AGAC, as concessionaire, has a right to develop
the project if it can demonstrate to the mining and environmental authorities on the basis of technical studies that its mining
exploration and, eventually, exploitation activities, will not impact the water resources of the Coello River basin and its
tributaries. In October 2022, AGAC returned all of its tenements involved in the Santa María-Montecristo project to the
government of Colombia. On 30 January 2023, the Colombian Mining Authority (Agencia Nacional de Minería) (ANM) duly
registered AGAC’s waiver of ownership of three of those tenements in the mining cadaster. The return of AGAC’s remaining
tenement involved in the Santa María-Montecristo project was duly registered by the ANM on 11 May 2023. While AGAC no
longer has a legal interest in the class action lawsuit following its waiver of ownership of those tenements, the
Administrative Court of Tolima has not yet dismissed the case for AGAC or formally excluded AGAC from the legal
proceedings.
The consolidated La Colosa class action lawsuit originally consisted of four separate class actions. In relation to this project,
in October 2016, Tolima’s Administrative Court ordered that a technical study be prepared by a panel of seven experts
(selected by the plaintiff, AGAC, universities, the Colombian government and an NGO) to determine whether the La Colosa
project presents a “threat” to the environment during its exploration phase. In December 2017, Ibagué’s Third Administrative
Court ordered that another technical study, similar to the one described in the October 2016 order, be prepared for the La
Colosa project. AGAC appealed both orders. In September 2018, Tolima’s Administrative Court consolidated all class
actions in relation to the La Colosa project into one single class action lawsuit which is currently pending before the Council
of State. The orders to prepare the technical studies have been temporarily suspended pending resolution by the Council of
State. If AGAC’s appeal before the Council of State is not successful, the Company may have to perform one or more
technical studies in relation to the La Colosa project. If the studies were to conclude that a “threat” exists, certain
development activities at the La Colosa project may be suspended.
Further, while the plaintiffs in the La Colosa class action have petitioned the courts to cancel the mining concession
contracts, the Company believes that the judiciary system in Colombia does not have the authority to order such
cancellation. Such power, by law, vests solely in the Colombian government which, through the relevant Colombian mining
authorities, has the discretion to declare concessions void if a concession holder breaches applicable environmental laws
or regulations. The Colombian government, as the authority granting the mining concession contracts, is also a defendant
in this class action lawsuit together with AGAC. AGAC continues to oppose, through a variety of integrated legal and
political strategies, the class action lawsuit that was filed against it. However, if the plaintiffs prevail and AGAC is unable to
perform its core concession contracts as a result of the judicial decision, the Company would be required to abandon the
project.
•Cortolima’s injunction against AngloGold Ashanti Colombia S.A.S. (AGAC): In March 2013, Cortolima, a regional
environmental authority in the Tolima department, issued a regulatory injunction against AGAC alleging, among other
things, that in relation to certain of AGAC’s La Colosa mine design-related activities in the municipality of Piedras, AGAC
engaged in drilling and other activities that could have negative effects on the environment. The injunction did not include
any allegation that AGAC’s actions actually caused any environmental damages in Piedras. AGAC’s challenge of the
injunction was unsuccessful before Cortolima. In August 2013, AGAC initiated legal proceedings before the Council of State
of Colombia (the highest court for administrative matters) seeking annulment of the injunction as well as restoration of its
rights to continue its activities in the area. In November 2019, the Council of State ruled that the competent judicial authority
to decide on this matter is the Administrative Court of Tolima and referred the case to that court. In July 2020, the Twelfth
Administrative Court of Tolima ruled that since the injunction is a preliminary and temporary measure imposed as part of the
administrative approval process within Cortolima and not a final decision, it is not yet amenable to administrative judicial
review. In July 2021, this decision was reversed on appeal by the Administrative Superior Court of Tolima in a ruling that
such injunctions are amenable to administrative judicial review. The appellate court ordered the Twelfth Administrative Court
of Tolima to review the matter and issue a decision thereon. Consequently, the Twelfth Administrative Court of Tolima
admitted the case and a first hearing was held in April 2022. Trial evidence was accepted. In October 2022, another hearing
241
was held to gather testimonies. The case remains pending. The Company expects that a final resolution of this matter will
include payment of a penalty by AGAC in an amount that is not expected to be material. While the injunction remains in
place, AGAC is not able to engage in certain of its activities related to the La Colosa project.
•Piedras and Cajamarca popular consultations: In 2013, the local council of the city of Piedras, near the La Colosa
project, organised a popular consultation to ban all mining activities in Piedras (Piedras popular consultation), the result of
which was validated by the Administrative Court of Tolima as part of an administrative procedure. Although the Piedras
popular consultation did not have an immediate impact on the La Colosa project (due to its distant location from the
project), AGAC believes the Piedras popular consultation was in violation of national law in Colombia. In 2013, AGAC filed a
‘tutela’ action (a legal action alleging a violation of constitutional rights) with the Council of State of Colombia (the highest
court for administrative issues). In 2014, AGAC’s ‘tutela’ action was dismissed by the Council of State for lack of standing
on the grounds that AGAC did not have mining tenements in Piedras. In addition, in 2015, AGAC filed a request for
annulment of the administrative acts adopted by the local authorities in furtherance of the results of the Piedras popular
consultation, which was rejected by the Second Administrative Court of Ibagué. AGAC subsequently appealed this ruling. In
July 2021, AGAC was notified that the Administrative Superior Court of Tolima ruled on appeal that, in light of the 2018
decision of the Constitutional Court of Colombia (the highest court for constitutional issues) holding that local municipalities
or regions are not entitled to veto mining activities through popular consultations (as further described below), the results of
the Piedras popular consultation, and the administrative acts adopted in furtherance thereof, were not enforceable. An
extraordinary appeal against this ruling was submitted in March 2022, which is pending.
In March 2017, the residents of the municipality of Cajamarca also voted in a popular consultation to disapprove mining
projects in the municipality, including the La Colosa project (Cajamarca popular consultation). However, the Mining Minister
of Colombia subsequently publicly confirmed that Cajamarca’s vote does not apply retroactively implying the Cajamarca
popular consultation did not have an immediate impact on AGAC’s rights with respect to the La Colosa project. In April
2017, AGAC nevertheless suspended all exploration activities at the La Colosa project until there is more certainty about
mining activity in Colombia. In October 2018, the Colombian Constitutional Court issued ruling SU-095-2018 stating that
local municipalities or regions were not entitled to veto mining activities through popular consultations. The Constitutional
Court also ordered the national legislative body, the Congress of Colombia, to enact a law within two years to ensure that
local communities and groups are adequately consulted in the approval of mining activities in accordance with specific
criteria set out in its ruling. Subsequently, a group of citizens submitted an annulment claim before the Administrative Court
of Cundinamarca to cancel AGAC’s mining contract in Cajamarca on the grounds of the results of the Cajamarca popular
consultation. After having admitted the annulment claim in December 2019, the Administrative Court of Cundinamarca
dismissed the plaintiffs’ claim in May 2021 on procedural grounds. The plaintiffs subsequently appealed this decision and
the appeal is currently pending before the Council of State.
•La Colosa Human Rights Litigation: In November 2014, the Personero (Ombudsman) of Ibagué, the capital of the
Tolima department, filed a petition against the Colombian government before the Inter-American Commission on Human
Rights (Commission), based in Washington, D.C., for alleged human rights violations protected by the American Convention
on Human Rights (Convention) which has been ratified by Colombia along with many other Central and South American
countries. The Commission has the power to refer a case to the Inter-American Court of Human Rights (Court) which is an
autonomous judicial institution based in San José, Costa Rica whose purpose is the application and interpretation of the
Convention. The petition alleges that the Colombian government denied justice to the Personero as a result of the failure of
the Colombian judiciary to resolve the issues raised in two class actions filed by him before the local Colombian
administrative courts within a reasonable period of time. Although AGAC was not a party to the suit, its outcome was
nevertheless important to the development of the La Colosa project. As the Commission neither accepted nor referred the
case to the Court and the issues raised in those two class actions have been adjudicated by the local Colombian
administrative courts, AGAC considers this matter to be moot.
•Paramo Delimitation: In November 2016, the Colombian government issued Resolution 1987/2016 delineating certain
wetlands or moorlands as environmentally important protected areas, which designation includes certain areas in and
around the La Colosa project. In these areas there are limitations, or in some instances outright bans, on mining and
mining-related activities. These limitations and bans could potentially adversely impact the design, operations and
production of the mining project at the La Colosa project. In June 2017, AGAC filed suit against the Colombian Ministry of
the Environment in the Administrative Court of Cundinamarca to annul Resolution 1987/2016 on technical and other
grounds. The lawsuit was admitted in April 2019. The Ministry of the Environment, as defendant in this action, is expected
to file its response to the annulment claim.
GHANA
•Pompora Treatment Plant Litigation: In April 2013, AngloGold Ashanti (Ghana) Limited (AGAG) received a summons
from Abdul Waliyu and 152 others in which the plaintiffs allege that they were or are residents of the Obuasi municipality or
its suburbs and that their health has been adversely affected by emissions and/or other environmental impacts arising in
connection with the current and/or historical operations of the Pompora Treatment Plant (PTP), which was decommissioned
242
in 2000. The plaintiffs’ alleged injuries include respiratory infections, skin diseases and certain cancers. The plaintiffs
subsequently did not file their application for directions in time. In February 2014, executive members of the PTP (AGAG)
Smoke Effect Association (PASEA), sued AGAG by themselves and on behalf of their members (undisclosed number) on
grounds similar to those discussed above, as well as economic hardships resulting from the failure of their crops. In June
2023, the court dismissed these matters for want of prosecution by the plaintiffs.
•Ghana Mining Leases Litigation: In January 2019, AGAG and AngloGold Ashanti (Iduapriem) Limited (AAIL), along with
other Ghanaian mining companies, were served with writs by two members of the Ghanaian Parliament seeking to invoke
the jurisdiction of the Ghanaian Supreme Court (highest court in Ghana) for a declaration that the mining companies were
not entitled to carry out any exploitation of minerals otherwise allowed under their relevant mining leases unless the leases
had been timely ratified by the Parliament of Ghana. In January 2019, the Ghanaian Attorney General filed its statement of
case, agreeing with the position of the plaintiffs (that the mining leases required parliamentary ratification) and requesting
that the Supreme Court order the mining companies to pay the Ghanaian government all revenue related to mining
activities accrued during the time such mining leases were unratified. In April 2019, AGAG and AAIL, in coordination with
the other mining companies, filed their statement of case. The Supreme Court has not yet set a date for the first hearing to
commence the case.
GUINEA
•Government of Guinea (National Claim Commission) v. Société AngloGold Ashanti Goldfields de Guinée SA (SAG):
A national claim recovery commission established by the government of Guinea has demanded that SAG pay $43 million in
dividends and penalties that would allegedly have been owed to the government of Guinea for the accounting years 2004 -
2007. SAG opposes the claim. Even though both parties had originally decided to submit their dispute to an independent
audit firm to be appointed by a common accord, the independent audit firm was never appointed. In December 2010, the
national claim recovery commission was disbanded and the matter was turned over to the Inspector General of the Ministry
of Finance of Guinea. This matter has been dormant since it was handed over to the Inspector General.
TANZANIA
•Geita Gold Mining Limited (GGM): In January 2007, Jackson Manyelo and other plaintiffs filed a suit against GGM in the
Mwanza High Court alleging that they were affected by blasting activities in the Katoma area carried out by GGM and had
suffered damages in the amount of TZS9.6 billion (approximately $6 million). In April 2015, the High Court issued a
judgment in favour of GGM. In 2016, plaintiffs appealed to the Court of Appeal, where the matter is pending.
•Geita Gold Mining Limited (GGM) and Samax Resources Limited (Samax) v. Government of Tanzania: In July 2017,
GGM and Samax filed a notice of arbitration against the government of Tanzania arising from the enactment by the
government of certain legislation that purports to make a number of changes to the operating environment of Tanzania’s
extractive industries, including mining. The notice of arbitration was submitted in accordance with Article 12 of the
Agreement for the Development of a Gold Mine at Geita, Mwanza between the government of Tanzania and each of GGM
and Samax (the MDA), and under the 1976 Arbitration Rules of the United Nations Commission on International Trade Law
(UNCITRAL). The Arbitral Tribunal has been duly constituted. Since January 2019, at the request of the parties, the arbitral
proceedings have been stayed several times in order to afford the parties the opportunity to achieve an amicable resolution
of the dispute and as a result of the impact of the COVID-19 pandemic. On 6 November 2023, the parties agreed to stay
the arbitration proceedings for a further period of 12 months until 6 November 2024.
•Arbitration under the United Kingdom-Tanzania Bilateral Investment Treaty (UK-Tanzania BIT): Unrelated to the
arbitration proceedings under the MDA described above, in September 2017, GGM and Samax, together with Cluff Oil
Limited and Cluff Mineral Exploration Limited, notified the government of Tanzania in writing that the Tanzanian
government’s conduct amounted to a breach of its commitments under the UK-Tanzania BIT. This notice triggered a
‘cooling-off’ period under the UK-Tanzania BIT, pursuant to which the parties had six months to achieve an amicable
resolution to their dispute. Following the expiry of the ‘cooling off’ period in March 2018, GGM, Samax, Cluff Oil Limited and
Cluff Mineral Exploration Limited are now entitled to submit their dispute with the government of Tanzania to ICSID
arbitration in accordance with the terms of the UK-Tanzania BIT to the extent that they may deem this necessary.
BRAZIL
•Public Civil Action between Mineração Serra Grande S.A. (MSG) and the Goiás State Public Prosecutor's Office
(Prosecutor): In August 2019, the Prosecutor filed a public civil action against MSG in the local court of Crixás (Court)
arguing that the Serra Grande tailings dam should be deactivated and decommissioned due to its size and upstream
construction method. The Prosecutor requested the Court to grant an injunction ordering MSG to, inter alia, completely
deactivate the tailings dam by 15 September 2021 and decommission the tailings dam, including complete removal of
tailings material, by 15 September 2022. Further, the Prosecutor requested that a daily penalty of approximately $245,000
243
be imposed for MSG’s failure to comply with such injunction. MSG submitted its defence in September 2019 and contends
that it has not violated any Brazilian laws or regulations applicable to operations of the Serra Grande tailings dam. In
February 2020, the Court granted an injunction in respect of a number of the requests made by the Prosecutor. In line with
the legal requirements of ANM Resolution No. 13/19, the injunction ordered the deactivation of the Serra Grande tailings
dam by 15 September 2021, but did not include requirements to decommission the tailings dam, or to conduct complete
removal of tailings material, by 15 September 2022. MSG filed a motion for clarification in relation to certain items of the
Court’s decision. In May 2020, the Court clarified that its injunction should be interpreted in line with the legal requirements
of ANM Resolution No. 13/19. In June 2020, the Prosecutor presented further technical arguments in court, reiterating its
request for an injunction ordering MSG to, inter alia, deactivate the tailings dam by September 2021 and to decommission
the tailings dam, including complete removal of tailings material. Afterwards, MSG filed an interlocutory appeal against the
preliminary injunction granted in February 2020 and a motion for further clarification. In August 2020, both MSG and the
Prosecutor filed petitions informing the Court that the parties did not wish to produce oral evidence at a hearing. In May
2021, the Court upheld the preliminary injunction ordering the deactivation of the Serra Grande tailings dam by 15
September 2021 and its decommissioning by 15 September 2025, both of which are consistent with the deadlines
established by existing legal and regulatory requirements. In June 2021, the Prosecutor appealed this decision. The Court
of Appeals of Goiás tried the case in August 2022 and has affirmed the first instance decision. In November 2022, the
Prosecutor appealed this Court of Appeals decision to the Superior Court of Justice. On 22 February 2023, the Vice-
President of the Court of Appeals denied the Prosecutor’s appeal to the Superior Court of Justice. On 12 April 2023, the
Prosecutor filed an interlocutory appeal against this decision of the Vice-President of the Court of Appeals before the
Superior Court of Justice, which was granted on 23 October 2023. As a result, the Prosecutor’s appeal of the Court of
Appeals decision is currently pending before the Superior Court of Justice.
NORTH AMERICA
•Arbitration between AngloGold Ashanti North America Inc. (AGANA) and Altius Royalty Corporation (Altius): On
27 March 2023, Altius initiated arbitration proceedings in Vancouver, B.C., Canada against AGANA regarding the
geographic scope of a 1.5 percent net smelter returns royalty. Altius asserts the royalty should be broadly interpreted to
cover nearly all claims controlled by AGANA in the Beatty, Nevada mining district, including claims related to the Expanded
Silicon project as well as claims acquired in 2022 as part of the Corvus Gold Inc. and Coeur Sterling, Inc. acquisitions.
AGANA intends to vigorously defend against Altius’ claims. The arbitration hearing was held in April 2024. The arbitration
panel is expected to render a decision on this matter in due course.
244
DIVIDENDS
Dividends may be approved by the board of directors of AngloGold Ashanti (the “board”) from time to time. The board’s approval
is based on the Company’s financial performance and compliance with applicable laws and the Company’s articles of
association, including in respect of capital maintenance requirements contemplated in the UK Companies Act.
AngloGold Ashanti’s dividend policy allows the board to declare a semi-annual dividend based on 20 percent of the free cash
flow generated by the business for that financial year, before taking into account non-sustaining capital expenditure, subject to
applicable laws required to be complied with before a dividend may be declared by the board. The dividend policy and the
quantum of any dividend are subject to the board’s discretion.
Dividends are declared in U.S. dollars and paid in U.S. dollars, South African rands and Ghanaian cedis. Exchange rate
fluctuations may therefore affect the value of the dividends received by registered shareholders and distributions paid by the
relevant depositary to investors holding AngloGold Ashanti securities. For details on taxation and exchange controls applicable to
holders of ordinary shares, see “Item 10D: Exchange controls”, “Item 10E: Taxation—United Kingdom Taxation—UK Tax
Consequences of Holding AngloGold Ashanti’s Ordinary Shares—Dividends” and “Item 10E: Taxation—United States Taxation
—U.S. Tax Consequences of Holding AngloGold Ashanti’s Ordinary Shares—Taxation of Dividends”.
245
8B.SIGNIFICANT CHANGES
Refer to “Item 18: Financial Statements—Note 33—Subsequent Events”.
246
ITEM 9: THE OFFER AND LISTING
9A.OFFER AND LISTING DETAILS
The principal trading markets for AngloGold Ashanti’s ordinary shares are the NYSE under the symbol “AU” and the JSE under
the symbol “ANG”.
9B.PLAN OF DISTRIBUTION
Not applicable.
9C.MARKETS
NATURE OF TRADING MARKET
The principal trading markets for AngloGold Ashanti’s ordinary shares are the NYSE under the symbol “AU” and the JSE under
the symbol “ANG”.
AngloGold Ashanti’s ordinary shares are also listed on the GSE, as ordinary shares under the symbol “AGA” and in the form of
Ghanaian Depositary Shares or GhDSs (each representing one one-hundredth of an ordinary share) under the symbol “AAD”,
and on the A2X in South Africa under the symbol “ANG”. On 27 June 2023, AngloGold Ashanti voluntarily delisted from the ASX
in Australia.
9D.SELLING SHAREHOLDERS
Not applicable.
9E.DILUTION
Not applicable.
9F.EXPENSES OF THE ISSUE
Not applicable.
247
ITEM 10:ADDITIONAL INFORMATION
10A.SHARE CAPITAL
Not applicable.
248
10B.ARTICLES OF ASSOCIATION
General
Unless stated otherwise, the following is a description of the material terms of the AngloGold Ashanti articles of association. This
description is a summary only and is not a complete description of such terms. The rights of holders of AngloGold Ashanti’s
ordinary shares are governed by the AngloGold Ashanti articles of association, the UK Companies Act and the laws of England
and Wales more generally.
AngloGold Ashanti plc (Registration No. 14654651; LEI No. 2138005YDSA7A82RNU96) was incorporated as a private limited
company under the laws of England and Wales on 10 February 2023 and was re-registered as a public limited company and
changed its name to AngloGold Ashanti plc on 22 June 2023 for the purposes of carrying out the corporate restructuring. On 25
September 2023, upon completion of the corporate restructuring, AngloGold Ashanti plc became the parent company of the
Group. The Company operates under the UK Companies Act, and is governed by the AngloGold Ashanti articles of association.
The AngloGold Ashanti articles of association are not required to include, and do not include, the details of the objects and
purposes of the Company.
The following description of the material terms of the AngloGold Ashanti articles of association includes a summary of certain
specific provisions of the AngloGold Ashanti articles of association. This summary does not contain all the information pertaining
to the rights of holders of AngloGold Ashanti’s ordinary shares and is qualified in its entirety by reference to the laws of England
and Wales and AngloGold Ashanti’s governing corporate documents. You are encouraged to read the AngloGold Ashanti articles
of association, a copy of which is filed as Exhibit 19.1 and is incorporated herein by reference.
In respect of AngloGold Ashanti, references to a “shareholder” are references to the registered legal owner of AngloGold
Ashanti’s ordinary shares and references to a “beneficial owner” are references to the owner of a beneficial interest in AngloGold
Ashanti’s ordinary shares.
Each of AngloGold Ashanti’s ordinary shares is fully paid, and is not subject to any further calls or assessments by AngloGold
Ashanti. There are no conversion rights or redemption provisions relating to any of AngloGold Ashanti’s ordinary shares.
Under English law, a person who is neither a resident nor national of the United Kingdom may freely hold (both legally and
beneficially), vote and transfer AngloGold Ashanti’s ordinary shares in the same manner and under the same terms as a UK
resident or national.
Under English law, the AngloGold Ashanti articles of association may only be amended by means of a special resolution of the
shareholders. The AngloGold Ashanti board is not authorised to change the AngloGold Ashanti articles of association.
Election of directors
Under English law, public companies such as AngloGold Ashanti must have at least two directors, and at least one director must
be a natural person – the AngloGold Ashanti articles of association can however set out a higher minimum. English law does not
prescribe a maximum number of directors, although the AngloGold Ashanti articles of association can impose a maximum. The
AngloGold Ashanti articles of association provide that AngloGold Ashanti must have a minimum of four directors and a maximum
of 20 directors (disregarding alternate directors).
Pursuant to the AngloGold Ashanti articles of association, shareholders have the right to elect directors by ordinary resolution.
Subject to the written approval of a majority of AngloGold Ashanti directors, the AngloGold Ashanti board is also entitled to
appoint directors, although such appointment must then be approved by shareholders by way of ordinary resolution at the next
general meeting.
The AngloGold Ashanti articles of association impose requirements with respect to the content of a shareholder notice submitted
by a shareholder nominating a director for election (in addition to the requirements imposed generally to requisition a resolution
at a shareholders meeting). The notice must include, among other things, information regarding any voting commitments or
compensation arrangements of such nominee, as well as material relationships of the person requisitioning the resolution and/or
certain associated persons and the nominee and any other information that may be required to be disclosed in connection with
the election of such director pursuant to Regulation 14A under the Exchange Act. The above must be provided within the
timeframes specified for requisitioning shareholder proposals.
If a shareholder fails to comply with the notice requirements set out in the AngloGold Ashanti articles of association, AngloGold
Ashanti will not be obliged to put the resolution for appointment of the nominee to the general meeting (and such resolution may
not be properly moved at the annual general meeting).
If Rule 14a-19 promulgated under the Exchange Act applies to AngloGold Ashanti,
249
•for any shareholder nominating a person for appointment as director to the AngloGold Ashanti board (and the beneficial
owner, if any, on whose behalf the nomination is being made), such letter must include a representation that the
shareholder giving notice and/or beneficial owner will, to the extent any proxies in support of director nominees other
than AngloGold Ashanti’s nominees are solicited, (a) solicit proxies from holders of AngloGold Ashanti’s outstanding
shares representing at least 67 percent of the voting power of shares entitled to vote on the election of directors, (b)
include a statement to that effect in its proxy statement and/or the proxy form, (c) otherwise comply with Rule 14a-19
promulgated under the Exchange Act and (d) provide the secretary of AngloGold Ashanti not less than five days prior to
the meeting or any adjournment, rescheduling or postponement thereof, with reasonable documentary evidence (as
determined by the secretary of AngloGold Ashanti in good faith) that such shareholder and/or beneficial owner complied
with such representations;
•if a shareholder providing notice and/or beneficial owner that intends to solicit proxies in support of director nominees
other than AngloGold Ashanti’s nominees no longer intends to solicit proxies in accordance with its representation
pursuant to the above requirements, such shareholder and/or beneficial owner will inform AngloGold Ashanti of this
change by delivering a writing to the secretary of AngloGold Ashanti no later than two business days after the
occurrence of such change; and
•if a shareholder and/or beneficial owner providing such notice is not in compliance with such representations and the
AngloGold Ashanti articles of association, no action will be taken on such nomination and such nominee will be deemed
disqualified, notwithstanding that proxies in respect of such nominee may have been received by AngloGold Ashanti.
If at a general meeting of AngloGold Ashanti, the number of directors approved to be appointed will exceed the maximum
number of directors set out in the AngloGold Ashanti articles of association, the first 20 directors approved to be appointed at the
general meeting will be so appointed and no further directors will be appointed at such meeting.
As a public company, AngloGold Ashanti may not appoint more than one person as a director by a single resolution at a general
meeting of its shareholders, unless a resolution approving the motion has first been unanimously agreed by the meeting – this is
intended to ensure the meeting is free to reject individual candidates, so the meeting cannot be presented with only the option of
electing a team to the AngloGold Ashanti board.
English law permits companies to provide for terms of different lengths for its directors. Any director’s employment agreement
with a guaranteed term of more than two years must be subject to the prior approval of shareholders by way of ordinary
resolution at a general meeting. Pursuant to the AngloGold Ashanti articles, at every annual general meeting, all the directors at
the date of the notice convening the annual general meeting will retire from office and may offer themselves for reappointment by
the shareholders.
Under English law:
•a person may not be appointed as a director unless they are at least 16 years of age at the time the appointment takes
effect;
•at least one director of each company must be a natural person;
•except with the leave of the court, a person is prohibited from acting as a director of a company if:
◦the person is an undischarged bankrupt;
◦a moratorium period under a debt relief order applies in relation to the person;
◦a bankruptcy restrictions order or undertaking, or a debt relief restrictions order or undertaking, is in force in
respect of the person; or
◦the person is subject to an order made under section 429(2)(b) (disabilities on revocation of administration
order against an individual) of the UK Insolvency Act 1986; and
•a court may or, in some cases, must make an order disqualifying a person from acting as a director, including without
limitation:
◦where they are convicted of an indictable offence (whether on indictment or summarily) in connection with the
promotion, formation, management, liquidation or striking off of a company, with the receivership of a
company’s property or with their being an administrative receiver of a company;
250
◦where it appears they have been persistently in default in relation to requirements for any return, account or
other document to be filed with, delivered or sent, or notice of any matter to be given, to the UK Registrar of
Companies; and
◦where they have been convicted of a relevant foreign offence, including offences committed in connection with
the promotion, formation or management of a company overseas which corresponds to an indictable offence
under the law of England and Wales or Scotland.
The AngloGold Ashanti articles of association impose requirements with respect to certain directors nominated for appointment
or reappointment (as applicable) at each annual general meeting. Pursuant to the AngloGold Ashanti articles of association, the
directors shall:
•at each annual general meeting during the period from 25 September 2023 until the date which is five years following
such date, nominate for appointment or reappointment (as applicable) a minimum of two representatives from South
Africa; and
•at each annual general meeting following expiry of the period referred to above, nominate for appointment or
reappointment (as applicable) a minimum of one representative from South Africa.
Removal of directors
Under English law, irrespective of any provisions in the AngloGold Ashanti articles of association to the contrary, the
shareholders may remove any of the AngloGold Ashanti directors without cause by ordinary resolution at a meeting, provided
notice of the proposal is given to AngloGold Ashanti by the shareholder making such proposal at least 28 days prior to the
general meeting at which such proposal is to be put to shareholders. An AngloGold Ashanti director subject to the procedure has
the right to (i) make certain written representations as to why he should not be removed (which AngloGold Ashanti must then
circulate to its shareholders) and (ii) be heard orally at the general meeting. Additionally, under the AngloGold Ashanti articles of
association, the shareholders may remove any of the AngloGold Ashanti directors without cause by special resolution at a
meeting, in which case the aforementioned procedural requirements shall not apply.
Further, under the AngloGold Ashanti articles of association, any AngloGold Ashanti director automatically stops being a director
if:
•the AngloGold Ashanti director gives AngloGold Ashanti written notice of resignation and the resignation becomes
effective;
•the AngloGold Ashanti director gives AngloGold Ashanti a written notice in which the AngloGold Ashanti director offers to
resign, the AngloGold Ashanti board decides to accept this offer and the resignation becomes effective;
•all of the other AngloGold Ashanti directors (who must comprise at least three people) pass a resolution or sign a written
notice removing the AngloGold Ashanti director as a director;
•the AngloGold Ashanti director is or has been suffering from mental or physical ill health and the AngloGold Ashanti
directors pass a resolution removing the AngloGold Ashanti director from office;
•the AngloGold Ashanti director has missed AngloGold Ashanti directors’ meetings (whether or not an alternate director
appointed by the absent AngloGold Ashanti director attends those meetings) for a continuous period of six months
without permission from the AngloGold Ashanti directors and the AngloGold Ashanti directors pass a resolution
removing the AngloGold Ashanti director from office;
•a bankruptcy order is made against the AngloGold Ashanti director or the AngloGold Ashanti director makes any
arrangement or composition with their creditors generally;
•the AngloGold Ashanti director is prohibited from being an AngloGold Ashanti director under any statute (and any
orders, regulations or other subordinate legislation made under it) applying to AngloGold Ashanti; or
•the AngloGold Ashanti director ceases to be an AngloGold Ashanti director under any statute (and any orders,
regulations or other subordinate legislation made under it) applying to AngloGold Ashanti, or is removed from office
under the AngloGold Ashanti articles of association.
If an AngloGold Ashanti director stops being an AngloGold Ashanti director for any reason, that person will also automatically
cease to be a member of any committee or sub-committee of the AngloGold Ashanti board.
251
Board remuneration
AngloGold Ashanti is required to put in place a directors’ remuneration policy containing details of the components of the
remuneration payments that may be made to AngloGold Ashanti’s directors (executive and non-executive). AngloGold Ashanti
must submit its directors’ remuneration policy to a binding shareholder vote every three years. Subject to the terms of the
remuneration policy, the directors or any committee authorised by the directors may decide how much to pay each director by
way of fees.
AngloGold Ashanti can pay the reasonable travel, hotel and incidental expenses of each director incurred in attending and
returning from general meetings, meetings of the directors or committees of the directors, or any other meetings which the
director is entitled to attend as a director. AngloGold Ashanti will pay all other expenses properly and reasonably incurred by
each director in connection with AngloGold Ashanti’s business or in the performance of their duties as directors.
Share Capital
Pursuant to the AngloGold Ashanti articles of association, the AngloGold Ashanti board is authorised to allot shares in AngloGold
Ashanti, and to grant rights to subscribe for or convert any security into shares in AngloGold Ashanti, up to a nominal amount of
$253,659,735 (representing approximately 60 percent of the aggregate nominal amount of AngloGold Ashanti’s issued share
capital immediately following implementation of the corporate restructuring), such authority to apply until the date that is five
years after the date of adoption of the AngloGold Ashanti articles of association. Notwithstanding the preceding sentence, the
AngloGold Ashanti articles of association provide that AngloGold Ashanti will comply with Rule 312.03(c) under the NYSE’s
Listed Company Manual (the “20% rule”). Pursuant to the 20% rule, any allotment of shares, or of securities convertible into or
exercisable for shares, that results in the issuance of 20 percent or more of either the number of shares outstanding or the voting
power outstanding before the issuance, will require shareholder approval via ordinary resolution of shareholders, other than any
such issuance that is (1) a public offering for cash or (2) another financing for cash at a price which is at least equal to the
“Minimum Price” (as defined below), other than, in the case of item (2), issuances in connection with an acquisition, when the
shares issued, combined with any other issuance in connection with the acquisition, equal or exceed 20 percent of either the
number of shares outstanding or the voting power outstanding before the issuance. “Minimum Price” is defined in accordance
with Rule 312.04 under the NYSE’s Listed Company Manual as the lower of: (i) the official closing price on the NYSE
immediately preceding the signing of the binding agreement with respect to the applicable issuance; or (ii) the average official
closing price on the NYSE for the five trading days immediately preceding the signing of the binding agreement with respect to
the applicable issuance. Authority to allot additional shares, or to allot shares after the expiry of this authority, may be granted to
the AngloGold Ashanti board by way of an ordinary resolution of the shareholders.
AngloGold Ashanti submitted a pre-transaction clearance application to HMRC in order to confirm the SDRT treatment of the
issuances of AngloGold Ashanti’s ordinary shares by AngloGold Ashanti as part of the corporate restructuring. In the event of a
future issuance of shares, AngloGold Ashanti may need to obtain a further clearance from HMRC at the relevant time.
Pre-emptive rights
English law generally provides shareholders with pre-emptive rights when new shares are issued for cash. However, it is
possible for a company’s articles of association or shareholders in a general meeting to exclude pre-emptive rights. Such an
exclusion of pre-emptive rights may be for a maximum period of five years from: (i) the date of adoption of the relevant articles of
association, if the exclusion is contained in the articles of association; or (ii) the date of the shareholder resolution, if the
exclusion is granted by shareholder resolution. In either case, this exclusion needs to be renewed by the company’s
shareholders on expiration (i.e., at least every five years), but may be sought more frequently for additional five-year periods (or
any shorter period).
Pursuant to the AngloGold Ashanti articles of association, the AngloGold Ashanti board is authorised to exclude pre-emptive
rights for a period of five years after the date of adoption of the AngloGold Ashanti articles of association in respect of the
allotment of equity securities or the sale of AngloGold Ashanti’s ordinary shares held as treasury shares for cash up to a
maximum nominal amount of $253,659,735. This authorisation under the AngloGold Ashanti articles of association will be in
addition to any power granted to the AngloGold Ashanti board by the shareholders by means of a special resolution.
Voting Rights and Restrictions on Voting
All AngloGold Ashanti’s ordinary shares have equal voting rights and all registered holders of AngloGold Ashanti’s ordinary
shares are entitled to attend and vote at all general meetings of AngloGold Ashanti. AngloGold Ashanti may issue, subject to the
restrictions discussed above under the caption “—Share Capital”, shares with preferential voting rights. This section assumes
that all shares have equal voting rights and that no preferential shares are issued.
Under English law, resolutions to be voted on by shareholders at a general meeting can be either (i) an ordinary resolution, which
means that the resolution must be passed by a simple majority of the votes cast by those entitled to vote (if the vote is by show
252
of hands) or a simple majority of the total voting rights of shareholders who (being entitled to do so) vote in person, by proxy or in
advance on the resolution (if the vote is by poll), or (ii) a special resolution, which means that the resolution must be passed by a
majority of not less than 75 percent of the votes cast by those entitled to vote (if the vote is by show of hands) or shareholders
representing not less than 75 percent of the total voting rights of the shareholders who (being entitled to do so) vote in person, by
proxy or in advance on the resolution (if the vote is by poll). For a resolution to be regarded as a special resolution, the notice of
the general meeting must specify the intention to propose the resolution as a special resolution.
For the purposes of determining which persons are entitled to attend or vote at a general meeting, AngloGold Ashanti may
specify in the notice convening the general meeting a time by which a person must be entered on the register in order to have
the right to attend or vote at the meeting.
Pursuant to the AngloGold Ashanti articles of association, any resolution put to the vote at a general meeting held partly by
means of an electronic facility will, unless the chair of the meeting directs that it will be decided on a show of hands, be decided
by way of a vote on a poll. Any such poll will be treated as having been validly demanded at the time fixed for the holding of the
meeting. If a general meeting is not held by means of an electronic facility, a resolution put to the vote at any general meeting will
be decided on a show of hands, unless a poll is demanded (in one of the manners set out below) when, or before, the chair of
the meeting declares the result of the show of hands.
A poll may be demanded by:
•the chair of the meeting;
•at least five persons at the meeting who are entitled to vote;
•one or more shareholders at the meeting who are entitled to vote (or their proxies) and who hold between them at least
ten percent of the total votes of all shareholders who have the right to vote at the meeting, provided that where a
shareholder is present by one or more proxies, each proxy will be treated as holding only the shares in respect of which
it is authorised to exercise voting rights; or
•one or more shareholders at the meeting who are entitled to vote (or their proxies) and whose shares are fully paid up
and represent at least ten percent of the total sum paid up on all shares which give the right to vote at the meeting,
provided that where a shareholder is present by one or more proxies, each proxy will be treated as holding only the
shares in respect of which it is authorised to exercise voting rights.
The chair of the meeting can also demand a poll before a resolution is put to the vote on a show of hands.
Notwithstanding the foregoing, for so long as any of AngloGold Ashanti’s ordinary shares are held in a settlement system
operated by DTC, any resolution put to the vote of a general meeting (held in whatever form) must be decided on a poll.
On a vote by way of a show of hands, each shareholder who is present at the general meeting in person and each duly
appointed proxy has one vote, except that if the proxy has been duly appointed by more than one shareholder entitled to vote
and is instructed by one or more of those shareholders to vote for the resolution and by one or more others to vote against it, or
is instructed by one or more of those shareholders to vote in one way and is given discretion as to how to vote by one or more
others (and wishes to use that discretion to vote in the other way) the proxy will then have one vote for and one vote against the
resolution.
On a vote on a resolution by way of a poll, each shareholder present in person or by proxy has one vote for every AngloGold
Ashanti share of which it is the holder.
If more than one joint shareholder votes (including voting by proxy), the only vote that will count is the vote of the person whose
name is listed before the other voters on the register for the share.
If a shareholder appoints more than one proxy and gives those proxies the apparent right to exercise votes on behalf of that
shareholder in a general meeting over more shares than are held by the shareholder, then each of the proxy forms will be invalid.
Notwithstanding the foregoing, if more than one valid proxy form is received in respect of the same share (or shares) for use at
the same meeting or poll, the one which is dated with the latest date will be treated as the valid form.
In the event Rule 14a-19 promulgated under the Exchange Act applies to AngloGold Ashanti and AngloGold Ashanti receives
proxies for disqualified or withdrawn nominees for the AngloGold Ashanti board, such votes for such disqualified or withdrawn
nominees in the proxies will be disregarded and not taken into account at any shareholders’ meeting.
Any vote or demand for a poll made under the authority of a valid proxy will be valid unless written notice has been received by
AngloGold Ashanti that (i) the person who appointed the proxy has died or is of unsound mind; (ii) the proxy form has been
253
revoked; or (iii) the authority of the person who signed the proxy form for the shareholder has been revoked. Such written notice
must be received before the deadline for when the proxy form should have been received to be valid for use.
Shareholders do not have a right to cumulative voting.
Dividends and Other Distributions
Declaring and paying dividends – Under English law, before a company can lawfully make a distribution or dividend, it must first
ensure it has sufficient distributable reserves (on a non-consolidated basis). The basic rule is that a company’s profits available
for distribution are its accumulated realised profits (which have not been previously utilised by distribution or capitalisation) less
its accumulated realised losses (which have not been previously written off in a reduction or reorganisation of capital duly made).
This requirement applies to AngloGold Ashanti and to each of AngloGold Ashanti’s subsidiaries which has been (or will be)
incorporated under English law. Dividends received by AngloGold Ashanti from its subsidiaries would contribute to its
accumulated realised profits.
Further, AngloGold Ashanti is also subject to certain capital maintenance requirements to ensure the net worth of AngloGold
Ashanti is at least equal to the amount of AngloGold Ashanti’s capital. As a public limited company, AngloGold Ashanti can only
make a distribution: (i) if, at the time that the distribution is made, the amount of its net assets (that is, the total excess of assets
over liabilities) is not less than the total of its called up share capital and distributable reserves; and (ii) if and to the extent that
the distribution itself, at the time that it is made, does not reduce the amount of AngloGold Ashanti’s net assets to less than that
total.
Subject to the foregoing, shareholders can declare dividends in accordance with their rights by passing an ordinary resolution.
No such dividend can exceed the amount recommended by the AngloGold Ashanti board. The AngloGold Ashanti board may pay
the fixed or other dividends on AngloGold Ashanti’s ordinary shares on the dates prescribed for the payment of those dividends.
The AngloGold Ashanti board may also, if the AngloGold Ashanti board considers that the financial position of AngloGold Ashanti
justifies such payment, pay interim dividends on AngloGold Ashanti’s ordinary shares on any dates and for any periods which
they decide. If the AngloGold Ashanti board acts in good faith, it will not be liable for any loss that any shareholders may suffer
because a lawful dividend has been paid on other shares which rank equally with or behind their shares, including the AngloGold
Ashanti ordinary shares.
Amount – All dividends on AngloGold Ashanti’s ordinary shares will be declared and paid in proportions based on the amounts
paid up on such shares during any period for which the dividend is paid. AngloGold Ashanti may issue shares that rank prior to
AngloGold Ashanti’s ordinary shares in respect of payment of dividends.
Interest – Unless the rights attaching to the relevant shares or the terms of issue of the relevant shares state otherwise, no
dividend or other sum payable by AngloGold Ashanti on or in respect of its shares carries a right to interest from AngloGold
Ashanti. Dividends and other sums payable on or in respect of AngloGold Ashanti’s ordinary shares will not bear interest.
Currency – Unless the rights attaching to or terms of issue of the relevant shares say otherwise, a dividend or any other money
payable in respect of a share may be paid in whatever currency the AngloGold Ashanti board decides. Dividends and other
money payable in respect of AngloGold Ashanti’s ordinary shares may be paid in any currency selected by the AngloGold
Ashanti board, although AngloGold Ashanti is expected to pay dividends and other distributions, if any, in U.S. dollars and South
African rand. The AngloGold Ashanti board may decide the rate of exchange for any currency conversions which may be
required, as well as how any costs involved (in relation to the currency of any dividend) are to be met.
Amounts due on shares can be deducted from dividends – If a shareholder owes AngloGold Ashanti any money for calls on
shares or money in any other way relating to its shares, the AngloGold Ashanti board can deduct any of this money from any
dividend or other money payable to the shareholder on or in respect of any share held by the shareholder. Money deducted in
this way can be used to pay amounts owed to AngloGold Ashanti.
Dividend not in cash – If recommended by the AngloGold Ashanti board, shareholders may, by ordinary resolution, direct and the
directors can decide (without any shareholder approval requirement) that the payment of all or any part of the dividend be
satisfied by the distribution of specific assets. The AngloGold Ashanti board can also decide that the payment of all or any part of
an interim dividend be satisfied by the distribution of specific assets. Where any difficulty arises in regard to the distribution, the
AngloGold Ashanti board may settle the same as it thinks fit.
Unclaimed dividends – Where any dividends or other amounts payable on an AngloGold Ashanti ordinary share have not been
claimed, the AngloGold Ashanti board can invest them or use them in any other way for AngloGold Ashanti’s benefit until they are
claimed. AngloGold Ashanti will not be a trustee of the money and will not be liable to pay interest on it. If a dividend or other
money has not been claimed for six years after being declared or becoming due for payment, it will be forfeited and go back to
AngloGold Ashanti unless the AngloGold Ashanti board decides otherwise.
254
Manner of payment – The AngloGold Ashanti board may elect to pay dividends solely by means of electronic transfer to an
account nominated in writing by the shareholder, or such other method as the AngloGold Ashanti board deems appropriate and
which method may be different for different shareholders or groups of shareholders. Amounts due to shareholders who provide
no, or invalid, account details will be treated as unclaimed.
AngloGold Ashanti may cease sending dividend payments in respect of any shares if these payments have been returned
undelivered to, or left uncashed by, the shareholder on at least two consecutive occasions or, if following one such occasion,
reasonable inquiries have failed to establish a shareholder’s new address. AngloGold Ashanti must recommence sending
payments for dividends payable on that share if the person(s) entitled so request and have supplied in writing a new address or
account to be used for that purpose.
Once a dividend has been paid to a shareholder, AngloGold Ashanti’s obligation in respect of such dividend will be discharged
and no person may bring a claim against AngloGold Ashanti in respect of such dividend.
Scrip Dividends – The AngloGold Ashanti board can offer holders of AngloGold Ashanti’s ordinary shares (excluding any
shareholder holding shares as treasury shares) the right to choose to receive extra AngloGold Ashanti ordinary shares, which are
credited as fully paid up, instead of some or all of their cash dividend. Before they can do this, shareholders must have passed
an ordinary resolution authorising the AngloGold Ashanti board to make this offer (in the case of both final and interim dividends).
The ordinary resolution can apply to some or all of a particular dividend or dividends, or it can apply to some or all of the
dividends which may be declared or paid in a specified period. The specified period must not end later than the third anniversary
of the date on which the ordinary resolution is passed.
Record Date – The AngloGold Ashanti board may select a date as the record date by reference to which a dividend will be
declared or paid or a distribution, allotment or issue made, and that date may be before the date on which the dividend,
distribution, allotment or issue is made or paid, including before any relevant resolution was passed.
Transferability
Any person whose AngloGold Ashanti ordinary shares are held through DTC may transfer the beneficial interest in some or all of
their AngloGold Ashanti ordinary shares to another person through DTC although the legal title to such shares will remain with
Cede & Co., as nominee for DTC.
Any shareholder holding shares in certificated form may transfer some or all of its certificated shares to another person by way of
a written instrument of transfer in the usual standard form or in any other form approved by the AngloGold Ashanti board. Any
written instrument of transfer for certificated shares must be signed or made effective in some other way by, or on behalf of, the
transferor and (in the case of a partly paid-up share) the transferee. The person transferring AngloGold Ashanti’s ordinary shares
will continue to be treated as a shareholder until the shareholder register is updated to include the name of the person to whom
the share is being transferred as the holder of that share.
As a matter of general principle, the AngloGold Ashanti board may decline to register any transfer of the legal title to any share:
•which is not a fully paid share;
•where the transfer is not lodged at the registered office or such other place as the AngloGold Ashanti board has
appointed;
•where the share transfer form is not properly stamped to show payment of any applicable stamp duty or certified or
otherwise shown to the satisfaction of the AngloGold Ashanti board to be exempt from stamp duty;
•where the transfer is not accompanied by the share certificate to which it relates (unless the transfer is being made by a
person to whom AngloGold Ashanti was not required to, and did not send, a certificate), or such other evidence as the
AngloGold Ashanti board may reasonably require to show the transferor’s right to make the transfer, or evidence of the
right of someone other than the transferor to make the transfer on the transferor’s behalf;
•where the share transfer form is used to transfer more than one class of share;
•where the number of joint holders to whom the share is to be transferred exceeds four;
•in other circumstances set out in the uncertificated securities rules; and
•in the case of shares held by an Identified Person or a Breaching Person (see “—Disclosure of interest in shares” and
“—Takeover Code” below).
255
If the AngloGold Ashanti board declines to register a transfer, it must give the transferee notice of the refusal to register the
transfer together with its reasons for the refusal.
No Fee For Registration
No fee is payable to AngloGold Ashanti for transferring shares or registering changes relating to the ownership of shares.
Redemption and Cancellation; Conversion and Redesignation
Under English law, AngloGold Ashanti may redesignate or rename a class or description of its shares by way of ordinary
resolution of the shareholders. AngloGold Ashanti may, by way of ordinary resolution of the shareholders, also redenominate its
share capital into a different currency by converting shares with a fixed nominal value in one currency into a fixed nominal value
in another currency. Following a redenomination of share capital, AngloGold Ashanti may also cancel part of its share capital by
special resolution so as to round its post-redenomination share values to a more suitable value.
Subject to any rights attaching to existing shares, AngloGold Ashanti can issue shares which can be redeemed. This can include
shares which can be redeemed if the holders want to do so, as well as shares which AngloGold Ashanti can insist on redeeming.
The AngloGold Ashanti board can decide on the terms and conditions and the manner of redemption of any redeemable share.
These terms and conditions will apply to the relevant shares as if they were set out in the AngloGold Ashanti articles of
association.
Under English law, convertible securities are typically issued with limited rights upon issue and may, in accordance with their
terms, be converted into securities “of a different description” (most often ordinary shares in the company). The conversion of the
securities may be automatic upon occurrence of a particular event, or may be an exercisable right of the holder or issuer.
Pursuant to the AngloGold Ashanti articles of association, the AngloGold Ashanti board is generally and unconditionally
authorised to convert any security into shares in AngloGold Ashanti. AngloGold Ashanti may also convert any security into shares
pursuant to an ordinary resolution.
Variation of rights
The rights attaching to any class of shares can be changed in a way provided by those rights or if no such provision is made, if
the change is approved either in writing by shareholders representing at least three quarters of the issued shares of that class by
amount (excluding any shares of that class held as treasury shares) or by a special resolution passed at a separate meeting of
the holders of the relevant class of shares. To every such separate class meeting the provisions of the AngloGold Ashanti articles
of association relating to general meetings will apply, except that (i) the quorum for any such meeting is one or more
shareholders present in person or by proxy, and who together hold at least one third in amount of the issued shares of the class
in question (excluding treasury shares) provided that where a shareholder is present by one or more proxies, each proxy will be
treated as holding only the shares in respect of which it is authorised to exercise voting rights; (ii) any shareholder who is present
in person or by proxy and entitled to vote can demand a poll; and (iii) at an adjourned meeting, the quorum will be one person
entitled to vote holding shares of the class in question (excluding treasury shares) or its proxy.
English law also confers a right of objection on shareholders who did not vote in favor of the variation – if shareholders
representing 15 percent or more of the issued shares of the relevant class apply to court to cancel the variation, the variation will
have no effect unless and until it is confirmed by the court. In such circumstances, the court may disallow the variation if it is
satisfied, having regard to all the circumstances, that the variation would unfairly prejudice the shareholders of the class being
represented by the applicant.
If new shares are created or issued which rank equally with, or subsequent to, any other existing shares, or if AngloGold Ashanti
purchases or redeems any of its own shares or makes any other return of capital on any other class of shares, the rights of the
existing shares will not be regarded as changed or abrogated unless the terms of the existing shares expressly say otherwise.
Alteration to share capital
AngloGold Ashanti may, by way of ordinary resolution of its shareholders, consolidate all or any of its share capital into shares of
larger amount per share than its existing shares, or sub-divide its shares or any of them into shares of smaller amount. Any
resolution authorising AngloGold Ashanti to subdivide any of its shares can provide that, as between the shareholders of the
divided shares, different rights (including deferred rights) and restrictions of a kind which AngloGold Ashanti can apply to new
shares can apply to different divided shares.
The UK Companies Act contains the procedural requirements for a reduction of capital. A reduction of capital must be approved
by shareholders by special resolution, and must be approved by a court. The decision to approve the reduction is at the court’s
discretion, and it will consider whether (i) the reduction is for a discernible purpose, (ii) all shareholders are treated equally, (iii)
256
the reduction has been properly explained to shareholders and (iv) AngloGold Ashanti’s creditors are safeguarded. Subject to
these requirements and to the requirements of the UK legislation, AngloGold Ashanti may reduce its share capital, its capital
redemption reserve and any share premium amount in any way.
Following completion of the corporate restructuring, AngloGold Ashanti undertook a capital reduction to create distributable
reserves.
Borrowing powers
Pursuant to the AngloGold Ashanti articles of association, the directors of AngloGold Ashanti can exercise all of the powers of
AngloGold Ashanti to: (i) borrow money; (ii) guarantee; (iii) indemnify; (iv) mortgage or charge all or any of the Company’s
undertaking, property and assets (present and future) and uncalled capital; (v) issue debentures and other securities; and (vi)
give security, either outright or as collateral security, for any debt, liability or obligation of the Company or of any third party.
Untraced shareholders
AngloGold Ashanti is entitled to sell at the best price reasonably obtainable any share held by a shareholder, or any share to
which a person is entitled by transmission of the title of such share if:
•for a period of 12 years, the shares have been in issue and at least three cash dividends have become payable
(whether interim or final) but no such dividend has been cashed or otherwise satisfied by the transfer of funds to a bank
account or through a relevant system by the shareholder or person concerned;
•AngloGold Ashanti has, after the expiration of that period, sent a notice to the last known address AngloGold Ashanti
has for the relevant shareholder stating that it intends to sell the shares; and
•AngloGold Ashanti has not, during such period and the further period of three months after sending the notice and prior
to the sale of the AngloGold Ashanti share, received any communication from the shareholder or person concerned.
The net proceeds of sale (after payment of the costs of sale) will be forfeited by the relevant holder of, or person entitled by
transmission to, the shares and will belong to AngloGold Ashanti and AngloGold Ashanti will not be liable in any respect, nor be
required to account, for such proceeds to the former holder of the shares.
General meetings and notices
Under English law, AngloGold Ashanti is required to hold an annual general meeting of its shareholders within six months of the
end of its fiscal year. Shareholders may also request that AngloGold Ashanti convene a general meeting. If AngloGold Ashanti
receives a request to hold a general meeting from a shareholder or shareholders representing at least five percent of the voting
rights of AngloGold Ashanti (excluding any voting rights attached to treasury shares) then the AngloGold Ashanti board must call,
and give notice of, a general meeting within 21 days of receiving the request. The general meeting must then be held within 28
days of the notice being given.
An annual general meeting must be called by not less than 21 clear days’ notice (i.e., excluding the deemed date of receipt of the
notice and the date of the meeting itself). All other general meetings may be called by not less than 14 clear days’ notice if: (a)
AngloGold Ashanti offers an electronic voting facility; and (b) a special resolution reducing the notice period to not less than 14
days clear days has been passed by shareholders at the most recent annual general meeting or a general meeting held since
the most recent annual general meeting. Notice of a meeting must be given to every shareholder and director of AngloGold
Ashanti and AngloGold Ashanti’s auditors.
Under English law, shareholders holding five percent of the shares or at least 100 shareholders who hold an average (per
shareholder) of paid up capital of at least £100 have the right to include resolutions in the notice for an AngloGold Ashanti annual
general meeting provided the resolution may be properly moved at the annual general meeting. A resolution may be properly
moved at a general meeting unless (i) it would, if passed, be ineffective (whether by reason of inconsistency with any enactment
or the AngloGold Ashanti articles of association or otherwise), (ii) it is defamatory of any person or (iii) it is frivolous or vexatious.
The AngloGold Ashanti articles of association impose requirements with respect to the content of any shareholder notice to either
(i) request a general meeting for the purposes of proposing a resolution or (ii) propose a resolution for a general meeting. The
provisions require the notice to include (without limitation) the reasons for proposing such resolution or requesting such general
meeting and matters relating to the identity of the relevant person requisitioning the resolution and certain associated persons
(including those acting in concert), and their respective interests in AngloGold Ashanti, any arrangements between the
requisitioning person and its associated persons or with any other person in connection with the proposed resolution and other
information that may be required to be disclosed in (i) a proxy statement or other filings required to be made in connection with
solicitations of proxies pursuant to Section 14 of the Exchange Act (whether or not Regulation 14A under the Exchange Act
257
applies to AngloGold Ashanti) or (ii) a Schedule 13D filed pursuant to Rule 13d-1(a) or an amendment pursuant to Rule 13d-2(a)
if such a statement were required to be filed under the Exchange Act and the rules and regulations promulgated thereunder.
Additionally, the AngloGold Ashanti articles of association impose requirements as to when such notices must be delivered. The
provisions require the person requisitioning a resolution to be put to an annual general meeting (other than a resolution to
remove a director in accordance with the requirements of English law) to deliver any such request in writing to the registered
office of AngloGold Ashanti, marked for the attention of “The Company Secretary”, not less than 90 nor more than 120 days
before the day prior to the date of the first anniversary of the preceding year’s annual general meeting, provided, however, that in
the event that the date of an annual general meeting is more than thirty calendar days before or more than sixty calendar days
after the date of the first anniversary of the preceding year’s annual general meeting, notice by the relevant shareholder must be
so delivered in writing not earlier than the close of business on the 120th calendar day prior to the scheduled date for such
annual general meeting and not later than the close of business on the later of (i) the 90th calendar day prior to the scheduled
date for such annual general meeting and (ii) the 10th calendar day after the day on which public announcement of the date of
such annual general meeting is first made by AngloGold Ashanti. In no event will any adjournment or postponement of an annual
general meeting or the announcement thereof commence a new time period for the delivery of a notice or request. In relation to
the first annual general meeting of AngloGold Ashanti occurring after 1 January 2024, references to the anniversary date of the
preceding year’s annual general meeting will be to 15 May 2023.
The AngloGold Ashanti articles of association impose further requirements with respect to the content of a shareholder notice
submitted by a shareholder nominating a director for election. The notice must include, among other things, information
regarding any voting commitments or compensation arrangements of such nominee, as well as material relationships of the
person requisitioning the resolution and/or certain associated persons and the nominee and any other information that may be
required to be disclosed in connection with solicitations of proxies for the election of such director, or is otherwise required, in
each case pursuant to Regulation 14A under the Exchange Act (whether or not Regulation 14A under the Exchange Act applies
to AngloGold Ashanti). The above must be provided within the timeframes specified for requisitioning shareholder proposals.
If the person requisitioning a resolution fails to comply with the notice requirements set out in the AngloGold Ashanti articles of
association (which shall be determined by AngloGold Ashanti), AngloGold Ashanti will not be obliged to put the resolution to the
annual general meeting (and such resolution may not be properly moved at the annual general meeting) or to call the general
meeting.
An Identified Person or a Breaching Person (see “—Disclosure of interest in shares” and “—Takeover Code” below) will not be
entitled to requisition that a resolution be put to an annual general meeting or to requisition that AngloGold Ashanti calls a
general meeting.
If Rule 14a-19 promulgated under the Exchange Act applies to AngloGold Ashanti,
•for any shareholder nominating a person for appointment as director to the AngloGold Ashanti board (and the beneficial
owner, if any, on whose behalf the nomination is being made), such letter must include a representation that the
shareholder giving notice and/or beneficial owner will, to the extent any proxies in support of director nominees other
than AngloGold Ashanti’s nominees are solicited, (a) solicit proxies from holders of AngloGold Ashanti’s outstanding
shares representing at least 67 percent of the voting power of shares entitled to vote on the election of directors, (b)
include a statement to that effect in its proxy statement and/or the proxy form, (c) otherwise comply with Rule 14a-19
promulgated under the Exchange Act and (d) provide the secretary of AngloGold Ashanti not less than five days prior to
the meeting or any adjournment, rescheduling or postponement thereof, with reasonable documentary evidence (as
determined by the secretary of AngloGold Ashanti in good faith) that such shareholder and/or beneficial owner complied
with such representations;
•if a shareholder providing notice and/or beneficial owner that intends to solicit proxies in support of director nominees
other than AngloGold Ashanti’s nominees no longer intends to solicit proxies in accordance with its representation
pursuant to the above requirements, such shareholder and/or beneficial owner will inform AngloGold Ashanti of this
change by delivering a writing to the secretary of AngloGold Ashanti no later than two business days after the
occurrence of such change; and
•if a shareholder and/or beneficial owner providing such notice is not in compliance with such representations and the
AngloGold Ashanti articles of association, no action will be taken on such nomination and such nominee will be deemed
disqualified, notwithstanding that proxies in respect of such nominee may have been received by AngloGold Ashanti.
Pursuant to the AngloGold Ashanti articles of association, if at a general meeting of AngloGold Ashanti, the number of directors
approved to be appointed will exceed the maximum number of directors set out in the AngloGold Ashanti articles of association,
the first 20 directors approved to be appointed at the general meeting will be so appointed and no further directors will be
appointed at such meeting.
A notice of meeting will specify: (i) the time, date and place of the meeting (including any satellite meeting place, identified as
such in the notice); (ii) the general nature of the business to be dealt with; (iii) whether the meeting is an annual general meeting;
and (iv) if any special resolutions have been proposed by the AngloGold Ashanti board.
258
The quorum for a general meeting is at least one or more shareholders present in person or by proxy who together hold at least
25 percent of the issued shares (excluding any shares held as treasury shares), provided that where a shareholder is present at
the meeting by one or more proxies, each proxy will be treated as holding only the shares in respect of which it is authorised to
exercise voting rights. The shareholders making up the quorum can be shareholders who are personally present or proxies for
shareholders or a combination of both.
If the AngloGold Ashanti board considers that it is impracticable or undesirable to hold a general meeting, whether generally or
on the date or at the time or place, or otherwise considers it appropriate to change other arrangements in relation to a general
meeting, it can move or postpone the meeting or change, cancel or introduce any electronic facility or make other changes in
respect of the meeting (or do any of these things). If a meeting is rearranged in this way, proxy forms are valid if they are
received as required by the AngloGold Ashanti articles of association not less than 48 hours before the time of the rearranged
meeting.
Annual accounts
Under English law, AngloGold Ashanti must deliver to the UK Registrar of Companies a copy of:
•AngloGold Ashanti’s annual accounts;
•the directors’ remuneration report;
•the directors’ report;
•a strategic report; and
•the auditor’s report on those accounts, the auditable part of the directors’ remuneration report, the directors’ report and
the strategic report.
The annual reports and accounts must be presented to shareholders at a general meeting. Copies of the annual accounts and
reports must, unless a shareholder agrees to receive more limited information in accordance with the UK Companies Act, be sent
to shareholders, debenture holders and everyone entitled to receive notice of general meetings at least 21 days before the date
of the meeting at which copies of the documents are to be presented. English law allows AngloGold Ashanti to distribute such
documents in electronic form or by means of a website, provided that the AngloGold Ashanti articles of association contain
provisions to that effect and individual consent has been obtained from each shareholder to receive such documents in electronic
form or by means of a website. The AngloGold Ashanti articles of association provide that such documents may be distributed in
electronic form or by means of a website.
AngloGold Ashanti must appoint an independent auditor to report on the annual accounts of AngloGold Ashanti. The auditor is
usually appointed by ordinary resolution at the general meeting of AngloGold Ashanti at which AngloGold Ashanti’s annual
accounts are laid. The AngloGold Ashanti board can also appoint auditors at any time to fill a casual vacancy.
The remuneration of an auditor is fixed by the shareholders by ordinary resolution or in a manner that the shareholders by
ordinary resolution determine.
Squeeze-out
Under English law, where a takeover offer has been made for AngloGold Ashanti and the offeror has acquired or unconditionally
contracted to acquire 90 percent or more in value of the shares to which the offer relates and 90 percent or more of the voting
rights carried by those shares, the offeror may give notice to the holder of any shares to which the offer relates which the offeror
has not acquired or unconditionally contracted to acquire, stating that it wishes to acquire, and is entitled to compulsorily acquire,
the outstanding shares on the same terms as the general takeover offer.
A dissenting shareholder may then object to the transfer on the basis that the compulsory acquisition would constitute unfair
prejudice (typically on the grounds that the offeror is not entitled to acquire shares or that the terms of acquisition should be
different to those offered) by application to court within six weeks of the date on which notice of mandatory transfer was given.
Absent any fraud or oppression, the court is unlikely to order that the mandatory acquisition will not take effect, although it may
specify terms of the transfer that it finds to be appropriate.
Such notice must be sent within three months of the last day on which the offer can be accepted in the prescribed manner. The
squeeze-out of the minority shareholders can be completed at the end of six weeks from the date the notice has been given,
subject to the minority shareholders failing to successfully lodge an application to court to prevent such squeeze-out any time
prior to the end of those six weeks. Following this period, the offeror can execute a transfer of the outstanding shares in its favour
and pay the consideration to AngloGold Ashanti to hold in trust for the outstanding minority shareholders. The consideration
offered to the outstanding minority shareholders whose shares are compulsorily acquired must, in general, be the same as the
consideration that was available under the takeover offer.
259
Sell-out
English law also gives outstanding minority shareholders a right to be bought out in certain circumstances by an offeror who has
made a takeover offer for all of a target’s shares. A holder of shares to which the offer relates, and who has not otherwise
accepted the offeror’s offer, may require the offeror to acquire its shares if, prior to the expiry of the acceptance period for such
offer, the offeror has acquired or unconditionally agreed to acquire (i) 90 percent or more in value of the target’s shares, and (ii)
90 percent or more of the voting rights carried by those shares. The offeror must notify the outstanding minority shareholders of
their sell-out right within one month of the above thresholds being met, and the outstanding minority shareholders then have
three months from the end of the offer period (or, if later, from the date of the notice from the offeror) to exercise their sell-out
rights. Should a shareholder exercise its right to be bought out, the offeror is required to acquire such shareholder’s shares on
the terms of the general takeover offer or on such other terms as may be agreed.
Disclosure of interest in shares
Under English law, AngloGold Ashanti is empowered to give notice in writing to any person whom it knows or has reasonable
cause to believe to have an interest in its shares, or to have had an interest at any time during the three years immediately
preceding the date on which the notice is issued, requiring such person, within a reasonable period and in any event within 14
days, to disclose to AngloGold Ashanti particulars of the person’s interest and (so far as is within its knowledge) particulars of any
other interest that subsists or subsisted in those shares.
Pursuant to the AngloGold Ashanti articles of association, AngloGold Ashanti will have powers to impose restrictions on any
person who defaults in supplying AngloGold Ashanti with the required particulars within the prescribed period (an “Identified
Person”), including (i) restricting the Identified Person’s ability to attend, either personally or by proxy, a shareholders’ meeting,
(ii) disregarding any votes cast or purported to be cast by or on behalf of such Identified Person (or any person acting in concert
with them), (iii) restricting the ability of such Identified Person to requisition a resolution at an annual general meeting and/or to
call a general meeting, (iv) withholding any dividends on any shares held by such Identified Person, and (v) refusing to register
any transfer of shares held by such Identified Person or any person acting in concert with them (unless the AngloGold Ashanti
directors are satisfied that the transfer is to an independent third party).
Moreover, pursuant to the AngloGold Ashanti articles of association, where the Identified Person is not a shareholder, AngloGold
Ashanti has the power to require the shareholder holding the shares in which the Identified Person is interested to transfer, at
AngloGold Ashanti’s discretion, such shares to the Identified Person or to such other nominee as AngloGold Ashanti may
determine in its sole discretion for nil consideration and on such other terms and conditions as AngloGold Ashanti may determine
and AngloGold Ashanti is appointed as the shareholder’s attorney for this purpose. This provision does not apply to any of
AngloGold Ashanti’s ordinary shares that are held through DTC.
If AngloGold Ashanti decides to exercise any of the enforcement powers described above, it will send out a notice to the
Identified Person notifying them of such and the exercise of such powers will not be effective until such notice has been
delivered.
Disclosure of significant share ownership
Pursuant to the AngloGold Ashanti articles of association and subject to certain exemptions, a person must notify AngloGold
Ashanti in the event that the percentage of the voting rights in AngloGold Ashanti held by such person reaches, exceeds or falls
below (i) three percent, four percent, five percent and (ii) each one percent threshold thereafter up to 100 percent, whether as a
result of an acquisition or disposal of shares or as a result of a change in voting rights attaching to the shares. The notification
must be made within two days of the day on which the notification requirement arises.
Purchase of own shares
AngloGold Ashanti may purchase its own shares out of distributable profits or the proceeds of a fresh issue of shares made by it
for the purposes of financing such purchase. However, AngloGold Ashanti may not purchase its own shares if, as a result of the
purchase, there would no longer be any shares of AngloGold Ashanti left in issue other than redeemable shares and/or shares
held as treasury shares. Shares must be fully paid in order to be repurchased.
AngloGold Ashanti will require shareholder authority in order to purchase its own shares, which will be periodically sought at
each annual general meeting. Such shareholder authority must specify the maximum number of AngloGold Ashanti shares that
may be repurchased pursuant to it and the minimum and maximum price that may be paid for such shares. In addition,
AngloGold Ashanti may only purchase its own shares otherwise than on a recognised investment exchange if it does so pursuant
to a contract authorised by an ordinary resolution of its shareholders before the purchase takes place. The shareholder authority
will not be effective if any shareholder(s) from whom AngloGold Ashanti proposes to purchase its own shares votes on the
resolution, and the resolution would not have passed if they had not so voted. The resolution authorising the purchase must
260
specify a date on which the authority to purchase will expire, such date not being later than five years after the passing of the
relevant shareholder resolution.
If purchased out of distributable profits, any shares that have been repurchased may be held as treasury shares or, if not so held,
must be cancelled immediately upon the completion of the purchase, thereby reducing the amount of AngloGold Ashanti’s issued
share capital. If purchased from the proceeds of a new issue of shares, they must be cancelled immediately upon completion of
the purchase.
Liquidation
The liquidation of an English company is a statutory process governed by the UK Insolvency Act 1986, where assets of the
company are realised for the benefit of creditors or shareholders and the company is dissolved. Liquidation may be voluntary,
where it is initiated by shareholders, or compulsory, where it is typically initiated by creditors and approved by the court.
There are two types of voluntary liquidation: a shareholders’ voluntary liquidation and a creditors’ voluntary liquidation. Each is
instigated by a special resolution of the shareholders and cannot be initiated by creditors directly. The essential difference is that
a shareholders’ voluntary liquidation applies to solvent companies and a creditors’ voluntary liquidation applies to insolvent
companies. Accordingly, voluntary liquidation is not always an insolvency procedure.
If AngloGold Ashanti is in liquidation, AngloGold Ashanti’s liquidator may, amongst other things, divide among shareholders
(excluding holders of treasury shares) in specie or in kind the whole or any part of AngloGold Ashanti’s assets (whether or not the
assets consist of property of one kind or consist of properties of different kinds and the liquidator may for such purpose set such
value as the liquidator deems fair upon any one or more class or classes of property and may determine how such division will
be carried out as between the holders of AngloGold Ashanti’s ordinary shares or different classes of shareholders), or vest all or
any part of such assets in trustees upon such trusts for the benefit of shareholders as the liquidator determines (and the
liquidation of AngloGold Ashanti may thereby be closed and AngloGold Ashanti thereby dissolved), but no shareholder will be
compelled to accept any shares or other assets upon which there is any liability or potential liability.
Upon a winding-up of AngloGold Ashanti, the holders of AngloGold Ashanti’s ordinary shares will be entitled to the whole of any
surplus assets remaining after AngloGold Ashanti’s liabilities have been satisfied and will share equally on a share for share
basis in AngloGold Ashanti’s assets remaining for distribution to the holders of AngloGold Ashanti’s ordinary shares.
Compromises and arrangements
Where AngloGold Ashanti and its creditors or shareholders or a class of either of them propose a compromise or arrangement
between AngloGold Ashanti and its creditors or its shareholders or a class of either of them (as applicable), the High Court of
Justice in England and Wales may order a meeting of the creditors or class of creditors or of the shareholders or class of
shareholders (as applicable) to be called in such manner as the court may direct. Any compromise or arrangement approved by
a majority in number present and voting at the meeting representing 75 percent or more in value of the creditors or 75 percent or
more of the voting rights of shareholders or class of either of them (as applicable), if sanctioned by the court, is binding upon
AngloGold Ashanti and all the creditors, shareholders of the specific class of either of them (as applicable).
Whether the capital of AngloGold Ashanti is to be treated as being a single class or divided into multiple classes of shares is a
matter to be determined by the court. The court may, in its discretion, treat a single class of shares as multiple classes, or
multiple classes of shares as a single class, for the purposes of the above shareholder approval taking into account all relevant
circumstances, which may include certain circumstances other than the rights attached to the shares themselves.
Disclosure and Takeovers
Takeover Code – The UK City Code on Takeovers and Mergers (the “Takeover Code”) aims to ensure fair treatment for all
shareholders and to provide an orderly framework for takeover bids in the United Kingdom.
The Takeover Code, applies to, among other things, an offer for a public limited company which has its registered office in the
United Kingdom and which is considered by the Panel on Takeovers and Mergers (the “UK Takeover Panel”) (an independent
body whose main functions are to administer the Takeover Code and regulate takeovers to which the Takeover Code applies) to
have its place of central management and control in the United Kingdom, the Channel Islands or the Isle of Man. This is the
“residency test”.
Under the Takeover Code, the UK Takeover Panel will determine whether AngloGold Ashanti has its place of central
management and control in the United Kingdom, the Channel Islands or the Isle of Man by looking at, in the first instance,
whether a majority of the AngloGold Ashanti directors are resident in the United Kingdom, the Channel Islands or the Isle of Man.
If a majority of the AngloGold Ashanti directors are so resident, then the “residency test” will normally be satisfied.
261
If at the time of a takeover offer, the UK Takeover Panel determines that the residency test is satisfied, AngloGold Ashanti would
be subject to the jurisdiction of the Takeover Code which sets out a number of rules and restrictions, including the following:
•AngloGold Ashanti’s ability to enter into deal protection arrangements with a bidder would be limited;
•AngloGold Ashanti might not, without the approval of its shareholders, be able to perform certain actions that could have
the effect of frustrating an offer, such as issuing shares or carrying out material acquisitions or disposals; and
•AngloGold Ashanti would be obliged to provide equality of information to any competing offerors or bona fide potential
offerors.
Following completion of the corporate restructuring, a majority of the AngloGold Ashanti directors are resident outside of the
United Kingdom, the Channel Islands and the Isle of Man. Based on its current and intended plans for the AngloGold Ashanti
board and management, AngloGold Ashanti anticipates that the residency test will not be met under the Takeover Code and
accordingly the Takeover Code should not apply to AngloGold Ashanti. However, it is possible that future changes in the
AngloGold Ashanti board’s composition, changes in the UK Takeover Panel’s interpretation of the Takeover Code, or other
events may result in AngloGold Ashanti falling within the jurisdiction of the Takeover Code.
Notwithstanding that the Takeover Code does not currently apply to AngloGold Ashanti, the AngloGold Ashanti articles of
association incorporate a number of provisions based on provisions under the Takeover Code which provisions will apply for so
long as the Takeover Code does not apply to AngloGold Ashanti, including the following.
Acquisitions of shares – When a person (other than a depositary, custodian or nominee in their capacity as such) who, together
with persons acting in concert with it, is interested in shares which:
•in the aggregate carry less than 30 percent of the voting rights of AngloGold Ashanti, such person may not acquire an
interest which (taken together with shares in which such person or persons acting in concert with such person are
interested) would carry 30 percent or more of the voting rights of AngloGold Ashanti; or
•in the aggregate carry not less than 30 percent and not more than 50 percent of the voting rights in AngloGold Ashanti,
such person may not acquire an interest in any other shares in AngloGold Ashanti,
in each case, except in certain circumstances set out in the AngloGold Ashanti articles of association, including in the case of an
acquisition with the prior consent of AngloGold Ashanti.
Mandatory offers – If a person (other than a depositary, custodian or nominee in their capacity as such):
•acquires an interest in AngloGold Ashanti’s shares that, when taken together with shares in which such person or
persons acting in concert with such person are interested, carry 30 percent or more of the voting rights of AngloGold
Ashanti; or
•is, together with persons acting in concert with such person, interested in shares that in the aggregate carry not less
than 30 percent and not more than 50 percent of the voting rights in AngloGold Ashanti and such person, or any person
acting in concert with such person, acquires additional interests in shares that increase their voting rights in AngloGold
Ashanti,
that person would be required (except in certain circumstances set out in the AngloGold Ashanti articles of association, including
with the prior consent of AngloGold Ashanti) to make a cash offer (or an offer with a cash alternative) to the holders of all the
issued (and to be issued) shares in AngloGold Ashanti at a price that is not less than the highest price paid for any interests in
the shares acquired by the offeror or its concert parties during the preceding 12 months, and otherwise in accordance with the
requirements for such an offer set out in the AngloGold Ashanti articles of association.
Save with the prior consent of AngloGold Ashanti, no acquisition of any interest in shares in AngloGold Ashanti which would give
rise to a mandatory offer requirement under the AngloGold Ashanti articles of association may be made if the making or
implementation of such offer would or might be dependent on the passing of a resolution at any meeting of shareholders of the
offeror or upon any other conditions, consents or arrangements (save that the offer may be conditional on the offeror having
received acceptances resulting in the offeror holding shares carrying more than 50 percent of the voting rights in AngloGold
Ashanti).
Voluntary offers – Any voluntary offer for shares in AngloGold Ashanti will not be made on less favourable terms than the terms
on which the offeror (or any person acting in concert with it) has acquired interests in shares in AngloGold Ashanti during the
offer period, within the three month period prior to the commencement of the offer period, or at such earlier time if AngloGold
Ashanti considers that there are circumstances which render such a course necessary in order to ensure that all shareholders,
and other persons with an interest in AngloGold Ashanti’s shares, are treated equally.
262
The offer must be made in cash or with a cash alternative where:
•during the offer period and within the 12-month period prior to its commencement, the offeror (together with any person
acting in concert with it) has acquired for cash an interest in shares which represents ten percent or more of the shares
of that class in issue, in which case the offer for that class will be in cash or accompanied by a cash alternative at not
less than the highest price paid by the offeror or any person acting in concert with it for any interest in shares of that
class acquired during the offer period and within 12 months prior to its commencement;
•during the offer period, the offeror (together with any person acting in concert with it) acquires any interest in shares for
cash, in which case the offer for that class will be in cash or accompanied by a cash alternative at not less than the
highest price paid by the offeror or any person acting in concert with it for any interest in shares of that class acquired
during the offer period; or
•AngloGold Ashanti considers that there are circumstances which render a cash offer or cash alternative necessary in
order to ensure that all shareholders, and other persons with an interest in AngloGold Ashanti’s shares, are treated
equally.
Each of the above requirements may be disapplied with the consent of AngloGold Ashanti.
Where the offeror (or any person acting in concert with the offeror) has acquired an interest in ten percent or more of any class of
shares in AngloGold Ashanti in exchange for securities in the three month period prior to the commencement of and during the
offer period, equivalent securities should be offered to all other holders of shares of that class under the offer, except in the case
of prior consent of AngloGold Ashanti.
Any offer must be open for acceptance for a period of not less than 21 days and, if the offer becomes or is declared
unconditional, the offer must remain open for not less than 14 days and the offeror must give at least 14 clear days’ notice before
the offer is closed.
It must also be a condition of any offer which, if accepted in full, would result in the offeror holding shares carrying over 50
percent of the voting rights of AngloGold Ashanti, that the offer will not become or be declared unconditional as to acceptances
unless the offeror has acquired or agreed to acquire shares carrying at least 50 percent of the voting rights, except in the case of
prior consent of AngloGold Ashanti.
Save with the prior consent of AngloGold Ashanti, an offer must not be subject to any conditions or pre-conditions which depend
solely on subjective judgements by the offeror or its directors or the fulfilment of which is in their hands and an offer must not be
made subject to a condition or pre-condition relating to financing. Notwithstanding the foregoing, if an offer is for cash or includes
a cash element and the offeror proposes to finance the cash consideration by an issue of new securities, the offer must be made
subject to any condition required, as a matter of law or regulatory requirement, in order validly to issue such securities or to have
them listed or admitted to trading.
Partial offers – AngloGold Ashanti consent is required for any offer which would constitute a partial offer under the Takeover
Code.
Disclosure requirements – The offeror must notify AngloGold Ashanti of any interest it (together with any person acting in concert
with the offeror) holds in the shares of AngloGold Ashanti within two business days of any announcement that first identifies it as
an offeror. Within 28 days of any announcement that first identifies it as an offeror, an offeror must either (i) announce its firm
intention to make an offer or (ii) announce that it does not intend to make an offer. If the offeror or any person acting in concert
with the offeror deals in any interests in shares of AngloGold Ashanti during an offer period, it must notify AngloGold Ashanti of
such dealing by no later than 12 p.m. (London time) on the business day following such dealing. For more information on
disclosure requirements in connection with share ownership, see “—Disclosure of significant share ownership”.
Non-compliance – Under the AngloGold Ashanti articles of association, AngloGold Ashanti will have powers to impose
restrictions on any person who fails to comply with the provisions described above relating to mandatory and voluntary offers
(and persists in such failure for 14 days after the date of service of a notice by AngloGold Ashanti on such person) or any person
acting in concert with them (a “Breaching Person”), including (i) restricting the Breaching Person’s ability to attend, either
personally or by proxy, a shareholders’ meeting, (ii) disregarding any votes cast or purported to be cast by or on behalf of such
Breaching Person, (iii) restricting the ability of such Breaching Person to requisition a resolution at an annual general meeting
and/or to call a general meeting, (iv) withholding any dividends on any shares held by such Breaching Person and (v) refusing to
register any transfer of shares held by such Breaching Person (unless the AngloGold Ashanti directors are satisfied that the
transfer is to an independent third party).
Moreover, where the Breaching Person is not a shareholder, AngloGold Ashanti has the power to require the shareholder holding
the shares in which the Breaching Person is interested to transfer, at AngloGold Ashanti’s direction, such shares to the Breaching
Person or to such other nominee as AngloGold Ashanti may determine in its sole discretion for nil consideration and on such
263
other terms and conditions as AngloGold Ashanti may determine, and AngloGold Ashanti is appointed as the shareholder’s
attorney for this purpose. This provision does not apply to any of AngloGold Ashanti’s ordinary shares that are held through DTC.
AngloGold Ashanti has full authority to determine the application of the offer provisions embedded in the AngloGold Ashanti
articles of association including as to the deemed application of relevant parts of the Takeover Code (as if it applied to AngloGold
Ashanti).
AngloGold Ashanti’s consent is required for any offer for interests in shares in AngloGold Ashanti that (i) purports to exclude U.S.
jurisdictional means; or (ii) is conducted in accordance with Rule 14d-1(c) (Tier I exemption) or Rule 14d-1(d) (Tier II exemption)
under the Exchange Act, or any successor provisions thereof.
The AngloGold Ashanti articles of association do not include all of the protections provided by the Takeover Code.
The AngloGold Ashanti articles of association include provisions that are intended to replicate certain provisions of the Takeover
Code relating to takeover offers and related protections afforded to a company and its shareholders. In the absence of the
jurisdiction of the UK Takeover Panel, the AngloGold Ashanti articles of association specify that the provisions embedded therein
are to be enforced by AngloGold Ashanti (as opposed to the UK Takeover Panel). AngloGold Ashanti may face challenges when
enforcing certain of these provisions against beneficial owners holding their shares through DTC.
Exchange controls
See “Item 10D: Exchange Controls”.
No sinking fund
AngloGold Ashanti’s ordinary shares have no sinking fund provisions.
Jurisdiction
The AngloGold Ashanti articles of association provide that:
•any proceeding, suit or action (other than those arising under the Securities Act or the Exchange Act) between (i) a
shareholder or a beneficial owner (in its capacity as such) and AngloGold Ashanti and/or AngloGold Ashanti’s directors
arising out of or in connection with the AngloGold Ashanti articles of association or otherwise, and/or (ii) to the fullest
extent permitted by law, between AngloGold Ashanti and its directors (in their capacities as such or as employees of
AngloGold Ashanti), including all claims made by or on behalf of AngloGold Ashanti against its directors, may only be
brought in the courts of England and Wales;
•the AngloGold Ashanti articles of association are governed by the laws of England and Wales; and
•unless AngloGold Ashanti by ordinary resolution consents to the selection of an alternative forum, the federal district
courts of the United States of America will be the exclusive forum for the resolution of any proceeding, suit or action
arising under the Securities Act or the Exchange Act.
U.S. Securities Laws Disclosures
AngloGold Ashanti is currently subject to the periodic reporting requirements of the SEC and the NYSE that apply to “foreign
private issuers”. The periodic disclosure required of foreign private issuers under applicable rules is more limited than the
periodic disclosure required of U.S. issuers. For example, AngloGold Ashanti is not required to publish reviewed financial
statements and analyses of operating and financial results for the quarters ended March 31 and September 30 each year. If
AngloGold Ashanti avails itself of exemptions afforded to foreign private issuers, investors will receive less timely financial reports
than they otherwise might receive from a comparable U.S. company or from certain of the company’s peers in the industry. This
may have an adverse impact on investors’ ability to make decisions about their investment in AngloGold Ashanti.
Further, AngloGold Ashanti is subject to the beneficial ownership reporting requirements of the Exchange Act. Sections 13(d) and
13(g) of the Exchange Act and Regulation 13D-G thereunder require an investor with beneficial ownership of more than five
percent of a covered class of equity securities to report such beneficial ownership on a publicly filed Schedule 13D or Schedule
13G. A “covered class” generally means, with limited exceptions, a voting class of equity securities registered under Section 12
of the Exchange Act
Differences in Corporate Law
The applicable provisions of the UK Companies Act differ from laws applicable to U.S. corporations and their shareholders. Set
forth below is a summary of certain differences between the provisions of the UK Companies Act applicable to us and the
General Corporation Law of the State of Delaware relating to shareholders’ rights and protections. This summary is not intended
264
to be a complete discussion of the respective rights and it is qualified in its entirety by reference to Delaware law and the laws of
England and Wales.
England and Wales | Delaware | |||
Number of Directors | Under the UK Companies Act, a public limited company must have at least two directors and the number of directors may be fixed by or in the manner provided in a company’s articles of association. | Under Delaware law, a corporation must have at least one director and the number of directors shall be fixed by or in the manner provided in the bylaws. | ||
Removal of Directors | Under the UK Companies Act, shareholders may remove a director without cause by an ordinary resolution (which is passed by a simple majority of those voting in person or by proxy at a general meeting) irrespective of any provisions of any service contract the director has with the company, provided 28 clear days’ notice of the resolution has been given to the company and its shareholders. On receipt of notice of an intended resolution to remove a director, the company must forthwith send a copy of the notice to the director concerned. Certain other procedural requirements under the UK Companies Act must also be followed, such as allowing the director to make representations against his or her removal either at the meeting or in writing. | Under Delaware law, any director or the entire board of directors may be removed, with or without cause, by the holders of a majority of the shares then entitled to vote at an election of directors, except (i) unless the certificate of incorporation provides otherwise, in the case of a corporation whose board of directors is classified, stockholders may effect such removal only for cause, or (ii) in the case of a corporation having cumulative voting, if less than the entire board of directors is to be removed, no director may be removed without cause if the votes cast against such director’s removal would be sufficient to elect such director if then cumulatively voted at an election of the entire board of directors, or, if there are classes of directors, at an election of the class of directors of which such director is a part. | ||
Vacancies on the Board of Directors | Under English law, the procedure by which directors, other than a company’s initial directors, are appointed is generally set out in a company’s articles of association, provided that where two or more persons are appointed as directors of a public limited company by resolution of the shareholders, resolutions appointing each director must be voted on individually, unless at the meeting of the shareholders during which the directors are proposed to be appointed, a unanimous resolution is first passed that two or more directors may be appointed by a single resolution. | Under Delaware law, vacancies and newly created directorships may be filled by a majority of the directors then in office (even though less than a quorum) or by a sole remaining director unless (i) otherwise provided in the certificate of incorporation or bylaws of the corporation or (ii) the certificate of incorporation directs that a particular class of stock is to elect such director, in which case a majority of the other directors elected by such class, or a sole remaining director elected by such class, will fill such vacancy. | ||
Annual General Meeting | Under the UK Companies Act, a public limited company must hold an annual general meeting in each six-month period beginning with the day following the company’s annual accounting reference date. | Under Delaware law, the annual meeting of stockholders shall be held at such place, on such date and at such time as may be designated from time to time by the board of directors or as provided in the certificate of incorporation or by the bylaws. | ||
General Meeting | Under the UK Companies Act, a general meeting of the shareholders of a public limited company may be called by the directors. Shareholders holding at least 5% of the paid-up capital of the company carrying voting rights at general meetings (excluding any paid-up capital held as treasury shares) can require the directors to call a general meeting. If the directors fail to call a general meeting within a certain period, the requisitioning shareholders (or any of them representing more than half of the total voting rights of the shareholders requisitioning the meeting) may themselves convene a general meeting. | Under Delaware law, special meetings of the stockholders may be called by the board of directors or by such person or persons as may be authorised by the certificate of incorporation or by the bylaws. |
265
Notice of General Meetings | Subject to a company’s articles of association providing for a longer period, under the UK Companies Act, (i) at least 21 days’ notice must be given for an annual general meeting and any resolutions to be proposed at the meeting and (ii) at least 14 days’ notice is required for any other general meeting of a public limited company. In addition, certain matters, such as the removal of directors or auditors, require special notice, which is 28 days’ notice. The shareholders of a company may in all cases consent to a shorter notice period, the proportion of shareholders’ consent required being 100% of those entitled to attend and vote in the case of an annual general meeting and, in the case of any other general meeting, a majority in number of the members having a right to attend and vote at the meeting, being a majority who together hold not less than 95% in nominal value of the shares giving a right to attend and vote at the meeting. | Under Delaware law, unless otherwise provided in the certificate of incorporation or bylaws, written or electronic notice of any meeting of the stockholders must be given to each stockholder entitled to vote at the meeting not less than ten nor more than 60 days before the date of the meeting and shall specify the place, date, hour and purpose or purposes of the meeting. | ||
Quorum | Subject to the provisions of a company’s articles of association, the UK Companies Act provides that two “qualifying persons” present at a meeting (in person, by proxy or authorised representative under the UK Companies Act (provided that the proxies and/or authorised representatives, represent different shareholders) shall constitute a quorum for companies with more than one shareholder. | The certificate of incorporation or bylaws may specify the number of shares, the holders of which shall be present or represented by proxy at any meeting in order to constitute a quorum, but in no event shall a quorum consist of less than one-third of the shares entitled to vote at the meeting. In the absence of such specification in the certificate of incorporation or bylaws, a majority of the shares entitled to vote, present in person or represented by proxy, shall constitute a quorum at a meeting of stockholders. | ||
Proxy | Under the UK Companies Act, at any meeting of shareholders, a shareholder may designate another person to attend, speak and vote at the meeting on their behalf by proxy. | Under Delaware law, at any meeting of stockholders, a stockholder may authorise another person to act for such stockholder by proxy, but no such proxy shall be voted or acted upon after three years from its date, unless the proxy provides for a longer period. A director of a Delaware corporation may not issue a proxy representing the director’s voting rights as a director. | ||
Preemptive Rights | Under the UK Companies Act, “equity securities”, being: (i) shares in the company other than shares that, with respect to dividends and capital, carry a right to participate only up to a specified amount in a distribution, referred to as “ordinary shares”; or (ii) rights to subscribe for, or to convert securities into, ordinary shares in the company, proposed to be allotted for cash must be offered first to the existing holders of equity shares in the company in proportion to the respective nominal value of their holdings of ordinary shares, unless an exception applies or a special resolution authorising the disapplication of pre-emption rights has been passed by shareholders in a general meeting or the articles of association provide otherwise in each case in accordance with the provisions of the UK Companies Act. | Under Delaware law, stockholders have no preemptive rights to subscribe to additional issues of stock or to any security convertible into such stock unless, and except to the extent that, such rights are expressly provided for in the certificate of incorporation. | ||
Authority to Allot | Under the UK Companies Act, the directors of a company may not exercise any power of the company to allot shares, to grant rights to subscribe for or convert any security into shares, unless an exception applies or an ordinary resolution to the contrary has been passed by shareholders in a general meeting or the articles of association provide otherwise, in each case in accordance with the provisions of the UK Companies Act. | Under Delaware law, if the corporation’s certificate of incorporation so provides, the board of directors has the power to authorise the issuance of stock. The board may authorise capital stock to be issued for consideration consisting of cash, any tangible or intangible property or any benefit to the corporation or any combination thereof. It may determine the amount of such consideration by setting a minimum amount of consideration or approving a formula. In the absence of actual fraud in the transaction, the judgment of the directors as to the value of such consideration is conclusive. |
266
Liability of Directors and Officers | Under the UK Companies Act, any provision, whether contained in a company’s articles of association or any contract or otherwise, that purports to exempt a director of a company, to any extent, from any liability that would otherwise attach to him in connection with any negligence, default, breach of duty or breach of trust in relation to the company, is void. Any provision by which a company directly or indirectly provides an indemnity, to any extent, for a director of the company or of an associated company against any liability attaching to him in connection with any negligence, default, breach of duty or breach of trust in relation to the company of which he is a director is also void except as permitted by the UK Companies Act, which provides exceptions for the company to (i) purchase and maintain insurance against such liability; (ii) provide a “qualifying third party indemnity,” or an indemnity against liability incurred by the director to a person other than the company or an associated company or criminal proceedings in which he is convicted; and (iii) provide a “qualifying pension scheme indemnity,” or an indemnity against liability incurred in connection with the company’s activities as trustee of an occupational pension plan. | Under Delaware law, a corporation’s certificate of incorporation may include a provision eliminating or limiting the personal liability of a director to the corporation and its stockholders for damages arising from a breach of fiduciary duty as a director. However, no provision can limit the liability of a director for: •any breach of the director’s duty of loyalty to the corporation or its stockholders; •acts or omissions not in good faith or that involve intentional misconduct or a knowing violation of law; •intentional or negligent payment of unlawful dividends or stock purchases or redemptions; or •any transaction from which the director derives an improper personal benefit. | ||
Voting Rights | Under English law, unless a poll is demanded by the shareholders of a company or is required by the chairman of the meeting or the company’s articles of association, shareholders shall vote on all resolutions on a show of hands. Under the UK Companies Act, a poll may be demanded by (i) not fewer than five shareholders having the right to vote on the resolution; (ii) any shareholder(s) representing not less than 10% of the total voting rights of all the shareholders having the right to vote on the resolution (excluding any voting rights attaching to treasury shares); or (iii) any shareholder(s) holding shares in the company conferring a right to vote on the resolution (excluding any voting rights attaching to treasury shares) being shares on which an aggregate sum has been paid up equal to not less than 10% of the total sum paid up on all the shares conferring that right. A company’s articles of association may provide more extensive rights for shareholders to call a poll. Under English law, an ordinary resolution is passed on a show of hands if it is approved by a simple majority (more than 50%) of the votes cast by shareholders present (in person or by proxy) and entitled to vote. If a poll is demanded, an ordinary resolution is passed if it is approved by holders representing a simple majority of the total voting rights of shareholders present, in person or by proxy, who, being entitled to vote, vote on the resolution. Special resolutions require the affirmative vote of not less than 75% of the votes cast by shareholders present, in person or by proxy, at the meeting. | Delaware law provides that, unless otherwise provided in the certificate of incorporation, each stockholder is entitled to one vote for each share of capital stock held by such stockholder. | ||
Shareholder Vote on Certain Transactions | The UK Companies Act provides for schemes of arrangement, which are arrangements or compromises between a company and any class of shareholders or creditors and used in certain types of reconstructions, amalgamations, capital reorganisations or takeovers. These arrangements require: •the approval at a shareholders’ or creditors’ meeting convened by order of the court, of (i) a majority in number; and (ii) representing 75% or more in value of the members or class of members (as the case may be), present and voting, either in person or by proxy; and •the approval of the court. | Generally, under Delaware law, unless the certificate of incorporation provides for the vote of a larger portion of the stock, completion of a merger, consolidation, sale, lease or exchange of all or substantially all of a corporation’s assets or dissolution requires: •the approval of the board of directors; and •the approval by the vote of the holders of a majority of the outstanding stock or, if the certificate of incorporation provides for more or less than one vote per share, a majority of the votes of the outstanding stock of the corporation entitled to vote on the matter. |
267
Standard of Conduct for Directors | Under English law, a director owes various statutory and fiduciary duties to the company, including: •to act in the way he considers, in good faith, would be most likely to promote the success of the company for the benefit of its members as a whole (and in doing so to have regard (amongst other matters) to: (i) the likely consequences of any decision in the long term, (ii) the interests of the company’s employees, (iii) the need to foster the company’s business relationships with suppliers, customers and others, (iv) the impact of the company’s operations on the community and the environment, (v) the desirability to maintain a reputation for high standards of business conduct and (vi) the need to act fairly as between members of the company); • to avoid a situation in which he has, or can have, a direct or indirect interest that conflicts, or possibly conflicts, with the interests of the company; • to act in accordance with the company’s constitution and only exercise his powers for the purposes for which they are conferred; • to exercise independent judgment; • to exercise reasonable care, skill and diligence; • not to accept benefits from a third party conferred by reason of his being a director or doing, or not doing, anything as a director; and • to declare any interest that he has, whether directly or indirectly, in a proposed or existing transaction or arrangement with the company. | Delaware law does not contain specific provisions setting forth the standard of conduct of a director. The scope of the fiduciary duties of directors is generally determined by the courts of the State of Delaware. In general, directors have a duty to act without self-interest, on a well- informed basis and in a manner they reasonably believe to be in the best interest of the stockholders. Directors of a Delaware corporation owe fiduciary duties of care and loyalty to the corporation and to its shareholders. The duty of care generally requires that a director acts in good faith, with the care that an ordinarily prudent person would exercise under similar circumstances. Under this duty, a director must inform himself of all material information reasonably available regarding a significant transaction. The duty of loyalty requires that a director act in a manner he reasonably believes to be in the best interests of the corporation. He must not use his corporate position for personal gain or advantage. In general, but subject to certain exceptions, actions of a director are presumed to have been made on an informed basis, in good faith and in the honest belief that the action taken was in the best interests of the corporation. However, this presumption may be rebutted by evidence of a breach of one of the fiduciary duties. Delaware courts have also imposed a heightened standard of conduct upon directors of a Delaware corporation who take any action designed to defeat a threatened change in control of the corporation. In addition, under Delaware law, when the board of directors of a Delaware corporation approves the sale or break-up of a corporation, the board of directors may, in certain circumstances, have a duty to obtain the highest value reasonably available to the shareholders. | ||
Shareholder Litigation | Under English law, generally, the company, rather than its shareholders, is the proper claimant in an action in respect of a wrong done to the company or where there is an irregularity in the company’s internal management. Notwithstanding this general position, the UK Companies Act provides that: (i) a court may allow a shareholder to bring a derivative claim (that is, an action in respect of and on behalf of the company) in respect of a cause of action vested in the company arising from a director’s negligence, default, breach of duty or breach of trust and seeking relief on behalf of the company; and (ii) a shareholder may bring a claim for a court order where the company’s affairs have been or are being conducted in a manner that is unfairly prejudicial to some or all of its shareholders. | Under Delaware law, a stockholder may initiate a derivative action to enforce a right of a corporation if the corporation fails to enforce the right itself. The complaint must: •state that the plaintiff was a stockholder at the time of the transaction of which the plaintiff complains or that the plaintiff’s shares thereafter devolved on the plaintiff by operation of law; and • allege with particularity the efforts made by the plaintiff to obtain the action the plaintiff desires from the directors and the reasons for the plaintiff’s failure to obtain the action; or •state the reasons for not making the effort. Additionally, the plaintiff must remain a stockholder through the duration of the derivative suit. The action will not be dismissed or compromised without the approval of the Delaware Court of Chancery. |
268
10C.MATERIAL CONTRACTS
Multi-currency Revolving Credit Facility
General
On 23 October 2018, AngloGold Ashanti Holdings plc (“AGAH”) and AngloGold Ashanti Australia Limited, as borrowers, entered
into a five-year unsecured multi-currency syndicated revolving credit facility of $1.4 billion (the “2018 multi-currency RCF”) with
the Bank of Nova Scotia, as facility agent, and certain financial institutions party thereto, as lenders. The loan consisted of (i) a
US dollar based facility with interest charged at a margin of 1.45 per cent above LIBOR and (ii) an Australian dollar based facility
capped at A$500 million with interest charged at a margin of 1.45 per cent above BBSY. The A$500 million portion of the 2018
multi-currency RCF was used to fund the working capital and development costs associated with the Group’s mining operations
within Australia without eroding the group’s headroom under its other facilities and exposing the Group to foreign exchange
gains/losses each quarter. On 9 June 2022, the 2018 multi-currency RCF was repaid and cancelled, and replaced with the 2022
multi-currency RCF (as defined below).
On 9 June 2022, AGAH and AngloGold Ashanti Australia Limited, as borrowers, entered into a new five-year unsecured multi-
currency syndicated revolving credit facility of $1.4 billion (the “2022 multi-currency RCF”) maturing in June 2027, with the option
of two one-year extensions on application. The 2022 multi-currency RCF was entered into with The Bank of Nova Scotia, as
facility agent, and certain financial institutions party thereto, as lenders. The 2022 multi-currency RCF consists of (i) a US dollar
based facility (base currency) and (ii) an Australian dollar based facility capped at A$500 million which will be used to fund the
working capital and development costs associated with the group's mining operations within Australia (without eroding the
group's headroom under its other facilities and exposing the group to foreign exchange gains/losses each quarter). The 2022
multi-currency RCF was entered into on substantially similar terms to the 2018 multi-currency RCF, save in respect of the basis
for the US dollar interest rate which transitioned from LIBOR to Compounded SOFR. On 24 May 2023, the maturity of the 2022
multi-currency RCF was extended by one year from 9 June 2027 to 9 June 2028. On 7 November 2023, certain technical
amendments were adopted to the 2022 multi-currency RCF in the context of AngloGold Ashanti’s corporate restructuring. As of
the date hereof, $300 million was drawn under the USD portion and the equivalent of $13 million was drawn under the AUD
portion of the 2022 multi-currency RCF.
Guarantees
The 2022 multi-currency RCF is guaranteed by AGAH and AngloGold Ashanti Australia Limited. The guarantees constitute
unconditional obligations of the guarantors and rank at least pari passu with all other future unsecured obligations of the
guarantors, except for obligations mandatorily preferred by law.
Security
Save as set out under the heading “—Guarantees” above, the obligations under the 2022 multi-currency RCF are unsecured.
Amount and repayment of borrowings
Loans under the 2022 multi-currency RCF must be for a minimum of $10 million, if the currency selected is the base currency
(US dollar), or a minimum of A$10 million (or for the balance of the undrawn total commitments at the time of the drawing), if the
currency selected is Australian dollars. No more than 14 loans may be outstanding at any time. Each loan must be repaid on the
maturity date in the same currency as the maturing loan. All loans must be repaid in full on the final maturity date. On 24 May
2023, the maturity of the 2022 multi-currency RCF was extended by one year from 9 June 2027 to 9 June 2028. As a result, the
2022 multi-currency RCF now matures in June 2028, with the option of one further one-year extension on application.
Interest rates and fees
The interest rate under the 2022 multi-currency RCF is calculated based on Compounded SOFR in the case of loans drawn in
US dollars and BBSY in the case of loans drawn in Australian dollars, in each case plus a margin. The initial margin is 1.45
percent per annum, but may vary between 0.90 percent and 2.15 percent per annum depending on the long-term debt rating of
AGAH. The applicable margin is subject to a ratings grid. In this regard, the interest margin will reduce if the group's credit rating
improves from its current BB+/Baa3 status and will increase if its credit rating worsens. Interest on each loan is payable on the
last day of the relevant loan’s interest period and, if the interest period exceeds six months, on the dates falling at six-monthly
intervals after the first day of the interest period.
The borrowers under the 2022 multi-currency RCF are required to pay a commitment fee in the base currency equal to 35
percent of the then applicable margin per annum on the undrawn and uncancelled amount of each lender’s commitment during
the commitment period. The borrowers are also required to pay a utilisation fee of 0.10 percent per annum (if the aggregate
outstanding loans are less than one third of the total commitments then in effect), 0.20 percent per annum (if the aggregate
outstanding loans are equal to or greater than one third but less than two-thirds of the total commitments then in effect) or 0.40
269
percent per annum (if the aggregate outstanding loans are equal to or greater than two-thirds of the total commitments then in
effect).
Financial covenant
The 2022 multi-currency RCF includes a financial maintenance covenant which requires that the ratio of Total Net Financial
Indebtedness to EBITDA (as such terms are defined in the revolving credit agreement) does not at any time exceed 3.50 to 1.00,
with the proviso that this ratio may exceed 3.50 to 1.00 once during the life of the revolving credit agreement, for one six-month
period subject to certain criteria.
Change of control
If a lender so requires, the commitment of such lender under the 2022 multi-currency RCF will be cancelled and the participation
of such lender in all outstanding loans, together with accrued interest and all other amounts accrued, will become immediately
due and payable in case any person or group of persons acting in concert becomes (directly or indirectly) the beneficial owner of
more than 50 percent of the issued share capital of AngloGold Ashanti plc, being the successor parent holding company of
AGAH.
Undertakings
The 2022 multi-currency RCF contains a negative pledge covenant, including restrictions on the granting of security, a change of
business of AGAH and its subsidiaries, acquisitions or participations in joint ventures, and mergers and disposals.
The 2022 multi-currency RCF also contains, among other things, the following affirmative covenants: mandatory periodic
reporting of financial and other information, notice upon the occurrence of events of default and certain other events, compliance
with environmental laws and other obligations requiring each of AGAH and its subsidiaries to maintain its corporate existence
and qualifications to conduct its business as currently conducted in all applicable jurisdictions and to maintain insurance
coverage. The covenants are subject to exceptions and materiality thresholds.
Events of default
The 2022 multi-currency RCF contains events of default including failure to make payment of amounts due, breach of obligations
under the loan documents, defaults under other agreements evidencing indebtedness, certain bankruptcy events and a
cessation of business and the occurrence of a material adverse change in the business and financial condition of the borrowers
and guarantors under the revolving credit agreement, or AngloGold Ashanti and its subsidiaries as a whole, or in the ability of the
borrowers and guarantors to perform their payment obligations under the loan documents. The occurrence of an event of default
could result in the immediate and automatic cancellation of all commitments and the acceleration of all payment obligations
under the 2022 multi-currency RCF and the other loan documents.
The above description is only a summary of certain provisions of the 2022 multi-currency RCF and is qualified in its entirety by
reference to the provisions of the 2022 multi-currency RCF, including the extension request letter and amendment agreement,
copies of which are attached hereto as Exhibits 19.4.2.1, 19.4.2.2 and 19.4.2.3 and are incorporated herein by reference.
Notes
Each of the series of notes described below were issued under the indenture dated as of 28 April 2010, as amended and
supplemented by the first supplemental indenture dated as of 23 September 2023 (as so amended and supplemented, the
“Indenture”), among AngloGold Ashanti Holdings plc (“AGAH”), as issuer, AngloGold Ashanti plc, as successor guarantor to
AngloGold Ashanti Limited (currently known as AngloGold Ashanti (Pty) Ltd), and The Bank of New York Mellon, as trustee. The
below descriptions are only a summary of certain provisions of those series of notes and are qualified in their entirety by
reference to the provisions of the Indenture and such relevant series of notes, a copy of each – in respect of the outstanding
series of notes – is attached hereto as Exhibits 19.2.1, 19.2.2, 19.2.3, 19.2.4 and 19.2.5 and is incorporated herein by reference.
2028 Notes
On 22 October 2021, AGAH issued $750 million 3.375 percent Notes due 2028 (the “2028 notes”). The interest on the 2028
notes is payable semi-annually on 1 May and 1 November of each year, commencing on 1 May 2022. Unless redeemed earlier,
the 2028 notes will mature on 1 November 2028. AGAH may on any one or more occasions redeem all or part of the 2028
notes, at a redemption price equal to the greater of (1) 100 percent of the principal amount of the 2028 notes to be redeemed
and (2) the sum of the present values of the remaining scheduled payments of principal and interest on the 2028 notes
(excluding any portion of such payments of interest accrued or unpaid as of the date of redemption) discounted to the
redemption date on a semiannual basis (assuming a 360-day year consisting of twelve 30-day months) at the treasury rate, plus
30 basis points, plus accrued and unpaid interest, if any, to the date of redemption. AGAH has agreed to pay certain additional
amounts in respect of any withholdings or deductions for certain types of taxes in certain jurisdictions on payments to holders of
270
the 2028 notes. The 2028 notes are unsecured and unsubordinated and are fully and unconditionally guaranteed by AngloGold
Ashanti plc.
AGAH has agreed to observe certain covenants with respect to the 2028 notes restricting, subject to certain limitations, the ability
of AngloGold Ashanti plc and AGAH to amalgamate, reconstruct, consolidate or merge with another company or other legal
entity, and the ability of AngloGold Ashanti plc and its restricted subsidiaries to pledge their assets to secure certain borrowings,
create or incur liens on certain of their property or to engage in sale and leaseback transactions. In case of a change of control of
the guarantor and a downgrade, within a specified period, of the 2028 notes by three rating agencies, holders of the 2028 notes
have the right to require the issuer to repurchase all or any part of their 2028 notes in cash for a value equal to 101 percent of the
aggregate principal amount of 2028 notes repurchased, plus accrued and unpaid interest, if any, on the 2028 notes repurchased
to the date of repurchase.
The offering of the 2028 notes was registered under the Securities Act. The 2028 notes were listed on the New York Stock
Exchange.
2030 Notes
On 1 October 2020, AGAH issued $700 million 3.750 percent Notes due 2030 (the “2030 notes”). The interest on the 2030 notes
is payable semi-annually on 1 April and 1 October of each year, commencing on 1 April 2021. Unless redeemed earlier, the 2030
notes will mature on 1 October 2030. AGAH may on any one or more occasions redeem all or part of the 2030 notes, at a
redemption price equal to the greater of (1) 100 percent of the principal amount of the 2030 notes to be redeemed and (2) the
sum of the present values of the remaining scheduled payments of principal and interest on the 2030 notes (excluding any
portion of such payments of interest accrued or unpaid as of the date of redemption) discounted to the redemption date on a
semiannual basis (assuming a 360-day year consisting of twelve 30-day months) at the treasury rate, plus 50 basis points, plus
accrued and unpaid interest, if any, to the date of redemption. AGAH has agreed to pay certain additional amounts in respect of
any withholdings or deductions for certain types of taxes in certain jurisdictions on payments to holders of the 2030 notes. The
2030 notes are unsecured and unsubordinated and are fully and unconditionally guaranteed by AngloGold Ashanti plc.
AGAH has agreed to observe certain covenants with respect to the 2030 notes restricting, subject to certain limitations, the ability
of AngloGold Ashanti plc and AGAH to amalgamate, reconstruct, consolidate or merge with another company or other legal
entity, and the ability of AngloGold Ashanti plc and its restricted subsidiaries to pledge their assets to secure certain borrowings,
create or incur liens on certain of their property or to engage in sale and leaseback transactions. In case of a change of control of
the guarantor and a downgrade, within a specified period, of the 2030 notes by three rating agencies, holders of the 2030 notes
have the right to require the issuer to repurchase all or any part of their 2030 notes in cash for a value equal to 101 percent of the
aggregate principal amount of 2030 notes repurchased, plus accrued and unpaid interest, if any, on the 2030 notes repurchased
to the date of repurchase.
The offering of the 2030 notes was registered under the Securities Act. The 2030 notes were listed on the New York Stock
Exchange.
2040 Notes
On 28 April 2010, AGAH issued inter alia $300 million 6.500 percent Notes due 2040 (the “2040 notes”). The interest on the 2040
notes is payable semi-annually on 15 April and 15 October of each year, commencing on 15 October 2010. Unless redeemed
earlier, the 2040 notes will mature on 15 April 2040. AGAH may on any one or more occasions redeem all or part of the 2040
notes, at a redemption price equal to the greater of (1) 100 percent of the principal amount of the 2040 notes to be redeemed
and (2) the sum of the present values of the remaining scheduled payments of principal and interest on the 2040 notes
(excluding any portion of such payments of interest accrued or unpaid as of the date of redemption) discounted to the
redemption date on a semiannual basis (assuming a 360-day year consisting of twelve 30-day months) at the treasury rate, plus
30 basis points, plus accrued and unpaid interest, if any, to the date of redemption. AGAH has agreed to pay certain additional
amounts in respect of any withholdings or deductions for certain types of taxes in certain jurisdictions on payments to holders of
the 2040 notes. The 2040 notes are unsecured and unsubordinated and are fully and unconditionally guaranteed by AngloGold
Ashanti plc.
AGAH has agreed to observe certain covenants with respect to the 2040 notes restricting, subject to certain limitations, the ability
of AngloGold Ashanti plc and AGAH to amalgamate, reconstruct, consolidate or merge with another company or other legal
entity, and the ability of AngloGold Ashanti plc and its restricted subsidiaries to pledge their assets to secure certain borrowings,
create or incur liens on certain of their property or to engage in sale and leaseback transactions. In case of a change of control of
the guarantor and a downgrade, within a specified period, of the 2040 notes below an investment grade rating by two rating
agencies, holders of the 2040 notes have the right to require the issuer to repurchase all or any part of their 2040 notes in cash
for a value equal to 101 percent of the aggregate principal amount of 2040 notes repurchased, plus accrued and unpaid interest,
if any, on the 2040 notes repurchased to the date of repurchase.
The offering of the 2040 notes was registered under the Securities Act. The 2040 notes were listed on the New York Stock
Exchange.
271
For further information, see “Item 18: Financial Statements—Note 22—Borrowings”, “Item 5B: Liquidity and Capital Resources”
and “Item 19: Exhibits”.
Former Deposit Agreement relating to AngloGold Ashanti ADSs
Prior to the implementation of the corporate restructuring, AngloGold Ashanti Limited maintained an American Depositary Share
(“ADS”) facility (the “ADS facility”). Each ADS represented the ownership interest of one ordinary share of AngloGold Ashanti
Limited and such ADSs were listed on the NYSE under the symbol “AU”. In this connection, AngloGold Ashanti Limited had
entered into an Amended and Restated Deposit Agreement dated 3 June 2008 with The Bank of New York Mellon as Depositary
and the owners and beneficial owners of ADSs, as amended (the “ADS Deposit Agreement”). The ADS Deposit Agreement set
out ADS holder rights as well as the rights and obligations of the Depositary and was governed by New York law.
On 25 September 2023, AngloGold Ashanti Limited and the Depositary amended the ADS Deposit Agreement (including the form
of American Depositary Receipt) to alter the procedures that follow termination of the ADS Deposit Agreement. On the same
date, upon implementation of the corporate restructuring, the ADS Deposit Agreement and ADS facility were terminated. Trading
in the ADSs on the NYSE had already ceased at the close of market on 22 September 2023. All outstanding ADSs were
converted into a right to receive delivery of a corresponding number of ordinary shares of AngloGold Ashanti plc. The ordinary
shares of AngloGold Ashanti plc were listed on the NYSE under the symbol “AU”, which had previously been used for the ADS
facility.
During the year ended 31 December 2023, The Bank of New York Mellon, as Depositary, reimbursed AngloGold Ashanti an
amount of $1,118,683 (2022: $934,248; 2021: $1,083,405) mainly for investor relations-related expenses.
Corporate Restructuring Transaction Agreements
As previously mentioned, on 12 May 2023, AngloGold Ashanti Limited announced the intention to implement a corporate
restructuring to reorganise its operations under a new parent company, AngloGold Ashanti plc, incorporated in England and
Wales and tax resident in the United Kingdom, with a primary listing of its ordinary shares on the NYSE. The corporate
restructuring was implemented in three sequential, separate and fully interconditional steps consisting of (i) a spin-off, (ii) a sale
of AngloGold Ashanti Holdings plc (“AGAH”), and (iii) a scheme of arrangement. The main transaction agreements comprised the
Scheme Implementation Agreement and the Irrevocable Offer to Purchase (each as defined below).
Scheme Implementation Agreement
AngloGold Ashanti (UK) Limited (currently known as AngloGold Ashanti plc) and AngloGold Ashanti Limited (currently known as
AngloGold Ashanti (Pty) Ltd) entered into an agreement dated as of 12 May 2023, as amended by the first addendum dated as
of 23 June 2023, in relation to, amongst other things, the spin-off and the scheme of arrangement (the “Scheme Implementation
Agreement”). The Scheme Implementation Agreement contained, amongst other things, the conditions precedent to which the
completion of the corporate restructuring was subject, provisions regarding the implementation of the corporate restructuring,
and certain representations and warranties given by each of the parties.
The above description is only a summary of the Scheme Implementation Agreement and is qualified in its entirety by reference to
the Scheme Implementation Agreement, a copy of which is attached hereto as Exhibits 19.4.5.1 and 19.4.5.2 and is incorporated
herein by reference.
Irrevocable Offer to Purchase
In addition, on 12 May 2023, AngloGold Ashanti (UK) Limited (currently known as AngloGold Ashanti plc) signed and delivered to
AngloGold Ashanti Limited (currently known as AngloGold Ashanti (Pty) Ltd) an offer document (the “Irrevocable Offer to
Purchase”) in terms of which, amongst other things, AngloGold Ashanti plc made an irrevocable offer to AngloGold Ashanti
Limited (currently known as AngloGold Ashanti (Pty) Ltd) to acquire all of the shares in AGAH. The Irrevocable Offer to Purchase
set out the terms and conditions of the irrevocable offer.
The above description is only a summary of the Irrevocable Offer to Purchase and is qualified in its entirety by reference to the
Irrevocable Offer to Purchase, a copy of which is attached hereto as Exhibits 19.4.5.3 and is incorporated herein by reference.
272
10D.EXCHANGE CONTROLS
Other than certain economic sanctions which may be in effect from time to time, there are currently no governmental laws,
decrees, regulations or other legislation in the United Kingdom which may affect (i) the import or export of capital, including the
availability of cash and cash equivalents for use by AngloGold Ashanti, or (ii) the remittance of dividends, interest, or other
payments by AngloGold Ashanti to holders of its ordinary shares who are non-residents of the United Kingdom (other than
customary withholding tax requirements).
There are no limitations imposed by English law (subject to the effect of certain economic sanctions which may be in effect from
time to time) or in the AngloGold Ashanti articles of association on the right of non-UK residents to hold or vote ordinary shares of
AngloGold Ashanti plc.
273
10E.TAXATION
United Kingdom Taxation
General
The following discussion addresses the material UK income tax, corporation tax, capital gains tax, stamp duty, and stamp duty
reserve tax (“SDRT”) consequences of the ownership and disposition of AngloGold Ashanti’s ordinary shares generally expected
to be applicable to Non-UK Holders (as defined below).
It applies to Non-UK Holders only if (i) such Non-UK Holders are the absolute beneficial owner of AngloGold Ashanti’s ordinary
shares and any dividends paid in respect of them; (ii) such Non-UK Holders hold AngloGold Ashanti’s ordinary shares as an
investment (rather than, for example, as securities to be realised in the course of a trade); and (iii) such Non-UK Holders hold
AngloGold Ashanti’s ordinary shares other than under a regime providing for exemption from tax. This section does not apply to a
Non-UK Holder if such Non-UK Holder is a member of a special class of holders subject to special rules, including:
•charities;
•trustees;
•persons carrying on certain financial activities (including market makers, brokers, dealers in securities, intermediaries
and persons connected with depository arrangements or clearance services);
•persons who have or could be treated for tax purposes as having acquired their AngloGold Ashanti ordinary shares by
reason of their employment or as carried interest;
•persons connected with AngloGold Ashanti;
•collective investment schemes;
•persons subject to UK tax on the remittance basis; and
•insurance companies.
This section is based on current UK legislation, current published practice of His Majesty’s Revenue and Customs (“HMRC”)
(which may not be binding on HMRC), and court decisions, in each case, in effect on the date hereof, all of which are subject to
change, possibly with retroactive effect, and to differing interpretations. In addition, this section is based in part upon the
assumption that the AngloGold Ashanti’s ordinary shares do not, at any time, derive at least 75 percent of their value from UK
land.
Unless stated otherwise, this section addresses only Non-UK Holders. References in this section to ‘‘Non-UK Holders’’ are to
holders of AngloGold Ashanti’s ordinary shares who, at the relevant time, (i) are not resident or domiciled for tax purposes in the
United Kingdom, and to whom split-year treatment does not apply; (ii) do not have a permanent establishment or branch or
agency in the United Kingdom to which their AngloGold Ashanti ordinary shares are attributable; (iii) have not, in the case of
individuals, within the past five years been resident for tax purposes in the United Kingdom; and (iv) are not carrying on a trade,
profession, or vocation in the United Kingdom.
Shareholders should be aware that the tax legislation of the shareholder’s jurisdiction and/or the tax legislation of the United
Kingdom, as well as the interpretation or amendment of any such tax legislation, may alter the benefits of investment in
AngloGold Ashanti’s ordinary shares.
If a shareholder is in any doubt about their tax position, the shareholder should consult an appropriately qualified independent
professional advisor immediately.
UK Tax Consequences of Holding AngloGold Ashanti’s Ordinary Shares
Subsequent Disposals of AngloGold Ashanti’s Ordinary Shares
Non-UK Holders will not be liable to UK corporation tax or capital gains tax on a disposal of their AngloGold Ashanti ordinary
shares.
Dividends
AngloGold Ashanti is not required to withhold UK tax at source from dividends paid on AngloGold Ashanti’s ordinary shares.
Non-UK Holders will not, therefore, be subject to UK income tax or corporation tax in respect of dividends paid on AngloGold
Ashanti’s ordinary shares.
UK Stamp Duty and SDRT
274
Pursuant to arrangements that AngloGold Ashanti has entered into with DTC, AngloGold Ashanti’s ordinary shares are currently
eligible to be held in book-entry form through the facilities of The Depository Trust Company (“DTC”). Based on AngloGold
Ashanti’s understanding of the DTC system and how trading occurs therein (including that DTC has not made an election under
section 97A(1) of the UK Finance Act 1986), transfers of AngloGold Ashanti’s ordinary shares held in book-entry form through
DTC should not attract a charge to UK stamp duty or SDRT.
A transfer of AngloGold Ashanti’s ordinary shares from within the DTC system out of DTC may, and any transfers on sale of
AngloGold Ashanti’s ordinary shares outside of DTC will, subject in each case to the availability of any exemptions or reliefs,
generally be liable to UK stamp duty at the rate of 0.5 percent of the amount or value of the consideration payable (rounded up to
the nearest multiple of £5) or, in respect of an unconditional agreement to transfer AngloGold Ashanti’s ordinary shares, SDRT at
the rate of 0.5 percent of the amount or value of the consideration payable. Any such stamp duty must be paid (and the relevant
transfer document stamped by HMRC) before the transfer can be registered in the share register of AngloGold Ashanti. However,
where a transfer is executed in pursuance of the agreement (which gave rise to the SDRT) and the document is duly stamped
within six years of the date of the agreement, the SDRT should be canceled and any SDRT paid should be repaid. UK stamp
duty and SDRT will, where applicable, generally be borne by the purchaser of the relevant AngloGold Ashanti ordinary shares.
In cases where AngloGold Ashanti’s ordinary shares are, outside of DTC, transferred to a connected company (or its nominee),
different rules may apply. If an AngloGold Ashanti shareholder decides to redeposit AngloGold Ashanti’s ordinary shares into
DTC, the redeposit will likely attract UK stamp duty and/or SDRT at a rate of 1.5 percent (see “—Depositary Receipt Systems
and Clearance Services” below).
Depositary Receipt Systems and Clearance Services
Where, from outside of DTC, AngloGold Ashanti’s ordinary shares are transferred: (a) to, or to a nominee or an agent for, a
person whose business is or includes the provision of clearance services (including DTC or its nominees) (a “Clearance
Service”); or (b) to, or to a nominee or an agent for, a person whose business is or includes issuing depositary receipts (a
“Depositary Receipt System”), UK stamp duty and/or SDRT may be chargeable at the higher rate of 1.5 percent of the amount or
value of the consideration given or, in certain circumstances, the value of the AngloGold Ashanti ordinary shares (rounded up to
the nearest multiple of £5 in the case of stamp duty). The rules regarding the application of this higher rate of stamp duty and
SDRT, and the exemptions therefrom, are complex, and specific professional advice should be sought before transferring shares
to a person within (a) or (b) of this paragraph. See “Item 3D: Risk Factors—Transfers of AngloGold Ashanti ordinary shares may
be subject to stamp duty or SDRT in the United Kingdom, which would increase the cost of dealing in AngloGold Ashanti
ordinary shares”.
If an AngloGold Ashanti shareholder decides to redeposit AngloGold Ashanti ordinary shares into DTC from outside of DTC, the
redeposit will likely attract UK stamp duty or SDRT at this higher rate of 1.5 percent. AngloGold Ashanti has put in place
arrangements with its transfer agent to require that AngloGold Ashanti ordinary shares held in certificated form cannot be
transferred into the DTC system until the transferor of the AngloGold Ashanti ordinary shares has first delivered the shares to a
depository specified by AngloGold Ashanti so that UK stamp duty or SDRT may be collected in connection with the initial delivery
to the depository. Any such AngloGold Ashanti ordinary shares will be evidenced by a receipt issued by the depository. Before
the transfer can be registered in AngloGold Ashanti’s share register, the transferor will also be required to provide the transfer
agent sufficient funds to settle the resultant liability for UK stamp duty or SDRT.
United States Taxation
General
The following discussion addresses the material U.S. federal income tax consequences generally expected to be applicable to
holders of AngloGold Ashanti’s ordinary shares. It applies to a holder only if they hold their AngloGold Ashanti ordinary shares as
a capital asset for U.S. federal income tax purposes. This section does not apply to a holder of AngloGold Ashanti’s ordinary
shares if they are a member of a special class of holders subject to special rules, including:
•a bank or other financial institution;
•a tax-exempt organisation;
•a real estate investment trust or real estate mortgage investment conduit;
•an entity or arrangement classified as a partnership for U.S. federal income tax purposes or other pass-through entity
such as a subchapter S corporation (or an investor in such an entity or arrangement);
•an insurance company;
•a regulated investment company;
•a dealer or broker in stocks and securities, or currencies;
•a trader in securities that elects mark-to-market treatment;
•a person subject to the alternative minimum tax;
•a person that received shares through the exercise of an employee stock option, through a tax qualified retirement plan
or otherwise as compensation;
275
•a person that owns or has owned directly, indirectly or constructively, 10 percent or more of the voting stock of
AngloGold Ashanti;
•a person that holds AngloGold Ashanti’s ordinary shares as part of a straddle, a hedge, constructive sale, conversion or
other integrated transaction;
•a person that acquires or sells AngloGold Ashanti’s ordinary shares as part of a wash sale for tax purposes;
•a person that acquires AngloGold Ashanti’s ordinary shares pursuant to the exercise of an employee stock option or
otherwise as compensation;
•a U.S. Shareholder (as defined below) whose functional currency is not the U.S. dollar; or
•a U.S. expatriate.
This section is based on the Internal Revenue Code of 1986, as amended, and the U.S. Treasury rules and regulations
promulgated thereunder (the “Code”), administrative rulings, court decisions and the income tax treaty between the U.S. and the
UK in effect on the date hereof, all of which are subject to change, possibly with retroactive effect, and to differing interpretations.
A “U.S. Shareholder” is a beneficial owner of AngloGold Ashanti’s ordinary shares who is for U.S. federal income tax purposes:
1. a citizen or resident of the United States;
2. a corporation, or any entity treated as a corporation, created or organised under the laws of the United States or any of
its political subdivisions;
3. an estate the income of which is subject to U.S. federal income taxation regardless of its source; or
4. a trust that (i) a U.S. court can exercise primary supervision over the trust’s administration and one or more U.S.
persons are authorised to control all substantial decisions of the trust or (ii) has a valid election in effect under applicable U.S.
Treasury regulations to be treated as a U.S. person.
A “non-U.S. Shareholder” is a beneficial owner of AngloGold Ashanti’s ordinary shares that is not a U.S. person for U.S. federal
income tax purposes.
If an entity or arrangement treated as a partnership for U.S. federal income tax purposes holds AngloGold Ashanti’s ordinary
shares, the tax treatment of a partner will generally depend upon the status of the partner and the activities of the partnership.
Each such partner having an interest in AngloGold Ashanti’s ordinary shares is urged to consult his, her or its own tax advisor in
light of his, her or its particular circumstances.
This section addresses only U.S. federal income tax law.
U.S. Tax Consequences of Holding AngloGold Ashanti’s Ordinary Shares
Taxation of dividends
U.S. Shareholders. Under the U.S. federal income tax laws, and subject to the PFIC rules discussed below, the gross amount of
any dividend AngloGold Ashanti pays out of its current or accumulated earnings and profits (as determined for U.S. federal
income tax purposes) is subject to U.S. federal income taxation. For a noncorporate U.S. Shareholder, dividends that constitute
qualified dividend income will be taxable at the preferential rates applicable to long-term capital gains, provided that such a
noncorporate U.S. Shareholder holds the shares for more than 60 days during the 121-day period beginning 60 days before the
ex-dividend date and meets other holding period requirements. Dividends AngloGold Ashanti pays with respect to the shares
generally will be qualified dividend income, provided that in the year that the dividends are received, the shares are readily
tradable on an established securities market in the United States.
The dividend is taxable when the dividend is received, actually or constructively. The dividend will not be eligible for the
dividends-received deduction generally allowed to U.S. corporations in respect of dividends received from other U.S.
corporations. The amount of the dividend distribution that must be included in the income of a U.S. Shareholder will be the U.S.
dollar value of the payments made, determined at the spot conversion rate on the date the dividend distribution is includible in
the U.S. Shareholder’s income, regardless of whether the payment is in fact converted into U.S. dollars. Generally, any gain or
loss resulting from currency exchange fluctuations during the period from the date the dividend payment is included in income to
the date the payment is converted into U.S. dollars will be treated as ordinary income or loss and will not be eligible for the
special tax rate applicable to qualified dividend income. Distributions in excess of current and accumulated earnings and profits,
as determined for U.S. federal income tax purposes, will be treated as a non-taxable return of capital to the extent of the U.S.
Shareholder’s basis in the shares and thereafter as capital gain. However, AngloGold Ashanti does not expect to calculate
earnings and profits in accordance with U.S. federal income tax principles. Accordingly, a U.S. Shareholder should expect to
generally treat distributions AngloGold Ashanti makes as dividends.
Non-U.S. Shareholders. To a non-U.S. Shareholder, dividends paid in respect of AngloGold Ashanti’s ordinary shares will not be
subject to U.S. federal income tax unless the dividends are “effectively connected” with the non-U.S. Shareholder’s conduct of a
trade or business within the United States, and the dividends are attributable to a permanent establishment that the non-U.S.
Shareholder maintains in the United States if that is required by an applicable income tax treaty as a condition for subjecting the
non-U.S. Shareholder to United States taxation on a net income basis. In such cases the non-U.S. Shareholder generally will be
276
taxed in the same manner as a U.S. Shareholder. For a corporate non-U.S. Shareholder, “effectively connected” dividends may,
under certain circumstances, be subject to an additional “branch profits tax” at a 30 percent rate or at a lower rate if the corporate
non-U.S. Shareholder is eligible for the benefits of an income tax treaty that provides for a lower rate.
Taxation of Capital Gains
U.S. Shareholders. Subject to the PFIC rules discussed below, if a U.S. Shareholder sells or otherwise disposes of the U.S.
Shareholder’s AngloGold Ashanti ordinary shares, the U.S. Shareholder will recognise capital gain or loss for U.S. federal income
tax purposes equal to the difference between the U.S. dollar value of the amount that the U.S. Shareholder realises and the U.S.
Shareholder’s tax basis, determined in U.S. dollars, in the U.S. Shareholder’s AngloGold Ashanti ordinary shares. Capital gain of
a non-corporate U.S. Shareholder is generally taxed at preferential rates where the property is held for more than one year. A
U.S. Shareholder’s ability to deduct capital losses is subject to limitations.
Non-U.S. Shareholders. A non-U.S. Shareholder will not be subject to U.S. federal income tax on gain recognised on the sale or
other disposition of the non-U.S. Shareholder’s AngloGold Ashanti ordinary shares unless:
1. the gain is “effectively connected” with the non-U.S. Shareholder’s conduct of a trade or business in the United
States, and the gain is attributable to a permanent establishment that the non-U.S. Shareholder maintains in the United States if
that is required by an applicable income tax treaty as a condition for subjecting the non-U.S. Shareholder to United States
taxation on a net income basis, or
2. the non-U.S. Shareholder is an individual, the non-U.S. Shareholder is present in the United States for 183 or
more days in the taxable year of the sale and certain other conditions exist.
“Effectively connected” gains recognised by a corporate non-U.S. Shareholder may also, under certain circumstances, be subject
to an additional “branch profits tax” at a 30 percent rate or at a lower rate if the corporate non-U.S. Shareholder is eligible for the
benefits of an income tax treaty that provides for a lower rate.
Medicare Tax
A U.S. Shareholder that is an individual or estate, or a trust that does not fall into a special class of trusts that is exempt from
such tax, is subject to a 3.8 percent tax on the lesser of (1) the U.S. Shareholder’s “net investment income” (or “undistributed net
investment income” in the case of an estate or trust) for the relevant taxable year and (2) the excess of the U.S. Shareholder’s
modified adjusted gross income (or adjusted gross income in the case of an estate or trust) for the taxable year over a certain
threshold (which in the case of individuals is between US$125,000 and US$250,000, depending on the individual’s
circumstances). A holder’s net investment income generally includes its dividend income and its net gains from the disposition of
AngloGold Ashanti’s ordinary shares, unless such dividend income or net gains are derived in the ordinary course of the conduct
of a trade or business (other than a trade or business that consists of certain passive or trading activities). A U.S. Shareholder
that is an individual, estate or trust is urged to consult the U.S. Shareholder’s tax advisors regarding the applicability of the
Medicare tax to the U.S. Shareholder’s income and gains in respect of the U.S. Shareholder’s individual investment in AngloGold
Ashanti’s ordinary shares.
PFIC Rules
AngloGold Ashanti expects that AngloGold Ashanti’s ordinary shares will not be treated as stock of a PFIC for U.S. federal
income tax purposes, but this conclusion is a factual determination that is made annually and thus may be subject to change. A
company is considered a PFIC if, for any taxable year after the application of applicable “look-through rules”, either (i) at least 75
percent of its gross income for the taxable year is passive income or (ii) at least 50 percent of the value, determined on the basis
of a quarterly average, of its assets is attributable to assets that produce or are held for the production of passive income. If
AngloGold Ashanti were to be treated as a PFIC, unless a U.S. Shareholder elects to be taxed annually on a mark-to-market
basis with respect to AngloGold Ashanti’s ordinary shares or makes a QEF election the first taxable year in which AngloGold
Ashanti is treated as a PFIC, gain realised on the sale or other disposition of the U.S. Shareholder’s AngloGold Ashanti ordinary
shares would in general not be treated as capital gain. Instead, a U.S. Shareholder would be treated as if the U.S. Shareholder
had realised such gain and certain excess distributions ratably over the U.S. Shareholder’s holding period for AngloGold
Ashanti’s ordinary shares and would be taxed at the highest tax rate in effect for each such year to which the gain was allocated,
together with an interest charge in respect of the tax attributable to each such year. With certain exceptions, a U.S. Shareholder’s
AngloGold Ashanti ordinary shares will be treated as stock in a PFIC if AngloGold Ashanti were a PFIC at any time during the
U.S. Shareholder’s holding period in AngloGold Ashanti’s ordinary shares. Dividends that a U.S. Shareholder receives from
AngloGold Ashanti will not be eligible for the special tax rates applicable to qualified dividend income if AngloGold Ashanti is
treated as a PFIC either in the taxable year of the distribution or the preceding taxable year, but instead will be taxable at rates
applicable to ordinary income. The QEF election is conditioned upon AngloGold Ashanti furnishing a U.S. Shareholder annually
with certain tax information. AngloGold Ashanti may not take the action necessary for a U.S. shareholder to make a QEF election
in the event AngloGold Ashanti is determined to be a PFIC.
277
Information with Respect to Foreign Financial Assets
Owners of “specified foreign financial assets” with an aggregate value in excess of US$50,000 (and in some circumstances, a
higher threshold) may be required to file an information report with respect to such assets with their tax returns. “Specified
foreign financial assets” may include financial accounts maintained by foreign financial institutions, as well as the following, but
only if they are held for investment and not held in accounts maintained by financial institutions: (i) stocks and securities issued
by non-U.S. persons, (ii) financial instruments and contracts that have non-U.S. issuers or counterparties, and (iii) interests in
foreign entities. Holders are urged to consult their tax advisors regarding the application of this reporting requirement to their
ownership of the AngloGold Ashanti’s ordinary shares in light of their particular circumstances.
Backup Withholding and Information Reporting
For a noncorporate U.S. Shareholder, information reporting requirements, on IRS Form 1099, generally will apply to dividend
payments or other taxable distributions made to the noncorporate U.S. Shareholder within the United States, and to the payment
of proceeds to the noncorporate U.S. Shareholder from the sale of AngloGold Ashanti’s ordinary shares effected at a United
States office of a broker.
Additionally, backup withholding (currently at a 24 percent rate) may apply to such payments if the noncorporate U.S.
Shareholder fails to comply with applicable certification requirements or are notified by the IRS that the noncorporate U.S.
Shareholder failed to report all interest and dividends required to be shown on the noncorporate U.S. Shareholder’s federal
income tax returns.
A non-U.S. Shareholder is generally exempt from backup withholding and information reporting requirements with respect to
dividend payments made to the non-U.S. Shareholder outside the United States by AngloGold Ashanti or another non-United
States payor. A non-U.S. Shareholder is also generally exempt from backup withholding and information reporting requirements
in respect of dividend payments made within the United States and the payment of the proceeds from the sale of AngloGold
Ashanti’s ordinary shares effected at a United States office of a broker, as long as either (i) the payor or broker does not have
actual knowledge or reason to know that the non-U.S. Shareholder is a United States person and the non-U.S. Shareholder has
furnished a valid IRS Form W-8 or other documentation upon which the payor or broker may rely to treat the payments as made
to a non-U.S. person, or (ii) the non-U.S. Shareholder otherwise establishes an exemption.
Payment of the proceeds from the sale of AngloGold Ashanti’s ordinary shares effected at a foreign office of a broker generally
will not be subject to information reporting or backup withholding. However, a sale effected at a foreign office of a broker could be
subject to information reporting in the same manner as a sale within the United States (and in certain cases may be subject to
backup withholding as well) if (i) the broker has certain connections to the United States, (ii) the proceeds or confirmation are
sent to the United States or (iii) the sale has certain other specified connections with the United States.
A shareholder generally may obtain a refund of any amounts withheld under the backup withholding rules that exceed the
shareholder’s income tax liability by filing a refund claim with the IRS.
The determination of the actual tax consequences to a shareholder will depend on the shareholder’s specific situation.
Shareholders should consult their own tax advisors as to the tax consequences in their particular circumstances,
including the applicability and effect of the alternative minimum tax and any state, local, foreign or other tax laws and
changes in those laws.
278
10F.DIVIDENDS AND PAYING AGENTS
Not applicable.
10G.STATEMENT BY EXPERTS
Not applicable.
10H.DOCUMENTS ON DISPLAY
AngloGold Ashanti files annual reports on Form 20-F and reports on Form 6-K with the SEC. You may access this information at
the SEC’s home page (http://www.sec.gov). Copies of the documents referred to herein may be inspected at AngloGold Ashanti’s
offices by contacting AngloGold Ashanti at 4th Floor, Communications House, South Street, Staines-upon-Thames, Surrey, TW18
4PR, United Kingdom, Attention: Company Secretary, telephone number: +44 (0) 203 968 3320.
No material on the AngloGold Ashanti website forms any part of, or is incorporated by reference into, this annual report on
Form 20-F. References herein to the Company’s website shall not be deemed to cause such incorporation.
10I.SUBSIDIARY INFORMATION
Not applicable.
10J. ANNUAL REPORT TO SECURITY HOLDERS
AngloGold Ashanti has submitted its annual report provided to security holders in electronic format as an exhibit to a current
report on Form 6-K.
279
ITEM 11: QUANTITATIVE AND QUALITATIVE DISCLOSURES ABOUT MARKET RISK
In the normal course of its operations, the Group is exposed to gold price and other commodity price risk, foreign exchange risk
and interest rate risk. In order to manage these risks, the Group may enter into transactions which make use of derivatives. The
Group does not acquire, hold or issue derivatives for speculative purposes. The Group has developed a comprehensive risk
management process to facilitate, control and monitor these risks.
Commodity price risk
Commodity price risk arises from the risk of an adverse effect on current or future earnings resulting from fluctuations in the price
of gold and Brent Crude oil. In order to manage gold price downside risk the Group enters into zero-cost collars for a portion of
its production. During the first quarter of 2023 the Group entered into zero-cost collars for a total of approximately 136,000
ounces of gold for the period from February 2023 to December 2023, during the second quarter of 2023 the Group entered into
zero-cost collars for a total of approximately 47,000 ounces of gold for the period from January 2024 to June 2024 and during the
fourth quarter of 2023 the Group entered into zero-cost collars for a total of approximately 300,000 ounces of gold for the period
from January 2024 to December 2024.
The Group makes use of forward contracts to mitigate price movements on Brent Crude oil purchases. In July 2022, the Group
entered into forward contracts for a total of 999,000 barrels of Brent Crude oil for the period from January 2023 to December
2023 that would be cash settled on a monthly basis against the contract price. The average price achieved on the forward
contracts was $89.20 per barrel of Brent Crude oil.
Foreign exchange risk
The Group has transactional foreign exchange exposures, which arise from sales or purchases by an operating unit in currencies
other than the unit's functional currency. The gold market is predominantly priced in US dollars which exposes the Group to the
risk of fluctuations in the Brazilian real/US dollar, Argentinean peso/US dollar, Australian dollar/US dollar, South African rand/US
dollar and Tanzanian shilling/US dollar exchange rates.
Interest rate risk
The Group's interest rate risk arises mainly from variable interest rate borrowings due to the volatility in the United States,
Australian and Tanzanian interest rates. Interest rate risk arising from borrowings is offset by cash and cash equivalents and
restricted cash held at variable rates.
The following is a breakdown of our financial instruments and a summary of fixed versus floating interest rate exposures.
280
US Dollar millions (1) | 2024 | 2025 | 2026 | 2027 | 2028 | Thereafter | Total | Fair value |
Borrowings (2) | ||||||||
Fixed rate (US$) | — | — | — | — | 750 | 1,000 | 1,750 | 1,567 |
Average interest rate | 4.1% | 4.1% | 4.1% | 4.1% | 4.1% | 4.6% | ||
Variable rate (US$) | 63 | 65 | — | — | 250 | — | 378 | 378 |
Average interest rate | 8.9% | 8.3% | 6.8% | 6.8% | 6.8% | 0.0% | ||
Variable rate (TZS) | 123 | — | — | — | — | — | 123 | 123 |
Average interest rate | 12.6% | 0.0% | 0.0% | 0.0% | 0.0% | 0.0% | ||
186 | 65 | — | — | 1,000 | 1,000 | 2,251 | 2,068 | |
Cash and cash equivalents | ||||||||
Variable rate (US$) | 546 | — | — | — | — | — | 546 | 546 |
Average interest rate | 3.7% | — | — | — | — | — | ||
Variable rate (ARS) | 89 | — | — | — | — | — | 89 | 89 |
Average interest rate | 110.0% | — | — | — | — | — | ||
Variable rate (ZAR) | 50 | — | — | — | — | — | 50 | 50 |
Average interest rate | 8.1% | — | — | — | — | — | ||
Variable rate (AUD) | 47 | — | — | — | — | — | 47 | 47 |
Average interest rate | 4.0% | — | — | — | — | — | ||
Variable rate (BRL) | 8 | — | — | — | — | — | 8 | 8 |
Average interest rate | 12.3% | — | — | — | — | — | ||
Variable rate (GBP) | 3 | — | — | — | — | — | 3 | 3 |
Average interest rate | 1.5% | — | — | — | — | — | ||
743 | — | — | — | — | — | 743 | 743 | |
Restricted cash | ||||||||
Variable rate (AUD) | 11 | — | — | — | — | — | 11 | 11 |
Average interest rate | 4.0% | — | — | — | — | — | ||
Variable rate (US$) | 23 | — | — | — | — | 34 | 57 | 57 |
Average interest rate | 1.8% | — | — | — | — | — | ||
34 | — | — | — | — | 34 | 68 | 68 |
(1) Information is presented in US dollar, which is the reporting currency of AngloGold Ashanti.
(2) Borrowings reflect principal repayments in each year.
For further information on market risk, including on the sensitivity of our financial instruments to selected changes in interest
rates and foreign exchange rates, refer to “Item 3D: Risk Factors—The price of gold, AngloGold Ashanti’s principal product, and
other commodity market price fluctuations could adversely affect the profitability of operations”, “Item 3D: Risk Factors—Foreign
exchange fluctuations could have a material adverse effect on AngloGold Ashanti’s results of operations and financial condition”,
“Item 3D: Risk Factors—The profitability of mining companies’ operations and the cash flows generated by these operations are
significantly affected by fluctuations in input production prices, many of which are linked to the prices of oil and steel”, and “Item
18: Financial Statements—Note 31—Financial risk management activities”.
281
ITEM 12:DESCRIPTION OF SECURITIES OTHER THAN EQUITY SECURITIES
12A.DEBT SECURITIES
Not applicable.
12B.WARRANTS AND RIGHTS
Not applicable.
12C.OTHER SECURITIES
Not applicable.
12D.AMERICAN DEPOSITARY SHARES
Not applicable.
12D.3. DEPOSITARY FEES AND CHARGES
On 25 September 2023, upon implementation of the corporate restructuring, the ADS Deposit Agreement and ADS facility were
terminated. All outstanding ADSs were converted into a right to receive delivery of a corresponding number of ordinary shares of
AngloGold Ashanti plc. As a result, there were no outstanding ADSs as at 31 December 2023. For further information, refer to
“Item 10C: Material Contracts—Former Deposit Agreement relating to AngloGold Ashanti ADSs”.
12D.4. DEPOSITARY PAYMENTS FOR 2023
During the year ended 31 December 2023, The Bank of New York Mellon, as Depositary, reimbursed AngloGold Ashanti an
amount of $1,118,683 (2022: $934,248; 2021: $1,083,405) mainly for investor relations-related expenses.
282
PART II
ITEM 13:DEFAULTS, DIVIDEND ARREARAGES AND DELINQUENCIES
Due to certain accounting errors as further described in “Item 18: Financial Statements—Note 1—Statement of Compliance—1.3
Restatements—1.3.2 Prior period error in the calculation of a net deferred tax asset with respect to the Obuasi mine and other
restatements”, a technical event of default occurred under the 2022 multi-currency RCF as the Group’s previously issued audited
consolidated financial statements as of and for the year ended 31 December 2022 and its previously issued unaudited
condensed consolidated interim financial statements as of and for the six-month period ended 30 June 2023 did not fairly
represent the consolidated financial condition of the Group as at the date to which they were drawn up.
In March 2024, the Group received waivers from all of its lenders under the 2022 multi-currency RCF in respect of this technical
event of default and any other breach, default or event of default which occurred or which may occur under or in respect of the
2022 multi-currency RCF as a result of, or in connection with, those accounting errors. As a result, at 19 April 2024, the Group
was in compliance with the covenants under its 2022 multi-currency RCF. See “Item 5B: Liquidity and Capital Resources—
Liquidity—Sources of Liquidity—Credit Facilities” and “Item 10C: Material Contracts—Multi-currency Revolving Credit Facility” for
further information about the 2022 multi-currency RCF.
283
ITEM 14:MATERIAL MODIFICATIONS TO THE RIGHTS OF SECURITY HOLDERS AND
USE OF PROCEEDS
On 25 September 2023, the Group completed a corporate restructuring whereby its operations were reorganised under a new
parent company, AngloGold Ashanti plc, incorporated in England and Wales and tax resident in the United Kingdom, with a
primary listing of its ordinary shares on the NYSE. Upon completion of the corporate restructuring, AngloGold Ashanti plc
became the listed UK parent company of the Group and the successor issuer to AngloGold Ashanti Limited. The previous South
African parent company of the Group, AngloGold Ashanti Limited, became a direct, wholly-owned subsidiary of AngloGold
Ashanti plc and was renamed AngloGold Ashanti (Pty) Ltd. Since that date, the rights of the holders of our ordinary shares have
been governed by the articles of association of AngloGold Ashanti plc, the UK Companies Act and the laws of England and
Wales more generally. See “Item 10B: Articles of Association”.
284
ITEM 15: CONTROLS AND PROCEDURES
As discussed in more detail below, due to material weaknesses identified in connection with the restatements described in
“Presentation of information—Explanatory note” and “Item 18: Financial Statements—Note 1—Statement of Compliance—1.3
Restatements”, the Company’s management, including the chief executive officer and chief financial officer, has concluded that
the Company’s disclosure controls and procedures (as defined in Rules 13a-15(e) and 15d-15(e) under the Securities Exchange
Act of 1934, as amended (the “Exchange Act”)) (“DCP”) and its internal control over financial reporting (as defined in Rules
13a-15(f) and 15d-15(f) under the Exchange Act) (“ICFR”) were not effective as of 31 December 2023 (the “Evaluation Date”).
Because the identified material weakness associated with the Obuasi Mine DTA (as defined below) also existed as of 31
December 2022, the Company’s management, including the chief executive officer and chief financial officer, has also concluded
that the Company’s ICFR and its DCP were not effective as of 31 December 2022 notwithstanding management’s prior
conclusions to the contrary as disclosed in AngloGold Ashanti Limited’s annual report on Form 20-F for the financial year ended
31 December 2022.
(a)Evaluation of Disclosure Controls and Procedures
As of the Evaluation Date, the Company, under the supervision and with the participation of its management, including the chief
executive officer and chief financial officer, has evaluated the effectiveness of the Company’s DCP. Based on such evaluation,
the chief executive officer and chief financial officer have concluded that, as of the Evaluation Date, considering the material
weaknesses in ICFR described below under Item 15(b), the Company’s DCP were not effective at ensuring that information
required to be disclosed by the Company in reports that it files or submits under the Exchange Act is recorded, processed,
summarised and reported within the time periods specified in the rules and forms of the SEC. These DCP include without
limitation, controls and procedures designed to ensure that information required to be disclosed by the Company in reports that it
files or submits under the Exchange Act is accumulated and communicated to the Company’s management, including its chief
executive officer and chief financial officer, as appropriate to allow for timely decisions regarding required disclosure.
(b)Management’s Annual Report on Internal Control over Financial Reporting
Management is responsible for establishing and maintaining ICFR for the Company. The Company’s ICFR is a process designed
to provide reasonable assurance regarding the reliability of financial reporting and the preparation of the Company’s financial
statements for external purposes in accordance with IFRS Accounting Standards, as issued by the IASB.
The Company’s ICFR includes those policies and procedures that:
•pertain to the maintenance of records that, in reasonable detail, accurately and fairly reflect transactions and
dispositions of the assets of the Company;
•provide reasonable assurance that transactions are recorded as necessary to permit preparation of financial statements
in accordance with generally accepted accounting principles, and that receipts and expenditures of the Company are
being made only in accordance with authorisations of management and the directors of the Company; and
•provide reasonable assurance regarding prevention or timely detection of unauthorised acquisition, use or disposition of
the Company’s assets that could have a material effect on the financial statements.
Because of its inherent limitations, ICFR may not prevent or detect all misstatements on a timely basis. Projections of any
evaluation of effectiveness to future periods is subject to the risk that controls may become inadequate because of changes in
conditions, or that the degree of compliance with policies and procedures may deteriorate.
The Company’s management has assessed the effectiveness of the Company’s ICFR as of the Evaluation Date. In making this
assessment, management used the criteria set forth in Internal Control — Integrated Framework (2013) issued by the Committee
of Sponsoring Organizations of the Treadway Commission (“COSO”). Based on this assessment, and using those criteria,
considering the material weaknesses described below, management has concluded that the Company’s ICFR was not effective
as of the Evaluation Date.
Material weaknesses
A material weakness is a deficiency, or combination of deficiencies, in ICFR, such that there is a reasonable possibility that a
material misstatement of financial statements will not be prevented or detected on a timely basis. Three material weaknesses
have been identified as of the Evaluation Date.
1.Net deferred tax asset at Obuasi
The Company’s management has identified, as part of its year-end financial closing process, control deficiencies
relating to the calculation of the net deferred tax asset with respect to the Obuasi mine (the “Obuasi Mine DTA”), that
constituted a material weakness as of the Evaluation Date. The Company’s management has concluded that the
285
Company did not design and maintain effective controls to prevent or detect the error relating to the calculation of the
Obuasi Mine DTA.
The Company’s management has concluded that the design of the existing control with respect to the calculation and
review of the Obuasi Mine DTA was deficient as it did not require (i) a specific assessment of the correct application of
Ghanaian tax laws and regulations and (ii) a comparison of the underlying data used in the deferred tax model for the
Obuasi mine to the correct source data (including the supporting business plan), both of which consequently contributed
to the misapplication of the requirements of IFRS Accounting Standards, as issued by the IASB, specifically, IAS 12 –
Income Taxes. This material weakness resulted in a restatement of the Company’s consolidated financial statements
for the financial year ended 31 December 2022 included in this annual report on Form 20-F as described in “Item 18:
Financial Statements—Note 1—Statement of Compliance—1.3 Restatements—1.3.2 Prior period error in the
calculation of a net deferred tax asset with respect to the Obuasi mine and other restatements”, specifically relating to
deferred tax and associated disclosures.
2.Ineffective controls over the impairment and impairment reversal assessment processes
The Company’s management has identified control deficiencies related to the impairment and impairment reversal
assessment processes associated with goodwill, intangible assets and long-lived assets that arose following an internal
restructuring and a redesign of such processes during the second half of 2023. These deficiencies, in the aggregate,
also constituted a material weakness as of the Evaluation Date.
The Company’s management has concluded that the Company did not design and maintain effective controls related to
the impairment and impairment reversal assessment processes with respect to the level of precision applied in the
review of the underlying data and assumptions used in the impairment models. If not remediated, this material
weakness could result in misstatements of impairments, impairment reversals, goodwill, intangible assets, tangible
assets and associated disclosures that would result in a material misstatement to the Company’s consolidated financial
statements that would not be prevented or detected on a timely basis. While this material weakness resulted in a
number of adjusted and unadjusted differences, it did not result in any material misstatements in the Company's
consolidated financial statements previously filed or included in this annual report on Form 20-F.
3.Ineffective ITGC access controls and control documentation over the SAP ERP software system
The Company’s management has identified control deficiencies relating to the management of end-user and privileged
user access in the Company’s Information Technology General Controls (“ITGC”) framework associated with its SAP
Enterprise Resource Planning (“ERP”) software system that, in the aggregate, also constituted a material weakness as
of the Evaluation Date.
The Company’s management has concluded that the Company did not design and maintain effective controls for the
periodic monitoring of (i) end-user and privileged user access and (ii) the use of certain sensitive transaction codes,
each within the Company’s ITGC framework associated with its SAP ERP software system, which is relevant for the
preparation of the Company’s consolidated financial statements and therefore increases the risk of a material
misstatement therein. These deficiencies specifically relate to user access controls that adequately restrict user and
privileged access to the ERP software system and related data to appropriate company personnel. In addition, the
quality of evidence retained supporting the execution of certain user access controls was not always at a sufficient level
of detail and such evidence did not consistently document conclusions reached on completion of control activities. If not
remediated, this material weakness could result in misstatements of the Company’s financial statement accounts or
disclosures that would result in a material misstatement to the Company’s consolidated financial statements that would
not be prevented or detected on a timely basis. The Company’s management did not identify any material
misstatements in the Company's consolidated financial statements previously filed or included in this annual report on
Form 20-F that were directly related to this material weakness.
(c)Attestation Report of the Registered Public Accounting Firm
The Company’s independent registered public accounting firm, PricewaterhouseCoopers Inc., has audited the effectiveness of
the Company’s ICFR as of the Evaluation Date, as stated in its report, which is provided in “Item 18: Financial Statements” in this
annual report on Form 20-F.
(d)Changes in Internal Control over Financial Reporting
Plans to Remediate Identified Material Weaknesses
As of the date of this annual report on Form 20-F, the Company’s management, in consultation with its Audit and Risk
Committee, is actively engaged in efforts to remediate the material weaknesses identified above and has prepared a remediation
plan for each material weakness, the key aspects of which are set out below.
286
1.Net deferred tax asset at Obuasi
The Company’s management plans to review and enhance the design of the existing controls to ensure that the controls
are documented in sufficient detail to allow for a systematic approach to the calculation and review of the Obuasi Mine
DTA in line with Ghanaian tax laws and regulations. The Company’s management also plans to design a control
requiring a comparison of the underlying data used in the deferred tax model for the Obuasi mine to the correct source
data (including the supporting business plan). In addition, the Company’s management plans to provide targeted
training to those employees responsible for the execution of the redesigned controls.
2.Ineffective controls over the impairment and impairment reversal assessment processes
The Company’s management plans to formalise the roles and accountabilities of internal stakeholders involved in the
impairment and impairment reversal assessment processes and provide targeted training to those employees
responsible for conducting such processes. In addition, the Company’s management plans to further develop and
implement a standardised template to enhance the evidence of its review of the impairment and impairment reversal
assessment processes. Such template will formalise a consistent approach towards the review of impairment models
and the preparation of related control documentation, including with respect to the level of precision applied in the
review of the underlying data and assumptions used in the impairment models, as well as the review of the outcome of
actual impairment calculations under such models. Such template will enhance the documentation of the results
obtained and the conclusions reached following each such review by management, and create a detailed audit trail
supporting management’s review process.
3.Ineffective ITGC access controls and control documentation over the SAP ERP software system
The Company’s management plans to enhance the existing list of high-risk sensitive transactions by performing a
periodic, and at least annual, risk-based reassessment of sensitive transactions and adding any additional high-risk
sensitive transactions identified from a review of the then current population of available SAP ERP transactions. The
Company’s management also plans to assess users against the updated list of high-risk sensitive transactions
periodically, and at least annually, and remove inappropriate access from users. Furthermore, the Company’s
management also plans to design and implement periodic monitoring controls in respect of end-user and privileged user
access in the Company’s ITGC framework associated with its SAP ERP software system. In addition, the Company’s
management plans to engage in training initiatives with control owners, re-emphasising the importance of timely
execution of controls and retaining sufficient evidence of a high standard and quality to support the conclusions of
controls executed.
The Company’s management believes that the measures described above, as well as other measures that may be implemented,
will remediate each of the material weaknesses described above. However, these material weaknesses will not be considered
remediated until the relevant remediation plans have been fully implemented and there has been appropriate time for the
Company’s management to conclude, through testing, that the controls have been effectively designed and are operating
effectively. As the Company’s management continues to evaluate and improve its ICFR, it may decide to take additional
measures to address any control deficiencies or otherwise strengthen its controls, or it may determine to reconsider and modify
certain of the remediation measures identified above. The Company expects to next assess the effectiveness of its ICFR as of
31 December 2024.
Other than the redesign of impairment and impairment reversal assessment processes referred to under Item 15(b)(2) above,
during the period covered by this annual report on Form 20-F, there were no changes in the Company’s ICFR identified in
connection with the evaluation required by Rules 13a-15(d) and 15d-15(d) under the Exchange Act that have materially affected,
or are reasonably likely to materially affect, the Company’s ICFR.
See also “Item 3D: Risk Factors—AngloGold Ashanti’s inability to maintain effective disclosure controls and procedures and an
effective system of internal control over financial reporting can be expected to negatively impact its ability to accurately and
timely report its financial results and other material disclosures or otherwise cause it to fail to meet its reporting obligations, which
could have a material adverse effect on its operations, investor confidence in its business and the reliability of its financial
statements, and the trading price of AngloGold Ashanti’s ordinary shares”.
287
ITEM 16A:AUDIT COMMITTEE FINANCIAL EXPERT
Membership of the Audit and Risk Committee, including its chairman, comprises only independent non-executive directors, in
compliance with the Sarbanes-Oxley Act. The Sarbanes-Oxley Act requires the board to identify a financial expert from within its
ranks. The board has resolved that Mr. Alan Ferguson is the Audit and Risk Committee’s financial expert. Individually, the
remaining members of the Audit and Risk Committee have considerable knowledge and experience in associated areas such as
audit, risk and corporate governance to help oversee and guide the board and the Company.
288
ITEM 16B:CODE OF ETHICS
In order to comply with the Company’s obligation in terms of the Sarbanes-Oxley Act, and in the interests of good governance,
the Company has systems and procedures to introduce, monitor and enforce its ethical codes and has adopted inter alia (i) a
Code of Business Principles and Ethics applicable to all directors, officers, employees, contractors and consultants of the
Company, (ii) a Code of Ethics for Senior Financial Officers applicable to the Chief Executive Officer, Chief Financial Officer and
Senior Vice President: Group Finance of the Company, and (iii) a whistle-blowing policy (in the form of its Speak-up Group
Standard) that encourages employees to report anonymously if they wish and without fear of retaliation acts of an unethical or
illegal nature that affect the Company’s interests. The Code of Business Principles and Ethics expresses the Company’s
commitment to the conduct of its business in line with ethical standards and is designed to enable directors, officers, employees,
contractors and consultants to perform their roles and duties with integrity and responsibility.
The Speak-up Group Standard provides channels for employees to report acts and practices that are in conflict with the
Company’s Code of Business Principles and Ethics or are unlawful, including financial malpractice or dangers to the public or the
environment. Reports may be made to management or through several mediums including the intranet, internet, e-mail,
telephone, short messaging system (SMS), fax and post. All reports not made to management are administered by a third party,
Tip-Offs Anonymous, to ensure independence of the process. Reported cases are relayed to management through Group
Compliance. A report is provided by Group Compliance to the Serious Concerns Committee, a management committee, on a
quarterly basis as well as the Social, Ethics and Sustainability Committee and the Audit and Risk Committee on a semi-annual
basis. Reporters have the option to request feedback on reported cases. The Speak-up Group Standard encourages reports to
be made in good faith in a responsible and ethical manner. Employees are encouraged to first seek resolution of alleged
malpractices through discussion with their direct managers, if appropriate, or other management including legal, compliance,
human resources or internal audit.
The Code of Business Principles and Ethics for directors, officers, employees, contractors and consultants of the Company, the
Code of Ethics for Senior Financial Officers for the Chief Executive Officer, Chief Financial Officer and Senior Vice President:
Group Finance of the Company, and the whistle-blowing policy (in the form of its Speak-up Group Standard) are available on the
Company’s website at https://www.anglogoldashanti.com/sustainability/governance/policies-standards/.
289
ITEM 16C:PRINCIPAL ACCOUNTANT FEES AND SERVICES
PricewaterhouseCoopers Inc. (“PwC”) served as AngloGold Ashanti’s independent registered public accountants for the financial
year ended 31 December 2023 whilst Ernst & Young Inc. (“EY”) served as AngloGold Ashanti’s independent registered public
accountants for each of the two financial years in the two-year period ended 31 December 2022, for each of which audited
financial statements appear in this annual report on Form 20-F.
The following table presents the aggregate fees for professional services and other services rendered by PwC and EY to
AngloGold Ashanti in 2023 and 2022, respectively.
2023 (5) | 2022 | ||
(in millions) | $ | $ | |
Audit fees(1) | 8.10 | 6.45 | |
Audit-related fees(2) | 2.40 | 1.91 | |
Tax fees(3) | 0.10 | 0.22 | |
All other fees(4) | 0.10 | 0.02 | |
Total | 10.70 | 8.60 |
Rounding may result in computational differences.
(1)The Audit fees consist of fees billed for the annual audit services engagement and other audit services, which are those services that only the external auditor
reasonably can provide, and include the Company audit; statutory audits; attest services; and assistance with and review of documents filed with the SEC.
(2)Audit-related fees consist of fees billed for assurance and related services.
(3)Tax fees include fees billed for tax advice and tax compliance services.
(4)All other fees include non-audit services such as advisory fees for the court-sanctioned capital reduction of AngloGold Ashanti plc and subscription fees for
PwC’s digital platform on accounting and business insights.
(5) Also includes fees for professional services and other services rendered by PricewaterhouseCoopers LLP as the UK statutory auditors of the Company for the
purposes of the UK Companies Act.
Audit and Risk Committee Pre-Approval Policies and Procedures
Under the charter of the Audit and Risk Committee (the “A&RC Charter”), the Audit and Risk Committee must pre-approve all
audit and permissible non-audit services to be provided by the independent registered public accounting firm, as set forth in
Section 10A of the Exchange Act (subject to the de minimis exceptions for non-audit services described in Section 10A(i)(1)(B) of
the Exchange Act) and the rules and regulations promulgated thereunder by the SEC. As permitted under the A&RC Charter, the
Audit and Risk Committee has delegated the pre-approval authority to the chairman of the Audit and Risk Committee, Mr. Alan
Ferguson, or his designated official.
All non-audit services provided to AngloGold Ashanti by its independent registered public accounting firm during 2023 were
reviewed and approved according to the procedures described above. None of such services provided during 2023 were
approved under the de minimis exception allowed under the Exchange Act.
Audit Firm Rotation
On 19 November 2021, PwC was appointed by AngloGold Ashanti’s Audit and Risk Committee as the Group’s independent
registered public accountants for the financial year ended 31 December 2023 after a formal tender process to appoint a new
independent registered public accounting firm. The appointment of PwC was approved by AngloGold Ashanti’s shareholders at
the AGM on 16 May 2022. EY resigned as independent registered public accountants of the Group on conclusion of its
responsibilities relating to the audit of the financial year ended 31 December 2022.
ITEM 16D:EXEMPTIONS FROM THE LISTING STANDARDS FOR AUDIT COMMITTEES
Not applicable.
290
ITEM 16E:PURCHASES OF EQUITY SECURITIES BY THE ISSUER AND AFFILIATED
PURCHASERS
The following table provides information about purchases by us and our affiliated purchasers during the fiscal year ended 31
December 2023 of equity securities that are registered by us pursuant to Section 12 of the Exchange Act:
Period | Total number of ordinary shares purchased (1) | Average price paid per ordinary share (2)(3) (in ZAR) | Total number of ordinary shares purchased as part of publicly announced plans or programmes | Maximum number of ordinary shares that may yet be purchased under the plans or programmes |
January 2023 | — | — | — | — |
February 2023 | — | — | — | — |
March 2023 (4) | 2,923 | 394.00 | — | — |
April 2023 | — | — | — | — |
May 2023 | — | — | — | — |
June 2023 (4) | 111,895 | 427.43 | — | — |
July 2023 | — | — | — | — |
August 2023 | — | — | — | — |
September 2023 (4) | 2,053 | 320.06 | — | — |
October 2023 | — | — | — | — |
November 2023 | — | — | — | — |
December 2023 (5) | 20,317 | 311.70 | — | — |
Total | 137,188 | — | — |
(1) Ordinary shares purchased to satisfy awards under our equity-based plans as described in “Item 6E: Share Ownership” or in satisfaction of buy-out or sign-on
awards.
(2) All purchases were made in open-market transactions on the JSE and are therefore denominated in South African rand.
(3) Excludes broker and transaction fees.
(4) The purchased equity securities consisted of ordinary shares of AngloGold Ashanti Limited.
(5) The purchased equity securities consisted of ordinary shares of AngloGold Ashanti plc.
291
ITEM 16F:CHANGE IN REGISTRANT’S CERTIFYING ACCOUNTANT
Not applicable.
ITEM 16G:CORPORATE GOVERNANCE
While AngloGold Ashanti is incorporated under the laws of England and Wales and therefore subject to the UK Companies Act
and its articles of association, its ordinary shares are not listed on any securities exchange in the United Kingdom and therefore
the Company is not subject to the UK Listing Rules.
AngloGold Ashanti’s ordinary shares are listed on the NYSE. We do not believe AngloGold Ashanti’s corporate governance
practices differ significantly from those followed by U.S. domestic companies under the NYSE Listing Standards other than as
described below.
The NYSE Listing Standards generally require shareholder approval for the adoption of, or any material revisions to, equity
compensation plans. However, under the NYSE Listing Standards, AngloGold Ashanti is permitted to follow home country
practice in lieu of such requirements and has elected to do so. Under its articles of association and the UK Companies Act,
AngloGold Ashanti is not required to seek shareholder approval for the adoption of, or any material revisions to, equity
compensation plans.
The NYSE Listing Standards also generally require shareholder approval for certain issuances of securities. However, under the
NYSE Listing Standards, AngloGold Ashanti is permitted to follow home country practice in lieu of such requirements and has
generally elected to do so. While under its articles of association and the UK Companies Act, AngloGold Ashanti is not required
to seek shareholder approval for issuances of securities in all circumstances for which the NYSE Listing Standards applicable to
U.S. domestic companies require such shareholder approval, its articles of association provide that, with respect to any issuance
of common stock, or securities convertible into or exercisable for common stock, in which either the voting power or number of
such securities constitutes, or upon issuance will constitute, 20 percent or more of the voting power or number of securities
outstanding before such issuance, AngloGold Ashanti must obtain shareholder approval, which requirement is in compliance with
the NYSE Listing Standards applicable to U.S. domestic companies. Furthermore, if any issuance of securities were to exceed
the directors’ authority to allot securities or disapply pre-emption rights pursuant to AngloGold Ashanti’s articles of association,
shareholder approval would also be required in respect of such issuance.
292
ITEM 16H:MINE SAFETY DISCLOSURE
The information concerning certain mine safety violations or other regulatory matters required pursuant to Section 1503(a) of the
Dodd-Frank Wall Street Reform and Consumer Protection Act and this Item 16H of Form 20-F is included in Exhibit 19.16 to this
annual report on Form 20-F.
ITEM 16I:DISCLOSURE REGARDING FOREIGN JURISDICTIONS THAT PREVENT
INSPECTIONS
Not applicable.
ITEM 16J:INSIDER TRADING POLICIES
Not applicable.
ITEM 16K:CYBERSECURITY
Risk Management and Strategy
AngloGold Ashanti’s cybersecurity governance employs a comprehensive and integrated approach to risk management,
engaging both internal teams and third-party service providers. The Company has established protocols for continuous
monitoring and proactive management of cybersecurity threats through daily and weekly meetings and continuous interactions
with its third-party around-the-clock Cyber Security Operations Centre (the “SOC”). In addition to maintaining security scores
above industry benchmarks according to third-party rating services, the SOC regularly engages in discussions with AngloGold
Ashanti’s internal cyber safety team and other digital technology stakeholders to address identified threats and vulnerabilities.
The Company’s strategy includes monthly cross-departmental cyber risk management meetings and maintenance of a detailed
cyber risk register, continuously updated for thorough risk assessment. Annually, the Company conducts external penetration
tests and monthly internal phishing simulations to evaluate and enhance its incident response capabilities and employee
alertness to cyber threats. Regular tabletop exercises further reinforce the Company’s preparedness in responding to potential
cyber incidents, ensuring the security and trust of its stakeholders in its robust cyber governance practices.
The Company’s cybersecurity processes are integrated into its broader enterprise-wide risk management systems. The routine
engagement between AngloGold Ashanti’s internal cyber safety team and other digital technology stakeholders, other internal
departments and the SOC underscores the Company’s comprehensive approach to risk assessment and mitigation. To better
integrate with the Company’s risk management systems, weekly and monthly meetings between the cyber safety team and
representatives from the digital technology function and Group Risk Management, respectively, have been implemented. The
Chief Information Security Officer (“CISO”) (designated the Vice President Cyber Safety) meets with the Chief Information Officer
(“CIO”) (designated the Senior Vice President Digital Technology) on a weekly basis. In addition, there are monthly Cyber Risk
Committee working group meetings involving members from Group Internal Audit, Group Risk Management, Group Security,
Group Safety and Group Compliance.
The Company routinely engages third parties in its cybersecurity operations. This engagement includes:
•Periodically consulting with external experts to provide specialised services on cybersecurity (such as penetration test
exercises).
•Annual reviews conducted by AngloGold Ashanti’s Group Internal Audit, using the Center for Internet Security (“CIS”)
framework as a benchmark to gauge the Company’s cybersecurity readiness.
•Utilising a third-party training platform to conduct and report upon cyber safety awareness training, which includes a
range of predefined training modules (“Cyber Safety Awareness Training”). This training is designed to ensure staff
remain updated on the latest cyber safety practices.
•Collaboration with a dedicated partner focused on operational technology cybersecurity. The Company believes
partnerships of this type are essential for addressing specific cybersecurity challenges in operational technology
environments.
•Outsourcing AngloGold Ashanti’s SOC to a managed service provider. The SOC operates around the clock, offering
continuous monitoring and proactive response to potential cybersecurity threats.
AngloGold Ashanti has subscribed to well-established third-party risk management solutions to fortify its oversight of third-party
cyber risks, utilising their continuous monitoring and risk rating system to preemptively address and mitigate potential threats in
its vendor network. In addition to these proactive measures, the Company has reached out specifically to vendors with access to
the AngloGold Ashanti network, ensuring they comply with its Cyber Safety Awareness Training mandate. This initiative
emphasises the importance of completing training campaigns and increasing cyber awareness about various cyber risks, such
293
as clicking on malicious links. This targeted outreach to the Company’s vendors with access to the AngloGold Ashanti network
forms a vital part of AngloGold Ashanti’s strategy to manage cybersecurity threats from third-party service providers. Further,
starting from the first quarter of 2023, the Company has initiated a process to include a cybersecurity clause in new vendor
contracts to assert a proactive cyber defence posture, ensuring service level agreements, roles and responsibilities for managing
cybersecurity threats are established from the outset of its commercial relationships. For contracts that were in place prior to this
initiative, the Company expects to incorporate cybersecurity clauses upon their amendment and/or renewal. This initiative is part
of a broader effort to embed AngloGold Ashanti’s cybersecurity standards into all third-party relationships.
Governance
Management Systems
AngloGold Ashanti has established governance procedures to manage cybersecurity threats. Several individuals in management
positions, including the CIO, the CISO and specific management committees are tasked with gauging cybersecurity threats and
formulating strategies to counteract them.
Management at AngloGold Ashanti plays a pivotal role in both assessing and managing the Company’s risks stemming from
cybersecurity threats. The Company’s CIO is accountable for the Company’s digital technology function. The Company’s CISO
leads the Company’s cybersecurity strategy and initiatives. Alongside internal legal expertise, the Company has engaged
external counsel for cybersecurity legal matters to provide specialised knowledge and legal insight. This partnership enhances
the Company’s cybersecurity framework and prioritises the Company being at the forefront of legal compliance and risk
management. Specialised management working groups such as the Cyber Risk Committee working group also play a pivotal
role, possessing a mix of technical cybersecurity skills and broad risk management capabilities to address the complexities of
cybersecurity challenges. With this collective expertise, both internal and external, each individual and committee member is
strategically positioned to further AngloGold Ashanti’s efforts against potential cybersecurity threats.
There are well-defined processes in place through which these individuals and management committees are kept informed about
cybersecurity matters. This includes regular updates on the prevention of potential threats, detection of actual threats, mitigation
strategies, and post-incident remediation efforts. These processes are designed so that the Company’s management is aware of
the current threat landscape and the actions being taken to address it. The CIO is consistently kept informed of any cyber-related
topics by the CISO during the weekly Digital Technology Management Committee meetings (when required) and/or in their
weekly one-on-one meetings. The CISO develops a comprehensive understanding of all activities within the cyber safety team
through weekly one-on-one meetings with each team lead. This structured and layered approach of communication is designed
to ensure that the CIO is equipped to provide updates on cybersecurity matters directly to the Audit and Risk Committee.
The Company’s Group Risk Management and Group Internal Audit functions have also incorporated cybersecurity into their
mandate, reinforcing the importance of cybersecurity across all levels of the Company. Members from Group Internal Audit and
Group Risk Management participate in monthly Cyber Risk Committee working group meetings together with members from
Group Security and Group Compliance. From a disclosure perspective, the Company assesses the materiality of reported
cybersecurity incidents exclusively through its Disclosure Committee, which provides a focused and expert evaluation of such
incidents against the relevant disclosure standards.
Key Cyber Management
Robin Fell (46)
Bsc (Hons), Physics, Durham University
TOGAF Certification Programme, The Open Group
Project Management Professional (PMP), Project Management Institute
Chief Information Officer (Senior Vice President Digital Technology)
Robin Fell was appointed as CIO of the Company with effect from 1 April 2022 and is the Company’s Senior Vice President
Digital Technology.
Mr. Fell is responsible for planning, implementing, managing and overseeing the overall use of digital technology across
business units, development projects and corporate offices within the Company. A key strategic aspect of his role is to manage
the successful convergence of information and operational technology to protect the business and achieve crucial competitive
advantage. Mr. Fell is also responsible for determining how various emerging digital technologies can benefit the Company and
improve business processes and outcomes. Mr. Fell is the owner of the Company’s “Digital Technology Roadmap” and
responsible for ensuring its alignment with the overall business strategy.
Mornay Walters (54)
PG DIP Information Systems, Leeds Becket University UK
294
Chief Information Security Officer( Vice President Cyber Safety)
Mornay Walters was appointed CISO of the Company with the effective date of 1 September 2017 and is the Company’s Vice
President Cyber Safety. Mr. Walters is responsible for the global Cyber Safety Strategy and Operations within the Company.
Board Oversight
The Company has set up mechanisms to regularly inform both the board of directors and the Audit and Risk Committee about
any potential cybersecurity threats and the measures and strategies taken to counteract them. The Audit and Risk Committee
charter has been tailored to grant the committee specific responsibilities in monitoring and reviewing the Company’s
cybersecurity programme. This includes active engagement in discussions with management on material cybersecurity incidents,
related threats, vulnerabilities, defences and planned responses. The quarterly committee meetings are designed to ensure
ongoing diligence in managing cybersecurity risks. Integral to this process is the role of the CIO. The Company’s CIO, who is
regularly updated about cybersecurity matters in weekly Digital Technology Management Committee meetings (when required)
and/or in weekly one-on-one meetings with the CISO, serves as the primary interface to the board of directors via the Audit and
Risk Committee. To this end, the CIO attends the Audit and Risk Committee meetings, accompanied by the CISO as required.
The CIO reports any questions and advice from the Audit and Risk Committee back to the management experts, providing for a
responsive approach to cyber risk management. Together, when appropriate, the CIO and CISO provide a robust channel of
communication with the board of directors through the Audit and Risk Committee, facilitating the escalation of cyber risks to the
board of directors where necessary via the Audit and Risk Committee. This approach aims to keep the board of directors
consistently informed about the state of cybersecurity threats and the strategies employed to tackle them. Furthermore, the Head
of the Company’s Group Internal Audit team (which has cybersecurity within its purview) also has a direct line of communication
with the Audit and Risk Committee as well as the Chairperson of the board of directors, which structure complements the
Company’s reporting mechanism in order to keep the board of directors informed from multiple perspectives about cybersecurity
matters.
For additional information regarding how cybersecurity threats are reasonably likely to materially affect AngloGold Ashanti’s
business, financial condition, results of operations, cash flows, ability to pay dividends and/or stock price, see “Item 3D: Risk
Factors—Breaches in cybersecurity and violations of data protection laws may adversely impact or disrupt AngloGold Ashanti’s
business” of this Form 20-F.
295
PART III
ITEM 17:FINANCIAL STATEMENTS
Not applicable.
296
ITEM 18:FINANCIAL STATEMENTS
The consolidated financial statements of AngloGold Ashanti plc for each of the three financial years in the period ended
31 December 2023 were authorised for issue by the Board of Directors on 25 April 2024 and were signed on its behalf by Gillian
A Doran, Chief Financial Officer, Maria DC Ramos, Chairperson of the Board of Directors, and Alan M Ferguson, Chairperson of
the Audit and Risk Committee.
The report of independent registered public accounting firm PricewaterhouseCoopers Inc., Johannesburg, Republic of South
The report of independent registered public accounting firm Ernst & Young Inc ., Johannesburg, Republic of South Africa (PCAOB
ID # 1698 ) is included in this Item 18.
F - 1
Report of Independent Registered Public Accounting Firm
To the Board of Directors and Shareholders of AngloGold Ashanti plc
Opinions on the Financial Statements and Internal Control over Financial Reporting
We have audited the accompanying consolidated statement of financial position of AngloGold Ashanti plc and its subsidiaries
(the “Company”) as of 31 December 2023, and the related consolidated income statement, statements of comprehensive
income, changes in equity and cash flows for the year ended 31 December 2023, including the related notes (collectively
referred to as the “consolidated financial statements”). We also have audited the Company’s internal control over financial
reporting as of 31 December 2023, based on criteria established in Internal Control - Integrated Framework (2013) issued by the
Committee of Sponsoring Organizations of the Treadway Commission (COSO).
In our opinion, the consolidated financial statements referred to above present fairly, in all material respects, the financial position
of the Company as of 31 December 2023, and the results of its operations and its cash flows for the year ended 31 December
2023 in conformity with IFRS Accounting Standards as issued by the International Accounting Standards Board. Also in our
opinion, the Company did not maintain, in all material respects, effective internal control over financial reporting as of 31
December 2023, based on criteria established in Internal Control - Integrated Framework (2013) issued by the COSO because
material weaknesses in internal control over financial reporting existed as of that date related to: (i) net deferred tax asset at
Obuasi; (ii) ineffective controls over the impairment and impairment reversal assessment processes; and (iii) ineffective
information technology general controls (“ITGC”) access controls and control documentation over the SAP Enterprise Resource
Planning (“ERP”) software system.
A material weakness is a deficiency, or a combination of deficiencies, in internal control over financial reporting, such that there is
a reasonable possibility that a material misstatement of the annual or interim financial statements will not be prevented or
detected on a timely basis. The material weaknesses referred to above are described in Management's Annual Report on
Internal Control over Financial Reporting appearing under Item 15(b). We considered these material weaknesses in determining
the nature, timing, and extent of audit tests applied in our audit of the 2023 consolidated financial statements, and our opinion
regarding the effectiveness of the Company’s internal control over financial reporting does not affect our opinion on those
consolidated financial statements.
We also have audited the adjustments to the 31 December 2022 and 31 December 2021 consolidated financial statements to
retrospectively recognise the corporate restructuring, as described in Note 1.3.1. In our opinion, such adjustments are
appropriate and have been properly applied. We were not engaged to audit, review, or apply any procedures to the 31 December
2022 or 31 December 2021 consolidated financial statements of the Company other than with respect to the adjustments to the
31 December 2022 and 31 December 2021 consolidated financial statements to retrospectively recognise the corporate
restructuring, as described in Note 1.3.1 and, accordingly, we do not express an opinion or any other form of assurance on the
31 December 2022 and 31 December 2021 consolidated financial statements taken as a whole.
Basis for Opinions
The Company's management is responsible for these consolidated financial statements, for maintaining effective internal control
over financial reporting, and for its assessment of the effectiveness of internal control over financial reporting, included in
Management's Annual Report on Internal Control over Financial Reporting appearing under Item 15(b). Our responsibility is to
express opinions on the Company’s consolidated financial statements and on the Company's internal control over financial
reporting based on our audit. We are a public accounting firm registered with the Public Company Accounting Oversight Board
(United States) (PCAOB) and are required to be independent with respect to the Company in accordance with the U.S. federal
securities laws and the applicable rules and regulations of the Securities and Exchange Commission and the PCAOB.
We conducted our audit in accordance with the standards of the PCAOB. Those standards require that we plan and perform the
audit to obtain reasonable assurance about whether the consolidated financial statements are free of material misstatement,
whether due to error or fraud, and whether effective internal control over financial reporting was maintained in all material
respects.
Our audit of the consolidated financial statements included performing procedures to assess the risks of material misstatement of
the consolidated financial statements, whether due to error or fraud, and performing procedures that respond to those risks.
Such procedures included examining, on a test basis, evidence regarding the amounts and disclosures in the consolidated
financial statements. Our audit also included evaluating the accounting principles used and significant estimates made by
management, as well as evaluating the overall presentation of the consolidated financial statements. Our audit of internal control
over financial reporting included obtaining an understanding of internal control over financial reporting, assessing the risk that a
material weakness exists, and testing and evaluating the design and operating effectiveness of internal control based on the
assessed risk. Our audit also included performing such other procedures as we considered necessary in the circumstances. We
believe that our audit provides a reasonable basis for our opinions.
F - 2
Definition and Limitations of Internal Control over Financial Reporting
A company’s internal control over financial reporting is a process designed to provide reasonable assurance regarding the
reliability of financial reporting and the preparation of financial statements for external purposes in accordance with generally
accepted accounting principles. A company’s internal control over financial reporting includes those policies and procedures that
(i) pertain to the maintenance of records that, in reasonable detail, accurately and fairly reflect the transactions and dispositions
of the assets of the company; (ii) provide reasonable assurance that transactions are recorded as necessary to permit
preparation of financial statements in accordance with generally accepted accounting principles, and that receipts and
expenditures of the company are being made only in accordance with authorizations of management and directors of the
company; and (iii) provide reasonable assurance regarding prevention or timely detection of unauthorized acquisition, use, or
disposition of the company’s assets that could have a material effect on the financial statements.
Because of its inherent limitations, internal control over financial reporting may not prevent or detect misstatements. Also,
projections of any evaluation of effectiveness to future periods are subject to the risk that controls may become inadequate
because of changes in conditions, or that the degree of compliance with the policies or procedures may deteriorate.
Critical Audit Matters
The critical audit matters communicated below are matters arising from the current period audit of the consolidated financial
statements that were communicated or required to be communicated to the audit committee and that (i) relate to accounts or
disclosures that are material to the consolidated financial statements and (ii) involved our especially challenging, subjective, or
complex judgments. The communication of critical audit matters does not alter in any way our opinion on the consolidated
financial statements, taken as a whole, and we are not, by communicating the critical audit matters below, providing separate
opinions on the critical audit matters or on the accounts or disclosures to which they relate.
Assessment of impairment and impairment reversals for tangible, intangible and right of use assets
As described in notes 12, 13 and 14 to the consolidated financial statements, the Company has tangible assets of USD 4 419
million, intangible assets of USD 107 million, which includes goodwill of USD 105 million, and right of use assets of USD 142
million at 31 December 2023. Furthermore, as described in note 12 to the consolidated financial statements, management
recognised a net impairment of tangible assets and right of use assets of USD 192 million for the year ended 31 December 2023,
mainly related to an impairment of USD 47 million in respect of the Córrego do Sítio (“CdS”) mine cash generating unit (“CGU”),
an impairment of USD 105 million in respect of the Serra Grande mine CGU and a net impairment of USD 15 million in respect of
the Cuiabá mine CGU. Management assesses non-financial assets for indicators of impairment as well as reversal of impairment
at each reporting period or whenever events or changes in circumstances indicate that the carrying value of a CGU may not be
recoverable or previous impairment should be reversed. An impairment assessment is performed annually on goodwill. The
recoverable amounts for the CGUs were determined on a fair value less costs of disposal basis using discounted estimates of
future cash flows derived from the life of mine (“LOM”) plans and value beyond Proven and Probable Mineral Reserve (including
exploration potential) to the extent this would be taken into account by a third party market participant. The CdS CGU was fully
impaired at 31 December 2023 due to challenging operating results and CdS being placed under care and maintenance in the
current year. The Serra Grande CGU was partially impaired during the year mainly due to a projection of lower grades and
ounces. The Cuiabá CGU was partially impaired during the year due to a suspension of operating activities. At 31 December
2023, management recognised an impairment reversal of USD 38 million related to the prior year impairment of the Cuiabá
CGU due to certainty in the processing of gold concentrate and improved operating results. Key assumptions in determining the
recoverable amounts of the CGUs are future gold prices, weighted average cost of capital rates, exchange rates, annual LOM
plans, Mineral Reserves estimates and value beyond Proven and Probable Mineral Reserve (including exploration potential).
The principal considerations for our determination that performing procedures relating to the assessment of impairment and
impairment reversals for tangible, intangible and right of use assets is a critical audit matter are (i) the significant judgment by
management in determining the recoverable amount for each relevant CGU; (ii) a high degree of auditor judgment, subjectivity,
and effort in evaluating management’s future cash flows and key assumptions, including future gold prices, weighted average
cost of capital rates, exchange rates, annual LOM plans, Mineral Reserves estimates and value beyond Proven and Probable
Mineral Reserve (including exploration potential); and (iii) the audit effort involved the use of professionals with specialised skill
and knowledge. As described in the “Opinions on the Financial Statements and Internal Control over Financial Reporting”
section, a material weakness was identified related to this matter.
Addressing the matter involved performing procedures and evaluating audit evidence in connection with forming our overall
opinion on the consolidated financial statements. These procedures included testing the effectiveness of controls relating to
management's impairment assessments, including controls relating to the key assumptions used in determining the recoverable
amount for each relevant CGU. These procedures also included, among others, testing management’s process for calculating
the recoverable amount for each relevant CGU, evaluating the appropriateness of the methodology used in the impairment
models, testing the completeness, accuracy and relevance of the underlying data used in the impairment models, and evaluating
the key assumptions used by management. These key assumptions included future gold prices, weighted average cost of capital
rates, exchange rates, annual LOM plans, Mineral Reserves estimates and value beyond Proven and Probable Mineral Reserve
(including exploration potential). Evaluating the reasonableness of management’s key assumptions involved (i) evaluating key
market-related assumptions (including future gold prices, weighted average cost of capital rates and exchange rates) used in the
models against external market and third party data, (ii) evaluating the reasonableness of the cash flow forecasts used in the
LOM plans and value beyond Proven and Probable Mineral Reserves (including exploration potential) by comparing the cash
flow forecasts to current and historical operational results, the Mineral Resources and Reserves approved by the Company’s
F - 3
Qualified Persons as part of the Mineral Reserves declaration, and agreeing these to final approved long-term business plans,
(iii) performing a retrospective comparison of forecasted cash flows to actual past performance and previous forecasts, and (iv)
performing sensitivity analyses. Professionals with specialised skill and knowledge were used to assist in the evaluation of the
appropriateness of the methodology applied in the impairment models and evaluating the reasonableness of key assumptions
including future gold prices, weighted average cost of capital rates and exchange rates.
Environmental rehabilitation provisions
As described in note 23 to the consolidated financial statements, the Company has made provision for environmental
rehabilitation that comprises a provision for decommissioning of USD 173 million and a provision for restoration of USD 452
million at 31 December 2023. The determination of these provisions is based on, among other considerations, judgements and
estimates of current damage caused, timing and amount of future costs to be incurred to rehabilitate mine sites, estimates of
future inflation, exchange rates and discount rates. Future changes to environmental laws and regulations, technology, life of
mine estimates, inflation rates, foreign currency exchange rates and discount rates could affect the carrying amounts of these
provisions.
The principal considerations for our determination that performing procedures relating to environmental rehabilitation provisions
is a critical audit matter are (i) the significant judgment by management in determining the timing and amount of future costs to
be incurred to rehabilitate mine sites; (ii) a high degree of auditor judgment, subjectivity, and effort in evaluating management’s
assumptions relating to future costs estimates; and (iii) the audit effort involved the use of professionals with specialised skill and
knowledge.
Addressing the matter involved performing procedures and evaluating audit evidence in connection with forming our overall
opinion on the consolidated financial statements. These procedures included testing the effectiveness of controls relating to
management’s review of the environmental rehabilitation provisions calculations and in particular the review of underlying future
costs estimates to be incurred to rehabilitate the mine sites. These procedures also included, among others, testing
management’s process for calculating the environmental rehabilitation provisions, evaluating the competence and objectivity of
management’s experts who produced future cost estimates, evaluating the appropriateness of the methodology used in the
calculations, and testing the completeness, accuracy and relevance of the underlying data used in the calculations. In evaluating
the appropriateness of future cost estimates, we focused on validating that costs underpinning the accounting provision
represent management’s and the experts’ best estimate of expenditure, based on the current extent of mine damage as well as
any risk adjustments included in the estimate. Professionals with specialised skill and knowledge were used to assist in
evaluating the reasonableness of key assumptions including the timing and amount of future costs to be incurred to rehabilitate
the mine sites.
/s/ PricewaterhouseCoopers Inc.
Johannesburg, Republic of South Africa
25 April 2024
We have served as the Company’s auditor since 2022.
F - 4
Report of Independent Registered Public Accounting Firm
To the Shareholders and the Board of Directors of AngloGold Ashanti plc, successor issuer to AngloGold Ashanti
Limited
Opinion on the Financial Statements
We have audited the accompanying consolidated statement of financial position of AngloGold Ashanti Limited (the Company) as
of 31 December 2022 and 2021, the related consolidated statements of income, comprehensive income, cash flows and
changes in equity for each of the two years in the period ended 31 December 2022, and the related notes (collectively referred to
as the “consolidated financial statements”). In our opinion, based on our audits and the report of other auditors, the consolidated
financial statements present fairly, in all material respects, the financial position of the Company at 31 December 2022 and 2021,
and the results of its operations and its cash flows for the years then ended, in conformity with International Financial Reporting
Standards (IFRS) as issued by the International Accounting Standards Board.
We did not audit the financial statements of Kibali (Jersey) Limited (Kibali), a corporation in which the Company has a 50%
interest. In the consolidated financial statements, the Company’s investment in Kibali was stated at $1,054 million and $1,598
million as of 31 December 2022 and 2021, respectively, and the Company’s equity in the net income of Kibali was stated at $144
million in 2022 and $225 million in 2021. Those statements were audited by other auditors whose report has been furnished to
us, and our opinion, insofar as it relates to the amounts included for Kibali, is based solely on the report of the other auditors.
The restatement of the equity balances for the years ended 31 December 2022 and 2021, as disclosed in Note 1.3.1 to the
consolidated financial statements, were not audited by us and, accordingly, we do not express an opinion on them.
Restatement of 2022 and 2021 Consolidated Financial Statements
As discussed in Note 1.3.2 to the consolidated financial statements, the consolidated financial statements at and for the years
ended 31 December 2022 and 2021 have been restated to correct misstatements.
Basis for Opinion
These financial statements are the responsibility of the Company's management. Our responsibility is to express an opinion on
the Company’s financial statements based on our audits. We are a public accounting firm registered with the Public Company
Accounting Oversight Board (United States) (PCAOB) and are required to be independent with respect to the Company in
accordance with the U.S. federal securities laws and the applicable rules and regulations of the U.S. Securities and Exchange
Commission and the PCAOB.
We conducted our audits in accordance with the standards of the PCAOB. Those standards require that we plan and perform the
audit to obtain reasonable assurance about whether the financial statements are free of material misstatement, whether due to
error or fraud. Our audits included performing procedures to assess the risks of material misstatement of the financial
statements, whether due to error or fraud, and performing procedures that respond to those risks. Such procedures included
examining, on a test basis, evidence regarding the amounts and disclosures in the financial statements. Our audits also included
evaluating the accounting principles used and significant estimates made by management, as well as evaluating the overall
presentation of the financial statements. We believe that our audits and the report of other auditors provide a reasonable basis
for our opinion.
/s/ Ernst & Young Inc.
We served as the Company’s auditor from 1944 to 2023.
Johannesburg, Republic of South Africa
17 March 2023, except for the effects of the restatement disclosed in Note 1.3.2, as to which the date is 25 April 2024.
F - 5
PAGE LEFT BLANK INTENTIONALLY
F - 6
ANGLOGOLD ASHANTI PLC
Group income statement
FOR THE YEARS ENDED December 31, 2023, 2022 and 2021
Figures in millions | Notes | 2023 | 2022 | 2021 | ||
Restated (1) (3) | Restated (1) (3) | |||||
US Dollars | ||||||
Revenue from product sales | 3 | |||||
Cost of sales | 4 | ( | ( | ( | ||
(Loss) gain on non-hedge derivatives and other commodity contracts | ( | ( | ||||
Gross profit | ||||||
Corporate administration, marketing and related expenses | ( | ( | ( | |||
Exploration and evaluation costs | ( | ( | ( | |||
Net impairment, derecognition of assets and profit (loss) on disposal | 12 | ( | ( | |||
Corporate restructuring costs (2) | ( | ( | ||||
Other (expenses) income (2) | 5 | ( | ( | ( | ||
Finance income | ||||||
Foreign exchange and fair value adjustments | ( | ( | ( | |||
Finance costs and unwinding of obligations | 6 | ( | ( | ( | ||
Share of associates and joint ventures’ profit | ||||||
Profit before taxation | ||||||
Taxation | 9 | ( | ( | ( | ||
Profit (loss) for the year | ( | |||||
Attributable to: | ||||||
Equity shareholders | ( | |||||
Non-controlling interests | ||||||
( | ||||||
Earnings (loss) per ordinary share | ||||||
Basic earnings (loss) per ordinary share (US cents) | 10 | ( | ||||
Diluted earnings (loss) per ordinary share (US cents) | 10 | ( | ||||
(1) The operating profit sub-total which was previously included in the presentation of the income statement has been removed .
(2) Corporate restructuring costs incurred are costs associated with the AngloGold Ashanti corporate restructuring and related taxes. This includes dividend
withholding taxes of $221 m (2022: nil ; 2021: nil ); Australian landholder duties of $49 m (2022: nil ; 2021: nil ) and corporate advisory costs of $44 m (2022: $14 m;
2021: nil ). The corporate restructuring costs of $14 m for 2022 were previously included in other (expenses) income. Refer to note 1.3.1.
(3)Comparative periods have been retrospectively restated, where indicated, due to the prior period error in the calculation of a net deferred tax asset with respect
to the Obuasi mine. Other errors have also been retrospectively restated. Refer to note 1.3.2.
F - 7
ANGLOGOLD ASHANTI PLC
Group statement of comprehensive income
FOR THE YEARS ENDED December 31, 2023, 2022 and 2021
Figures in millions | 2023 | 2022 | 2021 | |||
Restated (1) | Restated (1) | |||||
US Dollars | ||||||
Profit (loss) for the year | ( | |||||
Items that will be reclassified subsequently to profit or loss: | ( | ( | ||||
Exchange differences on translation of foreign operations | ( | ( | ||||
Items that will not be reclassified subsequently to profit or loss: | ( | ( | ( | |||
Exchange differences on translation of non-foreign operations (2) | ( | ( | ( | |||
Net (loss) gain on equity investments | ( | ( | ( | |||
Actuarial (loss) gain recognised | ( | ( | ||||
Deferred taxation thereon | ( | ( | ||||
Other comprehensive (loss) income for the year, net of tax | ( | ( | ||||
Total comprehensive income for the year, net of tax | ( | |||||
Attributable to: | ||||||
Equity shareholders | ( | |||||
Non-controlling interests | ||||||
( | ||||||
(1)Comparative periods have been retrospectively restated, where indicated, due to the prior period error in the calculation of a net deferred tax asset with respect
to the Obuasi mine. Other errors have also been retrospectively restated. Refer to note 1.3.2.
(2)Exchange differences arising on translation of non-foreign operations following the completion of the corporate restructuring transaction in September 2023 will
be recycled through the income statement on disposal.
F - 8
ANGLOGOLD ASHANTI PLC
Group statement of financial position
AS AT December 31, 2023, 2022 and 2021
Figures in millions | Notes | 2023 | 2022 | 2021 | ||
Restated (1) | Restated (1) | |||||
US Dollars | ||||||
ASSETS | ||||||
Non-current assets | ||||||
Tangible assets | 12 | |||||
Right of use assets | 13 | |||||
Intangible assets | 14 | |||||
Investments in associates and joint ventures | 16 | |||||
Other investments | ||||||
Loan receivable (2) | ||||||
Inventories | ||||||
Trade, other receivables and other assets | 18 | |||||
Reimbursive right for post-retirement benefits | 24 | |||||
Deferred taxation | 25 | |||||
Cash restricted for use | 19 | |||||
Current assets | ||||||
Loan receivable (2) | ||||||
Inventories | 17 | |||||
Trade, other receivables and other assets | 18 | |||||
Cash restricted for use | 19 | |||||
Cash and cash equivalents | 20 | |||||
Total assets | ||||||
EQUITY AND LIABILITIES | ||||||
Share capital and premium | 21 | |||||
Accumulated losses and other reserves | ||||||
Shareholders’ equity | ||||||
Non-controlling interests | ||||||
Total equity | ||||||
Non-current liabilities | ||||||
Borrowings | 22 | |||||
Lease liabilities | 13 | |||||
Environmental rehabilitation and other provisions | 23 | |||||
Provision for pension and post-retirement benefits | 24 | |||||
Trade and other payables | ||||||
Deferred taxation | 25 | |||||
Current liabilities | ||||||
Borrowings | 22 | |||||
Lease liabilities | 13 | |||||
Trade and other payables (3) | 26 | |||||
Environmental rehabilitation and other provisions (3) | 23 | |||||
Bank overdraft | 20 | |||||
Taxation | 27 | |||||
Total liabilities | ||||||
Total equity and liabilities | ||||||
(1) Comparative periods have been retrospectively restated, where indicated, due to the corporate restructuring and due to the prior period error in the calculation of a net deferred tax asset
with respect to the Obuasi mine. Other errors have also been retrospectively restated. Refer to notes 1.3.1 and 1.3.2.
(2) During 2023, Kibali (Jersey) Limited, which holds AngloGold Ashanti’s effective 45 % interest in Kibali Goldmines S.A., declared a dividend in specie through the distribution of a loan
receivable to its shareholders. The investment in joint ventures was reduced in 2023, due to the non-cash dividend distributed as a short-term joint venture loan receivable of $148 m and a
long-term joint venture loan receivable of $358 m. The short-term portion was based on the Kibali Goldmines S.A. future estimated cash flows. The loan bears semi-annual interest at
(3)Short-term provisions, which were previously reported as part of trade and other payables and other provisions, are now reported as part of environmental rehabilitation and other provisions
on the statement of financial position. Refer to note 1.3.2.
F - 9
ANGLOGOLD ASHANTI PLC
Group statement of cash flows
FOR THE YEARS ENDED December 31, 2023, 2022 and 2021
Figures in millions | Notes | 2023 | 2022(2) | 2021(2) | ||
US Dollars | ||||||
Cash flows from operating activities | ||||||
Cash generated from operations | 28 | |||||
Dividends received from joint ventures | ||||||
Taxation refund | 27 | |||||
Taxation paid | 27 | ( | ( | ( | ||
Net cash inflow (outflow) from operating activities | ||||||
Cash flows from investing activities | ||||||
Capital expenditure on tangible and intangible assets (1) | 12, 14 | ( | ( | ( | ||
Interest capitalised and paid | ( | ( | ||||
Acquisition of assets | ( | |||||
Dividends from associates and other investments | ||||||
Proceeds from disposal of tangible assets | ||||||
Other investments and assets acquired | ( | ( | ||||
Proceeds from disposal of other investments | ||||||
Proceeds from disposal of joint ventures | ||||||
Loans advanced | ( | ( | ( | |||
Decrease (increase) in cash restricted for use | ( | ( | ||||
Interest received | ||||||
Net cash inflow (outflow) from investing activities | ( | ( | ( | |||
Cash flows from financing activities | ||||||
Share securities tax on redomicile and reorganisation | ( | |||||
Proceeds from borrowings | 22 | |||||
Repayment of borrowings | 22 | ( | ( | ( | ||
Repayment of lease liabilities | 13 | ( | ( | ( | ||
Finance costs - borrowings | 22 | ( | ( | ( | ||
Finance costs - leases | 13 | ( | ( | ( | ||
Other borrowing costs | ( | ( | ( | |||
Dividends paid | ( | ( | ( | |||
Net cash outflow from financing activities | ( | ( | ( | |||
Net increase (decrease) in cash and cash equivalents | ( | ( | ||||
Translation | ( | ( | ( | |||
Cash and cash equivalents at beginning of year (net of bank overdraft) | ||||||
Cash and cash equivalents at end of year (net of bank overdraft) | 20 | |||||
(1)Capital expenditure which previously included disclosure for sustaining and non-sustaining capital expenditure, is now reflected as total capital expenditure on
tangible and intangible assets.
(2)The Group has voluntarily opted to revise the presentation of the statement of cash flows to reflect the indirect method. Refer to note 1.3.2.
F - 10
ANGLOGOLD ASHANTI PLC
Group statement of changes in equity
FOR THE YEARS ENDED December 31, 2023, 2022 and 2021
Equity holders of the parent | ||||||||||
Figures in millions | Share capital and premium | Reorganisatio n reserve | Other capital reserves (1) | Retained earnings (Accumulat ed losses) | Fair value through OCI | Actuarial gains (losses) | Foreign currency translation reserve (2) | Total | Non- controlling interests | Total equity |
US Dollars | ||||||||||
Balance at 31 December 2020 Restated (note 1.3) | ( | ( | ||||||||
Profit (loss) for the year | — | — | — | — | — | |||||
Other comprehensive income (loss) | — | — | — | ( | ( | ( | ( | — | ( | |
Total comprehensive income (loss) | — | — | ( | ( | ( | |||||
Shares issued | — | — | — | — | — | — | ||||
Share-based payment for share awards net of exercised | — | — | — | — | — | — | ||||
Dividends paid (note 11) | — | — | ( | — | — | — | ( | — | ( | |
Dividends of subsidiaries | — | — | — | — | — | — | ( | ( | ||
Translation | — | ( | — | ( | — | ( | ||||
Balance at 31 December 2021 Restated (note 1.3) | ( | ( | ( | |||||||
Profit (loss) for the year | — | — | — | — | — | |||||
Other comprehensive income (loss) | — | — | — | ( | ( | ( | ( | — | ( | |
Total comprehensive income (loss) | — | — | ( | ( | ( | |||||
Shares issued | — | — | — | — | — | — | ||||
Dividends paid (note 11) | — | — | ( | — | — | — | ( | — | ( | |
Dividends of subsidiaries | — | — | — | — | — | — | ( | ( | ||
Transfer on derecognition of equity investment | — | — | ( | — | — | — | ||||
Translation | — | ( | — | ( | — | — | ||||
Balance at 31 December 2022 Restated (note 1.3) | ( | ( | ( | ( | ||||||
Profit (loss) for the year | ( | ( | ( | |||||||
Other comprehensive income (loss) | ( | ( | ||||||||
Total comprehensive income (loss) | — | — | ( | ( | ( | ( | ( | |||
Shares issued | — | |||||||||
Share-based payment for share awards net of exercised | — | ( | — | — | — | — | ( | — | ( | |
Dividends paid (note 11) | — | — | ( | — | — | — | ( | — | ( | |
Dividends of subsidiaries | — | — | — | — | — | ( | ( | |||
Redomicile and reorganisation (note 1.1 and 21) | ( | — | — | — | — | — | — | |||
Share securities tax on redomicile and reorganisation | — | ( | — | ( | ( | |||||
Issue of bonus shares | — | — | — | — | — | — | ||||
Cancellation of bonus shares | ( | — | — | — | — | — | ( | — | ( | |
Transfer on derecognition of equity investment | ( | — | ||||||||
Translation | — | ( | — | — | — | |||||
Balance at 31 December 2023 | ( | ( | ( | ( | ||||||
(1)Other capital reserves include a surplus on disposal of Company shares held by companies prior to the formation of AngloGold Ashanti Limited of $8 m (2022: $8 m;
2021: $9 m), surplus on equity transaction of joint venture of $36 m (2022: $36 m; 2021: $36 m), equity items for share-based payments of $33 m (2022: $39 m; 2021:
$41 m) and other reserves.
(2) Foreign currency translation reserve includes a loss of $1,411 m (2022: $1,401 m; 2021: $1,399 m) that will not re-cycle through the income statement and a loss of
$35 m (2022: $40 m: 2021: $13 m) relating to the foreign operations that will re-cycle through the income statement on disposal. Following the completion of the
corporate restructuring transaction in September 2023, the Group’s parent company changed from being a South African domiciled parent company to a UK parent
company. As the functional currency of the UK parent company has been assessed to be USD, exchange differences of ZAR entities included in the Group arising on
consolidation post the effective date of the corporate restructuring transaction, will be re-cycled through the income statement on disposal.
F - 11
ANGLOGOLD ASHANTI PLC
Notes to the consolidated financial statements
FOR THE YEARS ENDED 31 December, 2023, 2022 and 2021
1STATEMENT OF COMPLIANCE
The consolidated financial statements have been prepared in accordance with IFRS Accounting Standards as issued by the
International Accounting Standards Board (IASB).
The following new accounting standard and amendments to published accounting standards which were effective for the first
time from 1 January 2023, were adopted, and had no material impact on the Group:
•Amendments to IAS 12 ‘Income Taxes’ relating to deferred tax assets and liabilities arising from a single transaction.
•Amendments to IAS 12 ‘Income Taxes’ which provides companies with temporary relief from accounting for deferred taxes
arising from the Organisation for Economic Co-operation and Development’s (OECD) international tax reform.
•IFRS 17 ‘Insurance Contracts’ which is a new standard for the recognition, measurement, presentation and disclosure of
insurance contracts.
The amendments to accounting standards issued which are relevant to the Group, but not yet effective on 31 December 2023,
include:
•Amendments to IFRS 7 ‘Financial Instruments: Disclosure’ and IAS 7 ‘Statement of Cash Flows’ relating to Supplier
Finance Arrangements
The amendments address the presentation of liabilities and the associated cash flows arising out of supplier finance
arrangements, as well as disclosures required for such arrangements. The disclosure requirements in the amendments
enhance the current requirements and are intended to assist users of financial statements in understanding the effects
of supplier finance arrangements on an entity’s liabilities, cash flows and exposure to liquidity risk. The effect of the
amendments to the accounting standard is not expected to have a material impact on the Group’s results.
•Amendments to IAS 21 ‘The Effects of Changes in Foreign Exchange Rates’ relating to Lack of Exchangeability
The amendments clarify how an entity should assess whether a currency is exchangeable and how it should determine
a spot exchange rate when exchangeability is lacking, as well as require the disclosure of information that enables
users of financial statements to understand the impact of a currency not being exchangeable. The effect of the
amendment to the accounting standard is not expected to have a material impact on the Group’s results.
1.1REPORTING ENTITY
On 12 May 2023, the Group announced the intention to implement a corporate restructuring to reorganise its operations under a
new parent company, AngloGold Ashanti plc, incorporated in England and Wales, with a primary listing of its ordinary shares on
the New York Stock Exchange (NYSE). The corporate restructuring was implemented through the issue of ordinary shares of
AngloGold Ashanti plc in exchange for the existing ordinary shares of AngloGold Ashanti Limited.
On 25 September 2023, the Group completed its corporate restructuring with the commencement of trading of the ordinary
shares of AngloGold Ashanti plc on the NYSE, maintaining the ticker symbol AU. Trading in the AngloGold Ashanti Limited
American Depositary Shares (ADSs) on the NYSE ceased at the close of market on 22 September 2023 and the AngloGold
Ashanti Limited ADS programme was terminated with effect from 25 September 2023. AngloGold Ashanti remains committed to
the Johannesburg Stock Exchange (JSE) and A2X Market (A2X) in South Africa and the Ghana Stock Exchange (GSE) in Ghana
on which it has maintained secondary listings. The ordinary shares of AngloGold Ashanti plc were listed on the JSE and A2X on
20 September 2023, maintaining the ticker symbol ANG. The ordinary shares and Ghanaian Depositary Shares of AngloGold
Ashanti plc were listed on the GSE, maintaining the ticker symbols AGA and AAD, respectively, on 26 September 2023.
The AngloGold Ashanti Group is now headquartered in Denver, Colorado, USA and retains a substantial corporate office in
Johannesburg. The Company’s registered office and principal executive office are located in the United Kingdom. The AngloGold
Ashanti plc consolidated financial statements are a continuation of the previous AngloGold Ashanti Limited consolidated financial
statements with the comparative information adjusted to reflect the legal share capital of AngloGold Ashanti plc.
See note 1.3.1 for the accounting treatment of the corporate restructuring transaction.
NOTES TO THE CONSOLIDATED FINANCIAL STATEMENTS
F - 12
On 25 September 2023, the Group completed a corporate restructuring whereby its operations were reorganised under a new
parent company, AngloGold Ashanti plc, which became the listed UK parent company of the Group and the successor issuer to
AngloGold Ashanti Limited, the previous parent company.
The consolidated financial statements have been prepared on a going concern basis under the historical cost convention, except
for the revaluation of certain assets and liabilities to fair value. The Group’s accounting policies are consistent in all material
respects with those applied in the previous year, except for the impact of the corporate restructuring.
The Group financial statements are presented in US dollars. All results are from continuing operations unless otherwise stated.
The Group financial statements incorporate the financial statements of the Company, its subsidiaries and its interests in joint
ventures and associates. The financial statements of all material subsidiaries, joint ventures and associates, are prepared for the
same reporting period as the Company, using the same accounting policies.
Subsidiaries are all entities over which the Group has control. The Group controls an entity when it is exposed to, or has rights
to, variable returns from its involvement with the entity and has the ability to affect those returns through its power over the entity.
Control would generally exist where the Group owns more than 50% of the voting rights, unless the Group and other investors
collectively control the entity where they must act together to direct the relevant activities. In such cases, as no investor
individually controls the entity, the investment is accounted for as an associate, joint venture or a joint operation. Subsidiaries
are fully consolidated from the date on which control is transferred to the Group. They are deconsolidated from the date on which
control ceases. The Group re-assesses whether or not it controls an investee if facts and circumstances indicate that there are
changes to one or more of the elements of control. Intra-group transactions, balances and unrealised gains and losses on
transactions between Group companies, including any resulting tax effects are eliminated.
The going concern assessment included the preparation of detailed cash flow forecasts for at least 12 months and updated life-
of-mine plan models with longer term cash flow projections, which demonstrate that the Group will have sufficient cash, other
liquid resources and undrawn credit facilities to enable it to meet its obligations as they fall due during the 12 months
immediately following the date when the financial statements are authorised for issue.
The Group’s base case going concern assessment is based upon management’s best estimate of gold and foreign exchange
consensus prices, while simultaneously applying a risk adjustment factor to the estimated production which has been determined
in line with approved life-of-mine plans and ongoing capital requirements. A further stress test has been prepared reflecting a
reduction in the consensus gold price, prior to any mitigation strategies in order to assess whether financial maintenance
covenants per the Group’s loan agreements are breached or financial liquidity headroom runs out. The result of this stress test
demonstrated that the likelihood of a decrease in the gold price causing a risk of a financial liquidity shortfall or a breach in the
financial maintenance covenants is remote.
Having assessed the financial position and future plans of the Group, the Directors believe that it is appropriate to adopt the
The Company’s 2020/2021 TCFD-aligned Climate Change Report outlines the Board-approved Climate Change Strategy which
seeks to embed the management of physical and transition climate risks and opportunities into the Company’s strategic and
operational planning processes, a process that was enabled through a refreshed company-wide climate change governance
framework. That Report also summarised, at a high level, findings from physical climate risk assessments conducted at each of
the operating assets, considering a business-as-usual climate scenario.
The potential effect of global decarbonisation scenarios and other transition risks on the Company’s business strategy and
planning assumptions, such as evolving host country climate policies, the cost of energy and other key mining inputs which may
be affected by carbon pricing, is an area that continues to be monitored and assessed.
AngloGold Ashanti does not mine or extract fossil fuels such as coal, natural gas or oil. AngloGold Ashanti does, however, emit
greenhouse gases (GHGs) directly through the combustion of fuels and other energy products at its gold mining operations and
indirectly through the consumption of electricity purchased from national grids that include fossil-based energy in their electricity
production.
The Company continues to execute on its 2021 Board-approved Climate Change Strategy, with a particular focus on developing
and implementing energy decarbonisation projects in support of its objective of reducing Scope 1 and 2 GHG emissions by 30 %
by 2030 as compared to a 2021 baseline, as announced in 2022. This mid-term target is a key milestone en-route to the
NOTES TO THE CONSOLIDATED FINANCIAL STATEMENTS
F - 13
Company’s overall objective of net zero Scope 1 and 2 GHG emissions by 2050, in line with the ambitions of the Paris
Agreement. In addition, the Company has committed to explore opportunities, where feasible, to address Scope 3 GHG
emissions consistent with its commitment, as a member of the International Council on Mining and Metals (ICMM), to set Scope
3 GHG emissions reduction targets.
In 2023, AngloGold Ashanti advanced its collective understanding of the various approaches to applying scenario analyses and
began efforts to quantify certain climate-related risk on its business plans. Having laid the groundwork for this in 2023, work on
developing the financial models will be progressed during 2024 and with a goal to inform its scenario analysis approach moving
forward.
Management has considered certain implications of climate change when preparing the consolidated financial statements. These
considerations, integral to the Group’s strategy and operations, were factored in across various areas:
•Estimates utilised in determining future cash flows in life-of-mine models feeding the impairment process:
•Mine sites are designed with a significant margin of safety to endure extreme weather events, such as heavy rainfall, high
winds, and temperature fluctuations. This engineering means that the structures and operational activities are more durable
than what the average weather conditions would require, resulting in an increased level of resilience against the increasing
severity and frequency of weather events predicted by climate change models.
•Estimates used in determining the environmental rehabilitation provision:
•Rehabilitation designs are progressively adapted to address identified risks, including changing expectations of seasonal
weather patterns.
•Rehabilitation plans and estimates include long-term monitoring and maintenance protocols, which also serve to address
unforeseen effects that may arise from a changing climatic patterns.
•Inclusion of a contingency allowance or risk factor, which may encompass climate change impacts on rehabilitation
success.
•Rehabilitation and decommissioning works scheduling and costing considerations factor in weather conditions to mitigate
risks of schedule and cost overruns.
•Determination of targets for the Group’s Deferred Share Plan.
The significant impacts of climate-related strategic decisions are reflected in management’s assessments and estimates,
particularly concerning future cash flow projections supporting the recoverable amounts of mining assets once the strategic
decisions have been approved by the Board, and the implementation of these is likely. While climate change considerations did
not significantly affect key accounting judgements and estimates in the current year, the focus on climate-related strategic
decisions, like decarbonisation projects and alternative energy sources, could potentially have a substantial impact in future
1.3RESTATEMENTS
1.3.1 Corporate restructuring
As described in note 1.1, the corporate restructuring transaction was completed on 25 September 2023. The acquisition of
AngloGold Ashanti Limited by AngloGold Ashanti plc did not constitute a business combination as defined by IFRS 3 ‘Business
Combinations’ and the predecessor accounting method was followed for the transaction using existing carrying values of assets
and liabilities. This was because neither party to the transaction could be identified as the accounting acquirer and post the
acquisition there was no change of economic substance or ownership in the Group. The shareholders of AngloGold Ashanti plc
have the same commercial and economic interest as they had prior to the transaction and no new additional ordinary shares
were issued as part of the transaction.
The corporate restructuring transaction was implemented on a share-for-share basis with 419,685,792 AngloGold Ashanti plc
ordinary shares issued at a nominal value of $1.00 each. Following the transaction, the consolidated financial statements of
AngloGold Ashanti plc reflect that the transaction is in substance a continuation of the consolidated financial statements of
AngloGold Ashanti Limited and the comparative information is presented as if the reorganisation had occurred at the beginning of
the earliest period presented. In order to effect the reorganisation in the Group at the beginning of the earliest period presented,
the share capital and share premium balances of AngloGold Ashanti Limited were represented to a reorganisation reserve. Post
the corporate restructuring transaction, the reorganisation reserve was adjusted to reflect the issue of AngloGold Ashanti plc
ordinary shares in exchange for AngloGold Ashanti Limited ordinary shares. Whilst the consolidated financial statements are a
continuation of AngloGold Ashanti Limited, the share capital and share premium balances in the statement of changes in equity
and statement of financial position for each of the financial years ended 31 December 2022 and 2021 have been represented to
reflect the effect of the reorganisation. As a result of the corporate restructuring transaction, there were no changes to earnings
per ordinary share (note 10) and dividends (note 11) for each of the financial years ended 31 December 2022 and 2021, as the
earnings per ordinary share and dividends were based on the ordinary shares of AngloGold Ashanti Limited, the previous parent
entity.
NOTES TO THE CONSOLIDATED FINANCIAL STATEMENTS
F - 14
The following disclosures have been impacted by the corporate restructuring transaction:
•Segmental information (note 2): With the change in domicile of the Group’s parent company from South Africa to the
United Kingdom, the segment disclosures have been updated to reflect the country of domicile to be the United
Kingdom. Comparative information has been restated.
•Taxation (note 9): With the change in domicile of the Group’s parent company from South Africa to the United Kingdom,
the Group tax rate reconciliation for 31 December 2023 has been prepared using the UK corporate tax rate of 25 %. The
comparative information is presented using the South African corporate tax rate of 28 %.
Following the completion of the corporate restructuring transaction in September 2023, the Group’s parent company changed
from being a South African domiciled parent company to a UK parent company. As the functional currency of the UK parent
company has been assessed to be USD, exchange differences of ZAR entities included in the Group arising on consolidation
post the effective date of the corporate restructuring transaction, will be re-cycled through the income statement on disposal.
1.3.2 Prior period error in the calculation of a net deferred tax asset with respect to the Obuasi mine and other
restatements
In connection with the preparation of the Group’s consolidated financial statements as of and for the financial year ended 31
December 2023, the Group concluded that its previously issued audited consolidated financial statements as of and for the
financial year ended 31 December 2022 contained an error in the calculation related to the reported amount of the net deferred
tax asset with regard to the Obuasi mine. The group has determined that the error related to an incorrect interpretation of
Ghanaian tax laws and regulations combined with the use of the incorrect underlying data in the deferred tax model for the
Obuasi mine, both of which consequently contributed to the misapplication of the requirements of IFRS Accounting Standards, as
issued by the IASB, specifically, IAS 12 ‘Income Taxes’. Additionally, the Group also corrected other errors which were not
considered material to the previously issued financial statements for the periods ended 31 December 2022 and 2021.
The Group evaluated the effect of these prior period errors and determined that it needed to restate its consolidated financial
statements as of and for the financial year ended 31 December 2022 and would restate its consolidated financial statements as
of and for the financial year ended 31 December 2021, in both cases in accordance with IFRS Accounting Standards. As part of
assessing the impact of the prior period errors, the Group applied the requirements of IAS 8 ‘Accounting Policies, Changes in
Accounting Estimates and Errors’ and the guidance in the SEC Staff Accounting Bulletin No. 99 ‘Materiality’. The aggregate
restatement due to the error related to the reported amount of the net deferred tax asset with regard to the Obuasi mine resulted
in a reduction in profit for the financial year ended 31 December 2022 by $49 m. The restatement due to the other errors which
were also corrected resulted in a reduction in profit for the financial year ended 31 December 2022 by $16 m and a reduction in
profit for the financial year ended 31 December 2021 by $8 m. The restatements had no impact on the Group’s debt, the financial
maintenance covenants in its credit facilities or its statement of cash flows.
The other errors which were corrected related to the following:
a.Kibali - Equity-accounted losses adjustment recorded in 2021 ($6 m) and 2022 ($3 m);
b.Geita - Foreign exchange adjustment on VAT receivable reclassified from 2022 to 2021 ($2
c.Rand Refinery - Derivative fair value adjustment reclassified from 2022 to 2021 ($2
d.Mineração Serra Grande - Impairment adjustment recorded in 2022 ($9 m);
e.Siguiri - Deferred stripping adjustment recorded in 2021 ($2 m) and 2022 ($4 m);
f.Group - Reclassification of environmental rehabilitation provisions from non-current provisions to current provisions in
2021 ($29 38
g.Group - Reclassification of lease liabilities from current liabilities to non-current liabilities in 2022 ($13
h.Group - Reclassification of short-term provisions from trade and other payables to environmental rehabilitation and
other provisions in 2021 ($47 43
The impact of the above restatements on each financial statement line item is presented below.
In addition, in the financial risk management note (note 31), liquidity risk disclosures on trade and other payables were adjusted
to exclude non-financial liabilities in 2021 ($150 m) and 2022 ($145 m).
Voluntary change in cash flow presentation
The Group has voluntarily opted to revise the presentation of the statement of cash flows to reflect the indirect method in
accordance with IAS 7 ‘Statement of Cash Flows’. The revised presentation enhances transparency of the Group’s selected
presentation of cash flows from operating activities. This resulted in the removal of additional disclosures relating to ‘receipts
from customers’ (2022: $4,517 m; 2021: $4,054 m) and ‘payments to suppliers and employees’ (2022: $3,273 m; 2021: $2,701 m)
as previously included in the statement of cash flows.
NOTES TO THE CONSOLIDATED FINANCIAL STATEMENTS
F - 15
1.3 RESTATEMENTS continued
2021 | |||||
Figures in millions | Ref | As reported on 31 December 2021 | 1.3.1 Corporate restructuring | 1.3.2 Other restatements | As restated on 31 December 2021 |
US Dollars | |||||
Income statement | |||||
Cost of sales | e | ( | ( | ( | |
Gross profit | e | ( | |||
Foreign exchange and fair value adjustments | b | ( | ( | ( | |
Share of associates and joint ventures' profit | a,c | ( | |||
Profit before taxation | a,b,c,e | ( | |||
Taxation | b | ( | ( | ||
Profit for the year | a,b,c,e | ( | |||
Attributable to: | |||||
Equity shareholders | a,b,c,e | ( | |||
Basic earnings per ordinary share (US cents) | ( | ||||
Diluted earnings per ordinary share (US cents) | ( | ||||
Headline earnings | a,b,c,e | ( | |||
Basic headline earnings per ordinary share (US cents) | ( | ||||
Diluted headline earnings per ordinary share (US cents) | ( | ||||
Statement of comprehensive income | |||||
Total comprehensive income for the year, net of tax | a,b,c,e | ( | |||
Statement of financial position | |||||
Tangible assets | e | ||||
Investments in associates and joint ventures | a,c | ( | |||
Non-current assets | a,c,e | ||||
— | |||||
Trade, other receivables and other assets | b | ( | |||
Current assets | b | ( | |||
— | |||||
Environmental rehabilitation and other provisions | f | ( | |||
Non-current liabilities | f | ( | |||
— | |||||
Trade and other payables | h | ( | |||
Environmental rehabilitation and other provisions | f,h | ||||
Current liabilities | f | ||||
Statement of changes in equity | |||||
Share capital and premium | ( | ||||
Reorganisation reserve | |||||
Accumulated losses | a,b,c,e | ( | ( | ||
Shareholders' equity | |||||
Non-controlling interests | e | ||||
Total equity | a,b,c,e | ||||
NOTES TO THE CONSOLIDATED FINANCIAL STATEMENTS
F - 16
1.3 RESTATEMENTS continued
2022 | ||||||
Figures in millions | Ref | As reported on 31 December 2022 | 1.3.1 Corporate restructuring | 1.3.2 Obuasi deferred tax restatement | 1.3.2 Other restatements | As restated on 31 December 2022 |
US Dollars | ||||||
Income statement | ||||||
Cost of sales | e | ( | ( | ( | ||
Gross profit | e | ( | ||||
Impairment, derecognition of assets and profit (loss) on disposal | d | ( | ( | ( | ||
Foreign exchange and fair value adjustments | b | ( | ( | |||
Share of associates and joint ventures' profit | a,c | ( | ||||
Profit before taxation | a,b,c,d.e | ( | ||||
Taxation | b,d | ( | ( | ( | ||
Profit for the year | a,b,c,d,e | ( | ( | |||
Attributable to: | ||||||
Equity shareholders | a,b,c,d,e | ( | ( | |||
Non-controlling interests | e | ( | ||||
Basic earnings per ordinary share (US cents) | ( | ( | ||||
Diluted earnings per ordinary share (US cents) | ( | ( | ||||
Headline earnings | a,b,c,e | ( | ( | |||
Basic headline earnings per ordinary share (US cents) | ( | ( | ||||
Diluted headline earnings per ordinary share (US cents) | ( | ( | ||||
Statement of comprehensive income | ||||||
Total comprehensive income for the year, net of tax | a,b,c,d,e | ( | ( | |||
Statement of financial position | ||||||
Tangible assets | d,e | ( | ||||
Investments in associates and joint ventures | a,c | ( | ||||
Deferred taxation | ( | |||||
Non-current assets | a,c,d,e | ( | ( | |||
Lease liabilities | g | |||||
Environmental rehabilitation and other provisions | f | ( | ||||
Non-current liabilities | f,g | ( | ||||
Lease liabilities | g | ( | ||||
Trade and other payables | h | ( | ||||
Environmental rehabilitation and other provisions | f,h | |||||
Current liabilities | f,g | |||||
Statement of changes in equity | ||||||
Share capital and premium | ( | |||||
Reorganisation reserve | ||||||
Accumulated losses | a,b,c,d,e | ( | ( | ( | ( | |
Foreign currency translation reserve | c | ( | ( | ( | ||
Shareholders' equity | a,b,c,d,e | ( | ( | |||
Non-controlling interests | e | |||||
Total equity | a,b,c,d,e | ( | ( | |||
NOTES TO THE CONSOLIDATED FINANCIAL STATEMENTS
F - 17
2SEGMENTAL INFORMATION
AngloGold Ashanti’s operating segments are being reported based on the financial information regularly provided to the Chief
Executive Officer and the Executive Committee, collectively identified as the Chief Operating Decision Maker (CODM). Individual
members of the Executive Committee are responsible for geographic regions of the business.
Under the Group’s operating model, the financial results and the composition of the operating segments are reported to the
CODM per geographical region and the Projects segment which comprises all the major non-sustaining capital projects with the
potential to be developed into operating entities.
In addition to the geographical reportable segments structure, the Group has voluntarily disaggregated and disclosed the
financial information on a line-by-line basis for each mining operation to facilitate comparability of mine performance.
Figures in millions | Gold income | ||||
US Dollars | 2023 | 2022 | 2021 | ||
Geographical analysis of gold income by origin is as follows: | |||||
Africa (1) | |||||
Kibali - Attributable 45% | |||||
Iduapriem | |||||
Obuasi | |||||
Siguiri | |||||
Geita | |||||
Australia | |||||
Sunrise Dam | |||||
Tropicana - Attributable 70% | |||||
Americas | |||||
Cerro Vanguardia | |||||
AngloGold Ashanti Mineração (2) | |||||
Serra Grande | |||||
Equity-accounted joint ventures included above | ( | ( | ( | ||
Geographical analysis of gold income by destination is as follows: | |||||
United Kingdom # | |||||
Foreign entities * | |||||
South Africa # | |||||
Ghana (3) | |||||
North America | |||||
South America | |||||
Australia | |||||
Europe | |||||
*Entities are considered foreign in relation to the Group’s country of domicile. With the change in domicile of the Group’s parent company from South Africa to the
United Kingdom, as a result of the corporate restructuring in September 2023, the segment disclosures have been updated to reflect the country of domicile to be
the United Kingdom. Comparative information has been restated.
#The Siguiri gold production is sold through an agent to multiple customers, the destination of which was previously not determinable, and as a result was
allocated to the Other category in the geographical analysis (2022: $591 m; 2021: $545 m). In the current financial year, the agent was able to provide the
geographical analysis for the gold income including the comparative periods, which have been reclassified to South Africa (2022: $100 m; 2021: $100 m) and the
United Kingdom (2022: $491 m; 2021: $445 m) accordingly. The Kibali gold production which was previously included in the geographical analysis (and allocated
to South Africa) has been removed (2022: $596 m; 2021: $659 m) as this is not required for joint ventures.
The Group's revenue is mainly derived from gold income. Approximately 67 % (2022: 67 %; 2021: 66 %) of the Group's total gold produced is sold to
three customers of the Group: ANZ Investment Bank Ltd in Australia 24 % (2022: 22 %; 2021: 23 %), Standard Chartered Bank in the United Kingdom 23 % (2022:
the bullion banks do not possess significant pricing power.
NOTES TO THE CONSOLIDATED FINANCIAL STATEMENTS
F - 18
Figures in millions | By-product revenue | ||||
US Dollars | 2023 | 2022 | 2021 | ||
Africa (1) | |||||
Kibali - Attributable 45% | |||||
Iduapriem | |||||
Obuasi | |||||
Siguiri | |||||
Geita | |||||
Australia | |||||
Sunrise Dam | |||||
Tropicana - Attributable 70% | |||||
Americas | |||||
Cerro Vanguardia | |||||
AngloGold Ashanti Mineração | |||||
Equity-accounted joint ventures included above | ( | ( | ( | ||
Figures in millions | Cost of sales | ||||
US Dollars | 2023 | 2022 | 2021 | ||
Restated (8) | Restated (8) | ||||
Africa (1) | |||||
Kibali - Attributable 45% | |||||
Iduapriem | |||||
Obuasi | |||||
Siguiri | |||||
Geita | |||||
Australia | |||||
Sunrise Dam | |||||
Tropicana - Attributable 70% | |||||
Administration and other | |||||
Americas | |||||
Cerro Vanguardia | |||||
AngloGold Ashanti Mineração | |||||
Serra Grande | |||||
Administration and other | |||||
Corporate and other | ( | ||||
Equity-accounted joint ventures included above | ( | ( | ( | ||
NOTES TO THE CONSOLIDATED FINANCIAL STATEMENTS
F - 19
Figures in millions | Gross profit (loss) (4) | ||||
US Dollars | 2023 | 2022 | 2021 | ||
Restated (8) | Restated (8) | ||||
Africa (1) | |||||
Kibali - Attributable 45% | |||||
Iduapriem | |||||
Obuasi | |||||
Siguiri | |||||
Geita | |||||
Administration and other | |||||
Australia | |||||
Sunrise Dam | |||||
Tropicana - Attributable 70% | |||||
Administration and other | ( | ( | ( | ||
Americas | |||||
Cerro Vanguardia | |||||
AngloGold Ashanti Mineração | |||||
Serra Grande | ( | ( | |||
Administration and other | ( | ( | ( | ||
Corporate and other | ( | ( | |||
Equity-accounted joint ventures included above | ( | ( | ( | ||
Figures in millions | Amortisation | ||||
US Dollars | 2023 | 2022 | 2021 | ||
Restated (8) | Restated (8) | ||||
Africa (1) | |||||
Kibali - Attributable 45% | |||||
Iduapriem | |||||
Obuasi | |||||
Siguiri | |||||
Geita | |||||
Australia | |||||
Sunrise Dam | |||||
Tropicana - Attributable 70% | |||||
Administration and other | |||||
Americas | |||||
Cerro Vanguardia | |||||
AngloGold Ashanti Mineração | |||||
Serra Grande | |||||
Administration and other | |||||
Corporate and other | |||||
Equity-accounted joint ventures included above | ( | ( | ( | ||
NOTES TO THE CONSOLIDATED FINANCIAL STATEMENTS
F - 20
Figures in millions | Total assets (5)(6) | ||||
US Dollars | 2023 | 2022 | 2021 | ||
Restated (8) | Restated (8) | ||||
Africa (1) | |||||
Kibali - Investment in joint venture and loan receivable | |||||
Iduapriem | |||||
Obuasi | |||||
Siguiri | |||||
Geita | |||||
Administration and other | |||||
Australia | |||||
Americas | |||||
Cerro Vanguardia | |||||
AngloGold Ashanti Mineração | |||||
Serra Grande | |||||
Administration and other | |||||
Projects | |||||
Colombian projects | |||||
North American projects | |||||
Corporate and other | |||||
Figures in millions | Non-current assets (7) | ||||
US Dollars | 2023 | 2022 | 2021 | ||
Restated (8) | Restated (8) | ||||
Non-current assets considered material, by country are: | |||||
United Kingdom | |||||
Foreign entities * | |||||
South Africa | |||||
DRC | |||||
Ghana | |||||
Tanzania | |||||
Australia | |||||
Brazil | |||||
United States | |||||
* Entities are considered foreign in relation to the Group’s country of domicile. With the change in domicile of the Group’s parent company from South Africa to the
United Kingdom, as a result of the corporate restructuring in September 2023, the segment disclosures have been updated to reflect the country of domicile to be
the United Kingdom. Comparative information has been restated.
NOTES TO THE CONSOLIDATED FINANCIAL STATEMENTS
F - 21
Figures in millions | Capital expenditure | ||||
US Dollars | 2023 | 2022 | 2021 | ||
Africa (1) | |||||
Kibali - Attributable 45% | |||||
Iduapriem | |||||
Obuasi | |||||
Siguiri | |||||
Geita | |||||
Australia | |||||
Sunrise Dam | |||||
Tropicana - Attributable 70% | |||||
Administration and other | |||||
Americas | |||||
Cerro Vanguardia | |||||
AngloGold Ashanti Mineração | |||||
Serra Grande | |||||
Projects | |||||
Colombian projects | |||||
North American projects | |||||
Corporate and other | |||||
Equity-accounted joint ventures included above | ( | ( | ( | ||
(1)Includes equity-accounted investments.
(2)Includes income from sale of gold concentrate of $267 m (2022: nil ; 2021: nil ).
(3)With the introduction of new gold sales regulations in Ghana, 20% of gold produced in Ghana must be sold to the Bank of Ghana at arm’s length.
(4)The Group's segmental profit measure is gross profit, which excludes the results of associates and joint ventures. For the reconciliation of gross profit to profit
before taxation, refer to the Group income statement.
(5)Total assets include allocated goodwill of $105 m (2022: $105 m; 2021: $111 m) for Australia and nil (2022: nil ; 2021: $8 m) for Americas (note 14).
(6)For the year ended 31 December 2023, pre-tax net impairments and derecognition of assets of $227 m were accounted for in the Americas ($207 m) and in the
Projects ($25 m), partly offset by a profit on derecognition of assets in Africa ($5 m). For the year ended 31 December 2022, pre-tax impairments and
derecognition of assets of $319 m were accounted for in the Americas ($315 m) and Africa ($4 m).
(7)Non-current assets exclude financial instruments, deferred tax assets and reimbursive right for post-retirement benefits.
(8)Comparative periods have been retrospectively restated. Refer to note 1.3.
NOTES TO THE CONSOLIDATED FINANCIAL STATEMENTS
F - 22
3REVENUE FROM PRODUCT SALES
US Dollars | |||||
Figures in millions | 2023 | 2022 | 2021 | ||
Revenue consists of the following principal categories: | |||||
Gold income (2) | |||||
Spot market sales | |||||
Concentrate sales (1) | |||||
By-products (2) | |||||
(1) There have been no material provisional price adjustments for the year ended 31 December 2023.
Accounting policies Revenue from product sales comprises sales of: •refined gold and doré bars; •by-products including silver and sulphuric acid; and •gold concentrate. Revenue from spot market sales are recognised at a point in time when control of the goods passes to the customer and the performance obligations of transferring control have been met. Control of the goods passes to the customer on settlement date. The amount of revenue recognised reflects the consideration to which the entity is entitled in exchange for the goods transferred. Sales of gold concentrate are recorded when control of ownership passes to the customer, net of refining and treatment charges. Control of ownership passes to the customer either at the warehouse, on the date of issuance of a holding certificate to the customer, or at the time of shipment, depending on the terms agreed with the customer. Sales prices are provisionally set on a specified future date after shipment, based on market prices. Revenue is recorded using forward market gold prices on the expected date that the final sales will be determined. Changes in the fair value as a result of changes in forward gold prices are classified as provisional price adjustments and included as a component of revenue. |
4COST OF SALES
US Dollars | |||||
Figures in millions | 2023 | 2022 | 2021 | ||
Restated (2) | Restated (2) | ||||
Operating costs (1) | |||||
Royalties | |||||
Total operating costs | |||||
Retrenchment costs | |||||
Rehabilitation and other non-cash costs | |||||
Amortisation of tangible assets | |||||
Amortisation of right of use assets | |||||
Amortisation of intangible assets (note 14) | |||||
Inventory change | ( | ( | |||
(1) Operating costs for 2023 include salaries and wages, stores and other consumables, fuel power and water, mining contractors (including variable lease
payments), labour contractors and consultants, and other expenses (credits).
(2)Comparative periods have been retrospectively restated. Refer to note 1.3.
NOTES TO THE CONSOLIDATED FINANCIAL STATEMENTS (continued)
F - 23
5OTHER EXPENSE (INCOME)
US Dollars | |||||
Figures in millions | 2023 | 2022 (2) | 2021 | ||
Care and maintenance | |||||
Governmental fiscal claims | |||||
Legacy tailings storage facilities obligations | ( | ||||
Pension and medical defined benefit | |||||
Royalties received | ( | ( | ( | ||
Retrenchment and related costs (1) | |||||
Legal fees and project costs | ( | ||||
Other indirect taxes | ( | ||||
Other income | ( | ||||
Premium on settlement of bonds | |||||
(1) Includes retrenchment costs of $6 m (2022: nil ; 2021: $14 m).
(2) Corporate restructuring costs of $14 m have been reclassified on a separate line on the face of the income statement.
6FINANCE COSTS AND UNWINDING OF OBLIGATIONS
US Dollars | |||||
Figures in millions | 2023 | 2022 | 2021 | ||
Finance costs | |||||
Finance costs on bonds, bank loans and other | |||||
Amortisation of fees | |||||
Lease finance charges | |||||
Less: interest capitalised | ( | ( | |||
Unwinding of obligations | |||||
Total finance costs and unwinding of obligations | |||||
The interest included within finance costs is calculated at effective interest rates.
7EMPLOYEE BENEFITS
US Dollars | |||||
Figures in millions | 2023 | 2022 | 2021 | ||
Salaries and wages (1) | |||||
Pension costs (2) | |||||
Share-based payment expense (note 8) | |||||
Other (3) | |||||
Included in cost of sales, other expenses and corporate administration, marketing and related expenses | |||||
(1) Salaries and wages includes executive directors’ and executive management’s salaries and other benefits and retrenchment costs.
(2) Includes defined contribution pension costs.
(3) Includes current medical expenses and defined benefit post-retirement medical expenses.
Average number of employees | 2023* | 2022 | 2021 | ||
Africa | |||||
Australia | |||||
Americas | |||||
Other, including corporate and non-gold producing subsidiaries | |||||
Total |
* The approximate number of contractors employed on average during 2023 was 19,615 (2022: 18,599 ; 2021: 16,384 ).
Accounting policies Termination benefits are payable when employment is terminated before the normal retirement date, or when an employee accepts voluntary redundancy in exchange for these benefits. The Group recognises a liability and expense for termination benefits when it is demonstrably committed to either terminating the employment of current employees according to a detailed formal plan without possibility of withdrawal; or providing termination benefits as a result of an offer made to encourage voluntary redundancy based on the number of employees expected to accept the offer. Benefits falling due more than 12 months after reporting date are discounted to present value. |
NOTES TO THE CONSOLIDATED FINANCIAL STATEMENTS (continued)
F - 24
8SHARE-BASED PAYMENTS
US Dollars | |||||
Figures in millions | 2023 | 2022 | 2021 | ||
Equity-settled share incentive schemes | |||||
Deferred Share Plan (DSP) | |||||
Total share-based payment expense | |||||
Previous equity schemes with outstanding awards exercisable included the Bonus Share Plan (BSP) and the Long-Term
Incentive Plan (LTIP). The Deferred Share Plan (DSP) replaced all previous AngloGold Ashanti incentive schemes. Upon
completion of the corporate restructuring in September 2023, the awards outstanding under the BSP and the LTIP were
converted to awards with respect to AngloGold Ashanti plc shares and transferred to the DSP, with the terms and conditions
remaining unchanged.
Bonus Share Plan (BSP)
Award date (unexercised awards) | 2018 | ||||
Calculated fair value (in ZAR) | |||||
Vesting date | 22 Feb 2019 | ||||
Vesting date | 22 Feb 2020 | ||||
Expiry date | 22 Feb 2028 | ||||
Number of shares | |||||
2023 | 2022 | 2021 | |||
Awards outstanding at beginning of year | |||||
Awards lapsed during the year | ( | ||||
Awards exercised during the year | ( | ( | ( | ||
Awards transferred to DSP Scheme | ( | ||||
Awards outstanding and exercisable at end of year | |||||
Long-Term Incentive Plan (LTIP)
Award date (unexercised awards) | 2015 | ||||
Calculated fair value (in ZAR) | |||||
Vesting date | 3 Mar 2018 | ||||
Expiry date | 3 Mar 2025 |
Number of shares | |||||
2023 | 2022 | 2021 | |||
Awards outstanding at beginning of year | |||||
Awards exercised during the year | ( | ( | ( | ||
Awards transferred to DSP Scheme | ( | ||||
Awards outstanding and exercisable at end of year | |||||
Deferred Share Plan (DSP)
The DSP was implemented with effect from 1 January 2018, with the first awards for the scheme allocated in March 2019. This
represents a single scheme under which share awards have been allocated to certain employees from 2019 through early 2024,
vesting equally over a period of two, three and five years depending on the level of seniority of the participant.
Award date (unvested awards and awards vested during the year) | 2023 | 2022 | 2021 | ||
Calculated fair value (in ZAR) | |||||
Award date | 24 Feb 2023 | 24 Feb 2022 | 24 Feb 2021 | ||
Expiry date | 25 Feb 2033 | 24 Feb 2032 | 25 Feb 2031 |
NOTES TO THE CONSOLIDATED FINANCIAL STATEMENTS (continued)
F - 25
Number of shares | |||||
2023 | 2022 | 2021 | |||
Awards outstanding at beginning of year | |||||
Awards granted during the year | |||||
Awards lapsed during the year | ( | ( | ( | ||
Awards exercised during the year | ( | ( | ( | ||
Awards transferred from BSP scheme | — | — | |||
Awards transferred from LTIP scheme | — | — | |||
Awards outstanding at end of year | |||||
Awards exercisable at end of year | |||||
Accounting policies The Group’s management awards certain employee bonuses in the form of equity-settled share-based payments on a discretionary basis. The fair value of the equity instruments granted is calculated at grant date. For transactions with employees, fair value is based on market prices of the equity instruments granted, if available, taking into account the terms and conditions upon which those equity instruments were granted. If market prices of the equity instruments granted are not available, the fair value of the equity instruments granted is estimated using an appropriate valuation model. Vesting conditions, other than market conditions, are not taken into account when estimating the fair value of shares or share options at measurement date. Over the vesting period, the fair value at measurement date is recognised as an employee benefit expense with a corresponding increase in other capital reserves based on the Group’s estimate of the number of instruments that will eventually vest. The income statement charge or credit for a period represents the movement in cumulative expense recognised as at the beginning and end of that period. Vesting assumptions for non-market conditions are reviewed at each reporting date to ensure they reflect current expectations. When options are exercised or share awards vest, the proceeds received, net of any directly attributable transaction costs, are credited to share capital (nominal value) and share premium. Where the terms of an equity settled award are modified, as a minimum, an expense is recognised as if the terms had not been modified. In addition, an expense is recognised for any modification which increases the total fair value of the share-based payment arrangement, or is otherwise beneficial to the employee, as measured at the date of the modification. |
NOTES TO THE CONSOLIDATED FINANCIAL STATEMENTS (continued)
F - 26
9TAXATION
Figures in millions | US Dollars | ||||
2023 | 2022 | 2021 | |||
Restated (6) | Restated (6) | ||||
Current taxation | |||||
Current year | |||||
Prior year under (over) provision | ( | ( | |||
Impairment and disposal of tangible assets | |||||
Deferred taxation | |||||
Current year | |||||
Change in estimate | |||||
Prior year under (over) provision | |||||
Impairment and disposal of tangible assets | ( | ( | |||
Change in statutory tax rate | |||||
( | |||||
Figures in millions | US Dollars | ||||
2023 | 2022 | 2021 | |||
Restated (6) | Restated (6) | ||||
Reconciliation to UK taxation rate (1) | |||||
Implied tax charge at | |||||
Increase (decrease) due to: | |||||
Expenses not tax deductible (2) | |||||
Share of associates and joint ventures' profit | ( | ( | ( | ||
Tax rate differentials (3) and withholding taxes (4) | |||||
Exchange variations and translation adjustments | ( | ||||
Deferred tax assets derecognised (recognised) at Obuasi | ( | ||||
Current year tax losses (expense) not recognised: | |||||
Obuasi | ( | ||||
AngloGold Ashanti Holdings plc | |||||
North America | |||||
Siguiri (5) | ( | ( | ( | ||
SA Corporate | |||||
Change in planned utilisation of deferred tax assets and impact of estimated deferred tax rate change | |||||
Restructuring costs | |||||
Tax allowances | |||||
Impact of statutory tax rate change | |||||
Adjustment in respect of prior years | ( | ||||
Other | ( | ||||
Income tax expense | |||||
(1) With the change in domicile of the Group’s parent company from South Africa to the United Kingdom, as a result of the corporate restructuring in September
2023, the Group tax rate reconciliation for 31 December 2023 has been prepared using the enacted UK corporate tax rate of 25 %. The comparative information
is presented using the South African corporate tax rate of 28 %.
(2) Includes non-deductible corporate, legal, project, exploration and rehabilitation costs, impairments in Brazil and Colombia and British Virgin Islands group losses.
(3) Due to different tax rates in various jurisdictions, primarily Tanzania, Ghana, Guinea, Australia, Brazil and Argentina.
(4) Withholding taxes on dividends paid.
(5) Siguiri current tax expense not recognised due to tax holiday.
(6)Comparative periods have been retrospectively restated. Refer to note 1.3.
NOTES TO THE CONSOLIDATED FINANCIAL STATEMENTS (continued)
F - 27
Organisation for Economic Co-operation and Development (OECD) Pillar Two model rules
The Group is within the scope of the OECD Pillar Two model rules as the Pillar Two legislation was enacted on 11 July 2023 in
the United Kingdom, the jurisdiction in which the Group’s parent company is incorporated, and will come into effect from 1
January 2024. Since the legislation was not effective at the reporting date, the Group has no related current tax exposure. The
Group applies the exception to recognising and disclosing information about deferred tax assets and liabilities related to Pillar
Two income taxes, as provided in the amendments to IAS 12 issued in May 2023.
Under the Pillar Two legislation, the Group is liable to pay a top-up tax for the difference between its Pillar Two effective tax rate
per jurisdiction and the 15% minimum rate. Based on the assessment carried out so far, most jurisdictions relevant to the Group
have a Pillar Two effective tax rate that exceeds 15 %, however, there are a limited number of jurisdictions where the Pillar Two
effective tax rate may be lower than 15 %. The Group does not expect a material exposure to Pillar Two income taxes in those
jurisdictions, with an estimated exposure ranging between $9 m to $13 m.
Due to the complexities in applying the Pillar Two legislation and calculating Pillar Two income, the Group is still in the process of
finalising its exposure to the Pillar Two legislation for when it comes into effect. Therefore, even for those entities with an
accounting effective tax rate above 15 %, there might still be Pillar Two tax implications.
Figures in millions | US Dollars | ||||
2023 | 2022 | 2021 | |||
Restated (1) | Restated (1) | ||||
Analysis of unrecognised tax losses | |||||
Available to be utilised against future profits | |||||
- utilisation required within one year | |||||
- utilisation required between one and two years | |||||
- utilisation required between two and five years | |||||
- utilisation required between five and twenty years | |||||
- utilisation in excess of twenty years | |||||
At the statutory tax rates, the unrecognised value of deferred tax assets is: $921 m (2022: $801 m; 2021: $847 m), mainly relating
to tax losses incurred in the United Kingdom, North America, Ghana, Colombia and South Africa.
(1)Comparative periods have been retrospectively restated. Refer to note 1.3.
Income tax uncertainties
AngloGold Ashanti operates in numerous countries around the world and accordingly is subject to, and pays annual income
taxes under, the various income tax regimes in the countries in which it operates. Some of these tax regimes are defined by
contractual agreements with local government, and others are defined by the general corporate income tax laws of the country.
The Group has historically filed, and continues to file, all required income tax returns and to pay the taxes reasonably determined
to be due. In some jurisdictions, tax authorities are yet to complete their assessments for previous years. The tax rules and
regulations in many countries are highly complex and subject to interpretation. From time to time, the Group is subject to a
review of its historical income tax filings and in connection with such reviews, disputes can arise with the tax authorities over the
interpretation or application of certain rules in respect of the Group’s business conducted within the country involved. Significant
judgement is required in determining the worldwide provisions for income taxes due to the complexity of legislation. There are
many transactions and calculations for which the ultimate tax determination is uncertain during the ordinary course of business.
Irrespective of whether potential economic outflows of matters have been assessed as probable or possible, individually
significant matters are included below, to the extent that disclosure does not prejudice the Group.
Argentina – Cerro Vanguardia SA
The Argentina Tax Authority has challenged the deduction of certain hedge losses, with tax and penalties amounting to $1 m
(2022: $4 m; 2021: $7 m). Management has appealed this matter which has been heard by the Tax Court, with final evidence
submitted in 2017. The matter is pending and judgement is expected in the next 24 months as at 31 December 2023.
Management is of the opinion that the hedge losses were claimed correctly and no provision has therefore been made.
F - 28
Brazil – AngloGold Ashanti Mineração and Serra Grande
The Brazil Tax Authority has challenged various aspects of the companies’ tax returns for periods from 2005 to 2016 which
individually and in aggregate are not considered to be material. Based on engagement with the Brazil Tax Authority, certain
amounts have been allowed and assessments reduced, whilst objections have been lodged against the remainder of the
findings. Serra Grande received tax assessments of $39 m (2022: $23 m; 2021: $19 m) relating to the amortisation of goodwill on
the acquisition of mining interests, which is permitted as a tax deduction when the acquirer is a domiciled entity. Management is
of the opinion that the Brazil Tax Authority is unlikely to succeed in this matter. This is supported by external legal advice and
therefore no provision has been made.
Colombia – La Colosa
The tax treatment of exploration expenditure has been challenged by the Colombian Tax Authority which resulted in claims for
taxes and penalties of $8 m (2022: $42 m; 2021: $74 m) pertaining to the 2010 to 2014 tax years.
These assessments were appealed in 2016 (in the case of La Colosa) and resulted in adverse judgements in the Administrative
Court of Cundinamarca in 2018, which were subsequently appealed by AngloGold Ashanti. The deduction of exploration costs is
prohibited from 2017 onwards following a change in legislation. Subsequent to this date, exploration costs have been treated in
accordance with the amended legislation. In July 2019, the Supreme Administrative Court (Council of State) issued a ruling that
duplicate penalties may not be charged. The impact of the ruling was that certain penalties were waived.
In 2022, the Council of State ruled against the Company upon appeal and ordered it to pay $34 m of additional taxes (which
included interest) in respect of the 2010 and 2011 tax returns, but it fully waived any related penalties. A revised tax reform was
adopted in December 2022 in Colombia, which may lead to a reduction of interest charged on outstanding tax obligations in
certain circumstances. In February 2023, the Company paid $25 m of additional taxes (which included interest) in respect of the
2011 income and equity tax returns, after taking into account a reduction of $6 m in interest under the tax reform, in full settlement
of the 2011 income and equity tax claims. In April 2023, the Company paid $3 m of additional taxes (which included interest) in
full settlement of the 2010 income tax claim. In February 2024, the Administrative Court of Cundinamarca ruled against the
Company’s tax treatment of exploration expenditure in respect of its 2013 tax return. In February 2024, the Company appealed
this ruling to the Council of State for resolution, which may take up to two years to be resolved. The Company’s lawsuit with
respect to its 2014 tax return is still pending before the Administrative Court of Cundinamarca. Penalties of $8 m (2022: $8 m;
2021: $9 m) pertaining to the 2013 and 2014 tax years were not recognised as a provision and are considered to be contingent,
awaiting final judgement from the Colombian Courts.
Guinea – Siguiri
The Guinea Tax Authority has challenged certain aspects of Société AngloGold Ashanti de Guinée S.A.'s tax return for the 2010
year of assessment totalling $8 m (attributable) (2022: $8 m (attributable); 2021: $8 m (attributable)). Management has objected to
the assessment. However, provision has been made for a portion of the total claims amounting to $2 m (attributable) (2022: $2 m
(attributable); 2021: $2 m (attributable)). A meeting was held in February 2022 under the Minister of Budget Tax advisor’s
chairmanship, calling for the formation of a tripartite committee to review the claim and resolve the issue. Members from
government were appointed to the committee, but no meetings have been held to date.
Mali – Yatela and AngloGold Ashanti Mali Services
The Mali Tax Authority has challenged various aspects of Société des Mines de Yatela S.A. and Société AngloGold Ashanti Mali
S.A.'s tax returns for periods of 2012 to 2019 totalling $3 m (attributable) (2022: $4 m (attributable); 2021: $4 m (attributable)).
Management is of the opinion that the Mali Tax Authority is unlikely to succeed in the tax matters and therefore no provision has
been made.
Tanzania – Geita Gold Mine
The Tanzania Revenue Authority has raised audit findings on various tax matters for years from 2009 to 2022 amounting to
$369 m (2022: $318 m; 2021: $291 m) including adjusted tax assessments relating to the 2022 tax year, which was received in
January 2024 totalling $44 m. In addition, the Tanzania Revenue Authority has issued Agency Notices on various local bank
accounts of the Company in Tanzania, enforcing payments from those bank accounts, despite the matters being on appeal. In
order to continue operating its bank accounts and to not impact operations, Geita made payments under protest for which a
receivable of $23 m (2022: $24 m; 2021: $25 m) was raised. Management has objected and appealed through various levels of
the administrative processes. Management has obtained external legal advice and is of the opinion that the claims of the
Tanzania Revenue Authority are unlikely to succeed.
In addition, it should be noted that amendments passed to Tanzanian legislation in 2017 amended the 2010 Mining Act and new
Finance Act. Effective from 1 July 2017, the gold mining royalty rate increased to 6% (from 4%) and further a 1% clearing fee on
the value of all minerals exported was imposed. The Group has been paying the higher royalty and clearing fees since this date,
under protest, and is of the view that this is in contravention of its Mining Development Agreement.
F - 29
Significant accounting judgements and estimates The Group tax reconciliation between tax expense and the product of accounting profit multiplied by the applicable tax rate, prepared in accordance with IAS 12 ‘Income Taxes’, applies the UK domestic corporate tax rate of 25% for the 2023 year. The Group recognises the net future tax benefit related to deferred income tax assets to the extent that it is probable that the deductible temporary differences will reverse in the foreseeable future. Assessing the recoverability of deferred income tax assets requires the Group to make significant estimates related to expectations of future taxable income. Estimates of future taxable income are based on detailed cash flow forecasts for at least 12 months and updated life-of-mine plan models with longer term cash flow projections from operations and the application of existing tax laws in each jurisdiction. To the extent that future cash flow projections and taxable income differ significantly from estimates, the ability of the Group to realise the net deferred tax assets recorded at the reporting date could be impacted. Additionally, future changes in tax laws in the jurisdictions in which the Group operates could limit the ability of the Group to obtain tax deductions in future periods. |
Accounting policies Deferred taxation is recognised on all qualifying temporary differences at the reporting date between the tax bases of assets and liabilities and their carrying amounts for financial reporting purposes. Deferred tax assets are only recognised to the extent that it is probable that the deductible temporary differences will reverse in the foreseeable future and future taxable profit will be available against which the temporary difference can be utilised. The carrying amount of deferred tax assets is reviewed at each reporting date. Deferred tax assets and liabilities are measured at future anticipated tax rates, which have been enacted or substantively enacted at the reporting date. Current and deferred tax is recognised as income or expense and included in profit or loss for the period, except to the extent that the tax arises from a transaction or event which is recognised, in the same or a different period in other comprehensive income or directly in equity, or an acquisition that is a business combination. Current tax is measured on taxable income at the applicable statutory rate enacted or substantively enacted at the reporting date. Interest and penalties, if any, are recognised in the income statement as part of taxation expense if based on the specific facts and circumstances, the entity has determined that the interest (receivable or payable) and penalties payable to the tax authorities are an income tax. |
F - 30
10EARNINGS (LOSS) PER ORDINARY SHARE
2023 | 2022 | 2021 | |||
Restated (4) | Restated (4) | ||||
US cents per share | |||||
Basic earnings (loss) per ordinary share | ( | ||||
The calculation of basic earnings (loss) per ordinary share is based on (loss)/profits attributable to equity shareholders of ($ average number of ordinary shares in issue during the financial year. | |||||
Diluted earnings (loss) per ordinary share | ( | ||||
The calculation of diluted earnings (loss) per ordinary share is based on (loss)/profits attributable to equity shareholders of ($ number of ordinary shares. | |||||
In calculating the basic and diluted number of ordinary shares outstanding for the year, the following were taken into
consideration:
Number of shares (1) | |||||
2023 | 2022 | 2021 | |||
Weighted average number of ordinary shares (2) | |||||
Dilutive potential of share options (3) | |||||
Diluted weighted average number of ordinary shares | |||||
(1)As a result of the corporate restructuring transaction, there were no changes to earnings per ordinary share for each of the financial years ended 31 December
2022 and 2021, as it was based on the ordinary shares of AngloGold Ashanti Limited, the previous parent entity.
(2)Employee compensation awards are included in basic earnings per ordinary share from the date that all necessary conditions have been satisfied and it is
virtually certain that shares will be issued as a result of employees exercising their options.
(3)Effect of share options for 2023 is anti-dilutive.
(4)Comparative periods have been retrospectively restated. Refer to note 1.3.
NOTES TO THE CONSOLIDATED FINANCIAL STATEMENTS
F - 31
10EARNINGS (LOSS) PER ORDINARY SHARE (continued)
US Dollars | |||||
Figures in millions | 2023 | 2022 | 2021 | ||
Restated (4) | Restated (4) | ||||
Headline earnings (loss) (1) | |||||
The profit (loss) attributable to equity shareholders was adjusted by the following to arrive at headline earnings (loss): | |||||
Profit (loss) attributable to equity shareholders | ( | ||||
Impairment of tangible assets, right of use assets and investment in joint venture, net | |||||
Impairment of tangible and right of use assets | |||||
Impairment of investment in joint venture | |||||
Taxation on impairment of tangible assets, right of use assets and investment in joint venture | ( | ( | |||
(Profit) loss on derecognition and disposal of tangible assets, net | ( | ||||
(Profit) loss on derecognition of assets | |||||
(Profit) loss on disposal of tangible assets | ( | ( | ( | ||
Taxation on derecognition and disposal of tangible assets | ( | ||||
( | |||||
US Cents | |||||
Headline earnings (loss) per ordinary share (1) | |||||
Headline earnings (loss) per ordinary share (2) | ( | ||||
Diluted headline earnings (loss) per ordinary share (3) | ( | ||||
(1)The financial measures “headline (loss) earnings” and “headline (loss) earnings per share” are not calculated in accordance with IFRS. These measures,
however, are calculated according to the Headline Earnings Circular 1/2023, issued by the South African Institute of Chartered Accountants (SAICA) at the
request of the JSE Limited (JSE). These measures, however, are required to be disclosed by the JSE Listings Requirements and therefore do not constitute
Non-GAAP financial measures for purposes of the rules and regulations of the U.S. Securities and Exchange Commission (SEC) applicable to the use and
disclosure of Non-GAAP financial measures. The tax effect of line items have not been disclosed if the tax is less than $1m or nil.
(2) Calculated on the basic weighted average number of ordinary shares.
(3)Calculated on the diluted weighted average number of ordinary shares.
(4)Comparative periods have been retrospectively restated. Refer to note 1.3.
11DIVIDENDS
US Dollars | ||||||
Figures in millions | 2023 | 2022 | 2021 | |||
Ordinary shares (1) (2) | ||||||
Dividend number 122 of and paid on 26 March 2021 ( | ||||||
Dividend number 123 of paid on 10 September 2021 ( | ||||||
Dividend number 124 of and paid on 25 March 2022 ( | ||||||
Dividend number 125 of paid on 9 September 2022 ( | ||||||
Dividend number 126 of and paid on 31 March 2023 ( | ||||||
Dividend number 127 of paid on 8 September 2023 ( | ||||||
(1) The dividend payout was based on the ordinary shares of AngloGold Ashanti Limited, the previous parent entity. See note 1.3.1.
(2) For proposed dividends subsequent to year-end, refer to note 33.
NOTES TO THE CONSOLIDATED FINANCIAL STATEMENTS (continued)
F - 32
12TANGIBLE ASSETS
Figures in millions | Mine development costs | Mine infrastructure | Mineral rights and dumps | Exploration and evaluation assets | Assets under construction | Land and buildings (2) | Total | ||||||
US Dollars | |||||||||||||
Cost | |||||||||||||
Balance at 1 January 2021 | |||||||||||||
Additions (5) | |||||||||||||
Finance costs capitalised (3) | |||||||||||||
Disposals | ( | ( | ( | ( | |||||||||
Derecognition of assets (6) | ( | ( | ( | ||||||||||
Transfers and other movements (1) (6) | ( | ( | |||||||||||
Translation | ( | ( | ( | ( | ( | ||||||||
Balance at 31 December 2021 Restated (4) | |||||||||||||
Accumulated amortisation and impairments | |||||||||||||
Balance at 1 January 2021 | |||||||||||||
Amortisation for the year | |||||||||||||
Impairment of assets | |||||||||||||
Disposals | ( | ( | ( | ||||||||||
Derecognition of assets (6) | ( | ( | ( | ||||||||||
Transfers and other movements (1) (6) | ( | ( | ( | ||||||||||
Translation | ( | ( | ( | ( | |||||||||
Balance at 31 December 2021 Restated (4) | |||||||||||||
Net book value at 31 December 2021 Restated (4) | |||||||||||||
Cost | |||||||||||||
Balance at 1 January 2022 Restated (4) | |||||||||||||
Additions (5) | |||||||||||||
Acquisition of assets | |||||||||||||
Finance costs capitalised (3) | |||||||||||||
Disposals | ( | ( | ( | ||||||||||
Derecognition of assets (6) | ( | ( | ( | ( | |||||||||
Transfers and other movements (1) (6) | ( | ( | ( | ||||||||||
Translation | ( | ( | ( | ( | ( | ||||||||
Balance at 31 December 2022 Restated (4) | |||||||||||||
Accumulated amortisation and impairments | |||||||||||||
Balance at 1 January 2022 Restated (4) | |||||||||||||
Amortisation for the year | |||||||||||||
Impairment of assets | |||||||||||||
Disposals | ( | ( | ( | ||||||||||
Derecognition of assets (6) | ( | ( | ( | ( | |||||||||
Transfers and other movements (1) (6) | |||||||||||||
Translation | ( | ( | ( | ( | ( | ||||||||
Balance at 31 December 2022 Restated (4) | |||||||||||||
Net book value at 31 December 2022 Restated | |||||||||||||
NOTES TO THE CONSOLIDATED FINANCIAL STATEMENTS
F - 33
Figures in millions | Mine development costs | Mine infrastructure | Mineral rights and dumps | Exploration and evaluation assets | Assets under construction | Land and buildings (2) | Total | ||||||
US Dollars | |||||||||||||
Cost | |||||||||||||
Balance at 1 January 2023 | |||||||||||||
Additions (5) | 0 | ||||||||||||
Disposals | ( | ( | ( | ( | ( | ( | |||||||
Derecognition of assets | ( | ( | ( | ||||||||||
Transfers and other movements (1) | ( | ||||||||||||
Translation | ( | ( | ( | ||||||||||
Balance at 31 December 2023 | |||||||||||||
Accumulated amortisation and impairments | |||||||||||||
Balance at 1 January 2023 | |||||||||||||
Amortisation for the year | |||||||||||||
Impairment of assets | |||||||||||||
Impairment reversals of assets | ( | ( | ( | ( | |||||||||
Disposals | ( | ( | ( | ( | ( | ||||||||
Derecognition of assets | ( | ( | ( | ||||||||||
Transfers and other movements (1) | ( | ( | |||||||||||
Translation | |||||||||||||
Balance at 31 December 2023 | |||||||||||||
Net book value at 31 December 2023 |
(1)Transfers and other movements include amounts from deferred stripping, changes in estimates of decommissioning assets and asset reclassifications.
(2)Assets of $7 m (2022: $7 m; 2021: $6 m) have been pledged as security.
(3)The weighted average capitalisation rate used to determine the amount of borrowing costs eligible for capitalisation was nil (2022: 4.96 %; 2021: 4.52 %).
(4)Comparative periods have been retrospectively restated. Refer to note 1.3.
(5)Additions which previously included disclosure for sustaining and non-sustaining capital expenditure, are now reflected as total additions.
(6)Derecognition of assets was previously included in the Transfers and other movements line.
NOTES TO THE CONSOLIDATED FINANCIAL STATEMENTS (continued)
12TANGIBLE ASSETS (continued)
F - 34
Figures in millions | Tangible Assets | Right of Use Assets | Goodwill | Total |
US Dollars | 2023 | |||
Group income statement | ||||
Impairment of assets | ( | ( | ( | |
Reversal of impairment of assets | ||||
Derecognition of assets | ( | ( | ||
Net profit (loss) on disposal of assets | ||||
Net impairment, derecognition of assets and profit (loss) on disposal | ( | ( | ( | |
2022 | ||||
Group income statement | ||||
Impairment of assets (Restated (1)) | ( | ( | ( | ( |
Derecognition of assets | ( | ( | ( | |
Net profit (loss) on disposal of assets | ||||
Net impairment, derecognition of assets and profit (loss) on disposal | ( | ( | ( | ( |
2021 | ||||
Group income statement | ||||
Impairment of assets | ( | ( | ||
Derecognition of assets | ( | ( | ||
Net profit (loss) on disposal of assets | ||||
Net impairment, derecognition of assets and profit (loss) on disposal | ||||
(1)Comparative periods have been retrospectively restated. Refer to note 1.3.
Impairment calculation assumptions – goodwill, tangible, right of use and intangible assets
The Group’s non-financial assets, other than inventories and deferred tax assets, are assessed for impairment or reversal of
impairment indicators at each reporting date or whenever events or changes in circumstances indicate that the carrying value
may not be recoverable.
•The gold price assumption used in the impairment calculations represents management’s best estimate of the expected real
short-term and long-term future price of gold based on consensus outlooks.
•The exchange rate assumption used in the impairment calculation of Sunrise Dam (refer to note 14) represents
management’s best estimate of the expected short-term and long-term exchange rates based on consensus outlooks.
Assumptions | Real gold price per oz | Exchange rate (A$/US$) | ||
2023 | 2022 | 2023 | 2022 | |
Year 1 | ||||
Year 2 | ||||
Year 3 | ||||
Year 4 | ||||
Year 5 | ||||
Long-term | ||||
Annual life-of-mine plans take into account the following:
•Proven and Probable Mineral Reserve;
•Value beyond Proven and Probable Mineral Reserve (including exploration potential) determined using the gold price
assumption referred to above; and applying an appropriate conversion factor to such values, where applicable;
•Foreign currency cash flows translated at estimated exchange rates, based on consensus outlooks, and then discounted
using appropriate discount rates for that currency;
•Cash flows used in impairment calculations are based on life-of-mine plans which range from four years to 26 years; and
•Variable operating cash flows are increased at local Consumer Price Index rates.
NOTES TO THE CONSOLIDATED FINANCIAL STATEMENTS (continued)
12TANGIBLE ASSETS (continued)
F - 35
Córrego do Sítio (CdS)
CdS is owned and operated by AngloGold Ashanti Mineração (“AGA Mineração”) in Brazil. The CdS mine has been in operation
since 1989 and consists of open pit and underground mines. Due to the challenging operating results, management assessed
various options related to the CdS mine cash generating unit (CGU), and finally took the decision to place CdS on care and
maintenance in August 2023. In 2022, an impairment loss of $151 m ($189 m gross of taxes) was recognised in respect of the
CdS mine CGU. During 2023, further impairment losses of $32 m ($47 m gross of taxes) was recognised on the remaining asset
balances. The impairment losses in 2022 and 2023 were recognised and included in the Americas segment.
Cuiabá
Cuiabá is owned and operated by AGA Mineração in Brazil. It has been in operation since 1834 and is an underground mine.
The property is currently in the production stage. In 2022, an impairment loss of $57 m ($70 m gross of taxes) was recognised in
respect of the Cuiabá mine CGU due to the temporary suspension of filtered tailings deposition on the Calcinados TSF and
processing of gold concentrate at the Queiroz metallurgical plant. During 2023, Cuiabá recognised further impairment losses of
$45 m ($53 m gross of taxes) largely due to the ongoing suspension of operating activities at the Queiroz metallurgical plant while
additional engineering and geotechnical work at the related Calcinados TSF was completed, and a decision not to restart
operations during the dry season (contrary to what was originally planned).
At 31 December 2023, the Cuiabá mine CGU recognised an impairment reversal of $28 m ($38 m gross of taxes) related to the
prior year impairment. The current year impairment on the Queiroz metallurgical plant was not considered for reversal. The
impairment reversal was largely due to certainty in the processing of gold concentrate and improved operating results at the
Cuiabá mine. The recoverable amount of $438 m was determined with reference to the CGU’s fair value less costs to dispose
derived from a discounted cash flow model, using a discount rate of 8.2 % (Dec 2022: 8.5 %), compared to the CGU’s carrying
amount of $184 m. This is a level 3 fair value measurement. The impairment loss in 2022 and the net impairment reversal in 2023
were recognised and included in the Americas segment.
Serra Grande
Mineração Serra Grande (“Serra Grande”) is wholly-owned by AngloGold Ashanti and is located in the northwest of Goiás State,
central Brazil. It has been in operation since 1986 and consists of three underground and two open pit mines. The property is
currently in the production stage. In 2022, an impairment loss of $48 m ($56 m gross of taxes) was recognised in respect of the
Serra Grande CGU largely due to a projection of lower grades and ounces and an increase in the interest rates which resulted in
an increased discount rate. The Serra Grande CGU recognised further impairment losses of $90 m ($105 m gross of taxes) during
December 2023 largely due to continued projections of lower grades and ounces. The recoverable amount of $39 m was
determined with reference to the CGU’s fair value less costs to dispose derived from a discounted cash flow model, using a
discount rate of 7 % (Dec 2022: 8.5 %), compared to the CGU’s carrying amount of $129 m. This is a level 3 fair value
measurement. The impairment losses in 2022 and 2023 were recognised and included in the Americas segment.
Gramalote
In September 2023, AngloGold Ashanti completed the sale of its entire 50 % indirect interest in the Gramalote project to B2Gold
Corporation effective 5 October 2023. During 2023, Gramalote recognised an impairment loss of $25 m ($25 m gross of taxes) as
the recoverable amount of Gramalote, based on its fair value less costs to dispose, was lower than its carrying value. The
recoverable amount of $42 m was determined with reference to the cash payments in the sale transaction, derived from a
discounted cash flow model, using a discount rate of 9.3 %, compared to the carrying amount of $67 m. This is a level 3 fair value
measurement. The impairment loss was recognised and included in the Projects segment.
NOTES TO THE CONSOLIDATED FINANCIAL STATEMENTS (continued)
12TANGIBLE ASSETS (continued)
F - 36
Cash Generating Unit | Mine Development Cost | Mine Infrastructure | Exploration and evaluation costs | Mineral Rights and Dumps | Assets under construction | Land and buildings | Total Tangible Asset Impairment | Goodwill | Right of use assets | Total Impairment | |||||||||
Figures in millions | 2023 | ||||||||||||||||||
US Dollars | |||||||||||||||||||
Americas segment | |||||||||||||||||||
CdS | |||||||||||||||||||
Cuiabá | ( | ( | ( | ||||||||||||||||
Serra Grande | |||||||||||||||||||
Projects | |||||||||||||||||||
Gramalote | |||||||||||||||||||
2022 | |||||||||||||||||||
Americas segment | |||||||||||||||||||
CdS | |||||||||||||||||||
Cuiabá | |||||||||||||||||||
Serra Grande | |||||||||||||||||||
Sensitivity analysis - impairment of assets
The assumptions that have the most influence on the impairment assessments and the life-of-mine plans which form the basis of
the assessment is the expected gold commodity price and discount rate.
Management determined a reasonably possible change of 6.9% in the gold price assumptions based on the standard deviation
of both AngloGold Ashanti's gold price assumption over the past five years and market analysts' forecasted long-term
assumptions. A 6.9% movement in the gold price (with all other variables held constant) would have resulted in the following
increase (decrease) in recoverable amount of the CGU as at 31 December 2023:
Figures in millions - US Dollars | 2023 |
6.9% increase | |
Serra Grande | |
Cuiabá | |
6.9% decrease | |
Serra Grande (decrease limited to carrying value) | ( |
Cuiabá | ( |
Management determined a reasonable possible change of 100 basis points, based on the Group’s weighted average cost of
capital rate over the past five financial years. A 100 basis point movement in the discount rate (with all other variables held
constant) would have resulted in the following (decrease) increase in recoverable amount of the CGU as at 31 December 2023:
Figures in millions - US Dollars | 2023 |
100 basis point increase | |
Serra Grande | ( |
Cuiabá | ( |
100 basis point decrease | |
Serra Grande | |
Cuiabá |
NOTES TO THE CONSOLIDATED FINANCIAL STATEMENTS (continued)
12TANGIBLE ASSETS (continued)
F - 37
Significant accounting judgements and estimates Amortisation The majority of mining assets are amortised using the units-of-production method (on an ounces basis) where the mine operating plan calls for production from a well-defined Proven and Probable Mineral Reserve. For other tangible assets, the straight-line method is applied over the estimated useful life of the asset which does not exceed the estimated mine life based on Proven and Probable Mineral Reserve as the useful lives of these assets are considered to be limited to the life of the relevant mine as follows: •plant and machinery up to life-of-mine; •equipment and motor vehicles up to •computer equipment up to Assets are amortised to residual values. Residual values and useful lives are reviewed, and adjusted if appropriate, at the beginning of each financial year. The calculation of the units-of-production rate of amortisation could be impacted to the extent that actual production in the future is different from current forecast production based on Proven and Probable Mineral Reserve. This would generally arise from the following factors: •changes in Proven and Probable Mineral Reserve; •the grade of Mineral Reserve may vary significantly from time to time; •differences between actual commodity prices and commodity price assumptions; •unforeseen operational issues at mine sites; and •changes in capital, operating, mining, processing and reclamation costs, discount rates and foreign exchange rates. Changes in Proven and Probable Mineral Reserve could similarly impact the useful lives of assets amortised on the straight-line method, where those lives are limited to the life of the mine. |
Stripping costs The Group has a number of surface mining operations that are in the production phase for which production stripping costs are incurred. The benefits that accrue to the Group as a result of incurring production stripping costs include (a) ore that can be used to produce inventory and (b) improved access to a component of the ore body that will be mined in future periods. Components of the various ore bodies at the operations of the Group are determined based on the geological areas identified for each of the ore bodies and are reflected in the Mineral Reserve reporting of the Group. In determining whether any production stripping costs should be capitalised as a stripping activity asset, the Group uses the average stripping ratio measure as an indicator of the quantum of production stripping costs that should be capitalised. Once determined that any portion of the production stripping costs should be capitalised, the Group determines the amount of the production stripping costs that should be capitalised with reference to the average mine costs per tonne of the component and the actual waste tonnes that should be deferred. The average mine cost per tonne of the component is calculated as the total expected costs to be incurred to mine the relevant component of the ore body, divided by the number of tonnes expected to be mined from the component. The average mine cost per tonne of the component to which the stripping activity asset relates are recalculated annually in the light of additional knowledge and changes in estimates. |
Development expenditure Development activities commence after project sanctioning by the appropriate level of management. Judgement is applied by management in determining when a project has reached a stage at which economically recoverable reserves exist such that development may be sanctioned. In exercising this judgement, management is required to make certain estimates and assumptions that may change as new information becomes available. If, after having started the development activity, a judgement is made that a development asset is impaired, the appropriate amount will be written off to the income statement. |
Impairment If there are impairment indicators, estimates are prepared of expected future cash flows for each group of assets. Expected future cash flows used in impairment calculations, which are based on life-of-mine plans, are inherently uncertain and could materially change over time and impact the recoverable amount. Life-of-mine plans range from factors including published Mineral Reserve, Mineral Resource, exploration potential and production estimates, together with economic factors such as spot and future metal prices, discount rates, foreign currency exchange rates, estimates of costs to produce Mineral Reserve and future capital expenditure. The discount rate used is the weighted average cost of capital (WACC), which is derived from a pricing model. In determining the WACC for each cash generating unit, sovereign and mining risk factors are considered to determine country specific risks. The estimated future cash flows and discount rates are post-tax. |
NOTES TO THE CONSOLIDATED FINANCIAL STATEMENTS (continued)
12TANGIBLE ASSETS (continued)
F - 38
Production start date The Group assesses the stage of each mine construction project to determine when a project moves into the production stage. The criteria used to assess the start date are determined by the unique nature of each mine construction project and include factors such as the complexity of a plant and its location. The Group considers various relevant criteria to assess when the construction project is substantially complete and ready for its intended use and moves into the production stage. The criteria used in the assessment would include, but are not limited to the following: •the level of capital expenditure compared to the construction cost estimates; •completion of a reasonable period of testing of the constructed asset; •adequacy of stope face; •ability to produce metals in saleable form (within specifications); and •ability to sustain ongoing production of metal. When a mine construction project moves into the production stage, the capitalisation of certain mine construction costs ceases and costs are either regarded as inventory or expensed, except for capitalisable costs related to mining asset additions or improvements, underground mine development, deferred stripping activities, or ore reserve development. |
Mineral Reserve estimates The Group reports its Mineral Resource and Mineral Reserve in accordance with Subpart 1300 of Regulation S-K (17 CFR § 229.1300) (“Regulation S-K 1300”). A Mineral Reserve estimate is an estimate of tonnage and grade or quality of Indicated and Measured Mineral Resource that can be the basis of an economically viable project. More specifically, it is the economically mineable part of a Measured or Indicated Mineral Resource, which includes diluting materials and allowances for losses that may occur when the material is mined or extracted. In order to estimate the Mineral Reserve, estimates and assumptions are required about a range of geological, technical and economic factors, including quantities, grades, production techniques, recovery rates, production costs, transport costs, commodity demand, commodity prices and exchange rates. Estimating the quantity and/or grade of the Mineral Reserve requires the size, shape and depth of ore bodies to be determined by analysing geological data such as the logging and assaying of drill samples. This process may require complex and difficult geological judgements and calculations to interpret the data. With the change in the economic assumptions used to estimate the Mineral Reserve from period to period, and because additional geological data is generated during the course of operations, estimates of the Mineral Reserve may change from period to period. Changes in the reported Mineral Reserve may affect the Group’s financial results and financial position in a number of ways, including the following: •asset carrying values may be affected due to changes in estimated future cash flows; •depreciation, depletion and amortisation charged in the income statement may change where such charges are determined by the units-of-production method, or where the useful economic lives of assets change; •overburden removal costs, including production stripping activities, recorded on the statement of financial position or charged in the income statement may change due to changes in stripping ratios or the units-of-production method of depreciation; •decommissioning site restoration and environmental provisions may change where changes in the estimated Mineral Reserve affect expectations about the timing or cost of these activities; and •the carrying value of deferred tax assets may change due to changes in estimates of the likely recovery of the tax benefits. |
Accounting policies Tangible assets are recorded at cost less accumulated amortisation, accumulated impairments and reversal of impairments. Cost includes the present value of related future decommissioning costs. Interest on borrowings relating to the financing of major capital projects under construction is capitalised during the construction phase as part of the cost of the project. Such borrowing costs are capitalised over the period during which the asset is being acquired or constructed and borrowings have been incurred. Capitalisation ceases when construction is interrupted for an extended period or when the asset is substantially complete. Other borrowing costs are expensed as incurred. For assets amortised on the units-of-production method, amortisation is calculated to allocate the cost of each asset to its residual value over its estimated useful life. For assets not amortised on the units-of-production method, amortisation is calculated on a straight line basis over its expected useful life. |
Mine development costs Capitalised mine development costs include expenditure incurred to develop new ore bodies, to define further mineralisation in existing ore bodies and, to expand the capacity of a mine. Mine development costs include acquired Proven and Probable Mineral Reserve at cost at the acquisition date. These costs are amortised from the date on which the assets are ready for use as intended by management. Depreciation, depletion and amortisation of mine development costs are computed by the units-of-production method based on estimated Proven and Probable Mineral Reserve. The Proven and Probable Mineral Reserve reflects estimated quantities of Mineral Reserve which can be recovered economically in the future from known mineral deposits. Capitalised mine development costs also include stripping activity assets relating to production stripping activities incurred in the production phase of open-pit operations of the Group. Stripping activity assets are amortised on a units-of-production method based on the Mineral Reserve of the component of the orebody to which these assets relate. Amortisation of stripping activity assets is included in cost of sales. |
NOTES TO THE CONSOLIDATED FINANCIAL STATEMENTS (continued)
12TANGIBLE ASSETS (continued)
F - 39
Mine infrastructure Mine plant facilities, including decommissioning assets, are amortised using the lesser of their useful life or units-of-production method based on estimated Proven and Probable Mineral Reserve. |
Land and assets under construction Land and assets under construction are not depreciated and are measured at historical cost less impairments. |
Mineral rights and dumps Mineral rights are amortised using the units-of-production method based on the estimated Proven and Probable Mineral Reserve. Dumps are amortised over the period of treatment. |
Exploration and evaluation assets All pre-licence and exploration costs, including geological and geographical costs, labour, Mineral Resource and exploratory drilling cost, are expensed as incurred, until it is concluded that a future economic benefit will more likely than not be realised. In evaluating if expenditures meet this criterion to be capitalised, several different sources of information are used depending on the level of exploration. While the criterion for concluding that expenditure should be capitalised is always probable, the information used to make that determination depends on the level of exploration: •Costs on greenfield sites, being those where the Group does not have any mineral deposits which are already being mined or developed under the planned method of extraction, are expensed as incurred until the Group is able to demonstrate that future economic benefits are probable, which generally will be the establishment of Proven and Probable Mineral Reserve at this location; •Costs on brownfield sites, being those adjacent to mineral deposits which are already being mined or developed under the planned method of extraction, are expensed as incurred until the Group is able to demonstrate that future economic benefits are probable, which generally will be the establishment of increased inclusive Proven and Probable Mineral Resource after which the expenditure is capitalised as mine development cost; and •Costs relating to extensions of mineral deposits, which are already being mined or developed, including expenditure on the definition of mineralisation of such mineral deposits, are capitalised as mine development cost. Costs relating to property acquisitions are capitalised within mine development costs. |
Impairment of non-financial assets The Group’s non-financial assets, other than inventories and deferred tax assets, are reviewed at each reporting date or whenever events or changes in circumstances indicate that the carrying amount may not be recoverable, to determine whether there is any indication of impairment. An impairment test is performed annually on all goodwill, intangible assets not yet in use and intangible assets with indefinite useful lives irrespective of whether any impairment indicators have been identified. For non-financial assets or cash generating units (CGUs), in circumstances in which indicators of impairment are identified, a formal impairment test is required to be carried out. The impairment test compares the assets or cash generating units (CGUs) carrying amount with its recoverable amount. The recoverable amount is the higher of the amounts calculated under the fair value less cost of disposal and value in use approaches. The future cash flows are adjusted for risks specific to the asset and is adjusted where applicable to consider any specific risks relating to the country where the asset or cash-generating unit is located. Future cash flows are discounted to their present value using a discount rate that reflects current market assessments of the time value of money. A CGU is the smallest identifiable Group of assets that generates cash inflows that are largely independent of the cash inflows from other assets or groups of assets. The composition and nature of the Group’s CGUs vary and is determined largely by identifying the smallest identifiable group of assets that generates independent cash inflows and factors specific to the Group’s mining operations. The Group’s CGUs are generally at the individual mine level, with some operating mines consisting of a combination of shafts and/or pits. Exploration assets are tested for impairment whenever facts and circumstances indicate that the carrying amount is not recoverable. Assets will be allocated to CGUs or groups of CGUs based on how the entity manages its operations i.e., by mineral within a specific geographic area. An impairment loss is recognised for the amount by which the assets or CGUs carrying amount exceeds their recoverable amount. At the reporting date the Group assesses whether any of the indicators which gave rise to previously recognised impairments have changed such that the impairment loss no longer exists or may have decreased. The impairment loss is then assessed on the original factors for reversal and if indicated, such reversal is recognised. |
NOTES TO THE CONSOLIDATED FINANCIAL STATEMENTS (continued)
12TANGIBLE ASSETS (continued)
F - 40
13 RIGHT OF USE ASSETS AND LEASE LIABILITIES
RIGHT OF USE ASSETS
Figures in millions - US Dollars | Mine Infrastructure | Land and buildings | Total | |||
Cost | ||||||
Balance at 1 January 2021 | ||||||
Additions | ||||||
Derecognition and other movements (1) | ( | ( | ( | |||
Translation | ( | ( | ||||
Balance at 31 December 2021 | ||||||
Accumulated amortisation and impairments | ||||||
Balance at 1 January 2021 | ||||||
Amortisation for the year | ||||||
Impairment | ||||||
Derecognition and other movements (1) | ( | ( | ( | |||
Translation | ( | ( | ||||
Balance at 31 December 2021 | ||||||
Net book value at 31 December 2021 | ||||||
Cost | ||||||
Balance at 1 January 2022 | ||||||
Additions | ||||||
Derecognition and other movements (1) | ( | ( | ||||
Translation | ( | ( | ( | |||
Balance at 31 December 2022 | ||||||
Accumulated amortisation and impairments | ||||||
Balance at 1 January 2022 | ||||||
Amortisation for the year | ||||||
Derecognition and other movements (1) | ( | ( | ||||
Impairment | ||||||
Translation | ( | ( | ||||
Balance at 31 December 2022 | ||||||
Net book value at 31 December 2022 | ||||||
Cost | ||||||
Balance at 1 January 2023 | ||||||
Additions | ||||||
Derecognition and other movements (1) | ( | ( | ||||
Translation | ( | |||||
Balance at 31 December 2023 | ||||||
Accumulated amortisation and impairments | ||||||
Balance at 1 January 2023 | ||||||
Amortisation for the year | ||||||
Derecognition and other movements (1) | ( | ( | ||||
Impairment (2) | ||||||
Impairment reversal (2) | ( | ( | ||||
Balance at 31 December 2023 | ||||||
Net book value at 31 December 2023 |
(1)Derecognition and other movements include amounts relating to modifications and terminations of leased assets.
(2) The Group recognised a net impairment loss of $192 m (gross of taxation) during December 2023, of which a net $7 m related to right of use assets. Refer to note
12.
NOTES TO THE CONSOLIDATED FINANCIAL STATEMENTS (continued)
F - 41
LEASE EXPENSES
Figures in millions - US Dollars | 2023 | 2022 | 2021 |
Amounts recognised in the statement of cash flows including expenses on short- term leases, variable lease payments and leases on low value assets | |||
Total cash outflow on leases including expenses on short-term leases, variable lease payments and leases on low value assets | |||
Amounts recognised in the income statement for lease payments not included in lease liabilities | |||
Expenses on short-term leases | |||
Expenses on variable lease payments (1) | |||
Expenses on leases of low value assets |
(1) The variable lease payments consist mainly of mining and drilling contracts and constitutes 85 % (2022: 86 %; 2021: 66 %) of total lease payments made during
the period. The variable nature of these contracts is to allow equal sharing of pain and gain between the Group and its contractors. These payments are
predominantly driven by performance measures on a per tonne or a per meter basis. The future cash flows to which the Group is potentially exposed to are not
disclosed as their variability does not permit reliable forecasts.
LEASE LIABILITIES
Figures in millions - US Dollars | 2023 | 2022 | 2021 |
Reconciliation of lease liabilities (1) | |||
A reconciliation of the lease liabilities included in the statement of financial position is set out in the following table: | |||
Opening balance | |||
Lease liabilities recognised | |||
Repayment of lease liabilities | ( | ( | ( |
Finance costs paid on lease liabilities | ( | ( | ( |
Interest charged to the income statement | |||
Modifications and terminations | ( | ( | |
Translation | ( | ( | |
Closing balance | |||
Lease liabilities (2) | |||
Non-current | |||
Current | |||
Total |
(1) The Group leases a number of assets as part of its activities. These primarily include gas pipelines, ore haulage and site services, mining equipment and
property. All lease contracts contain market review clauses in the event that the Group exercises its option to renew. A maturity analysis of lease liabilities is
provided in note 31.
(2)In 2022, $13
Significant accounting judgements and estimates Various factors are considered in assessing whether an arrangement contains a lease, including whether a service contract includes the implicit right to substantially all the economic benefits from assets used in providing the service and whether the Group directs how and for what purpose the assets are used. In determining the lease term, management considers all facts and circumstances that create an economic incentive to exercise an extension option, or not exercise a termination option. Extension options (or periods after termination options) are only included in the lease term if the lease is reasonably certain to be extended (or not terminated). The assessment is reviewed if a significant event or a significant change in circumstances occurs which affects this assessment and that is within the control of the lessee. The Company applies the considerations for short-term leases where leases are modified to extend the period by 12 months or less on expiry and these modifications are assessed on a standalone-basis. In determining the incremental borrowing rates, management considers the term of the lease, the nature of the asset being leased, in country borrowings as well as other sources of finance. |
NOTES TO THE CONSOLIDATED FINANCIAL STATEMENTS (continued)
F - 42
Accounting policies The Group assesses whether a contract is or contains a lease, at inception of a contract. The Group recognises a right of use asset and a corresponding lease liability with respect to all lease agreements in which it is the lessee, except for short-term leases (defined as leases with a lease term of 12 months or less with no purchase option) and leases of low value assets, where the recognition exemption is applied. For these leases, the Group recognises the lease payments as an operating expense on a straight-line basis over the term of the lease unless another systematic basis is more representative of the time pattern in which economic benefits from the leased asset are consumed. The lease liability is initially measured at the present value of the lease payments that are not paid at the commencement date, discounted by using the rate implicit in the lease. If this rate cannot be readily determined, the Group uses its incremental borrowing rate. The incremental borrowing rate is the rate that the Group would have to pay to borrow the funds necessary to obtain an asset of similar value to the right of use asset in a similar economic environment with similar terms, security and conditions. The Group applies a single discount rate for contracts that share similar characteristics. The Group has determined that contracts that are denominated in the same currency will use a single discount rate. Contracts may contain both lease and non-lease components. The Group allocates the consideration in the contract to the lease and non-lease components based on their relative stand-alone prices. Lease payments included in the measurement of the lease liability comprise: •fixed lease payments (including in-substance fixed payments), less any lease incentives; • variable lease payments that depend on an index or rate, initially measured using the index or rate at the commencement date; •amount expected to be payable by the lessee under residual value guarantees; •the exercise price of purchase options, if the lessee is reasonably certain to exercise the options; and •payments of penalties for terminating the lease, if the lease term reflects the exercise of an option to terminate the lease. The lease liability is subsequently measured by increasing the carrying amount to reflect interest on the lease liability (using the effective interest method) and by reducing the carrying amount to reflect the lease payments made. The Group remeasures the lease liability (and makes a corresponding adjustment to the related right of use asset) whenever: •the lease term has changed or there is a change in the assessment of exercise of a purchase option, in which case the lease liability is remeasured by discounting the revised lease payments using a revised discount rate; •the lease payments change due to changes in an index or rate or a change in expected payment under a guaranteed residual value, in which cases the lease liability is remeasured by discounting the revised lease payments using the initial discount rate (unless the lease payments change is due to a change in a floating interest rate, in which case a revised discount rate is used); or •a lease contract is modified and the lease modification is not accounted for as a separate lease, in which case the lease liability is remeasured by discounting the revised lease payments using a revised discount rate. The right of use assets comprise the initial measurement of the corresponding lease liability, lease payments made at or before the commencement day, any initial direct costs and restoration costs as described below. They are subsequently measured at cost less accumulated depreciation and impairment losses. The lease term is determined as the non-cancellable period of a lease, together with: •periods covered by an option to extend the lease if the Group is reasonably certain to make use of that option; and / or •periods covered by an option to terminate the lease, if the Group is reasonably certain not to make use of that option. Whenever the Group incurs an obligation for costs to dismantle and remove a leased asset, restore the site on which it is located or restore the underlying asset to the condition required by the terms and conditions of the lease, a provision is recognised and measured under IAS 37 ‘Provisions, Contingent Liabilities and Contingent Assets’. The costs are included in the related right of use asset, unless those costs are incurred to produce inventories. Right of use assets are depreciated over the shorter period of lease term and useful life of the underlying asset. If a lease transfers ownership of the underlying asset or the cost of the right of use asset reflects that the Group expects to exercise a purchase option, the related right of use asset is depreciated over the useful life of the underlying asset. The depreciation starts at the commencement date of the lease. The Group applies IAS 36 ‘Impairment of Assets’ to determine whether a right of use asset is impaired and accounts for any identified impairment loss accordingly. |
NOTES TO THE CONSOLIDATED FINANCIAL STATEMENTS (continued)
F - 43
14INTANGIBLE ASSETS
Figures in millions - US Dollars | Goodwill | Other | Total | ||
Cost | |||||
Balance at 1 January 2021 | |||||
Additions | |||||
Transfers and other movements (1) | ( | ( | |||
Translation | ( | ( | ( | ||
Balance at 31 December 2021 | |||||
Accumulated amortisation and impairments | |||||
Balance at 1 January 2021 | |||||
Amortisation for the year | |||||
Transfers and other movements (1) | ( | ( | |||
Translation | ( | ( | |||
Balance at 31 December 2021 | |||||
Net book value at 31 December 2021 | |||||
Cost | |||||
Balance at 1 January 2022 | |||||
Additions | |||||
Translation | ( | ( | ( | ||
Balance at 31 December 2022 | |||||
Accumulated amortisation and impairments | |||||
Balance at 1 January 2022 | |||||
Amortisation for the year | |||||
Impairment of goodwill | |||||
Translation | |||||
Balance at 31 December 2022 | |||||
Net book value at 31 December 2022 | |||||
Cost | |||||
Balance at 1 January 2023 (2) | |||||
Additions | |||||
Transfers and other movements (1) | |||||
Translation | ( | ( | |||
Balance at 31 December 2023 | |||||
Accumulated amortisation and impairments | |||||
Balance at 1 January 2023 (2) | |||||
Amortisation for the year | |||||
Translation | ( | ( | |||
Balance at 31 December 2023 | |||||
Net book value as 31 December 2023 |
(1)Transfers and other movements include amounts from asset reclassifications and amounts written off.
(2)The goodwill opening balances for cost and accumulated amortisation and impairments have been netted off to reflect the appropriate remaining goodwill
balance.
NOTES TO THE CONSOLIDATED FINANCIAL STATEMENTS (continued)
F - 44
Impairment calculation assumptions for goodwill
2023
includes significant goodwill is:
2023 | |||
US Dollars | |||
Figures in millions | Carrying Value | Fair value less costs to dispose | |
Sunrise Dam | |||
As at 31 December 2023, the recoverable amount of Sunrise Dam exceeded its carrying amount by $35 m. Sunrise Dam had
$105 m goodwill at 31 December 2023. The approved life-of-mine of Sunrise Dam is planned until 2028, however, for impairment
testing purposes, resources not included in the current approved life-of-mine plan where management has high confidence in the
orebody and economical recovery of gold, based on historical and similar geological experience, were included in the discounted
cash flow model. The attributable resource value ounces have been included in the discounted cash flow model applied based
on historical conversion factors in converting resources to reserves. The fair value less costs to dispose is derived from a
discounted cash flow model using a real discount rate of 5 %. This is a level 3 fair value measurement.
It is estimated that a decrease of the gold price assumptions by 2.3 %, or an increase in the discount rate of 5.1 % to 10.1 %, or an
increase of 2.4 % in the A$/US$ exchange rate, would cause the recoverable amount of this CGU to equal its carrying amount.
The sensitivity analysis has been provided on the basis that the key assumption changes without a change in the other
assumptions. However, for a change in each of the assumptions used, it is impracticable to disclose the consequential effect of
changes on the other variables used to measure the recoverable amount because these assumptions and others used in
impairment testing of goodwill are inextricably linked.
2022
goodwill is:
2022 | |||
US Dollars | |||
Figures in millions | Carrying Value | Value in use | |
Sunrise Dam | |||
As at 31 December 2022, the recoverable amount of Sunrise Dam exceeded its carrying amount by $63 m. Sunrise Dam had
$105 m goodwill at 31 December 2022. The approved life-of-mine of Sunrise Dam is planned until 2028. The value in use is
derived from a discounted cash flow model using a real discount rate of 4.6 %.
It is estimated that a decrease of the long-term real gold price of $1,731 /oz by 4.5 %, or an increase in the discount rate of 4.6 %
to 13.9 %, would cause the recoverable amount of this CGU to equal its carrying amount. The sensitivity analysis has been
provided on the basis that the key assumption changes without a change in the other assumptions. However, for a change in
each of the assumptions used, it is impracticable to disclose the consequential effect of changes on the other variables used to
measure the recoverable amount because these assumptions and others used in impairment testing of goodwill are inextricably
linked.
Significant accounting judgements and estimates For significant accounting judgements and estimates relating to impairments see Note 12. |
NOTES TO THE CONSOLIDATED FINANCIAL STATEMENTS (continued)
F - 45
Accounting policies Where an investment in a subsidiary, joint venture or an associate is made, any excess of the consideration transferred over the fair value of the attributable Mineral Resource including value beyond Proven and Probable Mineral Reserve, exploration properties and net assets is recognised as goodwill. Goodwill is not amortised, is tested annually for impairment or whenever events or changes in circumstances indicate that the carrying amount may not be recoverable and carried at cost less accumulated impairment losses. Gains and losses on the disposal of an entity include the carrying amount of goodwill relating to the entity sold. Goodwill is allocated to cash generating units for the purpose of impairment testing. |
NOTES TO THE CONSOLIDATED FINANCIAL STATEMENTS (continued)
F - 46
15 PRINCIPAL OPERATING SUBSIDIARIES AND JOINT OPERATIONS
AngloGold Ashanti plc is the ultimate parent of the Group. Its wholly-owned subsidiary, AngloGold Ashanti Holdings plc, a
company incorporated in the Isle of Man, primarily holds all of the Group’s interests in companies incorporated outside of South
Africa. The following table presents each of the Group’s principal operating subsidiaries and joint operations (including direct and
indirect holdings), the percentage of shares of each subsidiary and joint operation owned and the country of incorporation at 31
December 2023. There are no significant restrictions on the ability of the Group’s subsidiaries or joint operations to transfer funds
to AngloGold Ashanti plc in the form of cash dividends or repayment of loans or advances.
Percentage held | |||||
For the year ended 31 December | Country of incorporation | Holding | 2023 | 2022 | 2021 |
Principal operating subsidiaries | |||||
AngloGold Ashanti Australia Limited (1) | Australia | Indirect | |||
AngloGold Ashanti (Pty) Ltd (formerly AngloGold Ashanti Limited) | South Africa | Direct | |||
AngloGold Ashanti Holdings plc | Isle of Man | Direct | |||
AngloGold Ashanti USA Incorporated | United States of America | Indirect | |||
AngloGold Ashanti Córrego do Sítio Mineração S.A. | Brazil | Indirect | |||
AngloGold Ashanti (Ghana) Limited (2) | Ghana | Indirect | |||
AngloGold Ashanti (Iduapriem) Limited | Ghana | Indirect | |||
Cerro Vanguardia S.A. | Argentina | Indirect | |||
Geita Gold Mining Limited | Tanzania | Indirect | |||
Mineração Serra Grande S.A. | Brazil | Indirect | |||
Société AngloGold Ashanti de Guinée S.A. | Republic of Guinea | Indirect | |||
Unincorporated joint operation | |||||
Tropicana joint operation | Australia | Indirect | |||
(1)Owner of the Sunrise Dam operation and the Tropicana joint operation in Australia.
(2)Operates the Obuasi mine in Ghana.
Non-controlling interests
The Group has subsidiaries with non-controlling interests, however none of them were material to the statement of financial
position.
Accounting policies Items included in the financial statements of each of the Group’s entities are measured using the currency of the primary economic environment in which the entity operates (the ‘functional currency’). The functional currency of the parent company is United States Dollars. Foreign currency transactions are translated into the functional currency using the exchange rates prevailing at the dates of the transactions. Foreign exchange gains and losses resulting from the settlement of such transactions, and from the translation of monetary assets and liabilities denominated in foreign currencies, are recognised in profit or loss. |
The results and financial position of all Group entities (none of which has the currency of a hyperinflationary economy) that have a functional currency different from the presentation currency are translated into the presentation currency using closing rates of exchange at the reporting date for assets and liabilities, average rates of exchange for the year for income and expense items and historical rates of exchange for equity items. All resulting exchange differences are recognised in other comprehensive income and presented as a separate component of equity (foreign currency translation reserve, or FCTR). Exchange differences arising from the translation of the net investment in foreign operations are accounted for as other comprehensive income on consolidation. On realisation of net investments in foreign operations, the resulting FCTR is recycled to the income statement. On disposal of non-foreign operations, where the parent’s functional currency, is the same as the subsidiary’s, associate’s, joint venture’s or branch’s functional currency, no reclassification of FCTR is required. |
NOTES TO THE CONSOLIDATED FINANCIAL STATEMENTS (continued)
F - 47
16INVESTMENTS IN ASSOCIATES AND JOINT VENTURES
US Dollars | |||||
Figures in millions | 2023 | 2022 | 2021 | ||
Restated (3) | Restated (3) | ||||
Carrying value | |||||
Investments in associates | |||||
Investments in joint ventures (1) (2) | |||||
(1) During 2023, Kibali (Jersey) Limited, which holds AngloGold Ashanti’s effective 45 % interest in Kibali Goldmines S.A., declared a dividend in specie through the
distribution of a loan receivable to its shareholders. The investment in joint ventures was reduced in 2023, due to the non-cash dividend distributed as a short-
term joint venture loan receivable of $148 m and a long-term joint venture loan receivable of $358 m. The short-term portion was based on the Kibali Goldmines
S.A. future estimated cash flows. The loan bears semi-annual interest at 7.875 % per annum and is repayable on demand.
(2) Cash dividends received from joint ventures of $180 m (2022: $694 m; 2021: $231 m).
(3)Comparative periods have been retrospectively restated. Refer to note 1.3.
Detailed disclosures are provided for the years in which investments in associates and joint ventures are considered to be
material.
US Dollars | |||||
Figures in millions | 2023 | 2022 | 2021 | ||
Restated (2) | Restated (2) | ||||
Aggregate statement of profit or loss for associates (attributable) | |||||
Revenue | |||||
Operating (expenses) income | ( | ( | ( | ||
Taxation | ( | ( | ( | ||
Profit (loss) for the year (1) | |||||
Total comprehensive profit (loss) for the year, net of tax | |||||
(1) Includes share of non-controlling interest.
(2)Comparative periods have been retrospectively restated. Refer to note 1.3.
Name | Effective % | Description | Country of incorporation and operation | ||||||
2023 | 2022 | 2021 | |||||||
Kibali Goldmines S.A. (1) | Exploration and mine development | The Democratic Republic of the Congo | |||||||
(1)AngloGold Ashanti plc has a 50 % interest in Kibali (Jersey) Limited which holds its effective 45 % interest in Kibali Goldmines S.A.
US Dollars | |||||
Figures in millions | 2023 | 2022 | 2021 | ||
Restated (1) | Restated (1) | ||||
Carrying value of joint ventures | |||||
Kibali Goldmines S.A. | |||||
(Impairment) reversal of investment in joint venture | |||||
Société d’Exploitation des Mines d’Or de Yatela | ( | ( | |||
The cumulative unrecognised share of losses of the joint ventures: | |||||
Société d’Exploitation des Mines d’Or de Yatela | |||||
(1)Comparative periods have been retrospectively restated. Refer to note 1.3.
NOTES TO THE CONSOLIDATED FINANCIAL STATEMENTS (continued)
F - 48
US Dollars | |||||
Figures in millions | 2023 | 2022 | 2021 | ||
Restated (4) | Restated (4) | ||||
Statement of profit or loss | |||||
Revenue | |||||
Other operating costs and expenses | ( | ( | ( | ||
Amortisation of tangible and intangible assets | ( | ( | ( | ||
Finance costs, unwinding of obligations and cash repatriation fee | ( | ( | ( | ||
Interest received | |||||
Share of profits of equity accounted joint venture | |||||
Taxation | ( | ( | ( | ||
Profit for the year | |||||
Total comprehensive income for the year, net of tax | |||||
Dividends received from joint venture (attributable) | |||||
Statement of financial position | |||||
Non-current assets | |||||
Current assets | |||||
Cash and cash equivalents (2) | |||||
Total assets | |||||
Non-current financial liabilities | |||||
Other non-current liabilities | |||||
Current financial liabilities | |||||
Other current liabilities | |||||
Total liabilities | |||||
Net assets | |||||
Group’s share of net assets | |||||
Other (3) | ( | ( | ( | ||
Carrying amount of interest in joint venture | |||||
(1)At the end of January and in early February 2022, Kibali Goldmines S.A., which owns and operates the Kibali gold mine in the Democratic Republic of the Congo,
received fifteen claims from the Direction Générale des Douanes et Accises (“Customs Authority”) concerning customs duties. The Customs Authority claims that
incorrect import duty tariffs have been applied to the importation of certain consumables and equipment for the Kibali gold mine. In addition, they claimed that the
exemption available to Kibali Goldmines S.A., which was granted in relation to the original mining lease, no longer applied. Finally, the Customs Authority claimed
that a service fee paid on the exportation of gold was paid to the wrong government body. The claims, including substantial penalties and interest, totalled $339 m
(AngloGold Ashanti attributable share: $153 m). The Company has examined the Customs Authority claims and, except for certain immaterial items for which a
provision has already been made, concluded that they were without merit, as they sought to challenge established customs practices which have been accepted
by the Customs Authority for many years and, where relevant, were in line with ministerial instruction letters. The Company engaged in discussions with the
Customs Authority and Ministry of Finance to resolve the customs claims. As a result of these discussions, all of the customs claims have now been resolved
with the exception of one immaterial claim for which a provision has already been made.
(2)Kibali cash and cash equivalents are subject to various steps before they can be distributed to joint venture shareholders. Cash balances were reduced in 2022
due to repatriations in the form of dividends and repayment of shareholder loans.
(3)Includes amounts relating to additional costs and contributions at acquisition as well as non-controlling interests related to SOKIMO.
(4)Comparative periods have been retrospectively restated. Refer to note 1.3.
NOTES TO THE CONSOLIDATED FINANCIAL STATEMENTS (continued)
16INVESTMENTS IN ASSOCIATES AND JOINT VENTURES (continued)
F - 49
Accounting policies A joint venture is an entity in which the Group holds a long-term interest and which the Group and one or more other ventures jointly control under a contractual arrangement, that provides for strategic, financial and operating policy decisions relating to the activities requiring unanimous consent of the parties sharing control. In a joint venture the Group has rights to the net assets of the arrangement, rather than rights to its assets and obligations for its liabilities. An associate is an investment over which the Group exercises significant influence, but not control or joint control, over the financial and operating policies and normally owns between 20% and 50% of the voting equity. Joint ventures and Associates are equity-accounted from the effective date of acquisition to the effective date of disposal. Any losses of equity- accounted investments are accounted for in the consolidated financial statements until the investment in such investments is written down to zero. Thereafter, losses are accounted for only insofar as the Group is committed to providing financial support to such investees. The carrying value of equity-accounted investments represents the cost of each investment, including goodwill, balance outstanding on loans advanced if the loan forms part of the net investment in the investee, any impairment / impairment reversals recognised, the share of post- acquisition retained earnings and losses, and any other movements in reserves. The carrying value of equity-accounted investments is reviewed when indicators arise and if any impairment / impairment reversal has occurred; it is recognised in the period in which the impairment arose. If necessary, impairment and impairment reversals on loans and equity are reported under share of joint ventures and associates profit and loss. In the statement of cash flows, dividends received from joint ventures are included in operating activities as the Group has joint control over the strategic, financial and operating policy decisions. Dividends received from associates are included in investing activities as the Group only exercises significant influence over the financial and operating policies. |
NOTES TO THE CONSOLIDATED FINANCIAL STATEMENTS (continued)
16INVESTMENTS IN ASSOCIATES AND JOINT VENTURES (continued)
F - 50
17INVENTORIES
US Dollars | |||||
Figures in millions | 2023 | 2022 | 2021 | ||
Raw materials | |||||
- ore stockpiles | |||||
- heap-leach inventory | |||||
Work in progress | |||||
- metals in process | |||||
- gold concentrate in process | |||||
Finished goods | |||||
- gold doré/bullion | |||||
- by-products | |||||
- gold concentrate | |||||
Total metal inventories | |||||
Mine operating supplies | |||||
(1)The amount of the write down of ore stockpiles, heap-leach inventory, work in process, finished goods and mine operating supplies to net realisable value, and
recognised as an expense in cost of sales is $6 m (2022: $12 m; 2021: $13 m).
Significant accounting judgements and estimates Stockpiles and metals in process Costs that are incurred in or benefit the production process are accumulated in stockpiles and metals in process values. Net realisable value tests are performed at least annually and represent the estimated future sales price of the product, based on prevailing and long-term metals prices, less estimated costs to complete production and bring the product to sale. Surface and underground stockpiles and metals in process are measured by estimating the number of tonnes added and removed from the stockpile, the number of contained ounces based on assay data, and the estimated recovery percentage based on the expected processing method. Stockpile ore tonnages are verified by periodic surveys. Although the quantities of recoverable metal are reconciled by comparing the grades of ore to the quantities of metals actually recovered (metallurgical balancing), the nature of the process inherently limits the ability to precisely monitor recoverability levels. As a result, the metallurgical balancing process is constantly monitored and engineering estimates are refined based on actual results over time. Variations between actual and estimated quantities resulting from changes in assumptions and estimates that do not result in write-downs to net realisable value are accounted for on a prospective basis. |
Accounting policies Inventories are valued at the lower of cost and net realisable value after appropriate allowances for redundant and obsolete items. Cost is determined on the following bases: •metals in process are valued at the average total production cost at the relevant stage of production; •gold doré/bullion is valued on an average total production cost method; •ore stockpiles are valued at the average moving cost of mining and stockpiling the ore. Stockpiles are classified as a non-current asset where the stockpile exceeds current processing capacity; •by-products, which include silver and sulphuric acid, are valued using an average total production cost method; •mine operating supplies are valued at average cost; and •heap leach pad materials are measured on an average total production cost basis. A portion of the related depreciation, depletion and amortisation charge is included in the cost of inventory. Inventory write downs are included in cost of sales. |
NOTES TO THE CONSOLIDATED FINANCIAL STATEMENTS (continued)
F - 51
18TRADE, OTHER RECEIVABLES AND OTHER ASSETS
US Dollars | |||||
Figures in millions | 2023 | 2022 | 2021 | ||
Restated (2) | |||||
Non-current | |||||
Deferred compensation assets (financial assets) | |||||
Prepayments | |||||
Recoverable tax, rebates, levies and duties (1) | |||||
Current | |||||
Trade receivables (financial assets) | |||||
Deferred compensation asset (financial assets) | |||||
Prepayments | |||||
Recoverable tax, rebates, levies and duties (1) | |||||
Other receivables (financial assets) | |||||
Total trade, other receivables and other assets | |||||
There is a concentration of risk in respect of amounts due from Revenue Authorities for recoverable tax, rebates, levies and duties from subsidiaries in the Africa Region segment. These values are summarised as follows: | |||||
Recoverable value added tax | |||||
Appeal deposits | |||||
(1) Includes taxation asset, refer to note 27.
(2)Comparative periods have been retrospectively restated. Refer to note 1.3.
NOTES TO THE CONSOLIDATED FINANCIAL STATEMENTS (continued)
F - 52
18TRADE, OTHER RECEIVABLES AND OTHER ASSETS (continued)
Geita Gold Mine
Geita Gold Mining Limited (GGM) in Tanzania net indirect tax receivables balance was $153 m (2022: $153 m; 2021: $139 m).
Claims relating to periods from July 2022 totalling $73 m were offset against provisional tax payments in 2023. Offset against
provisional corporate tax payments amounted to $45 m in 2022 and $54 m in 2021, respectively. Amounts offset against VAT
claims have been certified by an external advisor and verified by the Tanzania Revenue Authority (TRA). The remaining disputed
balance relating to the period July 2017 to June 2020 was objected to as GGM believe that the claims have been correctly
lodged pursuant to Tanzanian law.
An amendment, effective 20 July 2017, to Tanzania's mining legislation included an amendment to the Value Added Tax Act,
2014 (No. 5) (2015 VAT Act) to the effect that no input tax credit can be claimed for the exportation of “raw minerals”. The Written
Laws (Miscellaneous Amendments) (No. 2) Act, 2019, issued during 2019, provides a definition for "raw minerals". However,
GGM has received notices from the TRA that they are not eligible for VAT relief from July 2017 onwards on the basis that all
production constitutes “raw minerals” for this purpose.
The basis for dispute of the disqualifications is on the interpretation of the legislation. Management's view is the definition of "raw
minerals" provided in the Written Laws (Miscellaneous Amendments) (No. 2) Act, 2019 excludes gold doré. Gold bearing ore is
mined from the open pit and underground mining operations, where it is further crushed and milled to maximise the gold recovery
process, producing gold doré exceeding 80% purity as well as beneficiated products (concentrate). On this basis the mined doré
and concentrate do not constitute “raw minerals” and accordingly the VAT claims are valid. Management have obtained legal
opinions that support management's view that doré does not constitute a “raw mineral”.
The Finance Act, 2020 (No. 8) became effective on 1 July 2020. The Finance Act amended the VAT Act by deleting the
disqualification of VAT refunds due to the exportation of “raw minerals”. The deletion is intended to ensure the recovery of VAT
refunds from July 2020, although the amendment cannot be applied retrospectively, the change in the VAT Act, together with the
Written Laws (Miscellaneous Amendments) (No.2) Act 2019, confirms that doré bars are not “raw minerals” and that VAT refunds
from July 2017 onwards are due to GGM. On 30 January 2021, management received a proposal from the TRA to settle VAT
objections filed between 2017 and 2020, confirming the TRA's position to disqualify all VAT refunds requested by GGM for the
period from July 2017 to June 2020. Management is not in agreement with the proposal and are pursuing legal remedies
provided to taxpayers by Tanzanian law, as well as working with the TRA towards an agreement to resolve these matters.
The total VAT claims submitted from July 2017 to June 2020 amount to $144 m (net of foreign exchange revaluations). All
disqualifications received from the TRA have been objected to by GGM in accordance with the provisions and time frames set
out in the Tax Administration Act, 2015 (No.10). Claims of $81 m (2022: $64 m; 2021: $50 m) were submitted to the TRA and the
total outstanding claims amount to $200 m (after taking into account offsets and foreign exchange revaluations). The net indirect
tax receivable at 31 December 2023 of $153 m, reflects a probability weighted scenario model of the discounting effects applied
to the timing of when GGM expects to offset its indirect tax claims against future income taxes of GGM.
Cerro Vanguardia (CVSA)
On 4 September 2018, a decree was published by the Argentinean Government, which reintroduced export duties for products
exported from Argentina. The export duty rate was 12% on the freight on board (FOB) value of goods exported, including gold,
paid in country. The duty was limited so as not to exceed ARS $4 for each US dollar exported. On 14 December 2019, the
Government of Argentina announced that the cap of ARS $4 for each US dollar exported, would be replaced by a flat rate of 12%
for 2020. On 2 October 2020, the Government of Argentina extended the export duties until 31 December 2021, at a rate of 8%
for gold bullion. On 31 December 2021, the Government of Argentina extended the export duties until 31 December 2023, at a
rate of 8% for gold bullion. The extension of the rate of 8% post 31 December 2023 is pending before Congress. In terms of the
Stability Agreement between CVSA and the Government of Argentina, CVSA has a right of refund or offset of these amounts paid
since export duties were zero percent at the time of the establishment of the Stability Agreement. The Stability Agreement also
provides for the refund of any amounts paid in excess of the tax rate (30 %) that applied at the time the Stability Agreement was
entered into. Export duty refunds for the years 2018 to 2023 are outstanding as at 31 December 2023 and their fair value has
been estimated using a probability weighted scenario model considering various recovery time frames, estimated Argentinean
peso to USD exchange rates and discounting using a country risk adjusted rate. As a result of the taxation cap, net export duty
receivables amount to $4 m (2022: $9 m; 2021: $19 m), and reflects the discounting effects applied to when CVSA expects refund
of these receivables.
NOTES TO THE CONSOLIDATED FINANCIAL STATEMENTS (continued)
F - 53
Significant accounting judgements and estimates Recoverable tax, rebates, levies and duties In a number of countries, particularly in Tanzania and Argentina, AngloGold Ashanti is due refunds of indirect tax which remain outstanding for periods longer than those provided for in the respective statutes. The Group uses probability weighted discounting models together with the expected timing of recovery of these refunds to estimate their fair values and related discounting effects which are updated at each reporting period. Timing of the recoverability and the resultant probabilities is updated based on several factors including ongoing correspondence and meetings with the relevant authorities and available income taxes for off-sets, if applicable. Where the recovery of the indirect tax refunds is tied to off-set arrangements against income taxes, the modeled scenarios incorporate judgements around the applicable mine’s business plan and availability of future income tax off-sets. The Group consults tax and legal specialists to determine the current basis of applicable laws and regulations in the associated jurisdictions which are highly complex and subject to interpretation. Future changes to such laws and regulations or the interpretation thereof could have a material impact on the carrying value of these assets, results of operations and cash flows. In addition, AngloGold Ashanti has unresolved non-income tax disputes in a number of countries, particularly in Tanzania, Brazil and Argentina. If the outstanding input taxes are not received and these disputes are not resolved in a manner favourable to AngloGold Ashanti, it could have a material adverse effect upon the carrying value of these assets and AngloGold Ashanti’s results of operations. |
NOTES TO THE CONSOLIDATED FINANCIAL STATEMENTS (continued)
F - 54
19CASH RESTRICTED FOR USE
US Dollars | |||||
Figures in millions | 2023 | 2022 | 2021 | ||
Non-current | |||||
Cash restricted for environmental and rehabilitation obligations (1) | |||||
Current | |||||
Cash restricted by prudential solvency requirements (2) | |||||
Cash balances held by joint operations (3) | |||||
Total cash restricted for use (note 31) | |||||
(1)Reclamation bonds provided to the Environmental Protection Agency in Ghana for environmental and rehabilitation obligations.
(2)Cash held by the Group's captive insurance company to maintain the solvency capital requirement.
(3)Cash held by joint operations for use within those entities only.
Accounting policies Cash restricted for use comprises cash and cash equivalents including amounts held in escrow, trust, separate bank accounts and cash held by joint operations which are not available for general use by the Group. Cash restricted for use for more than 12 months after year-end is classified as a non-current financial asset. |
NOTES TO THE CONSOLIDATED FINANCIAL STATEMENTS (continued)
F - 55
20CASH AND CASH EQUIVALENTS
US Dollars | |||||
Figures in millions | 2023 | 2022 | 2021 | ||
Cash and cash equivalents (1) | |||||
Bank overdraft | ( | ( | |||
Per the statement of cash flows | |||||
(1) Cash and cash equivalents include cash and deposits on call of $964 m (2022: $870 m; 2021: $712 m) and money market instruments of nil (2022: $238 m; 2021:
$442 m). Money market instruments were readily available for use by the Group.
Accounting policies Cash and cash equivalents comprise cash on hand, deposits on call and other short-term highly liquid investments with a maturity period of three months or less at date of purchase. Cash and cash equivalents are stated at carrying amount which fairly approximates its fair value. For the purposes of the statement of cash flows, cash and cash equivalents is net of bank overdrafts as it forms an integral part of the Group’s cash management. |
21SHARE CAPITAL AND PREMIUM
Number of shares | |||||
2023 | 2022 | 2021 | |||
Restated (1) | Restated (1) | ||||
Issued and fully paid ordinary shares | |||||
Ordinary shares issued at the beginning of the year | |||||
Issued in terms of the corporate restructuring at a nominal value of $ | |||||
Issued in terms of employee share awards | |||||
Ordinary shares issued at the end of the year | |||||
(1)Comparative periods have been retrospectively restated. Refer to note 1.3.
Corporate restructuring
See note 1.3.1.
NOTES TO THE CONSOLIDATED FINANCIAL STATEMENTS (continued)
F - 56
22BORROWINGS
Figures in millions | US Dollars | ||||||||
2023 | 2022 | 2021 | |||||||
Expiry date | Currency | Interest Rate | Contract Amount | Available facilities (2) | Utilised facilities | Utilised facilities | Utilised facilities | ||
Unsecured | |||||||||
Debt arrangements (1) | |||||||||
Rated bonds | November, 2028 | US dollar | |||||||
Rated bonds | October, 2030 | US dollar | |||||||
Rated bonds | April, 2040 | US dollar | |||||||
Unamortised loan costs | ( | ( | ( | ||||||
Interest accrued | |||||||||
Banking facilities | |||||||||
Multi-currency revolving credit facility | June, 2022 | US dollar, Australian dollar | LIBOR+ | ||||||
Siguiri revolving credit facility | August, 2022 | US dollar | LIBOR+ | ||||||
Geita revolving credit facility | December, 2024 | US dollar, Tanzanian shilling | SOFR+credit adj+ Tanzanian Treasury Bill+ | ||||||
Siguiri revolving credit facility | October, 2025 | US dollar | SOFR+ | ||||||
Multi-currency revolving credit facility | June, 2028 | US dollar, Australian dollar | SOFR+credit adj+ BBSY+ | ||||||
Commercial banking facilities | None | Rand | Linked to an overnight bank lending rate | ||||||
Total borrowings | |||||||||
NOTES TO THE CONSOLIDATED FINANCIAL STATEMENTS (continued)
F - 57
22 BORROWINGS continued | |||||
US Dollars | |||||
Figures in millions | 2023 | 2022 | 2021 | ||
Total borrowings | |||||
Current portion of borrowings | ( | ( | ( | ||
Total non-current borrowings | |||||
Amounts falling due | |||||
Within one year | |||||
Between one and two years | |||||
Between two and five years | |||||
After five years | |||||
Change in liabilities arising from financing activities: | |||||
Reconciliation of borrowings (excluding lease liabilities) (3) | |||||
A reconciliation of the total borrowings included in the statement of financial position is set out in the following table: | |||||
Opening balance | |||||
Proceeds from borrowings | |||||
Repayment of borrowings | ( | ( | ( | ||
Finance costs paid on borrowings | ( | ( | ( | ||
Deferred loan fees | ( | ( | ( | ||
Other borrowing fees | ( | ||||
Interest charged to the income statement | |||||
Translation | ( | ( | |||
Closing balance | |||||
Reconciliation of finance costs paid: | |||||
A reconciliation of the finance cost paid included in the statement of cash flows is set out in the following table: | |||||
Finance costs paid on borrowings | |||||
Capitalised finance cost | ( | ( | |||
Commitment fees, utilisation fees and other borrowing costs | |||||
Total finance costs paid | |||||
(1) The rated bonds are fully and unconditionally guaranteed by AngloGold Ashanti plc.
(2)Represents undrawn capital on borrowings facilities.
(3) Refer to note 13 for changes in lease liabilities arising from financing activities.
NOTES TO THE CONSOLIDATED FINANCIAL STATEMENTS (continued)
F - 58
23ENVIRONMENTAL REHABILITATION AND OTHER PROVISIONS
Figure in millions | Provision for decommissioning | Provision for restoration | Provision for silicosis | Other provisions (2) | Total | |||||
Balance at 1 January 2023 | ||||||||||
Changes in estimates - recognised in profit or loss (1) | ( | |||||||||
Change in estimates - capitalised (1) | ||||||||||
Reclassifications | ( | |||||||||
Utilised during the year | ( | ( | ( | ( | ||||||
Unwinding of provision | ||||||||||
Translation | ( | ( | ( | |||||||
Balance at 31 December 2023 | ||||||||||
Current | ||||||||||
Non-current |
US Dollars | |
Figures in millions | 2023 |
Expected cash flows | |
Within one year | |
Between one and two years | |
Between two and five years | |
After five years | |
Sensitivity analysis - Provision for decommissioning (3) | |
A change in discount rates and cash flows have a significant impact on the amounts recognised in the statement of financial position. A 10% change in the discount rate and cash flows would have the following impact: | |
Effect of increase in assumptions: | |
10% change in discount rate | ( |
10% change in cash flows | |
Effect of decrease in assumptions: | |
10% change in discount rate | |
10% change in cash flows | ( |
Sensitivity analysis - Provision for restoration (3) | |
A change in discount rates and cash flows have a significant impact on the amounts recognised in the income statement. A 10% change in the discount rate and cash flows would have the following impact: | |
Effect of increase in assumptions: | |
10% change in discount rate | ( |
10% change in cash flows | |
Effect of decrease in assumptions: | |
10% change in discount rate | |
10% change in cash flows | ( |
Sensitivity analysis - Provision for silicosis (3) | |
Significant judgements are applied in estimating the costs required to settle any qualifying silicosis claims and are based on certain assumptions which includes the number of claimants, take-up rates and disease progression rates. A 10% change in these assumptions would have the following impact: | |
Effect of increase in assumptions: | |
10% change in take-up rates | |
10% change in number of cases | |
10% change in disease progression rate | |
Effect of decrease in assumptions: | |
10% change in take-up rates | ( |
10% change in number of cases | ( |
10% change in disease progression rate | ( |
NOTES TO THE CONSOLIDATED FINANCIAL STATEMENTS (continued)
F - 59
(1)The change in estimates relating to the provision for decommissioning and restoration is attributable to shifts in discount rates from global economic assumption
changes, alterations in mine plans affecting cash flows, updates in design for closure of tailings storage facilities and in revised methodology following requests
from the environmental regulatory authorities. These provisions are expected to unwind beyond the end of the life-of-mine.
(2)Other provisions comprise claims filed by former employees in respect of loss of employment, work-related accident injuries and diseases, governmental fiscal
claims relating to levies, surcharges and environmental legal disputes and an onerous provision in Yatela. These liabilities are expected to be settled over the
next five-year period.
(3)The sensitivity analysis is based on the change of a single assumption, keeping all other assumptions constant. This may not be the case in practice where
changes in assumptions may result in correlated changes in other assumptions, and a change in the provision amount.
Inflation and discount rates applied
Significant judgement is applied in estimating the cost of rehabilitation that will be required in future to rehabilitate the Group’s
mines, related surface infrastructure and tailings storage facilities. The final cost may significantly differ from current estimates.
2023 | ||
Group rates (excluding Australia) | ||
USD inflation rate (range) | ||
USD discount rate (range) | ||
Australia | ||
AUD inflation rate (range) | ||
AUD discount rate (range) |
Environmental obligations
Pursuant to environmental regulations in the countries in which the Group operates, in connection with plans for the eventual
end-of-life of its mines, the Group is obligated to rehabilitate the lands where such mines are located. In most cases, AngloGold
Ashanti is required to provide financial guarantees for such work, including reclamation bonds or letters of credit issued by third
party entities, independent trust funds or cash reserves maintained by the operation, to the respective environmental protection
agency, or such other government department with responsibility for environmental oversight in the respective country, to cover
the estimated environmental rehabilitation obligations.
In most cases, the environmental obligations will expire on completion of the rehabilitation although, in some cases, the Group
may be required to post bonds for potential events or conditions that could arise after the rehabilitation has been completed.
In Australia, since 2014, AngloGold Ashanti has paid into a Mine Rehabilitation Fund an amount of AUD $13 m (2022: AUD $11 m;
2021: AUD $10 m) for a current carrying value of the liability of AUD$115 m. At Iduapriem, AngloGold Ashanti has provided a bond
comprising a cash component of $12 m (2022: $12 m; 2021:$11 m) with a further bond guarantee amounting to $41 m (2022:
$14 m; 2021: $39 m) issued by ABSA Bank Ghana Limited, Standard Chartered Bank Ghana Ltd, Ecobank Ghana Ltd, United
Bank for Africa, FirstRand Bank Ghana Ltd and Stanbic Bank Ghana Ltd for a current carrying value of the liability of $45 m
(2022: $46 m; 2021: $54 m). At Obuasi, AngloGold Ashanti has provided a bond comprising a cash component of $22 m (2022:
$22 m; 2021: $21 m) with a further bank guarantee amounting to $30 m (2022: $30 m; 2021: $30 m) issued by United Bank for
Africa, Stanbic Bank Ghana Ltd and Standard Chartered Bank Ghana PLC for a current carrying value of the liability of $168 m
(2022: $171 m; 2021: $217 m). In some circumstances AngloGold Ashanti may be required to post further bonds in due course
which will have a consequential income statement charge for the fees charged by the providers of the reclamation bonds.
NOTES TO THE CONSOLIDATED FINANCIAL STATEMENTS (continued)
F - 60
Significant accounting judgements and estimates Provision for environmental obligations The Group incurs obligations to close, restore and rehabilitate its mine sites affected by mining and exploration activities which are subject to various laws and regulations governing the protection of the environment. The Group recognises management’s best estimate for decommissioning and restoration obligations in the period in which they are incurred and the costs can be reasonably estimated. The determination of the provision is based on, among other considerations, judgements and estimates of current damage caused, timing and amount of future costs to be incurred to rehabilitate the mine sites, estimates of future inflation, exchange rates and discount rates. Future changes to environmental laws and regulations, technology, life-of-mine estimates, inflation rates, foreign currency exchange rates and discount rates could affect the carrying amount of this provision, cannot be predicted with certainty and could have a material impact on AngloGold Ashanti’s business, financial condition, results of operations and cash flows. Provision for silicosis The Group, together with other mining companies, were named in a class action suit for silicosis and tuberculosis which was certified by the Johannesburg High Court in May 2016. On 26 July 2019, the Johannesburg High Court approved the settlement of the silicosis and tuberculosis class action suit between the Occupational Lung Disease Gold Working Group (the Working Group) – representing AngloGold Ashanti, Gold Fields, African Rainbow Minerals, Anglo American SA, Harmony and Sibanye Stillwater – and lawyers representing affected mineworkers (settlement agreement). A jointly controlled Special Purpose Vehicle has been set up to act as an agent for the Working Group in relation to certain matters set out in the settlement agreement and trust deed. Claims will be accepted for a twelve-year period with an effective date of December 2019. The Settlement Agreement in the silicosis and tuberculosis class action litigation became operational on 10 December 2019. A settlement trust, known as the Tshiamiso Trust, was established to carry out the terms of the Settlement Agreement. Significant judgement is applied in estimating the costs that will be incurred to settle the silicosis class action claims and related expenditure. The final costs may differ from current cost estimates. The provision is based on actuarial assumptions including: •silicosis prevalence rates; •estimated settlement per claimant; •benefit take-up rates; •disease progression rates; •timing of cashflows; and •discount rate. Management believes the assumptions are appropriate, however changes in the assumptions may materially affect the provision and final costs of settlement. |
Accounting policies Environmental expenditure The Group has long term remediation obligations comprising decommissioning and restoration liabilities relating to its past operations which are based on the Group’s environmental management plans, in compliance with current environmental and regulatory requirements. Provisions for non-recurring remediation costs are made when there is a present obligation, it is probable that expenditure on remediation work will be required and the cost can be estimated within a reasonable range of possible outcomes. The costs are based on currently available facts, technology expected to be available at the time of the clean-up, laws and regulations presently or virtually certain to be enacted and prior experience in remediation of contaminated sites. |
Decommissioning costs The provision for decommissioning represents the cost that will arise from dismantling and removing an asset and restoring the site on which it is located. The obligation is incurred at the time the asset is put in place or as a consequence of using the asset for purposes other than to produce inventories. Accordingly, a provision and a decommissioning asset is recognised and included within mine infrastructure. Decommissioning costs are provided at the present value of the expenditures expected to settle the obligation, using estimated cash flows based on current prices. The unwinding of the decommissioning obligation is included in the income statement as finance costs. Estimated future costs of decommissioning obligations are reviewed regularly and adjusted as appropriate for new circumstances or changes in law or technology. Changes in estimates are capitalised or reversed against the relevant asset. Estimates are discounted at a pre-tax rate that reflects current market assessments of the time value of money. Gains or losses from the expected disposal of assets are not taken into account when determining the provision. |
Restoration costs The provision for restoration represents the cost of restoring site damage as a result of operating the asset to produce inventories. Changes in the provision are recorded in the income statement as a cost of production. Restoration costs are estimated at the present value of the expenditures expected to settle the obligation, using estimated cash flows based on current prices and adjusted for risks specific to the liability. The estimates are discounted at a pre-tax rate that reflects current market assessments of the time value of money. |
Other Litigation and administrative proceedings are evaluated on a case-by-case basis considering the information available, including that of legal counsel, to assess potential outcomes. Where it is considered probable that an obligation will result in an outflow of resources, a provision is recorded for the present value of the expected cash outflows if these are reasonably measurable. These provisions cover the estimated payments to plaintiffs, court fees and the cost of potential settlements. Where some or all of the expenditure required to settle a provision is expected to be reimbursed by another party, the reimbursement is recognised only when the reimbursement is virtually certain. The amount to be reimbursed is recognised as a separate asset. Where the Group has a joint and several liability with one or more other parties, no provision is recognised to the extent that those other parties are expected to settle part or all of the obligation. |
NOTES TO THE CONSOLIDATED FINANCIAL STATEMENTS (continued)
F - 61
24PROVISION FOR PENSION AND POST-RETIREMENT BENEFITS
US Dollars | |||||
Figures in millions | 2023 | 2022 | 2021 | ||
Defined benefit plans | |||||
The retirement schemes consist of the following: | |||||
Post-retirement medical scheme for AngloGold Ashanti's South African employees | |||||
Other defined benefit plans | |||||
Post-retirement medical scheme for AngloGold Ashanti's South African employees | |||||
The provision for post-retirement medical funding represents the provision for health care benefits for employees and retired employees and their registered dependants. | |||||
The post-retirement benefit costs are assessed in accordance with the advice of independent professionally qualified actuaries. The actuarial method used is the projected unit credit funding method. The last valuation was performed as at 31 December 2023. | |||||
Information with respect to the defined benefit liability is as follows: | |||||
Benefit obligation | |||||
Balance at beginning of year | |||||
Interest cost | |||||
Benefits paid | ( | ( | ( | ||
Actuarial loss (gain) | ( | ( | |||
Translation | ( | ( | ( | ||
Balance at end of year | |||||
Assumptions | |||||
Assumptions used to determine benefit obligations at the end of the year are as follows: | |||||
Discount rate | |||||
Expected increase in health care costs | |||||
Assumed health care cost trend rates have a significant effect on the amounts reported for health care plans. A 1% point change in assumed health care cost trend rates would have the following effect: | |||||
Effect on post-retirement benefit obligation – | |||||
Effect on post-retirement benefit obligation – | ( | ( | ( | ||
During 2022 and 2023, the Company purchased annuities to partly meet its obligations to pay medical aid contributions. 2024. The annuities are payable monthly and cover payable to retired members. | |||||
NOTES TO THE CONSOLIDATED FINANCIAL STATEMENTS (continued)
F - 62
Figures in millions | 2023 | 2022 | ||
Reimbursive right for post-retirement benefits | ||||
Balance at the beginning of the year | ||||
Premiums paid | ||||
Benefits paid | ( | ( | ||
Interest income | ||||
Actuarial gain (loss) | ( | |||
Translation | ( | |||
Balance at end of year | ||||
The fair value of the right of reimbursement has been determined as the present value of expected future annuity payments payable by the insurer in respect of continuation members, less the present value of the outstanding medical aid premium payment payable on 1 August 2024. The future annuity payments make appropriate allowance for future increases in line with CPI. The main input used in the valuation model are healthcare cost inflation of | ||||
Cash flows | ||||
Estimated future benefit payments | ||||
The following medical benefit payments, which reflect the expected future service, as appropriate, are expected to be paid through the purchased annuities: | ||||
2024 | ||||
2025 | ||||
2026 | ||||
2027 | ||||
2028 | ||||
Thereafter | ||||
Significant accounting judgements and estimates Post-retirement obligations The determination of the Group's obligation and expense for post-retirement liabilities, including the Group’s reimbursive asset relating to annuities purchased to fund the obligation, depends on the selection of certain assumptions used by actuaries to calculate amounts. These assumptions include, among others, the discount rate, health care inflation costs, rates of increase in compensation costs and the number of employees who reach retirement age before the mine reaches the end of its life. While AngloGold Ashanti believes that these assumptions are appropriate, significant changes in the assumptions may materially affect post-retirement obligations as well as future expenses, which may result in an impact on earnings in the periods that the changes in these assumptions occur. |
Accounting policies Post-employment benefit obligations Some Group companies provide post-retirement health care benefits to their retirees. The entitlement to these benefits is usually conditional on the employee remaining in service up to retirement age and completion of a minimum service period. The expected costs of these benefits are accrued over the period of employment using an accounting methodology on the same basis as that used for defined benefit pension plans. Actuarial gains and losses arising from experience adjustments and changes in actuarial assumptions are recorded in other comprehensive income immediately. These obligations are valued annually by independent qualified actuaries. Some of these obligations are funded with a purchased insurance policy to which the Group contributes premiums to. As this insurance policy does not meet the definition of a qualifying insurance policy the Group recognises its right to reimbursement under the insurance policy as a separate asset measured at fair value, similar to a defined benefit plan asset. Actuarial gains and losses arising from experience adjustments and changes in actuarial assumptions are recorded in other comprehensive income immediately. These assets are valued annually by independent qualified actuaries. |
NOTES TO THE CONSOLIDATED FINANCIAL STATEMENTS (continued)
F - 63
25DEFERRED TAXATION
US Dollars | |||||
Figures in millions | 2023 | 2022 | 2021 | ||
Restated (1) | Restated (1) | ||||
Deferred taxation relating to temporary differences is made up as follows: | |||||
Liabilities | |||||
Tangible assets (owned) | |||||
Right of use assets | |||||
Inventories | |||||
Other | |||||
Assets | |||||
Provisions | |||||
Lease liabilities | |||||
Tax losses | |||||
Other | |||||
Net deferred taxation liability | |||||
Included in the statement of financial position as follows: | |||||
Deferred tax assets | |||||
Deferred tax liabilities | |||||
Net deferred taxation liability | |||||
(1)The 2022 comparative period has been retrospectively restated. The restatement has resulted in an increase in taxable temporary differences on tangible assets
of $106 m and on other of $1 m, and an increase in deductible temporary differences on provisions of $56 m and on tax losses of $2 m. Refer to note 1.3.
Provision has been made for taxes that may result from future remittances of undistributed earnings of foreign subsidiaries or
foreign corporate joint ventures and associates, where the Group is able to assert that the undistributed earnings are not
permanently reinvested. In all other cases, the foreign subsidiaries reinvest the undistributed earnings into future capital
expansion projects, maintenance capital and ongoing working capital funding requirements. Unrecognised taxable temporary
differences pertaining to undistributed earnings totalled $1,334 m (2022: $1,393 m; 2021: $1,800 m). If remitted, the undistributed
earnings may be subject to withholding taxes between 0% - 10%.
NOTES TO THE CONSOLIDATED FINANCIAL STATEMENTS (continued)
F - 64
26TRADE AND OTHER PAYABLES
US Dollars | |||||
Figures in millions | 2023 | 2022 | 2021 | ||
Restated (3) (4) | Restated (3) (4) | ||||
Financial liabilities | |||||
Trade payables | |||||
Accruals (1) | |||||
Derivative financial liabilities | |||||
Non financial liabilities | |||||
Employee related payables (1) | |||||
Other payables (2) | |||||
Total trade and other payables | |||||
Current trade and other payables are non-interest bearing and are normally settled within 60 days. | |||||
(1) Employee related payables and short-term provisions, which were previously reported as part of accruals, are now being reported separately as these are
considered non financial liabilities. Short-term provisions are presented separately on the statement of financial position. Comparative figures have been
reclassified.
(2) Includes landholder duties of $49 m in respect of the corporate restructuring, which are expected to be settled in 2024.
(3)Short-term provisions of $43 47
environmental rehabilitation and other provisions on the statement of financial position.
(4)Comparative periods have been retrospectively restated. Refer to note 1.3.
.
NOTES TO THE CONSOLIDATED FINANCIAL STATEMENTS (continued)
F - 65
27TAXATION
US Dollars | |||||
Figures in millions | 2023 | 2022 | 2021 | ||
Balance at beginning of year | ( | ||||
Refunds during the year | |||||
Payments during the year | ( | ( | ( | ||
Taxation of items included in the income statement | |||||
Offset of VAT and other taxes | ( | ( | ( | ||
Transfer of Siguiri tax asset to non-current trade, other receivables and other assets | |||||
Withholding tax transferred from trade and other payables | |||||
Discounting of tax receivable | |||||
Translation | ( | ( | |||
Balance at end of year | ( | ||||
Included in the statement of financial position as follows: | |||||
Taxation asset included in trade, other receivables and other assets | ( | ( | ( | ||
Taxation liability | |||||
( | |||||
28CASH GENERATED FROM OPERATIONS
US Dollars | |||||
Figures in millions | 2023 | 2022 | 2021 | ||
Restated (1) | Restated (1) | ||||
Profit (loss) before taxation | |||||
Adjusted for: | |||||
Movement on non-hedge derivatives and other commodity contracts | |||||
Amortisation of tangible and right of use assets (note 4) | |||||
Amortisation of intangible assets (note 4) | |||||
Finance costs and unwinding of obligations (note 6) | |||||
Environmental, rehabilitation, silicosis and other provisions | ( | ( | ( | ||
Impairment and derecognition of assets | |||||
Profit on sale of assets | ( | ( | ( | ||
Other expenses (income) (non cash portion) | |||||
Interest income | ( | ( | ( | ||
Share of associates and joint ventures’ (profit) loss | ( | ( | ( | ||
Other non-cash movements | |||||
Other exchange losses | |||||
Movements in working capital | ( | ( | |||
Movements in working capital: | |||||
(Increase) decrease in inventories | ( | ( | |||
Increase in trade, other receivables and other assets | ( | ( | ( | ||
Increase in trade, other payables and provisions | |||||
( | ( | ||||
(1)Comparative periods have been retrospectively restated. Refer to note 1.3.
NOTES TO THE CONSOLIDATED FINANCIAL STATEMENTS (continued)
F - 66
29RELATED PARTIES
US Dollars | |||||
Figures in millions | 2023 | 2022 | 2021 | ||
Material related party transactions were as follows (not attributable): | |||||
Sales and services rendered to related parties | |||||
Associate - Rand Refinery (Pty) Ltd | |||||
Purchases and services acquired from related parties | |||||
Associate - Rand Refinery (Pty) Ltd | |||||
Outstanding balances arising from sale of goods and services due by related parties | |||||
Associate - Rand Refinery (Pty) Ltd | |||||
Amounts owed to/due by related parties above are unsecured and non-interest bearing. | |||||
Short-term loan advanced to related parties | |||||
Joint venture - Kibali Goldmines S.A. | |||||
Long-term loan advanced to related parties | |||||
Joint venture - Kibali Goldmines S.A. | |||||
NOTES TO THE CONSOLIDATED FINANCIAL STATEMENTS
F - 67
Key management remuneration includes executive and non-executive directors as well as executive management that held office in the current
year.
US Dollar thousands | 2023 | 2022 | 2021 | |||||
Base salary | Pension scheme benefits | Other benefits(2) | DSP awards | Buy-out share awards on recruitment (3) | Total (1) | Total | Total | |
Executive directors | ||||||||
(1)Remuneration for executive directors has been disclosed for the full 2023 financial year - this includes both AngloGold Ashanti Limited prior to the completion of
the corporate restructuring and AngloGold Ashanti plc after the completion of the corporate restructuring.
(2)Other benefits include family health insurance, group life insurance, cash in lieu of dividends, social security and a relocation allowance.
(3)Buy-out awards granted to executive directors are in respect of incentive arrangements that were forfeited from previous employer.
US Dollar thousands | 2023 | 2022 | 2021 | ||||
Base salary | Pension scheme benefits | Other benefits(2) | DSP awards | Total (1) | Total | Total | |
Executive management | |||||||
(1)Remuneration for executive management has been disclosed for the full 2023 financial year - this includes both AngloGold Ashanti Limited prior to the completion
of the corporate restructuring and AngloGold Ashanti plc after the completion of the corporate restructuring.
(2)Other benefits include family health insurance, group life insurance, cash in lieu of dividends, social security and a relocation allowance.
US Dollar thousands | 2023 | 2022 | 2021 | |||
Director fees (1) | Committee fees (2) | Travel allowance | Total | Total | Total | |
Non-executive directors | ||||||
(1) Includes the annual base fee paid to non-executive directors as well as fees paid for special Board meetings.
(2) Includes the fee paid to the individual for their committee membership and committee chairperson role, where applicable, as well as fees paid for special
committee meetings.
The table includes fees paid by AngloGold Ashanti Limited prior to the completion of the corporate restructuring on 25 September 2023 and payments made by
AngloGold Ashanti plc after this date.
NOTES TO THE CONSOLIDATED FINANCIAL STATEMENTS (continued)
F - 68
30CONTRACTUAL COMMITMENTS AND CONTINGENCIES
US Dollars | ||||||
Figures in millions | 2023 | 2022 | 2021 | |||
Capital commitments | ||||||
Acquisition of tangible assets | ||||||
Contracted for | ||||||
Not contracted for | ||||||
Authorised by the directors | ||||||
Allocated to: | ||||||
Non-sustaining capital | ||||||
- within one year | ||||||
- thereafter | ||||||
Sustaining capital | ||||||
- within one year | ||||||
- thereafter | ||||||
Share of underlying capital commitments of joint ventures included above | ||||||
Purchase obligations | ||||||
Contracted for | ||||||
- within one year | ||||||
- thereafter | ||||||
Purchase obligations
Purchase obligations represent contractual obligations for the purchase of mining contract services, power, supplies,
consumables, inventories, explosives and activated carbon.
In June 2023, AngloGold Ashanti Australia Limited signed a 10-year power purchase agreement with Pacific Energy Pty Ltd for
the procurement of 48MW of renewable energy from a hybrid wind and solar plant, aimed at the decarbonisation of the Tropicana
mine in Western Australia. The project is due for completion in early 2025. The expected cash flows over the 10 years
commencing in 2025 is $192 m (not included in the purchase obligations disclosed above).
To service these capital commitments, purchase obligations and other operational requirements, the Group is dependent on
existing cash resources, cash generated from operations and borrowings (in the form of bonds and credit facilities). As part of the
management of liquidity, funding and interest rate risk, the Group regularly evaluates market conditions and may enter into
transactions, from time to time, to repurchase outstanding debt, pursuant to open market purchases, privately negotiated
transactions, tender offers or other means.
Cash generated from operations is subject to operational, market and other risks. Distributions from operations may be subject to
foreign investment, exchange control laws and regulations, and the quantity of foreign exchange available in offshore countries.
In addition, distributions from joint ventures are subject to relevant Board approvals.
The credit facilities and other finance arrangements contain financial covenants and other similar undertakings. To the extent that
external borrowings are required, the Group’s covenant performance indicates that existing financing facilities will be available to
meet the above commitments. The financing facilities which mature in the near future are disclosed in current liabilities. The
Group believes that sufficient measures are in place to ensure that these facilities can be refinanced.
Litigation claims
On 27 March 2023, Altius Royalty Corporation (Altius) initiated arbitration proceedings in Vancouver, B.C., Canada against
AngloGold Ashanti North America Inc. (AGANA) regarding the geographic scope of a 1.5 percent net smelter returns royalty.
Altius asserts the royalty should be broadly interpreted to cover nearly all claims controlled by AGANA in the Beatty, Nevada
mining district, including claims related to the Expanded Silicon project as well as claims acquired in 2022 as part of the Corvus
Gold Inc. and Coeur Sterling, Inc. acquisitions. AGANA intends to vigorously defend against Altius’ claims. The arbitration hearing
was held in April 2024. The arbitration panel is expected to render a decision on this matter in due course. In view of the
NOTES TO THE CONSOLIDATED FINANCIAL STATEMENTS (continued)
F - 69
limitation of current information for the accurate estimation of a liability, no reliable estimate can be made for AGANA’s obligation
in this matter.
Tax claims
For a discussion on tax claims and tax uncertainties refer to note 9.
Significant accounting judgements and estimates When a loss is considered probable and can be reliably estimated, a liability is recorded in the amount of the best estimate for the ultimate loss. The likelihood of a loss with respect to a contingency can be difficult to predict and determining a meaningful estimate of the loss or a range of loss may not always be practicable based on the information available at the time and the potential effect of future events and decisions by third parties that will determine the ultimate resolution of the contingency. It is not uncommon for such matters to be resolved over many years, during which time relevant developments and new information is continuously evaluated to determine both the likelihood of any potential loss and whether it is possible to reasonably estimate a range of possible losses. When a loss is probable but a reasonable estimate cannot be made, disclosure is provided. In determining the threshold for disclosure on a qualitative and quantitative basis, management considers the potential for a disruptive effect on the normal functioning of the Group and/or whether the contingency could impact investment decisions. Such qualitative matters considered are reputational risks, regulatory compliance issues and reasonable investor considerations. As a global company, the Group is exposed to numerous legal risks. The outcome of currently pending and future proceedings cannot be predicted with certainty. Litigation and other judicial proceedings as a rule raise difficult and complex legal issues and are subject to uncertainties and complexities including, but not limited to, the facts and circumstances of each particular case, issues regarding the jurisdiction in which each suit is brought and differences in applicable law. Upon resolution of any pending legal matter, the Group may be forced to incur charges in excess of the presently established provisions and related insurance coverage. It is possible that the financial position, results of operations or cash flows of the Group could be materially affected by the unfavourable outcome of litigation. |
NOTES TO THE CONSOLIDATED FINANCIAL STATEMENTS (continued)
30Contractual commitments and contingencies (continued)
F - 70
31FINANCIAL RISK MANAGEMENT ACTIVITIES
Figures in millions - US Dollars | At fair value through profit or loss | At fair value through other comprehensive income | At amortised cost |
2023 | |||
Financial assets | |||
Other investments | |||
Trade, other receivables and other assets | |||
Loan receivable | |||
Restricted cash | |||
Cash and cash equivalents | |||
Financial liabilities | |||
Borrowings | — | ||
Lease liabilities | — | ||
Trade payables and accruals | — | ||
Derivative financial liabilities | — | ||
Bank overdraft | — | ||
2022 | |||
Financial assets | |||
Other investments | |||
Trade, other receivables and other assets | |||
Restricted cash | |||
Cash and cash equivalents | |||
Financial liabilities | |||
Borrowings | — | ||
Lease liabilities | — | ||
Trade payables and accruals | — | ||
Derivative financial liabilities | — | ||
Bank overdraft | — | ||
2021 | |||
Financial assets | |||
Other investments | |||
Trade, other receivables and other assets | |||
Restricted cash | |||
Cash and cash equivalents | |||
Financial liabilities | |||
Borrowings | — | ||
Lease liabilities | — | ||
Trade payables and accruals | — | ||
In the normal course of its operations, the Group is exposed to gold price and other commodity price risk, foreign exchange risk,
interest rate risk, liquidity risk and credit risk. In order to manage these risks, the Group may enter into transactions which make
use of derivatives. The Group does not acquire, hold or issue derivatives for speculative purposes. The Group has developed a
comprehensive risk management process to facilitate, control and monitor these risks. The Board has approved and monitors
NOTES TO THE CONSOLIDATED FINANCIAL STATEMENTS
F - 71
this risk management process, inclusive of documented treasury policies, counterparty limits and controlling and reporting
structures.
Managing risk in the Group
Risk management activities within the Group are the ultimate responsibility of the board of directors. The Chief Financial Officer
is responsible to the board of directors for the design, implementation and monitoring of the risk management plan. The Audit
and Risk Committee is responsible for overseeing risk management plans and systems, as well as financial risks which include a
review of treasury activities and the Group’s counterparties.
The financial risk management objectives of the Group are defined as follows:
•safeguarding the Group’s core earnings stream from its major assets through the effective control and management of
gold price risk, other commodity risk, foreign exchange risk and interest rate risk;
•effective and efficient usage of credit facilities in both the short and long-term through the adoption of reliable liquidity
management planning and procedures;
•ensuring that investment and hedging transactions are undertaken with creditworthy counterparties; and
•ensuring that all contracts and agreements related to risk management activities are co-ordinated, consistent throughout
the Group and that they comply with all relevant regulatory and statutory requirements.
Capital management
The primary objective of managing the Group's capital is to ensure that there is sufficient capital available to support the funding
requirements of the Group, including capital expenditure, in a way that optimises the cost of capital, maximises shareholders'
returns and ensures that the Group remains in a sound financial position.
The capital structure of the Group consists of net debt (borrowings as detailed in note 22, offset by cash and bank balances
detailed in note 20) and equity of the Group (comprising share capital and premium and accumulated reserves and non-
controlling interests).
The Group manages and makes adjustments to the capital structure as opportunities arise in the market place, as and when
borrowings mature, or as and when funding is required. This may take the form of raising equity, market or bank debt or hybrids
thereof.
The Group manages capital using various financial metrics including the ratio of Adjusted net debt to Adjusted EBITDA (leverage
ratio). Both the calculation of Adjusted net debt and Adjusted EBITDA are based on the formula included in the Group’s
Revolving Credit Facility (RCF) agreements. The leverage ratio of Adjusted net debt to Adjusted EBITDA should not exceed
than 4.5 times, subject to certain conditions, for one measurement period not exceeding six months, during the tenor of the
RCFs. At 31 December 2023, the Group was in compliance with all of the financial maintenance covenants per its loan
agreements.
Market risk
Commodity price risk
Commodity price risk arises from the risk of an adverse effect on current or future earnings resulting from fluctuations in the price
of gold and Brent Crude oil. In order to manage gold price downside risk, the Group may enter into zero-cost collars for a portion
of its production from time to time. During the first quarter of 2023, the Group entered into zero-cost collars for a total of
approximately 136,000 ounces of gold for the period from February 2023 to December 2023, during the second quarter of 2023,
the Group entered into zero-cost collars for a total of approximately 47,000 ounces of gold for the period from January 2024 to
June 2024 and during the fourth quarter of 2023 the Group entered into zero-cost collars for a total of approximately 300,000
ounces of gold for the period from January 2024 to December 2024.
In order to manage Brent Crude oil downside risk, the Group may enter into forward contracts for a portion of its oil consumption
from time to time. During July 2022, the Group entered into forward contracts for a total of 999,000 barrels of Brent Crude oil for
the period from January 2023 to December 2023 that would be cash settled on a monthly basis against the contract price. The
average price achieved on the forward contracts was $89.20 per barrel of Brent Crude oil. There were no open contracts at the
end of December 2023.
The Group has not designated the instruments for hedge accounting.
NOTES TO THE CONSOLIDATED FINANCIAL STATEMENTS (continued)
31FINANCIAL RISK MANAGEMENT ACTIVITIES (continued)
F - 72
Figures in millions - US Dollars | 2023 | 2022 | ||
Financial asset / (liability) | Income statement gain / (loss) | Financial asset / (liability) | Income statement gain / (loss) | |
Summary of derivatives | ||||
Gold zero-cost collars | ( | ( | ||
Brent Crude oil forward contracts | ( | ( | ( | |
Foreign exchange risk
The Group has transactional foreign exchange exposures, which arise from sales or purchases by an operating unit in currencies
other than the unit's functional currency. The gold market is predominately priced in US dollars which exposes the Group to the
risk of fluctuations in the Argentinean peso/US dollar, Australian dollar/US dollar and Tanzanian shilling/US dollar exchange
rates.
other than the functional currency of entities within the Group. The amounts have been presented in US dollar by converting the
foreign currency amount at the closing rate at the reporting date.
US Dollars | |||
Figures in millions | 2023 | 2022 | 2021 |
Cash and cash equivalents | |||
Argentinean peso | |||
South African rand | |||
Australian dollar | |||
Borrowings | |||
Australian dollar | |||
Tanzanian shilling | |||
Sensitivity analysis
remain constant). Management reasonably expects profit or loss to increase/(decrease) by the following sensitivities:
US Dollar millions | ||||
Figures in millions | 2023 | 2022 (1) | 2021 (1) | |
Cash and cash equivalents | ||||
Argentinean peso (ARS/$) | Spot +10% | ( | ( | ( |
South African rand (ZAR/$) | Spot +10% | ( | ( | ( |
Australian dollar (AUD/$) | Spot +10% | ( | ( | ( |
Argentinean peso (ARS/$) | Spot -10% | |||
South Africa rand (ZAR/$) | Spot -10% | |||
Australian dollar (AUD/$) | Spot -10% | |||
Borrowings | ||||
Tanzanian shilling (TZS/$) | Spot +10% | |||
Australian dollar (AUD/$) | Spot +10% | |||
Tanzanian shilling (TZS/$) | Spot -10% | ( | ( | ( |
Australian dollar (AUD/$) | Spot -10% | ( | ( | |
(1)The sensitivity analysis for the comparative periods were calculated at Spot (+ARS10 10 1.5
ZAR1.5 0.1 0.1 250 250
NOTES TO THE CONSOLIDATED FINANCIAL STATEMENTS (continued)
31FINANCIAL RISK MANAGEMENT ACTIVITIES (continued)
F - 73
Interest rate risk
The Group's interest rate risk arises mainly from variable interest rate borrowings due to the volatility in the United States,
Australian and Tanzanian interest rates. Interest rate risk arising from borrowings is offset by cash and cash equivalents and
restricted cash held at variable rates.
US Dollar millions | |||
Figures in millions | 2023 | 2022 | 2021 |
Fixed rate instruments | |||
Borrowings | |||
Variable rate instruments | |||
Restricted cash | |||
Cash and cash equivalents | |||
Borrowings | |||
Joint venture loan receivable | |||
Sensitivity analysis
The following table shows the approximate interest rate sensitivities of financial assets and financial liabilities at 31 December
(assuming that all other variables remain constant).
US Dollar millions | ||||
Figures in millions | 2023 | 2022 (1) | 2021 (1) | |
Joint venture loan receivable | ||||
United States dollar (2) | 1% increase | |||
Cash and cash equivalents | ||||
United States dollar | 1% increase | |||
Australian dollar | 1% increase | |||
South African rand | 1% increase | |||
Argentinean peso | 1% increase | |||
Borrowings | ||||
United States dollar | 1% increase | ( | ( | ( |
Australian dollar | 1% increase | ( | ( | |
Tanzanian shilling | 1% increase | ( | ( | ( |
(1)The sensitivity analysis for the comparative periods were calculated at 100 150
Australian dollar, 150 250
(2)Loan to Kibali (Jersey) Limited which holds AngloGold Ashanti’s effective 45 % interest in Kibali Goldmines S.A.
A decrease in interest rates would have the equal and opposite effect to the amounts disclosed above.
Liquidity risk
The Group manages liquidity risk by ensuring that it has sufficient committed borrowing and banking facilities after taking into
consideration the actual and forecast cash flows, in order to meet the Group's short, medium and long-term funding and liquidity
management requirements.
In the ordinary course of business, the Group receives cash from the proceeds of its gold sales and is required to fund its
working capital and capital expenditure requirements. This cash is managed to ensure surplus funds are invested in a manner to
achieve market-related returns whilst minimising risks. The Group is able to actively source financing at competitive rates. The
counterparties are financial and banking institutions and their credit ratings are regularly monitored.
NOTES TO THE CONSOLIDATED FINANCIAL STATEMENTS (continued)
31FINANCIAL RISK MANAGEMENT ACTIVITIES (continued)
F - 74
The Group has sufficient undrawn borrowing facilities available to fund its working capital and capital requirements (note 22).
The contractual maturities of undiscounted financial liabilities, including interest payments, are as follows:
Figures in millions - US Dollars | Within one year | Between one and two years | Between two and five years | After five years | Total |
2023 | |||||
Derivative financial liabilities | |||||
Gold zero-cost collar | |||||
Non-derivative financial liabilities | |||||
Trade payables and accruals | |||||
Bank overdraft | |||||
Borrowings | |||||
Lease liabilities | |||||
2022 | |||||
Derivative financial liabilities | |||||
Oil forward contracts | |||||
Non-derivative financial liabilities | |||||
Trade payables and accruals (Restated (1)) | |||||
Bank overdraft | |||||
Borrowings | |||||
Lease liabilities | |||||
2021 | |||||
Non-derivative financial liabilities | |||||
Trade payables and accruals (Restated (1)) | |||||
Borrowings | |||||
Lease liabilities | |||||
(1)Comparative periods have been retrospectively restated. Refer to note 26.
Credit risk
Credit risk arises from the risk that a counterparty may default or not meet its obligations timeously. The Group minimises credit
risk by ensuring that credit risk is spread over a number of counterparties. These counterparties are financial and banking
institutions. Counterparty credit limits and exposures are reviewed by the Audit and Risk Committee. Where possible,
management ensures that netting agreements are in place. No set-off is applied to the statement of financial position due to the
different maturity profiles of assets and liabilities.
NOTES TO THE CONSOLIDATED FINANCIAL STATEMENTS (continued)
31FINANCIAL RISK MANAGEMENT ACTIVITIES (continued)
F - 75
US Dollars | ||||
Figures in millions | 2023 | 2022 | 2021 | |
Cash and cash equivalents | ||||
Low (AAA to A-) | ||||
Medium (BBB to B-) | ||||
High (CCC+ and below) | ||||
Restricted cash | ||||
Low (AAA to A-) | ||||
Medium (BBB to B-) | ||||
Trade receivables which are recognised on settlement mainly comprise banking institutions purchasing gold bullion and normal
market settlement terms are two working days, therefore expected credit losses are not expected to be material. Trade and other
receivables, that are past due but not impaired totalled $14 m (2022: $12 m; 2021: $18 m).
The Group does not generally obtain collateral or other security to support financial instruments subject to credit risk, but
monitors the credit standing of counterparties.
Fair value of financial instruments
Fair value is determined using valuation techniques as outlined below, unless the instrument is traded in an active market. Where
possible, inputs are based on quoted prices and other market determined variables.
Fair value hierarchy
The Group uses the following hierarchy for determining and disclosing the fair value of financial instruments:
Level 1: quoted prices (unadjusted) in active markets for identical assets or liabilities;
Level 2:inputs other than quoted prices included in level 1 that are observable for the asset or liability, either directly (as prices)
or indirectly (derived from prices); and
Level 3:inputs for the asset or liability that are not based on observable market data (unobservable inputs).
NOTES TO THE CONSOLIDATED FINANCIAL STATEMENTS (continued)
31FINANCIAL RISK MANAGEMENT ACTIVITIES (continued)
F - 76
Figures in millions | US Dollars | ||||||||
Fair value | Carrying value | Fair value | Carrying value | Fair value | Carrying value | Valuation method | Significant inputs | Fair value hierarchy of inputs | |
As at Dec | As at Dec | As at Dec | As at Dec | As at Dec | As at Dec | ||||
Financial instrument | 2023 | 2022 | 2021 | ||||||
At fair value through profit and loss | |||||||||
Deferred compensation asset - Mponeng (1) | Probability weighted discounted cash flow | The production plan over the deferred compensation period and discount rates. | Level 3 | ||||||
Deferred compensation asset – Gramalote (1) | Probability weighted discounted cash flow | Stage gate payments over the deferred compensation period and discount rates. | Level 3 | ||||||
Derivative financial liability - gold zero-cost collar contracts (2) | Black-Scholes-Merton option pricing model | Forward and spot prices, the number of outstanding ounces of gold on open contracts, risk free rates and volatilities. | Level 2 | ||||||
Derivative financial liability - Brent Crude oil forward contracts (2) | Black-Scholes-Merton option pricing model | Forward and spot prices, the number of outstanding barrels of oil on open contracts, risk free rates and volatilities. | Level 2 | ||||||
At fair value through other comprehensive income | |||||||||
Listed equity investments | Level 1 | ||||||||
At amortised cost | |||||||||
Borrowings - Rated bonds | Level 1 | ||||||||
Borrowings - Revolving Credit Facilities | Discounted cash flow | Market related interest rates | Level 3 (3) | ||||||
Joint venture loan receivable | Discounted cash flow | Market related interest rates | Level 3 | ||||||
(1) Included in the statement of financial position in current and non-current trade, other receivables and other assets.
(2) Included in the statement of financial position in current trade and other payables.
(3) The fair value hierarchy level has been revised to level 3.
NOTES TO THE CONSOLIDATED FINANCIAL STATEMENTS (continued)
31FINANCIAL RISK MANAGEMENT ACTIVITIES (continued)
F - 77
US Dollar millions | |||
Figures in millions | 2023 | 2022 | 2021 |
Opening balance | |||
Unwinding of the deferred compensation asset | |||
Changes in estimates - fair value adjustments (1) | ( | ( | |
Sale of Gramalote | |||
Translation | ( | ( | ( |
Closing balance (2) | |||
(1) Included in the income statement in foreign exchange and fair value adjustments.
(2) Included in the statement of financial position in non-current trade, other receivables and other assets.
Significant accounting judgements and estimates Deferred compensation asset - Mponeng As at 31 December 2023, the deferred compensation asset ($ plans over the deferred compensation period as received from Harmony. The fair value calculated for the deferred compensation asset is level 3 in the fair value hierarchy due to the use of unobservable inputs. As at 31 December 2023, no portion of the deferred compensation related to Harmony developing below infrastructure has been included in the deferred compensation asset. A reasonable possible change in the number of ounces used in the weighted probability calculation would not have a material impact on the fair value of the deferred compensation asset. Deferred compensation asset - Gramalote As at 31 December 2023, the deferred compensation asset ($ considerations as per the purchase agreement. The assumptions used in the valuation included the timing and probability of contingent considerations. A reasonable possible change in the assumptions used in the weighted probability calculation would not have a material impact on the fair value of the deferred compensation asset. |
Accounting policies Financial instruments are initially recognised at fair value when the Group becomes a party to their contractual arrangements. Transaction costs directly attributable to the instrument’s acquisition or issue are included in the initial measurement of financial assets and financial liabilities, except financial instruments classified as at fair value through profit or loss (FVTPL), which are expensed. The subsequent measurement of financial instruments is dealt with below. |
Financial liabilities Financial liabilities are classified as measured at amortised cost using the effective interest rate method. Financial liabilities subsequently measured at amortised cost compromises of interest bearing borrowings, bank overdrafts and trade and other payables. A financial liability is derecognised when the obligation under the liability is discharged, cancelled or expires. The Group also derecognises a financial liability when its terms are modified and the cash flows of the modified liability are substantially different. In this case a new financial liability based on the modified terms is recognised at fair value. |
Financial assets A financial asset is classified as measured at: •Amortised cost; •Fair value through other comprehensive income (FVTOCI) - equity instruments; or •FVTPL. Assets at amortised cost include trade, other receivables and other assets, cash restricted for use and cash and cash equivalents. Interest income from these financial assets is included in finance income using the effective interest rate method. The trade receivables from provisional gold concentrate sales are carried at fair value through profit or loss and are marked-to-market at the end of each period until final settlement occurs, with changes in fair value classified as provisional price adjustments and included as a component of revenue. On derecognition of a financial asset, the difference between the proceeds received or receivable and the carrying amount of the asset is included in profit or loss. Impairment losses are presented in the statement of profit or loss. A gain or loss on a debt investment that is subsequently measured at FVTPL is recognised in profit or loss and presented net within foreign exchange and fair value adjustments in the period in which it arises. |
NOTES TO THE CONSOLIDATED FINANCIAL STATEMENTS (continued)
31FINANCIAL RISK MANAGEMENT ACTIVITIES (continued)
F - 78
32AUDITORS REMUNERATION
PricewaterhouseCoopers Inc. and PricewaterhouseCoopers LLP in 2023 and (ii) Ernst & Young Inc. in 2022 and 2021.
Figures in millions | 2023 | 2022 | 2021 |
US Dollars | |||
Audit fees (1) | |||
Audit-related fees (2) | |||
Tax fees (3) | |||
All other fees (4) | |||
Total | |||
(1)The Audit fees consist of fees billed for the annual audit services engagement and other audit services, which are those services that only the external auditor
reasonably can provide, and include the Company audit; statutory audits; attest services; and assistance with and review of documents filed with the SEC.
(2)Audit-related fees consist of fees billed for assurance and related services.
(3)Tax fees include fees billed for tax advice and tax compliance services.
(4)All other fees include non-audit services such as advisory fees for the court-sanctioned capital reduction of AngloGold Ashanti plc and subscription fees for
PwC’s digital platform on accounting and business insights.
NOTES TO THE CONSOLIDATED FINANCIAL STATEMENTS (continued)
F - 79
33SUBSEQUENT EVENTS
Dividend declaration - On 23 February 2024, the directors of AngloGold Ashanti announced the payment of a gross interim
cash dividend per ordinary share of 19 US cents.
PAGE LEFT BLANK INTENTIONALLY
NOTES TO THE CONSOLIDATED FINANCIAL STATEMENTS (continued)
F - 80
KIBALI (JERSEY) LIMITED
Consolidated Financial Statements for the Three Years Ended
31 December 2023, 2022 and 2021
F - 81
CONTENTS
PAGE | |
Report of independent Auditors | F - 83 |
(BDO LLP: London, United Kingdom: PCAOB ID # 1295) | |
Consolidated statements of profit or loss and other comprehensive income for the years ended 31 December 2023, 2022 and 2021 | F - 84 |
Consolidated statements of financial position as at 31 December 2023, 2022 and 2021 | F - 85 |
Consolidated statements of changes in equity for the years ended 31 December 2023, 2022 and 2021 | F - 86 |
Consolidated statements of cash flows for the years ended 31 December 2023, 2022 and 2021 | F - 87 |
Notes to the consolidated financial statements | F - 88 |
F - 82
REPORT OF INDEPENDENT REGISTERED PUBLIC ACCOUNTING FIRM
Shareholders and Board of Directors
Kibali (Jersey) Limited
Jersey, Channel Islands
Opinion on the Consolidated Financial Statements
We have audited the accompanying consolidated statements of financial position of Kibali (Jersey) Limited (the
“Company”) as of December 31, 2022 and 2021, the related consolidated statements of profit or loss and other
comprehensive income, changes in equity, and cash flows for each of the two years in the period ended December
31, 2022, and the related notes (collectively referred to as the “consolidated financial statements”). In our opinion,
the consolidated financial statements present fairly, in all material respects, the financial position of the Company at
December 31, 2022 and 2021, and the results of its operations and its cash flows for each of the two years in the
period ended December 31, 2022, in conformity with International Financial Reporting Standards as issued by the
International Accounting Standards Board.
Basis for Opinion
These consolidated financial statements are the responsibility of the Company’s management. Our responsibility is
to express an opinion on the Company’s consolidated financial statements based on our audits. We are a public
accounting firm registered with the Public Company Accounting Oversight Board (United States) (“PCAOB”) and are
required to be independent with respect to the Company in accordance with the U.S. federal securities laws and the
applicable rules and regulations of the Securities and Exchange Commission and the PCAOB.
We conducted our audits in accordance with the standards of the PCAOB. Those standards require that we plan
and perform the audit to obtain reasonable assurance about whether the consolidated financial statements are free
of material misstatement, whether due to error or fraud.
Our audits included performing procedures to assess the risks of material misstatement of the consolidated financial
statements, whether due to error or fraud, and performing procedures that respond to those risks. Such procedures
included examining, on a test basis, evidence regarding the amounts and disclosures in the consolidated financial
statements. Our audits also included evaluating the accounting principles used and significant estimates made by
management, as well as evaluating the overall presentation of the consolidated financial statements. We believe
that our audits provide a reasonable basis for our opinion.
/s/ BDO LLP
BDO LLP
We have served as the Company's auditor from 2013 through 2023.
London, United Kingdom
March 17, 2023
F - 83
CONSOLIDATED STATEMENTS OF PROFIT OR LOSS AND OTHER COMPREHENSIVE INCOME
FOR THE YEARS ENDED 31 DECEMBER 2023, 2022 and 2021
31 Dec | 31 Dec | 31 Dec | ||||||
Note | 2023 | 2022 | 2021 | |||||
Unaudited | Audited | Audited | ||||||
US$’000 | US$’000 | US$’000 | ||||||
REVENUE | ||||||||
Gold sales | 3 | 1,487,984 | 1,328,306 | 1,469,221 | ||||
Other income | 4 | 357 | 539 | 1,208 | ||||
TOTAL INCOME | 1,488,341 | 1,328,845 | 1,470,429 | |||||
COSTS AND EXPENSES | ||||||||
Mining and processing costs | 5 | 729,403 | 674,019 | 688,086 | ||||
Royalties | 77,408 | 62,472 | 68,704 | |||||
Exploration and corporate expenditure | 6 | 2,643 | 6,795 | 5,848 | ||||
Other expenses | 4 | 86,817 | 52,778 | 33,246 | ||||
TOTAL COSTS | 896,271 | 796,064 | 795,884 | |||||
Finance income | 7 | 4,237 | 5,187 | 5,618 | ||||
Finance costs | 7 | (18,770) | (49,917) | (5,913) | ||||
Share of profits of equity accounted joint venture | 24 | 738 | 157 | 103 | ||||
PROFIT BEFORE INCOME TAX | 578,275 | 488,208 | 674,353 | |||||
Income tax expense | 8 | (185,499) | (155,946) | (180,715) | ||||
PROFIT FOR THE YEAR | 392,776 | 332,262 | 493,638 | |||||
OTHER COMPREHENSIVE INCOME/(EXPENSE) | ||||||||
(Loss)/Gain on investment in marketable securities | — | (2) | (2) | |||||
TOTAL COMPREHENSIVE INCOME | 392,776 | 332,260 | 493,636 | |||||
PROFIT FOR THE YEAR | ||||||||
Attributable to: | ||||||||
Owners of the parent | 358,395 | 306,330 | 461,271 | |||||
Non-controlling interest | 15 | 34,381 | 25,930 | 32,367 | ||||
392,776 | 332,260 | 493,638 | ||||||
TOTAL COMPREHENSIVE INCOME | ||||||||
Attributable to: | ||||||||
Owners of the parent | 358,395 | 306,330 | 461,269 | |||||
Non-controlling interest | 15 | 34,381 | 25,930 | 32,367 | ||||
392,776 | 332,260 | 493,636 | ||||||
The accompanying notes form part of these consolidated financial statements
F - 84
CONSOLIDATED STATEMENTS OF FINANCIAL POSITION
AS AT 31 DECEMBER 2023, 2022 and 2021
31 Dec | 31 Dec | 31 Dec | ||||||
Note | 2023 | 2022 | 2021 | |||||
Unaudited | Audited | Audited | ||||||
US$’000 | US$’000 | US$’000 | ||||||
NON-CURRENT ASSETS | ||||||||
Property, plant and equipment | 9 | 1,847,658 | 1,844,984 | 1,811,291 | ||||
Mineral properties | 10 | 284,433 | 308,141 | 334,881 | ||||
Long term ore stockpiles | 13 | 60,752 | 20,160 | — | ||||
Investment in associate | 4 | 4 | 4 | |||||
Investment in joint venture | 24 | 27,073 | 26,254 | 21,776 | ||||
Trade and other receivables | 12 | 175,580 | 220,845 | 192,507 | ||||
Income tax receivable | 12 | 89,970 | — | — | ||||
TOTAL NON-CURRENT ASSETS | 2,485,470 | 2,420,388 | 2,360,459 | |||||
CURRENT ASSETS | ||||||||
Inventories and ore stockpiles | 13 | 111,965 | 75,921 | 107,951 | ||||
Trade and other receivables | 12 | 76,815 | 124,940 | 53,915 | ||||
Investment in marketable securities | 8 | 8 | 7 | |||||
Income tax receivable | 12 | 26,155 | 302 | — | ||||
Cash and cash equivalents | 20 | 122,968 | 91,865 | 1,115,359 | ||||
TOTAL CURRENT ASSETS | 337,911 | 293,036 | 1,277,232 | |||||
TOTAL ASSETS | 2,823,381 | 2,713,424 | 3,637,691 | |||||
EQUITY AND LIABILITIES | ||||||||
Equity | ||||||||
Share capital | 14 | 5 | 5 | 5 | ||||
Share premium | 14 | 2,123,612 | 2,123,612 | 2,523,612 | ||||
(Accumulated deficit)/Retained earnings | (1,039,227) | (27,194) | 655,276 | |||||
Other deficit | (40) | (40) | (38) | |||||
Equity attributable to owners of the parent | 1,084,350 | 2,096,383 | 3,178,855 | |||||
Non-controlling interest | 15 | 107,421 | 85,040 | 68,110 | ||||
TOTAL EQUITY | 1,191,771 | 2,181,423 | 3,246,965 | |||||
NON-CURRENT LIABILITIES | ||||||||
Loans and borrowings | 16 | 715,328 | — | 1,839 | ||||
Lease liabilities | 19 | 54,359 | 51,045 | 41,839 | ||||
Deferred tax liability | 11 | 381,286 | 296,507 | 196,654 | ||||
Provision for rehabilitation | 17 | 27,583 | 23,233 | 29,026 | ||||
TOTAL NON-CURRENT LIABILITIES | 1,178,556 | 370,785 | 269,358 | |||||
CURRENT LIABILITIES | ||||||||
Loans and borrowings | 16 | 296,441 | 43,298 | — | ||||
Lease liabilities | 19 | 11,328 | 12,507 | 13,909 | ||||
Trade and other payables | 18 | 101,797 | 104,815 | 97,109 | ||||
Provision for rehabilitation | 17 | 3,772 | 596 | 600 | ||||
Current tax payable | 8 | 39,716 | — | 9,750 | ||||
TOTAL CURRENT LIABILITIES | 453,054 | 161,216 | 121,368 | |||||
TOTAL EQUITY AND LIABILITIES | 2,823,381 | 2,713,424 | 3,637,691 | |||||
The consolidated financial statements for the years ended 31 December 2023, 2022 and 2021 were approved by Management on 25 April 2024 and
signed on its behalf by:
Graham Shuttleworth | ||
Director | ||
The accompanying notes form part of these consolidated financial statements
F - 85
CONSOLIDATED STATEMENTS OF CHANGES IN EQUITY
FOR THE YEARS ENDED 31 DECEMBER 2023, 2022 and 2021
(Accumulated | Total equity | |||||||
Deficit)/ | attributable | Non- | ||||||
US$’000 | Note | Share | Share | Retained | Other | to owners of | controlling | Total |
capital | premium | earnings | reserves | the parent | interest | equity | ||
Balance at 1 January 2021 Audited | 5 | 2,523,612 | 655,005 | (36) | 3,178,586 | 55,743 | 3,234,329 | |
Fair value movement on investment in marketable securities | (2) | (2) | — | (2) | ||||
Net profit for the year | — | — | 461,271 | — | 461,271 | 32,367 | 493,638 | |
Other comprehensive income | (2) | (2) | — | (2) | ||||
Total comprehensive income | — | — | 461,271 | (2) | 461,269 | 32,367 | 493,636 | |
Transactions with owners in their capacity as owners | ||||||||
Reclassification of share premium | — | — | — | — | — | — | — | |
Dividend paid (1) | — | — | (461,000) | — | (461,000) | (20,000) | (481,000) | |
— | — | (461,000) | — | (461,000) | (20,000) | (481,000) | ||
Balance at 1 January 2022 Audited | 5 | 2,523,612 | 655,276 | (38) | 3,178,855 | 68,110 | 3,246,965 | |
Fair value movement on investment in marketable securities | — | — | — | (2) | (2) | — | (2) | |
Net profit for the year | — | — | 306,330 | — | 306,330 | 25,930 | 332,260 | |
Other comprehensive income | — | — | — | — | — | — | — | |
Total comprehensive income | — | — | 306,330 | — | 306,330 | 25,930 | 332,260 | |
Transactions with owners in their capacity as owners | ||||||||
Reclassification of share premium | 14 | — | (400,000) | 400,000 | — | — | — | — |
Dividend paid (1) | — | — | (1,388,800) | — | (1,388,800) | (9,000) | (1,397,800) | |
— | (400,000) | (988,800) | — | (1,388,800) | (9,000) | (1,397,800) | ||
Balance at 31 December 2022 Audited | 5 | 2,123,612 | (27,194) | (40) | 2,096,383 | 85,040 | 2,181,423 | |
Fair value movement on investment in marketable securities | — | — | — | — | — | — | — | |
Net profit for the year | — | — | 358,395 | — | 358,395 | 34,381 | 392,776 | |
Other comprehensive income | — | — | — | — | — | — | — | |
Total comprehensive income | — | — | 358,395 | — | 358,395 | 34,381 | 392,776 | |
Transactions with owners in their capacity as owners | ||||||||
Reclassification of share premium | — | — | — | — | — | — | — | |
Dividend paid (1) | — | — | (359,700) | — | (359,700) | (12,000) | (371,700) | |
Dividend in specie (2) | 15 | (1,010,728) | (1,010,728) | (1,010,728) | ||||
Balance at 31 December 2023 Unaudited | 5 | 2,123,612 | (1,039,227) | (40) | 1,084,350 | 107,421 | 1,191,771 |
SHARE CAPITAL
The share capital comprises the issued ordinary shares of the Company at par.
SHARE PREMIUM
The share premium comprises the excess value recognised from the issue of ordinary shares at par.
(ACCUMULATED DEFICIT)/RETAINED EARNINGS
(Accumulated deficit)/Retained earnings comprises the Group’s cumulative accounting profits and losses since inception less dividends.
OTHER DEFICIT
Other deficits comprises the Group’s cumulative fair value movement on the investment in marketable securities since inception in Kilo
Goldmines Limited less amounts reclassified to profit and loss.
NON-CONTROLLING INTEREST
The non-controlling interest represents the total carrying value of the 10% interest
Société Minière de Kilo- Moto SA UNISARL
(SOKIMO) has in Kibali Goldmines SA, which is a subsidiary of Kibali (Jersey) Limited.
(1) Dividends paid in cash
(2) Dividends declared in specie through restructuring. Please refer to note 16.
The accompanying notes form part of these consolidated financial statements
F - 86
CONSOLIDATED STATEMENTS OF CASH FLOWS
FOR THE YEARS ENDED 31 DECEMBER 2023, 2022 and 2021
31 Dec | 31 Dec | 31 Dec | ||||||
2023 | 2022 | 2021 | ||||||
Unaudited | Audited | Audited | ||||||
US$’000 | US$’000 | US$’000 | ||||||
Cash Flows From Operating Activities | ||||||||
Cash generated by operations | 22 | 777,159 | 675,900 | 944,244 | ||||
Interest received | 7 | 4,237 | 3,783 | 3,327 | ||||
Finance cost paid | (1) | (1) | (1) | |||||
Dividends received from equity accounted joint venture | 24 | 357 | — | 495 | ||||
Income tax paid | 8 | (132,206) | (55,815) | (84,575) | ||||
Withholding tax paid | 8 | (3,000) | (8,100) | (18,000) | ||||
Net cash flows generated by operating activities | 646,546 | 615,767 | 845,490 | |||||
Cash Flows Related to Investing Activities | ||||||||
Additions of property, plant and equipment | 9 | (189,882) | (199,534) | (168,762) | ||||
Disposals of property, plant and equipment | 9 | 1,598 | — | — | ||||
Drawdowns, interest and capital payments from equity accounted joint venture | 24 | (738) | (157) | (37) | ||||
Net cash flows used in investing activities | (189,022) | (199,691) | (168,799) | |||||
Cash Flows Relating to Financing Activities | ||||||||
Payment of dividends | (370,500) | (1,396,900) | (481,000) | |||||
Cash repatriation fees paid | 7 | (12,148) | (44,351) | |||||
Increase in overdraft | 16 | 20,341 | ||||||
Decrease in overdraft | 16 | (20,260) | — | — | ||||
Lease repayments | 7 | (18,582) | (14,350) | (20,530) | ||||
Interest paid on lease liabilities | (5,247) | (4,310) | (4,035) | |||||
Net cash outflows used in financing activities | (426,737) | (1,439,570) | (505,565) | |||||
Net increase in cash and cash equivalents | 30,787 | (1,023,494) | 171,126 | |||||
FX impact on cash balances | 316 | — | ||||||
Cash and cash equivalents at the beginning of the year | 91,865 | 1,115,359 | 944,233 | |||||
Cash and cash equivalents at the end of the year | 122,968 | 91,865 | 1,115,359 | |||||
The accompanying notes form part of these consolidated financial statements
F - 87
NOTES TO THE CONSOLIDATED FINANCIAL STATEMENTS
1. SIGNIFICANT ACCOUNTING POLICIES
The principal accounting policies applied in the preparation of these consolidated financial statements are set out
below. These policies have been consistently applied to all the years presented, unless otherwise stated.
BASIS OF PREPARATION
The consolidated financial statements of Kibali (Jersey) Limited (the Company) and its subsidiaries and joint venture
(the Group) have been prepared in accordance with International Financial Reporting Standards and Interpretations
(collectively (IFRS)) as issued by the International Accounting Standards Board (IASB) and interpretations issued by
the IFRS Interpretations Committee (IFRS IC) applicable to companies reporting under IFRS.
The consolidated financial statements have been prepared under the historical cost convention, as modified by the
revaluation of investment in marketable securities classified as fair value through other comprehensive income. The
preparation of financial statements in conformity with IFRS requires the use of certain critical accounting estimates
and judgements. It also requires management to exercise its judgement in the process of applying the Group’s
accounting policies. The areas involving a high degree of judgement or complexity, or areas where assumptions
and estimates are significant to the consolidated financial statements are disclosed in note 2.
NEW STANDARDS AND INTERPRETATIONS APPLIED
The IASB has issued the following new standards, amendments to published standards and interpretations to
existing standards with effective dates on or prior to 1 January 2023 which have been adopted by the Group for the
first time this year and had an immaterial or no impact.
F - 88
1. SIGNIFICANT ACCOUNTING POLICIES (CONTINUED)
NEW STANDARDS AND INTERPRETATIONS APPLIED (CONTINUED)
Effective period commencing on or after | ||
Amendments to Existing Standards | ||
IFRS 17 | Insurance contracts including amendments to IFRS 17 | 01-Jan-23 |
IAS 1 | Amendments to IAS 1: Classification of Liabilities as Current or Non-current | 01-Jan-23 |
IAS 8 | Amendments to IAS 8 - Definition of Accounting Estimates | 01-Jan-23 |
IAS 1 | Amendments to IAS 1 and IFRS Practice Statement 2 - Disclosure of Accounting policies | 01-Jan-23 |
IAS 12 | Amendments to IAS 12 - Deferred Tax related to Assets and Liabilities arising from a Single Transaction | 01-Jan-23 |
IFRS 17 | Amendment to IFRS 17 - Initial Application of IFRS 17 and IFRS 9 - Comparative Information | 01-Jan-23 |
Certain new standards, amendments and interpretations to existing standards have been published and are
relevant to the Group’s activities and are mandatory for the Group’s accounting periods beginning 1 January 2024,
or later periods and which the Group has decided not to early adopt. These include the following, and are not
expected to have any material impact:
Effective period commencing on or after | ||
IAS 7 IFRS7 | Disclosures on supplier finance arrangements. Amended to require specific disclosures about supplier finance arrangements. | 01-Jan-24 |
IAS 1 | Amended to clarify how to classify debt and other liabilities as either current or non-current. | 01-Jan-24 |
IFRS 16 | Amended to address the accounting for a lease liability in a sale and leaseback transaction after the date of the transaction. | 01-Jan-24 |
Amendments to IAS 21 - Lack of Exchangeability - An entity is impacted by the amendments when it has a
transaction or an operation in a foreign currency that is not exchangeable into another currency at a measurement
date for a specified purpose. A currency is exchangeable when there is an ability to obtain the other currency (with a
normal administrative delay), and the transaction would take place through a market or exchange mechanism that
creates enforceable rights and obligations.
F - 89
1. SIGNIFICANT ACCOUNTING POLICIES (CONTINUED)
CONSOLIDATION
The consolidated financial statements includes the financial statements of the Company, its subsidiaries and the
Company’s equity accounted joint ventures using uniform accounting policies for similar transactions and other
events in similar circumstances.
SUBSIDIARIES
Subsidiaries are entities over which the Group has power, exposure, or rights, to variable returns from its
involvement and the ability to use its power over the investee to affect the amount of the Group's returns; generally
accompanying an interest of more than one-half of the voting rights.
Subsidiaries are fully consolidated from the date on which control is transferred to the Group. They are
deconsolidated from the date that control ceases. The purchase method of accounting is used to account for the
acquisition of subsidiaries by the Group. The cost of an acquisition is measured at the fair value of the assets
given, equity instruments issued and liabilities incurred or assumed at the date of exchange. Acquisition costs are
expensed. Identifiable assets acquired (including mineral property interests or other identifiable intangible assets)
and liabilities and contingent liabilities assumed in a business combination are measured initially at their fair values
at the acquisition date, irrespective of the extent of any non-controlling interest. The excess of the cost of
acquisition over the fair value of the Group’s share of the identifiable net assets acquired is recorded as goodwill. If
the cost of acquisition is less than the fair value of the net assets of the subsidiary acquired, the difference is
recognised directly in the statement of comprehensive income.
Intercompany transactions, balances and unrealised gains on transactions between group companies are
eliminated. Unrealised losses are also eliminated unless the transaction provides evidence of an impairment of the
asset transferred. Accounting policies of subsidiaries have been changed where necessary to ensure consistency
with the policies adopted by the Group.
NON-CONTROLLING INTERESTS
The Group initially recognises any non-controlling interest in the acquiree at the non-controlling interest's
proportionate share of the acquiree's net assets. The group has not elected to take the option to use fair value in
acquisitions completed to date.
The total comprehensive income of non-wholly owned subsidiaries is attributed to owners of the parent and to the
non-controlling interests in proportion to their relative ownership interests.
JOINT VENTURES
The Group holds interests in one joint venture. In a joint venture the parties that have joint control of the
arrangement (the joint venturer) have a right to the net assets of the arrangement. This right is accounted for in the
consolidated financial statements using the equity method. Joint control is considered to exist when there is
contractual joint control; control being the power to govern the financial and operating policies of an entity so as to
obtain benefits from the activities and the ability to use its power over the investee to affect the amounts of the
Group’s returns by the joint venturers.
Acquisitions
Except for initial recognition under IFRS 11 transition rules, further investments in additional joint ventures are
initially recognised at cost. The cost of an acquisition is measured at the fair value of the assets given, equity
instruments issued or liabilities incurred or assumed at the date of exchange, plus costs directly attributable to the
acquisition. Goodwill on associated companies and joint ventures represents the excess of the cost of acquisition of
the associate or joint venture over the Group’s share of the fair value of the identifiable net assets of the associate
or joint venture and is included in the carrying amount of the investment.
F - 90
1. SIGNIFICANT ACCOUNTING POLICIES (CONTINUED)
JOINT VENTURES (CONTINUED)
Joint ventures are accounted for using the equity method of accounting. In applying the equity method of
accounting, the Group’s share of its joint ventures’ post-acquisition profits or losses are recognised in profit or loss
and its share of post-acquisition other comprehensive income is recognised in other comprehensive income. These
post-acquisition movements and distributions received from the joint venture companies are adjusted against the
carrying amount of the investments. When the Group’s share of losses in a joint venture Company equals or
exceeds its interest in the joint venture Company, including any other unsecured non-current receivables, the Group
does not recognise further losses, unless it has obligations to make or has made payments on behalf of the joint
venture Company.
Unrealised gains on transactions between the Group and its joint venture companies are eliminated to the extent of
the Group’s interest in the joint venture companies. Unrealised losses are also eliminated unless the transaction
provides evidence of an impairment of the asset transferred. Trading receivables and payables with joint ventures
are classified within trade and other receivables and payables. The accounting policies of joint venture companies
have been changed where necessary to ensure consistency with the accounting policies adopted by the Group.
Dividends received are classified as operating cash flows in the consolidated cash flow statement.
The carrying value of the investment in joint venture is compared to the recoverable amounts whenever
circumstances indicate that the net book value may not be recoverable. An impairment is recognised in the profit or
loss to the extent that the carrying value exceeds the recoverable amount.
Impairment provisions for loans to joint ventures classified as ‘other investments’ in joint venture are recognised
based on a forward-looking expected credit loss model. The methodology used to determine the amount of the
provision is based on whether there has been a significant increase in credit risk since initial recognition of the
financial asset. For those where the credit risk has not increased significantly since initial recognition of the financial
asset, twelve month expected credit losses along with gross interest income are recognised. For those for which
credit risk has increased significantly, lifetime expected credit losses along with the gross interest income are
recognised. For those that are determined to be credit impaired, lifetime expected credit losses along with interest
income on a net basis are recognised.
FOREIGN CURRENCY TRANSLATION
Functional and presentation currency
Items included in the financial statements of each of the Group’s entities are measured using the currency of the
primary economic environment in which the entity operates (the functional currency). The consolidated financial
statements are presented in US dollars, which is also the functional currency of the Company and its significant
subsidiaries and joint ventures.
F - 91
1. SIGNIFICANT ACCOUNTING POLICIES (CONTINUED)
FOREIGN CURRENCY TRANSLATION
Transactions and balances
Foreign currency transactions are translated into the relevant functional currency using the exchange rates
prevailing at the date of the transactions. Foreign exchange gains and losses resulting from the settlement of such
transactions and from the translation at year end exchange rates of monetary assets and liabilities denominated in
foreign currencies are recognised in the statement of comprehensive income in other income and other expenses.
INTANGIBLE ASSETS
Mineral properties
Mineral properties are recognised at fair value if acquired as part of a business combination, otherwise they are
recognised at cost if acquired as an asset. We review and test the carrying amounts of intangible assets with finite
lives when an indicator of impairment is considered to exist.
Mineral properties are amortised on units of production basis from the point at which the mine commences
production (refer to ‘depreciation and amortisation’ policy below).
PROPERTY, PLANT AND EQUIPMENT
Long-lived assets and mine development costs
Long-lived assets including development costs and mine plant facilities (such as metallurgical plant, tailings and raw
water dams, power plant and mine infrastructure) are initially recorded at cost. Development of ore bodies includes
the development cost of shaft systems and waste rock removal that allows access to reserves that are economically
recoverable in the future. Costs associated with underground development are capitalised when the works provide
access to the ore body, whereas costs associated with ore extraction from operating ore body sections are treated
as operating costs. Where relevant the estimated cost of dismantling the asset and remediating the site is included
in the cost of property, plant and equipment, subsequently they are measured at cost less accumulated amortisation
and impairment.
Development costs consist primarily of direct expenditure incurred to establish or expand productive capacity.
Costs are capitalised during the construction of a new mine until commercial levels of production are achieved (refer
to ‛commercial production’ below), after which the relevant costs are amortised. Costs are capitalised provided that
the project is considered to be commercially, technically and economically viable. Such viability is deemed to be
achieved when the Group is confident that the project will provide a satisfactory return relative to its perceived risks
and is sufficiently certain of economic production. Costs which are necessarily incurred while commissioning new
assets, in the period before they are capable of operating in the manner intended by management, are capitalised
under ‘Long-lived assets and mine development costs’.
Development costs incurred after the commencement of production are capitalised to the extent they are expected
to give rise to a future economic benefit.
Commercial production
When a mine construction project is substantially complete and ready for its intended use the asset moves into the
production stage, the capitalisation of certain mine construction costs ceases and subsequent costs are either
regarded as inventory or expensed, except for capitalisable costs related to subsequent mining asset additions or
improvements, underground mine development or ore reserve development.
F - 92
1. SIGNIFICANT ACCOUNTING POLICIES (CONTINUED)
PROPERTY, PLANT AND EQUIPMENT (CONTINUED)
The commissioning of an underground mine typically occurs in phases, with sections brought into production whilst
deeper levels remain under construction. The shared infrastructures, such as declines of shafts, are assessed to
determine whether they contribute to the production areas. Where they contribute to production, the attributable
costs are transferred to production assets and start to be depreciated. The costs transferred comprise costs directly
attributable to producing zones or, where applicable, estimates of the portion of shared infrastructure that are
attributed to the producing zones.
Development expenditure approval
Development activities commence after project sanctioning by the appropriate level of management. Judgement is
applied by management in determining when a project has reached a stage at which economically recoverable
reserves exists such that development may be sanctioned. In exercising this judgement, management is required
to make certain estimates and assumptions similar to those described below for capitalised exploration and
evaluation expenditure. Any such estimates and assumptions may change as new information becomes available.
Stripping costs
In surface mining operations, the Group may find it necessary to remove waste materials to gain access to mineral
ore deposits prior to and after production commences. This waste removal activity is known as ‘stripping’. Prior to
production commencing from a pit, stripping costs are measured and capitalised until the point where the
overburden has been removed and access to the ore commences. Subsequent to production, waste stripping
continues, either as part of ore extraction as a run of mine activity or due to strategic decisions such as pit push-
back campaigns. There are two benefits accruing to the Group from stripping activity during the production phase:
usable ore that can be used to produce inventory and improved access to further quantities of material that will be
mined in future periods. Economic ore extracted during this period and subsequently is accounted for as inventory.
The production stripping costs relating to improved access to further quantities in future periods are capitalised as a
stripping activity asset, if and only if, all of the following are met:
•It is probable that the future economic benefit (improved access to the ore body) associated with the stripping
activity will flow to the Group;
•The Group can identify the component of the ore body for which access has been improved; and
•The costs relating to the stripping activity associated with that component or components can be measured
reliably.
In determining the relevant component of the ore body for which access is improved, the Group componentises its
mine into geographically distinct ore body sections or phases to which the stripping activities being undertaken
within that component are allocated. Such phases are determined based on assessment of factors such as geology
and mine planning.
Once determined that any portion of the production stripping costs should be capitalised, the Group typically uses
the average stripping ratio of the component or phase of the mine to which the production stripping cost related to
determine the amount of the production stripping costs that should be capitalised, unless the direct costs of stripping
activity can be separately identified in which case such costs are capitalised. The Group depreciates the deferred
costs capitalised as stripping assets on a unit of production method, with reference to the ex-pit ore production from
the relevant ore body component or phase.
Short-lived assets
Short-lived assets including non-mining assets are shown at cost less accumulated depreciation and impairment.
F - 93
1. SIGNIFICANT ACCOUNTING POLICIES (CONTINUED)
PROPERTY, PLANT AND EQUIPMENT (CONTINUED)
Depreciation and amortisation
Long-lived assets include mining properties, such as metallurgical plant, tailings and raw water dams, power plant
and mine infrastructure, as well as mine development costs and are depreciated on a unit of production basis by
using ounces produced to calculate depreciation.
Depreciation and amortisation are charged over the life of the mine (or over the remaining useful life of the asset, if
shorter) based on estimated contained ounces in proven and probable reserves and the portion of resources
considered probable of economic extraction based on the current LOM (Life of Mine) plan that benefit from the
development and are considered probable of economic extraction. No future capital expenditure is included in the
depreciable value. Proven and probable ore reserves and the portion of resources reflect estimated quantities of
economically recoverable reserves and resources, which can be recovered in the future from known mineral
deposits. Life of mine contained reserves and resources are used in the contained ounces units of production
depreciation calculation. Any changes to the expected life of the mine (or asset) are applied prospectively in
calculating depreciation and amortisation charges. Depreciation of construction and development costs commences
when commercial production is achieved, as detailed above. Underground development costs that are attributable
to the commissioned sections of an underground mine are depreciated from the date the development provides
access to operational areas and ore extraction begins from those areas. Other assets under construction, such as
plant improvement projects, are depreciated from the date they are commissioned, based on assessment by the
Group’s engineers.
Short-lived assets which include motor vehicles, office equipment and computer equipment are depreciated on a
straight-line basis over estimated useful lives of between two to five years but limited to the remaining mine life.
Residual values and useful lives are reviewed, and adjusted if appropriate, at each statement of financial position
date.
Changes to the estimated residual values or useful lives are accounted for prospectively. Depreciation starts when
the assets are ready and available for use.
Impairment
The carrying amount of the property, plant and equipment and investments in joint ventures of the group is
compared to the recoverable amount of the assets whenever events or changes in circumstances indicate that the
net book value may not be recoverable. The recoverable amount is the higher of value in use and the fair value
less cost to sell. In assessing the value in use, the expected future cash flows from the assets is determined by
applying a discount rate to the anticipated risk adjusted future cash flows. The discount rate used is the group’s
weighted average cost of capital adjusted for asset specific factors when applicable. An impairment is recognised in
the income statement to the extent that the carrying amount exceeds the assets’ recoverable amount. Generally
proven and probable reserves are used in the calculations, although limited ore resources may be included when
they are considered economically viable and sufficiently likely to be extracted and form part of the approved mine
plan. The models use the approved mine plans and exclude capital expenditure which enhance the assets or
extractable ore tonnes outside of such approved mine plans. The revised asset carrying amounts are depreciated
in line with group accounting policies.
A previously recognised impairment loss is reversed if the recoverable amount increases as a result of a reversal of
the conditions that originally resulted in the impairment. This reversal is recognised in the income statement and is
limited to the carrying amount that would have been determined, net of depreciation, had no impairment loss been
recognised in prior years.
Assets are grouped at the lowest levels for which there are separately identifiable cash flows (cash-generating
units) for purposes of assessing impairment. The estimates of future discounted cash flows are subject to risks and
uncertainties including the future gold price. It is therefore reasonably possible that changes could occur which may
affect the recoverability of property, plant and equipment.
F - 94
1. SIGNIFICANT ACCOUNTING POLICIES (CONTINUED)
INVENTORIES
Inventories include ore stockpiles, gold in process and doré, and supplies and spares and are stated at the lower of
cost or net realisable value. The cost of ore stockpiles and gold produced is determined principally by the weighted
average cost method using related production costs.
Costs of stockpiles include costs incurred up to the point of stockpiling, such as mining and grade control costs, but
exclude future costs of production. Ore extracted is allocated to separate stockpiles based on estimated grade, with
grades below defined cut-off levels treated as waste and expensed. While held in physically separate stockpiles, the
Group blends the ore from each stockpile when feeding the processing plant to achieve the resultant gold content.
In such circumstances, lower and higher grade ore stockpiles each represent a raw material, used in conjunction
with each other, to deliver overall gold production, as supported by the relevant feed plan. Kibali’s high and medium
grade ore stockpile is above 3g/t with a marginal ore cut-off grade of 0.5g/t.
The processing of ore in stockpiles occurs in accordance with the Life of Mine (LOM) processing plan that has been
optimised based on the known mineral reserves, current plant capacity and mine design. Ore tonnes contained in
the stockpile which are to be milled as per the mine plan over the period beyond the next twelve months, are
classified as non-current in the statement of financial position.
Net realisable value of ore stockpiles is determined with reference to estimated contained gold and market gold
prices applicable. Ore stockpiles which are blended together or with future ore mined when fed to the plant are
assessed as an input to the gold production process to ensure the combined stockpiles are carried at the lower of
cost and net realisable value. Ore stockpiles which are not planned to be blended in production are assessed
separately to ensure they are carried at the lower of cost and net realisable value, although no such stockpiles are
currently held.
Stores and materials consist of consumable stores and are valued at weighted average cost after appropriate
impairment of redundant and slow-moving items.
INTEREST/BORROWING COSTS
Interest is recognised on a time proportion basis, taking into account the principal outstanding and the effective rate
over the period to maturity. Borrowing cost is expensed as incurred except to the extent that it relates directly to the
construction of property, plant and equipment during the time that is required to complete and prepare the asset for
its intended use, when it is capitalised as part of property, plant and equipment. Borrowing costs are capitalised as
part of the cost of the asset where it is probable that the asset will result in economic benefit and where the
borrowing cost can be measured reliably. No interest or borrowing costs have been capitalised during any of the
disclosure periods.
ROYALTIES
Royalty arrangements based on mineral production are in place at each operating mine. The primary type of royalty
is a net smelter return royalty. Under this type of royalty, the Group pays the holder an amount calculated as the
royalty percentage multiplied by the value of gold production at market gold prices less selling costs. A royalty
expense is recorded when revenue from the sale of gold is recognised.
F - 95
1. SIGNIFICANT ACCOUNTING POLICIES (CONTINUED)
FINANCIAL INSTRUMENTS
Financial instruments are measured as set out below. Financial instruments carried on the statement of financial
position include cash and cash equivalents, trade and other receivables, trade and other payables, investments in
marketable securities, loans to joint ventures, loans to minorities and lease liabilities. Financial assets and financial
liabilities are recognised in the Group’s statement of financial position when the Group becomes a party to the
contractual provisions of the instrument.
Financial instruments are initially recognised at fair value when the group becomes a party to their contractual
arrangements. Transaction costs directly attributable to the instrument’s acquisition or issue are included in the
initial measurement of financial assets and financial liabilities, except financial instruments classified as at fair value
through profit or loss (FVTPL). The subsequent measurement of financial instruments is dealt with below.
Financial assets
On initial recognition, a financial asset is classified as measured at:
•Amortised cost;
•Fair value through other comprehensive income (OCI), or
•Fair value through profit or loss.
At initial recognition, the group measures a financial asset at its fair value plus, in the case of a financial asset not at
FVTPL, transaction costs that are directly attributable to the acquisition of the financial asset. Transaction costs of
financial assets carried at FVTPL, are expensed.
A financial asset is measured at amortised cost if it is held within the business model whose objective is to hold
assets to collect contractual cash flows and its contractual terms give rise, on specified dates, to cash flows that are
solely payments of principal and interest on the principal amount outstanding. Interest income from these financial
assets is included in finance income using the effective interest rate method. Any gain or loss arising on
derecognition is recognised directly in profit or loss and presented in other gains or losses, together with foreign
exchange gains or losses. Impairment losses are presented as separate line item in the statement of profit or loss. A
gain or loss on a debt investment that is subsequently measured at FVTPL is recognised in profit or loss and
presented net within other gains or losses in the period in which it arises. On derecognition of a financial asset, the
difference between the proceeds received or receivable and the carrying amount of the asset is included in profit or
loss.
Financial assets at amortised cost consist of trade receivables and other receivables (excluding taxes), cash and
cash equivalents. Impairment losses are assessed using the forward-looking expected credit loss (ECL) approach.
An allowance is recorded for all loans and other debt financial assets not held at FVTPL. The impairment
methodology applied depends on whether there has been a significant increase in credit risk. Trade receivable loss
allowances are measured at an amount equal to lifetime ECL’s. Loss allowances are deducted from the gross
carrying amount of the assets.
Cash and cash equivalents
Cash and cash equivalents are carried in the statement of financial position at cost. For the purpose of the cash
flow statement, cash and cash equivalents comprise cash on hand, deposits held at call with banks, other short
term highly liquid investments with a maturity of three months or less at the date of purchase and bank overdrafts. In
the statement of financial position, bank overdrafts are included in borrowings in current liabilities.
F - 96
1. SIGNIFICANT ACCOUNTING POLICIES (CONTINUED)
FINANCIAL LIABILITIES
Loans and borrowing
Borrowings are recognised initially at fair value, net of transaction costs incurred. Borrowings are subsequently
stated at amortised cost; any difference between the proceeds (net of transaction costs) and the redemption value
is recognised in the statement of comprehensive income over the period of the borrowings using the effective
interest method. Borrowings are classified as current liabilities unless the Company has an unconditional right to
defer settlement of the liability for at least 12 months after the statement of financial position date. During 2023, the
Group entered into a number of short-term financial arrangements with banks in relation to the cash repatriation
mechanism which were repaid during the year. Costs related to these arrangements are included in Finance Costs
in the statement of profit or loss and other comprehensive income and financing activities in the cash flow
statement.
Trade and other payables
Accounts payable and other short term monetary liabilities, are initially recognised at fair value, which equates to the
transaction price, and subsequently carried at amortised cost using the effective interest method.
REHABILITATION COSTS
The net present value of estimated future rehabilitation costs is provided for in the financial statements and
capitalized within property, plant and equipment on initial recognition. Rehabilitation will generally occur on closure
or after closure of a mine. Initial recognition is at the time of the construction or disturbance occurring and thereafter
as and when additional construction or disturbances take place. The estimates are reviewed annually to take into
account the effects of inflation and changes in estimated risk adjusted rehabilitation works cost and are discounted
using rates that reflect the time value of money.
Annual increases in the provision due to the unwinding of the discount are recognized in the statement of
comprehensive income as a finance cost. The present value of additional disturbances and changes in the estimate
of the rehabilitation liability are recorded to mining assets against an increase/decrease in the rehabilitation
provision. The rehabilitation asset is amortised as noted previously. Rehabilitation projects undertaken, included in
the estimates, are charged to the provision as incurred. Environmental liabilities, other than rehabilitation costs,
which relate to liabilities arising from specific events, are expensed when they are known, probable and may be
reasonably estimated.
PROVISIONS
Provisions are recognised when the Company has a present legal or constructive obligation as a result of past
events where it is probable that an outflow of resources embodying economic benefits will be required to settle the
obligation, and a reliable estimate of the amount of the obligation can be made.
CURRENT TAX
Current tax is the tax expected to be payable on the taxable income for the year calculated using rates (and laws)
that have been enacted or substantively enacted by the reporting date (and when such laws are applicable to the
group allowing for the impact of tax stability protections afforded to the group). It includes adjustments for tax
expected to be payable or recoverable in respect of previous periods.
The Group is subject to income tax in several jurisdictions and significant judgement is required in determining the
provision for income taxes. During the ordinary course of business, there are transactions and calculations for which
the ultimate tax determination is uncertain. As a result, the Group recognises tax liabilities based on estimates of
whether additional taxes and interest will be due.
These tax liabilities are recognised when, despite the company's belief that its tax return positions are supportable,
the company believes it is more likely than not that a taxation authority would not accept its filing position. In these
cases, the Group records its tax balances based on either the most likely amount or the expected value, which
weights multiple potential scenarios. The company believes that its accruals for tax liabilities are adequate for all
open audit years based on its assessment of many factors including past experience and interpretations of tax law.
F - 97
1. SIGNIFICANT ACCOUNTING POLICIES (CONTINUED)
DEFERRED TAXATION
Deferred tax is provided in full, using the liability method, on temporary differences arising between the tax bases of
assets and liabilities and their carrying amounts in the consolidated financial statements. However, if the temporary
difference arises from initial recognition of an asset or liability in a transaction other than a business combination
that at the time of the transaction affects neither accounting nor taxable profit or loss, it is not recognised. Deferred
tax is determined using tax rates (and laws) that have been enacted or substantively enacted by the statement of
financial position date (and when such laws are applicable to the group allowing for the impact of tax stability
protections afforded to the group) and are expected to apply when the temporary differences reverses. Deferred tax
assets are recognised to the extent that it is probable that future taxable profit will be available against which the
temporary differences can be utilised. Deferred tax is provided on temporary differences arising on investments in
subsidiaries and joint ventures, except where the timing of the reversal of the temporary difference is controlled by
the Group and it is probable that the temporary difference will not reverse in the foreseeable future.
VALUE ADDED TAX (TVA)
TVA receivables are recognized initially at cost. Subsequently, TVA receivables are adjusted for time value for
money as the refund process takes a while for the government to settle.
The Group assesses at each reporting period whether there is an indication that these receivables may be impaired
taking into account the risk of non-collectability and timing of receipt.
SHARE CAPITAL
Ordinary shares are classified as equity. Incremental costs directly attributable to the issue of new shares or
options are shown in equity as a deduction from the proceeds.
LEASES
The lease liabilities were measured at the present value of the remaining lease payments, discounted with the rate
determined by reference to the estimated incremental borrowing average rate of 6.81% p.a. Variable lease
payments are only included in the measurement of the lease liability if they depend on an index or rate. In such
cases, the initial measurement of the lease liability assumes the variable element will remain unchanged throughout
the lease term. Other variable lease payments are expensed in the period to which they relate.
Subsequent to initial measurement lease liabilities increase as a result of interest charged at a constant rate on the
balance outstanding and are reduced for lease payments made. Right-of-use assets are recorded under property,
plant and equipment and amortised on a straight-line basis over the remaining term of the lease or over the
remaining economic life of the asset if, rarely, this is judged to be shorter than the lease term.
CONTINGENT LIABILITIES
The Group discloses contingent liabilities when possible obligations exist as a result of past events, unless the
possible outflows of economic benefits are considered remote. By their nature, contingencies will often only be
resolved when one or more future events occur or fail to occur. The assessment of such contingencies inherently
involves the exercise of significant judgement and estimates of the outcome of future events. In certain
circumstances, to provide transparency, the Group voluntarily elects to disclose information regarding claims for
which any outflow of economic benefit is considered remote.
F - 98
1. SIGNIFICANT ACCOUNTING POLICIES (CONTINUED)
REVENUE RECOGNITION
The Company’s primary product is gold, other metals produced as part of the extraction process are considered to
be by-products arising from the production of gold. The Company enters into a contract for the sale of gold at each
of its mining operations. The performance obligation under its contract is to supply such gold to the customer,
subject to minimum quality specifications with the consideration for such gold sales determined by the market spot
price for each ounce of gold at the point of sale and gold content. As the sales from the gold contract is subject to
customer survey adjustment, sales are initially recorded based on the results of tests on the material prior to
shipment to determine the gold content and specification with such estimates subsequently adjusted to reflect the
final gold content determined by the customer shortly after period end. Revenue is recorded to the extent that it is
highly probable that there will be no subsequent reversal of such revenue due to gold content or quality
specifications. Historical adjustments of this nature have been insignificant.
The performance obligations are considered to be satisfied and control of the gold transferred as the gold leaves the
gold room upon collection by the customer, with title, possession and significant risks and rewards transferred at this
point with revenue recorded accordingly. Subsequent adjustments are recorded in revenue to take into account final
assay and weight certificates from the refinery, if different from the initial certificates. The differences between the
estimated and actual contained gold have historically not been significant. Payment terms from the customer are
based on 95% as initial payment for sales as agreed on the day of shipment based on the results of tests on the
material prior to shipment with the final payment of 5% based on final customer assay and includes an adjustment
to the initial 95% provisional payment. The period between provisional invoicing and final pricing, or settlement
period, is typically around 5 days.
EXPLORATION AND EVALUATION COSTS
The Group capitalizes all exploration and evaluation expenditures where management concludes that the realization
of future economic benefit is more likely than not. While the criteria for concluding that expenditure should be
capitalised is always probable, the information that management used to make that determination depends on the
level of exploration.
Exploration and evaluation expenditure on brownfield sites, being those adjacent to mineral deposits which are
already being mined or developed, is expensed as incurred until the directors are able to demonstrate that future
economic benefits are probable through the completion of a prefeasibility study, after which the expenditure is
capitalised as a mine development cost. A ‘prefeasibility study’ consists of a comprehensive study of the viability of
a mineral project that has advanced to a stage where the mining method, in the case of underground mining, or the
pit configuration, in the case of an open pit, has been established, and which, if an effective method of mineral
processing has been determined, includes a financial analysis based on reasonable assumptions of technical,
engineering, operating economic factors and the evaluation of other relevant factors. The prefeasibility study, when
combined with existing knowledge of the mineral property that is adjacent to mineral deposits that are already being
mined or developed, allow the directors to conclude that it is more likely than not that the Group will obtain future
economic benefit from the expenditures.
F - 99
1. SIGNIFICANT ACCOUNTING POLICIES (CONTINUED)
EXPLORATION AND EVALUATION COSTS (CONTINUED)
Exploration and evaluation expenditure on greenfield sites, being those where the Group does not have any mineral
deposits which are already being mined or developed, is expensed until such time as the directors have sufficient
information to determine that future economic benefits are probable, after which the expenditure is capitalised as a
mine development cost. The information required by directors is typically a final feasibility study however a
prefeasibility study may be deemed to be sufficient where the additional work required to prepare a final feasibility
study is not significant or the work done at prefeasibility level clearly demonstrates an economic asset. Exploration
and evaluation expenditure relating to extensions of mineral deposits which are already being mined or developed,
including expenditure on the definition of mineralisation of such mineral deposits, is capitalised as a mine
development cost following the completion of an economic evaluation equivalent to a prefeasibility study. This
economic evaluation is distinguished from a prefeasibility study in that some of the information that would normally
be determined in a prefeasibility study is instead obtained from the existing mine or development. This information,
when combined with existing knowledge of the mineral property already being mined or developed allow the
directors to conclude that more likely than not the Company will obtain future economic benefit from the
expenditures. Costs relating to property acquisitions are capitalised within development costs.
DIVIDEND DISTRIBUTION
Dividend distribution to the Company’s shareholders is recognised as a liability in the Group’s financial statements
in the period in which the dividends are approved by the board of directors and declared to shareholders.
In line with last year, Kibali Goldmines SA, a subsidiary of Kibali (Jersey) Limited established a mechanism for the
repatriation of cash from the DRC. This resulted in bank arrangement fees of US$12.1 million (2022: US$44.3
million) which have been presented as Cash repatriation fees within Finance Costs. Please refer to note 8 for more
details.
F - 100
2. KEY ACCOUNTING ESTIMATES AND JUDGEMENTS
Some of the accounting policies require the application of significant judgement by management in selecting the
appropriate assumptions for calculating financial estimates or determining the appropriate accounting treatment for
a transaction.
By their nature, these judgements are subject to an inherent degree of uncertainty and are based on historical
experience, terms of existing contracts, management’s view on trends in the gold mining industry and information
from outside sources.
The judgements and estimates that have a significant risk of causing a material adjustment to the carrying amounts
of assets and liabilities are discussed below:
Judgements:
•Democratic Republic of Congo (DRC) 2018 Mining Code
•Value Added Tax (TVA)
•Exploration and evaluation expenditure
•Customs claim
Estimates:
•Carrying values of property, plant and equipment
•Open cast mine stripping
•Determination of Ore reserves
•Capitalisation and depreciation
•Gold price assumptions
•Future rehabilitation obligations
•Stockpiles, gold in process and product inventories
JUDGEMENTS:
PRODUCTION STAGE
A mine that is under construction is determined to enter the production stage when the project is in the location and
condition necessary for it to be capable of operating in the manner intended by management. We use the following
factors to assess whether these criteria have been met:
(1) the level of capital expenditures compared to construction cost estimates; (2) the completion of a reasonable
period of commissioning and testing of mine plant and equipment; (3) the ability to produce minerals in saleable
form (within specifications); and (4) the ability to sustain ongoing production of minerals.
When a mine construction project moves into the production stage, the capitalization of certain mine construction
costs ceases and costs are either capitalized to inventory or expensed, except for capitalizable costs related to
property, plant and equipment additions or improvements, open pit stripping activities that provide a future benefit,
underground mine development or expenditures that meet the criteria for capitalization in accordance with IAS 16
Property, Plant and Equipment.
VALUE ADDED TAX (TVA)
Included in trade and other receivables (refer to note 13) is a recoverable TVA balance (including recoverable TVA
on fuel duty and after discounting provisions) of US$134.9 million (2022: US$191.2 million) owing by the fiscal
authorities in the DRC. The Group continues to seek recovery of TVA in the DRC, in line with the Mining Code. The
carrying value of the receivable has been assessed considering factors such as the level of receipts and tax offsets
in the period and to date, the impact of the settlement agreement reached in prior years, relationships and
communications with government officials and the tax authority and the limited quantum of disputed submissions.
Judgement exists in assessing recovery of these receivables as whilst the TVA balance is considered collectible,
uncertainty exists regarding the timing of receipts and offsets. During 2023, Kibali Goldmines SA has made a total
tax advance payment of US$175 million of which, US$75 million was offset against VAT refunds. Refer to note 13
for more detail.
F - 101
2. KEY ACCOUNTING ESTIMATES AND JUDGEMENTS (CONTINUED)
JUDGEMENTS (CONTINUED):
VALUE ADDED TAX (TVA) (CONTINUED)
Given the continued delays in recovery, the outstanding receivable was discounted by US$57.6 million
(2022: US$62.2 million) which required estimates as to the timing of future receipts and the level and timing of
future offsets with reference to relevant taxes forecast under the mine plan, historical levels and other factors. The
increase in the year was based on a probability weighted scenario analysis that takes into account numerous
recoverability profiles, following the DRC Government’s decision in July 2020 to suspend offsets and cash
repayments. A discount rate of 9.97% (2022: 10.34%) was applied to both the expected cash receipts and the
amounts forecasted to be recovered through offsetting across all scenarios in the assessment. Within the scenarios,
Management have assumed varying periods of delay in offsets, and have included staggered recovery profiles
which reflects management’s best estimates. A 1% increase/decrease in the discount rate will increase/decrease
the provision by US$4.7 million/US$4.5 million (2022: US$5.3 million/US$5.4 million).
EXPLORATION AND EVALUATION EXPENDITURE
The Group has to apply judgement in determining whether exploration and evaluation expenditure should be
capitalised or expensed. Management exercises this judgement based on the results of economic evaluations,
prefeasibility or feasibility studies. Costs are capitalised where those studies conclude that more likely than not the
Group will obtain future economic benefit from the expenditures.
ESTIMATES:
CARRYING VALUES OF PROPERTY, PLANT, EQUIPMENT AND MINERAL PROPERTIES
The Group assesses at each reporting period whether there is any indication that these assets may be impaired
(refer to note 10 and 11). If such indication exists, the Group estimates the recoverable amount of the asset. The
recoverable amount is assessed by reference to the higher of ‘value in use’ (being the net present value of expected
future cash flows of the relevant cash generating unit) and ‘fair value less cost to sell’. The estimates used for
impairment reviews are based on detailed mine and operating plans. We have performed an assessment to identify
impairment indicator using the Future cash flows are based on estimates of:
•The quantities of the proven and probable reserves and certain limited ore resources being those for which there
is a high degree of confidence in economic extraction;
•Future production levels;
•Future commodity prices; including oil forecast at US$80bbl (2022: US$70bbl);
•Future cash cost of production and capital expenditure associated with extraction of the reserves and certain
limited ore resources in the approved mine plan;
•Future gold prices – a gold price curve was used for the impairment calculations starting at a US$1,900/oz gold
price (2022: US$1,700/oz). A gold price of US$1,900/oz was used for the 2023 year (2024: US$1,850)
(2025: US$1,800) (2026: US$1,700) (thereafter at US$1,600/oz);
•A real discount rate equivalent to 7.3% (2022: real 6.6%).
No impairment indicator was identified.
F - 102
2. KEY ACCOUNTING ESTIMATES AND JUDGEMENTS (CONTINUED)
ESTIMATES (CONTINUED):
OPEN CAST MINE STRIPPING
The Group capitalises costs, associated with stripping activity, to expose the orebody, within mining assets.
Judgement is required in determining the relevant section or phase of the orebody to which stripping activity relates,
based on assessment of factors such as mine planning, geology of the open cast pits and strategic board decisions
such as the pushback campaigns which requires judgement over the eligible costs. The Group capitalised
US$31.4 million (2022 US$33.6 million) to stripping assets with a net book value of US$56 million (2022:
US$53 million). The capitalised stripping costs relate to four open cast satellite pits Aerodrome, KCD, Sessenge and
Gorumbwa. The Group subsequently depreciates relevant stripping assets as that section of the orebody is mined
which requires judgement as to the relevant section of the orebody for depreciation.
DETERMINATION OF ORE RESERVES
The Group estimated its Mineral Reserves and Mineral Resources based on information compiled by qualified
persons according to the Canadian Institute of Mining, Metallurgy and Petroleum (CIM) 2014 Definition Standards
for Mineral Resources and Mineral Reserves dated May 10, 2014 (CIM (2014) Standards) as incorporated with
NI 43-101 since the 2019 financial year. Previously the Group based its estimates of ore reserves and mineral
resources in accordance with the Australasian Code for Reporting of Exploration Results, Mineral Resources and
Ore Reserves of December 2012 (the 2012 JORC code).
Reserves determined in this way are used in the calculation of depreciation, amortisation and impairment charges,
as well as the assessment of the carrying value of mining assets and timing of mine closure obligations. There are
numerous uncertainties inherent in estimating ore reserves and assumptions that are valid at the time of estimation
may change significantly when new information becomes available. Changes in the forecast prices of commodities,
exchange rates, production costs or recovery rates may change the economic status of reserves and may,
ultimately, result in the reserves being restated.
CAPITALISATION AND DEPRECIATION
There are several methods that could be adopted for calculating depreciation, i.e. the straight line method, the
production method using ounces produced or tonnes milled. The directors believe the ounces produced method is
the best indication of plant and infrastructure usage. Estimates are required regarding the allocation of assets to
relevant proven and probable reserves and certain limited resources in the units of production calculations, with
assessments involving the Group’s mining, capital and geology departments. Proven and probable reserves and
certain limited resources are used in each depreciation calculation, which is considered to be a suitably
conservative measure of the future ore extractable using existing assets. Expenditure incurred to date in
underground infrastructure development considered to have been commissioned, is depreciated over the remaining
proven and probable reserves and certain limited resources of the underground mine, as the infrastructure provides
access to the future mining areas.
The Group applies judgement in allocating costs between operating and capital items in respect of underground
mining and in determining the date depreciation commences. Costs are capitalised when the activity provides
access to future ore bodies and are expensed as operating costs when the works involve extraction of ore from
operational sections of the ore body. The nature of activity is assessed based on information provided by
contractors, together with inspections by the Group’s mining teams. Direct labour, materials and other costs are
specifically allocated based on the activity performed. Indirect costs that are attributable to underground works are
allocated between capital and operating expenses based on factors such as development versus operating metres.
F - 103
2. KEY ACCOUNTING ESTIMATES AND JUDGEMENTS (CONTINUED)
ESTIMATES (CONTINUED):
CAPITALISATION AND DEPRECIATION (CONTINUED)
Judgement is required in determining the point at which assets under construction at Kibali begin commercial
production and should be depreciated. Depreciation start dates are determined considering the factors detailed in
Note 1 and during 2015 Kibali underground mine assets attributable to production started to be depreciated. The
commissioning of the underground happens in phases and as the sections are brought into production the
attributable costs are transferred and depreciated. Judgement is applied in identifying the costs considered
attributable to this production. Additionally, given ongoing mine construction and development, judgement was
required in allocating costs between operating costs, ore stockpiles and ongoing capital works. Costs have been
allocated based on the underlying activity and economic benefits.
GOLD PRICE ASSUMPTIONS
The following gold prices were used in the mineral reserves optimisation calculation:
202320222021
US$/oz1,30011,30021,2003
FUTURE REHABILITATION OBLIGATIONS
The net present value of current rehabilitation estimates have been discounted to their present value using a real
risk free rate of 1.98% (2022: 1.73%) per annum, with cash flows adjusted for a market risk rate of 10% (2022: 10%)
being the prevailing risk free interest rates at the time. The majority of expenditure is expected to be incurred at the
end of the mine life. The Group undertakes regular assessments by external experts of its mine closure plans,
together with assessments by internal staff in the intervening periods, to determine the required rehabilitation works,
cost of works and timing of such works. Judgment is required in determining the appropriate costs, timing of costs,
discount rates and inflation (when nominal discount rate used).
For further information, including the carrying amounts of the liabilities, refer to Note 18. A 0.25% change in the
discount rate on the Group’s rehabilitation estimates would result in an impact of US$0.1 million
(2022: US$0.8 million at 0.25% real) on the provision for environmental rehabilitation, and an impact of
US$0.1 million (2022: US$0.1 million) on the statement of comprehensive income.
STOCKPILES, GOLD IN PROCESS AND PRODUCT INVENTORIES
Costs that are incurred in or benefit the productive process are accumulated as stockpiles, gold in process and
product inventories. Net realisable value tests are performed at least annually and represent the estimated future
sales price of the product based on contained gold and metals prices, less estimated costs to complete production
and bring the product to sale. Judgment is required in assessing whether stockpiles of different grades should be
tested individually, or tested as inputs to the gold production process, as detailed in the Group’s accounting policy.
In the current year, the stockpiles were tested reflecting the planned blended feed of such stockpiles to the mill on
the basis that they are blended together and with future ore mined.
Stockpile quantities are measured by estimating the number of tonnes added and removed from the stockpile, the
number of contained gold ounces based on assay data, and the estimated recovery percentage based on the
expected processing method. Stockpile tonnages are verified by periodic surveys. The forecast gold prices and cost
escalators were those used in the impairment test detailed above.
1 A gold price range of US$1,300 to US$1,600/oz was used, pit dependant, with the majority (75%) at US$1,300/oz.
2 A gold price range of US$1,300 to US$1,600/oz was used, pit dependant, with the majority (75%) at US$1,300/oz.
3 A gold price range of US$1,200 to US$1,500/oz was used, pit dependant, with the majority (75%) at US$1,200/oz.
F - 104
3. REVENUE
The Company has disaggregated revenue into various categories in the following table, which is intended to depict
how the nature, amount, timing and uncertainty of revenue and cash flows are affected by economic date.
31 Dec 2023 Unaudited US$’000 | 31 Dec 2022 Audited US$’000 | 31 Dec 2021 Audited US$’000 | ||
Primary geographic market | ||||
Democratic Republic of Congo | 1,487,984 | 1,328,306 | 1,469,221 | |
1,487,984 | 1,328,306 | 1,469,221 | ||
Product type | ||||
Gold doré | 1,484,461 | 1,325,380 | 1,465,793 | |
Silver | 3,523 | 2,926 | 3,428 | |
1,487,984 | 1,328,306 | 1,469,221 | ||
Timing of transfer of goods | ||||
Point in time | 1,487,984 | 1,328,306 | 1,469,221 | |
1,487,984 | 1,328,306 | 1,469,221 |
4. OTHER INCOME AND EXPENSES
31 Dec 2023 | 31 Dec 2022 | 31 Dec 2021 | |||||
Unaudited | Audited | Audited | |||||
US$’000 | US$’000 | US$’000 | |||||
Other Income: | |||||||
Other income | — | — | 147 | ||||
Net foreign exchange gains | — | 82 | 741 | ||||
Dividend Received | 357 | 457 | 320 | ||||
357 | 539 | 1,208 | |||||
The total other income is not considered to be part of the main revenue generating activities and as such the Group
presents this income separately from revenue.
F - 105
4. OTHER INCOME AND EXPENSES (CONTINUED)
Note | 31 Dec 2023 | 31 Dec 2022 | 31 Dec 2021 | ||||
Unaudited | Audited | Audited | |||||
US$’000 | US$’000 | US$’000 | |||||
Other Expenses: | |||||||
Management Fee | 25 | 16,627 | 7,036 | 6,216 | |||
Net foreign exchange loss | 35,719 | — | — | ||||
COVID-19 specific costs | — | 1,030 | 35 | ||||
Other expenses | 39,157 | 38,762 | 18,644 | ||||
Discounting provision on VAT receivable adjustment | (4,686) | 5,950 | 8,351 | ||||
86,817 | 52,778 | 33,246 |
Included in other expenses for 2023 are US$7.2 million for fees paid under protest, US$8.7 million relating to
provision for other fiscal expenses, US$1.1 million relating to the funding provided to support the Garamba National
Park as well as cost for the rhino introduction project, US$4.5 million relating to the SOKIMO loan write off and
US$5.9 million relating to environmental and other taxes.
5. MINING AND PROCESSING COSTS
31 Dec | 31 Dec | 31 Dec | |||||
2023 | 2022 | 2021 | |||||
Unaudited | Audited | Audited | |||||
US$’000 | US$’000 | US$’000 | |||||
Mining and processing costs comprise: | |||||||
Mine production costs | 352,657 | 316,880 | 264,556 | ||||
Movement in production inventory and ore stockpiles | (38,893) | (11,871) | (15,340) | ||||
Depreciation and amortisation | 213,823 | 207,813 | 243,958 | ||||
Other mining and processing costs | 201,819 | 161,197 | 194,912 | ||||
729,406 | 674,019 | 688,086 |
6. EXPLORATION AND CORPORATE EXPENDITURE
31 Dec 2013 | 31 Dec 2012 | 31 Dec 2011 | |||||
2023 | 2022 | 2021 | |||||
Unaudited | Audited | Audited | |||||
US$’000 | US$’000 | US$’000 | |||||
Exploration and corporate expenditure comprise: | |||||||
Exploration expenditure | 1,363 | 3,452 | 4,214 | ||||
Corporate expenditure | 1,280 | 3,343 | 1,634 | ||||
2,643 | 6,795 | 5,848 | |||||
F - 106
7. FINANCE INCOME AND COSTS
31 Dec 2012 | 31 Dec 2012 | 31 Dec 2011 | |||||
2023 | 2022 | 2021 | |||||
Unaudited | Audited | Audited | |||||
US$’000 | US$’000 | US$’000 | |||||
Finance income comprise: | |||||||
Interest received – loans and receivables | 3,027 | 3,513 | 3,277 | ||||
Bank interest | 1,210 | 1,674 | 2,341 | ||||
Total finance income | 4,237 | 5,187 | 5,618 | ||||
Finance costs comprise: | |||||||
Interest expense on lease liability | (5,247) | (4,830) | (5,428) | ||||
Other interest expense | (412) | — | — | ||||
Unwinding of discount on provisions for Rehabilitation | (963) | (735) | (485) | ||||
Cash repatriation fee | (12,148) | (44,352) | — | ||||
Total finance costs | (18,770) | (49,917) | (5,913) | ||||
Net finance costs | (14,533) | (44,730) | (295) | ||||
Cash repatriation fee
The balance is related to fees paid to repatriate cash out of the Democratic Republic of Congo. Since the 2018 DRC
Mining Code came into force Kibali Goldmines SA is required to repatriate at least 60% of revenues to DRC in
accordance with Article 269 of the Code and is limited to using the repatriated money to pay local supplies.
Additionally, shareholder loans from non-residents and dividends to non-residents from such balances require
specific regulatory approval.
Amendments to the mining code resulted in delay to obtain approval for funds to be transferred out of the DRC to
the wider Kibali (Jersey) Limited structure and ultimately to the shareholders via dividends to Barrick and AGA.
Kibali discussed with the DRC Central Bank and Government on how best to repatriate the restricted cash that was
building up in the DRC. Management obtained the approval to repatriate US$300 million in 2023 (2022: US$1.1
billion).
F - 107
8. INCOME TAXES
31 Dec | 31 Dec | 31 Dec | |||||
2023 | 2022 | 2021 | |||||
Unaudited | Audited | Audited | |||||
US$’000 | US$’000 | US$’000 | |||||
Current taxation | 81,820 | 47,993 | 55,671 | ||||
Deferred taxation | 11 | 84,779 | 99,853 | 107,044 | |||
Withholding tax | 18,900 | 8,100 | 18,000 | ||||
185,499 | 155,946 | 180,715 | |||||
The tax on the Group’s profit before tax differs from the theoretical amount that would arise using the statutory tax
rate applicable to the Group’s main operations. Withholding tax arose from the dividend payment made from Kibali
Goldmines SA to Moto (Jersey) 2 Limited and Kibali (Jersey) Limited.
31 Dec | 31 Dec | 31 Dec | |||||
2023 | 2022 | 2021 | |||||
Unaudited | Audited | Audited | |||||
US$’000 | US$’000 | US$’000 | |||||
Profit before tax | 578,275 | 488,208 | 674,353 | ||||
Tax calculated at the DRC standard tax rate of 30% | 173,483 | 146,462 | 202,306 | ||||
Withholding tax | 18,900 | 8,100 | 18,000 | ||||
Reconciling items: | |||||||
Exempt income | (20,261) | (24,070) | (56,141) | ||||
Non-deductible costs | 13,377 | 25,454 | 16,550 | ||||
Taxation charges | 185,499 | 155,946 | 180,715 |
Kibali (Jersey) Limited is subject to an income tax rate in Jersey at 0%. In the DRC, Kibali is subject to corporation
tax at 30%. Kibali has losses for deduction against future mining income which are offset by accelerated capital
allowances on property, plant and equipment. Kibali (Jersey) Limited’s estimated tax deductions carried forward at
31 December 2023 amounted to US$210.3 million (2022: US$166.8 million) at the tax rate of 30% which are
reduced by accelerated capital allowances to result in a net deferred tax liabilities being recorded for the financial
years reported. In the current year, the group has a deferred tax liability of US$381.2 million. In addition, withholding
tax arose from the dividend payments from Kibali Goldmines SA to Kibali (Jersey) and Moto (Jersey) 2 Limited.
F - 108
9. PROPERTY, PLANT AND EQUIPMENT
31 Dec | 31 Dec | 31 Dec | |||
2023 | 2022 | 2021 | |||
Unaudited | Audited | Audited | |||
US$’000 | US$’000 | US$’000 | |||
Mine properties, mine development costs and mine plant facilities and equipment | |||||
Cost | |||||
Opening Balance | 3,332,841 | 3,118,076 | 3,161,305 | ||
Additions | 193,821 | 214,765 | 177,331 | ||
Transfers | — | — | — | ||
Disposals | (1,913) | — | — | ||
Other adjustments | 205 | — | (220,560) | ||
Closing Balance | 3,524,954 | 3,332,841 | 3,118,076 | ||
Accumulated depreciation | |||||
Opening Balance | (1,487,858) | (1,306,785) | (1,314,559) | ||
Depreciation | (190,115) | (181,072) | (212,786) | ||
Disposals | 676 | — | 220,560 | ||
Closing Balance | (1,677,297) | (1,487,857) | (1,306,785) | ||
Net book value | 1,847,657 | 1,844,984 | 1,811,291 | ||
Long-lived assets and development costs
Included in plant and equipment are long-lived assets and development costs which are amortised on a units of
production basis as detailed in note 2 and include mining properties, such as processing plants, tailings facilities,
raw water dams and power stations, as well as mine development costs. The net book value of these assets was
US$877.2 million at 31 December 2023 (2022: US$1,447 million) (2021: US$1,583 million). The value of assets
under construction included in plant and equipment that are not depreciated is US$336.3 million (2022: US$339
million) (2021: US$271.2 million (revised from US$294.0 million previously presented)). Revisions to amounts
previously presented as assets under construction reflect adjustments for items which were retrospectively identified
as being in use at the respective dates during 2023, as disclosed in note 1. Refer to note 2 for judgements applied
with regards to stripping assets.
Short-lived assets
Included in property, plant and equipment are short-lived assets which are depreciated over a short life which reflects their likely
useful economic life and are comprised of motor vehicles, computer equipment, aircrafts and fixtures and fittings. The net book
value of these assets was US$574.2 million at 31 December 2023 (2022: US$289 million) (2021: US$167.1 million).
Decommissioning asset
A decommissioning asset has been recognised relating to the rehabilitation liability to the value of US$14.3 million
(2022: US$9.1 million) (2021: US$15.5 million) (refer to note 17). Depreciation of the decommissioning asset commenced on
1 October 2013 when the Group commenced commercial production. The asset is depreciated over the life of the mine on a unit
of production basis (Refer to note 2).
Right of use assets (ROU)
The net carrying amount of buildings, plant and equipment includes the KAS 1 Limited (“KAS”) assets includes the
following amount in respect of Right of Use asset, which also includes the KAS 1 Limited (“KAS”) assets. Refer to
note 19.
31 Dec | 31 Dec | 31 Dec | |||
2023 | 2022 | 2021 | |||
US$’000 | US$’000 | US$’000 | |||
Right of Use Assets | 42,390 | 52,076 | 45,449 | ||
42,390 | 52,076 | 45,449 |
F - 109
10. MINERAL PROPERTIES
31 Dec | 31 Dec | 31 Dec | |||||
2023 | 2022 | 2021 | |||||
Unaudited | Audited | Audited | |||||
US$’000 | US$’000 | US$’000 | |||||
Cost | |||||||
At the beginning and end of the year | 745,092 | 745,092 | 745,092 | ||||
Amortisation | |||||||
At the beginning of the year | (436,951) | (410,211) | (379,039) | ||||
Charge for the year | (23,708) | (26,740) | (31,172) | ||||
At the end of the year | (460,659) | (436,951) | (410,211) | ||||
Net book value | 284,433 | 308,141 | 334,881 | ||||
Mineral properties represent the amounts attributable to licence interest on the purchase of Moto Goldmines Limited
(Moto) in 2009. The balance has been amortised over the life of mine on a unit of production basis since the Group
commenced commercial production on 1 October 2013.
11. DEFERRED TAXATION
31 Dec | 31 Dec | 31 Dec | ||||||
2023 | 2022 | 2021 | ||||||
Unaudited | Audited | Audited | ||||||
US$’000 | US$’000 | US$’000 | ||||||
Deferred taxation is calculated on temporary differences under the liability method using a tax rate of 30% in respect of the DRC operations. | ||||||||
The movement on deferred taxation is as follows: | ||||||||
At the beginning of the year | (296,507) | (196,654) | (89,610) | |||||
Statement of comprehensive income charge (Refer to note 9) | (84,779) | (99,853) | (107,044) | |||||
At the end of the year | (381,286) | (296,507) | (196,654) | |||||
Deferred taxation comprise the following: | ||||||||
Tax losses | 210,280 | 166,762 | 285,632 | |||||
Accelerated capital allowances | (591,566) | (463,269) | (482,286) | |||||
Net deferred tax liability | (381,286) | (296,507) | (196,654) | |||||
F - 110
12. TRADE AND OTHER RECEIVABLES
31 Dec | 31 Dec | 31 Dec | |||||
2023 | 2022 | 2021 | |||||
Unaudited | Audited | Audited | |||||
US$’000 | US$’000 | US$’000 | |||||
Advances to contractors | — | — | 225 | ||||
Trade receivables | 43,794 | 60,692 | 22,805 | ||||
Corporate tax receivable | 116,125 | — | — | ||||
Prepayments and other receivables | 52,797 | 65,892 | 34,302 | ||||
Loan to SOKIMO (refer note 25) | 20,845 | 28,010 | 25,897 | ||||
TVA receivable | 134,959 | 191,191 | 163,193 | ||||
368,520 | 345,785 | 246,422 | |||||
Less: Non-current portion | |||||||
Loan to SOKIMO (refer to note 25) | 14,845 | 28,010 | 25,897 | ||||
Drilling down payment | 1,644 | 1,644 | 3,417 | ||||
TVA Receivable | 133,315 | 191,191 | 163,193 | ||||
Corporate tax receivable | 89,970 | — | — | ||||
Prepayments and other receivables | 25,776 | — | — | ||||
265,550 | 220,845 | 192,507 | |||||
Current portion | 102,970 | 124,940 | 53,915 | ||||
The fair values of trade and other receivables are approximate to the carrying value.
The classes within trade and other receivables do not contain impaired assets however TVA receivables and duties
on fuel balances have been discounted with a provision of US$57.6 million (2022: US$62.2 million) recognised. The
maximum exposure to credit risk at the reporting date is the carrying value of each class of receivable mentioned
above. The Company does not hold any collateral as security. Refer to note 21 for further information on the
concentration of credit risk.
The terms of payment of trade receivables is less than seven days, advances to contractors 30 days and TVA is
recoverable under the Mining Code once submissions are approved. All amounts in current trade receivables have
been received post year end. The Group continues to seek recovery of TVA in line with the Mining Code. Judgement
exists in assessing recovery of this amount. No amounts are expected to be recovered in 2024. See note 2 for
further detail.
During 2023, Kibali Goldmines SA has made a total tax advance payment of US$175 million of which US$37.8
million relates to prepaid salary tax and is included in prepayments and other receivables .The income tax
receivable of US$116.1 million is disclosed separately from the income tax payable, as the receivable can only be
legally offset against 40% of the tax liabilities. At year-end, US$21.1 million of the corporate tax liability was offset
against the tax receivable.
The loan to SOKIMO used to bear interest at 8% until June 2023. The loan and interest will be repaid through future
dividends declared by Kibali Goldmines SA in accordance with the loan agreement . During June 2023, an
amendment was made to the agreement to suspend the interest accrual. Day-one losses were recognised on the
loan as a result (refer to note 4).
F - 111
13. INVENTORIES AND ORE STOCKPILES
31 Dec | 31 Dec | 31 Dec | |||||
2023 | 2022 | 2021 | |||||
Unaudited | Audited | Audited | |||||
US$’000 | US$’000 | US$’000 | |||||
Gold on hand | 15,332 | 11,409 | 4,244 | ||||
Consumables stores | 93,120 | 55,376 | 82,417 | ||||
Ore stockpiles | 61,243 | 26,678 | 15,744 | ||||
Gold in process | 3,022 | 2,618 | 5,546 | ||||
172,717 | 96,081 | 107,951 | |||||
Less: Non-current portion | |||||||
Ore stockpiles | 60,752 | 20,160 | — | ||||
Current portion | 111,965 | 75,921 | 107,951 | ||||
All inventory and ore stockpiles are stated at the lower of cost or net realisable value.
Inventories recognised as an expense during the year ended 31 December 2023 amounted to US$38,893 (2022:
US$11,871). These were included in mining and processing costs (Note 5).
14.SHARE CAPITAL AND PREMIUM
The total authorised number of ordinary shares is 10 000 (2022: 10 000) for the total value of US$10 000 (2022:
US$10 000). All issued shares are fully paid. The total number of issued shares at 31 December 2023 was
4 648 shares (2022: 4 648).
Barrick Gold (Kibali) Limited (Barrick) and AngloGold Ashanti Limited (AngloGold Ashanti) are joint venture partners
and shareholders of Kibali (Jersey) Limited, having acquired all 4 648 outstanding ordinary shares.
31 Dec | 31 Dec | 31 Dec | ||||
2023 | 2022 | 2021 | ||||
Unaudited | Audited | Audited | ||||
US$’000 | US$’000 | US$’000 | ||||
Movement in the number of ordinary shares outstanding: | ||||||
Balance at 1 January | 5 | 5 | 5 | |||
Shares issued | — | — | — | |||
Balance at 31 December | 5 | 5 | 5 | |||
Movement in share premium: | ||||||
Balance at 1 January | 2,123,612 | 2,523,612 | 2,523,612 | |||
Reclassification | — | (400,000) | — | |||
Balance at 31 December | 2,123,612 | 2,123,612 | 2,523,612 | |||
The 2022 reclassification relates to a transfer from share premium to retained earnings to ensure sufficient
distributable reserves.
F - 112
15.NON-CONTROLLING INTEREST
31 Dec | 31 Dec | 31 Dec | ||||
2023 | 2022 | 2021 | ||||
Unaudited | Audited | Audited | ||||
US$’000 | US$’000 | US$’000 | ||||
Balance at 1 January | 85,040 | 68,110 | 55,743 | |||
Non-controlling interest in results of Kibali Goldmines SA | 34,381 | 25,930 | 32,367 | |||
Dividend paid | (12,000) | (9,000) | (20,000) | |||
Balance at 31 December | 107,421 | 85,040 | 68,110 | |||
The non-controlling interest represents the 10% interest SOKIMO has in Kibali Goldmines SA, which is a subsidiary
of Kibali (Jersey) Limited.
This dividend paid represents the SOKIMO portion of the dividends paid to Kibali (Jersey) Limited and Moto
(Jersey) 2 Limited which subsequently flows through Moto (Jersey) 1 Limited to Kibali (Jersey) Limited.
See summarised financial information for Kibali at note 20.
16.LOANS, BORROWINGS AND LEASE LIABILITIES
31 Dec | 31 Dec | 31 Dec | |||
2023 | 2022 | 2021 | |||
Unaudited | Audited | Audited | |||
US$’000 | US$’000 | US$’000 | |||
Non-current | |||||
Lease liabilities | 54,359 | 51,045 | 41,839 | ||
54,359 | 51,045 | 41,839 | |||
Current | |||||
Lease liabilities | 11,328 | 12,507 | 13,909 | ||
Loans from the Group | 21,301 | 1,839 | |||
Bank account in overdraft | — | 21,997 | 1,656 | ||
Total loans and borrowings | 65,687 | 106,850 | 59,243 |
Lease liabilities
The lease liabilities mainly consist of KAS, in respect of the equipment, which has been transferred to the Group
under a previous instalment sale agreement, as well as leases related to the oxygen plant and other minor plant
components. Refer to note 10 for lease asset. Refer to the breakdown below for further details on the lease
liabilities.
Loan note – Barrick Gold Corporation and Anglo Gold Ashanti
During Q4 2023, Kibali 2 (Jersey) Limited underwent a restructuring which involved Kibali 2 (Jersey) Limited
declaring a dividend in specie through the distribution of a loan receivable to its shareholders. The external loan is
classified between a long- and short-term portion based on Kibali Goldmines SA’ future cashflows. The Principal
Amount shall be payable on demand. Interest shall be payable on the Principal Amount outstanding after demand
and on overdue interest both before and after default or judgment at the rate of 7.875% per annum, calculated and
compounded semi-annually on February 15 and August 15 until the outstanding balance of the Principal Amount
and all accumulated and compound interest thereon has been fully paid. Such interest shall accrue daily.
Loan from Barrick Gold Holdings
Barrick, a joint venture partner and operator of the Kibali gold mine, incurs management fees and other expenses
as part of its role as operator of the mine on behalf of the Group. These loans have no terms of repayment. All non-
current receivables are due after 12 months. The movement in the loan is disclosed as a non-cash movement as it
relates to management fees and intercompany charges which are unpaid at the balance sheet date.
F - 113
17.PROVISION FOR REHABILITATION
31 Dec | 31 Dec | 31 Dec | ||||
2023 | 2022 | 2021 | ||||
Unaudited | Audited | Audited | ||||
US$’000 | US$’000 | US$’000 | ||||
Balance at 1 January | 23,829 | 29,626 | 29,167 | |||
Unwinding of discount | 963 | 735 | 485 | |||
Change in estimates | 6,563 | (6,532) | (26) | |||
Total rehabilitation | 31,355 | 23,829 | 29,626 | |||
Current rehabilitation liability | 3,772 | 596 | 600 | |||
Non-Current Liability | 27,583 | 23,233 | 29,026 |
The provisions for rehabilitation costs include changes in estimates and have been discounted to their present value
at 1.98% (2022: 1.73%) per annum, being an estimate equivalent to the real risk free rate determined with reference
to US government bonds with maturity dates comparable to the estimated rehabilitation of the mines. The estimated
cash costs of rehabilitation are risk adjusted. Management have based the provision for environmental rehabilitation
on standards set by the World Bank, which require an environmental management plan, an annual environmental
report, a closure plan, an up-to-date register of plans of the facility, preservation of public safety on closure, carrying
out rehabilitation works and ensuring sufficient funds exist for the closure works. However, it is reasonably possible
that the estimate of its ultimate rehabilitation liability could change as a result of changes in regulations or cost
estimates.
The Group is committed to rehabilitation of its property. It makes use of independent environmental consultants for
advice and it also uses past experience in similar situations to ensure that the provision for rehabilitation is
adequate. The current Life of Mine (LOM) plan envisages the majority of the expected outflow to occur at the end of
the LOM (Refer to note 2) which, at the date of these consolidated financial statements, is 2041 (2022: 2037) for
Kibali gold mine.
Change in estimate for the year ended 31 December 2023 mainly relate to changes due to additional disturbances
during the year.
18.TRADE AND OTHER PAYABLES
31 Dec | 31 Dec | 31 Dec | ||||
2023 | 2022 | 2021 | ||||
Unaudited | Audited | Audited | ||||
US$’000 | US$’000 | US$’000 | ||||
Trade payables | 30,124 | 34,452 | 30,764 | |||
Accruals and other payables | 62,430 | 61,492 | 58,634 | |||
92,554 | 95,944 | 89,398 | ||||
Payroll and other compensations | 9,243 | 8,871 | 7,711 | |||
101,797 | 104,815 | 97,109 |
Accruals and other payables include retention, in respect of contracts with suppliers, of US$0.5 million (2022:
US$1.7 million).
Trade and other payables are all due within 120 days.
F - 114
19.LEASES
Right of use assets
31 Dec | 31 Dec | 31 Dec | |||
2023 | 2023 | 2022 | |||
Unaudited | Audited | Audited | |||
Description | US$’000 | US$’000 | US$’000 | ||
Carrying amount - beginning of the year | 43,696 | 45,449 | 46,175 | ||
Additions | 15,385 | 21,757 | 6,519 | ||
Impact of modifications | — | — | 3,235 | ||
Depreciation | (16,691) | (23,510) | (10,480) | ||
Carrying value - end of year | 42,390 | 43,696 | 45,449 |
Lease liabilities
The lease liabilities mainly consist of KAS, in respect of the equipment, which has been transferred to the Group
under a previous instalment sale agreement, as well as leases related to the oxygen plant and other minor plant
components. Refer to note 10 for lease asset. Refer to the breakdown below for further details on the lease
liabilities.
31 Dec | 31 Dec | 31 Dec | ||||
2023 | 2022 | 2021 | ||||
Unaudited | Audited | Audited | ||||
US$’000 | US$’000 | US$’000 | ||||
As at 1 January | 63,552 | 55,748 | 65,131 | |||
Additions | 15,385 | 21,757 | 6,519 | |||
Impact of modifications | — | — | 3,235 | |||
Interest expense | 5,659 | 4,830 | 5,428 | |||
Lease payments | (18,582) | (18,660) | (24,565) | |||
Foreign exchange movements | (327) | (123) | — | |||
As at 31 December | 65,687 | 63,552 | 55,748 |
F - 115
20.SEGMENTAL INFORMATION
Operating segments have been identified on the basis of internal reports about components of the Group that are
regularly reviewed by the Group’s chief operating decision maker. The operating segments included in the internal
reports are determined on the basis of their significance to the Group. In particular, the operating mine is reported
as a separate segment. KAS is included within the corporate segment. The Group’s chief operating decision maker
is considered by management to be the board of directors. An analysis of the Group’s business segments,
excluding intergroup transactions, is set out below. Major customers are not identifiable because all gold is sold
through an agent.
F - 116
20.SEGMENTAL INFORMATION (CONTINUED)
Country of operation | DRC | Jersey | |||||
US$’000 | Kibali Goldmines SA | Corporate | Intercompany eliminations and consolidation entries | Total | |||
Year ended 31 December 2023 Unaudited | |||||||
Profit and loss | |||||||
Total revenue | 1,487,984 | — | — | 1,487,984 | |||
Mining and processing costs excluding Depreciation | (516,511) | — | 2,054 | (514,457) | |||
Depreciation and amortisation | (194,892) | (427) | (18,531) | (213,850) | |||
Mining and processing costs | (711,403) | (427) | (16,477) | (728,307) | |||
Royalties | (77,408) | — | — | (77,408) | |||
Exploration and corporate expenditure | (1,363) | (1,280) | — | (2,643) | |||
Other (expenses)/income and JV profit | (82,020) | (3,316) | (1,481) | (86,817) | |||
Finance costs | (6,622) | (12,148) | — | (18,770) | |||
Finance income | 1,844 | 2,393 | — | 4,237 | |||
Profit before income tax | 611,012 | (14,778) | (17,958) | 578,276 | |||
Income tax expense | (166,599) | (18,900) | — | (185,499) | |||
Net profit for the year | 444,413 | (33,678) | (17,958) | 392,777 | |||
Capital expenditure | 194,645 | — | — | 194,645 | |||
Total assets | 2,812,327 | 1,996,908 | (1,985,857) | 2,823,378 | |||
Total liabilities | (1,607,088) | (1,024,763) | 1,000,240 | (1,631,611) | |||
Year ended 31 December 2022 Audited | |||||||
Profit and loss | |||||||
Total revenue | 1,328,306 | — | — | 1,328,306 | |||
Mining and processing costs excluding depreciation | (468,327) | — | 2,121 | (466,206) | |||
Depreciation and amortisation | (185,019) | (427) | (22,367) | (207,813) | |||
Mining and processing costs | (653,346) | (427) | (20,246) | (674,019) | |||
Royalties | (62,472) | — | — | (62,472) | |||
Exploration and corporate expenditure | (3,452) | (3,343) | — | (6,795) | |||
Other expenses and JV profit | (56,903) | 4,821 | — | (52,082) | |||
Finance costs | (152,079) | (35,073) | 137,236 | (49,916) | |||
Finance income | 3,700 | 12,664 | (11,178) | 5,186 | |||
Profit before income tax | 403,754 | (21,358) | 105,812 | 488,208 | |||
Income tax expense | (147,846) | (8,100) | — | (155,946) | |||
Net profit/(loss) for the year | 255,908 | (29,458) | 105,812 | 332,262 | |||
Capital expenditure | 214,765 | — | — | 214,765 | |||
Total assets | 2,685,504 | 2,171,491 | (2,143,571) | 2,713,424 | |||
Total liabilities | (1,708,355) | (289) | 1,176,642 | (532,002) | |||
F - 117
20.SEGMENTAL INFORMATION (CONTINUED) | |||||||
Country of operation | DRC | Jersey | |||||
US$’000 | Kibali Goldmines SA | Corporate | Intercompany eliminations and consolidation entries | Total | |||
Year ended 31 December 2021 Audited | |||||||
Profit and loss | |||||||
Total revenue | 1,469,221 | — | — | 1,469,221 | |||
Mining and processing costs excluding depreciation | (446,175) | — | 2,047 | (444,128) | |||
Depreciation and amortisation | (237,215) | (1,911) | (4,832) | (243,958) | |||
Mining and processing costs | (683,390) | (1,911) | (2,785) | (688,086) | |||
Royalties | (68,704) | — | — | (68,704) | |||
Exploration and corporate expenditure | (4,346) | 545 | (2,047) | (5,848) | |||
Other (expenses)/income and JV profit | (31,831) | (104) | — | (31,935) | |||
Finance costs | (198,660) | (1) | 192,748 | (5,913) | |||
Finance income | 4,099 | 12,697 | (11,178) | 5,618 | |||
Profit before income tax | 486,389 | 11,226 | 176,738 | 674,353 | |||
Income tax expense | (162,715) | (18,000) | — | (180,715) | |||
Net profit for the year | 323,674 | (6,774) | 176,738 | 493,638 | |||
Capital expenditure | 177,331 | — | — | 177,331 | |||
Total assets | 3,586,931 | 3,397,061 | (3,346,301) | 3,637,691 | |||
Total liabilities | (2,789,133) | (3,336) | 2,401,743 | (390,726) | |||
21.FINANCIAL RISK MANAGEMENT
Our financial instruments are financial liabilities and financial assets. Our principal financial liabilities are accounts
payable and debt. The main purpose of these financial instruments is to manage short-term cash flow and raise
funds for our capital expenditure programme. Our principal financial assets are cash and equivalents, accounts
receivable and notes receivable.
We manage our exposure to key financial risks in accordance with our financial risk management policy. The
objective of the policy is to support the delivery of our financial targets while protecting future financial security.
The main risks that could adversely affect our financial assets, liabilities or future cash flows are as follows:
•Market risk, including commodity price risk, foreign currency and interest rate risk;
•Credit risk;
•Liquidity risk; and
•Capital risk management.
Management designs strategies for managing each of these risks, which are summarized below. Our senior
management oversees the management of financial risks.
Our senior management ensures that our financial risk-taking activities are governed by policies and procedures
and that financial risks are identified, measured and managed in accordance with our policies and our risk appetite.
F - 118
21. FINANCIAL RISK MANAGEMENT (CONTINUED)
Market Risk
Market risk is the risk that changes in market factors, such as commodity prices, foreign exchange rates or interest
rates, will affect the value of our financial instruments. We manage market risk by either accepting it or mitigating it
through the use of derivatives and other economic hedging strategies.
Gold
We sell our gold production in the world market. The market prices of gold is the primary driver of our profitability
and ability to generate both operating and free cash flow. Our corporate treasury group may implement hedging
strategies on an opportunistic basis to protect us from downside price risk on our gold production. We did not enter
into any positions during 2023 or 2022 and we do not have any positions outstanding as at 31 December 2023. Our
gold production is subject to market prices.
Fuel
We consume diesel fuel to run our operations during the dry season. Diesel fuel is refined from crude oil and is
therefore subject to the same price volatility affecting crude oil prices. Therefore, volatility in crude oil and natural
gas prices have a direct and indirect impact on our production costs.
Foreign exchange and commodity price risk
In the normal course of business, the Group enters into transactions denominated in foreign currencies (primarily
Euro, British Pound, South African Rand, Congolese Franc and Australian Dollar). As a result, the Group is subject
to exposure from fluctuations in foreign currency exchange rates. In general, the Group does not enter into
derivatives to manage these currency risks and none existed in 2023 or 2022. Generally, the Group does not hedge
its exposure to gold price fluctuation risk and gold was sold at market spot prices in 2023 and 2022. Gold sales are
made in US dollars and do not expose the Group to any currency fluctuation risk. The Group is also exposed to
fluctuations in the price of consumables, such as fuel, steel, rubber, cyanide and lime, mainly due to changes in the
price of oil, as well as fluctuations in exchange rates.
There are no sensitivities disclosed for foreign exchange as these balances are immaterial.
31 Dec 2023 | 31 Dec 2022 | 31 Dec 2021 | |||
Unaudited | Audited | Audited | |||
US$’000 | US$’000 | US$’000 | |||
Level of exposure of foreign currency risk carrying value of foreign currency balances. Cash and cash equivalents includes balances denominated in: | |||||
•Congolese Franc (CDF) | 570 | (2,981) | 2,189 | ||
•Euro (EUR) | 547 | 419 | 4 | ||
•South African Rand (ZAR) | 254 | 624 | 205 | ||
•British Pound (GBP) | 46 | 47 | 199 | ||
•Australian Dollar (AUD) | 321 | 249 | 500 | ||
Interest rate and liquidity risk
Fluctuations in interest rates impact on the value of short-term cash investments, interest receivable on hire
purchase loans and interest payable on financing activities, giving rise to interest rate risk. The Group funds
working capital and capital expenditure requirements with operating cash flows. The drawdowns of any funds are
subject to the approval of the Annual budget and Business plan by the board of directors.
The Group has in the past been able to actively source financing through shareholder loans. The finance lease
entered into bears a fixed rate of interest.
The directors believe that the working capital resources, by way of internal sources and overdraft facilities, are
sufficient to the Group’s currently foreseeable future business requirements.
F - 119
21.FINANCIAL RISK MANAGEMENT (CONTINUED)
Amount US$’000 | Effective rate for the year | |
Cash and cash equivalents: | ||
All less than 90 days (2023) | 122,968 | 1.02% |
All less than 90 days (2022) | 91,865 | 0.85% |
All less than 90 days (2021) | 1,115,359 | 0.70% |
Concentration of credit risk
Credit risk is the risk that a third party might fail to fulfil its performance obligations under the terms of a financial
instrument. Credit risk arises from cash and equivalents, notes receivable and accounts receivable.
In normal circumstances, the Group’s cash balances do not give rise to a concentration of credit risk because it
endeavours to deal with a variety of major financial institutions wherever possible. For cash and equivalents, credit
risk exposure equals the carrying amount on the balance sheet. To mitigate our inherent exposure to credit risk we
maintain policies to limit the concentration of credit risk, review counterparty creditworthiness on a monthly basis,
and ensure liquidity of available funds. Where possible, our cash and equivalents are held with AAA rated financial
institutions. All cash balances under the Company’s control or joint control are free from assignment or other
charges. Cash held in banks in the DRC by Kibali is subject to administrative steps prior to repatriation. At year-end,
the group had US$122.9 million (2022: US$ 91.9 million) of cash in country, an increase of US$31.1 million year on
year. Management further assessed any expected credit losses, which was considered immaterial. In forming this
assessment, the Company considered the history of the banking relationships, knowledge of the DRC economy and
credit rating reports for the DRC banks to evaluate liquidity and any indications of increased credit risk associated
with the institutions.
The Group applies IFRS 9 to measure expected credit losses for receivables and loans including other investments
in joint ventures and loans to non-controlling interests, these are regularly monitored and assessed. Receivables
are impaired when it is probable that amounts outstanding are not recoverable as set out in the accounting policy
note for receivables. Gold doré, the Group’s principal product, is produced in the DRC. The gold doré is refined and
sold through the largest accredited gold refinery in the world. Credit risk is further managed by regularly reviewing
the financial statements of the refinery. Further, the Group is not exposed to significant credit risk on gold sales, as
cash is received within a few days of the sale taking place.
Capital risk management
The Group’s objectives when managing capital are to safeguard its ability to continue as a going concern in order to
provide future returns for shareholders and benefits for other stakeholders and to maintain an optimal capital
structure to reduce the cost of capital. In order to maintain or adjust the capital structure, the Group issue new
shares (by way of funding from the joint venture partners) or will make use of intercompany loans. The Group
monitors capital on the basis of the gearing ratio. This ratio is calculated as net borrowings, finance lease liabilities
and trade and other payables (less cash) divided by total capital. Total capital is calculated as equity, as shown in
the statement of financial position, plus net borrowings, finance lease liabilities and trade and other payables (less
cash). This measure may differ to other companies.
F - 120
21.FINANCIAL RISK MANAGEMENT (CONTINUED)
31 Dec 2023 | 31 Dec 2022 | 31 Dec 2021 | |||
Unaudited | Audited | Audited | |||
US$’000 | US$’000 | US$’000 | |||
Capital risk management | |||||
Borrowings, trade and other payables and lease liabilities (note 16 and 18) | 1,179,254 | 211,666 | 154,696 | ||
Less: cash and cash equivalents | (122,968) | (91,865) | (1,115,359) | ||
Net borrowings, trade and other payables and cash | 1,056,286 | 119,801 | (960,663) | ||
Total equity | 1,191,770 | 2,181,425 | 3,246,965 | ||
Total capital | 2,248,056 | 2,301,228 | 2,286,302 | ||
Gearing ratio | 47% | 5% | (42)% |
Maturity analysis
The following table analyses the Group’s financial liabilities into the relevant maturity groupings based on the
remaining period from the Statement of Financial Position to the contractual maturity date.
Trade and other payables | Borrowings* | Expected Future interest payments | |||
US$'000 | US$'000 | US$'000 | |||
At 31 December 2023 Unaudited | |||||
Financial liabilities | |||||
Within 1 year in demand | 92,554 | 302,692 | 5,077 | ||
Later than 1 year and no later than 5 years | — | 758,632 | 11,055 | ||
Total | 92,554 | 1,061,324 | 16,132 | ||
At 31 December 2022 Audited | |||||
Financial liabilities | |||||
Within 1 year in demand | 104,815 | 8,240 | 4,088 | ||
Later than 1 year and no later than 5 years | — | 64,934 | 7,413 | ||
Total | 104,815 | 73,174 | 11,501 | ||
At 31 December 2021 Audited | |||||
Financial liabilities | |||||
Within 1 year in demand | 97,109 | 11,502 | 2,407 | ||
Later than 1 year and no later than 5 years | — | 39,649 | 4,029 | ||
Total | 97,109 | 51,151 | 6,436 |
* This includes lease liabilities
F - 121
22.CASH FLOW FROM OPERATIONS
31 Dec | 31 Dec | 31 Dec | |||||
2023 | 2022 | 2021 | |||||
Unaudited | Audited | Audited | |||||
US$’000 | US$’000 | US$’000 | |||||
Profit before income taxation | 578,275 | 488,208 | 674,353 | ||||
Adjustments for: | |||||||
Finance income (Note 8) | (4,237) | (5,187) | (5,618) | ||||
Finance cost (Note 8) | 18,770 | 49,917 | 5,913 | ||||
Share of profits of equity accounted joint venture | (738) | (157) | (103) | ||||
Depreciation and amortisation (Note 5) | 213,820 | 207,813 | 243,958 | ||||
Foreign exchange loss / (gain) (Note 4) | 35,403 | — | (741) | ||||
TVA write off agreement | — | — | — | ||||
Movement in discounting provision on TVA (Note 4) | (4,686) | 5,950 | 8,351 | ||||
836,607 | 746,544 | 926,113 | |||||
Effects of changes in operating working capital items | |||||||
–Receivables | 21,872 | (96,962) | (26,214) | ||||
–Inventories | (36,044) | 11,871 | 19,412 | ||||
–Trade and other payables | (45,276) | 14,447 | 24,933 | ||||
Cash generated from operations | 777,159 | 675,900 | 944,244 | ||||
Cash flows relating to loans and borrowings within financing activities comprises the following movements in finance
lease liabilities:
F - 122
22. CASH FLOW FROM OPERATIONS (CONTINUED)
Cash flows relating to loans and borrowings within financing activities comprises the following movements in finance
lease liabilities:
Non-current | Current | Total | |||||
loans and | loans and | ||||||
borrowings | borrowings | ||||||
US$’000 | US$’000 | US$’000 | |||||
At 1 January 2021 Audited | 50,457 | 14,674 | 65,131 | ||||
Cash flows: | |||||||
Lease repayments | — | (24,565) | (24,565) | ||||
Non cash flows: | |||||||
Loans and borrowings classified as non-current at 31 December 2021 | (17,603) | 17,603 | — | ||||
Loan from Group (Note 16) | — | — | — | ||||
Interest and capital accrued | — | 5,428 | 5,428 | ||||
IFRS 16 lease additions | 8,985 | 769 | 9,754 | ||||
At 31 December 2021 1 Audited | 41,839 | 13,909 | 55,748 | ||||
At 1 January 2022 Audited | 41,839 | 13,909 | 55,748 | ||||
Cash flows: | |||||||
Lease repayments | — | (18,660) | (18,660) | ||||
Overdraft | 17 | — | 20,341 | 20,341 | |||
Non cash flows: | |||||||
Other movements | — | 3,495 | 3,495 | ||||
Loans and borrowings classified as non-current at 31 December 2022 | (12,551) | 12,551 | — | ||||
Loan from Group | 17 | — | 19,462 | 19,462 | |||
Interest and capital accrued | — | 4,707 | 4,707 | ||||
IFRS 16 lease additions | 21,757 | — | 21,757 | ||||
At 31 December 2022 Audited | 51,045 | 55,805 | 106,850 | ||||
At 1 January 2023 Unaudited | 51,045 | 55,805 | 106,850 | ||||
Cash flows: | |||||||
Lease repayments | — | (18,582) | (18,582) | ||||
Overdraft | 17 | — | (21,997) | (21,997) | |||
Non cash flows: | |||||||
Other movements | — | (696) | (696) | ||||
Loans and borrowings classified as non-current at 31 December 2023 | (12,071) | 12,071 | — | ||||
Loan from Barrick Gold Holdings | 17 | — | (20,260) | (20,260) | |||
Loan to BGC and AGA | 17 | 715,328 | 295,400 | 1,010,728 | |||
Interest and capital accrued | — | 6,027 | 6,027 | ||||
IFRS 16 lease additions and modifications | 15,385 | — | 15,385 | ||||
At 31 December 2023 Unaudited | 769,687 | 307,768 | 1,077,455 | ||||
1 Refer to note 18 and the consolidated cash flow statements on page F - 87.
F - 123
23.COMMITMENTS AND CONTINGENT LIABILITIES
31 Dec | 31 Dec | 31 Dec | |||||
2023 | 2022 | 2021 | |||||
Unaudited | Audited | Audited | |||||
US$’000 | US$’000 | US$’000 | |||||
Capital expenditure contracted for at statement of financial | |||||||
position date but not yet incurred is: | |||||||
Property, plant and equipment | 12,414 | 24,637 | 28,157 | ||||
At the end of January and in early February 2022, Kibali Goldmines SA, which owns and operates the Kibali gold
mine in the Democratic Republic of Congo, received fifteen claims from the Direction Générale des Douanes et
Accises (“Customs Authority”) concerning customs duties. The Customs Authority claimed that incorrect import duty
tariffs had been applied to the importation of certain consumables and equipment for the Kibali gold mine. In
addition, they claimed that the exemption available to Kibali Goldmines SA, which was granted in relation to the
original mining lease, no longer applied. Finally, the Customs Authority claimed that a service fee paid on the
exportation of gold was paid to the wrong government body. The claims, including substantial penalties and interest,
totaled US$339 million. The Company has examined the Customs Authority claims and, except for certain
immaterial items for which a provision has already been made, concluded that they were without merit, as they
sought to challenge established customs practices which have been accepted by the Customs Authority for many
years and, where relevant, were in line with ministerial instruction letters. The Company engaged in discussions
with the Customs Authority and Ministry of Finance to resolve the customs claims. As a result of these discussions,
all of the customs claims have now been resolved with the exception of one immaterial claim for which a provision
has already been made.
124
24. INVESTMENT IN JOINT VENTURE
Set out below is the summarised financial information for KAS which is accounted for using the equity method
(amounts stated at 100% before intercompany eliminations).
31 Dec | 31 Dec | 31 Dec | |||||
2023 | 2022 | 2021 | |||||
Unaudited | Audited | Audited | |||||
US$’000 | US$’000 | US$’000 | |||||
Summarised statement of financial position | |||||||
Current assets | |||||||
Cash and cash equivalents | 9,801 | 5,384 | 3,485 | ||||
Other current assets (excluding cash) | 4,278 | 8,962 | 3,675 | ||||
Total current assets | 14,079 | 14,346 | 7,160 | ||||
Other current liabilities (including trade payables) | (1,865) | (4,186) | (1,846) | ||||
Total current liabilities | (1,865) | (4,186) | (1,846) | ||||
Non-current | |||||||
Assets | 50,515 | 42,115 | 38,148 | ||||
Financial liabilities | (61,248) | (51,748) | (43,249) | ||||
Net assets | 1,481 | 527 | 213 | ||||
Summarised statement of comprehensive income | |||||||
Operating profit/(loss) | 834 | 288 | 3 | ||||
Interest income | 4,402 | 3,139 | 3,167 | ||||
Interest expense | (3,762) | (3,113) | (2,965) | ||||
Profit and total comprehensive income for the period | 1,474 | 314 | 205 | ||||
Dividends received from joint venture | — | — | 480 | ||||
Reconciliation of the summarised financial information presented to the carrying amount of the group's interest in KAS | ||||||||
Opening net assets at 1 January | 526 | 213 | 488 | |||||
Profit for the period | 1,474 | 314 | 205 | |||||
Dividends received | — | — | (480) | |||||
Closing net assets at 31 December | 2,000 | 527 | 213 | |||||
Interest in joint venture at 50.1% | 1,002 | 264 | 107 | |||||
Profit for the period at 50.1% | 738 | 157 | 103 | |||||
Funding classified as long term debt by joint venture recorded in ‘other investments in joint ventures’ | 26,071 | 25,990 | 21,669 | |||||
Carrying value | 27,073 | 26,254 | 21,776 | |||||
The loan to KAS bears interest at 8% and has no fixed repayment terms. Joint control is provided through a joint
venture agreement.
F - 125
25.RELATED PARTIES AND RELATED PARTY TRANSACTIONS
Related parties | Nature of relationship |
Barrick Gold Corporation | Ultimate Joint Venture partner |
Barrick Gold (Holdings) Limited | Ultimate Joint Venture partner |
AngloGold Ashanti plc | Ultimate Joint Venture partner |
AngloGold Ashanti Holdings plc | Joint Venture partner |
Barrick Gold (Kibali) Limited | Joint Venture partner |
Barrick Gold (Congo) SPRL | Entity under common control (subsidiary of Barrick) |
Société des Mines de Loulo SA | Entity under common control (subsidiary of Barrick) |
Société des Mines de Tongon SA | Entity under common control (subsidiary of Barrick) |
Société des Mines de Gounkoto SA | Entity under common control (subsidiary of Barrick) |
Rand Refinery (Pty) Limited | Associate of AngloGold Ashanti |
SOKIMO | Government interest in Kibali |
KAS | Joint Venture |
Isiro (Jersey) Limited | Joint Venture of Barrick |
KGL Isiro SARL | Subsidiary of Isiro (Jersey) Limited |
31 Dec | 31 Dec | 31 Dec | |||||
2023 | 2022 | 2021 | |||||
Unaudited | Audited | Audited | |||||
US$’000 | US$’000 | US$’000 | |||||
Related party transactions | |||||||
Dividend paid to SOKIMO | 12,000 | 9,000 | 20,000 | ||||
Management fee paid to Barrick Gold (Holdings) Ltd | 16,627 | 7,036 | 6,216 | ||||
Refining fees to Rand Refinery (Pty) Limited | 452 | 313 | 4,789 | ||||
Interest income from SOKIMO | 1,111 | 2,113 | 2,291 | ||||
Shareholders interest received from KAS | 1,916 | 1,400 | 1,469 | ||||
Interest incurred to KAS on the finance lease liability | — | 2,981 | 3,128 | ||||
Loan to AngloGold Ashanti | 505,364 | — | — | ||||
Loan to Barrick Gold Corporation | 505,364 | — | — | ||||
Amounts included in trade and other receivables owed from / (owing to) related parties | |||||||
Rand Refinery (Pty) Limited | 34,925 | 48,532 | 20,832 | ||||
Loan to SOKIMO | 20,845 | 28,010 | 25,897 | ||||
Loan to Barrick Gold (Congo) SPRL | 5,037 | 1,641 | 1,988 | ||||
Loan to KGL Isiro SARL | 211 | 208 | 202 | ||||
Loan (from) / to Société des Mines de Loulo SA | (134) | (95) | — | ||||
Loan (from) / to Société des Mines de Tongon SA | (75) | (34) | (29) | ||||
Loan to Société des Mines de Gounkoto SA | 1 | 1 | 1 | ||||
Amounts included in other investment in joint venture owing by related parties | |||||||
Loan to KAS | 26,071 | 25,990 | 21,669 | ||||
Loan to/(from) Barrick Gold (Holdings) Ltd | (1,041) | (21,301) | (1,839) | ||||
Finance lease liability with KAS | (49,021) | (44,690) | (35,187) | ||||
SOKIMO has a 10% interest in Kibali Goldmines SA, a subsidiary of the group.
The key management personnel are considered to be the board of Kibali and Kibali (Jersey) Limited. None of the
directors receive any remuneration for performing their director duties.
F - 126
25. RELATED PARTIES AND RELATED PARTY TRANSACTIONS (CONTINUED)
Rand Refinery (Pty) Limited (Rand Refinery) is an associate of AngloGold Ashanti. Kibali has incurred refining costs
of US$0.5 million in the year (2022: US$0.3 million). US$1,488 million (2022: US$1,328 million) of gold and silver
was sold by Rand Refinery under the contract with Kibali in which Rand Refinery is the stated agent.
It is the obligation of the joint venture parties, Barrick and AngloGold Ashanti, (joint venture partners) to fund the
Group for operating costs, capital costs and other costs in proportion to their respective percentage interests in
Kibali (Jersey) Limited. These costs are in accordance with the Kibali Joint Venture Agreement.
The finance lease liability due to KAS is in respect of the equipment which has been transferred to the Group under
an instalment sale agreement. Kibali (Jersey) Limited has a 50.1% shareholding in KAS.
Refer to notes 12 and 16 for the details of loans to and from related parties.
26.SUBSIDIARIES
The consolidated financial statements include the results of the Company and all of its subsidiaries and jointly
controlled entities at 31 December 2023. The Company, the principal subsidiaries and their interests are:
% of | Country of | ||
Interest | incorporation | ||
and | |||
residence | |||
Company | Kibali (Jersey) Ltd | Jersey | |
Subsidiary | Border Energy East Africa (Pty) Ltd | 100% | Uganda |
Subsidiary | Moto (Jersey) 1 Ltd | 100% | Jersey |
Subsidiary | Kibali 2 (Jersey) Ltd | 100% | Jersey |
Subsidiary | 0858065 B.C. Limited | 100% | Canada |
Subsidiary | Moto Goldmines Australia Pty Ltd | 100% | Australia |
Subsidiary | Kibali Goldmines SA | 90% | DRC |
F - 127
27. SUBSEQUENT EVENTS
Corporate Tax:
After year end, Kibali received a corporate income tax assessment for US$21 million as a result of the DRC fiscal
authorities disallowing as an expense a portion of the interest paid by Kibali on the historical loans it obtained to
finance the construction of the mine. The DRC fiscal authorities are seeking to adjust the deductible interest on the
loans from 8% to 7.75%. This results in additional taxes of US$11m plus penalties of US$10m. Kibali is still in
discussion with the DRC fiscal authorities on the matter.
VAT:
Kibali received Value Added Tax assessments amounting to US$152 million (including penalties) covering the period
2019 to 2022. The Company believes that the assessments are without merit and intends to defend the proceedings
vigorously. In order to dispute these assessments Kibali has to lodged deposits totalling US$8.9 million with the
DRC fiscal authorities.
28.OTHER INFORMATION
The Company is a private company limited by shares, incorporated in Jersey with its registered office at 3rd Floor,
Unity Chambers, 28 Halkett Street, St Helier, Jersey, JE2 4WJ, Channel Islands. The Company’s principal activity is
the operation of the Kibali gold mine in the DRC.
F - 128
ITEM 19:EXHIBITS
Exhibit Number | Description | Remarks | ||
Exhibit 19.1 | Filed herewith | |||
Exhibit 19.2.1 | Incorporated by reference to Exhibit 4.2 to AngloGold Ashanti (Pty) Ltd (formerly known as AngloGold Ashanti Limited) and AngloGold Ashanti Holdings plc’s Registration Statement on Form F-3 (Nos. 333-182712 and 333-182712-02) filed with the Securities and Exchange Commission on 17 July 2012 | |||
Exhibit 19.2.2 | Filed herewith | |||
Exhibit 19.2.3 | Incorporated by reference to Exhibit 99(C) to AngloGold Ashanti (Pty) Ltd (formerly known as AngloGold Ashanti Limited) and AngloGold Ashanti Holdings plc’s Registration Statement on Form 8-A (Nos. 001-14846 and 001-34725) filed with the Securities and Exchange Commission on 28 April 2010 | |||
Exhibit 19.2.4 | Incorporated by reference to Exhibit 4.1 to AngloGold Ashanti (Pty) Ltd (formerly known as AngloGold Ashanti Limited) and AngloGold Ashanti Holdings plc’s report on Form 6-K (Nos. 001-14846 and 001-34725) filed with the Securities and Exchange Commission on 1 October 2020 | |||
Exhibit 19.2.5 | Incorporated by reference to Exhibit 4.1 to AngloGold Ashanti (Pty) Ltd (formerly known as AngloGold Ashanti Limited) and AngloGold Ashanti Holdings plc’s report on Form 6-K (Nos. 001-14846 and 001-34725) filed with the Securities and Exchange Commission on 22 October 2021 | |||
Exhibit 19.2.6 | Filed herewith | |||
Exhibit 19.4.1 | Incorporated by reference to Exhibit 99.1 to AngloGold Ashanti plc’s Registration Statement on Form S-8 (No. 333-274681) filed with the Securities and Exchange Commission on 25 September 2023 | |||
Exhibit 19.4.2.1 | Incorporated by reference to Exhibit 19.4.4.1 to AngloGold Ashanti (Pty) Ltd’s (formerly known as AngloGold Ashanti Limited’s) Annual Report on Form 20-F (No. 001-14846) filed with the Securities and Exchange Commission on 17 March 2023 | |||
E - 1
Exhibit Number | Description | Remarks | ||
Exhibit 19.4.2.2 | Filed herewith | |||
Exhibit 19.4.2.3 | Filed herewith | |||
Exhibit 19.4.3.1 | Filed herewith | |||
Exhibit 19.4.3.2 | Filed herewith | |||
Exhibit 19.4.4 | Incorporated by reference to AngloGold Ashanti (Pty) Ltd’s (formerly known as AngloGold Ashanti Limited’s) report on Form 6-K (No. 001-14846) furnished to the Securities and Exchange Commission on 19 February 2016 | |||
Exhibit 19.4.5.1 | Incorporated by reference to Exhibit 2.1 to AngloGold Ashanti plc’s Registration Statement on Form F-4 (Amendment No. 1) (No. 333-272867) filed with the Securities and Exchange Commission on 3 July 2023 | |||
Exhibit 19.4.5.2 | Incorporated by reference to Exhibit 2.2 to AngloGold Ashanti plc’s Registration Statement on Form F-4 (Amendment No. 1) (No. 333-272867) filed with the Securities and Exchange Commission on 3 July 2023 | |||
Exhibit 19.4.5.3 | Incorporated by reference to Exhibit 2.3 to AngloGold Ashanti plc’s Registration Statement on Form F-4 (Amendment No. 1) (No. 333-272867) filed with the Securities and Exchange Commission on 3 July 2023 | |||
Exhibit 19.8 | Filed herewith | |||
Exhibit 19.12.1 | Filed herewith | |||
Exhibit 19.12.2 | Filed herewith | |||
Exhibit 19.13 | Filed herewith | |||
E - 2
Exhibit Number | Description | Remarks | ||
Exhibit 19.15.1 | Filed herewith | |||
Exhibit 19.15.2 | Filed herewith | |||
Exhibit 19.15.3 | Filed herewith | |||
Exhibit 19.15.4 | Filed herewith | |||
Exhibit 19.15.5 | Incorporated by reference to Exhibit 19.15.4 to AngloGold Ashanti (Pty) Ltd’s (formerly known as AngloGold Ashanti Limited’s) Annual Report on Form 20-F (No. 001-14846) filed with the Securities and Exchange Commission on 17 March 2023 | |||
Exhibit 19.15.6 | Filed herewith | |||
Exhibit 19.15.7 | Filed herewith | |||
Exhibit 19.15.8 | Incorporated by reference to Exhibit 19.15.7 to AngloGold Ashanti (Pty) Ltd’s (formerly known as AngloGold Ashanti Limited’s) Annual Report on Form 20-F (No. 001-14846) filed with the Securities and Exchange Commission on 17 March 2023 | |||
Exhibit 19.15.9 | Filed herewith | |||
Exhibit 19.15.10 | Filed herewith | |||
Exhibit 19.16 | Filed herewith | |||
Exhibit 19.17 | Filed herewith | |||
Exhibit 19.97 | Filed herewith | |||
Exhibit 19.101 | Interactive Data Files | |||
Exhibit 19.104 | Cover Page Interactive Data File (formatted as Inline XBRL and contained in Exhibit 19.101) | |||
E - 3
SIGNATURES
The registrant hereby certifies that it meets all of the requirements for filing on Form 20-F and that it has duly
caused and authorised the undersigned to sign this annual report on its behalf.
ANGLOGOLD ASHANTI PLC
/s/ G A Doran
Name | : | Gillian Ann Doran | ||
Title | : | Chief Financial Officer | ||
Date | : | 25 April 2024 |