a
UNITED STATES
SECURITIES AND EXCHANGE COMMISSION
Washington, D.C. 20549
FORM
REGISTRATION STATEMENT PURSUANT TO SECTION 12(b) OR (g) OF THE SECURITIES EXCHANGE ACT OF 1934 |
OR
ANNUAL REPORT PURSUANT TO SECTION 13 OR 15(d) OF THE SECURITIES EXCHANGE ACT OF 1934 |
OR
TRANSITION REPORT PURSUANT TO SECTION 13 OR 15(d) OF THE SECURITIES EXCHANGE ACT OF 1934 |
OR
SHELL COMPANY REPORT PURSUANT TO SECTION 13 OR 15(d) OF THE SECURITIES EXCHANGE ACT OF 1934 |
Commission file number:
(Exact name of Registrant as specified in its charter)
(Jurisdiction of incorporation)
(Address of principal executive offices)
Chief Legal Officer
Grupo Aval Acciones y Valores S.A.
Phone: (
E-mail:
(Name, Telephone, E-mail and/or Facsimile number and Address of Company Contact Person)
Copies to:
Yasin Keshvargar
Phone: (
Securities registered or to be registered pursuant to Section 12(b) of the Act:
Title of each class |
| Name of each exchange on which |
| ||
|
* Grupo Aval Acciones y Valores S.A.’s preferred shares are not listed for trading, but are only listed in connection with the registration of the American Depositary Shares, pursuant to the requirements of the New York Stock Exchange under the trading symbol(s):
Securities registered or to be registered pursuant to Section 12(g) of the Act:
None
Securities for which there is a reporting obligation pursuant to Section 15(d) of the Act:
None
Indicate the number of outstanding shares of each of the issuer’s classes of capital stock or common stock as of the close of business covered by the annual report.
Preferred shares:
Indicate by check mark if the registrant is a well-known seasoned issuer, as defined in Rule 405 of the Securities Act.
⌧
If this report is an annual or transition report, indicate by check mark if the registrant is not required to file reports pursuant to Section 13 or 15(d) of the Securities Exchange Act of 1934.
◻ Yes ⌧
Indicate by check mark whether the registrant (1) has filed all reports required to be filed by Section 13 or 15(d) of the Securities Exchange Act of 1934 during the preceding 12 months (or for such shorter period that the registrant was required to file such reports), and (2) has been subject to such filing requirements for the past 90 days.
⌧
Indicate by check mark whether the registrant has submitted electronically every Interactive Data File required to be submitted pursuant to Rule 405 of Regulation S-T during the preceding 12 months (or for such shorter period that the registrant was required to submit such files).
⌧
Indicate by check mark whether the registrant is a large accelerated filer, an accelerated filer, a non-accelerated filer, or an emerging growth company. See definition of “large accelerated filer,” “accelerated filer,” and “emerging growth company” in Rule 12b-2 of the Exchange Act:
Accelerated filer ◻ | Non-accelerated filer ◻ | Emerging growth company |
If an emerging growth company that prepares its financial statements in accordance with U.S. GAAP, indicate by check mark if the registrant has elected not to use the extended transition period for complying with any new or revised financial accounting standards provided pursuant to Section 13(a) of the Exchange Act. ◻
The term “new or revised financial accounting standard” refers to any update issued by the Financial Accounting Standards Board to its Accounting Standards Codification after April 5, 2012.
Indicate by check mark whether the registrant has filed a report on and attestation to its management’s assessment of the effectiveness of its internal control over financial reporting under Section 404(b) of the Sarbanes-Oxley Act (15 U.S.C. 7262(b)) by the registered public accounting firm that prepared or issued its audit report.
If securities are registered pursuant to Section 12(b) of the Act, indicate by check mark whether the financial statements of the registrant included in the filing reflect the correction of an error to previously issued financial statements: ☐
Indicate by check mark whether any of those error corrections are restatements that required a recovery analysis of incentive-based compensation received by any of the registrant’s executive officers during the relevant recovery period pursuant to §240.10D-1(b) : ☐
Indicate by check mark which basis of accounting the registrant has used to prepare the financial statements included in this filing:
US GAAP ◻ | Other ◻ |
If “Other” has been checked in response to the previous question indicate by check mark which financial statement item the registrant has elected to follow.
◻ Item 17 ◻ Item 18
If this is an annual report, indicate by check mark whether the registrant is a shell company (as defined in Rule 12b-2 of the Exchange Act).
TABLE OF CONTENTS
|
| Page |
|
|
|
1 | ||
5 | ||
ITEM 1. IDENTITY OF DIRECTORS, SENIOR MANAGEMENT AND ADVISERS | 5 | |
5 | ||
5 | ||
5 | ||
5 | ||
5 | ||
5 | ||
5 | ||
5 | ||
10 | ||
10 | ||
10 | ||
35 | ||
35 | ||
37 | ||
90 | ||
90 | ||
91 | ||
91 | ||
91 | ||
141 | ||
146 | ||
146 | ||
148 | ||
149 | ||
149 | ||
153 | ||
153 | ||
155 | ||
156 | ||
Disclosure of a registrant’s action to recover erroneously awarded compensation | 156 | |
156 | ||
156 | ||
157 | ||
160 | ||
160 | ||
160 | ||
161 | ||
161 | ||
161 | ||
161 | ||
161 | ||
162 | ||
163 | ||
163 | ||
i
163 | ||
163 | ||
163 | ||
170 | ||
170 | ||
170 | ||
177 | ||
180 | ||
180 | ||
180 | ||
ITEM 11. QUANTITATIVE AND QUALITATIVE DISCLOSURES ABOUT MARKET RISK | 180 | |
ITEM 12. DESCRIPTION OF SECURITIES OTHER THAN EQUITY SECURITIES | 200 | |
200 | ||
200 | ||
200 | ||
200 | ||
202 | ||
202 | ||
202 | ||
202 | ||
ITEM 14. MATERIAL MODIFICATIONS TO THE RIGHTS OF SECURITY HOLDERS AND USE OF PROCEEDS | 202 | |
202 | ||
202 | ||
202 | ||
202 | ||
202 | ||
202 | ||
202 | ||
Management’s annual report on internal control over financial reporting | 202 | |
203 | ||
203 | ||
203 | ||
203 | ||
203 | ||
203 | ||
ITEM 16D. Exemptions from the listing standards for audit committees | 204 | |
ITEM 16E. Purchases of equity securities by the issuer and affiliated purchasers | 204 | |
204 | ||
204 | ||
206 | ||
207 | ||
207 | ||
207 | ||
207 | ||
ii
PRESENTATION OF FINANCIAL AND OTHER INFORMATION
All references herein to “peso”, “pesos”, or “Ps” refer to the lawful currency of Colombia. All references to “U.S. dollars”, “dollars” or “U.S.$” are to United States dollars. This annual report translates certain Colombian peso amounts into U.S. dollars at specified rates solely for the convenience of the reader. The conversion of amounts expressed in pesos as of a specified date at the then prevailing exchange rate may result in the presentation of U.S. dollar amounts that differ from U.S. dollar amounts that would have been obtained by converting Colombian pesos as of another specified date. Unless otherwise noted in this annual report, all such peso amounts have been translated at the rate of Ps 4,810.20 per U.S.$1.00, which was the representative market rate published on December 31, 2022. The representative market rate is computed and certified by the Superintendency of Finance on a daily basis and represents the weighted average of the buy/sell foreign exchange rates negotiated on the previous day by certain financial institutions authorized to engage in foreign exchange transactions. Such conversion should not be construed as a representation that the peso amounts correspond to, or have been or could be converted into, U.S. dollars at that rate or any other rate. On April 11, 2023 the representative market rate was Ps 4,516.76 per U.S. $1.00.
Definitions
In this annual report, unless otherwise indicated or the context otherwise requires, the terms:
| ● | “BAC Credomatic” or “BAC” means BAC Credomatic Inc. and its consolidated subsidiaries; |
| ● | “Banco AV Villas” means Banco Comercial AV Villas S.A. and its consolidated subsidiary; |
| ● | “Banco de Bogotá” means Banco de Bogotá S.A. and its consolidated subsidiaries; |
| ● | “Banco de Occidente” means Banco de Occidente S.A. and its consolidated subsidiaries; |
| ● | “Banco Popular” means Banco Popular S.A. and its consolidated subsidiaries; |
| ● | “banks” and “our banking subsidiaries” mean Banco de Bogotá S.A., Banco de Occidente S.A., Banco Popular S.A. and Banco Comercial AV Villas S.A., and their respective consolidated subsidiaries; |
| ● | “BHI” means BAC Holding International, Corp. (formerly Leasing Bogotá S.A., Panamá or LB Panamá) and its consolidated subsidiaries; |
| ● | “Corficolombiana” means Corporación Financiera Colombiana S.A. and its consolidated subsidiaries; |
| ● | “Grupo Aval”, “we”, “us”, “our” and “our company” mean Grupo Aval Acciones y Valores S.A. and its consolidated subsidiaries; |
| ● | “Multi Financial Group” or “MFG” means Multi Financial Group Inc. and its consolidated subsidiaries. |
| ● | “Multi Financial Holding” or “MFH” means Multi Financial Holding Inc. and its consolidated subsidiaries. |
| ● | “Porvenir” means Sociedad Administradora de Fondos de Pensiones y Cesantías Porvenir S.A. and its consolidated subsidiary; and |
| ● | “Superintendency of Finance” means the Colombian Superintendency of Finance (Superintendencia Financiera de Colombia), a supervisory authority ascribed to the Colombian Ministry of Finance and Public Credit (Ministerio de Hacienda y Crédito Público), or the “Ministry of Finance”, holding the inspection, supervision and control authority over the individuals or entities involved in financial activities, securities markets, insurance and any other operations related to the management, use or investment of resources collected from the public, as well as inspection and supervision authority over the holding companies of financial conglomerates in Colombia. |
In this annual report, references to “beneficial ownership” are calculated pursuant to the definition ascribed by the U.S. Securities and Exchange Commission, or the “SEC”, of beneficial ownership for foreign private issuers contained in Form 20-F. Form 20-F defines the term “beneficial owner” of securities as referring to any person who, even if not the record owner of the securities, has or shares the underlying benefits of ownership, including the power to direct the voting or the disposition of the securities or to receive the economic benefit of ownership of the securities. A person is also considered to be the “beneficial owner” of securities when such person has the right to acquire within 60 days pursuant to an option or other agreement. Beneficial owners include persons who hold their securities through one
1
or more trustees, brokers, agents, legal representatives or other intermediaries, or through companies in which they have a “controlling interest”, which means the direct or indirect power to direct the management and policies of the entity.
Financial statements
We are a financial holding company and an issuer of securities in Colombia registered with the National Registry of Shares and Issuers (Registro Nacional de Emisores y Valores), and in this capacity, we are subject to inspection and surveillance by the Superintendency of Finance and required to comply with corporate governance and periodic reporting requirements to which all financial holdings and issuers are subject. We are not a financial institution in Colombia and we are not supervised or regulated as a financial institution. Since February 6, 2019, we are subject to the inspection and surveillance of the Superintendency of Finance as the financial holding company of the Aval Financial Conglomerate and we are required to comply with capital adequacy and additional regulations applicable to financial conglomerates. See “Item 4. Information on the Company—B. Business overview—Supervision and regulation”. All of our Colombian financial subsidiaries, including Banco de Bogotá, Banco de Occidente, Banco Popular, Banco AV Villas, Corficolombiana, Porvenir, and their respective financial subsidiaries, are entities under the direct comprehensive supervision of, and subject to inspection and surveillance as financial institutions by, the Superintendency of Finance.
Our consolidated financial statements at December 31, 2022 and 2021 and for the years ended December 31, 2022, 2021, and 2020 are included in this annual report and referred to as our audited consolidated financial statements. Our historical results are not necessarily indicative of results to be expected for future periods. We have prepared the audited consolidated financial statements included herein in accordance with International Financial Reporting Standards (“IFRS”) as issued by the International Accounting Standards Board (“IASB”), which we refer to as “IFRS”.
We and our Colombian subsidiaries prepare consolidated financial statements for publication in Colombia under IFRS as adopted by the Superintendency of Finance in accordance with Decree 1851 of 2013 and 3023 of 2013, as modified by Decrees 2420 and 2496 of 2015, 2131 of 2016, 2170 of 2017, 2483 of 2018, 2270 of 2019, 1432 of 2020, 938 of 2021 and 1611 of 2022.
Separate financial statements for us and our financial subsidiaries in Colombia are based on IFRS issued by the IASB in Spanish as of December 31, 2022 (which we refer to as “Colombian IFRS”), and pursuant to certain requirements under Colombian regulations. As a result, rules subsequently issued by the IASB are not applicable under Colombian IFRS. Our separate financial statements for local purposes, differ from IFRS as issued by the IASB in the following principal aspects:
| ● | Loss allowances are calculated based on specific rules of the Financial and Accounting Basic Circular (Circular Básica Contable y Financiera) issued by the Superintendency of Finance (which is applied in the local separate financial statements), whereas under IFRS, loss allowances are calculated according to the criteria set forth in IFRS 9 beginning on January 1, 2018. |
| ● | Financial instruments under Colombian IFRS are classified and measured under specific rules of the Financial and Accounting Basic Circular, whereas under IFRS, financial instruments are classified and measured according to the criteria set forth in IFRS 9 beginning on January 1, 2018 (with the exception of hedge accounting which is still treated under guidelines set forth in IAS 39). |
| ● | Decrees 2617 of 2022 and 1311 of 2021 allowed recognition of the effects of changes in statutory tax rates on differed tax assets and liabilities either through income tax expense or retained earnings. |
In March 2022, our subsidiary Banco de Bogotá completed the spin-off of 75% of its equity interest in BAC Holding International, Corp., or BHI (formerly Leasing Bogotá S.A., Panamá or LB Panamá), and its consolidated subsidiaries. This represented approximately 51.6% of Grupo Aval’s beneficial ownership interest in BHI and resulted in Grupo Aval’s loss of control of the previously consolidated subsidiary, which was also a standalone operating segment of Grupo Aval. Accordingly, BHI was deconsolidated from Grupo Aval’s consolidated statement of financial position as of March 31, 2022, and BHI’s results of operations for periods prior to the spin-off have been reclassified to discontinued operations in Grupo Aval’s consolidated Statement of income for all periods included in this Annual Report on Form 20-F. In December 2022, Banco de Bogotá sold an additional 20.89% equity interest in BHI (representing approximately 14.4% of Grupo Aval’s then-remaining beneficial ownership interest in BHI) in an unsolicited tender offer by Esadinco S.A. (see “Item 7. Major Shareholders and Related Party Transactions—B. Related party transactions”), which resulted in Grupo Aval losing its significant influence over BHI, and thereafter Grupo Aval’s remaining approximately 2.8% beneficial ownership interest ceased to be accounted for as an investment in associates and was recognized as a financial asset at fair value with changes in OCI (FVOCI). Accordingly, equity method for the period between April and November 2022, during which BHI was accounted for as an equity method investee, has been reclassified to discontinued operations in Grupo Aval’s consolidated Statement of income. In accordance with IFRS, our consolidated Statement of financial position at December 31, 2021, has not been retrospectively adjusted. As a result of the spin-off, we ceased to report BHI as an operating segment. For more information about the impact of the spin-off and subsequent tender offer please refer to “Item 5. Operating and Financial Review and Prospects—A. Operating Results—Principal factors affecting our financial condition and results of operations—Transactions related to BHI – Discontinued operations” and Note 1.1 “Discontinued Operations of BAC Holding” to our audited consolidated financial statements.
2
Ratios and Measures of Financial Performance
We have included in this annual report ratios and measures of financial performance such as return on average assets, or “ROAA”, and return on average equity, or “ROAE”. These measures should not be construed as an alternative to IFRS measures and should not be compared to similarly titled measures reported by other companies, which may evaluate such measures differently from how we do. For ratios and measures of financial performance, see “Item 3. Key Information—A. Selected financial data”.
Market share and other information
We obtained the market and competitive position data, including market forecasts, used throughout this annual report from market research, publicly available information and industry publications. We have presented this data on the basis of information from third-party sources that we believe are reliable, including, among others, the International Monetary Fund, or “IMF”, the Superintendency of Finance, the Colombian Banking Association (Asociación Bancaria y de Entidades Financieras de Colombia) or “Asobancaria”, the Colombian Stock Exchange, the Colombian National Bureau of Statistics (Departamento Administrativo Nacional de Estadística), or “DANE”. Industry and Government publications, including those referenced herein, generally state that the information presented has been obtained from sources believed to be reliable, but that the accuracy and completeness of such information is not guaranteed. Unless otherwise indicated, gross domestic product, or “GDP”, figures with respect to Colombia in this annual report are based on the 2015 base year data series published by DANE. Although we have no reason to believe that any of this information or these reports is inaccurate in any material respect, we have not independently verified the competitive position, market share, market size, market growth or other data provided by third parties or by industry or other publications. We do not make any representation or warranty as to the accuracy of such information.
Our consolidated statement of financial position and statement of income reflect information prepared under IFRS. Comparative disclosures of financial and operating performance of our Colombian banking subsidiaries, Corficolombiana, Porvenir and that of our competitors are based on separate information prepared under Colombian IFRS as reported to the Superintendency of Finance. These separate financial statements under Colombian IFRS do not reflect the consolidation of subsidiaries such as Corficolombiana, Porvenir or MFH, among others, are not intended to reflect the consolidated financial results of Grupo Aval and are not necessarily indicative of the results for any other future period. We include certain ratios in this annual report to compare us to our principal competitors, such as ROAA, ROAE, operational efficiency and asset quality indicators, among others.
“Grupo Aval aggregate” data reflects the sum of the separate financial statements of our four Colombian banking subsidiaries (Banco de Bogotá, Banco de Occidente, Banco Popular and Banco AV Villas) as reported to the Superintendency of Finance under Colombian IFRS.
Other conventions
Certain figures included in this annual report have been subject to rounding adjustments. Accordingly, figures shown as totals in certain tables may not be an arithmetic summation of the figures that precede them. As such, percentage calculations presented may differ from those of rounded numbers. References to “billions” in this annual report are to 1,000,000,000 and to “trillions” are to 1,000,000,000,000.
“Non-controlling interest” refers to the participation of minority shareholders in a subsidiary’s equity or net income, as applicable.
FORWARD-LOOKING STATEMENTS
Some of the matters discussed in this annual report concerning our operations and financial performance include estimates and forward-looking statements within the meaning of the Private Securities Litigation Reform Act of 1995 “Reform Act” including such statements contained in “Item 3. Key Information—D. Risk factors”, “Item 4. Information on the Company—B. Business overview” and “Item 5. Operating and Financial Review and Prospects”.
Our estimates and forward-looking statements are mainly based on our current expectations and estimates on projections of future events and trends, which affect or may affect our businesses and results of operations. Although we believe that these estimates and forward-looking statements are based upon reasonable assumptions, they are subject to several risks and uncertainties and are made in light of information currently available to us. Our estimates and forward-looking statements may be influenced by the following factors, among others:
| ● | changes in Colombian, regional and international business and economic, political or other conditions; |
| ● | developments affecting Colombian and international capital and financial markets; |
| ● | Government regulation and tax matters and developments affecting our company and industry; |
3
| ● | declines in the oil and affiliated services sector in the Colombian and global economies; |
| ● | increases in defaults by our customers; |
| ● | increases in goodwill impairment losses, or other impairments; |
| ● | decreases in deposits, customer loss or revenue loss; |
| ● | increases in allowances for contingent liabilities; |
| ● | our ability to sustain or improve our financial performance; |
| ● | increases in inflation rates, particularly in Colombia; |
| ● | the level of penetration of financial products and credit in Colombia; |
| ● | changes in interest rates which may, among other effects, adversely affect margins and the valuation of our treasury portfolio; |
| ● | decreases in the spread between investment yields and implied interest rates in annuities; |
| ● | movements in exchange rates; |
| ● | competition in the banking and financial services, credit card services, insurance, asset management, pension fund administration and related industries; |
| ● | adequacy of risk management procedures and credit, market and other risks of lending and investment activities; |
| ● | decreases in the level of capitalization of our subsidiaries; |
| ● | changes in market values of Colombian, particularly Colombian Government securities; |
| ● | adverse legal or regulatory disputes or proceedings; |
| ● | successful integration and future performance of acquired businesses or assets; |
| ● | natural disasters, public health crises or internal security issues affecting countries where we operate; |
| ● | loss of any key member of our senior management; and |
| ● | other risk factors as set forth under “Item 3. Key Information—D. Risk factors”. |
The words “believe”, “may”, “will”, “estimate”, “continue”, “anticipate”, “intend”, “expect”, “should”, “could”, “would”, “plan”, “predict”, “potential” and similar words are intended to identify estimates and forward-looking statements. All statements addressing our future operating performance, and statements addressing events and developments that we expect or anticipate will occur in the future, are forward-looking statements within the meaning of the Reform Act. Estimates and forward-looking statements are intended to be valid only at the date they were made, and we undertake no obligation to update or to review any estimate and/or forward-looking statement because of new information, future events or other factors. Estimates and forward-looking statements involve risks and uncertainties and are not guarantees of future performance. Our future results may differ materially from those expressed in these estimates and forward-looking statements. In light of the risks and uncertainties described above, the estimates and forward-looking statements discussed in this annual report might not occur and our future results and our performance may differ materially from those expressed in these forward-looking statements due to the factors mentioned above, among others. Because of these uncertainties, you should not make any investment decision based on these estimates and forward-looking statements.
These cautionary statements should be considered in connection with any written or oral forward-looking statements that we may issue in the future.
4
PART I
ITEM 1. IDENTITY OF DIRECTORS, SENIOR MANAGEMENT AND ADVISERS
A. Directors and senior management
Not applicable.
B. Advisers
Not applicable.
C. Auditors
Not applicable.
ITEM 2. OFFER STATISTICS AND EXPECTED TIMETABLE
A. Offer statistics
Not applicable.
B. Method and expected timetable
Not applicable.
ITEM 3. KEY INFORMATION
A. Selected financial data
The following financial data of Grupo Aval at December 31, 2022 and 2021 and for the years ended December 31, 2022, 2021 and 2020 have been derived from our audited consolidated financial statements prepared in accordance with IFRS, included in this report. Our historical results are not necessarily indicative of results to be expected for future periods.
This financial data should be read in conjunction with our audited consolidated financial statements and the related notes, “Presentation of financial and other information” and “Item 5. Operating and Financial Review and Prospects” included in this annual report.
5
Statement of income data
IFRS
2022 |
| 2021 |
| 2020 | |
(in Ps billions, except share and per share data) | |||||
Total interest income | 19,403.0 | 12,791.4 | 13,216.1 | ||
Total interest expense | (11,664.4) | (4,660.8) | (5,801.6) | ||
Net interest income | 7,738.6 | 8,130.6 | 7,414.5 | ||
Impairment loss on loans and other accounts receivable | (3,120.4) | (3,192.3) | (4,592.1) | ||
Impairment (loss) recovery on other financial assets | (16.7) | (0.7) | (16.8) | ||
Recovery of charged-off financial assets | 644.0 | 471.9 | 328.1 | ||
Net impairment loss on financial assets | (2,493.1) | (2,721.1) | (4,280.9) | ||
Net interest income, after impairment losses | 5,245.5 | 5,409.5 | 3,133.6 | ||
Net income from commissions and fees | 2,903.8 | 3,064.2 | 2,811.5 | ||
Gross profit from sales of goods and services | 4,545.1 | 3,098.9 | 2,823.3 | ||
Net trading income | 1,559.6 | 922.3 | 1,288.1 | ||
Net income from other financial instruments mandatorily at fair value through profit or loss | 278.8 | 270.1 | 252.4 | ||
Other income | (848.6) | 389.7 | 857.2 | ||
Other expenses | (7,409.8) | (6,790.1) | (6,324.2) | ||
Net income before tax expense | 6,274.4 | 6,364.6 | 4,841.9 | ||
Income tax expense | (2,271.4) | (2,323.4) | (1,360.1) | ||
Net income for the year from continuing operations | 4,003.0 | 4,041.2 | 3,481.8 | ||
Net income for the year from discontinued operations | 866.2 | 1,627.3 | 1,149.8 | ||
Net income for the year | 4,869.1 | 5,668.5 | 4,631.6 | ||
Net income for the year attributable to: | |||||
From continuing operations | 1,888.9 | 2,179.2 | 1,559.2 | ||
From discontinued operations | 594.0 | 1,118.6 | 790.3 | ||
Owners of the parent | 2,482.9 | 3,297.7 | 2,349.5 | ||
From continuing operations | 2,114.1 | 1,862.0 | 1,922.6 | ||
From discontinued operations | 272.2 | 508.8 | 359.5 | ||
Non-controlling interest | 2,386.2 | 2,370.8 | 2,282.1 | ||
Net income for the year | 4,869.1 | 5,668.5 | 4,631.6 | ||
Earnings per 1,000 shares (basic and diluted earnings): |
|
|
|
|
|
Common shares (in pesos) | 107,287.0 |
| 148,006.5 |
| 105,449.5 |
Earnings per 1,000 shares (basic and diluted earnings): |
|
|
|
|
|
Preferred shares (in pesos) | 107,287.0 |
| 148,006.5 |
| 105,449.5 |
Dividends per 1,000 shares: |
|
|
|
|
|
Common and preferred shares (in pesos) | 43,200.0 |
| 54,000.0 |
| 54,000.0 |
Weighted average number of shares: |
|
|
|
|
|
Outstanding common shares in thousands | 15,760,496.8 | 15,128,947.7 | 15,158,004.8 | ||
Outstanding preferred shares in thousands | 7,381,968.6 | 7,152,069.5 | 7,123,012.3 | ||
Outstanding common and preferred shares in thousands | 23,142,465.4 | 22,281,017.2 | 22,281,017.2 | ||
6
Statement of financial position data
Grupo Aval | |||
At December 31, | |||
2022 |
| 2021 | |
(in Ps billions) | |||
Assets: |
|
|
|
Cash and cash equivalents | 17,032.9 | 36,642.8 | |
Trading assets | 11,841.4 | 10,986.8 | |
Investment securities | 33,674.5 | 44,664.4 | |
Hedging derivative assets | 20.9 | 44.2 | |
Total loans, net | 179,115.8 | 220,297.8 | |
Other accounts receivables, net | 23,380.6 | 19,027.2 | |
Non-current assets held for sale | 92.8 | 208.4 | |
Investments in associates and joint ventures | 1,423.3 | 1,172.8 | |
Tangible assets | 7,235.4 | 9,100.6 | |
Concession arrangement rights | 13,242.7 | 11,098.1 | |
Goodwill | 2,248.2 | 8,486.6 | |
Other intangible assets | 2,040.2 | 1,886.0 | |
Income tax assets | 3,633.9 | 2,607.7 | |
Other assets | 608.6 | 680.5 | |
Total assets | 295,591.2 |
| 366,903.9 |
Liabilities: |
|
|
|
Trading liabilities | 1,757.6 | 1,049.9 | |
Hedging derivatives liabilities | 3.6 | 55.8 | |
Customer deposits | 173,341.1 | 234,470.4 | |
Interbank borrowings and overnight funds | 9,087.9 | 10,672.4 | |
Borrowings from banks and others | 30,309.4 | 27,124.7 | |
Bonds issued | 28,362.2 | 32,257.9 | |
Borrowings from development entities | 4,357.3 | 3,227.3 | |
Provisions | 1,227.2 | 1,150.3 | |
Income tax liabilities | 5,291.5 | 4,714.7 | |
Employee benefits | 890.0 | 1,163.1 | |
Other liabilities | 10,141.8 | 11,545.8 | |
Total liabilities | 264,769.6 |
| 327,432.3 |
Equity: |
|
|
|
Attributable to the owners of the parent |
|
|
|
Subscribed and paid-in capital | 23.7 | 22.3 | |
Additional paid-in capital | 9,571.4 | 8,490.8 | |
Retained earnings | 8,018.4 | 13,383.4 | |
Other comprehensive income | (1,146.6) | 1,117.2 | |
Equity attributable to owners of the parent | 16,467.0 |
| 23,013.7 |
Non-controlling interest | 14,354.7 | 16,458.0 | |
Total equity | 30,821.7 |
| 39,471.6 |
Total liabilities and equity | 295,591.2 |
| 366,903.9 |
7
Other financial and operating data
Grupo Aval |
| ||||
At and for the year ended December 31, |
| ||||
| 2022 |
| 2021(1) |
| |
(in percentages, unless otherwise |
| ||||
indicated) |
| ||||
Profitability ratios: |
|
|
|
| |
Net interest margin(2) |
| 3.8% | 4.5% | ||
Net interest margin including trading investment income(2) | 3.7% | 4.4% | |||
ROAA(3) |
| 1.6% | 1.6% | ||
ROAE(4) |
| 14.0% | 15.3% | ||
Efficiency ratios(5): |
| ||||
Cost to income | 45.8% | 42.8% | |||
Cost to assets | 2.7% | 2.8% | |||
Capital ratios: |
|
|
| ||
Period-end equity as a percentage of period-end total assets |
| 10.4% | 10.8% | ||
Tangible equity ratio(6) |
| 9.1% | 8.2% | ||
Credit quality data: |
|
|
| ||
Cost of risk: Impairment loss on loans and other accounts receivable / average gross loans(7) | 1.9% | 2.2% | |||
Cost of risk, net: Impairment loss on loans and other accounts receivable, net / average gross loans(7)(8) | 1.5% | 1.8% | |||
Charge-offs as a percentage of average gross loans(7) |
| 1.9% | 2.4% | ||
Loans past due more than 30 days / gross loans(7) |
| 4.3% | 4.7% | ||
Loans past due more than 90 days / gross loans(7) |
| 3.3% | 3.6% | ||
Loans classified as Stage 2 / gross loans(7) | 6.5% | 11.3% | |||
Loans classified as Stage 3 / gross loans(7) | 6.4% | 7.1% | |||
Loans classified as Stage 2 and Stage 3 / gross loans(7) | 12.8% | 18.3% | |||
Loss allowance as a percentage of loans past due more than 30 days |
| 116.1% | 121.1% | ||
Loss allowance as a percentage of loans past due more than 90 days |
| 155.0% | 155.2% | ||
Loss allowance for Stage 2 loans as a percentage of Stage 2 loans(7) | 12.1% | 9.9% | |||
Loss allowance for Stage 3 loans as a percentage of Stage 3 loans(7) | 54.0% | 53.1% | |||
Loss allowance for Stage 2 and Stage 3 loans as a percentage of Stage 2 and Stage 3 loans(7) | 32.9% | 26.6% | |||
Loss allowance as a percentage of gross loans(7) |
| 5.0% | 5.6% | ||
Operational data (in units): |
|
|
| ||
Number of customers of the banks(9) |
| 14,901,128 |
| 14,014,540 | |
Number of employees(10) |
| 77,043 |
| 83,146 | |
Number of branches(11) |
| 1,124 |
| 1,193 | |
Number of ATMs(11) |
| 3,174 |
| 3,361 | |
| (1) | In March, 2022, Banco de Bogotá completed the spin-off of 75% of its equity interest in BHI resulting in the loss of control of the previously consolidated subsidiary. Income statement information presented under financial and operating data refers to continuing operations unless otherwise noted. In accordance with IFRS, our consolidated statement of financial position prior to December 31, 2021, has not been retrospectively adjusted. For more information on the spin-off, see “Item 5. Operating and Financial Review and Prospects—A. Operating Results—Principal factors affecting our financial condition and results of operations—Transactions related to BHI – Discontinued operations” and Note 1.1 “Discontinued Operations of BAC Holding” to our audited consolidated financial statements. |
| (2) | Net interest margin is calculated as net interest income divided by total average interest-earning assets of continuing operations. Average interest-earning assets for 2022 and 2021 are calculated as the sum of interest-earning assets for continuing operations at each quarter-end during the applicable year and the prior year end divided by five. |
| (3) | For the years ended December 31, 2022 and 2021, ROAA is calculated as net income divided by consolidated average assets. Consolidated average assets for 2022 and 2021 are calculated as the sum of consolidated assets at each quarter-end during the applicable year and the prior year end divided by five. |
| (4) | For the years ended December 31, 2022 and 2021, ROAE is calculated as net income attributable to owners of the parent divided by consolidated average equity attributable to owners of the parent. Consolidated average equity attributable to owners of the parent for 2022 and 2021 is calculated as the sum of consolidated equity attributable to owners of the parent at each quarter-end during the applicable year end and the prior year end divided by five. |
8
| (5) | Our cost to income ratio is calculated as Other Expenses (see Note 30 of our audited consolidated financial statements), divided by total income before net impairment losses on financial assets (defined as the sum of net interest income, net income from commissions and fees, gross profit (loss) from sales of goods and services, net trading income, net income from other financial instruments mandatorily at fair value through profit or loss “FVTPL” and other income). Our cost to assets ratio is calculated as Other expenses divided by average assets of continuing operations. |
| (6) | Tangible equity ratio is calculated as total equity minus intangible assets (calculated as goodwill plus other intangible assets, excluding those related to concession arrangements rights, Ps 13,242.7 billion in 2022 and Ps 11,098.1 billion in 2021) divided by total assets minus intangible assets (as defined before). |
| (7) | Gross loans for continuing operations exclude interbank and overnight funds of continuing operations (Ps 5,967.7 billion in 2022 and Ps 3,218.4 billion in 2021) as these are short-term liquidity operations generally not subject to deterioration. Total gross loan portfolio includes Interbank and overnight funds. Throughout this document charge-offs and write-offs refer to the same concept. |
| (8) | Impairment (loss) on loans and other accounts receivable, net refers to Impairment (loss) on loans and other accounts receivable minus Recovery of charged-off financial assets. |
| (9) | Reflects aggregated customers of our banking subsidiaries. Customers of more than one of our Colombian banking subsidiaries and MFG are counted separately for each banking subsidiary. |
| (10) | Number of employees of continuing operations is defined as the sum of direct, temporary and outsourced personnel in financial entities (45,122 in 2022 and 45,954 in 2021), call-centers (7,840 in 2022 and 8,560 in 2021) and employees of non-financial entities of Corficolombiana (24,081 in 2022 and 29,851 in 2021). |
| (11) | Reflects aggregated number of full-service branches or ATMs of our Colombian banking subsidiaries and MFG, as applicable, located throughout Colombia and Panama. |
Ratios and Measures of Financial Performance
The tables in this section, and elsewhere in this annual report, provide the calculation of certain ratios and measures of financial performance, which are used by our management to analyze the evolution and results of our company. Some of the ratios and measures of financial performance presented by us are either non-IFRS or use non-IFRS inputs. This non-IFRS information should not be construed as an alternative to IFRS measures. The ratios and measures of financial performance as determined and measured by us should not be compared to similarly titled measures reported by other companies as other companies may calculate and report such measures differently.
ROAA and ROAE
ROAA, which is calculated as net income divided by consolidated average assets, provides a measure of return on assets. ROAE, which is calculated as net income attributable to owners of the parent, divided by consolidated average equity attributable to owners of the parent, provides a measure of the total return generated from our company and our subsidiaries for shareholders. Net income attributable to non-controlling interest divided by net income, provides an indication of non-controlling interest ownership of Grupo Aval’s consolidated subsidiaries net income; where a higher ratio typically implies that higher net income was generated in subsidiaries in which Grupo Aval has lower ownerships and vice versa.
9
The following table sets forth ROAA, ROAE and Net income attributable to non-controlling interest divided by net income for Grupo Aval for the indicated years.
Year ended December 31, |
| ||||||
| 2022 |
| 2021 |
| 2020 |
| |
(in Ps billions, except percentages) |
| ||||||
Grupo Aval (consolidated): |
|
|
|
| |||
Average assets(1) |
| 297,125.3 |
| 344,533.7 |
| 317,797.0 | |
Average equity attributable to owners of the parent(2) |
| 17,779.5 |
| 21,568.3 |
| 20,146.5 | |
Net income |
| 4,869.1 |
| 5,668.5 |
| 4,631.6 | |
Net income attributable to owners of the parent |
| 2,482.9 |
| 3,297.7 |
| 2,349.5 | |
Net income attributable to non-controlling interest |
| 2,386.2 |
| 2,370.8 |
| 2,282.1 | |
ROAA(1) |
| 1.6% | 1.6% | 1.5% | |||
ROAE(2) |
| 14.0% | 15.3% | 11.7% | |||
Net income attributable to non-controlling interest divided by net income |
| 49.0% | 41.8% | 49.3% | |||
| (1) | For methodology used to calculate Average assets and ROAA, see note (2) to the table under “Item 3. Key Information—A. Selected financial data—Other financial and operating data”. |
| (2) | For methodology used to calculate Average equity attributable to owners of the parent and ROAE, see note (3) to the table under “Item 3. Key Information—A. Selected financial data—Other financial and operating data”. |
B. Capitalization and indebtedness
Not applicable.
C. Reasons for the offer and use of proceeds
Not applicable.
D. Risk factors
Our business, financial condition and results of operations could be materially and adversely affected if any of the risks described below occur. In such an event, the market price of our preferred shares or our American Depositary Shares, or ADSs, could decline, and you could lose all or part of your investment. We may face additional risks and uncertainties that are not presently known to us, or that we currently deem immaterial, which may also impair our business.
Summary
The following summarizes some, but not all, of the risks provided below. Please carefully consider all of the information discussed in this Item 3.D. “Risk Factors” in this annual report for a more thorough description of these and other risks:
| ● | Risks relating to Colombia and other countries in which we operate: |
| o | we are exposed to adverse economic, political and social conditions in Colombia and other countries in which we operate, including variations in the exchange rates or downgrades in credit ratings of sovereign debt securities; |
| o | we are exposed to the vulnerability to external shocks of the Colombian economy; |
| o | we are exposed to internal security issues that have had or could have a negative effect on the Colombian economy; |
| o | we are exposed to political and economic instability in the region and in Eastern Europe; |
| o | we are exposed to changes in Government policies and actions, as well as judicial decisions that could significantly affect the local economy; |
| o | we are exposed to legal claims about violations of anti-corruption laws and other laws in the jurisdictions in which we operate; |
| o | we are exposed to risks related to our partaking in government enforcement actions and/or ongoing governmental investigations; |
| o | we are exposed to changes in tax regulations or the interpretation thereof that could result in new or higher taxes as well as Colombian tax haven regulations; |
| o | we are exposed to natural disasters, acts of war or terrorism, rioting or other external events; and |
| o | we are exposed to risks related to global climate change and environmental requirements; |
10
| ● | Risks relating to our businesses and industry |
| o | Risks relating to our banking business |
| ◾ | we are exposed to a deterioration in asset quality, including the loan portfolios of our banking subsidiaries; |
| ◾ | we are exposed to the inability of our banking subsidiaries to realize on collateral or guarantees of secured loans; |
| ◾ | we are exposed to limitations on the ability of our banking subsidiaries to collect on monetary obligations and enforce rights against collateral or under guarantees imposed by Colombian insolvency laws; |
| ◾ | we are exposed to failures of our risk management processes, including credit and market risk; |
| ◾ | we are exposed to declines in the value of our banks’ sovereign debt portfolios and other investments; |
| ◾ | we are exposed to counterparty risk; |
| ◾ | we are exposed to market and operational risks associated with derivatives transactions; |
| ◾ | we are exposed to liquidity risk; |
| ◾ | we are exposed to defaults by one or more of our largest borrowers; |
| ◾ | we are exposed to downgrades in our long-term credit ratings or in the credit ratings of our banking subsidiaries; |
| ◾ | we are exposed to prepayment risk; |
| ◾ | we are exposed to high competition in the credit card industry; |
| ◾ | we are exposed to changes in banking and financial services laws and regulations in Colombia and the other countries in which we operate; |
| ◾ | we are exposed to changes in accounting standards; |
| ◾ | we are exposed to regulatory actions that may result in fines, penalties or restrictions; |
| ◾ | we are exposed to legal and other challenges to maximize revenue from credit card fees and other fees from customer; |
| ◾ | we are exposed to the failure to protect personal information; and |
| ◾ | we are exposed to instability in global or local banking and financial systems. |
| o | Risks relating to our merchant banking business |
| ◾ | we are exposed to difficult market conditions that could affect Corficolombiana; |
| ◾ | we are exposed to risks related to our due diligence process not being able to identify all risks or ensure investment returns; |
| ◾ | we are exposed to Corficolombiana’s inability to realize profits from relatively illiquid assets, which represent a significant part of its investments; |
| ◾ | we are exposed to risks derived from Corficolombiana holding minority interest in other companies; |
| ◾ | we are exposed to not being able to access financing for new investment projects |
| ◾ | we are exposed to the concentration of Corficolombiana’s investments in five industries; and |
| ◾ | we are exposed to a variety of other issues outside of our control. |
| o | Risks relating our pension and severance fund management business |
| ◾ | we are exposed to risks derived from the highly regulated market in which Porvenir operates; and |
| ◾ | we are exposed to risks derived from the management of a significant amount of debt securities in pension and severance funds issued or guaranteed by the Colombian Government. |
| o | Other risks relating to our businesses |
| ◾ | we are exposed to fluctuations in interest rates and other market risks; |
| ◾ | we are exposed to our inability to effectively manage risks associated with the replacement of benchmark indices; |
| ◾ | we are exposed to fluctuations between the value of the Colombian peso and the U.S. dollar; |
| ◾ | we are exposed trading risks with respect to our trading activities; |
| ◾ | we are exposed to limitations on interest rates; |
| ◾ | we are exposed to limitations on the ability of residents to obtain loans denominated in foreign currency; |
| ◾ | we are exposed to constitutional actions, class actions and other legal actions involving claims for significant monetary awards against financial institutions; |
| ◾ | we are exposed to risks derived from acquisitions and strategic partnerships not performing in accordance with expectations, failing to receive required regulatory approvals or disrupting our operations; |
| ◾ | we are exposed to risks derived from our inability to manage our growth successfully; |
| ◾ | we are exposed to operational risks; |
| ◾ | we are exposed to risks derived from the failure of our information systems; |
| ◾ | we are exposed to cybersecurity threats; |
11
| ◾ | we are exposed to risks derived from our inability to detect money laundering and other illegal or improper activities fully or on a timely basis; |
| ◾ | we are exposed to competition and consolidation in the Colombian banking and financial industry; |
| ◾ | we are exposed to risks derived from our dependency on our senior management and Board of Directors; |
| ◾ | we are exposed to reputational risk; and |
| ◾ | we are exposed to risks derived from conflicting interests between our controlling shareholder and other common, preferred shareholders and ADS holders. |
| ● | Risks relating to our preferred shares and ADSs |
| o | we are exposed to exchange rate volatility; |
| o | we are exposed to restrictions on purchases of our preferred shares; |
| o | we are exposed to risks derived from the relative illiquidity of the Colombian securities markets; |
| o | we are exposed to risks derived from our inability to continue to develop or maintain an active market for our preferred shares and ADSs; |
| o | we are subject to different corporate rules and regulations than those available in other jurisdictions which may make it more difficult to holders of ADSs and underlying preferred shares to protect their interests; |
| o | we are subject to limitations imposed by Colombian law on our ability to pay dividends on the ADSs or underlying preferred shares; |
| o | holders of ADSs may encounter difficulties in the exercise of dividend rights and in the limited voting rights of our preferred shares; |
| o | our status as a foreign private issuer allows us to follow alternate standards to the corporate governance standards of the NYSE; |
| o | preemptive rights may not be available to holders of preferred shares or ADSs; |
| o | our ability to make payments on the ADSs may be adversely affected if we become unable to convert Colombian pesos to U.S. dollars or to transfer U.S. dollars abroad; |
| o | we are exposed to price variations as a result of being traded on more than one market; |
| o | if holders of ADSs surrender their ADSs and withdraw preferred shares, they may face adverse Colombian tax consequences; |
| o | banking regulations, accounting standards and corporate disclosure applicable to us differ from those in the United States and other countries; |
| o | judgments of Colombian courts with respect to our preferred shares will be payable only in pesos; and |
| o | U.S. investors in our preferred shares or the ADSs may find it difficult or impossible to enforce service of process and enforcement of judgments against us and our officers and directors. |
Risks relating to Colombia and other countries in which we operate
Adverse economic, political and social conditions in Colombia and other countries where we operate, including variations in the exchange rates or downgrades in credit ratings of sovereign debt securities, may have an adverse effect on our results of operations and financial condition.
Our principal subsidiaries in Colombia are financial institutions (four commercial banks, a pension and severance fund administrator and a merchant bank), and the majority of our operations, properties and customers are located in Colombia. As a consequence, our results of operations and financial condition are materially affected by economic, political and social conditions in Colombia.
Colombia is subject to economic, political and other uncertainties, including changes in monetary, exchange control and trade policies that could affect the overall business environment in Colombia, which would, in turn, affect our results of operations and financial condition. As depicted under “Item 5. Operating and Financial Review and Prospects—A. Operating Results— Principal factors affecting our financial condition and results of operations”, the current monetary policy implemented by the Central Bank of Colombia (the “Colombian Central Bank” or “Central Bank”), has resulted in sharp subsequent increases of the benchmark interest rates, the impact of which we are sometimes unable to immediately or fully pass through to our customers, which has negatively affected net interest income on our retail loan portfolios and could pressure asset quality as it affects our borrowers’ payment capacity under a macroeconomic context of lower economic activity and high inflation. Exchange rate volatility could also negatively affect the foreign currency positions of our borrowers, or our subsidiaries’ solvency, liquidity or profitability. Due to the fact that a large percentage of the costs and expenses of our subsidiaries is fixed, and that the speed at which changes in interest rates charged to our customers can be adjusted may differ from that at which our cost of funds may vary, we may not be able to reduce costs and expenses or transfer an increase in our costs to our customers while the occurrences of any of these events adversely affect the Colombian economy, in which case our profitability could be further adversely affected.
12
In the case of our pension and severance fund management business, economic conditions may affect the businesses and financial capacity of employers, which may result in a reduction in employee-contributor head counts or decrease the ability of employers to create new jobs or increase employee incomes and could reduce returns on stabilization reserves (see Item 4. Information on the Company—B. Business overview—Supervision and regulation—Pension and Severance Fund Management) and/or performance-based fees.
Furthermore, the implementation of certain public policies may result in social unrest reflected in protests, vandalism or strikes against such policies. Similarly, amidst these protests, participants may attack and cause damages to some of our banks’ branches, as well as block access to some of the offices of our entities, or cause disruptions to the mobility of our employees, preventing us from developing our business during those periods and cause temporary economic disruptions in our business.
As stated above, the political, economic and social environments are affected by many different factors, including significant governmental influence over local economies, substantial fluctuations in economic growth, high levels of inflation, exchange rate movements, exchange controls or restrictions on expatriation of earnings, high domestic interest rates, civil strife, political instability, drug trafficking and other forms of organized crime, wage and price controls, changes in tax policies, imposition of trade barriers, changes in the prices of commodities and unexpected changes in regulation.
Adverse economic, political and social developments, including allegations of corruption against the Colombian Government or Colombian corporations, may adversely affect demand for financial services and create uncertainty regarding our operating environment, which could have a material adverse effect on our subsidiaries and, consequently, on our company.
The Colombian economy remains vulnerable to external shocks.
Despite showing stronger economic growth in 2022 when compared to other countries in the region, the Colombian economy is expected to slow down as a result of high inflation levels, high interest rates, reduced consumer confidence and uncertainty from foreign investors due to the current socioeconomic situation. Exports are expected to continue to grow, albeit at a slower pace, benefiting mainly from expected improvements in the region's competitiveness and the demand for non-Russian oil by developed countries.
The conflict between Ukraine and Russia has had direct and indirect impacts on the Colombian economy. The increase in oil prices has positively impacted the country’s trade balance, improving the inflow of foreign currency to the Government and companies in the oil sector. On the other hand disruptions arising from the conflict have caused increases in the prices of agro-industrial inputs which have been passed through to food prices and ultimately reflected on inflation. Current government policies promoting a transition to renewable energy sources may adversely affect the country’s oil sector and economic growth prospects.
International monetary policies have also had a significant impact on local interest rate decisions, increasing the cost of acquiring new financial products. These factors pose challenges to the country's economic growth, and could directly and materially impact the performance of our entities in terms of growth and financial risk.
Colombia has experienced and continues to experience internal security issues that have had or could have a negative effect on the Colombian economy.
Colombia has experienced internal security issues, primarily due to the activities of paramilitary and guerrilla groups, such as the National Liberation Army (Ejército de Liberación Nacional), or “ELN”, urban militias, former members of the Revolutionary Armed Forces of Colombia (Disidencias de las Fuerzas Armadas Revolucionarias de Colombia), or “FARC”, and of drug cartels. These groups have exerted influence over the local population and funded their activities by protecting and rendering services to drug traffickers. Any breakdown in peace, renewed or continuing drug-related crime or guerilla and paramilitary activities may have a negative impact on the Colombian economy in the future. Our business or financial condition could be adversely affected by rapidly changing economic or social conditions, including any peace negotiation with guerilla, paramilitary or other groups, which may result in legislation that increases our tax burden, or that of other Colombian companies, which could, in turn, impact the overall economy.
The Colombian Government, under the authority granted by Congress under the Total Peace Law (“Ley de Paz Total”), is proposing to cease hostilities between the Colombian Army and various illegal groups, and has started negotiating several peace agreements with illegal groups, including various drug trafficking organizations, such as the “Clan del Golfo” group. The outcome of such negotiations is uncertain and even if peace agreements are successfully concluded, they could adversely affect the Colombian economy and social stability to the extent they result in the continuing operation of such illegal groups.
13
Political and economic instability in the region and in Eastern Europe may affect the Colombian economy and, consequently, our results of operations and financial condition.
Some of Colombia’s neighboring countries, particularly Venezuela, have experienced and continue to experience periods of political and economic instability. A significant number of Venezuelans have emigrated amid food and medicine shortages and profound political divisions in their country and a relevant portion of those migrants have opted to live in Colombia. Providing migrants with access to healthcare, utilities and education may have a negative impact on Colombia’s economy.
Moreover, diplomatic relations with neighboring countries have from time to time been tense and affected by events surrounding the Colombian military forces’ confrontations with guerrilla groups, particularly on Colombia’s borders with Venezuela.
For example, in 2022, the Republic of Perú fell into political instability after the Peruvian Congress removed President Pedro Castillo from office, which led to diplomatic protests, including from the Colombian Foreign Ministry, and, ultimately, a breakdown in diplomatic relations between the two countries.
We have been exposed to uncertainty in agricultural business as a result of the armed conflict taking place in Eastern Europe. A significant number of companies, which develop agribusiness in Colombia, use fertilizers that come from that region and have experienced raw material price increases in their production. On account of the commercial sanctions imposed by the United States and other countries against Russia, this sector of the Colombian economy experienced increases in the prices of fertilizers and restrictions on doing business with suppliers that are established in that part of the world. We are continuously monitoring variations and shocks in the prices of products that are related to our customers and production in the agricultural business, which could be materially adversely affected by these fluctuations. Likewise, the aforementioned sanctions and the progressive removal of gasoline subsidies, in Colombia may result in additional increases in fuel prices and inflation rates as a result of higher transportation costs.
Political conditions such as changes in the U.S. policies related to immigration and remittances, could affect the countries in which we operate. Economic conditions in the United States and the region are being impacted by inflation and recent benchmark rate increases by the Federal Reserve which could have an indirect adverse effect on the Colombian economy.
Changes in Government policies and actions, as well as judicial decisions, could significantly affect the local economy and, as a result, our results of operations and financial condition.
Our results of operations and financial condition may be adversely affected by changes in governmental policies and actions, and judicial decisions, involving a broad range of matters, including interest rates, fees, exchange rates, exchange controls, inflation rates, taxation, banking and pension fund regulations and other political or economic developments affecting Colombia.
Colombian governments have historically exercised substantial influence over their economies, and their policies are likely to continue to have a significant effect on companies, including us.
Moreover, regulatory uncertainty, public dialogue on reforms in Colombia and other countries where we operate, or the approval of reforms, may be disruptive to our business or the economy and may result in a material and adverse effect on our financial condition and results of operations.
The 2022 elections in Colombia resulted in a change of government and ideological orientation in economic policy. The new Government proposes to pass changes, in the Colombian Congress, to the framework of laws related to healthcare, taxes, private sector participation and prices in sectors such as utilities, energy and gas transportation, toll road concessions, pension funds and labor. Such changes could result in variations including new compliance obligations and higher costs, with respect of our operations and higher taxation, with potentially adverse outcomes for our clients’ income and for our profitability and growth prospects.
We and our subsidiaries are subject to anti-corruption laws and other laws in the jurisdictions in which we operate and violation of these regulations could harm our business.
We and our subsidiaries are subject to numerous, and sometimes conflicting, legal regimes on matters as diverse as anti-corruption, taxation, internal control and disclosure obligations, securities and derivatives regulation, anti-competition regulations, data privacy and labor relations. Compliance with diverse legal requirements is costly, time-consuming and requires significant resources. Violations of one or more of these regulations in the conduct of our business or the business of our subsidiaries could result in significant fines, criminal sanctions against us or our officers, prohibitions on doing business and damage to our reputation. Violations of these laws or regulations in connection with the performance of our obligations to our customers, as well as in connection with the performance of our subsidiaries’ obligations, could also result in liability for significant monetary damages, fines or criminal prosecution, unfavorable publicity and other reputational damage, restrictions on our ability to process information and allegations by our customers that we have not performed our contractual
14
obligations. Because of the varying degrees of development of the legal systems of the countries in which we operate, local laws might be insufficient to protect our rights due in part to a lack of multiple recourses and/or deficiencies in the access to justice.
Our employees, and joint venture partners, or other third parties with which we associate, could take actions that violate policies or procedures designed to promote legal and regulatory compliance or applicable anti-corruption laws or regulations. Violations of these laws or regulations by us or our subsidiaries, our employees or any of these third parties could subject us to criminal or civil enforcement actions (whether or not we participated or knew about the actions leading to the violations), including fines or penalties, disgorgement of profits and suspension or disqualification from work, including governmental contracting, any of which could materially adversely affect our business, including our results of operations and our reputation.
Grupo Aval and certain of its subsidiaries and officers are defendants or parties in government enforcement actions and/or subject to ongoing governmental investigations relating to the Ruta del Sol Project Sector 2 that could cause us to incur penalties and other sanctions, impact our ability to conduct our business, harm our reputation and negatively impact our financial results.
Grupo Aval and certain of its subsidiaries and officers are defendants or parties in government enforcement actions and/or subject to ongoing governmental investigations relating to the Ruta del Sol Project Sector 2 in Colombia and the United States, including by the U.S. Department of Justice and the SEC. Grupo Aval is cooperating with the DOJ and the SEC in these investigations and is in discussions regarding potential resolutions. However, we are currently unable to predict the outcome of the investigations or our discussions with the regulators, the amount of any penalties we may be required to pay or whether the outcome of these investigations will result in additional obligations or have a material adverse effect on Grupo Aval’s reputation, business, financial condition or results of operations. For further information about these proceedings and investigations, see "Item 8. Financial Information-—A. Consolidated statements and other financial information-—Legal proceedings".
We and our subsidiaries are exposed to a variety of potential material negative consequences as a result of these proceedings and investigations, which could result in judgments, settlements, admissions of wrongdoing, criminal convictions, fines, penalties, injunctions, cease and desist orders, debarment or other relief and we and our subsidiaries could be exposed to other litigation as a result of these proceedings and investigations, including actions initiated by shareholders.
Such investigations and proceedings, which are the subject of extensive media coverage and political interest in Colombia, could also have significant collateral consequences for our company and our subsidiaries, including fines or penalties, damage to reputation, loss of customers and business, the inability to offer certain products and services, disqualification or losing permission to operate certain businesses for a period, the dissemination of potentially damaging information that may come to light in the course of the investigations and proceedings and other direct and indirect adverse effects. Management will need to continue to direct substantial time and attention to resolving such matters, which could prevent them from focusing on our core businesses. We can provide no assurance that the outcome of any such investigations and proceedings will not be material to our reputation, business, financial position or results of operations.
New or higher taxes resulting from changes in tax regulations or the interpretation thereof in Colombia and other countries in which we operate could adversely affect our results of operations and financial condition or generate burdens to our shareholders or lenders.
It has become usual in Colombia for tax laws to be reformed on a regular basis. Since 2018, several tax reforms have been proposed by the Presidency and enacted by the Colombian Congress. As one of the first actions of the new Government, in August 2022, the Ministry of Finance presented to the Congress a draft seeking to raise $50 trillion pesos in order fund social programs proposed by the President. The Law was finally approved and enacted in December, 2022, and is intended to raise $20 trillion pesos.
The main aspects of such law can be summarized as follows:
15
New tax laws and regulations, and uncertainties with respect to future tax policies, pose risks to us. The Colombian Government was required by Law 1473 of 2011, also known as Law of Fiscal Rule, to significantly reduce its fiscal deficit and address issues regarding public policy, regulation regarding oil extraction and the transition to clean energies, migrations, public health events or other events that could require further tax reforms over the following years. This, in addition to an increase in fiscal deficit and the expected increase in new subsidies for the low-income bracket, could lead to higher taxation rates on our business and that of our borrowers. Changes in tax-related laws and regulations, and interpretations thereof, can impact tax burdens by increasing tax rates and fees, creating new taxes or withholdings, limiting tax deductions, and eliminating tax-based incentives and non-taxed income. In addition, tax authorities, local governments or courts may interpret tax regulations differently than we do, or impose new local tax regulations, which could result in increases in our tax payments, tax litigation and associated costs and penalties.
Colombian Government may implement new changes in the tax rules applicable to our securities, which could have a material adverse effect on our results of operations and financial condition or that may adversely affect our shareholders or holders of ADSs. ADSs do not have the same tax benefits as equity investments in Colombia. Although ADSs represent our preferred shares, they are subject to a different tax regulatory regime. Accordingly, the tax benefits applicable in Colombia to equity investments, in particular those relating to dividends and profits from sale, may not apply or apply differently in the case of our ADSs.
For further information, see “Item 10. Additional Information-E. Taxation”.
Colombian tax haven regulations could adversely affect our results of operations and financial condition.
Decree 1966 of 2014, as amended by Decree 2095 of 2014, put into effect article 260-7 of Colombia’s Tax Code, which regulates applicable rules for tax havens. Accordingly, a number of jurisdictions, including countries in which our banking subsidiaries operate, were either declared tax havens for Colombian tax purposes or temporarily excluded from such list subject to the completion of tax information exchange treaties within a short timeframe.
Article 260-7 of the Colombian Tax Code was reformed by Law 1819 of 2016, establishing a new legal framework pursuant to which certain jurisdictions may be classified as non-cooperative jurisdictions with low or no taxation or as jurisdictions with preferential tax regimes. This legal framework established a higher tax-withholding rate on Colombian source payments to those jurisdictions and entities considered part of such a jurisdiction.
As a result, some of our clients with financial products offered by our banking subsidiaries in such jurisdictions may experience, among other effects, an increase in their withholding tax rates, transfer pricing regulation, increased likelihood of being found in violation of tax regulations by the Colombian authorities and elevated information disclosure requirements which could have a negative impact on our business, financial condition and results of operations.
Natural disasters, acts of war or terrorism, rioting or other external events could disrupt our businesses and affect our results of operations and financial condition.
We are exposed to natural disasters, such as earthquakes, volcanic eruptions, tornadoes, tropical storms and hurricanes. Heavy rains or abnormally low rainfall in Colombia and other countries in which we operate, attributable in part to the La Niña and El Niño weather patterns, have resulted in severe flooding, mudslides and prolonged droughts in the past. These are recurring weather phenomena that may occur on an equal or greater scale in the future. In addition to severe weather and natural disasters, acts of war or terrorism, rioting and other adverse external events could have a significant impact on our ability to conduct business and may, among other things, affect the stability of our deposit base, impair the ability of borrowers to repay outstanding loans, impair the value of collateral of secured loans, cause significant property damage, cause us to incur additional expenses and/or result in loss of revenue. In the event of such circumstances, our disaster recovery plans may prove to be ineffective, which could have a material adverse effect on our ability to conduct our businesses, particularly if such an occurrence affects computer-based data processing, transmission, storage and retrieval systems or destroys customer or other data. In addition, if a significant number of our employees and senior managers were unavailable because of a natural disaster, our ability to conduct our businesses could be compromised. Natural disasters, acts of war or similar events could also result in substantial volatility in our results of operations for any fiscal quarter or year.
Risks related to global climate change and environmental requirements
In order to achieve adequate management of climate risk disclosures, the Superintendency of Finance required issuers of securities in December 2021 (through Circular 031) to disclose social, environmental, and climate related information. The report must follow SASB standards and TCFD recommendations associated with governance, strategy, management, and metrics about climate change. The deadline to formally commence reporting this information is February 2024. Implementing the TCFD recommendations is intended to facilitate an understanding of physical climate risks and transition risks that could affect Grupo Aval’s investments, including our banks’ portfolios and projects developed by our subsidiaries. Banco de Bogotá published its first TCFD report in 2022.
16
Further, in March 2022, the SEC proposed extensive climate disclosure rules that would require, among other things, disclosure of climate-related risks reasonably likely to have a material impact over the short, medium and long term; specified greenhouse gas (GHG) emissions metrics (which could include supply chain emissions disclosure if material to a registrant or if a registrant has included supply chain emissions targets in its public disclosure) in the financial statements in the filing, including a description of the methodology, significant inputs and significant assumptions used to calculate GHG emissions; targets and goals relating to GHG reduction or any other climate-related target that a company has set, including data to indicate progress made toward achieving the target; climate-specific governance disclosure, including the process by which the board exercises oversight and sets targets and goals, and the role of management in assessing and managing climate-related risks; and financial statement footnote disclosure of certain climate-related matters. While the new SEC rules have not yet gone into effect, and their ultimate date of effectiveness and scope remains uncertain, if the rules went into effect in their current form, they could have a material impact on our external reporting and controls processes and costs.
According to Corficolombiana, it is estimated that 37% of the Colombian banking system’s commercial loans portfolio would be vulnerable to the effects of climate change (9% of GDP). As a consequence of regulation and potential future environmental challenges, banks expect to increasingly consider the environmental risks for the allocation of credits and company financing and align incentives towards the fulfillment of NDC (Colombia’s Nationally Determined Contributions), that is, the instrument used to communicate a country’s climate actions and goals.
The transition towards a low carbon economy and the management of climate risks can result in drastic effects in the allocation of resources to different sectors, subsectors, projects, assets or regions, given the need to finance mitigation and adaptation measures that these demands. This is relevant to our subsidiaries, especially to our banks, which hold loans and other investments in diverse sectors within their portfolios, generating exposure to different climate risks. Depending on the nature, speed and focus of these changes, including changes in policy and allocation of resources as well as in the physical climate, the changes may entail different levels of or unpredictable risks for Grupo Aval and our subsidiaries.
Risks relating to our businesses and industry
Risks relating to our banking business
A deterioration in asset quality, including the loan portfolios of our banking subsidiaries, may have an adverse effect on our results of operations and financial condition.
Changes in the financial condition or credit profiles of customers of our banking subsidiaries and increases in inflation or interest rates and foreign exchange volatility could have a negative effect on the quality of our banks’ loan portfolios, potentially requiring them to increase impairment losses on loans and accounts receivable or resulting in reduced profitability. In particular, the percentage of past due or impaired loans may increase in the future as a result of factors beyond our control, such as economic conditions and political events affecting Colombia generally or specific sectors of the economy. These effects could be compounded by higher interest rates, which have recently led to and could lead to further declines in our net interest margins and profitability, as we have sometimes been and may in the future be unable to immediately or fully pass through our higher interest costs to our customers, whether as a result of competitive pressures or regulatory considerations.
A substantial number of our banks’ customers are individuals and small and medium sized enterprises, or “SMEs”, and these customers are potentially more susceptible to downturns in the economy than large corporations and high-income individuals. In addition, some corporate clients could suffer the effects of economic downturns. Consequently, our banking subsidiaries may experience higher levels of past due or impaired loans, which could result in increased impairment losses on loans and other accounts receivable due to defaults by, or deterioration in the credit profiles of, individual borrowers. Past due or impaired loans and resulting impairment losses may increase materially in the future and adversely affect our results of operations and financial condition.
Existing loan loss allowances may not be adequate to cover any increases in past due or impaired loans or a deterioration in the credit quality of loan portfolios. As a result, our banking subsidiaries may be required to increase impairment losses on loans and accounts receivables, which may adversely affect our results of operations and financial condition. Our exposure is concentrated in certain economic sectors and large corporations that could also increase our impairment losses.
Default rates generally increase with the age of loans, the level of past due or impaired loans may lag behind the rate of growth in loans but may increase when growth slows or the loan portfolios become more mature. As a result, historic loan loss experience may not necessarily be indicative of future loan loss experience.
17
Our banking subsidiaries may be unable to realize on collateral or guarantees of secured loans, which may adversely affect their results of operations and financial condition.
Our banking subsidiaries originate loans that are secured by collateral, including real estate and other assets that are generally located in Colombia and other countries where we operate. The value of collateral may significantly fluctuate or decline due to factors beyond the control of our subsidiaries, including, for example, prevailing economic and political conditions in the relevant jurisdiction. At December 31, 2022, 44.9% of consolidated loans past due more than 30 days were secured. An economic slowdown may lead to a downturn in the Colombian real estate markets, which may, in turn, result in declines in the value of real estate securing loans to levels below the principal balances of these loans. Any decline in the value of the collateral securing these loans or any other collateral securing these loans may result in reduced recoveries from collateral realization and have an adverse effect on our results of operations and financial condition. We may also not have sufficiently recent information on the value of collateral, which may result in an inaccurate assessment for loss allowance of our loans secured by such collateral. If this were to occur, we may need to incur additional impairments to cover actual losses of our loans, which may materially and adversely affect our results of operations and financial condition.
Our banking subsidiaries also make loans on the basis of guarantees from relatives, affiliates or associated persons of their principal borrowers. To the extent that guarantors encounter financial difficulties due to economic conditions, personal or business circumstances, or otherwise, the ability of our banks to enforce such guarantees may be impaired.
In addition, our banking subsidiaries may face difficulties in enforcing their rights as secured creditors against borrowers, collateral or guarantees. In particular, timing delays, documentary and procedural problems in realizing against collateral, as well as debtor-protective or other judicial interpretations of the law, may make it difficult to foreclose on collateral, realize against guarantees or enforce judgments in our favor, which could materially and adversely affect our results of operations and financial condition.
Colombian insolvency laws or laws of the Countries in which our customers are incorporated or the loans are extended, may limit the ability of our banking subsidiaries to collect on monetary obligations and enforce rights against collateral or under guarantees.
Insolvency laws in Colombia and other countries in which some of our clients are incorporated provide that creditors of an insolvent debtor are prohibited from initiating collection proceedings outside the bankruptcy or reorganization process of such debtor. In addition, all collection proceedings outstanding at the beginning of the bankruptcy or reorganization process must be suspended and such creditors are prevented from enforcing their rights against the collateral and other assets of the insolvent debtor during the insolvency process.
In Colombia, once a non-merchant individual has ceased paying his or her debts, such individual can initiate a voluntary insolvency proceeding before a notary public or mediator to reach an out-of-court agreement with creditors. The terms of any agreement reached with a group of creditors (two or more) that represent the majority of the total amount of the claims will be mandatorily applicable to all relevant creditors. The insolvency law also provides other protections to debtors. A perception that loans to individuals may be difficult or impossible to recover could cause our banking subsidiaries to enhance credit requirements and result in decreased lending to individuals by making access to credit more expensive. In addition, increased difficulties in enforcing debt and other monetary obligations due to insolvency laws could have an adverse effect on our results of operations and financial condition.
Any failure of risk management processes, including credit and market risk, could materially and adversely affect our banking businesses, results of operations and financial condition.
Credit risk is the principal risk inherent in the business of our banks. Although we have group-wide risk management guidelines, each bank is responsible for managing its own risk. Each bank’s policies and procedures, which are designed to identify, monitor and manage risk, may prove to be insufficient. Furthermore, our banks may not be able to upgrade risk management systems on a timely basis. Due to limitations in the availability of information, our assessment of credit risk associated with a particular customer may not be based on complete, accurate or reliable information. Personnel of our banking subsidiaries may fail to detect risks before they occur, or may not effectively implement their risk management systems, which may increase exposure to credit risk. As a result, any failure by our banking subsidiaries to effectively implement or consistently follow or refine risk management systems may result in higher risk exposures for our banking subsidiaries, which could materially and adversely affect our results of operations and financial condition.
Declines in the value of our banks’ sovereign debt portfolios or other investments could have an adverse effect on our results of operations.
Our Colombian banks’ securities portfolio primarily consists of debt securities issued or guaranteed by the Colombian Government. We are exposed to significant credit, market and liquidity risks associated with debt securities. At December 31, 2022 and 2021, debt securities represented 12.2% and 13.1% of our consolidated total assets, respectively. Of these, 57.4% and 42.5% were issued by the Colombian Central government, and 3.4% and 23.3% were issued or backed by other governments, respectively at December 31, 2022 and 2021. A significant decline in the value of these government securities or other investments could materially and adversely affect our debt securities
18
or broader financial asset portfolios and, consequently, our financial condition and results of operations. See “Item 4. Information on the Company—B. Business overview—Supervision and regulation—Mandatory Investments”.
We are subject to counterparty risk in our banking business.
Our banks and, to a lesser extent, Corficolombiana, Porvenir and our international banking operations, are exposed to counterparty risks in addition to credit risks associated with lending activities. Counterparty risk may arise from, for example, investing in securities of third parties, entering into derivative contracts under which counterparties have obligations to make payments to us, or executing securities, futures, currency or commodity trades from proprietary trading activities that fail to settle at the required time due to non-delivery by the counterparty or systems failure by clearing agents, exchanges, clearing houses or other financial intermediaries. These risks could materially and adversely affect our results of operations and financial condition.
Our banks are subject to market and operational risks associated with derivatives transactions.
Our banks and, to a lesser extent, Corficolombiana, Porvenir and our international banking operations, enter into derivatives transactions primarily for hedging purposes and, on a limited basis, on behalf of customers. Those transactions subject us to market and operational risks, including basis risk (the risk of loss associated with variations in the spread between the asset yield and the funding and/or hedge cost) and credit or default risk (the risk of insolvency or other inability of a counterparty to perform its obligations to us).
Market practices and documentation for derivatives transactions in Colombia and the countries where we operate may differ from those in other countries. In addition, the execution and performance of these transactions depend on our banks’ ability to develop adequate control and administration systems, and to hire and retain qualified personnel. These factors may further increase risks associated with derivatives transactions and could materially and adversely affect our results of operations and financial condition.
Our banking subsidiaries are subject to liquidity risk, which may result in increases in funding costs.
The principal sources of funding for our banking subsidiaries are savings deposits, time deposits and checking accounts, which together represented 65.2% and 71.4% of our consolidated total liabilities at December 31, 2022 and 2021, respectively. Because our banking subsidiaries rely primarily on deposits for funding, a sudden or unexpected shortage of funds in the banking systems in which we operate or overnight money markets may prevent our banking subsidiaries from meeting their obligations or obtaining necessary funding without incurring higher costs or selling certain assets at prices below prevailing market values, which could materially and adversely affect our results of operations and financial condition. The liquidity of our financial entities could also be impacted by reputational events affecting our entities as well as systemic events.
Our liquidity could be adversely affected by any inability to access the capital markets, illiquidity or volatility in the capital markets, the decrease in value of eligible collateral or increased collateral requirements, changes to our relationships with our funding providers based on real or perceived changes in our risk profile, governmental or regulatory decisions restricting public entity deposits in privately held banks, or changes in regulations that impact our funding.
Default by one or more of our largest borrowers could adversely affect our results of operations and financial condition.
Our exposure is concentrated in certain economic sectors and large corporations that could increase our impairment losses. Default on loans by one or more of these borrowers may materially adversely affect our results of operations and financial condition.
Downgrades in our long-term credit ratings or in the credit ratings of our banking subsidiaries would increase the cost of, or impair access to, funding and may impact our ability to maintain regulatory capital ratios.
Our credit ratings and those of our banking subsidiaries are an important component of our and their ability to obtain funding. Rating agencies regularly evaluate us, and their ratings of our debt are based on numerous dynamic, complex and inter-related factors and assumptions, including our financial strength, conditions affecting the overall financial services industry and the sovereign credit rating of Colombia and the jurisdictions we operate in.
Our banking subsidiaries may be required to raise additional capital or funding in the future to maintain regulatory capital ratios and provide liquidity to meet commitments and business needs, particularly if asset quality or earnings were to deteriorate. Since February 6, 2019, we are subject to the inspection and supervision of the Superintendency of Finance as the financial holding of the Aval Financial Conglomerate and we might be required in the future to raise additional capital to comply with new regulatory adequacy rules applicable to us at the conglomerate level.
19
Adverse changes in credit ratings or outlooks could increase the cost of funding in the capital markets or borrowings, or reduce the feasibility of refinancing existing debt or issue new debt required to finance our future projects. In addition, lenders and counterparties in derivatives transactions are sensitive to the risk of a ratings or outlook downgrade. Our ability to raise deposits may also be impacted by a change in credit ratings or outlooks, which could make us less successful when competing for deposits or preclude us or our subsidiaries from receiving funds from institutional investors, governments, governmental entities, or other providers of deposits and other funding.
Any occurrence that may limit our and our banking subsidiaries’ access to funding, such as a downgrade in credit ratings or outlook, or a decline in the confidence of debt purchasers, depositors, or counterparties in the capital markets may adversely affect capital costs, ability to raise capital or funding, and liquidity. Moreover, we and our banking subsidiaries may need to raise capital when many other financial institutions are also seeking to raise capital, which, in turn, would require us to compete with numerous other institutions for investors. An inability to raise additional capital on acceptable terms, when needed, or a downgrade in our or our banking subsidiaries’ credit ratings or outlook could have a materially adverse effect on our and our banking subsidiaries’ financial conditions and results of operations.
Our banking subsidiaries’ loan portfolios are subject to risk of prepayment, which may result in reinvestment of assets on less profitable terms.
The loan portfolios of our banking subsidiaries are subject to prepayment risk, which results from the ability of a borrower to pay a loan prior to maturity. Generally, in a declining interest rate environment, prepayment activity increases with the effect of reducing weighted average lives of interest-earning assets and adversely affecting results. Prepayment risk also has an adverse effect on credit card and collateralized mortgage obligations, since prepayments could shorten the weighted average life of these portfolios, which may result in a mismatch in funding or in reinvestment at lower yields.
The credit card industry is highly competitive and entails significant risks, including the possibility of over indebtedness of customers, which could have a material adverse effect on us.
The credit card business is subject to a number of risks and uncertainties, including the possibility of over indebtedness of our customers, despite our focus on low-risk, middle- and high-income customers.
The credit card industry is characterized by higher consumer default than other segments of the credit markets, and defaults are highly related to macroeconomic indicators that are beyond our control. According to predictions of certain analysts, Colombian economic growth rate prospects are slowing, and some forecasts predict negative growth. If this scenario manifests or continues, we may at risk of failing to effectively analyze the creditworthiness of our customers (including the targeting of certain sectors) in a timely manner, and we may be faced with unexpected losses that could have a material adverse effect on our results of operations and financial condition.
Changes in banking and financial services laws and regulations in Colombia and the other countries in which we operate could adversely affect our consolidated results.
Banking and financial services laws and regulations are subject to ongoing review and revision, including changes in response to global regulatory trends. As a result, governments have been actively considering new banking laws, regulations, reviewing and revising existing laws and regulations, particularly in relation to capital adequacy and accounting standards that may change the perceived strength on our banks, our credit ratings or our ability to grow or pay dividends. In addition, various international developments, will continue to impact us in the coming years. Decree 2555 of 2010 was amended in 2012, 2015, 2018 and 2019, modifying certain capital adequacy requirements for Colombian credit institutions. See “Item 4. Information on the Company—B. Business overview—Supervision and regulation”.
On September 21, 2017, the Colombian Congress passed Law 1870 to strengthen the regulation and supervision of financial conglomerates, also known as Law of Financial Conglomerates (Ley de Conglomerados Financieros). This law sets out the principles for supervising and regulating financial conglomerates. This law and its regulatory decrees (i) established criteria for identifying members of the financial conglomerates, as well as their controlling financial holding companies; (ii) provided the Colombian Government and Superintendency of Finance with tools to regulate and supervise financial conglomerates with respect to capital adequacy, corporate governance standards, risk management, internal control and criteria for identifying, administering, monitoring and revealing conflicts of interest; and (iii) established obligations and responsibilities applicable to the financial holding companies regarding the application and promotion of guidelines and rules across the financial conglomerates. Financial holding companies may be exposed to sanctions and fines derived from the breach of this law and its regulatory decrees by any member of the financial conglomerate. However, no fines have been imposed since the issuance of this law. We cannot assure that such law and its regulatory decrees will not have a material adverse impact on us. See “Item 4. Information on the Company—B. Business overview—Supervision and regulation—Regulatory framework for Colombian Financial Conglomerates”.
20
Our financial results may be negatively affected by changes to accounting standards.
We report our results and financial position in accordance with IFRS as issued by the IASB. Changes to IFRS or interpretations thereof may cause our future reported results and financial position to differ from current expectations, or historical results to differ from those previously reported due to the adoption of accounting standards on a retrospective basis. Such changes may also affect our regulatory capital and ratios. We monitor potential accounting changes and when possible, we determine their potential impact and disclose significant future changes in our audited consolidated financial statements that we expect as a result of those changes. Currently, there are a number of issued but not yet effective IFRS standards, as well as potential IFRS changes. For further information about developments in financial accounting and reporting standards, see Note 2 to our audited consolidated financial statements.
Regulatory actions may result in fines, penalties or restrictions that could materially and adversely affect our businesses and financial performance.
Our Colombian banks, as well as Corficolombiana, Porvenir and our international banking operations, are subject to regulation and supervision by financial authorities. These regulatory authorities have broad powers to adopt regulations and other requirements affecting or restricting virtually all aspects of our subsidiaries’ organization and operations, including, the imposition of anti-money laundering measures, liquidity or capital requirements and the authority to regulate the terms and conditions of credit transactions. Failure to comply with applicable regulations could subject our banking subsidiaries to fines or sanctions or even revocation of licenses or permits to operate. In the event that any of these subsidiaries encounter significant financial problems, is in danger of insolvency or becomes insolvent, or is otherwise deemed as non-viable, the financial authorities would have broad powers to intervene in our management and operations, including suspending or removing management and, in extreme circumstances, putting our banks, Corficolombiana, Porvenir and our international banking operations, into conservatorship or receivership or taking control of our banks, Corficolombiana, Porvenir and our other subsidiaries. Since February 6, 2019, Grupo Aval is subject to the inspection and supervision of the Superintendency of Finance as the financial holding of the Aval Financial Conglomerate and is required to comply with capital adequacy and additional regulations applicable to financial conglomerates that became effective. As a result, we may become subject to more stringent regulation. See “Item 4. Information on the Company—B. Business overview—Supervision and regulation”.
We may face legal and other challenges to maximizing revenue from credit card fees and other fees from customers.
As part of their credit card business, our banking subsidiaries face pressures related to the fees and commissions charged to merchants (merchant discounts) and the pricing of bank interchange fees charged by issuer banks to acquiring banks. Banks and card processors in Colombia have been subject to administrative investigations regarding the fees and commissions that are charged to the merchants by the acquiring banks and in respect to the banking interchange fees.
Similar investigations may be carried out by the relevant authorities in the future, which may result in penalties, lower fees charged to merchants and bank interchange fees, lead to changes in commercial strategies that may adversely affect our results of operations and financial condition. In addition, fees charged for other banking services may continue to be reduced in the future as a result of regulatory measures and/or pressure from retailers and interest groups.
Failure to protect personal information could adversely affect our reputation and our business.
Our subsidiaries manage and hold confidential personal information of customers in the normal course of their operations. Although, our subsidiaries have procedures and controls to safeguard personal information in our possession, unauthorized disclosures or unauthorized access to privileged information, fraud or events that interfere with regular banking and other services could subject us, our banks and other subsidiaries to legal actions, administrative sanctions and damages.
Although we work to develop secure data and information processing, storage and transmission capabilities to enhance information security, we face risks related to security breaches in connection with debit and credit card transactions that typically involve the transmission of personal information of our customers through various third parties, including retailers and payment processors. We and some of these parties have in the past been the target of security breaches and because the transactions involve third parties and environments, where we do not control the processing, storage or transmission of such information or the security protocols enacted by such third parties or in such environments, security breaches affecting any of these third parties could affect us, and in some cases we may have exposure and suffer losses for breaches relating to them, including costs to replace compromised debit and credit cards and address fraudulent transactions.
Although we employ a variety of physical, procedural and technological safeguards to protect personal information from mishandling, misuse or loss, these safeguards do not provide absolute assurance that mishandling, misuse or loss of the information will not occur, and that if mishandling, misuse or loss of information does occur, those events will be promptly detected and addressed. It is not always possible to deter or prevent employee misconduct, and the precautions we take to detect and prevent this activity may not always be effective. Similarly, when personal information is collected, compiled, processed, transmitted or stored by third parties on our behalf, our policies and procedures
21
require that the third party agrees to maintain the confidentiality of the information, establish and maintain policies and procedures designed to preserve the confidentiality of the information, and permit us to confirm the third party’s compliance with the terms of the agreement. Any failure to protect personal information could result in reputational damage and have a material adverse effect on our results of operations and financial condition.
Instability in global or local banking and financial systems could have a material adverse effect on our business, financial condition and results of operations.
Recent developments that indicate stress in international banking and financial systems, such as the recent receivership of Silicon Valley Bank and Signature Bank in the United States and the rescue and acquisition of Credit Suisse by UBS and Swiss regulators in Europe, could adversely affect confidence in banking systems, including in Colombia, which could cause our bank customers to withdraw or limit their deposits and increase our cost of capital. Additionally, actions by central banks in other countries could adversely impact our operations to the extent that we are unable to benefit from them. For example, the recent announcement by several central banks, including the Bank of Canada, the Bank of England, the Bank of Japan, the European Central Bank, the Federal Reserve, and the Swiss National Bank of coordinated action to enhance the provision of liquidity via the standing U.S. dollar liquidity swap line arrangements, intended to mitigate liquidity concerns in the jurisdictions that benefit from them, could lead international investors to limit or withdraw capital from banks in other jurisdictions that do not benefit from similar protections, which could impede our access to or increase the cost of foreign capital. Any further such developments, particularly in Colombia, could materially adversely impact our business, financial condition and results of operations.
Risks relating to our merchant banking business
Difficult market conditions can adversely affect Corficolombiana’s business.
Corficolombiana may be adversely affected by lower than expected returns on investments, reduced opportunities to realize value from investments, and failure to find suitable investments to deploy capital effectively. During periods of difficult market conditions (which may span across one or more industries, sectors or geographies), portfolio companies may experience adverse operating performance, decreased revenues, financial losses, difficulty in obtaining access to financing or increased funding costs. Negative financial performance of portfolio companies may materially and adversely affect Corficolombiana’s results of operations and cash flow. If the operating performance of those portfolio companies (as well as valuation multiples) does not improve following any such downturn or other portfolio companies experience adverse operating performance, Corficolombiana may be forced to sell those assets at values that are less than projected or even at a loss. Portfolio companies may also have difficulties expanding their businesses and operations or meeting debt service and other obligations as they become due. Furthermore, negative market conditions could potentially result in a portfolio company entering bankruptcy proceedings, thereby potentially resulting in a complete loss of the investment. Even if such conditions improve broadly and significantly over the long term, adverse conditions and/or other events in particular sectors may cause our performance to suffer further.
Corficolombiana’s due diligence process for evaluating prospective investments may not identify all risks or ensure investment returns.
Before making investments, Corficolombiana conducts due diligence based on the facts and circumstances applicable to each investment. When conducting due diligence, it may be required to evaluate important and complex business, financial, tax, accounting, environmental and legal issues. Outside consultants, legal advisors, accountants and investment banks may be involved in the due diligence process to varying degrees depending on the type of investment, but it may be unable to engage these third parties in a timely manner, or at all. Nevertheless, the due diligence investigation carried out by Corficolombiana with respect to any investment may not reveal or highlight all relevant risks of such investment opportunity. Moreover, such an investigation will not necessarily result in the investment being successful.
A significant part of Corficolombiana’s investments is in relatively illiquid assets, and Corficolombiana may fail to realize any profits from these investments for a considerable period of time or lose some or all of the principal amount of these investments.
As of December 31, 2022, 82.4% of Corficolombiana’s investment portfolio comes from unlisted companies. There are often no readily ascertainable market prices for such securities or for those investments of Corficolombiana in listed companies with low or medium trading volumes. As a result, there may be limited or no marketability for these investments, and they may decline in value while Corficolombiana might be seeking to dispose of them. Because there is significant uncertainty as to the valuation of illiquid investments, the stated values of such investments may not necessarily reflect the values that could be realized by Corficolombiana. In addition, in some cases, Corficolombiana may be prevented by contract from selling such investments for a period of time. Corficolombiana’s ability to dispose of investments may also be dependent on factors beyond its control. Thus, it is possible that investments in privately-held companies will only be disposed over a substantial length of time, if at all, exposing the investment returns to risks of declines in market prices during the intended disposition period. Accordingly, under certain conditions, Corficolombiana may be forced to either sell securities at lower prices than it had expected to realize or defer—potentially for a considerable period—sales that it had planned to make.
22
Corficolombiana might have minority investments in companies and therefore, it might not control them.
Corficolombiana’s investments include non-controlling equity interests, and it may also dispose of a portion of its majority equity securities in portfolio companies over time in a manner that results in Corficolombiana retaining minority investments. Those investments will be subject to the risk that the company in which the investment is made may take business, financial or management decisions with which we do not agree. Similarly, the majority stakeholders or the management of the company may take risks or otherwise act in a manner contrary to our interests. If any of the foregoing were to occur, the values of these investments could decrease or we may not be able to dispose of them, which would adversely affect Corficolombiana’s results of operations and financial condition. Any wrongdoing by these companies or their management might result in reputational or legal risks to us or lead to charge-offs or write-downs of Corficolombiana’s investments in such companies.
Corficolombiana’s new investment projects depend on its ability to access financing.
Corficolombiana may directly, or through its operating subsidiaries, enter into new investment projects that require significant financing. Corficolombiana or its operating subsidiaries may experience difficulties in accessing debt and equity financing resources required to fund or refinance such projects and/or may obtain them at higher costs and/or lower tenors than initially expected. As a result, Corficolombiana’s investment objectives may attain lower returns due to higher financing costs, delays in the investment schedule or any eventual stoppage of the investment project, which could also result in the payment of penalties to its counterparties, including the Government entities in the case of development of new highways and toll roads. If Corficolombiana is unable to obtain adequate financing on terms satisfactory to it, its ability to continue to grow or support its business and respond to business challenges could be significantly limited.
Most of Corficolombiana’s investments are concentrated in five industries.
The majority of Corficolombiana’s investment portfolio is concentrated in the energy and gas, infrastructure, agribusiness, hotels and financial services industries. Energy and gas and infrastructure accounted for 93.4% of Corficolombiana’s total investment portfolio as of December 31, 2022. During periods of difficult market conditions or slowdowns in these sectors, Corficolombiana may experience decreased revenues, difficulty in obtaining access to financing and increased funding costs.
A variety of issues outside of Corficolombiana’s control could affect the timing and performance of its investments, which may result in additional costs and reputational harm to Corficolombiana, reductions or delays in revenues or the payment of liquidated damages.
Many of Corficolombiana’s investments, including in the energy and gas and infrastructure sectors, involve challenging engineering, permitting, procurement and construction phases that may occur over extended periods, sometimes several years. These investments may also encounter difficulties as a result of delays in design, engineering information or materials to be completed or procured by them, the customer or a third party, delays or difficulties in equipment and material delivery, schedule changes, delays due to failure to timely obtain permits or rights of way or meet other regulatory requirements or permitting conditions accidents and catastrophic events, weather-related delays, protests, legal challenges or other political activity, and other factors. In the energy and gas sector, Corficolombiana, through Promigas, is exposed to a variety of inherent hazards and operating risks in gas distribution and transportation which could cause substantial financial losses.
If any of Corficolombiana’s investments or projects fail to comply with the applicable professional standards or contractual requirements, Corficolombiana or its subsidiaries could be exposed to significant monetary damages or violations. A catastrophic event at one of the investments could also result in significant professional or product liability, and warranty or other claims as well as reputational harm, especially if public safety is impacted. Some public concession contracts incorporate provisions enabling an early termination of concession contracts subject to specific clauses. This could result in a liquidation value that differs from the book value recorded by Corficolombiana. A relevant portion of Corficolombiana’s income is derived from construction activities that will be completed over the following years. Corficolombiana might not be successful originating and starting new projects to replace this income. Many of these difficulties and delays are beyond Corficolombiana’s control and could negatively impact its ability to achieve its anticipated return from its investments. Delays and additional costs may be substantial and not recoverable from third parties or insurance providers, and in some cases, may cause substantial financial losses.
Failure to meet any of their schedules or performance obligations could also result in additional costs or penalties, including liquidated damages, and such amounts could exceed profits from these projects. In extreme cases, the abovementioned factors could cause project cancellations, and Corficolombiana may not be able to replace such projects with similar projects or at all. Such delays or cancellations may impact Corficolombiana’s investments, its reputation or relationships with customers and could have a material adverse effect on Corficolombiana’s business, results of operations or financial condition.
23
Most investments held by Corficolombiana are in highly regulated industries. Therefore, a change in regulation could materially affect their value, could reduce the income that those investments will generate in the future or could adversely affect the ability of Corficolombiana to dispose of those investments.
Risks relating to our pension and severance fund management business
Porvenir operates in a highly regulated market, which limits its flexibility to manage its businesses.
Porvenir’s operations are regulated by Law 100 of 1993, as amended, the Organic Statute of the Financial System (Estatuto Orgánico del Sistema Financiero), or “EOSF”, Decree 2555 of 2010 issued by the Ministry of Finance, as amended, and regulations issued by the Superintendency of Finance and, to the extent applicable, Colombian Corporation Law. These regulations limit the range of assets in which pension fund administrators, or “AFPs”, can invest the assets under administration and also set investment limits, depending on the type of mandatory pension or severance fund managed by each AFP. AFPs can manage four types of mandatory pension funds (i) Lower Risk Fund (“Fondo Conservador”), (ii) Medium Risk Fund (“Fondo Moderado”), (iii) High Risk Fund (“Fondo de Mayor Riesgo”) and (iv) Planned Retirement Fund (“Fondo Especial de Retiro Programado”), and two types of severance portfolios (i) Short Term portfolio (“Portafolio de Corto Plazo”) and (ii) Long Term portfolio (“Portafolio de Largo Plazo”). In addition, each AFP is legally required to provide a minimum return on investment for each mandatory of its pension and severance funds. See “Item 4. Information on the Company—B. Business overview—Pension Fund Management—Pension Business Overview”.
Furthermore, Porvenir manages voluntary pension funds (fondos de pensiones de jubilación e invalidez) created by Decree 2513 of 1987, and fully amended by Decree 1207 of 2020 as supplementary savings vehicles for pensions, which are independent and different from the mandatory pension funds and benefit from tax incentives. Subject to certain limits, savings in voluntary pension funds are considered as exempt income for purposes of the corporate income tax (Impuesto de Renta) under rules defined in article 1261-1 of the Tax Statute. These exemptions have been subject to modifications through tax reforms such as Law 1607 of 2012, Law 1819 of 2016, Law 1943 of 2018, and Law 2277 of 2022 also known as “Reforma Tributaria para la Igualdad y la Justicia Social”. This law includes specific regulations to voluntary pension funds, in particular with respect to its tax benefits, reducing the limits applicable to deductions of income for the calculation of the income tax. These conditions reduce consumer interest in this type of savings product and have an adverse effect on the management fees received by Porvenir for the administration of these funds. Finally, Law 2112 of 2021 has forced mandatory pension funds to invest up to 3% of assets under management in private capital funds (“fondos de capital privado”, similar to hedge funds) seeking to promote entrepreneurship.
In March 2023, the Colombian government presented a bill to reform the current pension system, which will be discussed in Congress. This reform intends to extend the system’s coverage to a broader base of the population. In general terms, the reform shifts to a pillars structure in which (i) people who earn up to three minimum wages (“salario mínimo mensual legal vigente”) will contribute exclusively to Colpensiones, the governmental pension fund administrator and (ii) people who earn more than three minimum wages will contribute, with respect to the first three minimum wages to Colpensiones and excess thereof to a private pension fund. In addition, the bill also reforms the existing commissions structure for pension funds administrators from contributions to assets under management (AUM). Finally, the bill includes a transition regime applicable to individuals who have contributed to the pension system for over 1,000 weeks and such transition regime would be applicable and enforced effective January 1, 2025. The terms and conditions of the severance funds and voluntary pension funds remain unchanged under the bill.
During 2022, over 88% of the population who contributed to the pension system in Colombia earned three minimum wages or less. If the government proposal is approved as presented to Congress, private pension funds will experience a significant decrease in their management fees income considering that the first three minimum wages would be contributed to Colpensiones. Although the government proposal includes a fee for AUMs, we are not yet able to estimate if the resulting fee will partially or fully offset the negative effects of the reduced volume of contributions.
Changes to the current regulation or further regulation could materially impact our pension and severance fund management business and it is still uncertain what the short- and long-term implications of such changes would be.
As a result of the accession process of the Colombian Government to become a member country of the Organization for Economic Cooperation and Development (OECD), further regulation amending the current pension fund regulation could be enacted. Future regulation may not provide a favorable business environment and may adversely affect our results of operations and the financial condition of our pension fund management business.
24
A significant amount of debt securities in pension and severance funds managed by our pension and severance fund businesses are issued or guaranteed by the Colombian Government.
Our pension and severance fund management business, like our banks and other participants in the banking industry, is subject to the risk of loss in value of sovereign debt securities. A significant decline in the value of the securities issued or guaranteed by the Colombian Government could adversely affect the debt securities portfolio of our pension and severance fund management business and, consequently, our pension and severance fund management business’s results of operations and financial condition.
Other risks relating to our businesses
We are subject to fluctuations in interest rates and other market risks, which may materially and adversely affect our results of operations and financial condition.
Market risk refers to the probability of variations in income or in the market value of assets and liabilities due to changes in markets, including variations in market rates of interest and foreign currency exchange rates. Changes in interest rates affect the following areas, among others, of our banks’ businesses: net interest income, the volume of loans originated, market value of securities holdings, asset quality, and gains from sales of loans and securities. We do not manage market risk on a group-wide basis and are not subject to regulation or supervision of market risk on a group-wide basis.
Changes in short-term interest rates may affect interest margins quickly and, therefore, net interest income, which is the most important component of our revenue. Increases in interest rates may reduce the volume of loans originated by our banking subsidiaries. Sustained high interest rates may discourage customers from borrowing and may result in increased delinquencies in outstanding loans and deterioration in the quality of assets. Increases in interest rates may reduce the value of our assets, including the financial assets of our banks, the investments of Corficolombiana and the assets managed by Porvenir. Our banking subsidiaries hold a substantial portfolio of loans and debt securities that have both fixed and floating interest rates. In addition, we may incur costs (which, in turn, will affect our results of operations) if our banking subsidiaries implement strategies to reduce future interest rate exposure. Increases in interest rates may reduce gains or require our banking subsidiaries to record losses on sales of their loans or securities.
We may not effectively manage risks associated with the replacement of benchmark indices.
Interest rate, equity, foreign exchange rate and other types of indices which are deemed to be “benchmarks,” including those in widespread and long-standing use, have been the subject of ongoing international, national and other regulatory scrutiny and initiatives and proposals for reform. Some of these reforms are already effective while others are still to be implemented or are under consideration. These reforms may cause benchmarks to perform differently than in the past, or to disappear entirely, or have other consequences, which cannot be fully anticipated.
Any of the benchmark reforms which have been proposed or implemented, or the general increased regulatory scrutiny of benchmarks, could also increase the costs and risks of administering or otherwise participating in the setting of benchmarks and complying with regulations or requirements relating to benchmarks. Such factors may have the effect of discouraging market participants from continuing to administer or contribute to certain benchmarks, trigger changes in the rules or methodologies used in certain benchmarks or lead to the disappearance of certain benchmarks.
Any of these developments, and any future initiatives to regulate, reform or change the administration of benchmarks, could result in adverse consequences to the return on, value of and market for loans, mortgages, securities, derivatives and other financial instruments whose returns are linked to any such benchmark, including those issued, funded or held by us or our banking subsidiaries.
Due to the Financial Conduct Authority’s (FCA) confirmation that all LIBOR settings will either cease to be provided by any administrator or no longer be representative immediately after December 31, 2021, in the case of all sterling, euro, Swiss franc and Japanese yen settings, and the 1-week and 2-month US dollar settings; and immediately after June 30, 2023, in the case of the remaining settings; the entities worldwide were forced to transfer their LIBOR-indexed positions to new reference interest rates which could maintain the representativeness and depth of the “old” LIBOR.
On July 29, 2021, the Alternative Reference Rates Committee (ARRC) announced its recommendation for the use of the Chicago Mercantile Exchange (CME) SOFR term rates (TERM SOFR), following the completion of a key change in the trading agreements between market intermediaries on July 26, 2021, under the SOFR First initiative, in which it was recommended to stop using “Libor USD” and use “SOFR” for linear swap trading. With this initiative the transition was accelerated in all types of products, and furthermore, ARRC's recommendation on the use of the Term SOFR has facilitated the shift towards SOFR lending. According to the ARRC, the transition has proceeded smoothly, particularly in financial derivatives, consumer loans and floating rate markets. The market sees fluent progress in commercial lending and securitization markets, seeing further momentum towards SOFR-indexed issuance.
25
During 2022, the markets evidenced a successful transition process after the closing of operations in EUR LIBOR, CHF LIBOR, YEN LIBOR and GBP LIBOR despite some challenges faced by financial institutions regarding the selection of reference rates and renegotiation of contracts indexed to the previous reference rates. Regarding USD, LIBOR more than half of companies are already trading SOFR-indexed products. On May 5, 2022, CME Group launched the SOFR First initiative for option contracts to accelerate the transition in this type of products.
In 2021, Grupo Aval established certain principles and practices applicable to its financial subsidiaries to monitor the adequate transition of portfolio of credits, loans, deposits and derivative contracts that were previously indexed to LIBOR rates to the new reference rate, including a governance structure that would be responsible for controlling and supervising the execution of a work plan intended to facilitate (i) identification and measurement of indexed products, (ii) risk identification, assessment and control, (iii) operational and information technology readiness, (iv) preparation of legal contracts, (v) communication with stakeholders, (vi) training strategies and (vi) monitoring and periodic reporting to its governing bodies.
The implementation of these principles and practices within the group entities resulted in the approval of policies and documentation of processes and procedures intended to facilitate settlement of active and passive loans at the new market reference rates, offering and administration of products indexed to SOFR, incorporation of fallback clauses in the current contracts for the replacement of the LIBOR rate with the SOFR alternative, training of the commercial force and communication to current customers. The biggest challenges so far to the full implementation of these principles and practices by the first quarter of 2023 target have been in operational and systems’ issues. Despite our efforts, we cannot be certain that these principles and practices will be fully implemented on time or successfully achieve their intended objectives.
As of December 31, 2022, Grupo Aval had Ps 1,493.0 billion (2021: Ps 37,052.0 billion) of non-derivative financial assets and loan commitments, Ps 1,815.9 billion (2021: Ps 19,840.3 billion) of non-derivative financial liabilities that used LIBOR as a benchmark, as well as trading derivatives assets and liabilities with a fair value of Ps 81.19 billion (2021: Ps 31.8 billion) and Ps 124.7 billion (2021: Ps. 79.9 billion), respectively and derivatives held for risk management with a fair value of Ps 2.6 billion (2021: Ps 166.9 billion) with such characteristics. Most of these outstanding LIBOR-based loans, borrowings and contracts include fallback provisions to alternative reference rates.
However, it is not currently possible to determine whether, or to what extent, any such changes would affect us. The implementation of alternative benchmark rates may have a material adverse effect on our business, results of operations, financial condition and prospects.
We may be adversely affected by fluctuations between the value of the Colombian peso, and the U.S. dollar as a result of U.S. dollar-denominated indebtedness and assets.
We face exposure to fluctuations in the rate of exchange between the Colombian peso and the U.S. dollar, particularly given the fact that the Colombian peso has historically experienced significant devaluations and depreciations. Fluctuations in the exchange rate between the value of the Colombian peso, and the U.S. dollar may also negatively affect our leverage and capitalization ratios as measured by regulators or by rating agencies.
We are subject to impacts on our statement of income and/or statement of financial position derived from fluctuations of the Colombian peso, in particular, against the U.S. dollar, where most of our foreign long-term debt is denominated, as 23.3% of our average consolidated assets for the year ended December 31, 2022 and 31.1% of our average consolidated liabilities for the year ended December 31, 2022 were foreign currency-denominated.
We are exposed to changes in the values of current holdings and future cash flows denominated in other currencies, as part of our financial business as well as in the non-financial activities of Corficolombiana. For information on hedge accounting please refer to Note 10 of our audited consolidated financial statements.
Fluctuations in the exchange rate between the Colombian peso and the U.S. dollar may affect the value of our debt and investments on our statement of financial position and cause us to recognize gains or losses in our statement of income. Any substantial fluctuation in the U.S. dollar relative to the Colombian peso could affect our results of operations and our ability to meet our future payment obligations and increase or decrease the peso value of our regulatory capital, risk-weighted assets and goodwill, thereby affecting capital ratios of our banking subsidiaries.
We are subject to trading risks with respect to our trading activities.
Our banking subsidiaries, Corficolombiana, Porvenir and some other subsidiaries are allowed to engage in proprietary trading, and we might derive a portion of our profits from such trading activities. As a result, any reduction in trading income could adversely affect our results of operations and financial condition. Our trading income is volatile and dependent on numerous factors beyond our control, including, among
26
others, market trading activity, interest rates, exchange rates and general market volatility. A significant decline in our trading income, or large trading losses, could adversely affect our results of operations and financial condition.
Declines in the market price for securities and expected losses could result in impairment losses as well as increased unrealized losses on other securities. Losses in the Colombian equity markets could result in further losses from impairment or sale of these securities as well as increases in unrealized losses. Any significant increases in exposure to any of these non-traditional risks, or a significant increase in credit risk or bankruptcy of any of the counterparties, could materially and adversely affect our results of operations and financial condition.
Colombian law and similar regulations in countries in which we operate, impose or might impose limitations on interest rates, and future additional restrictions on interest rates or banking fees could negatively affect our profitability.
The Colombian Commercial Code (“Código de Comercio”) limits the amount of interest our Colombian subsidiaries may charge on commercial transactions, including transactions of our banking subsidiaries. In the future, regulations in Colombia or other countries in which we operate, could impose increased limitations regarding interest rates or banking fees. Law 1430 of December 2010, as amended, authorizes the Colombian Government to impose or place limits on tariffs and fees charged by banks and other financial institutions where the Government has determined that there is insufficient competition in a relevant market. Additionally, the law requires the Superintendency of Finance to implement a monitoring scheme of the tariffs and fees charged by the financial institutions in their relevant markets and to report the results of this evaluation semi-annually to the Colombian Government. The Colombian Government issued Decree 4809 of 2011 and Decree 1854 of 2015, which (i) require banks to provide each of their clients with statements of all fees charged to such clients on an annual basis, (ii) set a limit on the fees that banks may charge to their clients for withdrawals from automated teller machines of other banks and (iii) establish that transactions through the internet may not cost more than those made through other channels. Accordingly, the Superintendency of Finance has issued External Circular 012 of 2012, setting the rules and principles that must be followed by banking and financial institutions at the time of establishing, publishing and promoting their tariffs and fees. In 2022, Colombian Congress enacted different laws which may potentially impact our business. For example, Law 2277 of 2022 increased the income tax for financial entities, which now must pay an income tax rate 5% higher than other types of corporations.
Local authorities may impose requirements on the ability of residents, including our businesses, to obtain loans denominated in foreign currency.
Under local exchange control requirements, authorities may impose certain mandatory deposit requirements in connection with foreign currency-denominated loans obtained by residents, including our businesses. Future measures or requirements imposed by local authorities, such as mandatory deposit requirements, may adversely affect our and our clients’ ability to obtain loans in foreign currency.
Our businesses face constitutional actions, class actions and other legal actions involving claims for significant monetary awards against financial institutions, which may affect our businesses.
Under the Colombian Constitution and similar regulations in other countries in which we operate, individuals may initiate constitutional actions (acciones populares), or class actions (acciones de grupo), to protect their collective or class rights, respectively. Individuals may also initiate constitutional actions for the protection of their fundamental rights, known as “Tutelas”. Colombian financial institutions, including our banking subsidiaries, Corficolombiana and Porvenir, and other of our businesses have been, and continue to be, subject to these actions with regard to fees, financial services, mortgage lending and interest rates, the outcomes of which are uncertain. In addition, the number of such actions could increase in the future and could significantly affect our businesses.
Acquisitions and strategic partnerships may not perform in accordance with expectations, may fail to receive required regulatory approvals or may disrupt our operations and adversely affect our credit rating and profitability.
A component of our strategy is to identify and pursue growth-enhancing strategic opportunities, such as acquisitions and alliances, inside and outside of Colombia. As part of that strategy, we have acquired interests in various financial institutions in recent years. Strategic acquisitions and alliances could expose us to risks with which we have limited or no experience, as in the case of any significant acquisition outside of Colombia. In addition, potential acquisitions in Colombia and elsewhere may be subject to regulatory approval. We may be unsuccessful in obtaining any such approval or we may not obtain approvals on terms that are acceptable for us particularly in view of our subsidiaries’ and our combined significant market share in the Colombian banking industry.
We must necessarily base any assessment of potential acquisitions and alliances on assumptions with respect to operations, profitability and other matters that may subsequently prove to be incorrect. Future acquisitions and alliances, as well as other investments, may not produce anticipated synergies or perform in accordance with our expectations and could adversely affect our operations and profitability. In addition, new demands on our existing organization and personnel resulting from the integration of new acquisitions could disrupt our operations and adversely affect our operations and profitability.
27
We may not be able to manage our growth successfully.
We have been expanding the scope of our operations over the past years and we expect that this expansion will continue. As we continue to grow, we must improve our operational, technical and managerial knowledge and compliance systems in order to effectively manage our operations across the expanded group. Failure to successfully integrate, monitor and manage expanded operations could have a material adverse effect on our reputation and financial results. Our future growth will also depend on our access to internal and external financing sources. We may be unable to access such financing on commercially acceptable terms or at all.
We are subject to operational risks.
Our business depends on the ability of our banking subsidiaries to process large numbers of transactions efficiently and accurately. Operational risks and losses can result from fraud, employee error, failure to properly document transactions or to obtain proper internal authorization, failure to comply with regulatory requirements, breaches of conduct of business rules, equipment failures, natural disasters or the failure of external systems, among others.
The procedures adopted by Grupo Aval's banking subsidiaries regarding operational risk management were designed to identify and measure the risks to which the entities are exposed in the development of their operations, the establishment of controls for the adequate mitigation of the identified risks and the monitoring of the effectiveness of the system of controls. However, there can be no assurance that the currently adopted procedures will be effective in identifying or appropriately mitigating all of the operational risks we face.
Failure of our information systems could materially and adversely affect the effectiveness of our risk management and internal control processes as well as our results of operations and financial condition.
We and our subsidiaries are highly dependent on the ability to collect and process, on a timely basis, a large amount of financial and other information, transactions and services and products, at a time when transaction processes have become more complex with increasing volumes and increasingly shorter response expectations from our stakeholders. If we are unable to maintain these capabilities, our business operations, financial condition, reputation and results of operations could be materially and adversely affected. A partial or complete failure of any of these systems could materially and adversely affect our decision-making process, risk management, internal control systems and quality service, as well as our ability to respond on a timely basis to changing market conditions. Additionally, increased dependency on communications as well as the migration of processes to cloud operations can increase our exposure to IT failures and cybersecurity threats. See “—We are subject to cybersecurity threats”.
In addition, Grupo Aval and our subsidiaries ability to remain competitive will depend in part on our ability to upgrade our IT infrastructure and implement digitalization of products profitably through agile methodologies in environments with major planning challenges due to, for example, supply chain difficulties that have arisen over the last year increasing the lead times to obtain hardware. We and our subsidiaries must continually make significant investments and improvements in our and their IT infrastructure in order to ensure the proper functioning of financial controls, accounting and other data collection and processing systems and to remain competitive. Furthermore, as our banking subsidiaries open new branches and channels, they will need to improve their IT infrastructure, including maintaining and upgrading their software and hardware systems and their back-office operations. If there are technological impediments, unforeseen complications, errors or breakdowns in implementing new systems, our business, financial condition or results of operations may be adversely affected.
We are subject to cybersecurity threats
We and our subsidiaries dedicate significant resources to regularly maintaining and upgrading our systems to implement technology that protects our networks against cyberattacks. For example, we have implemented risk analysis processes and controls and a Computer Security Incident Response team - CSIRT to attend incidents and emergencies. This team has developed strategies to work in a coordinated manner against joint threats and implements simulated scenarios to test its reaction capabilities. In addition to the above, we and our subsidiaries also made progress in the selection and adoption of emerging technologies that allow us to strengthen our technical capacity such as User and Entity Behavior Analytics - UEBA, Endpoint Detection and Response - EDR, Cloud Access Security Broker - CASB, Cloud Security Posture Management – CSPM, among others. While we frequently experience cyberattacks, such as malware and ransomware infections, phishing, interception of sensitive data in cyberspace, and other attacks, which have required immediate CSIRT attention and have resulted in some temporary interruptions in non-operational areas, these attacks have not, to date, had a material impact on our business or clients. Depending on the seriousness of a cybersecurity incident, they are required to be reported to the corresponding committees of Information and IT security, and to the executive levels and Board of Directors of Grupo Aval. Nonetheless, future attacks could be more severe and have a material adverse impact on our business.
If one or more cyber-threats occur, it could result in a security impact on our systems and jeopardize our or subsidiaries customers’, or counterparties’ personal, confidential, proprietary or other information processed, stored in, and transmitted through our and our third-party providers’ computer systems. Furthermore, such events could cause interruptions or malfunctions in our or our subsidiaries customers’,
28
counterparties’ or third parties’ operations, which could result in reputational damage with our or our subsidiaries customers’, reduced demand for our services and products, additional costs to us (such as repairing systems, adding new personnel or technologies), regulatory investigations, litigation or enforcement, or regulatory fines or penalties, all or any of which could adversely affect our business, financial condition or results of operation.
Cyber-attacks maintain a trend of sophistication and specialization, as well as a higher level of visibility of the same before the public, and even though none of the high-level media cases affected us or our subsidiaries, we remain alert as those incidents can occur and persist for a long period of time without our being able to detect them. Cyberattack investigations can be unpredictable and take time to complete. During that time, we may not know the extent of the damage caused or the best way to remedy such a cyberattack.
Additionally, we may not take the most appropriate actions to remediate or mitigate a cyber-attack, which would further exacerbate the costs and consequences of a cyber-attack.
As financial institutions, we and our subsidiaries are susceptible to cybersecurity risks such as malware, ransomware, computer hackers, disgruntled employees and other causes that could affect the IT infrastructure that supports our service channels. These risks have increased significantly due to the proliferation of new technologies, the use of the internet and automated processes, the diversification of channels to perform financial transactions, hand in hand with the development of new techniques of organized crime, hackers, hacktivists, terrorists and other external parties.
The high demand for specialized personnel in the field of cybersecurity combined with an insufficient preparation in the field may impact our ability to identify or timely hire such personnel, which could adversely impact our ability to deal with cybersecurity challenges in the future.
Furthermore, the SEC proposed amendments to its rules to enhance and standardize disclosures regarding cybersecurity risk management, strategy, governance and incident reporting. The cost of implementing any measures required to be able to comply with the rules, once such amendments are finalized and effective, is uncertain and we cannot determine the extent of the impact, if any, that such costs would have on our operations.
See “Item 4. Information on the company—Other corporate information—Cybersecurity”
Our policies and procedures may not be able to detect money laundering and other illegal or improper activities fully or on a timely basis, which could expose us to fines and other liabilities.
We and our subsidiaries are required to comply with applicable anti-money laundering laws, anti-terrorism financing laws, anti-bribery and other regulations. These laws and regulations require us, among other things, to adopt and enforce “know your customer” policies and procedures, and to report suspicious or large transactions to the applicable regulatory authorities. While we and our financial institutions have adopted policies and procedures including ultimate beneficial owners identification, aimed at detecting and preventing the use of banking networks for money laundering activities and by terrorists and terrorist-related organizations and individuals generally, who are increasingly using sophisticated methods, such policies and procedures may not completely eliminate instances where they may be used by other parties to engage in money laundering and other illegal or improper activities.
We and our subsidiaries are subject to laws and regulations that prohibit corrupt payments to public officials, including the U.S. Foreign Corrupt Practices Act and Colombian regulations on transnational bribery. We have implemented Corporate Anti-corruption Policies and procedures, which incorporate, among other things, training, reporting channels, monitoring, internal investigations, and sanctions. While this system is designed to prevent and detect corrupt behavior and transactions, it does not completely eliminate the risk that our subsidiaries´ employees, providers, clients or agents may engage in corrupt practices.
If we or any of our subsidiaries, joint ventures or other affiliates fail to fully comply with applicable anti-money laundering laws, anti-terrorism financing laws, anti-corruption laws and other regulations, the relevant Government authorities to which they report have the power and authority to impose fines and other penalties.
Competition and consolidation in the Colombian banking and financial industry could adversely affect our market position.
We operate in a competitive market. Since the 1990s, when the Colombian financial system was deregulated, there has been an ongoing process of consolidation that has included foreign bank participants entering the Colombian market. We expect that consolidation will lead to the creation of larger local financial institutions, including additional foreign banks, presenting the risk that we could lose a portion of our market share in the industry, adversely affecting our results of operations.
29
Various banking institutions, which have recently been incorporated in Colombia, target the microcredit and small and medium enterprises segments. Local subsidiaries of international financial institutions have entered the market targeting corporate clients. The businesses of these new credit institutions may affect our market position in the individual, small and medium enterprises and our merchant banking operation. We also face competition from non-bank and non-financial competitors, such as fintechs. Several fintechs have started to develop as nonregulated businesses and subsequently sought lower tier banking licenses (for example as “compañías de financiamiento”), allowing them to receive savings deposits. Also, the National Development Plan draft presented by the Government in January 2023 has proposed an Open Banking initiative, making it compulsory for banks to deliver the information and data of their customers to other entities, which may represent a competition risk for our business.
In addition, consolidation in the Colombian financial services industry has increased, which may also increase competition in the markets where we operate. See “Item 4. Information on the Company—B. Business overview—Competition”.
Furthermore, our banking subsidiaries may face challenges as new competitors enter the market or existing competitors may adjust their services with unique product or service offerings or approaches to providing banking services. New entrants could take advantage of regulatory arbitrage to compete with substantially lower cost structures. Non-traditional providers of banking services may offer and/or increase their offerings of financial products and services directly to customers. Several of these competitors may have long operating histories, large customer bases, strong brand recognition and significant financial, marketing and other resources. Technological advances and heightened e-commerce activities have increased consumers’ access to products and services, which has in turn intensified competition among banks and nonbanks in offering loans. Existing competitors and market entrants may adopt more aggressive pricing and rates and devote more resources to technology, infrastructure and marketing. If we are unable to successfully compete with current and new competitors, or if we are unable to anticipate and adapt our offerings to changing banking industry trends, including innovation, digitalization and technological changes, our business may be adversely affected.
Our ability to maintain our competitive position depends mainly on our ability to anticipate and fulfill the needs of new and current customers through the development of innovative services and products, and our ability to offer adequate services and strengthen our customer base through cross-selling. Our failure to effectively anticipate or adapt to emerging technologies or changes in customer behavior, including among younger customers, could delay or prevent our access to new digital-based markets which would in turn have an adverse effect on our competitive position and business.
Our efforts to offer new services and products may not succeed if product or market opportunities develop more slowly than expected or if the profitability of these opportunities is undermined by competitive pressures. As we expand the range of our products and services, some of which may be at an early stage of development in the Colombian market, we will be exposed to new and potentially increasingly complex risks and development expenses. Our employees and our risk management systems may not be adequate to handle such risks. In addition, the cost of developing products that are not launched is likely to affect our results of operations. Any or all these factors, individually or collectively, could have a material adverse effect on us.
We depend on our senior management and our Board of Directors, and the loss of their services could have an adverse effect on our business.
We are highly dependent on our senior management teams and Board of Directors at both the group and subsidiary levels, all of whom possess considerable experience and expertise and have strong relationships with customers, participants of the Colombian business.
The loss of the services of any of these members of our, or our subsidiaries’, senior management and members of the Board of Directors, could have an adverse effect on our business. Accordingly, our success is dependent on appropriately managing the risks related to executing a succession plan for senior management and members of the Board of Directors on a timely basis.
We are subject to reputational risk, and our reputation is closely tied to that of our controlling shareholder, our senior management and members of the Board of Directors, and that of our subsidiaries.
Damage to our reputation may limit our ability to attract customers, employees and investors. Harm to our reputation can arise from employee or former employee misconduct, legal and regulatory non-compliance, ethical issues, allegations of money laundering, and failing to deliver minimum standards of service and quality, among others. In particular, our success has been attributable, in part, to the high esteem in which our controlling shareholder Mr. Sarmiento Angulo, our president, Mr. Sarmiento Gutiérrez, some of our senior management and our subsidiaries’ senior management and members of the Board of Directors are held in Colombia and the markets in which we operate. Reputation plays an integral role in our business operations, which are based on customer confidence and trust. If the public image or reputation of any of the foregoing is damaged as a result of negative publicity or otherwise, business relationships with customers of Grupo Aval may deteriorate, which would adversely affect our results of operations and financial condition. Any perceived or real difficulties experienced by any one of our subsidiaries would harm the reputation of Grupo Aval as a whole, which would also have an adverse effect on our results of operations and financial condition.
30
We are controlled by Mr. Sarmiento Angulo, whose interests could differ from the interests of other common, preferred shareholders and ADS holders.
Mr. Sarmiento Angulo beneficially owns 97.8% of our common shares outstanding and 45.4% of our preferred shares outstanding, as of April 10, 2023, and, accordingly, controls our group. See “Item 7. Major Shareholders and Related Party Transactions—A. Major shareholders”. The preferred shares do not have any voting rights and thus will not affect such control of our Group. Mr. Sarmiento Angulo will continue to have the right to control decisions, regardless of how our minority shareholders may vote on these issues and regardless of the interests of such shareholders, including holders of ADSs and underlying preferred shares. In addition to Mr. Sarmiento Angulo’s beneficial ownership through Grupo Aval, as of April 10, 2023, he beneficially owns 8.3% of Banco de Bogotá, 13.3% of Banco de Occidente, 15.5% of Banco AV Villas, 0.8% of Banco Popular and 11.5% of Corficolombiana.
Circumstances may occur in which Mr. Sarmiento Angulo may have an interest in pursuing transactions that, in his judgment, enhance the value of his several investments in the financial sector. These transactions may not necessarily be in Grupo Aval’s interest or that of its shareholders even if holders of the ADSs or the underlying preferred shares disagree. Due to his control, Mr. Sarmiento Angulo has, and will have, the power to:
| ● | elect a majority of our directors and appoint our executive officers, set our management policies and exercise overall control over our company and subsidiaries; |
| ● | agree to sell or otherwise transfer his controlling stake in our company; and |
| ● | determine the outcome of substantially all actions requiring shareholder approval, including transactions with related parties, corporate reorganizations, acquisitions and dispositions of assets, and dividends. |
In addition, the concentration of ownership may have the effect of delaying, preventing, or deterring a change of control of our company, could deprive our shareholders of an opportunity to receive a premium for the ADSs or underlying preferred shares as part of a sale of our company and might ultimately affect the market price of the ADSs and the underlying preferred shares.
We may engage in additional transactions with our controlling shareholder in the future.
In the future we may engage, as we have done in the past, in business and financial transactions with our controlling shareholder and other shareholders that may present potential conflicts of interest between our company and these shareholders. See “Item 7. Major Shareholders
and Related Party Transactions—B. Related party transactions.” While we believe that these transactions will be carried out on an arm’s-length basis, commercial and financial transactions between us and our controlling shareholder could create the potential for, or could result in, conflicts of interests between us and our other shareholders. To the extent that the price we pay for any assets acquired from our controlling shareholder exceeds the market value of such assets or is not as productive a use of our cash as other uses, our results of operations and financial condition could be adversely affected.
Risks relating to our preferred shares and ADSs
Exchange rate volatility may adversely affect the Colombian economy, the market price of the ADSs and the dividends payable to holders of the ADSs.
Pursuant to Colombian law, the Colombian Central Bank has the power to intervene in the exchange market in order to consolidate or dispose of international reserves, as well as to control any volatility in the exchange rate, acting through a variety of mechanisms, including discretionary ones. During recent years, the Colombian Central Bank has employed a floating exchange rate system with periodic interventions. From time to time, there have been significant fluctuations in the exchange rate between the Colombian peso and the U.S. dollar. Unforeseen events in international markets, fluctuations in interest rates, fluctuations in oil prices, changes in U.S. and international monetary policies, changes in capital flows, political developments or inflation rates may cause exchange rate instability that could, in turn, depress the value of the Colombian peso, thereby decreasing the U.S. dollar value of the dividends paid to holders of the ADSs.
Restrictions on purchasing our preferred shares may affect the market liquidity of our preferred shares and ADSs.
Under Colombian securities regulations, as a general rule, any transaction involving the sale of publicly traded shares of any Colombian company, including any sale of our preferred shares for the equivalent of 66,000 Unidades de Valor Real or “UVRs” (U.S.$ 4,496.5), or more, must be effected through the Colombian Stock Exchange. UVR is a Colombian inflation-adjusted monetary index calculated by the Board of Directors of the Colombian Central Bank and generally used for pricing home-mortgage loans (one UVR = Ps 327.7 (U.S.$ 0.07)
31
and 66,000 UVRs = Ps 21,628,899.6 at December 31, 2022). Any transfer of preferred shares underlying the ADSs may be required to be sold through the Colombian Stock Exchange, which could limit their liquidity or affect their market price.
The relative illiquidity of the Colombian securities markets may impair the ability of preferred shareholders and holders of ADSs to sell preferred shares underlying the ADSs.
Our preferred shares are listed on the Colombian Stock Exchange, which is relatively small and illiquid compared to securities exchanges in major financial centers. In addition, a small number of issuers represent a disproportionately large percentage of the market capitalization and trading volume on the Colombian Stock Exchange. A liquid trading market for the preferred shares or ADSs may not develop on the Colombian Stock Exchange or New York Stock Exchange, respectively. A limited trading market could impair the ability of a holder of preferred shares or ADSs to sell preferred shares (in the case of an ADS holder, obtained upon withdrawal of such shares from the ADR facility) on the Colombian Stock Exchange in the amount and at the price and time desired by such holder, and could increase the volatility of the market price of the preferred shares and the ADSs. In addition, a decrease in the liquidity of our ADR program may also impair investors’ ability to sell our preferred shares or ADSs in the New York Stock Exchange.
An active market for our preferred shares and the ADSs may not continue to develop or be maintained and the market price of our preferred shares and the ADSs may fluctuate in response to numerous factors.
The market price of our ADSs and preferred shares may fluctuate significantly in response to numerous factors, many of which are beyond our control, including actual or anticipated fluctuations in our operating results, economic downturns, political events in Colombia, or Panama, developments affecting the banking industry, exchange rates, changes in financial estimates by securities analysts or our failure to perform in line with such estimates, departures of key personnel, and sales of our preferred shares in the future, including by our banking subsidiaries who may have to sell our preferred shares obtained from investors who entered into loans with them to acquire our preferred shares in our offering of preferred shares in 2011, or the “Preferred Shares Local Offering”. Furthermore, common shares may be converted into preferred shares on a 1-1 basis provided that our preferred shares do not exceed 50% of our total subscribed share capital. Preferred shares are available for deposit into the ADS Program.
Holders of ADSs and underlying preferred shares may face difficulties in protecting their interests because we are subject to different corporate rules and regulations than those available in other jurisdictions, and our preferred shareholders have limited rights.
Holders of ADSs are not direct shareholders of our company and are unable to enforce the rights of shareholders under our by-laws and Colombian law. Under Colombian law, holders of our preferred shares may have fewer rights than shareholders of a corporation incorporated in the United States. Even if a holder of ADSs surrenders its ADSs and becomes a direct shareholder, a holder of our preferred shares under Colombian law may have fewer alternatives to protect its interests relative to actions by our Board of Directors or executive officers, and these alternatives may be less well-defined than under the laws of those other jurisdictions. In addition, holders of the ADSs and our preferred shares are not entitled to vote for the election of directors or to influence our management policies. Under our by-laws and Colombian law, holders of preferred shares (and, consequently, holders of ADSs) have no voting rights in respect of preferred shares, other than in limited circumstances.
The Colombian securities markets are not as highly regulated or supervised as the U.S. securities markets or the markets in some other jurisdictions. In addition, rules and policies against self-dealing or for preserving shareholder interests may be less well-defined and enforced in Colombia than in the United States and certain other countries, which may put holders of our preferred shares and the ADSs at a potential disadvantage. Corporate disclosures also may be less complete or informative than for a public company in the United States or in certain other countries.
Our ability to pay dividends on the ADSs or underlying preferred shares may be limited by Colombian law and because we are a holding company dependent on dividends from subsidiaries.
Under Colombian law, a company may only distribute dividends to the extent such distribution is fully supported by accurate financial statements demonstrating the financial condition of the company. Any dividends distributed in violation of this provision may not be reclaimed from shareholders who received such payments in good faith, and any subsequent distribution of profits may be suspended. In addition, dividends may not be distributed until losses from previous fiscal years have been absorbed. Dividends must be approved at the ordinary annual shareholders’ meeting.
Our ability to pay dividends on the preferred shares represented by ADSs will be contingent upon the financial condition of our subsidiaries. Any of our banking subsidiaries may be restricted from paying dividends to us if such subsidiary does not meet its required technical capital ratios or does not have sufficient retained earnings. In addition, we conduct substantially all of our operations through subsidiaries and are dependent on dividends from our subsidiaries to meet our obligations.
32
Holders of ADSs may encounter difficulties in the exercise of dividend rights and in the limited voting rights of our preferred shares.
Holders of ADSs may encounter difficulties in exercising rights with respect to the preferred shares underlying ADSs. If we make a distribution to holders of underlying shares in the form of securities or rights to acquire securities, the depositary is allowed, in its discretion, to sell those securities or rights on behalf of ADS holders and instead distribute the net proceeds to the ADS holders. Also, under some circumstances, you may not be able to exercise your limited voting rights by giving instructions to the depositary.
Our status as a foreign private issuer allows us to follow alternate standards to the corporate governance standards of the NYSE, which may limit the protections afforded to investors.
We are a “foreign private issuer” within the meaning of the NYSE corporate governance standards. Under the NYSE rules, a foreign private issuer may elect to comply with the practices of its home country and not to comply with certain corporate governance requirements applicable to U.S. companies with securities listed on the NYSE. We currently follow Colombian practices concerning corporate governance and intend to continue to do so. Accordingly, you will not have the same protections afforded to shareholders of companies that are subject to all NYSE corporate governance requirements. See “Item 6. Directors, Senior Management and Employees—C. Board practices—Principal differences between Colombian and U.S. corporate governance practices”.
Preemptive rights may not be available to holders of preferred shares or ADSs.
Colombian law and our by-laws require that, whenever we issue new common shares, we must offer the holders of common shares the right to subscribe a number of shares of such class sufficient to maintain their existing percentage ownership of our aggregate share capital. On the other hand, holders of preferred shares, including holders of ADSs, are entitled to preemptive rights only when so declared at a meeting of holders of our common shares. Our common shareholders may decide not to provide for such preemptive rights. Also, U.S. holders of ADSs may not be able to exercise their preemptive rights through JPMorgan Chase Bank, N.A., which acts as ADR depositary for our ADR facility, unless a registration statement under the Securities Act is effective with respect to such rights or an exemption from the registration requirement thereunder is available. Although we are not obligated to do so, we or our shareholders, as applicable, could consider at the time of any preemptive rights offering the costs and potential liabilities associated with any such registration statement, the benefits to us from enabling the holders of the ADSs to exercise those rights and any other factors deemed appropriate at the time, and will then make a decision as to whether to file a registration statement. Accordingly, we might decide not to file a registration statement in some cases.
If holders of ADSs are unable to exercise these rights because a registration statement has not been filed and no exemption from the registration requirement under the Securities Act is available, the ADR depositary may attempt to sell the holders’ preemptive rights and distribute the net proceeds from that sale, if any, to such holders, provided that, the meeting of holders of our common shares decides that holders of preferred shares are entitled to preemptive rights. The ADR depositary, after consultation with us, will have discretion as to the procedure for making preemptive rights available to the holders of ADSs, disposing of such rights and making any proceeds available to such holders. If by the terms of any preemptive rights offering or for any other reason the ADR depositary is unable or chooses not to make those rights available to any holder of ADSs, and if it is unable or for any reason chooses not to sell those rights, the depositary may allow the rights to lapse.
Whenever the rights are sold by the ADR depositary or such rights lapse, or if the common shareholders’ meeting does not grant preemptive rights to the holders of preferred shares, the equity interests of the holders of ADSs will be proportionately diluted.
Our ability to make payments on the ADSs may be adversely affected if we become unable to convert Colombian pesos to U.S. dollars or to transfer U.S. dollars abroad.
The Colombian Government does not currently restrict the ability of Colombian persons or entities to convert Colombian pesos to U.S. dollars. However, the Government may impose foreign exchange controls on dividend payments and remittances of interest and principal if the foreign currency reserves of the Central Bank fall below a level equal to the value of three months of imports into Colombia. Colombian law also allows the imposition of a deposit requirement with the Central Bank in connection with any foreign exchange transaction that may increase the cost of foreign exchange transactions or limit the amount of such transactions for a particular time. No such foreign exchange controls are currently applicable. Nevertheless, such restrictions may be imposed in the future, and any such restrictions could prevent, restrict or increase the price of our access to U.S. dollars, which we need to pay our foreign currency-denominated obligations.
We are traded on more than one market and this may result in price variations; in addition, investors may not be able to easily move shares for trading between such markets.
Trading in our ADSs on the NYSE or preferred shares on the Colombian Stock Exchange take place in different currencies (U.S. dollars on the NYSE and pesos on the Colombian Stock Exchange), and at different times (resulting from different time zones, different trading days and different public holidays in the United States and Colombia). The trading prices of our shares on these two markets may differ due to
33
these and other factors. Any decrease in the price of our preferred shares on the Colombian Stock Exchange could cause a decrease in the trading price of our ADSs on the NYSE. Investors could seek to sell or buy our shares to take advantage of any price differences between the markets through a practice referred to as arbitrage. Any arbitrage activity could create unexpected volatility in both our share prices on one exchange, and the shares available for trading on the other exchange. In addition, holders of ADSs will not be immediately able to surrender their ADSs and withdraw the underlying preferred shares for trading on the other market without effecting necessary procedures with the depositary. This could result in time delays and additional cost for holders of ADSs.
If holders of ADSs surrender their ADSs and withdraw preferred shares, they may face adverse Colombian tax consequences.
Although Colombian tax law does not specifically refer to the tax consequences applicable to an ADS holder withdrawing the underlying preferred shares, we believe, based on the advice of our Colombian counsel, that such a transaction should not result in a taxable event under Colombian law in the case of non-resident entities and non-resident individuals given the nature of the transaction. Nevertheless, this issue is not free from doubt, and the Colombian tax authorities may have a different interpretation of the law, or the law may change, and the Colombian tax authorities may assess taxes on the conversion of ADSs into preferred shares based upon the difference between the market value of the preferred shares and the adjusted tax basis of the ADSs. Furthermore, an investor who surrenders ADSs and withdraws preferred shares will be subject to income taxes on any gain associated with the sale of such preferred shares if such sale exceeds 10% of the issued and outstanding shares of the listed company during a taxable year.
Banking regulations, accounting standards and corporate disclosure applicable to us differ from those in the United States and other countries.
Colombian banking regulations may differ in material respects from regulations applicable to banks in other countries, including those in the U.S. For example, in Colombia, we are not subject to regulations applicable to financial institutions, although our banking subsidiaries, Corficolombiana, Porvenir and certain of our other subsidiaries are subject to such regulations. Since February 6, 2019, Grupo Aval is subject to supervision as the financial holding company of the Aval Financial Conglomerate. In addition, capital adequacy requirements for banks and financial conglomerates under Colombian regulations differ from those under U.S. regulations and may differ from those of other countries.
Colombia and other countries in which we operate have different corporate disclosure and accounting standards for our industry than those applicable in the United States. Financial reporting disclosure requirements in the jurisdictions in which we operate differ in certain significant respects from those required in the United States. There are also material differences between IFRS (as issued by the IASB) and Colombian IFRS. Accordingly, our separate financial statements may not be the same as the information available to holders of shares issued by a U.S. company. Furthermore, since January 1, 2015, we began preparing our financial statements in accordance with IFRS as issued by the IASB and, as a result, some of our financial data may not be easily comparable from period to period.
Judgments of Colombian courts with respect to our preferred shares will be payable only in pesos.
If proceedings are brought in Colombian courts seeking to enforce the rights of holders of our preferred shares, we will not be required to discharge our obligations in a currency other than Colombian pesos. Under Colombian law, an obligation in Colombia to pay amounts denominated in a currency other than Colombian pesos may only be satisfied in Colombian currency at the exchange rate, as determined by the Colombian Central Bank and published by the Superintendency of Finance, also known as Tasa Representativa del Mercado (TRM), in effect on the date the judgment is obtained, and such amounts are then adjusted to reflect exchange rate variations through the effective payment date. The then-prevailing exchange rate may not afford non-Colombian investors with full compensation for any claim arising out of or related to our obligations under the preferred shares, or indirectly, the ADSs.
U.S. investors in our preferred shares or the ADSs may find it difficult or impossible to enforce service of process and enforcement of judgments against us and our officers and directors.
We are incorporated under the laws of Colombia, and all of our subsidiaries are incorporated in jurisdictions outside the United States. In addition, our executive offices are located outside of the U.S. All of our directors and officers reside outside of the United States, and all or a substantial portion of our assets and the assets of most of our officers and directors are, and will most likely continue to be, located outside of the United States. As a result, it may be difficult or impossible for U.S. investors to serve legal process within the United States upon us or any of these persons or to enforce a judgment against us for civil liabilities in U.S. courts. In addition, you should not assume that courts in the countries where we or our subsidiaries are incorporated or where our or our subsidiaries’ assets are located (i) would enforce judgments of U.S. courts obtained in actions against us or our subsidiaries based upon the civil liability provisions of applicable U.S. federal and state securities laws or (ii) would enforce, in original actions, liabilities against us or our subsidiaries based on those laws.
There is also substantial doubt that the courts of Colombia would enter judgment in original actions brought in those courts predicated on U.S. federal or state securities laws. We have been advised by our Colombian counsel that there is no legal basis for original actions to be
34
brought against us or our directors and executive officers in a Colombian court predicated solely upon the provisions of the U.S. federal or state securities laws. In addition, certain remedies available under provisions of the U.S. securities laws may not be admitted or enforced by Colombian courts.
Grupo Aval’s by-laws contain an arbitration provision that provides for the exclusive jurisdiction of an arbitral tribunal to be seated at the Bogotá Chamber of Commerce. The arbitration provision provides that any conflict arising among shareholders, or between shareholders and Grupo Aval, in connection with the by-laws must be resolved by the arbitral tribunal. See “Item 4. Information on the Company—B. Business overview—Service of Process and Enforcement of Judgments”.
ITEM 4. INFORMATION ON THE COMPANY
A. History and development of the company
We are Colombia’s largest banking group based on consumer loans, and the second largest based on commercial loans and deposits at December 31, 2022. We provide a comprehensive range of financial services and products from traditional banking services, such as making loans and taking deposits, to pension and severance fund management.
Grupo Aval Acciones y Valores S.A. is a “sociedad anónima”, domiciled in Bogotá, Colombia and organized under Colombian laws and regulations. Grupo Aval was incorporated on January 7, 1994 under the name Administraciones Bancarias S.A. On April 18, 1997, the company changed its name to Sociedad A.B. S.A., and on January 8, 1998 to Grupo Aval Acciones y Valores S.A. Grupo Aval was created by our chairman, Mr. Sarmiento Angulo, to consolidate his interests in the Colombian financial sector.
The following are some of the main milestones in the development of the company:
| ● | In 1971, Mr. Sarmiento Angulo acquired a majority stake in Banco de Occidente, and in 1972 founded Corporación de Ahorro y Vivienda Las Villas to focus on low- and middle-income mortgage financing. In 1981, Mr. Sarmiento Angulo purchased a minority stake in Banco de Bogotá, and in 1988 he acquired a majority stake and control, consolidating a major participation in the banking system. Banco de Bogotá acquired a substantial majority of, and absorbed, Banco del Comercio in 1992. |
| ● | In 1991, Banco de Bogotá and Banco de Occidente founded Porvenir as a severance fund manager, and following the creation in 1993 of the private pension fund system in Colombia, expanded the business to include pension fund management in 1994. In 1996, Banco Popular was acquired from the Colombian Government. In 1997, Mr. Sarmiento Angulo acquired Corporación de Ahorro y Vivienda Ahorramas, which was later merged with Corporación de Ahorro y Vivienda Las Villas in 2000 and became Banco AV Villas in 2002. |
| ● | Between 1997 and 1999, Corficolombiana (which was founded in 1959 as an affiliate of Banco de Bogotá) acquired and merged with several merchant banks, including Corfitolima, Corfiprogreso, Corfes, Corfiboyacá, Corfisantander, Corfiandes and Indufinanciera. In 2005, Corfivalle, also a merchant bank merged with Corficolombiana. |
| ● | In 1998, Mr. Sarmiento Angulo contributed a majority of his direct and indirect holdings in the financial institutions into Grupo Aval. The Red Aval (Grupo Aval Network) was also established in 1998 to provide an integrated service network of branches and ATMs. |
| ● | Our international expansion began in 2010, with the acquisition of BAC Credomatic from GE Consumer Finance Central Holdings Corp. and General Electric Capital Corporation. In December 2013, we expanded our Central American operations with the acquisitions of BBVA Panamá (merged into BAC International Bank, Inc.) and Grupo Reformador (merged into Banco de América Central S.A. (Guatemala)). |
| ● | On April 18, 2013, we acquired Horizonte and completed its merger into Porvenir on December 31, 2013. |
| ● | On June 21, 2016, Grupo Aval, Banco de Bogotá, Banco de Occidente and Banco Popular entered into the Amended Corficolombiana Shareholders’ Agreement to provide for Grupo Aval to directly control Corficolombiana. Prior to June 21, 2016, Banco de Bogotá, which held a 38.3% equity interest in Corficolombiana, controlled Corficolombiana. |
| ● | On December 4, 2018, Aval Soluciones Digitales S.A. received an operating license issued by the Superintendency of Finance, to act as the first SEDPE (Specialized Companies in Deposits and Electronic Payments) created by a financial institution in Colombia. |
35
| ● | On December 31, 2018, our controlling shareholder registered Grupo Aval and some of its subsidiaries as part of the Sarmiento Angulo’s economic group (Grupo Empresarial Sarmiento Angulo) before the Chamber of Commerce of Bogotá. |
| ● | On February 6, 2019, Law 1870 of 2017 came into force designating Grupo Aval as the holding company of the Aval Financial Conglomerate (which includes, aside from the holding company, all of the financial subsidiaries of the group). As such, Grupo Aval Acciones y Valores S.A. is now under surveillance of the Superintendency of Finance. |
| ● | On May 22, 2020, we acquired through BHI, 96.6% of the common shares of MFG, and in June 2020, BHI acquired an additional 3.0% of MFG’s common shares. |
| ● | On July 28, 2021, Grupo Aval, Banco de Bogotá, Banco de Occidente, Fiduciaria Bogotá and Fiduciaria de Occidente entered into the Porvenir Shareholders’ Agreement to provide for Grupo Aval to directly control Porvenir. Prior to July 28, 2021, Banco de Bogotá, which held a 36.5% equity interest in Porvenir, controlled Porvenir. |
| ● | On March 25, 2022, after obtaining the necessary approvals, Banco de Bogotá executed a spin-off of a 75% equity stake in BHI to its shareholders and Grupo Aval subsequently spun-off its equity interest to its shareholders. As a result of the spin-off, Banco de Bogotá ceased to control BHI, retaining a 25% equity interest recognized as an investment in associates. Prior to the spin-off, BHI transferred its interest in MFG to Banco de Bogotá and, accordingly, MFG remains as a consolidated subsidiary. As a result of the spin-off, our Central American operations are limited to Panamá. |
| ● | On December 6, 2022, and following the required corporate governance procedures, Banco de Bogotá obtained the necessary approvals to sell its 25% equity interest in a tender offer for up to 25% of BHI’s outstanding shares, launched by Esadinco S.A. (an affiliate of Mr. Sarmiento Angulo) on October 14, 2022. The offer was oversubscribed 1.20x, and as a result, on December 19, 2022, Banco de Bogotá sold 20.89% of its stake in BHI. The remaining 4.11% ceased to be an investment in associates and was recognized as a financial asset at fair value with changes in OCI (FVOCI). Grupo Aval retained an indirect stake of approximately 2.29% in BHI (representing our proportional interest in the 4.11% equity stake in BHI retained by Banco de Bogotá). On March 17, 2023, Banco de Bogotá sold the aforementioned 4.11% equity stake in BHI to Endor Capital Assets S.R.L. (an affiliate of Mr. Sarmiento Angulo). |
Since 1999, Grupo Aval’s common shares have traded on the Colombian Stock Exchange under the ticker symbol “GRUPOAVAL”. Our preferred shares have been listed on the Colombian Stock Exchange since February 1, 2011 under the symbol “PFAVAL”. On September 22, 2014, we completed a SEC-registered initial public offering in the United States. Our ADSs began to trade on the New York Stock Exchange, or NYSE, under the symbol “AVAL” on September 23, 2014. Each ADS represents 20 preferred shares. For more information see “Item 9. The Offer and Listing—C. Markets”.
We have also completed three bond issuances in the international market through Grupo Aval Limited fully and unconditionally guaranteed by Grupo Aval Acciones y Valores S.A., in addition to those from our subsidiaries:
| ● | In February 2020, we completed our third international bond offering, issuing U.S.$1.0 billion (Ps 3,401.6 billion) at the date of the issuance of our 4.375% Senior Notes due 2030. |
In addition, we have completed multiple issuances on the local markets with an outstanding balance of Ps 1,138.6 billion and Ps 1,132.6 billion at December 31, 2022 and December 31, 2021, respectively. The most recent of which are:
| ● | Grupo Aval’s sixth bond issuance in the local market on 2017 in an amount of Ps 400.0 billion. |
| ● | Grupo Aval´s first tranche of its first issuance program of ordinary bonds in November 2019 in an amount of Ps 400.0 billion. |
See Note 21 of our audited consolidated financial statements for further information on Grupo Aval’s financial obligations from issued bonds.
The SEC maintains an internet website that contains reports, proxy, information statements and other information about issuers, like us, that file electronically with the SEC. The address of that website is www.sec.gov. The Company’s website address is www.grupoaval.com. The information contained on, or that can be accessed through, the Company’s website is not part of, and is not incorporated into, this Annual Report. The Company’s headquarters are located at Carrera 13 # 26A – 47, 23rd floor in Bogotá, Colombia and our telephone number is (+57) (601)743-3222.
36
B. Business overview
Our strategy
As noted above, following the spin-off and divestiture of Aval’s stake in BHI, a substantial majority of our operations are in Colombia. As a result, during 2022 we shifted our strategic focus to Colombia, and by doing so, we believe we have increased our agility and flexibility to respond to the dynamics of the local markets, improve our strategic position and capture future growth.
As one of the largest banking groups in Colombia, we offer a comprehensive range of financial services that allow us to have diversified sources of income and enhance our profitability. We operate through a multi-brand strategy that enable us to capitalize on the strengths, particular knowledge and best practices of each of our subsidiaries and our qualified and experienced management teams, see “Item 6. Directors, Senior Management and Employees”. We believe this strategy has led us to be well positioned to take advantage of market opportunities derived from economic cycles.
We closely monitor the performance of our subsidiaries and the performance of our competitors, promote best practices and create synergies and efficiencies that can be captured across our subsidiaries. We work on organically improve our market position, launch new products to serve new segments, improve our existing product and service offering and have cost-effective channels.
From time to time, we explore merger and acquisition opportunities. We have a proven track record of identifying, acquiring and integrating interests in companies we believe have strategic value to us. We provide support to our banking subsidiaries’ management teams in identifying opportunities, negotiating favorable terms and implementing acquisitions. We independently assess a prospective target’s strategic fit with the acquiring banking subsidiary and within our group as a whole, and aid our banks in evaluating, negotiating and implementing acquisitions.
All in all, we focus our efforts on pursuing our strategic goal of profitable and sustainable growth, primarily through the five strategic pillars:
| i) | Risk management |
| ii) | Innovation and digitalization |
| iii) | Efficiency and economies of scale |
| iv) | Talent management |
| v) | Social and environmental impact |
| (i) | Risk management |
Risk management is at the core of the banking business. Our strategic goal is to ensure that the financial risks we assume are within our risk appetite and are priced to generate long term value for our stakeholders and to strictly manage non-financial risks that we are exposed to in order to ensure the sustainability of our business.
Grupo Aval employs a risk management process that aims to identify, measure, monitor and control, as part of its daily activities, all the risks that fall under our risk management policies. We seek to excel in understanding, managing and pricing the financial risks, such as credit, liquidity, market, interest rate and capital risks, that we assume as part of our activity. We constantly monitor changes in the environment in order to assess our risk position and anticipate their impact on our business.
We implement risk underwriting standards and pricing discipline, seeking long-term value generation. Banks use funds transfer pricing (FTP) curves that allow them to isolate the risks managed by the asset liability management (ALM) units from the business units, as the base of an orderly pricing system for the intermediation activity.
We establish a corporate risk management system. Our subsidiaries must comply with risk related regulations in each jurisdiction they operate. In addition, our corporate risk function develops a consolidated assessment of the risks we take as a group, defines corporate risk policies, leads the effort to set risk appetites for our subsidiaries and oversee the implementation of appropriate risk management controls. Our risk management function coordinates group wide transformational initiatives. For a discussion of our risk management guidelines, see “Item 11. Quantitative and Qualitative Disclosures About Market Risk”.
37
We monitor and analyze cybersecurity incidents, assess their consequences, take the most appropriate actions to remediate or mitigate a cyber-attack and implement additional controls such as fraud intelligence, strengthening the enrollment process in digital channels, among others. Also, we make sure that our third-party service providers follow our security standards and maintain insurance coverage given the increasing sophistication of cyber-attacks. See “Item 4. Information on the company—Other corporate information—Cybersecurity”.
| (ii) | Innovation and Digitalization |
A second strategic pillar is to expand our product and service offerings and diversify our sources of income by focusing on: (i) improving our market share in profitable segments and products in which we have organic growth potential; (ii) launching new products to serve new customers and segments; (iii) enhancing our product and service offerings through digitalization; and (iv) expanding our cross-selling efforts.
In 2018 we launched a group-wide effort to lead the digital transformation, aligning our banking subsidiaries with a shared vision for a digital future. Our Colombian banking subsidiaries have launched joint efforts aligning our digital strategy to their individual capacities, with the aim of digitalizing their products, channels and processes in order to achieve operational efficiency and create more innovative products and services.
Our digital strategy considers 3 dimensions:
| ● | Digitalize existing products and processes. We intend to be more efficient, provide a better service and improve customer journeys. We believe that the banking industry is changing through efforts like ours. Accomplishing this objective will become a bank’s “ticket to play” in the future. Therefore, we are currently focusing most of our digitalization effort on this first dimension. So far, the digitalization of products has allowed banks to be closer to our customers and meet their financial needs. Additionally, we consolidated our data strategy capabilities by implementing a data platform "AUGUSTA" to apply analytics models to solve different business problems such as churn, buying propensity for our digital products, next best action, and fraud identification and prevention. |
| ● | Develop new digital business models. In order to compete for new customers, we constantly develop new products and services to decrease costs of acquisition, costs of service and improve customer experience. A couple of examples are: a) Matilde, a digital marketing platform, and b) dale!, a payment solution. -Matilde- generates personalized recommendations of products and services in digital advertising spaces, seeking to reduce the acquisition cost of digital products and reduce deployment times derived from the segmentation of audiences dale! is a 100% digital platform of Aval Soluciones Digitales S.A., to reach new customers with little or no penetration mainly due to high customer acquisition costs (CAC), low profitability or that belonged to younger generations more inclined to maintain digital-only relationships. |
| ● | Generate or participate in “digital ecosystems”. We believe that consumers are now looking for an integrated and seamless experience. For this reason, Grupo Aval aims to align the efforts of its different subsidiaries and strategic allies through a joint vision and digital tools. These efforts intend to embed our service portfolio in digital experiences from beginning to end, addressing our customers’ needs in terms of savings, investment, financing, and complementary services such as insurance and payments. This dimension of our digital strategy involves offering our digital financial products and services in a complementary way that adds value to the ecosystems through which other non-banking products and services are offered. |
| (iii) | Efficiencies and economies of scale |
Another Grupo Aval strategic pillar is to identify and capture synergies between our banking subsidiaries in order to achieve economies of scale and improve our efficiency.
We pursue opportunities to create synergies among our subsidiaries and leverage our combined strength. We intend to benefit from our combined scale, while retaining the agility and the resilience of a diversified group of entities. In addition, we seek to benefit throughout the Group from innovation originated in any one of our entities. We focus work on group-wide projects, such as digital banking and business process digitization, analytics, information technology, network integration (such as Red Aval) and procurement of goods and services, among others.
We work to identify potential synergies and assist in the implementation of technology and products developed at the holding level within our banks, to standardize and centralize technology and processes across each entity. We are migrating our main systems to the cloud, centralizing our entities telecommunications, standardizing some processes such as CRM and IFRS accounting, digitizing new products and transversal microservices and implementing homogeneous policies in all our technological processes such as cybersecurity.
38
Our marketing efforts are also coordinated pursuing two main objectives: (i) to increase the competitiveness of our subsidiaries; and (ii) to strengthen our positive corporate image, while encouraging our entities to establish their own identity. We negotiate corporate agreements for certain marketing services, develop initiatives to design and implement advertising and marketing campaigns of certain products and services for our subsidiaries and, set up marketing guidelines and pursue communications that increase the exposure of our brands and those of our subsidiaries.
We believe these efforts should allow us to improve our efficiency, benefiting from our combined scale by involving all our subsidiaries under a single umbrella.
| (iv) | Talent management |
Our strategic goal is to attract, develop and retain the best talent establishing conditions to maximize their well-being, enhance their capabilities and therefore contribute to Grupo Aval´s competitiveness.
To achieve this, we and our subsidiaries are committed to developing our human capital, focusing on well-being and training programs, diversity and inclusion, and in-house talent scouting at a corporate level. We are developing a corporate talent retention and promotion policies, supported on transparent goal setting and objective performance measurement and compensation.
| (v) | Social and Environmental Impact |
We believe that conducting business sustainably is central to achieving long-term value. In that sense, our social and environmental strategic pillar is to minimize the direct and indirect impact of our activities to achieve sustainable growth. In addition, we seek to prevent, mitigate, correct and compensate any negative impact that our operations may have. We seek to conduct our businesses in a sustainable manner, as we are committed to positively contribute to society and the reduction of our environmental impact. As part of our efforts, we coordinate the social and environmental initiatives of our subsidiaries, to increase our positive impact on our stakeholders. We are developing a comprehensive sustainability strategy based on sound corporate governance practices, environmental protection, and contribution to society.
ESG Model
We have developed an ESG Model that allows us to implement environmental, social, and governance initiatives in accordance with our strategic objective of achieving sustainable and profitable growth. Hence, our sustainability model covers five dimensions, which are aligned with our strategic pillars: (1) Corporate governance and risk, (2) Financial performance, (3) Corporate efficiencies and innovation, (4) Human capital and (5) Environment (social and environmental).
During 2022, our ESG initiatives were recognized in The Dow Jones Sustainability Index where we improved our rating by 10 points compared to the previous year. We reached 43 points, improving in the Social, Governance and Economic dimensions. In addition, Grupo Aval and its Colombian banking subsidiaries (Banco de Bogotá, Banco de Occidente, Banco Popular, and Banco AV Villas) joined the United Nations Environment Program Financial Initiative (UNEP FI), in order to support the transition to sustainable economies. Also, we maintained our adherence to the United Nations Global Compact, aligning our strategy with universally accepted principles and the contribution to and achievement of Sustainable Development Goals (SDGs).
Regarding our environmental dimension, at December 31, 2022, 1.8% of Banco de Bogota’s loan portfolio in Colombia was outstanding in industries that have positive environmental impact. Banco de Bogotá was the first bank to be certified as Carbon Neutral by ICONTEC (Instituto Colombiano de Normas Técnicas y Certificación) in June 2022. Furthermore, in December 2022, Banco de Bogotá adhered its lending and investment portfolios to the Net Zero Banking Alliance to align with pathways to net-zero by 2050. Separately Grupo Aval measured the carbon footprint for 2019, 2020, 2021 for scopes 1, 2 and 3, under GHG Protocol, evidencing a 56% reduction in GHG emissions between 2021 and 2019.
In relation to our social dimension, Grupo Aval, our banks, Porvenir and Corficolombiana renewed the Friendly Biz certification, endorsed by Future Builders and granted by CCLGBT (Cámara de Comerciantes LGBTI), recognizing us as entities with policies and processes that strengthen diversity, equity, and inclusion. Banco de Bogotá, Banco Popular, Banco de Occidente, Corficolombiana, and Porvenir have been recognized by Great Place to Work as some of the best employers in the country. Porvenir received the first-place award in Great Place to Work for women in Colombia. Grupo Aval, our subsidiary banks, Porvenir and Corficolombiana participated in Aequales PAR Ranking to find opportunities for improvement and promote actions that close gender equality gaps.
Regarding financial inclusion, dale!, Grupo Aval’s digital wallet, reached more than 600,000 customers in 2022, achieving 425% growth over the previous year and 2.3 million successful monetary transactions, 311% more than in 2021. Moreover, Banco de Bogotá allocated over Ps 216 billion to support microentrepreneurs in 756 Colombian municipalities, extended financial education activities to 356,000
39
beneficiaries, and issued over 300,000 UNICEF debit cards to support the education of Colombian children. Porvenir impacted more than 2 million people in 2022 with its financial education program, which received the quality seal granted by the Superintendency of Finance.
Regarding the governance dimension, Grupo Aval has a Corporate Governance Committee comprising members of the company’s senior management, which among others, is responsible for reviewing the company’s ESG matters. With respect to diversity in Grupo Aval’s Board of Directors, among other criteria, the experience, suitability, and moral character of board member candidates are determining factors. Grupo Aval’s Board of Directors is diverse in terms of age, gender, and profession (i.e. 28.5% of our board members are women).
Finally, our banks are in the process of implementing the Environmental and Social Risk Management System (ESRMS) for their respective loan portfolios. Banco de Occidente, Banco Popular, and Banco AV Villas started the diagnostic phase in 2022 and they expect to conclude the implementation process in 2023. Banco de Bogotá has had ESRMS since 2019.
Our operations
We manage our business through six main operating segments: Banco de Bogotá, Banco de Occidente, Banco Popular, Banco AV Villas, Porvenir and Corficolombiana (see Note 31 to our audited consolidated financial statements for more information), through which we conduct three main business lines: Commercial banking, merchant banking and pension and severance fund management. Prior to March 2022, BHI was one of our operating segments through which we consolidated our interests in BAC. See “Item 4. Information on the Company – A. History and development of the company”
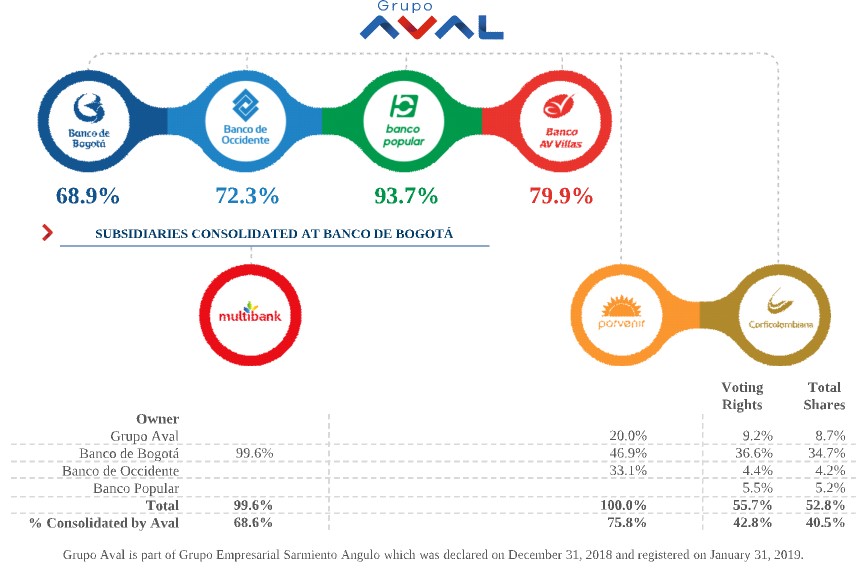
Source: Company data at December 31, 2022. Porvenir is held in Banco de Bogotá as follows: 36.5% through Banco de Bogotá and 10.4% through Fiduciaria Bogotá. Porvenir is held in Banco de Occidente as follows: 24.2% through Banco de Occidente and 8.9% through Fiduciaria de Occidente.
In addition to Mr. Sarmiento Angulo’s beneficial ownership through Grupo Aval, he beneficially owned 8.3% of Banco de Bogotá, 13.3% of Banco de Occidente, 15.5% of Banco AV Villas, 0.8% of Banco Popular and 11.5% of Corficolombiana, at April 10, 2023.
At December 31, 2022, 91.5% of our consolidated assets were recorded in our Colombian entities and 8.5% in Panama through MFH. In terms of businesses, 80.5% of our total consolidated assets were from our commercial banking subsidiaries, 18.3% were from Corficolombiana, and 1.2% were on-balance sheet consolidated assets of our pension and severance fund manager, Porvenir. On a consolidated basis, Grupo Aval manages Ps 295.6 trillion of on-balance sheet assets, and Ps 371.7 trillion of off-balance sheet assets (assets under management).
40
Commercial banking
We provide commercial banking services in Colombia and Panama. In Colombia, we operate four commercial banks (Banco de Bogotá, Banco de Occidente, Banco Popular and Banco AV Villas). In Panama we operate through MFH and its subsidiaries. Customers of any of our banks in Colombia may access Grupo Aval’s other bank branches to carry out basic banking transactions throughout our Red Aval (Grupo Aval network). Our Red Aval (Grupo Aval network) is one of the largest networks of ATMs and branches in Colombia and has been a key element of our competitive positioning in the Colombian market.
Under our multi-brand strategy, each of our banks focuses on particular types of customers, geographic regions and products. Our banks are encouraged to compete among themselves and with other market participants, while operating within central strategic guidelines established by our management. We believe that this strategy has contributed to our financial performance and allowed us to provide an integrated service network to our customers.
Our differentiated multi-brand business model builds on the individual strengths of our banks and the wide recognition of their brands. Each of our banks has developed over time a focus on particular and, to a degree, overlapping market sectors, geographic regions and services and products in Colombia. As a group, we are present in all banking businesses in Colombia, as shown in the following chart:
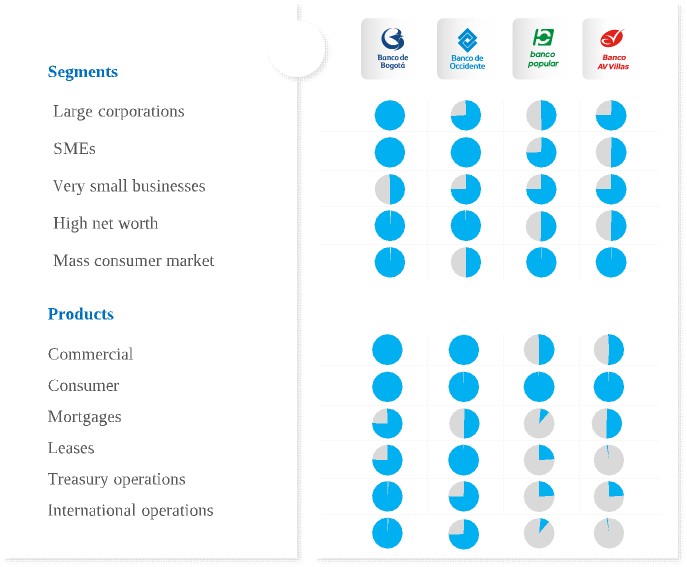
Through the subsidiaries of our banks, we also offer bancassurance, insurance, trust, bonded warehousing and brokerage transactions, real estate escrow services, merchandise and document storage and deposit, customs agency, cargo management, surety bond and merchandise distribution services, payment and collection services, and provide deposit and lending operations in foreign currencies.
Banco de Bogotá, founded in 1870, is Colombia’s oldest financial institution and the third largest bank measured by gross loans 11.4% market share at December 31, 2022. It is a full-service bank with nationwide coverage and a comprehensive portfolio of services and products. While Banco de Bogotá serves all market segments, it has a leading presence in commercial loans, with a particular focus on large corporations and a market share of 14.7% of commercial loans at December 31, 2022. Banco de Bogotá had a market share of 8.6% of consumer loans in Colombia and of 7.8% of mortgages, both at December 31, 2022. At December 31, 2022, Banco de Bogotá had a market share of 11.7% of deposits. At and for the year ended December 31, 2022, Banco de Bogotá had consolidated total assets of Ps 137.9 trillion and net income attributable to controlling interest of Ps 2.8 trillion on a consolidated basis.
Banco de Bogotá’s corporate strategy is centered in its customers, for which the bank strives to improve its value proposition on a regular basis, enhancing its products, strategies, initiatives, and efforts, in order to improve customer experience, as well as its role in society. The bank’s values place a significant importance on sustainability. Banco de Bogotá is the first carbon-neutral bank in Colombia, and adhered to the Net Zero Banking Alliance and Task Force on Climate-related Financial Disclosures, among other initiatives. Among several sustainable
41
projects, the bank supports job creation for young populations, agribusiness startups, and women in the textile industry. In addition, it issues debit cards that support the education of Colombian children and the Amazon’s reforestation, and has generated solar energy in some of its offices. For the third year in a row, the bank was certified as a Great Place to Work.
Banco de Bogotá is constantly working to update its technological infrastructure. In 2022, the bank revamped 325 ATMs installing state-of-the-art machines. The bank also implemented a facial recognition system, which was used by 2.2 million customers to validate their identity without physical interaction with its branch network, achieving a fully digital experience. The bank implemented 20 machine-learning models this year, focused on loan placement, deposit behavior estimation and insurance. In 2022, Banco de Bogotá originated 1.3 million digital loans amounting to Ps 4.4 trillion pesos, registering an annual growth of 92%.
Banco de Occidente is the fifth largest bank in Colombia measured by gross loans, with a market share of 6.4% at December 31, 2022. It focuses on mid-size and small and medium sized (SME) corporate customers, state-owned entities and high net-worth customers and has a diversified revenue stream. Banco de Occidente had market shares of 8.5% of commercial loans and 5.4% of consumer loans at December 31, 2022. Banco de Occidente had a market share of 8.2% of Colombia’s checking accounts at December 31, 2022. At December 31, 2022, Banco de Occidente had total consolidated assets of Ps 60,004.4 billion and net income attributable to owners of the parent of Ps 452.5 billion for the year ended December 31, 2022.
During 2022, Banco de Occidente continued implementing different strategies focused on improving commercial effectiveness, optimization of distribution channels, integration with its subsidiaries, digitalization, and launching several ESG initiatives. Banco de Occidente segments its corporate and personal banking customers in terms of service channels, commercial coverage and product offerings which increased sales force productivity. Banco de Occidente continued the commercial integration with its trust and portfolio management services offered by Fiduciaria de Occidente, off-shore products offered to Colombian and international clients through Banco de Occidente Panama and Occidental Bank Barbados, and added new shared services offerings to its subsidiaries in areas such as technology. On the digitalization front, during 2022 Banco de Occidente increased its digital products offering, with the launch of GoU Payment Gateway, while adding new digital products such as savings accounts in personal banking and Occicuenta for SMEs, and focusing on digital ecosystems such as Carroya.com and metrocuadrado.com.
Banco Popular is the seventh largest bank in Colombia measured by gross loans, with a market share of 3.9% at December 31, 2022. Banco Popular operates primarily in the consumer and public sector businesses. Banco Popular is a premier provider of financial solutions to Government entities nationwide with a particular strength in public sector deposits and loans. A significant portion of its portfolio consists of payroll loans to pensioners and public sector employees. Its access to payroll deductions for repayment of loans has historically resulted in consumer loans with a substantially lower-risk profile as compared to the banking system (consumer past-due loans of 3.1% compared to a banking system average of 5.4% at December 31, 2022). At December 31, 2022, Banco Popular had total consolidated assets of Ps 32,667.4 billion and net income attributable to owners of the parent of Ps 80.2 billion for the year ended December 31, 2022.
Banco Popular continues to work towards its purpose of being a sustainable company that creates experiences that positively transform people's lives. Banco Popular’s strategy for the future is based on three pillars: (i) strengthen its leadership in payroll loans supported by digitalization; (ii) diversify product offering, such as personal loans, credit cards and mortgages; and (iii) further penetrate the medium-size business sector. In 2022, Banco Popular continued to work on its digital transformation process as part of which the bank adopted an agility-based strategy, thorough a project called “Positive and Agile”, aimed at seeking and promoting incremental value generation through the adoption of new forms of collaborative work based on agile work practices. On the product offering front, the bank assembled a task force to create a product targeted to real estate developers. This effort should increase the bank’s penetration of this client segment and set the base for an expansion into new home financing, complementing the bank’s traditional focus on existing home financing. Additionally, Banco Popular continued developing alliances with fintechs to expand its personal loans offering oriented to employees of private companies, achieving a 250.7% or Ps 319.4 billion increase over the past year in the balance of this product, which now accounts for 2.7% of the bank’s consumer loans.
Banco AV Villas is the eleventh largest bank in Colombia measured by gross loans and focuses on services and products such as payroll loans and credit cards, as well as its traditional line of mortgages. Banco AV Villas has a broad service network throughout Colombia, with a concentration in Colombia’s central region, including Bogotá and the southwestern region. Banco AV Villas had a market share of 2.5% of deposits, 2.3% of gross loans, 4.5% of consumer loans and 2.6% of mortgages at December 31, 2022. At December 31, 2022, Banco AV Villas had total consolidated assets of Ps 19,648.3 billion and net income attributable to owners of the parent was Ps 103.4 billion.
Banco AV Villas seeks to continue expanding in the small- and medium-size corporate segment. In order to increase transaction volume through electronic channels and improve efficiency, Banco AV Villas is developing projects focusing its efforts on the digitalization of the bank’s services to improve customer service experience.
42
MFH through MFG provides a wide variety of financial services in Panama, mainly commercial, investment, mortgage and consumer banking, insurance, factoring, leasing and training services, as well as real estate. The main subsidiary of MFG is Multibank Inc., which consolidates the banking, insurance and portfolio management operations of the company.
Multibank Inc., is the sixth largest privately owned bank in Panama measured by gross loans, with a market share of 4.6%, the eighth measured by total deposits, with a market share of 3.4% as of December 31, 2022. At the same date, Multibank had a market share of 7.5 % of commercial loans, 4.4% of residential mortgage loans and 6.3% of consumer loans in Panama. In terms of outstanding balances, Multibank is the second largest provider of automobile loans in Panama with a market share of 16.8%, the third largest in agricultural loans with a market share of 17.6%, and the fourth largest in real estate developer loans with a market share of 10.5%.
During 2022, MFG continued to focus on its core retail and commercial banking business by strengthening the niche areas it successfully competes in, implementing different strategies focused on customer life cycle and superior customer service. Multibank continued segmenting its customer base and developing service platforms and product offerings tailored to the specific needs and characteristics of each of its client segments. The bank improved its online platform to further increase its clients’ access to products and services. In terms of sustainability, Multibank implemented policies to provide preferential interest rates for financing projects related to the installation of solar panels, biodigesters, wind power, hybrid vehicles, acquisition of energy efficiency appliances through credit cards, among others, to promote sustainable financing.
Corporate customers
Our banks provide services and products to public and private sector customers. Our banks segment their corporate customers into separate categories based principally on their annual revenues. We believe that these customer classifications, which are specific to each bank, allow our entities to tailor their services and products to the needs of each customer classification sector. The following table presents the number of corporate customers that our banks served at the dates indicated.
Grupo Aval | ||||||||||
| Banco de |
| Banco de |
| Banco |
| Banco AV |
| Grupo Aval | |
Bogotá(1) | Occidente | Popular | Villas | aggregate(2) | ||||||
(in thousands) | ||||||||||
Total corporate customers, as of: |
|
|
|
|
|
|
|
|
|
|
December 31, 2022 |
| 228.2 |
| 58.6 |
| 6.8 |
| 31.3 |
| 324.9 |
December 31, 2021 |
| 216.4 |
| 58.8 |
| 6.9 |
| 30.6 |
| 312.8 |
| (1) | These figures include MFG. |
| (2) | Reflects aggregated amounts of our banking subsidiaries, these figures may include overlap of customers. |
Individual customers
Our banks provide services and products to individuals throughout Colombia and Central America. Our banks classify their individual banking customers into separate categories based principally on income. The following table presents the number of individual customers that our banks served at the dates indicated.
Grupo Aval | ||||||||||||
| Banco de |
| Banco de |
| Banco |
| Banco AV |
|
| Grupo Aval | ||
Bogotá(1) | Occidente | Popular | Villas | Corficolombiana | aggregate(2) | |||||||
(in thousands) | ||||||||||||
Total individual customers, as of: |
|
|
|
|
|
|
|
|
|
|
|
|
December 31, 2022 |
| 8,412.8 |
| 1,107.1 |
| 3,513.7 |
| 1,226.8 |
| 315.7 |
| 14,576.2 |
December 31, 2021 |
| 7,691.5 |
| 1,031.7 |
| 3,460.4 |
| 1,174.9 |
| 343.3 |
| 13,701.8 |
| (1) | These figures include MFG. |
| (2) | Reflects aggregated amounts of our banking subsidiaries, these figures may reflect overlap of customers in Colombia. |
43
Lending activities
We classify our banks’ loans into the following categories: commercial, consumer, microcredit and mortgages. The following table presents our total loans, net at December 31, 2022.
At December 31, 2022 | ||||||||||||||||
|---|---|---|---|---|---|---|---|---|---|---|---|---|---|---|---|---|
Operating segments | ||||||||||||||||
| Banco de |
| Banco de |
| Banco |
| Banco |
|
|
| Other |
| Grupo Aval | |||
Bogotá | Occidente | Popular | AV Villas | Porvenir | Corficolombiana | segments (1) | consolidated(2) | |||||||||
(in Ps billions) | ||||||||||||||||
Commercial |
| 67,018.2 |
| 32,071.0 |
| 7,444.5 |
| 3,218.8 |
| — |
| 1,720.7 |
| 1,508.8 |
| 110,742.8 |
Commercial loans |
| 62,525.8 |
| 30,950.6 |
| 7,434.9 |
| 3,171.6 |
| — |
| 1,422.6 |
| 1,508.8 |
| 104,775.1 |
Interbank and overnight funds |
| 4,492.4 |
| 1,120.5 |
| 9.7 |
| 47.1 |
| — |
| 298.2 |
| — |
| 5,967.7 |
Consumer |
| 21,747.4 |
| 11,142.6 |
| 16,522.6 |
| 9,248.6 |
| — |
| 758.2 |
| — |
| 59,419.4 |
Mortgages |
| 11,539.3 |
| 2,488.0 |
| 1,252.8 |
| 2,584.4 |
| — |
| 18.7 |
| — |
| 17,883.4 |
Microcredit(2) |
| 265.3 |
| — |
| 2.2 |
| 0.2 |
| — |
| — |
| — |
| 267.7 |
Total gross loans |
| 100,570.3 |
| 45,701.7 |
| 25,222.2 |
| 15,051.9 |
| — |
| 2,497.6 |
| 1,508.8 |
| 188,313.4 |
Loss allowance |
| (5,293.3) |
| (2,033.2) |
| (1,248.8) |
| (577.2) |
| — |
| (42.2) |
| (2.9) |
| (9,197.5) |
Total loans, net |
| 95,277.0 |
| 43,668.5 |
| 23,973.4 |
| 14,474.7 |
| — |
| 2,455.5 |
| 1,505.9 |
| 179,115.8 |
| (1) | Commercial loans reflect the loans extended by Grupo Aval Acciones y Valores S.A. to an unconsolidated related party in December 2022. |
| (2) | Includes eliminations for intercompany or intra-group operations between Grupo Aval subsidiaries. |
| (3) | Microcredit loans are issued for the purpose of encouraging the activities of small businesses and are subject to the following requirements: the maximum amount to be lent is equal to 25 times the minimum wage (salario mínimo mensual legal vigente) without the balance of one single borrower exceeding such amount at any time, and the main source of payment for the corresponding obligation shall be the revenues obtained from the activities of the borrower’s micro business. The borrower’s outstanding indebtedness may not exceed 120 times the minimum wage. |
At December 31, 2022, the aggregate outstanding loans to our banks’ ten largest borrowers, our 11th to 50th largest borrowers and our 51st to 160th largest borrowers, represented 4.0%, 6.2% and 7.8%, respectively, of our consolidated total gross loan portfolio.
Commercial loan portfolio: consists of general purpose loans (loans with a maturity of over one year), working capital loans (loans with a maturity of up to one year), leases, loans funded by development banks, corporate credit cards and overdraft loans. Loans funded by development banks are loans granted to customers and focused on specific economic sectors and are funded by national or international government or government-related institutions. Interbank and overnight funds are short-term borrowings mostly entered into between banks. The following table presents our commercial loan portfolio at December 31, 2022.
At December 31, 2022 | ||||||||||||||||
Operating segments | ||||||||||||||||
| Banco de |
| Banco de |
| Banco |
| Banco |
|
|
| Other |
| Grupo Aval | |||
Bogotá | Occidente | Popular | AV Villas | Porvenir | Corficolombiana | segments (1) | consolidated(2) | |||||||||
(in Ps billions) | ||||||||||||||||
General purpose loans |
| 46,908.6 |
| 19,284.4 |
| 6,153.0 |
| 2,855.4 |
| — |
| — |
| 1,508.8 |
| 74,473.6 |
Working capital loans |
| 9,324.2 |
| 4,910.0 |
| 396.0 |
| 1.4 |
| — |
| — |
| — |
| 14,631.6 |
Leases |
| 3,388.9 |
| 5,831.0 |
| 207.3 |
| 14.6 |
| — |
| 1,422.6 |
| — |
| 10,862.0 |
Interbank and overnight funds |
| 4,492.4 |
| 1,120.5 |
| 9.7 |
| 47.1 |
| — |
| 298.2 |
| — |
| 5,967.7 |
Loans funded by development banks |
| 2,329.1 |
| 766.2 |
| 669.9 |
| 288.0 |
| — |
| — |
| — |
| 4,053.3 |
Overdrafts |
| 350.8 |
| 68.3 |
| 7.0 |
| 10.6 |
| — |
| — |
| — |
| 436.6 |
Credit cards |
| 224.2 |
| 90.6 |
| 1.6 |
| 1.7 |
| — |
| — |
| — |
| 317.9 |
Commercial loans |
| 67,018.2 |
| 32,071.0 |
| 7,444.5 |
| 3,218.8 |
| — |
| 1,720.7 |
| 1,508.8 |
| 110,742.8 |
| (1) | General purpose loans reflect the loans extended by Grupo Aval Acciones y Valores S.A. to an unconsolidated related party in December 2022. |
44
| (2) | Includes eliminations for intercompany or intra-group operations between Grupo Aval subsidiaries. |
Consumer loan portfolio: consists of payroll loans, personal loans, automobile and other vehicle loans, credit cards, overdrafts, leases, and general purpose loans. A payroll loan is a type of loan where payments are deducted directly from an employer’s salary. The following table presents our consumer loan portfolio at December 31, 2022.
At December 31, 2022 | ||||||||||||||||
Operating segments | ||||||||||||||||
| Banco de |
| Banco de |
| Banco |
| Banco |
|
|
| Other |
| Grupo Aval | |||
Bogotá | Occidente | Popular | AV Villas | Porvenir | Corficolombiana | segments | consolidated(1) | |||||||||
(in Ps billions) | ||||||||||||||||
Payroll loans | 7,803.0 | 3,988.7 | 15,658.3 | 5,856.7 | — | — | — | 33,306.7 | ||||||||
Credit cards |
| 3,709.1 | 1,520.9 | 417.1 | 1,376.5 | — | — | — | 7,023.6 | |||||||
Personal loans(2) |
| 7,084.1 | 3,138.2 | 446.8 | 1,998.3 | — | 758.2 | — | 13,425.6 | |||||||
Automobile loans and leases |
| 3,069.8 | 2,334.6 | 0.2 | 16.6 | — | — | — | 5,421.1 | |||||||
Leases |
| 9.1 | 9.4 | 0.0 | — | — | — | — | 18.5 | |||||||
General purpose loans |
| — | 148.1 | — | — | — | — | — | 148.1 | |||||||
Overdrafts |
| 72.3 | 2.8 | 0.2 | 0.5 | — | — | — | 75.9 | |||||||
Consumer loans |
| 21,747.4 |
| 11,142.6 |
| 16,522.6 |
| 9,248.6 |
| — |
| 758.2 |
| — |
| 59,419.4 |
| (1) | Includes eliminations for intercompany or intra-group operations between Grupo Aval subsidiaries. |
| (2) | Mostly composed of personal installment loans. |
We provide credit card services to our bank customers mainly through the Visa and MasterCard networks. The following table presents the number of activated issued credit cards of our banks in Colombia at the dates indicated.
Activated Issued Credit Cards | ||||
| December 31, |
| December 31, | |
Operating segment | 2022 | 2021 | ||
Banco de Bogotá |
| 1,423,079 |
| 1,170,381 |
Banco de Occidente |
| 572,300 |
| 555,764 |
Banco Popular |
| 226,088 |
| 255,252 |
Banco AV Villas |
| 520,353 |
| 487,828 |
Total activated issued credit cards |
| 2,741,820 |
| 2,469,225 |
Mortgages portfolio: In Colombia, Banco de Bogotá, Banco de Occidente and Banco AV Villas are our main originators of loans to customers for the purchase of real estate secured by mortgages, while Banco Popular is increasing its presence in this business. We have implemented strict underwriting standards: we do not offer mortgage loans in amounts greater than 70% of the value of the property to be purchased, upon origination and all of our mortgage loans (excluding housing leases) have maturities of up to fifteen years. The weighted average maturity of the Colombian mortgage loan portfolio at December 31, 2022 was 188 months (contractual life at the time of origination). Borrowers must also meet certain minimum income levels, and payments may not exceed 30% of the borrower’s monthly income in compliance with Colombian regulation. The weighted average maturity of MFH’s mortgage portfolio at December 31, 2022 was 288 months (contractual life at the time of origination). MFH has no significant exposure to the higher risk sectors, such as vacation homes or second-home mortgages.
Treasury operations
Our banks’ treasury departments are responsible for managing their proprietary trading activities, liquidity and distribution of treasury services and products to customers. Our banks’ proprietary trading activities include fixed income trading, derivatives and foreign exchange operations. We do not have any proprietary trading activities in equities and each of our banks have implemented trading activities policies. Our banks also take deposits from financial institutions as part of their treasury operations. These deposits are represented by certificates of interbank deposit, or “CDIs”, and earn interest at the interbank deposit rate. Banco de Bogotá and Banco de Occidente have active treasury operations, while Banco Popular and Banco AV Villas have smaller operations.
Deposits
Our banks offer traditional deposit services and products, including checking accounts, savings accounts, time deposits and other deposits. Checking accounts typically bear low or no interest. Checking accounts and savings accounts are payable on demand, although a significant
45
portion of these accounts tend to be stable in amount over time. The majority of our time deposits have maturities below 12 months and commonly earn interest at a fixed rate. The following table presents our deposits by product type at the dates indicated.
At December 31, 2022 | ||||||||||||||||
Operating segments | ||||||||||||||||
Banco de |
| Banco de |
| Banco |
| Banco |
|
|
| Other |
| Grupo Aval | ||||
| Bogotá | Occidente | Popular | AV Villas | Porvenir | Corficolombiana | segments | consolidated(1) | ||||||||
(in Ps billions) | ||||||||||||||||
Checking accounts |
| 16,280.5 |
| 7,586.6 |
| 1,101.9 |
| 1,481.6 |
| — |
| — |
| — |
| 25,932.1 |
Savings accounts |
| 32,317.0 |
| 22,022.0 |
| 12,388.4 |
| 9,152.8 |
| — |
| 1,169.6 |
| — |
| 74,293.9 |
Time deposits |
| 39,006.6 |
| 13,390.8 |
| 10,793.0 |
| 4,198.1 |
| — |
| 5,142.6 |
| — |
| 72,273.7 |
Other deposits |
| 423.4 |
| 96.6 |
| 31.2 |
| 12.0 |
| 1.1 |
| 277.3 |
| — |
| 841.5 |
Customer deposits |
| 88,027.5 |
| 43,095.9 |
| 24,314.5 |
| 14,844.5 |
| 1.1 |
| 6,589.6 |
| — |
| 173,341.1 |
| (1) | Includes eliminations for intercompany or intra-group operations between Grupo Aval subsidiaries. |
Distribution channels
Our banks provide services and products to their customers through our network. Each of our banks manages its own distribution network. In 1998, we created Red Aval (Grupo Aval network) in Colombia, which allows customers of any of our banks to make transfers, payments and undertake other basic banking functions in the networks of our other banks, through traditional channels and electronic networks, with results posting in real time to the accountholder’s bank with no additional fees. Red Aval (Grupo Aval network) services vary for each channel. In Panama, we serve our customers through a diversified distribution network that includes branches, ATMs, a standardized online banking platform, call centers and mobile phone banking.
46
The following table describes the main channels of our distribution network.
Distribution Channel |
| Description |
Full-service branches |
| Full-service branches act as part of our sales network and allow our bank customers to perform check cashing, deposits, savings account withdrawals, loan and credit card payments, transfers and advances. In Colombia, our clients can perform transactions of any of our banks at any of our branches thanks to the integration provided by Red Aval (Grupo Aval network). |
|
|
|
ATMs and electronic service points |
| Through our ATMs, all of our bank customers can, among other services, consult their balances, execute loan and credit card payments, perform transfers and advances, and pay for certain third-party services where we have a payment collection agreement in place (such as utility service companies). |
|
|
|
Payment collection centers (centros de pagos) |
| Payment collection centers allow our customers to pay for certain third-party services where we have a payment collection agreement in place (such as utility service companies). |
|
|
|
Banking correspondents (corresponsales bancarios) |
| Our banks enter into agreements with various third parties, including convenience store owners, to provide all of our bank customers with certain services, which can include checking and savings account withdrawals, account balance consultation, loan and credit card payments, transfers and advances, and payments for certain third-party services where we have a payment collection agreement in place (such as utility service companies). |
|
|
|
Automated telephone banking, mobile banking and online banking |
| Through our banks’ websites, mobile banking services and automated telephone banking, customers may pay loan and credit card balances, make transfers between accounts and make payments for collection agreements originated in any of our banks. |
During 2022, we continued optimizing our footprint by either closing, relocating or adapting branches to increase the effectiveness of our distribution network. The following table presents our total full-service branches in Colombia and Panama, at December 31, 2022 and 2021.
Change, December 31, 2022 vs. | ||||||||
|---|---|---|---|---|---|---|---|---|
At December 31, | December 31, 2021 | |||||||
| 2022 |
| 2021 |
| # |
| % | |
Banco de Bogotá | 477 | 517 | (40) | (7.7) | ||||
Banco de Occidente | 176 | 183 | (7) | (3.8) | ||||
Banco Popular | 189 | 188 | 1 | 0.5 | ||||
Banco AV Villas | 262 | 285 | (23) | (8.1) | ||||
Colombia | 1,104 | 1,173 | (69) | (5.9) | ||||
Panama | 20 | 20 | — | — | ||||
Full-service branches |
| 1,124 | 1,193 | (69) | (5.8) | |||
We continued optimizing our ATM footprint by either closing, relocating or adapting ATMs to increase the effectiveness of our distribution network. The following table presents our total ATMs in Colombia and Panama, at December 31, 2022 and 2021.
Change, December 31, 2022 vs. | ||||||||
At December 31, | December 31, 2021 | |||||||
| 2022 |
| 2021 |
| # |
| % | |
Banco de Bogotá | 1,648 | 1,694 | (46) | (2.7) | ||||
Banco de Occidente | 266 | 267 | (1) | (0.4) | ||||
Banco Popular | 693 | 756 | (63) | (8.3) | ||||
Banco AV Villas | 507 | 555 | (48) | (8.6) | ||||
Colombia | 3,114 | 3,272 | (158) | (4.8) | ||||
Panama | 60 | 89 | (29) | (32.6) | ||||
ATMs |
| 3,174 | 3,361 | (187) | (5.6) | |||
47
The following table presents our other points of service in Colombia and Central America, at December 31, 2022 and 2021.
Change, December 31, 2022 vs. | ||||||||
|---|---|---|---|---|---|---|---|---|
At December 31, | December 31, 2021 | |||||||
| 2022 |
| 2021 |
| # |
| % | |
Banco de Bogotá | 15,277 | 12,295 | 2,982 | 24.3 | ||||
Banco de Occidente | 38,577 | 32,265 | 6,312 | 19.6 | ||||
Banco Popular | 103 | 106 | (3) | (2.8) | ||||
Banco AV Villas | 2,680 | 2,210 | 470 | 21.3 | ||||
Colombia | 56,637 | 46,876 | 9,761 | 20.8 | ||||
Panama | — | — | — | N.A. | ||||
Other points of service(1) |
| 56,637 | 46,876 | 9,761 | 20.8 | |||
| (1) | In Colombia, other points of service include banking correspondents (corresponsales bancarios) or “CBs” and payment collection centers (centros de pago). |
In 2022, our transaction mix continued shifting toward digital channels. As such, successful monetary transactions through non-physical channels accounted for 24.9% of total transactions in 2022, 1.3% more than in 2021.
The following tables present volumes for successful monetary transactions processed through our distribution channels and their share of total transactions, in Colombia, Panama and the aggregate number for Grupo Aval, at the dates indicated.
Change, December 31, 2022 vs. | % of total transactions for the year ended | |||||||||||
At December 31, | December 31, 2021 | December 31, | ||||||||||
| 2022 |
| 2021 |
| # |
| % |
| 2022 |
| 2021 | |
(in thousands) | ||||||||||||
Branches | 68,818 | 67,451 | 1,367 | 2.0 | 17.4 | 16.6 | ||||||
ATMs | 129,374 | 141,311 | (11,936) | (8.4) | 32.6 | 34.7 | ||||||
Banking correspondents and other | 99,284 | 106,185 | (6,901) | (6.5) | 25.1 | 26.1 | ||||||
Online banking | 41,273 | 60,181 | (18,908) | (31.4) | 10.4 | 14.8 | ||||||
Mobile banking | 57,521 | 31,903 | 25,618 | 80.3 | 14.5 | 7.8 | ||||||
Automated telephone banking | 63 | 112 | (48) | (43.3) | 0.0 | 0.0 | ||||||
Colombia | 396,335 | 407,142 | (10,808) | (2.7) | 100.0 | 100.0 | ||||||
Change, December 31, 2022 vs. | % of total transactions for the year ended | |||||||||||
At December 31, | December 31, 2021 | December 31, | ||||||||||
| 2022 |
| 2021 |
| # |
| % |
| 2022 |
| 2021 | |
(in thousands) | ||||||||||||
Branches | 888 | 865 | 23 | 2.7 | 30.8 | 32.2 | ||||||
ATMs | 905 | 878 | 26 | 3.0 | 31.3 | 32.7 | ||||||
Banking correspondents and other | — | 11 | (11) | (100.0) | — | 0.4 | ||||||
Online banking | 436 | 355 | 80 | 22.6 | 15.1 | 13.2 | ||||||
Mobile banking | 657 | 577 | 80 | 13.9 | 22.8 | 21.5 | ||||||
Panama |
| 2,886 | 2,687 | 199 | 7.4 | 100.0 | 100.0 | |||||
Change, December 31, 2022 vs. | % of total transactions for the year ended | |||||||||||
At December 31, | December 31, 2021 | December 31, | ||||||||||
| 2022 |
| 2021 |
| # |
| % |
| 2022 |
| 2021 | |
(in thousands) | ||||||||||||
Branches | 69,707 | 68,316 | 1,391 | 2.0 | 17.5 | 16.7 | ||||||
ATMs | 130,279 | 142,189 | (11,910) | (8.4) | 32.6 | 34.7 | ||||||
Banking correspondents and other | 99,284 | 106,196 | (6,911) | (6.5) | 24.9 | 25.9 | ||||||
Online banking | 41,709 | 60,536 | (18,827) | (31.1) | 10.4 | 14.8 | ||||||
Mobile banking | 58,178 | 32,480 | 25,698 | 79.1 | 14.6 | 7.9 | ||||||
Automated telephone banking | 63 | 112 | (48) | (43.3) | 0.0 | 0.0 | ||||||
Total |
| 399,220 | 409,829 | (10,609) | (2.6) | 100.0 | 100.0 | |||||
Merchant banking
Corficolombiana is the largest merchant bank in Colombia based on total assets at December 31, 2022. Corficolombiana focuses on four main lines of business: (1) equity investments in strategic sectors of the Colombian economy, including infrastructure, energy and gas, agribusiness and hospitality; (2) investment banking, including services relating to capital markets, mergers and acquisitions and project finance transactions; (3) treasury operations; and (4) financial services such as trust services, among others. Corficolombiana had consolidated total assets and shareholders’ equity attributable to owners of the parent of Ps 54,030.3 billion and Ps 11,514.0 billion,
48
respectively, at December 31, 2022. Net income attributable to owners of the parent was Ps 1,728.1 billion for the year ended December 31, 2022.
Corficolombiana’s business model is based on the premise of investing in businesses in strategic sectors of the Colombian economy. Corficolombiana’s equity investment strategy is to target acquiring and holding majority or substantial stakes in strategic businesses. These investments enable Corficolombiana to exert influence or control over these businesses’ operations and to promote revenue growth, operational efficiencies and optimization of the capital structures.
Corficolombiana is regulated as a merchant bank (corporación financiera) by the Superintendency of Finance. Under Colombian law, a merchant bank is permitted to hold equity ownership positions in both financial and non-financial companies, unlike banks, which may only invest in financial companies. See “Item 4. Information on the Company—B. Business overview—Supervision and regulation”.
Corficolombiana’s asset distribution by sectors
Corficolombiana primarily invests in five sectors of the Colombian economy: energy and gas; infrastructure; agribusiness; hotels and financial services. It generally seeks to invest in businesses with leading market positions, strong cash flows and growth potential.
The following table provides information regarding Corficolombiana’s consolidated assets distributed by sectors at December 31, 2022.
At December 31, 2022 | ||||||||||||
|
|
| Financial |
|
|
| ||||||
Energy and | Services & | |||||||||||
Gas | Infrastructure | Others | Hospitality | Agribusiness | Total | |||||||
(in Ps billions) | ||||||||||||
Total assets(1) |
| 18,620 |
| 24,896 |
| 8,711 | 924 |
| 878 |
| 54,030.3 | |
As a percentage of total assets |
| 34.5% |
| 46.1% |
| 16.1% | 1.7% |
| 1.6% |
| 100.0% | |
| (1) | Eliminations are assigned to each operating segment. |
Corficolombiana’s main investments in the energy and gas sector include a 50.9% controlling stake in Promigas S.A. E.S.P., the second largest natural gas pipeline and distribution company in Colombia, and a minority stake in Grupo Energía Bogotá S.A. E.S.P, or “GEB”, an electricity and gas group. Promigas is included in our consolidated financial statements as it is under our “control” as defined in IFRS 10. However, pursuant to Colombian Regulation (Code of Commerce) Promigas is not a company under direct or indirect control of Grupo Aval.
Corficolombiana’s infrastructure investments are concentrated mainly in toll road concession projects, a sector in which it is a leading private investor in Colombia. The main investments of Corficolombiana in the infrastructure sector include Proyectos de Infraestructura S.A. (Buga-Tuluá-La Paila), Concesionaria Vial de los Andes S.A.S. (Bogotá-Villavicencio), Concesiones CCFC S.A. (Fontibón-Los Alpes), Concesionaria Panamericana S.A.S. (Los Alpes-Villeta and Chuguacal-Cambao), Concesionaria Vial del Pacífico S.A.S. (Ancón Sur-Bolombolo or “Conexión Pacífico 1”), Concesionaria Nueva Vía al Mar S.A.S. (Mulaló-Loboguerrero), Concesionaria Vial Andina S.A.S. (Bogotá-Villavicencio) and Concesionaria Vial del Oriente S.A.S. (Villavicencio-Yopal).
In the financial services & others sector, Corficolombiana offers trust and brokerage services to third-party customers through two subsidiaries: Fiduciaria Corficolombiana S.A. and Casa de Bolsa S.A. For information on Corficolombiana’s consolidated lending and deposit taking activities see “Item 4. Information on the Company—B. Business overview—Commercial Banking”. In 2022 the liquidation process of Leasing Corficolombiana S.A. was completed.
Corficolombiana also has investments in the hospitality sector. These include majority stakes in Hoteles Estelar de Colombia S.A. and Promotora y Comercializadora Turística Santamar S.A.
Finally, Corficolombiana’s main investments in agribusiness are centered on forestry and woodworking as well as the production of palm oil, rubber, rice and cotton mainly through Unipalma S.A., Valora S.A. and Organización Pajonales S.A.
Investment banking and treasury businesses
Corficolombiana’s investment banking team provides advice to third-party clients in the Colombian market covering a broad range of transactions, including, among others, capital markets, mergers and acquisitions and project finance. Corficolombiana has led the participation of private sector companies in infrastructure projects. In 2022, Corficolombiana’s investment bank helped raise financing and coordinate projects with third parties and sometimes with related parties.
49
Corficolombiana is a relevant participant in Colombian capital markets, both in sovereign and corporate debt securities and foreign currency-denominated securities. It is also an active participant in the derivatives market, and an active market maker for Colombian sovereign debt securities. At December 31, 2022, Corficolombiana had consolidated total fixed income assets of Ps 4,146.9 billion.
Pension and severance fund management
Porvenir is controlled by and consolidated under Grupo Aval. Porvenir is the leading private pension and severance fund management business in Colombia, based on assets under management, with a 44.6% market share of assets under management at December 31, 2022. Pension funds provide individual savings for retirement, while severance funds provide temporary income to employees who become unemployed. Through Aportes en Línea, Porvenir manages social security related information systems designed to provide employees with efficient payment solutions.
For the year ended December 31, 2022, 62.1% of Porvenir’s revenues were derived from mandatory pension funds, 27.5% from severance funds, 9.8% from voluntary pension funds and 0.5% from third-party sponsored pension liability funds. Porvenir derived the remaining 0.1% of its revenues from a combination of the profitability of its own investment portfolio, stabilization reserves and other income.
The following table presents a breakdown of Porvenir’s assets under management at the dates indicated. Adverse capital market conditions throughout 2022 drove the 1.9% contraction in the volume of funds managed by Porvenir, which in turn negatively affected returns on the stabilization reserve. For more information see “Item 5. Operating and Financial Review and Prospects—A. Operating Results—Management Discussion and Analysis of Operating Segments—Porvenir”.
| Change, December 31, 2022 vs. | |||||||
At December 31, | December 31, 2021 | |||||||
| 2022 |
| 2021 |
| # |
| % | |
(in Ps billions) | ||||||||
Mandatory pension funds |
| 159,338.6 |
| 160,419.8 |
| (1,081.1) |
| (0.7) |
Severance funds |
| 7,592.5 |
| 7,680.2 |
| (87.7) |
| (1.1) |
Voluntary pension funds |
| 4,836.0 |
| 5,207.9 |
| (371.9) |
| (7.1) |
Third-party sponsored pension funds |
| 19,425.4 |
| 21,500.6 |
| (2,075.2) |
| (9.7) |
Total assets under management |
| 191,192.5 |
| 194,808.4 |
| (3,615.9) |
| (1.9) |
The following table presents a breakdown of Porvenir’s clients at the dates indicated.
| Change, December 31, 2022 vs. | |||||||
At December 31, | December 31, 2021 | |||||||
| 2022 |
| 2021 |
| # |
| % | |
(in thousands) | ||||||||
Mandatory pension funds |
| 11,341.2 |
| 10,729.6 |
| 611.6 |
| 5.7 |
Severance funds |
| 5,095.8 |
| 4,852.2 |
| 243.6 |
| 5.0 |
Voluntary pension funds |
| 198.0 |
| 197.0 |
| 1.0 |
| 0.5 |
Total clients |
| 16,635.1 |
| 15,778.9 |
| 856.2 |
| 5.4 |
Porvenir’s investments
Porvenir is required to own at least 1.00% of the funds it manages that are subject to a minimum return, known as the stabilization reserve. This stabilization reserve represents 72.4% of Porvenir’s proprietary investments. In addition, Porvenir holds voluntary investments. Revenues related to Porvenir’s stabilization reserve and its proprietary portfolio represented (0.8)% and 15.7% of its total revenues for the years ended December 31, 2022 and December 31, 2021, respectively. In 2022 returns were negatively affected by the overall capital markets performance described above.
Distribution channels
Porvenir attracts new individual customers mainly through its direct sales force (1,079 individuals) with direct report to five regional sales managers located in Bogotá, Antioquia, the Southern Region, the Eastern Region and the Northern Region. At December 31, 2022, Porvenir had 54 offices, 5 service modules, 64 electronic service centers and 6 business service centers. It maintains a presence in all regions of Colombia through its service agreements with Grupo Aval’s banks.
50
Competition
Commercial banking
We are one of the largest financial banking groups in Colombia. Recently, we have outperformed one or more of our principal competitors under key operational metrics, such as ROAA, ROAE, and the ratio of loans classified as past due more than 30 days over gross loans. We believe that these results have been achieved due to our banks’ historically strong franchises, results-oriented philosophy and their disciplined risk management approach; all of which has been supported by our multi-brand business model.
The following market share and other data comparing us and our banking subsidiaries to our competitors is based on information derived from the combined separate financial information reported to the Superintendency of Finance by our 4 commercial banks based on Colombian IFRS. Our main competitors in Colombia are Bancolombia, Davivienda and BBVA Colombia, which are the three leading banking groups following Grupo Aval. Average balances are calculated using the 13 end-of-month average balances between December 2022 and December 2021. Grupo Aval figures reflect aggregated amounts of our separate banking subsidiaries in Colombia.
The following table shows ROAA, ROAE, efficiency ratio and Colombian market share information of our Colombian banking subsidiaries, our aggregate operation and our principal competitors in accordance with Colombian IFRS on a separate basis.
At and for the Year ended December 31, 2022 | ||||||||||||||||
Grupo Aval entities | ||||||||||||||||
| Banco de |
| Banco de |
| Banco |
| Banco AV |
| Grupo Aval |
|
|
| BBVA | |||
Bogotá(1) | Occidente | Popular | Villas | Aggregate (1)(2) | Bancolombia | Davivienda | Colombia | |||||||||
(in percentages) | ||||||||||||||||
ROAA(3) |
| 2.1 |
| 1.0 |
| 0.2 |
| 0.6 |
| 1.4 |
| 3.1 |
| 0.9 |
| 1.0 |
ROAE(4) |
| 12.9 |
| 10.9 |
| 2.4 |
| 7.0 |
| 11.0 |
| 20.8 |
| 8.5 |
| 15.8 |
Efficiency ratio(5) |
| 43.1 |
| 56.7 |
| 83.9 |
| 79.1 |
| 55.1 |
| 38.2 |
| 45.4 |
| 48.3 |
Market share in Colombia: |
|
|
|
|
|
|
|
|
|
|
|
|
|
|
|
|
Net income |
| 15.8 |
| 3.5 |
| 0.5 |
| 0.8 |
| 20.7 |
| 48.7 |
| 8.0 |
| 6.6 |
Deposits |
| 11.7 |
| 6.4 |
| 4.1 |
| 2.5 |
| 24.6 |
| 26.0 |
| 14.8 |
| 11.5 |
Gross loans |
| 11.4 |
| 6.4 |
| 3.9 |
| 2.3 |
| 24.0 |
| 26.9 |
| 16.7 |
| 10.8 |
Assets |
| 11.9 |
| 5.9 |
| 3.5 |
| 2.1 |
| 23.5 |
| 26.6 |
| 14.8 |
| 10.7 |
Branches |
| 9.4 |
| 3.5 |
| 3.7 |
| 5.1 |
| 21.7 |
| 11.4 |
| 9.8 |
| 8.0 |
ATMs |
| 10.3 |
| 1.7 |
| 4.3 |
| 3.2 |
| 19.4 |
| 31.5 |
| 13.6 |
| 9.3 |
Source: Company calculations based on separate information published by the Superintendency of Finance. Figures relating to branches and ATMs of Grupo Aval’s entities are derived from internal data.
| (1) | Ratios and market share data reflect aggregated separate data of Banco de Bogotá, Banco de Occidente, Banco Popular and Banco AV Villas. |
| (2) | ROAA is calculated as net income divided by the 13-month average of month-end total assets. |
| (3) | ROAE is calculated as net income divided by the 13-month average of month-end total equity. |
| (4) | Throughout this section, efficiency ratios are calculated as total expenses, divided by total income before net impairment losses on financial assets (including net interest income, net income from commissions and fees, net trading income and other income). |
Lending activities
At December 31, 2022, we had the second largest market share of gross loans in Colombia, with a 24.0% market share. We have a strong presence in commercial loans and in consumer loans (particularly in payroll loans, in which we had a 45.3% market share at December 31, 2022).
51
The following table presents a breakdown of the market share of our gross loans and that of our competitors by category at December 31, 2022.
At December 31, 2022 | ||||||||||
|---|---|---|---|---|---|---|---|---|---|---|
|
|
|
|
| Rest of the | |||||
Grupo Aval | BBVA | Colombian | ||||||||
Colombian IFRS | aggregate | Bancolombia | Davivienda | Colombia | market | |||||
(in percentages) | ||||||||||
Commercial loans |
| 26.2 |
| 34.1 |
| 13.5 |
| 8.9 |
| 17.3 |
Consumer loans |
| 26.9 |
| 20.1 |
| 17.2 |
| 12.8 |
| 23.1 |
Mortgages loans |
| 14.2 |
| 20.5 |
| 29.9 |
| 14.9 |
| 20.5 |
Microcredit loans |
| 1.5 |
| 3.4 |
| 0.0 |
| 0.0 |
| 95.0 |
Gross loans |
| 24.0 |
| 27.0 |
| 16.7 |
| 10.8 |
| 21.5 |
Source: Company calculations based on separate information published by the Superintendency of Finance.
Loan Portfolio Quality
We believe that the credit quality of our gross loans compares favorably against our principal competitors. The following table presents credit quality metrics for our gross loans and that of our competitors at the dates indicated.
| Loans past due more |
| Loans rated |
| Gross provision |
| Net provision |
| Allowance / loans | |
than 30 days / gross | C, D, E | expense / average |
| expense / average | past due more | |||||
loans | / gross loans(1) | gross loans(2) |
| gross loans(3) | than 30 days | |||||
Colombian IFRS | For the year ended December 31, 2022 | |||||||||
(in percentages) | ||||||||||
Banco de Bogotá |
| 3.9 |
| 7.0 |
| 2.0 | 1.5 |
| 158.2 | |
Banco de Occidente |
| 3.1 |
| 5.7 |
| 1.9 | 1.4 |
| 160.0 | |
Banco Popular |
| 3.0 |
| 3.9 |
| 0.9 | 0.7 |
| 170.7 | |
Banco AV Villas |
| 3.2 |
| 3.2 |
| 1.3 | 0.7 |
| 134.7 | |
Grupo Aval aggregate |
| 3.5 |
| 5.8 |
| 1.7 | 1.3 |
| 158.3 | |
Bancolombia |
| 3.5 |
| 5.5 |
| 2.2 | 1.9 | 178.5 | ||
Davivienda |
| 5.8 |
| 6.5 |
| 4.4 | 3.6 |
| 105.7 | |
BBVA Colombia |
| 3.0 |
| 4.4 |
| 1.6 | 1.3 |
| 169.7 | |
Rest of the Colombian market |
| 4.4 |
| 5.6 |
| 2.7 | 2.2 |
| 129.7 | |
Source: Company calculations based on separate information published by the Superintendency of Finance.
| (1) | For further information about loan classification categories, see “Item 11. Quantitative and Qualitative Disclosures About Market Risk”. |
| (2) | Gross provision expense is defined as provision expenses net of provision recoveries. |
| (3) | Net provision expense is defined as gross provision expense minus recoveries of charged-off loans. |
Deposits
At December 31, 2022, we had the second largest market share of total deposits in Colombia, with a market share of 24.6%. At the same date our principal competitors—Bancolombia, Davivienda and BBVA Colombia—had market shares of 26.0%, 14.8% and 11.5%, respectively.
52
The following table presents a breakdown of market share of deposits by type of deposit at December 31, 2022.
At December 31, 2022 | ||||||||||
|
|
|
|
| Rest of the | |||||
Grupo Aval | BBVA | Colombian | ||||||||
Colombian IFRS | aggregate | Bancolombia | Davivienda | Colombia | market | |||||
| (in percentages) | |||||||||
Checking accounts |
| 30.7 |
| 27.8 |
| 11.9 |
| 11.2 |
| 18.4 |
Savings accounts |
| 24.5 |
| 29.0 |
| 15.5 |
| 10.2 |
| 20.8 |
Time deposits |
| 24.1 |
| 21.5 |
| 15.4 |
| 13.8 |
| 25.1 |
Other deposits(1) | 3.5 | 19.3 | 7.9 | 7.3 | 62.1 | |||||
Total deposits |
| 24.6 |
| 26.0 |
| 14.8 |
| 11.5 |
| 23.1 |
Source: Company calculations based on separate information published by the Superintendency of Finance.
| (1) | Other deposits for the rest of the Colombian market include judicial deposits, mainly in Banco Agrario. |
At December 31, 2022, deposits represented a larger share of our total funding than that of most of our principal competitor banks, and we had a higher concentration of checking accounts. The table below presents the total funding mix across the Colombian market at December 31, 2022.
At December 31, 2022 | ||||||||||
|
|
|
|
| Rest of the | |||||
Grupo Aval | BBVA | Colombian | ||||||||
Colombian IFRS | aggregate | Bancolombia | Davivienda | Colombia | market | |||||
(in percentages) | ||||||||||
Funding: |
|
|
|
|
|
|
|
|
|
|
Deposits |
| 79.5 |
| 83.0 |
| 76.6 |
| 85.8 |
| 71.1 |
Other funding(1) |
| 20.5 |
| 17.0 |
| 23.4 |
| 14.2 |
| 28.9 |
Total funding |
| 100.0 |
| 100.0 |
| 100.0 |
| 100.0 |
| 100.0 |
Deposits: |
|
|
|
|
|
|
|
|
|
|
Checking accounts |
| 16.8 |
| 14.4 |
| 10.8 |
| 13.1 |
| 10.8 |
Savings accounts |
| 49.0 |
| 55.1 |
| 51.8 |
| 43.7 |
| 44.6 |
Time deposits |
| 33.8 |
| 28.6 |
| 36.0 |
| 41.6 |
| 37.7 |
Other deposits | 0.4 |
| 1.9 |
| 1.4 |
| 1.6 |
| 6.9 | |
Total deposits |
| 100.0 |
| 100.0 |
| 100.0 |
| 100.0 |
| 100.0 |
Average rate paid on funding: |
|
|
|
|
| |||||
Average rate paid on deposits |
| 5.1 |
| 3.5 |
| 5.3 |
| 5.2 |
| 4.7 |
Average rate paid on other funding(1) |
| 5.9 |
| 6.6 |
| 7.4 |
| 8.2 |
| 6.0 |
Average rate paid on total funding |
| 5.3 |
| 4.1 |
| 5.8 |
| 5.6 |
| 5.0 |
Source: Company calculations based on information published by the Superintendency of Finance.
| (1) | Other funding includes interbank borrowings and overnight funds, borrowings from banks, bonds issued and borrowings from development entities. |
53
Distribution channels
Through our banking subsidiaries, we have the largest branch network in Colombia, with 1,173 branches and 3,114 ATMs at December 31, 2022. The following table presents the distribution of branches and ATMs across the market at December 31, 2022.
At December 31, 2022 |
| ||||||||
Branches |
| ATMs |
| ||||||
| # of branches |
| Market share % | # of ATMs |
| Market share % | |||
Grupo Aval aggregate |
| 1,104 |
| 21.7% | 3,114 |
| 19.4% | ||
Bancolombia |
| 583 |
| 11.4% | 5,040 |
| 31.5% | ||
Davivienda |
| 502 |
| 9.8% | 2,181 |
| 13.6% | ||
BBVA Colombia |
| 407 |
| 8.0% | 1,496 |
| 9.3% | ||
Rest of the Colombian market |
| 2,501 |
| 49.1% | 4,188 |
| 26.1% | ||
Source: Company calculations based on separate information published by the Superintendency of Finance, except for information for Grupo Aval which reflects aggregate data obtained from our banking subsidiaries. ATMs for the Rest of the Colombian market include “Servibanca”, an ATM network.
Merchant banking
Corficolombiana was the largest merchant bank (corporación financiera) in Colombia in terms of assets and equity at December 31, 2022. Corficolombiana faces competition from local and global banks focused on merchant and investment banking. Bancolombia, through its subsidiary Banca de Inversión Bancolombia S.A., is Corficolombiana’s largest local competitor. Corficolombiana also faces competition from global banks with local investment banking operations. In addition, as an equity investor, Corficolombiana faces competition from other equity investors such as hedge funds, private equity firms and others.
The following table presents the market shares of Corficolombiana and its principal competitors by assets, liabilities, equity and net income at and for the year ended December 31, 2022.
Colombian IFRS |
| Assets |
| Liabilities |
| Equity |
| Net income |
(in percentages) | ||||||||
Corficolombiana |
| 85.3 |
| 96.3 |
| 76.1 |
| 89.8 |
Banca de Inversión Bancolombia S.A. |
| 7.7 |
| 0.6 |
| 13.6 |
| 6.7 |
BNP Paribas Colombia Corporación Financiera S.A. |
| 1.3 |
| 1.5 |
| 1.2 |
| 2.2 |
Corporación Financiera GNB Sudameris S.A. |
| 4.2 |
| 1.1 |
| 6.7 |
| 1.4 |
Corporación Financiera Davivienda S.A. |
| 1.5 |
| 0.4 |
| 2.5 |
| — |
Source: Information published by the Superintendency of Finance.
Pension and severance fund management
Porvenir is the leading private pension fund manager in Colombia in terms of assets under management. Porvenir’s principal private competitors are other pension fund managers, including Protección, Colfondos and Skandia. Based on separate data prepared under Colombian IFRS, at December 31, 2022, Porvenir was the most efficient pension and severance fund manager in Colombia, with an efficiency ratio of 66.9%.
54
The following table presents the market shares of the main market participants in the private pension and severance fund management business with respect to assets under management and individual customers at December 31, 2022, as well as net income for the year ended December 31, 2022. Net income for Protección in 2022 includes non-recurring net income related to the spin-off of its captive insurance to a newly created insurance company in an amount estimated to have increased its market share of net income from 3.2% to 55.5%.
At and for the year ended December 31, 2022 | ||||||||
| Porvenir |
| Protección |
| Colfondos |
| Skandia | |
(in percentages) | ||||||||
Individual customers to pension funds: |
|
|
|
|
|
|
|
|
Mandatory |
| 60.5 |
| 29.4 |
| 9.4 |
| 0.7 |
Severance |
| 54.7 |
| 34.8 |
| 9.7 |
| 0.7 |
Voluntary |
| 23.7 |
| 58.2 |
| 7.0 |
| 11.1 |
Total |
| 57.6 |
| 32.0 |
| 9.4 |
| 1.0 |
Assets under management: |
|
|
|
| ||||
Mandatory |
| 46.1 |
| 35.2 |
| 13.0 |
| 5.7 |
Severance |
| 47.9 |
| 39.1 |
| 10.4 |
| 2.6 |
Voluntary |
| 20.6 |
| 42.7 |
| 6.4 |
| 30.3 |
Total |
| 44.6 |
| 35.8 |
| 12.5 |
| 7.0 |
Net income: |
| 29.3 |
| 55.5 |
| 3.5 |
| 11.8 |
Source: Information published by the Superintendency of Finance for private pension and severance fund managers. Information does not include data from third-party pension liability funds, which does not comprise a material portion of the market. Net income calculated under Colombian IFRS.
Other corporate information
Technology
We continuously invest in new technology and the renewal of equipment and infrastructure in order to serve customers effectively, improve our profitability and grow our business. We believe that proper management of technology is key to the efficient management of our business. Our technology architecture focuses on our customers and supports our business model.
Grupo Aval manages the Group’s IT strategy focused on architecture, cybersecurity, processes, infrastructure, cloud computing and corporate procurement. Although we encourage each banking subsidiary to maintains its own information technology system, we work to identify potential synergies and assist in the implementation of technology and products developed at the holding level within our banks, to standardize and centralize technology and processes across each entity.
Each banking subsidiary is responsible for its information technology systems and distribution network. However, we seek to maximize the effectiveness of our distribution network and the levels of customer service and customer retention across all our banks through our Red Aval (Grupo Aval network), which connects all our Colombian banks’ networks. Our network allows each of our banking subsidiaries’ customers to access basic banking services at any ATM or branch office in any of our banks. In addition, the information related to the products and services that our customers have in any Grupo Aval entity is accessible through the website or mobile banking apps of any of our banks in Colombia. These websites and mobile banking applications were updated on 2021, renovating their interface, offering new services between entities and improving their technology using AWS tools.
Our principal projects currently consist of the following:
| ● | Migration of main systems to the cloud: This project commenced in 2022 and will last for five years (until 2027) and is expected to obtain savings of technology costs after completion. |
| ● | Centralization: We are currently working on centralizing our entities’ telecommunications. This project will take approximately two years. |
| ● | Basic software activity: We are focusing on the standardization of some processes in our banking subsidiaries, such as customer relationship management (CRM), treasury, IFRS accounting, habeas data and different cybersecurity tools. |
| ● | Digitalization: Our focus on digitalization encompasses creating new products (customer experience) and transversal microservices that can be invoked though new apps or channels. |
55
Policies: We continue working on migrating and implementing homogeneous policies in all our technological processes such as cybersecurity.
Our Colombian banking subsidiaries currently operate based on a hybrid IT model. Core banking processes are handled directly by each banking subsidiary, and electronic channels and administrative processes such as accounting, purchasing and budgeting operate in our shared services center, ATH and/or Nexa BPO. This model of centralization of our technological operation will continue its development in these shared services in order to achieve medium-term savings that optimize the results of Grupo Aval as a whole.
Cybersecurity
Cybersecurity risks for financial institutions, such as ours, are constantly monitored and updated based on new technologies. In the past years we have significantly increased the scope of our capabilities to respond to the proliferation of new attempts to break our security barriers, the use of the Internet and automated processes, the diversification of channels to perform financial transactions, hand in hand with the development of new techniques of organized crime, hackers, hacktivists, terrorists and other external parties. In 2022 these risks were managed successfully. In addition, we continue introducing new products and services, such as our digital channels, which requires updating processes and could result in new operational risks that we may not fully appreciate or identify.
Given this scenario, it is increasingly a priority for us and our subsidiaries to strengthen security teams. This is particularly in banking, our main activity, where the high demand for specialized personnel in the field of cybersecurity has become a real obstacle, boosted by the new technological tools of hackers, the rapid obsolescence of knowledge in security operation teams, and insufficient preparation in this specific field. We are exposed to potential cybersecurity events both directly in Aval and our subsidiaries as well as through our service providers and other third parties.
We and our subsidiaries are susceptible to malware, ransomware, computer hackers, disgruntled employees, hacktivists and other causes that could affect the IT infrastructure that supports our service channels. We outsource certain services and, although we require that our service providers follow our security standards, we cannot assure that any of our service providers will not experience cyber-attacks that would affect the provision of our services or interrupt our business. In the event of a breakdown or improper operation of our or a third party’s systems or unauthorized action by third parties or our employees, we could suffer financial loss, an impairment to our liquidity, a disruption of our businesses, regulatory sanctions or damage to our reputation. While many of our agreements with third party vendors include indemnification provisions, we may not be able to recover sufficiently, or at all, to adequately offset any losses; although we maintain insurance coverage that may, subject to policy terms and conditions, cover certain aspects of cyber risks, it may be insufficient to cover all losses.
Cybersecurity incidents are immediately reported through the High Impact Event Report and analyzed by the information security and technology security department to assess their consequences both with regards to the entity affected within Grupo Aval and to any affected third parties. We monitor the existence of such situations on a quarterly basis in the Corporate Vicepresidency of Risk and Compliance, allowing us to determine whether any of the incidents, individually or in aggregate, are to be categorized as a high impact event.
Given the increasing sophistication of cyber-attacks, incidents could occur and persist for an extended period without detection. Investigations of cyber-attacks can be unpredictable and take time to complete. During such time we may not necessarily assess the extent of the harm caused or how best to remediate it. Additionally, we may fail to take the most appropriate actions to remediate or mitigate a cyber-attack, which would further increase the costs and consequences of a cyberattack.
During 2022, the security controls associated with working remotely were maintained and strengthened in order to restrict and protect access to information and technological resources by our collaborators. In addition, more tools and services supported by emerging technologies such as machine learning, artificial intelligence and user behavior have been acquired and implemented, which allow us to identify, protect, detect and respond in a timely manner to possible incidents and/or cyber-attacks.
To mitigate the risks generated by the increase in the use of digital channels, we have continued with the implementation of additional controls such as: channel restriction for sending double authentication factors, fraud intelligence with rules based on statistical models, as well such as strengthening the enrollment process in digital channels. On the other hand, the transaction monitoring processes have increased and the awareness campaigns for our clients have been reinforced. Additionally, a process has been adopted through which every subsidiary reports the changes made to the controls or the implementation of new ones.
We implemented a policies that seeks to ensure that the risks are identified, measured, controlled and monitored, and considers the international best practices and regulations. The cyber-security risk management system is designed as a three line model: (i) a first line, which is responsible for defining information security strategy and the preventive detection and isolation of advanced threats, (ii) a second line that establishes the risk management framework and is responsible monitor the management of information security risks, and (iii) a
56
third line that supports regulatory compliance, independent supervision of the of the implementation of the first two lines and report of results to the Audit Committee.
Grupo Aval's senior management is committed to cybersecurity risk management, through a clear strategy which includes the allocation of human, technical and financial resources and a clear definition and disclosure of responsibilities regarding to cybersecurity.
Finally, the SEC proposed amendments to its rules to enhance and standardize disclosures regarding cybersecurity risk management, strategy, governance, and incident reporting by public companies. These amendments include policies and procedures for cybersecurity risk assessment, Management’s cybersecurity expertise and its role in managing cybersecurity risk and implementing policies and procedures, board-level governance around cybersecurity risk, identification of board member with cybersecurity expertise. Subject to the issuance of final rules, we are analyzing the potential impacts that these amendments could have, as well as the actions to be taken in this regard.
Intellectual property
We register and monitor our brands and trademarks in Colombia and abroad according to the marketing and commercial strategy established for each country. Part of this monitoring is focused in evaluating possible registration and renovation of brands and trademarks in Colombia, the United States, Mexico and other South and Central American countries, always in connection to Grupo Aval business strategy. We also evaluate continuously the possibility to object third party requesting for registration of brands and trademarks in countries in the region that, due to their similarity to Grupo Aval’s logos, could be generate a confusion or misleading to the public.
57
Selected statistical data
The following tables present select statistical information in accordance with subpart 1400 of Regulation S-K.
In March 2022, our subsidiary Banco de Bogotá completed the spin-off of 75% of its equity interest in BAC Holding International, Corp., or BHI (formerly Leasing Bogotá S.A., Panamá or LB Panamá), and its consolidated subsidiaries. This represented 51.6% of Grupo Aval’s beneficial ownership interest in BHI and resulted in Grupo Aval’s loss of control of the previously consolidated subsidiary, which was also a standalone operating segment of Grupo Aval. Accordingly, BHI was deconsolidated from Grupo Aval’s consolidated statement of financial position as of March 31, 2022, and BHI’s results of operations for periods prior to the spin-off have been reclassified to discontinued operations in Grupo Aval’s consolidated Statement of income for all periods included in this Annual Report on Form 20-F. In December 2022, Banco de Bogotá sold an additional 20.89% equity interest in BHI (representing approximately 14.4% of Grupo Aval’s then-remaining beneficial ownership interest in BHI) in an unsolicited tender offer by Esadinco S.A. (see “Item 7. Major Shareholders and Related Party Transactions—B. Related party transactions”), which resulted in Grupo Aval losing its significant influence over BHI, and thereafter Grupo Aval’s remaining approximately 2.8% beneficial ownership interest ceased to be accounted for as an investment in associates and was recognized as a financial asset at fair value with changes in OCI (FVOCI). Accordingly, equity method for the period between April and November 2022, during which BHI was accounted for as an equity method investee, has been reclassified to discontinued operations in Grupo Aval’s consolidated Statement of income. In accordance with IFRS, our consolidated statement of financial position for periods prior to December 31, 2021 have not been retrospectively adjusted. As a result of the spin-off, we ceased to report BHI as an operating segment. Banco de Bogotá has since sold the entirety of its equity interest in BHI.
For the years ended December 31, 2022, 2021 and 2020, the results of discontinued operations are presented separately on the consolidated statement of income; however, following the deconsolidation of a discontinued operation, no retrospective adjustments are permitted to be made to the prior period consolidated statements of financial position under IFRS. To facilitate meaningful analysis and comparability, average statement of financial position balances prior to the consummation of the spin-off, including as used to calculate average yields and average rates, have been adjusted to exclude the impact of discontinued operations substantially in accordance with Article 11 of Regulation S-X, and all information presented under “Item 4. Information on the Company — Selected statistical data” refers to financial data of continuing operations, unless otherwise specifically noted. For more information about the impact of the spin-off and subsequent tender offer, please refer to “Item 5. Operating and Financial Review and Prospects—A. Operating Results—Principal factors affecting our financial condition and results of operations—Transactions related to BHI – Discontinued operations” and Note 1.1 “Discontinued Operations of BAC Holding” to our audited consolidated financial statements.
Distribution of assets, liabilities and equity, interest rates and interest differential
| ● | average statement of financial position for 2022, 2021 and 2020 have been calculated as follows: the average of balances at December 31, at September 30, at June 30, and at March 31 of the corresponding year, and the balance at December 31, of the previous year, adjusted where applicable to exclude the impact of discontinued operations. |
Average Statement of Financial Position
For the years ended December 31, 2022, 2021 and 2020, the following table presents:
| ● | average balances for 2022, 2021 and 2020 calculated using the average of balances for our assets and liabilities (based on a five period average) according with the above paragraph; |
| ● | interest income earned on assets and interest paid on liabilities; and |
| ● | average yield and interest rate for our interest-earning assets of continuing operations and interest-bearing liabilities of continuing operations, respectively. |
58
Average statement of financial position and income from interest-earning and non-interest-earning |
| ||||||||||||||||||
assets for the years ended December 31, |
| ||||||||||||||||||
2022 | 2021 (1) | 2020 |
| ||||||||||||||||
|
| Interest |
|
|
| Interest |
|
|
| Interest |
|
| |||||||
Average | income | Average | Average | income | Average | Average | income | Average |
| ||||||||||
balance | earned | yield | balance | earned | yield | balance | earned | yield |
| ||||||||||
(in Ps billions, except percentages) |
| ||||||||||||||||||
ASSETS |
|
|
|
|
|
|
|
|
|
| |||||||||
Interest-earning assets |
|
|
|
|
|
|
|
|
|
| |||||||||
Fixed Income Investments |
|
|
|
|
|
|
|
|
|
|
|
|
|
|
|
|
|
| |
Domestic |
| 27,454.1 |
| 1,757.7 |
| 6.4 | % | 26,096.8 |
| 841.9 |
| 3.2 | % | 20,326.5 |
| 713.1 |
| 3.5 | % |
Foreign |
| 3,714.3 |
| 85.8 |
| 2.3 | % | 3,521.1 |
| 67.4 |
| 1.9 | % | 4,002.1 |
| 44.9 |
| 1.1 | % |
Total |
| 31,168.4 |
| 1,843.5 |
| 5.9 | % | 29,617.9 |
| 909.3 |
| 3.1 | % | 24,328.6 |
| 758.0 |
| 3.1 | % |
Interbank and overnight funds (2) |
|
|
|
|
|
|
|
|
|
|
|
|
|
|
|
|
|
|
|
Domestic |
| 3,245.5 | 477.8 | 14.7 | % | 1,703.0 | 133.6 | 7.8 | % | 1,626.7 | 163.6 | 10.1 | % | ||||||
Foreign |
| 69.4 | 9.9 | 14.3 | % | 92.7 | 1.4 | 1.5 | % | 108.6 | 0.9 | 0.8 | % | ||||||
Total |
| 3,314.9 |
| 487.7 |
| 14.7 | % | 1,795.7 |
| 135.0 |
| 7.5 | % | 1,735.3 |
| 164.5 |
| 9.5 | % |
Loans - Client portfolio |
|
|
|
|
|
|
|
|
|
|
|
|
|
|
|
|
|
|
|
Domestic |
| 151,661.6 | 16,010.7 |
| 10.6 | % | 135,192.9 | 10,896.4 |
| 8.1 | % | 130,428.1 | 11,784.0 |
| 9.0 | % | |||
Foreign |
| 15,674.1 | 1,061.1 |
| 6.8 | % | 13,030.9 | 850.8 |
| 6.5 | % | 12,691.5 | 509.6 |
| 4.0 | % | |||
Total |
| 167,335.7 |
| 17,071.8 |
| 10.2 | % | 148,223.8 |
| 11,747.2 |
| 7.9 | % | 143,119.5 |
| 12,293.6 |
| 8.6 | % |
Loans 32) |
|
|
|
|
|
|
|
|
|
|
|
|
|
|
|
|
|
|
|
Domestic |
| 154,907.1 | 16,488.5 |
| 10.6 | % | 136,895.9 | 11,029.9 |
| 8.1 | % | 132,054.7 | 11,947.6 |
| 9.0 | % | |||
Foreign |
| 15,743.6 | 1,071.1 |
| 6.8 | % | 13,123.6 | 852.2 |
| 6.5 | % | 12,800.1 | 510.5 |
| 4.0 | % | |||
Total |
| 170,650.6 |
| 17,559.5 |
| 10.3 | % | 150,019.5 |
| 11,882.1 |
| 7.9 | % | 144,854.8 |
| 12,458.1 |
| 8.6 | % |
Total interest-earning assets |
|
|
|
|
|
|
|
|
|
|
|
|
|
|
|
|
|
|
|
Domestic |
| 182,361.1 | 18,246.2 |
| 10.0 | % | 162,992.8 | 11,871.8 |
| 7.3 | % | 152,381.2 | 12,660.7 |
| 8.3 | % | |||
Foreign |
| 19,457.9 | 1,156.8 |
| 5.9 | % | 16,644.6 | 919.6 |
| 5.5 | % | 16,802.2 | 555.4 |
| 3.3 | % | |||
Total interest-earning assets |
| 201,819.0 |
| 19,403.0 |
| 9.6 | % | 179,637.4 |
| 12,791.4 |
| 7.1 | % | 169,183.4 |
| 13,216.1 |
| 7.8 | % |
Total non-interest-earning assets |
| 72,812.5 | — |
| — |
| 63,065.5 | — |
| — |
| 61,251.8 | — |
| — |
| |||
Total interest-earning and non interest-earning assets |
|
|
|
|
|
|
|
|
|
|
|
|
|
|
|
|
|
|
|
Domestic |
| 253,107.0 | 18,246.2 |
| 7.2 | % | 224,454.8 | 11,871.8 |
| 5.3 | % | 212,185.8 | 12,660.7 |
| 6.0 | % | |||
Foreign |
| 21,524.5 | 1,156.8 |
| 5.4 | % | 18,248.1 | 919.6 |
| 5.0 | % | 18,249.4 | 555.4 |
| 3.0 | % | |||
Total assets |
| 274,631.5 |
| 19,403.0 |
| 7.1 | % | 242,702.9 |
| 12,791.4 |
| 5.3 | % | 230,435.2 |
| 13,216.1 |
| 5.7 | % |
(1) For comparative purposes only, including both continuing and discontinued operations, our total average interest-earning assets, interest income earned thereon and average yield thereon for the year ended December 31, 2021 amounted to Ps. 257,453.2 billion, Ps. 19,647.5 billion and 7.6%, respectively, and our total average non-interest-earning assets for the same year amounted to Ps. Ps. 87,080.5 billion, in each case as reported in our Annual Report on Form 20-F for the year ended December 31, 2021.
(2) Reflects operations involving common short-term interbank funds, repurchase transactions (repos), simultaneous operations and transactions involving the temporary transfer of securities.
(3) Includes loans and interbank and overnight funds.
59
Average statement of financial position and income from interest-bearing and non-interest-bearing liabilities and |
| ||||||||||||||||||
equity for the years ended December 31, |
| ||||||||||||||||||
2022 | 2021 (1) | 2020 |
| ||||||||||||||||
|
| Interest |
|
|
| Interest |
|
|
| Interest |
|
| |||||||
Average | expense | Average | Average | expense | Average | Average | expense | Average |
| ||||||||||
balance | paid | interest rate | balance | paid | interest rate | balance | paid | interest rate |
| ||||||||||
(in Ps billions, except percentages) |
| ||||||||||||||||||
LIABILITIES AND EQUITY |
|
|
|
|
|
|
|
|
|
| |||||||||
Interest-bearing liabilities |
|
|
|
|
|
|
|
|
|
| |||||||||
Interest-bearing checking accounts |
|
|
|
|
|
|
|
|
|
|
|
|
|
|
|
|
|
| |
Domestic |
| 6,482.6 | 148.5 |
| 2.3 | % | 7,465.4 | 54.5 |
| 0.7 | % | 8,426.6 | 104.2 |
| 1.2 | % | |||
Foreign |
| 214.1 | 10.6 |
| 4.9 | % | 237.1 | 7.9 |
| 3.3 | % | 432.7 | 7.8 |
| 1.8 | % | |||
Total |
| 6,696.7 |
| 159.1 |
| 2.4 | % | 7,702.5 |
| 62.4 |
| 0.8 | % | 8,859.3 |
| 112.0 |
| 1.3 | % |
Savings accounts |
|
|
|
|
|
|
|
|
|
|
|
|
|
|
|
|
|
|
|
Domestic |
| 69,915.4 | 3,541.8 |
| 5.1 | % | 63,918.2 | 861.1 |
| 1.3 | % | 56,078.0 | 1,285.5 |
| 2.3 | % | |||
Foreign |
| 1,805.1 | 14.1 |
| 0.8 | % | 1,492.8 | 14.4 |
| 1.0 | % | 1,435.3 | 6.8 |
| 0.5 | % | |||
Total |
| 71,720.4 |
| 3,555.8 |
| 5.0 | % | 65,411.0 |
| 875.4 |
| 1.3 | % | 57,513.4 |
| 1,292.2 |
| 2.2 | % |
Time deposits |
|
|
|
|
|
|
|
|
|
|
|
|
|
|
|
|
|
|
|
Domestic |
| 52,114.7 | 3,692.2 |
| 7.1 | % | 46,049.4 | 1,406.4 |
| 3.1 | % | 48,541.9 | 2,016.1 |
| 4.2 | % | |||
Foreign |
| 9,316.6 | 349.3 |
| 3.7 | % | 8,163.3 | 293.7 |
| 3.6 | % | 8,140.6 | 157.4 |
| 1.9 | % | |||
Total |
| 61,431.3 |
| 4,041.5 |
| 6.6 | % | 54,212.7 |
| 1,700.1 |
| 3.1 | % | 56,682.6 |
| 2,173.5 |
| 3.8 | % |
Total interest bearing deposits |
|
|
|
|
|
|
|
|
|
|
|
|
|
|
|
|
|
|
|
Domestic |
| 128,512.7 | 7,382.4 |
| 5.7 | % | 117,433.0 | 2,322.0 |
| 2.0 | % | 113,046.6 | 3,405.8 |
| 3.0 | % | |||
Foreign |
| 11,335.7 | 374.0 |
| 3.3 | % | 9,893.2 | 315.9 |
| 3.2 | % | 10,008.6 | 172.0 |
| 1.7 | % | |||
Total |
| 139,848.4 |
| 7,756.4 |
| 5.5 | % | 127,326.2 |
| 2,637.9 |
| 2.1 | % | 123,055.2 |
| 3,577.8 |
| 2.9 | % |
Interbank and overnight funds (2) |
|
|
|
|
|
|
|
|
|
|
|
|
|
|
|
|
|
|
|
Domestic |
| 10,249.6 | 670.9 |
| 6.5 | % | 9,919.5 | 160.3 |
| 1.6 | % | 8,197.8 | 279.3 |
| 3.4 | % | |||
Foreign |
| 208.3 | 7.2 |
| 3.4 | % | 104.7 | 2.2 |
| 2.1 | % | 133.2 | 1.1 |
| 0.8 | % | |||
Total |
| 10,457.9 |
| 678.1 |
| 6.5 | % | 10,024.2 |
| 162.5 |
| 1.6 | % | 8,331.0 |
| 280.4 |
| 3.4 | % |
Borrowings from banks and other |
|
|
|
|
|
|
|
|
|
|
|
|
|
|
|
|
|
|
|
Domestic |
| 21,518.6 | 974.6 |
| 4.5 | % | 14,865.6 | 420.2 |
| 2.8 | % | 16,135.0 | 564.5 |
| 3.5 | % | |||
Foreign |
| 5,131.9 | 162.4 |
| 3.2 | % | 3,446.1 | 71.6 |
| 2.1 | % | 2,998.2 | 31.6 |
| 1.1 | % | |||
Total |
| 26,650.5 |
| 1,137.0 |
| 4.3 | % | 18,311.7 |
| 491.8 |
| 2.7 | % | 19,133.2 |
| 596.1 |
| 3.1 | % |
Long-term debt |
|
|
|
|
|
|
|
|
|
|
|
|
|
|
|
|
|
|
|
Domestic |
| 28,909.9 | 2,033.9 |
| 7.0 | % | 27,710.2 | 1,301.9 |
| 4.7 | % | 25,192.1 | 1,283.1 |
| 5.1 | % | |||
Foreign |
| 1,366.5 | 59.0 |
| 4.3 | % | 1,543.0 | 66.7 |
| 4.3 | % | 1,888.8 | 64.3 |
| 3.4 | % | |||
Total |
| 30,276.4 |
| 2,092.8 |
| 6.9 | % | 29,253.2 |
| 1,368.7 |
| 4.7 | % | 27,080.9 |
| 1,347.4 |
| 5.0 | % |
Total interest-bearing liabilities |
|
|
|
|
|
|
|
|
|
|
|
|
|
|
|
|
|
|
|
Domestic |
| 189,190.8 | 11,061.9 |
| 5.8 | % | 169,928.4 | 4,204.4 |
| 2.5 | % | 162,571.5 | 5,532.6 |
| 3.4 | % | |||
Foreign |
| 18,042.5 | 602.5 |
| 3.3 | % | 14,987.0 | 456.5 |
| 3.0 | % | 15,028.8 | 269.0 |
| 1.8 | % | |||
Total interest-bearing liabilities |
| 207,233.3 |
| 11,664.4 |
| 5.6 | % | 184,915.4 |
| 4,660.8 |
| 2.5 | % | 177,600.3 |
| 5,801.6 |
| 3.3 | % |
Total non-interest-bearing liabilities and equity |
| 67,398.2 |
| — |
| — |
| 57,787.5 |
| — |
| — |
| 52,834.9 |
| — |
| — |
|
Total liabilities and equity |
| 274,631.5 |
| 11,664.4 |
| 4.2 | % | 242,702.9 |
| 4,660.8 |
| 1.9 | % | 230,435.2 |
| 5,801.6 |
| 2.5 | % |
(1) For comparative purposes only, including both continuing and discontinued operations, our total average interest-bearing liabilities, interest expense paid thereon and average interest rate thereon for the year ended December 31, 2021 amounted to Ps. 266,029.1 billion, Ps. 6,918.7 billion and 2.6%, respectively, and our total average non-interest-bearing liabilities and equity for the same year amounted to Ps. 78,504.6 billion, in each case as reported in our Annual Report on Form 20-F for the year ended December 31, 2021.
(2) Reflects operations involving: common short-term interbank funds, repurchase transactions (repos), simultaneous operations and transactions involving the temporary transfer of securities.
60
Analysis of Changes in Volume and Rate on Interest Income and Interest Expense
The following tables allocate by currency of denomination, the changes in our interest income (interest-earning assets) and interest expense (interest-bearing liabilities) between the changes in average volume and changes in average yield (interest-earning assets) and average rates (interest-bearing liabilities) for the year ended December 31, 2022 compared to the year ended December 31, 2021 and the year ended December 31, 2021 compared to the year ended December 31, 2020. Volume and rate variances have been calculated based on variances in average balances over the period and changes in interest rates on average interest-earning assets and average interest-bearing funding as follows: (a) changes in volume (change in volume times new rate) and (b) changes in rates (change in rate times old volume). Net changes attributable to changes in both volume and interest rate have been allocated to changes in volume. You should read the following tables and the footnotes thereto in conjunction to our observations noted in “—Average statement of financial position”.
2022 - 2021 | 2021 - 2020 | |||||||||||
Increase (decrease) | Increase (decrease) | |||||||||||
due to changes in | due to changes in | |||||||||||
| Volume |
| Rate |
| Net change |
| Volume |
| Rate |
| Net change | |
(in Ps billions, except percentages) | ||||||||||||
Interest-earning assets: |
|
|
|
|
|
|
|
|
|
|
|
|
Fixed Income Investments |
|
|
|
|
|
|
|
|
|
|
|
|
Domestic |
| 86.9 | 829.0 | 915.9 |
| 186.1 | (57.4) | 128.8 | ||||
Foreign |
| 4.5 | 13.9 | 18.4 |
| (9.2) | 31.7 | 22.5 | ||||
Total |
| 91.7 | 842.5 | 934.3 |
| 162.4 | (11.1) | 151.2 | ||||
Interbank and overnight funds (1) |
| |||||||||||
Domestic |
| 227.1 | 117.1 | 344.2 |
| 6.0 | (36.0) | (30.0) | ||||
Foreign |
| (3.3) | 11.8 | 8.5 |
| (0.2) | 0.8 | 0.5 | ||||
Total |
| 223.5 | 129.2 | 352.7 |
| 4.5 | (34.1) | (29.5) | ||||
Loans |
| |||||||||||
Domestic |
| 1,738.6 | 3,375.7 | 5,114.3 |
| 384.0 | (1,271.6) | (887.6) | ||||
Foreign |
| 178.9 | 31.4 | 210.3 |
| 22.2 | 319.0 | 341.2 | ||||
Total |
| 1,949.8 | 3,374.8 | 5,324.7 |
| 404.5 | (950.9) | (546.4) | ||||
Sum interest-earnings assets |
| |||||||||||
Domestic |
| 2,052.5 | 4,321.9 | 6,374.4 |
| 576.2 | (1,365.1) | (788.9) | ||||
Foreign |
| 180.1 | 57.1 | 237.2 |
| 12.7 | 351.5 | 364.2 | ||||
Total interest-earnings assets |
| 2,265.0 | 4,346.6 | 6,611.6 |
| 571.4 | (996.1) | (424.7) | ||||
Interest-bearing liabilities |
| |||||||||||
Checking accounts |
| |||||||||||
Domestic |
| (22.5) | 116.6 | 94.0 |
| (7.0) | (42.7) | (49.7) | ||||
Foreign |
| (1.1) | 3.8 | 2.7 |
| (6.5) | 6.6 | 0.1 | ||||
Total |
| (23.9) | 120.6 | 96.7 |
| (9.4) | (40.3) | (49.7) | ||||
Saving accounts |
| |||||||||||
Domestic |
| 303.8 | 2,376.9 | 2,680.7 |
| 105.6 | (530.0) | (424.4) | ||||
Foreign |
| 2.4 | (2.7) | (0.3) |
| 0.6 | 7.0 | 7.6 | ||||
Total |
| 312.8 | 2,367.6 | 2,680.4 |
| 105.7 | (522.5) | (416.8) | ||||
Time deposits |
| — | — | — |
| — | — | — | ||||
Domestic |
| 429.7 | 1,856.0 | 2,285.7 |
| (76.1) | (533.5) | (609.7) | ||||
Foreign |
| 43.2 | 12.4 | 55.6 |
| 0.8 | 135.5 | 136.3 | ||||
Total |
| 474.9 | 1,866.4 | 2,341.3 |
| (77.5) | (395.9) | (473.4) | ||||
Interbank and overnight funds (1) |
| — | — | — |
| — | — | — | ||||
Domestic |
| 21.6 | 489.1 | 510.7 |
| 27.8 | (146.8) | (119.0) | ||||
Foreign |
| 3.6 | 1.4 | 5.0 |
| (0.6) | 1.7 | 1.1 | ||||
Total |
| 28.1 | 487.5 | 515.7 |
| 27.4 | (145.4) | (117.9) | ||||
Borrowings from banks and other |
| — | — | — |
| — | — | — | ||||
Domestic |
| 301.3 | 253.2 | 554.5 |
| (35.9) | (108.5) | (144.3) | ||||
Foreign |
| 53.3 | 37.4 | 90.7 |
| 9.3 | 30.7 | 40.0 | ||||
Total |
| 355.8 | 289.5 | 645.2 |
| (22.1) | (82.3) | (104.4) | ||||
Long-term debt | — | — | — |
| — | — | — | |||||
Domestic |
| 84.4 | 647.5 | 731.9 |
| 118.3 | (99.4) | 18.9 | ||||
Foreign |
| (7.6) | (0.1) | (7.7) |
| (14.9) | 17.3 | 2.4 | ||||
Total |
| 70.7 | 653.5 | 724.2 |
| 101.6 | (80.4) | 21.3 | ||||
Total interest-bearing liabilities | — | — | — |
| — | — | — | |||||
Domestic |
| 1,126.7 | 5,730.8 | 6,857.5 |
| 181.7 | (1,510.0) | (1,328.2) | ||||
Foreign |
| 101.8 | 44.3 | 146.1 |
| (0.9) | 188.3 | 187.4 | ||||
Total interest-bearing liabilities |
| 1,256.2 | 5,747.4 | 7,003.6 |
| 184.4 | (1,325.2) | (1,140.8) | ||||
(1) Reflects operations involving: common short-term interbank funds, repurchase transactions (repos), simultaneous operations and transactions involving the temporary transfer of securities.
61
Interest-earning assets – net interest margin and spread
The following table presents average balances of interest-earning assets as well as our yields on our average interest-earning assets, net interest earned, net interest margin and interest spread of continuing operations for the years ended December 31, 2022, 2021 and 2020.
For the years ended December 31, |
| ||||||
| 2022 |
| 2021 |
| 2020 |
| |
(in Ps billions, except percentages) |
| ||||||
Interbank and overnight funds |
|
| |||||
Domestic |
| 3,245.5 |
| 1,703.0 |
| 1,626.7 |
|
Foreign |
| 69.4 |
| 92.7 |
| 108.6 |
|
Total |
| 3,314.9 |
| 1,795.7 |
| 1,735.3 |
|
Loans - Client portfolio |
|
|
|
|
|
|
|
Domestic |
| 151,661.6 |
| 135,192.9 |
| 130,428.1 |
|
Foreign |
| 15,674.1 |
| 13,030.9 |
| 12,691.5 |
|
Total |
| 167,335.7 |
| 148,223.8 |
| 143,119.5 |
|
Fixed Income Investments |
|
|
|
| |||
Domestic |
| 27,454.1 |
| 26,096.8 |
| 20,326.5 |
|
Foreign |
| 3,714.3 |
| 3,521.1 |
| 4,002.1 |
|
Total |
| 31,168.4 |
| 29,617.9 |
| 24,328.6 |
|
Total average interest-earning assets |
|
|
|
|
|
|
|
Domestic |
| 182,361.1 |
| 162,992.8 |
| 152,381.2 | |
Foreign |
| 19,457.9 |
| 16,644.6 |
| 16,802.2 |
|
Total |
| 201,819.0 |
| 179,637.4 |
| 169,183.4 |
|
Gross interest earned |
|
|
|
|
|
|
|
Domestic |
| 18,246.2 |
| 11,871.8 |
| 12,660.7 |
|
Foreign |
| 1,156.8 |
| 919.6 |
| 555.4 |
|
Total |
| 19,403.0 |
| 12,791.4 |
| 13,216.1 |
|
Net interest income (1) |
|
|
|
|
|
|
|
Domestic |
| 7,184.3 |
| 7,667.4 |
| 7,128.1 |
|
Foreign |
| 554.3 |
| 463.2 |
| 286.4 |
|
Total |
| 7,738.6 |
| 8,130.6 |
| 7,414.5 |
|
Average yield on interest-earning assets |
|
|
|
|
|
|
|
Total Domestic |
| 10.0 | % | 7.3 | % | 8.3 | % |
Foreign |
| 5.9 | % | 5.5 | % | 3.3 | % |
Total |
| 9.6 | % | 7.1 | % | 7.8 | % |
Net interest margin (2) |
|
|
|
|
|
|
|
Total Domestic |
| 3.9 | % | 4.7 | % | 4.7 | % |
Foreign |
| 2.8 | % | 2.8 | % | 1.7 | % |
Total |
| 3.8 | % | 4.5 | % | 4.4 | % |
Interest spread on loans (3) |
|
|
|
|
|
|
|
Total Domestic |
| 4.8 | % | 6.1 | % | 6.0 | % |
Foreign |
| 3.5 | % | 3.3 | % | 2.3 | % |
Total |
| 4.7 | % | 5.9 | % | 5.7 | % |
Interest spread on total interest-earning assets (4) |
|
|
|
|
|
|
|
Total Domestic |
| 4.2 | % | 4.8 | % | 4.9 | % |
Foreign |
| 2.6 | % | 2.5 | % | 1.5 | % |
Total |
| 4.0 | % | 4.6 | % | 4.5 | % |
| (1) | Net interest income is calculated as interest income less interest paid and includes accrued interest on interbank and overnight funds. |
| (2) | Net interest margin is calculated as net interest income divided by total average interest-earning assets, of continuing operations. Such average interest-earning assets for 2022, 2021 and 2020 are calculated as the sum of such interest-earning assets at each quarter-end during the applicable year and the prior year end divided by five. |
| (3) | Interest spread on loans is calculated as the difference between the average yield on interest-earning loans and leases and the average rate paid on interest-bearing deposits. |
| (4) | Interest spread on total interest-earning assets is calculated as the difference between the average yield on interest-earning assets and the average rate paid on interest-bearing liabilities. |
62
Investment portfolio
The following tables summarizes the weighted average yield for each range of maturities by category of debt securities at fair value through OCI and at amortized cost as of December 31, 2022.
At December 31, 2022 |
| ||||||||||
Investments in debt securities at fair value through OCI | In one year or less | After one year through five years | After five years through ten years | After ten years | Total |
| |||||
| Average Yield % (1) | Average Yield % (1) | Average Yield % (1) | Average Yield % (1) | Average Yield % (1) |
| |||||
Debt securities |
|
| |||||||||
Peso-denominated |
|
|
|
|
|
|
|
|
|
| |
Securities issued or secured by the Colombian government |
| 5.3 | % | 11.0 | % | 11.4 | % | 11.0 | % | 10.6 | % |
Securities issued or secured by Colombian government entities |
| 18.5 | % | 15.5 | % | 17.5 | % | — | % | 16.1 | % |
Securities issued or secured by other financial entities |
| 18.5 | % | 19.0 | % | 21.5 | % | 16.9 | % | 18.8 | % |
Other securities |
| 5.5 | % | 22.0 | % | 17.5 | % | — | % | 13.4 | % |
Total weighted average yield, peso-denominated |
| 8.2 | % | 11.3 | % | 12.6 | % | 11.8 | % | 11.1 | % |
Foreign currency-denominated |
|
|
|
|
| ||||||
Securities issued or secured by the Colombian government |
| 2.7 | % | 4.3 | % | 5.8 | % | 7.1 | % | 4.3 | % |
Securities issued or secured by foreign Central Banks |
| — | % | — | % | 5.7 | % | — | % | 5.7 | % |
Securities issued or secured by Colombian government entities |
| 2.6 | % | 4.2 | % | 8.7 | % | — | % | 4.0 | % |
US government and agencies | 4.9 | % | 4.2 | % | 3.9 | % | 3.1 | % | 4.3 | % | |
Non-US governments and agencies |
| 2.2 | % | 5.3 | % | 5.5 | % | 7.3 | % | 5.3 | % |
Securities issued or secured by other financial entities | 3.4 | % | 4.5 | % | 5.7 | % | — | % | 4.2 | % | |
Other securities |
| 5.2 | % | 5.1 | % | 6.5 | % | 8.1 | % | 5.6 | % |
Total weighted average yield, foreign currency-denominated | 3.6 | % | 4.6 | % | 5.8 | % | 5.5 | % | 4.5 | % | |
Total Average Yield debt securities at fair value through OCI, net |
| 5.6 | % | 9.3 | % | 9.9 | % | 8.6 | % | 8.7 | % |
(1) The weighted-average yield is computed using the internal rate of return, or “IRR”, at December 31, 2022.
At December 31, 2022 |
| ||||||||||
Investments in debt securities at amortized cost | In one year or less | After one year through five years | After five years through ten years | After ten years | Total |
| |||||
| Average Yield % (1) | Average Yield % (1) | Average Yield % (1) | Average Yield % (1) | Average Yield % (1) |
| |||||
Debt securities |
|
| |||||||||
Peso-denominated |
|
|
|
|
|
|
|
|
|
| |
Securities issued or secured by the Colombian government |
| 10.6 | % | — | % | — | % | — | % | 10.6 | % |
Securities issued or secured by Colombian government entities |
| 8.7 | % | — | % | — | % | — | % | 8.7 | % |
Other securities |
| — | % | — | % | 15.1 | % | — | % | 15.1 | % |
Total weighted average yield, peso-denominated |
| 9.4 | % | — | % | 15.1 | % | — | % | 9.4 | % |
Foreign currency-denominated |
|
|
|
|
| ||||||
US government and agencies | 4.1 | % | — | % | — | % | — | % | 4.1 | % | |
Securities issued or secured by other financial entities | 8.1 | % | 7.2 | % | — | % | 10.0 | % | 9.9 | % | |
Other securities |
| 8.6 | % | 6.1 | % | 6.6 | % | 8.5 | % | 6.6 | % |
Total weighted average yield, foreign currency-denominated | 6.2 | % | 6.5 | % | 6.6 | % | 10.0 | % | 9.5 | % | |
Total Average Yield debt securities at amortized cost, net |
| 9.3 | % | 6.5 | % | 8.7 | % | 10.0 | % | 9.4 | % |
(1) The weighted-average yield is computed using the internal rate of return, or “IRR”, at December 31, 2022.
63
Loan portfolio
Maturity Profile of the Loan Portfolio
The following table presents the maturities of our loan portfolio at December 31, 2022.
At December 31, 2022 | ||||||||||
|
| After one |
| After five |
|
| ||||
In one | year through | years through | After | |||||||
year or less | five years | 15 years | 15 years | Total | ||||||
(in Ps billions) |
| |||||||||
Domestic |
|
|
|
|
|
|
|
| ||
Commercial |
|
|
|
|
|
|
|
| ||
General purpose loans |
| 34,231.4 | 28,353.0 | 6,752.8 | 5.9 | 69,343.1 | ||||
Loans funded by development banks |
| 1,236.6 | 2,089.2 | 727.4 | — | 4,053.3 | ||||
Working capital loans |
| 8,575.8 | 1,357.9 | 34.5 | 0.1 | 9,968.3 | ||||
Credit cards |
| 205.4 | 111.9 | 0.6 | — | 317.9 | ||||
Overdrafts |
| 198.2 | — | — | — | 198.2 | ||||
Leases | 2,755.4 | 6,126.5 | 1,915.7 | 25.0 | 10,822.6 | |||||
Interbank and overnight funds |
| 5,927.3 | — | — | — | 5,927.3 | ||||
Total commercial |
| 53,130.1 |
| 38,038.6 |
| 9,431.0 |
| 31.0 | 100,630.7 | |
Consumer |
|
|
|
|
|
|
|
|
| |
Credit cards |
| 3,350.8 | 3,193.5 | 217.7 | — | 6,762.1 | ||||
Personal loans |
| 2,995.8 | 8,496.3 | 1,109.1 | 7.1 | 12,608.3 | ||||
Payroll loans | 1,683.6 | 7,884.3 | 22,279.4 | 0.7 | 31,848.0 | |||||
Automobile and vehicle loans |
| 904.4 | 2,641.6 | 431.9 | 0.0 | 3,977.8 | ||||
Overdrafts |
| 31.1 | 0.0 | 0.0 | — | 31.1 | ||||
General purpose loans |
| 75.4 | 69.7 | 3.0 | 0.0 | 148.1 | ||||
Leases | 5.8 | 6.6 | 0.1 | — | 12.4 | |||||
Total consumer |
| 9,046.9 |
| 22,291.9 |
| 24,041.2 |
| 7.8 | 55,387.9 | |
Mortgages |
|
|
|
|
|
|
|
|
| |
Mortgages |
| 581.9 | 1,759.3 | 6,737.5 | 2,470.2 | 11,548.9 | ||||
Leases |
| 171.0 | 503.4 | 1,200.4 | 520.5 | 2,395.3 | ||||
Total Mortgages |
| 752.9 |
| 2,262.7 |
| 7,937.9 |
| 2,990.7 | 13,944.2 | |
Microcredit |
| 155.4 | 111.3 | 1.1 | 0.0 | 267.7 | ||||
Total domestic portfolio |
| 63,085.3 |
| 62,704.5 |
| 41,411.2 |
| 3,029.5 | 170,230.6 | |
Foreign |
|
|
|
|
|
|
|
|
| |
Commercial |
|
|
|
|
|
|
|
|
| |
General purpose loans |
| 1,175.9 | 3,673.0 | 278.5 | 3.1 | 5,130.5 | ||||
Working capital loans |
| 3,413.1 | 1,230.9 | 19.4 | — | 4,663.3 | ||||
Overdrafts |
| 234.1 | 4.4 | — | — | 238.5 | ||||
Leases |
| 9.4 | 30.0 | — | — | 39.4 | ||||
Interbank and overnight funds |
| 40.4 | — | — | — | 40.4 | ||||
Total commercial |
| 4,873.0 |
| 4,938.2 |
| 297.9 |
| 3.1 | 10,112.1 | |
Consumer |
|
|
|
|
|
|
|
|
| |
Credit cards |
| 225.0 | 20.2 | 16.4 | — | 261.5 | ||||
Personal loans |
| 1.1 | 29.8 | 305.9 | 480.7 | 817.4 | ||||
Payroll loans | 30.4 | 184.0 | 714.3 | 529.9 | 1,458.6 | |||||
Automobile and vehicle loans |
| 38.1 | 694.8 | 710.3 | — | 1,443.2 | ||||
Overdrafts |
| 44.4 | 0.3 | — | — | 44.7 | ||||
Leases |
| 1.2 | 4.8 | — | — | 6.0 | ||||
Total consumer |
| 340.2 |
| 933.9 |
| 1,746.8 |
| 1,010.6 | 4,031.5 | |
Mortgages |
| 0.0 | 6.4 | 159.5 | 3,773.1 | 3,939.1 | ||||
Total foreign portfolio |
| 5,213.2 |
| 5,878.5 |
| 2,204.3 |
| 4,786.8 | 18,082.8 | |
Total loan portfolio |
| 68,298.5 |
| 68,583.1 |
| 43,615.5 |
| 7,816.3 | 188,313.4 | |
64
The following table presents our loan portfolio due after one year and within one year or less as of December 31, 2022, broken down between fixed and variable rates.
|
| At December 31, |
2022 | ||
| (in Ps billions) | |
Loans with maturity of one year or less |
|
|
Variable rate: |
|
|
Domestic |
| 38,656.6 |
Foreign |
| 4,669.2 |
Total |
| 43,325.8 |
Fixed rate: |
| |
Domestic |
| 24,428.7 |
Foreign |
| 543.9 |
Total |
| 24,972.7 |
Total loans with maturity of one year or less |
| 68,298.5 |
Loans with maturity of more than one year |
|
|
Variable rate: |
|
|
Domestic |
| 44,610.3 |
Foreign |
| 12,828.4 |
Total |
| 57,438.7 |
Fixed rate: |
| |
Domestic |
| 62,535.0 |
Foreign |
| 41.2 |
Total |
| 62,576.2 |
Total loans with maturity of more than one year |
| 120,014.9 |
Total loan portfolio |
| 188,313.4 |
Credit Ratios
The following table presents our credit ratios for the years indicated, adjusted where applicable to exclude the impact of discontinued operations:
At December 31, | ||||||
|---|---|---|---|---|---|---|
2022 | 2021 | 2020 | ||||
(in Ps billions, except percentages) | ||||||
Domestic |
|
|
| |||
Commercial (1) | 0.8% | 1.3% | 1.7% | |||
Net charge-off during the period | 677.8 | 1,046.2 | 1,373.7 | |||
Average amount outstanding | 87,306.2 | 79,176.6 | 79,784.6 | |||
Consumer | 4.3% | 5.2% | 3.7% | |||
Net charge-off during the period | 2,197.5 | 2,348.6 | 1,495.9 | |||
Average amount outstanding | 51,331.9 | 44,846.7 | 40,644.2 | |||
Microcredit | 28.4% | 14.6% | 13.3% | |||
Net charge-off during the period | 80.6 | 49.9 | 51.7 | |||
Average amount outstanding | 284.3 | 342.8 | 388.9 | |||
Mortgages | 0.3% | 0.2% | 0.1% | |||
Net charge-off during the period | 32.6 | 25.4 | 9.6 | |||
Average amount outstanding | 12,739.2 | 10,826.8 | 9,610.4 | |||
Total domestic | 2.0% | 2.6% | 2.2% | |||
Net charge-off during the period | 2,988.6 | 3,470.1 | 2,930.9 | |||
Average amount outstanding | 151,661.6 | 135,192.9 | 130,428.1 | |||
Foreign |
|
| ||||
Commercial (1) | 0.8% | 0.5% | 0.1% | |||
Net charge-off during the period | 68.4 | 39.2 | 7.6 | |||
Average amount outstanding | 8,804.3 | 7,330.1 | 7,112.3 | |||
65
At December 31, | ||||||
|---|---|---|---|---|---|---|
2022 | 2021 | 2020 | ||||
(in Ps billions, except percentages) | ||||||
Consumer | 4.1% | 1.2% | 0.5% | |||
Net charge-off during the period | 145.7 | 35.0 | 15.8 | |||
Average amount outstanding | 3,524.0 | 2,983.8 | 2,963.3 | |||
Mortgages | 0.3% | 0.1% | 0.0% | |||
Net charge-off during the period | 9.2 | 1.8 | 0.2 | |||
Average amount outstanding | 3,345.9 | 2,717.0 | 2,615.9 | |||
Total foreign | 1.4% | 0.6% | 0.2% | |||
Net charge-off during the period | 223.3 | 76.0 | 23.6 | |||
Average amount outstanding | 15,674.1 | 13,030.9 | 12,691.5 | |||
Total loans | 1.9% | 2.4% | 2.1% | |||
Net charge-off during the period | 3,211.9 | 3,546.1 | 2,954.5 | |||
Average amount outstanding | 167,335.7 | 148,223.8 | 143,119.5 | |||
| (1) | Reflects charge-offs of commercial loans entered into with clients, in the ordinary course of our business charge-offs for interbank and overnight funds are not usual. |
For a discussion of Grupo Aval’s net impairment loss on financial assets see “Item 5. Operating and Financial Review and Prospects—A. Operating Results”.
See Note 4.1.5. “Risk Management” to our audited consolidated financial statements for the breakdown of allowance for credit losses by each loan category.
Deposits
The following table presents our average interest-bearing and non-interest bearing deposits by category for the periods indicated, adjusted where applicable to exclude the impact of discontinued operations:
Average statement of financial position and income from interest-bearing and non-interest-bearing liabilities |
| ||||||||||||||||||
|---|---|---|---|---|---|---|---|---|---|---|---|---|---|---|---|---|---|---|---|
for the years ended December 31, |
| ||||||||||||||||||
2022 | 2021 | 2020 |
| ||||||||||||||||
|
| Interest |
|
|
| Interest |
|
|
| Interest |
|
| |||||||
Average | expense | Average | Average | expense | Average | Average | expense | Average |
| ||||||||||
balance | paid | interest rate | balance | paid | interest rate | balance | paid | interest rate |
| ||||||||||
(in Ps billions, except percentages) |
| ||||||||||||||||||
Deposits |
|
|
|
|
|
|
|
|
|
| |||||||||
Interest-bearing deposits |
|
|
|
|
|
|
|
|
|
| |||||||||
Interest-bearing checking accounts |
|
|
|
|
|
|
|
|
|
|
|
|
|
|
|
|
|
| |
Domestic |
| 6,482.6 | 148.5 |
| 2.3 | % | 7,465.4 | 54.5 |
| 0.7 | % | 8,426.6 | 104.2 |
| 1.2 | % | |||
Foreign |
| 214.1 | 10.6 |
| 4.9 | % | 237.1 | 7.9 |
| 3.3 | % | 432.7 | 7.8 |
| 1.8 | % | |||
Total |
| 6,696.7 |
| 159.1 |
| 2.4 | % | 7,702.5 |
| 62.4 |
| 0.8 | % | 8,859.3 |
| 112.0 |
| 1.3 | % |
Savings accounts |
|
|
|
|
|
|
|
|
|
|
|
|
|
|
|
|
|
|
|
Domestic |
| 69,915.4 | 3,541.8 |
| 5.1 | % | 63,918.2 | 861.1 |
| 1.3 | % | 56,078.0 | 1,285.5 |
| 2.3 | % | |||
Foreign |
| 1,805.1 | 14.1 |
| 0.8 | % | 1,492.8 | 14.4 |
| 1.0 | % | 1,435.3 | 6.8 |
| 0.5 | % | |||
Total |
| 71,720.4 |
| 3,555.8 |
| 5.0 | % | 65,411.0 |
| 875.4 |
| 1.3 | % | 57,513.4 |
| 1,292.2 |
| 2.2 | % |
Time deposits |
|
|
|
|
|
|
|
|
|
|
|
|
|
|
|
|
|
|
|
Domestic |
| 52,114.7 | 3,692.2 |
| 7.1 | % | 46,049.4 | 1,406.4 |
| 3.1 | % | 48,541.9 | 2,016.1 |
| 4.2 | % | |||
Foreign |
| 9,316.6 | 349.3 |
| 3.7 | % | 8,163.3 | 293.7 |
| 3.6 | % | 8,140.6 | 157.4 |
| 1.9 | % | |||
Total |
| 61,431.3 |
| 4,041.5 |
| 6.6 | % | 54,212.7 |
| 1,700.1 |
| 3.1 | % | 56,682.6 |
| 2,173.5 |
| 3.8 | % |
Total interest bearing deposits |
|
|
|
|
|
|
|
|
|
|
|
|
|
|
|
|
|
|
|
Domestic |
| 128,512.7 | 7,382.4 |
| 5.7 | % | 117,433.0 | 2,322.0 |
| 2.0 | % | 113,046.6 | 3,405.8 |
| 3.0 | % | |||
Foreign |
| 11,335.7 | 374.0 |
| 3.3 | % | 9,893.2 | 315.9 |
| 3.2 | % | 10,008.6 | 172.0 |
| 1.7 | % | |||
Total |
| 139,848.4 |
| 7,756.4 |
| 5.5 | % | 127,326.2 |
| 2,637.9 |
| 2.1 | % | 123,055.2 |
| 3,577.8 |
| 2.9 | % |
Non-Interest-bearing deposits |
|
|
|
|
|
|
|
|
|
| |||||||||
Non-interest-bearing checking accounts |
|
|
|
|
|
|
|
|
|
|
|
|
|
|
|
|
|
| |
Domestic |
| 18,458.3 | — |
| — | % | 17,341.3 | — |
| — | % | 16,571.4 | — | — | % | ||||
Foreign |
| 1,315.1 | — |
| — | % | 1,295.8 | — |
| — | % | 1,140.2 | — | — | % | ||||
Total |
| 19,773.4 |
| — |
| — | % | 18,637.0 |
| — |
| — | % | 17,711.6 | — | — | % | ||
Others deposits |
|
|
|
|
|
|
|
|
|
|
|
|
|
| |||||
Domestic |
| 511.4 | — |
| — | % | 287.5 | — |
| — | % | 262.1 | — | — | % | ||||
Foreign |
| 8.9 | — |
| — | % | 7.1 | — |
| — | % | 3.8 | — | — | % | ||||
Total |
| 520.2 |
| — |
| — | % | 294.5 |
| — |
| — | % | 265.9 | — | — | % | ||
Total non-interest bearing deposits | |||||||||||||||||||
Domestic | 18,969.7 | — |
| — | % | 17,628.7 | — |
| — | % | 16,833.5 | — | — | % | |||||
Foreign | 1,323.9 | — |
| — | % | 1,302.9 | — |
| — | % | 1,144.1 | — | — | % | |||||
Total | 20,293.6 |
| — |
| — | % | 18,931.6 |
| — |
| — | % | 17,977.6 | — | — | % | |||
Total deposits |
|
|
|
|
|
|
|
|
|
|
|
|
|
| |||||
66
Average statement of financial position and income from interest-bearing and non-interest-bearing liabilities |
| ||||||||||||||||||
|---|---|---|---|---|---|---|---|---|---|---|---|---|---|---|---|---|---|---|---|
for the years ended December 31, |
| ||||||||||||||||||
2022 | 2021 | 2020 |
| ||||||||||||||||
|
| Interest |
|
|
| Interest |
|
|
| Interest |
|
| |||||||
Average | expense | Average | Average | expense | Average | Average | expense | Average |
| ||||||||||
balance | paid | interest rate | balance | paid | interest rate | balance | paid | interest rate |
| ||||||||||
(in Ps billions, except percentages) |
| ||||||||||||||||||
Domestic |
| 147,482.4 | 7,382.4 | 5.0 | % | 135,061.7 | 2,322.0 | 1.7 | % | 129,880.1 | 3,405.8 | 2.6 | % | ||||||
Foreign |
| 12,659.6 | 374.0 | 3.0 | % | 11,196.1 | 315.9 | 2.8 | % | 11,152.7 | 172.0 | 1.5 | % | ||||||
Total deposits |
| 160,142.1 | 7,756.4 | 4.8 | % | 146,257.8 | 2,637.9 | 1.8 | % | 141,032.8 | 3,577.8 | 2.5 | % | ||||||
The following table presents the amount of uninsured deposits by geography:
At December 31, 2022 (1) | |||||
(in Ps billions) | |||||
Peso-denominated | Foreign currency-denominated | Total | |||
Barbados…............................... | — | 1,161.3 | 1,161.3 | ||
Colombia…............................... | 125,914.2 | 6,910.6 | 132,824.8 | ||
Panamá.................................... | — | 23,173.1 | 23,173.1 | ||
Total.................................................... | 125,914.2 | 31,244.9 | 157,159.1 | ||
(1) Includes uninsured: checking accounts, saving accounts, time deposits and other deposits.
The following table presents a maturity profile of our uninsured time deposits by geography:
Colombia | |||||
At December 31, 2022 | |||||
(in Ps billions) | |||||
Peso-denominated | Foreign currency-denominated | Total | |||
3 months or less.................................... | 12,081.9 | 1,032.9 | 13,114.8 | ||
Over 3 through 6 months.............................. | 8,783.7 | 1,748.0 | 10,531.8 | ||
Over 6 through 12 months............................ | 17,675.5 | 180.9 | 17,856.4 | ||
Over 12 months........................... | 9,329.7 | 24.8 | 9,354.5 | ||
Total.................................................... | 47,870.9 | 2,986.6 | 50,857.5 | ||
Barbados | |||||
At December 31, 2022 | |||||
(in Ps billions) | |||||
Peso-denominated | Foreign currency-denominated | Total | |||
3 months or less.................................... | — | 145.8 | 145.8 | ||
Over 3 through 6 months.............................. | — | 322.6 | 322.6 | ||
Over 6 through 12 months............................ | — | 236.0 | 236.0 | ||
Over 12 months........................... | — | 51.7 | 51.7 | ||
Total.................................................... | — | 756.1 | 756.1 | ||
Panamá | |||||
At December 31, 2022 | |||||
(in Ps billions) | |||||
Peso-denominated | Foreign currency-denominated | Total | |||
3 months or less.................................... | — | 2,391.0 | 2,391.0 | ||
Over 3 through 6 months.............................. | — | 4,840.7 | 4,840.7 | ||
Over 6 through 12 months............................ | — | 4,631.6 | 4,631.6 | ||
Over 12 months........................... | — | 4,784.7 | 4,784.7 | ||
Total.................................................... | — | 16,647.9 | 16,647.9 | ||
67
Supervision and regulation
Colombian Banking Regulators
Pursuant to the Colombian Constitution, the Colombian Congress has the power to prescribe the general legal framework within which the Government and other authorities may regulate the financial system. The Colombian Constitution also permits the Colombian Congress to authorize Government intervention in the economy by statute. The agencies vested with the authority to regulate the financial system are the Board of Directors of the Colombian Central Bank, the Colombian Ministry of Finance, the Superintendency of Finance, the Superintendency of Industry and Commerce and the Securities Market Self-Regulatory Organization.
Central Bank
The Colombian Central Bank exercises the customary functions of a central bank, including price stabilization, legal currency issuance, regulation of currency circulation, credit and exchange rate monitoring and administration of international reserves. Its Board of Directors is the regulatory authority for monetary, currency exchange and credit policies, and is responsible for the direction and execution of the Colombian Central Bank duties. The Colombian Central Bank also acts as a lender of last resort to financial institutions.
Pursuant to the Colombian Constitution, the Colombian Central Bank is autonomous and independent from the Government in the formulation of monetary policy and currency exchange and credit policies. Specifically, the Constitution provides administrative, technical, budgetary and legal autonomy for the Colombian Central Bank and its Board of Directors with respect to monetary, credit and foreign exchange matters. The Colombian Central Bank reports to the Colombian Congress. Its Board of Directors has seven members: one member is the Minister of Finance and Public Credit, one member is the General Manager of the Colombian Central Bank, and the other five members, who are full-time employees, are appointed two at a time by the President of Colombia for four-year terms that can be extended.
Ministry of Finance
The Ministry of Finance designs, coordinates, regulates and executes economic policy, seeking to create an optimal administration of public finances for the economic and social development of the country. The Ministry of Finance regulates all aspects of finance, securities and insurance activities, pursuant to powers conferred by the Colombian Constitution. As part of its duties, the Ministry of Finance issues decrees mainly related to financial, taxation, customs, public credit and budgetary matters that may affect banking transactions in Colombia. In particular, the Ministry of Finance is responsible for regulations relating to financial institutions’ capital adequacy, risk limitations, authorized transactions, disclosure of information and accounting.
According to Decree 4172 of 2011, the “Unidad Administrativa Especial, Unidad de Proyección Normativa y Estudios de Regulación Financiera” (URF), an independent unit of the Ministry of Finance is responsible for preparing and drafting any new financial, monetary, credit, securities, foreign exchange and insurance regulation to be issued by the Colombian Government.
During 2022, the URF along with the Ministry of Finance issued 8 decrees: Decree 053 of 2022, which amends the regulation regarding bonds issuance by private capital funds (hedge funds); Decree 175 of 2022 regarding capital ratios and Tier 1 and Tier 2 capital for Trust Managers Corporations, Pension Funds Managers, Stock Market Broker dealers and Investment Managers Corporations; Decree 1297 of 2022 regarding Open Banking regulations; Decree 1387 of 2022 regarding minimum investments over Private Capital Funds (Hedge Funds); Decree 1458 of 2022 regulating investments of Pension funds over Private Capital Funds; Decree 1459 of 2022 which amends regulation regarding leasing agreement, low amounts consumer loans, and use of network agreements, among others; Decree 1533 of 2022 which amends regulation regarding legal lending limits and credit exposition to groups of related counterparties (“Great Expositions”); and Decree 1531 of 2022 regarding technical provisions for insurance companies. As noted, some of this regulation seems to directly affect the profitability and business lines of our companies, specially Decree 1533 of 2022, see “Item 4. Information on the Company—B. Business overview—Supervision and regulation.—Lending Limits”.
Superintendency of Finance
The Superintendency of Finance is a technical entity affiliated to the Ministry of Finance that performs the inspection, supervision and control authority of persons involved in financial, insurance and securities exchange activities, and any other operations related to the management, use or investment of resources collected from the public. The Superintendency of Finance is responsible for supervising the Colombian financial system with the purpose of preserving its stability and trustworthiness, as well as promoting, organizing and developing the Colombian securities market and protecting the users of financial and insurance services and investors in general.
Financial institutions must obtain the authorization of the Superintendency of Finance before commencing operations. In addition, all public offerings of securities require the prior approval of the Superintendency of Finance.
68
Violations of the financial system rules and regulations are subject to administrative, and in some cases, criminal sanctions. The Superintendency of Finance may inspect Colombian financial institutions on a discretionary basis and has the authority to impose sanctions including admonitions, fines, removals, or administrative takeovers on such institutions and their directors and officers for violations of Colombian laws or regulations, or such financial institutions’ by-laws.
The Superintendency of Finance exerts its supervisory powers over the financial sector on a consolidated and comprehensive basis. The consolidated supervision extends to all financial institutions including banks operating in Colombia and their subsidiaries abroad, in the latter case to the extent permitted by the laws of the respective country of incorporation. For these purposes, the Superintendency of Finance has executed several memorandums of understanding with foreign financial sector regulators, including the Superintendency of Banks of Panamá.
According to Decree 2555 of 2010, External Circular 029 of 2014 (“Basic Legal Circular”) and External Circular 100 of 1995 (“Basic Accounting and Financial Circular”) as amended, and to facilitate the Superintendency of Finance’s supervision, financial institutions are required to consolidate the results of operations of all of their subsidiaries in order to present consolidated financial statements of the controlling entity and its subsidiaries, consolidated solvency ratios and capital adequacy requirements of the group.
The Superintendency of Finance may also conduct onsite inspections of Colombian financial institutions, financial holdings and even their subsidiaries located abroad, in the latter case, subject to the applicable laws of the subsidiary’s country of incorporation.
According to Article 2.17.2.4.2.1 of Decree 1068 of 2015, when granting authorizations relating to foreign investment transactions made by direct shareholders of Colombian financial institutions in foreign financial entities, the Superintendency of Finance must take into account the possibility of exercising comprehensive and consolidated supervision. In addition, according to Law 1328 of 2009 and Decree 2555 of 2010: (1) direct capital investments by Colombian financial institutions in foreign financial, brokerage or insurance companies, branches or agencies, require the prior authorization by the Superintendency of Finance, and (2) indirect capital investment (i.e., through a subsidiary) in foreign financial, brokerage or insurance companies, branches or agencies, require the prior authorization by the Superintendency of Finance if: (a) the initial investment equals or exceeds 10% of the investor’s paid-in capital, (b) additional investments equal or exceed 5% of the investor’s paid-in capital or (c) the financial regulatory authority of the country where the investment is to be made has not executed a memorandum of understanding with the Superintendency of Finance. Other indirect investments do not require the approval of the Superintendency of Finance but must be reported to such entity prior to the respective investment.
As a financial holding and an issuer of securities traded on the Colombian Stock Exchange, Grupo Aval is subject to the inspection and surveillance of the Superintendency of Finance. Additionally, Grupo Aval’s financial and stock brokerage subsidiaries located in Colombia (including banks, merchant banks, financing companies, trust companies, managers of pensions and severance payment funds, bonded warehouses and stock brokerage firms) are each subject to the regulatory supervision of the Superintendency of Finance. The level of supervision and regulation is different, though, taking into account that Grupo Aval is not a financial institution. Since February 6, 2019, Grupo Aval became subject to the supervision and regulation of the Superintendency of Finance as the financial holding of the Aval Financial Conglomerate and is required to comply with capital adequacy and additional regulations applicable to financial conglomerates. See “Item 4. Information on the Company—B. Business overview—Supervision and regulation.—Regulatory framework for Colombian Financial Conglomerates”.
Between 2021 and 2023, 70 External Circulars (“CE” for its acronym in Spanish) have been issued by the Superintendency of Finance, we highlight the following: CE 02 of 2022 (Requirements for conditioned coverage of the Interest Rate subsidy for urban new housing loan); CE 03 of 2023 (Updating of the Information System of the Colombian Stock Market ); CE 05 of 2022 (Green Taxonomy adoption); CE 012 of 2022 (Instructions regarding yearly financial statements and yearly reports) CE 021 of 2021 regarding Calibration for liquidity margins applicable for the Calculus of the Net Stable Funding Coeficient; CE 031 of 2021 (Instructions regarding the disclosure of information on social and environmental matters, including climate issues); CE 025 of 2022 (which instructs regarding interest rate risk over the Banking Book) among others.
Fondo de Garantías de Instituciones Financieras
The Fondo de Garantías de Instituciones Financieras (“FOGAFIN”) was created pursuant to Law 117 of 1985. The primary function of FOGAFIN is to administer the deposit insurance system, with the objective of guaranteeing the deposits and savings held by the general public in Colombian financial institutions. See “—Troubled Financial Institutions—Deposit Insurance”. The other primary purposes for which FOGAFIN was formed were to support the banking industry, to facilitate the privatization of financial institutions by the Colombian Government, and to liquidate financial institutions under receivership.
FOGAFIN has tools and mechanisms that enable it to administer and temporarily take equity stakes in troubled financial institutions in order to allow it to determine whether a financial institution is viable or requires liquidation.
69
Securities Market Self-Regulatory Organization
Self-regulation in the capital markets was formally introduced in Colombia by Law 964 of 2005, and the securities market self-regulatory organization (Autoregulador del Mercado de Valores de Colombia), or “SRO”, was created on June 12, 2006.
The SRO is a private entity that has the power to supervise, sanction and regulate the entities subject to self-regulation (i.e., including securities intermediaries and any entity that voluntarily submits itself to self-regulation).
The SRO’s supervisory powers entitle it to review compliance with applicable laws and regulations and impose sanctions in the case of violations. The SRO may also propose regulation aimed at various matters, including conflicts of interest and improving the integrity and quality of the capital markets.
Superintendency of Industry and Commerce
According to Law 1340 of 2009, the Superintendency of Industry and Commerce is the competent national authority for all antitrust, intellectual property and data protection matters in every sector of the economy, including the financial sector.
As such, the Superintendency of Industry and Commerce is responsible for advancing administrative investigations of antitrust violations by financial and non-financial corporations and has the power to impose corresponding sanctions.
The Superintendency of Industry and Commerce is responsible for approving mergers, acquisitions and integrations between and among enterprises, except for mergers, acquisitions or integrations between financial entities. Pursuant to Law 1340 of 2009, the Superintendency of Finance is the authority responsible for approving mergers, acquisitions and integrations between financial institutions. For such approvals, the Superintendency of Finance must obtain a prior written opinion by the Superintendency of Industry and Commerce. Nonetheless, if any of the provisions set forth in numeral 4. of the Resolution 2751 of 2021 of the Superintendency of Industry and Commerce are met, the requirement to obtain such written opinion is not mandatory.
Regulatory framework for Colombian Financial Conglomerates
On September 21, 2017, the Colombian Congress enacted Law 1870 to strengthen the regulation and supervision of the financial conglomerates, also known as Law of Financial Conglomerates (Ley de Conglomerados Financieros). This Law sets out the scope of supervision and regulation of financial conglomerates in Colombia with the purpose of ensuring the stability of the financial system and providing the Colombian Government (Ministry of Finance) with regulatory powers to obtain complete and timely information that guarantees the transparency of the operations of the conglomerates and facilitates the exercise of consolidated supervision.
This law defines a financial conglomerate as a set of two or more local or foreign financial entities with a common controller requiring that at least one of these entities conduct financial activities in Colombia. Law 1870 also establishes the criteria for identifying the holding company of each financial conglomerate. Accordingly, any legal person or investment vehicle that exerts the first level of control or significant influence over the members of the financial conglomerate will be identified as the holding company. The Superintendency of Finance is in charge of identifying each financial conglomerate and its respective holding company.
As a result of Law 1870 of 2017, which became effective February 6, 2019, holding companies, such as Grupo Aval, became subject to the supervision of the Superintendency of Finance and are required to comply with this law. Law 1870 also granted the Colombian Government (Ministry of Finance) the authority to enact regulations regarding:
| ● | Rules of capital adequacy and minimum capital requirements of individual entities within a financial conglomerate, |
| ● | Criteria pursuant to which the Superintendency of Finance will be allowed to exclude certain entities and investment companies from the scope of these regulations, |
| ● | Criteria for determining whether certain entities must be identified as members of the financial conglomerate for the purpose of identifying, administering, monitoring and revealing conflicts of interest, and |
| ● | Limits of exposure and concentration of risk applicable to the financial conglomerate. |
70
The Law of Financial Conglomerates also provides the Superintendency of Finance with the authority to:
| ● | Instruct holding companies with respect to risk management, internal control, disclosure of information, conflicts of interest and corporate governance of the financial conglomerate, |
| ● | Require changes in the organizational structure of the financial conglomerate when the existing structure does not allow adequate disclosure of information, a comprehensive and consolidated supervision and the identification of its beneficial owner, |
| ● | Authorize the holding company to effect direct or indirect equity investments in financial entities, insurance companies and securities intermediaries, |
| ● | Request information and conduct on-site visits, and |
| ● | Cancel operating licenses of members of the financial conglomerate in cases where the controlling entity is domiciled in non-cooperative jurisdictions. |
Financial conglomerates that have holding companies incorporated abroad may be exempted from the scope of these regulations if their holding company provides satisfactory evidence that the members of its financial conglomerate are subject to a regime of prudential regulation and comprehensive and consolidated supervision similar to the one established in Colombia. Otherwise, the Superintendency of Finance will have the power to request information that it deems appropriate to exercise a comprehensive and consolidated supervision of the member(s) of the financial conglomerate established in Colombia. If the Superintendency of Finance considers that the information received does not allow the proper exercise of its supervisory functions, it may revoke the operating license of the supervised entity(ies).
Pursuant to Law 1870, the Ministry of Finance enacted the following regulatory decrees:
| ● | Decree 246, issued on February 2, 2018, set the criteria under which the Superintendency of Finance may exclude from the scope of its supervision, entities or investment vehicles of a financial conglomerate. The exclusion criteria are the following: (i) when the size of the entity is not significant in relation to the financial conglomerate to which it belongs, or (ii) when the level of interconnection and risk exposure of the entity has no significant impact on the financial conglomerate. |
| ● | Decree 774, issued on May 8, 2018, established Capital adequacy levels applicable to financial conglomerates. The technical assets of the financial conglomerate, as defined in the same decree, at no time may be less than the adequate equity of the financial conglomerate, also defined therein. The financial holding company is responsible for compliance, always, with the appropriate level of capital for the financial conglomerate, notwithstanding the obligations laid down in the regulation applicable to entities that are part of the financial conglomerate. If it becomes apparent that the technical assets of the financial conglomerate are less, the financial holding company must determine and inform the Financial Superintendence of Colombia the way in which it will be corrected. |
| ● | Decree 774 of 2018, established the following criteria for the calculation of the capital adequacy applicable to financial conglomerates: (i) technical capital should not be lower than adequate capital, (ii) the financial holding is responsible for the compliance of the capital adequacy applicable to the financial conglomerate, and (iii) in order to determine the adequate and the technical capital applicable to a financial conglomerate, financial holdings shall select a calculation basis using: (a) consolidated information, b) separate information, or (c) a combination of consolidated and separate information. For these purposes, Grupo Aval selected a combination of consolidated and separate information. |
Technical capital for the Aval Financial Conglomerate complied with the adequate capital required by regulation for each of the reported interim quarterly filings and at December 31, 2021. See “Item 3. Key Information—D. Risk factors—Risks relating to our businesses and industry—Risks relating to our banking business” and “Item 11. Quantitative and Qualitative Disclosures About Market Risk”.
| ● | Decree 1486, issued on August 6, 2018, which established obligations for members of a financial conglomerate, with respect to: (i) identifying the entities and individuals that need to be considered as related parties to the financial conglomerate (vinculados), (ii) policies regarding identification, disclosure, management and control of conflicts of interests, and (iii) policies and limits of exposure and concentration of risks for operations between entities of the conglomerate and between these and their related entities or individuals (vinculados). |
71
Regulatory framework for Colombian financial institutions
Basic Framework: Decree 663 of 1993
The basic regulatory framework for the operations of the Colombian financial sector is set forth in the Financial System Organic Statute or “EOSF”, as amended by Laws 510 of 1999, 546 of 1999, 795 of 2003, 964 of 2005, 1328 of 2009, 1555 of 2012 and 1735 of 2014. Decree 2555 of 2010 as well as in External Resolution 8 of 2000 (exchange control regulation statute) and External Resolution 4 of 2006 issued by the Board of Directors of the Colombian Central Bank.
The EOSF defines the structure of the Colombian financial system and establishes various business entities, including (1) credit institutions (which are further categorized into banks, merchant banks, financing companies and finance cooperatives), (2) financial services entities, (3) capitalization corporations, (4) insurance companies and (5) insurance intermediaries.
The EOSF also provides that no financial, banking or credit institution may operate in Colombia without the prior approval of the Superintendency of Finance. Subject to prior approval of the Superintendency of Finance, foreign banks may operate in Colombia through their subsidiaries established and incorporated in Colombia. Under Law 1328 of 2009, foreign banks, as of July 15, 2013, are permitted to operate through their “branches” and are not obligated to incorporate a Colombian subsidiary. Operations through these branches will be subject to prior approval by the Superintendency of Finance. Among other legal requirements, branches have to meet the same minimum capital requirements as independent entities do.
The main role of banks, merchant banks and financing companies is to receive deposits. Banks place funds back into circulation by means of loans or any active credit operation; merchant banks place funds into circulation by means of active credit operations or investments, with the purpose of promoting the creation or expansion of enterprises; and financing companies place funds back into circulation by means of active credit operations, with the purpose of fostering the sale of consumer goods and services, including leasing operations.
Each credit institution must be authorized by the Superintendency of Finance before it may develop and provide financial services. Furthermore, the activities of credit institutions are subject to limitations and restrictions, including limitations and restrictions relating to the extension of credit, risk concentration, investments, conditional operations, foreign currency loans and negotiations, and the administration of third-party funds. One of the main restrictions on financial activities is that banks may not acquire or hold products, merchandise, equity shares of corporations operating in non-financial activities, income bonds, or other similar securities, except: (i) when the bank has received those goods or securities as collateral for loans it has made or (ii) with respect to shares, when they are issued by companies where banks are permitted to hold investments (mainly financial affiliates). Banks are also subject to other limitations, including limitations on lending activities.
Modifications to Framework
Laws 510 of 1999, 546 of 1999, 795 of 2003 and 1328 of 2009 have substantially modified the control, regulation and surveillance powers of the Superintendency of Finance. In addition, Law 510 of 1999 and Law 1328 of 2009 streamlined the procedures and powers for FOGAFIN. The main purpose of Law 510 of 1999 was to increase the solvency and stability of Colombia’s financial institutions by establishing rules regarding their incorporation, as well as the permitted investments of credit institutions, insurance companies and investment companies. Law 546 of 1999 was enacted in order to regulate the system of long-term housing loans.
Law 795 of 2003 was enacted with the purpose of broadening the scope of activities to be performed by financial institutions and to update Colombian regulations with the latest principles of the Basel Committee at that time. Law 795 of 2003 also increased the minimum capital requirements needed to incorporate a financial institution and authorized the Superintendency of Finance to take precautionary measures with respect to financial institutions whose capital falls below certain thresholds. For example, in order to avoid a temporary receivership or intervention by the Superintendency of Finance, troubled financial institutions must submit a restructuring program to the Superintendency of Finance.
Law 1328 of 2009, as amended by Law 1748 of 2014, provided a new set of rights and responsibilities for customers of the financial system and a set of obligations for financial institutions, in order to minimize disputes. This law also broadened the scope of permitted business activities by regulated entities: following its adoption, banks were allowed to operate leasing businesses under certain circumstances and to extend loans to third parties so that borrowers may acquire control of other companies.
In order to implement and enforce the provisions related to Colombia’s financial system, the Superintendency of Finance has issued periodic circulars and resolutions. The External Circular 029 of 2014, known as the Basic Legal Circular, as amended, consolidates all of the rules and regulations applicable to financial institutions, including rules and regulations relating to the management, operations, investments, lending activities and money-laundering prevention activities of financial institutions. The External Circular 100 of 1995, known as the Basic Accounting and Financial Circular, consolidates all of the regulations applicable to the accounting and financial rules of financial institutions.
72
Furthermore, the Basic Accounting and Financial Circular regulates the assessment of credit institutions’ investments, risk management, financial statements, information disclosure and inter-banking credits.
Violations of Laws 510 of 1999, 546 of 1999, 795 of 2003 or 1328 of 2009, as well as of specific provisions of Decree 663 of 1993 and their relevant regulations, are subject to administrative sanctions and, in some cases, criminal sanctions.
Key interest rates
Colombian commercial banks, merchant banks (corporaciones financieras) and financing companies are required to report data to the Colombian Central Bank on a weekly basis regarding the total volume (in pesos) of certificates of deposit issued during the prior week and the average interest rates paid for certificates of deposit with maturities of 90 days. Based on such reports, the Colombian Central Bank calculates the DTF rate, which is published at the beginning of the following week for use in calculating interest rates payable by financial institutions. The DTF rate is the weighted average interest rate paid by commercial banks, merchant banks and financing companies for certificates of deposit with maturities of 90 days.
The Colombian Central Bank also calculates the interbank rate (Interés Bancario de Referencia), or “IBR”, which acts as a reference of overnight, one-month and three-month interbank loans, based on quotations submitted each business day by eight participating banks to the Colombian Central Bank. Using the median of the quotations submitted, the Colombian Central Bank calculates the overnight IBR each business day. The one-month and three-month IBRs are also calculated using the median of the quotations submitted each business day, based on the prices of interest rate swaps for each of these periods.
Article 884 of the Colombian Commercial Code provides for a limit on the amount of interest that may be charged in commercial transactions. The limit is 1.5 times the current banking interest rate (Interés Bancario Corriente), calculated as the average of the interest ordinarily charged by banks within a set period of time. The current banking interest rate is certified by the Superintendency of Finance.
On March 29, 2023, a major amendment to this rule was enacted by means of Decree 455 of 2023, which amended Decree 2555 of 2010 with regards to the certification of Interés Bancario Corriente and now includes five different certifications regarding new credit categories such as Rural Popular Productive Credit, Urban Popular Productive Credit, Rural Productive Credit, Urban Productive Credit, Productive Credit and Productive Credit of larger amounts. The certification of these banking interest rates may include any other source of credits (not only regulated banking entities) including lenders, credit originators and natural persons, among others. Given that this is a new regulation, it is uncertain the way in which its implementation will be undertaken. The Decree states that current banking interest rate will be in force for three months, until the methodology and sources for the new credit certifications are clearer.
Capital Adequacy Requirements
Pursuant to Decrees 1477 of 2018 and 1421 of 2019 Basel III principles were introduced to estimate adequate capital in credit institutions as follows:
| ● | Total solvency ratio is defined as the value of the technical capital (CET1, AT1 and T2) calculated under the terms of the Decree 1477 of 2018 and the Decree 1421 of 2019, divided by risk-weighted assets by level of credit, market and operational risk, at a minimum of 9%. Pursuant to Decree 2555 of 2010 (as amended), the Superintendency of Finance must grant prior approval of the eligibility of a debt, equity or hybrid instrument in order to be classified as Additional Tier I (AT1) or Tier II; |
| ● | A minimum Core Equity Tier 1 (CET1) of 4.5%; |
| ● | A minimum CET1 plus AT1 of 6%; |
| ● | A capital conservation buffer of 1.5% consisting of CET1; |
| ● | A systemic risk buffer of 1.0% for systemically important financial institutions (SIFI) consisting of CET1; |
| ● | In addition, these Decrees established a minimum leverage ratio of 3%. |
73
The following chart presents the statutory transition period as set forth in the Decrees 1477 of 2018 and 1421 of 2019:
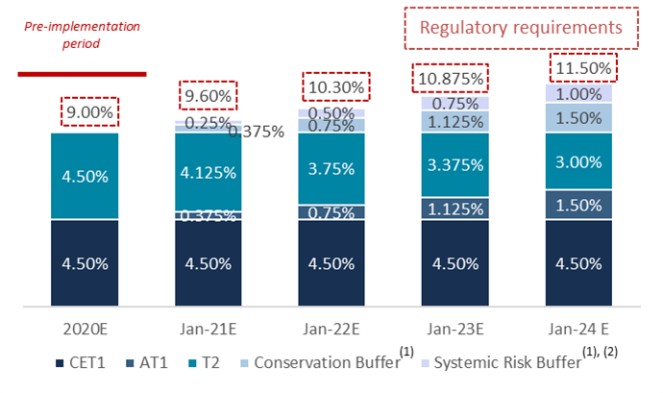
| (1) | Requires highest quality of capital. |
| (2) | Only applies to SIFIs as defined by the Superintendency of Finance. The Circular Letters 76 of 2020 and 72 of 2021 issued by the Superintendency of Finance, published the list of SIFIs for the year 2021 and 2022, which only included Banco of Bogotá among our Colombian banking subsidiaries, in accordance with the methodology defined for the identification of entities with systemic importance (External Circular 030 of 2019 issued by the same Superintendency). |
The following tables set forth the consolidated capital adequacy information, in compliance with the applicable Superintendency of Finance’s guidelines, for each of our Colombian banking subsidiaries, Porvenir and Corficolombiana at December 31, 2022 and 2021. Each of our subsidiaries subject to capital adequacy requirements presents technical capital levels above the minimum regulatory capital adequacy requirements established in their respective jurisdictions.
74
Banco de Bogotá
At December 31, |
| ||||
| 2022 |
| 2021 |
| |
(in Ps billions) |
| ||||
Subscribed and paid-in capital |
| 4 |
| 3 | |
Reserves and retained earnings |
| 13,301 |
| 18,371 | |
Other comprehensive income | 42 | 5,579 | |||
Net income for the period | 2,805 | 4,357 | |||
Non-controlling interests |
| — |
| — | |
Deductions: |
| ||||
Unconsolidated financial sector investments |
| (3,262) |
| (2,638) | |
Goodwill and other intangibles |
| (1,416) |
| (7,652) | |
Deferred tax assets |
| (1,036) |
| (1,222) | |
Other |
| (0) |
| — | |
CET1 |
| 10,438 |
| 16,798 | |
Hybrid instruments recognized as additional primary capital | — | 2,070 | |||
Other | — | — | |||
AT1 |
| — |
| 2,070 | |
Tier I | 10,438 | 18,868 | |||
Subordinated bonds |
| 3,136 |
| 3,439 | |
Plus/minus others |
| — |
| — | |
Tier II capital |
| 3,136 |
| 3,439 | |
Other deductions from technical capital |
| — |
| (28) | |
Technical capital |
| 13,574 |
| 22,279 | |
Risk-weighted assets |
| 88,898 |
| 142,408 | |
Value at risk |
| 760 |
| 1,014 | |
Regulatory value at risk(1) |
| 8,440 |
| 11,266 | |
Operational risk | 577 | 977 | |||
Regulatory operational risk(1) | 6,412 |
| 10,857 | ||
Risk-weighted assets including regulatory value at risk and operational risk |
| 103,751 | 164,531 | ||
CET1 solvency ratio |
| 10.06% | 10.21% | ||
AT1 capital solvency ratio | 0.00% | 1.26% | |||
Tier 1 capital solvency ratio | 10.06% | 11.47% | |||
Tier II solvency ratio |
| 3.02% | 2.09% | ||
Total solvency ratio(2) |
| 13.08% | 13.54% | ||
| (1) | Regulatory value at risk consists of value at risk multiplied by (100/9) as required by the Superintendency of Finance. Regulatory operational risk consists of operational risk multiplied by (100/9) as required by the Superintendency of Finance. |
| (2) | Solvency ratio is calculated as technical capital to risk-weighted assets, including regulatory value at risk and regulatory operational risk. |
75
Banco de Occidente
At December 31, |
| ||||
| 2022 |
| 2021 |
| |
(in Ps billions) |
| ||||
Subscribed and paid-in capital |
| 5 |
| 5 | |
Reserves and retained earnings |
| 4,791 |
| 4,359 | |
Other comprehensive income | (65) | 210 | |||
Net income for the period | 452 | 580 | |||
Non-controlling interests |
| — |
| — | |
Deductions: |
|
| |||
Unconsolidated financial sector investments |
| (227) |
| (671) | |
Goodwill and other intangibles |
| (533) |
| (448) | |
Deferred tax assets |
| — |
| (54) | |
Other |
| (4) |
| (5) | |
CET1 |
| 4,419 |
| 3,976 | |
Hybrid instruments recognized as additional primary capital | — | — | |||
Other | — | — | |||
AT1 |
| — |
| — | |
Tier I | 4,419 | 3,976 | |||
Subordinated bonds |
| 835 |
| 465 | |
Plus/minus others |
| — |
| — | |
Tier II capital |
| 835 |
| 465 | |
Other deductions from technical capital |
| — |
| — | |
Technical capital |
| 5,254 |
| 4,441 | |
Risk-weighted assets |
| 37,592 |
| 30,662 | |
Value at risk |
| 273 |
| 328 | |
Regulatory value at risk(1) |
| 3,028 |
| 3,640 | |
Operational risk | 227 | 150 | |||
Regulatory operational risk(1) | 2,525 |
| 1,671 | ||
Risk-weighted assets including regulatory value at risk and operational risk |
| 43,145 |
| 35,973 | |
CET1 solvency ratio |
| 10.24% | 11.05% | ||
AT1 capital solvency ratio | 0.00% | 0.00% | |||
Tier 1 capital solvency ratio |
| 10.24% | 11.05% | ||
Tier II solvency ratio |
| 1.94% | 1.29% | ||
Total solvency ratio(2) | 12.18% | 12.35% | |||
| (1) | Regulatory value at risk consists of value at risk multiplied by (100/9) as required by the Superintendency of Finance. Regulatory operational risk consists of operational risk multiplied by (100/9) as required by the Superintendency of Finance. |
| (2) | Solvency ratio is calculated as technical capital to risk-weighted assets, including regulatory value at risk and regulatory operational risk. |
76
Banco Popular
At December 31, |
| ||||
| 2022 |
| 2021 |
| |
(in Ps billions) |
| ||||
Subscribed and paid-in capital |
| 77 |
| 77 | |
Reserves and retained earnings |
| 2,876 |
| 2,694 | |
Other comprehensive income | 198 | 270 | |||
Net income for the period | 80 | 313 | |||
Non-controlling interests |
| 30 |
| 28 | |
Deductions: |
|
| |||
Unconsolidated financial sector investments |
| (355) |
| (286) | |
Goodwill and other intangibles |
| (294) |
| (243) | |
Deferred tax assets |
| — |
| — | |
Other |
| (158) |
| (174) | |
CET1 |
| 2,455 |
| 2,679 | |
Hybrid instruments recognized as additional primary capital | — | — | |||
Other | — | — | |||
AT1 |
| — |
| — | |
Tier I | 2,455 | 2,679 | |||
Subordinated bonds |
| 177 |
| 197 | |
Plus/minus others |
| — |
| — | |
Tier II capital |
| 177 |
| 197 | |
Other deductions from technical capital |
| — |
| — | |
Technical capital |
| 2,632 |
| 2,876 | |
Risk-weighted assets |
| 18,473 |
| 17,137 | |
Value at risk |
| 148 |
| 173 | |
Regulatory value at risk(1) |
| 1,641 |
| 1,925 | |
Operational risk | 116 | 72 | |||
Regulatory operational risk(1) | 1,288 |
| 801 | ||
Risk-weighted assets including regulatory value at risk and operational risk |
| 21,402 |
| 19,863 | |
CET1 solvency ratio |
| 11.47% | 13.49% | ||
AT1 capital solvency ratio | 0.00% | 0.00% | |||
Tier 1 capital solvency ratio |
| 11.47% | 13.49% | ||
Tier II solvency ratio |
| 0.83% | 0.99% | ||
Total solvency ratio(2) | 12.30% | 14.48% | |||
| (1) | Regulatory value at risk consists of value at risk multiplied by (100/9) as required by the Superintendency of Finance. Regulatory operational risk consists of operational risk multiplied by (100/9) as required by the Superintendency of Finance. |
| (2) | Solvency ratio is calculated as technical capital to risk-weighted assets, including regulatory value at risk and regulatory operational risk. |
77
Banco AV Villas
At December 31, |
| ||||
| 2022 |
| 2021 |
| |
(in Ps billions) |
| ||||
Subscribed and paid-in capital |
| 22 |
| 22 | |
Reserves and retained earnings |
| 1,524 |
| 1,421 | |
Other comprehensive income | (30) | 70 | |||
Net income for the period | 112 | 162 | |||
Non-controlling interests |
| — |
| — | |
Deductions: |
|
| |||
Unconsolidated financial sector investments |
| — |
| — | |
Goodwill and other intangibles |
| (124) |
| (111) | |
Deferred tax assets |
| — |
| (38) | |
Other |
| (153) |
| (198) | |
CET1 |
| 1,350 |
| 1,328 | |
Hybrid instruments recognized as additional primary capital | — | — | |||
Other | 0 | 0 | |||
AT1 |
| 0 |
| 0 | |
Tier I | 1,351 | 1,328 | |||
Subordinated bonds |
| — |
| — | |
Plus/minus others |
| 25 |
| 68 | |
Tier II capital |
| 25 |
| 68 | |
Other deductions from technical capital |
| — |
| — | |
Technical capital |
| 1,376 |
| 1,396 | |
Risk-weighted assets |
| 10,420 |
| 8,781 | |
Value at risk |
| 97 |
| 127 | |
Regulatory value at risk(1) |
| 1,075 |
| 1,409 | |
Operational risk | 82 | 55 | |||
Regulatory operational risk(1) | 909 |
| 614 | ||
Risk-weighted assets including regulatory value at risk and operational risk |
| 12,403 |
| 10,805 | |
CET1 solvency ratio |
| 10.89% | 12.29% | ||
AT1 capital solvency ratio | 0.00% | 0.00% | |||
Tier 1 capital solvency ratio |
| 10.89% | 12.29% | ||
Tier II solvency ratio |
| 0.20% | 0.63% | ||
Total solvency ratio(2) | 11.09% | 12.92% | |||
| (1) | Regulatory value at risk consists of value at risk multiplied by (100/9) as required by the Superintendency of Finance. Regulatory operational risk consists of operational risk multiplied by (100/9) as required by the Superintendency of Finance. |
| (2) | Solvency ratio is calculated as technical capital to risk-weighted assets, including regulatory value at risk and regulatory operational risk. |
78
Porvenir
In Colombia, pension and severance fund administrators are subject to specific regulation regarding capital adequacy. On March 2, 2018, Decree 415 of 2018, which amended Decree 2555 of 2010, introduced a new solvency measure for pension and severance fund administrators of minimum 9% of the value of the technical capital requirements (patrimonio técnico) divided by:
| ● | Summation of assets weighted by risk level; |
| ● | Operational risk exposure value multiplied by 100/9; and |
| ● | Market risk exposure value multiplied by 100/9; |
On August 6, 2019, the Decree 1420, established additional rules for pension and severance fund administrators related to the percentage of exposure applicable to operational risks. On February 3, 2022 the Decree 175 modified technical capital requirements for pension and severance fund administrators, migrating definitions on technical capital and risk-weighted assets closer to the Basel III framework. The Superintendency of Finance published instructions corresponding to the application of this Decree in December 2022. Pension and severance fund managers thus have a twelve-month transition period starting on January 2023 to comply with this regulation starting on February 2024.
At December 31, | ||||
| 2022 |
| 2021 | |
(in Ps billions) | ||||
Subscribed and paid-in capital |
| 109 |
| 109 |
Reserves and retained earnings |
| 2,312 |
| 2,033 |
Deductions: | ||||
Others |
| (51) |
| (51) |
Primary capital |
| 2,371 |
| 2,091 |
Unrealized gains/losses on securities available for sale(1) |
| (32) |
| (2) |
Secondary capital (Tier II) |
| (32) |
| (2) |
Deductions: | ||||
Value of the stabilization reserve | (1,782) | (1,613) | ||
Technical capital |
| 557 |
| 476 |
Risk-weighted assets |
| 907 |
| 1,097 |
Value at risk |
| 14 |
| 24 |
Regulatory value at risk(1) |
| 153 |
| 263 |
Operational risk | 128 | 136 | ||
Regulatory operational risk(2) | 1,420 | 1,510 | ||
Risk-weighted assets including regulatory value at risk and operational risk |
| 2,481 |
| 2,870 |
Solvency ratio(3) |
| 22.47% | 16.60% | |
| (1) | Unrealized gains/losses on securities available for sale do not flow through the statement of income until such securities are disposed of and the gain or loss is realized. |
| (2) | Regulatory value at risk consists of value at risk multiplied by (100/9) as required by the Superintendency of Finance. Regulatory operational risk consists of operational risk multiplied by specific weightings as defined the Superintendency of Finance. |
| (3) | Solvency ratio is calculated as technical capital to risk-weighted assets, including regulatory value at risk and regulatory operational risk. |
79
Corficolombiana
At December 31, |
| ||||
| 2022 |
| 2021 |
| |
(in Ps billions) |
| ||||
Subscribed and paid-in capital |
| 3 |
| 3 | |
Reserves and retained earnings |
| 9,588 |
| 8,406 | |
Other comprehensive income |
| 48 |
| 644 | |
Net income for the period | 1,714 | 1,296 | |||
Non-controlling interests | 1 | 1 | |||
Deductions: |
| ||||
Unconsolidated financial sector investments |
| — |
| — | |
Goodwill and other intangibles |
| (67) |
| (39) | |
Deferred tax assets |
| (5) |
| (2) | |
Other |
| (6) |
| (11) | |
CET1 |
| 11,276 |
| 10,298 | |
Hybrid instruments recognized as additional primary capital | — | — | |||
Other | 0 | 0 | |||
AT1 | 0 |
| 0 | ||
Tier I | 11,276 | 10,298 | |||
Subordinated bonds |
| — |
| — | |
Plus/minus others |
| — |
| — | |
Tier II capital |
| — |
| — | |
Other deductions from technical capital |
| (44) |
| (49) | |
Technical capital |
| 11,232 |
| 10,249 | |
Risk-weighted assets |
| 18,239 |
| 15,661 | |
Value at risk |
| 191 |
| 212 | |
Regulatory value at risk(1) |
| 2,117 |
| 2,352 | |
Operational risk | 303 | 190 | |||
Regulatory operational risk(1) | 3,372 |
| 2,112 | ||
Risk-weighted assets including regulatory value at risk and operational risk |
| 23,728 |
| 20,125 | |
CET1 solvency ratio |
| 47.52% | 51.17% | ||
AT1 capital solvency ratio | 0.00% | 0.00% | |||
Tier 1 capital solvency ratio | 47.52% | 51.17% | |||
Tier II solvency ratio |
| 0.00% | 0.00% | ||
Total solvency ratio(2) |
| 47.34% | 50.93% | ||
| (1) | Regulatory value at risk consists of value at risk multiplied by (100/9) as required by the Superintendency of Finance. Regulatory operational risk consists of operational risk multiplied by (100/9) as required by the Superintendency of Finance. |
| (2) | Solvency ratio is calculated as technical capital to risk-weighted assets, including regulatory value at risk and regulatory operational risk. |
80
Mandatory Investments
Colombian banking institutions are required to invest in agricultural development bonds (Títulos de Desarrollo Agropecuario, or “TDAs”) issued by Finagro, a Government entity, according to External Resolution 3 of 2000 of the Colombian Central Bank, as amended from time to time.
A major amendment over TDA´s was enacted by means of Law 2186 of 2022, allowing financial entities to substitute up to the 50% of the investments over TDA´s in credits to small and medium agropecuary producers, as regulated by the National Comission of Agropecuary Loans. Such limit of 50% shall be accomplished during the next two years of this Law. (January 2024). Nonetheless some sections of Law 2186 of 2022 are proposed to be eliminated by the draft of the National Development Plan.
The Colombian Central Bank requires that each bank maintains a total investment in these bonds equal to 5.61% of its checking and savings deposits minus legal reserves, plus 4.25% of its time deposits minus legal reserves with a maturity of up to 18 months. Finagro may issue two different types of agricultural development bonds:
| ● | Class A with an interest rate of four percentage points below the DTF effective annual rate (DTF-4%) or with an interest rate of three-point sixty-seven percentage points below the IBR 3-month nominal rate (IBR-3.67%). |
| ● | Class B with an interest rate of two percentage points below the DTF effective annual rate (DTF-2%) or with an interest rate of one point seventy one percentage points below the IBR 3-month nominal rate (IBR-1.71%). |
If the DTF interest rate falls to 4% or less, the profitability of the Class A TDAs will be 0%, and if the DTF rate falls to 2% or less, the profitability of the Class B TDAs will be 0%. The same applies to IBR rate. Banks are required to invest 50% of the total mandatory investment in Class A TDAs and 50% in Class B TDAs.
Under Government discretion, authorities may extend the scope of current regulations or require additional disbursements on current or new types of mandatory investments.
Pursuant to Decree 562 issued on April 15, 2020, Colombian credit institutions are required to invest in solidarity notes, these notes are public debt notes issued by the Colombian Government with a maturity date of one year (extendable for additional terms) to address COVID-19 effects in Colombia. Each credit institution has to invest:
| ● | 3% of its checking and savings deposits, minus the mandatory reserves, based on its reported monthly financial statements, and |
| ● | 1% of its time deposits subject to mandatory reserves, minus the mandatory reserves, based on its reported monthly financial statements. |
The Colombian Central Bank lowered reserve requirements as a measure to mitigate the negative impact of the Covid-19 pandemic on credit institutions on April 14, 2020 effective on April 22, 2020. These changes, which remain current, were made to support the acquisition of the solidarity notes with the excess liquidity generated through lower reserve requirements.
Minimum Incorporation Capital Requirements
The Decree 2555 of 2010 establishes minimum incorporation capital requirements for different financial institutions. When a financial institution fails to comply with the minimum required capital after a cure period granted by law, the Superintendency of Finance may intervene, causing the financial institution to be liquidated, merged with another institution or its corporate form may be converted into another category of financial institution, notwithstanding the fact that the institution may be subject to fines imposed by the Superintendency of Finance.
The minimum incorporation capital requirement for Colombian banks on a separate basis for 2022 was Ps 107,849 million. As of the date of this annual report, all our banks have consistently satisfied this incorporation capital requirement.
Capital Investment Limit
All investments in subsidiaries and other authorized capital investments, other than those carried out in order to fulfill legal provisions, may not exceed 100% of the total aggregate of the capital, equity reserves and the equity reappraisal account of the respective bank, financial corporation or financing company, excluding unadjusted fixed assets and including deductions for accumulated losses.
81
Foreign Currency Position Requirements
According to External Resolution No. 1 of 2018 and External Regulatory Circular DODM-398 issued by the Board of Directors of the Colombian Central Bank on March 22, 2019, which modified the foreign currency position requirements of Colombian banks, the foreign currency position (defined as the difference between rights and obligations denominated in foreign currencies) based on a three-business-day average, cannot exceed 20% of the bank’s technical capital. If the foreign currency position is negative, it cannot exceed 5% of the bank’s technical capital.
Currency exchange intermediaries such as Banco de Bogotá, with controlling interest of its overseas investments, are required to exclude those investments and any declared and approved hedging instruments (derivatives or debt) from their foreign currency positions starting on March 26, 2019. At December 31, 2022, Banco de Bogotá, Banco de Occidente, Banco Popular and Banco AV Villas had unconsolidated net foreign currency positions of U.S.$0.2 million, U.S.$(17.1) million, U.S.$9.9 million and U.S.$0.09 million, respectively, which fell within these regulatory guidelines.
Lending Limits
Decree 2555 of 2010 provides that a financial institution may not lend, individually or in the aggregate, to a single borrower an amount in excess of 10% of their technical capital (Patrimonio Técnico) if the only security for such operation is the borrower’s equity. Nevertheless, commercial banks can lend to a single person an amount equivalent to 25% of their technical capital (Patrimonio Técnico), as long as such loan is secured by eligible collateral and sufficient to secure a risk exceeding 5% of such equity.
Notwithstanding the general rule set above regarding the lending limit of 10%, Decree 816 of 2014 issued to promote the financing of Fourth Generation Concessions toll roads established that commercial banks are allowed to lend to a single borrower, a sum up to 25% of technical capital (Patrimonio Técnico). Fourth generation concessions fall under a governmental program issued under the administration of Former President Juan Manuel Santos, aiming to execute the construction of road infrastructure projects in association with private entities.
Pursuant Decree 2555 of 2010, a credit institution may not make a loan to any shareholder that holds directly more than 10% of its share capital. In no event may a loan to a shareholder that holds, directly or indirectly, 20% or more of a bank’s share capital exceed 20% of a bank’s capital requirements. In addition, this Decree establishes no loan to a single financial institution may exceed 30% of a bank’s technical capital (Patrimonio Técnico), the calculation of which includes loans, leasing operations and equity and debt investments, with the exception of loans funded by Colombian development banks for which no limit exists.
If a financial institution exceeds these limits, the Superintendency of Finance may impose a fine equal to up to twice the amount by which any such loan exceeded the limit.
No concentration limits apply to Grupo Aval on a consolidated basis, however, since February 6, 2020, pursuant to the Law of Financial Conglomerates, and in particular, Decree 1486 of 2018, on February, 2020, the Board of Directors of Grupo Aval approved the policies and limits of exposure and concentration of risks for operations between entities belonging to its financial conglomerate and between these and their related entities or individuals (vinculados). These policies include the identification of material risks, operations between entities of the financial conglomerate and between them and their related parties, responsibilities and obligations of administrators and governing bodies, certain quantitative limits and an early warning scheme, as well as disclosure mechanisms.
Furthermore, on August 4, 2022 Ministry of Finance enacted Decree 1533 of 2022, amending the regulation for legal lending limits and imposing new criteria for the risk exposure that a financial institution shall consider accounting individual and group exposure to credit risk, admissibility for collaterals and specially, what is named related counterparties group. This decree (so-called “Large Exposures”) takes account for the first time how related parties may represent the same risk for one entity or for a financial conglomerate. This regulation enter into force on August 2024 but financial entities have up to thirty-six (36) months (August 4, 2025) to comply with its provisions, which will result in limitations for loans and a potential reduction for infrastructure loans, depending on how the SPV in charge of the EPC is structured.
In 2022, Grupo Aval’s management carried out the necessary controls and activities to comply with the provisions of these policies.
The Colombian Central Bank also has the authority to establish maximum limits on the interest rates that commercial banks and other financial institutions may charge on loans.
At December 31, 2022, pursuant to Decree 2555 of 2010, our banks were subject to the following lending limits for unsecured and secured loans: Banco de Bogotá’s lending limit per borrower on a separate basis was Ps 1.36 billion for unsecured loans and Ps 3.39 billion for secured loans, Banco de Occidente’s lending limit per borrower on a separate basis was Ps 0.53 billion for unsecured loans and Ps 1.31 billion for secured loans, Banco Popular’s lending limit per borrower on a separate basis was Ps 0.26 billion for unsecured loans and Ps 0.66
82
billion for secured loans, and Banco AV Villas’ lending limit per borrower on a separate basis was 0.14 billion for unsecured loans and Ps 0.34 billion for secured loans.
Reserve Requirements
Credit institutions are required by the Board of Directors of the Colombian Central Bank to satisfy reserve requirements with respect to deposits and other cash demands. These reserves are held by the Colombian Central Bank in the form of cash deposits. According to External Resolution 5 of 2008, as amended by External Resolution 9 of 2016, the reserve requirements for Colombian banks are measured bi-weekly and the amounts depend on the class of deposits.
Reserve requirements for credit institutions presented a range between 0% and 8.0%. Credit institutions have to maintain reserves of 8.0% for checking accounts and savings deposits, reserves of 3.5% for time deposits with a maturity of less than 540 days, and no reserves for time deposits with a maturity equal or greater than 540 days.
Credit institutions must maintain these reserves in their accounts at the Colombian Central Bank or in cash.
Foreign Currency Loans
Colombian residents may only obtain foreign currency loans from foreign entities that obtain a code from the Colombian Central Bank. Such code has to be requested from the foreign exchange intermediary by the resident that wishes to obtain a loan from foreign entities or foreign individuals. Foreign currency loans must be either channeled through foreign exchange intermediaries (such as Colombian financial institutions) or deposited in offshore compensation accounts (i.e., specially designated accounts at foreign banks held by Colombian residents and registered before the Colombian Central Bank).
Under regulations issued by the Colombian Central Bank, every Colombian resident and institution borrowing funds in foreign currency is generally required to post with the Colombian Central Bank non-interest-bearing deposits for a specified term; however, the percentage of the required deposit is currently zero. No such deposits are required for foreign currency loans aimed at financing Colombian investments abroad or for short-term export loans (provided the loan is disbursed against the funds of Banco de Comercio Exterior—Bancoldex).
In addition, pursuant to Law 9 of 1991, the Board of Directors of the Colombian Central Bank is entitled to impose conditions and limitations on the incurrence of foreign currency indebtedness in order to avoid pressure in the foreign exchange market.
Restrictions on Foreign Investment in Colombia
Colombia’s foreign investment statute regulates the manner in which non-residents are permitted to invest in Colombia and participate in the Colombian securities market. Among other requirements, Colombian law requires foreign investors to register certain foreign exchange transactions with the Colombian Central Bank and obtain authorization for certain types of investments. Certain foreign exchange transactions, including those between residents and non-residents, must be made through authorized foreign exchange intermediaries.
Non-residents are permitted to hold portfolio investments in Colombia, through a registered stock brokerage firm, a trust company or an investment firm. Investors would only be allowed to transfer dividends abroad after the foreign investment registration procedure with the Colombian Central Bank has been completed. The failure of a non-resident investor to report or register foreign exchange transactions with the Colombian Central Bank relating to investments in Colombia on a timely basis may prevent the investor from remitting dividends, or an investigation that may result in a fine may be commenced.
Loss Allowance
In the consolidated financial statements of Colombian credit institutions, the following rules about loan loss allowances apply:
Regarding the entire loan portfolio, in accordance with IFRS 9, financial institutions must evaluate at the end of each accounting period if there is or has been a significant increase in the credit risk (SICR) of a loan measured in accordance with the amortized cost methodology. Impairment indicators include significant economic difficulties faced by the borrower, payment default and the probability that the borrower will seek protection from creditors. If impairment is determined, a loan loss provision charged to income is calculated as follows:
| ● | For loans deemed individually significant and impaired, an individual analysis is carried out in accordance with IFRS 9, which takes into consideration expected cash flows, interest rates, the amortization schedule, collateral and information from credit bureaus. A loan is considered impaired when, based on historic and current information and events, including forward-looking information such as macroeconomic indicators, it is concluded that a there is a probability that the lender will be unable to collect |
83
| in full the amounts owed as per the loan agreement, including interest and commissions. When a loan has been identified as impaired, the value of the loss is measured as: (i) the difference between the book value of the loan and the present value of expected future flows (taking into consideration the condition of the borrower), discounted by the interest rate initially established on the loan, or (ii) the present value of the collateral that guarantees the loan (after deducting the estimated selling costs of the collateral) when it is concluded that the fundamental source of repayment is the sale of the collateral. For the calculation of loss allowances considered individually significant, which are based on their guarantee, estimates of the fair value of such guarantee are established using independent expert appraisers. |
| ● | For those loans which are not individually significant and for loans individually significant but not impaired, a collective assessment is effected with loans grouped together by segments having similar characteristics, using statistical assessment techniques based on the analysis of historical losses to determine an estimate of percentage of expected losses in such assets as of the date of the financial statements, but which have not been identified on an individual basis. |
For the calculation of expected losses of loan portfolios analyzed collectively, statistical models are utilized which take into consideration three fundamental factors: exposure, probability of default and loss given default.
The calculation process includes analyses of specific, historical and qualitative components. The methodologies used include the following elements: a) detailed periodical analysis of the loan portfolio, b) credit classification system by risk levels, c) periodic review of the summary of loss allowances, d) identification of loans to be evaluated individually due to impairment, e) consideration of internal factors, such as our size, organizational structure, loan portfolio structure, loan administration process, analysis of overdue portfolio and experiences of historical losses, f) consideration of risks inherent to different types of loans, and g) consideration of external factors, including local, regional and national, as well as economic factors.
As of January 1, 2018, IASB adopted the expected credit loss (“ECL”) model according to IFRS 9. For more information regarding loss allowance calculations see “Item 11. Quantitative and Qualitative Disclosures About Market Risk”.
Separate financial statements for us and our financial subsidiaries in Colombia are based on Colombian IFRS and pursuant to certain requirements under Colombian regulations. Loss allowances are calculated based on specific rules of the Financial and Accounting Basic Circular (“Circular Básica Contable y Financiera”) issued by the Superintendency of Finance
Requirements for acquiring shares of a financial entity in Colombia.
Pursuant to Article 88 of EOSF, any transaction of national or foreign investors whose purpose is the acquisition of ten percent (10%) or more of the subscribed shares of any kind of entity subject to the supervision of the Superintendency of Finance, whether it is carried out through one or several operations of any nature, simultaneous or successive, or those by means of which said percentage is increased, shall require, under penalty of ineffectiveness, the prior approval of the Superintendency of Finance, who shall examine the suitability and responsibility of the persons interested in acquiring the equity in such entities.
Additionally, the Superintendency of Finance shall ascertain whether the public welfare will be protected during these transactions. Subsequently, the Superintendency of Finance will assure that none of the acquirers of the shares are under any situation that pursuant to the EOSF would not allow such acquirer or acquirers to incorporate a new financial entity, such as AML/TF measures or the breach of Legal Lending Limits, among others. The failure to request the Superintendency of Finance’s prior approval may result in the share transfer transaction being declared ineffective. Therefore, any effects of the transaction would be canceled and nullified as a matter of law, without the need for a judicial declaration.
However, the law provides certain exceptions to the requirement to obtain such prior approval. If an investor has been approved by the Superintendency of Finance for the acquisition of 10% or more of the shares of a financial entity during the last three years, such investor is allowed to notify the compliance with certain capital relations as provided by law, without the need of requesting a new approval. This also applies for financial entities, such as Unions, whose capital is not composed of or represented by shares.
Public Tender Offer Rules
Pursuant to Colombian law, the acquisition of the beneficial ownership of 25.0% or more of the outstanding shares with voting rights of a listed company, or the purchase of 5.0% or more of the outstanding shares with voting rights by a shareholder or group shareholders beneficially owning 25.0% or more of such outstanding shares of a listed company, should be made pursuant to the public tender offer rules. The preferred shares are not shares with voting rights for purposes of this requirement.
Under Article 6.15.2.1.1 of Decree 2555 of 2010, any entity or group of entities ultimately representing the same beneficial owner, directly or through one or more intermediaries, may only become the beneficial owner of more than 25.0% of the outstanding shares with voting
84
rights of a company that is publicly traded in Colombia by making a public tender offer directed to all holders of such shares of that company, following the procedures established by the Superintendency of Finance as per the applicable law.
Moreover, any beneficial owner of more than 25.0% of the outstanding shares with voting rights of a company who wants to acquire additional shares of the company representing more than 5.0% of the company’s outstanding shares with voting rights may only do so by making a public tender offer directed to all holders of such company’s shares, following the procedures established by the Colombian Superintendency of Finance as per the applicable.
These requirements do not need to be met in certain circumstances described in Article 6.15.2.1.2 of Decree 2555 of 2010, including: (i) if the purchase is approved by 100% of the holders of the outstanding shares of the company, (ii) if the purchaser acquires the percentages indicated above through an offer in a privatization process, (iii) if the company reacquires its own shares or (iv) if the company issues voting shares, among others.
In 2022, and as of the date of this annual report, there have been no public tender offers by third parties with respect to the Company’s shares or by Grupo Aval in respect to another company’s shares.
Sales of Publicly Traded Stock
Any transaction involving the sale of publicly traded stock of any Colombian company, including any sale of our preferred shares for the peso equivalent of 66,000 UVRs (U.S.$ 4,496.5) or more must be effected through the Colombian Stock Exchange. At December 31, 2022, one UVR equaled Ps 327.7 and 66,000 UVRs equal Ps 21,628,899.6.
Intervention Powers of the Superintendency of Finance – Bankruptcy Considerations
Pursuant to Colombian banking regulations, the Superintendency of Finance has the power to intervene in the operations of a bank in order to prevent it from, or to control and reduce the effects of, a bank failure.
The Superintendency of Finance may intervene in a bank’s business: (i) prior to the liquidation of the bank, by taking precautionary measures in order to take remedial actions and prevent the bank from being taken over by the Superintendency of Finance, or (ii) to take control of the bank to either administer the bank or order its liquidation, depending on the severity of the situation.
The purpose of taking control is to allow the Superintendency of Finance to decide: (i) whether the entity should be liquidated, (ii) whether it is possible to place it in a position to continue doing business in the ordinary course, or (iii) whether other measures may be adopted to secure better conditions so that depositors, creditors and investors may obtain the full or partial payment of their credits.
If the Superintendency of Finance takes control of a bank, FOGAFIN must appoint a special agent (who must be accepted by the Superintendency of Finance) to administer the affairs of the bank during such process and until the bank is ordered to be liquidated or the entity is reestablished to continue doing business in the ordinary course.
During the period of the Superintendency of Finance’s control (which ends when the liquidation process begins), Colombian banking laws prevent any creditor of the bank from (i) initiating any procedure for the collection of any amount owed by the bank, (ii) enforcing any judicial decision rendered against the bank to secure payment of any of its obligations, (iii) placing a lien or attachment on any of the assets of the bank to secure payment of any of its obligations, or (iv) making any payment, advance or compensation or assuming any obligation on behalf of the bank, with the funds or assets that may belong to it and are held by third parties, except for payments that are made by way of set-off between regulated entities of the Colombian financial and insurance systems.
In the event that the bank is liquidated, the Superintendency of Finance must, among other measures, provide that all term obligations of the bank are due and payable at the date when the order to liquidate becomes effective.
During the liquidation process, bank deposits and other types of saving instruments will be excluded from the liquidation process and, claims of creditors, as a general rule, rank as follows: (i) the first class of credits includes the court expenses incurred in the interest of all creditors, wages and other obligations related with employment contracts and tax obligations owed to tax authorities regarding national and local taxes; (ii) the second class of credits comprises the credits secured by a security interest on movable assets; (iii) the third class of credits includes the credits secured by real estate collateral, such as mortgages; (iv) the fourth class of credits contains some other obligations before the tax authorities against the debtor that are not included in the first class of credits and debts owed to suppliers of raw materials and other inputs; and (v) finally, the fifth class of credits includes all other obligations without any priority or privilege; provided however, which among credits of the fifth class, subordinated debt shall be ranked junior to the external liabilities (pasivos externos), senior only to capital stock. Each category of creditors will collect in the order indicated above, whereby distributions in one category will be subject to completing full distribution in the prior category.
85
Troubled Financial Institutions – Deposit Insurance
Subject to specific limitations, FOGAFIN is authorized to provide equity and/or secured loans to troubled financial institutions and to insure deposits of commercial banks and certain other financial institutions. In 1998 and 1999, to address the adverse effects of the economic crisis, certain regulations were adopted, among others, Law 546 of 1999 (Ley de Vivienda) and Law 550 of 1999 (Ley de Reactivación Económica).
To protect the customers of commercial banks and certain financial institutions, Resolution No. 1 of 1988 of FOGAFIN, as amended from time to time, requires mandatory deposit insurance. Under this resolution, banks must pay an annual premium of 0.3% of total funds received on savings accounts, checking accounts, certificates of deposit, special savings deposits, mortgage bonds, special accounts, bank collection services and electronic deposits. If a bank or financial institution is liquidated, the deposit insurance will cover the funds deposited by an individual or corporation with such bank, up to a maximum of Ps 50 million, regardless of the number of accounts held.
Anti-Money-Laundering Provisions
The regulatory framework to prevent and control money laundering is contained in, among others, the EOSF, Part I, Title IV, Chapter IV of Legal Basic Circular (Circular Básica Jurídica), as amended, issued by the Superintendency of Finance, as well as the Colombian Criminal Code.
Colombian laws adopt the latest guidelines related to anti-money laundering and other terrorist activities established by the Financial Action Task Force on Money Laundering, or “FATF”. Colombia, as a member of the GAFI-SUD (a FATF-style regional body) follows all of FATF’s 40 recommendations and nine special recommendations.
Anti-money laundering provisions have been complemented with provisions aimed at deterring terrorism financing. For that purpose, by means of the Legal Basic Circular, the Superintendency of Finance has issued regulations requiring the implementation by financial institutions of a system of controls for money laundering and terrorism financing.
The requirements include “know your customer” including ultimate beneficial owners identification, rules and procedures to protect financial institutions from being used directly by shareholders and executives in money-laundering activities, for channeling funds for terrorist activities, or for the concealment of assets from such activities; these rules and procedures set forth detailed instructions for monitoring these risks.
Part III, Title I, Chapter VII of Legal Basic Circular, as amended, issued by the Superintendency of Finance and applicable to issuers of securities in the capital markets, provides rules and guidelines regarding the prevention of money laundering and terrorism financing.
Finally, the Colombian Criminal Code includes criminal rules and regulations to prevent, control, detect, eliminate and prosecute all matters related to financing terrorism and money laundering. The criminal rules and regulations cover the omission of reports on cash transactions, mobilization or storage of cash, and the lack of controls.
On January 18, 2022, Colombia enacted Law 2195 (Anti-bribery law), which increases the penalties, fines, crimes and sanctions that may be emplaced to local and branches of foreign companies, on the matter of corruption and the commitment of certain conducts that may result in crimes or felonies against the public administration, environment, economic and social order, terrorism financing and organization of terrorism groups, money laundering, private corruption, unlawful administration, among others. The new penalties include fines, suspensions or bans on contracting with the government, the disclosure of the conducts in media, the prohibition to receive any subsidy from the government, the dismissal of the staff that has been involved with the conduct, and the dismissal of the staff that tolerated or agreed to the conduct resulting in the crimes once determined by a judge.
Insolvency Law
On July 12, 2012, the Colombian Congress enacted Law 1564, which provides insolvency protection for non-merchant individuals. Under the new insolvency regulation, which came into effect on October 1, 2012, once a non-merchant individual has ceased paying his or her debts, such individual can initiate a voluntary insolvency proceeding before a notary public or mediator to reach an agreement with his or her creditors. The terms of any agreement reached with two or more creditors that represent more than 50% of the total amount of the claims against such individual will be mandatorily applicable to all relevant creditors. The law also provides for increased debtor protections, including an automatic stay for a maximum of 90 days.
86
Prepayment of Credit Operations without Penalty
On July 9, 2012, the Colombian Congress enacted Law 1555, allowing consumers of financial services to prepay obligations denominated in pesos owed to financial institutions, without incurring in any penalty. Law 1555 also requires that financial institutions disclose the possibility of such prepayment to borrowers prior to the extension of any loan.
Law 1555 does not apply to (i) mortgage loans, for which prepayment is always allowed according to Law 546 of 1999, (ii) loans having a balance that exceeds 880 times the legal monthly minimum wages, or (iii) to financial obligations acquired prior to this Law’s effective date (July 9, 2012), and for which prepayments are governed by the relevant contractual provisions, or absent an agreement by the parties, by the laws in force at the time when the relevant agreement was executed.
Data Protection Law
On October 17, 2012, Law 1581 of 2012, as amended by Law 2157 of 2021 a new data protection regime that applies to any person that administers databases in Colombia, and this Law was regulated on June 27, 2013 by Decree 1377 of 2013 and Decree 886 of 2014. Although it does not apply in its solely to financial institutions, it provides a set of principles (legality, freedom, truthfulness, quality, transparency, access, confidentiality, among others) that apply to us in the administration of our databases. Additionally, there is a general prohibition of transferring personal data to other countries that do not provide adequate levels of data protection according to the standards set by the Superintendency of Industry and Commerce. This prohibition does not apply to transfers of data that are inherent to banking and securities activities under the applicable law. The 2021 amendment included a new term of permanence in databases from clients of financial services and notification process to execute the report.
Regulation on Liens over Movable Assets
On August 20, 2013, the Colombian Congress enacted Law 1676 with the purpose of increasing the public access to credit by providing a new regulation on liens over movable assets. Law 1676 introduced substantial modifications to Colombian regulation on liens over movable assets, including: (a) the creation of a single unified lien public registry, (b) the ability for creditors to directly foreclose on the secured assets for a value determined in an appraisal conducted by an independent expert appointed by the Superintendency of Companies, (c) the ability for creditors to enforce the security upon insolvency of the debtor, provided that the movable assets are not essential for the continuing of business of the insolvent debtor, and (d) an upgrade of priority upon liquidation.
Regulation on Payroll Loans
On April 27, 2012, the Colombian Congress enacted Law 1527, as amended by Law 1607 of 2012 and by Law 1902 of 2018, which consolidated the then existing regulatory framework on payroll deduction loans. Under Law 1527, payroll loans are secured by an irrevocable order or authorization from the clients to their respective employers or to the entity that pays their salary or other financial benefits arising from their employment to directly pay the loan. As opposed to the prior regulatory regime, employees may currently freely determine the financial institution granting the relevant financial product or service. Similarly, Law 1527 provides that the employer is jointly and severally liable for the employee’s payment obligation if the employer fails to effect the deductions required for the debt service of its employee’s obligation.
Regulatory Framework for Non-Financial Subsidiaries
Our Colombian subsidiaries that are not part of the financial sector are governed by the laws and regulations of the Colombian Civil Code and the Colombian Code of Commerce, as well as any regulations issued by the Colombian Superintendency of Industry and Commerce and the Superintendency of Corporations or any other type of special regulations that may be applicable to corporations, and the commercial and industrial activities carried out by these subsidiaries.
Service of Process and Enforcement of Judgments
Grupo Aval is incorporated under the laws of Colombia. All of our directors and officers reside outside the United States. Substantially all of our assets are located outside the United States, primarily in Colombia. As a result, it may not be possible, or it may be difficult, for you to effect service of process upon us or these other persons within the United States or to obtain recognition and enforcement of judgments obtained in U.S. courts against us or them, including those predicated upon the civil liability provisions of the U.S. federal securities laws or otherwise.
The Colombian Supreme Court will determine whether to recognize a U.S. judgment predicated on the U.S. securities laws through a proceeding known under Colombian law as “exequatur”. Enforcement of U.S. judgments may require a separate court procedure in Colombia. After the exequatur has been granted, if the judicial decision imposes an obligation to pay a sum of money or to comply with
87
certain obligations, an executive judicial proceeding (proceso ejecutivo) before a local court is available. Such proceeding would follow the same rules applicable for the enforcement of local judicial decisions.
The Colombian Supreme Court will recognize a foreign judgment, without reconsideration of the merits, only if the judgment satisfies the requirements of Articles 605, 606 and 607 of Law 1564 of 2012 (Código General del Proceso), provided that the parties affected by the judgment were summoned in the exequatur proceedings in accordance with applicable rules. Law 1564 of 2012 provides that the foreign judgment will be recognized if:
| ● | a treaty or convention exists between Colombia and the country where the judgment was granted relating to the recognition and enforcement of foreign judgments or, in the absence of such treaty or convention, there is reciprocity in the recognition of foreign judgments between the courts of the relevant jurisdiction and the courts of Colombia; |
| ● | the foreign judgment does not refer to “in rem” rights vested in assets that were located in Colombia at the time the suit was filed in the foreign court which issued the judgment; |
| ● | the foreign judgment does not contravene or conflict with Colombian laws relating to public order (i.e., provision considered to be international public policy) other than those governing judicial procedures; |
| ● | the foreign judgment is final and not subject to appeal in accordance with the laws of the country in which it was obtained. The copy of the judgment provided to the Colombian Supreme Court must be authenticated and legalized by a Colombian Consul and translated into Spanish by an authorized translator, duly registered at the Ministry of Foreign Affairs; |
| ● | the foreign judgment does not refer to any matter upon which Colombian courts have exclusive jurisdiction; |
| ● | no proceedings are pending in Colombia with respect to the same cause of action, and no final judgment has been awarded in any proceeding in Colombia on the same subject matter and between the same parties; |
| ● | in the proceedings commenced in the foreign court that issued the judgment, the defendant was served properly in accordance with the applicable laws in such jurisdiction, and was given a reasonable opportunity to defend itself against the action; and |
| ● | the Colombian Supreme Court has granted exequatur upon the foreign judgment. |
The United States and Colombia do not have a bilateral treaty providing for automatic reciprocal recognition and enforcement of judgments in civil and commercial matters. The Colombian Supreme Court, which is the only Colombian court that can recognize foreign judgments, has generally accepted that reciprocity exists when it has been proven that either a U.S. court has recognized a Colombian judgment or that a U.S. court would recognize a foreign judgment, including a judgment issued by a Colombian court. However, the Colombian legal system is not based on precedents and exequatur decisions are made on a case-by-case basis.
We have appointed Banco de Bogotá S.A., New York Agency as our authorized agent upon whom process may be served in any action instituted in any U.S. federal or state court having subject matter jurisdiction in the Borough of Manhattan in New York, New York, arising out of or based upon the ADSs or the underwriting agreement related to the ADSs.
Notwithstanding the foregoing, we cannot assure you that a Colombian court would recognize or enforce a judgment issued by a state or federal court in the United States with respect to the preferred shares or ADSs based on U.S. securities laws. We have been advised by our Colombian counsel that there is no legal basis for a Colombian court to exert jurisdiction over original actions to be brought against us or our directors and executive officers predicated solely upon the provisions of U.S. securities laws. In addition, certain remedies available under U.S. securities laws may not be admitted or enforced by Colombian courts.
Grupo Aval’s articles of incorporation and by-laws contain an arbitration clause that provides for the exclusive jurisdiction of an arbitral tribunal to be seated in Bogotá, D.C., Colombia. The arbitration provision provides that any conflict arising among shareholders, or between shareholders and Grupo Aval in connection with the by-laws, must be resolved by an arbitral tribunal.
Risk Management Framework
In order to comply with the provisions of Law 1870 of 2018, (Conglomerate Law), and specifically the provisions of External Circular 013 of 2019, now Chapter XXX of the CBCF issued by the SFC, enforceable as of June 21, 2021, Grupo Aval implemented these regulations through the Risk Management Framework (“Marco de Gestión de Riesgos” or “MGR” for its acronym in Spanish) of the Financial Conglomerate. This corresponds to a set of policies, procedures, methodologies, and controls that act in an integrated manner through metrics
88
that allow the Financial Holding, as the visible head of the financial conglomerate Aval, the management of its own risks, determined by regulation to be Contagion, Concentration and Strategic Risk. The latter is done through the identification, measurement, control, and monitoring of such risks. Likewise, the regulatory expectation is having a general knowledge of the regulatory risks to be managed by the financial entities that make up the financial conglomerate Aval.
Pension and Severance Fund Management
Pension business overview
The Ministry of Finance limits the range of assets in which pension and severance fund managers (“AFP”) can invest and sets concentration limits regarding the funds under administration. In addition, each AFP is required by law to provide a minimum return on investment for each of its mandatory pension and severance funds. This minimum return is determined pursuant to certain formulas established by means of Decree 2555 of 2010, which vary pursuant to the type of fund. Under the current multi-fund scheme, a risk profile system which differentiates conservative, moderate and aggressive risk portfolios for individual clients of mandatory pension funds, the time horizon for the calculation of the minimum return is between 36 to 60 months, depending on the risk profile of each portfolio. For severance funds, the long-term portfolio will have a 24-month time horizon, and the short-term portfolio will have a three-month time horizon.
If a fund’s cumulative return for any month is lower than the minimum return, the AFP must supplement the necessary amount to cover the difference within a period of five days. To do so, the AFP must first apply funds from its “stabilization reserve”, which is a portion of the AFP’s capital invested in the fund administered by the AFP and which must represent at least 1.0% of the value of that fund. If the stabilization reserve is insufficient to cover the difference, the AFP must provide resources from its remaining capital. If the AFP does not have enough resources to cover the difference, the Superintendency of Finance may order the capitalization of the AFP to its shareholders. If, notwithstanding the above, an AFP fails to observe either the minimum return or the stabilization requirements or the order of capitalization, the Superintendency of Finance may take control over the AFP, in which case FOGAFIN, the Colombian deposit insurance fund, is required to supply funds to cover the shortfall. In that event, the AFP may be dissolved and the funds under administration transferred to another AFP. See “Item 3. Key Information—D. Risk Factors—Risks relating to our businesses and industry—Risks relating to our pension and severance fund management business”.
Third party assets under management are held in trusts independent from the assets of the AFP, where the contributions made by each individual customer and its returns are held in an individual account.
Mandatory pension funds
Contributions to these pension funds are mandatory for all employees in Colombia and are jointly funded by the employer and the employee. In the case of contributing clients, the base contribution rate is 16.0% (up to 18.0% for employees meeting a certain salary threshold) of an employee’s base salary, whereby the employer contributes 75.0% and the employee 25.0% of the base contribution rate. Contributions are paid on a monthly basis. Of the 16.0%-18.0% total contribution, 11.5% goes to the individual customer’s account. The current pension system provides that 300 basis points (3.0%) of the contribution are distributed between (i) life and disability insurance and (ii) compensation for the AFP. In 2022, Porvenir’s funds subscribed life and disability coverage insurance with a 2.47% premium, which resulted in a 0.53% retained as compensation. The remainder is distributed between the National Solidarity Fund (Fondo de Solidaridad Pensional), depending on the employee’s salary (up to 2.0%), and the National Minimum Pension Warranty Fund (Fondo de Garantía de Pensión Mínima) (at 1.5%).
In the case of non-contributing clients, regulation allows private pension funds to charge a performance-based commission considering that these customers have to be to be served in the same manner as a contributing client through branches, call-centers, billing and managing of their individual customer fund. The established performance-based commission is 4.5% of monthly returns of the clients’ individual customer fund, with a cap at 50% of the last value charged as commission over the clients’ contribution as an active customer.
Employees may freely select their mandatory pension fund, a private pension and severance fund manager of their choice or the Government-sponsored defined public benefit plan, administered by Colpensiones, and can change plans after meeting minimum tenure requirement of five years to switch from the public fund to a private plan and only up to ten years prior to the retirement age, and six months to switch between private fund providers with no limitation prior to retirement age. Whenever an employee changes from one AFP to another, his/her entire savings balance at the fund is transferred to the pension fund administered by the new AFP. Mandatory pension funds cannot be withdrawn prematurely, and they generally expand over the individual’s working years.
Severance funds
Severance funds are independent trusts formed by the accumulated severance payment allowance required by Colombian labor law. The severance payment allowance is a social benefit inuring to employees for which employers are responsible under an employment agreement.
89
The allowance consists of the payment of one month’s salary per year of service and pro rata amounts for fractions of a year. This amount is deposited directly with the AFP by the employer. Porvenir and all other pension and severance fund managers in Colombia charge a fee (per year for assets under management) of 1.0% for amounts in the mandatory investments short-term portfolio and 3.0% in the long-term portfolio.
Voluntary pension funds
Voluntary pension funds are independent trusts formed by contributions from their participants and/or sponsors and their respective yields, for the purposes of complying with one or several voluntary retirement or disability pension plans. Porvenir earns annual management commissions for assets under management that range between 0.5% and 3.0%, depending on the balance of the customer and the selected portfolios (lower commissions for liquidity portfolios and higher commissions for more complex portfolios).
In 2020, the Colombian Government, through Decree 1207 issued a new legal framework applicable to voluntary pension funds. This legal framework required AFP to adopt higher standards of corporate governance rules and operating guidelines including a general investment policy. In 2022 Porvenir implemented all the required adjustments and procedures to fulfill the obligations arising from Decree 1207.
Third-party sponsored pension liability funds
Third-party sponsored pension liability funds are independent trusts made up of deposits from different institutions (both private and publicly owned) that require a professional institution to manage a fund that is usually created to finance special pension regimes (i.e., pensions that are paid by the employer; before 1994, companies were allowed to establish their own internal pension systems).
Third-party sponsored pension liability funds enable Porvenir to receive performance-based commissions, in few cases these funds have a minimum guaranteed return pursuant to their specific terms. The most important of these contracts is with FONPET (“Fondo Nacional de Pensiones de las entidades territoriales”), which was subject to renewal upon expiration during 2022, but was extended by the Ministry of Finance until April 2023. Porvenir retains a percentage of the yearly returns of each third-party sponsored pension liability fund, and in some cases, a portion of assets under management.
Pension fund solvency measures
For information regarding pension and severance fund solvency measures see “Item 4. Information on the Company—B. Business overview—Supervision and regulation—Capital Adequacy Requirements—Porvenir”.
C. Organizational structure
See Note 1 of our consolidated financial statements for information on our organizational structure. We conduct our operations through our four banks (Banco de Bogotá, Banco de Occidente, Banco Popular and Banco AV Villas), a pension and severance fund manager (Porvenir), and our merchant bank (Corficolombiana).
D. Property, plant and equipment
We have listed below the carrying amount of property, plant and equipment of each of our operating segments at December 31, 2022.
|
| Buildings and |
|
| Bearer |
| Other |
| ||||
| land(1) |
| Machinery |
| Equipment |
| plants |
| properties | Total | ||
(Ps billions) | ||||||||||||
Banco de Bogotá |
| 735.2 | 6.1 | 252.8 | — | 90.7 |
| 1,084.8 | ||||
Banco de Occidente |
| 107.9 | 0.0 | 81.6 | — | 8.8 |
| 198.3 | ||||
Banco Popular |
| 406.5 | 0.2 | 85.1 | — | 12.2 |
| 504.0 | ||||
Banco AV Villas |
| 190.4 | — | 59.1 | — | 16.2 |
| 265.6 | ||||
Porvenir | 57.1 | 0.4 | 19.4 | — | 1.3 | 78.2 | ||||||
Corficolombiana |
| 1,092.6 | 1,195.4 | 47.1 | 243.5 | 16.1 |
| 2,594.5 | ||||
Other segments | — | — | 2.1 | — | 0.7 | 2.7 | ||||||
Consolidation adjustments and eliminations | 1.0 | 0.1 | — | — | 0.8 | 2.0 | ||||||
Grupo Aval |
| 2,590.7 | 1,202.2 | 547.1 | 243.5 | 146.8 |
| 4,730.2 | ||||
| (1) | Includes ongoing constructions. |
90
ITEM 4A. UNRESOLVED STAFF COMMENTS
Not applicable.
ITEM 5. OPERATING AND FINANCIAL REVIEW AND PROSPECTS
A. Operating results
The following discussion of our financial condition and results of operations should be read in conjunction with our audited consolidated financial statements prepared in accordance with IFRS at December 31, 2022 and 2021 and for the years ended December 31, 2022, 2021 and 2020 and the related notes thereto, and with the other financial information included in this annual report. The preparation of our audited consolidated financial statements requires the adoption of assumptions and estimates that affect the amounts recorded as assets, liabilities, revenue and expenses in the years and periods addressed and are subject to certain risks and uncertainties. Our future results may vary substantially from those indicated because of various factors that affect our business, including, among others, those identified under “Forward-Looking Statements” and “Item 3. Key Information—D. Risk factors”, “Item 5. Operating and Financial Review and Prospects—D. Trend information”, and other factors discussed in this annual report. For information regarding the calculation methodology of the main key performance indicators used throughout this section see “Item 3. Key Information—A. Selected Financial Data”.
Volume and rate variances have been calculated based on variances in average balances over the period and changes in interest rates on average interest-earning assets and average interest-bearing funding as follows: (a) changes in volume (change in volume times new rate) and (b) changes in rates (change in rate times old volume). Net changes attributable to changes in both volume and interest rate have been allocated to changes in volume. Calculations are done on a line-by-line basis to account for changes in mix when analyzing each group of interest-earning assets (gross loans, total gross loans and total interest-earning assets) and interest-bearing funding (customer deposits, other funding and total funding). In Item 5, we refer to “N.A.” as not applicable.
As described below, in March 2022, Banco de Bogotá spun-off 75% of its equity interest in BHI to Banco de Bogotá’s shareholders, including Grupo Aval, and Grupo Aval spun-off shares of BHI it received from Banco de Bogotá to its own shareholders (the “Transaction”). Prior to the spin-off, BHI was a significant subsidiary and standalone operating segment of Grupo Aval. As a result of the Transaction, on March 31, 2022, we ceased to report BHI as an operating segment. The reporting perimeter of Grupo Aval’s remaining six operating segments remained unchanged. Banco de Bogotá sold an additional 20.89% stake in BHI in an unsolicited tender offer and sold its remaining 4.11% stake in BHI in March 2023 (see “Item 7. Major Shareholders and Related Party Transactions—B. Related party transactions”).
Prior to the spin-off, BHI was a significant subsidiary of Grupo Aval. As a result of the Transaction, on March 31, 2022, we ceased to report BHI as an operating segment and Ps 111,185.8 billion and Ps. 98,305.8 billion in total assets and total liabilities, respectively, were deconsolidated from Grupo Aval’s consolidated statement of financial position as of that date. Given that Banco de Bogotá retained a 25% equity interest in BHI, the spun-off portion from Grupo Aval’s total equity amounted to Ps 9,658.6 billion of which Ps 6,639.0 billion are equity attributable to owners of the parent, given our 68.7% equity interest in Banco the Bogotá at the time of the spin-off.
For the years ended December 31, 2022, 2021 and 2020, the results of discontinued operations are presented separately on the consolidated Statement of income; however, following the deconsolidation of a discontinued operation, no retrospective adjustments are permitted to be made to the prior period consolidated Statements of Financial Position under IFRS. To facilitate meaningful analysis and comparability, average Statement of financial position balances prior to the consummation of the Transaction, including as used to calculate average yields and average rates, have been adjusted to exclude the impact of discontinued operations substantially in accordance with Article 11 of Regulation S-X, and all information presented under “Item 5. Operating and Financial Review and Prospects—Results of Operations for the Year Ended December 31, 2022, compared to the Year Ended December 31, 2021” refers to financial and operating data of continuing operations, unless otherwise specifically noted. For more information on the spin-off and tender offer, please refer to Note 1.1 “Discontinued Operations of BAC Holding” to our audited consolidated financial statements.
We have not included a discussion of year-over-year comparisons between 2021 and 2020 in this annual report on Form 20-F. This discussion can be located in “Item 5. Operating and Financial Review and Prospects—Results of Operations for the Year Ended December 31, 2021 Compared to the Year Ended December 31, 2020” in our annual report on Form 20-F for the year ended December 31, 2021, filed with the SEC on April 21, 2022.
91
Principal factors affecting our financial condition and results of operations
International context
Economic activity for the year 2022 exceeded economist’s initial estimations globally. Countries around the world continued experiencing strong commercial activity and domestic demand, which furthered inflationary pressures. According to the IMF, global growth of 3.4% in 2022 slowed down from the 6.2% recorded in 2021, and is expected to continue trending downward to 2.9% in 2023 and stabilize at 3.1% in 2024. The rise in central bank rates to fight inflation and disruptions due to Russia’s war in Ukraine continue to weigh on economic activity. The reappearance of COVID-19 in China dampened growth in 2022. Global inflation accelerated to 8.8% in 2022 from 4.7% in 2021 and is expected to recede to 6.6% in 2023 and 4.3% in 2024. In most economies, amid the cost-of-living crisis, monetary policy became less accommodative in order to keep inflation expectations anchored.
IMF estimates evidence the effects of tightening monetary policies on growth across the Latin America and the Caribbean region which decelerated to 3.9% in 2022 from 7.0% in 2021. However, the economic performance diverged between countries in the region, with Colombia being the most dynamic economy in the region.
Colombian Economic Conditions
Colombia was no stranger to global trends experiencing an outstanding recovery during 2021 and the first half of 2022. However, this growth environment, compounded with a high dependence on imported food and idiosyncratic factors, added to an already weakened Colombian Peso. These factors drove Colombia to experience a particularly strong inflationary pressure that led to the steepest increase in interest rates in this century.
During 2022, Colombia´s GDP growth was 7.5%, one of the highest growths amongst all emerging countries. Growth was driven by the strength of private consumption (that grew 9.5%), and by robust investment dynamics (that grew 19.5%). Net exports had a negative impact on overall growth due to a 23.9% expansion of imports that exceeded a 14.9% increase in exports over the year. On the supply side, growth in 2022 was driven by the recovery of the recreation and entertainment sector, that experienced a 37.9% annual growth, followed by communications, growing at 14.2%, commercial activities, growing at 10.7%, and manufacturing, that delivered a 9.8% annual growth. Meanwhile, the Agriculture sector contracted 1.9% over the year due to higher input costs and challenging weather conditions.
The labor market has continued to improve, however at a slower pace. The average 2022 unemployment rate fell to 11.2%, improving from 13.8% in 2021. In December, the national unemployment rate reached 11.3% versus a 12.1% rate in December 2021.
Interest Rates and Inflation
Price pressures continued to build up in 2022, with food prices reaching an annual increase greater than 25% during the second half of the year. twelve-month inflation reached 13.1% in December 2022, the highest since 1999. In January 2023, inflation continued to accelerate reaching a twelve-month inflation of 13.3%. Food prices accounted for 35.0% of the overall price increase. Going forward, lower global prices of fertilizers and improving weather conditions should help to alleviate price pressures on the agricultural sector with inflation slowly easing during the next few months. In this context, the Central Bank continued to increase its reference rate to 12.75% after a 75 basis points hike during its January meeting, accumulating a 1,100 basis points hike since September 2021.
Inflation increased rapidly during the second half of 2021 as a result of the measures taken in response to the COVID-19 pandemic and the aforementioned recovery in economic activity, and reached 5.62% in 2021 as compared to 1.61% in 2020. After reaching 1.50% in March 2021, inflation accelerated during the remainder of the year.
Exchange rates
The Colombian peso ended the year 2022 at Ps 4,810.20 per dollar, depreciating 20.8% over the year. The average exchange rate in 2022 was Ps 4,257.12 per dollar, depreciating 13.6% compared to 2021. The exchange rate reached a maximum of Ps 5,061.21 on November 8, 2022 and a minimum of Ps 3,706.95 on April 5, 2022. Additional volatility of the Colombian peso has been inflicted by changes in public policy that could reduce the role of the private sector in certain industries such as health, pensions and utilities. This adds to previous concerns regarding changes in policies that could reduce oil and gas exploration as part an energy model transition. These reforms could lower domestic savings and impact the country’s external financing position, making it more vulnerable to external shocks.
We continue to be subject to impacts on our consolidated financial statements derived from fluctuations in the exchange rate of the Colombian peso, in particular, against the U.S. dollar, the currency in which most of our foreign long-term debt is denominated. Prior to the BHI spin-off, we were also subject to fluctuations between the U.S. dollar and each of the currencies in our Central American operations. At December
92
31, 2022, 23.3% of our average consolidated assets and 31.1% of our average consolidated liabilities were denominated in foreign currency. On a consolidated basis, we had U.S.$3.6 billion (Ps 17.5 trillion) of long-term debt denominated in U.S. dollars at December 31, 2022.
Fiscal accounts
On the fiscal front, the government ended 2022 with a deficit of 5.5% of GDP, an improvement versus the 7.1% recorded in 2021, reflecting the strong rebound of the economy and the positive effect of higher oil prices on tax collection. Net public debt to GDP fell to 59.6% in 2022 down from 60.8% in 2021, due to a higher GDP growth in nominal terms despite the weakening of the peso during last year. On December 13, 2022, Congress approved a tax reform under Law 2277 or “Reforma Tributaria para la Igualdad y la Justicia Social”, the tax bill proposed by the Ministry of Finance sought an adjustment of 1.7% of GDP. For 2023 the Ministry of Finance’s Financial Plan assumes 1.3% GDP growth and a fiscal deficit of 3.8% of GDP.
Loan Volumes
At December 31, 2022, gross loans in the Colombian banking system grew 16.7% compared to the prior year end, while at December 31, 2021, growth was 10.3% (16.6% and 10.1% when adjusted for securitized mortgage loans). Commercial loans grew 16.5% compared to 7.9% the previous year. Consumer loans accelerated rapidly and grew 18.2% in 2022 after growing 12.7% in 2021 driven by the post-COVID rebound in economic activity and by a shift in risk appetite levels of the banking system. Mortgages grew 14.8% compared to 14.3% the previous year. As Colombia’s nominal GDP expanded 22.7%, the ratio of bank loans (adjusted for securitized mortgage loans) to GDP decreased to 44.0% from 46.4% in 2021, lower than the 45.6% three-year average between 2019 and 2017.
Transactions related to BHI – Discontinued operations
Prior to March 2022, Grupo Aval held a 68.7% equity interest in BHI (100.0% through Banco de Bogotá), the holding company of BAC, Central America’s largest banking group. In 2010, when Banco de Bogotá purchased this operation, assets related to Leasing Bogotá S.A., Panamá (as BHI was formerly named) represented 18.7% of Grupo Aval’s consolidated assets. By the end of 2021, this ratio had increased to 31.9%. Because of BAC’s growth compounded with the depreciation of the Colombian peso, BAC had grown to be the size of Banco de Bogotá’s Colombian operations. Separating Banco de Bogotá’s Colombian operations and BAC operations was intended to strengthen their respective strategic positions, allowing them to better capture future growth and to adapt to the local market dynamics more quickly, through more efficient capital, fiscal and regulatory structures.
93
The following table illustrates, to facilitate comparability to our previously reported results, the contributions of the discontinued BHI segment to Grupo Aval’s audited consolidated Statement of income for the year ended December 31, 2021, prior to our deconsolidation of BHI, as reported in our annual report on Form 20-F for the year ended December 31, 2021, filed with the SEC on April 21, 2022:
BHI operating segment relative to Grupo Aval | ||||||||
|---|---|---|---|---|---|---|---|---|
Year ended December 31, 2021 | ||||||||
| Grupo Aval as reported on 2021 20-F |
| BHI operating segment |
| Grupo Aval as reported on 2022 20-F |
| BHI segment as a percentage of Grupo Aval as reported on 2021 20-F | |
(in Ps billions) | ||||||||
Total interest income |
| 19,647.5 |
| 6,856.1 |
| 12,791.4 |
| 34.9% |
Total interest expense |
| (6,918.7) |
| (2,257.8) |
| (4,660.8) |
| 32.6% |
Net interest income |
| 12,728.9 |
| 4,598.3 |
| 8,130.6 |
| 36.1% |
Impairment loss on loans and other accounts receivable |
| (4,500.1) |
| (1,307.8) |
| (3,192.3) |
| 29.1% |
Impairment (loss) recovery on other financial assets |
| (16.2) |
| (15.6) |
| (0.7) |
| 95.9% |
Recovery of charged-off financial assets |
| 481.2 |
| 9.3 |
| 471.9 |
| 1.9% |
Net impairment loss on financial assets |
| (4,035.1) |
| (1,314.0) |
| (2,721.1) |
| 32.6% |
Net interest income, after impairment losses | 8,693.8 | 3,284.2 | 5,409.5 | 37.8% | ||||
Net income from commissions and fees |
| 5,611.4 |
| 2,547.2 |
| 3,064.2 |
| 45.4% |
Gross profit from sales of goods and services | 3,098.9 | — | 3,098.9 | 0.0% | ||||
Net trading income |
| 948.7 |
| 26.4 |
| 922.3 |
| 2.8% |
Net income from other financial instruments mandatorily at fair value through profit or loss |
| 270.1 | — | 270.1 |
| 0.0% | ||
Other income |
| 1,294.0 |
| 904.4 |
| 389.7 |
| 69.9% |
Other expenses |
| (11,396.7) |
| (4,606.6) |
| (6,790.1) |
| 40.4% |
Net income before tax expense |
| 8,520.3 |
| 2,155.7 |
| 6,364.6 |
| 25.3% |
Income tax expense |
| (2,851.8) |
| (528.4) |
| (2,323.4) |
| 18.5% |
Net income for the year from continuing operations |
| 5,668.5 |
| 1,627.3 |
| 4,041.2 |
| 28.7% |
Net income for the year from discontinued operations | — | 64.1 | 1,627.3 | N.A. | ||||
Net income for the year |
| 5,668.5 |
| 1,691.4 |
| 5,668.5 |
| 29.8% |
In March 2022, after obtaining the necessary approvals, Banco de Bogotá executed a spin-off of a 75.0% equity stake in BHI to its shareholders and Grupo Aval subsequently spun-off to its shareholders the shares received in this process. Prior to the spin-off, BHI transferred its interest in MFG to Banco de Bogotá in September 2021 and as a result of the loss of control, net income of MFG recognized by BHI up to September 2021 was retrospectively reclassified to discontinued operations in the BHI operating segment. MFG remains a consolidated subsidiary of Grupo Aval and part of the Banco de Bogotá operating segment, the perimeter of which remains unchanged from last year. Prior to the spin-off, BHI was a significant subsidiary of Grupo Aval. Following the Transaction, net income recorded from BHI for reporting periods prior to the spin-off was retrospectively reclassified to discontinued operations. To facilitate meaningful analysis and comparability of the analysis of Grupo Aval’s results under “Results of Operations for the Year Ended December 31, 2022 Compared to the Year Ended December 31”, average Statement of Financial Position balances for assets and liabilities prior to the consummation of the Transaction, including as used to calculate average yields and average rates paid, have been adjusted to exclude the impact of discontinued operations.
As a result of the Transaction, Grupo Aval lost control over BHI and ceased to consolidate BHI in its financial statements and, on March 31, 2022, Ps 111,186 billion and Ps. 98,306 billion in total assets and total liabilities, respectively, were deconsolidated from Grupo Aval’s consolidated Statement of financial position as of that date. Given that Banco de Bogotá initially retained a 25% equity interest in BHI, the spun-off portion from Grupo Aval’s total equity amounted to Ps 9,658.6 billion of which Ps 6,639.0 billion are equity attributable to owners of the parent, given our 68.7% equity interest in Banco de Bogotá at the time of the spin-off. For illustrative purposes, the benefits on regulatory capital came mainly in two ways: BHI’s risk-weighted assets (U.S.$17.2 billion at December 31, 2021) ceased to be consolidated, and BHI’s intangibles (U.S.$1.6 billion at December 31, 2021) ceased to be deducted from CET1. This, in turn, substantially reduced the impact of FX volatility and several regulatory capital restrictions. The value of the spun-off equity from Banco de Bogotá on March 31, 2022, was equivalent to U.S.$2.6 billion and the value of tangible equity spun-off was U.S.$1.0 billion (both translated for convenience at the applicable exchange rate at March 31, 2022 of 3,756.02 Pesos per U.S. dollar). As a result of the Transaction, Banco de Bogotá strengthened its regulatory capital position amidst increased capital requirements derived from Colombia’s transition to Basel III standards.
94
The principal impacts of the transaction on our other financial and operating data included the following:
| ● | Grupo Aval’s net interest margin for 2021 retrospectively recast to exclude the impact of discontinued operations was 4.5%, compared to 4.9% including continuing operations and the BHI discontinued operations (as reported in our annual report on Form 20-F for the year ended December 31, 2021); |
| ● | Cost of risk, net of recoveries of charged-off assets for 2021 retroactively recast to exclude the impact of discontinued operations was 1.5%, compared to 1.9% including continuing operations and the BHI discontinued operations (as reported in our annual report on Form 20-F for the year ended December 31, 2021). |
| ● | Grupo Aval’s efficiency ratios improved, with Grupo Aval’s cost to income ratio improving 1.8 percentage points in 2021 to 45.8% on a continuing operations basis, as compared to 47.6% (including continuing and discontinued operations), and its cost to assets ratio improving 610 basis points in 2021 to 2.7% on a continuing operations basis, as compared to 3.3% (including continuing and discontinued operations). |
In March 2022, the retained equity interest in BHI allowed Grupo Aval and Banco de Bogotá to maintain significant influence over BHI as an associate, benefiting from its future growth potential and dividends. The exposure to a distinct geographic area (Central America) presented a diversified income stream for Banco de Bogotá’s operations as it remained significant when compared to the bank’s overall net income.
Between April and December, the global and local macroeconomic context shifted rapidly and Banco de Bogotá’s operations were faced with headwinds unforeseen at the time the spin-off occurred in March. The overall business environment changed materially during the second half of 2022, given the massive increase in the Central Bank intervention rate and the unprecedented speed at which monetary policy was transmitted to the cost of funds of Banco de Bogotá due to the accelerated implementation in Colombia of Net stable Funding Ratio (NSFR).
This scenario was not limited to Colombia as central banks’ monetary policy across the world became increasingly restrictive. As a result of the macroeconomic context and a deterioration of expectations, fixed income and equity markets posted large losses. During the last quarter of 2022, the outlook for economic conditions in 2023 and 2024 deteriorated as the Federal Reserve’s (FED) language turned more hawkish and analysts continued cutting world output estimations.
The U.S. dollar strengthened relative to other currencies, the Colombian Peso included, and rates for U.S. Treasuries increased dramatically as expected FED rate hikes increased in speed and duration. In addition, as a result of the risk-off in capital markets, risk premiums for emerging markets (including Colombia and Central American countries) increased rapidly during the second half of the year.
This context negatively impacted profitability metrics for most participants in the Colombian banking system, Banco de Bogotá included. The sector was faced with headwinds on regulatory capital, NSFR and liquidity coverage ratios (LCR or IRL in Spanish), unforeseen when Banco de Bogotá carried out the Transaction back in March 2022.
On October 2022 an unsolicited tender offer was extended to BHI’s shareholders (Banco de Bogotá included) by the beneficial owner of Grupo Aval, Banco de Bogotá and BHI for a minimum of 5% and a maximum of 25% of BHIs outstanding shares. Banco de Bogotá reassessed its strategy regarding BHI given the tender offer. The changes in the macroeconomic outlook combined with the favorable terms of the tender made it an attractive opportunity for Banco de Bogotá’s shareholders. Banco de Bogotá’s participation in the tender was ultimately intended to increase the bank’s future value generation potential and protect shareholders’ equity amidst a challenging scenario in 2023. Banco de Bogotá highlighted the following considerations to participate in the tender offer as presented to its General Shareholders Meeting:
| ● | Discount rates increased as a result of the abovementioned capital markets’ conditions and negatively impacted the fair value of debt and equity instruments worldwide. The tender offer was above the fair value estimated in independent valuations contracted by Banco de Bogotá and 50% above the pre-tender price of BHI’s share in the Colombian stock market. |
| ● | The resources provided by the transaction were expected to improve the bank’s future net income generation potential and strengthen regulatory capital, NSFR and LCR. Resources provided would be received in a juncture characterized by slow economic growth, high interest rates and tighter liquidity. |
| ● | Banco de Bogotá’s management team would be mainly focused on the Colombian market, allowing the company to work towards its strategic objectives of digital transformation and regaining market share in the Colombian market. |
95
| ● | Risk premiums in Central America increased significantly between March and December. |
In December 2022, Banco de Bogotá obtained the necessary approvals to sell its 25% equity interest in BHI in an unsolicited tender offer launched by Esadinco S.A. (an affiliate of Mr. Sarmiento Angulo) on October 14, 2022. The tender offer was oversubscribed 1.20x, and as a result, Banco de Bogotá disposed of a 20.89% equity interest in BHI. The remaining 4.11% ceased to be an investment in associate and was recognized as a financial asset at fair value with changes in OCI (FVOCI). Following the sale, the equity method recognized under the “share of profit of equity accounted investees, net of tax (equity method)” between April and November was reclassified to discontinued operations.
Following the disposal of BHI and reflecting the ordinary course of business for 2022, Banco de Bogotá’s consolidated CET1 and total solvency ratios at December 31, 2022 were 10.1% and 13.1% as compared to 10.2% and 13.5%, respectively at December 31, 2021. Banco de Bogotá’s separate NSFR ratios (as required by the Superintendency of Finance) were 105.1% and 107.7% at December 31, 2022 and 2021, respectively. Banco de Bogota’s separate 30-day LCR ratios (as required by the Superintendency of Finance) were 221.5% and 132.2% at December 31, 2022 and 2021, respectively.
For more information on the impacts of the BHI spin-off, deconsolidation and subsequent tender offer on our audited consolidated Statement of financial position, Statement of income and Statement of cash flows, see Note 1.1 “Discontinued Operations” to our audited consolidated financial statements.
Results of Operations for the Year Ended December 31, 2022 Compared to the Year Ended December 31, 2021
Colombia’s economy lost its momentum during the fourth quarter of 2022. GDP growth during 4Q22 rose to 2.9% when compared to the same quarter in 2021. The previous three quarters grew 7.8%, 12.1% and 7.7%, respectively. GDP Growth during the year was 7.5%. A contractionary monetary policy, which included several increases to the repo rate totaling a staggering 900 bps during the year, and 600 bps during the second half, was transmitted much faster than in the past to the banks’ costs of funds as the banking sector competed for longer term deposits mostly to comply with more demanding NSFR requirements issued by the Superintendency of Finance. Conversely, banks that specialize in consumer lending will only gradually reprice in time their mostly fixed-rate loan portfolios.
Grupo Aval’s net income for the year ended December 31, 2022 includes Ps 4,003.0 billion net income from continuing operations and Ps 866.2 billion net income from discontinued operations. Net income from discontinued operations consists of (i) Ps 796.6 billion of net income from BHI (either as a subsidiary between January and March or as an associate between April and November) and (ii) Ps 69.6 billion of net income from the net effects of the disposal process. Grupo Aval’s net income attributable owners of the parent for the year 2022 includes Ps 1,888.9 billion net income from continuing operations and Ps 594.0 billion net income from discontinued operations. Net income attributable to owners of the parent from discontinued operations consists of (i) Ps 548.0 billion of net income from BHI (either as a subsidiary between January and March or as an associate between April and November) and (ii) Ps 46.0 billion of net income from the net effects of the disposal process.
The effects of the disposal process result from a gain as a result of Banco de Bogota’s spin-off of 75% of BHI in March and a loss as a result of the sale of 20.9% of BHI in December in connection to Banco de Bogota’s acceptance of a tender offer on BHI’s shares. For more information on the transaction and the tender offer, see Note 1.1 “Discontinued Operations of BAC Holding” to our audited consolidated financial statements.
| ● | Grupo Aval’s consolidated loan portfolio grew 18.1% in 2022. During the year, consumer loans grew 17.0%, commercial loans grew 18.3% and mortgages grew 21.8%. Total deposits grew 17.0% in 2022. |
| ● | Grupo Aval’s net interest margin (NIM) decreased to 3.8% in 2022 from 4.5% in 2021. Our NIM includes the costs of borrowing of Corficolombiana’s non-financial subsidiaries, and therefore is not a pure banking NIM. This number is mostly distorted when the cost of borrowing increases materially, which was the case in 2022. |
| ● | Local and international fixed income and equity markets experienced losses throughout the year, which led to lower than expected returns on our financial subsidiaries’ investment portfolios and on Porvenir’s stabilization reserve. |
| ● | The improvement in expected credit losses (ECL), delinquency ratios and the composition of our loan portfolio as measured by loans classified by stages drove the 8.4% or Ps 227.9 billion decrease in impairment loss on loans and accounts receivable. The return to more a normalized payment behavior of our clients and the improvement of economic expectations as compared to those initially forecasted supported this performance. As such, Grupo Aval’s cost of risk net of recoveries of charged-off assets for 2022 improved to 1.5% from 1.8% for 2021. |
96
| ● | Net income from commissions and fees posted a 5.2% decrease as compared to 2021. Banking fees, Trust activities and portfolio management fees and Bonded warehouse fees increased 17.1%, 4.9% and 10.5%, respectively, during the year, while Pension and severance management fees contracted 26.16%, mostly due to the increase in life and disability insurance premiums, which Porvenir contracts and pays on behalf of its clients and which reduces Porvenir’s net income from commissions and fees. |
| ● | Solid results from our non-financial complemented the results of our banking operations. Nonetheless, the results of our non-financial entities were negatively affected by the increase costs of funding and hedging strategies recognized under net trading income from derivatives and foreign exchange gains (losses). |
| ● | We maintained our focus on a group wide cost control strategy, which allowed our expenses to increase 9.1% below inflation. Grupo Aval’s cost to assets ratio improved by 10 basis points during 2022 (to 2.7% from 2.8%). |
Our results for the year should be read in conjunction with our audited consolidated financial statements.
Grupo Aval
Overview
The following discussion describes the main drivers of Grupo Aval’s results of operations for the year ended December 31, 2022 compared to the year ended December 31, 2021. Further detail is provided in the Management Discussion and Analysis of Operating Segments.
Grupo Aval’s net income attributable to owners of the parent for the year ended December 31, 2022 was Ps 2,482.9 billion (Ps 107 per share, including common and preferred shares), decreasing 24.7% or Ps 814.9 billion compared to the year ended December 31, 2021. Net income from continuing operations attributable to owners of the parent was Ps 1,888.9 billion, 13.3% or Ps 290.3 billion lower than in 2021. Return on average equity for 2022 was 14.0% as compared to 15.3% in 2021 (including both continuing and discontinued operations).
Grupo Aval Consolidated | ||||||||
Year ended December 31, |
| Change, 2022 vs. 2021 | ||||||
| 2022 |
| 2021 |
| # |
| % | |
(in Ps billions) | ||||||||
Total interest income |
| 19,403.0 |
| 12,791.4 |
| 6,611.6 |
| 51.7 |
Total interest expense |
| (11,664.4) |
| (4,660.8) |
| (7,003.6) |
| 150.3 |
Net interest income |
| 7,738.6 |
| 8,130.6 |
| (391.9) |
| (4.8) |
Impairment loss on loans and other accounts receivable |
| (3,120.4) |
| (3,192.3) |
| 71.9 |
| (2.3) |
Impairment (loss) recovery on other financial assets |
| (16.7) |
| (0.7) |
| (16.1) |
| 2,433.3 |
Recovery of charged-off financial assets |
| 644.0 |
| 471.9 |
| 172.0 |
| 36.5 |
Net impairment loss on financial assets |
| (2,493.1) |
| (2,721.1) |
| 227.9 |
| (8.4) |
Net interest income, after impairment losses | 5,245.5 | 5,409.5 | (164.0) |
| (3.0) | |||
Net income from commissions and fees |
| 2,903.8 |
| 3,064.2 |
| (160.4) |
| (5.2) |
Gross profit from sales of goods and services | 4,545.1 | 3,098.9 | 1,446.2 |
| 46.7 | |||
Net trading income |
| 1,559.6 |
| 922.3 |
| 637.3 |
| 69.1 |
Net income from other financial instruments mandatorily at fair value through profit or loss |
| 278.8 |
| 270.1 | 8.7 |
| 3.2 | |
Other income |
| (848.6) |
| 389.7 |
| (1,238.3) |
| (317.8) |
Other expenses |
| (7,409.8) |
| (6,790.1) |
| (619.7) |
| 9.1 |
Net income before tax expense |
| 6,274.4 |
| 6,364.6 |
| (90.3) |
| (1.4) |
Income tax expense |
| (2,271.4) |
| (2,323.4) |
| 52.0 |
| (2.2) |
Net income for the year from continuing operations |
| 4,003.0 |
| 4,041.2 |
| (38.2) |
| (0.9) |
Net income for the year from discontinued operations | 866.2 |
| 1,627.3 | (761.1) |
| (46.8) | ||
Net income for the year | 4,869.1 | 5,668.5 | (799.4) |
| (14.1) | |||
Net income for the year attributable to: |
|
|
|
|
|
| ||
From continuing operations | 1,888.9 | 2,179.2 | (290.3) |
| (13.3) | |||
From discontinued operations | 594.0 | 1,118.6 | (524.6) |
| (46.9) | |||
Owners of the parent |
| 2,482.9 |
| 3,297.7 |
| (814.9) |
| (24.7) |
From continuing operations | 2,114.1 | 1,862.0 | 252.1 |
| 13.5 | |||
From discontinued operations | 272.2 | 508.8 | (236.6) |
| (46.5) | |||
Non-controlling interest |
| 2,386.2 |
| 2,370.8 |
| 15.5 |
| 0.7 |
Net income for the year |
| 4,869.1 |
| 5,668.5 |
| (799.4) |
| (14.1) |
97
Net interest income
Net interest income decreased 4.8% or Ps 391.9 billion to Ps 7,738.6 billion in 2022. Total interest expense increased 150.3% or Ps 7,003.6 billion, more than total interest income, resulting from a 311 basis point increase in interest rates paid on interest-bearing funding and an 11.8% or Ps 21,852.2 billion increase in the average balance of interest-bearing funding. Net interest expense contributed by Corficolombiana’s non-financial subsidiaries increased to a Ps 434.6 billion net interest expense, 53.7% or Ps 151.8 billion more than in 2021. Total interest income performance was driven by a 249 basis point increase in the average yield of interest-earning assets and a 12.3% or Ps 22,181.6 billion increase in the average balance of interest-earning assets. Yields and rates paid increased rapidly due to monetary policy in place throughout the year, a tighter liquidity environment and due to additional pressures coming from more demanding NSFR requirements, which drove the increase in the cost of interest-bearing deposits. The interest spread between the average yield on gross loans and the average rate paid on interest-bearing deposits decreased by 120 basis points to 4.7% and net interest margin contracted by 141 basis points to 3.5%.
Average balance of interest-earning assets | Net interest margin for | Net interest income for the | ||||||||||||||||
for the year ended December 31, | Change, 2022 vs. 2021 | the year ended December 31, | year ended December 31, | Change, 2022 vs. 2021 | ||||||||||||||
2022 |
| 2021 |
| # |
| % |
| 2022 |
| 2021 |
| 2022 |
| 2021 | # |
| % | |
(in Ps billions) | (in Ps billions) | |||||||||||||||||
201,819.0 | 179,637.4 | 22,181.6 | 12.3 | 3.8% |
| 4.5% | 7,738.6 | 8,130.6 | (391.9) | (4.8) | ||||||||
The following tables show: (i) the average balance, average yield and interest income on interest-earning assets from continuing operations with an analysis of impacts derived from changes in the average balance and the average yield, per type of interest-earning asset; interbank and overnight funds are shown separate from gross loans due to their characteristics and short-term nature and (ii) the average balance, average rate paid and interest expense on interest-bearing funding with an analysis of impacts derived from changes in the average balance and the average rate, per type of interest-bearing funding.
(i) | Average balance for the | Average yield for the | Interest income for the | Impact on interest income | Change, 2022 | |||||||||||||||||||
year ended December 31, | Change, 2022 vs. 2021 | year ended December 31, | year ended December 31, | due to changes in | vs. 2021 | |||||||||||||||||||
| 2022 |
| 2021 |
| # |
| % |
| 2022 |
| 2021 |
| 2022 |
| 2021 |
| Balance |
| Yield | Total |
| % | ||
(in Ps billions) | (in Ps billions) | (in Ps billions) | ||||||||||||||||||||||
Commercial |
| 96,110.5 |
| 86,506.7 |
| 9,603.8 |
| 11.1 |
| 9.0% |
| 5.4% |
| 8,608.6 |
| 4,698.6 |
| 860.2 |
| 3,049.8 | 3,910.0 |
| 83.2 | |
Consumer |
| 54,855.9 |
| 47,830.5 |
| 7,025.3 |
| 14.7 |
| 12.8% |
| 12.3% |
| 7,048.7 |
| 5,890.7 |
| 902.7 |
| 255.3 | 1,158.1 |
| 19.7 | |
Mortgages |
| 16,085.1 |
| 13,543.8 |
| 2,541.3 |
| 18.8 |
| 8.4% |
| 8.0% |
| 1,349.9 |
| 1,080.0 |
| 213.3 |
| 56.6 | 269.9 |
| 25.0 | |
Microcredit |
| 284.3 |
| 342.8 |
| (58.5) |
| (17.1) |
| 22.7% |
| 22.7% |
| 64.6 |
| 77.9 |
| (13.3) |
| (0.0) | (13.3) |
| (17.1) | |
Gross loans |
| 167,335.7 |
| 148,223.8 |
| 19,111.9 |
| 12.9 |
| 10.2% |
| 7.9% |
| 17,071.8 |
| 11,747.2 |
| 1,949.8 |
| 3,374.8 | 5,324.7 |
| 45.3 | |
Interbank and overnight funds | 3,314.9 |
| 1,795.7 |
| 1,519.2 |
| 84.6 |
| 14.7% |
| 7.5% |
| 487.7 |
| 135.0 |
| 223.5 |
| 129.2 | 352.7 |
| 261.3 | ||
Total gross loans | 170,650.6 |
| 150,019.5 |
| 20,631.1 |
| 13.8 |
| 10.3% |
| 7.9% |
| 17,559.5 |
| 11,882.1 |
| 2,122.9 |
| 3,554.5 | 5,677.4 |
| 47.8 | ||
Investments in debt securities | 31,168.4 |
| 29,617.9 |
| 1,550.5 |
| 5.2 |
| 5.9% |
| 3.1% |
| 1,843.5 |
| 909.3 |
| 91.7 |
| 842.5 | 934.3 |
| 102.7 | ||
Total interest-earning assets |
| 201,819.0 |
| 179,637.4 |
| 22,181.6 |
| 12.3 |
| 9.6% |
| 7.1% |
| 19,403.0 |
| 12,791.4 |
| 2,132.6 |
| 4,479.1 | 6,611.6 |
| 51.7 | |
(ii) | Average balance for the | Average rate paid for the | Interest expense for the | Impact on interest expense | Change, 2022 | |||||||||||||||||||
year ended December 31, | Change, 2022 vs. 2021 | year ended December 31, | year ended December 31, | due to changes in | vs. 2021 | |||||||||||||||||||
| 2022 |
| 2021 |
| # |
| % |
| 2022 |
| 2021 |
| 2022 |
| 2021 | Balance |
| Rate | Total | % | ||||
(in Ps billions) | (in Ps billions) | (in Ps billions) | ||||||||||||||||||||||
Checking accounts |
| 6,696.7 |
| 7,702.5 |
| (1,005.8) |
| (13.1) |
| 2.4% |
| 0.8% |
| (159.1) |
| (62.4) | 23.9 |
| (120.6) | (96.7) | 155.1 | |||
Time deposits |
| 61,431.3 |
| 54,212.7 |
| 7,218.6 |
| 13.3 |
| 6.6% |
| 3.1% |
| (4,041.5) |
| (1,700.1) | (474.9) |
| (1,866.4) | (2,341.3) | 137.7 | |||
Savings accounts |
| 71,720.4 |
| 65,411.0 |
| 6,309.4 |
| 9.6 |
| 5.0% |
| 1.3% |
| (3,555.8) |
| (875.4) | (312.8) |
| (2,367.6) | (2,680.4) | 306.2 | |||
Total interest-bearing deposits |
| 139,848.4 |
| 127,326.2 |
| 12,522.2 |
| 9.8 |
| 5.5% |
| 2.1% |
| (7,756.4) |
| (2,637.9) | (694.5) |
| (4,424.0) | (5,118.5) | 194.0 | |||
Interbank borrowings and overnight funds | 10,457.9 | 10,024.2 | 433.7 |
| 4.3 |
| 6.5% |
| 1.6% |
| (678.1) |
| (162.5) | (28.1) |
| (487.5) | (515.7) | 317.4 | ||||||
Borrowings from banks and others | 23,100.8 | 14,638.5 | 8,462.3 |
| 57.8 |
| 3.8% |
| 2.7% |
| (887.1) |
| (401.7) | (325.0) |
| (160.4) | (485.4) | 120.8 | ||||||
Bonds issued | 30,276.4 | 29,253.2 | 1,023.2 |
| 3.5 |
| 6.9% |
| 4.7% |
| (2,092.8) |
| (1,368.7) | (70.7) |
| (653.5) | (724.2) | 52.9 | ||||||
Borrowings from development entities | 3,549.7 | 3,673.2 | (123.5) |
| (3.4) |
| 7.0% |
| 2.5% |
| (249.9) |
| (90.0) | 8.7 |
| (168.5) | (159.8) | 177.6 | ||||||
Other funding | 67,384.9 | 57,589.2 | 9,795.7 |
| 17.0 |
| 5.8% |
| 3.5% |
| (3,908.0) |
| (2,022.9) | (568.1) |
| (1,317.0) | (1,885.1) | 93.2 | ||||||
Total interest-bearing liabilities | 207,233.3 | 184,915.4 | 22,317.9 |
| 12.1 |
| 5.6% |
| 2.5% |
| (11,664.4) | (4,660.8) | (1,256.2) |
| (5,747.4) | (7,003.6) | 150.3 | |||||||
Grupo Aval’s average balance of gross loans increased 12.9% or Ps 19,111.9 billion in 2022 and the average yield was 10.2%, 228 basis points higher than in 2021. Growth of average balances was lower than that of closing balances (18.1%), partly explained by (i) by stronger underwriting as the year progressed, particularly in commercial loans for which growth of closing balances was 18.3% compared to an 11.1% growth of average balances and (ii) the difference between a 20.8% year-on-year and a 13.6% average peso depreciation versus the U.S. dollar on foreign currency denominated loans (19.4% of total gross loans).
The average Central Bank rate in Colombia increased by 528 basis points to 7.20% in 2022 from 1.92% in 2021. The end of period Central Bank rate in Colombia increased by 900 basis points to 12.0% at December 31, 2022 from 3.00% a year earlier. Given that 85.2% of Grupo
98
Aval’s commercial loans are variable rate mostly referenced to the 3-month inter-bank rate (IBR) or the 90-day time deposit rate (DTF), average yields on commercial loans increased 353 basis points to 8.96%, slightly below the 528 basis points increase in the average Central Bank rate. On the other hand, given that 87.9% and 76.5% of Grupo Aval’s consumer loans and mortgages are fixed rate, the average yields on these loans only priced in during 2022 a small portion of the rise in reference rates and increased 53 basis points and 42 basis points, respectively.
The average balance of interest-earning investments in debt securities increased 5.2% or Ps 1,150.5 billion. The average yield for interest-earning investments in debt securities increased 284 basis points as our subsidiaries invested in securities at higher yields as the Colombian sovereign yield curve (TES) shifted upwards, following global sovereign fixed income rates and underpinned by the increase in Colombia’s sovereign risk premium.
Average funding rates moved upwards in line with the average Central Bank rate and distorted by competition for stable retail funding and term funding with tenors longer than one year. More demanding NSFR requirements effective on March 31, 2023 favor these sources of funding rather than those provided by financial institutions and open collective investment funds. Pressures on balances and rates built up during the latter part of the year to comply with NSFR requirements. The end of period balance of interest-bearing liabilities increased 17.1% or Ps 32,912.5 billion, driven by a 37.9% or Ps 19,845.0 billion increase in time deposits, a 68.0% or Ps 12,264.7 billion increase in borrowings from banks and others and a 7.4% or Ps 5,095.5 billion increase in savings accounts. The fast-paced growth of time deposits drove the 344 basis points increase in the average rate paid for time deposits, partially pricing in the increase in the average Central Bank rate.
Grupo Aval’s consolidated financial statements incorporate a substantial portion of funding used by Corficolombiana and its non-financial subsidiaries to finance both the ordinary course of business of non-financial subsidiaries and Corficolombiana’s investment portfolio in debt and equity securities. The contribution of Corficolombiana to Grupo Aval’s average balance of interest earning assets is smaller than the contribution to Grupo Aval’s average interest-bearing funding, resulting in a net leverage position. Net interest income (expense) contribution from Corficolombiana’s non-financial subsidiaries to Grupo Aval in 2022 amounted Ps 434.5 billion net interest expense, 53.7% or Ps 151.8 billion more than the Ps 282.8 billion net expense contribution in 2021. The increase in net interest expenses contributed by Corficolombiana is in line with higher interest rates for funding, whether through deposits taken by Corficolombiana or other funding (mostly borrowings from banks and others and bonds) taken by Corficolombiana and its subsidiaries.
Corficolombiana’s consolidated non-financial subsidiaries’ net interest income has been and is expected to continue to be negative in the future as these entities are not financial entities and thus pay interest expenses to fund returns of assets that are mostly not considered interest-earning assets. The returns on those assets are primarily registered in the gross profit (loss) from sales of goods and services and net income from other financial instruments mandatorily at FVTPL, and to a lesser extent, in Other income under share of profit of equity accounted investees, net of tax (equity method). Income and expenses related to financial assets and liabilities, in addition to net interest expense, are recognized under net trading income and foreign exchange gains (losses), net.
Net impairment loss on financial assets
Year ended December 31, | Change, 2022 vs. 2021 | |||||||
| 2022 |
| 2021 |
| # |
| % | |
(in Ps billions) | ||||||||
Impairment loss on loans and other accounts receivable |
| (3,120.4) |
| (3,192.3) |
| 71.9 |
| (2.3) |
Impairment (loss) recovery on other financial assets |
| (16.7) |
| (0.7) |
| (16.1) |
| 2,433.3 |
Recovery of charged-off financial assets |
| 644.0 |
| 471.9 |
| 172.0 |
| 36.5 |
Net impairment loss on financial assets |
| (2,493.1) |
| (2,721.1) |
| 227.9 |
| (8.4) |
Grupo Aval’s impairment loss on loans and other accounts receivable decreased 2.3% or Ps 71.9 billion to Ps 3,120.4 billion, driven by the improvement of the loan portfolio’s ECL, explained by (i) favorable performance of clients that had been granted reliefs during 2020 and (ii) in line with the economic recovery and its effect on borrowers’ credit risk. For more information regarding risk management please see “Item 11. Quantitative and Qualitative Disclosures About Market Risk”. Recovery of charged-off financial assets increased 36.5% or Ps 172.0 billion, leveraged on improved economic conditions and enhanced collection processes in our subsidiaries.
Impairment (loss) recovery on other financial assets was driven by a U.S.$5.3 million impairment loss (Stage 1 ECL recognition) of Grupo Aval Limited’s U.S.$520.0 million investment in subordinated corporate bonds convertible into common shares issued by BAC International Bank Inc., a subsidiary of BHI. This impairment loss had to be recognized following the loss of control associated with the spin-off of BHI (75% equity interest) in March 2022.
In general terms, Colombian and Panamanian governments adopted measures aimed at mitigating the negative effect of the pandemic on their respective economies, including through the regulation of an extension on tax returns and payments deadlines, temporary payment holidays on loans and a reduction and/or freezing of interest rates, without negative consequences on credit scores or payment records.
99
Although each bank tailored reliefs and structural payment programs to best suit their clients’ profiles, such support measures shared certain general characteristics. The outstanding portion of our loan book under payment holidays and structural payment programs is immaterial to Grupo Aval’s results.
The following table provides detail by category of impairment loss on loans and other accounts receivable, cost of risk and cost of risk, net. For more information on the calculation methodology please refer to “Item 3. Key Information—A. Selected Financial Data”.
Impairment loss on loans and other accounts receivable | Cost of risk for the | Change, | Cost of risk, net for the | Change, | ||||||||||||||||
|---|---|---|---|---|---|---|---|---|---|---|---|---|---|---|---|---|---|---|---|---|
Year ended December 31, | Change, 2022 vs. 2021 | year ended December 31, | 2022 vs. 2021 | year ended December 31, | 2022 vs. 2021 | |||||||||||||||
2022 | 2021 | # | % | 2022 | 2021 | basis points | 2022 | 2021 | basis points | |||||||||||
(in Ps billions) | ||||||||||||||||||||
Commercial | (622.8) | (1,234.3) | 611.5 | (49.5) | 0.6% | 1.4% | (78) | 0.6% | 1.3% | (80) | ||||||||||
Consumer | (2,498.7) | (1,828.4) | (670.3) | 36.7 | 4.6% | 3.8% | 73 | 3.6% | 3.0% | 59 | ||||||||||
Mortgage | 25.2 | (99.8) | 125.0 | (125.3) | (0.2)% | 0.7% | (89) | (0.2)% | 0.7% | (89) | ||||||||||
Microcredit | (5.5) | (17.5) | 12.0 | (68.6) | 1.9% | 5.1% | (318) | (3.7)% | 2.7% | (643) | ||||||||||
Gross loans | (3,101.8) | (3,180.0) | 78.2 | (2.5) | 1.9% | 2.1% | (29) | 1.5% | 1.8% | (36) | ||||||||||
Interbank and overnight funds | 0.9 | (1.5) | 2.5 | (161.3) | N.A. | N.A. | N.A. | N.A. | N.A. | N.A. | ||||||||||
Total gross loans | (3,100.8) | (3,181.5) | 80.7 | (2.5) | N.A. | N.A. | N.A. | N.A. | N.A. | N.A. | ||||||||||
Other accounts receivable | (19.6) | (10.8) | (8.7) | 80.4 | N.A. | N.A. | N.A. | N.A. | N.A. | N.A. | ||||||||||
Impairment loss on loans and other accounts receivable | (3,120.4) | (3,192.3) | 71.9 | (2.3) | 1.9% | 2.2% | (29) | 1.5% | 1.8% | (36) | ||||||||||
Grupo Aval’s cost of risk, net, composition of gross loans per stage and asset quality measured by delinquency improved driven by the following factors:
| 1. | Uncertainty about borrowers’ payment capacity continued to decrease in 2022 as payment behavior patterns of clients under relief programs consolidated, ECL models were updated with information that is likely to reflect future conditions of our borrowers more accurately. Under this context, the return of Stage 2 loans to Stage 1 was greater than in 2021. |
| 2. | Economic performance in 2022 was better than initially estimated when applying forward-looking macroeconomic information in 2021. In addition, risk models give a higher weight to recent history when incorporating economic information, this benefited ECL as 2022 was a year in which the recovery from the effects of the pandemic consolidated. |
| 3. | Origination activity improved significantly in 2022. The share of Stage 1 loans on the overall mix increased to 87.2%, up from 81.6% a year earlier, driven by Ps 24.0 trillion new financial assets originated (net of payments) in 2022. This was 1.2 times or Ps 13.2 trillion more than in 2021. |
| 4. | In 2022, the balance of Stage 2 loans decreased 32.3% or Ps 5,606.1 billion and decreased its weight on the overall mix of Stages to 6.5% in 2022 down from 11.3% in 2021. |
| a. | Commercial: The balance of Stage 2 commercial loans decreased 36.2% or Ps 3,215.6 billion in 2022 as compared to a Ps 1,506.5 billion increase in 2021. The performance for 2022 was driven by an improvement in our borrower’s financial conditions, that enabled the removal of overlays for commercial loans. |
| b. | Consumer: The balance of Stage 2 consumer loans decreased 21.1% or Ps 1,320.8 billion in 2022 as compared to a Ps 949.2 billion decrease in 2021, explained by a Ps 212.5 billion increase in charge-offs. The increase in impairment losses for consumer loans was driven by an increase in ECL of personal loans and credit cards, which have higher PDs than other secured products such as payroll loans and automobile loans and leases. At December 31, 2022, 56.1% of our consumer loans were payroll loans -mainly to Government employees and retirees- and 9.1% were automobile loans. |
For more information on loss allowance calculations, please refer to Note 4 of our audited consolidated financial statements.
100
The following table shows our gross loan classification by Stages in accordance with IFRS 9 (interbank and overnight funds are not included as they tend to be mostly Stage 1 and with low loss allowance due to their characteristics and short-term nature).
At December 31, | Change, 2022 vs. 2021 | |||||||||||||||||||||||
|---|---|---|---|---|---|---|---|---|---|---|---|---|---|---|---|---|---|---|---|---|---|---|---|---|
2022 | 2021 | Gross | ||||||||||||||||||||||
| Stage 1 |
| Stage 2 |
| Stage 3 |
| Gross loans |
| Stage 1 |
| Stage 2 |
| Stage 3 |
| Gross loans | Stage 1 |
| Stage 2 |
| Stage 3 |
| loans | ||
(in Ps billions) | % | |||||||||||||||||||||||
Commercial |
| 89,958.2 | 5,672.1 | 9,144.8 |
| 104,775.1 |
| 71,200.0 |
| 8,887.7 |
| 8,503.3 |
| 88,591.0 | 26.3 | (36.2) | 7.5 | 18.3 | ||||||
Consumer |
| 52,529.1 | 4,929.0 | 1,961.4 |
| 59,419.4 |
| 42,627.1 |
| 6,249.8 |
| 1,888.5 |
| 50,765.3 | 23.2 | (21.1) | 3.9 | 17.0 | ||||||
Mortgages |
| 16,226.4 | 1,159.8 | 497.1 | 17,883.4 | 12,033.8 |
| 2,200.2 |
| 447.4 | 14,681.5 | 34.8 | (47.3) | 11.1 | 21.8 | |||||||||
Microcredit |
| 224.5 | 14.1 | 29.2 |
| 267.7 |
| 187.4 |
| 43.4 |
| 87.0 |
| 317.7 | 19.8 | (67.6) | (66.5) | (15.7) | ||||||
Gross loans | 158,938.3 | 11,774.9 | 11,632.4 | 182,345.6 | 126,048.4 | 17,381.0 | 10,926.1 | 154,355.5 | 26.1 | (32.3) | 6.5 | 18.1 | ||||||||||||
| ||||||||||||||||||||||||
Commercial |
| 85.9% |
| 5.4% |
| 8.7% |
| 100.0% |
| 80.4% |
| 10.0% |
| 9.6% |
| 100.0% | ||||||||
Consumer |
| 88.4% |
| 8.3% |
| 3.3% |
| 100.0% |
| 84.0% |
| 12.3% |
| 3.7% |
| 100.0% | ||||||||
Mortgages |
| 90.7% | 6.5% | 2.8% | 100.0% | 82.0% | 15.0% | 3.0% | 100.0% | |||||||||||||||
Microcredit |
| 83.9% |
| 5.3% |
| 10.9% |
| 100.0% |
| 59.0% |
| 13.6% |
| 27.4% |
| 100.0% | ||||||||
Gross loans | 87.2% | 6.5% | 6.4% | 100.0% | 81.7% | 11.3% | 7.1% | 100.0% | ||||||||||||||||
In 2022, overlays put in place during 2020, which intended to anticipate future performance of delinquency were lifted. In 2020, overlays drove a Ps 10.9 trillion transfer of gross loans from Stage 1 to Stage 2. In 2021, Ps 5.5 trillion of gross loans transferred from Stage 2 to Stage 1 and Ps 3.9 trillion showed further signs of deterioration and were transferred to Stage 3, the majority of which was ultimately charged-off. In 2022, Ps 8.3 trillion of gross loans transferred from Stage 2 to Stage 1 and Ps 2.9 trillion showed further signs of deterioration and were transferred to Stage 3, the majority of which was ultimately charged-off.
The outstanding balance of commercial Stage 2 loans classified as “significant risk” (with PDs between 45% and 60%) decreased Ps 3,495.4 billion. The removal of overlays enabled a Ps 472.6 billion decrease in impairment losses for Stage 2 commercial loans. Loss allowance as a percentage of gross commercial loans classified as Stage 2 increased to 9.1% in 2022 from 8.5% in 2021. In Stage 2 consumer loans, personal loans classified as “appreciable risk” (with PDs between 22.5% and 45%) increased Ps 492.6 billion and credit cards classified as “appreciable risk” increased Ps 427.6 billion. As a result, impairment losses for Stage 2 personal loans and credit cards increased Ps 378.4 billion and Ps 240.8 billion, respectively. Observed deterioration has not yet reflected the changes in ECL; the balance of delinquent loans for these products increased Ps 63.8 billion over the year and charge-offs for these products increased Ps 177.3 billion. As such, loss allowance as a percentage of gross consumer loans classified as Stage 2 increased to 17.3% in 2022 from 13.2% in 2021.
The following table shows the balance of loans at least 91 days past due, delinquency ratios, charge-offs and charge-offs as a percentage of average gross loans for Grupo Aval (interbank and overnight funds are not included as they tend not to be past due or charged-off due to their characteristics and short-term nature).
Loans at least 91 days past due | Delinquency ratio (1) | Change, | ||||||||||||
At December 31, | Change, 2022 vs. 2021 | at December 31, | 2022 vs. 2021 | |||||||||||
2022 | 2021 | # | % | 2022 | 2021 | basis points | ||||||||
| (in Ps billions) | |||||||||||||
Commercial | 3,788.8 | 3,534.5 | 254.3 | 7.2 | 3.6% | 4.0% | (37) | |||||||
Consumer | 1,575.3 | 1,514.5 | 60.8 | 4.0 | 2.7% | 3.0% | (33) | |||||||
Mortgages |
| 540.9 | 470.5 | 70.4 | 15.0 | 3.0% | 3.2% | (18) | ||||||
Microcredit |
| 29.2 | 86.9 | (57.8) | (66.4) | 10.9% | 27.4% | (1,646) | ||||||
Gross loans |
| 5,934.2 | 5,606.4 | 327.8 | 5.8 | 3.3% | 3.6% | (38) | ||||||
Charge-offs | Charge-offs as a percentage | Change, | ||||||||||||
At December 31, | Change, 2022 vs. 2021 | of average gross loans | 2022 vs. 2021 | |||||||||||
2022 | 2021 | # | % | 2022 | 2021 | basis points | ||||||||
| (in Ps billions) | |||||||||||||
Commercial | 746.2 | 1,095.1 | (349.0) | (31.9) | 0.8% | 1.3% | (49) | |||||||
Consumer | 2,343.2 | 2,383.6 | (40.3) | (1.7) | 4.3% | 5.0% | (71) | |||||||
Mortgages |
| 41.9 | 27.2 | 14.7 | 54.1 | 0.3% | 0.2% | 6 | ||||||
Microcredit |
| 80.6 | 49.9 | 30.7 | 61.6 | 28.4% | 14.6% | 1,381 | ||||||
Total charge-offs |
| 3,211.9 | 3,555.8 | (343.9) | (9.7) | 1.9% | 2.4% | (48) | ||||||
| (1) | Calculated as loans past due more than 90 days divided by gross loans. |
101
Delinquency coverage ratio for gross loans, measured as loss allowance divided by past due gross loans more than 90 days remained materially stable at 155.1% in 2022 and 2021. Charge-offs as a percentage of average gross loans decreased explained in part by the origination dynamics mentioned before that led to strong growth of average balances that performed well as of December 31, 2022.
Net income from commissions and fees
Year ended December 31, |
| Change, 2022 vs. 2021 | ||||||
| 2022 |
| 2021 |
| # |
| % | |
(in Ps billions) | ||||||||
Banking fees |
| 2,448.5 |
| 2,090.8 |
| 357.7 |
| 17.1 |
Bonded warehouse services |
| 187.2 |
| 169.4 |
| 17.9 |
| 10.5 |
Trust activities and portfolio management services |
| 353.3 |
| 336.6 |
| 16.6 |
| 4.9 |
Pension and severance fund management |
| 885.4 |
| 1,199.1 |
| (313.7) |
| (26.2) |
Income from commissions and fees |
| 3,874.4 |
| 3,795.9 |
| 78.5 |
| 2.1 |
Expenses from commissions and fees |
| (970.7) |
| (731.7) |
| (238.9) |
| 32.7 |
Net income from commissions and fees |
| 2,903.8 |
| 3,064.2 |
| (160.4) |
| (5.2) |
Income from commissions and fees increased 2.1% or Ps 78.5 billion, positively impacted by a 17.1% or Ps 357.7 billion increase in banking fees that were partially offset by a 26.2% or Ps 313.7 billion decrease in pension and severance fund management fees. The increase in banking fees is related to the following:
| 1. | Banking service fees increased 12.3% or Ps 168.5 billion due to (i) higher transaction volumes on our branch network, especially during the last quarter of the year and (ii) higher bancassurance income in 2022 due to an increase in underwriting. |
| 2. | Debit and credit card fees increased 24.6% or Ps 164.9 billion mainly explained by a 38.3% or Ps 106.7 billion increase in income from merchant acquiring, as transactions on point-of-sale (POS) were significantly higher in 2022 exceeding pre-pandemic levels. Debit and credit card fees increased 14.8% or Ps 58.2 billion. |
Pension and severance fund management fees decreased driven by (i) a 35.6% or Ps 304.4 billion decrease in fee income from mandatory pension fund management, (ii) a 15.0% or Ps 15.5 billion decrease in revenues received from voluntary pension fund management mainly due to negative returns on AUMs, (iii) a 2.6% or Ps 6.2 billion increase in fee income from severance fund management driven by an increase in the number of clients, and (iv) a 3.1% or Ps 0.1 billion increase in fee income from third-party pension fund management, mainly FONPET.
Fees generated by Porvenir were negatively impacted by an increase in premiums paid for life and disability insurance coverage on mandatory pensions, which rose to 2.47% in February, 2022 up from 2.00% in 2021 as a result of the increased mortality, consequence of the COVID-19 pandemic. Given that this rate is deducted from the 3.00% Porvenir charges on contributions of its mandatory pension fund clients, the fee received by Porvenir declined to 0.53% in 2022 down from 1.00% in 2021. Between February and the first weeks of April Porvenir accounted for the higher insurance cost as expenses from commissions and fees in an amount of Ps 61.5 billion as regulation requires to notify clients of the change before it can be enforced. From that point on, the mandatory pension funds managed by Porvenir reflected the higher insurance cost as lower income from mandatory pension fund fees. This event explains part of the increase in expenses from commissions and fees.
The increase in expenses from commissions and fees was mainly driven by expenses related to the recovery of income from commissions and fees and by higher fees paid for external sales-forces, as commercial activity increased.
Gross profit from sales of goods and services
Year ended December 31, |
| Change, 2022 vs. 2021 | ||||||
| 2022 |
| 2021 |
| # |
| % | |
(in Ps billions) | ||||||||
Income from sales of goods and services |
| 12,141.3 |
| 10,450.9 |
| 1,690.4 |
| 16.2 |
Costs and expenses of sales of goods and services |
| (7,596.2) |
| (7,352.0) |
| (244.3) |
| 3.3 |
Gross profit from sales of goods and services |
| 4,545.1 |
| 3,098.9 |
| 1,446.2 |
| 46.7 |
Gross profit from sales of goods and services mainly reflects income and expenses related to non-financial assets and liabilities of Grupo Aval’s non-financial subsidiaries. Results related to financial assets and liabilities of these companies are presented under interest income, interest expense, net income from other financial instruments mandatorily at FVTPL, net trading income and foreign exchange gains (losses), net, and to a lesser extent, in Other income under share of profit of equity accounted investees, net of tax (equity method).
102
Year ended December 31, 2022 | ||||||||||||
|---|---|---|---|---|---|---|---|---|---|---|---|---|
| Infrastructure |
| Energy & Gas |
| Hospitality |
| Agribusiness |
| Other |
| Total | |
(in Ps billions) | ||||||||||||
Income from sales of goods and services |
| 5,330.2 |
| 5,718.8 |
| 532.3 |
| 341.0 |
| 219.0 |
| 12,141.3 |
Costs from sales of goods and services |
| (1,410.5) |
| (3,710.9) |
| (182.3) |
| (195.2) |
| (77.4) |
| (5,576.2) |
Gross income from sales of goods and services |
| 3,919.7 |
| 2,007.9 |
| 350.0 |
| 145.8 |
| 141.7 |
| 6,565.1 |
Personnel expenses | (29.8) | (116.8) | (58.6) | (14.1) | (402.7) | (622.0) | ||||||
Administrative and other expenses | (176.6) | (361.9) | (199.0) | (29.4) | (76.3) | (843.1) | ||||||
Depreciation and amortization | (61.1) | (337.9) | (14.6) | (6.9) | (23.9) | (444.5) | ||||||
Expenses from commissions and fees | (1.9) | (7.4) | (6.0) | (0.3) | (19.1) | (34.6) | ||||||
Allowance for impairment of receivables | (1.9) | (57.9) | 0.6 | 0.3 | (0.2) | (59.1) | ||||||
Other expenses | (0.0) | (16.7) | (0.0) | — | (0.0) | (16.7) | ||||||
Expenses from sales of goods and services | (271.2) | (898.5) | (277.7) | (50.4) | (522.2) | (2,020.0) | ||||||
Gross profit from sales of goods and services |
| 3,648.5 |
| 1,109.4 |
| 72.4 |
| 95.4 |
| (380.5) |
| 4,545.1 |
Year ended December 31, 2021 | ||||||||||||
| Infrastructure |
| Energy & Gas |
| Hospitality |
| Agribusiness |
| Other |
| Total | |
(in Ps billions) | ||||||||||||
Income from sales of goods and services |
| 4,714.7 |
| 4,987.2 |
| 296.8 |
| 252.5 |
| 199.6 |
| 10,450.9 |
Costs from sales of goods and services |
| (2,087.3) |
| (3,180.5) |
| (113.0) |
| (155.1) |
| (58.7) |
| (5,594.6) |
Gross income from sales of goods and services |
| 2,627.4 |
| 1,806.7 |
| 183.9 |
| 97.4 |
| 140.9 |
| 4,856.3 |
Personnel expenses | (25.2) | (119.3) | (43.2) | (13.2) | (398.5) | (599.4) | ||||||
Administrative and other expenses | (159.2) | (261.5) | (135.3) | (19.8) | (71.6) | (647.4) | ||||||
Depreciation and amortization | (69.8) | (297.4) | (15.5) | (7.0) | (25.6) | (415.4) | ||||||
Expenses from commissions and fees | (1.7) | (5.5) | (3.8) | (0.3) | (16.6) | (27.9) | ||||||
Allowance for impairment of receivables | (3.5) | (46.8) | (0.2) | (0.4) | (0.2) | (51.1) | ||||||
Other | (0.0) | (16.2) | (0.0) | (0.0) | (0.0) | (16.2) | ||||||
Expenses from sales of goods and services | (259.5) | (746.5) | (198.0) | (40.6) | (512.7) | (1,757.4) | ||||||
Gross profit from sales of goods and services |
| 2,367.9 |
| 1,060.2 |
| (14.1) |
| 56.8 |
| (371.8) |
| 3,098.9 |
Infrastructure companies were the largest contributor to this line item with Ps 3,648.5 billion in 2022. This sector drove the overall performance in gross profit from sales of goods and services growing 54.1% or Ps 1,280.6 billion compared to 2021 mainly explained by a Ps 615.5 billion increase in income and a Ps 665.2 billion decrease in costs and expenses. Income benefitted from increases in the internal rate of return (DOB or “Diferencial de Obra Bruto”) used to calculate financial assets of concession arrangements, driven by (i) the depreciation of the Colombian peso relative to the U.S. dollar and its positive effect on U.S. dollar denominated future guaranteed payments and (ii) the increase in observed and expected inflation relative to previous estimations used in future cash flow projections. The latter also led to a higher value of intangible assets related to concession arrangements due to increases in cash flow projections of toll-road income. Given that Corficolombiana’s concessions under construction are nearing their final stages, work progress was slower than in 2021, which in turn drove the reduction in construction costs. Partially offsetting the increase in gross profit from sales of goods and services, the infrastructure companies registered a Ps 533.8 billion increase in expenses related to hedging strategies (net trading income and foreign exchange losses) of its financial assets and liabilities (Ps 467.2 billion increase) and interest expense on financing (Ps 66.6 billion increase).
Gross profit for energy and gas companies in 2022 was Ps 1,109.4 billion, Ps 49.2 billion more than in 2021. Income increased 14.7% or Ps 731.6 billion and costs and expenses increased 17.4% or Ps 682.4 billion. Income grew vigorously during the first nine months of the year but had a sluggish fourth quarter as tariffs were lowered in September, transportation volumes to industrial clients decelerated in line with the economic slowdown and due to scheduled maintenances of pipelines. Offsetting the increase in gross profit from sales of goods and services, the energy and gas companies registered a Ps 92.8 billion increase in interest expense on financing.
Gross profit for hospitality companies in 2022 was Ps 72.4 billion, a Ps 86.4 billion improvement relative to the Ps 14.1 billion loss in 2021. Income increased 79.3% or Ps 235.5 billion driven by an increase in occupancy rates to 69.2%, the highest ever and over 10.0 percentage points higher than in 2019 (pre-pandemic levels). Costs increased 47.9% or Ps 149.1 billion driven by the reactivation of activities.
Gross profit for agribusiness companies in 2022 was Ps 95.4 billion, Ps 38.7 billion more than in 2021. Income increased 35.0% or Ps 88.5 billion due to a higher price of rubber and African palm oil, while costs increased 25.4% or Ps 49.8 billion mainly explained by the increase in prices for agro-industrial supplies and the effects of supply chain disruptions.
Gross loss for other sectors was Ps 380.5 billion in 2022, mainly reflects operating costs of other services companies (mainly call-centers) that provide Grupo Aval’s entities and third parties with call center, BPO and external sales-force services, Ps 8.8 billion more than the Ps 371.8 billion gross loss in 2021.
103
For a detailed analysis of the different sectors see “Item 5. Operating and Financial Review and Prospects—A. Operating Results—Management Discussion and Analysis of Operating Segments—Corficolombiana” and for information related to concession arrangements rights see Note 16 of our audited consolidated financial statements.
Net trading income
Grupo Aval’s net trading income (refer to Note 29 of our audited consolidated financial statements) was Ps 1,559.6 billion in 2022, Ps 637.3 billion or 69.1% higher than in 2021, resulting from a Ps 732.7 billion increase in net trading income from derivatives and a Ps 95.3 billion decrease in income from investment securities at fair value through profit or loss. The performance of net trading income from derivatives was offset by a Ps 1,334.3 billion decrease in foreign exchange gains (losses), net, recognized under other income.
Net trading income from investment securities at fair value through profit or loss consisted of two distinct drivers, income from Porvenir’s stabilization reserve decreased Ps 244.5 billion to a Ps 81.1 billion loss in 2022 (see “Item 5. Operating and Financial Review and Prospects—A. Operating Results—Management Discussion and Analysis of Operating Segments—Porvenir”) which was partially offset by a Ps 149.2 billion increase to a Ps 110.9 billion income from our other operating segments.
Net trading income from our non-financial subsidiaries decreased Ps 218.2 billion to a Ps 5.1 billion gain, resulting from a Ps 257.3 billion decrease in net trading income from derivatives and a Ps 39.1 billion increase in income from investment securities at fair value through profit or loss.
Total income from investment securities
Grupo Aval’s securities portfolio is classified in the following categories: (i) equity and fixed income investments at FVTPL (described in this section as net trading income in investment securities at FVTPL), (ii) fixed income investments at FVOCI and (iii) fixed income investments at amortized cost or “AC” (results from (ii) and (iii) are included in net interest income as interest income on investments in debt securities). Grupo Aval manages its investment portfolio in a comprehensive and integral manner that considers individual return of each one of these three categories and the total return of the investment securities portfolio.
Total income from investment securities for Grupo Aval (comprised of interest income on investments in debt securities and net trading income from investment securities at FVTPL) was Ps 1,873.3 billion for 2022, 81.1% or Ps 838.9 billion more than in 2021. This was primarily driven by 203 basis points increase in the average yield on total investment securities to 4.6% in 2022 up from 2.6% in 2021, generating a Ps 803.5 billion increase in interest income. In addition, a 1.9% or Ps 765.5 billion increase in the average balance of total investment securities to Ps 40,436.1 billion in 2022 resulted in a Ps 35.5 billion increase in interest income. The main drivers for this performance were discussed above in net interest income and net trading income.
Net income from other financial instruments mandatorily at FVTPL
Net income from financial instruments mandatorily at FVTPL reflect the fair value of concession arrangements entered between Promigas and the Colombian Government and increased by Ps 8.7 billion to Ps 278.8 billion in 2022 as compared to 2021.
Other income
Year ended December 31, |
| Change, 2022 vs. 2021 | ||||||
| 2022 |
| 2021 |
| # |
| % | |
(in Ps billions) | ||||||||
Foreign exchange gains (losses), net |
| (1,825.7) |
| (491.4) | (1,334.3) |
| 271.5 | |
Share of profit of equity accounted investees, net of tax (Equity method) |
| 372.8 |
| 300.2 | 72.6 |
| 24.2 | |
Net gain (loss) on sale of debt and equity securities |
| (134.7) |
| 83.6 | (218.3) |
| (261.0) | |
Dividends |
| 119.9 |
| 154.0 | (34.1) |
| (22.1) | |
Gain (loss) on the sale of non-current assets held for sale |
| 10.5 |
| 13.6 | (3.1) |
| (23.1) | |
Gain on sale of property, plant and equipment | 142.1 | 20.7 | 121.5 |
| 588.4 | |||
Net gain (loss) in asset valuation |
| 50.5 |
| 21.0 | 29.5 |
| 140.6 | |
Gain on loss of control of subsidiaries | 137.4 | — | 137.4 | N.A. | ||||
Other |
| 278.7 |
| 288.0 | (9.4) |
| (3.3) | |
Other income |
| (848.6) |
| 389.7 | (1,238.3) |
| (317.8) | |
Other income decreased Ps 1,238.3 billion, explained by a Ps 1,334.3 billion decrease in foreign exchange gains (losses), net to a Ps 1,825.7 billion net loss was partially offset by the Ps 732.7 billion increase in net trading income from derivatives mentioned before. The net result of both activities (foreign exchange and derivatives) for 2022 was a Ps 295.9 billion loss, Ps 601.6 billion lower than in 2021. In 2022,
104
Colombian Peso depreciation implicit in derivatives contracts increased considerably driven by the temporary expansion in the interest rate differential between Colombia and U.S.A., leading to a higher cost of hedging strategies when compared to 2021.
This situation explains the performance of our non-financial subsidiaries, particularly in infrastructure, that enter into derivatives contracts to hedge U.S.$ denominated financial assets and liabilities. The net result of both activities (foreign exchange and derivatives) for our non-financial subsidiaries for 2022 was a Ps 587.5 billion loss compared to a Ps 76.4 billion loss in 2021 (this is associated with income under “Gross profit from sales of goods and services”). Finally, prior to the spin-off of BHI, Banco de Bogotá hedged a net asset (long) dollar position through hedge accounting with effect in OCI. Following the spin-off, the bank was left with a net liability (short) dollar position and started hedging it through the Statement of income.
The Ps 218.3 billion decrease in net gain on sale of debt and equity securities to a Ps 134.7 billion loss in 2022 was explained by the realization of losses of certain debt investment securities classified at FVOCI that were reinvested at higher yields, which will have a positive effect on interest income on investments in debt securities going forward. The Ps 34.1 billion decrease in dividends was mainly driven by a Ps 45.2 billion extraordinary dividend declared in September 2021 by Grupo Energía de Bogotá (GEB).
Grupo Aval, through Banco de Bogotá, Banco Popular and Banco AV Villas, optimized its PP&E structure by transferring some non-strategic property, plant and equipment in exchange for equity in NEXUS Real Estate Capital Funds (a private equity fund specialized in real estate management). The transaction resulted in 2022 in income recognized through gain sale of property, plant and equipment (as their fair value was higher than their book value at the time of transfer) and net gain (loss) in asset valuation (as the update in their fair value was favorable at the time of transfer). The Ps 137.4 billion gain on loss of control of subsidiaries correspond to the valuation upon recognition as an investment in associate of Banco de Bogotá’s 25% equity interest in BHI.
The Ps 72.6 billion increase in share of profit of equity accounted investees, net of tax (equity method) was driven by (i) a Ps 36.6 billion increase in Cálidda, (ii) a Ps 12.8 billion increase in Aerocali (airport concession in Cali held through Corficolombiana) as passenger volume continued to recover from the negative impact of travel restrictions in place throughout 2020 and part of 2021, (iii) a Ps 8.0 billion increase from ACH due to increased volumes of automated clearinghouse transactions, and (iv) a Ps 7.0 billion increase in equity method from Credibanco and Redeban Multicolor (payment processing associates) as merchant acquiring volumes presented strong dynamics throughout the year.
Other expenses
| Year ended December 31, |
| Change, 2022 vs. 2021 | |||||
| 2022 |
| 2021 |
| # |
| % | |
(in Ps billions) | ||||||||
Losses from sales of noncurrent assets held for sale | (0.8) |
| (2.9) | 2.1 |
| (72.7) | ||
Personnel expenses | (2,833.8) |
| (2,634.2) | (199.6) |
| 7.6 | ||
Administrative and other expenses | (3,703.6) |
| (3,209.6) | (494.0) |
| 15.4 | ||
Depreciation and amortization | (645.7) |
| (606.9) | (38.9) |
| 6.4 | ||
Impairment loss on other assets | (20.8) |
| (70.0) | 49.2 |
| (70.3) | ||
Other | (205.1) |
| (266.5) | 61.5 |
| (23.1) | ||
Other expenses | (7,409.8) |
| (6,790.1) | (619.7) |
| 9.1 | ||
In 2022, we continued with our initiatives of cost containment. Other expenses increased 9.1% or Ps 619.7 billion, well below the end of period inflation of 13.1%. The 28.4% or Ps 192.5 billion increase in operating taxes in 2022 amounted to 2.8 percentage points of overall other expense growth and 6.0 percentage points of growth in administrative and other expenses. This is primarily explained by the increase in industry and commerce tax or ICA (charged at a department and municipal level), which is charged on a gross income basis and increased in line with income growth (driven by interest income on gross loans). Insurance expenses increased 8.6% or Ps 36.2 billion, driven by the insurance deposit paid in Colombia and in line with growth of average deposits for 2022. Service expenses such as staffing, utilities, travel and transportation expenses, and supplies and stationery, among others increased 8.0% or Ps 33.7 billion, below observed inflation.
The increase in personnel expenses resulted from an 8.6% or Ps 215.6 billion increase in salaries and employee benefits and an 11.5% or Ps 16.0 billion decrease in labor severances and bonus plan payments. For reference, the minimum wage in Colombia increased by 10.0% in 2022 as compared to 2021.
The Ps 49.2 billion decrease in impairment loss on other assets was driven by a Ps 56.8 billion provision recognized by Corficolombiana on its investment in Covipacífico in 2021 due to excess costs expected to be incurred on the Pacífico 1 project. The Ps 61.5 billion decrease in other is mainly explained by a Ps 74.8 billion decrease in provision expenses related to emerging costs of legal proceedings arising from individual civil lawsuits originated from mandatory pension fund clients in Porvenir seeking to be transferred to Colpensiones.
105
Given that Grupo Aval’s other expenses increased by 9.1% and its total income before net impairment losses on financial assets (defined as the sum of net interest income, net income from commissions and fees, gross profit (loss) from sales of goods and services, net trading income, net income from other financial instruments mandatorily at fair value through profit or loss “FVTPL” and other income) increased by 1.9%, the cost to income efficiency ratio was 45.8% in 2022 as compared to 42.8% in 2021. The ratio of other expenses as a percentage of average assets (not including assets previously held through BHI) improved to 2.7% in 2022, down from 2.8% in 2021.
Tax expense
Income tax expense for Grupo Aval decreased by 2.2% or Ps 52.0 billion, to Ps 2,271.4 billion in 2022, driven by a 1.4% or Ps 90.2 billion decrease in income before tax expense. Grupo Aval’s effective tax rate, calculated as income tax expense divided by income before income tax expense excluding dividends, equity method and gain on loss of control of subsidiaries (as they are non-taxable income), was 40.2% in 2022 and 39.3% in 2021. For more information on income tax expense please refer to Note 19 of our audited consolidated financial statements.
Net income from discontinued operations
Net income from discontinued operations decreased Ps 761.1 billion, to Ps 866.2 billion in 2022 compared with 2021. Net income from discontinued operations in 2022 includes a Ps 69.6 billion gain related to the BHI transactions (spin-off and sale) including (i) a Ps 1,052.6 billion gain related to the spin-off of 75.0% of equity interest of BHI in March and (ii) a Ps 983.0 billion loss on the sale of a 20.9% equity interest of BHI in December. In addition, in 2022 Grupo Aval through Banco de Bogotá recognized Ps 796.6 billion of BHI’s net income during the time it was a subsidiary (January – March) and afterwards, during the time it was accounted for as an investment in associate through the equity method (April – November). Net income from discontinued operations in 2021 reflects the consolidation of 100.0% of BHI’s net income as it was a consolidated subsidiary, while in 2022 it reflects 100.0% of BHI’s net income through March and a 25% equity interest reflecting Banco de Bogotá’s remaining interest using the equity method after the spin-off through November, as an additional stake was sold in the tender offer as described above.
The attributable portion of net income from discontinued operations reflects Grupo Aval’s equity interest in Banco de Bogotá. As a result, net income from discontinued operations attributable to owners of the parent was Ps 594.0 billion, 46.9% or Ps 524.6 billion lower than in 2021.
Net income attributable to non-controlling interest
Net income attributable to non-controlling interest increased 0.65%, or Ps 15.5 billion, to Ps 2,386.2 billion in 2022 compared to 2021. The ratio of net income attributable to non-controlling interest to net income increased to 49.0% in 2022 from 41.8% in 2021. The increase in this ratio is mainly attributable to (i) a 35.2% increase in Corficolombiana’s attributable net income, of which 59.5% is attributable to non-controlling interest (see Note 26 of our audited consolidated financial statements) and (ii) a 73.4% decrease in Porvenir’s attributable net income, of which 24.2% is non-controlling interest. Net income from discontinued operations attributable to non-controlling interest was Ps 272.2 billion, 46.5% or Ps 236.6 billion lower than in 2021.
106
Management Discussion and Analysis of Operating Segments
In the following section we will refer to the consolidated results of our main operating segments. Overall, the principal drivers for our operating segments are the same as those discussed under Grupo Aval’s Management Discussion and Analysis. As such, the following section will focus on the drivers affecting each of our operating segments rather than revisiting the general discussion.
In March 2022, Banco de Bogotá executed a spin-off of a 75% equity stake in BHI to its shareholders and Grupo Aval subsequently spun-off its equity interest to its shareholders. We retained an indirect stake of approximately 17.2% in BHI (representing our proportional interest in the 25% equity stake in BHI retained by Banco de Bogotá). Accordingly, starting in March 2022 lost control of BHI and ceased to consolidate it and its subsidiaries. The remaining 25% equity interest was accounted as an investment in associate at fair value upon recognition and through the equity method subsequently. In December 2022, Banco de Bogotá sold a 20.89% equity interest in BHI and retained a 4.11%, which was recognized as an equity investment at fair value with changes in OCI (FVOCI).
Banco de Bogotá’s operating segment figures previously reported for 2021 have been modified to reflect the discontinued operations arising from the aforementioned transactions. As a result, the Banco de Bogotá segment was modified reclassify the “Participation in results of subsidiaries” included in “Other income” to “Net income from discontinued operations”.
The presentation format in the following tables follows the structure of the consolidated Statement of income in our audited consolidated financial statements and may differ from the presentation of our operating segments in Note 31 of our audited consolidated financial statements in that the following tables aggregate intersegment and external income.
Net income attributable presented in the following section refers to net income attributable to the owners of each of the subsidiaries presented herein. Grupo Aval’s ownership in each subsidiary is described in “Item 4. Information on the company—C. Organizational structure”.
107
Banco de Bogotá
Overview
Banco de Bogotá’s net income attributable to owners of the parent for the year ended December 31, 2022 was Ps 2,804.9 billion, decreasing 35.6% or Ps 1,551.2 billion compared to the year ended December 31, 2021, driven by the Ps 1,165.6 billion decrease in gain on loss of control of subsidiaries (recorded in other income) and a Ps 626.3 billion decrease in net income from discontinued operations, related to the spin-off of a 75% equity stake in BHI on March 2022 and the sale of an additional 20.9% of equity stake in BHI on December 2022, as described further below. Net income attributable to owners of the parent excluding these effects grew 16.9% or Ps 240.7 billion. The following discussion describes the main drivers of Banco de Bogotá’s results of operations for the year ended December 31, 2022 compared to the year ended December 31, 2021.
Banco de Bogotá | ||||||||
For the year ended |
| Change 2022 vs | ||||||
December 31, |
| 2021 | ||||||
| 2022 |
| 2021 |
| # |
| % | |
(in Ps billions) | ||||||||
Total interest income |
| 9,293.0 |
| 6,170.5 |
| 3,122.5 |
| 50.6 |
Total interest expense |
| (4,597.8) |
| (2,122.2) |
| (2,475.6) |
| 116.7 |
Net interest income |
| 4,695.2 |
| 4,048.3 |
| 646.9 |
| 16.0 |
Impairment loss on loans and other accounts receivable |
| (1,691.7) |
| (1,899.3) |
| 207.6 |
| (10.9) |
Impairment (loss) recovery on other financial assets |
| 1.5 |
| 0.1 |
| 1.4 |
| 1,429.7 |
Recovery of charged-off financial assets |
| 327.8 |
| 219.6 |
| 108.2 |
| 49.2 |
Net impairment loss on financial assets |
| (1,362.4) |
| (1,679.6) |
| 317.2 |
| (18.9) |
Net interest income, after impairment losses | 3,332.8 | 2,368.8 | 964.1 |
| 40.7 | |||
Net income from commissions and fees |
| 1,238.1 |
| 1,098.8 |
| 139.3 |
| 12.7 |
Gross loss from sales of goods and services | (135.7) | (126.7) | (9.0) |
| 7.1 | |||
Net trading income |
| 1,179.8 |
| 538.6 |
| 641.2 |
| 119.1 |
Other income |
| (407.9) |
| 1,863.4 |
| (2,271.4) |
| (121.9) |
Other expenses |
| (3,111.4) |
| (2,756.5) |
| (355.0) |
| 12.9 |
Net income before tax expense |
| 2,095.7 |
| 2,986.4 |
| (890.7) |
| (29.8) |
Income tax expense |
| (290.2) |
| (252.6) |
| (37.6) |
| 14.9 |
Net income for the year from continuing operations |
| 1,805.5 |
| 2,733.8 |
| (928.3) |
| (34.0) |
Net income for the year from discontinued operations | 1,000.8 |
| 1,627.3 | (626.5) |
| (38.5) | ||
Net income for the year | 2,806.3 | 4,361.1 | (1,554.8) |
| (35.7) | |||
Net income for the year attributable to: |
|
|
|
|
|
| ||
From continuing operations | 1,804.1 | 2,729.0 | (924.9) |
| (33.9) | |||
From discontinued operations | 1,000.8 | 1,627.1 | (626.3) |
| (38.5) | |||
Owners of the parent |
| 2,804.9 |
| 4,356.1 |
| (1,551.2) |
| (35.6) |
From continuing operations | 1.4 | 4.8 | (3.4) |
| (71.3) | |||
From discontinued operations | — | 0.2 | (0.2) |
| (100.0) | |||
Non-controlling interest |
| 1.4 |
| 5.0 |
| (3.6) |
| (72.3) |
Net income for the year |
| 2,806.3 |
| 4,361.1 |
| (1,554.8) |
| (35.7) |
Net interest income
Net interest income increased 16.0% or Ps 646.9 billion to Ps 4,695.2 billion in 2022. Total interest income performance was driven by a 240 basis points increase in the average yield of interest-earning assets and a 10.8% or Ps 9,944.0 billion increase in the average balance of interest-earning assets. Total interest expense increased 116.7% or Ps 2,475.6 billion, less than total interest income, resulting from a 234 basis points increase in the average interest rate paid on interest-bearing funding. The average balance of interest-bearing funding increased 7.1% or Ps 6,546.6 billion. Yields and rates paid increased rapidly due to monetary policy in place throughout the year, a tighter liquidity environment and due to additional pressures coming from more demanding NSFR requirements, which drove the increase in the cost of interest-bearing deposits. The interest spread between the average yield on gross loans and the average rate paid on interest-bearing deposits decreased by 39 basis points to 4.9%. On the other hand, net interest margin expanded by 21 basis points to 4.6%, given that the increase in the average rate paid on interest-bearing liabilities was lower than the 285 basis points increase in the average rate paid on interest-bearing deposits. The main drivers impacting interest-earning assets and interest-bearing funding during 2022, are as described under Grupo Aval’s analysis.
108
Average balance of interest-earning assets | Net interest margin for | Net interest income for the | ||||||||||||||||
for the year ended December 31, | Change, 2022 vs. 2021 | the year ended December 31, | year ended December 31, | Change, 2022 vs. 2021 | ||||||||||||||
2022 |
| 2021 |
| # |
| % |
| 2022 |
| 2021 |
| 2022 |
| 2021 | # |
| % | |
(in Ps billions) | (in Ps billions) | |||||||||||||||||
102,286.5 | 92,342.5 | 9,944.0 | 10.8 | 4.6% |
| 4.4% | 4,695.2 | 4,048.3 | 646.9 | 16.0 | ||||||||
The following tables show: (i) the average balance, average yield and interest income on interest-earning assets with an analysis of impacts derived from changes in the average balance and the average yield, per type of interest-earning asset; interbank and overnight funds are shown separate from gross loans due to their characteristics and short-term nature and (ii) the average balance, average rate paid and interest expense on interest-bearing funding with an analysis of impacts derived from changes in the average balance and the average rate, per type of interest-bearing funding.
(i) | Average balance for the | Average yield for the | Interest income for the | Impact on interest income | Change, 2022 | |||||||||||||||||||
year ended December 31, | Change, 2022 vs. 2021 | year ended December 31, | year ended December 31, | due to changes in | vs. 2021 | |||||||||||||||||||
| 2022 |
| 2021 |
| # |
| % |
| 2022 |
| 2021 |
| 2022 |
| 2021 |
| Balance |
| Yield | Total |
| % | ||
(in Ps billions) | (in Ps billions) | (in Ps billions) | ||||||||||||||||||||||
Commercial |
| 58,088.5 |
| 53,938.2 |
| 4,150.2 |
| 7.7 |
| 8.5% |
| 5.2% |
| 4,919.9 |
| 2,807.5 |
| 351.5 |
| 1,760.9 | 2,112.4 |
| 75.2 | |
Consumer |
| 19,818.3 |
| 17,505.0 |
| 2,313.3 |
| 13.2 |
| 13.9% |
| 13.2% |
| 2,760.7 |
| 2,305.6 |
| 322.2 |
| 132.9 | 455.1 |
| 19.7 | |
Mortgages |
| 9,960.1 |
| 7,884.4 |
| 2,075.7 |
| 26.3 |
| 8.0% |
| 7.2% |
| 794.1 |
| 565.8 |
| 165.5 |
| 62.8 | 228.3 |
| 40.4 | |
Microcredit |
| 281.5 |
| 338.2 |
| (56.7) |
| (16.8) |
| 22.9% |
| 22.9% |
| 64.3 |
| 77.6 |
| (13.0) |
| (0.3) | (13.3) |
| (17.1) | |
Gross loans |
| 88,148.4 |
| 79,665.9 |
| 8,482.5 |
| 10.6 |
| 9.7% |
| 7.2% |
| 8,539.0 |
| 5,756.5 |
| 821.7 |
| 1,960.8 | 2,782.6 |
| 48.3 | |
Interbank and overnight funds | 1,163.1 |
| 345.9 |
| 817.3 |
| 236.3 |
| 18.3% |
| 18.0% |
| 212.4 |
| 62.4 |
| 149.2 |
| 0.8 | 150.0 |
| 240.4 | ||
Total gross loans | 89,311.5 |
| 80,011.8 |
| 9,299.8 |
| 11.6 |
| 9.8% |
| 7.3% |
| 8,751.4 |
| 5,818.9 |
| 911.3 |
| 2,021.3 | 2,932.5 |
| 50.4 | ||
Investments in debt securities | 12,974.9 |
| 12,330.7 |
| 644.2 |
| 5.2 |
| 4.2% |
| 2.9% |
| 541.6 |
| 351.6 |
| 26.9 |
| 163.0 | 189.9 |
| 54.0 | ||
Total interest-earning assets |
| 102,286.5 |
| 92,342.5 |
| 9,944.0 |
| 10.8 |
| 9.1% |
| 6.7% |
| 9,293.0 |
| 6,170.5 |
| 903.4 |
| 2,219.0 | 3,122.5 |
| 50.6 | |
(ii) | Average balance for the | Average rate paid for the | Interest expense for the | Impact on interest expense | Change, 2022 | |||||||||||||||||||
year ended December 31, | Change, 2022 vs. 2021 | year ended December 31, | year ended December 31, | due to changes in | vs. 2021 | |||||||||||||||||||
| 2022 |
| 2021 |
| # |
| % |
| 2022 |
| 2021 |
| 2022 |
| 2021 | Balance |
| Rate | Total | % | ||||
(in Ps billions) | (in Ps billions) | (in Ps billions) | ||||||||||||||||||||||
Checking accounts |
| 6,180.0 |
| 7,521.6 |
| (1,341.6) |
| (17.8) |
| 2.4% |
| 0.7% |
| (145.8) |
| (54.7) | 31.7 |
| (122.8) | (91.1) | 166.6 | |||
Time deposits |
| 34,114.8 |
| 30,910.6 |
| 3,204.1 |
| 10.4 |
| 5.4% |
| 2.8% |
| (1,858.2) |
| (879.6) | (174.5) |
| (804.1) | (978.6) | 111.3 | |||
Savings accounts |
| 30,917.4 |
| 30,324.5 |
| 592.9 |
| 2.0 |
| 4.5% |
| 1.2% |
| (1,382.7) |
| (376.8) | (26.5) |
| (979.4) | (1,005.9) | 267.0 | |||
Total interest-bearing deposits |
| 71,212.2 |
| 68,756.7 |
| 2,455.5 |
| 3.6 |
| 4.8% |
| 1.9% |
| (3,386.7) |
| (1,311.1) | (116.8) |
| (1,958.9) | (2,075.6) | 158.3 | |||
Interbank borrowings and overnight funds | 2,183.4 | 3,116.0 | (932.6) |
| (29.9) |
| 7.8% |
| 2.1% |
| (171.0) |
| (65.1) | 73.1 |
| (179.0) | (105.9) | 162.6 | ||||||
Borrowings from banks and others | 12,458.6 | 8,070.8 | 4,387.8 |
| 54.4 |
| 2.1% |
| 1.5% |
| (258.3) |
| (123.3) | (91.0) |
| (44.1) | (135.0) | 109.5 | ||||||
Bonds issued | 11,368.5 | 10,591.3 | 777.1 |
| 7.3 |
| 5.6% |
| 5.3% |
| (633.9) |
| (565.0) | (43.3) |
| (25.6) | (68.9) | 12.2 | ||||||
Borrowings from development entities | 1,966.3 | 2,107.5 | (141.2) |
| (6.7) |
| 7.5% |
| 2.7% |
| (147.8) |
| (57.7) | 10.6 |
| (100.7) | (90.1) | 156.1 | ||||||
Other funding | 27,976.8 | 23,885.6 | 4,091.2 |
| 17.1 |
| 4.3% |
| 3.4% |
| (1,211.0) |
| (811.1) | (177.1) |
| (222.9) | (399.9) | 49.3 | ||||||
Total interest-bearing liabilities | 99,189.0 | 92,642.3 | 6,546.6 |
| 7.1 |
| 4.6% |
| 2.3% |
| (4,597.8) | (2,122.2) | (303.5) |
| (2,172.1) | (2,475.6) | 116.7 | |||||||
Banco de Bogotá’s average balance of gross loans increased 10.6% or Ps 8,482.5 billion in 2022 and the average yield was 9.7%, 246 basis points higher than in 2021. Growth of average balances was lower than that of closing balances (17.3%), partly explained by (i) stronger underwriting as the year progressed, particularly in commercial loans for which growth of closing balances was 15.2% compared to a 7.7% growth of average balances and (ii) the difference between a 20.8% year-on-year and a 13.6% average peso depreciation versus the U.S. dollar on foreign currency denominated loans (28.0% of total gross loans).
Given that 88.0% of Banco de Bogotá’s commercial loans are variable rate mostly referenced either to the 3-month inter-bank rate (IBR) or the 90-day time deposit rate (DTF), average yields on commercial loans increased 326 basis points to 8.5%, below the 528 basis points increase in the average Central Bank rate to 7.2% in 2022 from 1.9% in 2021. On the other hand, given that 81.4% of Banco de Bogotá’s consumer loans are fixed rate, the average yields on consumer loans only priced in during 2022 a small portion of the rise in reference rates, and increased 76 basis points.
The average balance of interest-earning investments in debt securities increased 5.2% or Ps 644.2 billion. The average yield for interest-earning investments in debt securities increased 132 basis points as Banco de Bogotá invested in securities at higher yields as the Colombian sovereign yield curve (TES) shifted upwards, following global sovereign fixed income rates and underpinned by the increase in Colombia’s sovereign risk premium.
Finally, as described in Grupo Aval’s analysis, average funding rates moved upwards in line with the average Central Bank rate. In addition, cost of funds was pressed by competition for stable retail funding and term funding with tenors longer than one year in order to comply with the more demanding NSFR requirements. Pressures on balances and rates built up during the latter part of the year to comply with NSFR
109
requirements. The end of period balance of interest-bearing liabilities increased 16.7% or Ps 15,352.1 billion, driven by a 33.5% or Ps 9,794.5 billion increase in time deposits, a 50.6% or Ps 5,255.0 billion increase in borrowings from banks and others and a 3.6% or Ps 1,129.3 billion increase in savings accounts. The fast-paced growth of time deposits drove the 260 basis points increase in the average rate paid for time deposits, partially pricing in the increase in the average Central Bank rate.
Net impairment loss on financial assets
Year ended December 31, | Change, 2022 vs. 2021 | |||||||
| 2022 |
| 2021 |
| # |
| % | |
(in Ps billions) | ||||||||
Impairment loss on loans and other accounts receivable |
| (1,691.7) |
| (1,899.3) |
| 207.6 |
| (10.9) |
Impairment (loss) recovery on other financial assets |
| 1.5 |
| 0.1 |
| 1.4 |
| 1,429.7 |
Recovery of charged-off financial assets |
| 327.8 |
| 219.6 |
| 108.2 |
| 49.2 |
Net impairment loss on financial assets |
| (1,362.4) |
| (1,679.6) |
| 317.2 |
| (18.9) |
Banco de Bogotá’s impairment loss on loans and other accounts receivable decreased 10.9% or Ps 207.6 billion to Ps 1,691.7 billion, driven by the improvement of the loan portfolio’s ECL, explained by (i) favorable performance of clients that had been granted reliefs during 2020 and (ii) the economic recovery and its effect on borrowers’ credit risk. For more information regarding risk management please see “Item 11. Quantitative and Qualitative Disclosures About Market Risk”.
In addition, recovery of charged-off financial assets increased 49.2% or Ps 108.2 billion to Ps 327.8 billion, due to the drivers discussed under Grupo Aval’s analysis.
The following table provides detail by category of impairment loss on loans and other accounts receivable, cost of risk and cost of risk, net. For more information on the calculation methodology please refer to “Item 3. Key Information—A. Selected Financial Data”.
Impairment loss on loans and other accounts receivable | Cost of risk for the | Change, | Cost of risk, net for the | Change, | ||||||||||||||||
Year ended December 31, | Change, 2022 vs. 2021 | year ended December 31, | 2022 vs. 2021 | year ended December 31, | 2022 vs. 2021 | |||||||||||||||
2022 | 2021 | # | % | 2022 | 2021 | basis points | 2022 | 2021 | basis points | |||||||||||
(in Ps billions) | ||||||||||||||||||||
Commercial | (221.1) | (687.8) | 466.7 | (67.9) | 0.4% | 1.3% | (89) | 0.3% | 1.2% | (91) | ||||||||||
Consumer | (1,480.4) | (1,090.2) | (390.2) | 35.8 | 7.5% | 6.2% | 124 | 6.0% | 5.1% | 91 | ||||||||||
Mortgage | 15.6 | (97.6) | 113.3 | (116.0) | (0.2)% | 1.2% | (140) | (0.2)% | 1.2% | (139) | ||||||||||
Microcredit | (5.6) | (17.7) | 12.1 | (68.6) | 2.0% | 5.2% | (326) | (3.5)% | 3.0% | (649) | ||||||||||
Gross loans | (1,691.4) | (1,893.3) | 201.9 | (10.7) | 1.9% | 2.4% | (46) | 1.5% | 2.1% | (55) | ||||||||||
Interbank and overnight funds | 0.5 | 0.2 | 0.4 | 241.3 | N.A. | N.A. | N.A. | N.A. | N.A. | N.A. | ||||||||||
Total gross loans | (1,690.9) | (1,893.2) | 202.3 | (10.7) | N.A. | N.A. | N.A. | N.A. | N.A. | N.A. | ||||||||||
Other accounts receivable | (0.8) | (6.2) | 5.3 | (86.8) | N.A. | N.A. | N.A. | N.A. | N.A. | N.A. | ||||||||||
Impairment loss on loans and other accounts receivable | (1,691.7) | (1,899.3) | 207.6 | (10.9) | 1.9% | 2.4% | (46) | 1.5% | 2.1% | (56) | ||||||||||
Banco de Bogotá’s cost of risk, net decreased to 1.5% driven by the decrease in cost of risk of commercial loans and mortgages that was partially offset by an increase in the cost of risk of consumer loans. A Ps 564.1 billion decrease in impairment loss for Stage 3 loans explained the improvement, for which Ps 365.6 billion were consumer loans and Ps 142.0 billion were commercial loans. Partially offsetting this improvement was a Ps 217.2 billion increase in impairment losses for Stage 2 loans, explained by a Ps 623.1 billion increase in consumer loans that was somewhat compensated by a Ps 377.9 billion decrease in commercial loans and a Ps 53.7 billion decrease in mortgages.
The increase in impairment losses for consumer loans was driven by some deterioration in the asset quality of credit cards and personal loans, which have higher PDs than other secured products such as payroll loans and automobile loans and leases. The decrease in impairment losses for commercial loans and mortgages was driven by the reversal of impairment losses booked as overlays or for customers relieved during the pandemic, as borrower’s payment behavior recovered throughout the year. Finally, a Ps 145.0 billion increase in impairment losses for Stage 1 loans was mostly explained by organic growth of the loan portfolio.
110
The following table shows Banco de Bogotá’s gross loan classification by Stages in accordance with IFRS 9 (interbank and overnight funds are not included as they tend to be mostly Stage 1 and with low loss allowance due to their characteristics and short-term nature).
At December 31, | Change, 2022 vs. 2021 | |||||||||||||||||||||||
|---|---|---|---|---|---|---|---|---|---|---|---|---|---|---|---|---|---|---|---|---|---|---|---|---|
2022 | 2021 | Gross | ||||||||||||||||||||||
| Stage 1 |
| Stage 2 |
| Stage 3 |
| Gross loans |
| Stage 1 |
| Stage 2 |
| Stage 3 |
| Gross loans |
| Stage 1 |
| Stage 2 |
| Stage 3 |
| loans | |
(in Ps billions) | % | |||||||||||||||||||||||
Commercial |
| 52,510.5 | 3,764.6 | 6,250.7 |
| 62,525.8 |
| 43,872.9 | 5,002.1 | 5,414.6 |
| 54,289.6 | 19.7 | (24.7) | 15.4 | 15.2 | ||||||||
Consumer |
| 18,040.3 | 3,110.4 | 596.8 |
| 21,747.4 |
| 14,890.0 | 2,963.8 | 693.4 |
| 18,547.3 | 21.2 | 4.9 | (13.9) | 17.3 | ||||||||
Mortgages |
| 10,323.9 | 953.0 | 262.5 | 11,539.3 | 6,743.1 | 1,803.1 | 204.4 | 8,750.6 | 53.1 | (47.2) | 28.4 | 31.9 | |||||||||||
Microcredit |
| 222.8 | 14.0 | 28.5 |
| 265.3 |
| 184.7 | 43.2 | 86.4 |
| 314.4 | 20.6 | (67.6) | (67.0) | (15.6) | ||||||||
Gross loans | 81,097.5 | 7,842.0 | 7,138.4 | 96,078.0 | 65,690.8 | 9,812.3 | 6,398.8 | 81,901.8 | 23.5 | (20.1) | 11.6 | 17.3 | ||||||||||||
| ||||||||||||||||||||||||
Commercial |
| 84.0% |
| 6.0% |
| 10.0% |
| 100.0% |
| 80.8% |
| 9.2% |
| 10.0% |
| 100.0% | ||||||||
Consumer |
| 83.0% |
| 14.3% |
| 2.7% |
| 100.0% |
| 80.3% |
| 16.0% |
| 3.7% |
| 100.0% | ||||||||
Mortgages |
| 89.5% | 8.3% | 2.3% | 100.0% | 77.1% | 20.6% | 2.3% | 100.0% | |||||||||||||||
Microcredit |
| 84.0% |
| 5.3% |
| 10.7% |
| 100.0% |
| 58.8% |
| 13.8% |
| 27.5% |
| 100.0% | ||||||||
Gross loans | 84.4% | 8.2% | 7.4% | 100.0% | 80.2% | 12.0% | 7.8% | 100.0% | ||||||||||||||||
The quality of Banco de Bogotá’s gross loan portfolio measured both by the composition of stages and loans past due improved significantly in 2022 across all loan categories. At December 31, 2022, the balance of Stage 2 loans had decreased 20.1% or Ps 1,970.3 billion to Ps 7,842.0 billion. In commercial, Stage 2 loans decreased Ps 1,237.5 billion to Ps 3,764.6 billion, due to the drivers mentioned above. Net payment/origination of obligations classified as Stage 2 had a favorable evolution leading to a net reduction of Ps 1,259.3 billion and net transfers to Stage 2 from and to Stage 1 or Stage 3 amounted to a Ps 226.4 billion decrease. On the other hand, and in line with the depreciation of the Colombian Peso, the balance of Banco de Bogotá’s Stage 2 foreign currency denominated commercial loans increased Ps 249.8 billion. In consumer, Stage 2 loans increased Ps 146.6 billion to Ps 3,110.4 billion driven by an increase in credit cards (Ps 401.8 billion increase) and to a lesser extent in personal loans (Ps 107.2 billion increase), that were partially offset by a decrease in automobile loans and leases (Ps 360.8 billion decrease). Finally, in mortgages, overlays put in place during the pandemic were removed and explained the majority of the Ps 850.2 billion decrease in Stage 2 loans due to net transfers from and to Stage 1.
For further detail on credit risk model overlays and transitioning between stages, please refer to Grupo Aval’s analysis. For more information on loss allowance calculations and a description of PD risk categories under IFRS 9, please refer to Note 4.1 of our audited consolidated financial statements.
111
The following table shows the balance of loans at least 91 days past due, delinquency ratios, charge-offs and charge-offs as a percentage of average gross loans for Banco de Bogotá (interbank and overnight funds are not included as they tend not to be past due or charged-off due to their characteristics and short-term nature).
Loans at least 91 days past due | Delinquency ratio (1) | Change, | ||||||||||||
At December 31, | Change, 2022 vs. 2021 | at December 31, | 2022 vs. 2021 | |||||||||||
2022 | 2021 | # | % | 2022 | 2021 | basis points | ||||||||
| (in Ps billions) |
|
|
|
|
| ||||||||
Commercial | 2,448.8 | 2,147.2 | 301.5 | 14.0 | 3.9% | 4.0% | (4) | |||||||
Consumer | 588.2 | 688.6 | (100.3) | (14.6) | 2.7% | 3.7% | (101) | |||||||
Mortgages |
| 314.0 | 254.1 | 59.9 | 23.6 | 2.7% | 2.9% | (18) | ||||||
Microcredit |
| 28.5 | 86.4 | (57.9) | (67.0) | 10.7% | 27.5% | (1,675) | ||||||
Gross loans |
| 3,379.5 | 3,176.3 | 203.2 | 6.4 | 3.5% | 3.9% | (36) | ||||||
Charge-offs | Charge-offs as a percentage | Change, | ||||||||||||
At December 31, | Change, 2022 vs. 2021 | of average gross loans | 2022 vs. 2021 | |||||||||||
2022 | 2021 | # | % | 2022 | 2021 | basis points | ||||||||
| (in Ps billions) | |||||||||||||
Commercial | 257.3 | 550.2 | (292.8) | (53.2) | 0.4% | 1.0% | (58) | |||||||
Consumer | 1,416.4 | 1,528.8 | (112.5) | (7.4) | 7.1% | 8.7% | (159) | |||||||
Mortgages |
| 34.0 | 23.4 | 10.7 | 45.7 | 0.3% | 0.3% | 5 | ||||||
Microcredit |
| 80.6 | 49.4 | 31.2 | 63.2 | 28.6% | 14.6% | 1,403 | ||||||
Total charge-offs |
| 1,788.3 | 2,151.8 | (363.5) | (16.9) | 2.0% | 2.7% | (67) | ||||||
(1) Calculated as loans past due more than 90 days divided by gross loans.
Delinquency coverage ratio for gross loans, measured as loss allowance divided by past due gross loans more than 90 days was 156.6% in 2022 and 159.3% in 2021. Charge-offs as a percentage of average gross loans decreased explained by a relatively high level in 2021 due to the charge-offs of delinquent clients that were granted reliefs during the pandemic.
Net income from commissions and fees
| Year ended December 31, |
| Change, 2022 vs. 2021 | |||||
2022 |
| 2021 |
| # |
| % | ||
(in Ps billions) | ||||||||
Banking fees |
| 1,382.5 |
| 1,154.5 |
| 227.9 |
| 19.7 |
Bonded warehouse services |
| 122.9 |
| 113.7 |
| 9.2 |
| 8.1 |
Trust activities and portfolio management services |
| 161.1 |
| 156.2 |
| 5.0 |
| 3.2 |
Income from commissions and fees |
| 1,666.5 |
| 1,424.4 |
| 242.1 |
| 17.0 |
Expenses from commissions and fees |
| (428.4) |
| (325.6) |
| (102.8) |
| 31.6 |
Net income from commissions and fees |
| 1,238.1 |
| 1,098.8 |
| 139.3 |
| 12.7 |
Income from commissions and fees increased 17.0% or Ps 242.1 billion. Banking fees mainly explained this result, with a 19.7% or Ps 227.9 billion increase. The main drivers for this performance were the same as those discussed under Grupo Aval’s analysis. Banking service fees increased 14.7% or Ps 106.5 billion in line with loan growth and debit and credit card fees increased 29.2% or Ps 120.8 billion. This in turn, was driven by a 46.4% or Ps 70.4 billion increase in income from merchant acquiring and a 19.2% or Ps 50.4 billion increase in debit and credit card management fees, supported by higher transactional activity as compared to 2021. Bonded warehouse services increased 8.1% or Ps 9.2 billion and trust activities and portfolio management services increased 3.2% or Ps 5.0 billion. The latter had a sluggish performance explained by the challenging market conditions present throughout 2022 that negatively impacted performance based fees. Expenses from commissions and fees increased 31.6% or Ps 102.8 billion, driven by an increase in transactional activity and fees paid in relation to income from commissions and fees.
Gross loss from sales of goods and services
Year ended December 31, |
| Change, 2022 vs. 2021 | ||||||
| 2022 |
| 2021 |
| # |
| % | |
(in Ps billions) | ||||||||
Income from sales of goods and services |
| 35.7 |
| 34.4 |
| 1.3 |
| 3.9 |
Costs and expenses of sales of goods and services |
| (171.4) |
| (161.1) |
| (10.3) |
| 6.4 |
Gross loss from sales of goods and services |
| (135.7) |
| (126.7) |
| (9.0) |
| 7.1 |
112
Gross loss from sales of goods and services increased by Ps 9.0 billion to a gross loss of Ps 135.7 billion in 2022. This reflects the non-financial results of Almaviva and Megalinea, Banco de Bogotá’s subsidiaries. Income from sales of goods and services increased 3.9% or Ps 1.3 billion to Ps 35.7 billion in 2022. On the other hand, costs and expenses of sales of goods and services showed a 6.4% or Ps 10.3 billion increase to Ps 171.4 billion in 2022. The gross loss from sales of goods and services results from goods and services provided by the bank’s non-financial subsidiaries to Banco de Bogotá and its subsidiaries (which income is eliminated in the consolidation process).
Net trading income
Banco de Bogotá’s net trading income for 2022 was Ps 1,179.8 billion, Ps 641.2 billion higher than the Ps 538.6 billion income in 2021, resulting from a Ps 617.2 billion increase in income from derivatives and a Ps 24.0 billion decrease in net trading income from investment securities. The performance of net trading income from derivatives was offset by a Ps 1,075.0 billion increase in foreign exchange gains (losses), net, recognized under other income.
Total income from investment securities
Banco de Bogotá’s securities portfolio is classified in the following categories: (i) equity and fixed income investments at FVTPL (described in this section as net trading income in investment securities at FVTPL), (ii) fixed income investments at FVOCI and (iii) fixed income investments at AC (results from (ii) and (iii) are included in net interest income as interest income on investments in debt securities). Banco de Bogotá manages its investment portfolio in a comprehensive and integral manner that considers individual return of each one of these three categories and the total return of the investment securities portfolio.
Total income from investment securities for Banco de Bogotá (comprised of interest income on investments in debt securities and net trading income from investment securities at FVTPL) was Ps 503.5 billion for 2022, 73.9% or Ps 213.9 billion more than in 2021, primarily driven by a 142 basis points increase in the average yield on total investment securities to 3.41% in 2022 from 2.00% in 2021, resulting in a Ps 205.6 billion increase in interest income. The main drivers for this performance were discussed above in net interest income.
Other income
| Year ended December 31, |
| Change, 2022 vs. 2021 | |||||
| 2022 |
| 2021 |
| # |
| % | |
(in Ps billions) | ||||||||
Foreign exchange gains (losses), net | (1,507.2) |
| (432.3) | (1,075.0) |
| 248.7 | ||
Share of profit of equity accounted investees, net of tax (Equity method) | 665.3 |
| 711.3 | (46.0) |
| (6.5) | ||
Net gain (loss) on sale of debt and equity securities | 0.7 |
| 50.8 | (50.1) |
| (98.7) | ||
Dividends | 24.8 |
| 12.9 | 11.9 |
| 92.4 | ||
Gain (loss) on the sale of non-current assets held for sale | 4.2 |
| 1.4 | 2.7 |
| 190.0 | ||
Gain on sale of property, plant and equipment | 97.4 | 12.0 | 85.4 |
| 712.4 | |||
Net gain (loss) in asset valuation | 0.4 |
| 6.3 | (5.9) |
| (93.7) | ||
Gain on deconsolidation (loss of control) of subsidiaries | 137.4 | 1,303.0 | (1,165.6) | (89.5) | ||||
Other | 169.2 |
| 198.0 | (28.8) |
| (14.6) | ||
Other income | (407.9) |
| 1,863.4 | (2,271.4) |
| (121.9) | ||
Other income decreased 121.9% or Ps 2,271.4 billion, mainly driven by a Ps 1,165.6 billon decrease in gain on deconsolidation (loss of control) of subsidiaries and a Ps 1,075.0 billion decrease in foreign exchange gains (losses), net. In 2021, the Ps 1,303.0 billion gain on the deconsolidation of Porvenir results from the difference between the bank’s investment in Porvenir’s equity and its fair value at the date in which Banco de Bogotá lost control of Porvenir. In 2022 Ps 137.4 billion correspond to the valuation of Banco de Bogotá’s 25% equity interest in BHI following the spin-off of 75% in March as the bank had to account for the investment in associate at fair value upon recognition.
The Ps 1,075.0 billion decrease in foreign exchange gains (losses), net to a Ps 1,507.2 billion loss should be analyzed in conjunction with net trading income from derivatives. The net result of both activities (foreign exchange and derivatives) for 2022 was a Ps 289.4 billion loss compared to a Ps 168.3 billion gain in 2021. Prior to the spin-off of BHI, Banco de Bogotá hedged a net asset (long) dollar position through hedge accounting with effect in OCI. Following the spin-off, the bank was left with a net liability (short) dollar position and started hedging it through the Statement of income. In 2022, Colombian Peso depreciation implicit in derivatives contracts increased considerably driven by the temporary expansion in the interest rate differential between Colombia and U.S.A., leading to a higher cost of the hedging strategy when compared to 2021.
The Ps 50.1 billion decrease in net gain on sale of debt and equity securities was explained by temporary favorable conditions in fixed income markets during 2021 that were not present in 2022. The Ps 46.0 billion decrease in share of profit of equity accounted investees, net
113
of tax (equity method) was driven by the decrease in Porvenir’s net income that was partially offset by a better performance in Corficolombiana. For more information on the performance of these companies refer to “Item 5. Operating and Financial Review and Prospects—A. Operating Results—Management Discussion and Analysis of Operating Segments—Porvenir” and “Item 5. Operating and Financial Review and Prospects—A. Operating Results—Management Discussion and Analysis of Operating Segments—Corficolombiana”.
During the last quarter of 2022, Banco de Bogotá continued its PP&E structure optimization program by transferring some non-strategic property plant and equipment in exchange for equity in NEXUS Real Estate Capital Funds (a private equity fund specialized in real estate management), some of which were part of lease-back operations. As such, the bank recorded an Ps 84.1 billion increase in gain on the sale of property, plant and equipment (as fair value of derecognized PP&E was higher than book value).
Other expenses
Year ended December 31, | Change, 2022 vs. 2021 | |||||||
| 2022 |
| 2021 |
| # |
| % | |
(in Ps billions) |
|
| ||||||
Losses from sales of noncurrent assets held for sale |
| (0.8) |
| (1.3) | 0.5 |
| (38.9) | |
Personnel expenses |
| (1,129.4) |
| (1,058.1) | (71.3) |
| 6.7 | |
Administrative and other expenses |
| (1,565.9) |
| (1,301.0) | (264.9) |
| 20.4 | |
Depreciation and amortization |
| (302.5) |
| (285.7) | (16.8) |
| 5.9 | |
Impairment loss on other assets | (18.5) |
| (5.2) | (13.4) |
| 258.9 | ||
Other |
| (94.3) |
| (105.4) | 11.0 |
| (10.4) | |
Other expenses |
| (3,111.4) | (2,756.5) | (355.0) |
| 12.9 | ||
Other expenses increased 12.9% or Ps 355.0 billion to Ps 3,111.4 billion. The Ps 71.3 billion increase in personnel expenses results from a 7.5% or Ps 76.8 billion increase in salaries and employee benefits and a 18.6% or Ps 5.5 billion decrease in labor severances and bonus plan payments. Administrative and other expenses increased 20.4% or Ps 264.9 billion over the year. As explained under Grupo Aval’s analysis the increase in the industry and commerce tax (ICA) heavily impacted Banco de Bogotá, with operating taxes constituting the main driver for expense growth with a 35.4% or Ps 93.3 billion increase, explaining 7.2% of growth in administrative and other expenses. Insurance expenses increased 14.0% or Ps 23.8 billion driven by (i) a 13.4% or Ps 19.6 billion increase in deposit insurance, in line with higher volumes of deposits in Colombia and (ii) a 17.5% or Ps 4.2 billion increase in other insurance expenses as premiums were negatively impacted by higher insurance losses derived from the pandemic. Finally, service expenses such as staffing, utilities, travel and transportation expenses, and supplies and stationery, among others increased 13.0% or Ps 20.5 billion, in line with observed inflation. Other decreased 10.4% or Ps 11.0 billion.
Given that Banco de Bogotá’s other expenses increased by 12.9% and its total income before net impairment losses on financial assets (defined as the sum of net interest income, net income from commissions and fees, gross profit (loss) from sales of goods and services, net trading income and other income) decreased by 27.9%, the cost to income efficiency ratio deteriorated 1,712 basis points to 47.4% in 2022 from 30.3% in 2021. The efficiency ratio for 2021 benefited from the extraordinary gain in loss of control of Porvenir, which had a positive impact of 14.8 percentage points on efficiency for 2021. Aside from this positive effect, efficiency deteriorated 232 basis points in 2022. The ratio of other expenses as a percentage of average assets of continuing operations (not including assets previously held through BHI) deteriorated by 5 basis points to 2.4% in 2022 from 2.3% in 2021.
Tax expense
Income tax expense for Banco de Bogotá increased by Ps 37.6 billion, to a Ps 290.2 billion tax expense in 2022. This performance was driven by a Ps 308.3 billion increase in income before income tax expense excluding dividends, participation in results of subsidiaries, equity method, and gains on deconsolidation (loss of control) (as these are non-taxable income) and a 4.0 percentage points increase in the statutory tax rate for financial institutions to 38% from 34%. In addition, Banco de Bogotá benefited from a Ps 84.5 billion positive effect of the tax reform on deferred taxes given the bank’s net deferred tax asset position.
Net income from discontinued operations
Net income from discontinued operations decreased Ps 626.5 billion, to Ps 1,000.8 billion in 2022 compared with 2021. Net income from discontinued operations in 2022 includes a Ps 204.2 billion gain related to the BHI transactions (spin-off and sale) including (i) a Ps 1,187.3 billion gain related to the spin-off of 75.0% of equity interest of BHI in March and (ii) a Ps 983.0 billion loss on the sale of a 20.9% equity interest of BHI in December. In addition, in 2022 Banco de Bogotá recognized Ps 796.6 billion of BHI’s net income during the time it was a subsidiary (January – March) and afterwards, during the time it was accounted for as an investment in associate through the equity method (April – November). Net income from discontinued operations in 2021 reflects Banco de Bogotá’s 100.0% equity interest in BHI’s net income attributable to controlling interest as it was a consolidated subsidiary.
114
Net income attributable to non-controlling interest
Net income attributable to non-controlling interest decreased Ps 3.4 billion, to Ps 1.4 billion in 2022 compared with 2021. The ratio of net income attributable to non-controlling interest to net income was 0.05% in 2022 and 0.1% in 2021.
Banco de Occidente
Overview
Banco de Occidente’s net income attributable to owners of the parent for the year ended December 31, 2022 was Ps 452.5 billion, decreasing 22.0% or Ps 127.7 billion compared to the year ended December 31, 2021. The following discussion describes the main drivers of Banco de Occidente’s results of operations for the year ended December 31, 2022 compared to the year ended December 31, 2021.
Banco de Occidente | ||||||||
For the year ended |
| Change 2022 vs | ||||||
December 31, |
| 2021 | ||||||
| 2022 |
| 2021 |
| # |
| % | |
(in Ps billions) | ||||||||
Total interest income |
| 4,691.3 |
| 2,742.0 |
| 1,949.3 |
| 71.1 |
Total interest expense |
| (2,491.4) |
| (769.6) |
| (1,721.8) |
| 223.7 |
Net interest income |
| 2,199.9 |
| 1,972.3 |
| 227.5 |
| 11.5 |
Impairment loss on loans and other accounts receivable |
| (943.3) |
| (882.6) |
| (60.7) |
| 6.9 |
Impairment (loss) recovery on other financial assets |
| 2.2 |
| 0.5 |
| 1.7 |
| 354.8 |
Recovery of charged-off financial assets |
| 195.9 |
| 158.4 |
| 37.5 |
| 23.6 |
Net impairment loss on financial assets |
| (745.2) |
| (723.7) |
| (21.6) |
| 3.0 |
Net interest income, after impairment losses | 1,454.7 | 1,248.7 | 206.0 |
| 16.5 | |||
Net income from commissions and fees |
| 345.5 |
| 331.8 |
| 13.7 |
| 4.1 |
Gross loss from sales of goods and services | (101.1) | (81.7) | (19.4) |
| 23.7 | |||
Net trading income (loss) |
| 19.3 |
| (67.8) |
| 87.1 |
| (128.5) |
Other income |
| 377.0 |
| 552.6 |
| (175.6) |
| (31.8) |
Other expenses |
| (1,521.6) |
| (1,322.8) |
| (198.8) |
| 15.0 |
Net income before tax expense |
| 573.8 |
| 660.8 |
| (87.0) |
| (13.2) |
Income tax expense |
| (117.5) |
| (74.9) |
| (42.6) |
| 56.8 |
Net income for the year |
| 456.3 |
| 585.9 |
| (129.6) |
| (22.1) |
Net income for the year attributable to: |
|
|
|
|
|
| ||
Owners of the parent |
| 452.5 |
| 580.2 |
| (127.7) |
| (22.0) |
Non-controlling interest |
| 3.8 |
| 5.7 |
| (1.9) |
| (32.6) |
Net interest income
Net interest income increased 11.5% or Ps 227.5 billion to Ps 2,199.9 billion in 2022. Total interest income increased 71.1% or Ps 1,949.3 billion driven by a 307 basis points increase in the average yield of interest-earning assets and a 17.9% or Ps 7,205.4 billion increase in the average balance of interest-earning assets. Total interest expense increased 223.7% or Ps 1,721.8 billion, resulting from a 382 basis points increased in the average interest rate paid on interest-bearing funding and a 19.3% or Ps 6.675.8 billion increase in the average balance of interest-bearing funding. Yields and rates paid increased rapidly due to monetary policy in place throughout the year, a tighter liquidity environment and due to additional pressures coming from more demanding NSFR requirements, which drove the increase in the cost of interest-bearing deposits. The interest spread between the average yield on gross loans and the average rate paid on interest-bearing deposits decreased by 91 basis points to 4.7%. Net interest margin contracted by 26 basis points to 4.6%, given that the increase in the average rate paid on interest-bearing liabilities was lower than the 407 basis points increase in the average rate paid on interest-bearing deposits. The main drivers impacting interest-earning assets and interest-bearing funding during 2022, are as described under Grupo Aval’s analysis.
Average balance of interest-earning assets | Net interest margin for | Net interest income for the | ||||||||||||||||
for the year ended December 31, | Change, 2022 vs. 2021 | the year ended December 31, | year ended December 31, | Change, 2022 vs. 2021 | ||||||||||||||
2022 |
| 2021 |
| # |
| % |
| 2022 |
| 2021 |
| 2022 |
| 2021 | # |
| % | |
(in Ps billions) | (in Ps billions) | |||||||||||||||||
47,444.5 | 40,239.1 | 7,205.4 | 17.9 | 4.6% |
| 4.9% | 2,199.9 | 1,972.3 | 227.5 | 11.5 | ||||||||
115
The following tables show: (i) the average balance, average yield and interest income on interest-earning assets with an analysis of impacts derived from changes in the average balance and the average yield, per type of interest-earning asset; interbank and overnight funds are shown separate from gross loans due to their characteristics and short-term nature and (ii) the average balance, average rate paid and interest expense on interest-bearing funding with an analysis of impacts derived from changes in the average balance and the average rate, per type of interest-bearing funding.
(i) | Average balance for the | Average yield for the | Interest income for the | Impact on interest income | Change, 2022 | |||||||||||||||||||
|---|---|---|---|---|---|---|---|---|---|---|---|---|---|---|---|---|---|---|---|---|---|---|---|---|
year ended December 31, | Change, 2022 vs. 2021 | year ended December 31, | year ended December 31, | due to changes in | vs. 2021 | |||||||||||||||||||
| 2022 |
| 2021 |
| # |
| % |
| 2022 |
| 2021 |
| 2022 |
| 2021 |
| Balance |
| Yield | Total |
| % | ||
(in Ps billions) | (in Ps billions) | (in Ps billions) | ||||||||||||||||||||||
Commercial |
| 28,403.6 |
| 23,951.6 |
| 4,451.9 |
| 18.6 |
| 9.8% |
| 5.9% |
| 2,797.3 |
| 1,402.8 |
| 438.4 |
| 956.1 | 1,394.5 |
| 99.4 | |
Consumer |
| 9,937.0 |
| 8,253.9 |
| 1,683.1 |
| 20.4 |
| 13.2% |
| 11.7% |
| 1,311.2 |
| 969.6 |
| 222.1 |
| 119.5 | 341.6 |
| 35.2 | |
Mortgages |
| 2,289.8 |
| 2,006.8 |
| 283.0 |
| 14.1 |
| 9.1% |
| 9.0% |
| 208.1 |
| 181.0 |
| 25.7 |
| 1.4 | 27.1 |
| 15.0 | |
Gross loans |
| 40,630.4 |
| 34,212.4 |
| 6,418.0 |
| 18.8 |
| 10.6% |
| 7.5% |
| 4,316.6 |
| 2,553.4 |
| 681.8 |
| 1,081.3 | 1,763.2 |
| 69.1 | |
Interbank and overnight funds | 1,033.6 |
| 433.2 |
| 600.4 |
| 138.6 |
| 6.5% |
| 3.9% |
| 67.3 |
| 17.0 |
| 39.1 |
| 11.2 | 50.2 |
| 294.9 | ||
Total gross loans | 41,664.0 |
| 34,645.5 |
| 7,018.4 |
| 20.3 |
| 10.5% |
| 7.4% |
| 4,383.8 |
| 2,570.4 |
| 738.5 |
| 1,075.0 | 1,813.4 |
| 70.6 | ||
Investments in debt securities | 5,780.6 |
| 5,593.6 |
| 187.0 |
| 3.3 |
| 5.3% |
| 3.1% |
| 307.5 |
| 171.6 |
| 9.9 |
| 126.0 | 135.9 |
| 79.2 | ||
Total interest-earning assets |
| 47,444.5 |
| 40,239.1 |
| 7,205.4 |
| 17.9 |
| 9.9% |
| 6.8% |
| 4,691.3 |
| 2,742.0 |
| 712.5 |
| 1,236.9 | 1,949.3 |
| 71.1 | |
(ii) | Average balance for the | Average rate paid for the | Interest expense for the | Impact on interest expense | Change, 2022 | |||||||||||||||||||
year ended December 31, | Change, 2022 vs. 2021 | year ended December 31, | year ended December 31, | due to changes in | vs. 2021 | |||||||||||||||||||
| 2022 |
| 2021 |
| # |
| % |
| 2022 |
| 2021 |
| 2022 |
| 2021 | Balance |
| Rate | Total | % | ||||
(in Ps billions) | (in Ps billions) | (in Ps billions) | ||||||||||||||||||||||
Checking accounts |
| 574.2 |
| 698.6 |
| (124.4) |
| (17.8) |
| 2.8% |
| 0.8% |
| (16.0) |
| (5.9) | 3.5 |
| (13.6) | (10.1) | 170.8 | |||
Time deposits |
| 11,094.9 |
| 8,499.5 |
| 2,595.4 |
| 30.5 |
| 6.9% |
| 3.0% |
| (761.6) |
| (256.7) | (178.2) |
| (326.7) | (504.9) | 196.7 | |||
Savings accounts |
| 20,588.3 |
| 17,458.1 |
| 3,130.1 |
| 17.9 |
| 5.5% |
| 1.3% |
| (1,134.7) |
| (231.6) | (172.5) |
| (730.7) | (903.2) | 390.1 | |||
Total interest-bearing deposits |
| 32,257.4 |
| 26,656.3 |
| 5,601.1 |
| 21.0 |
| 5.9% |
| 1.9% |
| (1,912.3) |
| (494.2) | (332.1) |
| (1,086.1) | (1,418.2) | 287.0 | |||
Interbank borrowings and overnight funds | 2,312.1 | 1,692.6 | 619.5 |
| 36.6 |
| 5.8% |
| 1.5% |
| (133.3) |
| (25.9) | (35.7) |
| (71.7) | (107.4) | 414.8 | ||||||
Borrowings from banks and others | 3,174.9 | 2,078.3 | 1,096.6 |
| 52.8 |
| 3.2% |
| 1.9% |
| (100.8) |
| (38.7) | (34.8) |
| (27.3) | (62.1) | 160.4 | ||||||
Bonds issued | 2,569.8 | 2,975.7 | (405.9) |
| (13.6) |
| 11.2% |
| 6.2% |
| (286.9) |
| (184.7) | 45.3 |
| (147.6) | (102.2) | 55.4 | ||||||
Borrowings from development entities | 908.4 | 1,143.9 | (235.6) |
| (20.6) |
| 6.4% |
| 2.3% |
| (58.2) |
| (26.2) | 15.1 |
| (47.0) | (31.9) | 121.7 | ||||||
Other funding | 8,965.2 | 7,890.5 | 1,074.7 |
| 13.6 |
| 6.5% |
| 3.5% |
| (579.1) |
| (275.5) | (69.4) |
| (234.2) | (303.6) | 110.2 | ||||||
Total interest-bearing liabilities | 41,222.5 | 34,546.7 | 6,675.8 |
| 19.3 |
| 6.0% |
| 2.2% |
| (2,491.4) | (769.6) | (403.5) |
| (1,318.3) | (1,721.8) | 223.7 | |||||||
Banco de Occidente’s average balance of gross loans increased 20.3% or Ps 7,018.4 billion in 2022 and the average yield was 10.5%, 310 basis points higher than in 2021. Given that 81.9% of Banco de Occidente’s commercial loans are variable rate mostly referenced either to the 3-month inter-bank rate (IBR) or the 90-day time deposit rate (DTF), average yields on commercial loans increased 399 basis points to 9.8%, slightly below the 528 basis points increase in the average Central Bank rate to 7.2% in 2022 from 1.9% in 2021, given repricing lags. On the other hand, given that 21.4% of Banco de Occidente’s consumer loans are variable rate, the average yields on consumer loans only priced in during 2022 a small portion of the rise in reference rates and increased 145 basis points. However, dynamic origination of personal loans and automobile and vehicle loans enabled the bank to reprice part of the outstanding loan balances at year end.
The average balance of interest-earning investments in debt securities increased 3.3% or Ps 187.0 billion. The average yield for interest-earning investments in debt securities increased 225 basis points as Banco de Occidente invested in securities at higher yields as the Colombian sovereign yield curve (TES) shifted upwards, following global sovereign fixed income rates and underpinned by the increase in Colombia’s sovereign risk premium.
Finally, as described in Grupo Aval’s analysis, average funding rates moved upwards in line with the average Central Bank rate. In addition, cost of funds was pressed by competition for stable retail funding and term funding with tenors longer than one year in order to comply with the more demanding NSFR requirements. Pressures on balances and rates built up during the latter part of the year to comply with NSFR requirements. The end of period balance of interest-bearing liabilities increased 21.2% or Ps 7,971.2 billion, driven by a 46.0% or Ps 4,221.3 billion increase in time deposits, a 42.0% or Ps 1,161.6 billion increase in borrowings from banks and others (the bank took subordinated financing of U.S.$100.0 million with the Interamerican Development Bank and FINDEV, strengthening its regulatory capital and NSFR), and a 13.6% or Ps 2.636.6 billion increase savings accounts. The fast-paced growth of time deposits drove the 384 basis points increase in the average rate paid for time deposits, partially pricing in the increase in the average Central Bank rate.
116
Net impairment loss on financial assets
Year ended December 31, |
| Change, 2022 vs. 2021 | ||||||
| 2022 |
| 2021 |
| # |
| % | |
(in Ps billions) | ||||||||
Impairment loss on loans and other accounts receivable |
| (943.3) |
| (882.6) |
| (60.7) |
| 6.9 |
Impairment (loss) recovery on other financial assets |
| 2.2 |
| 0.5 |
| 1.7 |
| 354.8 |
Recovery of charged-off financial assets |
| 195.9 |
| 158.4 |
| 37.5 |
| 23.6 |
Net impairment loss on financial assets |
| (745.2) |
| (723.7) |
| (21.6) |
| 3.0 |
Banco de Occidente’s impairment loss on loans and other accounts receivable increased 6.9% or Ps 60.7 billion to Ps 943.3 billion, driven by the improvement of the loan portfolio’s ECL, explained by (i) favorable performance of clients that had been granted reliefs during 2020 and (ii) the economic recovery and its effect on borrowers’ credit risk. For more information regarding risk management measures implemented during 2022 in relation to COVID-19 please see “Item 11. Quantitative and Qualitative Disclosures About Market Risk”.
In addition, recovery of charged-off financial assets increased 23.6% or Ps 37.5 billion to Ps 195.9 billion, due to the drivers discussed under Grupo Aval’s analysis.
The following table provides detail by category of impairment loss on loans and other accounts receivable, cost of risk and cost of risk, net. For more information on the calculation methodology please refer to “Item 3. Key Information—A. Selected Financial Data”.
Impairment loss on loans and other accounts receivable | Cost of risk for the | Change, | Cost of risk, net for the | Change, | ||||||||||||||||
Year ended December 31, | Change, 2022 vs. 2021 | year ended December 31, | 2022 vs. 2021 | year ended December 31, | 2022 vs. 2021 | |||||||||||||||
2022 | 2021 | # | % | 2022 | 2021 | basis points | 2022 | 2021 | basis points | |||||||||||
(in Ps billions) | ||||||||||||||||||||
Commercial | (418.8) | (490.3) | 71.6 | (14.6) | 1.5% | 2.0% | (57) | 1.3% | 1.9% | (59) | ||||||||||
Consumer | (533.4) | (384.4) | (149.0) | 38.7 | 5.4% | 4.7% | 71 | 4.0% | 3.3% | 70 | ||||||||||
Mortgage | 16.5 | (2.9) | 19.4 | (661.8) | (0.7)% | 0.1% | (87) | (0.7)% | 0.1% | (86) | ||||||||||
Gross loans | (935.7) | (877.7) | (58.0) | 6.6 | 2.3% | 2.6% | (26) | 1.8% | 2.1% | (28) | ||||||||||
Interbank and overnight funds | (1.4) | 0.0 | (1.4) | (13,206.4) | N.A. | N.A. | N.A. | N.A. | N.A. | N.A. | ||||||||||
Total gross loans | (937.1) | (877.7) | (59.4) | 6.8 | N.A. | N.A. | N.A. | N.A. | N.A. | N.A. | ||||||||||
Other accounts receivable | (6.2) | (4.9) | (1.4) | 28.2 | N.A. | N.A. | N.A. | N.A. | N.A. | N.A. | ||||||||||
Impairment loss on loans and other accounts receivable | (943.3) | (882.6) | (60.7) | 6.9 | 2.3% | 2.6% | (26) | 1.8% | 2.1% | (28) | ||||||||||
Banco de Occidente’s cost of risk, net decreased to 1.8% driven by the decrease in cost of risk of commercial loans and mortgages that was partially offset by an increase in the cost of risk of consumer loans. The Ps 58.0 billion increase in impairment losses on gross loans is explained by a Ps 92.7 billion increase for Stage 1 loans, a Ps 2.7 billion decrease for Stage 2 loans, and a Ps 32.0 billion decrease for Stage 3 loans. The increase in expenses for Stage 1 loans is attributable to organic growth of the loan portfolio across all categories. The decrease of impairment losses for Stage 2 loans is composed of a Ps 54.6 billion decrease in commercial loans, a Ps 5.0 billion decrease in mortgages, and a Ps 56.8 billion increase in consumer loans. The decrease in impairment losses for Stage 2 commercial loans was driven by the reversal of impairment losses booked as overlays or for customers relieved during the pandemic, as borrower’s payment behavior recovered throughout the year. The increase in impairment losses for Stage 2 consumer loans was driven by some deterioration in the asset quality of personal loans and credit cards, which have higher PDs than other secured products such as payroll loans and automobile loans and leases. Finally, the decrease of impairment losses for Stage 3 loans was driven by a Ps 63.7 billion decrease in commercial loans and a Ps 29.3 billion increase in consumer loans.
117
The following table shows Banco de Occidente’s gross loan classification by Stages in accordance with IFRS 9 (interbank and overnight funds are not included as they tend to be mostly Stage 1 and with low loss allowance due to their characteristics and short-term nature).
At December 31, | Change, 2022 vs. 2021 | |||||||||||||||||||||||
2022 | 2021 | Gross | ||||||||||||||||||||||
| Stage 1 |
| Stage 2 |
| Stage 3 |
| Gross loans |
| Stage 1 |
| Stage 2 |
| Stage 3 |
| Gross loans | Stage 1 |
| Stage 2 |
| Stage 3 |
| loans | ||
(in Ps billions) | % | |||||||||||||||||||||||
Commercial |
| 26,864.7 | 1,877.9 | 2,208.0 |
| 30,950.6 |
| 19,857.2 |
| 3,371.0 | 2,350.6 |
| 25,578.8 | 35.3 | (44.3) | (6.1) | 21.0 | |||||||
Consumer |
| 9,966.5 | 749.5 | 426.7 |
| 11,142.6 |
| 6,683.5 |
| 1,792.1 | 411.8 |
| 8,887.5 | 49.1 | (58.2) | 3.6 | 25.4 | |||||||
Mortgages |
| 2,320.9 | 60.9 | 106.2 | 2,488.0 | 1,755.1 |
| 257.0 | 120.9 | 2,132.9 | 32.2 | (76.3) | (12.2) | 16.7 | ||||||||||
Gross loans | 39,152.0 | 2,688.4 | 2,740.8 | 44,581.2 | 28,295.8 | 5,420.1 | 2,883.3 | 36,599.2 | 38.4 | (50.4) | (4.9) | 21.8 | ||||||||||||
| ||||||||||||||||||||||||
Commercial |
| 86.8% |
| 6.1% |
| 7.1% |
| 100.0% |
| 77.6% |
| 13.2% |
| 9.2% |
| 100.0% | ||||||||
Consumer |
| 89.4% |
| 6.7% |
| 3.8% |
| 100.0% |
| 75.2% |
| 20.2% |
| 4.6% |
| 100.0% | ||||||||
Mortgages |
| 93.3% | 2.4% | 4.3% | 100.0% | 82.3% | 12.0% | 5.7% | 100.0% | |||||||||||||||
Gross loans | 87.8% | 6.0% | 6.1% | 100.0% | 77.3% | 14.8% | 7.9% | 100.0% | ||||||||||||||||
The quality of Banco de Occidente’s gross loan portfolio measured both by the composition of stages and loans past due improved significantly in 2022 across all loan categories. At December 31, 2022, the balance of Stage 2 loans had decreased 50.4% or Ps 2,731.7 billion to Ps 2,688.4 billion. In commercial, Stage 2 loans decreased Ps 1,493.1 billion to Ps 1,877.9 billion, due to the drivers mentioned above. Net transfers to or from Stage 2 from or to Stage 1 or Stage 3 amounted to a Ps 1,007.8 billion decrease and net payment/origination of obligations classified as Stage 2 had a favorable evolution leading to a net reduction of Ps 520.9 billion. In consumer, Stage 2 loans decreased Ps 1,042.6 billion to Ps 749.5 billion, driven by net transfers to or from Stage 2 from or to Stage 1 or Stage 3 that amounted to a Ps 661.3 billion decrease. The Ps 1,042.6 billion decrease was driven by improvements in personal installment loans (Ps 411.3 billion of which were classified as “acceptable above normal”) and payroll loans (Ps 372.6 billion of which were classified as “normal”). Finally, in mortgages, overlays put in place during the pandemic were removed and explained the majority of the Ps 196.0 billion decrease in Stage 2 loans due to net transfers from and to Stage 1.
For further detail on credit risk model overlays and transitioning between stages refer to Grupo Aval’s analysis. For more information on loss allowance calculations and a description of PD risk categories under IFRS 9, please refer to Note 4.1 of our audited consolidated financial statements.
The following table shows the balance of loans at least 91 days past due, delinquency ratios, charge-offs and charge-offs as a percentage of average gross loans for Banco de Occidente (interbank and overnight funds are not included as they tend not to be past due or charged-off due to their characteristics and short-term nature).
Loans at least 91 days past due | Delinquency ratio (1) | Change, | ||||||||||||
At December 31, | Change, 2022 vs. 2021 | at December 31, | 2022 vs. 2021 | |||||||||||
2022 | 2021 | # | % | 2022 | 2021 | basis points | ||||||||
| (in Ps billions) | |||||||||||||
Commercial | 950.6 | 1,022.7 | (72.1) | (7.1) | 3.1% | 4.0% | (93) | |||||||
Consumer | 245.4 | 198.3 | 47.2 | 23.8 | 2.2% | 2.2% | (3) | |||||||
Mortgages |
| 73.3 | 67.9 | 5.4 | 7.9 | 2.9% | 3.2% | (24) | ||||||
Gross loans |
| 1,269.3 | 1,288.9 | (19.6) | (1.5) | 2.8% | 3.5% | (67) | ||||||
Charge-offs | Charge-offs as a percentage | Change, | ||||||||||||
At December 31, | Change, 2022 vs. 2021 | of average gross loans | 2022 vs. 2021 | |||||||||||
2022 | 2021 | # | % | 2022 | 2021 | basis points | ||||||||
| (in Ps billions) | |||||||||||||
Commercial | 477.1 | 495.9 | (18.8) | (3.8) | 1.7% | 2.1% | (39) | |||||||
Consumer | 546.6 | 498.4 | 48.1 | 9.7 | 5.5% | 6.0% | (54) | |||||||
Mortgages |
| 2.4 | 1.8 | 0.6 | 30.0 | 0.1% | 0.1% | 1 | ||||||
Total charge-offs |
| 1,026.1 | 996.2 | 29.9 | 3.0 | 2.5% | 2.9% | (39) | ||||||
| (1) | Calculated as loans past due more than 90 days divided by gross loans. |
Delinquency coverage ratio for gross loans, measured as loss allowance divided by past due gross loans more than 90 days was 160.1% in 2022 and 152.7% in 2021. Charge-offs as a percentage of average gross loans decreased explained by a relatively high level in 2021 due to the charge-offs of delinquent clients that were granted reliefs during the pandemic.
118
Net income from commissions and fees
| Year ended December 31, | Change, 2022 vs. 2021 | ||||||
|
| 2022 |
| 2021 |
| # |
| % |
| (in Ps billions) | |||||||
Banking fees |
| 420.8 |
| 377.8 |
| 43.0 |
| 11.4 |
Trust activities and portfolio management services |
| 76.3 |
| 80.4 |
| (4.1) |
| (5.1) |
Income from commissions and fees |
| 497.1 |
| 458.2 |
| 38.9 |
| 8.5 |
Expenses from commissions and fees |
| (151.6) |
| (126.4) |
| (25.2) |
| 20.0 |
Net income from commissions and fees |
| 345.5 |
| 331.8 |
| 13.7 |
| 4.1 |
Income from commissions and fees increased 8.5% or Ps 38.9 billion. Banking fees mainly explained this result, with a 11.4% or Ps 43.0 billion increase. The main drivers for this performance were the same as those discussed under Grupo Aval’s analysis. Banking service fees increased 9.7% or Ps 23.9 billion and debit and credit card fees increased 16.0% or Ps 19.7 billion. This in turn, was driven by a Ps 11.0 billion increase in income from merchant acquiring and a Ps 8.4 billion increase in credit card fees, supported by higher transactional activity as compared to 2021. Trust activities and portfolio management services decreased 5.1% or Ps 4.1 billion, explained by the challenging market conditions present throughout 2022 that negatively impacted performance based fees. Expenses from commissions and fees increased 20.0% or Ps 25.2 billion, driven by an increase in transactional activity and fees paid in relation to income from commissions and fees.
Gross loss from sales of goods and services
Year ended December 31, |
| Change, 2022 vs. 2021 | ||||||
| 2022 |
| 2021 |
| # |
| % | |
(in Ps billions) | ||||||||
Income from sales of goods and services |
| 214.7 |
| 237.0 |
| (22.3) |
| (9.4) |
Costs and expenses of sales of goods and services |
| (315.8) |
| (318.7) |
| 2.9 |
| (0.9) |
Gross loss from sales of goods and services |
| (101.1) |
| (81.7) |
| (19.4) |
| 23.7 |
Gross loss from sales of goods and services increased by Ps 19.4 billion to a gross loss of Ps 101.1 billion in 2022, and refers to the non-financial results of Nexa BPO, Banco de Occidente’s subsidiary. Income from sales of goods and services decreased 9.4% or Ps 22.3 billion to Ps 214.7 billion in 2022 due, mainly, to a decrease in BPO services (mainly sales force) and to migration of certain call center activities to digital solutions such as virtual assistants.
Costs and expenses of sales of goods and services showed a 0.9% or Ps 2.9 billion decrease to Ps 315.8 billion in 2022, mainly driven by a 1.8% or Ps 4.6 billion decrease in personnel expenses. An 8.9% reduction in headcount was partially offset by a 10.1% increase in the minimum wage in 2022. The gross loss from sales of goods and services results from the provision of services by Nexa BPO to Banco de Occidente and its subsidiaries (which income is eliminated in the consolidation process).
Net trading income (loss)
Banco de Occidente’s net trading income for 2022 was Ps 19.3 billion, Ps 87.1 billion higher than the Ps 67.8 billion loss in 2021, resulting from a Ps 75.1 billion increase in net trading income from derivatives and a Ps 12.1 billion increase in income from investment securities at fair value through profit or loss. The performance of net trading income from derivatives was offset by a Ps 58.0 billion decrease in foreign exchange gains (losses), net, recognized under other income.
Total income from investment securities
Banco de Occidente’s securities portfolio is classified in the following categories: (i) equity and fixed income investments at FVTPL (described in this section as net trading income in investment securities at FVTPL), (ii) fixed income investments at FVOCI and (iii) fixed income investments at AC (results from (ii) and (iii) are included in net interest income as interest income on investments in debt securities). Banco de Occidente manages its investment portfolio in a comprehensive and integral manner that considers the individual return of each one of these three categories and the total return of the investment securities portfolio.
Total income from investment securities for Banco de Occidente (comprised of interest income on investments in debt securities and net trading income from investment securities at FVTPL) was Ps 340.7 billion for 2022, 76.8% or Ps 148.0 billion higher than in 2021, primarily driven by an 196 basis points increase in the average yield on total investment securities to 4.68% in 2022 from 2.72% in 2021, resulting in a Ps 138.9 billion increase in interest income. In addition, a 2.7% or Ps 194.1 billion increase in the average balance of total investment securities to Ps 7,279.5 billion in 2022, resulted in a Ps 9.1 billion increase in interest income. The main drivers for this performance were discussed above in net interest income.
119
Other income
Year ended December 31, | Change, 2022 vs. 2021 | |||||||
| 2022 |
| 2021 |
| # |
| % | |
(in Ps billions) | ||||||||
Foreign exchange gains (losses), net |
| 172.6 |
| 230.6 | (58.0) |
| (25.1) | |
Share of profit of equity accounted investees, net of tax (Equity method) |
| 122.0 |
| 245.9 | (123.8) |
| (50.4) | |
Net gain (loss) on sale of debt and equity securities |
| (29.0) |
| 1.3 | (30.3) |
| (2,254.5) | |
Dividends |
| 5.6 |
| 3.1 | 2.4 |
| 77.8 | |
Gain (loss) on the sale of non-current assets held for sale |
| 6.3 |
| 12.0 | (5.8) |
| (47.9) | |
Gain on sale of property, plant and equipment | 9.5 | 5.1 | 4.5 |
| 88.2 | |||
Net gain (loss) in asset valuation |
| 30.7 |
| 17.7 | 13.0 |
| 73.7 | |
Other |
| 59.2 |
| 36.8 | 22.3 |
| 60.6 | |
Other income |
| 377.0 |
| 552.6 | (175.6) |
| (31.8) | |
Other income decreased 31.8% or Ps 175.6 billion, as a result of a decrease in share of profit of equity accounted investees, net of tax (equity method) and foreign exchange gains (losses), net. The Ps 123.8 billion decrease in share of profit of equity accounted investees, net of tax (equity method) was driven by (i) Porvenir’s decrease in net income. For more information on the performance of these companies refer to “Item 5. Operating and Financial Review and Prospects—A. Operating Results—Management Discussion and Analysis of Operating Segments—Corficolombiana” and “Item 5. Operating and Financial Review and Prospects—A. Operating Results—Management Discussion and Analysis of Operating Segments—Porvenir”.
The Ps 58.0 billion decrease in foreign exchange gains (losses), net to a Ps 172.6 billion net gain was partially offset by the Ps 75.1 billion increase in net trading income from derivatives mentioned before. The net result of both activities (foreign exchange and derivatives) for 2022 was a Ps 158.7 billion gain, Ps 17.1 billion higher than in 2021, resulting from favorable portfolio positioning along the year. The Ps 30.3 billion decrease in net gain on sale of debt and equity securities to a Ps 29.0 billion loss in 2022 was explained by the realization of losses of certain debt investment securities classified at FVOCI that were reinvested at higher yields, which will have a positive effect on interest income on investments in debt securities going forward. Other, increased Ps 22.3 billion mainly due to higher income on operating leasing fees.
Other expenses
Year ended December 31, | Change, 2022 vs. 2021 | |||||||
| 2022 |
| 2021 |
| # |
| % | |
(in Ps billions) | ||||||||
Losses from sales of noncurrent assets held for sale |
| — |
| (0.1) | 0.1 |
| (100.0) | |
Personnel expenses |
| (560.4) |
| (503.6) | (56.7) |
| 11.3 | |
Administrative and other expenses |
| (781.2) |
| (687.3) | (93.9) |
| 13.7 | |
Depreciation and amortization |
| (145.0) |
| (126.5) | (18.5) |
| 14.6 | |
Impairment loss on other assets | (1.4) |
| (1.6) | 0.2 |
| (13.2) | ||
Other |
| (33.7) |
| (3.6) | (30.1) |
| 834.2 | |
Other expenses |
| (1,521.6) |
| (1,322.8) | (198.8) |
| 15.0 | |
Other expenses increased 15.0% or Ps 198.8 billion to Ps 1,521.6 billion. The Ps 11.3% or Ps 56.7 billion increase in personnel expenses results from a 11.3% or Ps 53.5 billion increase in salaries and employee benefits and a 10.6% or Ps 3.3 billion increase in labor severances and bonus plan payments. Administrative and other expenses increased 13.7% or Ps 93.9 over the year.
As explained under Grupo Aval’s analysis the increase in the industry and commerce tax (ICA) heavily impacted Banco de Occidente, with operating taxes constituting the main driver for expense growth with a 29.9% or Ps 46.8 billion increase, explaining 6.8% of growth in administrative and other expenses. Insurance expenses increased 9.9% or Ps 11.0 billion driven by (i) a 9.7% or Ps 10.1 billion increase in deposit insurance, in line with higher volumes of deposits in Colombia and (ii) a 13.0% or Ps 0.9 billion increase in other insurance expenses as premiums were negatively impacted by higher insurance losses derived from the pandemic. Administrative expenses related to affiliation, contributions and transfers, increased 16.2% or Ps 15.8 billion driven by a Ps 19.0 billion increase in fees paid to merchant acquiring processing firms. Finally, service expenses such as staffing, utilities, travel and transportation expenses, and supplies and stationery, among others increased 13.7% or Ps 6.4 billion, slightly above observed inflation.
Given that Banco de Occidente’s other expenses increased by 15.0% and its total income before net impairment losses on financial assets (defined as the sum of net interest income, net income from commissions and fees, gross profit (loss) from sales of goods and services, net trading income and other income) increased by 4.9%, the cost to income efficiency ratio deteriorated 471 basis points to 53.6% in 2022 from 48.9% in 2021. The ratio of other expenses as a percentage of average assets improved by 3 basis points to 2.7% in 2022 from 2.8% in 2021.
120
Tax expense
Income tax expense for Banco de Occidente increased by Ps 42.5 billion, to a Ps 117.5 billion tax expense in 2022. This performance was driven by a Ps 34.4 billion increase in income before income tax expense excluding dividends and the equity method (as both are non-taxable income) and a 4.0 percentage points increase in the statutory tax rate for financial institutions to 38% from 34%. In addition, both 2022 and 2021 were impacted by the effects of tax reforms and recoveries in taxes from prior periods, in 2022 the net result of these were a Ps 2.1 billion expense whereas in 2021 it was a Ps 11.5 billion expense. The difference between years gave rise to a Ps 9.3 billion increase in tax expense.
Net income attributable to non-controlling interest
Net income attributable to non-controlling interest decreased 32.6%, or Ps 1.8 billion, to Ps 3.8 billion in 2022 compared with 2021. The ratio of net income attributable to non-controlling interest to net income decreased to 0.8% in 2022 from 1.0% in 2021.
Banco Popular
Overview
Banco Popular’s net income attributable to owners of the parent for the year ended December 31, 2022, was Ps 80.2 billion, decreasing 74.4% or Ps 233.1 billion compared to the year ended December 31, 2021. The following discussion describes the main drivers of Banco de Popular’s results of operations for the year ended December 31, 2022, compared to the year ended December 31, 2021.
Banco Popular | ||||||||
For the year ended | Change 2022 vs | |||||||
December 31, | 2021 | |||||||
| 2022 |
| 2021 |
| # |
| % | |
(in Ps billions) | ||||||||
Total interest income |
| 2,915.2 |
| 2,208.7 |
| 706.4 |
| 32.0 |
Total interest expense |
| (1,751.8) |
| (617.6) |
| (1,134.2) |
| 183.6 |
Net interest income |
| 1,163.3 |
| 1,591.1 |
| (427.8) |
| (26.9) |
Impairment loss on loans and other accounts receivable |
| (225.5) |
| (197.2) |
| (28.3) |
| 14.4 |
Impairment (loss) recovery on other financial assets |
| 0.2 |
| (0.6) |
| 0.8 |
| (126.1) |
Recovery of charged-off financial assets |
| 43.6 |
| 35.9 |
| 7.7 |
| 21.5 |
Net impairment loss on financial assets |
| (181.7) |
| (161.9) |
| (19.8) |
| 12.2 |
Net interest income, after impairment losses | 981.6 | 1,429.2 | (447.6) |
| (31.3) | |||
Net income from commissions and fees |
| 203.1 |
| 194.1 |
| 9.1 |
| 4.7 |
Net trading income |
| 1.7 |
| 18.5 |
| (16.8) |
| (90.7) |
Other income |
| 217.6 |
| 134.7 |
| 82.9 |
| 61.6 |
Other expenses |
| (1,355.7) |
| (1,306.1) |
| (49.6) |
| 3.8 |
Net income before tax expense |
| 48.3 |
| 470.3 |
| (422.0) |
| (89.7) |
Income tax expense |
| 31.7 |
| (155.7) |
| 187.4 |
| (120.3) |
Net income for the year |
| 80.0 |
| 314.6 |
| (234.6) |
| (74.6) |
Net income for the year attributable to: |
|
|
|
|
|
| ||
Owners of the parent |
| 80.2 |
| 313.3 |
| (233.1) |
| (74.4) |
Non-controlling interest |
| (0.2) |
| 1.3 |
| (1.5) |
| (116.9) |
Net interest income
Net interest income decreased 26.9% or Ps 427.8 billion to Ps 1,163.3 billion in 2022. Interest expense increased 183.6% or Ps 1,134.2 billion, more than total interest income, due to a 395 basis points increase in the average interest rate paid on interest-bearing funding. The average balance of interest-bearing funding increased 14.5% or Ps 3,347.2 billion. Total interest income increased 32.0% or Ps 706.4 billion, driven by a 158 basis points increase in the average yield of interest-earning assets. The average balance of interest-earning assets increased 11.5% or Ps 2,959.4 billion. Yields and rates paid increased rapidly due to monetary policy in place throughout the year, a tighter liquidity environment and due to additional pressures coming from more demanding NSFR requirements, which drove the increase in the cost of interest-bearing deposits. In this context, Banco Popular was particularly affected by the decrease in its spreads and net interest margin given its focus on payroll loans, which are fixed rate and tend to price in changes in the benchmark rate slower than other products given their longer maturity. The interest spread between the average yield on gross loans and the average rate paid on interest-bearing deposits decreased
121
by 306 basis points to 3.8%. In turn, net interest margin decreased by 214 basis points to 4.1%. The main drivers impacting interest-earning assets and interest-bearing funding during 2022, are as described under Grupo Aval’s analysis.
Average balance of interest-earning assets | Net interest margin for | Net interest income for the | ||||||||||||||||
for the year ended December 31, | Change, 2022 vs. 2021 | the year ended December 31, | year ended December 31, | Change, 2022 vs. 2021 | ||||||||||||||
2022 |
| 2021 |
| # |
| % |
| 2022 |
| 2021 |
| 2022 |
| 2021 | # |
| % | |
(in Ps billions) | (in Ps billions) | |||||||||||||||||
28,592.0 | 25,632.6 | 2,959.4 | 11.5 | 4.1% |
| 6.2% | 1,163.3 | 1,591.1 | (427.8) | (26.9) | ||||||||
The following tables show: (i) the average balance, average yield and interest income on interest-earning assets with an analysis of impacts derived from changes in the average balance and the average yield, per type of interest-earning asset; interbank and overnight funds are shown separate from gross loans due to their characteristics and short-term nature and (ii) the average balance, average rate paid and interest expense on interest-bearing funding with an analysis of impacts derived from changes in the average balance and the average rate, per type of interest-bearing funding.
(i) | Average balance for the | Average yield for the | Interest income for the | Impact on interest income | Change, 2022 | |||||||||||||||||||
|---|---|---|---|---|---|---|---|---|---|---|---|---|---|---|---|---|---|---|---|---|---|---|---|---|
year ended December 31, | Change, 2022 vs. 2021 | year ended December 31, | year ended December 31, | due to changes in | vs. 2021 | |||||||||||||||||||
| 2022 |
| 2021 |
| # |
| % |
| 2022 |
| 2021 |
| 2022 |
| 2021 |
| Balance |
| Yield | Total |
| % | ||
(in Ps billions) | (in Ps billions) | (in Ps billions) | ||||||||||||||||||||||
Commercial |
| 6,953.9 |
| 6,640.3 |
| 313.6 |
| 4.7 |
| 8.6% |
| 4.3% |
| 599.9 |
| 284.6 |
| 27.1 |
| 288.2 | 315.3 |
| 110.8 | |
Consumer |
| 15,935.0 |
| 14,197.0 |
| 1,738.0 |
| 12.2 |
| 11.3% |
| 11.8% |
| 1,806.2 |
| 1,672.0 |
| 197.0 |
| (62.8) | 134.2 |
| 8.0 | |
Mortgages |
| 1,227.0 |
| 1,170.6 |
| 56.3 |
| 4.8 |
| 8.2% |
| 8.0% |
| 101.0 |
| 93.2 |
| 4.6 |
| 3.2 | 7.8 |
| 8.4 | |
Microcredit |
| 2.6 |
| 4.1 |
| (1.5) |
| (36.1) |
| 8.1% |
| 4.9% |
| 0.2 |
| 0.2 |
| (0.1) |
| 0.1 | 0.0 |
| 5.1 | |
Gross loans |
| 24,118.5 |
| 22,012.0 |
| 2,106.5 |
| 9.6 |
| 10.4% |
| 9.3% |
| 2,507.4 |
| 2,050.0 |
| 219.0 |
| 238.4 | 457.4 |
| 22.3 | |
Interbank and overnight funds | 402.6 |
| 80.0 |
| 322.6 |
| 403.0 |
| 14.6% |
| 7.3% |
| 58.7 |
| 5.9 |
| 47.0 |
| 5.8 | 52.9 |
| 901.7 | ||
Total gross loans | 24,521.1 |
| 22,092.1 |
| 2,429.0 |
| 11.0 |
| 10.5% |
| 9.3% |
| 2,566.1 |
| 2,055.9 |
| 254.2 |
| 256.0 | 510.2 |
| 24.8 | ||
Investments in debt securities | 4,070.9 |
| 3,540.5 |
| 530.3 |
| 15.0 |
| 8.6% |
| 4.3% |
| 349.0 |
| 152.8 |
| 45.5 |
| 150.7 | 196.2 |
| 128.4 | ||
Total interest-earning assets |
| 28,592.0 |
| 25,632.6 |
| 2,959.4 |
| 11.5 |
| 10.2% |
| 8.6% |
| 2,915.2 |
| 2,208.7 |
| 301.7 |
| 404.7 | 706.4 |
| 32.0 | |
(ii) | Average balance for the | Average rate paid for the | Interest expense for the | Impact on interest expense | Change, 2022 | |||||||||||||||||||
year ended December 31, | Change, 2022 vs. 2021 | year ended December 31, | year ended December 31, | due to changes in | vs. 2021 | |||||||||||||||||||
| 2022 |
| 2021 |
| # |
| % |
| 2022 |
| 2021 |
| 2022 |
| 2021 | Balance |
| Rate | Total | % | ||||
(in Ps billions) | (in Ps billions) | (in Ps billions) | ||||||||||||||||||||||
Checking accounts |
| 170.9 |
| 191.0 |
| (20.1) |
| (10.5) |
| 1.0% |
| 0.6% |
| (1.6) |
| (1.1) | 0.2 |
| (0.7) | (0.5) | 44.4 | |||
Time deposits |
| 9,212.9 |
| 7,894.6 |
| 1,318.3 |
| 16.7 |
| 8.1% |
| 3.7% |
| (748.3) |
| (293.8) | (107.1) |
| (347.4) | (454.4) | 154.7 | |||
Savings accounts |
| 12,944.4 |
| 11,800.1 |
| 1,144.3 |
| 9.7 |
| 5.5% |
| 1.6% |
| (713.7) |
| (184.7) | (63.1) |
| (465.9) | (529.0) | 286.4 | |||
Total interest-bearing deposits |
| 22,328.3 |
| 19,885.8 |
| 2,442.5 |
| 12.3 |
| 6.6% |
| 2.4% |
| (1,463.6) |
| (479.7) | (160.1) |
| (823.8) | (983.9) | 205.1 | |||
Interbank borrowings and overnight funds | 318.6 | 476.3 | (157.8) |
| (33.1) |
| 1.6% |
| 1.1% |
| (5.2) |
| (5.5) | 2.6 |
| (2.3) | 0.3 | (5.4) | ||||||
Borrowings from banks and others | 506.0 | 478.4 | 27.7 |
| 5.8 |
| 3.5% |
| 1.9% |
| (17.9) |
| (9.0) | (1.0) |
| (7.9) | (8.9) | 98.5 | ||||||
Bonds issued | 2,745.6 | 1,888.2 | 857.5 |
| 45.4 |
| 8.4% |
| 6.2% |
| (231.3) |
| (117.6) | (72.2) |
| (41.4) | (113.7) | 96.6 | ||||||
Borrowings from development entities | 567.0 | 389.6 | 177.4 |
| 45.5 |
| 6.0% |
| 1.5% |
| (33.8) |
| (5.9) | (10.6) |
| (17.4) | (28.0) | 478.1 | ||||||
Other funding | 4,137.2 | 3,232.5 | 904.7 |
| 28.0 |
| 7.0% |
| 4.3% |
| (288.2) |
| (138.0) | (63.0) |
| (87.2) | (150.2) | 108.9 | ||||||
Total interest-bearing funding | 26,465.5 | 23,118.3 | 3,347.2 |
| 14.5 |
| 6.6% |
| 2.7% |
| (1,751.8) | (617.6) | (221.6) |
| (912.6) | (1,134.2) | 183.6 | |||||||
Banco Popular’s average balance of gross loans increased 9.6% or Ps 2,106.5 billion in 2022 and the average yield was 10.4%, 108 basis points higher than in 2021. Growth of average balances was lower than that of closing balances (11.5%) reflecting mainly the performance of average commercial loans. Average balances for commercial loans grew less than closing balances reflecting a 15.8% increase in 2022 after a 9.0% decrease in 2021. Banco Popular revamped its product offering through strong credit cards origination and alliances with fintechs to originate personal installment loans in an effort to diversify its consumer loan portfolio and to benefit from the increase in interest rates for new originations. The closing balance for these products increased 23.7% or 79.8 billion and 250.7% or Ps 319.4 billion, respectively. The weight of personal loans in the overall consumer loan portfolio increased to 2.7% at December 31, 2022 from 0.8% at December 31, 2021.
Given that 97.1% of Banco Popular’s commercial loans are variable rate mostly referenced either to the 3-month inter-bank rate (IBR) or the 90-day time deposit rate (DTF), average yields on commercial loans increased 434 basis points to 8.6%, slightly below the 528 basis points increase in the average Central Bank rate to 7.2% in 2022 from 1.9% in 2021. On the other hand, given that Banco Popular’s consumer loans are fixed rate and growth was focused in the first half of the year, the average yields on consumer loans only priced in during 2022 a small portion of the rise in reference rates and decreased 44 basis points. Given that average yields on consumer loans in 2022 had a “V” shaped trend, with a bottom in the second quarter of 2022, the average yield for the year decreased when compared to that of 2021. However, during the last quarter of 2022 the yield on consumer loans was 11.5%, 12 basis points higher than in the same quarter of 2021 and 20 basis points higher than the average yield for the year 2022, pointing to a positive trend in repricing of the average balance of consumer loans.
122
The average yield for interest-earning investments in debt securities increased 426 basis points as Banco Popular’s investment portfolio has a sizable exposure to UVR denominated (inflation-linked) sovereign debt securities, for which average yields benefitted from the high inflation rates during 2022. At December 31, 2022, 34.3% of Banco Popular’s interest-earning investments in debt securities were invested in UVR denominated debt securities. In addition, the bank invested in securities at higher yields as the Colombian sovereign yield curve (TES) shifted upwards, following global sovereign fixed income rates and underpinned by the increase in Colombia’s sovereign risk premium. Finally, the average balance of interest-earning investments increased 15.0% or Ps 530.3 billion, which contributed with additional interest income.
Finally, as described in Grupo Aval’s analysis, average funding rates moved upwards in line with the average Central Bank rate. In addition, cost of funds was pressed by competition for stable retail funding and term funding with tenors longer than one year in order to comply with the more demanding NSFR requirements. Pressures on balances and rates built up during the latter part of the year to comply with NSFR requirements. The end of period balance of interest-bearing liabilities increased 12.5% or Ps 3,052.3 billion, driven by a 43.4% or Ps 3,268.6 billion increase in time deposits. The fast-paced growth of time deposits drove the 440 basis points increase in the average rate paid for time deposits, pricing in the majority of the increase in the average Central Bank rate.
Net impairment loss on financial assets
Year ended December 31, | Change, 2022 vs. 2021 | |||||||
| 2022 |
| 2021 |
| # |
| % | |
(in Ps billions) | ||||||||
Impairment loss on loans and other accounts receivable | (225.5) |
| (197.2) |
| (28.3) |
| 14.4 | |
Impairment (loss) recovery on other financial assets | 0.2 |
| (0.6) |
| 0.8 |
| (126.1) | |
Recovery of charged-off financial assets | 43.6 |
| 35.9 |
| 7.7 |
| 21.5 | |
Net impairment loss on financial assets | (181.7) |
| (161.9) |
| (19.8) |
| 12.2 | |
Banco Popular’s impairment loss on loans and other accounts receivable increased 14.4% or Ps 28.3 billion to Ps 225.5 billion. The drivers for this performance will be explained below. For more information regarding risk management measures implemented during 2022 please see “Item 11. Quantitative and Qualitative Disclosures About Market Risk”. In addition, recovery of charged-off financial assets increased 21.5% or Ps 7.7 billion to Ps 43.6 billion in 2022, due to the drivers discussed under Grupo Aval’s analysis.
The following table provides detail by category of impairment loss on loans and other accounts receivable, cost of risk and cost of risk, net. For more information on the calculation methodology please refer to “Item 3. Key Information—A. Selected Financial Data”.
Impairment loss on loans and other accounts receivable | Cost of risk for the | Change, | Cost of risk, net for the | Change, | ||||||||||||||||
Year ended December 31, | Change, 2022 vs. 2021 | year ended December 31, | 2022 vs. 2021 | year ended December 31, | 2022 vs. 2021 | |||||||||||||||
2022 | 2021 | # | % | 2022 | 2021 | basis points | 2022 | 2021 | basis points | |||||||||||
(in Ps billions) | ||||||||||||||||||||
Commercial | 13.5 | (28.8) | 42.3 | (146.8) | (0.2)% | 0.4% | (63) | (0.3)% | 0.4% | (65) | ||||||||||
Consumer | (235.7) | (165.0) | (70.7) | 42.8 | 1.5% | 1.2% | 32 | 1.2% | 0.9% | 31 | ||||||||||
Mortgage | (3.5) | (0.2) | (3.2) | 1,440.6 | 0.3% | 0.0% | 26 | 0.2% | 0.0% | 21 | ||||||||||
Microcredit | 0.1 | 0.1 | (0.1) | (46.7) | (2.5)% | (3.0)% | 49 | (29.2)% | (19.6)% | (959) | ||||||||||
Gross loans | (225.6) | (193.9) | (31.7) | 16.3 | 0.9% | 0.9% | 5 | 0.8% | 0.7% | 4 | ||||||||||
Interbank and overnight funds | 1.8 | (1.7) | 3.5 | N.A. | N.A. | N.A. | N.A. | N.A. | N.A. | N.A. | ||||||||||
Total gross loans | (223.8) | (195.6) | (28.2) | 14.4 | N.A. | N.A. | N.A. | N.A. | N.A. | N.A. | ||||||||||
Other accounts receivable | (1.7) | (1.5) | (0.1) | 7.0 | N.A. | N.A. | N.A. | N.A. | N.A. | N.A. | ||||||||||
Impairment loss on loans and other accounts receivable | (225.5) | (197.2) | (28.3) | 14.4 | 0.9% | 0.9% | 4 | 0.8% | 0.7% | 2 | ||||||||||
Banco Popular’s cost of risk, net remained materially stable at 0.8% driven by an increase in the cost of risk of consumer loans that was partially offset by a decrease in cost of risk of commercial loans. Impairment losses on gross loans increased 16.3% or Ps 31.7 billion in 2022. The Ps 70.7 billion increase impairment losses of consumer loans was driven by a Ps 41.5 billion increase (58.7% of the increase) in impairment losses of personal installment loans. Strong growth of closing balances drove this performance and explained a Ps 38.7 increase in impairment losses of Stage 1 loans. A similar situation was registered in credit cards, for which impairment losses for Stage 1 increased Ps 12.2 billion. The decrease in impairment losses for Stage 2 commercial loans was driven by the reversal of impairment losses booked as overlays or for customers relieved during the pandemic, as borrower’s payment behavior recovered throughout the year.
123
The following table shows Banco de Popular’s gross loan classification by Stages in accordance with IFRS 9 (interbank and overnight funds are not included as they tend to be mostly Stage 1 and with low loss allowance due to their characteristics and short-term nature).
At December 31, | Change, 2022 vs. 2021 | |||||||||||||||||||||||
|---|---|---|---|---|---|---|---|---|---|---|---|---|---|---|---|---|---|---|---|---|---|---|---|---|
2022 | 2021 | Gross | ||||||||||||||||||||||
| Stage 1 |
| Stage 2 |
| Stage 3 |
| Gross loans |
| Stage 1 |
| Stage 2 |
| Stage 3 |
| Gross loans | Stage 1 |
| Stage 2 |
| Stage 3 |
| loans | ||
(in Ps billions) | % | |||||||||||||||||||||||
Commercial |
| 6,910.0 | 11.1 | 513.7 |
| 7,434.9 |
| 5,217.5 |
| 655.1 |
| 549.8 |
| 6,422.4 | 32.4 | (98.3) | (6.6) | 15.8 | ||||||
Consumer |
| 15,475.0 | 436.5 | 611.1 |
| 16,522.6 |
| 14,079.9 |
| 430.9 |
| 483.8 |
| 14,994.6 | 9.9 | 1.3 | 26.3 | 10.2 | ||||||
Mortgages |
| 1,179.3 | 42.6 | 31.0 |
| 1,252.8 |
| 1,135.4 |
| 31.7 |
| 30.3 | 1,197.5 | 3.9 | 34.2 | 2.3 | 4.6 | |||||||
Microcredit |
| 1.5 | 0.0 | 0.7 |
| 2.2 |
| 2.5 |
| 0.1 |
| 0.6 |
| 3.2 | (38.9) | (74.6) | 20.0 | (29.8) | ||||||
Gross loans | 23,565.8 | 490.2 | 1,156.5 | 25,212.5 | 20,435.3 | 1,117.8 | 1,064.5 | 22,617.6 | 15.3 | (56.1) | 8.6 | 11.5 | ||||||||||||
| ||||||||||||||||||||||||
Commercial |
| 92.9% |
| 0.1% |
| 6.9% |
| 100.0% |
| 81.2% |
| 10.2% |
| 8.6% |
| 100.0% | ||||||||
Consumer |
| 93.7% |
| 2.6% |
| 3.7% |
| 100.0% |
| 93.9% |
| 2.9% |
| 3.2% |
| 100.0% | ||||||||
Mortgages |
| 94.1% | 3.4% | 2.5% | 100.0% | 94.8% | 2.6% | 2.5% | 100.0% | |||||||||||||||
Microcredit |
| 69.0% |
| 1.2% |
| 29.8% |
| 100.0% |
| 79.3% |
| 3.3% |
| 17.4% |
| 100.0% | ||||||||
Gross loans | 93.5% | 1.9% | 4.6% | 100.0% | 90.4% | 4.9% | 4.7% | 100.0% | ||||||||||||||||
The quality of Banco Popular’s gross loan portfolio measured by the composition of stages improved in 2022 driven by commercial loans. At December 31, 2022, the balance of Stage 2 loans had decreased 56.1% or Ps 627.6 billion to Ps 490.2 billion. In commercial, Stage 2 loans decreased Ps 644.0 billion to Ps 11.1 billion, due to the drivers mentioned above. In consumer, Stage 2 loans increased Ps 5.7 billion to Ps 436.5 billion, driven by a Ps 15.9 billion increase in net transfers to or from Stage 2 from or to Stage 1 or Stage 3, the majority of which was driven by personal installment loans. Finally, in mortgages, the Ps 10.8 billion increase in Stage 2 loans was explained by a Ps 12.4 billion increase in loans classified as “acceptable above normal risk”.
For further detail on credit risk model overlays and transitioning between stages, refer to Grupo Aval’s analysis. For more information on loss allowance calculations and a description of PD risk categories under IFRS 9, please refer to Note 4.1 of our audited consolidated financial statements.
The following table shows the balance of loans at least 91 days past due, delinquency ratios, charge-offs and charge-offs as a percentage of average gross loans for Banco Popular (interbank and overnight funds are not included as they tend not to be past due or charged-off due to their characteristics and short-term nature).
Loans at least 91 days past due | Delinquency ratio (1) | Change, | ||||||||||||
At December 31, | Change, 2022 vs. 2021 | at December 31, | 2022 vs. 2021 | |||||||||||
2022 | 2021 | # | % | 2022 | 2021 | basis points | ||||||||
| (in Ps billions) | |||||||||||||
Commercial | 301.1 | 261.9 | 39.1 | 14.9 | 4.0% | 4.1% | (3) | |||||||
Consumer | 440.3 | 351.0 | 89.3 | 25.4 | 2.7% | 2.3% | 32 | |||||||
Mortgages |
| 39.8 | 38.0 | 1.8 | 4.7 | 3.2% | 3.2% | 0 | ||||||
Microcredit |
| 0.7 | 0.5 | 0.1 | 25.2 | 29.5% | 16.5% | 1,297 | ||||||
Gross loans |
| 781.8 | 651.4 | 130.4 | 20.0 | 3.1% | 2.9% | 22 | ||||||
Charge-offs | Charge-offs as a percentage | Change, | ||||||||||||
At December 31, | Change, 2022 vs. 2021 | of average gross loans | 2022 vs. 2021 | |||||||||||
2022 | 2021 | # | % | 2022 | 2021 | basis points | ||||||||
| (in Ps billions) | |||||||||||||
Commercial | 10.9 | 45.4 | (34.6) | (76.1) | 0.2% | 0.7% | (53) | |||||||
Consumer | 171.8 | 189.6 | (17.7) | (9.4) | 1.1% | 1.3% | (26) | |||||||
Mortgages |
| 4.4 | 0.5 | 3.9 | 729.2 | 0.4% | 0.0% | 31 | ||||||
Microcredit |
| 0.1 | 0.5 | (0.5) | (87.2) | 2.5% | 12.6% | (1,007) | ||||||
Total charge-offs |
| 187.1 | 236.0 | (48.9) | (20.7) | 0.8% | 1.1% | (30) | ||||||
(1) | Calculated as loans past due more than 90 days divided by gross loans. |
Delinquency coverage ratio for gross loans, measured as loss allowance divided by past due gross loans more than 90 days was 159.7% in 2022 and 168.8% in 2021. Charge-offs decreased as a percentage of average gross loans. The decrease in the ratio of charge-offs to average
124
gross loans in addition to a slightly higher formation of loans at least 91 days past due, led to a deterioration in the delinquency ratio of payroll loans that explained the majority of the 32 basis points increase in the ratio of consumer loans.
Net income from commissions and fees
Year ended December 31, | Change, 2022 vs. 2021 | |||||||
| 2022 |
| 2021 |
| # |
| % | |
(in Ps billions) | ||||||||
Banking fees |
| 176.9 |
| 175.7 |
| 1.2 |
| 0.7 |
Bonded warehouse services |
| 67.1 |
| 58.3 |
| 8.7 |
| 15.0 |
Trust activities and portfolio management services |
| 27.2 |
| 22.2 |
| 4.9 |
| 22.1 |
Pension fund management |
| 0.9 |
| 1.5 |
| (0.7) |
| (43.5) |
Income from commissions and fees |
| 272.0 |
| 257.8 |
| 14.2 |
| 5.5 |
Expenses from commissions and fees |
| (68.9) |
| (63.7) |
| (5.2) |
| 8.1 |
Net income from commissions and fees |
| 203.1 |
| 194.1 |
| 9.1 |
| 4.7 |
Income from commissions and fees increased 5.5% or Ps 14.2 billion. Bonded warehouse services and trust activities and portfolio management services explained most of this result, increasing 15.0% or Ps 8.7 billion and 22.1% or Ps 4.9 billion respectively. Banking service fees increased 0.7% or Ps 1.2 billion, driven by a 27.6% or Ps 10.5 billion increase in debit and credit card fees that was partially offset by a 6.7% or Ps 9.1 billion decrease in banking service fees. Debit and credit card fees performance was driven by a 59.6% or Ps 10.8 billion increase in fees from merchant acquiring as domestic consumption was strong throughout the first nine months of the year. Banking service fees decreased due to a decrease in bancassurance fees as originations for consumer loans were slower than in 2021. Expenses form commissions and fees increased 8.1% or Ps 5.2 billion, driven by an increase in transactional activity and fees paid in relation to income from commissions and fees.
Net trading income
Banco Popular’s net trading income was Ps 1.7 billion in 2022 or Ps 16.8 billion lower than in 2021. This resulted from a Ps 27.7 billion decrease in net trading income from derivatives, partially offset by a Ps 11.0 billion increase in income from investment securities at fair value through profit or loss. The performance of net trading income from derivatives was offset by a Ps 34.4 billion increase in foreign exchange gains (losses), net, recognized under other income.
Total income from investment securities
Banco Popular’s securities portfolio is classified in the following categories: (i) equity and fixed income investments at FVTPL (described in this section as net trading income in investment securities at FVTPL), (ii) fixed income investments at FVOCI and (iii) fixed income investments at AC (results from (ii) and (iii) are included in net interest income as interest income on investments in debt securities). Banco Popular manages its investment portfolio in a comprehensive and integral manner that considers individual return of each one of these three categories and the total return of the investment securities portfolio.
Total income from investment securities for Banco Popular (comprised of interest income on investments in debt securities and net trading income from investment securities at FVTPL) was Ps 370.4 billion for 2022, 126.9% or Ps 207.2 billion higher than in 2021. This was primarily driven by a 421 basis points increase in the average yield to 8.4% in 2022 and a 15.0% or Ps 530.3 billion increase in the average balance of total investment securities to Ps 4,070.9 billion in 2022. The main drivers for this performance were discussed above in net interest income.
Other income
Year ended December 31, | Change, 2022 vs. 2021 | |||||||
| 2022 |
| 2021 |
| # |
| % | |
(in Ps billions) |
| |||||||
Foreign exchange gains (losses), net | 45.5 |
| 11.1 | 34.4 |
| 310.1 | ||
Share of profit of equity accounted investees, net of tax (Equity method) | 92.2 |
| 67.2 | 24.9 |
| 37.1 | ||
Net gain (loss) on sale of debt and equity securities | 2.6 |
| 16.6 | (14.0) |
| (84.2) | ||
Dividends | 14.7 |
| 7.7 | 7.1 |
| 92.2 | ||
Gain on sale of property, plant and equipment | 18.9 | 2.7 | 16.2 |
| 599.4 | |||
Net gain (loss) in asset valuation | 12.6 |
| (3.1) | 15.7 |
| (507.1) | ||
Other | 31.0 |
| 32.4 | (1.5) |
| (4.5) | ||
Other income | 217.6 |
| 134.7 | 82.9 |
| 61.6 | ||
125
Other income increased 61.6% or Ps 82.9 billion. The Ps 34.4 billion increase in foreign exchange gains (losses), net to a Ps 45.5 billion net gain should be analyzed in conjunction with net trading income from derivatives. The net result of both activities (foreign exchange and derivatives) for 2022 was a Ps 25.8 billion gain compared to a Ps 19.2 billion gain in 2021. Share of profit of equity accounted investees, net of tax (equity method) increased 37.1% or Ps 24.9 billion driven by the 35.2% increase in attributable net income of Corficolombiana. Banco Popular recorded a Ps 16.2 billion increase in gain on the sale of property, plant and equipment (as fair value of derecognized PP&E was higher than book value) and a Ps 15.7 billion increase in net gain (loss) in asset valuation mainly explained by favorable valuation of investment properties in 2022, associated with the aforementioned PP&E structure optimization. In 2022, Banco Popular continued its PP&E structure optimization program by transferring some non-strategic property plant and equipment in exchange for equity in NEXUS Real Estate Capital Funds (a private equity fund specialized in real estate management), which helped somewhat mitigate the negative effects of the rising interest rate context on the bank’s results. The Ps 14.0 billion decrease in net gain on sale of debt and equity securities was explained by temporary favorable conditions in fixed income markets during 2021 that were not present in 2022.
Other expenses
| Year ended December 31, |
| Change, 2022 vs. 2021 | |||||
| 2022 |
| 2021 |
| # |
| % | |
(in Ps billions) |
| |||||||
Personnel expenses | (462.1) |
| (450.4) | (11.7) |
| 2.6 | ||
Administrative and other expenses | (778.1) |
| (745.6) | (32.5) |
| 4.4 | ||
Depreciation and amortization | (96.6) |
| (100.1) | 3.4 |
| (3.4) | ||
Impairment loss on other assets | (0.6) |
| (3.7) | 3.1 |
| (84.4) | ||
Other | (18.3) |
| (6.3) | (12.0) |
| 189.9 | ||
Other expenses | (1,355.7) |
| (1,306.1) | (49.6) |
| 3.8 | ||
During 2022, Banco Popular focused part of its efforts on cost containment to face the headwinds from the aforementioned drivers on net interest income. Other expenses increased 3.8% or Ps 49.6 billion well below the 13.1% inflation rate for 2022. Administrative and other expenses drove the performance of other expenses with a 4.4% or Ps 32.5 billion increase. As explained under Grupo Aval’s analysis the increase in the industry and commerce tax (ICA) heavily impacted Banco Popular, with operating taxes constituting the main driver for expense growth with a 30.3% or Ps 36.2 billion increase, explaining 4.9% of growth in administrative and other expenses. The remaining administrative expenses decreased by Ps 3.7 billion. The increase 2.6% or Ps 11.7 billion increase in personnel expenses results from a 9.8% or Ps 38.8 billion increase in salaries and employee benefits that was partially offset by a 49.2% or Ps 27.1 billion decrease in labor severances and bonus plan payments. For reference, the minimum wage in Colombia increased by 10.0% in 2022. The Ps 12.0 billion increase in other is mainly attributable to a Ps 9.8 billion increase in losses related to the sale of property, plant and equipment.
Given that Banco Popular’s other expenses increased by 3.8% and its total income before net impairment losses on financial assets (defined as the sum of net interest income, net income from commissions and fees, net trading income and other income) decreased by 18.2%, the cost to income efficiency ratio increased to 85.5% in 2022 from 67.4% in 2021. The ratio of other expenses as a percentage of average assets decreased to 4.3% in 2022 from 4.6% in 2021.
Tax expense
Income tax expense for Banco Popular decreased by Ps 187.4 billion, to a Ps 31.7 billion recovery in 2022. This was driven by a Ps 454.0 billion decrease in income before income tax expense excluding dividends and the equity method (as both are non-taxable income). Banco Popular’s tax rate, calculated as income tax expense divided by income before income tax expense excluding dividends and the equity method (as both are non-taxable income), was 54.1% in 2022 and 39.4% in 2021.
Net income attributable to non-controlling interest
Net income attributable to non-controlling interest is not a significant contributor to net income for Banco Popular and is responsible for only -0.3% of net income for 2022 and 0.4% for 2021.
126
Banco AV Villas
Overview
Banco AV Villas’ net income attributable to owners of the parent for the year ended December 31, 2022 was Ps 103.4 billion, decreasing 46.1% or Ps 88.4 billion compared to the year ended December 31, 2021. The following discussion describes the main drivers of Banco AV Villas’ results of operations for the year ended December 31, 2022 compared to the year ended December 31, 2021.
Banco AV Villas | ||||||||
For the year ended | Change 2022 vs | |||||||
December 31, | 2021 | |||||||
| 2022 |
| 2021 |
| # |
| % | |
(in Ps billions) | ||||||||
Total interest income |
| 1,664.2 |
| 1,306.1 |
| 358.1 |
| 27.4 |
Total interest expense |
| (764.4) |
| (238.0) |
| (526.4) |
| 221.2 |
Net interest income |
| 899.8 |
| 1,068.1 |
| (168.3) |
| (15.8) |
Impairment loss on loans and other accounts receivable |
| (234.6) |
| (207.0) |
| (27.5) |
| 13.3 |
Impairment (loss) recovery on other financial assets |
| (0.0) |
| (0.3) |
| 0.3 |
| (94.6) |
Recovery of charged-off financial assets |
| 76.7 |
| 57.9 |
| 18.9 |
| 32.6 |
Net impairment loss on financial assets |
| (157.8) |
| (149.5) |
| (8.4) |
| 5.6 |
Net interest income, after impairment losses | 742.0 | 918.6 | (176.6) |
| (19.2) | |||
Net income from commissions and fees |
| 118.5 |
| 93.1 |
| 25.4 |
| 27.3 |
Net trading income (loss) |
| 6.2 |
| (0.6) |
| 6.8 |
| (1,102.9) |
Other income |
| 58.8 |
| 28.9 |
| 29.9 |
| 103.7 |
Other expenses |
| (794.1) |
| (730.9) |
| (63.2) |
| 8.6 |
Net income before tax expense |
| 131.3 |
| 309.0 |
| (177.6) |
| (57.5) |
Income tax expense |
| (27.6) |
| (116.7) |
| 89.2 |
| (76.4) |
Net income for the year |
| 103.8 |
| 192.2 |
| (88.5) |
| (46.0) |
Net income for the year attributable to: |
|
|
|
|
| |||
Owners of the parent |
| 103.4 |
| 191.8 |
| (88.4) |
| (46.1) |
Non-controlling interest |
| 0.4 |
| 0.4 |
| (0.1) |
| (14.0) |
Net interest income
Net interest income decreased 15.8% or Ps 168.3 billion to Ps 899.8 billion in 2022. Interest expense increased 221.2% or Ps 526.4 billion, more than the increase in total interest income, due to a 336 basis points increase in the average interest rate paid on interest-bearing funding, in addition to a 11.6% or Ps 1,540.1 billion increase in average balance of interest-bearing funding. Total interest income increased 27.4% or Ps 358.1 billion driven by a 133 basis point increase in the average yield of interest-earning assets in addition to a 10.2% or Ps 1,570.5 billion increase in average balance of interest-earning assets. Yields and rates paid increased rapidly due to monetary policy in place throughout the year, a tighter liquidity environment and due to additional pressures coming from more demanding NSFR requirements, which drove the increase in the cost of interest-bearing deposits. The interest spread between the average yield on gross loans and the average rate paid on interest-bearing deposits decreased by 216 basis points to 6.0%. In turn, net interest margin contracted by 164 basis points to 5.3%. The main drivers impacting interest-earning assets and interest-bearing funding during 2022, are as described under Grupo Aval’s analysis.
Average balance of interest-earning assets | Net interest margin for | Net interest income for the | ||||||||||||||||
for the year ended December 31, | Change, 2022 vs. 2021 | the year ended December 31, | year ended December 31, | Change, 2022 vs. 2021 | ||||||||||||||
2022 |
| 2021 |
| # |
| % |
| 2022 |
| 2021 |
| 2022 |
| 2021 | # |
| % | |
(in Ps billions) | (in Ps billions) | |||||||||||||||||
16,893.3 | 15,322.8 | 1,570.5 | 10.2 | 5.3% |
| 7.0% | 899.8 | 1,068.1 | (168.3) | (15.8) | ||||||||
The following tables show: (i) the average balance, average yield and interest income on interest-earning assets with an analysis of impacts derived from changes in the average balance and the average yield, per type of interest-earning asset; interbank and overnight funds are shown separate from gross loans due to their characteristics and short-term nature, (ii) the average balance, average rate paid and interest expense on interest-bearing funding with an analysis of impacts derived from changes in the average balance and the average rate, per type of interest-bearing funding, and (iii) net interest margin and net interest income.
127
(i) | Average balance for the | Average yield for the | Interest income for the | Impact on interest income | Change, 2022 | |||||||||||||||||||
|---|---|---|---|---|---|---|---|---|---|---|---|---|---|---|---|---|---|---|---|---|---|---|---|---|
year ended December 31, | Change, 2022 vs. 2021 | year ended December 31, | year ended December 31, | due to changes in | vs. 2021 | |||||||||||||||||||
| 2022 |
| 2021 |
| # |
| % |
| 2022 |
| 2021 |
| 2022 |
| 2021 |
| Balance |
| Yield | Total |
| % | ||
(in Ps billions) | (in Ps billions) | (in Ps billions) | ||||||||||||||||||||||
Commercial |
| 3,014.6 |
| 2,552.6 |
| 462.0 |
| 18.1 |
| 9.5% |
| 5.0% |
| 285.9 |
| 127.8 |
| 43.8 |
| 114.3 | 158.1 |
| 123.7 | |
Consumer |
| 8,507.9 |
| 7,396.3 |
| 1,111.6 |
| 15.0 |
| 11.8% |
| 11.5% |
| 1,003.0 |
| 849.7 |
| 131.0 |
| 22.3 | 153.3 |
| 18.0 | |
Mortgages |
| 2,590.7 |
| 2,468.0 |
| 122.7 |
| 5.0 |
| 9.5% |
| 9.7% |
| 245.3 |
| 238.6 |
| 11.6 |
| (4.9) | 6.7 |
| 2.8 | |
Microcredit |
| 0.2 |
| 0.4 |
| (0.2) |
| (58.6) |
| 20.5% |
| 15.8% |
| 0.0 |
| 0.1 |
| (0.0) |
| 0.0 | (0.0) |
| (46.5) | |
Gross loans |
| 14,113.4 |
| 12,417.3 |
| 1,696.1 |
| 13.7 |
| 10.9% |
| 9.8% |
| 1,534.3 |
| 1,216.2 |
| 184.4 |
| 133.7 | 318.1 |
| 26.2 | |
Interbank and overnight funds | 16.2 |
| 113.9 |
| (97.7) |
| (85.8) |
| 12.1% |
| 1.8% |
| 2.0 |
| 2.0 |
| (11.8) |
| 11.7 | (0.1) |
| (4.1) | ||
Total gross loans | 14,129.6 |
| 12,531.2 |
| 1,598.4 |
| 12.8 |
| 10.9% |
| 9.7% |
| 1,536.2 |
| 1,218.2 |
| 173.8 |
| 144.2 | 318.0 |
| 26.1 | ||
Investments in debt securities | 2,763.7 |
| 2,791.6 |
| (27.8) |
| (1.0) |
| 4.6% |
| 3.1% |
| 128.0 |
| 87.9 |
| (1.3) |
| 41.4 | 40.1 |
| 45.7 | ||
Total interest-earning assets |
| 16,893.3 |
| 15,322.8 |
| 1,570.5 |
| 10.2 |
| 9.9% |
| 8.5% |
| 1,664.2 |
| 1,306.1 |
| 154.7 |
| 203.4 | 358.1 |
| 27.4 | |
(ii) | Average balance for the | Average rate paid for the | Interest expense for the | Impact on interest expense | Change, 2022 | |||||||||||||||||||
year ended December 31, | Change, 2022 vs. 2021 | year ended December 31, | year ended December 31, | due to changes in | vs. 2021 | |||||||||||||||||||
| 2022 |
| 2021 |
| # |
| % |
| 2022 |
| 2021 |
| 2022 |
| 2021 | Balance |
| Rate | Total | % | ||||
(in Ps billions) | (in Ps billions) | (in Ps billions) | ||||||||||||||||||||||
Checking accounts |
| 158.8 |
| 186.4 |
| (27.6) |
| (14.8) |
| 1.0% |
| 0.5% |
| (1.6) |
| (1.0) | 0.3 |
| (0.9) | (0.7) | 67.4 | |||
Time deposits |
| 3,584.5 |
| 3,386.3 |
| 198.2 |
| 5.9 |
| 7.0% |
| 2.9% |
| (250.6) |
| (98.4) | (13.9) |
| (138.3) | (152.2) | 154.7 | |||
Savings accounts |
| 8,970.9 |
| 8,456.0 |
| 514.9 |
| 6.1 |
| 4.1% |
| 1.1% |
| (367.0) |
| (96.7) | (21.1) |
| (249.3) | (270.3) | 279.6 | |||
Total interest-bearing deposits |
| 12,714.2 |
| 12,028.7 |
| 685.4 |
| 5.7 |
| 4.9% |
| 1.6% |
| (619.2) |
| (196.0) | (33.4) |
| (389.8) | (423.2) | 215.9 | |||
Interbank borrowings and overnight funds | 1,226.3 | 602.4 | 623.9 |
| 103.6 |
| 7.2% |
| 2.4% |
| (88.9) |
| (14.7) | (45.2) |
| (29.0) | (74.2) | 505.0 | ||||||
Borrowings from banks and others | 357.4 | 271.1 | 86.3 |
| 31.9 |
| 7.9% |
| 4.0% |
| (28.1) |
| (11.0) | (6.8) |
| (10.4) | (17.2) | 156.7 | ||||||
Bonds issued | 461.2 | 401.0 | 60.1 |
| 15.0 |
| 5.5% |
| 4.0% |
| (25.3) |
| (16.1) | (3.3) |
| — | (3.3) | 56.9 | ||||||
Borrowings from development entities | 95.4 | 11.1 | 84.3 |
| 757.0 |
| 3.0% |
| 2.0% |
| (2.9) |
| (0.2) | (2.5) |
| (0.1) | (2.7) | 1,220.2 | ||||||
Other funding | 2,140.4 | 1,285.6 | 854.7 |
| 66.5 |
| 6.8% |
| 3.3% |
| (145.2) |
| (42.0) | (58.0) |
| (45.2) | (103.2) | 245.7 | ||||||
Total interest-bearing funding | 14,854.5 | 13,314.4 | 1,540.1 |
| 11.6 |
| 5.1% |
| 1.8% |
| (764.4) | (238.0) | (79.3) |
| (447.1) | (526.4) | 221.2 | |||||||
Banco AV Villas’ average balance of gross loans increased 13.7% or Ps 1,696.1 billion in 2022 and the average yield was 10.9%, 108 basis points higher than in 2021. Average balances grew slower than closing balances (14.4%), explained by stronger growth toward the second half of the year, particularly in consumer loans. Commercial loans increased 18.1% on average balances and increased 14.6% at end of period. Consumer loan growth of average and end of period balances was 15.0% and 19.1%, respectively. In 2022, Banco AV Villas shifted its secured-product driven focus, in place for the last three years, reactivating unsecured products; seeking to increase its presence in segments that started to recover from the negative impacts of the pandemic and to benefit from the increase in interest rates for new originations. As a result, the end of period balance for personal loans increased 43.4%, credit cards grew 19.6% and payroll loans grew 12.9%, respectively.
Given that 72.4% of Banco AV Villas’ commercial loans are variable rate, mostly referenced either to the 3-month inter-bank rate (IBR) or the 90-day time deposit rate (DTF), average yields on commercial loans increased 448 basis points to 9.5%, slightly below the 528 basis points increase in the average Central Bank rate to 7.2% in 2022 from 1.9% in 2021. On the other hand, given that Banco AV Villas’ consumer loans are fixed rate, the average yields on consumer loans only priced in a small portion of the rise in reference rates during 2022 and increased 30 basis points.
Average interest-earning investments in debt securities remained materially stable over the year with a 1.0% or Ps 27.8 billion decrease. The average yield for interest-earning investments in debt securities increased 148 basis points as Banco AV Villas invested in securities at higher yields as the Colombian sovereign yield curve (TES) shifted upwards, following global sovereign fixed income rates and the increase in Colombia’s sovereign risk premium.
Finally, as described in Grupo Aval’s analysis, average funding rates moved upwards in line with the average Central Bank rate. In addition, cost of funds was pressed by competition for stable retail funding and term funding with tenors longer than one year in order to comply with the more demanding NSFR requirements. Pressures on balances and rates built up during the latter part of the year to comply with NSFR requirements. The end of period balance of interest-bearing liabilities increased 16.4% or Ps 2,252.0 billion, driven by a 40.0% or Ps 1,199.7 billion increase in time deposits, a Ps 408.0 billion increase in borrowings from development entities and a 3.4% or Ps 297.4 billion increase in savings accounts. The fast-paced growth of time deposits drove the 409 basis points increase in the average rate paid for time deposits, pricing in the majority of the increase in the average Central Bank rate.
128
Net impairment loss on financial assets
Year ended December 31, | Change, 2022 vs. 2021 | |||||||
| 2022 |
| 2021 |
| # |
| % | |
(in Ps billions) |
| |||||||
Impairment loss on loans and other accounts receivable |
| (234.6) |
| (207.0) |
| (27.5) |
| 13.3 |
Impairment (loss) recovery on other financial assets | (0.0) |
| (0.3) |
| 0.3 |
| (94.6) | |
Recovery of charged-off financial assets |
| 76.7 |
| 57.9 |
| 18.9 |
| 32.6 |
Net impairment loss on financial assets |
| (157.8) |
| (149.5) |
| (8.4) |
| 5.6 |
Banco AV Villas’ impairment loss on loans and other accounts receivable increased 13.3% or Ps 27.5 billion to Ps 234.6 billion, driven by the growth of the end of period loan portfolio. The bank achieved a 32.6% or Ps 18.9 billion increase in recovery of charged-off financial assets, leveraged on improved economic conditions and enhanced collection processes.
The following table provides detail by category of impairment loss on loans and other accounts receivable, cost of risk and cost of risk, net. For more information on the calculation methodology please refer to “Item 3. Key Information—A. Selected Financial Data”.
Impairment loss on loans and other accounts receivable | Cost of risk for the | Change, | Cost of risk, net for the | Change, | ||||||||||||||||
Year ended December 31, | Change, 2022 vs. 2021 | year ended December 31, | 2022 vs. 2021 | year ended December 31, | 2022 vs. 2021 | |||||||||||||||
2022 | 2021 | # | % | 2022 | 2021 | basis points | 2022 | 2021 | basis points | |||||||||||
(in Ps billions) | ||||||||||||||||||||
Commercial | 5.9 | (27.5) | 33.4 | (121.6) | (0.2)% | 1.1% | (127) | (0.2)% | 1.1% | (129) | ||||||||||
Consumer | (235.1) | (180.5) | (54.5) | 30.2 | 2.8% | 2.4% | 32 | 1.9% | 1.7% | 20 | ||||||||||
Mortgage | (3.4) | 0.9 | (4.3) | (475.9) | 0.1% | 0.0% | 17 | 0.1% | (0.1)% | 18 | ||||||||||
Microcredit | (0.0) | 0.0 | (0.0) | (111.3) | 2.6% | (9.5)% | 1,205 | 2.6% | (11.2)% | 1,382 | ||||||||||
Gross loans | (232.6) | (207.0) | (25.5) | 12.3 | 1.6% | 1.7% | (2) | 1.1% | 1.2% | (10) | ||||||||||
Interbank and overnight funds | (0.0) | (0.0) | (0.0) | N.A. | N.A. | N.A. | N.A. | N.A. | N.A. | N.A. | ||||||||||
Total gross loans | (232.6) | (207.0) | (25.5) | 12.3 | N.A. | N.A. | N.A. | N.A. | N.A. | N.A. | ||||||||||
Other accounts receivable | (2.0) | (0.0) | (2.0) | 18,818.3 | N.A. | N.A. | N.A. | N.A. | N.A. | N.A. | ||||||||||
Impairment loss on loans and other accounts receivable | (234.6) | (207.0) | (27.5) | 13.3 | 1.7% | 1.7% | (1) | 1.1% | 1.2% | (8) | ||||||||||
Banco de AV Villas’ cost of risk remained materially flat while improving 10 basis points when including recoveries of charged-off assets, driven by an improvement in commercial loans and a deterioration in other loan categories. The Ps 25.5 billion increase in impairment losses on gross loans is explained by a Ps 12.3 billion increase in impairment losses for Stage 1 loans, a Ps 34.1 billion increase in impairment losses for Stage 2 loans, and a Ps 20.9 billion decrease in impairment losses for Stage 3 loans. The increase in impairment losses for Stage 1 loans is attributable to organic growth of the loan portfolio across all categories. The increase of impairment losses for Stage 2 loans was driven by a Ps 31.8 billion increase in impairment losses for consumer loans and is explained by deterioration in the asset quality of personal loans and credit cards, that rolled into Stage 3 and were ultimately charged-off. Finally, the decrease of impairment losses for Stage 3 loans was driven by a Ps 14.4 billion decrease in impairment losses for consumer loans and a Ps 7.7 billion decrease in commercial loans, as the portion of the portfolio rolling to this stage decreased as compared to a year earlier.
The following table shows Banco AV Villas’ gross loan classification by Stages in accordance with IFRS 9 (interbank and overnight funds are not included as they tend to be mostly Stage 1 and with low loss allowance due to their characteristics and short-term nature).
At December 31, | Change, 2022 vs. 2021 | |||||||||||||||||||||||
2022 | 2021 | Gross | ||||||||||||||||||||||
| Stage 1 |
| Stage 2 |
| Stage 3 |
| Gross loans |
| Stage 1 |
| Stage 2 |
| Stage 3 |
| Gross loans | Stage 1 |
| Stage 2 |
| Stage 3 |
| loans | ||
(in Ps billions) | % | |||||||||||||||||||||||
Commercial |
| 2,980.9 | 18.4 | 172.3 |
| 3,171.6 |
| 2,507.3 |
| 71.4 |
| 188.3 |
| 2,767.0 | 18.9 | (74.2) | (8.5) | 14.6 | ||||||
Consumer |
| 8,427.2 | 533.8 | 287.6 |
| 9,248.6 |
| 6,505.2 |
| 995.2 |
| 262.8 |
| 7,763.2 | 29.5 | (46.4) | 9.4 | 19.1 | ||||||
Mortgages |
| 2,383.6 | 103.3 | 97.5 |
| 2,584.4 |
| 2,383.8 |
| 108.4 |
| 91.9 | 2,584.1 | (0.0) | (4.7) | 6.1 | 0.0 | |||||||
Microcredit |
| 0.1 | — | 0.0 |
| 0.2 |
| 0.2 |
| 0.0 |
| 0.0 |
| 0.2 | (26.9) | (100.0) | 33.1 | (28.4) | ||||||
Gross loans | 13,791.8 | 655.5 | 557.4 | 15,004.8 | 11,396.5 | 1,175.0 | 543.0 | 13,114.5 | 21.0 | (44.2) | 2.7 | 14.4 | ||||||||||||
| ||||||||||||||||||||||||
Commercial |
| 94.0% |
| 0.6% |
| 5.4% |
| 100.0% |
| 90.6% |
| 2.6% |
| 6.8% |
| 100.0% | ||||||||
Consumer |
| 91.1% |
| 5.8% |
| 3.1% |
| 100.0% |
| 83.8% |
| 12.8% |
| 3.4% |
| 100.0% | ||||||||
Mortgages |
| 92.2% | 4.0% | 3.8% | 100.0% | 92.2% | 4.2% | 3.6% | 100.0% | |||||||||||||||
Microcredit |
| 76.7% |
| 0.0% |
| 23.3% |
| 100.0% |
| 75.1% |
| 12.4% |
| 12.6% |
| 100.0% | ||||||||
Gross loans | 91.9% | 4.4% | 3.7% | 100.0% | 86.9% | 9.0% | 4.1% | 100.0% | ||||||||||||||||
129
The quality of Banco AV Villas’ gross loan portfolio measured by the composition of stages improved in 2022 across most categories of loans. At December 31, 2022, the balance of Stage 2 loans had decreased 44.2% or Ps 519.5 billion to Ps 655.5 billion. In consumer, Stage 2 loans decreased Ps 461.5 billion to Ps 533.8 billion, due to a Ps 379.0 billion decrease in the balance of payroll loans classified as “normal risk” that transitioned to Stage 1, and a Ps 91.9 billion and Ps 12.2 billion decrease in personal loans and credit cards, respectively that transitioned to stage 3 and were ultimately charged-off. Finally, in commercial loans overlays were removed and led to a Ps 34.4 billion decrease in the balance of Stage 2 loans classified as “normal risk”.
For more information on loss allowance calculations and a description of PD risk categories under IFRS 9, please refer to Note 4.1 of our audited consolidated financial statements.
The following table shows the balance of loans at least 91 days past due, delinquency ratios, charge-offs and charge-offs as a percentage of average gross loans for Banco AV Villas (interbank and overnight funds are not included as they tend not to be past due or charged-off due to their characteristics and short-term nature).
Loans at least 91 days past due | Delinquency ratio (1) | Change, | ||||||||||||
At December 31, | Change, 2022 vs. 2021 | at December 31, | 2022 vs. 2021 | |||||||||||
2022 | 2021 | # | % | 2022 | 2021 | basis points | ||||||||
| (in Ps billions) | |||||||||||||
Commercial | 88.4 | 102.6 | (14.2) | (13.9) | 2.8% | 3.7% | (92) | |||||||
Consumer | 281.5 | 254.1 | 27.5 | 10.8 | 3.0% | 3.3% | (23) | |||||||
Mortgages |
| 113.8 | 110.4 | 3.4 | 3.1 | 4.4% | 4.3% | 13 | ||||||
Microcredit |
| 0.0 | 0.0 | 0.0 | 33.1 | 23.3% | 12.6% | 1,079 | ||||||
Gross loans |
| 483.8 | 467.2 | 16.6 | 3.6 | 3.2% | 3.6% | (34) | ||||||
Charge-offs | Charge-offs as a percentage | Change, | ||||||||||||
At December 31, | Change, 2022 vs. 2021 | of average gross loans | 2022 vs. 2021 | |||||||||||
2022 | 2021 | # | % | 2022 | 2021 | basis points | ||||||||
| (in Ps billions) | |||||||||||||
Commercial | 0.9 | 3.0 | (2.1) | (71.1) | 0.0% | 0.1% | (9) | |||||||
Consumer | 202.8 | 162.7 | 40.1 | 24.6 | 2.4% | 2.2% | 18 | |||||||
Mortgages |
| 1.1 | 1.4 | (0.4) | (25.1) | 0.0% | 0.1% | (2) | ||||||
Microcredit |
| — | 0.0 | (0.0) | (100.0) | 0.0% | 2.0% | (203) | ||||||
Total charge-offs |
| 204.8 | 167.2 | 37.6 | 22.5 | 1.5% | 1.3% | 10 | ||||||
(1) | Calculated as loans past due more than 90 days divided by gross loans. |
At December 31, 2022, asset quality measured by loans at least 91 days past due had improved 34 basis points to 3.2% as compared to a year earlier, driven by the improvement of consumer and commercial loans. In particular, credit cards and personal loans contributed with 33 and 8 basis points of the improvement in the delinquency ratio of consumer loans aided by a higher rate of charge-offs. Payroll loans showed a slight deterioration in asset quality to 1.23% in 2022 from 0.86% in 2021, that contributed 20 pbs to the increase in the delinquency ratio of consumer loans. Delinquency coverage ratio for gross loans, measured as loss allowance divided by past due gross loans more than 90 days was 119.3% in 2022 and 115.0% in 2021. Charge-offs increased as a percentage of average gross loans, mainly in consumer loans and driven by the deterioration of personal loans and credit cards.
Net income from commissions and fees
| Year ended December 31, |
| Change, 2022 vs. 2021 | |||||
| 2022 |
| 2021 |
| # |
| % | |
(in Ps billions) |
| |||||||
Banking fees | 333.6 |
| 298.7 |
| 34.9 |
| 11.7 | |
Income from commissions and fees | 333.6 |
| 298.7 |
| 34.9 |
| 11.7 | |
Expenses from commissions and fees | (215.1) |
| (205.6) |
| (9.5) |
| 4.6 | |
Net income from commissions and fees | 118.5 |
| 93.1 |
| 25.4 |
| 27.3 | |
Income from commissions and fees increased as a direct result of an 11.7% or Ps 34.9 billion increase in banking fees. The main drivers for this increase are the same as those discussed under Grupo Aval’s analysis. Debit and credit card fees increased 14.3% or Ps 13.8 billion, driven by a 35.2% or Ps 14.4 billion increase in fees from merchant acquiring as domestic consumption was strong throughout the first nine months of the year. Banking service fees increased 7.5% or Ps 13.8 billion, and branch network services increased 54.5% or Ps 7.4 billion. The 4.6% or Ps 9.5 billion increase in expenses from commissions and fees is related to growth in income from banking service fees and branch network services.
130
Net trading income (loss)
Banco AV Villas’ net trading income was Ps 6.2 billion in 2022, Ps 6.8 billion higher than the Ps 0.6 billion loss in 2021, resulting from a Ps 6.8 billion increase income from investment securities at fair value through profit or loss and stable results in net trading income from derivatives.
Total income from investment securities
Banco AV Villas’ securities portfolio is classified in the following categories: (i) equity and fixed income investments at FVTPL (described in this section as net trading income in investment securities at FVTPL), (ii) fixed income investments at FVOCI and (iii) fixed income investments at AC (results from (ii) and (iii) are included in net interest income as interest income on investments in debt securities). Banco AV Villas manages its investment portfolio in a comprehensive and integral manner that considers the individual return of each one of these three categories and the total return of the investment securities portfolio.
Total income from investment securities for Banco AV Villas (comprised of interest income on investments in debt securities and net trading income from investment securities at FVTPL) was Ps 137.5 billion for 2022, 51.8% or Ps 46.9 billion more than in 2021. This was primarily driven by a 174 basis points decrease in the average yield on total investment securities to 4.6% in 2022 from 2.9% in 2021, resulting in a Ps 54.3 billion increase in interest income, which was partially offset by a 5.1% or Ps 158.7 billion decrease in the average balance of total investment securities to Ps 2,958.2 billion in 2022, resulting in a Ps 7.4 billion decrease in interest income. The main drivers for this performance were discussed above in net interest income.
Other income
| Year ended December 31, |
| Change, 2022 vs. 2021 | |||||
| 2022 |
| 2021 |
| # |
| % | |
(in Ps billions) |
| |||||||
Foreign exchange gains (losses), net | 3.0 |
| 1.7 | 1.3 |
| 76.2 | ||
Share of profit of equity accounted investees, net of tax (Equity method) | 1.4 |
| 1.6 | (0.2) |
| (12.1) | ||
Net gain (loss) on sale of debt and equity securities | 0.1 |
| 4.2 | (4.2) |
| (98.5) | ||
Dividends | 7.3 |
| 4.6 | 2.8 |
| 60.9 | ||
Gain (loss) on the sale of non-current assets held for sale | 0.1 |
| 0.0 | 0.0 |
| 29.1 | ||
Gain on sale of property, plant and equipment | 16.4 | 0.8 | 15.5 |
| 1,828.1 | |||
Net gain (loss) in asset valuation | 4.1 |
| 0.2 | 3.9 |
| 1,992.2 | ||
Other | 26.4 |
| 15.6 | 10.8 |
| 68.8 | ||
Other income | 58.8 |
| 28.9 | 29.9 |
| 103.7 | ||
Other income increased 103.7% or Ps 29.9 billion. During the last quarter of 2022, Banco AV Villas continued its PP&E structure optimization program by transferring some non-strategic property plant and equipment in exchange for equity in NEXUS Real Estate Capital Funds (a private equity fund specialized in real estate management), which helped somewhat mitigate the negative effects of the rising interest rate context on the bank’s results. As such, the bank recorded a Ps 15.5 billion increase in gain on the sale of property, plant and equipment (as fair value of derecognized PP&E was higher than book value) and a Ps 3.9 billion increase in net gain (loss) in asset valuation mainly explained by favorable valuation of investment properties in 2022, associated with the aforementioned PP&E structure optimization. The Ps 10.8 billion increase in other is mainly explained by commercial incentives received from Mastercard in 2022 for reaching credit and debit card issuance goals. The Ps 2.8 billion increase in dividends is attributable to a Ps 3.6 billion increase in dividends from A.C.H. Colombia S.A. The Ps 1.3 billion increase in foreign exchange gains (losses), net to a Ps 3.0 billion net gain should be analyzed in conjunction with net trading income from derivatives. The net result of both activities (foreign exchange and derivatives) for 2022 was a Ps 0.3 billion loss compared to a Ps 1.6 billion loss in 2021.
131
Other expenses
| Year ended December 31, |
| Change, 2022 vs. 2021 | |||||
| 2022 |
| 2021 |
| # |
| % | |
(in Ps billions) |
| |||||||
Losses from sales of noncurrent assets held for sale | (0.0) |
| (0.0) | 0.0 |
| (52.9) | ||
Personnel expenses | (277.9) |
| (262.2) | (15.7) |
| 6.0 | ||
Administrative and other expenses | (437.3) |
| (394.8) | (42.5) |
| 10.8 | ||
Depreciation and amortization | (69.9) |
| (66.5) | (3.4) |
| 5.1 | ||
Other | (8.7) |
| (7.3) | (1.4) |
| 19.1 | ||
Other expenses | (794.1) |
| (730.9) | (63.2) |
| 8.6 | ||
During 2022, Banco AV Villas’ focus remained on cost contention. Other expenses increased 8.6% or Ps 63.2 billion, well below the 13.1% inflation rate for 2022. Administrative and other expenses drove the performance of other expenses with a 10.8% or Ps 42.5 billion increase. As explained under Grupo Aval’s analysis the increase in the industry and commerce tax (ICA) heavily impacted Banco AV Villas, with operating taxes constituting the main driver for expense growth with a 36.2% or Ps 12.0 billion increase, explaining 3.0% of growth in administrative and other expenses. Marketing expenses increased Ps 10.3 billion, as the bank focused on digital marketing, and our corporate loyalty and experiences programs.
The 6.0% or Ps 15.7 billion increase in personnel expenses results from a 7.3% or Ps 18.1 billion increase in salaries and employee benefits and a 17.8% or Ps 2.5 billion decrease in labor severances and bonus plan payments. Finally, other increased Ps 1.4 billion due to a Ps 3.1 billion increase in losses on the sale of property, plant and equipment.
Given that Banco AV Villas’ other expenses increased 8.6% and its total income before net impairment losses on financial assets (defined as the sum of net interest income, net income from commissions and fees, net trading income and other income) decreased by 8.9%, the cost to income efficiency ratio increased to 73.3% in 2022 from 61.5% in 2021. The ratio of other expenses as a percentage of average assets improved by 4 basis points to 4.27% in 2022 from 4.31% in 2021.
Tax expense
Income tax expense for Banco AV Villas decreased by 76.4% or Ps 89.2 billion, to Ps 27.6 billion in 2022. Banco AV Villas’ effective tax rate, calculated as income tax expense divided by income before income tax expense excluding dividends and the equity method (as both are non-taxable income), was 22.5% in 2022 and 38.6% in 2021. This was driven by a 59.9% or Ps 183.1 billion decrease in income before income tax expense excluding dividends and the equity method, resulting in a Ps 62.3 billion decrease in income tax expense.
Net income attributable to non-controlling interest
Net income attributable to non-controlling interest is not a significant contributor to net income for Banco AV Villas, and is responsible for only 0.4% of net income for 2022 and 0.2% for 2021.
132
Porvenir
Overview
Porvenir’s net income attributable to owners of the parent for the year ended December 31, 2022 was Ps 154.3 billion, decreasing 73.4% or Ps 425.2 billion compared to the year ended December 31, 2021. The following discussion describes the main drivers of Porvenir’s results of operations for the year ended December 31, 2022 compared to the year ended December 31, 2021.
Porvenir | ||||||||
For the year ended |
| Change 2022 vs | ||||||
December 31, |
| 2021 | ||||||
| 2022 |
| 2021 |
| # |
| % | |
(in Ps billions) | ||||||||
Total interest income | 106.3 |
| 50.2 |
| 56.0 |
| 111.6 | |
Total interest expense | (63.2) |
| (40.2) |
| (23.0) |
| 57.0 | |
Net interest income | 43.1 |
| 10.0 |
| 33.1 |
| 331.9 | |
Impairment loss on loans and other accounts receivable | (8.1) |
| (6.6) |
| (1.4) |
| 21.6 | |
Impairment (loss) recovery on other financial assets | 0.3 |
| (0.3) |
| 0.6 |
| (199.2) | |
Net impairment loss on financial assets | (7.8) |
| (6.9) |
| (0.8) |
| 12.1 | |
Net interest income, after impairment losses | 35.3 | 3.0 | 32.2 |
| 1,066.9 | |||
Net income from commissions and fees | 692.1 |
| 1,098.5 |
| (406.5) |
| (37.0) | |
Gross loss from sales of goods and services | 8.2 | (8.9) | 17.2 |
| (192.2) | |||
Net trading income | (37.6) |
| 221.8 |
| (259.4) |
| (117.0) | |
Other income | (52.6) |
| (54.8) |
| 2.1 |
| (3.9) | |
Other expenses | (397.2) |
| (487.5) |
| 90.4 |
| (18.5) | |
Net income before tax expense | 248.2 |
| 772.1 |
| (523.9) |
| (67.9) | |
Income tax expense | (93.0) |
| (191.9) |
| 98.9 |
| (51.5) | |
Net income for the year | 155.2 |
| 580.2 |
| (425.0) |
| (73.3) | |
Net income for the year attributable to: |
|
|
|
|
| |||
Owners of the parent | 154.3 |
| 579.5 |
| (425.2) |
| (73.4) | |
Non-controlling interest | 0.9 |
| 0.7 |
| 0.2 |
| 26.7 | |
Net interest income
Porvenir’s net interest income was Ps 43.1 billion and Ps 10.0 billion in 2022 and 2021, respectively. Net interest income is mainly the result of interest accrued on interest-earning investments in debt securities corresponding to Porvenir’s proprietary investment portfolio (at fair value through other comprehensive income and at amortized cost) and on interbank and overnight funds.
Interest income increased 111.6% or Ps 56.0 billion to Ps 106.3 billion in 2022, mainly as a result of a Ps 34.4 billion increase in interest income from investment securities. This increase was driven by a 541 basis points increase in the average yield of interest-earning investments in debt securities to 11.1% in 2022, that resulted in a Ps 45.3 billion increase in income. This was partially offset by an 11.7% or Ps 98.1 billion decrease in the average balance of interest-earning investments in debt securities to Ps 738.8 billion in 2022, that resulted in a Ps 10.9 billion decrease in income.
Net impairment loss on financial assets
Porvenir’s net impairment loss on financial assets increased Ps 0.8 billion to Ps 7.8 billion in 2022.
Net income from commissions and fees
| Year ended December 31, |
| Change, 2022 vs. 2021 | |||||
| 2022 |
| 2021 |
| # |
| % | |
(in Ps billions) | ||||||||
Banking fees | 0.6 |
| 15.8 |
| (15.2) |
| (96.1) | |
Pension and severance fund management |
| 884.6 |
| 1,197.5 |
| (313.0) |
| (26.1) |
Income from commissions and fees | 885.2 |
| 1,213.3 |
| (328.2) |
| (27.0) | |
Expenses from commissions and fees | (193.1) |
| (114.8) |
| (78.3) |
| 68.2 | |
Net income from commissions and fees | 692.1 |
| 1,098.5 |
| (406.5) |
| (37.0) | |
Net income from commissions and fees decreased 37.0% or Ps 406.5 billion. Premiums paid for life and disability insurance coverage on mandatory pensions increased to 2.47% in February 2022 from 2.00% in 2021 as a result of the increased mortality, a consequence of the
133
COVID-19 pandemic. Given that this rate is deducted from the 3.00% Porvenir charges on contributions of its mandatory pension fund clients, the fee received by Porvenir declined to 0.53% in 2022 from 1.00% in 2021. Between February and the first weeks of April Porvenir accounted for the increased portion of the insurance cost as expenses from commissions and fees in an amount of Ps 61.5 billion as regulation requires to notify clients of the change before it can be enforced and therefore was absorbed directly by Porvenir. From that point on, the mandatory pension funds managed by Porvenir assumed the higher insurance cost as lower income from mandatory pension fund fees. This event explains most of the increase in expenses from commissions and fees.
As a result of the above, pension and severance fund management fees decreased 27.0% or Ps 328.2 billion driven by (i) a 35.6% or Ps 304.4 billion decrease in fee income from mandatory pension fund management, (ii) a 14.6% or Ps 14.8 billion decrease in revenues received from voluntary pension fund management mainly due to negative returns on AUMs, (iii) a 2.6% or Ps 6.1 billion increase in fee income from severance fund management driven by an increase in the number of clients, and (iv) a 3.1% or Ps 0.1 billion increase in fee income from third-party pension fund management, mainly FONPET. Mandatory pension fund management was driven by a 29.2% or Ps 204.8 billion decrease in fees charged to contributing clients (contribution-based) and a 65.4% or Ps 99.6 billion decrease in fees charged to non-contributing clients (performance-based) due to negative returns on assets under management.
Gross loss from sales of goods and services
Year ended December 31, |
| Change, 2022 vs. 2021 | ||||||
| 2022 |
| 2021 |
| # |
| % | |
(in Ps billions) | ||||||||
Income from sales of goods and services |
| 71.3 |
| 46.7 |
| 24.6 |
| 52.8 |
Costs and expenses of sales of goods and services |
| (63.0) |
| (55.6) |
| (7.4) |
| 13.4 |
Gross loss from sales of goods and services |
| 8.2 |
| (8.9) |
| 17.2 |
| (192.2) |
Gross profit (loss) from sales of goods and services was a profit of Ps 8.2 billion in 2022 as compared to a Ps 8.9 billion loss in 2021, reflecting the result of Aportes en Línea, Porvenir’s subsidiary. Aportes en Línea provides technical and administrative services to Porvenir and third parties, among which are Grupo Aval and its subsidiaries. Another business line for Aportes en Linea consists in social security processing services for employed and self-employed population. As employment recovered to pre-pandemic levels, income from sales of goods and services to third parties increased 52.8% or Ps 24.6 billion. Costs and expenses of sales of goods and services increased 13.4% or Ps 7.4 billion, at a slower pace than income, driven by an 18.2% or Ps 3.5 billion increase in administrative and other expenses and a 12.6% or Ps 2.0 billion increase in personnel expenses.
Net trading income
Porvenir’s net trading income (loss) was a Ps 37.6 billion loss in 2022, Ps 259.4 billion lower than in 2021, resulting from a Ps 245.6 billion decrease in income from investment securities at fair value through profit or loss and a Ps 13.8 billion decrease in net trading income from derivatives. The performance of net trading income from derivatives was partially offset by a Ps 4.4 billion increase in foreign exchange gains (losses), net, recognized under other income.
Porvenir’s income from investment securities at fair value through profit or loss mainly reflects the result of the stabilization reserve, which is a portion of the pension and severance fund manager’s capital invested in the fund administered by the pension and severance fund manager and which must represent at least 1.0% of the value of that fund. At December 31, 2022, Porvenir’s stabilization reserve amounted to Ps 1.9 trillion and its income decreased Ps 244.5 billion to a Ps 81.1 billion loss in 2022. Income resulting from Porvenir’s proprietary investment portfolio held for trading at fair value through profit or loss decreased Ps 1.1 billion to Ps 1.6 billion in 2022.
Other income
| Year ended December 31, |
| Change, 2022 vs. 2021 | |||||
| 2022 |
| 2021 |
| # |
| % | |
(in Ps billions) | ||||||||
Foreign exchange gains (losses), net | (54.8) |
| (59.2) | 4.4 |
| (7.4) | ||
Share of profit of equity accounted investees, net of tax (Equity method) | 0.0 |
| 0.0 | (0.0) |
| (2.9) | ||
Net gain (loss) on sale of debt and equity securities | (4.9) |
| 0.2 | (5.1) |
| (2,756.7) | ||
Gain on sale of property, plant and equipment | — | — | — |
| N.A. | |||
Net gain (loss) in asset valuation | 1.6 |
| (1.0) | 2.6 |
| (253.4) | ||
Other | 5.5 |
| 5.3 | 0.2 |
| 4.5 | ||
Other income | (52.6) |
| (54.8) | 2.1 |
| (3.9) | ||
Other income increased Ps 2.1 billion, mainly as a result of lower losses in foreign exchange gains (losses), net. The Ps 4.4 billion improvement in foreign exchange gains (losses), net to a Ps 54.8 billion net loss was offset by the Ps 13.8 billion decrease in net trading
134
income from derivatives mentioned before. The net result of both activities (foreign exchange and derivatives) for 2022 was a Ps 12.9 billion loss, Ps 9.4 billion more than the Ps 3.5 billion loss in 2021. The Ps 5.1 billion decrease in net gain on sale of debt and equity securities was explained by the liquidation of certain positions in fixed income instruments during 2022.
Other expenses
Year ended December 31, | Change, 2022 vs. 2021 | |||||||
| 2022 |
| 2021 |
| # |
| % | |
(in Ps billions) | ||||||||
Personnel expenses |
| (168.4) |
| (156.4) | (12.1) |
| 7.7 | |
Administrative and other expenses |
| (195.1) |
| (213.0) | 18.0 |
| (8.4) | |
Depreciation and amortization |
| (14.5) |
| (12.2) | (2.3) |
| 19.1 | |
Other |
| (19.2) |
| (106.0) | 86.8 |
| (81.9) | |
Other expenses |
| (397.2) |
| (487.5) | 90.4 |
| (18.5) | |
Other expenses decreased 18.5% or Ps 90.4 billion, mainly driven by other. The Ps 86.8 billion decrease in other is mainly explained by a Ps 74.8 billion decrease in provision expenses related to emerging costs of legal proceedings arising from individual civil lawsuits originated from mandatory pension fund clients. Porvenir focused part of its efforts on cost containment to face the headwinds from the aforementioned drivers on income. The 8.4% or Ps 18.0 billion decrease in administrative and other expenses is explained by a Ps 21.0 billion decrease in IT related fees. The 7.7% or Ps 12.1 billion increase in personnel expenses results from a 5.3% or Ps 8.2 billion increase in salaries and employee benefits and a 3.9 billion increase in labor severances and bonus plan payments.
Tax expense
Income tax expense for Porvenir decreased by Ps 98.9 billion, or 51.5%, to Ps 93.0 billion in 2022. Porvenir’s effective tax rate, calculated as income tax expense divided by income before income tax expense excluding dividends and the equity method (as both are non-taxable income), was 37.5% in 2022 and 24.9% in 2021.
Net income attributable to non-controlling interest
Net income attributable to non-controlling interest is not a significant contributor to net income for Porvenir, and is responsible for only 0.6% of net income for 2022 and 0.1% for 2021.
135
Corficolombiana
Overview
Corficolombiana’s net income attributable to owners of the parent for the year ended December 31, 2022 was Ps 1,728.1 billion, increasing 35.2% or Ps 450.1 billion compared to the year ended December 31, 2021. The following discussion describes the main drivers of Corficolombiana’s results of operations for the year ended December 31, 2022 compared to the year ended December 31, 2021.
Corficolombiana | ||||||||
For the year ended |
| Change 2022 vs | ||||||
December 31, |
| 2021 | ||||||
| 2022 |
| 2021 |
| # |
| % | |
(in Ps billions) | ||||||||
Total interest income | 833.7 |
| 463.9 |
| 369.8 |
| 79.7 | |
Total interest expense | (2,030.3) |
| (1,028.3) |
| (1,001.9) |
| 97.4 | |
Net interest income(expense) | (1,196.5) |
| (564.4) |
| (632.1) |
| 112.0 | |
Impairment loss on loans and other accounts receivable | (14.4) |
| (9.3) |
| (5.1) |
| 55.3 | |
Impairment (loss) recovery on other financial assets | 0.1 |
| 0.1 |
| 0.0 |
| 40.2 | |
Recovery of charged-off financial assets | (0.0) |
| (0.0) |
| 0.0 |
| N.A. | |
Net impairment loss on financial assets | (14.3) |
| (9.2) |
| (5.1) |
| 55.4 | |
Net interest income, after impairment losses | (1,210.8) | (573.6) | (637.2) |
| 111.1 | |||
Net income from commissions and fees | 111.9 |
| 82.5 |
| 29.5 |
| 35.7 | |
Gross profit from sales of goods and services | 4,928.3 | 3,480.0 | 1,448.3 |
| 41.6 | |||
Net trading income | 388.0 |
| 207.5 |
| 180.5 |
| 87.0 | |
Net income from other financial instruments mandatorily at fair value through profit or loss | 278.8 |
| 270.1 | 8.7 |
| 3.2 | ||
Other income | (151.5) |
| 189.2 |
| (340.7) |
| (180.1) | |
Other expenses | (289.5) |
| (330.1) |
| 40.6 |
| (12.3) | |
Net income before tax expense | 4,055.1 |
| 3,325.6 |
| 729.5 |
| 21.9 | |
Income tax expense | (1,753.7) |
| (1,476.6) |
| (277.2) |
| 18.8 | |
Net income for the year | 2,301.4 |
| 1,849.0 |
| 452.4 |
| 24.5 | |
Net income for the year attributable to: |
|
|
|
|
| |||
Owners of the parent | 1,728.1 |
| 1,278.0 |
| 450.1 |
| 35.2 | |
Non-controlling interest | 573.3 |
| 571.0 |
| 2.3 |
| 0.4 | |
Net interest income
Corficolombiana’s net interest expense was Ps 1,196.5 billion and Ps 564.4 billion in 2022 and 2021, respectively. Net interest expenses are mainly the result of a net leverage position of the non-financial subsidiaries consolidated by Corficolombiana. Net interest expense of Corficolombiana’s non-financial subsidiaries increased to a Ps 560.9 billion, 69.6% or Ps 230.1 billion more than in 2021. Corficolombiana’s consolidated non-financial subsidiaries’ net interest income has been and is expected to continue to be negative in the future as these entities are not financial entities and thus pay interest expenses to fund returns of assets that are mostly not considered interest-earning assets. The returns on those assets are primarily registered in the gross profit (loss) from sales of goods and services and net income from other financial instruments mandatorily at FVTPL, and to a lesser extent, in Other income under share of profit of equity accounted investees, net of tax (equity method). Income and expenses related to financial assets and liabilities, in addition to net interest expense, are recognized under net trading income and foreign exchange gains (losses), net.
Average balance of interest-earning assets | Net interest margin for | Net interest income for the | ||||||||||||||||
for the year ended December 31, | Change, 2022 vs. 2021 | the year ended December 31, | year ended December 31, | Change, 2022 vs. 2021 | ||||||||||||||
2022 |
| 2021 |
| # |
| % |
| 2022 |
| 2021 |
| 2022 |
| 2021 | # |
| % | |
(in Ps billions) | (in Ps billions) | |||||||||||||||||
5,193.9 | 4,642.5 | 551.4 | 11.9 | (23.0)% |
| (12.2)% | (1,196.5) | (564.4) | (632.1) | 112.0 | ||||||||
The following tables show: (i) the average balance, average yield and interest income on interest-earning assets with an analysis of impacts derived from changes in the average balance and the average yield, per type of interest-earning asset; interbank and overnight funds are shown separate from gross loans due to their characteristics and short-term nature and (ii) the average balance, average rate paid and interest
136
expense on interest-bearing funding with an analysis of impacts derived from changes in the average balance and the average rate, per type of interest-bearing funding.
(i) | Average balance for the | Average yield for the | Interest income for the | Impact on interest income | Change, 2022 | |||||||||||||||||||
|---|---|---|---|---|---|---|---|---|---|---|---|---|---|---|---|---|---|---|---|---|---|---|---|---|
year ended December 31, | Change, 2022 vs. 2021 | year ended December 31, | year ended December 31, | due to changes in | vs. 2021 | |||||||||||||||||||
| 2022 |
| 2021 |
| # |
| % |
| 2022 |
| 2021 |
| 2022 |
| 2021 |
| Balance |
| Yield | Total |
| % | ||
(in Ps billions) | (in Ps billions) | (in Ps billions) | ||||||||||||||||||||||
Commercial |
| 1,329.6 |
| 1,280.9 |
| 48.7 |
| 3.8 |
| 17.4% |
| 15.4% |
| 231.2 |
| 196.7 |
| 8.5 |
| 26.0 | 34.5 |
| 17.5 | |
Consumer |
| 657.7 |
| 478.3 |
| 179.3 |
| 37.5 |
| 25.5% |
| 19.6% |
| 167.6 |
| 93.9 |
| 45.7 |
| 28.0 | 73.8 |
| 78.6 | |
Mortgages |
| 17.4 |
| 14.0 |
| 3.5 |
| 24.9 |
| 8.0% |
| 10.2% |
| 1.4 |
| 1.4 |
| 0.3 |
| (0.3) | (0.0) |
| (2.3) | |
Gross loans |
| 2,004.6 |
| 1,773.2 |
| 231.5 |
| 13.1 |
| 20.0% |
| 16.5% |
| 400.2 |
| 292.0 |
| 46.2 |
| 62.0 | 108.2 |
| 37.1 | |
Interbank and overnight funds | 720.2 |
| 734.8 |
| (14.6) |
| (2.0) |
| 33.3% |
| 9.4% |
| 239.8 |
| 69.3 |
| (4.9) |
| 175.3 | 170.5 |
| 245.8 | ||
Total gross loans | 2,724.8 |
| 2,507.9 |
| 216.9 |
| 8.6 |
| 23.5% |
| 14.4% |
| 640.0 |
| 361.3 |
| 50.9 |
| 227.8 | 278.7 |
| 77.1 | ||
Investments in debt securities | 2,469.1 |
| 2,134.6 |
| 334.5 |
| 15.7 |
| 7.8% |
| 4.8% |
| 193.7 |
| 102.6 |
| 26.2 |
| 64.8 | 91.1 |
| 88.8 | ||
Total interest-earning assets |
| 5,193.9 |
| 4,642.5 |
| 551.4 |
| 11.9 |
| 16.1% |
| 10.0% |
| 833.7 |
| 463.9 |
| 88.5 |
| 281.3 | 369.8 |
| 79.7 | |
(ii) | Average balance for the | Average rate paid for the | Interest expense for the | Impact on interest expense | Change, 2022 | |||||||||||||||||||
year ended December 31, | Change, 2022 vs. 2021 | year ended December 31, | year ended December 31, | due to changes in | vs. 2021 | |||||||||||||||||||
| 2022 |
| 2021 |
| # |
| % |
| 2022 |
| 2021 |
| 2022 |
| 2021 | Balance |
| Rate | Total | % | ||||
(in Ps billions) | (in Ps billions) | (in Ps billions) | ||||||||||||||||||||||
Time deposits |
| 4,923.2 |
| 4,577.6 |
| 345.6 |
| 7.5 |
| 9.5% |
| 4.8% |
| (467.7) |
| (220.1) | (32.8) |
| (214.8) | (247.6) | 112.5 | |||
Savings accounts |
| 908.2 |
| 566.4 |
| 341.9 |
| 60.4 |
| 9.0% |
| 2.1% |
| (81.7) |
| (11.7) | (30.7) |
| (39.2) | (70.0) | 597.5 | |||
Total interest-bearing deposits |
| 5,831.5 |
| 5,144.0 |
| 687.4 |
| 13.4 |
| 9.4% |
| 4.5% |
| (549.4) |
| (231.8) | (64.8) |
| (252.8) | (317.6) | 137.0 | |||
Interbank borrowings and overnight funds | 4,339.2 | 4,141.0 | 198.2 |
| 4.8 |
| 5.8% |
| 1.3% |
| (253.1) |
| (53.0) | (11.6) |
| (188.5) | (200.1) | 377.6 | ||||||
Borrowings from banks and others | 9,057.3 | 7,154.6 | 1,902.7 |
| 26.6 |
| 8.3% |
| 6.5% |
| (750.4) |
| (461.8) | (157.6) |
| (130.9) | (288.5) | 62.5 | ||||||
Bonds issued | 5,822.5 | 5,299.3 | 523.2 |
| 9.9 |
| 8.1% |
| 5.3% |
| (470.3) |
| (281.7) | (42.3) |
| (146.3) | (188.5) | 66.9 | ||||||
Borrowings from development entities | 12.6 | 21.0 | (8.4) |
| (40.1) |
| 57.0% |
| 0.0% |
| (7.2) |
| — | 4.8 |
| (12.0) | (7.2) | N.A. | ||||||
Other funding | 19,231.6 | 16,615.9 | 2,615.7 |
| 15.7 |
| 7.7% |
| 4.8% |
| (1,480.9) |
| (796.6) | (201.4) |
| (482.9) | (684.3) | 85.9 | ||||||
Total interest-bearing liabilities | 25,063.0 | 21,759.9 | 3,303.1 |
| 15.2 |
| 8.1% |
| 4.7% |
| (2,030.3) | (1,028.3) | (267.6) |
| (734.3) | (1,001.9) | 97.4 | |||||||
The 79.7% or Ps 369.8 billion increase in total interest income was mainly the result of a 606 basis points increase in the average yield of interest-earning assets to 16.1% in 2022 and a 11.9% or Ps 551.4 billion increase in the average balance of interest-earning assets. Corficolombiana derives its interest income on total gross loans mainly from the following activities: (i) income on commercial loans from the Sociedad Portuaria del Callao (SPEC) LNG regasification terminal, which is classified as a financial lease in accordance with IFRS 16, (ii) interests on investment in debt securities and interbank and overnight funds, mainly corresponding to Corficolombiana’s treasury operations, and (iii) income on consumer loans from Promigas’ non-banking financing program under the Brilla brand. As a result, income on total gross loans benefited from the increase in the average Central Bank rate during 2022.
Corficolombiana’s total interest expense increased 97.4% or Ps 1,001.9 billion mainly as a result of a 337 basis points increase in the average rate paid on interest-bearing liabilities to 8.1% in 2022 and a 15.2% or Ps 3,303.1 billion increase in the average balance of interest-bearing liabilities to Ps 25,063.0 billion. The increase in net interest expenses was in line with higher interest rates for funding, whether through deposits taken by Corficolombiana or other funding (mostly borrowings from banks and others and bonds) taken by Corficolombiana and its subsidiaries. The Ps 1,902.7 billion increase in the average balance of borrowings from banks and others is mainly attributable to the effect of a 13.6% average peso depreciation versus the U.S. dollar on foreign currency denominated funding and to funding needs of Corficolombiana’s subsidiaries in the ordinary course of business.
Net impairment loss on financial assets
Corficolombiana’s net impairment loss on financial assets increased Ps 5.1 billion to Ps 14.4 billion in 2022. This was driven by a Ps 5.1 billion increase in impairment loss on loans and accounts receivable, mainly as a result of strong origination activity of consumer loans in under the Brilla brand during 2022.
137
Net income from commissions and fees
| Year ended December 31, |
| Change, 2022 vs. 2021 | |||||
| 2022 |
| 2021 |
| # |
| % | |
(in Ps billions) | ||||||||
Banking fees | 39.6 |
| 17.6 |
| 22.0 |
| 125.3 | |
Trust activities and portfolio management services | 89.5 |
| 78.5 |
| 11.0 |
| 14.0 | |
Income from commissions and fees | 129.1 |
| 96.1 |
| 33.0 |
| 34.4 | |
Expenses from commissions and fees | (17.2) |
| (13.6) |
| (3.6) |
| 26.4 | |
Net income from commissions and fees | 111.9 |
| 82.5 |
| 29.5 |
| 35.7 | |
Net income from commissions and fees increased 35.7% or Ps 29.5 billion, driven by income from commissions and fees. Banking fees increased Ps 22.0 billion and were driven by Casa de Bolsa, Corficolombiana’s subsidiary, as it was the main broker in several of the tender offers extended in Colombia’s Stock Exchange (BVC) throughout 2022. In addition, investment banking activity contributed to the performance of banking fees. Trust and portfolio management activities increased 14.0% or Ps 11.0 billion as Fiduciaria Corficolombiana increased its AUMs by 22.0% even amidst challenging capital market conditions.
Gross profit from sales of goods and services
Year ended December 31, |
| Change, 2022 vs. 2021 | ||||||
| 2022 |
| 2021 |
| # |
| % | |
(in Ps billions) | ||||||||
Income from sales of goods and services |
| 11,988.1 |
| 10,310.5 |
| 1,677.6 |
| 16.3 |
Costs and expenses of sales of goods and services |
| (7,059.8) |
| (6,830.5) |
| (229.4) |
| 3.4 |
Gross profit from sales of goods and services |
| 4,928.3 |
| 3,480.0 |
| 1,448.3 |
| 41.6 |
Gross profit from sales of goods and services mainly reflects the result of Corficolombiana’s non-financial companies. The Ps 1,448.3 billion increase was driven by companies in the infrastructure sector. The following discussion identifies the main drivers contributing to the performance by industry:
Infrastructure
Infrastructure companies were the largest contributor to this line item with Ps 3,647.8 billion in 2022. This sector drove the overall performance in gross profit from sales of goods and services growing 54.2% or Ps 1,282.8 billion compared to 2021 mainly explained by a Ps 615.8 billion increase in income and a Ps 667.0 billion decrease in costs and expenses. Income benefitted from increases in the internal rate of return (DOB or “Diferencial de Obra Bruto”) used to calculate financial assets of concession arrangements, driven by (i) the depreciation of the Colombian peso relative to the U.S. dollar and its positive effect on U.S. dollar denominated future guaranteed payments and (ii) the increase in observed and expected inflation relative to previous estimations used in future cash flow projections. The latter also led to a higher value of intangible assets related to concession arrangements due to increases in cash flow projections of toll-road income. Given that Corficolombiana’s concessions under construction are nearing their final stages, work progress was slower than in 2021, which in turn drove the reduction in construction costs. Partially offsetting the decrease in construction costs, the infrastructure companies registered a Ps 667.3 billion increase in expenses related to hedging strategies (net trading income and foreign exchange losses) of its financial assets and liabilities (Ps 488.8 billion increase) and interest expense on financing (Ps 178.4 billion increase).
Energy and Gas
Gross profit for energy and gas companies in 2022 was Ps 1,104.0 billion, Ps 41.6 billion more than in 2021. Income increased 14.7% or Ps 731.6 billion and costs and expenses increased 17.6% or Ps 690.0 billion. Income grew vigorously during the first nine months of the year but had a sluggish fourth quarter as tariffs were lowered in September, transportation volumes to industrial clients decelerated in line with the economic slowdown and due to scheduled maintenances of pipelines. Offsetting the increase in gross profit from sales of goods and services, the energy and gas companies registered a Ps 205.9 billion increase in interest expense on financing.
Other sectors
Gross profit for hospitality companies in 2022 was Ps 72.7 billion, a Ps 86.9 billion improvement relative to the Ps 14.3 billion loss in 2021. Income increased 79.4% or Ps 236.1 billion driven by an increase in occupancy rates to 69.2%, the highest ever and over 10.0 percentage points higher than in 2019 (pre-pandemic levels). Costs increased 47.8% or Ps 149.2 billion driven by the reactivation of activities.
Gross profit for agribusiness companies in 2022 was Ps 95.1 billion, Ps 38.0 billion more than in 2021. Income increased 34.8% or Ps 88.1 billion due to a higher price of rubber and African palm oil, while costs increased 25.6% or Ps 50.1 billion mainly explained by the increase
138
in prices for agro-industrial supplies and the effects of supply chain disruptions. Gross profit for other companies, mainly Tesicol, was Ps 8.8 billion, Ps 1.0 billion less than in 2021. Income increased 10.3% or Ps 6.0 billion and costs increased 14.3% or Ps 6.9 billion.
Net trading income
Corficolombiana’s net trading income was Ps 388.0 billion in 2022, Ps 180.5 billion higher than in 2021, resulting from a Ps 81.6 billion increase in net trading income from derivatives and a Ps 98.9 billion increase in income from investment securities at fair value through profit or loss. The performance of net trading income from derivatives was offset by a Ps 240.0 billion decrease in foreign exchange gains (losses), net, recognized under other income.
Net trading income from Corficolombiana’s non-financial subsidiaries decreased Ps 254.9 billion to a Ps 3.5 billion gain, resulting from a Ps 257.3 billion decrease in net trading income from derivatives and a Ps 2.4 billion increase in income from investment securities at fair value through profit or loss.
Total income from investment securities
Corficolombiana’s securities portfolio is classified in the following categories: (i) equity and fixed income investments at FVTPL (described in this section as net trading income in investment securities at FVTPL), (ii) fixed income investments at FVOCI and (iii) fixed income investments at AC (results from (ii) and (iii) are included in net interest income as interest income on investments in debt securities). Corficolombiana manages its investment portfolio in a comprehensive and integral manner that considers individual return of each one of these three categories and the total return of the investment securities portfolio.
Total income from investment securities for Corficolombiana (comprised of interest income on investments in debt securities and net trading income from investment securities at FVTPL) was Ps 274.6 billion for 2022, 224.4% or Ps 190.0 billion higher than in 2021. This was primarily driven by a 320 basis points increase in the average yield on total investment securities to 4.7% in 2022 from 1.5% in 2021, resulting in a Ps 179.1 billion increase in interest income. The average balance of total investment securities increased 15.7% or Ps 334.5 billion to Ps 2,469.1 billion in 2022. The main drivers for this performance were discussed above in net interest income.
Net income from other financial instruments mandatorily at FVTPL
Net income from financial instruments mandatorily at FVTPL reflect the fair value of concession arrangements entered between Promigas and the Colombian Government and increased by Ps 8.7 billion to Ps 278.7 billion in 2022 as compared to 2021.
Other income
| Year ended December 31, |
| Change, 2022 vs. 2021 | |||||
| 2022 |
| 2021 |
| # |
| % | |
(in Ps billions) | ||||||||
Foreign exchange gains (losses), net | (483.6) |
| (243.7) | (239.9) |
| 98.5 | ||
Share of profit of equity accounted investees, net of tax (Equity method) | 326.9 |
| 273.8 | 53.1 |
| 19.4 | ||
Net gain (loss) on sale of debt and equity securities | (104.9) |
| 10.5 | (115.4) |
| (1,098.3) | ||
Dividends | 104.1 |
| 144.5 | (40.4) |
| (28.0) | ||
Gain on sale of property, plant and equipment | 0.0 | 0.1 | (0.0) |
| N.A. | |||
Net gain (loss) in asset valuation | 0.9 |
| 1.0 | (0.1) |
| (6.3) | ||
Other | 5.1 |
| 3.1 | 2.0 |
| 65.0 | ||
Other income | (151.5) |
| 189.2 | (340.7) |
| (180.1) | ||
Other income decreased 180.1% or Ps 340.7 billion, mainly as a result of a decrease of Ps 239.9 billion in foreign exchange gains (losses), net driven by Corficolombiana’s non-financial subsidiaries as explained above. The Ps 115.4 billion decrease in net gain on sale of debt and equity securities to a Ps 104.9 billion loss in 2022 was explained by the realization of losses of certain debt investment securities classified at FVOCI that were reinvested at higher yields, which will have a positive effect on interest income on investments in debt securities going forward.
The Ps 53.1 billion increase in share of profit of equity accounted investees, net of tax (equity method) was mainly driven by an increase in Promigas’ investments in associates in the gas distribution business and an increase in Aerocali (airport concession in Cali) which recovered from the negative impact of travel restrictions in place throughout the pandemic. Other equity accounted investees such as Nexa BPO, Extrucol and Concesionaria Tibitoc contributed to the increase in equity method. The Ps 40.4 billion decrease in dividends was mainly driven by a Ps 45.2 billion extraordinary dividend declared in September 2021 by Grupo Energía de Bogotá (GEB).
139
Other expenses
Year ended December 31, | Change, 2022 vs. 2021 | |||||||
|---|---|---|---|---|---|---|---|---|
| 2022 |
| 2021 |
| # |
| % | |
(in Ps billions) | ||||||||
Personnel expenses |
| (123.1) |
| (108.0) | (15.1) |
| 14.0 | |
Administrative and other expenses |
| (126.7) |
| (100.6) | (26.1) |
| 25.9 | |
Depreciation and amortization |
| (11.5) |
| (9.4) | (2.1) |
| 21.8 | |
Impairment loss on other assets | (0.0) |
| (59.2) | 59.2 |
| N.A. | ||
Net loss from liquidation of subsidiaries | (0.1) |
| (22.0) |
| 21.9 |
| N.A. | |
Other |
| (28.2) |
| (30.9) | 2.8 |
| (8.9) | |
Other expenses |
| (289.5) |
| (330.1) | 40.6 |
| (12.3) | |
Other expenses decreased 12.3% or Ps 40.6 billion. The Ps 59.2 billion decrease in impairment loss on other assets was driven by a Ps 56.8 billion provision recognized by Corficolombiana on its investment in Covipacífico due to excess costs expected to be incurred on the Pacífico 1 project in 2021. The Ps 21.9 billion decrease in net loss from liquidation of subsidiaries results from expenses recognized by Leasing Corficolombiana in 2021, which was liquidated in 2022. The Ps 26.1 billion increase in administrative and other expenses is explained by consultancy, audit and other fees. The increase in personnel expenses results from a 11.8% or Ps 12.6 billion increase in salaries and employee benefits and a Ps 2.5 billion increase in labor severances and bonus plan payments. Corficolombiana recognized a Ps 24.0 billion expense under other reflecting a donation made to Centro de Tratamiento e Investigación del Cáncer – CTIC (Cancer Treatment and Research Center).
Tax expense
Income tax expense for Corficolombiana increased by Ps 277.2 billion, or 18.8%, to Ps 1,753.7 billion in 2022. Corficolombiana’s effective tax rate, calculated as income tax expense divided by income before income tax expense excluding dividends and the equity method (as both are non-taxable income), was 48.4% in 2022 and 50.4% in 2021.
Net income attributable to non-controlling interest
Net income attributable to non-controlling interest in Corficolombiana increased by 0.4%, or Ps 2.3 billion to Ps 573.3 billion in 2022. The ratio of net income attributable to non-controlling interest to net income decreased to 24.9% in 2022 from 30.9% in 2021. The increase in this ratio is mainly attributable to (i) higher net income from the infrastructure sector where Corficolombiana holds low minority interests and (ii) a 9.1% decrease in net income from Promigas where Corficolombiana holds a 48.1% minority interest.
140
B. Liquidity and capital resources
The following table sets forth our sources of liquidity and capital resources at the dates indicated.
| At December 31, | |||
| 2022 |
| 2021(1) | |
(in Ps billions) | ||||
Liabilities and equity: |
|
|
| |
Trading liabilities | 1,757.6 |
| 1,049.9 | |
Hedging derivatives liabilities | 3.6 |
| 55.8 | |
Customer deposits | 173,341.1 |
| 234,470.4 | |
Interbank borrowings and overnight funds | 9,087.9 |
| 10,672.4 | |
Borrowings from banks and others | 30,309.4 |
| 27,124.7 | |
Bonds issued | 28,362.2 |
| 32,257.9 | |
Borrowings from development entities | 4,357.3 |
| 3,227.3 | |
Provisions | 1,227.2 |
| 1,150.3 | |
Income tax liabilities | 5,291.5 |
| 4,714.7 | |
Employee benefits | 890.0 |
| 1,163.1 | |
Other liabilities | 10,141.8 |
| 11,545.8 | |
Total liabilities | 264,769.6 |
| 327,432.3 | |
Equity attributable to owners of the parent | 16,467.0 |
| 23,013.7 | |
Non-controlling interest | 14,354.7 |
| 16,458.0 | |
Total equity | 30,821.7 |
| 39,471.6 | |
Total liabilities and equity | 295,591.2 |
| 366,903.9 | |
| (1) | Figures at December 31, 2021 include Ps 100,439.2 billion of total liabilities from BHI that were consolidated by Grupo Aval prior to the spin-off in March 2022. |
Capitalization ratios
The following tables present consolidated capitalization ratios for our main subsidiaries subject to capital requirements. As discussed in other sections of this document, Decree 1477 of 2018 modified the capital adequacy requirements applicable to financing entities in Colombia. As a result, our banking subsidiaries migrated to Basel III capital requirements starting in January 2021.
At December 31, 2022 |
| ||||||||||||||
Grupo Aval entities |
| ||||||||||||||
Banco de | Banco de | Banco | Banco AV | Grupo Aval |
| ||||||||||
| Bogotá |
| Occidente |
| Popular |
| Villas |
| Porvenir |
| Corficolombiana |
| consolidated |
| |
Tangible equity ratio(1) |
| 10.5% | 7.9% | 9.0% | 8.8% | 66.2% | 26.9% | 9.1% | |||||||
CET1 ratio | 10.1% | 10.2% | 11.5% | 10.9% | N.A. | 47.5% | — | ||||||||
AT1 ratio | 0.0% | 0.0% | 0.0% | 0.0% | N.A. | 0.0% | — | ||||||||
Tier 1 ratio(2) |
| 10.1% | 10.2% | 11.5% | 10.9% | N.A. | 47.5% | — | |||||||
Tier 2 ratio(3) | 3.0% | 1.9% | 0.8% | 0.2% | N.A. | 0.0% | — | ||||||||
Solvency ratio(4) |
| 13.1% | 12.2% | 12.3% | 11.1% | 22.5% | 47.3% | — | |||||||
Source: Company calculations based on each entity’s respective financial statements for the period indicated.
| (1) | Tangible equity ratio is calculated as total equity minus intangible assets (calculated as goodwill plus other intangible assets excluding those related to concession arrangements rights) divided by total assets minus intangible assets (calculated as goodwill plus other intangible assets excluding those related to concession arrangements rights). See “Item 3. Key Information—A. Selected financial data— Ratios and Measures of Financial Performance”. |
| (2) | Tier 1 ratio is calculated as the sum of CET1 and AT1 divided by risk-weighted assets. |
| (3) | Tier 2 ratio is calculated as Tier 2 capital divided by risk-weighted assets. |
| (4) | Solvency ratio is calculated as technical capital (net of deductions from technical capital) divided by risk-weighted assets. For a definition of technical capital, see “Item 4. Information on the Company—B. Business Overview—Supervision and regulation—Capital Adequacy Requirements”. |
All of our banking subsidiaries (Banco de Bogotá, Banco de Occidente, Banco Popular and Banco AV Villas), Porvenir and Corficolombiana, are subject to inspection and supervision as financial institutions by the Superintendency of Finance. Grupo Aval is now also subject to the
141
inspection and supervision of the Superintendency of Finance as a result of Law 1870 of 2017, also known as Law of Financial Conglomerates, which came in effect on February 6, 2019. Grupo Aval, as the holding company of its financial conglomerate is responsible for the compliance with capital adequacy requirements, corporate governance standards, risk management and internal control and criteria for identifying, managing and revealing conflicts of interest, applicable to its financial conglomerate. See “Item 4. Information on the Company—B. Business Overview—Supervision and regulation—Capital Adequacy Requirements”.
Funding
Our banking subsidiaries fund most of their loans with customer deposits. Other sources of funding include interbank borrowings and overnight funds, borrowings from banks and others, borrowings from development entities and bonds issued. For more information on funding, refer to Note 21 of our audited consolidated financial statements.
The following table summarizes Grupo Aval’s consolidated funding structure at the dates indicated.
| At December 31, | |||
| 2022 |
| 2021(1) | |
(in Ps billions) | ||||
Customer deposits | 173,341.1 |
| 234,470.4 | |
Interbank borrowings and overnight funds | 9,087.9 |
| 10,672.4 | |
Borrowings from banks and others | 30,309.4 |
| 27,124.7 | |
Bonds issued | 28,362.2 |
| 32,257.9 | |
Borrowings from development entities | 4,357.3 |
| 3,227.3 | |
Total funding | 245,457.9 |
| 307,752.7 | |
| (1) | Figures at December 31, 2021 include Ps 96,599.6 billion of total funding from BHI that was consolidated by Grupo Aval prior to the spin-off in March 2022. |
Total funding decreased by 20.2% between December 31, 2022 and December 31, 2021 mainly as a result of the spin-off of BHI. Funding of our continuing operations increased 16.2% between December 31, 2022 and December 31, 2021 mainly due to an increase in customer deposits and borrowings from banks and others.
The following analysis will focus on the changes of our continuing operations. Between December 31, 2022 and December 31, 2021, borrowings from banks and others, customer deposits and borrowings from development entities as a percentage of total funding increased by 380 basis points, 48 basis points and 25 basis points to 12.3%, 70.6% and 1.8%, respectively. Bonds issued and interbank borrowings and overnight funds as a percentage of total funding decreased by 337 basis points and 117 basis points to 11.6% and 3.7%, respectively.
Our Colombian funding base also benefits from the highest available local credit ratings for each of our four Colombian banking subsidiaries and each of Corficolombiana and Porvenir, as assigned by BRC Investor Services S.A., an affiliate of Standard & Poor’s Investors Services LLC, or “S&P”. Banco Popular and Banco AV Villas have also achieved the highest available local credit ratings as assigned by Value and Risk Rating S.A. S.C.V.
142
The following table presents Grupo Aval’s and its direct subsidiaries international and local ratings as issuers.
International | Local |
| ||||||||||||||||
|---|---|---|---|---|---|---|---|---|---|---|---|---|---|---|---|---|---|---|
Fitch | BRC | Outlook | Outlook | |||||||||||||||
Fitch | Standard | Ratings | Standard | Outlook | Fitch | Standard | ||||||||||||
|
| Moody's |
| Ratings |
| & Poor's |
| Nacional |
| & Poor's |
| Moody’s |
| Ratings |
| & Poor's | ||
Grupo Aval |
| Foreign currency - Long term |
| Ba2 |
| BB+ |
| Negative |
| Stable | ||||||||
| Local currency - Long term |
| Ba2 |
| BB+ |
| AAA | |||||||||||
Banco de Bogotá |
| Foreign currency - Long term |
| Baa2 |
| BB+ |
| BB+ |
| Stable | Stable |
| Stable | |||||
| Foreign currency - Short term |
| P-2 |
| B |
| B | |||||||||||
| Local currency - Long term |
| Baa2 |
| BB+ |
| BB+ |
| AAA | Stable | Stable |
| Stable | |||||
| Local currency - Short term |
| P-2 |
| B |
| B | BRC1+ | ||||||||||
Banco de Occidente |
| Foreign currency - Long term |
| BB+ | Stable | |||||||||||||
| Foreign currency - Short term |
| B | |||||||||||||||
Local currency - Long term |
| BB+ |
| AAA |
| AAA |
| Stable | ||||||||||
Local currency - Short term |
| B |
| F1+ |
| BRC1+ | ||||||||||||
Banco Popular |
| Local currency - Long term |
| AAA | ||||||||||||||
| Local currency - Short term |
| BRC1+ | |||||||||||||||
Banco AV Villas |
| Local currency - Long term |
| AAA | ||||||||||||||
| Local currency - Short term |
| BRC1+ | |||||||||||||||
Corficolombiana |
| Foreign currency - Long term |
| BB+ |
|
| Stable | |||||||||||
Foreign currency - Short term | B | |||||||||||||||||
Local currency - Long term | BB+ | AAA | AAA | |||||||||||||||
Local currency - Short term | B | F1+ | BRC1+ | |||||||||||||||
Any adverse change in credit ratings may increase the cost of our funding. See “Item 3. Key Information—D. Risk factors—Risks relating to our businesses and industry—Risks relating to our banking business—Downgrades in our long-term credit ratings or in the credit ratings of our banking subsidiaries would increase the cost of, or impair access to, funding and may impact our ability to maintain regulatory capital ratios”.
The following tables present our consolidated funding from deposits at the dates indicated.
At December 31, | ||||
| 2022 |
| 2021(1) | |
(in Ps billions) | ||||
Interest-bearing customer deposits: |
|
|
|
|
Checking accounts |
| 6,236.6 |
| 34,059.8 |
Time deposits |
| 72,273.7 |
| 85,530.2 |
Savings deposits |
| 74,293.9 |
| 89,097.1 |
Total interest-bearing customer deposits |
| 152,804.2 |
| 208,687.2 |
Non-interest-bearing customer deposits: |
|
|
|
|
Checking accounts |
| 19,695.4 |
| 25,166.1 |
Other deposits(2) |
| 841.5 |
| 617.2 |
Total non-interest-bearing customer deposits |
| 20,536.9 |
| 25,783.3 |
Total customer deposits |
| 173,341.1 |
| 234,470.4 |
| (1) | Figures at December 31, 2021 include Ps 86,371.9 billion of total customer deposits from BHI that were consolidated by Grupo Aval prior to the spin-off in March 2022. |
| (2) | Consists of deposits from correspondent banks, cashier checks and collection services. |
Checking accounts. Our consolidated balance of checking accounts was Ps 25,932.1 billion at December 31, 2022 and Ps 59,225.8 billion at December 31, 2021, representing 10.6% and 19.2% of total funding, respectively. Figures at December 31, 2021 include Ps 33,027.8 billion of total checking accounts from BHI that were consolidated by Grupo Aval prior to the spin-off in March 2022. For our continuing operations, the balance of checking accounts was Ps 25,932.1 billion at December 31, 2022 and Ps 26,198.0 billion at December 31, 2021, representing 10.6% and 12.4% of total funding, respectively.
Time deposits. Our consolidated balance of time deposits was Ps 72,273.7 billion at December 31, 2022 and Ps 85,530.2 billion at December 31, 2021, representing 29.4% and 27.8% of total funding, respectively. Figures at December 31, 2021 include Ps 33,101.6 billion of total time deposits from BHI that were consolidated by Grupo Aval prior to the spin-off in March 2022. For our continuing operations, the balance of time deposits was Ps 72,273.7 billion at December 31, 2022 and Ps 52,428.7 billion at December 31, 2021, representing 29.4% and 24.8% of total funding, respectively.
143
The following table presents time deposits held by amount and maturity for deposits at the date indicated.
At December 31, 2022 | ||||||
|---|---|---|---|---|---|---|
| Peso- |
| Foreign currency- |
| ||
denominated | denominated | Total | ||||
(in Ps billions) | ||||||
Domestic | ||||||
Up to 3 months |
| 11,660.4 | 3,325.6 |
| 14,986.1 | |
From 3 to 6 months |
| 7,730.9 | 4,046.5 |
| 11,777.4 | |
From 6 to 12 months |
| 12,842.7 | 1,847.8 |
| 14,690.4 | |
More than 12 months |
| 11,585.6 | 172.9 |
| 11,758.5 | |
Time deposits less than U.S.$100,000(1) |
| 8,063.5 | 381.0 |
| 8,444.4 | |
Total domestic |
| 51,883.1 |
| 9,773.8 |
| 61,656.9 |
Foreign |
| — |
| 10,616.8 | 10,616.8 | |
Total time deposits |
| 51,883.1 |
| 20,390.6 |
| 72,273.7 |
| (1) | Equivalent to Ps 481.0 million at the representative market rate at December 31, 2022 of Ps 4,810.20 per U.S.$1.00. |
Savings deposits. Our consolidated balance of savings deposits was Ps 74,293.9 billion at December 31, 2022 and Ps 89,097.1 billion at December 31, 2021, representing 30.3% and 29.0% of total funding, respectively, in each of those years. Figures at December 31, 2021 include Ps 19,898.7 billion of total savings deposits from BHI that were consolidated by Grupo Aval prior to the spin-off in March 2022. For our continuing operations, the balance of time deposits was Ps 74,293.9 billion at December 31, 2022 and Ps 69,198.4 billion at December 31, 2021, representing 30.3% and 32.8% of total funding, respectively.
Other deposits. Our consolidated balance of other deposits, which consist mainly of deposits from correspondent banks, cashier checks and collection services, was Ps 841.5 billion at December 31, 2022 and Ps 617.2 billion at December 31, 2021, representing 0.3% and 0.2%, respectively. Figures at December 31, 2021 include Ps 343.9 billion of total of other deposits from BHI that were consolidated by Grupo Aval prior to the spin-off in March 2022. For our continuing operations, the balance of other deposits was Ps 841.5 billion at December 31, 2022 and Ps 273.3 billion at December 31, 2021, representing 0.3% and 0.1% of total funding, respectively.
Interbank borrowings and overnight funds. Our consolidated balance of interbank borrowings and overnight funds was Ps 9,087.9 billion at December 31, 2022 and Ps 10,672.4 billion at December 31, 2021, representing 3.7% and 3.5% of total funding, respectively. Figures at December 31, 2021 include Ps 394.4 billion of total interbank borrowings and overnight funds from BHI that were consolidated by Grupo Aval prior to the spin-off in March 2022. For our continuing operations, the balance of interbank borrowings and overnight funds was Ps 9,087.9 billion at December 31, 2022 and Ps 10,278.1 billion at December 31, 2021, representing 3.7% and 4.9% of total funding, respectively.
The following table sets forth our short-term borrowings consisting of interbank borrowings at and for the year ended December 31, 2022.
At and for the year ended December 31, | ||||
2022 | ||||
|
| Nominal | ||
weighted | ||||
average | ||||
Amount | rate | |||
(in Ps billions, except percentages) | ||||
Short-term borrowings |
|
|
|
|
Interbank borrowings and overnight funds |
|
|
|
|
End of period |
| 9,087.9 |
| — |
Average during period |
| 10,536.8 |
| 6.4% |
Maximum amount of borrowing at any month-end |
| 12,181.3 |
| — |
Interest paid during the period |
| 678.1 |
| — |
As part of their interbank transactions, our banks maintain a portfolio of Government securities and private sector liquid debt instruments that can be used to obtain overnight funds from other financial institutions or investment funds by selling such securities and simultaneously agreeing to repurchase them. Due to the short-term nature of this source of funding, the balance of these transactions is volatile.
Borrowings from banks and others. Our consolidated balance of borrowings from banks and others was Ps 30,309.4 billion at December 31, 2022 and Ps 27,124.7 billion at December 31, 2021, representing 12.3% and 8.8% of total funding requirements, respectively. Figures at December 31, 2021 include Ps 9,080.1 billion of total borrowings from banks and others from BHI that were consolidated by Grupo Aval
144
prior to the spin-off in March 2022. For our continuing operations, the balance of borrowings from banks and others was Ps 30,309.4 billion at December 31, 2022 and Ps 18,044.6 billion at December 31, 2021, representing 12.3% and 8.5% of total funding, respectively.
Borrowings from development entities. Borrowings from development entities are provided by correspondent banks and by governmental entities to promote lending to specific sectors of the Colombian economy. This funding traditionally has fully matched maturities and interest rates with related loans, and thus have no effect on NSFR, totaled Ps 4,357.3 billion at December 31, 2022 and Ps 3,227.3 billion at December 31, 2021, representing 1.8% and 1.0% of total funding requirements, respectively. At December 31, 2021 there were not borrowings from development entities from BHI that were consolidated by Grupo Aval.
Bonds issued. Grupo Aval and its subsidiaries issue bonds in the Colombian and international markets. Our consolidated balance of bonds issued outstanding was Ps 28,362.2 billion at December 31, 2022 and Ps 32,257.9 billion at December 31, 2021, representing 11.6% and 10.5% of total funding requirements, respectively. Figures at December 31, 2021 include Ps 753.2 billion of total bonds issued from BHI that were consolidated by Grupo Aval prior to the spin-off in March 2022. For our continuing operations, the balance of bonds issued was Ps 28,362.2 billion at December 31, 2022 and Ps 31,504.7 billion at December 31, 2021, representing 11.6% and 14.9% of total funding, respectively. The main driver for the decrease in the balance was the maturity on September 26, 2022 of Grupo Aval Limited’s U.S.$1.0 billion 2012 senior bond issuance.
We and our subsidiaries have also issued bonds in pesos and US$ in the local and international markets. The following bond issuances were placed in the market in 2022:
Issuance | Amount | |||||||
Issuer |
| date |
| (in Ps billion) |
| Expiration date |
| Interest rate |
Banco Popular | 2022 | 490.8 | March 2024 and 2027 | Fixed 10.20%;CPI + 3.84% and IBR 2.68% | ||||
Issuance | Amount | |||||||
Issuer |
| date |
| (in Ps billion) (1) |
| Expiration date |
| Interest rate |
Multibank Inc. | 2022 | 222.4 | January 2023 and December 2032 | Fixed 2.0% to 7.25% | ||||
| (1) | Translated to pesos using the representative market rate as computed and certified by the Superintendency of Finance at the date of each issuance. |
Amounts referred to in the table above reflect the gross amounts issued by each issuer. These are subject to eliminations in the consolidation process if an entity consolidated by Grupo Aval is a bondholder of the issuance.
Capital expenditures
Grupo Aval incurred in Ps 365.6 billion of net capital expenditures in tangible assets in 2022, as compared to Ps 530.7 billion in 2021.
Off-balance sheet arrangements
In the ordinary course of business, our banking subsidiaries have entered into various types of off-balance sheet arrangements, including credit lines, letters of credit and financial guarantees. Our banking subsidiaries utilize these instruments to meet their customers’ financing needs. The contractual amount of these instruments represents the maximum possible credit risk should the counterparty draw down the entire commitment or our bank fulfill its entire obligation under the guarantees, and the counterparty subsequently fails to perform according to the terms of the contract. Our banking subsidiaries may hold cash or other liquid collateral to support these commitments, and they generally have legal recourse to recover amounts paid but not recovered from customers under these instruments. Most of these commitments and guarantees expire undrawn. As a result, the total contractual amount of these instruments may not represent our banking subsidiaries’ future credit exposure or funding requirements under normal circumstances. In addition, some of these commitments, primarily those related to consumer financing, are cancelable by our banks upon notice.
145
The following table presents the maximum potential amount of future payments under these instruments and other contingencies at the dates presented for Grupo Aval on a consolidated basis.
| At December 31, | |||
| 2022 |
| 2021 | |
Grupo Aval | (in Ps billions) | |||
Unused credit card limits | 11,861.4 |
| 29,541.9 | |
Issued and confirmed letters of credit | 1,191.7 |
| 2,198.7 | |
Unused lines of credit | 6,610.9 |
| 5,894.6 | |
Bank guarantees | 4,686.1 |
| 3,603.9 | |
Approved credits not disbursed | 5,037.9 |
| 5,098.8 | |
Civil demands against our banks | 755.7 |
| 16.1 | |
Other | 3,585.2 |
| 3,859.4 | |
Total | 33,728.9 |
| 50,213.3 | |
| (1) | Figures at December 31, 2021 include Ps 22,850.4 billion of off-balance sheet arrangements from BHI that were consolidated by Grupo Aval prior to the spin-off in March 2022. |
Contractual obligations
The following tables present our contractual obligations at December 31, 2022.
| At December 31, 2022 | |||||||||
Payments due by period | ||||||||||
Less than | More than | |||||||||
| Total |
| 1 year |
| 1 - 3 years |
| 3 - 5 years |
| 5 years | |
Grupo Aval (in Ps billions) | ||||||||||
Liabilities: |
|
|
|
|
|
|
|
|
|
|
Long-term debt obligations |
| 28,362.2 |
| 5,723.6 |
| 3,461.7 |
| 8,124.9 |
| 11,052.0 |
Time deposits |
| 72,273.7 |
| 55,681.0 |
| 13,235.4 |
| 2,059.7 |
| 1,297.7 |
Long-term borrowings from banks and others |
| 30,309.4 |
| 20,081.7 |
| 2,830.3 |
| 3,668.0 |
| 3,729.4 |
Interbank and overnight funds |
| 9,087.9 |
| 9,087.9 |
| — |
| — |
| — |
Borrowings from development entities | 4,357.3 |
| 1,062.0 |
| 2,092.7 |
| 612.0 |
| 590.5 | |
Employee benefit plans |
| 890.0 |
| 501.8 |
| 134.8 |
| 58.1 |
| 195.2 |
Other liabilities | 10,141.8 |
| 8,386.9 |
| 1,526.3 |
| 196.6 |
| 32.0 | |
Total |
| 155,422.3 |
| 100,525.0 |
| 23,281.2 |
| 14,719.3 |
| 16,896.8 |
See Note 21 to our audited consolidated financial statements at December 31, 2022.
C. Research and development, patents and licenses, etc.
N/A.
D. Trend information
During 2022, Grupo Aval’s banking operation contributed 67.1% of its attributable net income, its merchant bank business contributed 28.2% and its pension fund business the remaining 4.7%. Given the impact of BHI’s spin-off on our audited consolidated financial statements, the following analysis will refer to the trend information of our continuing operations.
In terms of continuing operations, Grupo Aval’s banking operation contributed 56.7% of its attributable net income, its merchant bank business contributed 37.1% and its pension fund business the remaining 6.2%. The contribution to continuing operations of our banking operation remained relatively stable as compared to 56.7% in 2021, experiencing pressures from the sharp increase in reference rates and competition for funding driven by more demanding NSFR requirements. These elements drove the decrease in net interest margins (NIM) of our retail loans and debt securities investment portfolios, which are mostly at fixed interest rates.
Gross loans grew 18.1% in 2022. Commercial loans grew 18.3%, consumer loans grew 17.0%, mortgage loans grew 21.8%, and microcredit loans decreased 15.7%. Stronger origination activity as compared to 2021 drove the performance of our loan portfolios. The 20.8% annual depreciation of the Peso contributed to growth in our foreign currency denominated loans.
146
Net interest margin (NIM) for 2022 decreased by 69 basis points to 3.8% mainly as a result of the accelerated transmission of the Central Bank’s contractionary monetary policy into funding that was partially offset by higher yields of our interest-earning assets. This situation led to a 62 basis points decrease in the spread between our interest-earning assets and our interest-bearing liabilities.
Inflationary pressures remained high around the globe in the last months of 2022. Although inflation has started to recede in most countries during the first months of 2023, in Colombia 12-month inflation of 13.34% in March 2023 was slightly higher than the 13.12% mark in December 2022. Monthly inflations of 1.78% in January, 1.66% in February and 1.05% in March took year to date inflation at March 2023 to 4.56%. As a result of these inflationary pressures, the Central Bank increased its benchmark interest rate by 75 basis points in January 2023 and 25 basis points in March 2023 to 13.0%. Our economic analysts’ estimate the Central Bank rate could further increase to 13.25%, remain at that level until August and start trending down to 11.0% at year-end 2023.
More Stringent NSFR requirements distorted the market for deposits throughout 2022 as banks competed for marginal funding to comply with more demanding regulation that started to apply on March 31, 2023. Historically, the average spread between time deposits and the Colombian sovereign curve (cero coupon) was close to 100 basis points, with variances depending on maturity. In March 2022, banks started to compete for this type of funding to strengthen NSFR metrics, which drove an increase of this spread to close to 190 basis points in the second quarter of 2022, 290 basis points in the third quarter, 370 in the fourth quarter. The spread reached a maximum of 500 basis points by mid-January 2023. Nonetheless, as banks accommodated to NSFR metrics competition winded down during February 2023; as a result, the spread has dropped to levels below 200 basis points in March 2023.
We anticipate NIM of our banking operations will remain under pressure during the first half of 2023 and start progressively increasing towards the second half of the year with diverging trends between commercial and retail loans (consumer, mortgages and microcredit) and fixed income investments. Commercial gross loans represent 57.5% of our gross loan portfolio, of which 85.2% is variable rate mostly referenced either to the 3-month inter-bank rate (IBR) or the 90-day time deposit rate (DTF) that moves in tandem with the benchmark rate. In contrast consumer gross loans are mainly fixed rate.
Cost of risk net of recoveries was 1.5% for 2022, 36 basis points lower than in 2021. Grupo Aval’s cost of risk improved driven by the decrease in expected credit losses (ECL) resulting from stronger economic activity. Asset quality, as measured by gross loans classified as Stage 1 improved to 87.2% in 2022 from 81.7% in 2021.
Net trading income on investments evidenced raising interest rate environment and the volatile performance of international fixed income and equity markets throughout the year, as it reflected losses during the first three quarters and a positive result in the last quarter of the year. Net trading income from derivatives was stronger in 2022 than in 2021, although offset by a decrease of foreign exchange gains (losses). The result of both operations was negatively impacted by the increase in forward rates to hedge the Peso exchange rate.
Grupo Aval continued to focus part of its efforts on a rigorous control of operating expenses growth in 2022. Other expenses grew 9.3% as compared to 2021 with headwinds coming from increases in operating taxes in 2022, that amounted to 2.8 percentage points of overall other expense growth. The continued progress of our digital efforts and cost control initiatives across our subsidiaries also contributed to this improvement. Some initiatives include (i) reformatting and closure of branches, (ii) business process optimizations, (iii) a migration of transactions to digital channels and (iv) an ATM network optimization.
During 2022, Grupo Aval’s merchant banking business reflected a strong contribution from Corficolombiana’s infrastructure projects and its energy and gas business. Consolidated gross income from sales of goods and services increased Ps 1,446.2 billion or 46.7% to Ps 4,545.1 billion. Partially offsetting this performance, our non-financial subsidiaries experienced the negative impact from increases in funding rates (recorded under net interest income) and the net effect of the increase in forward rates (recorded under net trading income from derivatives under net trading income and foreign exchange gains (losses), net under other income). Net interest expense contributed by our non-financial subsidiaries increased Ps 151.8 billion to a Ps 434.6 billion net interest expense and the net loss from derivatives and foreign exchange gains (losses), net contributed by our non-financial subsidiaries increased Ps 511.1 billion to a Ps 587.5 billion net loss. Results of operations of Grupo Aval’s non-financial entities for 2023 are expected to be lower than in 2022, given that Coviandina completed the construction phase in 2022, the construction of Covioriente will continue to progress and Covipacifico will approach completion.
The pension fund business reflected the negative effects of capital markets performance on its stabilization reserve and the increase in life and disability insurance premiums on mandatory pension fee income. These were partially offset by a positive evolution in employment metrics and the number of clients that mitigated the increase in insurance premiums on fee income. Porvenir’s clients for mandatory, voluntary and severance funds at December 31, 2022 were 16.6 million (5.6% more customers than the 15.8 million customers at December 31, 2021). This result was driven by (i) an increase of 611.6 thousand clients to Porvenir’s mandatory pension fund to 11.3 million (a 5.7% increase) and an increase of 243.6 thousand clients to severance funds to 5.1 million (a 5.0% increase).
Grupo Aval’s future results will be driven by the performance of our banking operations and thus will depend on how credit volumes, net interest margin, cost of risk and overall expenses behave. Results from our investments in the non-financial sector will be highly reliant on
147
how investments in the infrastructure (construction progress, inflation and Peso exchange rate) and in energy & gas (distribution volumes and prices) sectors perform. These results will be affected in a lesser magnitude, by the performance of the hospitality, agribusiness and other sectors. Porvenir’s results for the year 2023 will greatly depend on the final Law approved by congress which intends to modify Colombia’s pension system (pension reform). For information on the bill submitted to Congress please see “Item 3. Key Information—D. Risk Factors—Risks relating to our pension and severance fund management business—Porvenir operates in a highly regulated market, which limits its flexibility to manage its businesses.”.
E. Critical accounting estimates
Critical accounting policies are those that require us to exercise judgment or involve a higher degree of complexity in the application of the accounting policies that currently affect our financial condition and results of operations. The accounting estimates we make in these contexts require us to calculate variables and make assumptions about matters that are highly uncertain. In each case, if we had made other estimates, or if changes in the estimates occur from period to period, our financial condition and results of operations could be materially affected.
Significant accounting policies, including those affected by critical accounting estimates and judgements, are described in Note 3 of our audited consolidated financial statements. See Note 3 to our audited consolidated financial statements for a complete list of the critical accounting judgments and estimates. There are many other areas in which we use estimates about uncertain matters, but we believe the reasonably likely effect of changed or different estimates would not be material to our financial statements.
The following are the critical accounting policies that have the most significant effects on the amounts recognized in our audited consolidated financial statements:
| ● | Impairment of amortized cost financial assets and financial assets measured at fair value through other comprehensive income (FVOCI): the most significant judgments relate to establishing the criteria for determining whether credit risk on a financial asset has increased significantly since initial recognition, determining the methodology for incorporating forward-looking information into the measurement of ECL and selection and approval of models used to measure ECL. A high degree of uncertainty is involved in making estimations using assumptions that are highly subjective and very sensitive to the risk factors. See Note 4 (4.1.5) of our audited consolidated financial statements. |
| ● | Revenue recognition and fair value of concession arrangements: the most significant judgments relate to establishing the criteria for recognizing revenues from concessions in the construction phase and measuring the fair value of concession arrangements. See Note 16 of our audited consolidated financial statements. |
| ● | Recognition of deferred tax assets: the most significant judgments relate to availability of future taxable profit against which carry-forward tax losses can be used. See Note 19 of our audited consolidated financial statements. |
| ● | Fair value of financial instruments: a variety of valuation techniques are used, some of which are determined using significant unobservable inputs. See Note 5 of our audited consolidated financial statements. |
| ● | Impairment testing for CGUs containing goodwill: a high degree of uncertainty is involved in estimating the recoverable amounts resulting from future cash flows of the cash-generating units (CGU) and discount rates. See Note 17 of our audited consolidated financial statements. |
| ● | Recognition and measurement of provisions and contingencies: significant judgment may be required due to the high degree of uncertainty associated with the likelihood and magnitude of an outflow of resources that may arise. See Note 23 of our audited consolidated financial statements. |
| ● | Defined benefit obligations: the most significant judgments relate to key assumptions involved in the measurement, including discount rate, inflation rate and mortality, among other. See Note 22 of our audited financial statements. |
| ● | Classification of financial assets: the most significant judgments relate to the assessment of the business model within which the assets are held and assessment of whether the contractual terms of the financial asset are solely payments of principal and interest on the principal amount outstanding. See Note 2 (2.5) (ii) of our audited financial statements. |
| ● | Determination of control over investees. See Note 2 (2.1) of our audited financial statements. |
148
ITEM 6. DIRECTORS, SENIOR MANAGEMENT AND EMPLOYEES
A. Directors and senior management
Board of Directors
The Board of Directors of Grupo Aval is composed of seven principal members and seven alternate members, each of whom serves a one-year term and may be reelected indefinitely. The term for the current directors expires on March 31, 2024.
The current members of the Board of Directors were appointed at a shareholders’ meeting held on March 30, 2023. The following table presents the names of the current principal and alternate members of the Board of Directors.
Board member |
| Alternate |
Luis Carlos Sarmiento Angulo |
| Mauricio Cárdenas Müller |
Alejandro Figueroa Jaramillo |
| Carlos Eduardo Upegui Cuartas |
María Lorena Gutiérrez Botero |
| Juan Camilo Ángel Mejía |
Álvaro Velásquez Cock (1)(3) |
| Ana María Cuéllar de Jaramillo |
Fabio Castellanos Ordóñez (1)(2)(3) |
| Luis Fernando López Roca (2) |
Miguel Largacha Martínez |
| César Prado Villegas |
Esther América Paz Montoya(1)(2)(3) |
| Germán Villamil Pardo(2) |
| (1) | Member of the Audit committee. |
| (2) | Independent director under Colombian requirements. |
| (3) | Independent director under SEC Audit Committee rules. |
Luis Fernando Pabón Pabón is the secretary of our Board of Directors.
Biographical information of the principal members of our Board of Directors and the secretary of our board is set forth below. Ages of members of our Board of Directors throughout this annual report are as of April 10, 2023.
Luis Carlos Sarmiento Angulo, age 90, has served as the Chairman of the Board of Directors of Grupo Aval since 1999. Mr. Sarmiento Angulo is the founder and controlling shareholder of Grupo Aval and, since 1985, has served as a member of the Board of Directors of Organización Luis Carlos Sarmiento Angulo Ltda., an affiliate of our controlling shareholder. Since 2010 he has served as principal member of the Board of Directors of Casa Editorial El Tiempo and of CEET TV. He also serves as Chairman of the Board of Directors of the following not-for-profit entities: Fundación Grupo Aval, Fundación Luis Carlos Sarmiento Angulo, and Fundación Centro de Tratamiento e Investigación del Cáncer—“CTIC”. He is supporting, among other initiatives, the CTIC, Corporación Excelencia en la Justicia, and Fundación para el Futuro de Colombia—Colfuturo. He holds a degree in Civil Engineering from Universidad Nacional de Colombia. He is the father of the President of Grupo Aval, Mr. Luis Carlos Sarmiento Gutiérrez. Mr. Sarmiento Angulo’s business address is Carrera 13 No. 26A-47, Bogotá, D.C., Colombia.
Alejandro Figueroa Jaramillo, age 81, has served as a principal member on the Board of Directors of Grupo Aval since 1999. Mr. Figueroa Jaramillo has been the President of Banco de Bogotá since 1988. He has been employed with Banco de Bogotá since 1973, where he also served as Executive Vice President and Vice President of Finance. He is the Chairman of the Board of Directors of Porvenir and has been a board member of Porvenir since 1991. He has also been a member of the Board of Directors of Corficolombiana since 1998 and of Fundación Grupo Aval since 2011 and of Asociación Bancaria de Colombia - Asobancaria. He previously served as Vice-Minister and Deputy Minister of Economic Development of Colombia. He holds a degree in Civil Engineering from Facultad de Minas de la Universidad Nacional in Antioquia and a Master of Arts degree and PhD candidate in Economics from Harvard University. Mr. Figueroa Jaramillo’s business address is Calle 35 No. 7-47, Bogotá, D.C., Colombia.
María Lorena Gutiérrez Botero, age 54, has served as President of Corficolombiana since August, 2018. Ms. Gutiérrez previously served as Minister of Commerce, Industry and Tourism from 2017 to 2018, Ambassador of Colombia in Germany from 2016 to 2017 and Minister to the Presidency from 2010 to 2016. She has also served in the past as Dean of the Business School at Universidad de Los Andes from 2003 to 2010. Ms Gutiérrez served as a member on the Board of Directors of Grupo Aval, Promigas, Proindesa, Fiduciaria Corficolombiana, Gas Comprimido del Perú, Gases del Caribe She holds a degree in Industrial Engineering with a specialization in finance from Universidad de los Andes, a Master of Business Administration (MBA) and a PhD in Finance from the A.B. Freeman School of Business at Tulane University. Her principal business address is Carrera 13 No. 26-35, Bogotá, D.C., Colombia.
149
Álvaro Velásquez Cock, age 83, has served as a principal member of the Board of Directors of Grupo Aval since 2013 and previously as an alternate member thereof since 2008. Mr. Velásquez Cock has served as advisor to Grupo Ethuss since 1994. He has acted as Dean of the Faculty of Economics of the Universidad de Antioquia, Chief of the Departamento Nacional de Estadística—DANE, President of Pedro Gómez & Cía. S.A. and as a member of the Advisory Committee of the Superintendence of Finance. He has been a member of the Board of Directors of Banco de Bogotá since 2001, of Banco de Bogotá—Panamá since 1984, of Corficolombiana since 1992, of Unipalma since 1996 and of BAC entities since 2011. He holds a degree in Economics from the Universidad de Antioquia. Mr. Velásquez Cock’s business address is Carrera 13 No. 26A-47, Bogotá, D.C., Colombia.
Fabio Castellanos Ordóñez, age 66, has served as a principal member of the Board of Directors of Grupo Aval since March 2018 and previously as an alternate member since September 2015. He was, until 2020 the local representative in Colombia of AMF (Ascending Markets Financial Guaranty Corporation) and has previously acted as Chief Country Officer and Executive Director of ABN-AMRO Bank (Colombia) S.A., The Royal Bank of Scotland (Colombia) S.A., Scotiabank Colombia S.A. and Vice President and Corporate Finance Executive of the Representative Office in Colombia, New York and Argentina of The Chase Manhattan Bank, N.A for 22 years. Mr. Castellanos serves as member of the Board of Directors of Ignacio Gómez IHM S.A. He holds a degree in Business Administration from California State Polytechnic University and a Master’s Degree in Management in the Network Economy from Universitá Cattolica del Sacro Cuore. Mr. Castellanos Ordóñez’ business address is Carrera 13 No. 26A-47, Bogotá, D.C., Colombia.
Miguel Largacha Martínez, age 59, has served as President of Porvenir since 2008. Mr. Largacha Martínez previously served as President of Horizonte Sociedad Administradora de Fondos de Pensiones y de Cesantías S.A., and held other positions within BBVA Colombia S.A., including Executive Vice President and Vice President of Banco Ganadero (the predecessor to BBVA Colombia S.A.) and has been a member of the Board of Directors of Fundación Grupo Aval since 2011. He holds a law degree from Universidad Javeriana and has further completed graduate studies in Financial Legislation and Executive Management at the Universidad de los Andes. His business address is Carrera 13 No. 27-75, Bogotá, D.C., Colombia.
Esther América Paz Montoya, age 68, has served as a principal member on the Board of Directors of Grupo Aval since 2010, and previously as an alternate member thereof since 2005. Ms. Paz Montoya is a former President of Banco AV Villas, where she also served as Vice President of Finance and Vice President of Operations, and a former President of Ahorramás Corporación de Ahorro y Vivienda. Ms. Paz Montoya has served as a member of the Board of Directors of Agremiación Cívica Centro Internacional San Diego S.A. and Admincentros. She holds a degree in Business Administration from the Universidad del Valle and graduate studies in finance from Universidad de Los Andes. Ms. Paz Montoya’s business address is Carrera 13 No. 26A-47, Bogotá, D.C., Colombia.
Biographical information of the alternate members of our Board of Directors is set forth below.
Mauricio Cárdenas Müller, age 53, has served as an alternate member of the Board of Directors of Grupo Aval since 2015. Previously, he served as a principal member on the Board of Directors of Grupo Aval from 2010 until 2014, and as an alternate member thereof since 2002 until 2010. Mr. Cárdenas Müller has acted as chief advisor to Luis Carlos Sarmiento Angulo since 2004. He is a member of the Board of Directors of Seguros Alfa S.A. and of Seguros de Vida Alfa S.A. since 2014, and previously served from 2002 until 2011. He has also served as a member of the Board of Directors of Fundación para el Futuro de Colombia – Colfuturo since 2007, of Porvenir since 2008, and of Casa Editorial El Tiempo since 2011. Mr. Cárdenas holds a degree in Electronic Engineering from Universidad Javeriana and a MBA from Escuela de Dirección y Negocios de la Universidad de la Sabana – INALDE. Mr. Cárdenas Müller’s business address is Carrera 13 No. 26A–47, Bogotá, D.C., Colombia.
Carlos Eduardo Upegui Cuartas, age 61, has served as an alternate member of the Board of Directors of Grupo Aval since March 26, 2021 and principal member of the Board of Directors of Corficolombiana and of Asociacion Bancaria de Colombia - Asobancaria. Mr. Upegui Cuartas has been President of Banco Popular since June 2014 and previously acted as its Executive Vice-president. Previously he was legal representative of Ripley Compañía de Financiamiento S.A. from 2012 to 2014 and President of BCSC S.A. from 2009 to 2012. He has also served in the past as member of the Board of Directors in several financial entities including Metlife Colombia Seguros de Vida S.A., Titularizadora Colombiana S.A., Depósito Centralizado de Valores de Colombia—Deceval S.A. He holds a degree in business administration with graduate studies in markets from Universidad de los Andes. His business address is Calle 17 No. 7-43, Bogotá, D.C., Colombia.
Juan Camilo Ángel Mejía, age 57, has served as an alternate member on the Board of Directors of Grupo Aval since 2008. Mr. Ángel Mejía has been the President of Banco AV Villas since 2007, and previously acted as its Vice President of Credit and Portfolio, Vice President of Asset Regularization and Vice President of Real Estate. Previously he was an advisor in the Offerings Department of Banco Central Hipotecario and Project Manager in the Capital Markets division of Corfinsura. He has also been a member of the Board of Directors of Asociación Bancaria de Colombia - Asobancaria since 2007, of Titularizadora Colombiana S.A. since 2008 and of Fundación Grupo Aval since 2011. He holds a degree in Civil Engineering from the Universidad de Medellín with graduate studies in finance from Universidad Eafit. Mr. Ángel Mejía’s business address is Carrera 13 No. 26A-47, Bogotá, D.C., Colombia.
Ana María Cuéllar de Jaramillo, age 69, has served as an alternate member of the Board of Directors of Grupo Aval since 2012 and Banco de Bogotá since 2007 and also serves as a member of the Board of Directors of Biomax S.A. Ladrillera Santa Fe S.A. and of BAC entities
150
since 2011. Ms. Cuéllar de Jaramillo is an independent consultant who specializes in systems and procedures for financial control and has formerly served as Director of the Dirección de Impuestos y Aduanas Nacionales DIAN and in several positions in Citibank. She holds a degree in accounting from Universidad Jorge Tadeo Lozano. Ms. Cuéllar de Jaramillo’s business address is Carrera 13 No. 26A-47, Bogotá, D.C., Colombia.
Luis Fernando López Roca, age 66, has served as an alternate member on the Board of Directors of Grupo Aval since March 23, 2018. Dr. López Roca is a partner of López Montealegre Abogados S.A., Director of the Financial Law Department at Universidad Externado de Colombia, Alternate Judge of the Constitutional Court for the 2018-2021 period and arbitrator. Dr. López Roca has acted as Superintendent of Securities, President of the Colombian Association of Commercial Financing Companies, and Advisor to the Inter-American Development Bank. He also held several positions in the Superintendency of Corporations, the Chamber of Commerce of Bogotá and the Superintendency of Banks (Superintendency of Finance). Dr. López Roca holds a Law Degree and PhD from Universidad Externado de Colombia, with an LLM in International Business Law at Universidad Francisco Vitoria and graduate studies in Economic, Commercial and Financial law at Universidad Externado de Colombia and Universidad de los Andes. Dr. López Roca’s business address is Carrera 13 No. 26A-47, Bogotá, D.C., Colombia.
César Prado Villegas, age 51, has served as President of Banco de Occidente since September 2018 and as member of the Board of Directors of Grupo Aval since March 29, 2019 and also as a member of the Board of Directors of Corficolombiana since March 2019 and Fiduciaria de Occidente since March 2020. Mr. Prado previously served as Administrative Vice-president of Banco de Bogotá from April to September 2018, President of Fiduciaria Bogotá from 2010 to 2018 and Superintendent of Finance from 2007 to 2008. He holds a law degree from Universidad del Rosario, a graduate degree in commercial law from Universidad de los Andes and a LLM from The London School of Economics. His business address is Carrera 4 No. 7-61, Cali, Colombia.
Germán Villamil Pardo, age 63, has served as an alternate member on the Board of Directors of Grupo Aval since 2010 and previously as a principal member thereof since 2006. Mr. Villamil Pardo is a partner of Gómez Pinzón Abogados S.A. He has served as a member of the Board of Directors of Gómez Pinzón Abogados S.A. since 1997. Mr. Villamil Pardo formerly served as a member of the board of Inversiones Inmobiliarias Arauco Alameda S.A.S and Inversiones Inmobiliarias Barranquilla Arauco S.A.S. He previously held several positions in the Ministry of Finance of Colombia as well as in Banco de la República. He holds a law degree with graduate studies in tax law from the Universidad de los Andes. Mr. Villamil Pardo’s business address is Carrera 13 No. 26A-47, Bogotá, D.C., Colombia.
Luis Fernando Pabón Pabón, age 64, has served as Secretary of the Board of Grupo Aval since 2000. Mr. Pabón Pabón formerly served as Legal Vice President of Banco de Colombia and as Legal Counsel to the President of Banco de Bogotá. He has been a member of the Board of Directors of Banco AV Villas since 1998, of Porvenir since 2003, of Almaviva S.A. since 2007, of Organización Luis Carlos Sarmiento Angulo Ltda. since 2006 and of Casa Editorial El Tiempo and CEET TV since 2011. He also serves as legal counsel to Organización Luis Carlos Sarmiento Angulo Ltda. Mr. Pabón Pabón holds a law degree from Universidad Javeriana and graduate studies in financial law from the Universidad de los Andes. Mr. Pabón Pabón’s business address is Carrera 13 No. 26A-47, Bogotá, D.C., Colombia.
151
Executive officers
The executive officers of Grupo Aval are responsible for the day-to-day management of our company. The following table lists the names and positions of our executive officers and the presidents of our banking subsidiaries, Corficolombiana and Porvenir. Certain of our executive officers are also members of the boards of directors of our subsidiaries.
Name |
| Position |
Luis Carlos Sarmiento Gutiérrez |
| President |
Diego Fernando Solano Saravia |
| Chief Financial Officer |
Rodolfo Vélez Borda |
| Chief of Information Technology |
Rafael Eduardo Neira Torres |
| Chief of Internal Control |
Jorge Adrián Rincón Plata |
| Chief Legal Officer |
Eduardo Duque Suárez |
| Chief Risk Officer |
María Edith González Flórez |
| Vice President of Accounting |
|
|
|
Banco de Bogotá |
|
|
Alejandro Figueroa Jaramillo |
| President |
Banco de Occidente |
|
|
César Prado Villegas |
| President |
Banco Popular |
|
|
Carlos Eduardo Upegui Cuartas |
| President |
Banco AV Villas |
|
|
Juan Camilo Ángel Mejía |
| President |
Corficolombiana |
|
|
María Lorena Gutiérrez Botero |
| President |
Porvenir |
|
|
Miguel Largacha Martínez |
| President |
Biographical information of our executive officers and key employees who are not directors is set forth below. Ages of our executive officers throughout this annual report are as of April 10, 2023.
Luis Carlos Sarmiento Gutiérrez, age 61, has served as President of Grupo Aval since 2000. Mr. Sarmiento Gutiérrez acted as President of Cocelco S.A. from 1997 until 2000. Previously he served as Executive Vice President at First Bank of the Americas in New York and as an analyst and financial manager at Procter & Gamble’s corporate headquarters. He has been the Chairman of the Board of Directors of Banco de Bogotá since 2004 and of Corficolombiana since 2006. He holds a Bachelor of Science degree, magna cum laude, in civil engineering from the University of Miami and a MBA with a concentration in Finance from the Johnson Graduate School of Management at Cornell University. Mr. Sarmiento Gutiérrez’s business address is Carrera 13 No. 26A-47, Bogotá, D.C., Colombia.
Diego Fernando Solano Saravia, age 57, has served as Chief Financial Officer since 2010, and formerly as Vice President of Corporate Planning, of Grupo Aval since 2006. He previously served as associate principal at McKinsey & Co. and Corporate Banking Vice President at Banco Santander Colombia. He holds a degree in Systems Engineering from the Universidad de los Andes and a MBA from the Wharton School at the University of Pennsylvania. His business address is Carrera 13 No. 26A-47, Bogotá, D.C., Colombia.
Rodolfo Vélez Borda, age 58, has served as Chief of Information Technology at Grupo Aval since 2012 and formerly as Vice President of Technology and Operations of Banco AV Villas and Corporación Ahorramás. He has been a member of the Board of Directors of Fondo de Empleados FEVI since 2012, ACH Colombia S.A. since 2006 and A Toda Hora S.A. (“ATH”) since 2005. He holds a degree in Systems Engineering from the Universidad de Los Andes, graduate studies in Telecommunications from the Universidad de Los Andes and a Business Management specialty from Aden Business School and MIT. Mr. Vélez Borda’s business address is Carrera 13 No. 26A-47, Bogotá, D.C., Colombia.
Rafael Eduardo Neira Torres, age 65, has served as Chief of Internal Control of Grupo Aval since 2009. Mr. Neira Torres acted as Deputy Superintendent of Finance, and formerly as Adjunct Superintendent, at the Superintendency of Finance from 2006 to 2008. He previously worked as Operations Vice President at Banco Davivienda. He holds a degree in Accounting from the Universidad Jorge Tadeo Lozano and graduate studies in Banking Management from the Universidad de los Andes. Mr. Neira Torres’ business address is Carrera 13 No. 26A-47, Bogotá, D.C., Colombia.
Jorge Adrián Rincón Plata, age 43, has served as our Chief Legal Officer since May 2012. Mr. Rincón previously served as Legal Counsel to Banco de Bogotá. He holds a degree in law from the Universidad Autónoma de Bucaramanga and a Masters in International Business Law from Queen Mary University & Westfield College, University of London. Mr. Rincón Plata’s business address is Carrera 13 No. 26A-47, Bogotá, D.C., Colombia.
152
Eduardo Duque Suárez, age 57, joined as Chief Risk Officer on March 2022. Previously, he served as Mexico and Latam Global Functions Independent Compliance Risk Management Head in Citi, Regional ICG Risk Manager Senior Credit officer Level 2 for Colombia, Ecuador, Ecuador and Venezuela, Risk Manager Country Officer Chile, Perú and Bolivia, Deputy Country Credit Risk Manager and Vice-president Emerging Markets Corporate Banking EMCB – Institutional Client Group. He also worked as Director in Waventure S.A. de C.V in Mexico, Director in NM Rothschild & Sons Mexico, Assistant Director in NM Rothschild & Sons Colombia and Assistant Director in Deutsche Morgan Grenfell Group Public Limited Company from 1997 to 2005. He holds a degree in Economics and a MSc in Economics from Universidad de Los Andes. Mr. Duque Suarez’ business address is Carrera 13 No. 26A-47, Bogotá, D.C., Colombia.
María Edith González Flórez, age 64, has served as Vice President of Accounting since 2010, and formerly as Financial and Administrative Manager, of Grupo Aval since 2004. Ms. González Flórez previously worked as Financial Manager at Cocelco S.A. and Movistar. She holds a degree in Public Accounting from the Universidad de Santiago de Cali and graduate studies in finance from Universidad ICESI. Ms. González Flórez’s business address is Carrera 13 No. 26A-47, Bogotá, D.C., Colombia.
B. Compensation
Our common shareholders must approve the compensation of our Board of Directors at the shareholders’ ordinary meeting held in March of every calendar year.
Each member of our Board of Directors, including alternates, receives a fee based on attendance at each Board of Directors’ session. Committee members, including our audit committee, also receive an additional fee for attending audit committee meetings.
For the April 1, 2022 to March 31, 2023 period, the Board of Directors and the audit committee’ session fee per member was Ps 3,000,000 per meeting. For the April 1, 2023 to March 31, 2024 period, the Board of Directors and the audit committee’ session fee per member is Ps 3,400,000 per meeting.
We are not required under Colombian law to publish information regarding the compensation of our individual executive officers, and we do not make this information public. Our shareholders, however, can request this information prior to our general shareholders’ meetings. The aggregate amount of compensation, inclusive of bonuses, which we and our subsidiaries paid to directors, alternate directors and senior executive officers was Ps 54.5 billion in 2022. We pay bonuses to our executive officers which vary according to each officer’s performance and the achievement of certain goals, and, therefore, the amounts paid may vary for each officer.
We do not have, and have not had in the past, any share option plans.
C. Board practices
Principal differences between Colombian and U.S. corporate governance practices
Grupo Aval, as a listed company that qualifies as a foreign private issuer under the NYSE listing standards in accordance with the NYSE corporate governance rules, is permitted to follow home-country practice in some circumstances in lieu of the provisions of the corporate governance rules contained in Section 303A of the NYSE Listed Company Manual that are applicable to U.S. companies. We follow corporate governance practices applicable to Colombian companies and those described in our Corporate Governance Code, which in turn follow Colombian corporate governance rules. The Corporate Governance Code is available at Grupo Aval’s website at www.grupoaval.com. Information on our website is not incorporated into this annual report.
The following is a summary of the significant differences between the corporate governance practices followed by Grupo Aval and those applicable to domestic issuers under the NYSE listing standards.
Independence of directors
Under NYSE corporate governance rules, a majority of a U.S. company’s Board of Directors must be composed of independent directors, although as a foreign private issuer and a company that is controlled, directly or indirectly, by Mr. Luis Carlos Sarmiento Angulo, we would not be required to comply with this rule. Law 964 of 2005 requires that our Board of Directors consist of five to ten members and that at least 25% of such members be independent directors, and Decree 3923 of 2006 regulates their election. “Independence” within the meaning of Law 964 of 2005 is primarily concerned with independence from management and the absence of material related-party transactions between the director and the company. See “Item 10. Additional Information—B. Memorandum and articles of association”. In compliance with Colombian law and our by-laws, Grupo Aval’s Board of Directors is composed of seven members, of which two are independent under Colombian rules. In addition, Colombian law mandates that all directors exercise independent judgment under all circumstances.
153
Non-executive director meetings
Pursuant to the NYSE listing standards, non-executive directors of U.S. listed companies must meet on a regular basis without management being present. Under Colombian regulations, there is no prohibition against officers being members of the Board of Directors, and it is our practice that each president of our banks be a member of our Board of Directors. The non-executive directors of Grupo Aval do not meet formally without management present.
Committees of the Board of Directors
Under NYSE listing standards, all U.S. companies listed on the NYSE must have an audit committee, a compensation committee and a nominating/corporate governance committee, each with a written charter addressing certain minimum specified duties, and all members of such committees must be independent. In each case, the independence of directors must be established pursuant to highly detailed rules promulgated by the NYSE and, in the case of the audit committee, the NYSE and the SEC. We have established an audit committee, a corporate matters committee, compensation committee and risk committee as further described below.
Audit committee
Our audit committee is composed of three members, appointed by the Board of Directors: Esther América Paz Montoya, Álvaro Velásquez Cock and Fabio Castellanos Ordóñez. Fabio Castellanos Ordóñez is the financial expert on the audit committee. All members of our audit committee are independent under the NYSE and SEC corporate governance rules applicable to us. Company officers are not members of the audit committee; however, the meetings and work product of the audit committee are supported by reports and presentations by company officers. Pursuant to Colombian Securities regulation (Law 964 of 2005), the audit committee has a charter approved by the Board of Directors, which sets forth the main aspects related to the operation of such committee, including, among others, its composition and duties. The audit committee charter addresses various corporate governance subjects. Our external auditor KPMG, as our independent registered public accounting firm, is invited to attend all meetings of the audit committee. Pursuant to Colombian law, the audit committee must meet at least quarterly.
Our audit committee advises the Board of Directors generally on internal control matters, and it specifically undertakes to:
| ● | review financial statements prior to their submission to the Board of Directors and to the general shareholders’ meeting; |
| ● | supervise the internal auditor to verify if its actions address the internal control needs of the company and to identify limitations with respect to its duties; |
| ● | review all internal control reports of the company and supervise compliance with such reports by the company’s management; |
| ● | issue its opinion on the independence of the external auditor, based on standards set forth by Colombian and U.S. regulations; |
| ● | monitor the company’s levels of risk exposure at least every six months and propose mitigation measures as needed; |
| ● | propose to the Board of Directors control systems to prevent, detect and adequately respond to the risk of fraud and improper conduct by company employees; |
| ● | provide assistance to our Board of Directors in fulfilling its responsibilities with respect to our compliance with legal and regulatory requirements; |
| ● | make recommendations to the general shareholders meeting concerning the engagement of the independent accounting firm; and |
| ● | issue reports to the Board of Directors on matters deemed relevant. |
Corporate matters committee
Our corporate matters committee is composed of three members, appointed by the Board of Directors: Esther América Paz Montoya, Álvaro Velásquez Cock and Fabio Castellanos Ordóñez. The corporate matters committee is responsible for overseeing the activities executed by the internal control of Grupo Aval and its subsidiaries.
154
Compensation committee
Our compensation committee is composed of two directors: Mr. Luis Carlos Sarmiento Angulo and Mr. Mauricio Cárdenas Müller. Our Board of Directors may change the members of the committee at any time. The compensation committee advises the board on remuneration matters and specifically undertakes to (i) review the remuneration of our President and (ii) review the criteria upon which our President will determine the remuneration of our senior management and employees. Colombian law does not require the creation of a compensation committee and the Board of Directors is not required by law to adopt a compensation committee charter.
Risk Committee
Our risk committee is composed of three directors: Ms. Maria Lorena Gutierrez, Mr. Fabio Castellanos and Mr. Miguel Largacha. The committee, which charter is approved by the Board of Directors, assists and advices the board in aspects related to supervision of Grupo Aval’s risk management policies.
D. Employees
At December 31, 2022, on a consolidated basis, we employed 77,043 individuals, with 49,960 direct employees, 6,775 personnel provided by staffing service companies and 20,308 outside contractors.
The following table presents the approximate breakdown of the employees, personnel provided by staffing service companies and outside contractors of our banking subsidiaries, Corficolombiana, Porvenir and Grupo Aval (separate), at December 31, 2022.
| Banco de |
| Banco de |
| Banco |
| Banco AV |
|
|
| Grupo Aval |
| ||||
Bogotá(1)(2) | Occidente(3) | Popular(4) | Villas(5) | Porvenir | Corficolombiana(6) | (separate) | Total | |||||||||
Employees |
| 12,818 | 14,964 | 4,365 | 4,812 | 2,693 | 10,190 | 118 |
| 49,960 | ||||||
Personnel provided by staffing service companies |
| 1,357 | — | 840 | 464 | 11 | 4,103 | — |
| 6,775 | ||||||
Outside contractors |
| 3,280 | 2,437 | 1,790 | 1,607 | 225 | 10,964 | 5 |
| 20,308 | ||||||
Total |
| 17,455 |
| 17,401 |
| 6,995 |
| 6,883 |
| 2,929 |
| 25,257 |
| 123 |
| 77,043 |
| (1) | Includes employees of MFH and its respective subsidiaries. |
| (2) | 50.70% (4,971) of Banco de Bogotá’s (separate) direct employees (9,804) are represented by unions and 56.00% (5,490) of such employees are covered by collective bargaining agreements that expire in August 2024. |
| (3) | 44.26% (3,010) of Banco de Occidente’s (separate) direct employees (6,800) are represented by unions and are covered by collective bargaining agreements that expire in December 2026. |
| (4) | 60.57% (2,195) of Banco Popular’s (separate) direct employees (3,624) are represented by unions and 94.62% (3,429) of such employees are covered by collective bargaining agreements that expire in December 2023. |
| (5) | 15.11% (632) of Banco AV Villas’ (separate) direct employees (4,183) are represented by unions and 84.29% (3,526) of such employees are covered by collective bargaining agreements that expire in December 2023. |
| (6) | Corficolombiana’s total employees reflect 29,851 employees from non-financial entities and 1,118 employees from financial entities. |
155
E. Share ownership
Mr. Sarmiento Angulo beneficially owns 97.8% of our outstanding common shares and 45.4% of our preferred shares as determined under SEC rules at April 10, 2023. See “Item 7. Major Shareholders and Related Party Transactions—A. Major shareholders”. The following table provides the names of our other directors and key executive officers who owned shares of Grupo Aval at April 10, 2023.
|
| Percentage of |
|
| Percentage of | |||
outstanding | outstanding | |||||||
Common | common | Preferred | preferred | |||||
Shareholder | shares | shares | shares | shares | ||||
Esther América Paz Montoya |
| 251,718 |
| * |
| 423,076 |
| * |
Diego Fernando Solano Saravia |
| 53,191 |
| * |
| 163,135 |
| * |
Luis Fernando Pabón Pabón |
| 83,924 |
| * |
| 123,773 |
| * |
Mauricio Cárdenas Müller |
| 40,616 |
| * |
| 76,923 |
| * |
Germán Villamil Pardo |
| 33,058 |
| * |
| — |
| * |
Álvaro Velásquez Cock |
| 8,264 |
| * |
| 11,538 |
| * |
Juan Camilo Ángel Mejía |
| 7,319 |
| * |
| 22,666 |
| * |
Rodolfo Vélez Borda |
| 7,112 |
| * |
| 11,538 |
| * |
Ana María Cuéllar de Jaramillo |
| — |
| * |
| 50,846 |
| * |
César Prado Villegas |
| — |
| * |
| — |
| * |
Alejandro Figueroa Jaramillo |
| — |
| * |
| — |
| * |
Fabio Castellanos Ordóñez |
| — |
| * |
| — |
| * |
Carlos Eduardo Upegui Cuartas |
| — |
| * |
| — |
| * |
Luis Fernando López Roca |
| — |
| * |
| — |
| * |
Luis Carlos Sarmiento Gutiérrez |
| — |
| * |
| — |
| * |
Rafael Eduardo Neira Torres |
| — |
| * |
| — |
| * |
Jorge Adrián Rincón Plata |
| — |
| * |
| — |
| * |
Eduardo Duque Suárez | — | * | — | * | ||||
María Edith González Flórez |
| — |
| * |
| — |
| * |
María Lorena Gutiérrez Botero |
| — |
| * |
| — |
| * |
Miguel Largacha Martínez |
| — |
| * |
| — |
| * |
* less than 0.1%.
F. Disclosure of a registrant’s action to recover erroneously awarded compensation
Not applicable.
ITEM 7. MAJOR SHAREHOLDERS AND RELATED PARTY TRANSACTIONS
A. Major shareholders
Mr. Luis Carlos Sarmiento Angulo controls Grupo Aval and was the beneficial owner of 80.9% of our issued and outstanding share capital at December 31, 2022. He retained 97.8% of our voting power by virtue of his beneficial ownership of 97.8% of our outstanding common shares, and beneficially owned 45.4% of our outstanding preferred shares, as determined under SEC rules, at April 10, 2023. Beneficial ownership is defined in Form 20-F and generally includes voting or investment power over securities. Percentage of beneficial ownership is based on 23,743,475,754 of our aggregate equity securities outstanding comprised of 16,203,137,431 common shares outstanding and 7,540,338,323 preferred shares outstanding at April 10, 2023.
The principal shareholder, as a common shareholder and a preferred shareholder, does not have any different or special voting rights in comparison to any other common shareholder or preferred shareholder, respectively.
The following table sets forth information, as of December 31, 2022, regarding the beneficial ownership of our equity securities by:
| ● | Mr. Sarmiento Angulo, who beneficially owns 80.9% of our outstanding share capital; |
| ● | all directors and executive officers as a group; and |
| ● | other shareholders. |
156
| At December 31, 2022 |
| |||||||
|
| Percentage of |
|
| Percentage of |
| |||
| outstanding |
| outstanding | ||||||
Principal beneficial owners | Common shares |
| common shares | Preferred shares |
| preferred shares | |||
Luis Carlos Sarmiento Angulo | 15,844,485,878 |
| 97.8% | 3,372,734,618 |
| 44.7% | |||
Other directors and officers as a group* | 485,202 |
| 0.0% | 883,495 |
| 0.0% | |||
Other shareholders | 359,174,900 |
| 2.2% | 4,165,711,661 |
| 55.3% | |||
Total | 16,204,145,980 |
| 100.0% | 7,539,329,774 |
| 100.0% | |||
* less than 0.1%.
As of December 31, 2022, we had 34,896 holders of preferred shares registered in Colombia in addition to JPMorgan Chase Bank, N.A. as depositary of the American Depositary Receipts, or “ADRs”, evidencing ADSs. As of April 5, 2023, there were a total of 6,934 ADR holders of record and as of April 10, 2023 there were 11,755,716 ADRs outstanding, representing 235,114,320 preferred shares or 3.1% of outstanding preferred shares. Since some of these ADRs are held by nominees, the number of record holders may not be representative of the number of beneficial holders.
B. Related party transactions
We currently engage in, and expect from time to time in the future to engage in, financial and commercial transactions with “related parties” (within the meaning of the SEC rules). Unless otherwise indicated below, such transactions are conducted on an arm’s-length basis in the ordinary course of business, on terms that would apply to transactions with third parties.
The following chart presents outstanding amounts of related party transactions involving assets or liabilities between Grupo Aval and its consolidated subsidiaries, and each of the following individuals and entities.
| Transactions between Grupo Aval and its subsidiaries, and | |||||||
|
| Close family |
|
| ||||
Grupo Aval’s | members of | |||||||
directors and key | Mr. Sarmiento | Mr. Sarmiento | Mr. Sarmiento | |||||
management and | Angulo and their | Gutiérrez and his | Angulo and his | |||||
their affiliates(1) | affiliates | affiliates | affiliates | |||||
(in Ps billions) | ||||||||
At December 31, 2022 | ||||||||
Assets | ||||||||
Cash and cash equivalents | — | — | — | 0.3 | ||||
Financial assets in investments(2) | — | — | — | 4,846.2 | ||||
Loans(2) | 286.5 | 18.4 | 0.0 | 3,665.8 | ||||
Accounts receivable | 675.9 | 0.0 | — | 1,492.5 | ||||
Other assets | 22.7 | — | — | 16.5 | ||||
Liabilities | ||||||||
Deposits(3) | 75.0 |
| 260.1 |
| 5.2 |
| 1,239.5 | |
Financial obligations | 5.2 |
| 0.4 |
| 0.0 |
| 173.6 | |
Accounts payable | 0.0 |
| — |
| — |
| 7.1 | |
Other liabilities | 28.9 |
| 0.5 |
| — |
| 380.6 | |
At December 31, 2021 |
|
|
|
|
|
|
| |
Assets | ||||||||
Cash and cash equivalents | — | — | — | — | ||||
Financial assets in investments(2) | — | — | — | 1,389.6 | ||||
Loans(2) | 262.8 | 10.8 | 0.0 | 2,024.7 | ||||
Accounts receivable | 126.2 | 0.1 | — | 84.6 | ||||
Other assets | 0.9 | — | — | 13.7 | ||||
Liabilities | ||||||||
Deposits(3) | 39.7 | 191.3 | 5.4 | 2,017.9 | ||||
Financial obligations | 0.0 | 0.0 | — | — | ||||
Accounts payable | 0.3 | 0.7 | 0.0 | 787.1 | ||||
Other liabilities | 0.1 | — | — | 4.1 | ||||
157
| (1) | Excludes Mr. Sarmiento Angulo and Mr. Sarmiento Gutiérrez and their affiliates. Key management includes executive officers of Grupo Aval as well as each of the presidents of our banks, Corficolombiana and Porvenir at December 31, 2022. Key management at December 31, 2021 included the president of BHI. |
| (2) | Figures based on gross outstanding balances of financial assets. See “—Financial assets and liabilities with related parties”. Financial assets in question were made in the ordinary course of business, were made on substantially the same terms, including interest rates and collateral, as those prevailing at the time for comparable transactions with other persons, and did not involve more than the normal risk of collectability or present other unfavorable features. |
| (3) | Deposits of related parties held with us were made in the ordinary course of business, were made on substantially the same terms, including interest rates, as those prevailing at the time for comparable transactions with other persons. |
For information on related party transactions in accordance with IFRS disclosure rules, see Note 34 to our audited consolidated financial statements. For the purposes of Note 34 to our audited consolidated financial statements, “related parties” includes entities and persons that must be identified as such pursuant to IAS 24. For the purposes of this section, and as required by SEC rules, “related parties” includes enterprises that control, or are under common control with Grupo Aval, associates, individuals owning directly or indirectly an interest in the voting power that gives them significant influence over Grupo Aval, close family members, key management personnel (including directors and senior management) and any enterprises in which a substantial interest in the voting power is owned, directly or indirectly, by any of the persons listed above. We determine beneficial ownership under SEC rules. See “—A. Major shareholders”.
In the past, affiliates of Mr. Sarmiento Angulo, have obtained authorizations of Grupo Aval’s Board of Directors to acquire either common or preferred shares of Grupo Aval. On November 28, 2018, Grupo Aval’s Board of Directors authorized companies controlled by Mr. Sarmiento Angulo to acquire up to one hundred million common and/or preferred shares of the company in one or multiple operations, during a term of up to one year. Pursuant to such authorizations, as of December 31, 2019 through affiliate companies, Mr. Sarmiento Angulo acquired 2,724,247 common shares or Ps 3.3 billion (U.S.$1.0 million) and 1,702,800 preferred shares or Ps 1.9 billion (U.S.$0.6 million) in open market transactions. On February 12, 2020, Grupo Aval’s Board of Directors authorized companies controlled by Mr. Sarmiento Angulo to acquire up to one hundred million common and/or preferred shares of the company in one or multiple operations, during a term of up to two years. Pursuant to such authorizations, as of February 12, 2022 through affiliate companies, Mr. Sarmiento Angulo acquired 1,724,001 preferred shares or Ps 1.4 billion in open market transactions. On May 11, 2022, Grupo Aval’s Board of Directors authorized companies controlled by Mr. Sarmiento Angulo to acquire up to 3.0% of common and/or preferred shares of the company in one or multiple operations, during a term of up to two years. Pursuant to such authorizations, as of December 31, 2022 through affiliate companies, Mr. Sarmiento Angulo acquired 27,626,300 preferred shares or Ps 15.1 billion in open market transactions. As of April 5, 2023 through affiliate companies, Mr. Luis Carlos Sarmiento Angulo acquired 51,171,666 preferred shares or Ps 28.6 billion in open market transactions.
In October 2022, Esadinco S.A., an entity controlled by Mr. Sarmiento Angulo, launched an unsolicited tender offer for up to 25% of BHI’s shares. Banco de Bogotá tendered all of its shares in BHI, of which 9,030,422,813 BHI shares, or 20.89% of equity interest in BHI (representing approximately 14.4% of Grupo Aval’s then-remaining beneficial ownership interest in BHI) were accepted for tender and sold to Esadinco, S.A. at a price of Ps 293 per share in December 2022. The total consideration received by Banco de Bogotá amounted to Ps 2,645.9 billion. See “Item 5. Operating and Financial Review and Prospects—A. Operating Results—Principal factors affecting our financial condition and results of operations—Transactions related to BHI – Discontinued operations” for more information on the tender offer. In March 2023, Banco de Bogotá sold its remaining 4.11% equity interest representing 1,774,622,820 shares of BHI to Endor Capital Assets S.R.L, an entity controlled by Mr. Sarmiento Angulo at a price of Ps 293 per share. The total consideration received by Banco de Bogotá amounted to Ps 520.0 billion.
Certain members of our Board of Directors and key management own shares of Grupo Aval which, other than in the case of Mr. Sarmiento Angulo, were acquired in the open market or in one of our public offerings and represent less than 0.1% of our total outstanding shares.
Financial assets and liabilities with related parties
In the past, we and some of our subsidiaries have entered into operations with BHI and its subsidiaries in the ordinary course of business. Most recently, in December 2021, Grupo Aval Limited extended a short-term loan to BAC Holding International Corp. in an amount of U.S.$75.0 million that matured in September 2022. In 2020, through Resolution No. 208-20 of May 14, 2020 issued by the Superintendency of the Securities Market of the Republic of Panama, BAC International Bank, Inc. issued perpetual subordinated corporate bonds convertible into common shares for a nominal value of up to U.S.$700.0 million. The bonds bear an interest rate of 10.0% payable quarterly unless the issuer exercises its right not to pay interest. Grupo Aval Limited, a wholly-owned subsidiary of Grupo Aval, subscribed U.S.$520.0 million and as of December 31, 2022 the full balance remained outstanding. Given that BHI was consolidated into Grupo Aval at December 31, 2021, balances shown in the table above do not reflect these balances.
158
As of April 10, 2023, Mr. Sarmiento Angulo controls BHI as the beneficial owner of a 87.55% direct ownership of BHI’s issued and outstanding share capital. Mr. Sarmiento Angulo retained control of BHI following our spin-off of a 75% equity interest of BHI in March 2022, and increased his equity interest through tender offers and purchases of shares.
Following the guidelines approved by Grupo Aval’s General Shareholders Meeting and authorized by its Board of Directors, Grupo Aval extended a loan operation to Esadinco S.A. (an affiliate of Mr. Sarmiento Angulo) on December 2, 2022 to finance the tender offer of 25% of BHI’s shares. The loan operation consisted of two tranches: (i) a peso denominated loan for the equivalent of U.S.$270.0 million with a 3-year (36 months) tenor at 3-month SOFR + 3.5% and (ii) a Ps 200.0 billion loan with a 2-year (24 months) tenor at 3-month IBR + 4.5%. Both tranches are bullet, with interest payable on a quarterly basis. Collateral for both tranches was established at a minimum of 115% of the capital outstanding and the underlying assets deemed acceptable were shares of BHI or any other subsidiary under Grupo Aval’s direct control. The transaction was conducted on substantially the same terms, including interest rates and collateral, as those prevailing at the time for comparable transactions with other persons, and did not involve more than the normal risk of collectability or present other unfavorable features. At December 31, 2022, the outstanding balance at amortized cost of these loans was Ps 1,508.8 billion.
Business and financial reasons for borrowing from entities affiliated with Mr. Sarmiento Angulo
In the past, we have borrowed from entities beneficially owned by Mr. Sarmiento Angulo. These loans have been entered into on an arm’s-length basis with us, the holding company, at a rate substantially consistent with rates that would have been available to the holding company from other lenders at the time those borrowings were entered into. In addition to the global and local bond markets, companies affiliated with our controlling shareholder are among our funding alternatives. There are no outstanding loans granted to Grupo Aval by shareholders of Grupo Aval and their respective affiliates since December 20, 2013.
Loans granted to related parties by our banking subsidiaries
Key management of Grupo Aval and our banks, and their respective affiliates, who meet our credit eligibility requirements may subscribe to loans in the ordinary course of business, on market terms and conditions available to the general public.
All outstanding loans with our related parties are made in the ordinary course of business and on terms and conditions, including interest rates and collateral, not materially different from those available to the general public and did not involve more than the normal risk of collectability or present other unfavorable features.
Other transactions with Mr. Sarmiento Angulo and his affiliates
Beneficial ownership in our banking subsidiaries (outside of Grupo Aval)
In addition to his beneficial ownership in Grupo Aval, Mr. Sarmiento Angulo beneficially owns at April 10, 2023, 8.3% of Banco de Bogotá, 13.3% of Banco de Occidente, 15.5% of Banco AV Villas, 0.8% of Banco Popular, and 11.5% of Corficolombiana.
Except as stated above, Mr. Sarmiento Angulo does not have any other beneficial ownership in our banking subsidiaries. For information on the dividend history of our banking subsidiaries, see “Item 10. Additional Information—F. Dividends and paying agents—Dividend history of our banking subsidiaries”.
Insurance services
Seguros de Vida Alfa S.A., or “Vida Alfa”, a life insurance affiliate of Mr. Sarmiento Angulo, provides insurance required by law, as well as annuities, relating to the mandatory pension funds managed by Porvenir. The insurance provider is selected by Porvenir through a competitive bidding process once every four years. Premiums under this insurance policy are deducted by Porvenir from the individual customers’ account and transferred to Vida Alfa on behalf of the individual customer.
The table below presents the insurance premiums paid for the periods indicated.
Period |
| Amount |
| (in Ps billions) | |
For the year ended December 31, |
|
|
2022 |
| 2,095.8 |
2021 |
| 1,395.8 |
2020 |
| 1,246.2 |
Vida Alfa also provides:
159
| ● | life insurance, as sole provider and as co-insurer with non-affiliated insurers (pursuant to a competitive bidding process), for individual borrowers of our banking subsidiaries to cover the risk of non-payment upon death. Premiums are paid by the borrowers; and |
| ● | labor risks insurance for employees of Grupo Aval and its subsidiaries in Colombia. |
Seguros Alfa S.A., or “Alfa”, a property and casualty insurance affiliate of Mr. Sarmiento Angulo, provides fire and earthquake insurance for mortgage loans granted by certain of our banks. In addition, Alfa provides surety bonds and property insurance for our subsidiaries. Our banking subsidiaries also sell bancassurance products affiliated with Vida Alfa and Alfa. These transactions are conducted on an arm’s-length basis in the ordinary course of business. Alfa has in the past, but not currently, provided bankers’ blanket bond coverage to us and our subsidiaries, reinsured under prevailing market conditions, and surety bonds for Corficolombiana’s toll road concessions.
Other
The following companies are beneficially owned by Mr. Sarmiento Angulo at December 31, 2022, and may continue to provide services to us and our subsidiaries for amounts that are immaterial: Construcciones Planificadas S.A. (office renovations) and Vigía S.A. (security services). At December 31, 2022 we have significant influence with a 34.0% equity interest in ADL Digital Lab S.A.S. (digital development), a company beneficially owned by Mr. Sarmiento Angulo.
C. Interests of experts and counsel
Not applicable.
ITEM 8. FINANCIAL INFORMATION
A. Consolidated statements and other financial information
Financial statements
See “Item 18. Financial Statements”, which contains our audited consolidated financial statements prepared in accordance with IFRS.
Legal proceedings
We, our banking subsidiaries, Corficolombiana, Porvenir and our other subsidiaries are party to lawsuits and administrative proceedings incidental to the normal course of our business.
We record contingency provisions when the risk of loss is probable, in which case, we would consider settling. In cases where we litigate a claim, we record a provision for our estimate of the probable loss based on historical data for similar claims. As of December 31, 2022 and 2021, we and our banking subsidiaries had recorded consolidated provisions relating to administrative fines, indemnifications and legal proceedings for a total amount of Ps 229.2 billion and Ps 247.5 billion, respectively. These figures are presented before minority interest and thus do not reflect their potential impact on Grupo Aval’s net income attributable to owners of the parent.
Other litigation
On December 21, 2016, the United States Department of Justice announced that Odebrecht S.A., a global construction conglomerate based in Brazil, pled guilty and agreed to pay a monetary penalty to resolve charges with authorities in the United States, Brazil and Switzerland arising out of their schemes to pay approximately U.S.$800 million in bribes to Government officials in twelve countries around the world, including U.S.$11.5 million in Colombia, where the company admitted to offering bribes in order to obtain and amend infrastructure contracts, including the toll road concession Ruta del Sol Sector 2 awarded to the Concessionaire in 2009. Episol, a wholly-owned subsidiary of Corficolombiana, is a minority (33%) non-controlling shareholder in the Concessionaire and Odebrecht is the majority controlling and operating shareholder with a participation of 62%. A third shareholder, CSS Constructores S.A., participates with 5%.
Following the public announcement made by the United States Department of Justice relating to Odebrecht's admission of bribery, the Fiscalía initiated an investigation on December 22, 2016 establishing that Odebrecht effected payments directly from its Brazilian headquarters through its "division of structured operations" to obtain Government contracts in Colombia, including: (i) a payment in the amount of U.S.$6.5 million to Gabriel García Morales, Vice Minister of Transportation and acting manager of the INCO (a Government agency later replaced by the ANI), in order to award toll road concession Ruta del Sol Sector 2 in December 2009 and, (ii) a payment in the amount of U.S.$4.6 million to former congressman Otto Nicolas Bula Bula for the adjudication of the Ocaña-Gamarra tranche that was
160
added to toll road concession Ruta del Sol Sector 2 through Amendment N° 6, executed on March 14, 2014 by the director of the National Infrastructure Agency, Luis Fernando Andrade.
Additional investigations and proceedings relating to Ruta del Sol Sector 2 and relating to admissions made by Odebrecht and public servants were initiated by other judicial, arbitral and administrative authorities such as the Tribunal Administrativo de Cundinamarca, arbitral proceedings before the Chamber of Commerce of Bogotá, the Superintendency of Industry and Commerce, the Superintendency of Corporations, the Superintendency of Transportation and the Procuraduría General de la Nación (the country's general prosecutor of public servants, or the "PGN"). Grupo Aval, Corficolombiana and Episol and members of its management, were included or have voluntarily intervened in some of these investigations and proceedings and there can be no assurance that Grupo Aval or any of its subsidiaries and employees will not be included in future additional proceedings or voluntarily participate in such or other future additional proceedings to defend its rights and interests. For example, in late 2018, the U.S. Department of Justice and the SEC informed Grupo Aval that they had opened investigations on matters related to the Ruta del Sol Sector 2 project. Grupo Aval is cooperating with the DOJ and the SEC in these investigations and is in discussions regarding potential resolutions. However, we are currently unable to predict the outcome of the investigations or our discussions with the regulators, the amount of any penalties we may be required to pay or whether the outcome of these investigations will result in additional obligations. For further information see Note 27 of our audited financial statements.
We, our banking subsidiaries, Corficolombiana, Porvenir and our other subsidiaries are, from time to time, subject to claims and parties to legal proceedings incidental to the normal course of our business, including in connection with our lending activities, employees, taxation matters and other general commercial matters. Due to the inherent difficulty of predicting the outcome of legal disputes, we cannot predict the eventual outcome of these pending matters, the timing of the ultimate resolution of these matters or the eventual loss, fines or penalties related to each pending matter may be. We believe that we have recorded adequate provisions for the anticipated costs in connection with these claims and legal proceedings and believe that liabilities related to such claims and proceedings should not, taken together, have a material adverse effect on our business, financial conditions, or results of operations. However, in light of the uncertainties involved in such claims and proceedings, the ultimate resolution of these matters may exceed the provisions that we have currently recorded. As a result, the outcome of a particular matter could be material to our operating results for a particular period.
B. Significant changes
On March 31, 2022, Banco de Bogotá spun-off 75% of its equity interest in BHI to Banco de Bogotá’s shareholders, including Grupo Aval, and Grupo Aval spun-off shares of BHI it received from Banco de Bogotá to its own shareholders (the “Transaction”). As a result of the Transaction, Banco de Bogotá and Grupo Aval lost control of BHI and ceased to consolidate it. Prior to the spin-off, BHI was a significant subsidiary of Grupo Aval. See “Item 5. Operating and Financial Review and Prospects—A. Operating results—Principal factors affecting our financial condition and results of operations—Transactions related to BHI – Discontinued operations”.
ITEM 9. THE OFFER AND LISTING
A. Offering and listing details
Not applicable.
B. Plan of distribution
Not applicable.
C. Markets
Market price and volume information
Trading history of our ADSs
On September 22, 2014, we completed a SEC-registered initial public offering in the United States. We raised Ps 2.6 trillion (U.S.$1.3 billion) in gross proceeds. Our ADSs began to trade on the New York Stock Exchange, or NYSE, under the symbol “AVAL” on September 23, 2014. Each ADS represents 20 preferred shares.
Trading history of our common and preferred shares
In 1999, we conducted our initial public equity offering in Colombia and listed our common shares on the Colombian Stock Exchange under the ticker symbol “GRUPOAVAL”, raising Ps 62.5 billion (U.S.$35.3 million) in gross proceeds. Grupo Aval’s initial public offering was the first large-scale equity offering of a Colombian company to the general public, which allowed several thousand investors to become our
161
shareholders. In 2007, we conducted our second public offering of common shares pursuant to a preemptive rights offering in Colombia, raising Ps 372.0 billion (U.S.$210.4 million) in gross proceeds.
Our preferred shares have been listed since February 1, 2011 on the Colombian Stock Exchange under the symbol “PFAVAL”. We registered our preferred shares with the SEC and concluded our first offering of our preferred shares pursuant to a preemptive rights offering in Colombia, raising Ps 2.1 trillion (U.S.$1.1 billion) in gross proceeds. On January 17, 2014, we completed our third public offering of common shares pursuant to a preemptive rights offering, or the “Common Share Rights Offering”, raising Ps 2.4 trillion (U.S.$1.3 billion). In September 2014, we completed our second public offering of preferred shares pursuant to an initial public offering in the United States, as stated above in “—Trading history of our ADSs”.
Trading on the Colombian Stock Exchange
The Colombian Stock Exchange is the sole trading market for our common and preferred shares. The aggregate equity market capitalization of the 78 issuers listed on the Colombian Stock Exchange at April 10 , 2023 was Ps 322.8 trillion.
Regulation of Colombian Securities Markets
Colombian securities markets are subject to the supervision and regulation of the Superintendency of Finance, which was created in 2005 following the merger of the Superintendency of Banking and the Superintendency of Securities. The Superintendency of Finance is an independent regulatory entity ascribed to the Ministry of Finance. The Superintendency of Finance has the authority to inspect, supervise and control the financial, insurance and securities exchange sectors and any other activities related to the investment or management of public savings. Accordingly, we are subject to the control of the Superintendency of Finance as an issuer of securities, and our subsidiaries are subject to its control, supervision and regulation as financial institutions and issuers of securities. See “Item 4. Information on the Company—B. Business Overview—Supervision and regulation—Colombian banking regulators—Ministry of Finance” and “—Superintendency of Finance”.
Registration of the ADR Program and Investment in Our ADSs by Non-Residents of Colombia
The International Investment Statute of Colombia as provided by Decree 1068 of 2015, as amended, regulates the manner in which foreign investors may participate in the Colombian securities markets and undertake other types of investment, prescribes registration with the Colombian Central Bank of certain foreign exchange transactions and specifies procedures under which certain types of foreign investments are to be authorized and administered.
The International Investment Statute provides specific procedures for the registration of ADR programs as a form of foreign portfolio investment, which is required for the acquisition of the preferred shares to be offered in the form of ADSs. In addition, a holder of our ADSs or preferred shares may under certain circumstances be required to comply directly with certain registration and other requirements under the foreign investment regulations. Under these regulations, the failure of a non-resident investor to report or register foreign exchange transactions relating to investments in Colombia with the Colombian Central Bank on a timely basis may prevent the investor from obtaining remittance payments, including for the payment of dividends, and constitute an exchange control violation and/or result in a fine.
Each individual investor who deposits preferred shares into the ADR facility in exchange for our ADSs will be required, as a condition to acceptance by Fiduciaria Bogotá S.A., or “Fidubogotá”, as custodian of such deposit, to provide or cause to be provided certain information to Fidubogotá and/or the Depositary to enable it to comply with the registration requirements under the foreign investment regulations relating to foreign exchange. A holder of ADSs who withdraws preferred shares from the ADS deposit facility under certain circumstances may be required to comply directly with certain registration and other requirements under the foreign investment regulations. Under these regulations, the failure of a non-resident investor to report or register foreign exchange transactions relating to investments in Colombia with the Central Bank on a timely basis may prevent the investor from obtaining remittance payments, including for the payment of dividends, constitute an exchange control violation and/or result in a fine.
Under Colombian law, foreign investors receive the same treatment as Colombian citizens with respect to the ownership and voting of our ADSs and preferred shares. See “Item 3. Key Information—D. Risk factors—Risks relating to our businesses and industry—Risks relating to our preferred shares and ADSs” and “Item 4. Information on the Company—B. Business overview—Supervision and regulation—Restrictions on foreign investment in Colombia”.
D. Selling shareholders
Not applicable.
162
E. Dilution
Not applicable.
F. Expenses of the issue
Not applicable.
ITEM 10. ADDITIONAL INFORMATION
A. Share capital
Not applicable.
B. Memorandum and articles of association
The following is a summary of certain significant provisions of our by-laws, Colombian corporate law, the rules and regulations of the Superintendency of Finance and the Listing Rules of the Colombian Stock Exchange that pertain to our capital, management, periodical and occasional disclosures, as well as other corporate issues applicable to us. The description below includes the material provisions of our by-laws and Colombian corporate law. In Colombia, by-laws are the principal governing document of a corporation.
Our by-laws provide for an authorized share capital of 120,000,000,000 shares of par value of Ps 1.00 each, which may be either of two classes: common shares or shares with a preferred dividend, liquidation preference and no voting. At April 10, 2023, we had 16,203,137,431 common shares outstanding, and 7,540,338,323 preferred shares outstanding.
Our by-laws also provide for the conversion of common shares into preferred shares only when such conversion is approved or authorized at a general shareholders’ meeting. A shareholders’ meeting must define, in each case, the procedure to be followed for such conversion and must determine, among other matters, the maximum number or percentage of shares that may be converted. The shareholders’ meeting may also authorize the board of directors or the President of our Company to approve the agreements, forms and other documents to be executed in order to give effect to a conversion.
Our shareholders’ meeting held on December 7, 2010, determined that outstanding common shares may be converted into preferred shares on a 1-to-1 basis. Conversion of common shares into preferred shares may only be made once a month, provided that, as required by Colombian law and in accordance with our by-laws, our preferred shares shall not exceed 50% of our subscribed capital.
For a description of offerings of our shares see “Item 4. Information on the Company—A. History and development of the company—Our history”.
Voting Rights
Common Shares
The holders of common shares are entitled to vote on the basis of one vote per share on any matter subject to approval at a general shareholders’ meeting according to articles 14 through 19 of the by-laws, as amended from time to time. These general meetings may be ordinary meetings or extraordinary meetings. Ordinary general shareholders’ meetings occur once a year, no later than the last business day of March, for the following purposes:
| ● | to review the general situation of the Company; |
| ● | to determine the general economic policy of the Company; |
| ● | to consider the approval of our report for the preceding year ending on December 31, as applicable, including the financial statements for the above-mentioned term; |
| ● | to review the report prepared by the external auditor for the preceding year ending on December 31; |
| ● | to elect directors and the external auditor (on an annual basis); |
163
| ● | to determine the compensation of the members of the board of directors and the external auditor (on an annual basis); and |
| ● | to determine the dividend to be distributed and the allocation of profits, if any, of the preceding year ending on December 31, as well as any retained earnings from twelve months. |
Pursuant to Law 964 of 2005, at least 25% of the members of our board of directors must be independent within the meaning of Colombian rules. A person who is an “independent director” is understood to mean a director who is not:
| ● | an employee or executive officer of the issuer or any of its parent or subsidiary companies, including any person acting in such capacity during the year immediately preceding that in which they were appointed to the board, except in the case of an independent member of the board of directors being re-elected; |
| ● | a shareholder, who either directly or by virtue of an agreement directs, guides or controls the majority of the entity’s voting rights or who determines the majority composition of the administrative, directing or controlling bodies of this same entity; |
| ● | a partner or employee of any association or firm that provides advisory or consultancy services to the issuer or to companies belonging to the same economic group to which such issuer belongs, in the event that income obtained from such services represent for said association or firm at least twenty percent (20.0%) of its total operating income; |
| ● | an employee or executive officer of a foundation, association, partnership or corporation that receives significant donations from the issuer. The term “significant donations” is quantified as twenty percent (20.0%) or more of the total amount of donations received by the respective institution; |
| ● | an administrator of any entity on whose board of directors a legal representative of the issuer participates; or |
| ● | a board member who receives from the issuer any kind of remuneration other than fees as a member of the board of directors, member of the audit committee or any other committee established by the board of directors. |
Pursuant to Decree 3923 of 2006, the election of independent directors must be in a ballot separate from the ballot to elect the rest of the directors, unless the reaching of the minimum number of independent directors required by law or by the by-laws is assured, or when there is only one list that includes the minimum number of independent directors required by law or by the by-laws.
Both elections are made under a proportional representation voting system named electoral quotient “cociente electoral” (except for the elections unanimously approved by the general shareholders’ meeting). Under that system:
| ● | each holder of common shares is entitled at the annual general shareholders’ meeting to nominate candidates for the election of directors; |
| ● | each nomination of one or more directors by a shareholder constitutes a list for the purposes of the election; |
| ● | each list of nominees must contain a hierarchy as to the order of preference for nominees in that list to be elected; |
| ● | once all lists have been nominated, holders of common shares may cast one vote for each common share held in favor of a particular list of nominees. Votes may not be cast for particular nominees in a list; they may be cast only for the entire list; |
| ● | the total number of votes cast in the election is divided by the number of directors to be elected. The resulting quotient is the quota of votes necessary to elect particular directors. For each time that the number of votes cast for a list of nominees is divisible by the quota of votes, one nominee from that list is elected, in the order of the hierarchy of that list; and |
| ● | when no list has enough remaining votes to satisfy the quota of votes necessary to elect a director, any remaining board seat or seats are filled by electing the highest remaining nominee from the list with the highest number of remaining votes cast until all available seats have been filled. |
There is no maximum age limit requirement for the election or retirement of directors. No minimum number of shares is required for a director’s qualification. Directors may be removed by shareholders entitled to vote prior to the expiration of their term.
164
Extraordinary general shareholders’ meetings may take place when duly called for a specified purpose or purposes, or, without prior notice, when holders representing all outstanding shares entitled to vote on the issues presented are present at the meeting. Extraordinary meetings of shareholders may be called by our president, our board of directors or the certified public accountant, directly or by request of a plural number of shareholders representing no less than 25.0% of the company’s common voting shares, in which case an announcement must be made by the board of directors, the legal representative or the certified public accountant. In addition, meetings may be called by the Superintendency of Finance, directly or by request of shareholders holding at least 15.0% of the common voting shares. Notice of extraordinary meetings should be given at least five days in advance.
Quorum for ordinary and extraordinary general shareholders’ meetings to be convened at first call requires the presence of multiple shareholders who represent at least 50.0% plus one of the outstanding shares entitled to vote at the relevant meeting. If no quorum is present for a general shareholders’ meeting, a subsequent meeting may be called within 10 to 30 business days at which the presence of two or more shareholders entitled to vote at the relevant meeting constitutes quorum, regardless of the number of shares represented.
Notice of ordinary general meetings must be published in one newspaper of wide circulation, at least 15 business days prior to the proposed date of a general shareholders’ meeting. Notice of extraordinary general meetings, listing the matters to be addressed at such meetings, must be published in one newspaper of wide circulation, at least five calendar days prior to the proposed date of an extraordinary general shareholders’ meeting.
Except where Colombian law requires a supermajority, decisions made at a shareholders’ meeting must be approved by a majority of the shares present. Pursuant to Colombian law and/or our by-laws, special-majorities are required in the following cases:
| ● | the vote of at least 70.0% of the shares present and entitled to vote at a shareholders’ meeting is required to approve the issuance of common shares not subject to preemptive rights; |
| ● | the Company must distribute (i) at least 50.0% of the annual’s net profits according to Article 155 of the Colombian Code of Commerce, or (ii) at least 70.0% of the annual’s net profits if the total amount segregated in the legal, statutory and other reserves exceeds the Company’s outstanding capital, according to Article 454 of the Colombian Code of Commerce; however, the vote of at least 78.0% of the shares represented and entitled to vote may approve the distribution of a lower percentage of dividends; |
| ● | the vote of at least 80.0% of the shares present and entitled to vote is required to approve the payment of dividends in shares; however, according to Law 222 of 1995, if a “situation of control” exists, whereby the decision-making power is subject to the will of a person or group of persons, a company may only pay dividends by issuing shares, to the shareholders that so accept; |
| ● | unanimity is required to replace a vacancy on the board of directors without applying the electoral quotient system described above; and |
| ● | the vote of 70.0% of the issued and outstanding common shares and 70.0% of the outstanding and issued preferred shares is required to approve any amendment that may impair the rights of the preferred shares. |
The adoption by a shareholders’ meeting of certain corporate actions such as mergers, spin-offs, and share conversions are also subject to authorization by the Superintendency of Finance.
Preferred Shares
The holders of preferred shares are not entitled to receive notice of, attend or vote at any general shareholders’ meeting of holders of common shares, except as described below.
The holders of preferred shares will be entitled to vote on the basis of one vote per share at any shareholders’ meeting, whenever a shareholder vote is required on the following matters:
| ● | in the event that amendments to our by-laws may impair the conditions or rights assigned to such preferred shares and when the conversion of such shares into common shares is to be approved. In both such cases, the vote of 70.0% of the outstanding and issued common shares and preferred shares is required; and |
| ● | if at the end of any accounting period, our profits are not sufficient to pay the minimum dividend on the preferred shares and the Superintendency of Finance, by its own decision or upon request of holders of at least 10.0% of preferred shares, determines that benefits were concealed or shareholders were misled with regard to benefits thereby decreasing the profits to be distributed, the |
165
| Superintendency of Finance may resolve that holders of preferred shares should participate with deliberation and voting rights at the general shareholders’ meeting, in the terms established by law. |
We must issue a notice of any meeting at which holders of preferred shares are entitled to vote. The notice must be published in a newspaper of wide circulation. Depending on the matters to be subjects of the shareholders meeting, notice to preferred shareholders must be delivered at least 15 business days prior to the ordinary meeting or 5 calendar days before the extraordinary meetings. Each notice must contain the following:
| ● | the date of the meeting; |
| ● | a description of any resolution to be proposed for adoption at the meeting on which the holders of preferred shares are entitled to vote; and |
| ● | instructions for the delivery of proxies. |
Redemption
All shareholders (whether holders of common or preferred shares) have, at their option, a redemption right in the following cases:
| ● | if, as a result of a merger, transformation or spin-off of the Company, (a) the shareholders must assume a higher level of liability (i.e., by transforming a corporation into a partnership), or (b) the economic rights of the shareholders are impaired. In these events, the shareholders that were not present at the meeting in which the decision was taken or voted against it, these may exercise the redemption right. |
Pursuant to Colombian Law (Article 12 of Law 222 of 1995), the economic rights of shareholders are deemed to be impaired if:
| ● | their ownership percentage is reduced as a result of the merger, transformation or spin-off of the Company; |
| ● | the equity value or the par value of the shares is reduced (in the latter case, only to the extent that the reduction of the par value implies a decrease in the Company’s stock capital); and |
| ● | the negotiability of the shares is restricted or diminished. |
| ● | If the Company decides to withdraw the listing of its shares from a stock exchange or its registration before the National Registry of Shares and Issuers. |
The exercise of this right is regulated by Articles 15 and 16 of Law 222 of 1995. According to Article 15, within five days following notice of the exercise of this right by a shareholder, the Company must offer to the other shareholders the shares owned by the exercising shareholder. Within the following 15 days, the other shareholders may acquire the shares on a pro rata basis. If all or a part of the shares are not acquired by the other shareholders, then the Company must reacquire them to the extent there are profits or reserves built up by the Company for those purposes. If neither the shareholders nor the Company acquires all of the shares owned by the exercising shareholder, then pursuant to Article 16 of Law 222 of 1995, such exercising shareholder is entitled to the reimbursement of the capital contributions made to the Company.
In both cases, the redemption price of the shares will be established by the agreement of seller and buyer. In the absence of such agreement, the redemption price will be determined by an expert appraiser. Notwithstanding the above, the by-laws may establish other methods for determining the redemption price to be paid in the foregoing circumstances. Our current by-laws do not contemplate such other methods.
Dividends
Common Shares
Following the approval of the financial statements at a general shareholders’ meeting, shareholders may determine the allocation of distributable profits, if any, of the preceding accounting period by a resolution approved by the majority of the holders of common shares present at the ordinary general shareholders’ meeting, pursuant to the recommendation of the board of directors and management.
Under the Colombian Code of Commerce, a company must, after payment of income taxes and appropriation of legal reserves, and after off-setting losses from prior periods distribute at least 50.0% of net profits to all shareholders, payable in cash, or as determined by the
166
shareholders, within a period of one year following the date on which the shareholders determine the payment of dividends. If the total amount segregated in the legal, statutory and occasional reserves of a company exceeds its outstanding capital, this percentage is increased to 70.0%. The minimum common shares dividend payment requirement of 50.0% or 70.0%, as the case may be, may be waived by a favorable vote of the holders of 78.0% of a company’s common shares present at the meeting, in which case the shareholders may distribute any percentage of the net profits. The dividends may be paid in shares if such proposal is approved by representatives of eighty (80%) of the shares present at the meeting.
Under Colombian law and our by-laws, net profits obtained in each accounting period are to be allocated as follows:
| ● | first, an amount equivalent to 10.0% of net profits is segregated to build a legal reserve, until that reserve is equal to at least 50.0% of our subscribed capital; |
| ● | second, payment of the minimum dividend on the preferred shares; and |
| ● | third, allocation of the balance of the net profits is determined by the holders of a majority of the common shares entitled to vote on the recommendation of the board of directors and the president and may, subject to further reserves required by the by-laws, be distributed as dividends. |
Under Colombian law, the dividends payable to the holders of common shares, for each common share, cannot exceed the dividends per share payable to holders of the preferred shares, for each preferred share. All common shares that are fully paid-in and outstanding at the time a dividend or other distribution is declared are entitled to share equally in that dividend or other distribution. Common shares that are only partially paid-in participate in a dividend or distribution in the same proportion as the shares have been paid in at the time of the dividend or distribution.
The general shareholders’ meeting may allocate a portion of the profits to, among others, welfare, education or civic services.
Preferred Shares
Holders of preferred shares are entitled to receive a minimum dividend after deducting losses affecting the capital, and deducting any amounts set aside for legal reserve, but before creating or accruing for any other reserve and before any declared dividends are paid to holders of common shares, so long as dividends have been approved by the shareholders’ meeting of Grupo Aval. Dividends to holders of common and preferred shares must be approved by the shareholders. If no dividends are declared, no holder of Grupo Aval’s preferred or common shares will be entitled to payment. Pursuant to the offering memorandum of the preferred shares, the minimum dividend will be equal to Ps 1.00 in each calendar semester, so long as this value is higher than the dividend paid to the holders of common shares. If the minimum preferred dividend is not equal or higher than the per share dividend on the common shares, the minimum dividend will be equal to the dividend paid to the holders of common shares, if any. So long as the dividend declared is equal to or in excess of the aforementioned minimum, the same dividend must be paid on both the common and the preferred shares.
Payment of the preferred dividend shall be made at the time and in the manner established in the general shareholders’ meeting and with the priority indicated by Colombian law.
Grupo Aval is under a “situation of control” (whereby the decision-making power is subject to the will of a person or group of persons). As a result, the Company may only pay stock dividends to the shareholders that so accept it. Those shareholders that do not accept to receive a stock dividend, are entitled to receive their dividend in cash.
For additional information regarding dividends, see “—F. Dividends and paying agents—Dividend policy of Grupo Aval”.
General Aspects Involving Dividends
The dividend periods may be different from the periods covered by the balance sheet. In the general shareholders’ meeting, shareholders will determine such dividend periods, the effective date, and the method and the place for payment of dividends.
Dividends declared on the common shares and the preferred shares will be payable to the record holders of those shares, as they are recorded on our share registry, on the appropriate dates as determined in the general shareholders’ meeting. However, in accordance with Decree 4766 of December 14, 2011 (which amended articles 2.23.1.1.4 and 2.23.1.1.5 of Decree 2555 of 2010), issued by the Ministry of Finance:
167
| ● | companies whose shares are registered with the National Registry of Shares and Issuers must establish a period of at least three trading days between the date that they receive approval to distribute profits from the General Shareholders Meeting and the date of payment; and |
| ● | the ex-dividend period (fecha ex-dividendo) is the period during which it is understood that a purchase of shares does not include the right to receive dividends. The ex-dividend date shall be set forth by stock exchanges, and it cannot be less than two trading days. According to Colombian Stock Exchange regulations, a transaction is “ex-dividend” if it takes place between the first day of dividend payment and the four trading days preceding that date. |
Liquidation Rights
We will be dissolved if certain events take place, including the following:
| ● | Pursuant to our by-laws, unless otherwise extended by the shareholders, our term of existence will expire at May 25, 2044; |
| ● | losses cause the decrease of our shareholders’ equity below 50% of the amount of outstanding share capital, unless one or more of the corrective measures described in the Colombian Code of Commerce are adopted by the shareholders within six months; |
| ● | by decision at the general shareholders’ meeting; and |
| ● | in certain other events expressly provided by law and in the by-laws. |
Upon dissolution, a liquidator must be appointed by a general meeting of the shareholders to wind up the affairs of our company.
Upon liquidation, and out of the surplus assets available for distribution to shareholders, holders of fully paid preferred shares are entitled to a preference in the reimbursement of the portion of their contribution (“aporte” as provided by Article 63 of Law 222 of 1995) to Grupo Aval attributable to the nominal value of the outstanding preferred shares (i.e., Ps.1.00 per share). This reimbursement, if any, is payable in pesos before any distribution or payment may be made to holders of common shares. If, upon any liquidation, assets that are available for distribution among the holders of preferred shares are insufficient to pay in full their respective liquidation preferences, such assets will be distributed among those holders pro rata.
Subject to the preferential liquidation rights of holders of preferred shares, and provided there are still sufficient assets remaining, all fully paid common shares will be entitled to participate in any distribution upon liquidation. Partially paid common shares must participate in a distribution upon liquidation in the same proportion that those shares have been paid at the time of the distribution.
To the extent there are surplus assets available for distribution after full payment to the holders of preferred and common shares of their contribution to Grupo Aval, the surplus assets will be distributed among all holders of shares of share capital (common or preferred), pro rata, in accordance with their respective holdings of shares.
Preemptive Rights and Other Anti-Dilution Provisions
Pursuant to the Colombian Code of Commerce, we are allowed to have an outstanding amount of share capital that is less than the authorized share capital set out in our by-laws. Under our by-laws, the holders of common shares determine the amount of authorized share capital, and our board of directors has the power to (1) order the issuance and regulate the terms of subscription of common shares up to the total amount of authorized share capital, and (2) regulate the issuance of preferred shares, when expressly delegated at the general shareholders’ meeting. The issuance of preferred shares must be approved by the general shareholders’ meeting, which shall determine the nature and extent of any rights, according to our by-laws and Colombian law.
At the time of incorporation of a Colombian company, its outstanding share capital must represent at least 50% of the authorized capital. Any increases in the authorized share capital or decreases in the outstanding share capital must be approved by the majority of shareholders required to approve a general amendment to the by-laws.
Colombian law requires that, whenever we issue new common shares, we must offer to the holders of common shares the right to subscribe a number of common shares sufficient to maintain their existing ownership percentage of the aggregate share capital. These rights are preemptive rights. On the other hand, holders of preferred shares are entitled to preemptive rights only in the specific situations that the shareholders’ meeting so decides. See “Item 3. Key Information—D. Risk factors—Risks relating to our businesses and industry—Risks relating to our preferred shares and ADSs.”
168
Common shareholders at a general shareholders’ meeting may waive preemptive rights of common shares with respect to a particular capital increase by the favorable vote of at least 70.0% of the shares represented at the meeting. Preemptive rights must be exercised within the period stated in the share placement terms of the increase, which cannot be less than 15 business days following the publication of the notice of the public offer of that capital increase. From the date of the notice of the share placement terms, preemptive rights may be transferred separately from the corresponding shares.
The Superintendency of Finance will authorize a decrease in the outstanding share capital approved by the holders of common shares only if:
| ● | we have no outstanding liabilities; |
| ● | our creditors consent in writing; or |
| ● | the outstanding share capital remaining after the reduction represents at least twice the amount of our liabilities. |
Restrictions on Purchases and Sales of Share Capital by Related Parties
Pursuant to the Colombian Code of Commerce, the members of our board of directors and certain of our principal executive officers may not, directly or indirectly, buy or sell shares of our share capital while they hold their positions, unless they obtain the prior approval of the board of directors passed with the vote of two-thirds of its members (excluding, in the case of transactions by a director, such director’s vote). Furthermore, pursuant to Article 262 of the Colombian Code of Commerce, Grupo Aval’s subsidiaries are prohibited from owning (directly or indirectly) shares of Grupo Aval.
In addition, as our shares are publicly traded on the Colombian Stock Exchange, the transfer of the shares is subject to the applicable securities regulation and the rules of the Colombian Stock Exchange.
Pursuant to Article 23 of Law 222 of 1995, the members of our board of directors and our legal representatives generally must perform their duties according to the principles of good faith, due diligence and loyalty. In particular, the directors and legal representatives must refrain from entering into any transaction (including any sale and purchase of shares) which may imply competition with the Company or a conflict of interest, unless they obtain the prior approval of the General Shareholders Meeting, which, in any case, shall only be granted if the respective transaction does not harm the Company’s interests. The Company, in the ordinary course of its business, may enter into transactions with its directors.
Under the Company’s by-laws, directors have no power to vote on compensation to themselves or any members of the board of directors. This task is specifically assigned to the shareholders entitled to vote.
Transfer and Registration of Shares
Grupo Aval’s common and preferred shares are listed on the Colombian Stock Exchange. According to Colombian regulations, shares listed on a stock exchange must be sold and transferred only through such exchange, unless such shares were issued outside Colombia and are transferred outside Colombia, or unless the share purchase transaction amounts to a value that is lower than the regulatory threshold of 66,000 UVRs, as required by Article 6.15.1.1.2 of Decree 2555 of 2010. In addition, among others, the following transactions are not required to be undertaken through the relevant stock exchange:
| ● | transfers between shareholders with the same beneficial owner; |
| ● | transfers of shares owned by financial institutions that are being liquidated under the control and supervision of the Superintendency of Finance; |
| ● | issuer repurchases; |
| ● | transfers by the State; and |
| ● | any other transactions as may be authorized by the Superintendency of Finance. |
Under Colombian law, shares may be traded either in physical form or electronic form. Transfers of shares are subject to a registry system which differs depending on whether the shares are evidenced in electronic form or physical form. Transfers of shares evidenced by electronic certificates must first be registered with a securities central depositary through a stockbroker. The main purpose of the securities central
169
depositary is to receive, safe keep and manage securities certificates issued by corporations in order to keep a record of the transactions undertaken over such securities, including transfers, pledges and withdrawals. Accordingly, they are not allowed to hold, invest or otherwise use the securities held under their custody.
Transfer of shares evidenced by electronic or physical certificates, as the case may be, must be registered on the company’s share ledger. Only those holders registered on the share ledger are recognized as shareholders. Registration requires endorsement of the certificates or a written instruction from the holder. In the case of electronic certificates, the securities central depositary notifies us regarding the transfer of shares after registering it in its system.
All of our shares are currently deposited with the securities central depositary (Deceval).
C. Material contracts
On February 4, 2020, we entered into an indenture in connection with our issuance of U.S.$1.0 billion (Ps 3,401.6 billion at the date of the issuance) of 4.375% Senior Notes due 2030. The indenture was among us, as guarantor, Grupo Aval Limited, as Issuer, Deutsche Bank Trust Company Americas, as Trustee, Registrar, Paying Agent and Transfer Agent. Such Indenture was supplemented and amended on February 23, 2022 in connection with the spin-off of BHI.
D. Exchange controls
Restrictions on Foreign Investment in Colombia
Colombia’s foreign investment statute regulates the manner in which non-residents are permitted to invest in Colombia and participate in the Colombian securities market. Among other requirements, Colombian law requires foreign investors to register certain foreign exchange transactions with the Colombian Central Bank and obtain authorization for certain types of investments. Certain foreign exchange transactions, including those between residents and non-residents, must be made through authorized foreign exchange intermediaries.
Non-residents are permitted to hold portfolio investments in Colombia, through a registered stock brokerage firm, a trust company or an investment firm. Investors would only be allowed to transfer dividends abroad after the foreign investment registration procedure with the Colombian Central Bank has been completed. The failure of a non-resident investor to report or register foreign exchange transactions with the Colombian Central Bank relating to investments in Colombia on a timely basis may prevent the investor from remitting dividends, or an investigation, that may result in a fine, may be commenced.
E. Taxation
The following summary contains a description of certain Colombian and U.S. federal income tax considerations in connection with ownership and disposition of ADSs and preferred shares, but it does not purport to be a comprehensive description of all of the Colombian and United States tax considerations. The summary is based upon the tax laws of Colombia and regulations thereunder and on the tax laws of the United States and regulations thereunder as of date hereof, which are subject to change. A change in such laws and regulations could apply retroactively and could affect the validity of this summary.
Colombian Tax Considerations
For Colombian tax purposes, the residence status is triggered depending on the type of individual as follows:
| ● | Aliens: Residence is established by the continuous or discontinuous presence in the country for more than 183 days including entry and exit days, within any period of 365 consecutive calendar days taking into account the day of the arrival and the day of departure of the individual. For this purpose, when the continuous or discontinuous presence in the country takes place in more than one taxable year, the person would be considered as a Colombian resident for the second taxable year. |
| ● | Diplomatic employees of the Colombian State and their companions: These persons are totally or partially exempted from income tax or capital gains tax in the country in which they are performing their work, according to the Vienna Conventions on Diplomatic and Consular Relations. |
| ● | Colombian Nationals: |
Individuals:
170
An individual is considered a tax resident under different circumstances, one of which is the permanence in Colombian territory either continuously or discontinuously (considering days between arrival and departure) for 183 days in any given 365-day period. If the 365-day period covers more than one taxable year, the individual will be deemed as a taxpayer for the second year.
In addition, domestic tax law also deems as tax residents those individuals who hold the Colombian nationality and fulfill at least one of the following requirements in the corresponding taxable year: (i) the individual’s spouse or permanent companion or dependent children are Colombian tax residents in the corresponding tax year; or, (ii) 50% or more of the individual’s income is considered to be generated in Colombia; or, (iii) 50% or more of the individual’s assets are managed within Colombia; or, (iv) 50% or more of the individual’s assets are deemed to be possessed in Colombia; or, (v) if once required by the Tax Authorities, the Colombian national fails to demonstrate that the tax residence is held abroad or, (vi) the tax residence is held in non-cooperative jurisdictions as defined by the Colombian Government.
As an exception to the previous rule, if the referred individual (who holds the Colombian nationality) (i) perceives 50% or more of income in the country of domicile, or (ii) has 50% or more of its assets possessed in the country of domicile, the individual will not be considered a tax resident in Colombia.
Legal entities:
For Colombian tax purposes, a legal entity is considered a tax resident generally when its effective place of management is located in Colombia during the relevant taxable year (the possibility that nonresident entities have an effective place of management in Colombia can exist based on the day-to-day activities). In addition, a Legal Entity incorporated under the laws of Colombia or whose principal place of business is located in Colombia, is also considered a Colombian resident.
Pursuant to the Colombian Tax Code, resident individuals and Colombian entities are subject to tax over their worldwide income, while non-resident individuals and foreign entities are only taxed on their Colombian-source income. Foreign entities with permanent establishments (e.g. branches in Colombia) are subject to taxation over the worldwide income attributable to the permanent establishment.
Colombian Tax Law includes a definition of permanent establishment for foreign entities or individuals applicable when the entity or individual trigger the events described in Article 20-1 of the Colombian Tax Code. In this case, as stated before, the permanent establishment is considered a Colombian taxpayer in regard to its attributable worldwide income.
Taxation of Dividends
As a general rule, dividends distributed out of profits that were not subject to tax at the level of a Colombian entity (e.g., because there was an application of the tax benefit, book to tax difference, Net Operating Losses –NOLs– amortization, etc.), must be subject to the corresponding Income Tax rate applicable in the year in which the dividends are paid or registered as being payable to the shareholder. In this case, the Colombian entity should apply a withholding income tax that could be credited by the shareholder against its income tax liability. The applicable withholding tax rate for taxable period 2022 and 2023 corresponds to the general income tax rate.
Financial institutions, insurance and reinsurance companies, stockbrokers, among others, will be subject to a 5% corporate income tax surtax (for a total corporate income tax rate of 40%) until 2027, to the extent their taxable income exceeds 120,000 UVTs (Ps 5,089.4 billion).
Colombian tax legal frameworks provide a special tax to dividends paid, which was modified effective January 1, 2023. This special tax will be collected by the dividend paying entity. In the case of a distribution to foreign legal entities or non-resident individuals, a withholding tax of 20% relative to the payment or book entry will be applied.
Regarding tax resident individuals, dividends paid since January 1, 2023, must be taxed under the progressive rate under the section 241 of the Colombian Tax Code (capped at a rate of 39%). Under specific situations, the national dividend paying entity has to apply a withholding tax of 15%.
Before applying the previously mentioned tax rate, the following scenarios must be considered:
| ● | Dividends which were taxed at a corporate level: In accordance with current regulations, dividends which have been taxed at a corporate level will be subject to: |
| - | When the investor is a national entity, dividends distributed out of profits taxed at the corporate level will be subject to a 10% withholding tax. Such withholding tax may be offset against the dividend taxed on the shareholder in the case of individuals |
171
| tax residents in Colombia and foreign investors. The exceptions for the application of the dividend withholding tax will still apply. |
| - | When the investor is a foreign entity or non-resident individual, dividends distributed out of profit taxed at the corporate level will be subject to a 20% withholding tax. |
| - | When the investor is a resident individual, dividends distributed out of profit taxed at the corporate level must be taxed under the progressive rate of the section 241 of the Colombian Tax Code.. |
| ● | Dividends which have not been taxed at a corporate level: On the other hand, in cases where the dividends subject to distribution have not been taxed at a corporate level, they should first be taxed at the current general income tax rate in the period of distribution (hereinafter “recapture tax”); and subsequently the rules mentioned above must be applied. |
| ● | Dividends distributed within enterprise group / under situation of control / Colombian Holding Companies Regime (“Compañía Holding Colombiana or CHC”): when the first dividend distribution payment is executed by a national entity to another national entity and both pertain to (i) an enterprise group, (ii) are under situation of control, or (iii) are duly registered under CHC Regime, the dividend withholding tax does not apply. |
| ● | Transition regime for tax on dividends: If the profits were generated prior to December 31, 2016 (“pre-2017") and appropriated to be distributed in the future, dividends are not subject to the provisions of the current regulations in the case of profits that were taxed at the corporate income tax rate. For profits that were not taxed at the corporate income tax rate, the recapture tax will be applicable. |
172
Based on the above, the following table summarizes the tax treatment of dividends in the absence of a tax treaty:
Dividend tax rate | Withholding rate | Recapture tax | |
|---|---|---|---|
Dividend distributions from pre-2017 profits that were taxed at the corporate income tax rate distributed to Colombian tax resident individuals, Colombian entities and Non-Colombian tax residents. | Non-taxed | N.A. | N.A. |
Dividend distributions from pre-2017 profits that were not taxed at the corporate income tax rate distributed to Colombian tax resident individuals | Non-taxed | N.A. | Corporate income tax rate |
Dividend distributions from pre-2017 profits that were not taxed at the corporate income tax rate distributed to Colombian entities | Non-taxed | N.A. | Corporate income tax rate |
Dividend distributions from pre-2017 profits that were not taxed at the corporate income tax rate distributed to Non-Colombian tax residents | Non-taxed | N.A. | Corporate income tax rate |
Dividend distributions from pre-2017 profits that were not taxed at the corporate income tax rate to Non-Colombian tax residents complying with the portfolio investment definitions under the Colombian Tax Code | 25% | N.A. | N.A. |
Withholding tax on dividend distributions from post-2017 profits that were taxed at the corporate income tax rate distributed to Colombian tax resident individuals | N.A. | 2022: 10% for amounts equal or in excess of 300 UVTs | N.A. |
Withholding tax on dividend distributions from post-2017 profits that were taxed at the corporate income tax rate distributed to Colombian entities | N.A. | 2022: 7.5% | N.A. |
Withholding tax on dividend distributions from post-2017 profits that were taxed at the corporate income tax rate distributed to Non-Colombian tax residents (including dividend distributions made to permanent establishments) | N.A. | 2022: 10.0% | N.A. |
Dividend distributions from post-2017 profits that were not taxed at the corporate income tax rate distributed to Colombian tax resident individuals | Applicable income tax rate for the individual | 2022: 10% for amounts equal or in excess of 300 UVTs | Corporate income tax rate |
Dividend distributions from post-2017 profits that were not taxed at the corporate income tax rate distributed to Colombian entities | 2022: 7.5% | N.A. | Corporate income tax rate |
Dividend distributions from post-2017 profits that were not taxed at the corporate income tax rate distributed to Non-Colombian tax residents | 2022: 10.0% | N.A. | Corporate income tax rate |
Dividend distributions from post-2017 profits that were not taxed at the corporate income tax rate to Non-Colombian tax residents complying with the portfolio investment definitions under the Colombian Tax Code | 40.00% | N.A. | N.A. |
A portion of the dividend payment approved by Grupo Aval’s General Meeting of Shareholders held on March 30, 2022, was declared from profits generated by the company before December 31, 2016; the remaining portion was declared from profits generated by the company after 2016. The payment of dividends with charge to profits generated by the company before December 31, 2016 was not subject to dividend tax according to Article 246-1 of the Colombian Tax Code, introduced by Article 9 of Law 1819 of 2016 and amended by article 121 of Law 1943 of 2018. Dividend tax on dividends on profits generated by the company after 2016 depends on the subject receiving it (Colombian tax resident individuals, Colombian entities, Non-Colombian tax residents or Non-Colombian tax residents complying with the portfolio investment definitions under the Colombian Tax Code).
Dividends paid to Non-Colombian tax residents complying with the portfolio investment definitions under the Colombian Tax Code who hold ADSs through the depositary will be subject to income taxes and withholding in Colombia as mentioned in the previous chart.
As a general rule, foreign companies, foreign investment funds, and Non- Colombian tax residents are not required by law to file an income tax return in Colombia. However, they are subject to the withholding tax, which can be understood as the dividend tax for the foreign entity or non-resident individual (in accordance with Section 592 of the Colombian Tax Code).
“UVT” or “Unidad de Valor Tributario” refers to a tax unit established each year by the Colombian Tax Authority (“DIAN”) for the calculation of tax returns. UVT was established at an equivalent to Ps 38,004 for 2022 and Ps 42,412 for 2023.
173
Taxation of Capital Gains Derived from the Sales of ADSs
Pursuant to Article 24 of the Colombian Tax Code, gains derived by non-resident entities or non-resident individuals of Colombia from the sale of the ADSs are not subject to income, withholding, remittance or other taxes in Colombia. If the holder is a resident in Colombia, this capital gain will be taxed in Colombia according to the general tax rules.
Taxation of Capital Gains Derived from the Sales of Shares in Colombia
According to Article 36-1 of the Colombian Tax Code, capital gains from the sale of shares listed on the Colombian Stock Exchange are not subject to income tax in Colombia, provided that the shares sold by the same beneficial owner during each fiscal year do not represent more than 10% (for 2022) and 3% (for 2023 onwards) of the issued and outstanding shares of the listed company. ADSs are not subject to the same tax framework as equity investments in Colombia. Although ADSs represent our preferred shares, they are subject to a different tax regulatory regime.
Tax on Foreign Capital Investment Portfolio Income in Colombia
The 2012 Tax Reform (see “Item 4. Information on the Company-B. Business Overview-Supervision and regulation-Regulation on Payroll Loans”) established a new tax regime for foreign capital portfolio investments. Investors will be required to pay income tax for the profits obtained in the development of their activities, regardless of the vehicle used to carry them out, pursuant to Article 18-1 of the Colombian Tax Code.
The withholding rate of such tax is generally 14%; however, a 5% rate will apply for investments in fixed income securities or in derivatives whose underlying assets is a fixed income security, and a 25% rate will apply to investors domiciled in non-cooperative tax jurisdictions. Article 260-7 of Colombian Tax Code was modified by Law 1819 of 2016 which establishes a new legal framework and provides criteria pursuant to which certain jurisdictions may be classified as non-cooperative jurisdictions with low or no taxation or as jurisdictions with preferential tax regimes.
Payment of this tax will be accomplished through withholding that is performed on a monthly basis by the administrator of such investment portfolio, based on the profits earned by the investor during the corresponding month. When the income corresponds to dividends, the withholding will be made by the company paying the dividend at the time of payment. As a general rule, the withholding, performed according to the rules established in the Colombian Tax Code, shall constitute a final tax and investors will not be required to file an income tax return.
Other Colombian Taxes
| ● | Financial institutions, insurance and reinsurance companies, stockbrokers, among others, will be subject to a 5% income tax surcharge (total corporate income tax rate of 40%) until 2027, to the extent their taxable income exceeds 120,000 UVTs (Ps 5,089.4 billion). |
| ● | 15% minimum tax rate (adjusted tax rate): Law 2277 of 2022 established a 15% minimum tax rate (referred to as adjusted tax rate - ATR). The ATR will be determined based on the ratio between the adjusted income tax (AIT) divided by the adjusted income (AI). Law establishes the factors to be considered when calculating the AIT and AI. If the ATR is lower than 15%, income tax has to be adjusted to achieve the 15% rate. This rule does not apply, among others, to non-residents, hotels and concessions. |
| ● | Significant economic presence: Non-residents with a “significant economic presence” (SEP) in Colombia will be subject to a general 10% withholding tax (unless another withholding tax rate applies). Nevertheless, the non-resident entity may opt to assess its income tax liability at a 3% rate over the gross income of Colombian source, subject to the filing of an income tax return. |
Law 2277 of 2022 allows a Double Tax Treaty to prevail over Colombian domestic law. In the case that Colombia signs an international agreement forbidding this form of taxation, the rules mentioned above would be inapplicable for fiscal periods following the effective date of the international agreement.
A significant economic presence is triggered if the following criteria are met:
| - | The non-resident entity has a deliberate and systematic interaction with the Colombian market. This type of interaction is presumed to exist when the non-resident has interaction or marketing activities with more than 300,000 users in Colombia during the prior year, or within the relevant tax year, or displays the price of goods in Colombian Pesos or allows payment in Colombian Pesos. |
174
| - | Gross income for the non-resident entity from transactions with customers in Colombia is higher than 31,300 UVTs (Ps 1,327.5 billion) during the prior year or the current taxable year. |
If the activities in Colombia are developed by different related parties, the aforementioned criteria will consider the aggregate transactions of all related entities.
This rule will be effective January 1, 2024.
| ● | Tax deductions, benefits and incentives: Certain non-taxable income, special deductions, exempt income, and tax credits will be limited to 3% of net taxable income prior to the special deductions subject to the limitation. The limitation will apply only to the tax benefits expressly provided by the rule. Although some special treatments were repealed, it is generally provided that acquired rights should be respected until the term originally provided by the repealed Law. |
| ● | Effective place of management (“Sede Efectiva de Administración”): The considerations that qualify a non-resident entity to have an effective place of management in Colombia were broadened. Amongst the new considerations, an effective place of management may exist based on the day-to-day activities as opposed to previously considered strategic activities. A non-resident that has an effective place of management is considered by tax authorities as a Colombian tax resident. |
As of the close of business covered by the annual report, there is no income tax treaty and no inheritance or gift tax treaty in effect between Colombia and the United States. Pursuant to Articles 24 and 36-1 of the Colombian Tax Code, transfers of ADSs from non-residents or residents to non-residents of Colombia by gift or inheritance are not subject to Colombian income tax. Transfers of ADSs by gift or inheritance from residents to residents or from non-residents to residents will be subject to Colombian income tax at the income tax rate applicable for capital gains obtained by residents of Colombia. There is no Colombian stamp, issue, registration, transfer or similar taxes or duties payable by holders of shares or ADSs.
United States Federal Income Taxation Considerations for U.S. Holders
The following is a description of the material U.S. federal income tax consequences to the U.S. Holders described below of owning and disposing of our ADSs or preferred shares, but it does not purport to be a comprehensive description of all tax considerations that may be relevant to a particular person’s decision to hold the securities. This discussion applies only to a U.S. Holder that holds our ADSs or preferred shares as capital assets for U.S. federal income tax purposes. In addition, it does not describe all of the tax consequences that may be relevant in light of the U.S. Holder’s particular circumstances, including alternative minimum tax consequences, the potential application of certain provisions of the Internal Revenue Code of 1986, as amended (the “Code”) known as the Medicare contribution tax, and tax consequences applicable to U.S. Holders subject to special rules, such as:
| ● | certain financial institutions; |
| ● | dealers in securities or currencies or traders in securities that use a mark-to-market method of tax accounting; |
| ● | persons holding ADSs or preferred shares as part of a hedging transaction, straddle, wash sale, conversion transaction or integrated transaction or persons entering into a constructive sale with respect to the ADSs or preferred shares; |
| ● | persons whose functional currency for U.S. federal income tax purposes is not the U.S. dollar; |
| ● | entities classified as partnerships for U.S. federal income tax purposes; |
| ● | tax-exempt entities, “individual retirement accounts” or “Roth IRAs”; |
| ● | persons that own or are deemed to own ten percent or more of the voting power or value of our stock; |
| ● | persons who acquired our ADSs or preferred shares pursuant to the exercise of an employee stock option or otherwise as compensation; or |
| ● | persons holding our ADSs or preferred shares in connection with a trade or business conducted outside of the United States. |
If an entity that is classified as a partnership for U.S. federal income tax purposes holds our ADSs or preferred shares, the U.S. federal income tax treatment of a partner will generally depend on the status of the partner and the activities of the partnership. Partnerships holding
175
our ADSs or preferred shares and partners in such partnerships should consult their tax advisers as to the particular U.S. federal income tax consequences of holding and disposing of the ADSs or preferred shares.
This discussion is based on the Code, administrative pronouncements, judicial decisions, and final, temporary and proposed Treasury regulations, all as of the date hereof, any of which is subject to change, possibly with retroactive effect. It is also based in part on representations by the depositary and assumes that each obligation under the deposit agreement and any related agreement will be performed in accordance with its terms.
A “U.S. Holder” is a beneficial owner of our ADSs or preferred shares that is for U.S. federal income tax purposes:
| ● | a citizen or individual resident of the United States; |
| ● | a corporation, or other entity taxable as a corporation, created or organized in or under the laws of the United States, any state therein or the District of Columbia; or |
| ● | an estate or trust the income of which is subject to U.S. federal income taxation regardless of its source. |
In general, a U.S. Holder who owns ADSs will be treated as the owner of the underlying preferred shares represented by those ADSs for U.S. federal income tax purposes. Accordingly, no gain or loss will be recognized if a U.S. Holder exchanges ADSs for the underlying shares represented by those ADSs.
U.S. Holders should consult their tax advisers concerning the U.S. federal, state, local and non-U.S. tax consequences of owning and disposing of our ADSs or preferred shares in their particular circumstances.
Except as described in “─Passive Foreign Investment Company Rules” below, this discussion assumes that we have not been, and will not become, a passive foreign investment company, or “PFIC”, for any taxable year.
Taxation of Distributions
The preferred shares constitute equity of our company for U.S. federal income tax purposes. Distributions paid on our ADSs or preferred shares will be treated as dividends to the extent paid out of our current or accumulated earnings and profits (as determined under U.S. federal income tax principles). Because we do not maintain calculations of our earnings and profits under U.S. federal income tax principles, it is expected that distributions generally will be reported to U.S. Holders as dividends. Subject to applicable limitations (including a minimum holding period requirement), dividends paid to certain non-corporate U.S. Holders that constitute “qualified dividend income” will be taxable at rates applicable to long-term capital gains. Dividends paid on our ADSs will generally constitute qualified dividend income, provided the ADSs are readily tradable on an established securities market in the United States (such as the NYSE, where our ADSs are traded). It is unclear whether these reduced rates will apply to dividends paid with respect to our preferred shares that are not backed by ADSs. U.S. Holders should consult their tax advisers regarding the availability of the reduced tax rate on dividends in their particular circumstances.
The amount of a dividend generally will include any amounts withheld by our company in respect of Colombian taxes. The amount of the dividend will generally be treated as foreign-source dividend income to U.S. Holders and will not be eligible for the dividends-received deduction generally available to U.S. corporations under the Code. Dividends will be included in a U.S. Holder’s income on the date of the depositary’s receipt of the dividend, in the case of ADSs, or on the date actually or constructively received by the U.S. Holder, in the case of the preferred shares. The amount of any dividend income paid in Colombian pesos will be the U.S. dollar amount calculated by reference to the exchange rate in effect on the applicable date of receipt, regardless of whether the payment is in fact converted into U.S. dollars. If the dividend is converted into U.S. dollars on the applicable date of receipt, a U.S. Holder should not be required to recognize foreign currency gain or loss in respect of the dividend income. A U.S. Holder may have foreign currency gain or loss if the dividend is converted into U.S. dollars after the date of receipt.
The rules governing foreign tax credits are complex. For example, Treasury regulations impose additional requirements for foreign taxes to be eligible for credit. We have not determined whether these requirements have been met with respect to any withholding tax imposed on dividends on ADSs or preferred shares and, therefore, U.S. Holders should consult their tax advisers regarding the availability of foreign tax credits for any amounts withheld with respect to distributions on ADSs or preferred shares. In lieu of claiming a foreign tax credit, U.S. Holders may, at their election, deduct foreign taxes, including the Colombian tax, in computing their taxable income, subject to generally applicable limitations under U.S. law. An election to deduct foreign taxes instead of claiming foreign tax credits applies to all foreign taxes paid or accrued in the taxable year.
176
Sale, Redemption or Other Taxable Disposition of ADSs or Preferred Shares
Subject to the PFIC rules described below, for U.S. federal income tax purposes, gain or loss realized on the sale, redemption or other taxable disposition of our ADSs or preferred shares will be capital gain or loss, and will be long-term capital gain or loss if the U.S. Holder held the ADSs or preferred shares for more than one year, provided that in the case of redemption, (i) the U.S. Holder does not actually or constructively own any of our voting stock after giving effect to such redemption or (ii) the redemption is not otherwise treated as essentially equivalent to a dividend under the Code. The amount of the gain or loss will equal the difference between the U.S. Holder’s tax basis in the ADSs or preferred shares disposed of and the amount realized on the disposition, in each case as determined in U.S. dollars. This gain or loss will generally be U.S.-source gain or loss for foreign tax credit purposes.
Passive Foreign Investment Company Rules
Based on proposed Treasury regulations, including those which are proposed to be effective for taxable years beginning after December 31, 1994, we believe we were not a PFIC for U.S. federal income tax purposes for the 2022 taxable year. However, because the proposed Treasury regulations may not be finalized in their current form, because the application of the proposed regulations is not entirely clear and because the composition of our income and assets will vary over time, there can be no assurance that we were not or will not be a PFIC for any taxable year. The determination of whether we are a PFIC is made annually and is based upon the composition of our income and assets (including the income and assets of, among others, entities in which we hold at least a 25% interest) and the nature of our activities. In general, we will be a PFIC for any taxable year in which at least 75% of our gross income is passive income, or at least 50% of the value (determined on a quarterly basis) of our assets is attributable to assets that produce or are held for the production of passive income.
If we were a PFIC for any taxable year during which a U.S. Holder held our ADSs or preferred shares, any gain recognized by a U.S. Holder on a sale or other disposition of ADSs or preferred shares (including certain pledges) would be allocated ratably over the U.S. Holder’s holding period for the ADSs or preferred shares. The amounts allocated to the taxable year of the sale or other disposition and to any year before we became a PFIC would be taxed as ordinary income. The amount allocated to each other taxable year within the holding period would be subject to tax at the highest rate in effect for individuals or corporations, as appropriate, for that taxable year, and an interest charge would be imposed on the tax on such amount. Further, any distribution in respect of ADSs or preferred shares in excess of 125% of the average of the annual distributions on ADSs or preferred shares received by the U.S. Holder during the preceding three years or the U.S. Holder’s holding period, whichever is shorter, would be subject to taxation in the same manner as described immediately above with respect to gains. Certain elections may be available that would result in alternative treatments (such as mark-to-market treatment) of the ADSs or preferred shares. U.S. Holders should consult their tax advisers to determine whether any of these elections would be available and, if so, what the consequences of the alternative treatments would be in their particular circumstances.
If we were a PFIC or, with respect to a particular U.S. Holder, were treated as a PFIC for the taxable year in which we paid a dividend or for the prior taxable year, the favorable dividend rates discussed above with respect to qualified dividend income paid to non-corporate holders would not apply. In addition, if we are a PFIC for any taxable year during which a U.S. Holder owned our ADSs or preferred shares, the U.S. Holder will generally be required to file IRS Form 8621 (or any successor form) with their annual U.S. federal income tax returns, subject to certain exceptions.
Information Reporting and Backup Withholding
Payments of dividends and sales proceeds that are made within the United States or through certain U.S.- related financial intermediaries generally are subject to information reporting, and may be subject to backup withholding, unless (i) the U.S. Holder is an exempt recipient or (ii) in the case of backup withholding, the U.S. Holder provides a correct taxpayer identification number and certifies that it is not subject to backup withholding. The amount of any backup withholding from a payment to a U.S. Holder will be allowed as a credit against the U.S. Holder’s U.S. federal income tax liability and may entitle it to a refund, provided that the required information is timely furnished to the Internal Revenue Service.
Certain U.S. Holders who are individuals (and certain specified entities) may be required to report information relating to their ownership of shares of a non-U.S. entity or non-U.S. accounts through which such shares are held. U.S. Holders are urged to consult their tax advisers regarding any reporting obligation with respect to our ADSs or preferred shares.
F. Dividends and paying agents
Dividend policy of Grupo Aval
The amount of dividends, if any, that we pay will be dependent, in large part, on the amount of dividends received from our subsidiaries. Our subsidiaries declared Ps 1,029.1 billion and Ps 1,546.5 billion of dividends payable to us for the years ended December 31, 2022 and
177
2021, respectively. We declared an aggregate of Ps 999.8 billion and Ps 1,203.2 billion of dividends to our shareholders with respect to net income for the years ended December 31, 2022 and 2021, respectively.
Unless noted otherwise, the following table presents the net profits of, and dividends (cash and stock) declared by us and each of our direct subsidiaries, and the amount of dividends that we would be entitled to receive from each of them during the periods indicated.
| Dividends declared with respect to net income for the year ended December 31, | |||||||||||||||||||||||||||
| 2022 |
| 2021 |
| 2022 |
| 2021 |
| 2022 |
| 2021 |
| 2022 |
| 2021 |
| 2022 |
| 2021 |
| 2022 |
| 2021 |
| 2022 |
| 2021 | |
Banco de | Banco de | Banco | Banco | |||||||||||||||||||||||||
Bogotá | Occidente | Popular | AV Villas | Corficolombiana | Porvenir | Total | ||||||||||||||||||||||
(in Ps billions, except percentages) | ||||||||||||||||||||||||||||
Direct ownership interest held by Grupo Aval | 68.9% | 68.7% | 72.3% | 72.3% | 93.7% | 93.7% | 79.9% | 79.9% | 8.7% | 8.5% | 20.0% | 20.0% | — |
| — | |||||||||||||
Separate net profits | 2,251.7 |
| 4,385.6 |
| 502.6 |
| 492.1 |
| 73.0 |
| 333.6 |
| 112.0 |
| 161.6 |
| 1,774.0 |
| 1,715.7 |
| 153.9 |
| 579.6 |
| 4,867.4 |
| 7,668.1 | |
Dividends declared | 1,112.6 |
| 1,105.2 |
| 251.3 |
| 150.0 |
| — |
| 146.5 |
| — |
| 87.6 |
| 500.2 |
| 771.8 |
| 200.5 |
| 300.1 |
| 2,064.7 |
| 2,561.2 | |
Dividends contributed to Grupo Aval | 764.8 |
| 1,105.2 |
| 181.6 |
| 108.4 |
| — |
| 137.3 |
| — |
| 70.0 |
| 42.5 |
| 65.6 |
| 40.1 |
| 60.0 |
| 1,029.1 |
| 1,546.5 | |
Dividends declared by Grupo Aval | — |
| — |
| — |
| — |
| — |
| — |
| — |
| — |
| — |
| — |
| — |
| — |
| 999.8 |
| 1,203.2 | |
The allocation of our distributable profits, if any, is determined by our common shareholders following approval of our annual financial statements. Our general shareholders’ meetings generally occur in March, three months after the close of the annual period.
In the past we have paid and received dividends on a monthly basis. We have not, however, adopted a specific dividend policy with respect to future dividends. The amount of any distributions will depend on many factors, such as the results of operations and financial condition of our company and our subsidiaries, their cash requirements, their prospects and other factors deemed relevant by our board of directors and shareholders.
Our company pays dividends based on our net income as reported in our separate audited financial statements prepared under Colombian IFRS. For the year ended December 31, 2022 separate net income as reported in our Colombian IFRS financial statements was Ps 2,541.2 billion, 2.3% higher than net income attributable to the owners of the parent as reported in our audited consolidated financial statements. For the year ended December 31, 2021 separate net income as reported in our Colombian IFRS financial statements was Ps 3,502.8 billion, 6.2% higher than net income attributable to the owners of the parent as reported in our audited consolidated financial statements.
We expect that differences between Colombian IFRS and IFRS financial statements will continue to occur in future periods. The amount of dividends expected from our subsidiaries will also depend on the future share ownership in our subsidiaries.
Dividend history of Grupo Aval
The following table presents the annual cash dividends paid by Grupo Aval on each share during the periods indicated.
| Cash dividends |
| Stock dividends |
| Total dividends |
| Total dividends | |
Dividends declared with respect to net income | per share | per share(1) | per share | per share | ||||
| (Ps) |
| (Ps) |
| (Ps) |
| (U.S.$) | |
Year ended: | ||||||||
2020 |
| 54.00 |
| — |
| 54.00 |
| 0.011 |
2021 |
| — |
| 54.00 |
| 54.00 |
| 0.011 |
2022 |
| 43.20 |
| — |
| 43.20 |
| 0.009 |
| (1) | In accordance with regulation, payment in stock dividends must be explicitly consented by shareholders. If the shareholder does not explicitly express the desire to receive stock dividends, the payment will be done in cash the same day in which the payment of stock dividends is made. |
Given that Grupo Aval’s dividends have been to some extent dependent on the dividends received from its direct stakes in each of its subsidiaries, we detail below the cash and stock dividends per share paid by each of Grupo Aval’s direct subsidiaries for the periods indicated.
Banco de Bogotá
| Cash dividends |
| Stock dividends |
| Total dividends |
| Total dividends | |
Dividends declared with respect to net income | per share | per share(1) | per share | per share | ||||
| (Ps) |
| (Ps) |
| (Ps) |
| (U.S.$) | |
Year ended: |
|
|
|
| ||||
2020 |
| 3,336.00 |
| — |
| 3,336.00 |
| 0.694 |
2021 |
| — |
| 3,336.00 |
| 3,336.00 |
| 0.694 |
2022 |
| 3,132.00 |
| — |
| 3,132.00 |
| 0.651 |
178
| (1) | In accordance with regulation, payment in stock dividends must be explicitly consented by shareholders. If the shareholder does not explicitly express the desire to receive stock dividends, the payment will be done in cash the same day in which the payment of stock dividends is made. |
Banco de Occidente
| Cash dividends |
| Cash dividends | |
Dividends declared with respect to net income | per share | per share | ||
| (Ps) |
| (U.S.$) | |
Year ended: | ||||
2020 |
| 1,233.96 |
| 0.257 |
2021 |
| 962.16 |
| 0.200 |
2022 |
| 1,612.08 |
| 0.335 |
Banco Popular
| Cash dividends |
| Cash dividends | |
Dividends declared with respect to net income | per share | per share | ||
| (Ps) |
| (U.S.$) | |
Year ended: | ||||
2020 |
| 13.68 |
| 0.003 |
2021 |
| 18.96 |
| 0.004 |
2022 |
| — |
| — |
Banco AV Villas
| Cash dividends |
| Cash dividends | |
Dividends declared with respect to net income | per share | per share | ||
| (Ps) |
| (U.S.$) | |
Year ended: | ||||
2020 |
| 285.36 |
| 0.059 |
2021 |
| 390.00 |
| 0.081 |
2022 |
| — |
| — |
Porvenir
| Cash dividends |
| Cash dividends | |
Dividends declared with respect to net income | per share | per share | ||
| (Ps) |
| (U.S.$) | |
Year ended: |
| |||
2020 |
| 4,752.00 |
| 0.988 |
2021 |
| 2,748.00 |
| 0.571 |
2022 |
| 1,836.00 |
| 0.382 |
Banco de Bogotá, Fiduciaria Bogotá, Banco de Occidente and Fiduciaria de Occidente received dividend payments from Porvenir in their respective ownership of the company (see Item 4—B. Business overview—Our operations).
Corficolombiana
| Cash dividends |
| Stock dividends |
| Total dividends |
| Total dividends | |
Dividends declared with respect to net income | per share | per share(1) | per share | per share | ||||
| (Ps) |
| (Ps) |
| (Ps) |
| (U.S.$) | |
Year ended: | ||||||||
2020 |
| — |
| 2,042.00 |
| 2,042.00 |
| 0.425 |
2021 |
| — |
| 2,260.00 |
| 2,260.00 |
| 0.470 |
2022 |
| 1,368.00 |
| — |
| 1,368.00 |
| 0.284 |
| (1) | In accordance with regulation, payment in stock dividends must be explicitly consented by shareholders. If the shareholder does not explicitly express the desire to receive stock dividends, the payment will be done in cash the same day in which the payment of stock dividends is made. |
Banco de Bogotá, Banco de Occidente and Banco Popular received dividend payments from Corficolombiana in their respective ownership of the company (see Item 4—B. Business overview—Our operations).
179
General aspects involving dividends
The dividend periods may be different from the periods covered by the statement of financial position. At the general shareholders’ meeting, shareholders will determine such dividend periods, the effective date, the system and the place for payment of dividends.
Dividends declared on the shares of common and preferred shares will be payable to the record holders of those shares, as they are recorded on our stock registry, on the appropriate record dates as determined at the general shareholders’ meeting. However, pursuant to External Circular 13 of 1998 issued by the former Superintendency of Securities (currently, the Superintendency of Finance), if a shareholder sells shares during the ten business days immediately preceding the payment date, dividends corresponding to those shares will be paid by us to the seller.
The vote of at least 80.0% of the shares present and entitled to vote is required to approve the payment of dividends in shares; however, according to Law 222 of 1995, if a “situation of control” exists, whereby the decision-making power is subject to the will of another person or group of persons, a company may only pay dividends by issuing shares, to the shareholders that so accept.
G. Statement by experts
Not applicable.
H. Documents on display
We are subject to the informational requirements of the Exchange Act. Accordingly, we are required to file reports and other information with the SEC, including annual reports on Form 20-F and reports on Form 6-K. The SEC maintains an internet website that contains reports and other information about issuers, like us, that file electronically with the SEC. The address of that website, where you can inspect those reports and other information filed with the SEC, is www.sec.gov.
I. Subsidiary information
Not applicable.
ITEM 11. QUANTITATIVE AND QUALITATIVE DISCLOSURES ABOUT MARKET RISK
Risk Management
Grupo Aval and its subsidiaries in the financial sector including, among others, Banco de Bogotá, Banco de Occidente, Banco AV Villas, Banco Popular, Corficolombiana and Porvenir, manage risk pursuant to the applicable regulations in each country where they operate and those according to Grupo Aval’s internal policies.
The board of directors take the lead on establishing a sound risk management culture, that supports and provides appropriate standards for responsible behavior. The Risk Framework dully approved by the board of directors requires risk management practices to be integrated into key processes across Grupo Aval, ensuring risks are appropriately identified, assessed, monitored, and mitigated in a timely manner, depending on a range of factors, including the nature, size, complexity, and risk profile.
Senior Risk management team should ensure the identification and assessment of the inherent risks of material activities, processes and systems pertaining to the holding nature of Aval to make sure those inherent risks are properly controlled and mitigated in alignment with the approved risk appetite.
The following sections outline the key risks that are inherent to the business activities of our subsidiaries, as well as the way in which those are managed:
| 1. | Financial risks: Financial risks managed by Grupo Aval’s financial subsidiaries include liquidity risk, market risk, credit risk, interest rate risk and operational risk. For further details, see note 4 of our audited consolidated financial statements. |
| 2. | Non-Financial risks: Main non-financial risks managed by Grupo Aval include anti-money laundering and terrorist financing, anti-bribery and anticorruption and compliance with local regulation, the U.S. Sarbanes-Oxley Act of 2002, among others. |
| 3. | Conglomerate risks: Law 1870 of 2017 (Financial Conglomerates Law) requires financial conglomerates to manage the risks to which they are exposed. For this purpose, the Superintendency of Finance, through External Circular 013 of June 20, 2019, |
180
| established the risks that financial conglomerates must manage from June 2021 onwards. These risks are Concentration risk, Contagion risk, and Strategic risk. |
Control Environment and Risk Culture
Our risk management system (“Sistema de Gestión de Riesgos” (SGR)) seeks to comply not only with local regulation but also to align with best practices and international standards as many jurisdictions move to adopt Basel principles. Accordingly, the model adopts commonly accepted risk taxonomy and provides oversight and guidance to our subsidiaries who operate under a similarly guided regulatory defined relevant risks, related to the business model and characterization of each subsidiary.
At the holding level, our risk control environment, governed independently, based on 14 principles (see footnote), focusses on concentration, contagion and strategic risk as ruled by applicable local holding regulation, which is being introduced and developed particularly since 2017 under Law 1870 Sept 2017. Based on a general risk appetite framework established and approved by the board of directors and the limits and thresholds thereby approved, we ensure effective risk identification and assessment; monitoring and reporting; and control and mitigation. Furthermore, risk management implements processes and procedures to regularly report at the board, senior management, and business line levels. These allows us to assure a strong risk management based fundamentally on:
| ● | active board and senior management oversight; |
| ● | adequate policies, procedures, processes and limits; |
| ● | adequate risk measurement, assessment, monitoring, and management information systems; |
| ● | comprehensive internal controls; and |
| ● | an independent assessment by internal audit. |
Grupo Aval promotes a culture of risk management that reaches all the entities, whether they are financial or non-financial, under a strict, permanent and cohesive “tone from the top”.
The risk culture is conveyed to all our entities and units, relying on the following elements:
| ● | we have independent risk management, monitored at the individual entities level and at consolidated level; |
| ● | we use detailed manuals on policies and processes to manage the risks we are subject to; |
| ● | we use different technological tools, for the analysis, monitoring and control of risks; |
| ● | we have a risk limit system that is updated on a regular basis to address new market conditions and risks to which we are exposed; |
| ● | we use information systems to monitor risk exposure on a recurring basis, seeking to ensure that approval limits are systematically met and, if necessary, allowing for appropriate corrective actions; |
| ● | our main risks are analyzed on a continuous basis; and |
| ● | we provide ongoing training on risk, at every level within the organization. |
Risk Governance in Grupo Aval
As part of Grupo Aval’s risk management and control architecture, the following corporate structure has been established:
Grupo Aval Board of Directors
The board of directors is responsible for establishing the risk appetite and for the approval of the general scope of the risk management function. It also sets and oversees risk management corporate policies applicable at the Grupo Aval level.
181
Boards of Directors of the Financial Subsidiaries
The responsibilities of the boards of directors of Grupo Aval’s financial subsidiaries regarding risk management include:
| ● | to define and approve the general policies and strategies related to internal control systems for risk management; |
| ● | to approve risk management policies; |
| ● | to approve trading and counterparty limits; |
| ● | to approve risk appetite and exposure limits; |
| ● | to approve procedures and methodologies for risk management; |
| ● | to ensure the adequate assignment of resources required for an effective risk management; |
| ● | to set forth responsibilities and attributes for risk management roles; |
| ● | to set forth and define committees’ functions leading to a proper organization, control and monitoring of risk generating operations; |
| ● | to require Grupo Aval financial subsidiaries’ management to submit periodic reports on risk exposure levels; and |
| ● | to periodically review any risk-management reports on control or mitigation of risks, submitted by the Audit Committee. |
Audit Committee of Grupo Aval and Audit Committees of our Financial Subsidiaries:
The Audit Committees’ principal objective is to evaluate and monitor the Internal Control System.
The Audit Committee is responsible for:
| ● | assessing the structure of the internal control function, to establish: (i) whether the procedures are appropriate to protect our assets, and those of third parties under our administration and custody, and (ii) whether transactions are being properly authorized and registered. For such purpose, the areas in charge of the administration of the risk systems, the External and Internal Auditors present any established periodical or occasional reports to the Committee; |
| ● | monitoring risk exposure levels and their potential consequences; and |
| ● | overseeing the risk management policy applicable to Grupo Aval. |
Corporate Risk Unit
The corporate risk unit is led by Grupo Aval’s Chief Risk Officer, which functions include:
| ● | to identify and transfer best practices regarding corporate risk management; |
| ● | to support the board of directors and the financial subsidiaries in structuring their risk appetites; |
| ● | to establish and ensure compliance with policies and guidelines aimed at maintaining an adequate risk exposure; |
| ● | to consolidate and monitor Grupo Aval’s risk exposures; |
| ● | to lead and align risk management processes across Grupo Aval subsidiaries, through corporate guidelines and processes; and |
| ● | to report the outcomes of risk management to Grupo Aval’s Presidency and Audit Committee. |
182
Risk Management Committees of the financial subsidiaries
Grupo Aval’s financial subsidiaries have risk management committees which periodically identify, measure, control and analyze the credit risk management system (SARC for its initials in Spanish), market risk management systems (SARM), operating risk management system (SARO) and business continuity plan management (PCN). Additionally, our financial subsidiaries have an asset-liability committee (ALCO), which makes decisions regarding asset and liability management and evaluates the effectiveness of the liquidity risk management system (SARL). The ALCO establishes adequate procedures and mechanisms for liquidity management and identifies sources of risk through sensitivity analysis, assessing probabilities of lower returns or additional liquidity needs. Legal risk is monitored by general counsel in each subsidiary of the financial sector.
The main functions of the Risk Management Committees include:
| ● | reviewing and proposing risk appetite and exposure limits to the board of directors; |
| ● | designing systems to measure risk appetite and exposure limits; |
| ● | assessing inherent risks involved in entering new markets, products, segments and countries, among others; and |
| ● | ensuring that risk management and measurement methodologies are appropriate and aligned with the characteristics and activities of the entity. |
Risk Management Unit and its equivalent in our financial subsidiaries
The Risk Management Unit and their equivalents, have the following functions:
| ● | to oversee the adequate compliance with the policies and procedures established by the board of directors and the risk management committees; |
| ● | to design methodologies and procedures for risk management; |
| ● | to ensure the timely identification of deviations relating to compliance with the policies established for risk management; and |
| ● | to prepare timely reports for the board of directors, the risk committees, and the Government entities in charge of the control and supervision of the financial subsidiaries’ risk policies compliance. |
Internal Audit and Internal Control Unit
The internal audit units at each financial subsidiary have independent criteria and carry out periodic independent compliance assessments of risk management policies and procedures, regarding risk management and control environment. Reports are submitted directly to the audit committees responsible for monitoring risks and proposing corrective measures, if necessary.
In addition to the internal audit units at the financial subsidiaries, there is a Corporate Internal Control unit that ensures the compliance of our subsidiaries with corporate policies. The Chief of Internal Control participates in the audit committees of significant subsidiaries. The corporate internal control unit performs periodic independent audits of Grupo Aval’s subsidiaries to monitor their compliance with corporate risk management policies. Its reports are presented directly to senior management at each of the subsidiaries and to the corresponding audit committees, including the corporate matters committee of Grupo Aval.
Non-financial Subsidiaries
Corficolombiana consolidates most of our interests in non-financial subsidiaries. As such, its Government, Risk and Compliance (GRC) Vice Presidency provides oversight through these subsidiaries’ risk management and internal controls. This monitoring activity covers subsidiaries in the infrastructure and the energy and gas sectors, where most its investment portfolio is concentrated, and is currently being expanded to the remaining sectors. Corficolombiana ensures that its non-financial sector subsidiaries follow guidelines in relation to risk management set forth by Corficolombiana and Grupo Aval’s policies and best practices established by law.
For all other non-financial subsidiaries of Grupo Aval, the board of directors of each consolidating financial entity has the faculty to establish guidelines in terms of risk policies and risk monitoring processes, which must be implemented at each of such subsidiaries.
183
Risk Framework by the Superintendency of Finance (SFC)
On February 6, 2019, the Colombian national government, through Law 1870 of 2017, defined regulatory framework applicable to financial conglomerates in Colombia and the scope of supervision of the Superintendency of Finance, aimed to ensure the stability of the financial system and taking the Supervision to international standards. This law created the category of financial holding and financial conglomerates. Whilst developing this law, the Superintendency of Finance identified Aval as a financial conglomerate and determined the entities belonging to the Aval Financial Conglomerate.
For more information, see “Item 4. Information on the Company — B. Business overview—Supervision and regulation—Regulatory framework for Colombian Financial Conglomerates”.
Risk Management Systems
Financial Risk
Credit Risk Management
The credit risk management processes of our banks take into consideration the requirements of the Superintendency of Finance, local regulators, Grupo Aval’s credit-risk management guidelines and the composition of each of our bank’s loan portfolio. See Note 4 to our audited consolidated financial statements.
The guiding principles of risk management at Grupo Aval and our banks are the following:
| ● | collective decision making for commercial loans of significant amount at the board level of each of our banks; |
| ● | extensive and in-depth market knowledge, result of our market leadership and our experienced, stable and seasoned senior management; |
| ● | clear top-down guidelines in accordance with: (i) know-your-customer policies; and (ii) commercial loan credit structures based on the clear identification of sources of repayment and the cash-flow generating capacity of the borrower; |
| ● | use of common credit analysis tools and risk based loan pricing tools across all our banks; |
| ● | diversification of the commercial loan portfolio with respect to industries and economic groups; |
| ● | specialization in retail banking product niches; and |
| ● | extensive use of continuously updated rating and scoring models to ensure the growth of high-credit quality consumer loans; |
For more information, see Note 4 of our audited consolidated financial statements.
Commercial Lending
58.81% of our total gross loan portfolio is made up of commercial loans to corporate, small, and medium sized enterprises. However, the share of commercial loans varies across of our banks. As of December 31, 2022, the percentage of commercial loans was 66.64%, 70.17%, 29.52%, 21.38% and 68.89% for Banco de Bogotá, Banco de Occidente, Banco Popular, Banco AV Villas and Corficolombiana, respectively.
The credit approval process for commercial loans at each of our banks in Colombia follows the policies and lending authorities established by each banking subsidiary. The highest lending authority in all banks, other than the board of directors, is the national credit committee (Comité Nacional de Crédito at Banco de Bogotá and Banco AV Villas, Comité de Crédito Dirección General at Banco de Occidente and Comité de Presidencia at Banco Popular). These have approval authority of lending limits that range between Ps 6.8 billion at Banco AV Villas and Ps 50.0 billion at Banco de Bogotá.
Following the approval of an application by the national credit committee of any of our banks, information regarding the approval is sent to the Grupo Aval risk management unit if it could result in aggregate exposure to the borrower exceeding Ps 5.0 billion. The credit approval process includes the presentation to Grupo Aval’s credit committee of all potential credit exposures per client (or client’s economic group) that, across all our banks, represent an exposure in excess of Ps 30.0 billion, or if it is considered to be part of a sector under special watch.
184
Delegation to the national credit committees of the banks can be made depending on the risk parameters defined by Grupo Aval’s credit committee. This committee, which is composed by the credit vice presidents of each of our banks and the credit risk management staff of Grupo Aval, meets on a weekly basis to discuss general developments in the industry and economy, risks and opportunities, and the structure of credit transactions, as well as to consult on and evaluate potential business opportunities.
The committee consolidates requests for loans across all banks and evaluates our total exposure to potential borrowers. In each case, the committee evaluates the relevant bank’s application of its credit analysis policy and it may make recommendations according to the structure of the loan. The credit committee will then submit to Grupo Aval’s advisory board those transactions for its review.
Grupo Aval evaluates, when applicable based on concentration thresholds, credit applications submitted to it by Grupo Aval’s banks and makes recommendations with respect to such loans. The Boards of Directors of the banks make the final decisions with respect to such applications. To facilitate the analysis of commercial loan applications which meet the threshold and are thus reviewed by Grupo Aval, we have developed certain tools, including a standardized “Proyecto de crédito”.
We seek to achieve a profitable, high-quality commercial loan portfolio and an efficient procedure for analyzing potential loans across our banks. For that purpose, we have established policies and procedures for the analysis and approval of potential commercial credit transactions that seek to focus lending on:
| ● | borrowers whose shareholders and management have, in our opinion, with solid character (considering not only an analysis of the borrower’s credit profile but also its reputation in the business community, among other factors); |
| ● | borrowers that participate in key industries; |
| ● | borrowers that are leaders or strong players in the industries where they participate; |
| ● | clearly identify and quantify primary and secondary sources of repayment, with a bias towards operational cash flow; |
| ● | transaction structures, including covenants and guarantees, which provide adequate protection; and |
| ● | adequate pricing to properly compensate capital invested and market and credit risks incurred. |
As part of our commercial banking activity, we make loans to public sector entities. For purposes of evaluating the extension of credit to public sector entities, our banks follow three criteria: (i) the loan must be used to finance an investment that has been approved by local authorities; and (ii) a source of repayment, primarily tax revenues, must be clearly identified.
For more information, see Note 4 of our audited consolidated financial statements.
Consumer Lending
Consumer lending represented 31.55% of the total gross loan portfolio as of December 31, 2022. However, share of consumer lending and specialization by product varies across of our banks. As of December 31, 2022, Banco Popular’s consumer lending represented 65.5% of its total gross loan portfolio and was concentrated mainly in payroll loans (libranzas), a product in which it is the leader in Colombia. At Banco AV Villas, Banco de Bogotá, consumer lending represented 61.4% and 21.6% of their total gross loan portfolio, respectively. At Banco de Occidente, 24.4%. At Corficolombiana, 30.4% of total gross loans were consumer loans granted primarily by Promigas and its subsidiaries to its residential gas utility users.
The credit approval process for consumer loans at each of our banks follows the policies and lending authorities established by each bank. The highest consumer lending authority at all banks, other than the board of directors, is the Consumer management Committee or National Consumer Credit Committee. These have lending limits that range between Ps 3.0 billion and Ps 6.0 billion.
For consumer banking, each bank has developed risk models designed to take into consideration the product offering. Banco Popular, for which payroll loans represent 94.8% of the consumer loan portfolio, has developed a business model which concentrates its analysis on the credit and operational risks of the payee (the employer) supported with statistical origination and behavior models. After being exclusively a mortgage lending institution until 2000, it has a developed different niches in consumer lending. The fast growth of consumer lending with above average credit quality has been the result of the development of in-house statistical origination and behavior models and the development of a multiple view vintage analysis tools, which have allowed the origination of consumer loan products to the lower income population, which is a more profitable customer segment in which relatively few banks compete. Banco de Bogotá has a full-service consumer loan portfolio of credit cards, personal loans, automobile loans and overdrafts.
185
Mortgage Lending
Mortgage lending represented 9.50% of our total gross loan portfolio as of December 31, 2022, with Banco de Bogotá and Banco AV Villas being the highest share. Mortgage lending represented 11.5% and 17.2% of Banco de Bogotá’s and Banco AV Villas’ total gross loan portfolios, respectively, as of December 31, 2022.
Microcredit Lending
Microcredit loans represented 0.1% of the total gross loan portfolio as of December 31, 2022.
Credit Classification and Provisioning
Our banks are continually engaged in the determination of risk factors associated with their credit-related assets, through their duration, including restructurings. For such purposes, they have designed and adopted the credit risk administration system (Sistema de Administración de Riesgo de Crédito), or “SARC”, (for its initials in Spanish) in accordance with Superintendency of Finance guidelines. The SARC has integrated credit policies and procedures for the administration of credit risks, models of reference for the determination and calculation of anticipated losses, allowances for coverage of credit risks and internal control procedures.
Our banks are required to classify the loan portfolio in accordance with the rules of the Superintendency of Finance, which established the following loan classification categories: “AA”, “A”, “BB”, “B”, “CC” and “Default”, depending on the strength of the credit and its past due status.
Each bank reviews the outstanding loan portfolio components under the above-mentioned criteria and classifies individual loans under the risk-rating categories below, based on minimum objective criteria, such as balance sheet strength, profitability, and cash generation capacity. The classification of new commercial loans is made based on these objective criteria. The criteria are also evaluated on an ongoing basis, together with loan performance, in reviewing the classification of existing commercial loans.
Category |
| Approval |
| Commercial loan portfolio |
| Consumer loan portfolio | |||||
“AA” |
| New loans with risk rating at approval of “AA” |
| Outstanding loans and financial leases with past due payments not exceeding 29 days (i.e., between 0 and 29 days past due). The debtor’s financial statements or its projected cash flows, as well as all other credit information available to the financial subsidiaries, reflect excellent paying capacity. |
| Loans whose risk rating is “AA” according to the methodology of the Consumer Reference Model (MRCO), as established by the Superintendency of Finance | |||||
|
|
|
|
|
|
| |||||
“A” |
| New loans with risk rating at approval of “B” |
| Outstanding loans and financial leases with delayed payments in excess of 30 days but not exceeding 59 days (i.e., between 30 and 59 days past due). The debtor’s financial statements or its projected cash flows, as well as all other credit information available to the financial subsidiaries, reflect appropriate paying capacity. |
| Loans whose risk rating is “A” according to the methodology of the MRCO as established by the Superintendency of Finance | |||||
“BB” |
| New loans with risk rating at approval of “B” |
| Outstanding loans and financial leases past due more than 60 days but less than 90 days (i.e., between 60 and 89 days past due). Loans in this category are acceptably serviced and collateralized, but there are weaknesses which may potentially affect, on a transitory or permanent basis, the debtor’s ability to pay or its projected cash flows, to the extent that, if not timely corrected, would affect the normal collection of credit or contracts. |
| Loans whose risk rating is “BB” according to the methodology of the MRCO as established by the Superintendency of Finance | |||||
|
|
|
|
|
|
| |||||
“B” |
| New loans with risk rating at approval of “C” |
| Outstanding loans and financial leases past due over 90 days but less than 120 days (i.e., between 90 and 119 days past due). The debtor shows insufficient paying capacity of its obligations. |
| Loans whose risk rating is “B” according to the methodology of the MRCO as established by the Superintendency of Finance | |||||
|
|
|
|
|
|
| |||||
“CC” |
| New loans with risk rating approval of “C” |
| Outstanding loans and financial lessees past due more than 120 days but less than 150 days (i.e., between 120 and 149 days past due). Loans in this category represent grave insufficiencies in the debtors’ paying capacity or in the project’s cash flow, which may compromise the normal collection of the obligations. |
| Loans whose risk rating is “CC” according to the methodology of the MRCO as established by the Superintendency of Finance | |||||
|
|
|
|
|
|
| |||||
“Default” |
| – |
| Outstanding loans and financial leases past due for 150 days or more, or that, being restructured, reach days past due greater than or equal to 60 days This category is deemed uncollectible. These loans are considered in default. |
| Consumer loan portfolio past due over 90 days or more, or that, being restructured, reach days past due greater than or equal to 60 days | |||||
186
For new consumer loans, our banks use their internal statistical origination models to develop an initial classification category (“AA”, “A”, “BB”, “B” and “CC”). Once the loan is disbursed, the banks use formulas provided by the Superintendency of Finance, which incorporate payment performance of the borrower to calculate a score which in turn is used to determine the loan classification.
For financial leases the risk categories are established in the same manner as commercial or consumer loans.
For separate financial statement reporting purposes under Colombian IFRS, the Superintendency of Finance requires that loans and leases be given a risk category on the scale of “A”, “B”, “C”, “D” and “E”. As a result, the risk classifications are aligned to the risk categories as follows.
| Risk classification – Banks | |||
Risk category – Superintendency of Finance |
| Commercial |
| Consumer |
“A” |
| “AA” |
| “AA” |
|
|
|
| “A” – between 0 and 30 days past due |
“B” |
| “A” |
| “A” – more than 30 days past due |
|
| “BB” |
| “BB” |
“C” |
| “B” |
| “B” |
|
| “CC” |
| “CC” |
“D” |
| “Default” |
| “Default” – all past due loans not classified in “E” |
“E” |
| “Default” |
| “Default” – past due loans with a Loss given default (LGD) of 100%(1) |
| (1) | LGD is defined as a percentage to reflect the credit loss incurred if an obligor defaults. LGD for debtors depends on the type of collateral and as a percentage would gradually increase depending on the number of days elapsed after being classified in each category. |
For our mortgage and microcredit loan portfolios the risk categories, based on past due status, are as follows.
Category |
| Microcredit |
| Mortgage |
“A” Normal Risk |
| In compliance or up to date and up to 30 days past due |
| In compliance or up to 60 days past due |
“B” Acceptable Risk |
| Past due between 31 and 60 days |
| Past due between 61 and 150 days |
“C” Appreciable Risk |
| Past due between 61 and 90 days |
| Past due between 151 and 360 days |
“D” Significant Risk |
| Past due between 91 and 120 days |
| Past due between 361 and 540 days |
“E” Uncollectable |
| Past due over 120 days |
| Past due over 540 days |
Loss allowance
Grupo Aval’s banks regularly review their loan portfolio to evaluate its impairment; while determining if an impairment should be recorded with charge to results of the year, management performs judgments for determining if there are observable data indicating a decrease in the estimated cash flow of the loan portfolio before the decrease in such flow may be identified for a particular loan of the portfolio.
The loan loss allowance calculation process includes analysis of specific, historical and subjective components. The methodologies used by our banking subsidiaries include the following elements:
| ● | a detailed periodic analysis of the loan portfolio; |
| ● | a credit classification system by risk levels; |
| ● | a periodic review of the summary of loss allowances; |
| ● | identification of individually evaluated loans due to impairment; |
| ● | consideration of internal factors such as size, organizational structure, loan portfolio structure, loan administration process, analysis of overdue portfolio and experiences of historical losses; |
| ● | consideration of risks inherent to different types of loans; and |
187
| ● | consideration of external factors, including local, regional, and national, as well as economic factors. |
For credits individually considered as significant and impaired, the amount of the loan loss allowance is calculated using the discounted cash flow method. Management of each financial entity makes assumptions regarding the amount to be recovered for each client and the time in which such amount will be recovered. During the calculation of allowances for credits considered individually as significant and impaired, based on their guarantee, management performs estimates of the fair value of such guarantees with the support of independent expert appraisers.
For loans not considered individually significant, or for those credits individually significant but not impaired, loan loss allowances are calculated collectively using elements as the historical loss rate, periodically updated data reflecting current economic conditions, performance trends of the industry, geographic concentrations of debtors within each portfolio of the segment and any other relevant information that may affect the payment. Grupo Aval’s banking subsidiaries also determine whether the credit risk (i.e., risk of default) of a financial instrument has increased significantly since initial recognition. They consider reasonable and supportable information that is relevant and available without undue cost or effort, including both quantitative and qualitative information and analysis based on their historical experience, expert credit assessment and forward-looking information.
To quantify expected credit losses in portfolios evaluated collectively the banking subsidiaries of Grupo Aval have calculation methodologies that consider three fundamental factors: exposure, probability of default and loss given default.
| ● | Exposure at default – “EAD” is the expected exposure from a counterparty at the time of a possible default. |
| ● | Probability of default – “PD” is the probability that the counterpart defaults in its payment obligations of capital and/or interest. The probability of default is associated to the rating/scoring or level of delinquency of the borrower. When a financial instrument’s credit risk has increased significantly since initial recognition, a PD for the remaining life of the credit (PD-lifetime) is used, while a PD for the next 12 months is used when the credit risk has not increased significantly. |
| ● | Loss given default – “LGD” is the estimated loss in case a payment default occurs taking into consideration the guarantees and the corresponding appraisal. |
For more information, see Note 4.1 Credit Risk.
Liquidity Risk Management
In each of our financial subsidiaries, the asset and liability management ALM team is responsible for managing the bank´s balance sheet and ensuring that the bank is able to meet its financial obligations. This includes managing the bank´s liquidity, interest rate risk, and other financial risks. The ALM team works closely with other teams within the bank, such as the treasury, risk management, and investment teams, to ensure that the bank´s overall risk profile is consistent with the risk appetite and regulatory requirement. The financing and liquidity models are decentralized and based on the autonomous management of each subsidiary. However, liquidity risk policies at the financial subsidiaries are compliant with guidelines established by the Superintendency of Finance and local regulators.
These guidelines require Grupo Aval’s Colombian financial subsidiaries to establish a liquidity risk management system (Sistema de Administración de Riesgo de Liquidez), which includes the identification, measurement, control and monitoring functions to ensure the management of day-to-day liquidity needs, adjust minimum liquidity buffers and establish liquidity contingency plans to deal with unexpected situations. Grupo Aval, as a holding company, is not required to maintain minimum liquidity positions.
Grupo Aval's Colombian banking subsidiaries and Corficolombiana must maintain as deposits in Colombian Central Bank or cash on hand to comply with the reserve requirements of Colombian Central Bank and the Superintendency of Finance. These funds are part of reserve requirements and are calculated over the daily average of the different customer deposits. This requirement is 8% on demand and saving deposits, and 3.5% for time deposits with a term up to 18 months. For time deposits with tenors exceeding 18 months, the reserve requirement remained at 0%.
Following a strong rebound in 2022, the rise in inflation is becoming the main concern of Central Banks. Therefore, the short-term and long-term funding market have experienced an increase in its rates, anticipating to the increases in Central Banks’s rates, this has driven the asset management areas and risk areas to increase the frequency with which they monitor their liquidity risk indicators through their internal risk committees. This monitoring has allowed decisions to be made in a timely manner, mitigating risk situations that could affect the stability of our entities.
188
The Corporate risk units and our subsidiaries’ risk units, have been monitoring the behavior of our clients’ deposits daily. Our subsidiaries at the same time monitored and followed up on strategies to maintain liquidity at adequate levels.
Moreover, financial subsidiaries controlled by Grupo Aval are required to maintain adequate liquidity positions based on the Superintendency of Finance’s liquidity parameters using a short-term liquidity index (Indicador de Riesgo de Liquidez), or “IRL”, that measures 7 and 30 day liquidity. This index is defined as the difference between adjusted liquid assets and net liquidity requirements:
| ● | Liquid assets include (i) debt securities adjusted by market liquidity and exchange rate excluding investments in securities at amortized cost, different from mandatory investments; (ii) Central Bank deposits; and (iii) available cash. |
| ● | Net liquidity requirements result from the difference between expected contractual asset and contractual and non-contractual liability cash flows. Cash flows from loans past due more than 30 days are not included in this calculation. |
During 2022, Grupo Aval’s financial subsidiaries in Colombia maintained adequate levels of high-quality liquid assets to meet the 30-day liquidity requirements, according to the methodology of the Superintendency of Finance. There is no evidence of any upcoming liquidity risk threat. Notwithstanding the foregoing, the liquidity units of the financial subsidiaries have worked to measure the future impacts on the index considering the economic and commercial environment.
The following tables show the consolidated IRL Ratio as of December 31, 2022, and 2021 for each of our banks in Colombia and Corficolombiana, expressed in Ps billions and as a percentage.
| At December 31, | |||||||||||||||||||
Banco de Bogotá |
| Banco de Occidente |
| Banco Popular |
| Banco AV Villas |
| Corficolombiana | ||||||||||||
| 2022 |
| 2021 |
| 2022 |
| 2021 |
| 2022 |
| 2021 |
| 2022 |
| 2021 |
| 2022 |
| 2021 | |
(in Ps billions) | ||||||||||||||||||||
IRL – 7 days |
| 10,865 |
| 10,234 | 5,338 |
| 5,923 | 4,141 |
| 3,847 | 1,828 |
| 2,507 | 1,542 |
| 819 | ||||
IRL – 30 days |
| 6,446 |
| 2,928 | 1,921 |
| 2,936 | 1,589 |
| 1,671 | 488 |
| 1,139 | 866 |
| 613 | ||||
| At December 31, | |||||||||||||||||||
| Banco de Bogotá |
| Banco de Occidente |
| Banco Popular |
| Banco AV Villas |
| Corficolombiana | |||||||||||
| 2022 |
| 2021 |
| 2022 |
| 2021 |
| 2022 |
| 2021 |
| 2022 |
| 2021 |
| 2022 |
| 2021 | |
(in percentages) | ||||||||||||||||||||
IRL – 7 days | 1,328 |
| 673 | 744 |
| 348 | 463 |
| 525 | 488 |
| 829 | 358 |
| 221 | |||||
IRL – 30 days | 222 |
| 132 | 145 |
| 180 | 143 |
| 154 | 127 |
| 167 | 168 |
| 169 | |||||
Supervised entities are required to calculate and report weekly to the Superintendency of Finance a short-term liquidity risk indicator. The Liquidity Risk Indicator (IRL for its initials in Spanish) is calculated over periods of 7 and 30 days and should be at least 100 percent. During 2022, Grupo Aval’s Colombian banks complied with the regulatory minimum requirement.
The Superintendency of Finance issued External Circular 019 of 2019, setting the objective, rules, and definition of the metric for the CFEN ratio (Coeficiente de Financiación Estable Neto). The CFEN ratio, based on the Basel NSFR (Net Stable Funding Ratio) standard, limits excessive dependence on unstable funding resources for strategic assets that are often illiquid and at the same time, allows entities to maintain a stable funding profile in relation to their assets.
The CFEN ratio is defined as a ratio of the available amount of stable funding (ASF) to a required amount of stable funding (RSF). “Stable funding” is defined as those types and amounts of equity and liability financing, expected to be reliable sources of funds over a one-year time horizon under conditions of long-term stress.
Available stable funding (ASF) is defined as the sum of: (i) capital; (ii) preferred stock with maturity of equal to or greater than one year; (iii) liabilities with effective maturities of one year or greater; and (iv) the portion of “stable” non-maturity deposits and/or term deposits with maturities of less than one year that would be expected to stay with the institution for an extended period in a stress scenario multiplied by an ASF factor.
The required amount of stable funding is calculated as the sum of the value of the assets held and funded by the institution, multiplied by a specific required stable funding (RSF) factor assigned to each particular asset type, multiplied by its associated RSF factor. The total RSF is the sum of the corresponding weighted amounts. RSF factors are intended to approximate the amount of a specific asset that would have to be financed, either because it will be renewed, it could not be liquidated through its sale, or it is engaged in a money market operation, in a year without incurring in significant losses. That amount must be financed with ASF.
189
Supervised entities are required to calculate and report monthly to the SFC a long-term liquidity ratio. The Net Stable Funding Ratio (CFEN for its initials in Spanish) was adopted in phases, beginning at 80 percent of target in March 2020 and reaching 100 percent by March 2022 for banks with assets greater than or equal to 2 percent of total banking sector’s assets. Grupo Aval's Colombian banking subsidiaries must comply with the minimum requirement of 100 percent, in contrast, Corficolombia is exempt from CFEN ratio regulatory minimum requirement due to have assets under 2 percent of total banking sector´s assets and its core business is the active management of an equity portfolio. During 2022, Grupo Aval’s Colombian banks compliant the regulatory minimum requirement.
In line with the timeline specified in the 2019 publication, the CFEN became a minimum requirement of 100% on March 2022. The Superintendency of Finance issued External Circular 021 of 2022 which published (i) the list of criteria that interdependent foreign exchange assets and liabilities items must complied to be exclude from CFEN ratio, (ii) guidelines to categorized financial institution´s funding sources, (iii) and introduce a method seek to banks determined the stability of deposits from mutual funds and other investment vehicles. Additionally, the SFC, through this circular ratified that a 0% ASF factor will comprise deposits from financial institutions and mutual funds without deterministic maturity, form March 2023 onwards.
The following tables show the consolidated CFEN ratio for each of our banks in Colombia as well as for Corficolombiana, expressed as a percentage as of December 31, 2022, and 2021 as follows:
| At December 31, 2022 | |||||||||
Banco de Bogotá |
| Banco de Occidente |
| Banco Popular |
| Banco AV Villas |
| Corficolombiana | ||
(in Percentage) | ||||||||||
CFEN | 105.1 | 108.6 | 102.2 | 108.7 | 98.6 | |||||
| At December 31, 2021 | |||||||||
Banco de Bogotá |
| Banco de Occidente |
| Banco Popular |
| Banco AV Villas |
| Corficolombiana | ||
(in Percentage) | ||||||||||
CFEN | 107.7 | 107.7 | 93.8 | 111.6 | 222.2 | |||||
Market Risk Management
Market risk management focuses on the probability of changes in the value of the investment’s portfolios due to fluctuations in financial instruments’ prices. Market risk management systems are composed by a set of policies, procedures, and controls in order to identify, measure, monitor and control the sources of risk.
Grupo Aval, as a financial holding, does not have material market risk on its own but it monitors and oversees market risk at a consolidated entities level through reports received from its financial subsidiaries in charge of managing their own market risk. The financial subsidiaries present substantial market risk, primarily because of banks’ lending, trading and investment businesses. The main sources of market risks to which financial subsidiaries are exposed to: interest rate risk, foreign exchange rate risk, variations in stock price risk and investment fund risk:
| ● | Interest rate risk: because of mismatches between interest-rate-sensitive assets and liabilities, we are engaged in using interest rate swaps or other off-balance sheet derivative instruments. Interest rate risk arises in connection with trading and non-trading activities. |
| ● | Foreign exchange rate risk: because of mismatches between assets and liabilities, and off-balance sheet derivative instruments denominated in foreign currencies. |
| ● | Variations in stock price risk: in connection with investments in equity securities, including our merchant banking investments. |
| ● | Investment fund risk: primarily from investments in mutual funds. |
Grupo Aval and its financial subsidiaries’ respective Boards of Directors, through their risk management committees, are responsible for establishing policies, procedures, and limits regarding market risk. Additionally, these committees monitor overall performance considering the risks assumed. These policies and procedures describe the control framework used by Grupo Aval and its financial subsidiaries to identify, measure, and manage market risk exposures inherent in financials activities. The main purpose of these policies and procedures is to set risk limits.
All risk managers within Grupo Aval must ensure that each business activity is performed in accordance with the financial subsidiaries policies. These policies and procedures are followed in market risk decision-making in all business units and activities. Financial subsidiaries
190
have established a Market Risk Management System “Sistema de Administración de Riesgos de Mercado”, or SARM (for its initials in Spanish), which meets the requirements of the Superintendency of Finance. Each financial subsidiary is responsible for setting limits and monitoring market risk.
Market risk management employees at Grupo Aval and financial subsidiaries are responsible for:
| ● | identifying, measuring, managing and controlling market risk exposures inherent in their businesses; |
| ● | analyzing exposures under stress scenarios; |
| ● | confirming compliance with risk management policies, reporting deviation from such policies, and proposing changes to policies when required; |
| ● | designing value securities and financial instruments methodologies; and |
| ● | reporting trading instruments’ market risk levels to senior management on a daily basis. |
Financial subsidiaries hold trading and non-trading instruments which are classified in the treasury or banking book, according with the strategy, nature, and financial instruments risks.
Grupo Aval’s financial subsidiaries manage their investment portfolios in a comprehensive and integral manner that is intended to assess the level of market risk exposure for each one of the three categories of the investment securities portfolio. Therefore, test measures such as DVO1 or duration sensitivity are used in the market risk assessment process.
Trading Instruments
Trading instruments include positions in financial instruments acquired to take advantage of current and/or expected differences between purchase and sale prices. As a result of trading fixed rate and floating rate securities, equity securities, investment funds and foreign exchange, Grupo Aval and its financial subsidiaries are exposed to interest rate risk, stock prices risk, investment fund and foreign exchange rate risks, as well as volatility risk when derivatives are used. Financial subsidiaries trade foreign exchange, fixed income instruments, including fixed and floating rate securities, and derivative instruments (forwards, options, cross currency swaps and interest rate swaps).
Market risk departments use value at risk, or “VaR”, to measure their exposure to market risk in trading instruments. VaR is an estimate of the expected maximum loss in market value of a given portfolio over a time horizon at a specific confidence interval, subject to certain assumptions and limitations discussed below.
VaR models have inherent limitations, including the fact that they rely on historical data, which may not be indicative of future market conditions or trading patterns. As a result, VaR models could overestimate or underestimate the value at risk and should not be viewed as predictions of future results. Furthermore, it can be possible to incur in losses materially in excess of the amounts indicated by the VaR models on a specific trading day or over a period. VaR does not calculate the greatest possible loss. In addition, VaR models are subject to the reasonable judgment of market risk management’s employees.
As described below, financial subsidiaries measure interest rate risk, foreign exchange risk, variations in stock price risk and investment fund risk in accordance with VaR models. They use two types of approaches to measure VaR: (i) internal VaR models and (ii) regulatory VaR.
Internal VaR
Financial subsidiaries use internal models to manage market risk. Parameters are set to adapt to the evolution of volatility of the risk factors over time using statistical methods to estimate them. Internal VaR models usually give more weight to recent data in the time of calculations to reflect actual market conditions. The corporate governance bodies of the financial subsidiaries set limits based on this VaR measure to control the market risks. Parametric VaR and historical simulation methodologies are also used.
Each financial subsidiaries’ board of directors, assets and liabilities committee and/or risk management committee establishes the maximum VaR for each type of investment and for each type of risk using their own internal VaR models as well as the Superintendency of Finance methodology. Financial subsidiaries use VaR estimates to alert senior management whenever the statistically estimated losses in the banks’ portfolios exceed pre-established levels. Limits on VaR are used to control exposure on a portfolio-by-portfolio basis.
191
To strictly control the trading portfolios, each entity has limits for every risk factor. To determine the limits, the impact of the variation in each asset class is considered. These risk limits are validated through stress testing based on historical extreme scenarios.
Regulatory VaR
The Regulatory VaR calculation is mainly used for the Superintendency of Finance’s capital ratio (solvency ratio) calculations and the methodology is based on the Basel II model.
This model applies only to the banks’ investment portfolio and excludes investments at amortized cost and other specific non-trading positions included in the “Available for sale” portfolios. Total market risk is calculated daily by aggregating the VaR for each risk exposure category on a ten-day horizon using risk factors calculated in extreme market stress scenarios. VaR at month-end comprises part of the capital adequacy ratio calculation (as set forth in Decree 2555 of 2010). The Superintendency of Finance’s policy issues, require financial subsidiaries to calculate VaR for the following risk factors: interest rate risk, foreign exchange rate risk, variations in stock price risk and fund risk; correlations between risk factors are not considered. The fluctuations in the portfolio’s VaR depend on volatilities determined by the Superintendency of Finance, duration, and changes in balances outstanding. The ten-day horizon is defined as the average time in which an entity could sell a trading position in the market. Moreover, the Superintendency of Finance has not made publicly available technical information on how it determines the volatilities used in this model, and only limited information is available. The volatilities used in the Superintendency of Finance’s model are of a similar magnitude to those observed in very high volatility or stress periods.
The VaR calculation for each parent company is the aggregate of the parent and its financial subsidiaries’ VAR, using, the standard methodology defined by the Superintendency of Finance.
Interest Rate Risk
Financial subsidiaries’ exposure to interest rate risk in their trading portfolios primarily arises from investments in securities (floating and fixed rate) and derivative instruments. According to the Superintendency of Finance rules, financial subsidiaries calculate interest rate risk for positions in pesos, foreign currency and UVRs separately. UVR is a Colombian inflation-adjusted monetary index calculated by the Colombian Central Bank’s board of directors and generally used as an alternative for home-mortgage loans pricing floating rates. The interest rate risk model is designed to measure the risk of losses arising from changes in market interest rates. It includes the sum of the net short or long position in the whole trading book, a proportion of the matched positions in each time band (vertical disallowance) and a proportion of the matched positions across different time bands (horizontal disallowance).
A significant portion of market risk of the financial subsidiaries is interest rate risk generated by long positions held in peso-denominated Colombian government debt. Financial subsidiaries prefer these securities because the government debt market is the largest and most developed of the local financial markets. Additionally, government debt securities support the liquidity management as they are eligible for Colombian Central Bank overnight repo funding and are classified as high-quality liquid assets. Government debt securities also carry a zero weight for capital adequacy calculations making them attractive in terms of use of capital. These factors provide an incentive to invest in government debt securities and diversify less into other debt securities that do not possess these characteristics.
Foreign Exchange Rate Risk
Financial subsidiaries use a sensitivity factor to calculate the probability of losses because of fluctuations in currencies in which they hold positions. Regulatory VaR is computed daily by multiplying the net position by the maximum probable variation in the price of such positions on a ten-day horizon, determined by the Superintendency of Finance as shown in the following table.
U.S. dollar |
| 12.5% | |
Euro |
| 11.0% | |
Other currencies |
| 13.0% |
Our banks’ exposure to foreign exchange rate risk arises mainly from changes in the U.S. dollar/peso exchange rate. Our banks use an approximation to estimate the risk in exchange-rate-related option positions based on delta, gamma and vega sensitivities, which is included in foreign exchange risk.
The foreign exchange rate risk VaR calculation under the standard model of the Superintendency of Finance includes the trading and non-trading book.
192
Equity Price Risk
In determining regulatory VaR variations in stock price risk, certain investments are excluded: (i) equity securities in financial institutions supervised by the Superintendency of Finance; and (ii) equity securities derived from corporate restructuring processes or received as in-kind payment for non-performing loans. In addition, as part of the solvency ratio calculation, equity securities in entities supervised by the Superintendency of Finance that do not consolidate, are generally deducted from primary capital. Investments in entities that consolidate but are not supervised by Superintendency of Finance (non-financial investment), are included in VaR calculations.
Variations in stock price risk in Grupo Aval, derive mainly from Corficolombiana’s non-financial investment portfolio. The Superintendency of Finance’s methodology for determining VaR for variations in stock price risk outlined above resulted in the incorporation of Corficolombiana’s consolidated and non-consolidated equity securities in non-financial institutions.
In December 2010, the Superintendency of Finance issued a methodology that excludes from the VaR calculation investments that are available for sale, equity securities that are acquired as strategic investments and intended to be held on a long-term horizon.
Variations in stock price risk VaR are computed daily by multiplying the net position by the maximum likely variation in the price of such positions on a ten-day horizon, determined by the Superintendency of Finance to be 14.7%. This coefficient is based on historic volatilities and is seldom adjusted.
Investment Fund Risk
Investment fund risk comes from temporary investment of cash in portfolios managed by trust companies. Investment fund risk VaR is computed daily by multiplying the net position by the maximum probable variation in the price of such positions on a ten-day horizon, determined by the Superintendency of Finance to be 14.7%.
The following tables show the VaR calculation, for each subordinate on a consolidated basis and Porvenir, relating to of the risk factors described above and based on the Superintendency of Finance’s methodology (Regulatory VaR) for the years ended December 31, 2022, and 2021. The average, minimum and maximum levels are determined based on end-of quarterly calculations, using 4-quaterly data points of the year analyzed.
Banco de Bogotá
At | ||||||||||
December 31, | ||||||||||
Year ended December 31, 2022 | 2021 | |||||||||
| Period end |
| Average |
| Maximum |
| Minimum |
| Period end | |
(in Ps millions) | ||||||||||
Interest rate risk VaR |
| 440,531 |
| 441,281 |
| 460,435 |
| 426,736 |
| 834,269 |
Foreign exchange rate risk VaR |
| 171,517 |
| 133,241 |
| 179,646 |
| 87,497 |
| 70,029 |
Variations in equity price risk VaR |
| 3,870 |
| 4,182 |
| 4,650 |
| 3,759 |
| 2,820 |
Fund risk VaR |
| 143,705 |
| 118,107 |
| 143,705 |
| 108,165 |
| 106,827 |
Banco de Occidente
At | ||||||||||
December 31, | ||||||||||
Year ended December 31, 2022 | 2021 | |||||||||
| Period end |
| Average |
| Maximum |
| Minimum |
| Period end | |
(in Ps millions) | ||||||||||
Interest rate risk VaR |
| 173,355 |
| 196,810 |
| 243,326 |
| 173,355 |
| 255,312 |
Foreign exchange rate risk VaR |
| 15,681 |
| 3,354 |
| 15,681 |
| 99 |
| 2,749 |
Variations in equity price risk VaR |
| — |
| — |
| — |
| — |
| — |
Fund risk VaR |
| 83,479 |
| 80,639 |
| 83,479 |
| 75,869 |
| 69,551 |
193
Banco Popular
At | ||||||||||
|---|---|---|---|---|---|---|---|---|---|---|
December 31, | ||||||||||
Year ended December 31, 2022 | 2021 | |||||||||
| Period end |
| Average |
| Maximum |
| Minimum |
| Period end | |
(in Ps millions) | ||||||||||
Interest rate risk VaR |
| 121,194 |
| 130,739 |
| 144,932 |
| 121,194 |
| 151,504 |
Foreign exchange rate risk VaR |
| 5,796 |
| 5,618 |
| 6,711 |
| 4,290 |
| 5,649 |
Variations in equity price risk VaR |
| 147 |
| 143 |
| 148 |
| 140 |
| 144 |
Fund risk VaR |
| 20,548 |
| 15,952 |
| 20,548 |
| 12,209 |
| 15,964 |
Banco AV Villas
At | ||||||||||
December 31, | ||||||||||
Year ended December 31, 2022 | 2021 | |||||||||
| Period end |
| Average |
| Maximum |
| Minimum |
| Period end | |
(in Ps millions) | ||||||||||
Interest rate risk VaR |
| 84,749 |
| 99,727 |
| 120,545 |
| 82,312 |
| 125,004 |
Foreign exchange rate risk VaR |
| 98 |
| 48 |
| 106 |
| 9 |
| 41 |
Variations in equity price risk VaR |
| — |
| — |
| — |
| — |
| — |
Fund risk VaR |
| 11,864 |
| 2,090 |
| 11,864 |
| 158 |
| 1,754 |
Porvenir
At | ||||||||||
December 31, | ||||||||||
Year ended December 31, 2022 | 2021 | |||||||||
| Period end |
| Average |
| Maximum |
| Minimum |
| Period end | |
(in Ps millions) | ||||||||||
Interest rate risk VaR |
| 29,363 |
| 40,927 |
| 61,686 |
| 25,698 |
| 44,976 |
Foreign exchange rate risk VaR |
| 976 |
| 577 |
| 1,682 |
| 93 |
| 272 |
Variations in equity price risk VaR |
| 2,541 |
| 2,579 |
| 3,379 |
| 1,404 |
| 2,673 |
Fund risk VaR |
| 788 |
| 5,504 |
| 15,922 |
| 788 |
| 1,924 |
Corficolombiana
At | ||||||||||
|---|---|---|---|---|---|---|---|---|---|---|
December 31, | ||||||||||
Year ended December 31, 2022 | 2021 | |||||||||
| Period end |
| Average |
| Maximum |
| Minimum |
| Period end | |
(in Ps millions) | ||||||||||
Interest rate risk VaR |
| 160,195 |
| 172,466 |
| 185,935 |
| 148,170 |
| 195,119 |
Foreign exchange rate risk VaR |
| 23,090 |
| 15,882 |
| 40,422 |
| 3,828 |
| 1,876 |
Variations in equity price risk VaR |
| 6,557 |
| 9,308 |
| 13,350 |
| 6,017 |
| 13,267 |
Fund risk VaR |
| 692 |
| 1,087 |
| 1,609 |
| 692 |
| 1,423 |
Considerations on Equity Price Risk Regulatory VaR
As stated above, variations in equity price risk measured based on the regulatory VaR methodology include equity securities held for trading through profit or losses and non-strategic holdings. In addition, it does not discriminate between listed and unlisted equity investments or between those consolidated and those which are not. It focuses on investments in non-financial institutions.
Holding periods for many of Corficolombiana’s equity investments exceed ten years. Its largest investments have been in the portfolio for many years and are intended to remain as permanent investments. At December 31, 2022 and 2021, the investments subject to regulatory VaR were the holdings in Mineros S.A.
194
The following table breaks down our investments subject to regulatory VaR by time since initial investments at December 31, 2022 and 2021.
At December 31, |
| ||||||||||||
|---|---|---|---|---|---|---|---|---|---|---|---|---|---|
2022 | 2021 |
| |||||||||||
| Investment |
|
|
| Investment |
|
|
| |||||
subject to | Percentage | subject to |
| ||||||||||
Regulatory | Regulatory | of | Regulatory | Regulatory | Percentage of |
| |||||||
VaR | VaR | portfolio | VaR | VaR | portfolio |
| |||||||
More than 36 months |
| 44,122 |
| 6,486 |
| 100% | 85,229 |
| 12,617 |
| 100% | ||
Total |
| 44,122 |
| 6,486 |
| 100% | 85,229 |
| 12,617 |
| 100% | ||
Non-Trading Instruments
Non-trading instruments consist mainly of loans and deposits. Our banks’ primary market risk exposure in non-trading instruments is interest rate risk, which arises from the possibility of changes in market interest rates. Those changes in market interest rates affect our banks’ net interest income due to timing differences on their assets and liabilities repricing. Additionally, our banks are affected by gaps in maturity dates and interest rates in different asset and liability accounts.
For more information, see Note 4.2.4 Interest Rate Risk to our audited consolidated financial statements for a breakdown of our financial assets and liabilities by maturity bands and by interest rate type.
As part of their management of interest rate risk, financial subsidiaries analyze the interest rate mismatches between their interest-earning assets and their interest-earning liabilities. This sensitivity analysis based on hypothetical changes assumes the composition of Grupo Aval’s balance sheet remains constant over the period being measured.
The following analysis estimates the sensitivity of outstanding balances of financial assets and financial liabilities to variations in interest rates on December 31, 2022. The analysis assumes constant market parameters, without including the effects of discretional customer decisions and changes in macroeconomic fundamentals over financial assets and liabilities. Assumes also no subject matter expert discretionary management. As a result, if interest rates were to increase 100 basis points, assuming no asymmetrical movement in yield curves and a constant structure of the Statement of financial position (no changes in maturities and assuming simultaneous repricing), net income before income tax expense for the year 2022 would have been Ps. 353,827 higher, mainly as a result of higher interest income on variable interest assets and partially offset by higher interest expenses on variable interest liabilities and lower fair values of securities at fair value through profit or loss. The portion of assets at variable rates is greater than the liabilities at variable rate. Other comprehensive income in equity would have been Ps. 538,385 (2021: Ps. 850,710) lower, mainly because of a decrease in the fair value of fixed rate financial assets classified as fair value through OCI.
Additionally, Superintendency of Finance guidelines require financial subsidiaries to measure foreign exchange rate risk VaR not only for treasury book positions but also for all assets and liabilities denominated in foreign currencies. Our non-trading instruments are exposed to foreign exchange rate risk mainly from loans and deposits denominated in dollars. This foreign exchange rate risk is monitored under the VaR methodology described above.
Operational Risk Management
Grupo Aval defines operational risk as "the risk of incurring losses due to deficiencies, failures or inadequate functioning of our processes, technology, infrastructure or human resources, as well as the occurrence of external events associated with them, including legal risk". Operational risk is inherent to all services, products, activities, processes and systems, and affects all business and support areas, so all employees are responsible for managing and controlling the risks that arise in the development of their activities.
The operational risk policies in Grupo Aval and financial subsidiaries are aimed at complying with the guidelines established by Superintendency of Finance. These guidelines require to establish a system of operational risk management (SARO) that includes identification, measurement, control and monitoring of functions required to ensure adequate risk management..
As a part of the processes achieved in the management of operational risk the execution of missionary, strategic and support processes and implements the necessary controls to meet its obligations with clients, shareholders and other stakeholders. SARO's management is complemented by the definition, implementation, testing and maintenance of the Business Continuity Plan, which is part of strengthening the operational risk control stage.
To comply with the implementation of SARO, each of our financial subsidiaries established within its organizational structure an operational risk unit independent of the operational and control areas of each financial subsidiary. The responsibilities of these units are the establishment
195
and definition of policies, methodologies and procedures for communicating within each organization all information related to operational risk. In addition to the staff of each operational risk unit, the financial subsidiaries have established the role of operational risk leaders, which are employees in key areas who, in addition to their functional responsibilities, are required to report events or situations which may result in eventual operational losses. Additionally, each financial subsidiary has an operational risk management committee which meets on a periodical basis to review operational risks policies and follow up on the execution of action plans.
The Operational Risk Unit (URO) maintains its monitoring process to the risk profile of the entity, reports to senior management, and validated that risks levels have not exceeded the adequate and accepted risk levels.
At Grupo Aval, an operational risk management committee, composed of the heads of the operational risk units of each financial subsidiary and staff of Grupo Aval risk management, was established. The main activities of this committee, are as follows:
•coordinate the analysis of regulation and the impact in Grupo Aval's financial subsidiaries;
•identify and apply operational risk management best practices;
•monitor the financial subsidiaries' operational risk management performance systems;
•coordinate the standardization of operational risk methodologies;
•identify and implement operational risk management tools; and
•standardization of criteria in the search for business continuity tools.
The maturity of our the Business Continuity Management system represents our commitment to a strong and resilient culture, providing all stakeholders with contingency solutions that enable them to increase their confidence in managing events that disrupt the normal operation of our business. The execution of business continuity testing has been developed to identify strengths and opportunities for improvement in the entities' operation scheme. As a result, the strategies and preparedness preparation of the funcional teams and technological teams and processes proved to be effective in facing disruption scenarios.
The guidelines established by Grupo Aval's Corporate Business Continuity Committee aim to support compliance with business continuity requirements based on the a deep knowledge of the policies and activities developed by each entity. Remote work has been an effective contingency strategy for Grupo Aval and its Subsidiary Entities with which it has responded in a timely manner to the needs of all stakeholders.
Grupo Aval and its financial entities adopted the guidelines established by the Superintendency of finance, related to operational risk management and what was established in Decree 1421 issued on August 6, 2019, complying with the capital requirements for operational risk.
For the determination of capital requirements for Operational Risk, the Value at Operational Risk (VeR RO) calculated in accordance with the instructions set forth in Chapter XXIII of the Basic Accounting and Financial Circular (CBCF) is used. Credit institutions base their calculation on the standard method defined in Annex 1 of the referred chapter in order to determine the exposure to operational risk. The standard model includes a transition table for the estimation of the IPI (internal loss indicator) which may be used until December 2025, while each entity undergoes the certification process of the operational risk event base, in accordance with the provisions of the Circular:
Term | Minimum IPI |
Effective January 2021 | 0.7 |
Effective January 2022 | 1.0 |
Effective January 2023 | 1.3 |
From January 2024 through December 2025 | 1.5 |
During 2022, Banco de Occidente and Corficolombiana submitted for approval by the Financial Superintendency of Colombia their operational risk event bases, therefore, for the calculation of the VeRRo they are using the IPI according to their own operational risk event base, for the case of the pension and severance fund management company the Financial Superintendency has established a different methodology contained in Annex 2.
196
Below are the figures by Entity as of the end of December 2022 compared to 2021:
At December 31, 2022 | At December 31, 2021 | |||||||
|---|---|---|---|---|---|---|---|---|
Entity | Value | Basis Points of Regulatory Capital | Value | Basis Points of Regulatory Capital | ||||
(in Ps millions) | ||||||||
Banco de Bogotá | 6,412 | 86 | 10,857 | 96 | ||||
Banco de Occidente | 2,525 | 76 | 1,671 | 60 | ||||
Banco Popular | 1,288 | 79 | 801 | 61 | ||||
Banco AV Villas | 909 | 88 | 614 | 78 | ||||
Corficolombiana | 3,372 | 806 | 2,112 | 597 | ||||
Porvenir | 1,420 | 113 | 1,510 | 476 | ||||
It should be noted that the difference between the periods for Banco de Bogotá VeRRo is due to the spin-off of BAC, this information is detailed in note 1.1 Discontinued operation BAC Holding.
Non-Financial Risk Review
Grupo Aval and its subsidiaries are committed to the preservation of integrity through compliance with applicable laws, regulations, and ethical standards in each of the markets in which they operate. All employees are expected to adhere to these laws, regulations and ethical standards and management of each subsidiary is responsible for ensuring such compliance. Compliance is an essential ingredient of good corporate governance.
The compliance function covers all matters relating to regulatory compliance, the prevention of money laundering and terrorist financing, consumer protection, antibribery and anticorruption, as well as compliance with the standards of the U.S. Sarbanes-Oxley Act of 2002 (Sarbanes-Oxley) in some subsidiaries including the most significant from a quantitative perspective.
The compliance function is independent of the business lines in all our subsidiaries and promotes adherence to the rules, oversight requirements, principles, and values of good conduct through all our companies. The corporate governance structure at Grupo Aval establishes standards, policies and best practices that apply to each company to enforce the standard requirements, that business units should follow. The compliance or risk units in each subsidiary enforce the application of the corporate and internal policies providing advice and information in the interest of employees, customers, shareholders, and supervisors.
The compliance function in our financial subsidiaries is incorporated into the risk areas with access to the board of directors and its committees through the Chief Risk Officer or its equivalent. In addition, the legal departments of each financial subsidiary, have access to these bodies on a regular basis. This structure is aligned with banking regulatory requirements and supervisory expectations. In non-financial subsidiaries the compliance function is in charge of the area of compliance.
The compliance unit assists Management at the entity level in identifying and assessing potential compliance issues as well as providing guidance to staff on compliance laws, rules, and standards, and performs a monitoring and reporting role. The legal departments or its equivalent of the subsidiaries have the primary responsibility for identifying and interpreting compliance laws, rules, and standards, and for aiding in drafting related policies and procedures. The internal audit units review the adequacy of controls established to ensure compliance with policies, plans, procedures, and business objectives, in accordance with the annual internal audit plan and legal requirements, as well as COSO 2013 as internal control framework.
Anti-money laundering and terrorist financing
Grupo Aval and its financial subsidiaries must comply with the guidelines established by local authorities and the Superintendency of Finance of Colombia (which, in turn, follows international standards). These guidelines require that Colombian financial entities establish a risk management system for risks related to money laundering and terrorist financing (Sistema de Administración de Riesgo de Lavado de Activos y Financiación del Terrorismo - SARLAFT) which includes the identification, measurement, control, and monitoring functions to prevent and mitigate the materialization of risks related to money laundering and terrorist financing.
In compliance with the regulations of the Superintendency of Corporations, the obligated entities by this authority, in the non-financial sector, have implemented the control system for the prevention of the money laundering and financing of terrorism called SAGRILAFT (Sistema de Autogestión de Riesgo Integral de Lavado de Activos y Financiación del Terrorismo). A methodology for measuring the maturity level of the system to prevent money laundering and terrorist financing was defined, consisting of an annual self-evaluation that includes qualitative factors of the compliance program ranging from the control environment to monitoring the effectiveness of the controls.
197
Bimonthly Corporate Committees are held with the participation of the Compliance Officers of the principal entities. Through these instances, Grupo Aval ensures that best practices are adopted by the companies, and undertakes a periodic review of the methodology, risk factors and risks materializations. Depending on their impact an assessment is made in these committees to determine if there are gaps in the factors considered (ranging from policies, organization, knowledge of the client, identification of unusual operations, status of communications, acquisition, development and maintenance of systems, incident management, degree of compliance, strategy, government, and control architecture, among others) or improvement opportunities. Compliance Officers in each subsidiary are required to report periodically the main findings and assessment of the anti-money laundering risk to the board of directors.
All local financial subsidiaries, and the obligated entities by the Superintendency of Corporations in the non-financial sector required to implement the control system for the prevention of money laundering and financing of terrorism – SAGRILAFT, in compliance with local regulations, must report suspicious transactions to the UIAF (Unidad de Información y Análisis Financiero) of the Ministry of Finance.
Annually, each subsidiary must certify to Grupo Aval holding the degree of compliance with corporate policies and procedures for the calendar year that ends, based on program maturity goals. According to this, each of our subsidiaries must comply the minimum standards defined by Grupo Aval, even if the local regulation is less demanding.
Anti-bribery and anti-corruption
Grupo Aval has designed controls to safeguard that its employees act with integrity in all of their dealings and strictly prohibits bribery and corruption in any form. Anti-corruption principles are stated in the Corporate Anti-Corruption Policy and are summarized below, based on the fundamental principle of zero tolerance:
| ● | Employees of Grupo Aval and of all its subsidiaries must conduct their business fairly, honestly, accountably and transparently; therefore, all forms of corruption, including facilitation payments, are strictly prohibited; |
| ● | Ethical lines of Grupo Aval and its subsidiaries are available to employees and third-parties. Any complaints are carefully investigated, ensuring appropriate actions and the whistleblowers anonymity. Other means such as email and web pages can be used to report corruption events; |
| ● | Gifts or entertainment must always be proportionate and reasonable, must have a legitimate purpose and must not create a conflict of interest or the perception thereof; |
| ● | Donations and sponsorships are controlled, regulated by strict principles, and should be reported to Compliance Officers; and |
| ● | Questionable behavior should be challenged, and rumors of improper payments or activities should be reported to management or could be reported via the whistleblower reporting channels. |
In accordance with the above, Grupo Aval monitors that the accounting records of transactions with high exposure to anti-corruption and anti-bribery laws accurately reflect such transactions and their proper accountancy.
A corporate methodology has been established to identify, assess, document and manage corruption risks. It includes semi-annually updating of the risk – controls matrix, applying the approved methodology and annual evaluation of the risk of corruption at the level of each entity.
We have designed a process of self-assessment and annual certification applicable to all the Grupo Aval subordinates which consists of evaluating the environment of control and the way in which each subordinate is mitigating the anti-corruption risks identified, with a special emphasis on particular issues such as donations, gifts, invitations, sponsorships, and TPI (third parties intermediaries) administration. The policies also apply to acquisitions and joint ventures.
Legal Risk
Each subsidiary’s legal division supports operational risk management in its area of expertise. Specifically, this division defines and institutes the necessary procedures to adequately control the legal risks inherent in financial subsidiaries’ operations, making sure legal risks are well mitigated and that the controls meet legal standards. It also analyzes and drafts contracts for operations carried out by the different business units.
With respect to the legal situation of each subsidiary the legal division ensures that the respective contingencies allowances have been appropriately created whenever required. Grupo Aval has assessed the relevant claims filed against it, based on the analysis and criteria of the lawyers in charge.
198
Regarding copyrights, Grupo Aval and each of its subsidiaries only uses software or licenses that have been legally acquired and only allows officially licensed software to be used on its computers.
Details of the litigation filed against Grupo Aval are disclosed in Note 23 and 27 to our audited consolidated financial statements.
Conglomerate Risk
As of December 31, 2022, Aval Financial Conglomerate includes 29 Colombian and foreign entities that undertake activities under the supervision of the Superintendency of Finance (SFC).
Grupo Aval S.A., as holding company defined by the Superintendency of Finance, approved the Risk Management Framework (MGR) in its board of directors, and through the Risk Committee, studied and approved the MGR and the Early Warning System methodology and procedure for the implementation.
To develop the guidelines established in the Risk Management Framework Policy of the Aval Financial Conglomerate, through MGR’s methodology, the aspects that the Financial Holding must consider for risks management of Financial Conglomerate’s risks are:
| 1. | Contagion Risk: (Also sometimes referred as Systemic Risk) Risk that result from the deterioration of the financial conditions of one or more of the entities belonging to a financial conglomerate, the stability of this or any of its entities will be compromised, or that of the financial system. |
To assess this risk, Grupo Aval Risk managemet´s unit, considers the relationships and exposures between entities of the conglomerate, and between these and their related entities or affiliates. Once those relationships are considered, through subject matter expert criteria and correlation analysis, it considers if also due to market perception and/or the potential materialization of reputational risk, those related entities can be affected by potential contagion. This type of risk defined broadly as: “risk arising from negative perception on the part of customers, counterparties, shareholders, investors, debt-holders, market analysts, other relevant parties or regulators that can adversely affect a bank’s ability to maintain existing, or establish new, business relationships and continued access to sources of funding”-Basel definition. This risk is understood by local regulators as the possibility of loss incurred by a financial conglomerate’s entity due to dispute, bad image, negative publicity, true or not, with respect to the same institution or its business practices, which causes loss of customers or decrease in income.
The materiality of the risk will depend, among other factors, on the amount, type and frequency of interconnections that entities of the financial conglomerate have and those with which they relate.
| 2. | Strategic risk: this risk arises from the inadequate consideration of risks in the strategic planning process of the Financial Holding and its implementation, as well as the impossibility of adapting to changes or the development of the economies and markets where the financial conglomerate operates. |
This risk can also arise when the Financial Conglomerate ventures into new markets.
Grupo Aval as the Financial Holding of the Aval Financial Conglomerate, if required, will establish additional corporate governance policies that allow to identify circumstances that lead to materialization of this risk and mechanisms that allow its mitigation.
| 3. | Concentration risk: Corresponds to the risk that an exposure to a single counterparty can: (i) generate losses that compromise the stability and financial position of the financial conglomerate, or (ii) disturbs the normal development of its business; or (iii) generate a material change in the risk profile of the financial conglomerate. |
As part of the management of concentration risk in the financial conglomerate, Grupo Aval analyzes risk factors such as lines of business, geographical location, economic sector, and counterparties. Additionally, the concentration of service providers, shared service centers and the eventual occurrence of natural disasters are analyzed.
The Financial Holding has an organizational structure that promotes and facilitates the risk management of the financial conglomerate, while recognizing the organizational structure and the legal and governance autonomy of the entities that belong to the financial conglomerate.
Grupo Aval, with the support of Risk Committee, monitors Risk Management Framework, Risk Appetite Framework of the Financial Holding, and the Financial Conglomerate’s Risk Profile to communicate in a timely manner to the board of directors about possible deviations from risk levels established and issue recommendations to take corrective actions and/or to modify policies when it is necessary.
199
As of December 31, 2022, financial conglomerate's risks management function was carried out in accordance with the defined policies, procedures, and methodologies.
ITEM 12. DESCRIPTION OF SECURITIES OTHER THAN EQUITY SECURITIES
A. Debt securities
Not applicable.
B. Warrants and rights
Not applicable.
C. Other securities
Not applicable.
D. American depositary shares
Fees and Expenses
The depositary may charge each person to whom ADSs are issued, including, without limitation, issuances against deposits of preferred shares, issuances in respect of preferred share distributions, rights and other distributions, issuances pursuant to a share dividend or share split declared by us or issuances pursuant to a merger, exchange of securities or any other transaction or event affecting the ADSs or deposited securities, and each person surrendering ADSs for withdrawal of deposited securities in any manner permitted by the deposit agreement or whose ADRs are cancelled or reduced for any other reason, up to U.S.$5.00 for each 100 ADSs (or any portion thereof) issued, delivered, reduced, cancelled or surrendered, as the case may be. The depositary may sell (by public or private sale) sufficient securities and property received in respect of a preferred share distribution, rights and/or other distribution prior to such deposit to pay such charge.
The following additional charges will be incurred by the ADR holders, by any party depositing or withdrawing preferred shares or by any party surrendering ADSs or to whom ADSs are issued (including, without limitation, issuances pursuant to a share dividend or share split declared by our company or an exchange of securities regarding the ADRs or the deposited securities or a distribution of ADSs), whichever is applicable:
| ● | a fee of U.S.$0.05 or less per ADS for any cash distribution made pursuant to the deposit agreement; |
| ● | a fee of U.S.$1.50 per ADR or ADRs for transfers of ADRs; |
| ● | a fee for the distribution of securities (or the sale of securities in connection with a distribution), such fee being in an amount equal to the fee for the execution and delivery of ADSs that would have been charged as a result of the deposit of such securities (treating all such securities as if they were preferred shares) but which securities or the net cash proceeds from the sale thereof are instead distributed by the depositary to those holders entitled thereto; |
| ● | an aggregate fee of U.S.$0.05 per ADS per calendar year (or portion thereof) for services performed by the depositary in administering our ADR program (which fee may be charged on a periodic basis during each calendar year and shall be assessed against holders as of the record date or record dates set by the depositary during each calendar year and will be payable at the sole discretion of the depositary by billing such holders or by deducting such charge from one or more cash dividends or other cash distributions); |
| ● | any other charge payable by any of the depositary, any of the depositary’s agents, including, without limitation, the custodian, or the agents of the depositary’s agents in connection with the servicing of our preferred shares or other deposited securities (which charge will be assessed against registered holders of our ADRs as of the record date or dates set by the depositary and will be payable at the sole discretion of the depositary by billing such registered holders or by deducting such charge from one or more cash dividends or other cash distributions); |
| ● | stock transfer or other taxes and other governmental charges; |
| ● | cable, telex and facsimile transmission and delivery charges incurred at your request in connection with the deposit or delivery of shares; |
200
| ● | transfer or registration fees for the registration of transfer of deposited securities on any applicable register in connection with the deposit or withdrawal of deposited securities; |
| ● | expenses of the depositary in connection with the conversion of foreign currency into U.S. dollars; and |
| ● | such fees and expenses as are incurred by the depositary (including without limitation expenses incurred in connection with compliance with foreign exchange control regulations or any law or regulation relating to foreign investment) in delivery of deposited securities or otherwise in connection with the depositary’s or its custodian’s compliance with applicable laws, rules or regulations. |
We will pay all other charges and expenses of the depositary and any agent of the depositary (except the custodian) pursuant to agreements from time to time between us and the depositary. The charges described above may be amended from time to time.
Direct and indirect payments
Our depositary has agreed to reimburse us for certain expenses we incur that are related to the establishment and maintenance of the ADR program upon such terms and conditions as we and the depositary may agree from time to time. The depositary may make available to us a set amount or a portion of the depositary fees charged in respect of the ADR program or otherwise upon such terms and conditions as we and the depositary may agree from time to time.
The depositary collects fees for making distributions to investors by deducting those fees from the amounts distributed or by selling a portion of distributable property to pay the fees. The depositary may collect its annual fee for depositary services by deduction from cash distributions, by directly billing investors or by charging the book-entry system accounts of participants acting for them. The depositary will generally set off the amounts owing from distributions made to holders of ADSs. If, however, no distribution exists and payment owing is not timely received by the depositary, the depositary may refuse to provide any further services to holders that have not paid those fees and expenses owing until such fees and expenses have been paid. At the discretion of the depositary, all fees and charges owing under the deposit agreement are due in advance and/or when declared owing by the depositary. The depositary may generally refuse to provide services to any holder until the fees and expenses owing by such holder for those services or otherwise are paid.
For the year ended December 31, 2022 we received U.S.$0.93 million in payments from J.P. Morgan Chase Bank, N.A. as depositary of the ADR program.
201
PART II
ITEM 13. DEFAULTS, DIVIDEND ARREARAGES AND DELINQUENCIES
A. Defaults
No matters to report.
B. Arrears and delinquencies
No matters to report.
ITEM 14. MATERIAL MODIFICATIONS TO THE RIGHTS OF SECURITY HOLDERS AND USE OF PROCEEDS
A. Material modifications to instruments
Not applicable.
B. Material modifications to rights
Not applicable.
C. Withdrawal or substitution of assets
Not applicable.
D. Change in trustees or paying agents
Not applicable.
E. Use of proceeds
Not applicable.
ITEM 15. CONTROLS AND PROCEDURES
A. Disclosure controls and procedures
As of December 31, 2022, under the supervision and with the participation of our management, including our President and Chief Financial Officer, we performed an evaluation of the effectiveness of the design and operation of our disclosure controls and procedures (as defined in Rule 13a-15(e) under the Exchange Act). There are inherent limitations to the effectiveness of any disclosure controls and procedures system, including the possibility of human error and circumventing or overriding them. Even if effective, disclosure controls and procedures can provide only reasonable assurance of achieving their control objectives.
Based on such evaluation, our President and Chief Financial Officer concluded that our disclosure controls and procedures are effective to provide reasonable assurance that the information we are required to disclose in the reports we file or submit under the Exchange Act is (i) recorded, processed, summarized and reported within the time periods specified in the SEC’s rules and forms and (ii) accumulated and communicated to our management to allow timely decisions regarding required disclosures.
B. Management’s annual report on internal control over financial reporting
Our management is responsible for establishing and maintaining an adequate internal control over financial reporting as defined in Rule 13a-15(f) under the Exchange Act.
Our internal control over financial reporting is a process designed by, or under the supervision of, our principal executive and principal financial officers, management and other personnel, to provide reasonable assurance regarding the reliability of financial reporting and the preparation of our financial statements for external reporting purposes, in accordance with generally accepted accounting principles. These include those policies and procedures that:
202
| 1. | Pertain to the maintenance of records that, in reasonable detail, accurately and fairly reflect transactions and dispositions of our assets; |
| 2. | Provide reasonable assurance that transactions are recorded as necessary to permit preparation of financial statements, in accordance with generally accepted accounting principles, and that receipts and expenditures are being made only in accordance with authorization of our management and directors; and |
| 3. | Provide reasonable assurance regarding prevention or timely detection of unauthorized acquisition, use or disposition of our assets that could have a material effect on our financial statements. |
Because of its inherent limitations, internal control over financial reporting may not prevent or detect misstatements. Therefore, effective control over financial reporting cannot, and does not, provide absolute assurance of achieving our control objectives. Also, projections of, and any evaluation of effectiveness of the internal controls in future periods are subject to the risk that controls may become inadequate because of changes in conditions, or that the degree of compliance with the policies or procedures may deteriorate.
We have adapted our internal control over financial reporting based on the guidelines set by the Internal Control – Integrated Framework of the Committee of Sponsoring Organizations of the Treadway Commission (“COSO”).
Under the supervision and with the participation of our management, including our President, our Chief Financial Officer, our Chief Risk Officer and our Chief of Internal Control, we conducted an evaluation of the effectiveness of our internal control over financial reporting as of December 31, 2022, based on the guidelines set forth by the COSO 2013.
Based on this assessment, management believes that, as of December 31, 2022, its internal control over financial reporting was effective.
C. Attestation report of the registered public accounting firm
The effectiveness of the internal control over financial reporting, as of December 31, 2022, has been audited by KPMG, an independent registered public accounting firm. KPMG’s Report of Independent Registered Public Accountant Firm appears on page F-2.
D. Changes in internal control over financial reporting
There was no significant change in our internal control over financial reporting that occurred during the period covered by this annual report that has materially affected, or is reasonably likely to materially affect, our internal control over financial reporting.
ITEM 16. [RESERVED]
ITEM 16A. Audit committee financial expert
The Board of Directors has determined that Fabio Castellanos Ordóñez is an audit committee financial expert. All members of our audit committee, namely Esther América Paz Montoya, Álvaro Velásquez Cock and Fabio Castellanos Ordóñez, are independent audit committee members under the standards of the New York Stock Exchange, which applies the audit committee independence requirements of the Securities and Exchange Commission.
ITEM 16B. Code of ethics
New York Stock Exchange rules for U.S. companies require that listed companies adopt and disclose a code of business conduct and ethics for directors, officers and employees, and promptly disclose any waivers of the code for directors or executive officers. We have in place a code of ethics that applies to the Company’s officers and employees, which is available on Grupo Aval’s website (www.grupoaval.com).
ITEM 16C. Principal accountant fees and services
Amounts billed by KPMG for audit and other services were as follows:
| 2022 |
| 2021 | |
(In Ps millions) | ||||
Audit fees |
| 32,508 |
| 36,324 |
Audit-related fees |
| — |
| — |
Tax fees |
| 56 |
| 17 |
All other fees paid |
| — |
| — |
203
The aggregate fees billed under the caption audit fees for professional services rendered to Grupo Aval for the audit of its financial statements and for services that are normally provided to Grupo Aval, in connection with statutory or regulatory filings or engagements totaled Ps 32,508 million and Ps 36,324 million for the years 2022 and 2021, respectively.
Additionally, tax fees paid, which include other consultancy fees different from audit and audit-related fees, totaled Ps 56 million and Ps 17 million for the years ended 2022 and 2021, respectively.
The services commissioned from our auditors meet the independence requirements stipulated by the Board of Accountants (Junta Central de Contadores) and by SEC rules and regulations, and they did not involve the performance of any work that is incompatible with the audit function.
If we are required to engage an auditing firm for audit and audit-related services, those services have to be pre-approved by the Audit Committee.
The Audit Committee is regularly informed of all fees paid to the auditing firms by us.
ITEM 16D. Exemptions from the listing standards for audit committees
All of the members of our audit committee satisfy the independence requirements of the NYSE applicable to foreign private issuers.
ITEM 16E. Purchases of equity securities by the issuer and affiliated purchasers
Grupo Aval may repurchase its shares only with retained earnings. On the other hand, Colombian law prohibits the repurchase of shares of entities under the comprehensive supervision of, and subject to inspection and surveillance as financial institutions by, the Superintendency of Finance. As such, Banco de Bogotá, Banco de Occidente, Banco Popular, Banco AV Villas, Corficolombiana and Porvenir and their respective financial subsidiaries are not permitted to repurchase their shares or Grupo Aval’s shares.
The following table presents the number of our preferred shares approved for purchase by us or by “affiliated purchasers” (as that term is defined in Rule 10b-18(a)(3) under the Securities Exchange Act of 1934, as amended):
|
|
|
| |||||
Total Number of Shares | Maximum Number of | |||||||
Purchased as Part of | Shares that May Yet be | |||||||
Total Number of Shares | Average Price Paid per | Publicly Announced Plans | Purchased Under the Plans or | |||||
Period | Purchased | Share | or Programs | Programs | ||||
January, 2022 |
| — | — | — | 98,275,999 | |||
February, 2022 |
| — | — | — | 98,275,999 | |||
March, 2022 |
| — | — | — | — | |||
April, 2022 |
| — | — | — | — | |||
May, 2022 |
| — | — | — | 712,304,273 | |||
June, 2022 |
| — | — | — | 712,304,273 | |||
July, 2022 |
| — | — | — | 712,304,273 | |||
August, 2022 |
| — | — | — | 712,304,273 | |||
September, 2022 |
| — | — | — | 712,304,273 | |||
October, 2022 |
| — | — | — | 712,304,273 | |||
November, 2022 |
| 9,631,300 | 550 | 9,631,300 | 702,672,973 | |||
December, 2022 | 17,995,000 | 547 | 17,995,000 | 684,677,973 |
ITEM 16F. Change in registrant’s certifying accountant
Not applicable.
ITEM 16G. Corporate governance
Grupo Aval, as a listed company that qualifies as a foreign private issuer under the NYSE listing standards in accordance with the NYSE corporate governance rules, is permitted to follow home-country practice in some circumstances in lieu of the provisions of the corporate governance rules contained in Section 303A of the NYSE Listed Company Manual that are applicable to U.S. companies. We follow corporate governance practices applicable to Colombian companies and those described in our Corporate Governance Code, which in turn
204
follow Colombian corporate governance rules. The Corporate Governance Code is available at Grupo Aval’s website at www.grupoaval.com. Information on our website is not incorporated into this annual report.
The following is a summary of the significant differences between the corporate governance practices followed by Grupo Aval and those applicable to domestic issuers under the NYSE listing standards.
Independence of directors
See “Item 6. Directors, Senior Management and Employees—C. Board practices— Principal differences between Colombian and U.S. corporate governance practices—Independence of directors”.
Non-executive director meetings
See “Item 6. Directors, senior management and employees—C. Board practices— Principal differences between Colombian and U.S. corporate governance practices—Non-executive director meetings”.
Committees of the Board of Directors
See “Item 6. Directors, senior management and employees—C. Board practices— Principal differences between Colombian and U.S. corporate governance practices—Committees of the Board of Directors”.
Shareholder approval of equity compensation plans
Under NYSE listing standards, shareholders of U.S. companies must be given the opportunity to vote on all equity compensation plans and to approve material revisions to those plans, with limited exceptions set forth in the NYSE rules. Grupo Aval and its subsidiaries currently have no equity compensation plans. Under Colombian law, shareholder approval is required for the compensation of members of the Board of Directors.
Shareholder approval of dividends
While NYSE corporate governance standards for U.S. companies do not require listed companies to have shareholders approve or declare dividends, in accordance with the Colombian Code of Commerce, all dividends must be approved by Grupo Aval’s shareholders.
Corporate governance guidelines
NYSE rules for U.S. companies require that listed companies adopt and disclose corporate governance guidelines. The Superintendency of Finance recommends, but does not require, that listed companies adopt corporate governance guidelines; instead, it requires an annual corporate governance survey that compares a company’s corporate governance practices to those recommended by the Superintendency of Finance, and mandates periodic disclosure thereof to the Colombian securities market information system. The annual corporate governance survey is available at Grupo Aval’s website at www.grupoaval.com.
Code of business conduct and ethics
See “Item 16B. Code of Ethics.”
Compliance with corporate governance rules
NYSE rules require the chief executive officer to certify annually that such officer is not aware of any non-compliance with NYSE corporate governance rules, and executive officers are required to promptly notify the NYSE of any material non-compliance. Companies must also submit a written affirmation annually or promptly upon the occurrence of certain changes in corporate governance. No similar requirements exist under Colombian law.
205
Internal audit function
NYSE rules for U.S. companies require that listed companies maintain an internal audit function to provide management and the audit committee with ongoing assessments of the company’s risk management processes and system of internal control. Grupo Aval maintains an internal auditor, and a Chief of Internal Control to coordinate this function at the corporate level.
ITEM 16H. Mine safety disclosure
Not applicable.
ITEM 16I. Disclosure Regarding Foreign Jurisdictions that Prevent Inspections
Not Applicable
206
PART III
ITEM 17. Financial statements
We have responded to Item 18 in lieu of this item.
ITEM 18. Financial statements
Financial Statements are filed as part of this annual report, see page F-1.
ITEM 19. Exhibits
1.1 |
| |
|
|
|
2.1 |
| |
2.2 | ||
2.3 | ||
2.4 | ||
|
|
|
8.1 |
| |
|
|
|
12.1 |
| Certification pursuant to section 302 of the Sarbanes-Oxley Act of 2002. |
|
|
|
12.2 |
| Certification pursuant to section 302 of the Sarbanes-Oxley Act of 2002. |
|
|
|
13.1 |
| |
|
|
|
13.2 |
| |
|
|
|
101.INS |
| Inline XBRL Instance Document |
|
|
|
101.SCH |
| Inline XBRL Taxonomy Extension Schema Document |
|
|
|
101.CAL |
| Inline XBRL Taxonomy Extension Calculation Linkbase Document |
|
|
|
101.LAB |
| Inline XBRL Taxonomy Extension Label Linkbase Document |
|
|
|
101.PRE |
| Inline XBRL Taxonomy Extension Presentation Linkbase Document |
|
|
|
101.DEF 104. |
| Inline XBRL Taxonomy Extension Definition Linkbase Document Inline XBRL Cover Page Interactive Data File (embedded within the Inline XBRL document). |
We will furnish to the SEC, upon request, copies of any unfiled instruments that define the rights of holders of long-term debt of Grupo Aval.
207
INDEX TO CONSOLIDATED FINANCIAL STATEMENTS
|
| Page |
Audited consolidated financial statements of Grupo Aval Acciones y Valores S.A. and its subsidiaries as of December 31, 2022, and 2021 and for each of the years ended December 31, 2022, 2021 and 2020 |
| |
Report of independent registered public accounting firm (PCAOB ID | F-2 | |
Consolidated statements of financial position as of December 31, 2022, and 2021 | F-5 | |
Consolidated statements of income for the years ended as of December 31, 2022, 2021 and 2020 | F-7 | |
F-8 | ||
Consolidated statements of changes in equity for the years ended December 31, 2022, 2021 and 2020 | F-9 | |
Consolidated statements of cash flow for the years ended December 31, 2022, 2021 and 2020 | F-10 | |
F-12 |
F-1
Report of Independent Registered Public Accounting Firm
To the Stockholders and Board of Directors
Grupo Aval Acciones y Valores S.A.:
Opinions on the Consolidated Financial Statements and Internal Control Over Financial Reporting
We have audited the accompanying consolidated statements of financial position of Grupo Aval Acciones y Valores S.A. and subsidiaries (Grupo Aval) as of December 31, 2022 and 2021, the related consolidated statements of income, other comprehensive income, changes in equity, and cash flows for each of the years in the three-year period ended December 31, 2022, and the related notes (collectively, the consolidated financial statements). We also have audited Grupo Aval’s internal control over financial reporting as of December 31, 2022, based on criteria established in Internal Control – Integrated Framework (2013) issued by the Committee of Sponsoring Organizations of the Treadway Commission.
In our opinion, the consolidated financial statements referred to above present fairly, in all material respects, the financial position of Grupo Aval as of December 31, 2022 and 2021, and the results of its operations and its cash flows for each of the years in the three-year period ended December 31, 2022, in conformity with International Financial Reporting Standards (IFRS) as issued by the International Accounting Standards Board. Also in our opinion, Grupo Aval maintained, in all material respects, effective internal control over financial reporting as of December 31, 2022 based on criteria established in Internal Control – Integrated Framework (2013) issued by the Committee of Sponsoring Organizations of the Treadway Commission.
Basis for Opinions
Grupo Aval’s management is responsible for these consolidated financial statements, for maintaining effective internal control over financial reporting, and for its assessment of the effectiveness of internal control over financial reporting, included in the accompanying “Management’s annual report on internal control over financial reporting”. Our responsibility is to express an opinion on Grupo Aval’s consolidated financial statements and an opinion on Grupo Aval’s internal control over financial reporting based on our audits. We are a public accounting firm registered with the Public Company Accounting Oversight Board (United States) (PCAOB) and are required to be independent with respect to Grupo Aval in accordance with the U.S. federal securities laws and the applicable rules and regulations of the Securities and Exchange Commission and the PCAOB.
We conducted our audits in accordance with the standards of the PCAOB. Those standards require that we plan and perform the audits to obtain reasonable assurance about whether the consolidated financial statements are free of material misstatement, whether due to error or fraud, and whether effective internal control over financial reporting was maintained in all material respects.
Our audits of the consolidated financial statements included performing procedures to assess the risks of material misstatement of the consolidated financial statements, whether due to error or fraud, and performing procedures that respond to those risks. Such procedures included examining, on a test basis, evidence regarding the amounts and disclosures in the consolidated financial statements. Our audits also included evaluating the accounting principles used and significant estimates made by management, as well as evaluating the overall presentation of the consolidated financial statements. Our audit of internal control over financial reporting included obtaining an understanding of internal control over financial reporting, assessing the risk that a material weakness exists, and testing and evaluating the design and operating effectiveness of internal control based on the assessed risk. Our audits also included performing such other procedures as we considered necessary in the circumstances. We believe that our audits provide a reasonable basis for our opinions.
Definition and Limitations of Internal Control Over Financial Reporting
A company’s internal control over financial reporting is a process designed to provide reasonable assurance regarding the reliability of financial reporting and the preparation of financial statements for external purposes in accordance with generally accepted accounting principles. A company’s internal control over financial reporting includes those policies and procedures that (1) pertain to the maintenance of records that, in reasonable detail, accurately and fairly reflect the transactions and dispositions of the assets of the company; (2) provide reasonable assurance that transactions are recorded as necessary to permit preparation of financial statements in accordance with generally accepted accounting principles, and that receipts and expenditures of the company are being made only in accordance with authorizations of management and directors of the company; and (3) provide reasonable assurance regarding prevention or timely detection of unauthorized acquisition, use, or disposition of the company’s assets that could have a material effect on the financial statements.
F-2
Because of its inherent limitations, internal control over financial reporting may not prevent or detect misstatements. Also, projections of any evaluation of effectiveness to future periods are subject to the risk that controls may become inadequate because of changes in conditions, or that the degree of compliance with the policies or procedures may deteriorate.
Critical Audit Matters
The critical audit matters communicated below are matters arising from the current period audit of the consolidated financial statements that were communicated or required to be communicated to the audit committee and that: (1) relate to accounts or disclosures that are material to the consolidated financial statements and (2) involved our especially challenging, subjective, or complex judgments. The communication of critical audit matters does not alter in any way our opinion on the consolidated financial statements, taken as a whole, and we are not, by communicating the critical audit matters below, providing separate opinions on the critical audit matters or on the accounts or disclosures to which they relate.
| (i) | Assessment of the loss allowance on the loan portfolio |
As discussed in Notes 4.1.5 and 11 to the consolidated financial statements, Grupo Aval’s loss allowance for its loan portfolio was 9,197,514 million of Colombian pesos as of December 31, 2022. The Group measures the loss allowance for its loan portfolio at an amount equal to lifetime Expected Credit Losses (ECL), except for those loans that have not experienced a Significant Increase in Credit Risk (SICR) since their initial recognition for which Grupo Aval calculates a twelve-month ECL. The loss allowance for the loan portfolio reflects a probability weighted outcome that considers multiple economic scenarios based on forecasts of future economic conditions and is determined as a function of Grupo Aval’s estimate of the Probability of Default (PD), Loss Given Default (LGD) and Exposure at Default (EAD) of each loan. Grupo Aval uses complex models which incorporate inputs and assumptions that require knowledge of the market and experience in the industry.
We identified the assessment of the loss allowance for the loan portfolio as a critical audit matter. Significant auditor judgment was required because there is a high degree of measurement uncertainty due to significant judgments inherent to the methodology, including judgments on forward-looking information. Assessment of the loss allowance on the loan portfolio required significant auditor attention and complex auditor judgment as well as specialized skills and industry knowledge.
The following are the primary procedures we performed to address this critical audit matter. We evaluated the design and tested the operating effectiveness of certain internal controls related to Grupo Aval’s process for calculating the loss allowance for loans. This included controls related to: (i) the models and assumptions used; (ii) the economic forecasting; (iii) the completeness and accuracy of data; and (iv) the review of the overall allowance for impairment losses, including the application of judgment applied by Grupo Aval’s credit expert. We involved credit risk professionals with specialized skills and knowledge who assisted in: (i) evaluating the models and key inputs used in determining PD, LGD and EAD parameters; (ii) evaluating the forecasts of macroeconomic variables and the probability weighting of scenarios; (iii) assessing the qualitative adjustments applied to the loss allowance for loans; (iv) for a sample of individually significant loans, checking the accuracy of the impairment calculation and analyzing the values of the guarantees; and (v) for a sample of individually significant loans, assessing the credit risk rating assigned by Grupo Aval.
| (ii) | Assessment of the revenue recognized from concession arrangements in the construction phase and the fair value of financial assets related to concession arrangements. |
As discussed in Notes 2.20, 5 and 16 to the consolidated financial statements Grupo Aval has
3,507,231 million of Colombian pesos of financial assets arising from concession contracts which are measured at fair value and classified as level 3 and 7,329,700 million of Colombian pesos of intangible assets derived from concession contracts in the construction phase as of December 31, 2022. Grupo Aval is party to concession arrangements with the government for the construction and subsequent maintenance of infrastructure, for a given period of time. In exchange Grupo Aval is entitled to receive direct payments from the government and / or fees charged to the end users of the infrastructure. During the construction phase Grupo Aval recognizes revenue and a financial asset for payments that are unconditionally guaranteed, and / or an intangible asset for payments which are linked to the use of the infrastructure. Performance obligations related to the construction services are satisfied over time and the amount of revenue recognized is dependent on the stage of completion of the construction services and the fair value of the asset being recognized. Grupo Aval has designated some of the financial assets related to concession arrangements to be measured at fair value through profit or loss subsequent to initial recognition.
We identified the assessment of the revenue recognized from concession arrangements in the construction phase and the fair value of financial assets related to concession arrangements as a critical audit matter. It involved significant auditor judgment and audit effort, including the involvement of valuation professionals with specialized skills and knowledge. For contracts in the construction phase, auditor judgment was required to assess the estimated costs to completion and to evaluate the models developed by Grupo Aval to estimate the fair value at recognition of the financial and intangible assets as well as the significant unobservable inputs and assumptions to these models. For financial assets related to concession arrangements subsequently measured at fair value through profit or loss, auditor judgment was required to evaluate the models developed by Grupo Aval to estimate their fair value as well as the significant unobservable inputs and assumptions to these models. The significant unobservable inputs and assumptions to the
F-3
models include the weighted average cost of capital (WACC), the future inflation rates and the projected income from the use of the infrastructure.
The following are the primary procedures we performed to address this critical audit matter. We evaluated the design and tested the operating effectiveness of certain internal controls related to Grupo Aval’s process to determine the fair value of financial assets arising from concession contracts and the revenue to be recognized from contracts in the construction phase. This included controls related to: (i) the review of the inputs and assumptions used; (ii) the review of the estimation of costs to completion; and (iii) the review and approval of the fair value of the assets and the amount of revenue to be recognized. We involved valuation professionals with specialized skills and knowledge who assisted in: (i) assessing whether the internally developed models are consistent with valuation practices generally used for that purpose and IFRS; (ii) comparing the WACC to a range determined using market-verified macroeconomic assumptions; (iii) evaluating the future inflation rates by comparing to available market data; (iv) assessing estimated costs to completion including the assumptions used; (v) evaluating the projected income from the use of the infrastructure by comparing to internal and external data, where available; and (vi) evaluating Grupo Aval´s ability to accurately forecast inflation and construction costs, by comparing a selection of previously estimated values to the actual values realized
/s/ KPMG S.A.S. | |
We have served as Grupo Aval’s auditor since 1985 | |
April 13, 2023
F-4
Grupo Aval Acciones y Valores S.A.
Consolidated Statement of Financial Position
As of December 31, 2022 and 2021
(Amounts expressed in millions of Colombian pesos)
|
| |||||||
Notes | 2022 | 2021 | ||||||
Assets |
|
|
|
|
|
| ||
Cash and cash equivalents |
| 6, 7 |
| Ps. | |
| Ps. | |
Trading assets |
| 6, 8 |
| |
| | ||
Investment securities |
| 6, 9 |
| |
| | ||
Hedging derivative assets |
| 6, 10 |
| |
| | ||
Loans: |
| 4.1, 6, 11 |
|
| ||||
Commercial |
|
|
| |
| | ||
Consumer |
|
|
| |
| | ||
Mortgages |
|
|
| |
| | ||
Microcredit |
|
|
| |
| | ||
| |
| | |||||
Loss allowance |
| 4.1.5 |
| ( |
| ( | ||
Total loans, net |
|
|
| |
| | ||
Other accounts receivable, net |
| 6, 12 |
| |
| | ||
Non-current assets held for sale |
| 13 |
| |
| | ||
Investments in associates and joint ventures |
| 14 |
| |
| | ||
Tangible assets: |
| 15 |
|
|
|
| ||
Property, plant and equipment for own-use and given in operating lease, net |
|
|
| |
| | ||
Right-of-use assets | | | ||||||
Investment properties |
|
|
| |
| | ||
Biological assets |
|
|
| |
| | ||
| |
| | |||||
Intangibles |
|
|
|
|
|
| ||
Concession arrangement rights |
| 16 |
| |
| | ||
Goodwill |
| 17 |
| |
| | ||
Other intangible assets |
| 18 |
| |
| | ||
| |
| | |||||
Income tax assets: |
| 19 |
|
|
|
| ||
Current |
|
|
| |
| | ||
Deferred |
|
|
| |
| | ||
| |
| | |||||
Other assets |
|
|
| |
| | ||
Total assets |
|
|
| Ps. | |
| Ps. | |
The accompanying notes are an integral part of these Consolidated Financial Statements
F-5
Grupo Aval Acciones y Valores S.A.
Consolidated Statement of Financial Position, continued
As of December 31, 2022 and 2021
(Amounts expressed in millions of Colombian pesos)
|
| |||||||
Notes | 2022 | 2021 | ||||||
Liabilities and equity |
|
|
|
|
|
| ||
Liabilities |
|
|
|
|
|
| ||
Trading liabilities |
| 6, 8 |
| Ps. | |
| Ps. | |
Hedging derivative liabilities |
| 6, 10 |
| |
| | ||
Customer deposits: |
| 20 |
|
|
|
| ||
Checking accounts |
|
|
| |
| | ||
Savings accounts |
|
|
| |
| | ||
Time deposits |
|
|
| |
| | ||
Other |
|
|
| |
| | ||
| |
| | |||||
Financial obligations: |
| 21 |
|
|
| |||
Interbank borrowings and overnight funds |
|
|
| |
| | ||
Borrowings from banks and others |
|
|
| |
| | ||
Bonds issued |
|
|
| |
| | ||
Borrowings from development entities |
|
|
| |
| | ||
| |
| | |||||
Provisions: |
| 23 |
|
|
| |||
Legal related |
|
|
| |
| | ||
Non legal related |
|
|
| |
| | ||
| |
| | |||||
Income tax liabilities: |
| 19 |
|
|
| |||
Current |
|
|
| |
| | ||
Deferred |
|
|
| |
| | ||
| |
| | |||||
Employee benefits |
| 22 |
| |
| | ||
Other liabilities |
| 24 |
| |
| | ||
Total liabilities |
|
|
| |
| | ||
Equity |
|
|
|
|
| |||
Owners of the parent: |
| 25 |
|
|
| |||
Subscribed and paid-in capital |
|
|
| |
| | ||
Additional paid-in capital |
|
|
| |
| | ||
Retained earnings |
|
|
| |
| | ||
Other comprehensive income |
|
|
| ( |
| | ||
Equity attributable to owners of the parent |
|
| |
| | |||
Non-controlling interests |
| 26 |
| |
| | ||
Total equity |
|
|
| |
| | ||
Total liabilities and equity |
|
|
| Ps. | |
| Ps. | |
The accompanying notes are an integral part of these Consolidated Financial Statements
F-6
Grupo Aval Acciones y Valores S.A.
Consolidated Statement of Income
For the years ended December 31, 2022, 2021 and 2020
(Amounts expressed in millions of Colombian pesos)
For the years ended | |||||||||||
Continuing operations | Notes | 2022 | 2021 (1) | 2020 (1) | |||||||
Interest income calculated using the effective interest method |
|
|
|
|
|
|
|
| |||
Loan portfolio |
| 11 |
| Ps. | |
| Ps. | |
| Ps. | |
Investments in debt securities |
|
| |
| |
| | ||||
Total interest income |
|
| |
| |
| | ||||
Interest expense |
|
|
|
|
|
| |||||
Deposits |
|
|
|
|
|
| |||||
Checking accounts |
|
| ( |
| ( |
| ( | ||||
Savings accounts |
|
| ( |
| ( |
| ( | ||||
Time deposits |
|
| ( |
| ( |
| ( | ||||
| ( |
| ( |
| ( | ||||||
Financial obligations |
|
|
|
|
|
|
| ||||
Interbank borrowings and overnight funds |
|
| ( |
| ( |
| ( | ||||
Borrowings from banks and others |
|
| ( |
| ( |
| ( | ||||
Bonds issued |
|
| ( |
| ( |
| ( | ||||
Borrowing from development entities |
|
| ( |
| ( |
| ( | ||||
| ( |
| ( |
| ( | ||||||
Net interest income |
|
| |
| |
| | ||||
Impairment (losses) recoveries on financial assets |
|
|
|
|
|
|
| ||||
Loans and other accounts receivable |
|
| ( |
| ( |
| ( | ||||
Other financial assets |
|
| ( |
| ( |
| ( | ||||
Recovery of charged-off financial assets |
|
| |
| |
| | ||||
Net impairment loss on financial assets |
|
| ( |
| ( |
| ( | ||||
Net interest income, after impairment losses |
|
| |
| |
| | ||||
Income from commissions and fees |
|
| |
| |
| | ||||
Expenses from commissions and fees |
|
| ( |
| ( |
| ( | ||||
Net income from commissions and fees |
| 28 |
| |
| |
| | |||
Income from sales of goods and services |
|
| |
| |
| | ||||
Costs and expenses of sales goods and services |
|
| ( |
| ( |
| ( | ||||
Gross profit from sales of goods and services |
| 28 |
| |
| |
| | |||
Net trading income |
| 29 |
| |
| |
| | |||
Net income from other financial instruments mandatorily at fair value through profit or loss |
| 16 |
| |
| |
| | |||
Other income |
| 30 |
| ( |
| |
| | |||
Other expenses |
| 30 |
| ( |
| ( |
| ( | |||
Net income before tax expense |
|
|
| |
| |
| | |||
Income tax expense |
| 19 |
| ( |
| ( |
| ( | |||
Net income from continuing operations |
|
|
| Ps. | |
| Ps. | |
| Ps. | |
Net income from discontinued operations, net of tax | 1.1 | | | | |||||||
Net income for the year | Ps. | | Ps. | | Ps. | | |||||
Net income attributable to owners of the parent | |||||||||||
Net income for the period from continuing operations | | | | ||||||||
Net income for the period from discontinued operations, net of tax | 1.1 | | | | |||||||
Owners of the parent | 25 | Ps. | |
| Ps. | |
| Ps. | | ||
Net income attributable to non-controlling interests | |||||||||||
Net income for the period from continuing operations | | | | ||||||||
Net income for the period from discontinued operations, net of tax | 1.1 | | | | |||||||
Non-controlling interests | 26 | Ps. | |
| Ps. | |
| Ps. | | ||
Net income for the year | Ps. | | Ps. | | Ps. | | |||||
Net income per share basic and diluted (in Colombian pesos, see note 25) |
| |
| | |||||||
(1) Comparative information has been re-presented due to a discontinued operation disclosed in Note 1.1.
The accompanying notes are an integral part of these Consolidated Financial Statements
F-7
Grupo Aval Acciones y Valores S.A.
Consolidated Statement of Other Comprehensive Income
For the years ended December 31, 2022, 2021 and 2020
(Amounts expressed in millions of Colombian pesos)
| For the years ended | ||||||||||
Notes | 2022 | 2021 | 2020 | ||||||||
Net income for the year |
| Ps. | |
| Ps. | |
| Ps. | | ||
Other comprehensive income |
|
|
|
|
|
| |||||
Items that will be reclassified to profit or loss |
|
|
|
|
|
| |||||
Net (losses) gain on hedges of net investments in foreign operations: | 10, 25.5 |
|
|
|
|
|
| ||||
Hedged items |
|
| ( |
| |
| | ||||
Hedging derivative instrument |
|
| |
| ( |
| ( | ||||
Hedging non-derivative instrument |
|
| |
| ( |
| ( | ||||
Cash flow hedges | 10, 25.5 |
| ( |
| |
| | ||||
Foreign currency translation differences from unhedged foreign operations | 25.5 |
| |
| ( |
| ( | ||||
Unrealized (losses) gains on securities at FVOCI |
|
|
|
|
|
| |||||
Debt financial instruments | 9, 25.5 |
| ( |
| ( |
| | ||||
Investments in associates and joint ventures |
| 14, 25.5 |
| |
| ( |
| | |||
Income tax expense |
| 19, 25.5 |
| ( |
| |
| | |||
| ( |
| |
| ( | ||||||
Items that will not be reclassified to profit or loss |
|
|
|
|
| ||||||
Transfer from owner-occupied property to investment property | 25.5 | | | | |||||||
Unrealized (losses) gains on equity securities at FVOCI | 9.4, 25.5 |
| ( |
| ( |
| | ||||
Actuarial gains (losses) from defined benefit pension plans |
| 22, 25.5 |
| |
| |
| ( | |||
Income tax expense |
| 19, 25.5 |
| ( |
| ( |
| | |||
| ( |
| ( |
| | ||||||
Other comprehensive income, net of taxes | 25.5 |
| ( |
| |
| ( | ||||
Total comprehensive income, net of taxes |
| Ps. | |
| Ps. | |
| Ps. | | ||
Total comprehensive income for the year attributable to: |
|
|
|
|
|
| |||||
Owners of the parent |
| Ps. | |
| Ps. | |
| Ps. | | ||
Non-controlling interests |
| |
| |
| | |||||
| Ps. | |
| Ps. | |
| Ps. | | |||
The accompanying notes are an integral part of these Consolidated Financial Statements
F-8
Grupo Aval Acciones y Valores S.A.
Consolidated Statement of Changes in Equity
For the years ended December 31, 2022, 2021 and 2020
(Amounts expressed in millions of Colombian pesos)
|
|
|
|
| Equity |
|
| ||||||||||||||
Subscribed | Additional | Appropriated | Other | attributable to | Non- | ||||||||||||||||
and paid-in | paid – in | retained | comprehensive | owners of the | controlling | ||||||||||||||||
capital | capital | earnings | income (OCI) | parent | interest (NCI) | Total equity | |||||||||||||||
Balance as of January 1, 2020 | Ps. | |
| Ps. | |
| Ps. | |
| Ps. | |
| Ps. | |
| Ps. | |
| Ps. | | |
Issuance of shares | — | — | — | — | — | | | ||||||||||||||
Business combination (1) | — | — | — | — | — | | | ||||||||||||||
Declared dividends (2) |
| — | — | ( | — |
| ( |
| ( |
| ( | ||||||||||
Equity transactions |
| — | | — | — |
| |
| ( |
| ( | ||||||||||
Preferred shares | — | — | ( | — | ( | ( | ( | ||||||||||||||
Effect of realization of equity instruments |
| — | — | | — |
| |
| |
| | ||||||||||
Other comprehensive income | — | — | — | ( |
| ( |
| | ( | ||||||||||||
Withholding Tax over dividends | — | — | ( | — |
| ( |
| ( | ( | ||||||||||||
Net income |
| — | — | | — |
| |
| |
| | ||||||||||
Balance as of December 31, 2020 |
| Ps. | |
| Ps. | |
| Ps. | |
| Ps. | |
| Ps. | |
| Ps. | |
| Ps. | |
Issuance of shares |
| — | — | — | — |
| — |
| |
| | ||||||||||
Declared dividends (2) |
| — | — | ( | — |
| ( |
| ( |
| ( | ||||||||||
Equity transactions |
| — | | — | — |
| |
| ( |
| — | ||||||||||
Preferred shares | — | — | ( | — | ( | ( | ( | ||||||||||||||
Effect of realization of equity instruments | — | — | | — | | | | ||||||||||||||
Other comprehensive income |
| — | — | — | |
| |
| |
| | ||||||||||
Withholding Tax over dividends | — | — | ( | — |
| ( |
| ( |
| ( | |||||||||||
Net income |
| — | — | | — |
| |
| |
| | ||||||||||
Balance as of December 31, 2021 |
| Ps. | |
| Ps. | |
| Ps. | |
| Ps. | |
| Ps. | |
| Ps. | |
| Ps. | |
Issuance of shares (3) |
| | | — | — |
| |
| |
| | ||||||||||
Declared dividends in shares (2) |
| — | — | ( | — |
| ( |
| ( |
| ( | ||||||||||
Declared dividends in cash (2) | — | — | ( | — | ( | ( | ( | ||||||||||||||
Equity transactions (4) | — | ( | — | — | ( | ( | ( | ||||||||||||||
Spin Off (5) | — | — | ( | — | ( | ( | ( | ||||||||||||||
Effect of realization of equity instruments |
| — | — | ( | — |
| ( |
| ( |
| ( | ||||||||||
Other comprehensive income (6) | — | — | — | ( |
| ( |
| ( |
| ( | |||||||||||
Withholding Tax over dividends (7) |
| — | — | ( | — |
| ( |
| ( |
| ( | ||||||||||
Net income |
| — | — | | — |
| |
| |
| | ||||||||||
Balance as of December 31, 2022 |
| Ps. | |
| Ps. | |
| Ps. | |
| Ps. | ( |
| Ps. | |
| Ps. | |
| Ps. | |
| (1) | See note 35 “Business combination”. |
| (2) | See note 25.2 “Declared Dividends”. |
| (3) | See note 25 “Equity attributable to owners of the parent”. |
| (4) | See note 25.4. “Equity transactions”. |
| (5) | See note 1.1. “Discontinued operations of BAC Holding”. |
| (6) | Include the realization of OCI of discontinued operation - See note 1.1. “Discontinued operations of BAC Holding”, and see note 25.5 “Consolidated Other Comprehensive Income (OCI)” |
| (7) | See note 19.8 “Withholdings tax on dividends paid between entities”. |
The accompanying notes are an integral part of these Consolidated Financial Statements
F-9
Grupo Aval Acciones y Valores S.A.
Consolidated Statement of Cash Flows
For the years ended December 31, 2022, 2021 and 2020
(Amounts expressed in millions of Colombian pesos)
|
| ||||||||||
Notes | 2022 | 2021 (1) | 2020 (1) | ||||||||
Cash flows from operating activities: |
|
|
|
|
|
|
|
| |||
Net income before income tax of continuing operations |
|
|
| Ps. | |
| Ps. | |
| Ps. | |
Reconciliation of net income before taxes and net cash (used) provided by operating activities: |
|
|
|
|
|
|
|
| |||
Depreciation of tangible assets and right-of-use assets |
| 15, 28, 30 |
| |
| |
| | |||
Amortization of intangible assets |
| 28, 30 |
| |
| |
| | |||
Impairment losses on loans and other accounts receivable |
| 4.1.5, 28 |
| |
| |
| | |||
Net interest income |
|
|
| ( |
| ( |
| ( | |||
Accrued dividends |
| 30 |
| ( |
| ( |
| ( | |||
Net gains on sales of non-current assets held for sale |
| 30 |
| ( |
| ( |
| ( | |||
Gain on sale of property plant and equipment for own-use |
|
| ( |
| ( |
| ( | ||||
Loss on sale of investment property | |
| |
| | ||||||
Gain on biological assets | ( |
| ( |
| ( | ||||||
Valuations and interest from concession arrangement |
|
|
| ( |
| ( |
| ( | |||
Foreign exchange losses (gains) |
| 30 |
| |
| ( |
| ( | |||
Profit of equity accounted on investments in associates and joint ventures |
| 14, 30 |
| ( |
| ( |
| ( | |||
Net (gains) or losses on fair value adjustments of: |
|
|
|
|
|
|
| ||||
Derivatives |
| 29 |
| ( |
| ( |
| ( | |||
Non-current assets held for sale |
| 13 |
| |
| |
| | |||
Investment properties |
| 15 |
| ( |
| ( |
| | |||
Biological assets |
| 15 |
| ( |
| ( |
| ( | |||
Changes in operating assets and liabilities: |
|
|
|
|
|
|
| ||||
Trading assets |
|
|
| |
| |
| ( | |||
Other accounts receivable | ( | ( | ( | ||||||||
Derivatives |
|
|
| |
| |
| ( | |||
Other assets |
|
|
| |
| ( |
| ( | |||
Other liabilities and provisions | | | | ||||||||
Employee benefits |
|
|
| |
| ( |
| ( | |||
Loans |
|
|
| ( |
| ( |
| ( | |||
Customer deposits |
|
|
| |
| |
| | |||
Interbank borrowings and overnight funds |
|
|
| ( |
| |
| ( | |||
Borrowings from development entities |
|
|
| |
| ( |
| ( | |||
Borrowings from banks and others |
|
|
| |
| |
| ( | |||
Interest received |
|
|
| |
| |
| | |||
Interest paid |
|
|
| ( |
| ( |
| ( | |||
Interest paid on leases | ( |
| ( |
| ( | ||||||
Income tax paid | ( |
| ( |
| ( | ||||||
Net cash (used in) provided by operating activities |
|
|
| Ps. | ( |
| Ps. | |
| Ps. | |
| (1) | See note 1.1, Information was not modified with respect to previous years. |
The accompanying notes are an integral part of these Consolidated Financial Statements
F-10
Grupo Aval Acciones y Valores S.A.
Consolidated Statement of Cash Flows
For the years ended December 31, 2022, 2021 and 2020, continued
(Amounts expressed in millions of Colombian pesos)
|
| ||||||||||
| Notes |
| 2022 |
| 2021 (1) |
| 2020 (1) | ||||
Cash flows from investing activities: |
|
|
|
|
|
| |||||
Acquisition of property, plant and equipment for own use and operating lease |
| 15 |
| Ps. | ( | Ps. | ( | Ps. | ( | ||
Acquisition of investment property |
| 15 |
| ( | ( | ( | |||||
Additions of cost of biological assets |
| 15 |
| ( | ( | ( | |||||
Additions of concession arrangement rights |
|
|
| | ( | ( | |||||
Additions of others intangibles assets |
|
|
| ( | ( | ( | |||||
Acquisition of investments at FVOCI |
|
|
| ( | ( | ( | |||||
Proceeds from sale of investments at FVOCI | | | | ||||||||
Proceeds from sale of own property and equipment |
|
| | | | ||||||
Proceeds from sale of investment properties |
|
| | | | ||||||
Proceeds from sale of biological assets |
|
| | | | ||||||
Proceeds from sale of non-current assets held for sale |
|
|
| | | | |||||
Purchases of financial assets at amortized cost |
|
|
| ( | ( | ( | |||||
Redemptions of financial assets at amortized cost |
|
|
| | | | |||||
Dividends received from investments |
|
|
| | | | |||||
Acquisition of investments in associates and joint ventures | 14 | ( | ( | ( | |||||||
Capitalized leasing cost | ( | — | ( | ||||||||
Business combination, net of cash |
|
|
| — | — | ( | |||||
Proceeds from sale of investments in associates | 1.1 | | — | — | |||||||
Discontinued operation | 1.1 | ( | — | — | |||||||
Net cash used in by investing activities |
|
|
| Ps. | ( | Ps. | ( | Ps. | ( | ||
Cash flows from financing activities: |
|
|
|
|
|
| |||||
Dividends paid to shareholders |
| 21.3 |
| ( | ( | ( | |||||
Dividends paid to non-controlling interest |
| 21.3, 26 |
| ( | ( | ( | |||||
Issuance of debt securities |
| 21.3 |
| | | | |||||
Payment of outstanding debt securities |
| 21.3 |
| ( | ( | ( | |||||
Leases | 21.3 | ( | ( | ( | |||||||
Redemption of preferred shares | 21.3 | — | ( | ( | |||||||
Issuance of common shares |
| 21.3 |
| — | | ( | |||||
Equity transaction |
| 21.3, 25.4 |
| ( | — | — | |||||
Net cash (used in) provided by financing activities |
|
|
| ( | ( | | |||||
Effect of foreign currency changes on cash and cash equivalents |
|
|
| | | | |||||
Decrease in cash and cash equivalents from discontinued operations | 1.1 | ( | — | — | |||||||
(Decrease) increase in cash and cash equivalents |
|
|
| ( | | | |||||
Cash and cash equivalents at beginning of year |
| 7 |
| Ps. | | Ps. | | Ps. | | ||
Cash and cash equivalents at end of year |
| 7 |
| Ps. | | Ps. | | Ps. | |
| (1) | See note 1.1, information was not modified with respect to previous years. |
The accompanying notes are an integral part of these Consolidated Financial Statements
F-11
Grupo Aval Acciones y Valores S.A.
Notes to the Consolidated Financial Statements
For the years ended December 31, 2022, 2021 and 2020
(Amounts expressed in millions of Colombian pesos)
NOTE 1 – REPORTING ENTITY
Grupo Aval Acciones y Valores S.A. (hereinafter the “The Group” or “Grupo Aval”) was established under Colombian law in January 7, 1994, with its main offices and business address registered in Bogotá, D.C., Colombia. The corporate purpose of Grupo Aval is the purchase and sale of securities issued by financial and commercial entities. Grupo Aval is the majority shareholder of Banco de Bogotá S.A., Banco de Occidente S.A., Banco Popular S.A. and Banco Comercial AV Villas S.A., entities whose main purpose is to perform all transactions, operations and services inherent to the banking business, pursuant to applicable laws and regulations. Furthermore, through its direct and indirect investments in Corporación Financiera Colombiana S.A. (“Corficolombiana”) and in Sociedad Administradora de Fondos de Pensiones y Cesantías Porvenir S.A. (“Porvenir”), Grupo Aval also engages in investment banking activities, in the non-financial sector and manages pensions and severance funds in Colombia.
In performing its activities and pursuant to the corporate bylaws, Grupo Aval may (i) promote the creation of all types of companies relating to its corporate purpose; (ii) represent individuals and companies involved in similar or complementary activities; (iii) grant or receive loans with or without interest; (iv) submit its properties as collateral; (v) issue, endorse, acquire, protest, cancel, or pay bills of exchange, checks, promissory notes or any other type of financial instruments, accept or submit them as payment; (vi) acquire, sell, tax, lease or manage any kind of assets; (vii) subscribe or acquire any kind of investments and sell or otherwise dispose of them; (viii) acquire and sell shares in companies that purse similar or complementary corporate interests ; (ix) render services in areas relating to its activities, experience and knowledge; and (x) carry out or participate, in acts and contracts relating to the aforementioned activities, enabling the exercise of rights and compliance of the obligations of The Group.
The duration of Grupo Aval set forth under the bylaws is until May 24, 2044, but the Company may be dissolved before such term expires, or it may be extended by free decision of Grupo Aval shareholders meeting.
When preparing its consolidated financial statements, Grupo Aval Acciones y Valores S.A., directly consolidates the following entities:
Banco de Bogotá S.A.
Banco de Bogotá S.A., in which Grupo Aval holds
The following table presents details of Banco de Bogotá’s most significant subsidiaries which are indirectly consolidated by Grupo Aval as of December 31, 2022:
|
|
|
| Total | ||||
Total voting | ownership | |||||||
rights held by | interest held | |||||||
Subsidiary | Core business | Location | Grupo Aval | by Grupo Aval | ||||
Main local direct subsidiaries |
|
|
|
|
|
| ||
Fiduciaria Bogotá S.A. |
|
|
| |||||
Almaviva S.A. | ||||||||
Megalínea S.A. |
|
|
| |||||
Main international direct subsidiaries (*) |
|
|
| |||||
Banco de Bogotá Panamá S.A. |
|
|
| |||||
Multi Financial Holding (**) | ||||||||
(*) Discontinued operations of BAC Holding Corp. (BAC Holding) (see note 1.1.)
(**) During September 2021, as part of the strategic reorganization that Banco de Bogotá and its subsidiaries have been carrying out, y transferring the control of MFG to Banco de Bogotá, through a new holding company established in Panama named Multi Financial Holding (MFH), whose only shareholder is Banco de Bogotá with a
F-12
Grupo Aval Acciones y Valores S.A.
Notes to the Consolidated Financial Statements
For the years ended December 31, 2022, 2021 and 2020
(Amounts expressed in millions of Colombian pesos)
Banco de Occidente S.A.
Banco de Occidente S.A., in which Grupo Aval holds
The following table presents the details of Banco de Occidente’s most significant subsidiaries, which are indirectly consolidated by Grupo Aval, as of December 31, 2022:
|
|
|
| Total | ||||
Total voting | ownership | |||||||
rights held by | interest held | |||||||
Subsidiary | Core business | Location | Grupo Aval | by Grupo Aval | ||||
Banco de Occidente (Panamá). S.A. |
|
|
| |||||
Fiduciaria de Occidente S.A. |
|
|
| |||||
Occidental Bank Barbados Ltd. |
|
|
|
Banco Popular S. A.
Banco Popular S. A., in which Grupo Aval holds
The following table presents the details of Banco Popular’s most significant subsidiaries which are indirectly consolidated by Grupo Aval, as of December 31, 2022:
Total | ||||||||
Total voting | ownership | |||||||
rights held by | interest held | |||||||
Subsidiary | Core business | Location | Grupo Aval | by Grupo Aval | ||||
Alpopular S.A. |
|
|
| |||||
Fiduciaria Popular S.A. |
|
|
|
Banco Comercial AV Villas S. A.
Banco Comercial AV Villas S. A., in which Grupo Aval holds
The following table presents the details of Banco AV Villas’ subsidiary which is indirectly consolidated by Grupo Aval, as of December 31, 2022:
Total | |||||||||
Total voting | ownership | ||||||||
rights held by | interest held | ||||||||
Subsidiary | Core business | Location | Grupo Aval | by Grupo Aval | |||||
A Toda Hora S.A. ATH |
|
F-13
Grupo Aval Acciones y Valores S.A.
Notes to the Consolidated Financial Statements
For the years ended December 31, 2022, 2021 and 2020
(Amounts expressed in millions of Colombian pesos)
Corporación Financiera Colombiana S.A. – Corficolombiana S.A.
Corficolombiana S.A., in which Grupo Aval and its subsidiaries own
The following table presents the details of Corficolombiana´s most significant subsidiaries which are indirectly consolidated by Grupo Aval, at December 31, 2022:
|
|
|
| Total | ||||
Total voting | ownership | |||||||
Main Indirect Subsidiaries | rights held by | interest held | ||||||
Subsidiary | Core business | Location | Grupo Aval |
| by Grupo Aval | |||
Promigas S.A. E.S.P. | ||||||||
Colombiana de Licitaciones y Concesiones S.A.S. |
|
|
| |||||
Estudios y Proyectos del Sol S.A.S. |
|
|
| |||||
CFC Gas Holding S.A.S. | ||||||||
Proyectos y Desarrollos Viales del Pacífico S.A.S. | ||||||||
Concesionaria Vial Del Oriente S.A.S. |
|
|
| |||||
Concesionaria Vial Del Pacifico S.A.S. |
|
|
|
Sociedad Administradora de Fondos de Pensiones y Cesantías Porvenir S.A.
Porvenir S.A., in which Grupo Aval and its subsidiaries own
The following table presents the details of Porvenir’ subsidiary which is indirectly consolidated by Grupo Aval, as of December 31, 2022:
|
|
|
| Total | ||||
Total voting | ownership | |||||||
rights held by | interest held | |||||||
Subsidiary | Core business | Location | Grupo Aval | by Grupo Aval | ||||
Aportes en Línea S.A. |
|
|
|
Grupo Aval Limited
Grupo Aval Limited is a
F-14
Grupo Aval Acciones y Valores S.A.
Notes to the Consolidated Financial Statements
For the years ended December 31, 2022, 2021 and 2020
(Amounts expressed in millions of Colombian pesos)
Legal and regulatory restrictions
Grupo Aval and its Colombian subsidiaries are subject to the following restrictions to transfer profits or perform transactions, in accordance with the legal requirements in Colombia:
| ● | Before distributing any dividends to their shareholders, the companies should assign 10% of their profits to a legal reserve until the reserve equals 50% of paid-in capital. |
| ● | The subsidiaries of Grupo Aval that operate in the financial sector in Colombia may not grant loans to a counterpart that exceed 10% of their regulatory capital if the loan is unsecured or 25% if it is granted with an acceptable security or third party guarantee, as per Superintendency of Finance rules. There is an exception to this rule that extends the maximum quota up to 25% (without guarantee) when it comes to loans to fourth generation roads “4G” infrastructure projects. These same limits apply to companies which are not part of Grupo Aval. |
| ● | Pursuant to article 2.1.2.1.8 of Decree 2555 of 2010, banks in Colombia have a lending limit of 30% of their regulatory capital with respect to loans granted to financial entities. These same limits apply all financial entities. |
Foreign subsidiaries of Grupo Aval do not have any restriction to transfer dividends to the parent company. Lending operations in general have restrictions similar to those of banks in Colombia, as described above.
Grupo Aval and its subsidiaries do not have significant restrictions on their ability to access or use their assets and settle their liabilities other than those resulting from the supervisory frameworks within which subsidiaries of the financial sector operate. The supervisory frameworks require subsidiaries of the financial sector to keep certain levels of regulatory capital (see note 4.4) and liquid assets (see note 4.3), limit their exposure to other parts of Grupo Aval and its subsidiaries and comply with other ratios.
NOTE 1.1 DISCONTINUED OPERATIONS OF BAC HOLDING
On March 31, 2022, a
| A) | SPIN-OFF BAC Holding International Corp. (BAC Holding) |
In March 2022, Grupo Aval completed the spin-off process that resulted in the loss of control of BAC Holding, through the subsidiary Banco de Bogotá, which at the time had a
The following are the impacts on assets, liabilities and equity recognized in the Consolidated Financial Statements as a result of BAC Holding´s spin-off as of March 31, 2022:
Spin-off | Value | |
Total assets | Ps. | |
Total liabilities | | |
Non-controlling interest | | |
BAC Holding´s equity as of March 31, 2022 | Ps. | |
Spin-off percentage | ||
Spin-off amount | Ps. | |
Percentage of Grupo Aval over BAC Holding | ||
Effect of the spin-off on owners of the parent | Ps. | ( |
Effect of the spin-off on non-controlling interest | Ps. | ( |
F-15
Grupo Aval Acciones y Valores S.A.
Notes to the Consolidated Financial Statements
For the years ended December 31, 2022, 2021 and 2020
(Amounts expressed in millions of Colombian pesos)
The following is the effect of the realization of Other Comprehensive Income a result of the loss of control of the subsidiary BAC Holding as of March 31, 2022:
Other Comprehensive Income items which were reclassified to profit or loss | Value | |
|---|---|---|
Hedged items | Ps. | |
Hedging derivative instruments | ( | |
Hedging non-derivative instruments | ( | |
Foreign currency translation differences from unhedged foreign operations | ( | |
Unrealized gains on debt securities at FVOCI | | |
Income tax expense | | |
Total reclassifications of Other Comprehensive Income to profit or loss | Ps. | |
Grupo Aval´s ownership over BAC Holding | ||
Attributable to owners of the parent | Ps. | |
Attributable to non-controlling interest | Ps. | |
Total reclassifications of Other Comprehensive Income to retained earnings | Ps. | ( |
Grupo Aval´s ownership over BAC Holding | ||
Attributable to owners of the parent | Ps. | ( |
Attributable to non-controlling interest | Ps. | ( |
The following are BAC Holding´s assets and liabilities which were derecognized at their carrying values as a result of the spin off as of March 31, 2022:
Assets | ||
Cash and cash equivalents | Ps. | |
Trading assets | | |
Investment securities | | |
Loans, net | | |
Other accounts receivable, net | | |
Non-current assets held for sale | | |
Tangible assets | | |
Goodwill | | |
Other Intangibles | | |
Income tax assets | | |
Other assets | | |
Total assets | Ps. | |
Liabilities and equity | ||
Liabilities | ||
Trading liabilities | Ps. | |
Customer deposits | | |
Financial obligations | | |
Provisions | | |
Income tax liabilities | | |
Employee benefits | | |
Other liabilities | | |
Total liabilities | Ps. | |
Owners of the parent: | ||
Equity attributable to owners of the parent | | |
Non-controlling interest | | |
Total equity | | |
Total liabilities and equity | Ps. | |
F-16
Grupo Aval Acciones y Valores S.A.
Notes to the Consolidated Financial Statements
For the years ended December 31, 2022, 2021 and 2020
(Amounts expressed in millions of Colombian pesos)
Income Statement of discontinued operations
The following is discontinued operations Income Statement for the three-month period ended March 31 2022:
From January 1, to March 31, | ||
|---|---|---|
2022 | ||
Interest income calculated using the effective interest method | ||
Loan portfolio | Ps. | |
Investments in debt securities | | |
Total interest income | | |
Interest expense | ||
Deposits | ||
Checking accounts | ( | |
Savings accounts | ( | |
Time deposits | ( | |
( | ||
Financial obligations | ||
Interbank borrowings and overnight funds | ( | |
Borrowings from banks and others | ( | |
Bonds issued | ( | |
( | ||
Net interest income | | |
Impairment losses on financial assets | ||
Loans and other accounts receivable | ( | |
Other financial assets | ( | |
Net impairment loss on financial assets | ( | |
Net interest income, after impairment losses | | |
Income from commissions and fees | | |
Expenses from commissions and fees | ( | |
Net income from commissions and fees | | |
Net trading income | | |
Other income | | |
Other expenses | ( | |
Net income before tax expense | | |
Income tax expense | ( | |
Net income from discontinued operations | Ps. | |
Net reclassifications of Other Comprehensive Income | Ps. | |
Net income from discontinued operations, net of tax | Ps. | |
Net income for the year attributable to: | ||
Owners of the parent | Ps. | |
Non-controlling interests | | |
Net income from discontinued operations, net of tax | Ps. | |
Net income per share basic and diluted (in Colombian pesos, see note 25.3 "Earnings per share"). | Ps. | |
F-17
Grupo Aval Acciones y Valores S.A.
Notes to the Consolidated Financial Statements
For the years ended December 31, 2022, 2021 and 2020
(Amounts expressed in millions of Colombian pesos)
Cash Flows of spin-off
The following is the detail of the Cash Flow of discontinued operations from January 1 to March 31, 2022:
March 31, | ||
2022 | ||
Net gain discontinued operations, net of taxes | Ps. | ( |
Reconciliation of net income before taxes and net cash provided by operating activities: | ||
Effect of realization OCI to income | Ps. | |
BAC Holding Corp's participation in results | | |
Net cash provided by operating activities | Ps. | - |
Cash flows from investing activities: | ||
Loss of control in subsidiary | Ps. | ( |
Net cash by investing activities | Ps. | ( |
Decrease in cash and cash equivalents | Ps. | ( |
Decrease in cash and cash equivalents | ( | |
Cash and cash equivalents at beginning of year | Ps. | |
Cash and cash equivalents at end of year | Ps. | - |
B) SALE OF BAC HOLDING
Upon completion of the
On December 14, 2022, the Colombian Stock Exchange communicated to the market the results of the Public Offer for Acquisition (OPA was carried out by a related party controlled by the ultimate beneficial owner of the Group - see note 34) – BAC Holding´s of ordinary shares, stating the acceptance of a total of
The aforementioned transaction was partially financed by the Group through a loan to the acquiring entity (see note 34).
F-18
Grupo Aval Acciones y Valores S.A.
Notes to the Consolidated Financial Statements
For the years ended December 31, 2022, 2021 and 2020
(Amounts expressed in millions of Colombian pesos)
The following are the details of the transaction:
Disposal of BAC Holding | Value | |
BAC shares before the sale | | |
Investment carrying amount as of April 1, (The fair value of the retained interest). | Ps. | |
Equity method | ||
Share of profit of equity accounted investees, net of tax | | |
Other Comprehensive Income, investments in associates | ( | |
Other Comprehensive Income, foreign currency translation differences from hedged | | |
Other Comprehensive Income, cumulative translation adjustment of the investments | | |
Derecognition of BAC Holding as an investment in associate | Ps. | |
Effects on the Income Statement for the period | Value | |
Derecognition of BAC Holding as an investment in associate | Ps. | ( |
Recognition of retained interest | | |
Consideration received | | |
Amount reclassified to discontinued operations as a Share of profit of equity accounted investees, net of tax | Ps. | |
Other Comprehensive Income items are reclassified to the Income Statement | ||
Net gain (loss) on hedges of net investments in foreign operations: | ||
Foreign currency translation differences from hedged | | |
Non-derivative hedging instrument | ( | |
Foreign currency translation differences from unhedged foreign operations | | |
Equity method | ( | |
Cumulative translation adjustment of the investments | | |
Deferred tax | | |
Total Other Comprehensive Income reclassifications to the Income Statement | Ps. | |
Grupo Aval´s ownership over BAC Holding | ||
Attributable to owners of the parent | Ps. | |
Attributable to non-controlling interest | Ps. | |
Total Other Comprehensive Income reclassifications to the Income Statement | | |
Loss from discontinued operations | Ps. | ( |
Cash Flows of sale
December 31, | ||
2022 | ||
Net income from discontinued operations | Ps. | ( |
Effect of realization OCI to income | ( | |
Net income net, tax expense | Ps. | ( |
Changes in operating assets and liabilities | | |
Net cash provided by operating activities | - | |
Net cash provided by investing activities | | |
Net cash used by financing activities | - | |
Effect of foreign currency changes on cash and equivalents | - | |
Increase in cash and cash equivalents | | |
Cash and cash equivalents at beginning of period | Ps. | - |
Cash and cash equivalents at end of period | Ps. | |
F-19
Grupo Aval Acciones y Valores S.A.
Notes to the Consolidated Financial Statements
For the years ended December 31, 2022, 2021 and 2020
(Amounts expressed in millions of Colombian pesos)
Summary discontinued operations during the year 2022 BAC Holding Corp. (BAC Holding)
Spin-off | Sale | Net | ||||
From January 1, to March 31, | December | December | ||||
2022 | 2022 | 2022 | ||||
Interest income calculated using the effective interest method | ||||||
Loan portfolio | Ps. | | Ps. | — | Ps. | |
Investments in debt securities | | — | | |||
Total interest income | | — | | |||
Interest expense | ||||||
Deposits | ||||||
Checking accounts | ( | — | ( | |||
Savings accounts | ( | — | ( | |||
Time deposits | ( | — | ( | |||
( | — | ( | ||||
Financial obligations | ||||||
Interbank borrowings and overnight funds | ( | — | ( | |||
Borrowings from banks and others | ( | — | ( | |||
Bonds issued | ( | — | ( | |||
( | — | ( | ||||
Net interest income | | — | | |||
Impairment (losses) recoveries on financial assets | ||||||
Loans and other accounts receivable | ( | — | ( | |||
Other financial assets | ( | — | ( | |||
Net impairment loss on financial assets | ( | — | ( | |||
Net interest income, after impairment losses | | — | | |||
Income from commissions and fees | | — | | |||
Expenses from commissions and fees | ( | — | ( | |||
Net income from commissions and fees | | — | | |||
Net trading income | | — | | |||
Other income | | | | |||
Other expenses | ( | ( | ( | |||
Net income (loss) before tax expense | | ( | ( | |||
Income tax expense | ( | — | ( | |||
Net income (loss) from discontinued operations | Ps. | | Ps. | ( | Ps. | ( |
Net reclassifications of Other Comprehensive Income | Ps. | | Ps. | | Ps. | |
Net income (loss) from discontinued operations, net of tax | Ps. | | Ps. | ( | Ps. | |
Net income (loss) for the year attributable to: | ||||||
Owners of the parent | Ps. | | Ps. | ( | Ps. | |
Non-controlling interests | | ( | | |||
Net income (loss) from discontinued operations, net of tax | Ps. | | Ps. | ( | Ps. | |
Net income per share basic and diluted (in Colombian pesos, see note 25.3 "Earnings per share"). | Ps. | | Ps. | ( | Ps. | |
F-20
Grupo Aval Acciones y Valores S.A.
Notes to the Consolidated Financial Statements
For the years ended December 31, 2022, 2021 and 2020
(Amounts expressed in millions of Colombian pesos)
Impact on the cash flow report:
The impacts on cash flow for the periods ended are detailed below:
December 31, | December 31, | December 31, | ||||
2022 | 2021 | 2020 | ||||
Net gain discontinued operations, net of taxes | Ps. | ( | Ps. | ( | Ps. | ( |
Reconciliation of net income before taxes and net cash provided by operating activities: | ||||||
Effect of realization OCI to income | Ps. | | - | - | ||
BAC Holding Corp's participation in results | | | | |||
Loss on sale of investment and recognition of retained interest | ( | - | - | |||
Net cash provided by operating activities | Ps. | - | Ps. | - | Ps. | - |
Cash flows from investing activities: | ||||||
Loss of control in subsidiary | Ps. | ( | Ps. | ( | Ps. | ( |
Proceeds from sale of investments in associates | | - | - | |||
Net cash by investing activities | Ps. | ( | Ps. | ( | Ps. | ( |
Decrease in cash and cash equivalents | Ps. | ( | Ps. | | Ps. | |
Decrease in cash and cash equivalents | ( | ( | ( | |||
Cash and cash equivalents at beginning of year | Ps. | | Ps. | | Ps. | |
Cash and cash equivalents at end of year | Ps. | | Ps. | - | Ps. | - |
F-21
Grupo Aval Acciones y Valores S.A.
Notes to the Consolidated Financial Statements
For the years ended December 31, 2022, 2021 and 2020
(Amounts expressed in millions of Colombian pesos)
Summary of discontinued operations for years 2021 and 2020 BAC Holding Corp. (BAC Holding)
For comparative purposes, the effects of the BAC Holding´s discontinued operations are presented for the periods ended December 31, 2021, and 2020.
2021 | 2020 | |||
Interest income calculated using the effective interest method | ||||
Loan portfolio | Ps. | Ps. | ||
Investments in debt securities | ||||
Total interest income | ||||
Interest expense | ||||
Deposits | ||||
Checking accounts | ( | ( | ||
Savings accounts | ( | ( | ||
Time deposits | ( | ( | ||
( | ( | |||
Financial obligations | ||||
Interbank borrowings and overnight funds | ( | ( | ||
Borrowings from banks and others | ( | ( | ||
Bonds issued | ( | ( | ||
( | ( | |||
Net interest income | ||||
Impairment (losses) recoveries on financial assets | ||||
Loans and other accounts receivable | ( | ( | ||
Other financial assets | ( | ( | ||
Recovery of charged-off financial assets | — | |||
Net impairment loss on financial assets | ( | ( | ||
Net interest income, after impairment losses | ||||
Income from commissions and fees | ||||
Expenses from commissions and fees | ( | ( | ||
Net income from commissions and fees | ||||
Net trading income | ||||
Other income | ||||
Other expenses | ( | ( | ||
Net income before tax expense | ||||
Income tax expense | ( | ( | ||
Net income from discontinued operations, net of tax | Ps. | Ps. | ||
Net income for the year attributable to: | ||||
Owners of the parent | Ps. | Ps. | ||
Non-controlling interests | ||||
Net income from discontinued operations, net of tax | Ps. | Ps. | ||
Net income per share basic and diluted (in Colombian pesos, see note 25.3 "Earnings per share"). | Ps. | | Ps. | |
F-22
Grupo Aval Acciones y Valores S.A.
Notes to the Consolidated Financial Statements
For the years ended December 31, 2022, 2021 and 2020
(Amounts expressed in millions of Colombian pesos)
NOTE 2 – BASIS OF PREPARATION OF THE CONSOLIDATED FINANCIAL STATEMENTS AND SUMMARY OF SIGNIFICANT ACCOUNTING POLICIES
The Consolidated Financial Statements of Grupo Aval have been prepared in accordance with International Financial Reporting Standards (IFRS) as issued by the International Accounting Standards Board (IASB).
The Consolidated Financial Statements have been prepared on the basis of historical cost, except for financial assets at Fair Value Through Profit or Loss (“FVTPL”), at Fair Value Through Other Comprehensive Income (“FVOCI”), derivative financial instruments, investment properties, non-current assets held for sale and biological assets which are measured at fair value. Additionally, non-current assets held for sale are measured at the lower value of their carrying value at the time of transfer and fair value, minus estimated costs of disposal and employee benefits which are measured at the present value of the defined benefit obligation (see note 2.22).
The Consolidated Financial Statements were authorized for issuance by the Audit Committee on April 13, 2023.
The following are the main accounting policies applied in preparing the Consolidated Financial Statements of Grupo Aval as of December 31, 2022, 2021 and 2020.
2.1 Basis of preparation
a)Presentation of Consolidated Financial Statements
The Consolidated Financial Statements are prepared as follows:
| ● | The Consolidated Statement of Financial position presents the company´s assets and liabilities based on liquidity since it provides reliable and more relevant information than separate current and non-current classifications. |
| ● | The Consolidated Statements of Income and Other Comprehensive Income are presented separately. The Consolidated Statement of Income is presented according to the function of expenses, as this method provides reliable and more relevant information. |
| ● | The Consolidated Statement of Cash Flows is presented using the indirect method. Accordingly, net cash flows from operating activities are determined by reconciling net income before tax expense, with the effects of non-cash items, net changes in assets and liabilities from operating activities, and for any other effects that are not classified as investing or financing activities. Revenues and expenses due to interest received and paid are part of operating activities. |
b) | Consolidated Financial Statements |
Grupo Aval prepares its Consolidated Financial Statements incorporating its controlled entities. Grupo Aval controls an investee if and only if it complies with the following elements:
| ● | Power over the investee entitling Grupo Aval to direct any relevant activities that significantly affect the investee's performance. |
| ● | Exposure, or rights to variable returns from its involvement with the investee. |
| ● | Ability to affect those returns through its power over the investee. |
Grupo Aval carries out an annual assessment of all its contractual relationships in order to identify new controlled entities or entities where control has been lost. For the year 2022 and 2021, no new entities were identified which had to be consolidated. As for the year 2020, a business combination was identified (see note 35).
The financial statements for Grupo Aval´s subsidiaries are included in the consolidated financial statements since the date on which Grupo Aval acquires control or following control until the date on which control is lost.
During the consolidation process, Grupo Aval combines the assets, liabilities and profits or losses of those entities under control, previously aligning the accounting policies in all the subsidiaries and translating its financial statements to
F-23
Grupo Aval Acciones y Valores S.A.
Notes to the Consolidated Financial Statements
For the years ended December 31, 2022, 2021 and 2020
(Amounts expressed in millions of Colombian pesos)
Colombian Pesos. This process includes eliminating intra-group balances and transactions and any unrealized and realized income and expense (except for foreign currency translation gains or losses and those taxes which are not subject to elimination) arising from intra-group transactions. Unrealized losses are eliminated in the same way as unrealized gains, but only to the extent that there is no evidence of impairment.
Non-controlling interests are presented under total equity in the Consolidated Statement of Financial Position of Grupo Aval separately from equity attributable to owners of the parent company.
For consolidation purposes, the Consolidated Statements of Financial Position and Income of entities with a functional currency different form Grupo Aval´ are translated to Colombian pesos as follows:
| ● | Assets and liabilities are translated at the closing exchange rate at the reporting date; |
| ● | Income, expense and cash flows are translated at the corresponding month’s average exchange rate since they approximate the exchange rates of each specific transaction; |
| ● | All resulting exchange differences are recognized in other comprehensive income and accumulated in the foreign currency translation reserve, except to the extent that the translation difference is allocated to non-controlling interests. |
When Grupo Aval ceases to consolidate or equity account for an investment because of a loss of control, joint control or significant influence, any retained interest in the entity is remeasured to its fair value, with the change in carrying amount recognized in profit or loss. This fair value becomes the initial carrying amount for the purposes of subsequently accounting for the retained interest as an associate, joint venture or financial asset. In addition, any amounts previously recognized in other comprehensive income in respect of that entity are accounted for as if the group had directly disposed of the related assets or liabilities. This may mean that amounts previously recognized in other comprehensive income are reclassified to profit or loss.
c) | Investments in associates |
Associates are companies in which Grupo Aval has significant influence but not control and are accounted for under the equity method. They are presented in the Consolidated Statement of Financial Position as “Investments in associates and joint ventures” (see Note 2.1 “Joint arrangements”). Grupo Aval exercises significant influence over another entity if it owns, directly or indirectly,
Dividends received from associates and joint ventures are recognized as a lower value in the carrying amount of the investment.
In the case that Grupo Aval´s share of losses in an equity-accounted investment equals or exceeds its interest in the entity, including any other unsecured long-term receivables, Grupo Aval does not recognize further losses, unless it has incurred obligations or made payments on behalf of the other entity.
Unrealized gains on transactions between Grupo Aval and its associates are eliminated to the extent of Grupo Aval’s interest in these entities. Unrealized losses are also eliminated unless the transaction provides evidence of an impairment of the asset transferred.
Accounting policies of associates have been changed where necessary to ensure consistency with the policies adopted by Grupo Aval.
The carrying amount of associates are tested for impairment.
d)Joint arrangements
A joint arrangement is one in which two or more parties have joint control of the arrangement. Joint arrangements are divided into joint operations or joint ventures. The classification depends on the contractual rights and obligations of each investor, rather than the legal structure of the joint arrangement, under joint operations the parties having joint control of
F-24
Grupo Aval Acciones y Valores S.A.
Notes to the Consolidated Financial Statements
For the years ended December 31, 2022, 2021 and 2020
(Amounts expressed in millions of Colombian pesos)
the agreement have rights to the assets and obligations to the liabilities relating to the agreement. Under joint ventures, the parties having joint control, are entitled to the net assets of the agreement.
Grupo Aval recognizes joint operations in the Consolidated Financial Statements based on their proportional and contractual participation in each of the assets, liabilities and profit or loss of the contract or entity wherein the agreement is held. Grupo Aval recognizes joint ventures through the equity method, in the same manner as investments in associates.
2.2 Functional and presentation currency
Considering that the majority of the Group´s business activities as well as the generation and use of cash is in Colombian pesos, the Colombian peso is the currency that most accurately represents the economic environment of Grupo Aval’s operations, both for the Consolidated Financial Statements and for the parent company. Foreign entities have functional currencies different from the Colombian peso, which are translated to Colombian pesos for presentation purposes. The main functional currency these foreign entities is the US dollar.
2.3 Transactions in foreign currencies
Monetary assets and liabilities denominated in foreign currencies are translated into the functional currency using the prevailing exchange rate at the reporting date. Non-monetary assets and liabilities denominated in foreign currencies in terms of historical costs are measured using the exchange rate at the transaction date. Financial instruments measured at fair value are converted using the exchange rate at the date the fair value was determined. Profits or losses resulting from the translation process are recognized in profit or loss, except for financial instruments designated as hedging instruments.
As of December 31, 2022 and 2021, the representative market rates as computed and certified by the Superintendency of Finance (for the U.S. dollar which is the most representative foreign currency for Grupo Aval´s transactions) were Ps
2.4 Operating segments
An operating segment is a component of an entity which:
| a) | Engages in business activities from which it can earn revenue and incur expenses (including revenue and expenses from transactions with other components of the same entity); |
| b) | Operating profit or losses are regularly reviewed by the chief operating decision maker, who decides on the resources allocation to the segment and assesses its performance and. |
| c) | Discrete financial information is available, |
Segment results that are reported to the Chief Operating Decision Maker (CODM) include items that are directly attributable to a segment as well as those that can be allocated on a reasonable basis.
Management regularly evaluates the performance for each segment; Grupo Aval discloses information separately for each identified operating segment, meeting any of the following quantitative thresholds:
| a) | The segment´s reported revenue from the ordinary activities, including revenue from external customers as well as revenue from intersegment transfers, is equal or greater than 10% of the revenue of combined ordinary activities, internal and external, of all operating segments. |
| b) | The amount of the segment´s reported net income is, in absolute terms, equal or greater than 10% of the amount greater of: (i) the combined reported net income of all the segments not reporting a loss; and (ii) the reported combined loss of all segments of the operations with incurred losses. |
| c) | The segment´s assets are equal to or greater than 10% of the combined assets of all segments of the operation. |
The information regarding other activities of the business of operating segments that do not have to be reported is combined and disclosed within the category of “Others”.
F-25
Grupo Aval Acciones y Valores S.A.
Notes to the Consolidated Financial Statements
For the years ended December 31, 2022, 2021 and 2020
(Amounts expressed in millions of Colombian pesos)
2.5 Financial assets and financial liabilities
i. Recognition and initial measurement
Grupo Aval initially recognizes loans and advances, deposits, debt securities issued and subordinated liabilities on the date on which they are originated. All other financial instruments (including regular-purchases and sales of financial assets) are recognized on the trade date, which is the date in which Grupo Aval becomes a party to the contractual provisions of the instrument.
A financial asset or financial liability is initially measured at fair value. Additionally, for instruments measured at amortized cost or Fair Value Through Other Comprehensive Income (“FVOCI”), transaction costs are added if directly attributable to its acquisition or issuance.
ii. Classification
Financial assets
On initial recognition, a financial asset is classified as: amortized cost, Fair Value Through Other Comprehensive Income (“FVOCI”) or Fair Value Through Profit or Loss (“FVTPL”).
A financial asset is measured at amortized cost if it meets both of the following conditions and is not designated as at FVTPL:
| ● | The asset is held within a business model in which the objective is to hold assets to collect contractual cash flows; and |
| ● | The contractual terms of the financial asset give rise on specified dates to cash flows that are solely payments of principal and interest on the principal amount outstanding. |
A debt instrument is measured at FVOCI only if it meets both of the following conditions and is not designated as at FVTPL:
| ● | The asset is held within a business model whose objective is achieved both by collecting contractual cash flows and selling the financial asset; and |
| ● | The contractual terms of the financial asset give rise on specified dates to cash flows that are solely payments of principal and interest on the principal amount outstanding. |
On initial recognition of an equity investment that is not held for trading, Grupo Aval may irrevocably elect to present subsequent changes in fair value in Other Comprehensive Income (“OCI”). This election is made on an investment-by-investment basis.
All other financial assets are classified and measured at FVTPL.
Business model assessment
Grupo Aval makes an assessment of the objective of a business model in which an asset is held at a portfolio level because this best reflects the way the business is managed, and information is provided to management. The information considered includes:
| ● | The established policies and objectives for the portfolio and their actual application. In particular, whether management’s strategy focuses on earning contractual interest revenue, maintaining a particular interest rate profile, matching the duration of the financial assets to the duration of the liabilities that are funding those assets; |
| ● | How the performance of the portfolio is evaluated and reported to Grupo Aval’s management; |
| ● | The risks that affect the performance of the business model (and the financial assets held within that business model) and how those risks are managed; and |
| ● | The frequency, volume and timing of sales of financial assets in prior periods, the reasons for such sales and its expectations about future sale activity. However, information about sales activity is not considered in isolation, but as part of an overall assessment of how Grupo Aval’s stated objective for managing the financial assets is achieved and how cash flows are realized. |
Financial assets that are held for trading, for which performance is evaluated on a fair value basis are measured at FVTPL because their objective is neither to collect contractual cash flows nor to collect contractual cash flows and sell the financial assets.
F-26
Grupo Aval Acciones y Valores S.A.
Notes to the Consolidated Financial Statements
For the years ended December 31, 2022, 2021 and 2020
(Amounts expressed in millions of Colombian pesos)
Assessment whether contractual cash flows are solely payments of principal and interest (SPPI)
For the purposes of this assessment, “principal” is defined as the fair value of the financial asset on initial recognition. “Interest” is defined as consideration for the time value of money and for the credit risk associated with the principal amount outstanding during a particular period of time and for other basic lending risks (e.g. liquidity risk and administrative costs), as well as profit margin.
In assessing whether the contractual cash flows are solely payments of principal and interest (SPPI), Grupo Aval considers the contractual terms of the instrument. This includes assessing whether the financial asset contains a contractual term that could change the timing or amount of contractual cash flows such that it would not meet this condition. Upon assessment Group Aval considers:
| ● | Contingent events that would change the amount and timing of cash flows; |
| ● | Leverage covenants; |
| ● | Prepayment and extension terms; |
| ● | Terms that limit Grupo Aval’s claim to cash flows from specified assets; and |
| ● | Features that modify consideration of the time value of money. |
Interest rates on certain commercial and consumer loans originated by Grupo Aval are pegged to standard variable rates generally used in each country where Grupo Aval operates and includes a spread. In Colombia, the standard variable rates are based on the DTF (rate interest calculated as the average for time deposits)s or the interbank rate (in Spanish Interés Bancario de Referencia), or “IBR” rates, both of which are calculated weekly by the Central Bank based on information collected from the Colombian financial system, plus a spread, and in the case of loans in foreign currency issued in Colombian entities and in other countries Grupo Aval uses LIBOR interest rates plus a spread. See Note 4 – “Interest rate benchmark reform”.
In these cases, Grupo Aval assesses whether the discretionary feature is consistent with the SPPI criteria by considering a number of factors, including whether:
| ● | Borrowers are able to prepay the loans without significant penalties, |
| ● | Market competition ensures that interest rates are consistent between banks, and |
| ● | Any regulatory or customer protection framework is in place that requires banks to treat customers fairly. |
A prepayment feature is consistent with the SPPI criterion if the prepayment amount substantially represents unpaid amounts of principal and interest on the principal amount outstanding, which may include reasonable compensation for early termination of the contract.
In addition, a prepayment feature is treated as consistent with this criterion if a financial asset is acquired or originated at a premium or discount to its contractual par amount, and the prepayment amount substantially represents the contractual par amount plus accrued (but unpaid) contractual interest (which may also include reasonable compensation for early termination), and the fair value of the prepayment feature is insignificant upon initial recognition.
Financial liabilities
Grupo Aval classifies its financial liabilities, other than derivatives, financial guarantees and loan commitments, as measured at amortized cost.
F-27
Grupo Aval Acciones y Valores S.A.
Notes to the Consolidated Financial Statements
For the years ended December 31, 2022, 2021 and 2020
(Amounts expressed in millions of Colombian pesos)
iii. Reclassifications
Financial assets
Financial assets are not reclassified subsequent to their initial recognition, except in the period after Grupo Aval’s entities changes their business model for managing financial assets.
iv. Derecognition
Financial assets
Grupo Aval derecognizes a financial asset when the contractual rights to the cash flows from the financial asset expire (see also (v)), or it transfers the rights to receive the contractual cash flows in a transaction in which substantially all of the risks and rewards of ownership of the financial asset are transferred or in which Grupo Aval neither transfers nor retains substantially all of the risks and rewards of ownership but it does not retain control of the financial asset.
At derecognition of a financial asset, the difference between the carrying amount of the asset (or the carrying amount allocated to the portion of the asset derecognized) and the sum of (i) the consideration received (including any new asset obtained less any new liability assumed) and (ii) any cumulative gain or loss that had been recognized in OCI is recognized in profit or loss.
Any cumulative gain/loss recognized in OCI in respect of equity investment securities designated as at FVOCI is not recognized in profit or loss on derecognition of such securities, as explained in (2.10). Any interest in transferred financial assets that qualify for derecognition that is created or retained by Group Aval is recognized as a separate asset or liability.
Grupo Aval enters into transactions whereby it transfers assets recognized on its Consolidated Statement of Financial Position but retains either all or substantially all of the risks and rewards of the transferred assets or a portion of them. In such cases, the transferred assets are not derecognized. Examples of such transactions are securities lending and sale-and-repurchase transactions.
When assets are sold to a third party with a concurrent total rate of return swap on the transferred assets, the transaction is accounted for as a secured financing transaction similar to sale-and repurchase transactions, given that Grupo Aval retains all or substantially all of the risks and rewards of ownership of such assets.
In transactions in which it neither retains nor transfers substantially all of the risks and rewards of ownership of a financial asset and it retains control over the asset, Grupo Aval continues to recognize the asset to the extent of its continuing involvement, determined by the extent to which it is exposed to changes in the value of the transferred asset.
Financial liabilities
Grupo Aval derecognizes a financial liability when its contractual obligations are discharged or cancelled or expire.
v. Modifications of financial assets and financial liabilities
Financial assets
If the terms of a financial asset are modified, then Grupo Aval assesses whether the cash flows of the modified asset are substantially different.
If the cash flows are substantially different, the contractual rights to cash flows from the original financial asset are deemed to have expired. In that case, the original financial asset is derecognized (see (iv)) and a new financial asset is recognized at fair value plus any eligible transaction costs. Any fees received as part of the modification are accounted for as follows:
| ● | Fees that are considered in determining the fair value of the new asset and fees that represent reimbursement of eligible transaction costs are included in the initial measurement of the asset; and |
| ● | Other fees are included in profit or loss as part of the gain or loss on derecognition. |
If cash flows are modified when the borrower is in financial distress, the objective of the modification is usually to maximize recovery of the original contractual terms rather than to originate a new asset with substantially different terms. If Group Aval plans to modify
F-28
Grupo Aval Acciones y Valores S.A.
Notes to the Consolidated Financial Statements
For the years ended December 31, 2022, 2021 and 2020
(Amounts expressed in millions of Colombian pesos)
a financial asset in a way that would result in foregoing of cash flows, it considers whether a portion of the asset should be written off before the modification takes place (see below for write‑off policy). This approach impacts the result of the quantitative evaluation and means that the derecognition criteria are not usually met in such cases.
If the modification of a financial asset measured at amortized cost or FVOCI does not result in derecognition of the financial asset, then Grupo Aval recalculates the gross carrying amount of the financial asset using the original effective interest rate of the asset and recognizes the resulting adjustment as a recovery or impairment in the Consolidated Statement of Income. For variable-rate financial assets, the original effective interest rate used to calculate the modification gain or loss is adjusted to reflect current market terms at the time of the modification. Any costs or fees incurred, and fees received as part of the modification are incorporated into the gross carrying amount of the modified financial asset and are amortized over the remaining term of the modified financial asset.
Financial liabilities
Grupo Aval derecognizes a financial liability when its terms are modified, and the cash flows of the modified liability are substantially different. In this case, a new financial liability based on the modified terms is recognized at fair value. The difference between the carrying amount of the financial liability extinguished and the new financial liability with modified terms is recognized in the Consolidated Statement of Income.
If the modification of a financial liability measured at amortized cost does not result in derecognition of the financial liability, then Grupo Aval first recalculates the gross carrying amount of the financial liability using the original effective interest rate of the liability and recognizes the resulting adjustment as interest expense in the Consolidated Statement of Income. For variable-rate financial assets, the original effective interest rate used to calculate the modification gain or loss is adjusted to reflect current market terms at the time of the modification. Any costs or fees incurred, and fees received as part of the modification are incorporated into the gross carrying amount of the modified financial liability and are amortized over the remaining term of the modified financial liability.
vi. Offsetting of financial assets and liabilities
Financial assets and liabilities are offset, and the net amount is recognized in the Consolidated Statement of Financial Position, when there is a legally enforceable right to offset recognized amounts and management intends to settle them on a net basis or to realize the asset and settle the liability simultaneously.
Income and expenses are presented on a net basis only when permitted under IFRS, or for gains and losses arising from a group of similar transactions such as Grupo Aval’s trading activity.
vii. Fair value measurement
“Fair value is the price that would be received to sell an asset or paid to transfer a liability in an orderly transaction between market participants at the measurement date in the principal or, in its absence, the most advantageous market to which Grupo Aval has access at that date.
Grupo Aval measures the fair value of an instrument using the quoted price in an active market for that instrument. A market is regarded as active if transactions for the asset or liability take place with sufficient frequency and volume to provide pricing information on an ongoing basis.
If there is no quoted price in an active market, Grupo Aval uses valuation techniques that maximize the use of relevant observable inputs and minimize the use of unobservable inputs. The chosen valuation technique incorporates all of the factors that market participants would take into account in pricing a transaction.
The best evidence of the fair value of a financial instrument on initial recognition is normally the transaction price – i.e. the fair value of the consideration given or received. If Grupo Aval determines that the fair value on initial recognition differs from the transaction price and the fair value is evidenced neither by a quoted price in an active market for an identical asset or liability nor based on a valuation technique for which any unobservable inputs are deemed to be insignificant in relation to the measurement, then the financial instrument is initially measured at fair value, adjusted to defer the difference between the fair value on initial recognition and the transaction price. Subsequently, that difference is recognized in the Consolidated Statement of Income on an appropriate basis over the life of the instrument but no later than when the valuation is wholly supported by observable market data or the transaction is closed out.
F-29
Grupo Aval Acciones y Valores S.A.
Notes to the Consolidated Financial Statements
For the years ended December 31, 2022, 2021 and 2020
(Amounts expressed in millions of Colombian pesos)
Portfolios of financial assets and financial liabilities that are exposed to market risk and credit risk, managed by Grupo Aval on the basis of the net exposure to either market or credit risk are measured on the basis of a price that would be received to sell a net long position (or paid to transfer a net short position) for the particular risk exposure. Portfolio-level adjustments – e.g. bid-ask adjustment or credit risk adjustments that reflect the measurement on the basis of the net exposure – are allocated to the individual assets and liabilities on the basis of the relative risk adjustment of each of the individual instruments in the portfolio.
The fair value of a financial liability with a demand feature (e.g. a demand deposit) is no less than the amount payable on demand, discounted from the first date on which the amount could be required to be paid.
Grupo Aval recognizes transfers between levels of the fair value hierarchy as of the end of the reporting period during which the change has occurred. See Note 5.
viii. Repurchase agreements and reverse repurchase agreements
Purchases of financial instruments under a non-optional resale agreement are measured at fair value and recognized as financial assets in the Consolidated Statement of Financial Position under interbank and overnight funds.
The excess of the purchase prices over the resale prices is recognized as interest income over the contractual term.
Sales of financial instruments under a non-optional repurchase agreement are measured at fair value and recognized as liabilities in the Consolidated Statement of Financial Position under Interbank borrowings, overnight funds and borrowings from banks and others.
The excess of the sales prices over the repurchase prices is recognized as interest expense over the contractual term.
Retained interests (i.e. the assets that collateralize the repurchase agreements) are primarily classified as fair value through OCI and measured at fair value.
ix. Impairment of financial assets
Grupo Aval recognizes loss allowances for Expected Credit Losses – (“ECL”) on the following financial instruments that are not measured at FVTPL:
| ● | Debt investment instruments; |
| ● | Loans and receivables; |
| ● | Financial guarantee contracts issued; |
| ● | Loan commitments issued, and |
| ● | Other accounts receivable |
No credit impairment loss is recognized on equity investments.
Grupo Aval measures loss allowances at an amount equal to lifetime ECL (Stage 2 and stage 3), except the following cases, for which they are measured as 12-month ECL (Stage 1):
| ● | Debt investment securities that are determined to have low credit risk at the reporting date; and |
| ● | Other financial instruments (other than loans and lease receivables) on which credit risk has not increased significantly – (“SICR”) since their initial recognition. |
Grupo Aval considers a financial asset is classified as a low credit risk asset if the issuer is related to an investment grade credit rating.
12-month ECL is the portion of ECL that results from default events on a financial instrument that are possible within the 12 months after the reporting date.
F-30
Grupo Aval Acciones y Valores S.A.
Notes to the Consolidated Financial Statements
For the years ended December 31, 2022, 2021 and 2020
(Amounts expressed in millions of Colombian pesos)
Measurement of ECL
Measurement of ECL is described in Note 4(4.1.5 Amounts arising from ECL).
Modified Financial Assets
If the terms of a financial asset are renegotiated or modified or an existing financial asset is replaced with a new one due to financial distress of the borrower, an assessment is made of whether the financial asset should be derecognized (see (iv)) and ECL are measured as follows:
| ● | If the restructuring is not expected to result in derecognition of the existing asset, then the expected cash flows arising from the modified financial asset are included in calculating the cash shortfalls from the existing asset (see Note 4(4.1.1)). |
| ● | If the restructuring is expected to result in derecognition of the existing asset, then the expected fair value of the new asset is treated as the final cash flow from the existing financial asset at the time of its derecognition. This amount is included in calculating the cash shortfalls from the existing financial asset that are discounted from the expected date of derecognition to the reporting date using the original effective interest rate of the existing financial asset. |
Credit-impaired financial assets
At each reporting date, Grupo Aval assesses whether financial assets carried at amortized cost and at FVOCI are credit-impaired. A financial asset is ‘credit-impaired’ when one or more events that have a detrimental impact on the estimated future cash flows of the financial asset have occurred.
Evidence that a financial asset is credit-impaired includes the following observable data:
| ● | Significant financial difficulty of the borrower or issuer; |
| ● | A breach of contract such as a default or past due event; |
| ● | The restructuring of a loan or advance by Grupo Aval on terms that Grupo Aval’ entities would not consider otherwise; |
| ● | It is becoming probable that the borrower will enter bankruptcy or other financial reorganization; or |
| ● | The disappearance of an active market for a security because of financial difficulties. |
A loan that has been renegotiated due to a deterioration in the borrower’s condition is usually considered to be credit-impaired unless there is evidence that the risk of not receiving contractual cash flows has decreased significantly and there are no other indicators of impairment. In addition, a loan different to a mortgage that is overdue for 90 days or more is considered impaired.
In making an assessment of whether an investment in sovereign debt is credit-impaired, Grupo Aval considers the following factors.
| ● | The market’s assessment of creditworthiness as reflected in the bond yields. |
| ● | The rating agencies’ assessments of creditworthiness. |
| ● | The country’s ability to access the capital markets for new debt issuance. |
| ● | The probability of debt being restructured, resulting in holders suffering losses through voluntary or mandatory debt forgiveness; and |
| ● | The international support mechanisms in place to provide the necessary support as ‘lender of last resort’ to that country, as well as the intention, reflected in public statements, of governments and agencies to use those mechanisms. This includes an assessment of the depth of those mechanisms and, irrespective of the political intent, whether there is the capacity to fulfil the required criteria. |
x. Presentation of allowance for ECL in the Consolidated Statement of Financial Position
Loss allowances for ECL are presented in the Consolidated Statement of Financial Position and the impact is showed in the Consolidated Statement of Income line “Impairment (losses) recoveries on financial assets” as follows:
| ● | Financial assets measured at amortized cost: as a deduction from the gross carrying amount of the assets; |
| ● | Loan commitments and financial guarantee contracts: generally presented as provisions; |
| ● | Where a financial instrument includes both a drawn and an undrawn component, and Grupo Aval cannot identify the ECL on the loan commitment component separately from those on the drawn component: Grupo Aval presents a combined loss allowance for both components. The combined amount is presented as a deduction from the gross carrying amount of the |
F-31
Grupo Aval Acciones y Valores S.A.
Notes to the Consolidated Financial Statements
For the years ended December 31, 2022, 2021 and 2020
(Amounts expressed in millions of Colombian pesos)
| drawn component. Any excess of the loss allowance over the gross amount of the drawn component is presented as a provision; and |
| ● | Debt instruments measured at FVOCI: no loss allowance is recognized in the Consolidated Statement of Financial Position because the carrying amount of these assets is their fair value. However, the ECL is disclosed and is recognized as part of the net change recognized in the fair value reserve under other comprehensive income. |
xi. Write-offs
Loans and debt securities are written off (either partially or in full) when there is no prospect of recovery. This is generally the case when Grupo Aval determines that the borrower does not have assets or sources of income that could generate sufficient cash flows to repay the amounts subject to be written-off.
Recoveries of amounts previously written off are included in “recovery of charged off financial assets” in the Consolidated Statement of Income.
Financial assets that are written off could still be subject to enforcement activities in order to comply with Grupo Aval’s procedures for recovery of amounts due. The contractual amount outstanding on the financial assets that were written off during the reporting period are disclosed in note 4.1.5 Amounts arising from ECL; Loss Allowance reconciliation tables.
2.6 Cash and cash equivalents
Cash and cash equivalents include cash, bank deposits, and other short-term investments with original maturities of three months or less from the date of their acquisition that are subject to an insignificant risk of changes in their fair value and are used by Grupo Aval in the management of its short-term commitments.
2.7 Trading assets and liabilities
‘Trading assets and liabilities’ are those assets and liabilities that Grupo Aval mainly acquires or incurs for the purpose of selling or repurchasing in the near term or holds as part of a portfolio that is managed comprehensively for short-term profit or position taking. Trading assets and liabilities are initially recognized and subsequently measured at fair value in the Consolidated Statement of Financial Position, with transaction costs recognized in Consolidated Statement of Income. All changes in fair value are recognized as part of net trading income in Consolidated Statement of Income.
2.8 Derivatives
a) Derivatives and hedge accounting
A derivative is a financial instrument for which value changes respond to changes in one or more variables denominated as “underlying” (e.g. a specific interest rate, the price of a financial instrument, a listed commodity, a foreign currency exchange rate, etc.). A derivative requires no initial net investment or an initial net investment that is smaller than would be required for other types of contracts that would be expected to have a similar response to changes in market factors.
Grupo Aval and its subsidiaries trades in financial markets, forward contracts, future contracts, swaps and options that fulfil the definition of a derivative.
Financial assets and liabilities arising from transactions with derivatives are generally not offset in the Consolidated Statement of Financial Position. However, when there is a legal and exercisable right to offset the recognized values and Grupo Aval intends to settle them on a net basis or to realize the assets and settle the liability simultaneously, derivatives are presented as net values in the Consolidated Statement of Financial Position.
Derivative transactions are initially recognized at fair value. Subsequent changes in the fair value are recognized in profit or loss, unless the derivative instrument is designated as a hedging instrument and, in this case, the accounting criteria will depend on the nature of the hedged item, as described below.
At the beginning of the hedging transaction, Grupo Aval formally documents the existing relationship between the hedging instrument and the hedged item, including the risk management objective and strategy in undertaking the hedging relationship. It
F-32
Grupo Aval Acciones y Valores S.A.
Notes to the Consolidated Financial Statements
For the years ended December 31, 2022, 2021 and 2020
(Amounts expressed in millions of Colombian pesos)
also documents its assessment, both initially as well as on a recurring basis, of whether the hedging relationship is highly effective in offsetting the changes in fair value or cash flows of the hedged items.
The applicable policy for hedging and embedded derivatives is described below:
| (i) | For fair value hedge of assets or liabilities and firm commitments, changes in the fair value of the derivative instrument are recognized in profit or loss, as well as any other change in the fair value of the asset, liability or firm commitment attributable to the hedge risk, |
| (ii) | For cash flow hedge of a particular risk associated with a recognized asset or liability or a projected highly probable transaction, the effective portion of changes in the fair value of the derivative is recognized in other comprehensive income. The gain or loss relating to the portion that is not effective for hedging or that does not relate to the hedged risk is immediately recognized in profit or loss. |
The values accumulated in other comprehensive income are transferred to profit or loss in the same period in which the hedged item is recognized in profit or loss; and
| (iii) | Hedging of net investments in a foreign operation is recognized similarly to cash flow hedging: the effective portion of changes in fair value of the hedging instrument is recognized in other comprehensive income, and the ineffective portion of the changes in fair value of the derivative is recognized in profit or loss. The hedging instrument’s gains or losses accumulated in equity will be recognized in profit or loss when the net investment in foreign operations is sold or partially disposed of. |
b) Embedded derivatives
Derivatives may be embedded in another contractual arrangement (a host contract). Grupo Aval accounts for an embedded derivative separately from the host contract when:
| ● | The host contract is not a financial asset in the scope of IFRS 9; |
| ● | The host contract is not itself carried at FVTPL; |
| ● | The terms of the embedded derivative would meet the definition of a derivative if they were contained in a separate contract; and |
| ● | The economic characteristics and risks of the embedded derivative are not closely related to the economic characteristics and risks of the host contract. |
Separated embedded derivatives are measured at fair value, with all changes in fair value recognized in profit or loss unless they form part of a qualifying cash flow or net investment hedging relationship. Separated embedded derivatives are presented in the Consolidated Statement of Financial Position together with the host contract.
2.9 Loans
The ‘Loans’ line item in the Consolidated Statement of Financial Position include:
| ● | Loans measured at amortized cost (see 2.5(ii)); they are initially measured at fair value plus incremental direct transaction costs, and subsequently at their amortized cost using the effective interest method; |
| ● | Financial lease receivables measured at amortized cost (see 2.5(ii)). |
When Grupo Aval purchases a financial asset and simultaneously enters into an agreement to resell the asset (or a substantially similar asset) at a fixed price on a future date (reverse repo or stock borrowing), the arrangement is accounted for as a loan, and the underlying asset is not recognized in Grupo Aval’s Consolidated Financial Statements.
The effective interest rate method is a method of calculating the amortized cost of a financial asset and allocating the interest income or expense over the relevant period. The effective interest rate is the rate that discounts future cash payments or receipts (without consideration of future credit losses, over the expected life of the financial instrument) to the net carrying amount of the financial asset at initial recognition. In the process of calculating the effective interest rate, Grupo Aval estimates the cash flows considering the contractual terms including prepayment expectations of the financial instrument for portfolios with high prepayment levels,
F-33
Grupo Aval Acciones y Valores S.A.
Notes to the Consolidated Financial Statements
For the years ended December 31, 2022, 2021 and 2020
(Amounts expressed in millions of Colombian pesos)
except for future credit losses and considering the initial fair value plus transaction costs and premiums granted, minus commissions and discounts received which form integral part of the effective rate.
2.10 Investment securities
The ‘investment securities’ line in the Consolidated Statement of Financial Position includes:
| ● | Debt investment securities measured at amortized cost (see 2.5(ii)); These are initially measured at fair value plus incremental direct transaction costs, and subsequently at their amortized cost using the effective interest method; |
| ● | Debt and equity investment securities mandatorily measured at FVTPL (see 2.5(ii)); These are at fair value with changes recognized immediately in profit or loss; |
| ● | Debt securities measured at FVOCI; and |
| ● | Equity investment securities designated as at FVOCI. |
For debt investment securities measured at FVOCI, gains and losses are recognized in OCI, except for the following, which are recognized in profit or loss in the same manner as for financial assets measured at amortized cost:
| ● | Interest revenue using the effective interest method; |
| ● | ECL impairments and reversals of impairments; and |
| ● | Foreign exchange gains and losses. |
When a debt security measured at FVOCI is derecognized, the cumulative gain or loss previously recognized in OCI is reclassified from equity and recognized as profit or loss in the Consolidated Statement of Income under “other income net gain on sale of debt and equity securities”.
Grupo Aval elects to present changes in the fair value of certain investments in equity instruments that are not held for trading in OCI. The election is made on an instrument-by-instrument basis on initial recognition and is irrevocable.
Gains and losses on such equity instruments are never reclassified to profit or loss and no impairment is recognized in profit or loss. Cumulative gains and losses recognized in OCI are transferred to retained earnings upon disposal of an investment. Dividends are recognized in profit or loss unless they clearly represent a recovery of part of the cost of the investment, in which case they are recognized in OCI.
After initial recognition, net gains and losses resulting from changes in fair value for financial assets classified and measured at fair value, are presented either (i) in the Consolidated Statement of Income in the account “net trading income - trading investment securities” for financial assets at FVTPL or (ii) in OCI for financial instruments at FVOCI, in accordance with note 2.5 ii) above.
In turn, after their initial recognition, financial assets classified at amortized cost are adjusted to reflect interest accrued at the effective interest rate method, less payments received from borrowers.
See detail of effective interest rate method in note 2.9 Loans
Income from dividends from financial assets in equity instruments at FVOCI is recognized in income in the account of “other income dividends” when the right to receive payment is established, regardless of the decision that has been made to record the variations in fair value in results or OCI.
2.11 Financial liabilities
A financial liability is any contractual liability in which Grupo Aval commits to deliver cash or other financial asset to another entity or person, or to exchange financial assets or financial liabilities under potentially unfavorable conditions for Grupo Aval, or a contract which will be terminated or could be settled using equity instruments owned by the entity. Financial liabilities are initially recognized based on their fair value, which is usually equal to the transaction value adjusted by directly attributable costs. Subsequently, such financial liabilities are measured at their amortized cost according to the effective interest rate method determined at initial recognition and recognized in profit or loss.
F-34
Grupo Aval Acciones y Valores S.A.
Notes to the Consolidated Financial Statements
For the years ended December 31, 2022, 2021 and 2020
(Amounts expressed in millions of Colombian pesos)
Financial liabilities are only derecognized from the Consolidated Statement of Financial Position when the obligations are extinguished, that is, when the obligations are discharged, cancelled, or expire.
2.12 Financial guarantees
Financial guarantees are those contracts requiring that the issuer carries out specific payments to reimburse the creditor for losses incurred when a specific debtor defaults in its payment obligation, in accordance with the original or modified conditions, of a debt instrument; regardless of its legal form.
Financial guarantees issued or commitments to provide a loan at a below-market interest rate are initially measured at fair value. Subsequently, they are measured:
| ● | As at the highest value between the amount initially recognized net of the loss allowance determined in accordance with IFRS 9 (see 2.5 (vii)) and the amount initially recognized less, when appropriate, the cumulative amount of income recognized in accordance with the principles of IFRS 15. |
| ● | As of the reporting date Grupo Aval has no loan commitments that are measured at FVTPL. |
Credit risk impairment losses established over financial guarantee contracts under IFRS 9, are recognized as liabilities under “Provisions – other provisions” and recognized in profit or loss under “other expenses”, see note 2.5 ix “Impairment of financial assets in the Consolidated Statement of Financial Position”.
2.13 Non-current assets held for sale and discontinued operations
Foreclosed assets and non-current assets held for sale, which Grupo Aval intends to sell in a period of less than one year, and it is considered highly probable that their value will be recovered primarily through sale rather than through continuing use, are recognized as "non-current assets held for sale". These assets are measured at the lower of their carrying value at the time of transfer and fair value, less estimated disposal costs.
A discontinued operation is a component of the entity that has been disposed of or is classified as held for sale and that represents a separate major line of business or geographical area of operations, is part of a single co-ordinated plan to dispose of such a line of business or area of operations, or is a subsidiary acquired exclusively with a view to resale. The results of discontinued operations are presented separately in the Consolidated Statement of Income.
2.14 Property, plant and equipment for own use
Property, plant and equipment include the assets, owned or under financial leases held by Grupo Aval for current or future use for more than one period.
They are recognized in the Consolidated Statement of Financial Position at their acquisition or construction cost, less the corresponding accumulated depreciation and, if applicable, the estimated impairment losses resulting from comparing the carrying amount of each asset with its recoverable value.
Depreciation is calculated by applying the straight-line method over the acquisition cost of the assets (except for the bearer plants, which are depreciated based on production units), less any residual value; land is not depreciated.
The annual depreciation rates for each type of assets are:
Asset |
| Useful Life |
Own use buildings |
| According to appraisals |
Equipment, furniture and accessories |
| From |
Machinery and equipment (*) |
| From |
Computer equipment |
| From |
Vehicles |
| From |
Bearer plants |
| From |
(*) Except for the gas pipelines, these are depreciated according to appraisals (70 years).
Conservation and maintenance expense is recognized when incurred as “Administrative Expense”.
F-35
Grupo Aval Acciones y Valores S.A.
Notes to the Consolidated Financial Statements
For the years ended December 31, 2022, 2021 and 2020
(Amounts expressed in millions of Colombian pesos)
At each reporting date, the Group analyzes whether there are signs, that an asset may be impaired for such purposes, develops what is established in policy 2.21 "Impairment of non-financial assets".
A bearer plant is a live plant that meets the following requirements:
| a) | It is used for the manufacturing or supply of agricultural products; |
| b) | It is expected to produce for more than one period; and |
| c) | It has a remote probability of being sold as an agricultural product, except for irregular sales related to thinning and trimming. |
Bearer plants under the set-up and growing phase are subject to a biological transformation which is reflected through cost accumulation until they reach their maturity level. In the case of the African oil palm, maturity is reached in the second year, while maturity for rubber plants is reached in the seventh year. After reaching their maturity, bearer plants are considered developed and the future economic benefits arise from the sale of the fruit produced during the useful life of the plant.
Bearer plants are measured at their cost less accumulated depreciation and any impairment losses. The useful life is equal to the plants´ production periods. The useful life of the rubber plant is
2.15 Investment properties
Land and buildings, considered in whole or in part, that are held to earn rental income or for capital appreciation, rather than for own use or sale in the ordinary course of business. Investment properties are recognized initially at cost, including all costs associated with the transaction, and subsequently measured at fair value, with changes in fair value recognized in profit or loss.
2.16 Leases
Lessee accounting
At inception of a contract, Grupo Aval assesses whether a contract is, or contains, a lease. A contract is, or contains, a lease if the contract conveys the right to control the use of an identified asset for a period of time in exchange for consideration. To assess whether a contract conveys the right to control the use of an identified asset, the Group uses the definition of a lease in IFRS 16.
Grupo Aval recognizes a right-of-use asset and a lease liability at the lease commencement date.
The right-of-use asset is initially measured at cost, which comprises the initial amount of the lease liability adjusted for any lease payments made at or before the commencement date, plus any initial direct costs incurred and an estimate of costs to dismantle and remove any improvements made.
The right-of-use asset is subsequently depreciated using the straight-line method from the commencement date to the end of the lease term. In addition, the right-of-use asset is periodically reduced by impairment losses, if any, and adjusted for certain remeasurements of the lease liability.
The lease liability is initially measured at the present value of the lease payments that are not paid at the commencement date, discounted using the interest rate implicit in the lease or, if that rate cannot be readily determined, the Group’s incremental borrowing rate. Generally, the Group uses its incremental borrowing rate as the discount rate.
Grupo Aval determines its incremental borrowing rate by analyzing its borrowings from various external sources and makes certain adjustments to reflect the terms of the lease and type of asset leased.
When the lease liability is remeasured in this way, a corresponding adjustment is made to the carrying amount of the right-of-use asset; or is recorded in profit or loss if the carrying amount of the right-of-use asset has been reduced to zero.
Grupo Aval presents right-of-use assets in ‘Tangible assets’ and lease liabilities in ‘Borrowings from banks and others’ in the Consolidated Statement of Financial Position.
F-36
Grupo Aval Acciones y Valores S.A.
Notes to the Consolidated Financial Statements
For the years ended December 31, 2022, 2021 and 2020
(Amounts expressed in millions of Colombian pesos)
Short-term leases and leases of low-value assets
Grupo Aval has elected not to recognize right-of-use assets and lease liabilities for leases of low-value assets and short-term leases. The Grupo Aval recognizes the lease payments associated with these leases as an expense on a straight-line basis over the lease term.
Lessor accounting
When Grupo Aval acts as a lessor, it determines at lease inception whether the lease is a finance lease or an operating lease. To classify each lease, the Group makes an overall assessment of whether the lease transfers substantially all of the risks and rewards incidental to ownership of the underlying asset. If this is the case, then the lease is a finance lease; if not, then it is an operating lease. As part of this assessment, the Group considers certain indicators such as whether the lease is for a major part of the economic life of the asset. Lease contracts classified as financial leases are included in the Consolidated Statement of Financial position as “Loans” and are recognized in the same way as other loans, as explained in note 2.9.
2.17 Biological assets
Biological assets; are measured at fair value less disposal cost, both at the time of initial recognition and at the end of reporting period, except for biological assets for which fair value cannot be measured reliably; in which case they are measured at cost less accumulated depreciation and impairment loss. Gains and losses arising from the initial and subsequent fair value measurement of the agricultural products are included in the Consolidated Statement of Income. Costs incurred in the agricultural production process are also recognized directly in the Consolidated Statement of Income.
The fair value of biological assets is determined using valuations performed by experienced internal professionals, using discounted cash flow models. The expected cash flows of the crop’s total life are determined by using the market price of the agricultural product currently in effect and the estimated productive life of plants, net of maintenance and harvest costs and of any other costs required for plant maintenance during the production period. The productive life of plants is estimated considering the age, location and type of product. The fair value of the biological assets is dependent on current market prices for each product.
2.18 Business combinations and goodwill
Business combinations are accounted for using the “acquisition method” when control is transferred to the controlling entity. The consideration transferred in the acquisition is generally measured at fair value, as are the identifiable net assets acquired. If non-controlling interests arise during the acquisition of control of the entity, such non-controlling interests are recognized at either fair value.
Goodwill is measured as the excess of the aggregate of consideration transferred, over the amount of any interest previously acquired and the net of identifiable assets acquired and liabilities assumed at acquisition date. Goodwill acquired in a business combination is assigned to each of the groups of cash-generating units from which benefit are expected as a result of the acquisition. Goodwill is not subsequently amortized; however, it is subject to an annual impairment assessment in relation to the cash-generating unit to which it has been assigned and, from which benefits are expected deriving from the synergies of business combinations. A loss due to impairment recognized on Goodwill cannot be reversed in subsequent periods.
2.19 Other intangible assets
Other intangible assets mainly comprise software and licenses, which are initially measured at the cost of acquisition or cost of development. Costs incurred during the research phase are expensed as incurred.
Development expenses which are directly attributable to design and performance tests of software and identifiable, unique and controlled by Grupo Aval are recognized as intangible assets, if following conditions are met:
| ● | Technically, it is possible to complete the intangible asset production, so it can be available for use; |
| ● | Management intends to complete the corresponding intangible asset for use; |
| ● | Management has the capacity of using the intangible asset; |
| ● | It is probable that future economic benefits that are attributable to the asset will flow to the entity; |
F-37
Grupo Aval Acciones y Valores S.A.
Notes to the Consolidated Financial Statements
For the years ended December 31, 2022, 2021 and 2020
(Amounts expressed in millions of Colombian pesos)
| ● | There is availability of adequate technical or financial resources or other type, for completion and usage of the intangible asset; and |
| ● | Costs attributable to the intangible asset during its development phase can be estimated and measured in a reliable manner. |
Costs that are directly attributable and capitalized as part of intangible assets include personnel expense directly related to developing such intangibles and overhead expenses that can be capitalized.
Expenses that do not satisfy these criteria are recognized as incurred expenses. Disbursements over intangible assets are initially recognized as expenses of the period and they are not subsequently recognized as intangible assets.
After initial recognition, an intangible asset shall be carried at its cost less any accumulated amortization and any accumulated impairment losses. The annual amortization rates estimate for each type of assets are:
Intangible Asset |
| Useful Life |
|---|---|---|
Software and information technology applications |
| From |
Licenses |
| From |
Trademarks |
| Indefinite |
Customer-related assets |
| From |
Intellectual property rights |
| From |
Models, formulas, designs and prototypes |
| |
Easements | From |
At the end of each period, the Group will test whether an intangible asset with an indefinite useful life has experienced an impairment loss by comparing its recoverable amount with its carrying amount on an annual basis and not only when there are indications of impairment. Likewise, that the useful life of an intangible asset that is not being amortized will be reviewed every period to determine if there are facts and circumstances that allow continuing to maintain an indefinite useful life for that asset. Any impairment loss or subsequent reversal is recognized in the Consolidated Statement of Income; Such impairment is determined by the excess of the book value over the recoverable value.
2.20 Concession arrangements rights
Concession contracts, are those in virtue of which certain subsidiaries of Grupo Aval make a commitment with the Governments in the countries in where they operate for the construction or maintenance of infrastructure, for a period of time during which, said entities receive the revenue derived from the contract, either through direct payments from the Government, through tolls or other types of fees charged to the end users of the project, which, are recognized as financial assets or intangible assets.
A financial asset is recognized when pursuant to the contractual conditions, there is an entitlement to an unconditional contractual right of receiving cash or other financial assets from the grantor or from the Government, due to construction services or when the Government guarantees minimum income from tolls or fees charged to the users of the concession work during the term of the concession agreement.
An intangible asset is recognized if in the concession contract does not include an unconditional right for the concessionaire to receive cash and, on the contrary, its revenue depends on the right it has for the use of the infrastructure under concession. In some cases, contracts can contain both financial and intangible assets.
Concession arrangements are recognized as follows:
| (a) | During the construction stage, all estimated income for construction services as well as the costs associated to the construction are recognized in the Consolidated Statement of Income based on the stage of completion of the work performed. In the event that there is an expected loss, this is recognized as an expense immediately. |
| (b) | If all or part of the concession arrangement is classified as a financial asset, it is recognized in accordance with the accounting policy for financial assets as set out in note 2.5. |
| (c) | If all or part of the concession contract is classified as an intangible asset, the revenues are accumulated as intangible assets during the construction phase of the project, assets and are amortized over the term of the arrangement in a manner that reflects the pattern in which the concession asset’s economic benefits are consumed by the entity, from the moment the asset enters into service. |
F-38
Grupo Aval Acciones y Valores S.A.
Notes to the Consolidated Financial Statements
For the years ended December 31, 2022, 2021 and 2020
(Amounts expressed in millions of Colombian pesos)
2.21 Impairment of non-financial assets
At each reporting date, Grupo Aval reviews the carrying amounts of its non-financial assets (other than investment properties and deferred tax assets) to determine whether there is any indication of impairment. If any such indication exists, then the asset’s recoverable amount is estimated.
Goodwill is tested annually for impairment. For impairment testing, assets are grouped together into the smallest group of assets that generates cash inflows from continuing use that is largely independent of the cash inflows of other assets or Cash Generating Units (CGU). Goodwill arising from a business combination is allocated to CGUs or groups of CGUs that are expected to benefit from the synergies of the combination.
The “recoverable amount” of an asset or CGU is the greater of its value in use and its fair value less costs to sell. “Value in use” is based on the estimated future cash flows, discounted to their present value using a pre-tax discount rate that reflects current market assessments of the time value of money and the risks specific to the asset or cash generating units “CGU”.
An impairment loss is recognized if the carrying amount of an asset or CGU exceeds its recoverable amount.
Impairment losses are recognized in profit or loss. They are allocated first to reduce the carrying amount of any goodwill allocated to the CGU, and then to reduce the carrying amounts of the other assets in the CGU on a pro rata basis.
An impairment loss of goodwill cannot be reversed. For other assets, an impairment loss is reversed only to the extent that the asset’s carrying amount does not exceed the carrying amount that would have been determined, net of depreciation or amortization, if no impairment loss had been recognized.
2.22 Employee Benefits
Grupo Aval´s entities provide the following benefits to employees in exchange of services rendered to the Group:
| a) | Short-term employee benefits |
Pursuant to Colombian and other countries labor rules, such benefits are comprised of salaries, premiums, vacations, severance payments and payroll tax contributions to the local Government designated agencies which are paid within 12 months following the end of the reporting period. Such benefits are accumulated on an accrual basis and recognized in profit or loss.
| b) | Post-employment benefits (defined benefit plans) |
Grupo Aval pays to its employees certain benefits when they retire or upon completion of their employment period, other than indemnities. These benefits include retirement pensions which are directly assumed by Grupo Aval’s entities, pending severance payments to employees belonging to the labor regime prior to Law 50 1990 in Colombia, and certain extra-legal benefits or benefits agreed in collective bargaining agreements.
Post-employment benefits liabilities are determined based on the present value of estimated future payments, calculated based on actuarial assessments using the projected unit of credit method, and applying actuarial assumptions about mortality rate, increase of salaries and personnel turnover, and interest rates determined with reference to bond market returns of local Government’ bonds or high-quality business liabilities in effect at the reporting date. Under the projected unit of credit method, future benefits to be paid to employees are assigned to each accounting period in which the employee renders the service. Therefore, the corresponding expense due to these benefits recognized in profit or loss of Grupo Aval includes the present service cost assigned in the actuarial calculation plus the financial cost of calculated liabilities. Changes in liabilities due to changes in actuarial assumptions are recognized in Other Comprehensive Income.
Changes in actuarial liabilities due to changes in employment benefits granted to employees that have a retroactive effect are recognized as an expense in the earlier of the following dates:
| ● | When a modification of the granted employment benefits takes place, or |
| ● | When provisions for restructuring costs are recognized by a subsidiary. |
F-39
Grupo Aval Acciones y Valores S.A.
Notes to the Consolidated Financial Statements
For the years ended December 31, 2022, 2021 and 2020
(Amounts expressed in millions of Colombian pesos)
| c) | Other long-term employee benefits |
Long term benefits are different from employee short-term benefits, post-employment benefits and termination benefits. In accordance with the collective bargaining agreements and regulations of each company of Grupo Aval, such benefits are mainly related to seniority bonuses.
Long-term liabilities for employee benefits are determined in the same manner as post-employment benefits described in item (b) above; the only difference is that the changes in the actuarial liability due to changes in the actuarial assumptions are recognized in profit or loss.
| d) | Termination benefits |
These benefits are payments which must be made by Grupo Aval´s entities derived from their taking the unilateral decision of terminating and employee´s labor contract or from and employee´s decision to accept benefits offered by an entity in exchange for terminating the employment contract, such payments correspond to severances for dismissal or redundancy and other benefits that entities unilaterally decide to grant to their employees under such circumstances.
Termination benefits are recognized as a liability and in profit or loss at the earlier of the following dates:
| ● | When Grupo Aval´s entities formally inform to the employee about its decision of dismissal; or |
| ● | When provisions for restructuring costs are recognized by a subsidiary. |
2.23 Income taxes
Income tax expense includes both current and deferred tax. Tax expense is recognized in profit or loss except for items recognized in Other Comprehensive Income or directly in equity.
Current income tax expense is calculated based on the tax laws in force (enacted or substantively enacted) in each of the countries in which we operate as of the reporting date of the Consolidated Financial Statements is subject to the income tax. Management of each subsidiary of Grupo Aval periodically assesses tax return positions with respect to situations where the applicable tax regulation is subject to interpretation and establishes provisions, when appropriate, on the basis of amounts expected to be paid to tax authorities.
Deferred taxes are recognized with respect to temporary differences arising between carrying amounts of assets and liabilities for financial reporting purposes and the amounts used for tax purposes. Deferred taxes are not recognized for: (i) temporary differences on the initial recognition of goodwill; (ii) temporary differences on the initial recognition of an asset or liability in a transaction that is not a business combination and that affects neither the accounting nor the taxable profit or loss and (iii) temporary differences related to investments in subsidiaries to the extent that it is probable that they will not reverse in the foreseeable future. Deferred taxes are measured using the tax rates that are expected to be applied to the temporary differences upon reversal, using enacted tax rates or substantively enacted at the reporting date.
Deferred taxes assets are only recognized to the extent it is probable that future taxable income is expected to be available to offset temporary differences.
Deferred tax liabilities arise from taxable temporary differences, except for the deferred tax liabilities on investments in subsidiaries, when the opportunity of reversal of temporary differences is controlled by Grupo Aval and it is not expected to be reversed in the near future. Generally, Grupo Aval has the ability to control the temporary differences of investments in associates.
Current taxes are offset only when the entity has a legally enforceable right to offset and the entity intends to either settle on a net basis or to realize the asset and settle the liability simultaneously. Deferred taxes are offset when the entity has a legally enforceable right to offset current tax assets against current tax liabilities and when the deferred tax assets and liabilities are related to income taxes levied by the same tax authority over the same taxable entity or over different entities but these entities have an intention to settle current tax liabilities and assets on a net basis or their tax assets and liabilities will be realized simultaneously, for each period in which these differences reverse.
In determining the amount of current and deferred taxes, Grupo Aval considers the impact of uncertain tax exposures on current tax liabilities, including whether additional taxes and interest may be due. This assessment relies on estimates and assumptions and may involve a series of judgments about future events. New information may become available that causes Grupo Aval to change its judgment regarding the adequacy of existing tax liabilities; such changes to tax liabilities would impact tax expense in the period in which such a determination is made.
F-40
Grupo Aval Acciones y Valores S.A.
Notes to the Consolidated Financial Statements
For the years ended December 31, 2022, 2021 and 2020
(Amounts expressed in millions of Colombian pesos)
2.24 Capitalization of borrowing costs
Borrowing costs which are directly attributable to the acquisition, construction or production of a qualifying asset which requires a substantial period of time to get ready for its intended use are part of the cost of the asset. Other borrowing costs are recognized as expenses.
Grupo Aval begins capitalizing borrowing costs as part of the cost of a qualifying asset on the commencement date. This is the date when the entity first meets all of the following conditions:
(a) it incurs expenditures for the asset;
(b) it incurs borrowing costs; and
(c) it undertakes activities that are necessary to prepare the asset for its intended use or sale.
2.25 Provisions
Provisions for environmental dismantling and recovery, restructuring costs and legal claims are recognized when Grupo Aval has a present legal or assumed obligation as a result of past events, and it is probable that an outflow of economic benefits will be required to settle the obligation. Restructuring provisions include penalties due to cancelation of leases.
Provisions are measured at the present value of outflows expected to be necessary to settle the obligation, using a discount rate before taxes, reflecting the assessments of the time value of money of the current market as well as the specific risks of the obligation. The subsequent increase of the provision due to the unwinding of the discount rate is recognized as “financial expense”.
2.26 Non-voting rights of preferred shares
Preferred shares represent partial ownership and do not provide shareholders with any of the voting rights of common shares. Grupo Aval has classified as an equity instrument all the non-voting preferred shares. See note 25 equity attributable to owners of the parent.
2.27 Revenues
(i) Effective interest rate
Interest income and expense are recognized in the Consolidated Statement of Income using the effective interest method. The ‘effective interest rate’ is the rate that exactly discounts estimated future cash payments or receipts through the expected life of the financial instrument to:
| ● | The gross carrying amount of the financial asset; or |
| ● | The amortized cost of the financial liability. |
When calculating the effective interest rate for financial instruments other than credit-impaired assets, Grupo Aval estimates future cash flows considering all contractual terms of the financial instrument, but not expected credit losses. For credit-impaired financial assets, a credit-adjusted effective interest rate is calculated using estimated future cash flows including expected credit losses.
The calculation of the effective interest rate includes transaction costs and fees and points paid or received that are an integral part of the effective interest rate. Transaction costs include incremental costs that are directly attributable to the acquisition or issue of a financial asset or financial liability.
(ii) Amortized cost and gross carrying amount
The ‘amortized cost’ of a financial asset or financial liability is the amount at which the financial asset or financial liability is measured on initial recognition minus the principal repayments, plus or minus the cumulative amortization using the effective interest method of any difference between that initial amount and the maturity amount and, for financial assets, adjusted for any expected credit loss allowance.
F-41
Grupo Aval Acciones y Valores S.A.
Notes to the Consolidated Financial Statements
For the years ended December 31, 2022, 2021 and 2020
(Amounts expressed in millions of Colombian pesos)
The ‘gross carrying amount’ of a financial asset is the amortized cost of a financial asset before adjusting for any expected credit loss allowance.
(iii) Calculation of interest income and expense
In calculating interest income and expense, the effective interest rate is applied to the gross carrying amount of the asset (when the asset is not credit-impaired) or to the amortized cost of the liability to calculate the interest income and expenses.
However, for financial assets that have become credit-impaired subsequent to initial recognition, interest income is calculated by applying the effective interest rate to the amortized cost of the financial asset. If the asset is no longer credit-impaired, then the calculation of interest income reverts to the gross basis.
For financial assets that were credit-impaired on initial recognition, interest income is calculated by applying the credit-adjusted effective interest rate to the amortized cost of the asset. The calculation of interest income does not revert to a gross basis, even if the credit risk of the asset improves.
For information on when financial assets are credit-impaired, see note 2(2.5) (ix).
(iv) Presentation
Interest income and expense presented in the Consolidated Statement of Income include:
| ● | Interest on financial assets and financial liabilities measured at amortized cost calculated on an effective interest basis, see note 2.27 (i); |
| ● | Interest on debt instruments measured at FVOCI calculated on an effective interest basis see note 2.27 (i); |
Interest income and expense on all trading assets and liabilities are considered to be incidental to Grupo Aval’s trading operations and are presented together with all other changes in the fair value of trading assets and liabilities in net trading income.
Interest income and expense on other financial assets and financial liabilities mandatory at FVTPL are presented in “Net trading income” and financial assets in concessions arrangements rights at FVTPL under “Net income from financial instruments at fair value other that negotiable”.
‘Net trading income’ comprises net gains or losses related to held for trading assets and liabilities, and includes all realized and unrealized fair value changes, interest, dividends and foreign exchange differences.
Contract assets
A contract asset is Grupo Aval’s right to consideration in exchange for goods or services that Grupo Aval has transferred to a customer when that right is conditional on something other than the passage of time (for example, invoicing or delivery of other elements of the contracts).
Contract costs eligible for capitalization as incremental costs of obtaining a contract are recognized as a contract asset. Contract costs are capitalized when are incurred if Grupo Aval expects to recover those costs. Contract costs are amortized on a systematic basis consistent with the transfer of the services to the customer and the related revenues are recognized. Contract costs capitalized are impaired if the customer retires or if the asset’s carrying amount exceeds projected discounted cash flows relating to the contract.
Contract liabilities
Contract liabilities comprise Grupo Aval’s obligation to transfer goods or services to a customer for which Grupo Aval has received consideration from the end customer or the amount is due. Additionally, it includes deferred income relating to goods or services that will be delivered in the future, which are charged to a customer in advance but not yet due.
F-42
Grupo Aval Acciones y Valores S.A.
Notes to the Consolidated Financial Statements
For the years ended December 31, 2022, 2021 and 2020
(Amounts expressed in millions of Colombian pesos)
Steps for revenue recognition
Grupo Aval recognizes revenue from contracts with customers based on a five-step model as set out in IFRS 15:
| ● | Step 1. Identify contract(s) with a customer: A contract is defined as an agreement between two or more parties that creates enforceable rights and obligations and sets out the criteria for every contract that must be met. Contracts can be written, oral or implied by an entity’s customary business practices. |
| ● | Step 2. Identify performance obligations in the contract: A performance obligation is a promise in a contract with a customer to transfer a good or service to the customer. |
| ● | Step 3. Determine the transaction price: The transaction price is the amount of consideration to which Grupo Aval expects to be entitled in exchange for transferring promised goods or services to a customer, excluding amounts collected on behalf of third parties. |
| ● | Step 4. Allocate the transaction price to the performance obligations in the contract: For a contract that has more than one performance obligation, Grupo Aval allocates the transaction price to each performance obligation in an amount that depicts the amount of consideration to which Grupo Aval expects to be entitled in exchange for satisfying each performance obligation. |
| ● | Step 5. Recognize revenue when (or as) Grupo Aval satisfies a performance obligation. |
Grupo Aval satisfies a performance obligation and recognizes revenue over time, if one of the following criteria is met:
| a) | Grupo Aval´s performance does not create an asset with an alternate use to Grupo Aval, and Grupo Aval has as an enforceable right to payment for the performance completed to date. |
| b) | Grupo Aval´s performance creates or enhances an asset that the customer controls as the asset is created or enhanced. |
| c) | The customer simultaneously receives and consumes the benefits provided as Grupo Aval´s performs its obligation. |
For performance obligations where one of the above conditions are not met, revenue is recognized at the point in time at which the performance obligation is satisfied.
When Grupo Aval satisfies a performance obligation by delivering the promised goods or services it creates a contract asset on the amount of consideration earned by the performance. Where the amount of consideration received from a customer exceeds the amount of revenue recognized this gives rise to a contract liability.
Revenue is measured based on consideration specified in a contract with a customer and excludes amounts collected on behalf of third parties. Grupo Aval recognizes revenue when it transfers control over a good or service to a customer. Revenue is presented net of value added tax (VAT), rebates and discounts and after eliminating intra-group sales.
Grupo Aval assesses its revenue arrangements to determine if it is acting as principal or agent.
Revenue is recognized to the extent it is probable that the economic benefits will flow to Grupo Aval and the revenue and costs, if applicable, can be measured reliably.
The following is a description of principal activities from which Grupo Aval generates revenue from contracts with customers:
(i) Banking (Financial Services)
Grupo Aval often enter into contracts that cover a number of different services. Such contracts might contain components within, and components outside, the scope of IFRS 15. Therefore, Grupo Aval only applies the IFRS 15 guidance where it has contracts that are all or partly outside the scope of IFRS 9.
The main revenue streams earned by the banks from contracts with customers are the following:
Banks receive bancassurance commissions for introducing new clients to third party insurers, where the bank does not underwrite the insurance policy itself. These commissions are usually paid periodically (for example, monthly) to banks based on the volume of new policies (and/or renewal of existing policies) originating from clients introduced by the bank. The transaction price might include
F-43
Grupo Aval Acciones y Valores S.A.
Notes to the Consolidated Financial Statements
For the years ended December 31, 2022, 2021 and 2020
(Amounts expressed in millions of Colombian pesos)
an element of consideration that is variable or contingent on the outcome of future events, such as policy cancellations, which is estimated and included in the transaction price based on the most likely amount only when it is highly probable that the resolution of the uncertainty will not result in a significant reversal of revenue.
Performance obligations are fulfilled over time, taking into account that customers (insurers) receive benefits as time progresses. Where the commission calculation is made on a monthly basis or in a shorter period, the total amount of the commission is recognized in the results when its determination is made. If the settlement of commissions is defined in periods longer than a monthly basis, the expected income to recognize revenues is estimated as time progresses.
Loan commitment fees are within the scope of IFRS 15 when it is unlikely that a specific lending arrangement will be entered into and the loan commitment is not measured at FVTPL. Loan syndication fees received by a bank that arranges a loan and retains no part of the loan package for itself (or retains a part at the same Effective Interest Rate “EIR” for comparable risk as other participants) are within the scope of IFRS 15.
Income from performance obligations to provide such services, which are met at a point in time, are recognized when the particular event defined in the contracts occurs (e.g., approval of the syndicated loan). The obligations met over time are recognized during the period of the commitment; If income is received in advance, it is deferred over the period of the commitment. If income is received upon expiration, it is estimated periodically.
| ● | Credit cards: Interchange fees, Annual-quarterly-monthly fees, Loyalty programs |
There are contracts that create enforceable rights and obligations between the Bank and the cardholders or merchants under which the bank will provide services, sometimes in exchange for annual and other fees. The following are some of the services that might exist in a contract with a cardholder:
| ● | Issuance of loyalty points (which are options to acquire goods/services for free or at a discount in the future), usually based on the monetary volume of card transactions; |
| ● | Payment processing service; |
| ● | Insurance where the bank is not the insurer; |
| ● | Fraud protection; and |
| ● | Processing of certain transactions, such as purchases in a foreign currency and Advances. |
The transaction price is allocated to each performance obligation based on the relative stand-alone selling prices of the goods or services being provided to the customer. The allocation of the transaction price to each of the separate performance obligations will not necessarily be required where there is more than one performance obligation and the performance obligations all satisfied at the same time or evenly over the period.
Performance obligations are fulfilled over time, taking into account that customers receive benefits as time goes on. Given that the entity's efforts or resources are expended evenly throughout the performance period, income is recognized on a linear basis during the period defined under the credit card conditions. The costs of plastic or security elements are capitalized as contract signing costs.
In connection with Grupo Aval the credit and debit card processing fee, customers receive benefits every time they make purchases. In this context, income is recognized periodically (daily or monthly) on the basis of the amounts traded. Income that would be deferred by the valuation of the points granted for customer loyalty programs to the cardholders will be extracted from the total amount of commissions recorded periodically. See section (vi) Customer loyalty program below.
Savings and checking accounts contracts usually allow customers access to a variety of services, including wire transfer processing, ATM use for cash withdrawals, issuance of debit cards, and account statements; they might also include other benefits. Fees are charged on a periodic basis and give the customer access to banking services and additional benefits. Performance obligations are fulfilled over time, taking into account that customers receive benefits as time progresses. As a result, banks recognize fees from providing services in the accounting period in which the services are rendered.
F-44
Grupo Aval Acciones y Valores S.A.
Notes to the Consolidated Financial Statements
For the years ended December 31, 2022, 2021 and 2020
(Amounts expressed in millions of Colombian pesos)
Advisory contracts with customers are not standardized. These contracts might differ between customers, and they often include variable consideration, including contingent fees, that are only payable upon meeting agreed milestones.
Income from performance obligations to provide such services, which are met at a point in time, are recognized when the particular event defined in the contracts occurs. The obligations met over time are recognized considering method of milestones achieved (when only one milestone that considers the delivery of results, income is recognized at a single moment when the final delivery is made.)
(ii) Asset management
Revenues of asset portfolios management correspond to fees which arise from the rendering of management and advisory services and usually are measured based on performance and profit of asset portfolios of asset portfolios, which are recognized based on amounts calculated under the formulas established by the contracts when such amount is no longer subject to adjustments resulting from future events.
If the fee expected is variable, the variable consideration included in the transaction price is limited to the amount for which it is highly probable that a significant reversal of the amount of cumulative revenue recognized will not occur when the uncertainty is resolved. In the estimation, Grupo Aval considers both the likelihood and the magnitude of the revenue reversal. Factors that could increase the likelihood or the magnitude of a revenue reversal include, but are not limited to, (i) the amount of consideration is highly susceptible to factors outside the entity’s influence, (ii) the uncertainty about the amount of consideration is not expected to be resolved for a long period of time, and (iii) the contract has a large number and broad range of possible consideration amounts.
Fees are often based on net assets under management or returns generated by the underlying investments held by the funds subject to certain thresholds.
The contractual measurement period for performance fees of fund managers is often a month, quarter or year, and in some rare cases longer. In some cases, the fees will be constrained until the contractual measurement period is completed. The Group assess if there is a portion (a minimum amount) of the variable consideration that should be recognized prior to the end of the contractual measurement period. The full amount of the fee will likely be recognized as of the end of the contractual measurement period when the asset manager becomes certain of the amount. In certain cases, the full amount of the fee will be recognized upon redemption when is no longer subject to reversal.
(iii) Construction and operation services (Concessions)
In concession arrangements, Grupo Aval determines that its performance obligations (construction, operation and maintenance) are satisfied over time and measures progress toward completion to determine the timing of revenue recognition using a method that depicts the transfer of the goods or services to the customer.
Grupo Aval considers the nature of the product or services provided and the terms of the contract, such as termination rights, the rights to demand or retain payments, and the legal title to work in process in determining the best input or output method for measuring progress toward satisfaction of the performance obligation.
Grupo Aval applies a single method to measure progress for each performance obligation within a contract. The method can be either an input method (cost incurred, labor hours) or output method (units produced, milestones reached).
Estimations of revenues, costs or progress toward completion are revised if circumstances change. Any resulting increases or decreases in estimated revenues or costs are reflected in profit or loss in the period in which the circumstances that give rise to the revision become known by management.
(iv) Power and utilities
Contracts between a customer and a public utility company establish the rates and terms of service for the purchase, delivery, and sale of electricity or gas. Grupo Aval determines that its obligation is represented in a single performance obligation which is to sell electricity or gas, and it is satisfied over time (over the term of the agreement) through a series of distinct goods or services that are substantially the same and have the same pattern of transfer to the customer.
F-45
Grupo Aval Acciones y Valores S.A.
Notes to the Consolidated Financial Statements
For the years ended December 31, 2022, 2021 and 2020
(Amounts expressed in millions of Colombian pesos)
Some contracts include multiple deliverables, such as the installation of fixtures or repairs, which are accounted as separate performance obligations. The transaction price is allocated to each performance obligation based on the stand-alone selling prices (regulated rates). If contracts include the installation of fixtures, the associated revenue is recognized at the point in time when goods are installed, the ownership has been transferred and the customer has accepted the goods.
(v) Logistic activities
Grupo Aval´s transport and logistics companies offer multiple products or services to their customers as part of a single agreement. Separate performance obligations are identified in an agreement based on the terms of the contract and Grupo Aval's usual business practices.
Revenue recognition criteria generally applies separately to each performance obligation. In certain circumstances, it may be necessary to separate a transaction into identifiable components to reflect the content of the transaction. It may be necessary to group two or more transactions when they are linked in such a way that the commercial effect cannot be understood without reference to the series of transactions as a whole.
The transaction price is assigned to performance obligations separately in a contract based on the relative independent selling price of each separate performance obligation.
(vi) Customer loyalty program
Financial entities and hotels of Grupo Aval manage loyalty programs in which the customers accumulate points for their purchases, entitling them to redeem such points for prizes in accordance with the policies and the prize plan in force as of the redemption date. Reward points are recognized as an identifiable component separate from income for the service rendered, at their fair value. Income from loyalty programs is deferred and recognized in the Consolidated Statement of Income until the entity has fulfilled its obligations to supply the products under the terms of the program or when it is no longer probable that the points under the program will be redeemed.
Grupo Aval acts as the principal in a customer loyalty program if it obtains control of the goods or services of another party in advance of transferring control of those goods or services to a customer. Grupo Aval is an agent if its performance obligation is to arrange for another party to provide the goods or services.
(vii) Hotel services
Revenue is derived from the following sources:
| i) | Management fees: earned from hotels managed by Grupo Aval, usually under long-term contracts with the hotel owner. Management fees include a base fee, generally a percentage of hotel revenue, which is recognized when earned in accordance with the terms of the contract and an incentive fee, generally based on the hotel’s profitability or cash flows and recognized when the related performance criteria are met under the terms of the contract. |
| ii) | Owned and leased: primarily derived from hotel operations, including the guests accommodation and sales of food and beverage from owned and leased hotels operated under Grupo Aval brand names. |
Revenue is recognized at the point when the goods are sold or services are rendered.
(viii) Agriculture products
Grupo Aval grows and sells agricultural products through companies owned by Corficolombiana. Sales are recognized when control of the products has been transferred, meaning when the products are delivered to the wholesaler, the wholesaler has full discretion over the channel and price to sell the products, and there is no unfulfilled obligation. Delivery occurs when the products have been shipped to the specific location, the risks of obsolescence and loss have been transferred to the wholesaler, and either the wholesaler has accepted the products in accordance with the sales contract, the acceptance provisions have lapsed, or Grupo Aval has objective evidence that all criteria for acceptance have been satisfied.
Revenue from these sales is recognized based on the price specified in the contract, net of discounts. Accumulated experience is used to estimate and provide for the discounts, using the most likely amount, and revenue is only recognized to the extent that it is highly
F-46
Grupo Aval Acciones y Valores S.A.
Notes to the Consolidated Financial Statements
For the years ended December 31, 2022, 2021 and 2020
(Amounts expressed in millions of Colombian pesos)
probable that a significant reversal will not occur. A receivable is recognized when the goods are delivered as this is the point in time that the consideration is unconditional because only the passage of time is required before the payment is due.
(ix) Financing components.
Grupo Aval adjusts transaction prices for the time value of money for contracts where the period between the transfer of the promised goods or services to the customer and payment by the customer exceeds one year.
2.28 Earnings per share
Earnings per share is calculated as net income for the period attributable to Grupo Aval’s shareholders divided by the weighted average number of common and preferred shares outstanding during the period. Diluted earnings per share are determined in the same way, on the basis of net income, but the weighted average number of shares outstanding is adjusted to account for the potential dilutive effect of stock options. Grupo Aval does not have financial instruments with potential dilutive effects. As a consequence, only basic earnings per share are disclosed in these financial statements.
2.29 New and amended IFRS
New standards and amendments to standards are effective for annual periods beginning after 1 January 2023 and earlier application is permitted; however, Grupo Aval has not early adopted them in preparing these Consolidated Financial Statements.
|
| Effective for | ||
Annual Periods | ||||
New or Amended Standard | Title of the Standard | Beginning on or After | ||
Forthcoming requirements. |
|
|
|
|
Insurance Contracts | IFRS 17 Insurance Contracts | January 1,2023 | ||
Disclosure of Accounting Polices | Amendments to IAS 1 Presentation of Financial Statements and IFRS Practice Statement 2 | January 1,2023 | ||
Definition of Accounting Estimate | Amendments to IAS 8 Accounting Policies, Changes in Accounting Estimates and Errors | January 1,2023 | ||
Deferred Tax related to Assets and Liabilities arising from a Single Transaction | Amendments to IAS 12 Income Taxes | January 1,2023 | ||
Lease Liability in Sale and Leaseback | Amendments to IFRS 16 Leases | January 1,2024 | ||
Classification of Liabilities as Current or Non-current | Amendments to IAS 1 Presentation of Financial Statements | January 1,2024 | ||
Sale or Contribution of Assets between an Investor and its Associate or Joint Venture | Amendments to IFRS 10 Consolidated Financial Statements and IAS 28 Investments in Associates and Joint Ventures | Available for optional adoption / effective date deferred indefinitely |
Grupo Aval has preliminarily assessed the impacts of the adoption of the new or amended standards detailed above, concluding that these are not expected to have a significant impact on Grupo Aval’s consolidated financial statements.
F-47
Grupo Aval Acciones y Valores S.A.
Notes to the Consolidated Financial Statements
For the years ended December 31, 2022, 2021 and 2020
(Amounts expressed in millions of Colombian pesos)
NOTE 3 – JUDGMENTS AND CRITICAL ACCOUNTING ESTIMATES IN APPLYING ACCOUNTING POLICIES
Grupo Aval’s management makes estimates and assumptions that affect the amounts recognized in the consolidated financial statements and the carrying value of the assets and liabilities within the fiscal year. The judgments and estimates are continuously evaluated and are based on the experience of management and other factors, including the occurrence of future events that are believed to be reasonable under the current circumstances. Management also makes certain judgments besides those which involve estimates during the process of applying accounting policies. The judgments that have the most significant effects on the amounts recognized in the consolidated financial statements and the estimates that may cause an important adjustment to the book value of assets and liabilities in the following year include the following:
A. Judgments
Information about judgments made in applying accounting policies that have the most significant effects on the amounts recognized in the consolidated financial statements is included in the following notes.
– Note 2 (2.1) – determination of control over investees.
– Note 2 (2.5) (ii) – classification of financial assets: assessment of the business model within which the assets are held and assessment of whether the contractual terms of the financial asset are solely payments of principal and interest on the principal amount outstanding.
– Note 4 (4.1.5) – establishing the criteria for determining whether credit risk on the financial asset has increased significantly since initial recognition, determining the methodology for incorporating forward-looking information into the measurement of ECL and selection and approval of models used to measure ECL.
B. Assumptions and estimation uncertainties
Information about assumptions and estimation uncertainties that have a significant risk of resulting in a material adjustment in the year ended is included in the following notes.
– Note 4 (4.1.5) – impairment of financial instruments: assessment of whether credit risk on the financial asset has increased significantly since initial recognition and incorporation of forward-looking information in the measurement of ECL.
– Note 4 (4.1.5) – impairment of financial instruments: key assumptions used in estimating recoverable cash flows.
– Note 5 – determination of the fair value of financial instruments with significant unobservable inputs.
– Note 16 – measurement and revenue recognition of concession arrangements.
– Note 17 – impairment testing for CGUs containing goodwill: key assumptions underlying recoverable amounts.
– Note 19 – recognition of deferred tax assets: availability of future taxable profit against which carry-forward tax losses can be used.
– Note 22 – measurement of defined benefit obligations: key actuarial assumptions.
– Notes 23 – recognition and measurement of provisions and contingencies: key assumptions about the likelihood and magnitude of an outflow of resources.
F-48
Grupo Aval Acciones y Valores S.A.
Notes to the Consolidated Financial Statements
For the years ended December 31, 2022, 2021 and 2020
(Amounts expressed in millions of Colombian pesos)
NOTE 4 – RISK MANAGEMENT
Grupo Aval and its subsidiaries in the financial sector, Banco de Bogotá, Banco de Occidente, Banco AV Villas, Banco Popular, Corficolombiana and Porvenir manage risk pursuant to the applicable regulations in each country where they operate and according to Grupo Aval’s internal policies.
The risk framework requires that strong risk management practices are integrated in the key processes across Grupo Aval with a goal of ensuring risks are appropriately considered, evaluated and responded to in a timely manner. Grupo Aval employs a risk management process that aims to identify, measure, monitor and control, as part of the daily activities, all the risks that Grupo Aval is exposed to.
Lines of Defense: in addition to the roles of Executive Officers in managing risk, management has ownership and accountability across the three lines of defense: (1) First Line: Business Units, (2) Second Line: mainly concentrated in the Independent Risk Management units and (3) Third line: Corporate Audit.
| ● | Business Units: Include the business lines as well as the Technology and Operations areas which are responsible for appropriate assessment and effective management of all risks associated with their processes. |
| ● | Independent Risk Management Units: Risk management areas include risk management and compliance departments. Grupo Aval has other control functions that are not part of these areas but are also key in risk mitigation of non-financial risks, including legal, human resources and certain activities within the financial and administrative processes. |
| ● | Corporate Audit: Corporate audit maintains its independence from the first and second lines by reporting directly to the Audit Committee or the Board. Corporate Audit provides independent assessment and validation through testing of key processes and controls across Grupo Aval. |
The following sections outline the key financial risks that are inherent to the business activities of the subsidiaries:
Financial risks
| i) | Credit risk: the risk of financial loss if a debtor fails to meet their contractual obligations. |
| ii) | Market risk: the risk of loss arising from potential adverse changes in the value of the subsidiaries in the financial sector assets and liabilities or future results, arising as a result of changes in market variables such as interest rates, foreign exchange rates, equity prices, commodity prices, implied volatilities or credit spreads; this includes the structural interest rate and foreign exchange risks. |
| iii) | Liquidity risk: the risk of being unable to meet contractual and contingent obligations or that the subsidiaries in the financial sector do not have the appropriate amount, composition and tenor of funding and liquidity to support the financial assets and liabilities requirements (funding liquidity risk). Also includes the capability to manage its investment portfolio in terms of liquidity, duration and currency (market liquidity risk). |
| iv) | Interest rate risk: it is the current or potential risk to equity and profits that arise from adverse movements in interest rates, which affect the positions of the banking book. |
Additionally, the risk areas are responsible for supporting capital management by determining risk levels of the calculation of capital adequacy requirements, impact assessment of the risk materialization on compliance with capital levels and determining the levels of risk appetite.
Objective and general guidelines of financial risk management
Grupo Aval’s and its subsidiaries’ of the financial sector objective is to maximize returns for its investors through strong risk management. The guiding principles of risk management at Grupo Aval are as follows:
| a) | Make risk management a part of every institutional process. |
| b) | Collective decision making for the approval of commercial lending of significant amounts. |
| c) | Extensive and in-depth industry and market knowledge, as a result of sound leadership and experienced, stable and seasoned senior management. |
F-49
Grupo Aval Acciones y Valores S.A.
Notes to the Consolidated Financial Statements
For the years ended December 31, 2022, 2021 and 2020
(Amounts expressed in millions of Colombian pesos)
| d) | Clear risk management policies based on a top-down approach with respect to: |
| ● | Compliance with know-your-customer policies. |
| ● | Commercial loans credit structure based on clear identification of sources of repayment as well as cash flow generation capacity of the borrower. |
| e) | Use of similar credit analysis tools for analysis across Grupo Aval’s subsidiaries of financial sector. |
| f) | Diversification of the commercial loan portfolio with respect to industries and economic groups. |
| g) | Specialization in consumer product niches. |
| h) | Extensive use of continuously updated scoring models and up-to-date credit ratings to ensure quality growth of loans with high credit quality. |
| i) | Conservative policies in terms of: |
| ● | trading portfolio composition with bias towards lower volatility instruments, |
| ● | proprietary trading position, and |
| ● | variable compensation for the trading staff. |
| j) | Control the position-level exposures based on market risk sensitivities (such as VaR, DV01, Delta, Rho and Vega) and credit risk exposures by counterparties. |
| k) | Concentration and diversification limits which are based on market liquidity and volatility, operational capacity, valuation and credit quality of counterparties. |
| l) | Control and follow up on the funding and liquidity risk with independent oversight. This includes setting limits related to high quality liquid assets and maturity concentration of financial liabilities among others. |
| m) | Ensuring compliance with regulatory limits and reviewing how the current and projected strategy can affect those limits. |
| n) | Use of our market presence in the identification and implementation of best practices for operational risk management. |
Main premises for risk management
Grupo Aval´s risk culture is based on the principles indicated in the section above, which are transmitted to all subsidiaries of the financial sector and business units. The strategy related to risk management is supported by the following guidelines:
| a) | In all of Grupo Aval´s subsidiaries of the financial sector, the risk function is independent of the business units. The segregation of functions between the business areas and the risk areas in charge of risk measurement analysis, control and reporting, provide enough independence and autonomy for proper risk control. |
| b) | The decision-making process at the subsidiaries of the financial sector requires that transactions of significant amounts are sent to decision centers such as risk committees. The frequency of meetings of these committees ensures a high degree of agility regarding proposal resolution, and continuous participation of senior management in management of different risks. |
| c) | Grupo Aval has corporate policies for the risks to which it is exposed. The business and risk units of Grupo Aval and its subsidiaries of the financial sector hold orientation meetings based on approaches to risk that are consistent with Grupo Aval´s risk culture. |
| d) | Grupo Aval has implemented a risk system that is updated on a regular basis to address new conditions in the markets and the risks to which Grupo Aval is exposed. |
| e) | There are adequate information systems to monitor risk exposure, ensure compliance with the approved policies and implement appropriate corrective actions as and when necessary. |
| f) | Key risks are analyzed on a regular basis, not only when risks materialize or problems occur during the normal course of business but in a continuous process of risk management. |
| g) | Grupo Aval and its subsidiaries of the financial sector have training courses on risk culture for all hierarchy levels in the organization. |
| h) | A risk culture has been integrated throughout the organization, consisting of a series of attitudes, values, skills and guidelines to action. |
F-50
Grupo Aval Acciones y Valores S.A.
Notes to the Consolidated Financial Statements
For the years ended December 31, 2022, 2021 and 2020
(Amounts expressed in millions of Colombian pesos)
Interest rate benchmark reform
Due to the Financial Conduct Authority’s (FCA) confirmation that all LIBOR settings will either cease to be provided by any administrator or no longer be representative immediately after 31 December 2021, in the case of all sterling, euro, Swiss franc and Japanese yen settings, and the 1-week and 2-month US dollar settings; and immediately after 30 June 2023, in the case of the remaining settings; the entities worldwide were forced to transfer their LIBOR-indexed positions to new reference interest rates which could maintain the representativeness and depth of the “old” LIBOR.
On July 29, 2021, the Alternative Reference Rates Committee (ARRC) announced its recommendation for the use of the Chicago Mercantile Exchange (CME) SOFR term rates (TERM SOFR), following the completion of a key change in the trading agreements between market intermediaries on July 26, 2021, under the SOFR First initiative, in which it was recommended to stop using “USD LIBOR” and use “SOFR” for linear swap trading. With this initiative the transition was accelerated in all types of products, and furthermore, ARRC's recommendation on the use of the Term SOFR has facilitated the shift towards SOFR lending. According to the ARRC, the transition has proceeded smoothly, particularly in financial derivatives, consumer loans and floating rate markets. The market sees fluent progress in commercial lending and securitization markets, seeing further momentum towards SOFR-indexed issuance.
During 2022, the markets have evidenced a successful transition process after the closing of operations in EUR LIBOR, CHF LIBOR, YEN LIBOR and GBP LIBOR despite some challenges faced by financial institutions regarding the selection of reference rates and renegotiation of contracts indexed to the previous reference rates. Regarding USD, LIBOR more than half of companies are already trading SOFR-indexed products. On May 5, 2022, CME Group launched the SOFR First initiative for option contracts to accelerate the transition in this type of products.
Back in 2021, Grupo Aval established certain principles and good practices which its financial subsidiaries had to adopt to ensure that the portfolio of credits, loans, deposits and derivative contracts that were previously indexed to LIBOR rates made an adequate transition to the new reference rates. The subsidiaries and affiliates of Grupo Aval, depending on the size of the portfolio and the nature of the business, had to form a governance structure that would be responsible for controlling and supervising the execution of a work plan, which in turn would allow (i) identification and measurement of indexed products, (ii) risk identification, assessment and control, (iii) operational and information technology readiness, (iv) preparation of legal contracts, (v) communication with stakeholders, (vi) training strategies and (vi) monitoring and periodic reporting to its governing bodies.
The implementation of these principles and good practices within the group entities resulted in the approval of policies and documentation of processes and procedures ensuring settlement of active and passive loans at the new market reference rates, offering and administration of products indexed to SOFR, incorporation of fallback clauses in the current contracts for the replacement of the LIBOR rate with the SOFR alternative, training of the commercial force and communication to current customers.
The amount of the contracts that Grupo Aval and its subsidiaries have indexed to LIBOR rates that will expire in June 2023 and the amount of the contracts that have included fallback clauses for the December 31, 2022 and 2021 cut-off are shown below:
F-51
Grupo Aval Acciones y Valores S.A.
Notes to the Consolidated Financial Statements
For the years ended December 31, 2022, 2021 and 2020
(Amounts expressed in millions of Colombian pesos)
Non-derivative financial assets and liabilities.
During 2022 and 2021, the Group had the following LIBOR exposures concerning non-derivative financial assets and loan portfolio subject to LIBOR benchmarks. The following table shows the value of non-derivative financial assets and liabilities indexed at LIBOR rates in millions of dollars and millions of Colombian pesos:
December 31, 2022 | December 31, 2021 | ||||||||||||||||
Total Amount | Total amount of | Amount | Total Amount | Total amount of | Amount | ||||||||||||
Assets | |||||||||||||||||
Debt securities FVOCI | US$. | — | US$. | — | US$. | — | US$. | | US$. | | US$. | | |||||
Debt securities at amortized cost | | | — | | | — | |||||||||||
Commercial loan | | | | | | | |||||||||||
Consumer loan | | | — | | | | |||||||||||
Mortgage loan | | | — | | | | |||||||||||
Total financial assets indexed to Libor references | US$. | US$. | US$. | US$. | US$. | US$. | |||||||||||
Liabilities | |||||||||||||||||
Time deposits | US$. | — | US$. | — | US$. | — | US$. | | US$. | — | US$. | — | |||||
Borrowing from banks and others | | | | | | | |||||||||||
Borrowing from development entities | | | — | | | — | |||||||||||
Total Liabilities | US$. | US$. | US$. | US$. | US$. | US$. | |||||||||||
December 31, 2022 | December 31, 2021 | ||||||||||||||||
Total Amount | Total amount of | Amount | Total Amount of Contracts | Total amount of | Amount | ||||||||||||
Assets | |||||||||||||||||
Debt securities FVOCI | Ps. | — | Ps. | — | Ps. | — | Ps. | | Ps. | | Ps. | | |||||
Debt securities at amortized cost | | | — | | | — | |||||||||||
Commercial loan | | | | | | | |||||||||||
Consumer loan | | | — | | | | |||||||||||
Mortgage loan | | | — | | | | |||||||||||
Total financial assets indexed to Libor references | Ps. | | Ps. | | Ps. | | Ps. | | Ps. | | Ps. | | |||||
Liabilities | |||||||||||||||||
Time deposits | Ps. | — | Ps. | — | Ps. | — | Ps. | | Ps. | — | Ps. | — | |||||
Borrowing from banks and others | | | | | | | |||||||||||
Borrowing from development entities | | | — | | | — | |||||||||||
Total Liabilities | Ps. | | Ps. | | Ps. | | Ps. | | Ps. | | Ps. | | |||||
F-52
Grupo Aval Acciones y Valores S.A.
Notes to the Consolidated Financial Statements
For the years ended December 31, 2022, 2021 and 2020
(Amounts expressed in millions of Colombian pesos)
Derivatives and hedge accounting
Grupo Aval´s subsidiaries maintain trading derivatives and risk management hedges indexed at LIBOR rates. Certain derivatives held for risk management purposes are designated in hedging relationships. Interest rate swap and cross-currency swap contracts have floating legs that are indexed to LIBOR benchmarks. The following table shows the value of derivative and hedge accounting indexed at LIBOR rates in millions of dollars and millions of Colombian pesos:
December 31, 2022 | December 31, 2021 | ||||||||||||||||
Total Amount | Total amount of | Amount | Total Amount | Total amount of | Amount | ||||||||||||
Derivatives and hedge accounting | |||||||||||||||||
Trading derivative assets | |||||||||||||||||
Interest rate swaps | US$. | | US$. | | US$. | | US$. | | US$. | | US$. | — | |||||
Cross-currency swaps | | | | | | — | |||||||||||
Total | US$. | US$. | US$. | US$. | US$. | US$. | |||||||||||
Trading derivative liabilities | |||||||||||||||||
Interest rate swaps | US$. | | US$. | | US$. | | US$. | | US$. | | US$. | — | |||||
Cross-currency swaps | | | | | | — | |||||||||||
Total | US$. | US$. | US$. | US$. | US$. | US$. | |||||||||||
Derivatives held for risk management | |||||||||||||||||
Interest rate swaps | US$. | | US$. | | US$. | | US$. | | US$. | | US$. | | |||||
Total | US$. | US$. | US$. | US$. | US$. | US$. | |||||||||||
December 31, 2022 | December 31, 2021 | ||||||||||||||||
Total Amount | Total amount of | Amount | Total Amount | Total amount of | Amount | ||||||||||||
Derivatives and hedge accounting | |||||||||||||||||
Trading derivative assets | |||||||||||||||||
Interest rate swaps | Ps. | | Ps. | | Ps. | | Ps. | | Ps. | | Ps. | — | |||||
Cross-currency swaps | | | | | | — | |||||||||||
Total | Ps. | | Ps. | | Ps. | | Ps. | | Ps. | | Ps. | — | |||||
Trading derivative liabilities | |||||||||||||||||
Interest rate swaps | Ps. | | Ps. | | Ps. | | Ps. | | Ps. | | Ps. | — | |||||
Cross-currency swaps | | | | | | — | |||||||||||
Total | Ps. | | Ps. | | Ps. | | Ps. | | Ps. | | Ps. | — | |||||
Derivatives held for risk management | |||||||||||||||||
Interest rate swaps | Ps. | | Ps. | | Ps. | | Ps. | | Ps. | | Ps. | | |||||
Total | Ps. | | Ps. | | Ps. | | Ps. | | Ps. | | Ps. | | |||||
The values corresponding to December 2021 were adjusted after the spin-off of BAC Holding, the details of which are explained in note 1.1 “Discontinued operations of BAC Holding”.
F-53
Grupo Aval Acciones y Valores S.A.
Notes to the Consolidated Financial Statements
For the years ended December 31, 2022, 2021 and 2020
(Amounts expressed in millions of Colombian pesos)
Financial Risk Review
4.1 Credit Risk
Exposure to credit risk as of December 31, 2022 presents a decrease due to the spin-off of BAC Holding. See Note 1.1 "Discontinued operations of BAC Holding".
4.1.1 Consolidated Credit Risk Exposure
Grupo Aval´s subsidiaries are exposed to credit risk, consisting of the risk of financial loss as a result of a failure of a debtor to meet their contractual obligations in financial transactions on a timely and complete manner. Exposure to credit risk for Grupo Aval and its subsidiaries is a result of credit activities and transactions with counterparties.
The maximum exposure to credit risk of Grupo Aval, at a consolidated level is reflected in the carrying value of financial assets in the consolidated statement of financial position of Grupo Aval as of December 31, 2022 and 2021 as follows:
Assets |
| December 31, 2022 |
| December 31, 2021 | ||
Cash and cash equivalents (*) | Ps. | | Ps. | | ||
Trading investments in debt securities | | | ||||
Investments in debt securities mandatorily at FVTPL | | — | ||||
Investments in debt securities at FVOCI | | | ||||
Investments in debt securities at amortized cost | | | ||||
Derivatives instruments | | | ||||
Hedging derivatives | | | ||||
Loans |
|
| ||||
Commercial | | | ||||
Consumer | | | ||||
Mortgage | | | ||||
Microcredit | | | ||||
Interbank and overnight funds | | | ||||
Other accounts receivable FVTPL | | | ||||
Other accounts receivable at amortized cost | | | ||||
Total financial assets with credit risk | Ps. | | Ps. | | ||
Financial instruments with credit risk outside of the statement of financial position at its nominal value |
|
| ||||
Financial guarantees and letters of credit | | | ||||
Credit commitments | | | ||||
Total exposure to credit risk outside of the statement of financial position | Ps. | | Ps. | | ||
Total maximum exposure to credit risk | Ps. | | Ps. | | ||
(*) Not including funds in the entity’s custody (cash, tellers, vaults), because there is no credit risk regarding Grupo Aval entities. See Note 4.1.3 h)
With regard to guarantees and commitments to extend credit amounts, the maximum credit risk exposure is the amount of a commitment. Credit risk is mitigated by guarantees and collaterals as described in note 4.1.4 Mitigation of Credit Risk, Collateral and Other Credit Risk Enhancements.
Each of Grupo Aval´s financial subsidiaries assume the credit risk for both the credit activities, which includes commercial, consumer, mortgage and microcredit credit lending, and treasury activities including interbank loans, investment portfolio management, derivatives and foreign currency trading activities among others. Despite being independent businesses, the nature of insolvency risk of a borrower or counterparty is similar and therefore the criteria in which they are evaluated is similar.
F-54
Grupo Aval Acciones y Valores S.A.
Notes to the Consolidated Financial Statements
For the years ended December 31, 2022, 2021 and 2020
(Amounts expressed in millions of Colombian pesos)
4.1.1.A. Loan portfolio disclosure
Loans are recorded at amortized cost in the statement of financial position, and are classified as commercial, consumer, mortgage, microcredit and interbank and overnight funds. The following table presents the portfolio balances, provision balances and net value portfolio by segment:
December 31, 2022
|
|
| Total loan | ||||||
Portfolio segment | Loan Portfolio | Loss allowance | Portfolio, net | ||||||
Commercial |
| Ps. | |
| Ps. | |
| Ps. | |
Interbank and overnight funds | | | | ||||||
Client portfolio |
|
| |
|
| |
|
| |
Consumer |
|
| |
|
| |
|
| |
Residential mortgage |
|
| |
|
| |
|
| |
Microcredit |
|
| |
|
| |
|
| |
Total portfolio |
| Ps. | |
| Ps. | |
| Ps. | |
December 31, 2021
|
|
| Total loan | ||||||
Portfolio segment | Loan Portfolio | Loss allowance | Portfolio, net | ||||||
Commercial |
| Ps. | |
| Ps. | |
| Ps. | |
Interbank and overnight funds | | | | ||||||
Client portfolio |
|
| |
|
| |
|
| |
Consumer |
|
| |
|
| |
|
| |
Residential mortgage |
|
| |
|
| |
|
| |
Microcredit |
|
| |
|
| |
|
| |
Total portfolio |
| Ps. | |
| Ps. | |
| Ps. | |
4.1.1.B Loan portfolio given as collateral
In 2022 and 2021, there were
4.1.2 Loan and Counterparty Approval Process for subsidiaries in the financial sector
The principles and rules for credit management and credit risk for each financial subsidiary are contained in the credit manual, both for commercial banking activities and treasury activities. Evaluation criteria to measure credit risk follows the principal instructions set forth by the Treasury and Credit Risk Committees.
The maximum authority regarding lending is the Board of Directors for each bank, which approves the general policy and has the capacity to approve large size transactions. In the normal banking operation, authorizations for approval of loans and lines of credit depend on the amounts, credit quality, tenor and security collateral or guarantees offered by the client. The Board of Directors of each bank has delegated part of its lending authorities to different committees and executives who process the credit requests and are responsible for the analysis and credit review.
Additionally, for the approval of credits, certain considerations are taken into account including but not limited to, the probability of default, the recovery percentage of guarantees received, current customer exposure and tenor & concentration by economic sector.
Regarding treasury operations, the Boards of Directors of the financial subsidiaries approve lines of credit for counterparties. Risk control is essentially carried out through three mechanisms: periodic approval of lines of credit, evaluation of the conditions of the issuers at least annually and a report on concentrations for each client or economic group.
Although each financial subsidiary is responsible for its credit decisions and risk management, Grupo Aval as the holding entity, oversees the implementation of appropriate risk management controls at the financial subsidiaries through the Corporate Risk Unit and has established upward loan reporting processes. The holding’s risk management staff meets on a periodically basis to discuss Grupo Aval subsidiaries’ loan portfolio, developments in industry, risks and opportunities. Grupo Aval also coordinates loan syndication among its banks to effectively leverage the combined equity of its banks and manage any risk issues.
F-55
Grupo Aval Acciones y Valores S.A.
Notes to the Consolidated Financial Statements
For the years ended December 31, 2022, 2021 and 2020
(Amounts expressed in millions of Colombian pesos)
Each subsidiary of the financial sector has a Credit Risk Management System, which is managed by the credit vice-presidency or its equivalent, and includes, among others, the design, implementation and evaluation of policies and risk mechanisms defined by the Credit and Treasury Risk Committee and the Board of Directors of each entity. The operation of the Credit Risk Management System has resulted in the integration of risk measurement tools into the credit approval process in each of the financial subsidiaries.
Each subsidiary of the financial sector in Colombia has two models for evaluating credit risk for the approval of commercial loans. The first is the financial ratings model, which consists of statistical models based on the client´s financial information, which are used in the approval process and for portfolio management and monitoring. The second model is based on the client´s financial ratings and their historical payment behavior with the bank.
For retail loans (including mortgage loans and auto loans) models are based on product line characteristic, sociodemographic variables and the historical payment behavior of the clients with the bank and the financial sector.
As a result of the changes caused by the national and international economic and political situation, since the beginning of 2020 it was necessary to review and adjust origination strategies, along with approved debt limits in accordance with individual risk analysis, especially for customers identified in high-risk sectors.
4.1.3 Credit quality analysis
The Credit-risk Monitoring Process and Credit rating of the loan portfolio
The monitoring process and credit risk review of each financial subsidiary is carried out in several steps including portfolio analysis by vintages, risk level rating, permanent high-risk clients’ review, restructuring processes of operations and the receipt of foreclosed assets as payment.
Periodically the financial subsidiaries classify each client in one of these risk categories: Category A-Normal, B Acceptable, C-Appreciable, D-Significant and E- Non - recoverability, based on the statistical models that each subsidiary has.
In addition, each financial subsidiary evaluates the commercial portfolio by economic sectors, where macro-sectors are evaluated with the purpose of monitoring the concentration per economic sector and the risk level of each one.
At least once a year, each financial subsidiary carries out an individual analysis of credit risk based on updated financial information of the client, payment record, collateral security/guarantees received, credit bureau reports and other qualitative information available; based on the information, clients are classified by risk level as mentioned above.
Each risk category is explained as follows:
Category |
| PD* | Risk | Description | ||
|---|---|---|---|---|---|---|
1 |
| 0%- 7.5% |
| Normal |
| Appropriately serviced. The debtor’s financial statements or their projected cash flows, as well as all other credit information available to us, reflect adequate paying capacity |
2 |
| 7.5% - 15% |
| Acceptable above normal |
| Adequately serviced and protected, but there are weaknesses which may potentially affect, on a temporary or permanent basis, the debtor’s paying capacity or their projected cash flows to the extent that, if not timely corrected, would affect the collection of the credits as contracted |
3 |
| 15% - 22.5% |
|
| ||
4 |
| 22.5% - 30% |
| Appreciable |
| Have debtors with insufficient paying capacity or relate to projects with insufficient cash flow, which may compromise the normal collection of the obligations |
5 |
| 30% - 45% |
|
| ||
6 |
| 45% - 60% |
| Significant |
| Have the same deficiencies as loans in category 4-5, but to a larger extent; consequently, the probability of collection is highly doubtful |
7 |
| 60% - 90% |
|
| ||
8 |
| > 90% |
| Non-recoverability |
| Deemed uncollectible. |
(*) Probability of default – “PD” is the probability that the counterpart defaults in their payment obligations of capital and/or interest.
For mortgage loans and microcredits, the previous classification by risk levels is carried out monthly considering the number of days past due.
F-56
Grupo Aval Acciones y Valores S.A.
Notes to the Consolidated Financial Statements
For the years ended December 31, 2022, 2021 and 2020
(Amounts expressed in millions of Colombian pesos)
In addition, the credit risk exposure is managed through a periodic analysis of the borrowers (or potential borrowers) to determine the repayment capacity of capital and interest. The credit risk exposure is also mitigated partly by obtaining collateral security, corporate and personal guarantees.
The following table sets out information about the credit quality of financial assets measured at amortized cost. Unless specifically indicated, for financial assets, the amounts in the table represent gross carrying amounts. For loan commitments and financial guarantee contracts, the amounts in the table represent the amounts committed or guaranteed, respectively. Based on the foregoing classifications, each financial subsidiary establishes and executes collection strategies directed at maximizing the collection of the loan portfolio.
As of December 31, 2022 and 2021, the following is a summary of the credit portfolio by probability of default. Explanation of the terms: Stage 1, Stage 2 and Stage 3 are included in Note 2 (2.5) (ix) and explained in detail in Note 4.1.5 (Measurement of Expected Credit Loss).
Total Portfolio
December 31, 2022 | ||||||||||||
Total Exposure | ||||||||||||
PD Range |
| Stage 1 |
| Stage 2 |
| Stage 3 |
| Total | ||||
0%- 7.5% | Ps. | | Ps. | | Ps. | | Ps. | | ||||
7.5% - 15% | | | | | ||||||||
15% - 22.5% | | | | | ||||||||
22.5% - 30% | | | | | ||||||||
30% - 45% | | | | | ||||||||
45% - 60% | | | | | ||||||||
60% - 90% | | | | | ||||||||
> 90% | | | | | ||||||||
TOTAL | Ps. | | Ps. | | Ps. | | Ps. | | ||||
December 31, 2021 | ||||||||||||
Total Exposure | ||||||||||||
PD Range |
| Stage 1 |
| Stage 2 |
| Stage 3 |
| Total | ||||
0%- 7.5% | Ps. | | Ps. | | Ps. | | Ps. | | ||||
7.5% - 15% | | | | | ||||||||
15% - 22.5% | | | | | ||||||||
22.5% - 30% | | | | | ||||||||
30% - 45% | | | | | ||||||||
45% - 60% | | | | | ||||||||
60% - 90% | | | | | ||||||||
> 90% | | | | | ||||||||
TOTAL | Ps. | | Ps. | | Ps. | | Ps. | | ||||
Commercial – Client portfolio
December 31, 2022 | ||||||||||||
Total Exposure | ||||||||||||
PD Range |
| Stage 1 |
| Stage 2 |
| Stage 3 |
| Total | ||||
0%- 7.5% | Ps. | | Ps. | | Ps. | | Ps. | | ||||
7.5% - 15% | | | — | | ||||||||
15% - 22.5% | | | — | | ||||||||
22.5% - 30% | | | | | ||||||||
30% - 45% | | | — | | ||||||||
45% - 60% | | | | | ||||||||
60% - 90% | | | | | ||||||||
> 90% | | | | | ||||||||
TOTAL | Ps. | | Ps. | | Ps. | | Ps. | | ||||
December 31, 2021 | ||||||||||||
|---|---|---|---|---|---|---|---|---|---|---|---|---|
Total Exposure | ||||||||||||
PD Range |
| Stage 1 |
| Stage 2 |
| Stage 3 |
| Total | ||||
0%- 7.5% | Ps. | | Ps. | | Ps. | | Ps. | | ||||
F-57
Grupo Aval Acciones y Valores S.A.
Notes to the Consolidated Financial Statements
For the years ended December 31, 2022, 2021 and 2020
(Amounts expressed in millions of Colombian pesos)
December 31, 2021 | ||||||||||||
|---|---|---|---|---|---|---|---|---|---|---|---|---|
Total Exposure | ||||||||||||
PD Range |
| Stage 1 |
| Stage 2 |
| Stage 3 |
| Total | ||||
7.5% - 15% | | | | | ||||||||
15% - 22.5% | | | — | | ||||||||
22.5% - 30% | | | — | | ||||||||
30% - 45% | | | — | | ||||||||
45% - 60% | | | | | ||||||||
60% - 90% | | | — | | ||||||||
> 90% | | | | | ||||||||
TOTAL | Ps. | | Ps. | | Ps. | | Ps. | | ||||
Consumer
December 31, 2022 | ||||||||||||
Total Exposure | ||||||||||||
PD Range |
| Stage 1 |
| Stage 2 |
| Stage 3 |
| Total | ||||
0%- 7.5% | Ps. | | Ps. | | Ps. | | Ps. | | ||||
7.5% - 15% | | | | | ||||||||
15% - 22.5% | | | | | ||||||||
22.5% - 30% | | | | | ||||||||
30% - 45% | | | | | ||||||||
45% - 60% | | | | | ||||||||
60% - 90% | | | | | ||||||||
> 90% | | | | | ||||||||
TOTAL | Ps. | | Ps. | | Ps. | | Ps. | | ||||
December 31, 2021 | ||||||||||||
Total Exposure | ||||||||||||
PD Range |
| Stage 1 |
| Stage 2 |
| Stage 3 |
| Total | ||||
0%- 7.5% | Ps. | | Ps. | | Ps. | | Ps. | | ||||
7.5% - 15% | | | | | ||||||||
15% - 22.5% | | | | | ||||||||
22.5% - 30% | | | | | ||||||||
30% - 45% | | | | | ||||||||
45% - 60% | | | | | ||||||||
60% - 90% | | | | | ||||||||
> 90% | | | | | ||||||||
TOTAL | Ps. | | Ps. | | Ps. | | Ps. | | ||||
Mortgage
December 31, 2022 | ||||||||||||
Total Exposure | ||||||||||||
PD Range |
| Stage 1 |
| Stage 2 |
| Stage 3 |
| Total | ||||
0%- 7.5% | Ps. | | Ps. | | Ps. | | Ps. | | ||||
7.5% - 15% | | | — | | ||||||||
15% - 22.5% | | | — | | ||||||||
22.5% - 30% | | | | | ||||||||
30% - 45% | | | | | ||||||||
45% - 60% | — | | | | ||||||||
60% - 90% | — | | | | ||||||||
> 90% | — | | | | ||||||||
TOTAL | Ps. | | Ps. | | Ps. | | Ps. | | ||||
F-58
Grupo Aval Acciones y Valores S.A.
Notes to the Consolidated Financial Statements
For the years ended December 31, 2022, 2021 and 2020
(Amounts expressed in millions of Colombian pesos)
December 31, 2021 | ||||||||||||
Total Exposure | ||||||||||||
PD Range |
| Stage 1 |
| Stage 2 |
| Stage 3 |
| Total | ||||
0%- 7.5% | Ps. | | Ps. | | Ps. | — | Ps. | | ||||
7.5% - 15% | | | — | | ||||||||
15% - 22.5% | | | | | ||||||||
22.5% - 30% | | | | | ||||||||
30% - 45% | | | | | ||||||||
45% - 60% | — | | — | | ||||||||
60% - 90% | — | | | | ||||||||
> 90% | — | | | | ||||||||
TOTAL | Ps. | | Ps. | | Ps. | | Ps. | | ||||
Microcredit
December 31, 2022 | ||||||||||||
Total Exposure | ||||||||||||
PD Range |
| Stage 1 |
| Stage 2 |
| Stage 3 |
| Total | ||||
0%- 7.5% | Ps. | | Ps. | — | Ps. | — | Ps. | | ||||
7.5% - 15% | | — | — | | ||||||||
15% - 22.5% | | — | — | | ||||||||
22.5% - 30% | | | — | | ||||||||
30% - 45% | | | — | | ||||||||
45% - 60% | | — | — | | ||||||||
60% - 90% | | | — | | ||||||||
> 90% | | — | | | ||||||||
TOTAL | Ps. | | Ps. | | Ps. | | Ps. | | ||||
December 31, 2021 | ||||||||||||
Total Exposure | ||||||||||||
PD Range |
| Stage 1 |
| Stage 2 |
| Stage 3 |
| Total | ||||
0%- 7.5% | Ps. | | Ps. | | Ps. | — | Ps. | | ||||
7.5% - 15% | | — | — | | ||||||||
15% - 22.5% | | — | — | | ||||||||
22.5% - 30% | | | — | | ||||||||
30% - 45% | | | — | | ||||||||
45% - 60% | | | — | | ||||||||
60% - 90% | | | — | | ||||||||
> 90% | — | — | | | ||||||||
TOTAL | Ps. | | Ps. | | Ps. | | Ps. | | ||||
Interbank and overnight funds
December 31, 2022 | ||||||||||||
|---|---|---|---|---|---|---|---|---|---|---|---|---|
Total Exposure | ||||||||||||
PD Range |
| Stage 1 |
| Stage 2 |
| Stage 3 |
| Total | ||||
0%- 7.5% | Ps. | | Ps. | — | Ps. | — | Ps. | | ||||
7.5% - 15% | — | — | — | — | ||||||||
15% - 22.5% | — | — | — | — | ||||||||
22.5% - 30% | — | — | — | — | ||||||||
30% - 45% | — | — | — | — | ||||||||
45% - 60% | — | — | — | — | ||||||||
60% - 90% | — | — | — | — | ||||||||
> 90% | — | — | | | ||||||||
TOTAL | Ps. | | Ps. | — | Ps. | | Ps. | | ||||
F-59
Grupo Aval Acciones y Valores S.A.
Notes to the Consolidated Financial Statements
For the years ended December 31, 2022, 2021 and 2020
(Amounts expressed in millions of Colombian pesos)
December 31, 2021 | ||||||||||||
|---|---|---|---|---|---|---|---|---|---|---|---|---|
Total Exposure | ||||||||||||
PD Range |
| Stage 1 |
| Stage 2 |
| Stage 3 |
| Total | ||||
0%- 7.5% | Ps. | | Ps. | — | Ps. | — | Ps. | | ||||
7.5% - 15% | | — | — | | ||||||||
15% - 22.5% | — | — | — | — | ||||||||
22.5% - 30% | — | — | — | — | ||||||||
30% - 45% | — | — | — | — | ||||||||
45% - 60% | — | — | — | — | ||||||||
60% - 90% | — | — | — | — | ||||||||
> 90% | — | — | — | — | ||||||||
TOTAL | Ps. | | Ps. | — | Ps. | — | Ps. | | ||||
Loan commitments and financial guarantee contracts
December 31, 2022 | ||||||||||||
Total Exposure | ||||||||||||
PD Range |
| Stage 1 |
| Stage 2 |
| Stage 3 |
| Total | ||||
0%- 7.5% | Ps. | | Ps. | | Ps. | | Ps. | | ||||
7.5% - 15% | | | | | ||||||||
15% - 22.5% | | | | | ||||||||
22.5% - 30% | | | | | ||||||||
30% - 45% | | | | | ||||||||
45% - 60% | | | | | ||||||||
60% - 90% | | | | | ||||||||
> 90% | — | | | | ||||||||
TOTAL | Ps. | | Ps. | | Ps. | | Ps. | | ||||
December 31, 2021 | ||||||||||||
Total Exposure | ||||||||||||
PD Range |
| Stage 1 |
| Stage 2 |
| Stage 3 |
| Total | ||||
0%- 7.5% | Ps. | | Ps. | | Ps. | | Ps. | | ||||
7.5% - 15% | | | | | ||||||||
15% - 22.5% | | | | | ||||||||
22.5% - 30% | | | | | ||||||||
30% - 45% | | | | | ||||||||
45% - 60% | | | | | ||||||||
60% - 90% | | | | | ||||||||
> 90% | | | | | ||||||||
TOTAL | Ps. | | Ps. | | Ps. | | Ps. | | ||||
Credit quality of financial assets (excluding loan portfolio)
The following is the breakdown of the different financial assets excluding loan portfolio, by credit risk level and type of issuer based on the rating issued by the independent credit ratings agency. A financial asset is considered investment grade if its credit rating is
F-60
Grupo Aval Acciones y Valores S.A.
Notes to the Consolidated Financial Statements
For the years ended December 31, 2022, 2021 and 2020
(Amounts expressed in millions of Colombian pesos)
BBB- or higher by Standard & Poor's or Fitch Ratings scale, Baa3 or higher by Moody's scale, F3 or higher by Fitch Ratings Colombia S.A or BRC3 or higher by BRC of Colombia. Otherwise, the financial asset is considered speculative.
a) | Trading investment in debt securities |
|
| December 31, 2022 |
| December 31, 2021 | ||
Investment grade |
|
|
|
| ||
Sovereign (*) |
| Ps. | |
| Ps. | |
Other public entities (**) |
| |
| | ||
Corporate |
| |
| | ||
Financial entities |
| |
| | ||
Total investment grade |
| Ps. | |
| Ps. | |
Speculative grade |
|
|
|
| ||
Sovereign (*) |
| Ps. | |
| Ps. | |
Other public entities (**) | | | ||||
Corporate | | | ||||
Financial entities |
| |
| | ||
Multilaterals | | | ||||
Total Speculative grade |
| Ps. | |
| Ps. | |
Without grade or not available |
|
|
|
| ||
Corporate |
| Ps. | |
| Ps. | |
Total without grade or not available |
| Ps. | |
| Ps. | |
| Ps. | |
| Ps. | | |
(*) A sovereign credit rating considers the risk of Treasury issuer or similar agency (government debt portfolio).
(**) Corresponds to operations with government entities, including public administrations in general including regional and local governments.
b) | Investments in debt securities mandatorily at FVTPL |
|
| December 31, 2022 |
| December 31, 2021 | ||
Investment grade |
|
|
|
| ||
Corporate |
| Ps. | |
| Ps. | — |
Total investment grade |
| Ps. | |
| Ps. | — |
c) | Investments in debt securities at FVOCI |
December 31, 2022 | ||||||||||||
|---|---|---|---|---|---|---|---|---|---|---|---|---|
| Stage 1 |
| Stage 2 |
| Stage 3 |
| Total | |||||
Investment grade | ||||||||||||
Sovereign (*) |
| Ps. | |
| Ps. | — |
| Ps. | — |
| Ps. | |
Other public entities (**) |
| |
| — |
| — |
| | ||||
Central banks | | — | — | | ||||||||
Corporate |
| |
| — |
| — |
| | ||||
Financial entities |
| |
| — |
| — |
| | ||||
Multilaterals |
| |
| — |
| — |
| | ||||
Total investment grade |
| Ps. | |
| Ps. | — |
| Ps. | — |
| Ps. | |
Speculative grade |
|
|
|
|
|
|
|
| ||||
Sovereign (*) |
| Ps. | |
| Ps. | — |
| Ps. | — |
| Ps. | |
Other public entities (**) | | — | — | | ||||||||
Corporate |
| |
| — |
| — |
| | ||||
Financial entities |
| |
| — |
| — |
| | ||||
Multilaterals | | — | — | | ||||||||
Total speculative grade |
| Ps. | |
| Ps. | — |
| Ps. | — |
| Ps. | |
Without Grade or Not available | ||||||||||||
Financial Entities | Ps. | | Ps. | — | Ps. | — | Ps. | | ||||
Total Without Grade or Not available | Ps. | | Ps. | — | Ps. | — | Ps. | | ||||
| Ps. | |
| Ps. | — |
| Ps. | — |
| Ps. | | |
(*) Sovereign credit rating is considered as the risk of the Treasury issuer or a similar agency (government debt portfolio).
(**) Corresponds to operations with government entities; including public administrations in general (includes regional and local governments).
F-61
Grupo Aval Acciones y Valores S.A.
Notes to the Consolidated Financial Statements
For the years ended December 31, 2022, 2021 and 2020
(Amounts expressed in millions of Colombian pesos)
December 31, 2021 | ||||||||||||
| Stage 1 |
| Stage 2 |
| Stage 3 |
| Total | |||||
Investment grade | ||||||||||||
Sovereign (*) |
| Ps. | |
| Ps. | — |
| Ps. | — |
| Ps. | |
Other public entities (**) |
| |
| — |
| — |
| | ||||
Central banks | | — | — | | ||||||||
Corporate |
| |
| — |
| — |
| | ||||
Financial entities |
| |
| — |
| — |
| | ||||
Multilaterals |
| |
| — |
| — |
| | ||||
Total investment grade |
| Ps. | |
| Ps. | — |
| Ps. | — |
| Ps. | |
Speculative grade |
|
|
|
|
|
|
|
| ||||
Sovereign (*) |
| Ps. | |
| Ps. | — |
| Ps. | — |
| Ps. | |
Other public entities (**) | | — | — | | ||||||||
Central banks |
| |
| — |
| — |
| | ||||
Corporate |
| |
| — |
| — |
| | ||||
Financial entities | | — | — | | ||||||||
Multilaterals |
| |
| — |
| — |
| | ||||
Total speculative grade |
| Ps. | |
| Ps. | — |
| Ps. | — |
| Ps. | |
Without Grade or Not available | ||||||||||||
Corporate | Ps. | | Ps. | — | Ps. | — | Ps. | | ||||
Financial entities | | — | — | | ||||||||
Total Without Grade or Not available | Ps. | | Ps. | — | Ps. | — | Ps. | | ||||
| Ps. | |
| Ps. | — |
| Ps. | — |
| Ps. | | |
(*) Sovereign credit rating is considered as the risk of the Treasury issuer or a similar agency (government debt portfolio).
(**) Corresponds to operations with government entities; including public administrations in general (includes regional and local governments).
d) | Investments in debt securities at amortized cost |
December 31, 2022 | ||||||||||||
|---|---|---|---|---|---|---|---|---|---|---|---|---|
|
| Stage 1 |
| Stage 2 |
| Stage 3 |
| Total | ||||
Investment grade |
|
|
|
|
|
|
|
| ||||
Sovereign (*) |
| Ps. | |
| Ps. | — |
| Ps. | — |
| Ps. | |
Financial entities |
| |
| — |
| — |
| | ||||
Total investment grade |
| Ps. | |
| Ps. | — |
| Ps. | — |
| Ps. | |
Speculative grade | ||||||||||||
Other public entities (**) | Ps. | | Ps. | — | Ps. | — | Ps. | | ||||
Corporate | | — | — | | ||||||||
Financial Entities | | — | — | | ||||||||
Total speculative grade | Ps. | |
| Ps. | — |
| Ps. | — |
| Ps. | | |
Without Grade or Not available | ||||||||||||
Corporate | Ps. | | Ps. | | Ps. | — | Ps. | | ||||
Financial Entities | | | — | | ||||||||
Total Without Grade or Not available | Ps. | | Ps. | | Ps. | — | Ps. | | ||||
| Ps. | |
| Ps. | |
| Ps. | — |
| Ps. | | |
(*) Sovereign credit rating is considered as the risk of the Treasury issuer or a similar agency (government debt portfolio).
(**) Corresponds to operations with government entities; including public administrations in general (includes regional and local governments).
F-62
Grupo Aval Acciones y Valores S.A.
Notes to the Consolidated Financial Statements
For the years ended December 31, 2022, 2021 and 2020
(Amounts expressed in millions of Colombian pesos)
December 31, 2021 | ||||||||||||
|
| Stage 1 |
| Stage 2 |
| Stage 3 |
| Total | ||||
Investment grade |
|
|
|
|
|
|
|
| ||||
Sovereign (*) |
| Ps. | |
| Ps. | — |
| Ps. | — |
| Ps. | |
Financial entities |
| |
| — |
| — |
| | ||||
Total investment grade |
| Ps. | |
| Ps. | — |
| Ps. | — |
| Ps. | |
Speculative grade | ||||||||||||
Other public entities (**) | Ps. | | Ps. | — | Ps. | — | Ps. | | ||||
Corporate | | — | — | | ||||||||
Financial entities | | — | — | | ||||||||
Total speculative grade | Ps. | | Ps. | — | Ps. | — | Ps. | | ||||
Without Grade or Not available | ||||||||||||
Corporate | Ps. | | Ps. | | Ps. | — | Ps. | | ||||
Financial Entities | | | — | | ||||||||
Total Without Grade or Not available | Ps. | | Ps. | | Ps. | — | Ps. | | ||||
| Ps. | |
| Ps. | |
| Ps. | — |
| Ps. | | |
(*) Sovereign credit rating is considered as the risk of the Treasury issuer or a similar agency (government debt portfolio).
(**) Corresponds to operations with government entities; including public administrations in general (includes regional and local governments).
e) | Other accounts receivable at FVTPL |
|
| December 31, 2022 |
| December 31, 2021 | ||
Investment grade |
|
|
|
| ||
Sovereign (*) |
| Ps. | |
| Ps. | |
Total investment grade | Ps. | | Ps. | | ||
(*) Sovereign credit rating is considered as the risk of the Treasury issuer or a similar agency (government debt portfolio).
f) | Other accounts receivable at amortized cost |
December 31, 2022 | ||||||||||
Stage 1 | Stage 2 | Stage 3 | Simplified Approach | Total | ||||||
Other receivables using general approach | ||||||||||
Other accounts receivable and contract assets for corporate customers | Ps. | | Ps. | — | Ps. | — | Ps. | — | Ps. | |
Other accounts receivable related to gas, energy services, contributions and others | | | | — | | |||||
Other receivables using simplified approach | ||||||||||
Other accounts receivable from individual customers | — | — | — | | | |||||
Total other receivables | Ps. | | Ps. | | Ps. | | Ps. | | Ps. | |
December 31, 2021 | ||||||||||
|---|---|---|---|---|---|---|---|---|---|---|
Stage 1 | Stage 2 | Stage 3 | Simplified Approach | Total | ||||||
Other receivables using general approach | ||||||||||
Other accounts receivable and contract assets for corporate customers | Ps. | | Ps. | — | Ps. | — | Ps. | — | Ps. | |
Other accounts receivable related to gas, energy services, contributions and others | | | | — | | |||||
Other receivables using simplified approach | ||||||||||
Other accounts receivable from individual customers | — | — | — | | | |||||
Total other receivables | Ps. | | Ps. | | Ps. | | Ps. | | Ps. | |
F-63
Grupo Aval Acciones y Valores S.A.
Notes to the Consolidated Financial Statements
For the years ended December 31, 2022, 2021 and 2020
(Amounts expressed in millions of Colombian pesos)
Evaluated using general approach
The following table provides information about the exposure to credit risk for other accounts receivable and contract assets for corporate customers as of December 31, 2022, and 2021. The credit quality of these financial assets follows the methodology of the probability of default of debt securities and other liquid financial assets (See note 4.1.5).
December 31, 2022 | ||||||||||||
| Stage 1 |
| Stage 2 |
| Stage 3 |
| Total | |||||
Investment grade |
|
|
|
|
|
|
|
| ||||
Sovereign (*) |
| Ps. | |
| Ps. | — |
| Ps. | — |
| Ps. | |
Financial entities |
| |
| — |
| — |
| | ||||
Total investment grade |
| Ps. | |
| Ps. | — |
| Ps. | — |
| Ps. | |
(*) Sovereign credit rating is considered as the risk of the Treasury issuer or a similar agency (government debt portfolio).
December 31, 2021 | ||||||||||||
| Stage 1 |
| Stage 2 |
| Stage 3 |
| Total | |||||
Investment grade |
|
|
|
|
|
|
|
| ||||
Sovereign (*) |
| Ps. | |
| Ps. | — |
| Ps. | — |
| Ps. | |
Financial entities |
| |
| — |
| — |
| | ||||
Total investment grade |
| Ps. | |
| Ps. | — |
| Ps. | — |
| Ps. | |
(*) Sovereign credit rating is considered as the risk of the Treasury issuer or a similar agency (government debt portfolio).
The following table provides information about the exposure to credit risk by segment for accounts receivable related to gas and energy services, the methodology used to estimate the ECLs is the same used for Loan and Receivable (See note 4.1.5):
December 31, 2022 | ||||||||||||
| Stage 1 |
| Stage 2 |
| Stage 3 |
| Total | |||||
Segmentation |
|
|
|
|
|
|
|
| ||||
Contributions |
| Ps. | |
| Ps. | |
| Ps. | |
| Ps. | |
Gas |
| |
| |
| |
| | ||||
Energy |
| |
| |
| |
| | ||||
Other accounts receivable |
| |
| |
| |
| | ||||
Total segmentation |
| Ps. | |
| Ps. | |
| Ps. | |
| Ps. | |
December 31, 2021 | ||||||||||||
| Stage 1 |
| Stage 2 |
| Stage 3 |
| Total | |||||
Segmentation |
|
|
|
|
|
|
|
| ||||
Contributions |
| Ps. | |
| Ps. | — |
| Ps. | — |
| Ps. | |
Gas |
| |
| |
| |
| | ||||
Energy |
| |
| |
| |
| | ||||
Other accounts receivable |
| |
| — |
| — |
| | ||||
Total segmentation |
| Ps. | |
| Ps. | |
| Ps. | |
| Ps. | |
Evaluated using simplified approach
Grupo Aval uses a probability matrix to measure the ECL for other receivables from individual customers, which have small balances.
The weighted-average loss rate is calculated using a “rolling rate” method based on the probability that a receivable will progress through successive stages of default until write off. The rolling rate is calculated for exposures in different segments and separately in accordance with the following common features of credit risk.
F-64
Grupo Aval Acciones y Valores S.A.
Notes to the Consolidated Financial Statements
For the years ended December 31, 2022, 2021 and 2020
(Amounts expressed in millions of Colombian pesos)
The following table provides information about the exposure to credit risk and ECLs for trade receivables and contract assets from individual customers as of December 31, 2022 and 2021.
Weighted- | Gross |
| ||||||||
average loss | carrying | Loss | Credit- | |||||||
December 31, 2022 |
| rate |
| amount |
| allowance |
| impaired | ||
0–30 days past due |
| % | Ps. | |
| Ps. | | Ps. | — | |
31–60 days past due |
| % | |
| |
| — | |||
61–90 days past due |
| % | |
| |
| — | |||
More than 90 days past due |
| % | |
| |
| | |||
|
|
| Ps. | |
| Ps. | | Ps. | | |
Weighted- | Gross |
| ||||||||
average loss | carrying | Loss | Credit- | |||||||
December 31, 2021 |
| rate |
| amount |
| allowance |
| impaired | ||
0–30 days past due |
| | % | Ps. | |
| Ps. | | Ps. | — |
31–60 days past due |
| | % | |
| |
| — | ||
61–90 days past due |
| | % | |
| |
| — | ||
More than 90 days past due |
| | % | |
| |
| | ||
|
|
| Ps. | |
| Ps. | | Ps. | | |
The loss rates are based on the experience of real credit loss during a year and the balance of accounts receivable at the cut-off date for previously defined homogeneous segments. It takes into consideration elements such as: segmentation by type of receivable account, date of analysis, definition of loss, among others. Based on the characteristics of the short-term receivable accounts, these portfolios result from operations where there are no non-linear impacts, therefore, the application of macroeconomic scenarios is not considered.
g) | Derivative instruments |
The details of credit rating determined by independent credit rating agents of counterparties in trading derivatives and hedge derivatives are as follows.
Credit worthiness |
| December 31, 2022 |
| December 31, 2021 | ||
Investment grade |
| Ps. | |
| Ps. | |
Speculative |
|
| |
|
| |
Without grade or not available |
|
| |
|
| |
Total |
| Ps. | |
| Ps. | |
The following table shows an analysis of counterparty credit exposures that arise from derivative transactions. Transactions derived from Grupo Aval are generally fully guaranteed with cash:
Trading derivatives
Total | Central counterparties | |||||||
| Notional |
| Fair |
| Notional |
| Fair | |
amount | value | amount | value | |||||
2022 |
|
|
|
|
|
|
|
|
Derivative assets | Ps. | | Ps. | | Ps. | | Ps. | |
Derivative liabilities |
| |
| |
| |
| |
2021 |
|
|
|
|
|
|
|
|
Derivative assets | Ps. | | Ps. | | Ps. | | Ps. | |
Derivative liabilities |
| |
| |
| |
| |
F-65
Grupo Aval Acciones y Valores S.A.
Notes to the Consolidated Financial Statements
For the years ended December 31, 2022, 2021 and 2020
(Amounts expressed in millions of Colombian pesos)
Hedging derivatives
Total | Central counterparties | |||||||
| Notional |
| Fair |
| Notional |
| Fair | |
amount | value | amount | value | |||||
2022 |
|
|
|
|
|
|
|
|
Derivative assets | Ps. | | Ps. | | Ps. | — | Ps. | — |
Derivative liabilities |
| | | — | — | |||
2021 |
|
|
|
|
|
|
|
|
Derivative assets | Ps. | | Ps. | | Ps. | | Ps. | — |
Derivative liabilities |
| | | | — | |||
Derivative transactions of Grupo Aval are collateralized by cash of Ps (
h) | Cash and cash equivalents |
Grupo Aval held cash and cash equivalents of Ps.
| December 31, 2022 |
| December 31, 2021 | |||
Investment grade |
| Ps. | |
| Ps. | |
Central bank |
|
| |
|
| |
Financial entities |
|
| |
|
| |
Speculative grade |
|
| |
|
| |
Central bank |
|
| |
|
| |
Financial entities |
|
| |
|
| |
Without grade or not available |
|
| |
|
| |
Financial entities |
|
| |
|
| |
Cash and cash equivalent with third parties |
| Ps. | |
| Ps. | |
Cash held by entity (*) |
| Ps. | |
| Ps. | |
Total |
| Ps. | |
| Ps. | |
(*) Cash held by each Grupo Aval’s bank in custody in vaults, ATMs and cash.
4.1.4 Mitigation of Credit Risk, Collateral and Other Credit Risk Enhancements
The exposure to credit risk for each of Grupo Aval´s financial subsidiaries is reduced by collateral and other credit enhancements. The existence of collateral security or guarantees can be a requirement but not a determining factor in approval of a credit. Credit risk policies of Grupo Aval require an evaluation of the debtor’s payment capacity based on the debtor´s ability to generate the resources needed for the timely and complete payment of their obligations.
Credit risk management includes the following activities:
| ● | Analysis of credit risk: For commercial lending, tools are used for the individual evaluation of credits based on payment capacity supported on cash generation, credit rating models with inputs from historical and projected financial condition, and on the payment history of the debtor with the financial sector. For interbank and overnight funds, the Camel Model is used to analyze financial institutions according to six factors represented by capital adequacy, assets quality, management, earnings, liquidity, and sensitivity. For consumer lending (including mortgages and auto financing), scoring models are based on characteristics of each credit line and in terms of clients, sociodemographic variables and payment behavior with both then bank and the financial sector. |
| ● | Evaluation of collateral security / guarantees with appropriate debt coverage in accordance with the credit policies of each financial subsidiary. Collateral security includes mortgages on real estate, pledge on assets, cash deposits and investments. |
| ● | Evaluation of the liquidity of the collateral security / guarantees received. |
F-66
Grupo Aval Acciones y Valores S.A.
Notes to the Consolidated Financial Statements
For the years ended December 31, 2022, 2021 and 2020
(Amounts expressed in millions of Colombian pesos)
The methods used for the evaluation of collateral security / guarantees are aligned with the market practices and include the use of independent real estate appraisers or the market value of securities. All collateral security / guarantees must be legally evaluated and drafted following the parameters of applicable legal regulations.
Mortgage lending
The following tables classify credit exposures for mortgage loans and advances to retail customers by ranges of loan-to-value (LTV) ratio. LTV is calculated as the ratio of the gross amount of the loan – or the amount of the loan commitments – to the value of the collateral. The value of the collateral for mortgage loans is based on the collateral value at origination updated based on changes in house price indices.
| December 31, 2022 |
| December 31, 2021 | |||
LTV ratio |
|
| ||||
Less than 50% | Ps. | | Ps. | | ||
51 – 70% | | | ||||
71 – 90% | | | ||||
91 – 100% | | | ||||
More than 100% | | | ||||
Total | Ps. | | Ps. | | ||
Credit-impaired mortgage loans
For credit-impaired loans the value of collateral is based on the most recent appraisals
| December 31, 2022 |
| December 31, 2021 | |||
LTV ratio |
|
|
|
|
|
|
Less than 50% |
| Ps. | |
| Ps. | |
51 – 70% |
|
| |
|
| |
More than 70% |
|
| |
|
| |
Total |
| Ps. | |
| Ps. | |
As of December 31, 2022, and 2021, the following chart shows the detail of the credit portfolio per type of guarantees received.
|
|
|
|
| Interbank and |
| ||||||||||||
December 31, 2022 | Commercial | Consumer | Mortgages | Microcredit | overnight funds | Total | ||||||||||||
Unsecured credits |
| Ps. | |
| Ps. | |
| Ps. | |
| Ps. | |
| Ps. | |
| Ps. | |
Loans secured by other banks |
|
| |
|
| |
|
| — |
|
| — |
|
| — |
|
| |
Collateralized credits: |
|
|
|
|
|
|
|
|
|
|
|
|
|
|
|
|
| |
Mortgages |
|
| |
|
| |
|
| |
|
| |
|
| — |
|
| |
Other real estate |
|
| |
|
| |
|
| |
|
| |
|
| — |
|
| |
Investments in equity instruments |
|
| |
|
| — |
|
| — |
|
| — |
|
| — |
|
| |
Deposits in cash or cash equivalents |
|
| |
|
| |
|
| — |
|
| — |
|
| — |
|
| |
Leased machineries and vehicles |
|
| |
|
| |
|
| |
|
| — |
|
| — |
|
| |
Fiduciary agreements, standby letters and guarantee funds |
|
| |
|
| |
|
| |
|
| |
|
| — |
|
| |
Pledged income |
|
| |
|
| — |
|
| — |
|
| — |
|
| — |
|
| |
Pledges |
|
| |
|
| |
|
| — |
|
| |
|
| — |
|
| |
Other assets |
|
| |
|
| |
|
| — |
|
| |
|
| |
|
| |
Total gross loan portfolio |
| Ps. | |
| Ps. | |
| Ps. | |
| Ps. | |
| Ps. | |
| Ps. | |
F-67
Grupo Aval Acciones y Valores S.A.
Notes to the Consolidated Financial Statements
For the years ended December 31, 2022, 2021 and 2020
(Amounts expressed in millions of Colombian pesos)
|
|
|
|
|
| Interbank and |
| |||||||||||
|---|---|---|---|---|---|---|---|---|---|---|---|---|---|---|---|---|---|---|
December 31, 2021 |
| Commercial | Consumer | Mortgages | Microcredit | overnight funds | Total | |||||||||||
Unsecured credits |
| Ps. | |
| Ps. | |
| Ps. | |
| Ps. | |
| Ps. | |
| Ps. | |
Loans secured by other banks |
|
| |
|
| |
|
| — |
|
| — |
|
| — |
|
| |
Collateralized credits: |
|
|
|
|
|
|
|
|
|
|
|
|
|
|
|
|
|
|
Mortgages |
|
| |
|
| |
|
| |
|
| |
|
| — |
|
| |
Other real estate |
|
| |
|
| |
|
| |
|
| |
|
| — |
|
| |
Investments in equity instruments |
|
| |
|
| — |
|
| — |
|
| — |
|
| — |
|
| |
Deposits in cash or cash equivalents |
|
| |
|
| |
|
| — |
|
| — |
|
| — |
|
| |
Leased machineries and vehicles |
|
| |
|
| |
|
| |
|
| — |
|
| — |
|
| |
Fiduciary agreements, standby letters and guarantee funds |
|
| |
|
| |
|
| |
|
| |
|
| — |
|
| |
Pledged income |
|
| |
|
| — |
|
| — |
|
| — |
|
| — |
|
| |
Pledges |
|
| |
|
| |
|
| |
|
| |
|
| — |
|
| |
Other assets |
|
| |
|
| |
|
| — |
|
| |
|
| |
|
| |
Total gross loan portfolio |
| Ps. | |
| Ps. | |
| Ps. | |
| Ps. | |
| Ps. | |
| Ps. | |
As of December 31, 2022, and 2021, the following chart sets out the carrying amount and the value of identifiable collateral (mainly commercial property) for commercial loans held by Grupo Aval at a consolidated level:
December 31, 2022 | December 31, 2021 | |||||||||||
| Carrying Amount |
| Collateral | Carrying Amount | Collateral | |||||||
Stages 1 and 2 | Ps. | | Ps. | Ps. | | Ps. | | |||||
Stage 3 | | | | |||||||||
Ps. | Ps. | | Ps. | | Ps. | | ||||||
4.1.5 Amounts arising from Expected Credit Loss (ECL)
Definition of Default
Grupo Aval considers a financial asset to be in default when:
| ● | The borrower is unlikely to pay its credit obligations to Grupo Aval in full. Without prejudice, Grupo Aval takes actions such as realizing collateral (if any is held); |
| ● | The borrower is more than 90 days past due on any material credit obligation other than mortgages to Grupo Aval. Overdrafts are considered past due once the customer has breached the allowed tenor or been advised of the reduction of the limit; |
| ● | For mortgages, when the borrower is more than 180 days past due; |
| ● | The borrower is in a state of restructuring, bankruptcy proceedings or business reorganization. |
| ● | In the case of fixed income financial securities, the following concepts among others apply: |
| - | External rating of the issuer or instrument in rating D under Standard & Poor’s and Fitch Ratings scale or rating C under Moody’s scale; |
| - | Contractual payments are not made on the due date; |
| - | There is a very high probability of suspension of payments; |
| - | The issuer likely to go bankrupt or file for bankruptcy or similar action; or |
| - | The financial asset no longer has an active market given its financial difficulties. |
In assessing whether a borrower is in default, Grupo Aval considers indicators as follows:
| ● | Qualitative: e.g. breaches of non-financial covenants; |
| ● | Quantitative: e.g. breaches of financial covenants, overdue status and non-payment of another obligation of the same issuer to Grupo Aval; and |
| ● | Based on internally historical or developed data and obtained from external sources. |
Inputs used in the assessment of whether a financial instrument is in default may vary over time to reflect changes in circumstances.
F-68
Grupo Aval Acciones y Valores S.A.
Notes to the Consolidated Financial Statements
For the years ended December 31, 2022, 2021 and 2020
(Amounts expressed in millions of Colombian pesos)
Inputs, assumptions and techniques used to estimate expected credit loss allowance
Credit risk models measures the exposure for individual counterparties, based on the following parameters: probability of default (PD), loss given default (LGD) and exposure at default (EAD). For a specific credit facility (loans, debt securities, other liquid financial assets, other accounts receivable, loan commitments and financial guarantee contracts) the product of these three parameters results in the expected credit loss. See accounting policy in Note 2 (2.5 ix).
Measurement of ECL
The measurement of expected credit losses is a calculation that involves an important number of interrelated inputs and assumptions, such as the financial asset’s probability of default, loss given default and exposure at default, which are modelled based on macroeconomic variables. Furthermore, the determination of the ECL requires the application of expert credit judgment to assess the current situation.
As mentioned above, the key inputs for the measurement of ECLs are usually the following variables:
| ● | Probability of default (PD); |
| ● | Loss given default (LGD); and |
| ● | Exposure at default (EAD). |
The estimation of these parameters depends on the credit facility. Loans and receivables methodology uses information derived from internally developed statistical models, comprising both quantitative and qualitative factors, and other historical data. On the other hand, debt securities methodology incorporates relevant external market information or international credit ratings.
PD is the probability that the counterparty defaults in its payment obligations of capital and/or interest. Credit risk grades are the primary input in the determination of the term structure of PD for exposures. Grupo Aval collects performance and default information about its credit risk exposures analyzed by jurisdiction or region, by type of product and borrower, and by credit risk grade. For some portfolios, information purchased from external credit bureaus may also be used.
Grupo Aval employs statistical models to analyze the data collected and generates estimates of the remaining lifetime PD of exposures and how these are expected to change as a result of the passage of time.
LGD is an estimate of the loss arising at default, which is computed as a percentage of exposure that the entity ultimately expects to lose in the event of a default in a financial instrument.
Grupo Aval estimates LGD parameters based on the history of recovery rates of claims against defaulted counterparties. The LGD models considers the collateral structure, seniority of the claim, counterparty industry and recovery costs of any collateral that is integral to the financial asset. For loans secured/ guaranteed by real estate, loan-to-value (LTV) ratios will be a key parameter in determining LGD. Estimates are calibrated for different economic scenarios and, for real estate lending, to reflect possible changes in property prices.
The EAD represents the expected exposure in the event of default. Grupo Aval derives the EAD from the current exposure to the counterparty and potential changes to the current amount allowed under the contract, including amortization and prepayments. The EAD of a financial asset is the gross carrying amount at default. For lending commitments and financial guarantees, the EAD considers the amount drawn, as well as potential future amounts that may be drawn or repaid under the contract, which are estimated based on historical observations and forward-looking forecasts.
Subject to using the Lifetime PD for financial assets for which credit risk has significantly increased, Grupo Aval measures ECLs considering the risk of default over the maximum contractual period (including any borrower’s extension options) over which there is exposure to credit risk, even if for risk management purposes, Grupo Aval considers a longer period. The maximum contractual period extends to the date at which Grupo Aval has the right to require repayment of an advance or terminate a loan commitment or guarantee.
For retail overdrafts, credit cards, and certain corporate revolving facilities that include both a loan and an undrawn commitment component, Grupo Aval measures ECLs over a period longer than the maximum contractual period if Grupo Aval’s contractual ability to demand repayment and cancel the undrawn commitment does not limit Grupo Aval’s exposure to credit losses to the contractual notice period. These facilities do not have a fixed term or repayment structure and are managed on a collective basis. Grupo Aval can cancel them with immediate effect, but the contractual right is not enforced in the normal day-to-day management,
F-69
Grupo Aval Acciones y Valores S.A.
Notes to the Consolidated Financial Statements
For the years ended December 31, 2022, 2021 and 2020
(Amounts expressed in millions of Colombian pesos)
but rather when Grupo Aval becomes aware of an increase in credit risk of a particular facility. This period is estimated considering the credit risk management actions that Grupo Aval expects to mitigate ECLs. These include a reduction in the limits and the cancellation of the credit.
Where modelling of a parameter is carried out on a collective basis, the financial instruments are grouped based on shared risk characteristics that include:
| ● | Instrument type; |
| ● | Credit risk ratings; |
| ● | Collateral type; |
| ● | Date of initial recognition; |
| ● | Remaining term to maturity; and |
| ● | Industry. |
The groups are subject to regular review to ensure that exposures within a particular group remain appropriately homogeneous.
Credit Risk Model: Loans and receivables
I. Transitions between stages
Significant Increase in Credit Risk
When determining whether the credit risk (i.e. risk of default) of a financial instrument has increased significantly since initial recognition, Grupo Aval considers reasonable and supportable information that is relevant and available without undue cost or effort, including both quantitative and qualitative information and analysis based on Grupo Aval’s historical experience, expert credit assessment and forward-looking information.
The following criteria are used to determine if a significant increase in credit risk has occurred:
| ● | Comparison of the remaining lifetime probability of default (PD) at the reporting date with the lifetime PD at initial recognition of the exposure. |
| ● | Quantitative aspects such as credits with 30 days past due. |
| ● | Qualitative criteria from analysts is also considered based on expert and supportable information. |
The criteria for determining whether credit risk has increased significantly will vary by portfolio and will include a backstop based on delinquency.
Grupo Aval will monitor the effectiveness of the criteria used in identifying significant increases in credit risk through regular reviews to confirm that:
| ● | The criteria are useful in identifying significant increases in credit risk before an exposure is in default; |
| ● | The criteria align with the point in time when an asset becomes over 30 days past due; |
| ● | The average time between the identification of a significant increase in credit risk and default appears reasonable; |
| ● | Exposures are not generally transferred directly from 12-month ECL measurement to credit-impaired; and |
| ● | There is unwarranted volatility in loss allowance from transfers between 12-month ECL and lifetime ECL measurements. |
II. PD – Probability of Default
Term structure of PD
Credit risk grades are the primary input in the determination of the term structure of PD for exposures. Grupo Aval collects performance and default information about its credit risk exposures by type of product and borrower, and by credit risk grade. For some portfolios, information purchased from external credit bureaus may also be used.
Grupo Aval employs statistical models to analyze the data collected and generates estimates of the remaining lifetime PD of exposures and how these are expected to change as a result of the passage of time.
F-70
Grupo Aval Acciones y Valores S.A.
Notes to the Consolidated Financial Statements
For the years ended December 31, 2022, 2021 and 2020
(Amounts expressed in millions of Colombian pesos)
This analysis includes the identification and calibration of the relation between changes in default rates and changes in key macro-economic factors, as well as an in-depth analysis of the impact of certain other factors on the risk of default. For exposures to specific industries and/or regions, the analysis may extend to relevant commodity and/ or real estate prices.
For stage 1 the PD estimates the probability that the credit will default in the next 12 months, while the PD in stage 2 is the result of the probabilities for the remaining life of the credit. The probability in Stage 3 is defined as 100%.
Grupo Aval’s approach to incorporating forward-looking information into this assessment is discussed below.
Forward-Looking Information
Grupo Aval incorporates forward-looking information into both its assessment of whether the credit risk of an instrument has increased significantly since initial recognition and its measurement of ECLs. Grupo Aval formulates a ‘base case’ view of the future direction of relevant economic variables and a representative range of other possible forecast scenarios based on forecasts provided by economic experts and considering a forecast of multiple variables. This process involves developing two or more additional economic scenarios and considering the relative probabilities of each outcome.
The B scenario (base case) represents a most-likely outcome. It is aligned with information used by Grupo Aval for other purposes, such as budgeting. The other scenarios represent more optimistic (C) and more pessimistic (A) outcomes with their respective probability of occurrence.
Grupo Aval has identified and documented key drivers of credit risk and credit losses for each portfolio of financial instruments and, using an analysis of historical data, has estimated relationships between macro-economic variables and credit risk and credit losses.
Changes in economic conditions will be monitored by Grupo Aval´s Entities and subsidiaries to be incorporated into the macroeconomic parameters used to prepare stress scenarios and financial projections. Forward looking information was adjusted, recognizing macroeconomic impacts based on the available information about past events, current conditions and forecasts of economic conditions.
The following table presents one-year projections for Colombia made in December 2021, compared to the official data for December 2022:
2022 | 2021 | ||||
Real Scenario | Scenario A | Scenario B | Scenario C | ||
Inflation | |||||
DTF Interest rate | |||||
GDP Growth | |||||
Unemployment rate | |||||
The following table presents one-year projections for Panamá made in December 2021, compared to the official data for December 2022:
2022 | 2021 | ||||
Real Scenario | Scenario A | Scenario B | Scenario C | ||
Inflation | |||||
Nominal interest rate variation | |||||
GDP Growth | |||||
F-71
Grupo Aval Acciones y Valores S.A.
Notes to the Consolidated Financial Statements
For the years ended December 31, 2022, 2021 and 2020
(Amounts expressed in millions of Colombian pesos)
The economic scenarios used as of December 31, 2022, and 2021 (one-year projections) include the following expected scenarios of key indicators (among others) for Colombia.
2022 | 2021 | ||||||
Scenario A | Scenario B | Scenario C | Scenario A | Scenario B | Scenario C | ||
Inflation | |||||||
DTF interest rate | |||||||
GDP Growth | ( | ||||||
Used home prices | ( | ( | |||||
Unemployment rate | |||||||
The economic scenarios used as of December 31, 2022, and 2021 (one-year projections) include the following expected scenarios of key indicators (among others) for Panamá.
2022 | 2021 | ||||||
Scenario A | Scenario B | Scenario C | Scenario A | Scenario B | Scenario C | ||
Inflation | |||||||
Nominal interest rate variation | |||||||
GDP Growth | |||||||
The scenario probability weightings applied as of December 31, 2022, and 2021 in measuring ECL are as follows.
Colombia
2022 | 2021 | |||||||||||||
| Scenario A |
| Scenario B |
| Scenario C |
| Scenario A |
| Scenario B |
| Scenario C |
| ||
Scenario probability | ||||||||||||||
Panamá
2022 | 2021 | |||||||||||||
| Scenario A |
| Scenario B |
| Scenario C |
| Scenario A |
| Scenario B |
| Scenario C |
| ||
Scenario probability |
| |||||||||||||
F-72
Grupo Aval Acciones y Valores S.A.
Notes to the Consolidated Financial Statements
For the years ended December 31, 2022, 2021 and 2020
(Amounts expressed in millions of Colombian pesos)
The table below shows the loss allowance on loans assuming each forward-looking scenario (e.g. scenario A, B and C) were weighted 100% instead of applying scenario probability weights across the three scenarios.
December 31, 2022 | December 31, 2021 | ||||||||||||||||||
|---|---|---|---|---|---|---|---|---|---|---|---|---|---|---|---|---|---|---|---|
Scenario A | Scenario B | Scenario C |
| Scenario A | Scenario B | Scenario C | |||||||||||||
Gross Exposure | |||||||||||||||||||
Commercial | Ps. | | Ps. | | Ps. | | Ps. | | Ps. | | Ps. | | |||||||
Consumer | | | | | | | |||||||||||||
Mortgages | | | | | | | |||||||||||||
Microcredit | | | | | | | |||||||||||||
Interbank and overnight founds | | | | | | | |||||||||||||
Total gross exposure | Ps. | | Ps. | | Ps. | | Ps. | | Ps. | | Ps. | | |||||||
Loss Allowance for each scenario | |||||||||||||||||||
Commercial | Ps. | | Ps. | | Ps. | | Ps. | | Ps. | | Ps. | | |||||||
Consumer | | | | | | | |||||||||||||
Mortgages | | | | | | | |||||||||||||
Microcredit | | | | | | | |||||||||||||
Interbank and overnight founds | | | | | | | |||||||||||||
Total Loss Allowance | Ps. | | Ps. | | Ps. | | Ps. | | Ps. | | Ps. | | |||||||
The table below shows the loan portfolio in Stage 2 for each scenario. | |||||||||||||||||||
Proportion of Assets in Stage 2 | |||||||||||||||||||
Commercial | | % | | % | | % | | % | | % | | % | |||||||
Consumer | | % | | % | | % | | % | | % | | % | |||||||
Mortgages | | % | | % | | % | | % | | % | | % | |||||||
Microcredit | | % | | % | | % | | % | | % | | % | |||||||
Interbank and overnight founds | — | % | — | % | — | % | — | % | — | % | — | % | |||||||
Credit Risk Rating
Grupo Aval allocates each exposure to a credit risk grade based on a variety of data intended to be predictive of the probability of default and applying experienced credit judgment. Grupo Aval uses these grades with the purpose identifying significant increases in credit risk. Credit risk grades are defined using qualitative and quantitative factors that are indicative of the risk of default. These factors may vary depending on the nature of the exposure and the type of borrower.
Each exposure is allocated to a credit risk grade at initial recognition based on available information about the borrower. Exposures are subject to ongoing monitoring, which may result in an exposure being moved to a different credit risk grade. The monitoring typically involves using of the following data:
Commercial |
| Consumer |
| Mortgage |
| Microcredit |
-Information from the audited financial statements obtained during periodic reviews. |
| -Information collected internally about the behavior of customers. |
| -Information collected internally about the behavior of customers. |
| -Information collected internally about the behavior of customers. |
-Data from credit bureaus. |
| -Data from credit bureaus. |
| -Data from credit bureaus. |
| -Data from credit bureaus. |
-Information collected internally about the behavior of customers. | ||||||
-Information of the different sectors. |
III. LGD – Loss Given Default
LGD is a measure of the likely loss in the event of a default. To estimate LGD, Grupo Aval uses information of the collateral security / guarantee which covers each individual credit, when available. In any case, Grupo Aval uses historical and forward-looking information (the same information described above in II. PD – Probability of Default - Forward-Looking Information) to estimate
F-73
Grupo Aval Acciones y Valores S.A.
Notes to the Consolidated Financial Statements
For the years ended December 31, 2022, 2021 and 2020
(Amounts expressed in millions of Colombian pesos)
the expected potential recovery in case of a default. The LGD is estimated in groups by type of credit, collateral security / guarantee or maturity.
IV. EAD – Exposure at Default
EAD represents the expected exposure from a counterparty at the time of a possible default. For stage 2 Grupo Aval incorporates in the analysis of the exposure at default the probability of payments and increase in exposure during the lifetime of the credit.
These probabilities are estimated using the historical information collected by the financial subsidiaries and are grouped by type of product. The probabilities are constantly reviewed in order to accurately estimate them and calibrate them.
Credit Risk Model: Debt securities
This model estimates the impairment of credit risk in debt securities. In general, at the moment of inception, all financial assets originate ECLs for the next 12 months. If credit risk increases significantly and there is enough objective evidence of increase of probability of default, then the reserve is adjusted for the remaining life of the financial asset.
I. Transition between stages
A financial asset is classified as a low credit risk asset if the issuer is related to an investment grade credit rating.
Financial assets different than low credit risk must be evaluated individually. The first step in the methodology consist in evaluating a significant increase in credit risk by comparing the current status against the status at initial recognition of the security.
External elements related to a significant increase in credit risk are detailed below:
| ● | Negative changes in external credit ratings. |
| ● | Changes in external market variables such as credit spreads, prices of issuer’s CDS and other prices of debt instruments and equities. |
| ● | Changes in business, economic, financial, regulatory or technological environment which can affect the payment capacity of the issuer. |
| ● | Changes in operational results that can compromise the payment capacity of the issuer. |
If the financial asset loses its low credit risk condition or if changes in external environment results in a review of the condition, then this probably shows a significant increase in credit risk. Consequently, the financial asset will be analyzed to determine if there is a significant increase of credit risk (stage 2) or if the asset should be classified as stage 3.
Objective evidence of impairment is the second step in making changes between stages. It is concluded that there is objective evidence of impairment if one the following situations is met:
| ● | The external credit rating of the issuance, issuer or counterparty is reduced to D on the Standard & Poor´s and Fitch Ratings scale or up to C on the Moody´s scale. |
| ● | Contractual payments are not made on the established dates, terms or grace periods. |
| ● | There is a certainty of suspension of payments. |
| ● | There is a probability that the issuer or counterparty will go into a bankruptcy process. |
| ● | Due to financial difficulties there is no market for financial assets. |
II. PD – Probability of default
PD depends of the external credit rating of the issuance, issuer or counterparty. Credit rating information is published by international credit rating corporations, such as Standard & Poor’s, Moody’s and Fitch Ratings, or national credit rating corporations, such as Fitch Ratings Colombia S.A. or BRC. In any case, international ratings have priority over national ratings.
Credit ratings from S&P have priority over the other rating corporations. If the issuance, issuer or counterparty is not rated by S&P, credit ratings from Moody’s or Fitch Ratings can be used but they must be translated to the S&P rating scale. The order of priority in credit rating corporations is as follows: S&P in first place, Moody’s in second place and Fitch Ratings in the third one. The reason
F-74
Grupo Aval Acciones y Valores S.A.
Notes to the Consolidated Financial Statements
For the years ended December 31, 2022, 2021 and 2020
(Amounts expressed in millions of Colombian pesos)
for choosing this hierarchy is to avoid discretion at the time of assigning a rating. National credit ratings can be used only if international credit ratings are not available, and the translation condition to the S&P rating scale must be followed as well.
For financial assets classified as stage 1, PD correspond to the probability of default for the next 12 months established in accordance to “Cumulative Default Rates by Rating Modifiers” for both sovereign and corporate issuers, expressed at an annual basis. If the remaining life of the assets is less than 12 months, the resulting PD will correspond to the weighted 12 months-PD with the remaining life of the financial asset.
For financial assets classified as stage 2, lifetime PD must be used and computed using the “Cumulative Default Rates by Rating Modifiers” for both sovereign and corporate issuers, expressed at an annual basis and according to the term of each flow.
For financial assets classified as stage 3, lifetime PD will equal 100% for any issuance, issuer or counterparty.
PD value tables are available in S&P Global Ratings: “2020 Annual Sovereign Default Study and Rating Transitions” and “2020 Annual Global Corporate Default Study and Rating Transitions Study”.
Forward-Looking Information
Grupo Aval incorporates forward-looking information into its assessment of whether the credit risk of an instrument has increased significantly since initial recognition and its measurement of ECL. This information will directly affect the PD and the stage classification.
When rating the sovereign and corporate issuers, credit ratings agencies incorporate prospective information, as well as forecasting of macroeconomic variables and the influence of these factors over the business conditions. Grupo Aval’s methodology includes external credit ratings which, under the previous argument, have already considered prospective information.
Furthermore, credit ratings are also subject to rating outlooks which can modify the current credit ratings. Details are provided below. Rating outlooks are published by credit rating corporations and reflect the perspective of the potential long-term credit rating over the next 6 to 24 months.
| ● | If the Rating Outlook is categorized as “STABLE”, no adjustments in credit ratings are needed. |
| ● | If the Rating Outlook is “POSITIVE”, PD will be adjusted as the average between the current PD and the applicable PD in the case credit rating improves one notch. However, this would only take place if the resulting PD is lower than the current PD. |
| ● | If the Rating Outlook is “NEGATIVE”, PD will be adjusted as the average between the current PD and the applicable PD in the case credit rating deteriorates one notch. However, this would only take place if the resulting PD is higher than the current PD. |
III. LGD – Loss given default
LGD is a measure of the potential loss if a default scenario occurs. To establish the LGD, Grupo Aval’s methodology uses information published by Moody’s credit rating corporation. LGD is based on relevant external default data, such as the historical recovery rates, which is defined as the complement of LGD calculation.
Moody’s computes Recovery Rates as the ratio between market prices after 30 days of the default or the debt swap price at the closing date, and the market price of the issuance at the beginning of the default. In the case of unavailable market prices, recovery rates will be the resulting ratio between present value of expected cash flows of the new instruments received with the debt swap and the present value of the initial instruments.
Grupo Aval´s methodology assigns weights for recovery rates for Sovereigns Debt and Corporates Debt. The recovery rates for Sovereigns. Sovereign debt recovery rates remained at
Further information is available and published annually by Moody’s in the “Sovereign default and recovery rates 1983-2020” and “Annual Default Study” reports.
F-75
Grupo Aval Acciones y Valores S.A.
Notes to the Consolidated Financial Statements
For the years ended December 31, 2022, 2021 and 2020
(Amounts expressed in millions of Colombian pesos)
IV. EAD – Exposure at default
EAD represents the amount owed from a counterparty at the time of a possible default and only for securities classified at amortized cost or FVOCI. See accounting policy in Note 2 (2.5 ix).
For stage 1 and stage 3 financial assets, EAD will correspond to the full valuation of the assets at amortized cost.
For stage 2 financial assets, EAD will consider the financial asset amortized scheme assuming no default in the previous years.
In the case that financial assets present a guarantees or security collateral, these could reduce total EAD. This is a typical case of collateralized interbank loans.
Credit Risk Model: Other accounts receivable
Grupo Aval uses two approaches to estimate ECL of financial assets classified as other accounts receivables.
The first one is the simplified approach where Grupo Aval uses an allowance matrix to measure the ECLs of trade receivables from individual customers, which comprise a very large number of small amounts.
Loss rates are calculated using a ‘roll rate’ method based on the probability of a receivable progressing through successive stages of delinquency to write-off. Roll rates are calculated separately for exposures in different segments based on the following common credit risk characteristics like type of product purchased.
Loss rates are based on the experience of real credit loss during a year and the balance of accounts receivable at the cut-off date for previously defined homogeneous segments. It takes into consideration elements such as: segmentation by type of receivable account, date of analysis, definition of loss, among others. Based on the characteristics of the short-term receivable accounts, these portfolios result from operations where there are no non-linear impacts, therefore, the application of macroeconomic scenarios is not considered.
The second one is the general approach, it considers the methodologies explained above for loans and debt securities. For non-financial companies in the oil and gas sector, the loans methodology is considered, while the debt securities methodology is considered for government and other government related entities.
F-76
Grupo Aval Acciones y Valores S.A.
Notes to the Consolidated Financial Statements
For the years ended December 31, 2022, 2021 and 2020
(Amounts expressed in millions of Colombian pesos)
Loss allowance
The table below shows the loss allowance balances as of December 31, 2022 and 2021.
December 31, 2022 | |||||||||||||||
Stage 1 | Stage 2 | Stage 3 | |||||||||||||
Lifetime | Lifetime | ||||||||||||||
ECL not | ECL | ||||||||||||||
12-month | credit- | credit- | Simplified | ||||||||||||
| ECL |
| impaired |
| impaired |
| approach |
| Total | ||||||
Loan portfolio |
|
|
|
|
|
|
|
|
|
|
|
|
|
| |
Commercial loan client portfolio |
| Ps. | |
| Ps. | |
| Ps. | |
| Ps. | — |
| Ps. | |
Consumer loan portfolio |
|
| |
|
| |
|
| |
|
| — |
|
| |
Mortgage loan portfolio |
|
| |
|
| |
|
| |
|
| — |
|
| |
Microcredit loan portfolio |
|
| |
|
| |
|
| |
|
| — |
|
| |
Interbank loan and overnight founds portfolio |
|
| |
|
| — |
|
| — |
|
| — |
|
| |
Total loan portfolio |
| Ps. | |
| Ps. | |
| Ps. | |
| Ps. | — |
| Ps. | |
Investments in debt securities at amortized cost |
|
| |
|
| |
|
| — |
|
| — |
|
| |
Other accounts receivable |
|
| |
|
| |
|
| |
|
| |
|
| |
Total loss allowance financial assets at amortized cost |
| Ps. | |
| Ps. | |
| Ps. | |
| Ps. | |
| Ps. | |
Investments in debt securities at FVOCI |
| Ps. | |
| Ps. | — |
| Ps. | — |
| Ps. | — |
| Ps. | |
Loan commitments and financial guarantee contracts |
|
| |
|
| |
|
| |
|
| — |
|
| |
Total loss allowance |
| Ps. | |
| Ps. | |
| Ps. | |
| Ps. | |
| Ps. | |
F-77
Grupo Aval Acciones y Valores S.A.
Notes to the Consolidated Financial Statements
For the years ended December 31, 2022, 2021 and 2020
(Amounts expressed in millions of Colombian pesos)
December 31, 2021 | |||||||||||||||
Stage 1 | Stage 2 | Stage 3 | |||||||||||||
Lifetime | Lifetime | ||||||||||||||
ECL not | ECL | ||||||||||||||
12-month | credit- | credit- | Simplified | ||||||||||||
| ECL |
| impaired |
| impaired |
| approach |
| Total | ||||||
Loan portfolio |
|
|
|
|
|
|
|
|
|
|
|
|
|
| |
Commercial loan client portfolio |
| Ps. | |
| Ps. | |
| Ps. | |
| Ps. | — |
| Ps. | |
Consumer loan portfolio |
|
| |
|
| |
|
| |
|
| — |
|
| |
Mortgage loan portfolio |
|
| |
|
| |
|
| |
|
| — |
|
| |
Microcredit loan portfolio |
|
| |
|
| |
|
| |
|
| — |
|
| |
Interbank loan and overnight founds portfolio |
|
| |
|
| — |
|
| — |
|
| — |
|
| |
Total loan portfolio |
| Ps. | |
| Ps. | |
| Ps. | |
| Ps. | — |
| Ps. | |
Investments in debt securities at amortized cost |
|
| |
|
| |
|
| — |
|
| — |
|
| |
Other accounts receivable |
|
| |
|
| |
|
| |
|
| |
|
| |
Total loss allowance financial assets at amortized cost |
| Ps. | |
| Ps. | |
| Ps. | |
| Ps. | |
| Ps. | |
Investments in debt securities at FVOCI |
| Ps. | |
| Ps. | — |
| Ps. | — |
| Ps. | — |
| Ps. | |
Loan commitments and financial guarantee contracts |
|
| |
|
| |
|
| |
|
| — |
|
| |
Total loss allowance |
| Ps. | |
| Ps. | |
| Ps. | |
| Ps. | |
| Ps. | |
The table below presents impairment losses per portfolio as of December 31
2022 | 2021 | 2020 | ||||
Commercial | Ps. | | Ps. | | Ps. | |
Consumer | | | | |||
Mortgage | ( | | | |||
Microcredit | | | | |||
Interbank and overnight funds | ( | | ( | |||
Total | Ps. | | Ps. | | Ps. | |
2022 | 2021 | 2020 | ||||
Other receivables | Ps. | | Ps. | | Ps. | |
The table below shows for loans stage 3 individually assessed for ECL the gross amount and loss allowance balances as of December 31, 2022 and 2021.
December 31, 2022 | |||||||||
| Gross Amount Registered |
| Collateral Guarantees |
| Allowance Recognized | ||||
Without recognized provision |
|
|
|
|
|
|
|
|
|
Commercial |
| Ps. | |
| Ps. | |
| Ps. | — |
Repos, interbank loans portfolio |
|
| — |
|
| — |
|
| — |
Subtotal |
| Ps. | |
| Ps. | |
| Ps. | — |
With recognized provision |
|
|
|
|
|
|
|
|
|
Commercial |
| Ps. | |
| Ps. | |
| Ps. | |
Consumer |
|
| |
|
| |
|
| |
Residential mortgage |
|
| |
|
| — |
|
| |
Repos, interbank loans portfolio |
|
| |
|
| — |
|
| — |
Subtotal |
| Ps. | |
| Ps. | |
| Ps. | |
Totals |
|
|
|
|
|
|
|
|
|
Commercial |
|
| |
|
| |
|
| |
Consumer |
|
| |
|
| |
|
| |
Residential mortgage |
|
| |
|
| — |
|
| |
Repos, interbank loans portfolio |
|
| |
|
| — |
|
| — |
Total |
| Ps. | |
| Ps. | |
| Ps. | |
F-78
Grupo Aval Acciones y Valores S.A.
Notes to the Consolidated Financial Statements
For the years ended December 31, 2022, 2021 and 2020
(Amounts expressed in millions of Colombian pesos)
December 31, 2021 | |||||||||
| Gross Amount Registered |
| Collateral Guarantees |
| Allowance Recognized | ||||
Without recognized provision |
|
|
|
|
|
|
|
|
|
Commercial |
| Ps. | |
| Ps. | |
| Ps. | — |
Repos, interbank loans portfolio |
|
| — |
|
| — |
|
| — |
Subtotal |
| Ps. | |
| Ps. | |
| Ps. | — |
With recognized provision |
|
|
|
|
|
|
|
|
|
Commercial |
| Ps. | |
| Ps. | |
| Ps. | |
Consumer |
|
| |
|
| — |
|
| |
Repos, interbank loans portfolio |
|
| — |
|
| — |
|
| — |
Subtotal |
| Ps. | |
| Ps. | |
| Ps. | |
Totals |
|
|
|
|
|
|
|
|
|
Commercial |
|
| |
|
| |
|
| |
Consumer |
|
| |
|
| — |
|
| |
Repos, interbank loans portfolio |
|
| — |
|
| — |
|
| — |
Total |
| Ps. | |
| Ps. | |
| Ps. | |
The difference between the value of the loan and the guarantees disclosed in the table above corresponds to unsecured loans valued under the discounted cash flow method. When using this method, it is implied that it is possible for the customer to make future payments.
The loss allowance recognized in the period is impacted by a variety of factors, as described below:
| ● | Transfers between Stage 1 and Stages 2 or 3 due to financial instruments experiencing significant increases (or decreases) in credit risk or becoming credit-impaired in the period, and the consequent "step up" (or "step down") between 12-month and lifetime ECL; |
| ● | Additional allowances for new financial instruments recognized during the period, as well as releases for financial instruments de-recognized in the period; |
| ● | Impact of the measurement of ECL due to changes made to models and assumptions; |
| ● | Decrease within ECL due to the passage of time, as ECL is measured on a present value basis; |
| ● | Foreign exchange retranslations for asset denominated in foreign currencies and other movements; and |
| ● | Financial assets derecognized during the period and write-offs of allowances related to assets than were written off during the period. |
The following tables show the reconciliations from the opening to the closing balance of the loss allowance by class of financial instrument.
Total Loan portfolio
| Stage 2 | |||||||||||
|---|---|---|---|---|---|---|---|---|---|---|---|---|
Lifetime | Stage 3 | |||||||||||
Stage 1 | ECL not | Lifetime | ||||||||||
12-month | credit- | ECL credit- | ||||||||||
| ECL |
| impaired |
| impaired |
| Total | |||||
Loss allowance as of January 1, 2020 | Ps. | |
| Ps. | |
| Ps. | | Ps. | | ||
Transfers: | ||||||||||||
Transfer from stage 1 to stage 2 | ( | | — | — | ||||||||
Transfer from stage 1 to stage 3 | ( | — | | — | ||||||||
Transfer from stage 2 to stage 3 | — | ( | | — | ||||||||
Transfer from stage 3 to stage 2 | — | | ( | — | ||||||||
Transfer from stage 2 to stage 1 | | ( | — | — | ||||||||
Transfer from stage 3 to stage 1 | | — | ( | — | ||||||||
Net remeasurement of loss allowance (6) | | | | | ||||||||
New financial assets originated or purchased | | | | | ||||||||
Financial assets that have been derecognized | ( | ( | ( | ( | ||||||||
Unwind of discount (3) | — | — | | | ||||||||
FX and other movements | | ( | ( | ( | ||||||||
Discontinued operations (1) | ( | | | | ||||||||
Reclassification BAC (1) (2) | | ( | ( | ( | ||||||||
F-79
Grupo Aval Acciones y Valores S.A.
Notes to the Consolidated Financial Statements
For the years ended December 31, 2022, 2021 and 2020
(Amounts expressed in millions of Colombian pesos)
| Stage 2 | |||||||||||
|---|---|---|---|---|---|---|---|---|---|---|---|---|
Lifetime | Stage 3 | |||||||||||
Stage 1 | ECL not | Lifetime | ||||||||||
12-month | credit- | ECL credit- | ||||||||||
| ECL |
| impaired |
| impaired |
| Total | |||||
Write-offs | ( | ( | ( | ( | ||||||||
Loss allowance as of December 31, 2020 | Ps. | |
| Ps. | |
| Ps. | | Ps. | | ||
Transfers: |
|
|
|
|
|
|
| |||||
Transfer from stage 1 to stage 2 | ( |
|
| |
|
| — | — | ||||
Transfer from stage 1 to stage 3 | ( |
|
| — |
|
| | — | ||||
Transfer from stage 2 to stage 3 | — |
|
| ( |
|
| | — | ||||
Transfer from stage 3 to stage 2 | — |
|
| |
|
| ( | — | ||||
Transfer from stage 2 to stage 1 | |
|
| ( |
|
| — | — | ||||
Transfer from stage 3 to stage 1 | |
|
| — |
|
| ( | — | ||||
Net remeasurement of loss allowance (5) | ( |
|
| |
|
| | | ||||
New financial assets originated or purchased | |
|
| |
|
| | | ||||
Financial assets that have been derecognized | ( |
|
| ( |
|
| ( | ( | ||||
Unwind of discount (3) | — |
|
| |
|
| | | ||||
FX and other movements | |
|
| |
|
| | | ||||
Discontinued operations (1) | ( | | | | ||||||||
Reclassification BAC (1) (2) | |
|
| ( |
|
| ( | ( | ||||
Write-offs | ( |
|
| ( |
|
| ( | ( | ||||
Loss allowance as of December 31, 2021 |
| Ps. | |
| Ps. | |
| Ps. | |
| Ps. | |
Transfers: |
|
|
|
|
|
|
|
|
|
|
|
|
Transfer from stage 1 to stage 2 |
|
| ( | | — |
|
| — | ||||
Transfer from stage 1 to stage 3 |
|
| ( | — | |
|
| — | ||||
Transfer from stage 2 to stage 3 |
|
| — | ( | |
|
| — | ||||
Transfer from stage 3 to stage 2 |
|
| — | | ( |
|
| — | ||||
Transfer from stage 2 to stage 1 |
|
| | ( | — |
|
| — | ||||
Transfer from stage 3 to stage 1 |
|
| | — | ( |
|
| — | ||||
Net remeasurement of loss allowance (4) |
|
| ( | | |
|
| | ||||
New financial assets originated or purchased |
|
| | | |
|
| | ||||
Financial assets that have been derecognized |
|
| ( | ( | ( |
|
| ( | ||||
Unwind of discount (3) |
|
| — | | |
|
| | ||||
FX and other movements |
|
| | | |
|
| | ||||
Discontinued operations (1) | ( | | | | ||||||||
Loss of control in subsidiary (1) |
|
| ( | ( | ( |
|
| ( | ||||
Write-offs |
|
| ( | ( | ( |
|
| ( | ||||
Loss allowance as of December 31, 2022 |
| Ps. | |
| Ps. | |
| Ps. | |
| Ps. | |
(1) See note 1.1 “Discontinued operations of BAC Holding”
(2) Correspond to reclassification for comparability of the movements of BAC Holding consider the deconsolidation of this entity during year 2022.
(3) | The unwind of discount on Stage 3 financial assets is reported within "interest income" so that interest income is recognized on the amortized cost (after deducting the ECL allowance) |
(4) | This amount includes impact of the measurement of ECL due to changes made in PDs/LGDs/EADs and changes made to model assumptions and methodologies from the opening to the closing balance. The following table shows the impact by stage estimated using all parameters as of December 31, 2022 versus parameters as of 2021 and the loan portfolio as of 2022. |
December 31, 2022 | ||||||||||
| Stage 2 |
| Stage 3 |
| ||||||
Stage 1 | Lifetime ECL not | Lifetime ECL | ||||||||
12-month ECL | credit-impaired | credit-impaired | Total | |||||||
Ps. | ( |
| Ps. | |
| Ps. | |
| Ps. | ( |
F-80
Grupo Aval Acciones y Valores S.A.
Notes to the Consolidated Financial Statements
For the years ended December 31, 2022, 2021 and 2020
(Amounts expressed in millions of Colombian pesos)
(5) This amount includes impact of the measurement of ECL due to changes made in PDs/LGDs/EADs and changes made to model assumptions and methodologies from the opening to the closing balance. The following table shows the impact by stage estimated using all parameters as of December 31, 2021 versus parameters as of December 31,2020 and the loan portfolio as of December 31, 2021.
December 31, 2021 | ||||||||||
| Stage 2 |
| Stage 3 |
| ||||||
Stage 1 | Lifetime ECL not | Lifetime ECL | ||||||||
12-month ECL | credit-impaired | credit-impaired | Total | |||||||
Ps. | ( |
| Ps. | |
| Ps. | |
| Ps. | |
(6) This amount includes impact of the measurement of ECL due to changes made in PDs/LGDs/EADs and changes made to model assumptions and methodologies from the opening to the closing balance. The following table shows the impact by stage estimated using all parameters as of December 31, 2020 versus parameters as of December 31,2019 and the loan portfolio as of December 31, 2020.
December 31, 2020 | ||||||||||
| Stage 2 |
| Stage 3 |
| ||||||
Stage 1 | Lifetime ECL not | Lifetime ECL | ||||||||
12-month ECL | credit-impaired | credit-impaired | Total | |||||||
Ps. | ( |
| Ps. | |
| Ps. | |
| Ps. | |
The following table further explains changes in the gross carrying amount of the loan portfolio to help explain their significance to the changes in the allowance for the same portfolio as discussed above.
| Stage 2 | |||||||||||
|---|---|---|---|---|---|---|---|---|---|---|---|---|
Lifetime | Stage 3 | |||||||||||
Stage 1 | ECL not | Lifetime | ||||||||||
12-month | credit- | ECL credit- | ||||||||||
| ECL |
| impaired |
| impaired |
| Total | |||||
Total portfolio as of January 1, 2020 |
| Ps. | Ps. | Ps. | Ps. | | ||||||
Transfers: | ||||||||||||
Transfer from stage 1 to stage 2 | ( |
| |
| — | — | ||||||
Transfer from stage 1 to stage 3 | ( |
| — |
| | — | ||||||
Transfer from stage 2 to stage 3 | — |
| ( |
| | — | ||||||
Transfer from stage 2 to stage 1 | |
| ( |
| — | — | ||||||
Transfer from stage 3 to stage 2 | — |
| |
| ( | — | ||||||
Transfer from stage 3 to stage 1 | |
| — |
| ( | — | ||||||
New financial assets originated or purchased | | | | | ||||||||
Financial assets that have been paid | ( | ( | ( | ( | ||||||||
Net remeasurement of amortized cost and other receivables | ( | | | | ||||||||
Write-offs | ( | ( | ( | ( | ||||||||
On business combination(3) | |
|
| |
|
| | | ||||
Discontinued operations (1) | |
|
| |
|
| | | ||||
Reclassification BAC (1) (2) | ( |
|
| |
|
| | ( | ||||
FX and other movements | ( |
| |
| | ( | ||||||
Total portfolio as of December 31, 2020 |
| Ps. | Ps. | Ps. |
| Ps. | ||||||
Transfers: | ||||||||||||
Transfer from stage 1 to stage 2 | ( |
| |
| — | — | ||||||
Transfer from stage 1 to stage 3 | ( |
| — |
| | — | ||||||
Transfer from stage 2 to stage 3 | — |
| ( |
| | — | ||||||
Transfer from stage 2 to stage 1 | |
| ( |
| — | — | ||||||
Transfer from stage 3 to stage 2 | — |
| |
| ( | — | ||||||
Transfer from stage 3 to stage 1 | |
| — |
| ( | — | ||||||
New financial assets originated or purchased | | | | | ||||||||
Financial assets that have been paid | ( | ( | ( | ( | ||||||||
Net remeasurement of amortized cost and other receivables | ( | | | | ||||||||
Write-offs | ( | ( | ( | ( | ||||||||
Discontinued operations (1) | |
|
| |
|
| | | ||||
Reclassification BAC (1) (2) | |
|
| ( |
|
| | | ||||
FX and other movements | |
| |
| | | ||||||
Total portfolio as of December 31, 2021 |
| Ps. | |
| Ps. | |
| Ps. | |
| Ps. | |
F-81
Grupo Aval Acciones y Valores S.A.
Notes to the Consolidated Financial Statements
For the years ended December 31, 2022, 2021 and 2020
(Amounts expressed in millions of Colombian pesos)
| Stage 2 | |||||||||||
|---|---|---|---|---|---|---|---|---|---|---|---|---|
Lifetime | Stage 3 | |||||||||||
Stage 1 | ECL not | Lifetime | ||||||||||
12-month | credit- | ECL credit- | ||||||||||
| ECL |
| impaired |
| impaired |
| Total | |||||
Transfers: |
|
|
|
|
|
|
|
|
|
|
|
|
Transfer from stage 1 to stage 2 |
|
| ( | | — |
|
| — | ||||
Transfer from stage 1 to stage 3 |
|
| ( | — | |
|
| — | ||||
Transfer from stage 2 to stage 3 |
|
| — | ( | |
|
| — | ||||
Transfer from stage 2 to stage 1 |
|
| | ( | — |
|
| — | ||||
Transfer from stage 3 to stage 2 |
|
| — | | ( |
|
| — | ||||
Transfer from stage 3 to stage 1 |
|
| | — | ( |
|
| — | ||||
New financial assets originated or purchased |
|
| | | |
|
| | ||||
Financial assets that have been paid |
|
| ( | ( | ( |
|
| ( | ||||
Net remeasurement of amortized cost and other receivables |
|
| ( | | |
|
| | ||||
Write-offs |
|
| ( | ( | ( |
|
| ( | ||||
Discontinued operations (1) | | ( | ( | | ||||||||
Loss of control in subsidiary (1) | ( | ( | ( | ( | ||||||||
FX and other movements | | | | | ||||||||
Total portfolio as of December 31, 2022 |
| Ps. | |
| Ps. | |
| Ps. | |
| Ps. | |
(1) See note 1.1 “Discontinued operations of BAC Holding”
(2) Correspond to reclassification for comparability of the movements of BAC Holding consider the deconsolidation of this entity during year 2022.
(3) See note 35 Business combination
The total loan portfolio is composed of commercial loans – client portfolio, consumer loans, mortgage loans, microcredit loans and interbank and overnight funds loan. The following tables show the movement in provision and gross amounts of these portfolios separately:
F-82
Grupo Aval Acciones y Valores S.A.
Notes to the Consolidated Financial Statements
For the years ended December 31, 2022, 2021 and 2020
(Amounts expressed in millions of Colombian pesos)
Commercial – Client portfolio
| Stage 2 | |||||||||||
Lifetime | Stage 3 | |||||||||||
Stage 1 | ECL not | Lifetime | ||||||||||
12-month | credit- | ECL credit- | ||||||||||
| ECL |
| impaired |
| impaired |
| Total | |||||
Loss allowance as of January 1, 2020 | Ps. | |
| Ps. | |
| Ps. | | Ps. | | ||
Transfers: | ||||||||||||
Transfer from stage 1 to stage 2 | ( | | — | — | ||||||||
Transfer from stage 1 to stage 3 | ( | — | | — | ||||||||
Transfer from stage 2 to stage 3 | — | ( | | — | ||||||||
Transfer from stage 3 to stage 2 | — | | ( | — | ||||||||
Transfer from stage 2 to stage 1 | | ( | — | — | ||||||||
Transfer from stage 3 to stage 1 | | — | ( | — | ||||||||
Net remeasurement of loss allowance (6) | ( | | | | ||||||||
New financial assets originated or purchased | | | | | ||||||||
Financial assets that have been derecognized | ( | ( | ( | ( | ||||||||
Unwind of discount (3) | — | — | | | ||||||||
FX and other movements | | ( | ( | | ||||||||
Discontinued operations (1) | ( | | | | ||||||||
Reclassification BAC (1) (2) | | ( | ( | ( | ||||||||
Write-offs | ( | ( | ( | ( | ||||||||
Loss allowance as of December 31, 2020 | Ps. | |
| Ps. | |
| Ps. | | Ps. | | ||
Transfers: |
|
|
|
|
|
|
| |||||
Transfer from stage 1 to stage 2 | ( |
| |
| — | — | ||||||
Transfer from stage 1 to stage 3 | ( |
| — |
| | — | ||||||
Transfer from stage 2 to stage 3 | — |
| ( |
| | — | ||||||
Transfer from stage 3 to stage 2 | — |
| |
| ( | — | ||||||
Transfer from stage 2 to stage 1 | |
| ( |
| — | — | ||||||
Transfer from stage 3 to stage 1 | |
| — |
| ( | — | ||||||
Net remeasurement of loss allowance (5) | ( |
| |
| | | ||||||
New financial assets originated or purchased | |
| |
| | | ||||||
Financial assets that have been derecognized | ( |
| ( |
| ( | ( | ||||||
Unwind of discount (3) | — |
| — |
| | | ||||||
FX and other movements | |
| |
| | | ||||||
Discontinued operations (1) | ( | | ||||||||||
Reclassification BAC (1) (2) | |
|
| ( |
|
| ( | ( | ||||
Write-offs | ( |
|
| ( |
|
| ( | ( | ||||
Loss allowance as of December 31, 2021 |
| Ps. | |
| Ps. | |
| Ps. | |
| Ps. | |
Transfers: |
|
|
|
|
|
|
|
|
| |||
Transfer from stage 1 to stage 2 |
|
| ( |
|
| |
|
| — |
|
| — |
Transfer from stage 1 to stage 3 |
|
| ( |
|
| — |
|
| |
|
| — |
Transfer from stage 2 to stage 3 |
|
| — |
|
| ( |
|
| |
|
| — |
Transfer from stage 3 to stage 2 |
|
| — |
|
| |
|
| ( |
|
| — |
Transfer from stage 2 to stage 1 |
|
| |
|
| ( |
|
| — |
|
| — |
Transfer from stage 3 to stage 1 |
|
| |
|
| — |
|
| ( |
|
| — |
Net remeasurement of loss allowance (4) |
|
| ( |
|
| ( |
|
| |
|
| |
New financial assets originated or purchased |
|
| |
|
| |
|
| |
|
| |
Financial assets that have been derecognized |
|
| ( |
|
| ( |
|
| ( |
|
| ( |
Unwind of discount (3) |
|
| — |
|
| |
|
| |
|
| |
FX and other movements |
|
| |
|
| |
|
| |
|
| |
Discontinued operations (1) | | ( | | | ||||||||
Loss of control in subsidiary (1) |
|
| ( |
|
| ( |
|
| ( |
|
| ( |
Write-offs |
|
| ( |
|
| ( |
|
| ( |
|
| ( |
Loss allowance as of December 31, 2022 |
| Ps. | |
| Ps. | |
| Ps. | |
| Ps. | |
(1) See note 1.1 “Discontinued operations of BAC Holding”
(2) Correspond to reclassification for comparability of the movements of BAC Holding consider the deconsolidation of this entity during year 2022.
(3) | The unwind of discount on Stage 3 financial assets is reported within "interest income" so that interest income is recognized on the amortized cost (after deducting the ECL allowance) |
F-83
Grupo Aval Acciones y Valores S.A.
Notes to the Consolidated Financial Statements
For the years ended December 31, 2022, 2021 and 2020
(Amounts expressed in millions of Colombian pesos)
(4) | This amount includes impact of the measurement of ECL due to changes made in PDs/LGDs/EADs and changes made to model assumptions and methodologies from the opening to the closing balance. The following table shows the impact by stage estimated using all parameters as of December 31, 2022 versus parameters as of 2021 and the loan portfolio as of 2022. |
December 31, 2022 | ||||||||||
| Stage 2 |
| Stage 3 |
| ||||||
Stage 1 | Lifetime ECL not | Lifetime ECL | ||||||||
12-month ECL | credit-impaired | credit-impaired | Total | |||||||
Ps. | ( |
| Ps. | |
| Ps. | |
| Ps. | |
(5) This amount includes impact of the measurement of ECL due to changes made in PDs/LGDs/EADs and changes made to model assumptions and methodologies from the opening to the closing balance. The following table shows the impact by stage estimated using all parameters as of December 31, 2021 versus parameters as of December 31,2020 and the loan portfolio as of December 31, 2021.
December 31, 2021 | ||||||||||
| Stage 2 |
| Stage 3 |
| ||||||
Stage 1 | Lifetime ECL not | Lifetime ECL | ||||||||
12-month ECL | credit-impaired | credit-impaired | Total | |||||||
Ps. | |
| Ps. | |
| Ps. | |
| Ps. | |
(6) This amount includes impact of the measurement of ECL due to changes made in PDs/LGDs/EADs and changes made to model assumptions and methodologies from the opening to the closing balance. The following table shows the impact by stage estimated using all parameters as of December 31, 2020 versus parameters as of December 31,2019 and the loan portfolio as of December 31, 2020.
December 31, 2020 | ||||||||||
| Stage 2 |
| Stage 3 |
| ||||||
Stage 1 | Lifetime ECL not | Lifetime ECL | ||||||||
12-month ECL | credit-impaired | credit-impaired | Total | |||||||
Ps. | ( |
| Ps. | |
| Ps. | |
| Ps. | |
The following table further explains changes in the gross carrying amount of the commercial portfolio to help explain their significance to the changes in the allowance for the same portfolio as discussed above.
| Stage 2 | |||||||||||
|---|---|---|---|---|---|---|---|---|---|---|---|---|
Lifetime | Stage 3 | |||||||||||
Stage 1 | ECL not | Lifetime | ||||||||||
12-month | credit- | ECL credit- | ||||||||||
| ECL |
| impaired |
| impaired |
| Total | |||||
Total portfolio as of January 1, 2020 |
| Ps. | Ps. | Ps. | Ps. | | ||||||
Transfers: | ||||||||||||
Transfer from stage 1 to stage 2 | ( |
| |
| — | — | ||||||
Transfer from stage 1 to stage 3 | ( |
| — |
| | — | ||||||
Transfer from stage 2 to stage 3 | — |
| ( |
| | — | ||||||
Transfer from stage 2 to stage 1 | |
| ( |
| — | — | ||||||
Transfer from stage 3 to stage 2 | — |
| |
| ( | — | ||||||
Transfer from stage 3 to stage 1 | |
| — |
| ( | — | ||||||
New financial assets originated or purchased | | | | | ||||||||
Financial assets that have been paid | ( | ( | ( | ( | ||||||||
Net remeasurement of amortized cost and other receivables | | | | | ||||||||
Write-offs | ( | ( | ( | ( | ||||||||
On business combination(3) | |
|
| |
|
| | | ||||
Discontinued operations (1) | |
|
| |
|
| | | ||||
Reclassification BAC (1) (2) | ( |
|
| |
|
| | | ||||
FX and other movements | |
| |
| | | ||||||
Total portfolio as of December 31, 2020 |
| Ps. | Ps. | Ps. |
| Ps. | ||||||
Transfers: | ||||||||||||
Transfer from stage 1 to stage 2 | ( |
| |
| — | — | ||||||
Transfer from stage 1 to stage 3 | ( |
| — |
| | — | ||||||
Transfer from stage 2 to stage 3 | — |
| ( |
| | — | ||||||
Transfer from stage 2 to stage 1 | |
| ( |
| — | — | ||||||
Transfer from stage 3 to stage 2 | — |
| |
| ( | — | ||||||
Transfer from stage 3 to stage 1 | |
| — |
| ( | — | ||||||
New financial assets originated or purchased | |
| |
| | | ||||||
F-84
Grupo Aval Acciones y Valores S.A.
Notes to the Consolidated Financial Statements
For the years ended December 31, 2022, 2021 and 2020
(Amounts expressed in millions of Colombian pesos)
| Stage 2 | |||||||||||
|---|---|---|---|---|---|---|---|---|---|---|---|---|
Lifetime | Stage 3 | |||||||||||
Stage 1 | ECL not | Lifetime | ||||||||||
12-month | credit- | ECL credit- | ||||||||||
| ECL |
| impaired |
| impaired |
| Total | |||||
Financial assets that have been paid | ( |
| ( |
| ( | ( | ||||||
Net remeasurement of amortized cost and other receivables | ( |
| ( |
| | | ||||||
Write-offs | ( |
| ( |
| ( | ( | ||||||
Discontinued operations (1) | |
|
| |
|
| | | ||||
Reclassification BAC (1) (2) | |
|
| |
|
| ( | | ||||
FX and other movements | |
| |
| | | ||||||
Total portfolio as of December 31, 2021 |
| Ps. | |
| Ps. | |
| Ps. | |
| Ps. | |
Transfers: |
|
|
|
|
|
|
|
|
|
|
|
|
Transfer from stage 1 to stage 2 |
|
| ( | | — |
|
| — | ||||
Transfer from stage 1 to stage 3 |
|
| ( | — | |
|
| — | ||||
Transfer from stage 2 to stage 3 |
|
| — | ( | |
|
| — | ||||
Transfer from stage 2 to stage 1 |
|
| | ( | — |
|
| — | ||||
Transfer from stage 3 to stage 2 |
|
| — | | ( |
|
| — | ||||
Transfer from stage 3 to stage 1 |
|
| | — | ( |
|
| — | ||||
New financial assets originated or purchased |
|
| | | |
|
| | ||||
Financial assets that have been paid |
|
| ( | ( | ( |
|
| ( | ||||
Net remeasurement of amortized cost and other receivables |
|
| ( | | |
|
| | ||||
Write-offs |
|
| ( | ( | ( |
|
| ( | ||||
Discontinued operations (1) | | | ( | | ||||||||
Loss of control in subsidiary (1) | ( | ( | | ( | ||||||||
FX and other movements | | | | | ||||||||
Total portfolio as of December 31, 2022 |
| Ps. | |
| Ps. | |
| Ps. | |
| Ps. | |
(1) See note 1.1 “Discontinued operations of BAC Holding”
(2) Correspond to reclassification for comparability of the movements of BAC Holding consider the deconsolidation of this entity during year 2022.
(3) See note 35 Business combination
F-85
Grupo Aval Acciones y Valores S.A.
Notes to the Consolidated Financial Statements
For the years ended December 31, 2022, 2021 and 2020
(Amounts expressed in millions of Colombian pesos)
Consumer loan portfolio
| Stage 2 | |||||||||||
Lifetime | Stage 3 | |||||||||||
Stage 1 | ECL not | Lifetime | ||||||||||
12-month | credit- | ECL credit- | ||||||||||
| ECL |
| impaired |
| impaired |
| Total | |||||
Loss allowance as of January 1, 2020 | Ps. | |
| Ps. | |
| Ps. | | Ps. | | ||
Transfers: | ||||||||||||
Transfer from stage 1 to stage 2 | ( | | — | — | ||||||||
Transfer from stage 1 to stage 3 | ( | — | | — | ||||||||
Transfer from stage 2 to stage 3 | — | ( | | — | ||||||||
Transfer from stage 3 to stage 2 | — | | ( | — | ||||||||
Transfer from stage 2 to stage 1 | | ( | — | — | ||||||||
Transfer from stage 3 to stage 1 | | — | ( | — | ||||||||
Net remeasurement of loss allowance (6) | | | | | ||||||||
New financial assets originated or purchased | | | | | ||||||||
Financial assets that have been derecognized | ( | ( | | ( | ||||||||
Unwind of discount (3) | — | — | | | ||||||||
FX and other movements | ( | ( | ( | ( | ||||||||
Discontinued operations (1) | ( | | | | ||||||||
Reclassification BAC (1) (2) | | ( | ( | ( | ||||||||
Write-offs | ( | ( | ( | ( | ||||||||
Loss allowance as of December 31, 2020 | Ps. | |
| Ps. | |
| Ps. | | Ps. | | ||
Transfers: |
|
|
|
|
|
|
| |||||
Transfer from stage 1 to stage 2 | ( |
|
| |
|
| — |
|
| — | ||
Transfer from stage 1 to stage 3 | ( |
|
| — |
|
| |
|
| — | ||
Transfer from stage 2 to stage 3 | — |
|
| ( |
|
| |
|
| — | ||
Transfer from stage 3 to stage 2 | — |
|
| |
|
| ( |
|
| — | ||
Transfer from stage 2 to stage 1 | |
|
| ( |
|
| — |
|
| — | ||
Transfer from stage 3 to stage 1 | |
|
| — |
|
| ( |
|
| — | ||
Net remeasurement of loss allowance (5) | ( |
|
| |
|
| |
|
| | ||
New financial assets originated or purchased | |
|
| |
|
| |
|
| | ||
Financial assets that have been derecognized | ( |
|
| ( |
|
| ( |
|
| ( | ||
Unwind of discount (3) | — |
|
| — |
|
| |
|
| | ||
FX and other movements | ( |
|
| |
|
| |
|
| | ||
Discontinued operations (1) | ( | | | | ||||||||
Reclassification BAC (1) (2) | |
|
| ( |
|
| ( |
|
| ( | ||
Write-offs | ( |
|
| ( |
|
| ( |
|
| ( | ||
Loss allowance as of December 31, 2021 |
| Ps. | |
| Ps. | |
| Ps. | |
| Ps. | |
Transfers: |
|
|
|
|
|
|
|
|
|
|
|
|
Transfer from stage 1 to stage 2 |
|
| ( | | — |
|
| — | ||||
Transfer from stage 1 to stage 3 |
|
| ( | — | |
|
| — | ||||
Transfer from stage 2 to stage 3 |
|
| — | ( | |
|
| — | ||||
Transfer from stage 3 to stage 2 |
|
| — | | ( |
|
| — | ||||
Transfer from stage 2 to stage 1 |
|
| | ( | — |
|
| — | ||||
Transfer from stage 3 to stage 1 |
|
| | — | ( |
|
| — | ||||
Net remeasurement of loss allowance (4) |
|
| ( | | |
|
| | ||||
New financial assets originated or purchased |
|
| | | |
|
| | ||||
Financial assets that have been derecognized |
|
| ( | ( | ( |
|
| ( | ||||
Unwind of discount (3) |
|
| — | | |
|
| | ||||
FX and other movements |
|
| ( | | |
|
| | ||||
Discontinued operations (1) | ( | | | | ||||||||
Loss of control in subsidiary (1) |
|
| ( | ( | ( |
|
| ( | ||||
Write-offs |
|
| ( | ( | ( |
|
| ( | ||||
Loss allowance as of December 31, 2022 |
| Ps. | |
| Ps. | |
| Ps. | |
| Ps. | |
(1) See note 1.1 “Discontinued operations of BAC Holding”
(2) Correspond to reclassification for comparability of the movements of BAC Holding consider the deconsolidation of this entity during year 2022.
(3) | The unwind of discount on Stage 3 financial assets is reported within "interest income" so that interest income is recognized on the amortized cost (after deducting the ECL allowance) |
F-86
Grupo Aval Acciones y Valores S.A.
Notes to the Consolidated Financial Statements
For the years ended December 31, 2022, 2021 and 2020
(Amounts expressed in millions of Colombian pesos)
(4) | This amount includes impact of the measurement of ECL due to changes made in PDs/LGDs/EADs and changes made to model assumptions and methodologies from the opening to the closing balance. The following table shows the impact by stage estimated using all parameters as of December 31, 2022 versus parameters as of 2021 and the loan portfolio as of 2022. |
December 31, 2022 | ||||||||||
| Stage 2 |
| Stage 3 |
| ||||||
Stage 1 | Lifetime ECL not | Lifetime ECL | ||||||||
12-month ECL | credit-impaired | credit-impaired | Total | |||||||
Ps. | ( |
| Ps. | ( |
| Ps. | ( |
| Ps. | ( |
(5) This amount includes impact of the measurement of ECL due to changes made in PDs/LGDs/EADs and changes made to model assumptions and methodologies from the opening to the closing balance. The following table shows the impact by stage estimated using all parameters as of December 31, 2021 versus parameters as of December 31,2020 and the loan portfolio as of December 31, 2021.
December 31, 2021 | ||||||||||
| Stage 2 |
| Stage 3 |
| ||||||
Stage 1 | Lifetime ECL not | Lifetime ECL | ||||||||
12-month ECL | credit-impaired | credit-impaired | Total | |||||||
Ps. | ( |
| Ps. | |
| Ps. | |
| Ps. | ( |
(6) This amount includes impact of the measurement of ECL due to changes made in PDs/LGDs/EADs and changes made to model assumptions and methodologies from the opening to the closing balance. The following table shows the impact by stage estimated using all parameters as of December 31, 2020 versus parameters as of December 31,2019 and the loan portfolio as of December 31, 2020.
December 31, 2020 | ||||||||||
| Stage 2 |
| Stage 3 |
| ||||||
Stage 1 | Lifetime ECL not | Lifetime ECL | ||||||||
12-month ECL | credit-impaired | credit-impaired | Total | |||||||
Ps. | ( |
| Ps. | |
| Ps. | ( |
| Ps. | |
The following table further explains changes in the gross carrying amount of the consumer portfolio to help explain their significance to the changes in the allowance for the same portfolio as discussed above.
| Stage 2 | |||||||||||
|---|---|---|---|---|---|---|---|---|---|---|---|---|
Lifetime | Stage 3 | |||||||||||
Stage 1 | ECL not | Lifetime | ||||||||||
12-month | credit- | ECL credit- | ||||||||||
| ECL |
| impaired |
| impaired |
| Total | |||||
Total portfolio as of January 1, 2020 |
| Ps. | Ps. | Ps. | Ps. | | ||||||
Transfers: | ||||||||||||
Transfer from stage 1 to stage 2 | ( |
| |
| — | — | ||||||
Transfer from stage 1 to stage 3 | ( |
| — |
| | — | ||||||
Transfer from stage 2 to stage 3 | — |
| ( |
| | — | ||||||
Transfer from stage 2 to stage 1 | |
| ( |
| — | — | ||||||
Transfer from stage 3 to stage 2 | — |
| |
| ( | — | ||||||
Transfer from stage 3 to stage 1 | |
| — |
| ( | — | ||||||
New financial assets originated or purchased | | | | | ||||||||
Financial assets that have been paid | ( | ( | ( | ( | ||||||||
Net remeasurement of amortized cost and other receivables | ( | | | ( | ||||||||
Write-offs | ( | ( | ( |
|
| ( | ||||||
On business combination(3) | |
|
| |
|
| | | ||||
Discontinued operations (1) | |
|
| |
|
| | | ||||
Reclassification BAC (1) (2) | ( |
|
| |
|
| | ( | ||||
FX and other movements | ( |
| ( |
| | ( | ||||||
Total portfolio as of December 31, 2020 |
| Ps. | Ps. | Ps. |
| Ps. | ||||||
F-87
Grupo Aval Acciones y Valores S.A.
Notes to the Consolidated Financial Statements
For the years ended December 31, 2022, 2021 and 2020
(Amounts expressed in millions of Colombian pesos)
| Stage 2 | |||||||||||
|---|---|---|---|---|---|---|---|---|---|---|---|---|
Lifetime | Stage 3 | |||||||||||
Stage 1 | ECL not | Lifetime | ||||||||||
12-month | credit- | ECL credit- | ||||||||||
| ECL |
| impaired |
| impaired |
| Total | |||||
Transfers: | ||||||||||||
Transfer from stage 1 to stage 2 | ( |
| |
| — | — | ||||||
Transfer from stage 1 to stage 3 | ( |
| — |
| | — | ||||||
Transfer from stage 2 to stage 3 | — |
| ( |
| | — | ||||||
Transfer from stage 2 to stage 1 | |
| ( |
| — | — | ||||||
Transfer from stage 3 to stage 2 | — |
| |
| ( | — | ||||||
Transfer from stage 3 to stage 1 | |
| — |
| ( | — | ||||||
New financial assets originated or purchased | |
| |
| | | ||||||
Financial assets that have been paid | ( |
| ( |
| ( | ( | ||||||
Net remeasurement of amortized cost and other receivables | ( |
| |
| | ( | ||||||
Write-offs | ( |
| ( |
| ( |
|
| ( | ||||
Discontinued operations (1) | | | | | ||||||||
Reclassification BAC (1) (2) | | ( | ( | | ||||||||
FX and other movements | ( |
| |
| | | ||||||
Total portfolio as of December 31, 2021 |
| Ps. | |
| Ps. | |
| Ps. | |
| Ps. | |
Transfers: |
|
|
|
|
|
|
|
|
|
|
|
|
Transfer from stage 1 to stage 2 |
|
| ( | | — |
|
| — | ||||
Transfer from stage 1 to stage 3 |
|
| ( | — | |
|
| — | ||||
Transfer from stage 2 to stage 3 |
|
| — | ( | |
|
| — | ||||
Transfer from stage 2 to stage 1 |
|
| | ( | — |
|
| — | ||||
Transfer from stage 3 to stage 2 |
|
| — | | ( |
|
| — | ||||
Transfer from stage 3 to stage 1 |
|
| | — | ( |
|
| — | ||||
New financial assets originated or purchased |
|
| | | |
|
| | ||||
Financial assets that have been paid |
|
| ( | ( | ( |
|
| ( | ||||
Net remeasurement of amortized cost and other receivables |
|
| ( | | |
|
| ( | ||||
Write-offs |
|
| ( | ( | ( |
|
| ( | ||||
Discontinued operations (1) | | ( | ( | | ||||||||
Loss of control in subsidiary (1) | ( | ( | ( | ( | ||||||||
FX and other movements | | | ( | | ||||||||
Total portfolio as of December 31, 2022 |
| Ps. | |
| Ps. | |
| Ps. | |
| Ps. | |
(1) See note 1.1 “Discontinued operations of BAC Holding”
(2) Correspond to reclassification for comparability of the movements of BAC Holding consider the deconsolidation of this entity during year 2022.
(3) See note 35 Business combination
F-88
Grupo Aval Acciones y Valores S.A.
Notes to the Consolidated Financial Statements
For the years ended December 31, 2022, 2021 and 2020
(Amounts expressed in millions of Colombian pesos)
Mortgage loan portfolio
| Stage 2 | |||||||||||
Lifetime | Stage 3 | |||||||||||
Stage 1 | ECL not | Lifetime | ||||||||||
12-month | credit- | ECL credit- | ||||||||||
| ECL |
| impaired |
| impaired |
| Total | |||||
Loss allowance as of January 1, 2020 | Ps. | | Ps. | | Ps. | | Ps. | | ||||
Transfers: | ||||||||||||
Transfer from stage 1 to stage 2 | ( | | — | — | ||||||||
Transfer from stage 1 to stage 3 | ( | — | | — | ||||||||
Transfer from stage 2 to stage 3 | — | ( | | — | ||||||||
Transfer from stage 3 to stage 2 | — | | ( | — | ||||||||
Transfer from stage 2 to stage 1 | | ( | — | — | ||||||||
Transfer from stage 3 to stage 1 | | — | ( | — | ||||||||
Net remeasurement of loss allowance (6) | ( | | | | ||||||||
New financial assets originated or purchased | | | | | ||||||||
Financial assets that have been derecognized | ( | ( | ( | ( | ||||||||
Unwind of discount (3) | — | — | | | ||||||||
FX and other movements | ( | ( | ( | ( | ||||||||
Discontinued operations (1) | ( | | | | ||||||||
Reclassification BAC (1) (2) | | ( | ( | ( | ||||||||
Write-offs | ( | ( | ( | ( | ||||||||
Loss allowance balance as of December 31, 2020 | Ps. | | Ps. | | Ps. | | Ps. | | ||||
Transfers: |
|
|
|
|
|
|
| |||||
Transfer from stage 1 to stage 2 | ( |
|
| |
|
| — | — | ||||
Transfer from stage 1 to stage 3 | ( |
|
| — |
|
| | — | ||||
Transfer from stage 2 to stage 3 | — |
|
| ( |
|
| | — | ||||
Transfer from stage 3 to stage 2 | — |
|
| |
|
| ( | — | ||||
Transfer from stage 2 to stage 1 | |
|
| ( |
|
| — | — | ||||
Transfer from stage 3 to stage 1 | |
|
| — |
|
| ( | — | ||||
Net remeasurement of loss allowance (5) | ( |
|
| |
|
| | | ||||
New financial assets originated or purchased | |
|
| |
|
| | | ||||
Financial assets that have been derecognized | ( |
|
| ( |
|
| ( | ( | ||||
Unwind of discount (3) | — |
|
| |
|
| | | ||||
FX and other movements | ( |
|
| |
|
| | | ||||
Discontinued operations (1) | ( | | ||||||||||
Reclassification BAC (1) (2) | | ( | ( | | ||||||||
Write-offs | ( |
|
| ( |
|
| ( | ( | ||||
Loss allowance balance as of December 31, 2021 | Ps. | | Ps. | | Ps. | | Ps. | | ||||
Transfers: |
|
|
|
|
|
|
|
|
|
|
|
|
Transfer from stage 1 to stage 2 |
|
| ( | | — |
|
| — | ||||
Transfer from stage 1 to stage 3 |
|
| ( | — | |
|
| — | ||||
Transfer from stage 2 to stage 3 |
|
| — | ( | |
|
| — | ||||
Transfer from stage 3 to stage 2 |
|
| — | | ( |
|
| — | ||||
Transfer from stage 2 to stage 1 |
|
| | ( | — |
|
| — | ||||
Transfer from stage 3 to stage 1 |
|
| | — | ( |
|
| — | ||||
Net remeasurement of loss allowance (4) |
|
| ( | | |
|
| ( | ||||
New financial assets originated or purchased |
|
| | | |
|
| | ||||
Financial assets that have been derecognized |
|
| ( | ( | ( |
|
| ( | ||||
Unwind of discount (3) |
|
| — | | |
|
| | ||||
FX and other movements |
|
| ( | | |
|
| | ||||
Discontinued operations (1) | ( | | | | ||||||||
Loss of control in subsidiary (1) |
|
| ( | ( | ( |
|
| ( | ||||
Write-offs |
|
| ( | ( | ( |
|
| ( | ||||
Loss allowance as of December 31, 2022 |
| Ps. | |
| Ps. | |
| Ps. | |
| Ps. | |
(1) See note 1.1 “Discontinued operations of BAC Holding”
(2) Correspond to reclassification for comparability of the movements of BAC Holding consider the deconsolidation of this entity during year 2022.
(3) | The unwind of discount on Stage 3 financial assets is reported within "interest income" so that interest income is recognized on the amortized cost (after deducting the ECL allowance) |
F-89
Grupo Aval Acciones y Valores S.A.
Notes to the Consolidated Financial Statements
For the years ended December 31, 2022, 2021 and 2020
(Amounts expressed in millions of Colombian pesos)
(4) | This amount includes impact of the measurement of ECL due to changes made in PDs/LGDs/EADs and changes made to model assumptions and methodologies from the opening to the closing balance. The following table shows the impact by stage estimated using all parameters as of December 31, 2022 versus parameters as of 2021 and the loan portfolio as of 2022. |
December 31, 2022 | |||||||||||
| Stage 2 |
| Stage 3 |
| |||||||
Stage 1 | Lifetime ECL not | Lifetime ECL | |||||||||
12-month ECL | credit-impaired | credit-impaired | Total | ||||||||
Ps. | ( |
| Ps. | ( |
| Ps. | ( |
| Ps. | (90,615) | |
(5) This amount includes impact of the measurement of ECL due to changes made in PDs/LGDs/EADs and changes made to model assumptions and methodologies from the opening to the closing balance. The following table shows the impact by stage estimated using all parameters as of December 31, 2021 versus parameters as of December 31,2020 and the loan portfolio as of December 31, 2021.
December 31, 2021 | ||||||||||
| Stage 2 |
| Stage 3 |
| ||||||
Stage 1 | Lifetime ECL not | Lifetime ECL | ||||||||
12-month ECL | credit-impaired | credit-impaired | Total | |||||||
Ps. | |
| Ps. | ( |
| Ps. | |
| Ps. | |
(6) This amount includes impact of the measurement of ECL due to changes made in PDs/LGDs/EADs and changes made to model assumptions and methodologies from the opening to the closing balance. The following table shows the impact by stage estimated using all parameters as of December 31, 2020 versus parameters as of December 31,2019 and the loan portfolio as of December 31, 2020.
December 31, 2020 | ||||||||||
| Stage 2 |
| Stage 3 |
| ||||||
Stage 1 | Lifetime ECL not | Lifetime ECL | ||||||||
12-month ECL | credit-impaired | credit-impaired | Total | |||||||
Ps. | |
| Ps. | |
| Ps. | |
| Ps. | |
The following table further explains changes in the gross carrying amount of the mortgage portfolio to help explain their significance to the changes in the allowance for the same portfolio as discussed above.
| Stage 2 | |||||||||||
|---|---|---|---|---|---|---|---|---|---|---|---|---|
Lifetime | Stage 3 | |||||||||||
Stage 1 | ECL not | Lifetime | ||||||||||
12-month | credit- | ECL credit- | ||||||||||
| ECL |
| impaired |
| impaired |
| Total | |||||
Total portfolio as of January 1, 2020 |
| Ps. | |
| Ps. | |
| Ps. | |
| Ps. | |
Transfers: |
|
|
|
|
|
|
| |||||
Transfer from stage 1 to stage 2 | ( |
| |
| — | — | ||||||
Transfer from stage 1 to stage 3 | ( |
| — |
| | — | ||||||
Transfer from stage 2 to stage 3 | — |
| ( |
| | — | ||||||
Transfer from stage 2 to stage 1 | |
| ( |
| — | — | ||||||
Transfer from stage 3 to stage 2 | — |
| |
| ( | — | ||||||
Transfer from stage 3 to stage 1 | |
| — |
| ( | — | ||||||
New financial assets originated or purchased | | | ( | | ||||||||
Financial assets that have been paid | ( | ( | ( | ( | ||||||||
Net remeasurement of amortized cost and other receivables | | | | | ||||||||
Write-offs | ( | ( | ( |
|
| ( | ||||||
On business combination(3) | |
|
| |
|
| | | ||||
Discontinued operations (1) | |
|
| |
|
| | | ||||
Reclassification BAC (1) (2) | ( |
|
| |
|
| | ( | ||||
FX and other movements | ( |
| ( |
| ( | ( | ||||||
Total portfolio as of December 31, 2020 |
| Ps. | Ps. | Ps. |
| Ps. | ||||||
F-90
Grupo Aval Acciones y Valores S.A.
Notes to the Consolidated Financial Statements
For the years ended December 31, 2022, 2021 and 2020
(Amounts expressed in millions of Colombian pesos)
| Stage 2 | |||||||||||
|---|---|---|---|---|---|---|---|---|---|---|---|---|
Lifetime | Stage 3 | |||||||||||
Stage 1 | ECL not | Lifetime | ||||||||||
12-month | credit- | ECL credit- | ||||||||||
| ECL |
| impaired |
| impaired |
| Total | |||||
Transfers: |
|
|
|
|
|
|
| |||||
Transfer from stage 1 to stage 2 | ( |
|
| |
|
| — | — | ||||
Transfer from stage 1 to stage 3 | ( |
|
| — |
|
| | — | ||||
Transfer from stage 2 to stage 3 | — |
|
| ( |
|
| | — | ||||
Transfer from stage 2 to stage 1 | |
|
| ( |
|
| — | — | ||||
Transfer from stage 3 to stage 2 | — |
|
| |
|
| ( | — | ||||
Transfer from stage 3 to stage 1 | |
|
| — |
|
| ( | — | ||||
New financial assets originated or purchased | |
|
| |
|
| | | ||||
Financial assets that have been paid | ( |
|
| ( |
|
| ( | ( | ||||
Net remeasurement of amortized cost and other receivables | ( |
|
| |
|
| | ( | ||||
Write-offs | ( |
|
| ( |
|
| ( | ( | ||||
Discontinued operations (1) | | | | | ||||||||
Reclassification BAC (1) (2) | | ( | | | ||||||||
FX and other movements | |
|
| |
|
| | | ||||
Total portfolio as of December 31, 2021 |
| Ps. | |
| Ps. | |
| Ps. | |
| Ps. | |
Transfers: |
|
|
|
|
|
|
|
|
|
|
|
|
Transfer from stage 1 to stage 2 |
|
| ( | | — |
|
| — | ||||
Transfer from stage 1 to stage 3 |
|
| ( | — | |
|
| — | ||||
Transfer from stage 2 to stage 3 |
|
| — | ( | |
|
| — | ||||
Transfer from stage 2 to stage 1 |
|
| | ( | — |
|
| — | ||||
Transfer from stage 3 to stage 2 |
|
| — | | ( |
|
| — | ||||
Transfer from stage 3 to stage 1 |
|
| | — | ( |
|
| — | ||||
New financial assets originated or purchased |
|
| | | |
|
| | ||||
Financial assets that have been paid |
|
| ( | ( | ( |
|
| ( | ||||
Net remeasurement of amortized cost and other receivables |
|
| ( | | |
|
| ( | ||||
Write-offs |
|
| ( | ( | ( |
|
| ( | ||||
Discontinued operations (1) | | ( | ( | ( | ||||||||
Loss of control in subsidiary (1) | ( | ( | ( | ( | ||||||||
FX and other movements | | | | | ||||||||
Total portfolio as of December 31, 2022 |
| Ps. | |
| Ps. | |
| Ps. | |
| Ps. | |
(1) See note 1.1 “Discontinued operations of BAC Holding”
(2) Correspond to reclassification for comparability of the movements of BAC Holding consider the deconsolidation of this entity during year 2022.
(3) See note 35 Business combination
F-91
Grupo Aval Acciones y Valores S.A.
Notes to the Consolidated Financial Statements
For the years ended December 31, 2022, 2021 and 2020
(Amounts expressed in millions of Colombian pesos)
Microcredit loan portfolio
| Stage 2 | |||||||||||
Lifetime | Stage 3 | |||||||||||
Stage 1 | ECL not | Lifetime | ||||||||||
12-month | credit- | ECL credit- | ||||||||||
| ECL |
| impaired |
| impaired |
| Total | |||||
Loss allowance as of January 1, 2020 | Ps. | |
| Ps. | |
| Ps. | | Ps. | | ||
Transfers: | ||||||||||||
Transfer from stage 1 to stage 2 | ( |
|
| |
|
| — | — | ||||
Transfer from stage 1 to stage 3 | ( |
|
| — |
|
| | — | ||||
Transfer from stage 2 to stage 3 | — |
|
| ( |
|
| | — | ||||
Transfer from stage 3 to stage 2 | — |
|
| |
|
| ( | — | ||||
Transfer from stage 2 to stage 1 | |
|
| ( |
|
| — | — | ||||
Transfer from stage 3 to stage 1 | |
|
| — |
|
| ( | — | ||||
Net remeasurement of loss allowance (4) | |
|
| |
|
| | | ||||
New financial assets originated or purchased | |
|
| |
|
| | | ||||
Financial assets that have been derecognized | ( |
|
| ( |
|
| ( | ( | ||||
Unwind of discount (1) | — |
|
| — |
|
| | | ||||
Write-offs | ( |
|
| ( |
|
| ( | ( | ||||
Loss allowance balance as of December 31, 2020 | Ps. | |
| Ps. | |
| Ps. | | Ps. | | ||
Transfers: |
|
|
|
|
|
|
| |||||
Transfer from stage 1 to stage 2 | ( | | — | — | ||||||||
Transfer from stage 1 to stage 3 | ( | — | | — | ||||||||
Transfer from stage 2 to stage 3 | — | ( | | — | ||||||||
Transfer from stage 3 to stage 2 | — | | ( | — | ||||||||
Transfer from stage 2 to stage 1 | | ( | — | — | ||||||||
Transfer from stage 3 to stage 1 | | — | ( | — | ||||||||
Net remeasurement of loss allowance (3) | ( | ( | | | ||||||||
New financial assets originated or purchased | | | | | ||||||||
Financial assets that have been derecognized | ( | ( | ( | ( | ||||||||
Unwind of discount (1) | — | — | | | ||||||||
Write-offs | ( | ( | ( | ( | ||||||||
Loss allowance balance as of December 31, 2021 |
| Ps. | |
| Ps. | |
| Ps. | |
| Ps. | |
Transfers: |
|
|
|
|
|
|
|
|
|
|
|
|
Transfer from stage 1 to stage 2 |
|
| ( | | — |
|
| — | ||||
Transfer from stage 1 to stage 3 |
|
| ( | — | |
|
| — | ||||
Transfer from stage 2 to stage 3 |
|
| — | ( | |
|
| — | ||||
Transfer from stage 3 to stage 2 |
|
| — | | ( |
|
| — | ||||
Transfer from stage 2 to stage 1 |
|
| | ( | — |
|
| — | ||||
Transfer from stage 3 to stage 1 |
|
| | — | ( |
|
| — | ||||
Net remeasurement of loss allowance (2) |
|
| ( | | |
|
| | ||||
New financial assets originated or purchased |
|
| | | |
|
| | ||||
Financial assets that have been derecognized |
|
| ( | ( | ( |
|
| ( | ||||
Unwind of discount (1) |
|
| — | — | |
|
| | ||||
Write-offs |
|
| ( | ( | ( |
|
| ( | ||||
Loss allowance as of December 31, 2022 |
| Ps. | |
| Ps. | |
| Ps. | |
| Ps. | |
(1) | The unwind of discount on Stage 3 financial assets is reported within "interest income" so that interest income is recognized on the amortized cost (after deducting the ECL allowance) |
(2) | This amount includes impact of the measurement of ECL due to changes made in PDs/LGDs/EADs and changes made to model assumptions and methodologies from the opening to the closing balance. The following table shows the impact by stage estimated using all parameters as of December 31, 2022 versus parameters as of December 31,2021 and the loan portfolio as of December 31, 2022. |
December 31, 2022 | ||||||||||
| Stage 2 |
| Stage 3 |
| ||||||
Stage 1 | Lifetime ECL not | Lifetime ECL | ||||||||
12-month ECL | credit-impaired | credit-impaired | Total | |||||||
Ps. | ( |
| Ps. | |
| Ps. | ( |
| Ps. | ( |
F-92
Grupo Aval Acciones y Valores S.A.
Notes to the Consolidated Financial Statements
For the years ended December 31, 2022, 2021 and 2020
(Amounts expressed in millions of Colombian pesos)
(3) This amount includes impact of the measurement of ECL due to changes made in PDs/LGDs/EADs and changes made to model assumptions and methodologies from the opening to the closing balance. The following table shows the impact by stage estimated using all parameters as of December 31, 2021 versus parameters as of December 31,2020 and the loan portfolio as of December 31, 2021.
December 31, 2021 | ||||||||||
|---|---|---|---|---|---|---|---|---|---|---|
| Stage 2 |
| Stage 3 |
| ||||||
Stage 1 | Lifetime ECL not | Lifetime ECL | ||||||||
12-month ECL | credit-impaired | credit-impaired | Total | |||||||
Ps. | ( |
| Ps. | ( |
| Ps. | ( |
| Ps. | ( |
(4) This amount includes impact of the measurement of ECL due to changes made in PDs/LGDs/EADs and changes made to model assumptions and methodologies from the opening to the closing balance. The following table shows the impact by stage estimated using all parameters as of December 31, 2020 versus parameters as of December 31,2019 and the loan portfolio as of December 31, 2020.
December 31, 2020 | ||||||||||
| Stage 2 |
| Stage 3 |
| ||||||
Stage 1 | Lifetime ECL not | Lifetime ECL | ||||||||
12-month ECL | credit-impaired | credit-impaired | Total | |||||||
Ps. | ( |
| Ps. | |
| Ps. | |
| Ps. | |
The following table further explains changes in the gross carrying amount of the microcredit portfolio to help explain their significance to the changes in the allowance for the same portfolio as discussed above.
| Stage 2 | |||||||||||
|---|---|---|---|---|---|---|---|---|---|---|---|---|
Lifetime | Stage 3 | |||||||||||
Stage 1 | ECL not | Lifetime | ||||||||||
12-month | credit- | ECL credit- | ||||||||||
| ECL |
| impaired |
| impaired |
| Total | |||||
Total portfolio as of January 1, 2020 |
| Ps. | |
| Ps. | |
| Ps. | |
| Ps. | |
Transfers: | ||||||||||||
Transfer from stage 1 to stage 2 | ( |
|
| |
|
| — | — | ||||
Transfer from stage 1 to stage 3 | ( |
|
| — |
|
| | — | ||||
Transfer from stage 2 to stage 3 | — |
|
| ( |
|
| | — | ||||
Transfer from stage 2 to stage 1 | |
|
| ( |
|
| — | — | ||||
Transfer from stage 3 to stage 2 | — |
|
| |
|
| ( | — | ||||
Transfer from stage 3 to stage 1 | |
|
| — |
|
| ( | — | ||||
New financial assets originated or purchased | |
|
| |
|
| | | ||||
Financial assets that have been paid | ( |
|
| ( |
|
| ( | ( | ||||
Net remeasurement of amortized cost and other receivables | ( |
|
| — |
|
| ( | ( | ||||
Write-offs | ( |
|
| ( |
|
| ( | ( | ||||
Total portfolio as of December 31, 2020 |
| Ps. | |
| Ps. | |
| Ps. | |
| Ps. | |
Transfers: | ||||||||||||
Transfer from stage 1 to stage 2 | ( | | — | — | ||||||||
Transfer from stage 1 to stage 3 | ( | — | | — | ||||||||
Transfer from stage 2 to stage 3 | — | ( | | — | ||||||||
Transfer from stage 2 to stage 1 | | ( | — | — | ||||||||
Transfer from stage 3 to stage 2 | — | | ( | — | ||||||||
Transfer from stage 3 to stage 1 | | — | ( | — | ||||||||
New financial assets originated or purchased | | | | | ||||||||
Financial assets that have been paid | ( | ( | ( | ( | ||||||||
Net remeasurement of amortized cost and other receivables | | | | | ||||||||
Write-offs | ( | ( | ( | ( | ||||||||
Total portfolio as of December 31, 2021 |
| Ps. | |
| Ps. | |
| Ps. | |
| Ps. | |
Transfers: |
|
|
|
|
|
|
|
|
|
|
|
|
Transfer from stage 1 to stage 2 |
|
| ( | | — |
|
| — | ||||
Transfer from stage 1 to stage 3 |
|
| ( | — | |
|
| — | ||||
Transfer from stage 2 to stage 3 |
|
| — | ( | |
|
| — | ||||
Transfer from stage 2 to stage 1 |
|
| | ( | — |
|
| — | ||||
F-93
Grupo Aval Acciones y Valores S.A.
Notes to the Consolidated Financial Statements
For the years ended December 31, 2022, 2021 and 2020
(Amounts expressed in millions of Colombian pesos)
| Stage 2 | |||||||||||
|---|---|---|---|---|---|---|---|---|---|---|---|---|
Lifetime | Stage 3 | |||||||||||
Stage 1 | ECL not | Lifetime | ||||||||||
12-month | credit- | ECL credit- | ||||||||||
| ECL |
| impaired |
| impaired |
| Total | |||||
Transfer from stage 3 to stage 2 |
|
| — | | ( |
|
| — | ||||
Transfer from stage 3 to stage 1 |
|
| | — | ( |
|
| — | ||||
New financial assets originated or purchased |
|
| | | |
|
| | ||||
Financial assets that have been paid |
|
| ( | ( | ( |
|
| ( | ||||
Net remeasurement of amortized cost and other receivables |
|
| | | |
|
| | ||||
Write-offs |
|
| ( | ( | ( |
|
| ( | ||||
Total portfolio as of December 31, 2022 |
| Ps. | |
| Ps. | |
| Ps. | |
| Ps. | |
Interbank and overnight funds
| Stage 2 | |||||||||||
Lifetime | Stage 3 | |||||||||||
Stage 1 | ECL not | Lifetime | ||||||||||
12-month | credit- | ECL credit- | ||||||||||
| ECL |
| impaired |
| impaired |
| Total | |||||
Loss allowance as of January 1, 2020 | Ps. | |
| Ps. | — |
| Ps. | | Ps. | | ||
Transfers: | ||||||||||||
Transfer from stage 3 to stage 1 | |
|
| ( |
|
| — | — | ||||
Net remeasurement of loss allowance (3) | |
|
| |
|
| ( | ( | ||||
New financial assets originated or purchased | |
|
| — |
|
| | | ||||
Financial assets that have been derecognized | ( |
|
| ( |
|
| — | ( | ||||
Write-offs | — | — | — | — | ||||||||
Loss allowance balance as of December 31, 2020 | Ps. | |
| Ps. | — |
| Ps. | | Ps. | | ||
Net remeasurement of loss allowance (2) | ( | — | — | ( | ||||||||
New financial assets originated or purchased | | — | — | | ||||||||
Financial assets that have been derecognized | ( | — | ( | ( | ||||||||
Loss allowance balance as of December 31, 2021 |
| Ps. | |
| Ps. | — |
| Ps. | — |
| Ps. | |
Net remeasurement of loss allowance (1) |
|
| | — | — |
|
| | ||||
New financial assets originated or purchased |
|
| | — | — |
|
| | ||||
Financial assets that have been derecognized |
|
| ( | — | — |
|
| ( | ||||
Loss allowance as of December 31, 2022 |
| Ps. | |
| Ps. | — |
| Ps. | — |
| Ps. | |
(1) | This amount includes impact of the measurement of ECL due to changes made in PDs/LGDs/EADs and changes made to model assumptions and methodologies from the opening to the closing balance. The following table shows the impact by stage estimated using all parameters as of December 31, 2022 versus parameters as of December 31,2021 and the loan portfolio as of December 31, 2022. |
December 31, 2022 | ||||||||||
| Stage 2 |
| Stage 3 |
| ||||||
Stage 1 | Lifetime ECL not | Lifetime ECL | ||||||||
12-month ECL | credit-impaired | credit-impaired | Total | |||||||
Ps. | ( |
| Ps. | — |
| Ps. | — |
| Ps. | ( |
(2) This amount includes impact of the measurement of ECL due to changes made in PDs/LGDs/EADs and changes made to model assumptions and methodologies from the opening to the closing balance. The following table shows the impact by stage estimated using all parameters as of December 31, 2021 versus parameters as of December 31,2020 and the loan portfolio as of December 31, 2021.
December 31, 2021 | ||||||||||
| Stage 2 |
| Stage 3 |
| ||||||
Stage 1 | Lifetime ECL not | Lifetime ECL | ||||||||
12-month ECL | credit-impaired | credit-impaired | Total | |||||||
Ps. | |
| Ps. | — |
| Ps. | — |
| Ps. | |
(3) This amount includes impact of the measurement of ECL due to changes made in PDs/LGDs/EADs and changes made to model assumptions and methodologies from the opening to the closing balance. The following table shows the impact by stage estimated using all parameters as of December 31, 2020 versus parameters as of December 31,2019 and the loan portfolio as of December 31, 2020.
F-94
Grupo Aval Acciones y Valores S.A.
Notes to the Consolidated Financial Statements
For the years ended December 31, 2022, 2021 and 2020
(Amounts expressed in millions of Colombian pesos)
December 31, 2020 | ||||||||||
| Stage 2 |
| Stage 3 |
| ||||||
Stage 1 | Lifetime ECL not | Lifetime ECL | ||||||||
12-month ECL | credit-impaired | credit-impaired | Total | |||||||
Ps. | |
| Ps. | — |
| Ps. | — |
| Ps. | |
F-95
Grupo Aval Acciones y Valores S.A.
Notes to the Consolidated Financial Statements
For the years ended December 31, 2022, 2021 and 2020
(Amounts expressed in millions of Colombian pesos)
The following table further explains changes in the gross carrying amount of the interbank and overnight funds portfolio to help explain their significance to the changes in the allowance for the same portfolio as discussed above:
| Stage 2 | |||||||||||
Lifetime | Stage 3 | |||||||||||
Stage 1 | ECL not | Lifetime | ||||||||||
12-month | credit- | ECL credit- | ||||||||||
| ECL |
| impaired |
| impaired |
| Total | |||||
Total portfolio as of January 1, 2020 |
| Ps. | |
| Ps. | |
| Ps. | |
| Ps. | |
New financial assets originated or purchased | |
|
| — |
|
| — | | ||||
Financial assets that have been paid | ( |
|
| ( |
|
| ( | ( | ||||
Net remeasurement of amortized cost and other receivables | ( |
|
| — |
|
| | ( | ||||
On business combination(3) | | — | — | | ||||||||
Discontinued operations (1) | | — | — | | ||||||||
Reclassification BAC (1) (2) | | — | — | | ||||||||
FX and other movements | ( |
|
| — |
|
| — | ( | ||||
Total portfolio as of December 31, 2020 |
| Ps. | |
| Ps. | — |
| Ps. | |
| Ps. | |
New financial assets originated or purchased | |
|
| — |
|
| — | | ||||
Financial assets that have been paid | ( |
|
| — |
|
| — | ( | ||||
Net remeasurement of amortized cost and other receivables | |
|
| — |
|
| ( | | ||||
Discontinued operations (1) | | — | — | | ||||||||
Reclassification BAC (1) (2) | ( | — | — | ( | ||||||||
FX and other movements | |
|
| — |
|
| — | | ||||
Total portfolio as of December 31, 2021 |
| Ps. | |
| Ps. | — |
| Ps. | — |
| Ps. | |
New financial assets originated or purchased |
|
| | — | |
|
| | ||||
Financial assets that have been paid |
|
| ( | — | — |
|
| ( | ||||
Net remeasurement of amortized cost and other receivables |
|
| | — | — |
|
| | ||||
Discontinued operations (1) | | — | — | | ||||||||
Loss of control in subsidiary (1) | ( | — | — | ( | ||||||||
FX and other movements | ( | — | — | ( | ||||||||
Total portfolio as of December 31, 2022 |
| Ps. | |
| Ps. | — |
| Ps. | |
| Ps. | |
(1) See note 1.1 “Discontinued operations of BAC Holding”
(2) Correspond to reclassification for comparability of the movements of BAC Holding consider the deconsolidation of this entity during year 2022.
(3) See note 35 Business combination
F-96
Grupo Aval Acciones y Valores S.A.
Notes to the Consolidated Financial Statements
For the years ended December 31, 2022, 2021 and 2020
(Amounts expressed in millions of Colombian pesos)
The following table further explains changes in the gross carrying amount of investments in debt securities at FVOCI portfolio to help explain their significance to the changes in the allowance for the same portfolio as discussed above:
Investments in debt securities at FVOCI
| Stage 2 | |||||||||||
Lifetime | Stage 3 | |||||||||||
Stage 1 | ECL not | Lifetime | ||||||||||
12-month | credit- | ECL credit- | ||||||||||
| ECL |
| impaired |
| impaired |
| Total | |||||
Loss allowance as of January 1, 2020 | Ps. | | Ps. | — | Ps. | — | Ps. | | ||||
Net remeasurement of loss allowance (5) | | — | — | | ||||||||
New financial assets originated or purchased | | — | — | | ||||||||
Financial assets that have been derecognized | ( | — | — | ( | ||||||||
Discontinued operations (1) | | | — | | ||||||||
Reclassification BAC (1) (2) | ( | | — | ( | ||||||||
FX and other movements | ( | — | — | ( | ||||||||
Loss allowance balance as of December 31, 2020 |
| Ps. | |
| Ps. | |
| Ps. | — |
| Ps. | |
Net remeasurement of loss allowance (4) | ( | — | — | ( | ||||||||
New financial assets originated or purchased | | — | — | | ||||||||
Financial assets that have been derecognized | ( | | — | ( | ||||||||
Discontinued operations (1) | | ( | — | | ||||||||
Reclassification BAC (1) (2) | | | — | | ||||||||
FX and other movements | | ( | — | | ||||||||
Loss allowance balance as of December 31, 2021 | Ps. | |
| Ps. | — |
| Ps. | — |
| Ps. | | |
Net remeasurement of loss allowance (3) |
|
| ( |
|
| — |
|
| — |
|
| ( |
New financial assets originated or purchased |
|
| |
|
| — |
|
| — |
|
| |
Financial assets that have been derecognized |
|
| ( |
|
| — |
|
| — |
|
| ( |
Discontinued operations (1) | | — | — | | ||||||||
Loss of control in subsidiary (1) | ( | — | — | ( | ||||||||
FX and other movements |
|
| |
|
| — |
|
| — |
|
| |
Loss allowance as of December 31, 2022 |
| Ps. | |
| Ps. | — |
| Ps. | — |
| Ps. | |
(1) See note 1.1 “Discontinued operations of BAC Holding”
(2) Correspond to reclassification for comparability of the movements of BAC Holding consider the deconsolidation of this entity during year 2022.
(3) This amount includes impact of the measurement of ECL due to changes made in PDs/LGDs/EADs and changes made to model assumptions and methodologies from the opening to the closing balance. The following table shows the impact by stage estimated using all parameters as of December 31, 2022 versus parameters as of December 31, 2021 and the investments portfolio as of December 31, 2022.
December 31, 2022 | ||||||||||
| Stage 2 |
| Stage 3 |
| ||||||
Stage 1 | Lifetime ECL not | Lifetime ECL | ||||||||
12-month ECL | credit-impaired | credit-impaired | Total | |||||||
Ps. | ( |
| Ps. | — |
| Ps. | — |
| Ps. | ( |
(4) This amount includes impact of the measurement of ECL due to changes made in PDs/LGDs/EADs and changes made to model assumptions and methodologies from the opening to the closing balance. The following table shows the impact by stage estimated using all parameters as of December 31, 2021 versus parameters as of December 31, 2020 and the investments portfolio as of December 31, 2021.
December 31, 2021 | ||||||||||
| Stage 2 |
| Stage 3 |
| ||||||
Stage 1 | Lifetime ECL not | Lifetime ECL | ||||||||
12-month ECL | credit-impaired | credit-impaired | Total | |||||||
Ps. | ( |
| Ps. | — |
| Ps. | — |
| Ps. | ( |
F-97
Grupo Aval Acciones y Valores S.A.
Notes to the Consolidated Financial Statements
For the years ended December 31, 2022, 2021 and 2020
(Amounts expressed in millions of Colombian pesos)
(5) This amount includes impact of the measurement of ECL due to changes made in PDs/LGDs/EADs and changes made to model assumptions and methodologies from the opening to the closing balance. The following table shows the impact by stage estimated using all parameters as of December 31, 2020 versus parameters as of December 31, 2019 and the investments portfolio as of December 31, 2020.
December 31, 2020 | ||||||||||
| Stage 2 |
| Stage 3 |
| ||||||
Stage 1 | Lifetime ECL not | Lifetime ECL | ||||||||
12-month ECL | credit-impaired | credit-impaired | Total | |||||||
Ps. | |
| Ps. | |
| Ps. | — |
| Ps. | |
The following table further explains changes in the gross carrying amount of investments in debt securities at amortized cost portfolio to help explain their significance to the changes in the allowance for the same portfolio as discussed above:
Investments in debt securities at amortized cost
| Stage 2 | |||||||||||
Lifetime | Stage 3 | |||||||||||
Stage 1 | ECL not | Lifetime | ||||||||||
12-month | credit- | ECL credit- | ||||||||||
| ECL |
| impaired |
| impaired |
| Total | |||||
Loss allowance balance as of January 1, 2020 | Ps. | | Ps. | — | Ps. | — | Ps. | | ||||
Net remeasurement of loss allowance (5) | ( | — | — | ( | ||||||||
New financial assets originated or purchased | | | — | | ||||||||
Financial assets that have been derecognized | ( | — | — | ( | ||||||||
Discontinued operations (1) | | — | — | | ||||||||
Reclassification BAC (1) (2) | | — | — | | ||||||||
FX and other movements | ( | ( | — | ( | ||||||||
Loss allowance as of December 31, 2020 | Ps. | |
| Ps. | |
| Ps. | — |
| Ps. | | |
Transfer from stage 1 to stage 2 | ( | | — | — | ||||||||
Net remeasurement of loss allowance (4) | ( | | — | | ||||||||
New financial assets originated or purchased | | | — | | ||||||||
Financial assets that have been derecognized | ( | — | — | ( | ||||||||
Discontinued operations (1) | ( | | — | ( | ||||||||
Reclassification BAC (1) (2) | ( | ( | — | ( | ||||||||
FX and other movements | | | — | | ||||||||
Loss allowance as of December 31, 2021 | Ps. | |
| Ps. | |
| Ps. | — |
| Ps. | | |
Net remeasurement of loss allowance (3) | | | — | | ||||||||
New financial assets originated or purchased | | — | — | | ||||||||
Financial assets that have been derecognized | ( | ( | — | ( | ||||||||
Discontinued operations (1) | ( | — | — | ( | ||||||||
Loss of control in subsidiary (1) | ( | — | — | ( | ||||||||
FX and other movements | | | — | | ||||||||
Loss allowance as of December 31, 2022 |
| Ps. | |
| Ps. | |
| Ps. | — |
| Ps. | |
(1) See note 1.1 “Discontinued operations of BAC Holding”
(2) Correspond to reclassification for comparability of the movements of BAC Holding consider the deconsolidation of this entity during year 2022.
(3) This amount includes impact of the measurement of ECL due to changes made in PDs/LGDs/EADs and changes made to model assumptions and methodologies from the opening to the closing balance. The following table shows the impact by stage estimated using all parameters as of December 31, 2022 versus parameters as of December 31, 2021 and the investments portfolio as of December 31, 2022.
December 31, 2022 | ||||||||||
| Stage 2 |
| Stage 3 |
| ||||||
Stage 1 | Lifetime ECL not | Lifetime ECL | ||||||||
12-month ECL | credit-impaired | credit-impaired | Total | |||||||
Ps. | ( |
| Ps. | |
| Ps. | — |
| Ps. | ( |
F-98
Grupo Aval Acciones y Valores S.A.
Notes to the Consolidated Financial Statements
For the years ended December 31, 2022, 2021 and 2020
(Amounts expressed in millions of Colombian pesos)
(4) This amount includes impact of the measurement of ECL due to changes made in PDs/LGDs/EADs and changes made to model assumptions and methodologies from the opening to the closing balance. The following table shows the impact by stage estimated using all parameters as of December 31, 2021 versus parameters as of December 31, 2020 and the investments portfolio as of December 31, 2021.
December 31, 2021 | ||||||||||
| Stage 2 |
| Stage 3 |
| ||||||
Stage 1 | Lifetime ECL not | Lifetime ECL | ||||||||
12-month ECL | credit-impaired | credit-impaired | Total | |||||||
Ps. | ( |
| Ps. | — |
| Ps. | — |
| Ps. | ( |
(5) This amount includes impact of the measurement of ECL due to changes made in PDs/LGDs/EADs and changes made to model assumptions and methodologies from the opening to the closing balance. The following table shows the impact by stage estimated using all parameters as of December 31, 2020 versus parameters as of December 31, 2019 and the investments portfolio as of December 31, 2020.
December 31, 2020 | ||||||||||
| Stage 2 |
| Stage 3 |
| ||||||
Stage 1 | Lifetime ECL not | Lifetime ECL | ||||||||
12-month ECL | credit-impaired | credit-impaired | Total | |||||||
Ps. | |
| Ps. | — |
| Ps. | — |
| Ps. | |
Other accounts receivable
General approach
| Stage 2 | |||||||||||
Lifetime | Stage 3 | |||||||||||
Stage 1 | ECL not | Lifetime | ||||||||||
12-month | credit- | ECL credit- | ||||||||||
| ECL |
| impaired |
| impaired |
| Total | |||||
Loss allowance as of January 1, 2020 | Ps. | |
| Ps. | |
| Ps. | | Ps. | | ||
Net remeasurement of loss allowance | |
| |
| | | ||||||
FX and other movements | |
| ( |
| | ( | ||||||
Write-offs | ( |
| — |
| ( | ( | ||||||
Loss allowance as of December 31, 2020 | Ps. | |
| Ps. | |
| Ps. | | Ps. | | ||
Net remeasurement of loss allowance | |
|
| |
|
| | | ||||
FX and other movements | ( |
|
| |
|
| | | ||||
Write-offs | ( |
|
| — |
|
| ( | ( | ||||
Loss allowance as of December 31, 2021 |
| Ps. | |
| Ps. | |
| Ps. | |
| Ps. | |
Net remeasurement of loss allowance |
|
| | | |
|
| | ||||
FX and other movements |
|
| | | |
|
| | ||||
Write-offs |
|
| ( | — | ( |
|
| ( | ||||
Loss allowance as of December 31, 2022 |
| Ps. | |
| Ps. | |
| Ps. | |
| Ps. | |
Simplified approach
F-99
Grupo Aval Acciones y Valores S.A.
Notes to the Consolidated Financial Statements
For the years ended December 31, 2022, 2021 and 2020
(Amounts expressed in millions of Colombian pesos)
|
| Loss allowance | |
Loss allowance as of January 1, 2020 | Ps. | ||
On business combination (3) | |||
Reclassification BAC (1)(2) | ( | ||
Discontinued operations (1) | |||
Provision charged to profit or loss |
| ||
Recovery of partial payments from the clients |
| ( | |
Write-offs |
| ( | |
Exchange gains (losses) in foreign currency | ( | ||
Loss allowance as of December 31, 2020 |
| Ps. | |
Reclassification BAC (1)(2) | ( | ||
Discontinued operations (1) | | ||
Provision charged to profit or loss |
|
| |
Recovery for partial payments from the clients |
|
| ( |
Write-offs |
|
| ( |
Exchange gains (losses) in foreign currency |
|
| |
Loss allowance as of December 31, 2021 |
| Ps. | |
Loss of control in subsidiary (1) | ( | ||
Discontinued operations (1) | | ||
Entity liquidation | ( | ||
Provision charged to profit or loss |
|
| |
Recovery for partial payments from the clients |
|
| ( |
Write-offs |
|
| ( |
Exchange gains (losses) in foreign currency |
|
| |
Loss allowance as of December 31, 2022 |
| Ps. | |
(1) See note 1.1 “Discontinued operations of BAC Holding”
(2) Correspond to reclassification for comparability of the movements of BAC Holding consider the deconsolidation of this entity during year 2022.
(3) See note 35 Business combination
Loan commitments and financial guarantee contracts
F-100
Grupo Aval Acciones y Valores S.A.
Notes to the Consolidated Financial Statements
For the years ended December 31, 2022, 2021 and 2020
(Amounts expressed in millions of Colombian pesos)
| Stage 2 | |||||||||||
Lifetime | Stage 3 | |||||||||||
Stage 1 | ECL not | Lifetime | ||||||||||
12-month | credit- | ECL credit- | ||||||||||
| ECL |
| impaired |
| impaired |
| Total | |||||
Loss allowance as of January 1, 2020 |
| Ps. | |
| Ps. | |
| Ps. | |
| Ps. | |
Transfers: |
|
|
|
|
|
|
|
|
|
|
| |
Transfer from stage 1 to stage 2 | ( |
|
| |
|
| — | — | ||||
Transfer from stage 1 to stage 3 | ( |
|
| — |
|
| | — | ||||
Transfer from stage 2 to stage 3 | — |
|
| ( |
|
| | — | ||||
Transfer from stage 3 to stage 2 | — |
|
| |
|
| ( | — | ||||
Transfer from stage 2 to stage 1 | |
|
| ( |
|
| — | — | ||||
Transfer from stage 3 to stage 1 | | — | ( | — | ||||||||
Net remeasurement of loss allowance | ( |
|
| |
|
| ( | | ||||
New loan commitments and financial guarantees issued | |
|
| |
|
| ( | | ||||
FX and other movements | |
|
| — |
|
| — | | ||||
Discontinued operations (1) | ( | | ( | ( | ||||||||
Reclassification BAC (1) (2) | | | ( | | ||||||||
Loss allowance as of December 31, 2020 |
| Ps. | |
| Ps. | |
| Ps. | |
| Ps. | |
Transfers: |
|
|
|
|
|
|
|
|
|
|
| |
Transfer from stage 1 to stage 2 | ( |
|
| |
|
| — | — | ||||
Transfer from stage 1 to stage 3 | ( |
|
| — |
|
| | — | ||||
Transfer from stage 2 to stage 3 | — |
|
| ( |
|
| | — | ||||
Transfer from stage 3 to stage 2 | — |
|
| |
|
| ( | — | ||||
Transfer from stage 2 to stage 1 | |
|
| ( |
|
| — | — | ||||
Transfer from stage 3 to stage 1 | | — | ( | — | ||||||||
Net remeasurement of loss allowance | ( |
|
| |
|
| ( | ( | ||||
New loan commitments and financial guarantees issued | |
|
| |
|
| | | ||||
FX and other movements | ( |
|
| — |
|
| | ( | ||||
Discontinued operations (1) | ( | ( | | | ||||||||
Reclassification BAC (1) (2) | | | | | ||||||||
Loss allowance as of December 31, 2021 |
| Ps. | |
| Ps. | |
| Ps. | |
| Ps. | |
Transfers: |
|
|
|
|
|
|
|
|
|
|
|
|
Transfer from stage 1 to stage 2 |
|
| ( | | — |
|
| — | ||||
Transfer from stage 1 to stage 3 |
|
| ( | — | |
|
| — | ||||
Transfer from stage 2 to stage 3 |
|
| — | ( | |
|
| — | ||||
Transfer from stage 3 to stage 2 |
|
| — | | ( |
|
| — | ||||
Transfer from stage 2 to stage 1 |
|
| | ( | — |
|
| — | ||||
Transfer from stage 3 to stage 1 | | — | ( | — | ||||||||
Net remeasurement of loss allowance |
|
| ( | ( | ( |
|
| ( | ||||
New loan commitments and financial guarantees issued |
|
| | | ( |
|
| | ||||
FX and other movements |
|
| | | — |
|
| | ||||
Discontinued operations (1) | ( | ( | ( | ( | ||||||||
Loss of control in subsidiary (1) | ( | ( | ( | ( | ||||||||
Loss allowance as of December 31, 2022 |
| Ps. | |
| Ps. | |
| Ps. | |
| Ps. | |
(1) See note 1.1 “Discontinued operations of BAC Holding”
(2) Correspond to reclassification for comparability of the movements of BAC Holding consider the deconsolidation of this entity during year 2022.
F-101
Grupo Aval Acciones y Valores S.A.
Notes to the Consolidated Financial Statements
For the years ended December 31, 2022, 2021 and 2020
(Amounts expressed in millions of Colombian pesos)
4.1.6 Concentrations of credit risk
Loan portfolio
Policies to prevent excessive credit-risk concentration
In order to prevent excessive concentrations of credit risk at an individual, economic group, country or economic sectors level, each financial subsidiary of Grupo Aval maintains updated exposure thresholds to limit concentration. The exposure limit by a financial subsidiary of Grupo Aval to an individual client or economic group depends on the risk profile of the client (or economic group), the nature of the risk of the debtor and the experience of each financial subsidiary in a specific market or sector.
Concentration risk control is key to the risk management process. Grupo Aval´s financial subsidiaries monitor the degree of credit risk concentration by sector and individual or group customer.
In order to avoid credit risk concentration at Grupo Aval level, management relies on the financial subsidiaries Credit Risk Vice-Presidency or its equivalent, which consolidates, and monitors the credit risk exposures of all financial subsidiaries, to determine the maximum levels of concentration.
Pursuant to Colombian regulations, financial subsidiaries in Colombia cannot grant unsecured loans to borrowers, which on a combined basis exceed 10% of the financial subsidiary´s regulatory capital calculated according to the regulations of the Superintendency of Finance. Loans maybe more than 10% of the regulatory capital of the financial subsidiary when they are secured by acceptable collateral and/or certain guarantees.
Concentration by sector
Below is the credit portfolio distribution of Grupo Aval by economic sector as of December 31, 2022, and 2021:
Sector |
| December 31, 2022 |
| % | December 31, 2021 |
| % | ||||
Consumer services |
| Ps. | |
| | % | Ps. | |
| | % |
Commercial services |
|
| |
| | % |
| |
| | % |
Construction | | | % | | | % | |||||
Food, beverage and tobacco |
|
| |
| | % |
| |
| | % |
Other industrial and manufacturing products | | | % | | | % | |||||
Transportation and communications | | | % | | | % | |||||
Public services |
|
| |
| | % |
| |
| | % |
Chemical production |
|
| |
| | % |
| |
| | % |
Government | | | % | | | % | |||||
Agricultural |
|
| |
| | % |
| |
| | % |
Trade and tourism |
|
| |
| | % |
| |
| | % |
Mining products and oil |
|
| |
| | % |
| |
| | % |
Other | | | % | | | % | |||||
Total of each economic sector |
| Ps. | |
| | % | Ps. | |
| | % |
F-102
Grupo Aval Acciones y Valores S.A.
Notes to the Consolidated Financial Statements
For the years ended December 31, 2022, 2021 and 2020
(Amounts expressed in millions of Colombian pesos)
Concentration by country
The detail of credit risk at the level of Grupo Aval in the different geographic areas determined according to the domicile of the debtor, without taking into consideration loan loss provisions as of December 31, 2022, and 2021 is as follows:
December 31, 2022 |
| Commercial |
| Consumer |
| Mortgages |
| Microcredit |
| Interbank and overnight funds |
| Total | ||||||
Colombia | Ps. | | Ps. | | Ps. | | Ps. | | Ps. | | Ps. | |||||||
Panamá |
| |
| |
| |
| — |
| |
| |||||||
United States | | | — | — | — | |||||||||||||
Guatemala | | — | — | — | — | |||||||||||||
Costa Rica |
| |
| |
| |
| — |
| |
| |||||||
Honduras |
| |
| — |
| — |
| — |
| — |
| |||||||
El Salvador | | — | — | — | — | |||||||||||||
Nicaragua | — | — | — | — | — | — | ||||||||||||
Other countries |
| |
| |
| — |
| — |
| — |
| |||||||
Total gross loan portfolio | Ps. | | Ps. | | Ps. | | Ps. | | Ps. | | Ps. | | ||||||
December 31, 2021 |
| Commercial |
| Consumer |
| Mortgages |
| Microcredit |
| Interbank and overnight funds |
| Total | ||||||
Colombia |
| Ps. | |
| Ps. | |
| Ps. | |
| Ps. | |
| Ps. | |
| Ps. | |
Panamá |
|
| |
|
| |
|
| |
|
| — |
|
| |
|
| |
Costa Rica | | | | — | | | ||||||||||||
Guatemala | | | | — | | | ||||||||||||
Honduras | | | | — | | | ||||||||||||
El Salvador |
|
| |
|
| |
|
| |
|
| — |
|
| |
|
| |
United States |
|
| |
|
| |
|
| — |
|
| — |
|
| |
|
| |
Nicaragua | | | | — | | | ||||||||||||
Other countries |
|
| |
|
| |
|
| — |
|
| — |
|
| |
|
| |
Total gross loan portfolio |
| Ps. | |
| Ps. | |
| Ps. | |
| Ps. | |
| Ps. | |
| Ps. | |
Concentration by currency
The classification of loan portfolio by type of currency is as follows:
December 31, 2022 |
| Colombian Pesos |
| Foreign currency |
| Total | |||
Commercial |
| Ps. | |
| Ps. | |
| Ps. | |
Consumer |
|
| |
|
| |
|
| |
Residential mortgage |
|
| |
|
| |
|
| |
Microcredit |
|
| |
|
| — |
|
| |
Interbank and overnight funds |
|
| |
|
| |
|
| |
Total gross loan portfolio |
| Ps. | |
| Ps. | |
| Ps. | |
December 31, 2021 |
| Colombian Pesos |
| Foreign currency |
| Total | |||
Commercial |
| Ps. | |
| Ps. | |
| Ps. | |
Consumer |
|
| |
|
| |
|
| |
Residential mortgage |
|
| |
|
| |
|
| |
Microcredit |
|
| |
|
| — |
|
| |
Interbank and overnight funds |
|
| |
|
| |
|
| |
Total gross loan portfolio |
| Ps. | |
| Ps. | |
| Ps. | |
As of December 31, 2022 the loan portfolio in foreign currency represents
F-103
Grupo Aval Acciones y Valores S.A.
Notes to the Consolidated Financial Statements
For the years ended December 31, 2022, 2021 and 2020
(Amounts expressed in millions of Colombian pesos)
Investment debt securities
Grupo Aval entities monitor concentrations of credit risk by sector and by geographic location. An analysis of concentrations of credit risk from investment securities is shown below.
Concentration by sector
Trading debt securities (see note 8.1)
The balance of financial assets in investments in trading debt securities includes the following as of December 31, 2022, and 2021:
| December 31, |
| December 31, | |||
|---|---|---|---|---|---|---|
2022 | 2021 | |||||
In Colombian Pesos |
|
|
|
|
|
|
Securities issued or secured by Colombian Government |
| Ps. | |
| Ps. | |
Securities issued or secured by other Colombian Government entities |
|
| |
|
| |
Securities issued or secured by other financial entities |
|
| |
|
| |
Securities issued or secured by non-financial sector entities |
|
| |
|
| |
Others |
|
| |
|
| |
Total in Colombian Pesos |
| Ps. | |
| Ps. | |
In foreign currency |
|
|
|
|
|
|
Securities issued or secured by Colombian Government |
| Ps. | |
| Ps. | |
Securities issued or secured by foreign Governments |
|
| |
|
| |
Securities issued or secured by other financial entities |
|
| |
|
| |
Others |
|
| |
|
| |
Total in foreign currency |
| Ps. | |
| Ps. | |
Total trading debt securities |
| Ps. | |
| Ps. | |
Investments in debt securities mandatorily at FVTPL (see note 9.1)
The balance of financial assets in investments in debt securities mandatorily at FVTPL includes the following as of December 31, 2022, and 2021:
| December 31, |
| December 31, | |||
2022 | 2021 | |||||
In Colombian Pesos |
|
|
|
|
|
|
Others |
| Ps. | |
| Ps. | — |
Total debt securities mandatorily at FVTPL |
| Ps. | |
| Ps. | — |
F-104
Grupo Aval Acciones y Valores S.A.
Notes to the Consolidated Financial Statements
For the years ended December 31, 2022, 2021 and 2020
(Amounts expressed in millions of Colombian pesos)
Investments in debt securities at FVOCI
The balance of financial assets in investments in debt securities at FVOCI includes the following as of December 31, 2022, and 2021:
| December 31, |
| December 31, | |||
2022 | 2021 | |||||
In Colombian Pesos |
|
| ||||
Securities issued or secured by Colombian Government |
| Ps. | |
| Ps. | |
Securities issued or secured by other Colombian Government entities | | | ||||
Securities issued or secured by other financial entities | | | ||||
Securities issued or secured by non-financial sector entities | | | ||||
Others | | | ||||
Total in Colombian Pesos |
| Ps. | |
| Ps. | |
In foreign currency |
|
|
|
| ||
Securities issued or secured by Colombian Government | Ps. | |
| Ps. | | |
Securities issued or secured by other Colombian Government entities | |
|
| | ||
Securities issued or secured by foreign Governments | |
|
| | ||
Securities issued or secured by central banks | |
|
| | ||
Securities issued or secured by other financial entities | |
|
| | ||
Securities issued or secured by non-financial sector entities | |
|
| | ||
Others | |
|
| | ||
Total in foreign currency |
| Ps. | |
| Ps. | |
Total debt securities at FVOCI |
| Ps. | |
| Ps. | |
Investments in debt securities at amortized cost
The balance of financial assets in investments in debt securities at amortized cost includes the following as of December 31, 2022, and 2021:
December 31, |
| December 31, | ||||
In Colombian Pesos | 2022 | 2021 | ||||
Securities issued or secured by Colombian Government | Ps. | | Ps. | | ||
Securities issued or secured by other Colombian Government entities |
| |
| | ||
Others |
|
| |
|
| |
Total in Colombian Pesos |
| Ps. | |
| Ps. | |
In foreign currency |
|
|
|
|
|
|
Securities issued or secured by foreign Governments |
| Ps. | |
| Ps. | |
Securities issued or secured by other financial entities | | | ||||
Securities issued or secured by non-financial sector entities | | | ||||
Others | | | ||||
Total in foreign currency |
| Ps. | |
| Ps. | |
Total investments in debt securities at amortized cost |
| Ps. | |
| Ps. | |
F-105
Grupo Aval Acciones y Valores S.A.
Notes to the Consolidated Financial Statements
For the years ended December 31, 2022, 2021 and 2020
(Amounts expressed in millions of Colombian pesos)
Concentration of investments in debt securities by location
As of December 31, | ||||||
| 2022 |
| 2021 | |||
Colombia |
| Ps. | |
| Ps. | |
Panama |
| |
| | ||
USA |
| |
| | ||
Multilateral – Bladex (Foreign Trade Bank of Latin America) |
| |
| | ||
Brazil |
| |
| | ||
Mexico |
| |
| | ||
Costa Rica |
| |
| | ||
Chile |
| |
| | ||
Multilateral – Andean Development Corporation (Corporacion Andina de Fomento) |
| |
| | ||
Peru |
| |
| | ||
Multilateral – International Bank for Reconstruction and Development |
| |
| | ||
Multilateral – Inter-American Corporation for the Financing of Infrastructure | | | ||||
Paraguay |
| |
| | ||
Guatemala | — | | ||||
Honduras | — | | ||||
Nicaragua |
| — |
| | ||
El Salvador |
| — |
| | ||
Dominican Republic | — | | ||||
Multilateral – Central American Bank for Economic Integration | — | | ||||
Total investments in debt securities |
| Ps. | |
| Ps. | |
Concentration by Sovereign Debt
As a general rule, Grupo Aval considers sovereign risk to be the risk assumed in deposits with Central Banks (including the mandatory deposits), investments in debt issues of a Government. In addition, the risk arising from transactions with public sector entities that have the following features: their funds are obtained only from fiscal income, they are legally recognized as entities directly included in the government sector, and their activities are of a non-commercial nature.
Sovereign risk exposure arises mainly from Grupo Aval’s banking subsidiaries obligations to maintain certain mandatory deposits in Central Banks and from the fixed-income portfolios held as part of the on-balance-sheet structural interest rate risk management strategy and in the trading books of the treasury department. Most of these exposures are denominated in pesos and are financed through peso denominated repurchase agreements or customer deposits.
As of December 31, 2022, and 2021, the investment portfolio of financial assets in debt instruments is comprised mainly of securities issued or secured by entities of the Republic of Colombia and issued or secured by other Colombian Government entities, which represent
F-106
Grupo Aval Acciones y Valores S.A.
Notes to the Consolidated Financial Statements
For the years ended December 31, 2022, 2021 and 2020
(Amounts expressed in millions of Colombian pesos)
Below is the detail of Grupo Aval’s sovereign debt portfolio issued by Central Governments per country:
December 31, 2022 | December 31, 2021 |
| |||||||||
|
|
|
| % |
|
| % |
| |||
Investment grade (1) |
|
|
|
|
|
|
|
| |||
Colombia | Ps. | |
| | % | Ps. | |
| | % | |
Panama |
| |
| | % | |
| | % | ||
Peru | — | — | % | | | % | |||||
Mexico | | | % | | | % | |||||
United States of America |
| |
| | % | |
| | % | ||
Total Investment grade | Ps. | |
| | % | Ps. | |
| | % | |
Speculative (2) |
|
|
|
|
|
|
|
| |||
Brazil | | | % | | | % | |||||
Colombia | | | % | | | % | |||||
Chile | — | — | % | | | % | |||||
Costa Rica |
| |
| | % | |
| | % | ||
Honduras |
| — |
| — | % | |
| | % | ||
Guatemala |
| — |
| — | % | |
| | % | ||
El Salvador |
| — |
| — | % | |
| | % | ||
Nicaragua |
| — |
| — | % | |
| | % | ||
Total Speculative | Ps. | |
| | % | Ps. | |
| | % | |
Ps. | |
| | % | Ps. | |
| | % | ||
Below is the detail of Grupo Aval’s debt portfolio issued by Central Banks:
December 31, 2022 | December 31, 2021 |
| |||||||||
|
|
|
| % |
|
| % |
| |||
Investment Grade (1) | |||||||||||
Panama (*) | Ps. | |
| | % | Ps. | |
| | % | |
Total Investment grade | Ps. | | | % | Ps. | | | % | |||
Speculative (2) |
|
|
|
|
|
|
| ||||
Guatemala | Ps. | — |
| — | % | Ps. | |
| | % | |
Costa Rica |
| — |
| — | % | |
| | % | ||
Nicaragua |
| — |
| — | % | |
| | % | ||
Total Speculative | Ps. | — |
| — | % | Ps. | |
| | % | |
Total sovereign risk | Ps. | |
| | % | Ps. | |
| | % | |
| (1) | Investment grade includes the risk rating of Fitch Ratings Colombia S.A o F1+ to F3, BRC of Colombia from BRC 1+ to BRC 3 and Standard & Poor’s from AAA to BBB-. |
| (2) | Speculative or non-investment grade level includes the risk rating of Fitch Ratings Colombia S.A. from B to E, BRC de Colombia from BRC 4 to BRC 6 and Standard & Poor’s from BB+ to D. |
(*) These investments correspond to the National Bank of Panama, which is the official Bank and has the functions of a Central Bank, however, it does not have the power to issue banknotes or reserve requirements.
4.1.7 Modified Financial Assets - troubled debt restructuring business process.
Each financial subsidiary of Grupo Aval periodically carries out, at the request of the client, restructurings of obligations. Such restructurings generally consist of extensions of tenors, decrease of interest rates, partial write-off of indebtedness or payment with assets of the debtor or guarantor.
Our banking subsidiaries follow highly rigorous definitions and policies in this management process, so that it is performed in accordance with the best practices and in strict compliance with regulatory requirements. In connection to this, Grupo Aval´s banking subsidiaries have a detailed policy with regard to the aforementioned transactions.
The objective of granting such restructurings is to provide the client with a viable alternative to meet its obligations to the bank and to adapt to changing conditions.
When a loan is restructured due to a debtor´s financial difficulties, the debt is flagged within the records of each bank as a restructured credit in accordance with the regulations of the Superintendency of Finance. The restructuring process has a negative impact on the
F-107
Grupo Aval Acciones y Valores S.A.
Notes to the Consolidated Financial Statements
For the years ended December 31, 2022, 2021 and 2020
(Amounts expressed in millions of Colombian pesos)
debtor’s rating, which can only be improved when the client has complied during a prudent period with the terms of the restructurings, its financial condition has improved or when sufficient additional guarantees have been obtained.
Restructured loans are included for impairment evaluation and determination of provisions. However, the marking of a credit as restructured does not necessarily imply its rating is impaired, because in some cases new guarantees are obtained supporting the obligation.
The following is the balance of restructured loans as of December 31, 2022, and 2021:
Restructured loans |
| December 31, 2022 |
| December 31, 2021 | ||
Local currency | Ps. | | Ps. | | ||
Foreign currency |
| |
| | ||
Total restructured | Ps. | | Ps. | | ||
4.1.8 Foreclosed assets business process
When persuasive collection processes or credit restructurings are not effective, a legal proceeding is carried out or an agreement is reached with the client for the receipt of assets as payment. Each subsidiary of the financial sector has clearly established policies for receiving assets and has a separate department specialized in the management of these cases and in charge of their eventual sale or liquidation.
During the years ended December 31, 2022, and 2021, the following is the total of foreclosed assets received and sold during such periods:
| December 31, 2022 |
| December 31, 2021 | |||
Foreclosed assets received | Ps. | | Ps. | | ||
Foreclosed assets sold |
| |
| | ||
4.1.9 Loan commitments and financial guarantee contracts
As part of our operations, Grupo Aval grants guarantees and letters of credit to its customers wherein Grupo Aval financial subsidiaries are irrevocably committed to make payments to third parties when customers do not comply with their obligations with such third parties. These products have the same policies for approval of disbursements of loans regarding client’s credit risk and guarantees required according to the circumstances of each client.
The commitments for credit extension represent unused portions of authorizations to grant loans, use of credit cards, overdraft limits and letters of credit. With respect to credit risk over commitments to extend credit lines, Grupo Aval is potentially exposed to credit risk in an amount equal to the total amount of unused commitments, if the unused amount were to be withdrawn in whole. However, the amount of the loss is less that the total amount of commitments unused, since most commitments to extend credits are contingent on the customer maintaining specific credit risk standards.
Pending unused credit lines and guarantees do not necessarily represent future cash out flows, because such facilities may expire and not be used whole or in part.
Following is the detail of the guarantees, letters of credit and credit commitments on non-used credit lines as of December 31, 2022, and 2021.
Loan commitments and financial guarantee contracts
December 31, 2022 | December 31, 2021 | |||||
| Notional amount |
| Notional amount | |||
Guarantees | Ps. | | Ps. | | ||
Unused letters of credit |
| |
| | ||
Unused limits of overdrafts |
| |
| | ||
Unused credit card limits |
| |
| | ||
Other |
| |
| | ||
Total | Ps. | | Ps. | | ||
F-108
Grupo Aval Acciones y Valores S.A.
Notes to the Consolidated Financial Statements
For the years ended December 31, 2022, 2021 and 2020
(Amounts expressed in millions of Colombian pesos)
The following is the detail of the credit commitments by type of currency:
| December 31, 2022 |
| December 31, 2021 | |||
Colombian Pesos | Ps. | | Ps. | | ||
U.S. dollars |
| |
| | ||
Euro |
| |
| | ||
Other |
| |
| | ||
Total |
| Ps. | |
| Ps. | |
4.1.10 Offset of financial assets and financial liabilities
The disclosures set out in the following tables include financial assets and liabilities that:
| ● | are offset in the Group’s statement of financial position; or |
| ● | are subject to an enforceable master netting arrangement or similar agreement that covers similar financial instruments, irrespective of whether they are offset in the statement of financial position. |
The ‘similar agreements’ include derivative clearing agreements; global master repurchase agreements and global master securities lending agreements. Similar financial instruments include derivatives, sale-and-repurchase agreements, reverse sale-and-repurchase agreements, and securities borrowing and lending agreements. Financial instruments such as loans and deposits are not disclosed in the following tables unless they are offset in the statement of financial position.
The ISDA (International Swaps and Derivatives Association) and similar master netting arrangements do not meet the criteria for offsetting in the statement of financial position. This is because they create for the parties to the agreement a right of set-off of recognized amounts that is enforceable only following an event of default, insolvency or bankruptcy of Grupo Aval or of the counterparties or following other predetermined events. In addition, Grupo Aval and its counterparties do not intend to settle on a net basis or to realize the assets and settle the liabilities simultaneously.
Grupo Aval receives and gives collateral in the form of cash and marketable securities in respect of the following transactions:
| ● | Derivatives; and |
| ● | Sale-and-repurchase, and reverse sale-and-repurchase agreements. |
This collateral is subject to standard industry terms including, when appropriate, an ISDA credit support annex. This means that securities received/given as collateral can be pledged or sold during the term of the transaction but have to be returned on maturity of the transaction. The terms also give each party the right to terminate the related transactions on the counterparty’s failure to post collateral.
The gross amounts of financial assets and financial liabilities and their net amounts disclosed in the above tables have been measured in the statement of financial position on the following bases:
| ● | Derivative assets and liabilities – fair value; |
| ● | Assets and liabilities resulting from sale-and-repurchase agreements, reverse sale-and repurchase agreements and securities lending and borrowing – amortized cost; |
F-109
Grupo Aval Acciones y Valores S.A.
Notes to the Consolidated Financial Statements
For the years ended December 31, 2022, 2021 and 2020
(Amounts expressed in millions of Colombian pesos)
The following is the detail of the financial instruments subject to offset contractually required as of December 31, 2022, and 2021:
December 31, 2022
Gross | Gross Amounts | Net Amounts of | Gross Amounts Not | |||||||||||||||
|---|---|---|---|---|---|---|---|---|---|---|---|---|---|---|---|---|---|---|
Amounts of | Offset in the | Assets Presented in | Offset in the Consolidated Balance Sheet | |||||||||||||||
Recognized | Consolidated | the Consolidated | Financial | Cash collateral | Net | |||||||||||||
Assets | Balance Sheet | Balance Sheet | Instruments | Received | Exposure | |||||||||||||
Offsetting assets |
|
|
|
|
|
| ||||||||||||
Derivatives | Ps. | | Ps. | — | Ps. | | Ps. | ( | Ps. | ( | Ps. | | ||||||
Repurchase agreements | | — | | ( | ( | | ||||||||||||
Total | Ps. | | Ps. | — | Ps. | | Ps. | ( | Ps. | ( | Ps. | | ||||||
Gross | Gross Amounts | Net Amounts of | Gross Amounts Not | |||||||||||||||
Amounts of | Offset in the | Liabilities Presented in | Offset in the Consolidated Balance Sheet | |||||||||||||||
Recognized | Consolidated | the Consolidated | Financial | Cash collateral | Net | |||||||||||||
| Liabilities | Balance Sheet | Balance Sheet | Instruments | Delivered | Exposure | ||||||||||||
Offsetting liabilities |
|
|
|
|
|
| ||||||||||||
Derivatives | Ps. | | Ps. | — | Ps. | | Ps. | ( | Ps. | ( | Ps. | | ||||||
Repurchase agreements | | — | | ( | ( | ( | ||||||||||||
Total | Ps. | | Ps. | — | Ps. | | Ps. | ( | Ps. | ( | Ps. | ( | ||||||
December 31, 2021
|
|
|
|
| ||||||||||||||
Gross | Gross Amounts | Net Amounts of | Gross Amounts Not | |||||||||||||||
Amounts of | Offset in the | Assets Presented in | Offset in the Consolidated Balance Sheet |
| ||||||||||||||
Recognized | Consolidated | the Consolidated | Financial | Cash collateral | Net | |||||||||||||
| Assets |
| Balance Sheet |
| Balance Sheet |
| Instruments |
| Received |
| Exposure | |||||||
Offsetting assets |
|
|
|
|
|
| ||||||||||||
Derivatives | Ps. | | Ps. | — | Ps. | | Ps. | ( | Ps. | ( | Ps. | | ||||||
Repurchase agreements | | — | | ( | ( | | ||||||||||||
Total | Ps. | | Ps. | — | Ps. | | Ps. | ( | Ps. | ( | Ps. | | ||||||
|
|
|
| |||||||||||||||
Gross | Gross Amounts | Net Amounts of | Gross Amounts Not | |||||||||||||||
Amounts of | Offset in the | Liabilities Presented in | Offset in the Consolidated Balance Sheet | |||||||||||||||
Recognized | Consolidated | the Consolidated | Financial | Cash collateral | Net | |||||||||||||
| Liabilities |
| Balance Sheet |
| Balance Sheet |
| Instruments |
| Delivered |
| Exposure | |||||||
Offsetting liabilities |
|
|
|
|
|
| ||||||||||||
Derivatives | Ps. | | Ps. | — | Ps. | | Ps. | ( | Ps. | ( | Ps. | | ||||||
Repurchase agreements | | — | | ( | ( | ( | ||||||||||||
Total | Ps. | | Ps. | — | Ps. | | Ps. | ( | Ps. | ( | Ps. | ( | ||||||
F-110
Grupo Aval Acciones y Valores S.A.
Notes to the Consolidated Financial Statements
For the years ended December 31, 2022, 2021 and 2020
(Amounts expressed in millions of Colombian pesos)
4.2 Market Risk
Market risk refers to the risk that a change in the level of one or more market prices, rates, indices, volatilities, correlations or other market factors, such as liquidity, will result in losses in a position or in the portfolio.
Grupo Aval´s financial subsidiaries (namely Banco de Bogotá, Banco de Occidente, Banco Popular, Banco AV Villas, Corficolombiana, Porvenir and the trust companies of the financial subsidiaries) actively participate in money markets, foreign exchange markets and capital markets, for both of their books (for balance sheet risk management and trading book) and to provide financial services to their customers. This is done subject to established policies and risk limits. In that regard, they hold financial asset portfolios within the allowed limits and risk levels.
Market risk arises from the positions of Grupo Aval´s financial subsidiaries in debt securities investment portfolios, derivatives and equity instruments. These risks are created by changes in factors such as interest rates, inflation, foreign currency exchange rates, share prices, credit margins of instruments and their volatility, as well as the liquidity in the markets where Grupo Aval operates.
Our business units and trading desks are responsible for ensuring that market risk exposures are well-managed and prudent. The risk management groups and our business unit management ensure that these risks are measured and closely monitored. A variety of limits and controls are designed to manage price and liquidity risk. Market risk is monitored through various mechanisms such as: statistically analysis (using Value-at-Risk models and related analytical measures), risk factor sensitivity analysis, and routine stress testing, conducted in collaboration with the business units by the Market Risk Unit. The material risks identified by these processes are summarized in reports produced by the Market Risk Unit that are circulated to, and discussed with, senior management.
4.2.1 Trading Book Risk
Grupo Aval´s financial subsidiaries trade financial instruments for various reasons, mainly:
| ● | To offer products tailored to specific customer needs. Some of these products are designed to hedge the financial risks of customers. |
| ● | To take advantage of arbitrage opportunities among different yield curves, assets and markets, obtaining returns with an adequate use of capital. |
| ● | To hedge asset and liability risk positions on proprietary positions, to act on behalf of customers or to take advantage of arbitrage opportunities mainly in foreign exchange and interest rates in both local and foreign markets. |
In carrying out these operations, Grupo Aval´s financial subsidiaries take risks, within predetermined limits. These risks are mitigated with the use of derivative products and other financial instruments within limits that are permanently monitored by risk.
The following is a breakdown of Grupo Aval’s financial assets and liabilities exposed to trading risk held at December 31, 2022 and 2021.
Account |
| December 31, 2022 |
| December 31, 2021 | ||
Financial assets |
| |||||
Debt financial assets |
|
| ||||
Trading investments in debt securities | Ps. | | Ps. | | ||
Investments in debt securities mandatorily at FVTPL | | — | ||||
Investments in debt securities at FVOCI | | | ||||
Total debt securities | Ps. | | Ps. | | ||
Derivative assets instruments | Ps. | | Ps. | | ||
Hedging derivatives assets | | | ||||
| | |||||
Total financial assets | Ps. | | Ps. | | ||
Liabilities |
|
| ||||
Derivative liabilities instruments | | | ||||
Hedging derivatives liabilities | | | ||||
Total financial liabilities | | | ||||
Net position | Ps. | | Ps. | | ||
F-111
Grupo Aval Acciones y Valores S.A.
Notes to the Consolidated Financial Statements
For the years ended December 31, 2022, 2021 and 2020
(Amounts expressed in millions of Colombian pesos)
4.2.2 Description of Objectives, Policies and Processes to Manage Trading Risk
Our financial subsidiaries participate in money markets, foreign exchange markets and capital markets to meet their needs and those of their customers, subject to established policies and risk levels. In this respect, they manage different portfolios of financial assets within the limits and risk levels allowed.
The risks assumed by Grupo Aval´s financial subsidiaries in transactions related to the trading or treasury book are consistent with the overall trading strategy, considering the market depth for each instrument, its impact on risk-weighted assets and regulatory capital, the profit budget established for each business unit, and the balance sheet structure.
Trading strategies are established on the basis of approved limits, in an effort to balance the risk / return relationship. Moreover, there is a structure of limits consistent with Grupo Aval’s general philosophy and is based on capital levels, earnings performance and risk appetite.
The Market Risk Management System (SARM in Spanish) allows Grupo Aval´s financial subsidiaries to identify, measure, control and monitor the market risk they are exposed to in carrying out their operations.
There are several scenarios in which Grupo Aval´s financial subsidiaries are exposed to trading risks.
| ● | Interest Rate Risk |
Grupo Aval’s financial subsidiaries are exposed to interest rate risk as a result of its market-making activities and proprietary trading in interest rate sensitive financial instruments (e.g., risk arising from changes in the level or implied volatility of interest rates, the timing of mortgage prepayments, the shape of the yield curve and credit spreads for credit sensitive instruments). This risk includes the risk of repricing of floating rates. Additionally, as part of the interest rate risk management, asset and liability management committees have been established to monitor the execution of these strategies.
| ● | Foreign Exchange Risk |
Grupo Aval’s financial subsidiary’s portfolios are exposed to foreign exchange rate and implied volatility risk as a result of market making negotiation in foreign currencies and from maintaining foreign exchange positions.
| ● | Equity Price Risk and Mutual Fund Risk |
Grupo Aval´s financial subsidiaries are exposed to equity price risk in specific investments and are exposed to mutual fund risk.
4.2.2.1 Risk Management
Grupo Aval financial subsidiaries manage their trading positions by employing a variety of risk mitigation strategies. These strategies include diversification of risk exposures and hedging through the purchase or sale of positions in related securities and financial instruments, including a variety of derivative products (e.g., futures, forwards, swaps and options). The financial subsidiaries manage their market risk associated with its trading activities on a decentralized basis. Our corporate risk unit supervises the level of risk taken in order to ensure that its global exposure limits are observed.
Senior management and the Boards of Directors of our banks and their financial subsidiaries play an active role in managing and controlling market risk. They do so by analyzing established reports and through committees that comprehensively monitor - both technically and fundamentally - the different variables that influence domestic and foreign markets. This process is intended to support strategic trading and portfolio decisions.
Analyzing and monitoring the market risks that Grupo Aval´s financial subsidiaries take in their operations is essential for decision making and to assess potential effects on their financial position. An ongoing analysis of macroeconomic conditions is necessary in order to achieve an ideal combination of market risk, return and liquidity.
The risks assumed in financial operations are reflected in a limit structure that includes different types of instruments, specific trading strategies, the market depth in which Grupo Aval´s financial subsidiaries operate, the impact on risk-weighted assets and regulatory capital, as well as the balance sheet structure. These limits are monitored daily and reported regularly to the Board of Directors of Grupo Aval´s financial subsidiaries.
F-112
Grupo Aval Acciones y Valores S.A.
Notes to the Consolidated Financial Statements
For the years ended December 31, 2022, 2021 and 2020
(Amounts expressed in millions of Colombian pesos)
In order to minimize interest rate and exchange rate risks in specific positions and transactions, Grupo Aval´s financial subsidiaries manage hedging strategies by taking positions in derivative instruments such as non-deliverable forwards (NDF) related to securities, money market transactions and foreign exchange forwards.
4.2.2.2 Methods Used to Measure Market Risk
The Market Risk areas independently reviews the Company’s trading portfolios on a regular basis from a market risk perspective utilizing Value at Risk (VaR) internal and regulatory models, and other quantitative and qualitative risk measures and analyses. Each trading business and the market risk areas also use, as appropriate, measures such as sensitivity to changes in interest rates, prices, and implied volatilities to monitor and report market risk exposures. Stress testing, which measures the impact on the value of existing portfolios of specified changes in market factors for certain products, is performed periodically and is reviewed by our risk and trading areas. Reports summarizing material risk exposures are produced by the market risk areas and are provided to senior management.
The Boards of Directors and the Risk Committees of Grupo Aval´s financial subsidiaries approve a framework of limits based on the value-at-risk related to the annual budget.
Regulatory VaR (regulatory calculation)
The Regulatory VaR calculation is primarily used for the Superintendency of Finance’s solvency ratio calculations. Each bank has standard models for capital purposes; however, they also maintain internal models in order to manage their day-to- day risk and profit decisions.
The Superintendency of Finance methodology is based on the Basel II model. This model applies only to the financial subsidiaries’ investment portfolio and excludes investments not classified as trading. Total market risk is calculated on a daily basis by aggregating the VaR for each risk exposure category on a ten-day horizon, based on risk factors calculated under extreme market stress scenarios. VaR at month-end is part of the capital adequacy ratio calculation (as set forth in Decree 2555 of 2010). The Superintendency of Finance’s rules require the financial subsidiaries to calculate VaR for the following risk factors: interest rate risk, foreign exchange rate risk, equity price risk and fund risk. Correlations between risk factors are not considered. The fluctuations in the portfolio’s VaR depend on sensitivity factors determined by the Superintendency of Finance, modified duration and changes in balances outstanding. The ten-day horizon is defined as the average time in which an entity could sell a trading position in the market.
The VaR calculation includes all the portfolios of the entities and their financial subsidiaries and is estimated under the methodology defined by the Superintendency of Finance of Colombia.
These VaR calculation models are used to determine the occurrence of potential losses among the different business units. The methods also allow comparisons of activities in different markets and identification of the riskiest positions in treasury activities. These tools are also used to determine limits on traders’ positions and to promptly review positions and trading strategies in response to changes in market conditions. VaR models have inherent limitations, partially because they rely on historical data, which may not be an indicative of future market conditions. VaR models could overestimate or underestimate the value at risk if market conditions vary significantly and they do not calculate the greatest possible loss. That’s why each company uses additional measurement tools in order to compensate for the VaR limitations. Expected Shortfall analysis, stress test and back tests are part of the risk measurement tools in the financial subsidiaries. The methods used to measure VaR are assessed regularly and backtested to check their efficiency.
Grupo Aval´s financial subsidiaries have tools to carry out portfolio stress and/or sensitivity tests, using extreme scenario simulations. Additionally, there are limits according to the "risk type" associated with each of the instruments comprising the different portfolios. These limits are related to sensitivity or impact on the value of the portfolio as a result of fluctuations of specific risk factors such as: interest rate (Rho), exchange rate (Delta) and volatility (Vega).
Grupo Aval´s financial subsidiaries have counterparty and trading limits for each trader in the trading platforms for the markets where they operate. Trading limits are controlled daily by the back and middle offices of each entity. Trading limits for individual traders are assigned based upon the individual´s level in the organization, market and trading experience and product and portfolio management knowledge.
There is also a process to monitor the prices of fixed-income securities traded in foreign markets published by investment price providers for those jurisdictions.
In addition, fixed income securities are subject to a qualitative liquidity analysis to determine the market depth for those instruments.
F-113
Grupo Aval Acciones y Valores S.A.
Notes to the Consolidated Financial Statements
For the years ended December 31, 2022, 2021 and 2020
(Amounts expressed in millions of Colombian pesos)
Finally, the daily transaction monitoring process includes controlling different aspects of trading, such as terms of negotiation, non-conventional or off-market transactions, and related party transactions.
According to the standard model, the market value-at-risk (VaR) for Grupo Aval´s financial subsidiaries consolidated at their level of December 31, 2022 and 2021 was as follows:
December 31, 2022 | December 31, 2021 | |||||||
|
| Basis points of |
|
| Basis points of | |||
Entity | Value at Risk | regulatory capital | Value at Risk | regulatory capital | ||||
Banco Bogotá S.A | Ps. | | | Ps. | |
| | |
Banco de Occidente S.A |
| | |
| |
| | |
Banco Popular S.A |
| | |
| |
| | |
Banco AV Villas S.A |
| | |
| |
| | |
Corficolombiana S.A |
| | |
| |
| | |
Porvenir S.A |
| | |
| |
| | |
The following tables show the VaR calculation relating to each of the risk factors described above and based on the Superintendency of Finance Methodology (Regulatory VaR) for the years ended December 31, 2022 and 2021, for a ten-day horizon for each of our Colombian banking subsidiaries. The minimum, maximum and average levels are determined based on end-of-month calculations, using 12 data points between January and December.
Banco de Bogotá S.A
Maximum, Minimum and Average VaR Values | ||||||||
December 31, 2022 | ||||||||
| Minimum |
| Average |
| Maximum |
| Period end | |
Interest rate | Ps. | | | | | |||
Exchange rate |
| | | | | |||
Shares |
| | | | | |||
Mutual funds |
| | | | | |||
Maximum, Minimum and Average VaR Values | ||||||||
December 31, 2021 | ||||||||
| Minimum |
| Average |
| Maximum |
| Period end | |
Interest rate | Ps. | |
| |
| |
| |
Exchange rate |
| |
| |
| |
| |
Shares |
| |
| |
| |
| |
Mutual funds |
| |
| |
| |
| |
Banco de Bogota´s market risk weighted assets remained on average
The main difference between December 2021 and December 2022 is because of the spin-off of BAC Holding, the details of which are explained in Note 1.1 Discontinued Operation BAC Holding.
F-114
Grupo Aval Acciones y Valores S.A.
Notes to the Consolidated Financial Statements
For the years ended December 31, 2022, 2021 and 2020
(Amounts expressed in millions of Colombian pesos)
Banco de Occidente S.A
Maximum, Minimum and Average VaR Values | ||||||||
December 31, 2022 | ||||||||
| Minimum |
| Average |
| Maximum |
| Period end | |
Interest rate | Ps. | | | | | |||
Exchange rate |
| | | | | |||
Shares |
| — | — | — | — | |||
Mutual funds |
| | | | | |||
Maximum, Minimum and Average VaR Values | ||||||||
December 31, 2021 | ||||||||
| Minimum |
| Average |
| Maximum |
| Period end | |
Interest rate | Ps. | |
| |
| |
| |
Exchange rate |
| |
| |
| |
| |
Shares |
| — |
| — |
| — |
| — |
Mutual funds |
| |
| |
| |
| |
Banco de Occidente´s market risk weighted assets remained on average
Banco Popular S.A
Maximum, Minimum and Average VaR Values | ||||||||
December 31, 2022 | ||||||||
| Minimum |
| Average |
| Maximum |
| Period end | |
Interest rate | Ps. | | | | | |||
Exchange rate |
| | | | | |||
Shares |
| | | | | |||
Mutual funds |
| | | | | |||
Maximum, Minimum and Average VaR Values | ||||||||
December 31, 2021 | ||||||||
| Minimum |
| Average |
| Maximum |
| Period end | |
Interest rate | Ps. | |
| |
| |
| |
Exchange rate |
| |
| |
| |
| |
Shares |
| |
| |
| |
| |
Mutual funds |
| |
| |
| |
| |
Banco Popular´s market risk weighted assets remained on average
Banco Comercial AV Villas S.A
Maximum, Minimum and Average VaR Values | ||||||||
December 31, 2022 | ||||||||
| Minimum |
| Average |
| Maximum |
| Period end | |
Interest rate | Ps. | | | | | |||
Exchange rate |
| | | | | |||
Shares |
| — | — | — | — | |||
Mutual funds |
| | | | | |||
Maximum, Minimum and Average VaR Values | ||||||||
December 31, 2021 | ||||||||
|
| Minimum |
| Average |
| Maximum |
| Period end |
Interest rate | Ps. | |
| |
| |
| |
Exchange rate |
| |
| |
| |
| |
Shares |
| — |
| — |
| — |
| — |
Mutual funds |
| |
| |
| |
| |
F-115
Grupo Aval Acciones y Valores S.A.
Notes to the Consolidated Financial Statements
For the years ended December 31, 2022, 2021 and 2020
(Amounts expressed in millions of Colombian pesos)
Banco AV Villas’ market risk weighted assets remained on average
Corficolombiana S.A
Maximum, Minimum and Average VaR Values | ||||||||
|---|---|---|---|---|---|---|---|---|
December 31, 2022 | ||||||||
| Minimum |
| Average |
| Maximum |
| Period end | |
Interest rate | Ps. | | | | | |||
Exchange rate |
| | | | | |||
Shares |
| | | | | |||
Mutual funds |
| | | | | |||
Maximum, Minimum and Average VaR Values | ||||||||
December 31, 2021 | ||||||||
| Minimum |
| Average |
| Maximum |
| Period end | |
Interest rate | Ps. | |
| |
| |
| |
Exchange rate |
| |
| |
| |
| |
Shares |
| |
| |
| |
| |
Mutual funds |
| |
| |
| |
| |
Corficolombiana’s market risk weighted assets remained on average
As a pension fund, Porvenir has a value-at-risk measurement methodology that differs from credit establishments and is established by the Superintendency of Finance. The following tables show the VaR calculation relating to each of the risk factors described above and based on that Methodology (Regulatory VaR) for the years ended December 31, 2022, and 2021, for a ten-day horizon.
Porvenir S.A
Maximum, Minimum and Average VaR Values | ||||||||
December 31, 2022 | ||||||||
| Minimum |
| Average |
| Maximum |
| Period end | |
Interest rate | Ps. | | | | | |||
Exchange rate |
| | | | | |||
Shares |
| | | | | |||
Mutual funds |
| | | | | |||
Maximum, Minimum and Average VaR Values | ||||||||
|---|---|---|---|---|---|---|---|---|
December 31, 2021 | ||||||||
| Minimum |
| Average |
| Maximum |
| Period end | |
Interest rate | Ps. | |
| |
| |
| |
Exchange rate |
| |
| |
| |
| |
Shares |
| |
| |
| |
| |
Mutual funds |
| |
| |
| |
| |
Porvenir’ market risk weighted assets remained on average
F-116
Grupo Aval Acciones y Valores S.A.
Notes to the Consolidated Financial Statements
For the years ended December 31, 2022, 2021 and 2020
(Amounts expressed in millions of Colombian pesos)
Investment Price Risk in Equity Instruments
Equity Investments
Variations in equity price risk measured based on the regulatory VaR methodology include both equity securities held for trading through profit or losses and non-strategic holdings. In addition, it does not discriminate between listed and unlisted equity investments or between those which consolidate and those which do not. It includes investments in non-financial institutions.
Holding periods for many of Corficolombiana’s equity investments exceed ten years. Its largest investments have remained in the portfolio for several years and are intended to remain as permanent investments. Therefore, no value at risk is estimated. At December 31, 2022 and 2021, the only investments subject to regulatory VaR were holdings in Mineros S.A.
The following table breaks down our investments subject to regulatory VaR by time since initial investments at December 31, 2022 and 2021.
At December 31, |
| ||||||||||||
2022 | 2021 |
| |||||||||||
| Investment |
|
|
| Investment |
|
|
| |||||
subject to | Percentage | subject to |
| ||||||||||
Regulatory | Regulatory | of | Regulatory | Regulatory | Percentage of |
| |||||||
VaR | VaR | portfolio | VaR | VaR | portfolio |
| |||||||
More than 36 months | Ps. | | | | % Ps. | | | | % | ||||
Total | Ps. | |
| |
| | % Ps. | |
| |
| | % |
4.2.3 Structural foreign exchange risk
Grupo Aval´s financial subsidiaries have agencies and subsidiaries offshore and have assets and liabilities in foreign currencies and are thus exposed to changes in the exchange rates, primarily the United States Dollar. Foreign exchange risk is present when there are assets and liabilities denominated in foreign currency, when investments are made in foreign subsidiaries and branches and when we extend loans or take funds in foreign currency. There is also foreign exchange risk in foreign currency off- balance sheet transactions.
Subsidiaries of the financial sector in Colombia are authorized by the country’s central bank (Banco de la República) to trade currencies and to maintain balances in foreign currency in accounts abroad. Colombian law allows for banks to maintain a net daily asset or liability position in foreign currency, determined as the difference in foreign currency denominated rights and foreign currency denominated obligations, including both on and off-balance sheet positions. On a separate basis, the average of this difference over three business days cannot exceed twenty percent (
The maximum and minimum total foreign currency position and the spot foreign currency position are determined according to each entity´s regulatory capital. The regulatory capital that is used in the calculations, corresponds to the regulatory capital of the last business day of the previous two-months. The exchange rate used in the calculation is the average of the exchange rate of the previous month set by the Superintendency of Finance.
A substantial amount of Grupo Aval’s foreign currency assets and liabilities are in U.S. dollars. Details on the assets and liabilities in foreign currency held by Grupo Aval as of December 31, 2022 and 2021 are shown below:
F-117
Grupo Aval Acciones y Valores S.A.
Notes to the Consolidated Financial Statements
For the years ended December 31, 2022, 2021 and 2020
(Amounts expressed in millions of Colombian pesos)
December 31,2022 |
| Other currencies | Total in | |||
U.S. dollars | converted to U.S. | Colombian pesos | ||||
Account |
| (Millions) |
| dollars (Millions) |
| (Millions) |
Financial assets |
|
|
| |||
Cash and cash equivalents | | | Ps. | | ||
Trading investments in debt securities | | — | | |||
Investments in debt securities at FVOCI | | — | | |||
Investments in debt securities at amortized cost | | — | | |||
Loan portfolio financial assets at amortized cost | | | | |||
Derivative financial assets held for trading | | — | | |||
Derivative financial assets held for hedging | | — | | |||
Trade receivable | | | | |||
Total financial assets | | | Ps. | | ||
|
| Other currencies |
| Total in | ||
U.S. dollars | converted to U.S. | Colombian pesos | ||||
Account | (Millions) | dollars (Millions) | (Millions) | |||
Financial liabilities |
|
|
| |||
Derivative financial liabilities held for trading | | — | | |||
Derivative financial liabilities held for hedging | — | — | | |||
Customer deposits | | | | |||
Financial obligations | | | | |||
Accounts payable | | — | | |||
Total financial liabilities | | | | |||
Net financial asset (liability) position | ( | | ( | |||
December 31,2021 |
| Other currencies | Total in | |||
U.S. dollars | converted to U.S. | Colombian pesos | ||||
Account |
| (Millions) |
| dollars (Millions) |
| (Millions) |
Financial assets |
|
|
| |||
Cash and cash equivalents | | | Ps. | | ||
Trading investments in debt securities | | | | |||
Investments in debt securities at FVOCI | | | | |||
Investments in debt securities at amortized cost | | — | | |||
Loan portfolio financial assets at amortized cost | | | | |||
Derivative financial assets held for trading | | — | | |||
Derivative financial assets held for hedging | | — | | |||
Trade receivable | | | | |||
Total financial assets | | | Ps. | | ||
|
| Other currencies |
| Total in | ||
| U.S. dollars |
| converted to U.S. |
| Colombian pesos | |
Account | (Millions) |
| dollars (Millions) |
| (Millions) | |
Financial liabilities |
|
|
|
|
|
|
Derivative financial liabilities held for trading | | — | Ps. | | ||
Derivative financial liabilities held for hedging | | — | | |||
Customer deposits | | | | |||
Financial obligations | | | | |||
Accounts payable | | — | | |||
Total financial liabilities |
| |
| | Ps. | |
Net financial asset (liability) position |
| ( |
| |
| ( |
Grupo Aval’s financial subsidiaries hedge their foreign exchange exposure using derivatives instruments, especially forwards. The net foreign currency position of each subsidiary is monitored on a daily basis.
Grupo Aval has a number of investments in foreign subsidiaries and branches whose net assets are exposed to foreign exchange risk because of the translation of gains or losses for the purpose of consolidating their financial statements. The exposure arising from net assets in foreign operations is hedged primarily with financial obligations, bonds and foreign exchange derivative instruments.
F-118
Grupo Aval Acciones y Valores S.A.
Notes to the Consolidated Financial Statements
For the years ended December 31, 2022, 2021 and 2020
(Amounts expressed in millions of Colombian pesos)
The following table presents sensitivities of profit or loss before taxes and equity (OCI) to reasonably possible changes in exchange rates applied at the end of the reporting period relative to the functional currency of the respective Group entities, with all other variables held constant:
December 31,2022 |
| Increase |
| Decrease | ||
|---|---|---|---|---|---|---|
Ps.100 per U.S. | Ps.100 per U.S. | |||||
dollar | dollar | |||||
Equity (mainly OCI) (1) |
| Ps. | |
| Ps. | ( |
Profit and loss before taxes |
|
| ( |
|
| |
December 31,2021 |
| Increase |
| Decrease | ||
|---|---|---|---|---|---|---|
Ps.100 per U.S. | Ps.100 per U.S. | |||||
dollar | dollar | |||||
Equity (mainly OCI) (1) |
| Ps. | |
| Ps. | ( |
Profit and loss before taxes |
|
| |
|
| ( |
| (1) | The effect produced by the spin-off of BAC Holding is excluded from this sensitivities analyses to make the results of December 2022 and December 2021 comparable. |
The sensitivity in equity considers mainly assets and liabilities of entities with functional currencies different from the Group’s presentation currency compensated with derivatives and financial labilities designated to hedge net investments in foreign operations. For the purposes of presenting the results for the year 2022, the figures for 2021 have been adjusted, excluding assets and liabilities with a functional currency other than Colombian pesos and which, in turn, are offset with derivatives and financial liabilities from BAC Holding and MFH.
The sensitivity in profit or loss was calculated for monetary assets and liabilities denominated in currencies other than the functional currency of the respective entities of the Group, including intercompany balances which are not hedged. The Group’s exposure to currency risk at the end of the reporting period is not representative of the typical exposure during the year.
4.2.4 Structural Interest Rate Risk
Non-trading instruments consist primarily of loans and deposits. The net interest margin of our financial subsidiaries may be affected by changes in interest rates. Losses can result from unexpected movements in interest rates. For this reason, our financial subsidiaries monitor the interest rate risk daily and set limits on asset and liability mismatches.
Grupo Aval´s financial subsidiaries monitor their interest rate risk daily and set limits to repricing mismatches between assets and liabilities. They analyze their interest rate exposure in a dynamic way. Scenario modelling considers renewal of existing positions, financing alternatives, and hedges. Considering these scenarios, the financial subsidiaries calculate the profit and loss impact of changes in interest rates.
The following table shows interest rates exposure for assets and liabilities at December 31, 2022 and 2021. In this table, fixed rate instruments are classified according to their maturity date and floating rate instruments are classified according to their repricing date. The following analysis includes the interest rate exposure of non-interest-bearing and interest-bearing assets and liabilities by maturity bucket for our financial subsidiaries:
F-119
Grupo Aval Acciones y Valores S.A.
Notes to the Consolidated Financial Statements
For the years ended December 31, 2022, 2021 and 2020
(Amounts expressed in millions of Colombian pesos)
December 31, 2022
| Less than |
| From one to |
| From six to |
| More than a |
| Non- |
| ||||||||
Assets | one month | six months | twelve months | year | interest | Total | ||||||||||||
Cash and cash equivalents | Ps. | | Ps. | — | Ps. | — | Ps. | — | Ps. | | Ps. | | ||||||
Trading investments in debt securities | | | | | — | | ||||||||||||
Investments in debt securities mandatorily at FVTPL | — | — | — | | — | | ||||||||||||
Investments in debt securities at FVOCI | | | | | — | | ||||||||||||
Investments in debt securities at amortized cost | | | | | — | | ||||||||||||
Trade receivable at FVTPL | — | — | — | | — | | ||||||||||||
Commercial loans | | | | | — | | ||||||||||||
Consumer loans | | | | | — | | ||||||||||||
Mortgages loans | | | | | — | | ||||||||||||
Microcredit loans | | | | | — | | ||||||||||||
Interbank and overnight founds | | | — | — | — | | ||||||||||||
Trade receivable | — | | — | | | | ||||||||||||
Total Assets | Ps. | | Ps. | | Ps. | | Ps. | | Ps. | | Ps. | | ||||||
— | ||||||||||||||||||
| Less than |
| From one to |
| From six to |
| More than a |
| Non- |
|
| |||||||
Liabilities | one month | six months | twelve months | year | interest | Total | ||||||||||||
Checking accounts | Ps. | | Ps. | — | Ps. | — | Ps. | — | Ps. | | Ps. | | ||||||
Time deposits | | | | | — | | ||||||||||||
Saving deposits | | — | — | — | — | | ||||||||||||
Other deposits | — | — | — | — | | | ||||||||||||
Interbank and overnight funds | | | | | — | | ||||||||||||
Leases contracts | | | | | — | | ||||||||||||
Borrowing from banks and similar | | | | | — | | ||||||||||||
Long-term debt | | | | | — | | ||||||||||||
Borrowing from development entities | | | | | — | | ||||||||||||
Total Liabilities | Ps. | | Ps. | | Ps. | | Ps. | | Ps. | | Ps. | | ||||||
December 31, 2021
Less than | From one to | From six to | More than a | Non- |
| |||||||||||||
|---|---|---|---|---|---|---|---|---|---|---|---|---|---|---|---|---|---|---|
Assets | one month | six months | twelve months | year | interest | Total | ||||||||||||
Cash and cash equivalents | Ps. | | Ps. | — | Ps. | — | Ps. | — | Ps. | | Ps. | | ||||||
Trading investments in debt securities | | | | | — | | ||||||||||||
Investments in debt securities mandatorily at FVTPL | — | — | — | — | — | — | ||||||||||||
Investments in debt securities at FVOCI | | | | | — | | ||||||||||||
Investments in debt securities at amortized cost | | | | | — | | ||||||||||||
Trade receivable at FVTPL | — | — | — | | — | | ||||||||||||
Commercial loans | | | | | — | | ||||||||||||
Consumer loans | | | | | — | | ||||||||||||
Mortgages loans | | | | | — | | ||||||||||||
Microcredit loans | | | | | — | | ||||||||||||
Interbank and overnight founds | | | — | — | — | | ||||||||||||
Trade receivable | — | | — | | | | ||||||||||||
Total Assets | Ps. | | Ps. | | Ps. | | Ps. | | Ps. | | Ps. | | ||||||
| Less than |
| From one to |
| From six to |
| More than a |
| Non- |
| ||||||||
Liabilities | one month | six months | twelve months | year | interest | Total | ||||||||||||
Checking accounts | Ps. | | Ps. | — | Ps. | — | Ps. | — | Ps. | | Ps. | | ||||||
Time deposits | | | | | — | | ||||||||||||
Saving deposits | | — | — | — | . | — | | |||||||||||
Other deposits | | | — | — | | | ||||||||||||
Interbank and overnight funds | | | | | — | | ||||||||||||
Leases contracts | | | | | — | | ||||||||||||
Borrowing from banks and similar | | | | | — | | ||||||||||||
Long-term debt | | | | | — | | ||||||||||||
Borrowing from development entities | | | | | — | | ||||||||||||
Total Liabilities | Ps. | | Ps. | | Ps. | | Ps. | | Ps. | | Ps. | | ||||||
F-120
Grupo Aval Acciones y Valores S.A.
Notes to the Consolidated Financial Statements
For the years ended December 31, 2022, 2021 and 2020
(Amounts expressed in millions of Colombian pesos)
As part of their interest rate risk management process, our financial subsidiaries analyze the interest rate mismatches between their interest-earning assets and their interest-earning liabilities. This sensitivity analysis, based on hypothetical changes, assumes that the composition of Grupo Aval´s statement of financial position remains constant over the period being measured.
The following analysis estimates the impact of an accounting sensitivity of outstanding balances of financial assets and financial liabilities to variations in interest rates at December 31, 2022. The analysis assumes constant market parameters, without including the effects of discretional customer decisions and changes in macroeconomic fundamentals over financial assets and liabilities. As a result, if interest rates were to increase
The following is a breakdown of non-interest-bearing and interest-bearing assets and liabilities by interest rate type and by maturity, as at December 31, 2022 and 2021.
December 31, 2022
Under one year | Over one year | Non- | ||||||||||||||||
Assets |
| Variable |
| Fixed |
| Variable |
| Fixed |
| interest |
| Total | ||||||
Cash due from banks and Central Bank | Ps. | | Ps. | | Ps. | — | Ps. | — | Ps. | | Ps. | | ||||||
Trading investments in debt securities | | | | | — | | ||||||||||||
Investments in debt securities mandatorily at FVTPL | — | — | — | | — | | ||||||||||||
Investments in debt securities at FVOCI | | | | | — | | ||||||||||||
Investments in debt securities at amortized cost | | | | | — | | ||||||||||||
Trade receivable at FVTPL | — | — | | — | — | | ||||||||||||
Commercial loans | | | | | — | | ||||||||||||
Consumer loans | | | | | — | | ||||||||||||
Mortgages loans | | | | | — | | ||||||||||||
Microcredit loans | | | | | — | | ||||||||||||
Interbank and overnight founds | | | — | — | — | | ||||||||||||
Trade receivable | | — | | | | | ||||||||||||
Total Assets | Ps. | | Ps. | | Ps. | | Ps. | | Ps. | | Ps. | | ||||||
Under one year | Over one year | Non- | ||||||||||||||||
Liabilities |
| Variable |
| Fixed |
| Variable |
| Fixed |
| interest |
| Total | ||||||
Checking accounts | Ps. | | Ps. | | Ps. | — | Ps. | — | Ps. | | Ps. | | ||||||
Time deposits | | | | | — | | ||||||||||||
Saving deposits | | | | — | — | | ||||||||||||
Other deposits | — | — | — | — | | | ||||||||||||
Interbank and overnight funds | | | | — | — | | ||||||||||||
Leases contracts | | | | | — | | ||||||||||||
Borrowing from banks and other | | | | | — | | ||||||||||||
Long-term debt | | | | | — | | ||||||||||||
Borrowing from development entities | | | | | — | | ||||||||||||
Total Liabilities | Ps. | | Ps. | | Ps. | | Ps. | | Ps. | | Ps. | | ||||||
F-121
Grupo Aval Acciones y Valores S.A.
Notes to the Consolidated Financial Statements
For the years ended December 31, 2022, 2021 and 2020
(Amounts expressed in millions of Colombian pesos)
December 31, 2021
Under one year | Over one year | Non- | ||||||||||||||||
Assets |
| Variable |
| Fixed |
| Variable |
| Fixed |
| interest |
| Total | ||||||
Cash due from banks and Central Bank | Ps. | | Ps. | | Ps. | — | Ps. | — | Ps. | | Ps. | | ||||||
Trading investments in debt securities | | | | | — | | ||||||||||||
Investments in debt securities mandatorily at FVTPL | — | — | — | — | — | — | ||||||||||||
Investments in debt securities at FVOCI | | | | | — | | ||||||||||||
Investments in debt securities at amortized cost | | | | | — | | ||||||||||||
Trade receivable at FVTPL | — | — | | — | — | | ||||||||||||
Commercial loans | | | | | — | | ||||||||||||
Consumer loans | | | | | — | | ||||||||||||
Mortgages loans | | | | | — | | ||||||||||||
Microcredit loans | | | | | — | | ||||||||||||
Interbank and overnight founds | | | — | — | — | | ||||||||||||
Trade receivable | | — | | | | | ||||||||||||
Total Assets | Ps. | | Ps. | | Ps. | | Ps. | | Ps. | | Ps. | | ||||||
Under one year | Over one year | Non- | ||||||||||||||||
Liabilities |
| Variable |
| Fixed |
| Variable |
| Fixed |
| interest |
| Total | ||||||
Checking accounts | Ps. | | Ps. | | Ps. | — | Ps. | — | Ps. | | Ps. | | ||||||
Time deposits | | | | | — | | ||||||||||||
Saving deposits | | | — | — | . | — | | |||||||||||
Other deposits | | | — | — | | | ||||||||||||
Interbank and overnight funds | | | — | | — | | ||||||||||||
Leases contracts | | | | | — | | ||||||||||||
Borrowing from banks and other | | | | | — | | ||||||||||||
Long-term debt | | | | | — | | ||||||||||||
Borrowing from development entities | | | | | — | | ||||||||||||
Total Liabilities | Ps. | | Ps. | | Ps. | | Ps. | | Ps. | | Ps. | | ||||||
4.3 Liquidity Risk
Liquidity risk management has always been a basic element of Grupo Aval’s business strategy and a fundamental cornerstone, together with capital, on which the strength of its balance sheet rests. Liquidity risk is related to the inability of Grupo Aval´s subsidiaries to fulfill their obligations with customers, financial market counterparties, lenders, suppliers, authorities or other stakeholders at any given moment, in any currency and in any location.
Structural liquidity management aims to finance the recurring nature of a company’s activities under optimal terms of time and cost, avoiding taking unwanted liquidity risks. At Grupo Aval, the financing and liquidity model is decentralized and based on autonomous subsidiaries that are responsible for covering their own liquidity needs. Therefore, each entity reviews its available resources on a daily basis in order to control its liquidity risk.
The financial subsidiaries of Grupo Aval are responsible for complying with the regulatory liquidity requirements, as well as meeting the obligations arising from their current and future activity. In consequence, they will either take deposits from their customers, or by resorting to the wholesale markets where they operate. Grupo Aval’s financial subsidiaries have a strong capacity as well as to raise funds in the wholesale markets.
Financial subsidiaries comply with the requirements for liquidity risk management of the jurisdictions in which they operate. They define policies that govern the functions of identification, measurement, control and monitoring required to manage daily liquidity requirements, comply with minimum liquidity buffers and establish liquidity contingency plans to deal with any unexpected situation.
Financial subsidiaries controlled by Grupo Aval, in Colombia, are required to maintain adequate liquidity positions based on the Superintendency of Finance’s liquidity parameters, using a short-term liquidity index (Indicador de Riesgo de Liquidez), or “IRL,”
F-122
Grupo Aval Acciones y Valores S.A.
Notes to the Consolidated Financial Statements
For the years ended December 31, 2022, 2021 and 2020
(Amounts expressed in millions of Colombian pesos)
that measures liquidity for different time horizons from 1 to 90 days. This index is defined as the difference between adjusted liquid assets and net liquidity requirements.
| • | Liquid assets include total debt securities adjusted by market liquidity and exchange rate, excluding investment securities at amortized cost different from mandatory investments, Central Bank deposits and available cash. |
| • | Net liquidity requirements are the difference between expected contractual asset and contractual and non-contractual liability cash flows. Cash flows from past due loans are not included in this calculation. |
During 2020, as part of its convergence towards Basel III standards, the Superintendency of Finance incorporates the segmentation by type of deposits in the calculation of non-contractual liability cash flows. The methodology segments saving deposits in eight categories, according with their balance and the type of customer, then calculates the run-off rate for each category and finally multiplies both to determine the non-contractual reserve.
Grupo Aval´s financial subsidiaries assess the volatility of deposits, debt levels, the asset and liability structure, the liquidity of different asset types, the availability of lines of credit and the effectiveness of asset and liability management. The objective is to have adequate liquidity to manage possible stress scenarios.
The quantification of appropriate money market funding levels is an integral part of the liquidity measurement carried out by each entity. Based on statistical analysis, primary and secondary sources of liquidity are identified in order to ensure funding stability and diversification, and to minimize concentration.
Financial subsidiaries in Colombia must maintain cash on hand and in Central Banks deposits in order to comply with reserve requirements. The calculation of the reserve requirement is based on the daily average of the different types of deposits every two weeks. This requirement is
There are no reserve requirements for our subsidiaries located in Panamá because there is no Central Bank to regulate such requirements.
The following is a breakdown of the liquid assets by maturity from 1 to 90 days, based on separate figures of our financial subsidiaries in Colombia at December 31, 2022 and 2021:
December 31, 2022
| Liquid assets |
|
|
| ||||
available at the end | From 31 to 90 | |||||||
Bank | of the year (1) | From 1 to 7 days (2) | From 1 to 30 days (2) | days (2) | ||||
Banco de Bogota | Ps. | | Ps. | | Ps. | | Ps. | ( |
Banco Occidente |
| | | | ( | |||
Banco Popular |
| | | | ( | |||
Banco AV Villas |
| | | | ( | |||
Corficolombiana |
| | | | ( |
December 31, 2021
| Liquid assets |
|
|
| ||||
| available at the end |
| From 31 to 90 | |||||
Bank |
| of the year (1) | From 1 to 7 days (2) | From 1 to 30 days (2) | days (2) | |||
Banco de Bogota | Ps. | | Ps. | | Ps. | | Ps. | ( |
Banco Occidente |
| |
| |
| |
| ( |
Banco Popular |
| |
| |
| |
| ( |
Banco AV Villas |
| |
| |
| |
| ( |
Corficolombiana |
| |
| |
| |
| |
| (1) | Liquid assets are the sum of assets that are easily convertible into cash. Fixed income investments at amortized cost and financial investments pledged as collateral or subject to any other type of encumbrance, preventive measure or of any nature, that prevent their free assignment or transfer, as well as those that have been transferred under repurchase agreements, simultaneous or temporary transfer of securities are excluded. The value of the liquid assets mentioned above is calculated at the market price of the fair value on the date of the evaluation. |
| (2) | This amount is the remaining value of the liquid assets in the specified time period, or the IRL, that is calculated as the difference between liquid assets and liquid assets requirement, according to the IRL methodology, the liquidity requirement is the difference of contractual cash inflows and contractual and non-contractual cash outflows during a given period. |
F-123
Grupo Aval Acciones y Valores S.A.
Notes to the Consolidated Financial Statements
For the years ended December 31, 2022, 2021 and 2020
(Amounts expressed in millions of Colombian pesos)
The following tables show the consolidated IRL Ratio as of December 31, 2022 and 2021 for each of our banks in Colombia and Corficolombiana, expressed in Ps billions and as a percentage:
| At December 31, | |||||||||||||||||||
Banco de Bogotá |
| Banco de Occidente |
| Banco Popular |
| Banco AV Villas |
| Corficolombiana | ||||||||||||
| 2022 |
| 2021 |
| 2022 |
| 2021 |
| 2022 |
| 2021 |
| 2022 |
| 2021 |
| 2022 |
| 2021 | |
(in Ps) | ||||||||||||||||||||
IRL – 7 days | | | | | | | | | | | ||||||||||
IRL – 30 days | | | | | | | | | | | ||||||||||
| At December 31, | |||||||||||||||||||
| Banco de Bogotá |
| Banco de Occidente |
| Banco Popular |
| Banco AV Villas |
| Corficolombiana | |||||||||||
| 2022 |
| 2021 |
| 2022 |
| 2021 |
| 2022 |
| 2021 |
| 2022 |
| 2021 |
| 2022 |
| 2021 | |
(in percentages) | ||||||||||||||||||||
IRL – 7 days | |
| | . | |
| | |
| | |
| | |
| | ||||
IRL – 30 days | |
| | |
| | |
| | |
| | |
| | |||||
Supervised entities are required to calculate and report to the SFC on a weekly basis an indicator of short-term liquidity risk. The Liquidity Risk Indicator (IRL) is calculated in periods of 7 and 30 days and must be at least 100 percent. During 2022, Grupo Aval's Colombian banks met the minimum regulatory requirement.
The liquidity calculations described above assume normal liquidity conditions, according to the contractual flows and historical experience of each of the financial subsidiaries. for extreme liquidity events caused by unusual deposit withdrawals, the financial subsidiaries have contingency plans that include available credit lines with other financial institutions and access to special lines of credit with Colombia´s Central Bank, in accordance with current regulations. These lines of credit are granted when required, and are collateralized by Colombian government securities or by a portfolio of high-quality loans, as specified in the Central Bank regulations. Grupo Aval´s financial subsidiaries did not access the Central Bank special lines of credit during the years ended at December 31, 2022 and 2021.
The banks in each country are responsible for their liquidity position on a stand-alone basis. They have access to funding mechanisms with their central banks, and to funding through credit lines. Short-term credits are offered by correspondent banks and financing is granted by multilateral organizations, among others.
F-124
Grupo Aval Acciones y Valores S.A.
Notes to the Consolidated Financial Statements
For the years ended December 31, 2022, 2021 and 2020
(Amounts expressed in millions of Colombian pesos)
The following is a breakdown shows the contractual undiscounted cash flows of the financial assets and liabilities including contractual interest receivable and payable at December 31, 2022 and 2021.
December 31, 2022
Less than | From one to six | From six to twelve | More than |
| |||||||||||
Assets |
| one month |
| months |
| months |
| a year |
| Total | |||||
Cash and cash equivalents | Ps. | | Ps. | | Ps. | — | Ps. | — | Ps. | | |||||
Trading investments in debt securities | | | | | | ||||||||||
Investments in debt securities at FVOCI | | | | | | ||||||||||
Investments in debt securities at amortized cost | | | | | | ||||||||||
Commercial loans | | | | | | ||||||||||
Consumer loans | | | | | | ||||||||||
Mortgages loans | | | | | | ||||||||||
Microcredit loans | | | | | | ||||||||||
Interbank and overnight funds | | | — | — | | ||||||||||
Trading derivatives | | | | | | ||||||||||
Hedging derivatives | | | | | | ||||||||||
Trade receivable | | | | | | ||||||||||
Other assets | | — | | | | ||||||||||
Total Assets | Ps. | | Ps. | | Ps. | | Ps. | | Ps. | | |||||
Less than | From one to six | From six to twelve | More than |
| |||||||||||
Liabilities |
| one month |
| months |
| months |
| a year |
| Total | |||||
Checking accounts | Ps. | | Ps. | — | Ps. | — | Ps. | — | Ps. | | |||||
Time Deposits | | | | | | ||||||||||
Saving deposits | | — | — | — | | ||||||||||
Other deposits | | | — | | | ||||||||||
Interbank and overnight funds | | | | | | ||||||||||
Leases contracts | | | | | | ||||||||||
Borrowing from banks and other | | | | | | ||||||||||
Long-term debt | | | | | | ||||||||||
Borrowing from development entities | | | | | | ||||||||||
Trading derivatives | | | | | | ||||||||||
Hedging derivatives | | | — | | | ||||||||||
Other liabilities | | | — | | | ||||||||||
Total Liabilities | Ps. | | Ps. | | Ps. | | Ps. | | Ps. | | |||||
Less than one | From one to | From six to | More than a | ||||||||||||
Commitments Loans | month | six months | twelve months | year | Total | ||||||||||
Guarantees | Ps. | | Ps. | | Ps. | | Ps. | | Ps. | | |||||
Standby letters of credit | | | — | | | ||||||||||
Overdraft facility | | — | — | — | | ||||||||||
Standby credit card facility | | | | | | ||||||||||
Undrawn approved loans | | | — | — | | ||||||||||
Others | | — | — | — | | ||||||||||
Total Commitments Loans | Ps. | | Ps. | | Ps. | | Ps. | | Ps. | | |||||
F-125
Grupo Aval Acciones y Valores S.A.
Notes to the Consolidated Financial Statements
For the years ended December 31, 2022, 2021 and 2020
(Amounts expressed in millions of Colombian pesos)
December 31, 2021
Less than one | From one to | From six to | More than a | ||||||||||||
Assets |
| month |
| six months |
| twelve months |
| year |
| Total | |||||
Cash and cash equivalents | Ps. | | Ps. | — | Ps. | — | Ps. | — | Ps. | | |||||
Trading investments in debt securities | | | | | | ||||||||||
Investments in debt securities at FVOCI | | | | | | ||||||||||
Investments in debt securities at amortized cost | | | | | | ||||||||||
Commercial loans | | | | | | ||||||||||
Consumer loans | | | | | | ||||||||||
Mortgages loans | | | | | | ||||||||||
Microcredit loans | | | | | | ||||||||||
Interbank and overnight funds | | | — | — | | ||||||||||
Trading derivatives | | | | | | ||||||||||
Hedging derivatives | | | | | | ||||||||||
Trade receivable | | | — | | | ||||||||||
Other assets | | | — | | | ||||||||||
Total Assets | Ps. | | Ps. | | Ps. | | Ps. | | Ps. | | |||||
Less than one | From one to | From six to | More than a | ||||||||||||
Liabilities |
| month |
| six months |
| twelve months |
| year |
| Total | |||||
Checking accounts | Ps. | | Ps. | — | Ps. | — | Ps. | — | Ps. | | |||||
Time Deposits | | | | | | ||||||||||
Saving deposits | | — | — | — | | ||||||||||
Other deposits | | | — | | | ||||||||||
Interbank and overnight funds | | | | | | ||||||||||
Leases contracts | | | | | | ||||||||||
Borrowing from banks and other | | | | | | ||||||||||
Long-term debt | | | | | | ||||||||||
Borrowing from development entities | | | | | | ||||||||||
Trading derivatives | | | | | | ||||||||||
Hedging derivatives | | | — | | | ||||||||||
Other liabilities | | | — | | | ||||||||||
Total Liabilities | Ps. | | Ps. | | Ps. | | Ps. | | Ps. | | |||||
Less than one | From one to | From six to | More than a | ||||||||||||
Commitments Loans |
| month |
| six months |
| twelve months |
| year |
| Total | |||||
Guarantees | Ps. | | Ps. | | Ps. | | Ps. | | Ps. | | |||||
Standby letters of credit | | | | — | | ||||||||||
Overdraft facility | | — | — | — | | ||||||||||
Standby credit card facility | | | | | | ||||||||||
Undrawn approved loans | | | — | — | | ||||||||||
Others | — | — | — | | | ||||||||||
Total Commitments Loans | Ps. | | Ps. | | Ps. | | Ps. | | Ps. | | |||||
4.4 Regulatory capital management
Grupo Aval, Financial Holding
As a result of Colombian Law 1870 of 2017 (also known as the Financial Conglomerates Law), that came in effect on February 6, 2019, Grupo Aval has become subject to the inspection and supervision of the Superintendency of Finance (SFC, for its acronym in Spanish). This law created the legal categories of financial holding companies and of financial conglomerates, and gives the Colombian Finance minister the power, to impose capital adequacy requirements on the financial conglomerates on an aggregate/consolidated basis, among others.
In compliance with Decree 774 issued on May 8th, 2018 by the Colombian Government that came in effect on 8th of November 2019 and the External Circular 012 of June 5, 2019 (in Spanish Circular Externa 012 del 5 de junio de 2019) issued by the Superintendency of Finance (SFC), Grupo Aval is subject to minimum capital requirements. As of December 31, 2022, and 2021, Grupo Aval as a Financial Conglomerate, complied with regulatory capital requirements.
F-126
Grupo Aval Acciones y Valores S.A.
Notes to the Consolidated Financial Statements
For the years ended December 31, 2022, 2021 and 2020
(Amounts expressed in millions of Colombian pesos)
Grupo Aval’s financial subsidiaries
Decree 2555 of 2010 (as modified by Decree 1771 of 2012, Decree 1648 of 2014, Decree 2392 of 2015, Decrees 1477 of 2018 and 1421 of 2019) sets forth capital adequacy requirements for Colombian credit institutions. Starting on January 1, 2021, technical capital for Colombian credit institutions consisted of the sum of total Core Equity Tier I (CET1 or patrimonio básico ordinario), Additional Tier I capital (AT1 or patrimonio básico adicional), and Tier II capital (Tier II or patrimonio adicional). Tier I capital consist of the sum of CET1 (patrimonio básico ordinario) and AT1 (patrimonio básico adicional). Tier I and Tier II, as defined herein, may differ to the manner in which these terms are used in other jurisdictions.
Pursuant to Decrees 1477 of 2018 and 1421 of 2019 Basel III principles were introduced to estimate adequate capital in credit institutions as follows:
| ● | Total solvency ratio is defined as the value of the technical capital (CET1, AT1 and T2) calculated under the terms of the Decree 1477 of 2018 and the Decree 1421 of 2019, divided by risk-weighted assets by level of credit, market and operational risk, at a minimum of |
| ● | A minimum CET1 of |
| ● | A minimum Tier I of |
| ● | A capital conservation buffer of |
| ● | A systemic risk buffer of |
| ● | In addition, these Decrees established a minimum leverage ratio of |
These indicators (with the exception of the leverage ratio) must be achieved gradually from 2021 to 2024, in accordance with the transition plan established in the regulation. Banco de Bogotá is considered one of the systemically important financial institutions, according to Circular Externa 76 of December 2, 2020 issued by the Superintendency of Finance, and therefore must comply with the systemic buffer (explained above).
The following chart presents the statutory transition period as set forth in the Decrees 1477 of 2018 and 1421 of 2019:
(1)Requires highest quality of capital.
(2)Only apply to SIFIs as defined by the Superintendency of Finance. The Circular Letters 76 of 2020 and 72 of 2021 issued by the Superintendency of Finance, published the list of SIFIs for the year 2021 and 2022, which only included Banco de Bogotá among our Colombian banking subsidiaries, in accordance with the methodology defined for the identification of entities with systemic importance (External Circular 030 of 2019 issued by the same Superintendency).
F-127
Grupo Aval Acciones y Valores S.A.
Notes to the Consolidated Financial Statements
For the years ended December 31, 2022, 2021 and 2020
(Amounts expressed in millions of Colombian pesos)
As of December 31 2022, and 2021, all of Grupo Aval´s financial subsidiaries complied with the minimum regulatory capital requirements, as demonstrated in a table below:
Banco de Bogotá S.A.
At December 31, |
| ||||||
| 2022 |
| 2021 |
| |||
Subscribed and paid-in capital | Ps. | | Ps. | | |||
Reserves and retained earnings |
| |
| | |||
Other comprehensive income |
| |
| | |||
Net income for the period | | | |||||
Non-controlling interests | — | — | |||||
Deductions: |
|
| |||||
Unconsolidated financial sector investments |
| ( |
| ( | |||
Goodwill and other intangibles |
| ( |
| ( | |||
Deferred tax assets |
| ( |
| ( | |||
Other |
| ( |
| — | |||
CET1 | Ps. | | Ps. | | |||
Hybrid instruments recognized as additional primary capital | — | | |||||
Other | — | — | |||||
AT1 | — | | |||||
Tier I | Ps. | | Ps. | | |||
Subordinated bonds |
| |
| | |||
Plus/minus others |
| — |
| — | |||
Tier II capital | Ps. | | Ps. | | |||
Other deductions from technical capital |
| — |
| ( | |||
Technical capital | Ps. | | Ps. | | |||
Risk-weighted assets |
| |
| | |||
Value at risk |
| |
| | |||
Regulatory value at risk(1) |
| |
| | |||
Operational risk | | | |||||
Regulatory operational risk(1) | |
| | ||||
Risk-weighted assets including regulatory value at risk and operational risk |
| | | ||||
CET1 solvency ratio |
| ||||||
AT1 capital solvency ratio | |||||||
Tier 1 capital solvency ratio | |||||||
Tier II solvency ratio |
| ||||||
Total solvency ratio(2) |
| ||||||
(1) Regulatory value at risk consists of value at risk multiplied by (100/9) as required by the Superintendency of Finance. Regulatory operational risk consists of operational risk multiplied by (100/9) as required by the Superintendency of Finance.
(2) Solvency ratio is calculated as technical capital to risk-weighted assets, including regulatory value at risk and regulatory operational risk.
F-128
Grupo Aval Acciones y Valores S.A.
Notes to the Consolidated Financial Statements
For the years ended December 31, 2022, 2021 and 2020
(Amounts expressed in millions of Colombian pesos)
Banco de Occidente S.A.
At December 31, |
| ||||||
|---|---|---|---|---|---|---|---|
| 2022 |
| 2021 |
| |||
Subscribed and paid-in capital | Ps. | | Ps. | | |||
Reserves and retained earnings |
| |
| | |||
Other comprehensive income |
| ( |
| | |||
Net income for the period | | | |||||
Non-controlling interests | — | — | |||||
Deductions: |
|
| |||||
Unconsolidated financial sector investments |
| ( |
| ( | |||
Goodwill and other intangibles |
| ( |
| ( | |||
Deferred tax assets |
| — |
| ( | |||
Other |
| ( |
| ( | |||
CET1 | Ps. | | Ps. | | |||
Hybrid instruments recognized as additional primary capital | — | — | |||||
Other | — | — | |||||
AT1 | — | — | |||||
Tier I | Ps. | | Ps. | | |||
Subordinated bonds |
| |
| | |||
Plus/minus others |
| — |
| — | |||
Tier II capital | Ps. | | Ps. | | |||
Other deductions from technical capital |
| — |
| — | |||
Technical capital | Ps. | | Ps. | | |||
Risk-weighted assets |
| |
| | |||
Value at risk |
| |
| | |||
Regulatory value at risk(1) |
| |
| | |||
Operational risk | | | |||||
Regulatory operational risk(1) | |
| | ||||
Risk-weighted assets including regulatory value at risk and operational risk |
| |
| | |||
CET1 solvency ratio |
| ||||||
AT1 capital solvency ratio | |||||||
Tier 1 capital solvency ratio |
| ||||||
Tier II solvency ratio |
| ||||||
Total solvency ratio(2) | |||||||
(1) Regulatory value at risk consists of value at risk multiplied by (100/9) as required by the Superintendency of Finance. Regulatory operational risk consists of operational risk multiplied by (100/9) as required by the Superintendency of Finance.
(2) Solvency ratio is calculated as technical capital to risk-weighted assets, including regulatory value at risk and regulatory operational risk.
F-129
Grupo Aval Acciones y Valores S.A.
Notes to the Consolidated Financial Statements
For the years ended December 31, 2022, 2021 and 2020
(Amounts expressed in millions of Colombian pesos)
Banco Popular S.A.
At December 31, |
| ||||||
| 2022 |
| 2021 |
| |||
Subscribed and paid-in capital | Ps. | | Ps. | | |||
Reserves and retained earnings |
| |
| | |||
Other comprehensive income |
| |
| | |||
Net income for the period | | | |||||
Non-controlling interests | | | |||||
Deductions: |
|
| |||||
Unconsolidated financial sector investments |
| ( |
| ( | |||
Goodwill and other intangibles |
| ( |
| ( | |||
Deferred tax assets |
| — |
| — | |||
Other |
| ( |
| ( | |||
CET1 | Ps. | | Ps. | | |||
Hybrid instruments recognized as additional primary capital | — | — | |||||
Other | — | — | |||||
AT1 | — | — | |||||
Tier I | Ps. | | Ps. | | |||
Subordinated bonds |
| |
| | |||
Plus/minus others |
| — |
| — | |||
Tier II capital | Ps. | | Ps. | | |||
Other deductions from technical capital |
| — |
| — | |||
Technical capital | Ps. | | Ps. | | |||
Risk-weighted assets |
| |
| | |||
Value at risk |
| |
| | |||
Regulatory value at risk(1) |
| |
| | |||
Operational risk | | | |||||
Regulatory operational risk(1) | |
| | ||||
Risk-weighted assets including regulatory value at risk and operational risk |
| |
| | |||
CET1 solvency ratio |
| ||||||
AT1 capital solvency ratio | |||||||
Tier 1 capital solvency ratio |
| ||||||
Tier II solvency ratio |
| ||||||
Total solvency ratio(2) | |||||||
(1) Regulatory value at risk consists of value at risk multiplied by (100/9) as required by the Superintendency of Finance. Regulatory operational risk consists of operational risk multiplied by (100/9) as required by the Superintendency of Finance.
(2) Solvency ratio is calculated as technical capital to risk-weighted assets, including regulatory value at risk and regulatory operational risk.
F-130
Grupo Aval Acciones y Valores S.A.
Notes to the Consolidated Financial Statements
For the years ended December 31, 2022, 2021 and 2020
(Amounts expressed in millions of Colombian pesos)
Banco Comercial AV Villas S.A.
At December 31, |
| ||||||
| 2022 |
| 2021 |
| |||
Subscribed and paid-in capital | Ps. | | Ps. | | |||
Reserves and retained earnings |
| |
| | |||
Other comprehensive income |
| ( |
| | |||
Net income for the period | | | |||||
Non-controlling interests | — | — | |||||
Deductions: |
|
| |||||
Unconsolidated financial sector investments |
| — |
| — | |||
Goodwill and other intangibles |
| ( |
| ( | |||
Deferred tax assets |
| — |
| ( | |||
Other |
| ( |
| ( | |||
CET1 | Ps. | | Ps. | | |||
Hybrid instruments recognized as additional primary capital | — | — | |||||
Other | | | |||||
AT1 | | | |||||
Tier I | Ps. | | Ps. | | |||
Subordinated bonds |
| — |
| — | |||
Plus/minus others |
| |
| | |||
Tier II capital | Ps. | | Ps. | | |||
Other deductions from technical capital |
| — |
| — | |||
Technical capital | Ps. | | Ps. | | |||
Risk-weighted assets |
| |
| | |||
Value at risk |
| |
| | |||
Regulatory value at risk(1) |
| |
| | |||
Operational risk | | | |||||
Regulatory operational risk(1) | |
| | ||||
Risk-weighted assets including regulatory value at risk and operational risk |
| |
| | |||
CET1 solvency ratio |
| ||||||
AT1 capital solvency ratio | |||||||
Tier 1 capital solvency ratio |
| ||||||
Tier II solvency ratio |
| ||||||
Total solvency ratio(2) | |||||||
(1) Regulatory value at risk consists of value at risk multiplied by (100/9) as required by the Superintendency of Finance. Regulatory operational risk consists of operational risk multiplied by (100/9) as required by the Superintendency of Finance.
(2) Solvency ratio is calculated as technical capital to risk-weighted assets, including regulatory value at risk and regulatory operational risk.
F-131
Grupo Aval Acciones y Valores S.A.
Notes to the Consolidated Financial Statements
For the years ended December 31, 2022, 2021 and 2020
(Amounts expressed in millions of Colombian pesos)
Corficolombiana S.A.
At December 31, |
| ||||||
| 2022 |
|
| 2021 |
| ||
Subscribed and paid-in capital | Ps. | |
| Ps. | | ||
Reserves and retained earnings |
| |
|
| | ||
Other comprehensive income |
| |
|
| | ||
Net income for the period | | | |||||
Non-controlling interests | | ||||||
Deductions: |
|
|
| ||||
Unconsolidated financial sector investments |
| — |
|
| — | ||
Goodwill and other intangibles |
| ( |
|
| ( | ||
Deferred tax assets |
| ( |
|
| ( | ||
Other |
| ( |
|
| ( | ||
CET1 | Ps. | |
| Ps. | | ||
Hybrid instruments recognized as additional primary capital | — | — | |||||
Other | | | |||||
AT1 | | | |||||
Tier I | Ps. | | Ps. | | |||
Subordinated bonds |
| — |
|
| — | ||
Plus/minus others |
| — |
|
| — | ||
Tier II capital | Ps. | — |
| Ps. | — | ||
Other deductions from technical capital |
| ( |
|
| ( | ||
Technical capital | Ps. | |
| Ps. | | ||
Risk-weighted assets |
| |
|
| | ||
Value at risk |
| |
|
| | ||
Regulatory value at risk(1) |
| |
|
| | ||
Operational risk | | | |||||
Regulatory operational risk(1) | |
| | ||||
Risk-weighted assets including regulatory value at risk and operational risk |
| |
|
| | ||
CET1 solvency ratio |
|
| |||||
AT1 capital solvency ratio | |||||||
Tier 1 capital solvency ratio | |||||||
Tier II solvency ratio |
|
| |||||
Total solvency ratio(2) |
|
| |||||
(1) Regulatory value at risk consists of value at risk multiplied by (100/9) as required by the Superintendency of Finance. Regulatory operational risk consists of operational risk multiplied by (100/9) as required by the Superintendency of Finance.
(2) Solvency ratio is calculated as technical capital to risk-weighted assets, including regulatory value at risk and regulatory operational risk.
F-132
Grupo Aval Acciones y Valores S.A.
Notes to the Consolidated Financial Statements
For the years ended December 31, 2022, 2021 and 2020
(Amounts expressed in millions of Colombian pesos)
Porvenir S.A.
Likewise, Porvenir has adequately complied with the capital requirements established for pensions fund administrators in Colombia. The following is the detail of the capital requirements defined for this type of financial institution:
At December 31, | ||||||
| 2022 |
| 2021 | |||
Subscribed and paid-in capital | Ps. | | Ps. | | ||
Reserves and retained earnings |
| |
| | ||
Deductions: | ||||||
Others |
| ( |
| ( | ||
Primary capital | Ps. | | Ps. | | ||
Unrealized gains/losses on securities available for sale(1) |
| ( |
| ( | ||
Secondary capital (Tier II) | Ps. | ( | Ps. | ( | ||
Deductions: | ||||||
Value of the stabilization reserve | ( | ( | ||||
Technical capital | Ps. | | Ps. | | ||
Risk-weighted assets |
| |
| | ||
Value at risk |
| |
| | ||
Regulatory value at risk(1) |
| |
| | ||
Operational risk | | | ||||
Regulatory operational risk(2) | | | ||||
Risk-weighted assets including regulatory value at risk and operational risk |
| |
| | ||
Solvency ratio(3) |
| |||||
(1) Unrealized gains/losses on securities available for sale do not flow through the Consolidate Statement of Income until such securities are disposed of and the gain or loss is realized.
(2) Regulatory value at risk consists of value at risk multiplied by (100/9) as required by the Superintendency of Finance. Regulatory operational risk consists of operational risk multiplied by (100/9) as required by the Superintendency of Finance.
(3) Solvency ratio is calculated as technical capital to risk-weighted assets, including regulatory value at risk and regulatory operational risk.
NOTE 5 – ESTIMATION OF FAIR VALUE
The fair value of the financial assets and liabilities traded in active markets (such as financial assets in debt securities, equity securities and derivatives actively listed in stock exchanges or interbank markets) is based on dirty prices supplied by a price vendor. A dirty price includes accrued unpaid interest on the security, from the date of issuance or last payment of interest, up the date at which the security is valued.
An active market is a market where transactions for assets or liabilities are carried out with sufficient frequency and volume in order to provide price information on an ongoing basis. The fair value of financial assets and liabilities that are not traded in an active market is determined through appraisal techniques determined by the price supplier or by the management of Grupo Aval’s entities. Appraisal techniques used for non-standardized financial instruments such as options, foreign exchange swaps and derivatives of the over-the-counter market, which include the use of interest rate or currency assessment curves built by providers and extrapolated to the specific conditions of the instrument being appraised, discounted cash flow analysis, options pricing models and other valuation techniques commonly used by market participants who rely mostly on market data and the least possible on specific data of entities.
Grupo Aval may use models developed internally for financial instruments with no active markets. These models are usually based on valuation techniques and methods generally standardized in the financial sector. The valuation models are mainly used for
F-133
Grupo Aval Acciones y Valores S.A.
Notes to the Consolidated Financial Statements
For the years ended December 31, 2022, 2021 and 2020
(Amounts expressed in millions of Colombian pesos)
appraising financial equity instruments not listed on the stock exchange, debt certificates and other debt instruments for which the markets were or have been inactive during the financial period. Some inputs of these models may not be observable in the market and are therefore estimated based on assumptions.
The output of a model is always an estimate or approximation of a value that cannot be determined with certainty, and the valuation techniques used may not fully reflect all the factors relevant to the positions of Grupo Aval. Therefore, the appraisals are adjusted, if necessary, to allow for additional factors, including country risk, liquidity risks and counterparty risks.
The fair value hierarchy has the following levels:
| ● | Level 1 inputs are quoted prices (unadjusted) in active markets for assets or liabilities identical to those which the entity can access as of the date of measurement. |
| ● | Level 2 inputs are inputs different than quoted prices included in Level 1 that are observable for the asset or liability, whether directly or indirectly in non-active markets. |
| ● | Level 3 inputs are unobservable inputs for the asset or liability. |
The level in the fair value hierarchy within which fair value measurement is classified in whole is determined based on the input of the lowest level that is most significant for measuring its total fair value. For such purpose, the relevance of an input is assessed in connection with the measurement of the total fair value. Financial instruments that are listed in markets that are not deemed active, but which are valued based in accordance with quoted market prices, quotes from price vendors or alternative price sources supported by observable inputs, are classified in Level 2.
If a fair value measurement uses observable inputs that require significant adjustments based on unobservable inputs, this measurement is classified as Level 3. The assessment of the importance of a particular input to the measurement of fair value in whole requires judgment, taking into account specific factors of the asset or liability.
Determining what is deemed as ‘observable’ requires a significant judgment by Grupo Aval. Grupo Aval considers as observable data the market data which is already available, distributed or updated by the price suppliers, and it is reliable and verifiable, with no property rights, and provided by independent sources which are actively involved in the reference market.
5.1 Measurements of Fair Value on a Recurring Basis
Measurements of fair value on a recurring basis are those required or allowed in statement of financial position at the end of each accounting period.
The following table presents an analysis, within the hierarchy of fair value, of Grupo Aval´s assets and liabilities (by class), measured at fair value as of December 31, 2022 and 2021, on a recurring basis.
December 31, 2022
| Level 1 |
| Level 2 |
| Level 3 |
| Total | |||||
|---|---|---|---|---|---|---|---|---|---|---|---|---|
Assets |
|
|
|
| ||||||||
Trading investments |
|
|
|
| ||||||||
Securities issued or secured by Colombian Government | Ps. | | Ps. | | Ps. | — | Ps. | | ||||
Securities issued or secured by other Colombian Government entities | — | | — | | ||||||||
Securities issued or secured by foreign Governments | — | | — | | ||||||||
Securities issued or secured by other financial entities | — | | — | | ||||||||
Securities issued or secured by non-financial sector entities | — | | — | | ||||||||
Others | — | | — | | ||||||||
Total trading investments | Ps. | | Ps. | | Ps. | — | Ps. | | ||||
Investments in debt securities at fair value through profit or loss |
|
|
|
| ||||||||
Others | — | — | | | ||||||||
Total investments in debt securities at fair value through profit or loss | Ps. | | Ps. | | Ps. | | Ps. | | ||||
Investments in debt securities at fair value through OCI |
|
|
|
| ||||||||
Securities issued or secured by Colombian Government | Ps. | | Ps. | | Ps. | — | Ps. | | ||||
Securities issued or secured by other Colombian Government entities | | | — | | ||||||||
F-134
Grupo Aval Acciones y Valores S.A.
Notes to the Consolidated Financial Statements
For the years ended December 31, 2022, 2021 and 2020
(Amounts expressed in millions of Colombian pesos)
| Level 1 |
| Level 2 |
| Level 3 |
| Total | |||||
|---|---|---|---|---|---|---|---|---|---|---|---|---|
Securities issued or secured by foreign Governments | | | — | | ||||||||
Securities issued or secured by central banks | — | | — | | ||||||||
Securities issued or secured by other financial entities | — | | | | ||||||||
Securities issued or secured by non-financial sector entities | — | | — | | ||||||||
Others | | | — | | ||||||||
Total investments in debt securities at fair value through OCI | Ps. | | Ps. | | Ps. | | Ps. | | ||||
Total investments in debt securities | Ps. | | Ps. | | Ps. | | Ps. | | ||||
Equity securities |
|
|
|
| ||||||||
Trading equity securities | Ps. | | Ps. | | Ps. | | Ps. | | ||||
Investments in equity through OCI | | | | | ||||||||
Total equity securities | Ps. | | Ps. | | Ps. | | Ps. | | ||||
Held for trading derivatives |
|
|
|
| ||||||||
Currency forward | Ps. | — | Ps. | | Ps. | — | Ps. | | ||||
Debt securities forward | — | | — | | ||||||||
Interest rate swap | — | | — | | ||||||||
Currency swap | — | | — | | ||||||||
Currency options | — | | — | | ||||||||
Total held for trading derivatives | Ps. | — | Ps. | | Ps. | — | Ps. | | ||||
Hedging derivatives |
|
|
|
| ||||||||
Currency forward | — | | — | | ||||||||
Interest rate swap | — | | — | | ||||||||
Total hedging derivatives | Ps. | — | Ps. | | Ps. | — | Ps. | | ||||
Other account receivables |
|
|
|
| ||||||||
Financial assets in concession contracts | — | — | | | ||||||||
Total other account receivables designated at fair value | Ps. | — | Ps. | — | Ps. | | Ps. | | ||||
Non- financial assets |
|
|
|
| ||||||||
Biological assets | — | — | | | ||||||||
Investment properties | — | — | | | ||||||||
Total non- financial assets | Ps. | — | Ps. | — | Ps. | | Ps. | | ||||
Total assets at fair value on recurring basis | Ps. | | Ps. | | Ps. | | Ps. | | ||||
Liabilities | ||||||||||||
Trading derivatives | ||||||||||||
Currency forward | Ps. | — | Ps. | | Ps. | — | Ps. | | ||||
Debt securities forward | — | | — | | ||||||||
Interest rate futures | | — | — | | ||||||||
Interest rate swap | — | | — | | ||||||||
Currency swap | — | | — | | ||||||||
Currency options | — | | — | | ||||||||
Total trading derivatives | Ps. | | Ps. | | Ps. | — | Ps. | | ||||
Hedging derivatives | ||||||||||||
Currency forward | Ps. | — | Ps. | | Ps. | — | Ps. | | ||||
Interest rate swap | — | | — | | ||||||||
Total hedging derivatives | Ps. | — | Ps. | | Ps. | — | Ps. | | ||||
Total liabilities at fair value on recurring basis | Ps. | | Ps. | | Ps. | — | Ps. | | ||||
December 31, 2021
| Level 1 |
| Level 2 |
| Level 3 |
| Total | |||||
|---|---|---|---|---|---|---|---|---|---|---|---|---|
Assets |
|
|
|
| ||||||||
Trading investments |
|
|
|
| ||||||||
Securities issued or secured by Colombian Government | Ps. | | Ps. | | Ps. | — | Ps. | | ||||
Securities issued or secured by other Colombian Government entities | — | | — | | ||||||||
Securities issued or secured by foreign Governments | — | | | | ||||||||
Securities issued or secured by other financial entities | — | | — | | ||||||||
Securities issued or secured by non-financial sector entities | — | | — | | ||||||||
Others | — | | — | | ||||||||
Total trading investments | Ps. | | Ps. | | Ps. | | Ps. | | ||||
Investments in debt securities at fair value through profit or loss | ||||||||||||
Others | — | — | — | — | ||||||||
F-135
Grupo Aval Acciones y Valores S.A.
Notes to the Consolidated Financial Statements
For the years ended December 31, 2022, 2021 and 2020
(Amounts expressed in millions of Colombian pesos)
| Level 1 |
| Level 2 |
| Level 3 |
| Total | |||||
|---|---|---|---|---|---|---|---|---|---|---|---|---|
Total investments in debt securities at fair value through profit or loss | Ps. | | Ps. | | Ps. | | Ps. | | ||||
Investments in debt securities at fair value through OCI |
|
|
|
| ||||||||
Securities issued or secured by Colombian Government | Ps. | | Ps. | | Ps. | — | Ps. | | ||||
Securities issued or secured by other Colombian Government entities | | | — | | ||||||||
Securities issued or secured by foreign Governments | | | — | | ||||||||
Securities issued or secured by central banks | — | | — | | ||||||||
Securities issued or secured by other financial entities | — | | | | ||||||||
Securities issued or secured by non-financial sector entities | — | | — | | ||||||||
Others | | | | | ||||||||
Total investments in debt securities at fair value through OCI | Ps. | | Ps. | | Ps. | | Ps. | | ||||
Total investments in debt securities | Ps. | | Ps. | | Ps. | | Ps. | | ||||
Equity securities |
|
|
|
| ||||||||
Trading equity securities | Ps. | | Ps. | | Ps. | | Ps. | | ||||
Investments in equity through OCI | | | | | ||||||||
Total equity securities | Ps. | | Ps. | | Ps. | | Ps. | | ||||
Held for trading derivatives |
|
|
|
| ||||||||
Currency forward | Ps. | — | Ps. | | Ps. | — | Ps. | | ||||
Debt securities forward | — | | — | | ||||||||
Interest rate swap | — | | — | | ||||||||
Currency swap | — | | — | | ||||||||
Currency options | — | | — | | ||||||||
Index future | | — | — | | ||||||||
Total held for trading derivatives | Ps. | | Ps. | | Ps. | — | Ps. | | ||||
Hedging derivatives |
|
|
|
| ||||||||
Currency forward | — | | — | | ||||||||
Interest rate swap | — | | — | | ||||||||
Currency swap | — | | — | | ||||||||
Total hedging derivatives | Ps. | — | Ps. | | Ps. | — | Ps. | | ||||
Other account receivables |
|
|
|
| ||||||||
Financial assets in concession contracts | — | — | | | ||||||||
Total other account receivables designated at fair value | Ps. | — | Ps. | — | Ps. | | Ps. | | ||||
Non- financial assets |
|
|
|
| ||||||||
Biological assets | — | — | | | ||||||||
Investment properties | — | — | | | ||||||||
Total non- financial assets | Ps. | — | Ps. | — | Ps. | | Ps. | | ||||
Total assets at fair value on recurring basis | Ps. | | Ps. | | Ps. | | Ps. | | ||||
|
|
|
| |||||||||
Liabilities | ||||||||||||
Trading derivatives | ||||||||||||
Currency forward | Ps. | — | Ps. | | Ps. | — | Ps. | | ||||
Debt securities forward | — | | — | | ||||||||
Index futures | | — | — | | ||||||||
Interest rate swap | — | | — | | ||||||||
Currency swap | — | | — | | ||||||||
Currency options | — | | — | | ||||||||
Total trading derivatives | Ps. | | Ps. | | Ps. | — | Ps. | | ||||
Hedging derivatives |
|
|
|
| ||||||||
Currency forward | Ps. | — | Ps. | | Ps. | — | Ps. | | ||||
Interest rate swap | — | | — | | ||||||||
Total hedging derivatives | Ps. | — | Ps. | | Ps. | — | Ps. | | ||||
Total liabilities at fair value on recurring basis | Ps. | | Ps. | | Ps. | — | Ps. | | ||||
F-136
Grupo Aval Acciones y Valores S.A.
Notes to the Consolidated Financial Statements
For the years ended December 31, 2022, 2021 and 2020
(Amounts expressed in millions of Colombian pesos)
5.1.1. Trading assets in debt securities pledged as collateral
The following is a list of held-for-trading financial assets that are being used as collateral in repo operations, pledged as collateral for transactions with financial instruments, or pledged to third parties as collateral to secure financial obligations with other banks.
| December 31, 2022 | |||||||||||
|---|---|---|---|---|---|---|---|---|---|---|---|---|
Level 1 | Level 2 | Level 3 | Total | |||||||||
Pledged as collateral in money market operations | ||||||||||||
Securities issued or secured by Colombian Government |
| Ps. | |
| Ps. | | Ps. | — | Ps. | | ||
Securities issued or secured by other Colombian Government entities | — | | — | | ||||||||
Securities issued or secured by other financial entities | — | | — | | ||||||||
| Ps. | |
| Ps. | | Ps. | — | Ps. | | |||
Pledged as collateral to special entities such as CRCC, BR and BVC (*) | ||||||||||||
Securities issued or secured by Colombian Government |
| Ps. | |
| Ps. | — | Ps. | — | Ps. | | ||
Ps. | | Ps. | — | Ps. | — | Ps. | | |||||
Pledged as collateral in operations with derivative instruments | ||||||||||||
Securities issued or secured by Colombian Government | Ps. | |
| Ps. | — | Ps. | — | Ps. | | |||
Ps. | | Ps. | — | Ps. | — | Ps. | | |||||
| Ps. | |
| Ps. | | Ps. | — | Ps. | | |||
(*) Cámara de Riesgo Central de Contraparte (“CRCC”), Banco de la República (“BR”) and Bolsa de Valores de Colombia (“BVC”)
| December 31, 2021 | |||||||||||
Level 1 | Level 2 | Level 3 | Total | |||||||||
Pledged as collateral in money market operations | ||||||||||||
Securities issued or secured by foreign Governments |
| Ps. | — |
| Ps. | | Ps. | — | Ps. | | ||
Securities issued or secured by Colombian Government | | | — | | ||||||||
Securities issued or secured by other financial entities | — | | — | | ||||||||
| Ps. | |
| Ps. | | Ps. | — | Ps. | | |||
Pledged as collateral to special entities such as CRCC, BR and BVC (*) | ||||||||||||
Securities issued or secured by Colombian Government |
| Ps. | |
| Ps. | — | Ps. | — | Ps. | | ||
Ps. | | Ps. | — | Ps. | — | Ps. | | |||||
| Ps. | |
| Ps. | | Ps. | — | Ps. | | |||
(*) Cámara de Riesgo Central de Contraparte (“CRCC”), Banco de la República (“BR”) and Bolsa de Valores de Colombia (“BVC”)
5.1.2 Investment in debt at FVOCI securities pledged as collateral
The following is a list of debt securities at FVOCI that are being used as collateral in repo operations, pledged as collateral for transactions with financial instruments, or pledged to third parties as collateral to secure financial obligations with other banks.
| December 31, 2022 | |||||||||||
|---|---|---|---|---|---|---|---|---|---|---|---|---|
Level 1 | Level 2 | Level 3 | Total | |||||||||
Pledged as collateral in money market operations |
|
|
|
| ||||||||
Securities issued or secured by central banks | Ps. | — | Ps. | | Ps. | — | Ps. | | ||||
Securities issued or secured by foreign Governments |
| |
| | — | | ||||||
Securities issued or secured by Colombian Government |
|
| |
|
| |
| — |
| | ||
Securities issued or secured by other Colombian Government entities |
|
| |
|
| |
| — |
| | ||
Securities issued or secured by other financial entities |
|
| — |
|
| |
| — |
| | ||
Securities issued or secured by non-financial sector entities | — | | — | | ||||||||
Others |
|
| — |
|
| |
| — |
| | ||
| Ps. | |
| Ps. | | Ps. | — | Ps. | | |||
F-137
Grupo Aval Acciones y Valores S.A.
Notes to the Consolidated Financial Statements
For the years ended December 31, 2022, 2021 and 2020
(Amounts expressed in millions of Colombian pesos)
| December 31, 2022 | |||||||||||
|---|---|---|---|---|---|---|---|---|---|---|---|---|
Level 1 | Level 2 | Level 3 | Total | |||||||||
Pledged as collateral in operations with derivative instruments |
|
|
|
|
|
|
|
|
|
| ||
Securities issued or secured by Colombian Government |
| Ps. | |
| Ps. | — | Ps. | — | Ps. | | ||
| Ps. | |
| Ps. | — | Ps. | — | Ps. | | |||
Pledged as collateral to special entities such as CRCC, BR and BVC (*) |
|
|
|
|
|
|
|
|
|
| ||
Securities issued or secured by Colombian Government |
| Ps. | |
| Ps. | — | Ps. | — | Ps. | | ||
| Ps. | |
| Ps. | — | Ps. | — | Ps. | | |||
| Ps. | |
| Ps. | | Ps. | — | Ps. | | |||
(*) Cámara de Riesgo Central de Contraparte (“CRCC”), Banco de la República (“BR”) and Bolsa de Valores de Colombia (“BVC”)
December 31, 2021 | ||||||||||||
|---|---|---|---|---|---|---|---|---|---|---|---|---|
Level 1 | Level 2 | Level 3 | Total | |||||||||
Pledged as collateral in money market operations |
|
|
|
| ||||||||
Securities issued or secured by central banks | Ps. | — | Ps. | | Ps. | — | Ps. | | ||||
Securities issued or secured by foreign Governments | |
| | — | | |||||||
Securities issued or secured by Colombian Government |
| |
|
| |
| — |
| | |||
Securities issued or secured by other Colombian Government entities |
| |
|
| |
| — |
| | |||
Securities issued or secured by other financial entities | — |
|
| |
| — |
| | ||||
Securities issued or secured by non-financial sector entities |
| — |
|
| |
| — |
| | |||
Others |
| |
|
| |
| — |
| | |||
Ps. | |
| Ps. | | Ps. | — | Ps. | | ||||
Pledged as collateral in operations with derivative instruments |
|
|
|
|
|
|
|
|
| |||
Securities issued or secured by Colombian Government | Ps. | |
| Ps. | — | Ps. | — | Ps. | | |||
Ps. | |
| Ps. | — | Ps. | — | Ps. | | ||||
Pledged as collateral to special entities such as CRCC, BR and BVC (*) |
|
|
|
|
|
|
|
|
| |||
Securities issued or secured by Colombian Government | Ps. | |
| Ps. | | Ps. | — | Ps. | | |||
Ps. | |
| Ps. | | Ps. | — | Ps. | | ||||
Ps. | |
| Ps. | | Ps. | — | Ps. | | ||||
(*) Cámara de Riesgo Central de Contraparte (“CRCC”), Banco de la República (“BR”) and Bolsa de Valores de Colombia (“BVC”)
5.2 Items Measured at Fair Value on a Non-Recurring Basis
Grupo Aval is required on a nonrecurring basis to adjust the carrying value of certain assets and liabilities or provide valuation allowances. These assets or liabilities primarily include impaired collateralized loans and non-current assets held for sale. The fair value of these assets which are classified as Level 3 are determined using pricing models, discounted cash flow methodologies, current replacement cost or similar techniques, using internal models or external experts with sufficient experience and knowledge of the real estate market or of assets being appraised. Generally, these appraisals are carried out by references to market data or based on the replacement cost, when sufficient market data is not available.
The following table presents Grupo Aval’s assets and liabilities, classified within the fair value hierarchy, which are measured on a nonrecurring basis as of December 31, 2022 and 2021 at fair value less cost of sale:
Level 1 | Level 2 | Level 3 | Total | |||||||||
December 31, 2022 | ||||||||||||
Impaired collateralized loans |
| Ps. | — |
| Ps. | — |
| Ps. | |
| Ps. | |
Non- current assets held for sale | — | — | | | ||||||||
| Ps. | — |
| Ps. | — |
| Ps. | |
| Ps. | | |
Level 1 | Level 2 | Level 3 | Total | |||||||||
|---|---|---|---|---|---|---|---|---|---|---|---|---|
December 31, 2021 | ||||||||||||
Impaired collateralized loans |
| Ps. | — |
| Ps. | — |
| Ps. | |
| Ps. | |
Non- current assets held for sale | — | — | | | ||||||||
| Ps. | — |
| Ps. | — |
| Ps. | |
| Ps. | | |
F-138
Grupo Aval Acciones y Valores S.A.
Notes to the Consolidated Financial Statements
For the years ended December 31, 2022, 2021 and 2020
(Amounts expressed in millions of Colombian pesos)
5.3 Fair Value determination
The following tables provide information about valuation techniques and significant inputs when measuring fair value on a recurring basis for assets and liabilities, with fair value hierarchy classification of level 2 or level 3.
Level 2 instruments are those which are valued using inputs other than quoted prices included within level 1 that are observable for the asset or liability, either directly or indirectly.
The following table provides information about valuation techniques and significant inputs when measuring fair value on a recurring basis for assets and liabilities classified as level 2.
ASSETS AND LIABILITIES | Valuation technique Level 2 | Significant inputs |
|---|---|---|
Investments in debt securities at fair value | ||
In Colombian Pesos | ||
Securities issued or secured by the Colombian Government |
|
|
Securities issued or secured by other Colombian Government entities |
|
|
In Foreign Currency | ||
Securities issued or secured by the Colombian Government | Income approach | Theoretical price / estimated price(1) |
Securities issued or secured by foreign Governments |
|
|
Securities issued or secured by central banks | Market approach | Bloomberg Generic |
Securities issued or secured by other financial entities |
|
|
Securities issued or secured by non-financial sector entities |
|
|
Equity securities | ||
Corporate stock | Market approach | Estimated prices(1) |
Investment funds (2) | Market approach | Market value of underlying assets, less management and administrative fees |
Trading derivatives | ||
Foreign currency forward |
| Discounted cash flow |
F-139
Grupo Aval Acciones y Valores S.A.
Notes to the Consolidated Financial Statements
For the years ended December 31, 2022, 2021 and 2020
(Amounts expressed in millions of Colombian pesos)
ASSETS AND LIABILITIES | Valuation technique Level 2 | Significant inputs |
|---|---|---|
TRM, curves and market price(2) | ||
Debt securities forward | Income approach | Discounted cash flow |
Interest rate swap |
| Discounted cash flow |
Currency options |
|
|
Hedging derivatives | ||
Currency forward |
| Discounted cash flow |
Interest rate swap | Income approach | Discounted cash flow |
| (1) | Estimated Price: A valuation model based on information obtained from a price vendor when it is not able to supply quoted prices (unadjusted) for each security. This model is the basis for the construction of the valuation margin of the securities that is represented on the assigned curve or reference rate. This margin remains constant on the assigned curve or reference rate when calculating the theoretical valuation price. |
| (2) | Quoted market prices (i.e. obtained from price vendors). The subsidiary Porvenir S. A. according to Colombian rules is required to invest to 1% of its total assets under management from severance and mandatory pension funds. |
The following table provides information about valuation techniques and significant unobservable inputs when measuring Level 3 assets and liabilities at recurring fair value.
ASSETS | Valuation technique Level 3 | Significant inputs |
|---|---|---|
Investments in debt securities at fair value | ||
In Colombian Pesos | ||
Others | Income approach | Yield and margin |
In Foreign Currency | ||
Securities issued or secured by other financial entities | Income approach |
|
Equity securities | ||
Investments in equity securities(1.1) |
| - Growth in values after 5 years |
Investments in equity securities through profit or loss - Nexus(1.2) | Market Comparison | Market Comparison |
Other financial assets | ||
Assets under concession contracts | Discounted cash flow | - Free-cash flow from concession contracts |
Non-financial assets | ||
F-140
Grupo Aval Acciones y Valores S.A.
Notes to the Consolidated Financial Statements
For the years ended December 31, 2022, 2021 and 2020
(Amounts expressed in millions of Colombian pesos)
ASSETS | Valuation technique Level 3 | Significant inputs |
|---|---|---|
Biological assets | Discounted cash flow | The processes used to collect data and determine the fair value of biological assets are described in (3) |
Investment properties | Discounted cash flow | The processes used to collect data and determine the fair value of investment properties are described in (4) |
(1.1) Valuation of equity securities and investment funds Level 3
Investments with fair value hierarchy level 3 have significant unobservable inputs. Level 3 instruments include equity instruments and investments in real estate, the private equity funds, which are not quoted on any stock exchange. Given that observable prices are not available for these securities, Grupo Aval has used valuation techniques as discounted cash flows and comparable multiples to obtain fair value.
The following table includes a sensitivity analysis of main equity securities amounting to Ps.
| Favorable |
| Unfavorable | |||||
Methods and Variables |
| Variation |
| impact |
| impact | ||
Comparable multiples / Recent transaction price | ||||||||
EBITDA Number of times |
|
|
| Ps. | |
| Ps. | ( |
Adjusted discounted cash flow | ||||||||
Growth in residual values after 5 years |
| /- |
| |
| ( | ||
/- | |
| ( | |||||
Income |
| /- |
| |
| ( | ||
Discount interest rates |
| /- |
| |
| ( | ||
| Ps. | |
| Ps. | ( | |||
(1.2) Valuation of equity instruments through profit or loss
The fair value of real state capital funds’ investments classified in level 3 have significant unobservable inputs. These Level 3 instruments include primarily investments in equity instruments, which are not publicly traded. In other cases, such as the Nexus Real Estate Capital Funds, the investments are valued using their unit value (Commercial appraisal). Given that observable prices are not available for these investments, Grupo Aval uses valuation techniques to obtain the fair value.
The following table includes a sensitivity analysis of main equity securities amounting Ps.
Scenario 1 |
| Scenario 2 | ||||
Sensitivity impacts | Ps. | |
| Ps. | ( | |
Ps. | |
| Ps. | ( | ||
Scenario 1 | |||
Increase variable: | |||
Market value (square meter) | + | ||
Market income | + | ||
Initial capitalization rate | |||
Cash flow discount rate | + |
Scenario 2 | |||
Decrease variable: | |||
Market value (square meter) | - | ||
Market income | - | ||
Initial capitalization rate | - | ||
Cash flow discount rate | - |
F-141
Grupo Aval Acciones y Valores S.A.
Notes to the Consolidated Financial Statements
For the years ended December 31, 2022, 2021 and 2020
(Amounts expressed in millions of Colombian pesos)
(2) Valuation of financial assets under Gas and Energy concession arrangement rights
Promigas and subsidiaries, designated the financial assets under concession contracts at fair value, the method used to estimate it is discounted cash flows.
The assumptions and inputs used in the calculation of the financial asset estimate were:
| ● | The expiration date of each concession contract. |
| ● | The proportion of the expiry period left of each of the concession contracts in force. |
| ● | Operational cash flows (only) of the assets under concession. |
The components of the calculations are the following:
| ● | Free cash flow generated solely by assets under concession. |
| ● | Expiry period of the concession. |
| ● | Amount in - perpetuity of the Free Cash Flow (FCF) of the year, estimated factoring in a growth in the residual amount between |
| ● | Current amount of the residual amount Weighted Average Cost of Capital (WACC), between |
| ● | Financial income: annual adjustment of financial asset balance to WACC (*). |
(*) Nominal WACC calculated under the Capital Asset Pricing Model (CAPM) methodology for each entity, updated annually. The following variables were used for determining the WACC:
| ● | Beta unlevered USA (Oil/Gas Distribution): Damodaran. (Unlevered Beta 0.67, average 2017 - 2021) |
| ● | Risk Free Rate, Source: Geometric Average 1998-2021 of American bonds “T-Bonds”. |
| ● | Market Return, Source: Geometric Average 1998-2021 Damodaran “Stocks” USA. |
| ● | Market Premium: Market Return – Risk Free Rate. |
| ● | Country Risk Premium: Average last 5 years EMBI (Difference between 10-year Colombian sovereign bonds and 10 years “T-Bonds”). Damodaran. |
| ● | Emerging Market: Equity Premium Emerging countries (Lambda - Damodaran) |
Sensitivity analysis
The following table includes a sensitivity analysis of the assumptions used by Promigas and its subsidiaries in the calculation of fair value of unconditional transfer rights of gas pipelines to Government entities at the expiration date of the contracts. The value of the financial asset at December 31, 2022 is Ps.
December 31, 2022 | December 31, 2021 | |||||||||||
Variable |
| +100 bps |
| -100 bps |
| +100 bps |
| -100 bps | ||||
WACC |
| Ps. | ( | Ps. | | Ps. | ( | Ps. | | |||
Perpetuity growth rate | | ( | | ( | ||||||||
(*) Perpetuity growth rate in the case of concessions with renewal clauses that are highly likely to be exercised.
(3) Biological Assets
Fair value of Grupo Aval subsidiaries “biological assets”, which correspond to agricultural activities related to biological assets (animals or plants), is estimated based on internal reports prepared by the companies who own such assets. Fair value of biological assets is determined using valuations performed by experienced internal professionals, using discounted cash flow models. Since no comparable market exist for the biological assets, given their nature, their fair value is determined using discounted cash flows models for each biological asset, based on estimated future quantities of crops, prices, harvesting costs, and maintenance and crop yields, among others, discounted using a risk-free rate adjusted by an appropriate risk premium. See note 15.
The main assumptions used for determining the fair value of the principal biological assets are as follows:
F-142
Grupo Aval Acciones y Valores S.A.
Notes to the Consolidated Financial Statements
For the years ended December 31, 2022, 2021 and 2020
(Amounts expressed in millions of Colombian pesos)
1. Biological assets growing in rubber crops:
The price of natural rubber used to calculate the 2023-2025 cash flows was forecasted based on the average of the last 3 years of the Technically Specified Rubber (TSR20) per ton January 2020 Ps.
2. Biological assets growing in African palm crops:
The price of African palm oil (US$
(4) Investment properties
Investment properties are recognized at fair value, based on a valuation made at each year-end period using, as a basis, independent appraisal expert whose report is obtained and reviewed by management. While in the countries in which we operate, the frequency of transactions in the real state sector is low compared to other more developed markets, management believes there are enough references to assess the fair value of investment properties owned by Grupo Aval and its subsidiaries based on comparable market transactions (See note 15.4).
Fire-sales are excluded from the comparable transactions used to estimate the fair-value of investment properties. Management has reviewed the main assumptions used by the independent external appraisers (such as inflation, interest rates, etc.) and believes they are consistent with market conditions at each end of period. However, management believes that the estimation of the fair value of investment properties depends on significant judgment from the independent expert appraisers, and as such, there could be a significant probability that the actual price of sale of a property differs from its fair value. (See note 5.1)
5.4 Transfers between level 1, level 2 and level 3 of the fair value hierarchy
The following table summarizes the transfer between fair value levels 1, 2 and 3 during 2022 and 2021. In general, transfers between Levels in the investment portfolios are due, fundamentally, to changes in the liquidity levels of the securities in the markets.
December 31, 2022
| ||||||||||||||||||
Investments in debt | Investments in debt | |||||||||||||||||
securities at FVTPL | securities at FVOCI | |||||||||||||||||
Transfers between: | Transfers between: | |||||||||||||||||
| Level 2 to 1 |
| Level 1 to 2 | Level 3 to 2 |
| Level 2 to 1 |
| Level 1 to 2 | Level 3 to 2 | |||||||||
Securities issued or secured by Colombian Government |
| Ps. | |
| Ps. | — | Ps. | — |
| Ps. | |
| Ps. | — | Ps. | — | ||
Securities issued or secured by other Colombian Government entities | — | — | — | | — | — | ||||||||||||
Securities issued or secured by foreign Governments | — | — | | | — | |||||||||||||
Securities issued or secured by other financial entities | — | — | — | — | — | | ||||||||||||
Securities issued or secured by non-financial sector entities | — | — | — | | ||||||||||||||
Others | — | — | — | | | | ||||||||||||
| Ps. | |
| Ps. | — | Ps. | | Ps. | |
| Ps. | | Ps. | | ||||
F-143
Grupo Aval Acciones y Valores S.A.
Notes to the Consolidated Financial Statements
For the years ended December 31, 2022, 2021 and 2020
(Amounts expressed in millions of Colombian pesos)
December 31, 2021
Investments in debt | Investments in debt | |||||||||||||||||
securities at FVTPL | securities at FVOCI | |||||||||||||||||
Transfers between: | Transfers between: | |||||||||||||||||
| Level 2 to 1 |
| Level 1 to 2 | Level 3 to 2 |
| Level 2 to 1 |
| Level 1 to 2 | Level 3 to 2 | |||||||||
Securities issued or secured by Colombian Government |
| Ps. | — |
| Ps. | — | Ps. | — |
| Ps. | — |
| Ps. | | Ps. | — | ||
Securities issued or secured by other Colombian Government entities | — | — | — | — | | — | ||||||||||||
Securities issued or secured by other financial entities | — | — | — | — | | — | ||||||||||||
Others | — | — | — | | — | — | ||||||||||||
| Ps. | — | Ps. | — | Ps. | — |
| Ps. | | Ps. | | Ps. | — | |||||
5.5 Reconciliation Level 3 of the fair value hierarchy
The reconciliation from the opening balances to the closing balances for the fair value measurements categorized within Level 3 is shows in the following table:
Financial assets |
|
| Financial assets in |
|
| |||||||||
in debt | Equity | concession | Biological | Investment | ||||||||||
securities | instruments | arrangements | assets | properties | ||||||||||
January 1, 2020 | Ps. | |
| Ps. | |
| Ps. | |
| Ps. | |
| Ps. | |
Changes in fair value recognised in profit or loss (3) |
| ( |
|
| |
|
| |
|
| | ( | ||
Changes in fair value recognised in OCI |
| ( |
|
| |
|
| — |
|
| — | | ||
Transfers to/from non-current assets held for sale |
| — |
|
| — |
|
| — |
|
| — | | ||
Reclassifications |
| — |
|
| |
| — |
|
| — | | |||
Business combination | — | — | — | — | | |||||||||
Effect of movements in exchange rates | — | — |
| — | — | ( | ||||||||
Additions |
| |
| (*) | |
| — |
|
| | | |||
Sales / redemptions | ( |
| — |
| — |
|
| ( | ( | |||||
Discontinued operations (1) | — | ( | — | — | — | |||||||||
Reclassification BAC (1) (2) | — | | — | — | — | |||||||||
December 31, 2020 | Ps. | |
| Ps. | |
| Ps. | |
| Ps. | |
| Ps. | |
Changes in fair value recognised in profit or loss (3) |
| |
|
| |
|
| |
| | | |||
Changes in fair value recognised in OCI |
| |
|
| ( |
|
| — |
| — | | |||
Transfers to/from non-current assets held for sale |
| — |
|
| — |
|
| — |
| — | | |||
Reclassifications |
| — |
|
| — |
|
| — |
| — | | |||
Effect of movements in exchange rates | — | — | — | — | | |||||||||
Additions |
| — |
| |
|
| — |
| | | ||||
Sales / redemptions | ( |
| ( |
| — |
| ( | ( | ||||||
Discontinued operations (1) | — | | — | — | — | |||||||||
Reclassification BAC (1) (2) | — | ( | — | — | — | |||||||||
Transfers from level 2 to level 3 | — | | — | — | — | |||||||||
Transfers from level 3 to level 2 | — | ( | — | — | — | |||||||||
December 31, 2021 | Ps. | |
| Ps. | |
| Ps. | |
| Ps. | |
| Ps. | |
Changes in fair value recognised in profit or loss (3) |
| ( |
|
| |
|
| |
|
| | | ||
Changes in fair value recognised in OCI |
| |
|
| |
|
| — |
|
| — | | ||
Transfers to/from non-current assets held for sale |
| — |
|
| — |
|
| — |
|
| — | | ||
Reclassifications |
| — |
|
| — |
|
| — |
|
| — | ( | ||
Effect of movements in exchange rates | — | — | — | — | | |||||||||
Additions |
| |
| |
| — |
|
| | | ||||
Sales / redemptions |
| ( |
|
| ( |
|
| — |
|
| ( | ( | ||
Discontinued operations (1) | — | | — | — | — | |||||||||
Loss of control in subsidiary (1) | ( | ( | — | — | — | |||||||||
Transfers from level 3 to level 2 | ( | ( | — | — | — | |||||||||
December 31, 2022 | Ps. | |
| Ps. | |
| Ps. | |
| Ps. | |
| Ps. | |
(*) For the 12 months ended as of December 31, 2020 this addition of Ps.
F-144
Grupo Aval Acciones y Valores S.A.
Notes to the Consolidated Financial Statements
For the years ended December 31, 2022, 2021 and 2020
(Amounts expressed in millions of Colombian pesos)
(1) See note 1.1 “Discontinued operations of BAC Holding”
(2) Correspond to reclassification for comparability of the movements of BAC Holding consider the deconsolidation of this entity during year 2022.
(3) Included in a) securities in “Net trading income” line; b) financial assets in concession arrangements in “Net income from other financial instruments mandatorily at fair value through profit or loss” line; and c) Biological assets and Investment properties in “Income from sales of goods and services” line.
5.6 Fair Value of Financial Assets and Liabilities recognized at Amortized Cost
The following table shows a summary of financial assets and liabilities accounted at amortized cost and valued at fair value as of December 31, 2022 and 2021, only for disclosure purposes.
December 31, 2022 | December 31, 2021 | |||||||||||
|---|---|---|---|---|---|---|---|---|---|---|---|---|
Carrying | Fair Value | Carrying | Fair Value | |||||||||
Amount | Estimate | Amount | Estimate | |||||||||
Assets |
|
|
|
|
|
|
|
|
|
|
|
|
Investments in debt securities at amortized cost (1) |
| Ps. | |
| Ps. | |
| Ps. | |
| Ps. | |
Net credit portfolio at amortized cost (2) |
|
| |
|
| |
|
| |
|
| |
Total financial assets |
| Ps. | |
| Ps. | |
| Ps. | |
| Ps. | |
Liabilities |
|
|
|
|
|
|
|
|
|
|
|
|
Customer deposits (3) |
| Ps. | |
| Ps. | |
| Ps. | |
| Ps. | |
Financial obligations (4) |
|
| |
|
| |
|
| |
|
| |
Total financial liabilities |
| Ps. | |
| Ps. | |
| Ps. | |
| Ps. | |
(1) Financial assets at amortized cost
Fair value of fixed income investments at amortized cost was determined using the dirty price given by the price supplier, securities in an active market and with a market price for the day of the valuation are classified as level 1; securities with no active market and/or with an estimated price (present value of the flows of a security, discounted with the reference rate and the corresponding margin) given by the supplier are classified as level 2 and level 3.
(2) Credit portfolio at amortized cost
For credit portfolio at amortized cost, the fair value was determined using discounted cash flows models at zero coupon bond, taking into account the credit risk and its maturity; the process of valuation is deemed as level 3.
Accounts receivable and payable are classified as short-term assets and liabilities; in consequence, their fair value is similar to their book value.
(3) Customer deposits
The fair value of demand deposits is equal to their carrying value. For fixed-term deposits with maturities of less than 180 days, their fair value is deemed equal to their carrying value. For fixed-term deposits with maturities of more than 180 days, their fair value was estimated using the carrying discounted cash flow models and the interest rates offered by banks in accordance with their maturity. This is considered as a level 2 valuation.
(4) Financial obligations
For financial liabilities and other short-term liabilities, the carrying value was considered to be similar to its fair value. The fair value of long-term financial liabilities was determined using the discounted cash flow model at interest rates free of risk adjusted by risk premiums of each entity. The fair value of outstanding bonds is determined according to quoted prices or estimated prices supplied by the price vendor. It is considered that this is a level 2 valuation.
F-145
Grupo Aval Acciones y Valores S.A.
Notes to the Consolidated Financial Statements
For the years ended December 31, 2022, 2021 and 2020
(Amounts expressed in millions of Colombian pesos)
NOTE 6 – CLASSIFICATION OF FINANCIAL ASSETS AND FINANCIAL LIABILITIES
See accounting policies in Notes 2(2.5).
The following table provides a reconciliation of gross amount between line items in the consolidated statement of financial position and categories of financial instruments as of December 31, 2022 and 2021.
|
| Mandatorily |
| FVOCI – |
| FVOCI – |
|
| Total | ||||||||
|---|---|---|---|---|---|---|---|---|---|---|---|---|---|---|---|---|---|
December 31, 2022 | at | debt | equity | Amortized | gross carrying | ||||||||||||
Assets | Note | FVTPL | instruments | instruments | Cost | amount | |||||||||||
Cash and cash equivalents |
| 7 |
| Ps. | — |
| Ps. | — |
| Ps. | — |
| Ps. | |
| Ps. | |
Trading assets |
| 8 |
|
| |
|
| — |
|
| — |
|
| — |
|
| |
Debt securities |
|
|
|
| |
|
| — |
|
| — |
|
| — |
|
| |
Equity securities |
|
|
|
| |
|
| — |
|
| — |
|
| — |
|
| |
Derivative assets |
|
|
|
| |
|
| — |
|
| — |
|
| — |
|
| |
Investment securities |
| 9 |
|
| |
|
| |
|
| |
|
| |
|
| |
Measured at fair value |
|
|
|
| |
|
| |
|
| |
|
| — |
|
| |
Measured at amortized cost |
|
|
|
| — |
|
| — |
|
| — |
|
| |
|
| |
Loans |
| 11 |
|
| — |
|
| — |
|
| — |
|
| |
|
| |
Other accounts receivable |
| 12 |
|
| |
|
| — |
|
| — |
|
| |
|
| |
Measured at fair value |
|
|
|
| |
|
| — |
|
| — |
|
| — |
|
| |
Measured at amortized cost |
|
|
|
| — |
|
| — |
|
| — |
|
| |
|
| |
Hedging derivative assets |
| 10 |
|
| |
|
| — |
|
| — |
|
| — |
|
| |
Total financial assets |
|
|
| Ps. | |
| Ps. | |
| Ps. | |
| Ps. | |
| Ps. | |
|
| Mandatorily |
| FVOCI – |
| FVOCI – |
|
| Total | ||||||||
at | debt | equity | Amortized | gross carrying | |||||||||||||
Liabilities | Note | FVTPL | instruments | instruments | Cost | amount | |||||||||||
Trading liabilities |
|
|
|
|
|
|
|
|
|
|
| ||||||
Derivative liabilities | 8 | Ps. | | Ps. | — | Ps. | — | Ps. | — | Ps. | | ||||||
Hedging derivative liabilities | 10 |
| |
| — |
| — |
| — |
| | ||||||
Customer deposits | 20 |
| — |
| — |
| — |
| |
| | ||||||
Financial obligations | 21 |
| — |
| — |
| — |
| |
| | ||||||
Total financial liabilities |
| Ps. | | Ps. | — | Ps. | — | Ps. | | Ps. | | ||||||
|
| Mandatorily |
| FVOCI – |
| FVOCI – |
|
| Total | ||||||||
|---|---|---|---|---|---|---|---|---|---|---|---|---|---|---|---|---|---|
December 31, 2021 | at | debt | equity | Amortized | gross carrying | ||||||||||||
Assets | Note | FVTPL | instruments | instruments | Cost | amount | |||||||||||
Cash and cash equivalents |
| 7 |
| Ps. | — |
| Ps. | — |
| Ps. | — |
| Ps. | |
| Ps. | |
Trading assets |
| 8 |
|
| |
|
| — |
|
| — |
|
| — |
|
| |
Debt securities |
|
|
|
| | — | — | — |
|
| | ||||||
Equity securities |
|
|
|
| | — | — | — |
|
| | ||||||
Derivative assets |
|
|
|
| | — | — | — |
|
| | ||||||
Investment securities |
| 9 |
|
| — |
|
| |
|
| |
|
| |
|
| |
Measured at fair value |
|
|
|
| — |
| |
| | — |
|
| | ||||
Measured at amortized cost |
|
|
|
| — | — | — | |
|
| | ||||||
Loans |
| 11 |
|
| — | — | — | |
|
| | ||||||
Other accounts receivable |
| 12 |
|
| |
|
| — |
|
| — |
|
| |
|
| |
Measured at fair value |
|
|
|
| | — | — | — |
|
| | ||||||
Measured at amortized cost |
|
|
|
| — | — | — | |
|
| | ||||||
Hedging derivative assets |
| 10 |
|
| |
|
| — |
|
| — |
|
| — |
|
| |
Total financial assets |
|
|
| Ps. | |
| Ps. | |
| Ps. | |
| Ps. | |
| Ps. | |
|
| Mandatorily |
| FVOCI – |
| FVOCI – |
|
| Total | ||||||||
at | debt | equity | Amortized | gross carrying | |||||||||||||
Liabilities | Note | FVTPL | instruments | instruments | Cost | amount | |||||||||||
Trading liabilities |
|
|
|
|
|
|
|
|
|
|
| ||||||
Derivative liabilities | 8 | Ps. | | Ps. | — | Ps. | — | Ps. | — | Ps. | | ||||||
Hedging derivative liabilities | 10 |
| |
| — |
| — |
| — |
| | ||||||
Customer deposits | 20 |
| — |
| — |
| — |
| |
| | ||||||
Financial obligations | 21 |
| — |
| — |
| — |
| |
| | ||||||
Total financial liabilities |
| Ps. | | Ps. | — | Ps. | — | Ps. | | Ps. | | ||||||
F-146
Grupo Aval Acciones y Valores S.A.
Notes to the Consolidated Financial Statements
For the years ended December 31, 2022, 2021 and 2020
(Amounts expressed in millions of Colombian pesos)
NOTE 7 – CASH AND CASH EQUIVALENTS
Balances of cash and cash equivalents comprise the following as of December 31, 2022 and 2021:
| December 31, 2022 |
| December 31, 2021 | |||
|---|---|---|---|---|---|---|
In Colombian Pesos |
| |||||
Cash | Ps. | | Ps. | | ||
Deposits in the Colombian central bank | | | ||||
Demand deposits in banks and other financial entities | | | ||||
Clearing houses | | | ||||
Investments in debt securities maturing in under three months | | — | ||||
Cash held for specific purposes (1) | | | ||||
Ps. | | Ps. | | |||
In foreign currency | ||||||
Cash | Ps. | | Ps. | | ||
Demand deposits in banks and other financial entities | | | ||||
Investments in debt securities maturing in under three months | | | ||||
Cash held for specific purposes (1) | — | | ||||
Ps. | | Ps. | | |||
Total cash and cash equivalents | Ps. | | Ps. | | ||
(1) The variation in cash held for specific purposes corresponds to: Ps.
Grupo Aval´s banking subsidiaries had cash reserves to comply with the mandatory (see note 4.3) amount for time deposits, checking accounts and savings accounts for Ps.
NOTE 8 – TRADING ASSETS AND LIABILITIES
Balances of trading asset and liabilities comprise the following as of December 31, 2022 and 2021:
December 31, | December 31, | |||||||
|---|---|---|---|---|---|---|---|---|
| Note |
| 2022 |
| 2021 | |||
Trading assets |
| |||||||
Debt securities | 8.1 |
| Ps. | |
| Ps. | | |
Equity securities | 8.2 | | | |||||
Derivative assets | 8.3 | | | |||||
| Ps. | |
| Ps. | | |||
Trading liabilities | ||||||||
Derivative liabilities | 8.3 | | | |||||
| Ps. | |
| Ps. | | |||
Total trading assets and liabilities net |
| Ps. | |
| Ps. | | ||
F-147
Grupo Aval Acciones y Valores S.A.
Notes to the Consolidated Financial Statements
For the years ended December 31, 2022, 2021 and 2020
(Amounts expressed in millions of Colombian pesos)
8.1 Trading investments in debt securities
The following is the balance at December 31, 2022 and 2021.
| December 31, |
| December 31, | |||
2022 | 2021 | |||||
Securities issued or secured by the Colombian Government |
| Ps. | |
| Ps. | |
Securities issued or secured by other Colombian Government entities |
|
| |
|
| |
Securities issued or secured by foreign Governments |
|
| |
|
| |
Securities issued or secured by other financial entities |
|
| |
|
| |
Securities issued or secured by non-financial sector entities |
|
| |
|
| |
Others |
|
| |
|
| |
Total trading debt securities |
| Ps. | |
| Ps. | |
8.2 Trading investments in equity securities
The following is the balance as of December 31, 2022 and 2021.
| December 31, |
| December 31, | |||
|---|---|---|---|---|---|---|
2022 | 2021 | |||||
In Colombian Pesos |
|
|
|
|
|
|
Corporate stock |
| Ps. | |
| Ps. | |
Investment funds (1)(2) |
|
| |
|
| |
Pension and severance funds (3) |
|
| |
|
| |
| Ps. | |
| Ps. | | |
In foreign currency |
|
|
|
|
|
|
Corporate stock |
| Ps. | |
| Ps. | |
Investment funds |
|
| |
|
| |
| Ps. | |
| Ps. | | |
Total equity securities |
| Ps. | |
| Ps. | |
(1) Grupo Aval has restricted investment funds related to Concesionaria Nueva Vía al Mar Ps.
(2) Includes investments in the private real estate fund Nexus as of December 31, 2022 of Ps.
(3) Pursuant to Colombian rules, Porvenir S. A. is required to directly invest
F-148
Grupo Aval Acciones y Valores S.A.
Notes to the Consolidated Financial Statements
For the years ended December 31, 2022, 2021 and 2020
(Amounts expressed in millions of Colombian pesos)
8.3 Trading derivatives assets and liabilities
Trading derivative assets and liabilities comprise the following as of December 31, 2022 and 2021.
December 31, 2022 | December 31, 2021 | |||||||||||
| Assets |
| Liabilities |
| Assets |
| Liabilities | |||||
Forward contracts |
|
|
|
|
|
| ||||||
Foreign currency to buy |
| Ps. | |
| Ps. | |
| Ps. | |
| Ps. | |
Foreign currency to sell |
|
| |
|
| |
|
| |
|
| |
Debt securities to buy |
|
| |
|
| |
|
| — |
|
| |
Debt securities to sell |
|
| |
|
| |
|
| |
|
| |
Subtotal |
| Ps. | |
| Ps. | |
| Ps. | |
| Ps. | |
Swap |
|
|
|
|
|
|
|
|
|
|
|
|
Cross currency |
|
| | |
|
| | | ||||
Interest rate |
|
| | |
|
| | | ||||
Subtotal |
| Ps. | |
| Ps. | |
| Ps. | |
| Ps. | |
Futures contracts |
|
|
|
|
|
|
|
|
|
|
|
|
Interest rate to sell |
|
| — | |
|
| — | — | ||||
Index to buy | — | — |
|
| | | ||||||
Index to sell | — | — | — | | ||||||||
Subtotal |
| Ps. | — |
| Ps. | |
| Ps. | |
| Ps. | |
Options contracts |
|
|
|
|
|
|
|
|
|
|
|
|
Foreign currency to buy |
|
| | |
|
| | | ||||
Foreign currency to sell |
|
| | |
|
| | | ||||
Subtotal |
|
| |
|
| |
|
| |
|
| |
Total derivative assets and liabilities trading |
| Ps. | |
| Ps. | |
| Ps. | |
| Ps. | |
Derivative instruments contracted by Grupo Aval or its subsidiaries are generally traded in either domestic financial markets or in over-the-counter international markets. Derivative instruments have a net favorable position (asset) or a net unfavorable position (liability) as a result of fluctuations in exchange rates, in interest rates or other variables relating to market conditions. As a result, the aggregate amount of fair values of the assets and liabilities in derivative instruments may vary significantly from time to time.
NOTE 9 – INVESTMENT SECURITIES
Balances of investment securities comprise the following as of December 31, 2022 and 2021:
| Note |
| December 31, 2022 |
| December 31, 2021 | |||
Investments in debt securities mandatorily at FVTPL | 9.1 | Ps. | |
| Ps. | — | ||
Investments in debt securities at FVOCI | 9.2 | |
| | ||||
Investments in debt securities at amortized cost | 9.3 | | | |||||
Investments in equity securities at FVOCI | 9.4 | | | |||||
| Ps. | | Ps. | | ||||
| ||||||||
Loss impairment | ||||||||
Investments in debt securities at amortized cost | 4.1.5 | Ps. | ( |
| Ps. | ( | ||
| Ps. | ( | Ps. | ( | ||||
Total investment securities net |
| Ps. | |
| Ps. | | ||
F-149
Grupo Aval Acciones y Valores S.A.
Notes to the Consolidated Financial Statements
For the years ended December 31, 2022, 2021 and 2020
(Amounts expressed in millions of Colombian pesos)
9.1 Investments in debt securities mandatorily at FVTPL
The following table includes investments on asset-backed securities mandatorily at FVTPL because the contractual cash flows of these securities are not SPPI on the principal outstanding.
| December 31, 2022 |
| December 31, 2021 | |||
Others |
| |
| — | ||
Total investments in debt securities mandatorily at FVTPL |
| Ps. | |
| Ps. | — |
9.2 Investments in debt securities at FVOCI
The following table includes investments in debt securities at FVOCI as of December 31, 2022 and 2021:
December 31, 2022
Debt securities |
| Cost |
| Unrealized Gain |
| Unrealized Losses |
| Fair Value | ECL | ||||||
Securities issued or secured by Colombian Government |
| Ps. | |
| Ps. | |
| Ps. | ( |
| Ps. | | Ps. | | |
Securities issued or secured by other Colombian Government entities | | | ( | | | ||||||||||
Securities issued or secured by foreign Governments | | | ( | | | ||||||||||
Securities issued or secured by central banks | | — | ( | | | ||||||||||
Securities issued or secured by other financial entities | | | ( | | | ||||||||||
Securities issued or secured by non-financial sector entities | | — | ( | | | ||||||||||
Others | | | ( | | | ||||||||||
Total debt securities at FVOCI |
| Ps. | |
| Ps. | |
| Ps. | ( |
| Ps. | | Ps. | | |
December 31, 2021
Debt securities |
| Cost |
| Unrealized Gain |
| Unrealized Losses |
| Fair Value | ECL | ||||||
Securities issued or secured by Colombian Government |
| Ps. | |
| Ps. | |
| Ps. | ( |
| Ps. | | Ps. | | |
Securities issued or secured by other Colombian Government entities | | | ( | | | ||||||||||
Securities issued or secured by foreign Governments | | | ( | | | ||||||||||
Securities issued or secured by central banks | | | ( | | | ||||||||||
Securities issued or secured by other financial entities | | | ( | | | ||||||||||
Securities issued or secured by non-financial sector entities | | | ( | | | ||||||||||
Others | | | ( | | | ||||||||||
Total debt securities at FVOCI |
| Ps. | |
| Ps. | |
| Ps. | ( |
| Ps. | | Ps. | | |
The following table shows amounts reclassified to profit or loss from OCI before taxes, related to fixed income investments debt securities measured at FVOCI:
F-150
Grupo Aval Acciones y Valores S.A.
Notes to the Consolidated Financial Statements
For the years ended December 31, 2022, 2021 and 2020
(Amounts expressed in millions of Colombian pesos)
| December 31, 2022 |
| December 31, 2021 | |||
|---|---|---|---|---|---|---|
Redemptions or sales | Ps. | ( | Ps. | | ||
ECL allowance | | ( | ||||
Total reclassified to profit or loss |
| Ps. | ( |
| Ps. | |
9.3 Investments in debt securities at amortized cost
The following table includes investments in debt securities at amortized cost as of December 31, 2022 and 2021
Debt securities |
| December 31, 2022 |
| December 31, 2021 | ||
Securities issued or secured by Colombian Government | Ps. | | Ps. | | ||
Securities issued or secured by other Colombian Government entities | | | ||||
Securities issued or secured by foreign Governments | | | ||||
Securities issued or secured by other financial entities | | | ||||
Securities issued or secured by non-financial sector entities | | | ||||
Others | | | ||||
Total debt securities at amortized cost |
| Ps. | |
| Ps. | |
The following is a summary of investments in debt securities at amortized cost by maturity dates:
| December 31, 2022 |
| December 31, 2021 | |||
Up to 1 month |
| Ps. | |
| Ps. | |
More than 1 month and no more than 3 months | | | ||||
More than 3 months and no more than 1 year | | | ||||
More than 1 year and no more than 5 years | | | ||||
More than 5 years and no more than 10 years | | | ||||
More than 10 years | | | ||||
Total |
| Ps. | |
| Ps. | |
9.3.1 Investment in debt at amortized cost securities pledged as collateral
The following is a list of debt securities at amortized cost that are being used as collateral in repo operations, pledged as collateral for transactions with financial instruments, or pledged to third parties as collateral to secure financial obligations with other banks (See note 33).
| December 31, |
| December 31, | |||
2022 | 2021 | |||||
Pledged as collateral in money market operations |
|
| ||||
Securities issued or secured by other Colombian Government entities |
| Ps. | |
| Ps. | |
Securities issued or secured by other financial entities | | | ||||
Securities issued or secured by non-financial sector entities | | | ||||
Ps. | | Ps. | | |||
Pledged as collateral to special entities such as CRCC, BR and BVC (*) | ||||||
Securities issued or secured by other Colombian Government entities | Ps. | | Ps. | | ||
| Ps. | |
| Ps. | | |
| Ps. | |
| Ps. | | |
(*) Cámara de Riesgo Central de Contraparte (“CRCC”), Banco de la República (“BR”) and Bolsa de Valores de Colombia (“BVC”)
F-151
Grupo Aval Acciones y Valores S.A.
Notes to the Consolidated Financial Statements
For the years ended December 31, 2022, 2021 and 2020
(Amounts expressed in millions of Colombian pesos)
9.4 Investments in equity securities at fair value through OCI
The following is the balance at December 31, 2022 and 2021
December 31, 2022 | ||||||||||||
| Cost |
| Unrealized Gain |
| Unrealized Losses |
| Fair Value | |||||
In Colombian Pesos | ||||||||||||
Corporate stock |
| Ps. | |
| Ps. | |
| Ps. | ( |
| Ps. | |
In foreign currency | ||||||||||||
Corporate stock | | | ( | | ||||||||
Total equity securities |
| Ps. | |
| Ps. | |
| Ps. | ( |
| Ps. | |
December 31, 2021
ok | ||||||||||||
| Cost |
| Unrealized Gain |
| Unrealized Losses |
| Fair Value | |||||
In Colombian Pesos | ||||||||||||
Corporate Stock |
| Ps. | |
| Ps. | |
| Ps. | ( |
| Ps. | |
In foreign currency | ||||||||||||
Corporate Stock | | | ( | | ||||||||
Total equity securities |
| Ps. | |
| Ps. | |
| Ps. | ( |
| Ps. | |
Variations in fair values fundamentally reflect variations in the performance of companies and market conditions mainly due to changes in interest rates and other economic trends in the country where the investment is held. At December 31, 2022 and 2021 Grupo Aval considers that there is no evidence of deterioration.
The details of equity instruments through OCI as of December 31, 2022 and 2021 are as follows.
Entity (*) |
| December 31, 2022 |
| December 31, 2021 | ||
Empresa de Energía de Bogotá S.A. E.S.P. |
| Ps. | |
| Ps. | |
BAC Holding International Corp | | — | ||||
Mineros S.A. | | | ||||
Port operating companies | | | ||||
Bolsa de Valores de Colombia S.A. | | | ||||
Others | | | ||||
Total |
| Ps. | |
| Ps. | |
(*) These investments in equity securities have been designated as FVOCI considering that they represent strategic investments for Grupo Aval and therefore, they are not expected to be sold in a foreseeable future.
For the years ended December 31, 2022 and 2021, dividends from these equity investments in the amount of Ps.
F-152
Grupo Aval Acciones y Valores S.A.
Notes to the Consolidated Financial Statements
For the years ended December 31, 2022, 2021 and 2020
(Amounts expressed in millions of Colombian pesos)
NOTE 10 – HEDGE ACCOUNTING
In accordance with its risk management policies, Grupo Aval uses hedge accounting to manage foreign exchange risk relating to investments in foreign operations and in forecasted transactions of Promigas and its subsidiaries, as follows:
Hedges of net investment in foreign operations
Banco de Bogotá, Banco de Occidente and Promigas are exposed to foreign exchange risk related to their investments in foreign subsidiaries, that have the US Dollar as functional currency.
The purpose of hedge accounting is to mitigate and offset any adverse changes resulting from the fluctuation in exchange rate of the Colombian Peso and the functional currency of such investments. The impacts of those movements are reflected in the cumulative translation adjustment in other comprehensive income of the consolidated financial statements.
To cover this risk, Grupo Aval hedges its exposure through foreign currency financial liabilities expressed in U.S. dollars and forward contracts for the sale of U.S. dollars.
Changes in the Colombian peso against the U.S. dollar have been as follows:
Date |
| Value of US$ 1 |
| Variation in pesos |
December 31, 2020 |
| |
| |
December 31, 2021 |
| |
| |
December 31, 2022 |
| |
| |
According to the information described above, the following table shows movements of OCI gross of taxes, related to hedges of net investment in foreign operations:
|
| |||||||||||
Hedging | Hedging | |||||||||||
Hedged | non-derivative | derivative | Net OCI | |||||||||
Investment |
| Item | instrument | instrument |
| account | ||||||
Multi Financial Holding and BAC Holding (1) | (2) | Ps. | ( | (3) | Ps. | | (4) | Ps. | | Ps. | ( | |
Other subsidiaries and branches Banco de Bogotá | | ( | | | ||||||||
Occidental Bank Barbados Ltd. | | ( | — | — | ||||||||
Banco de Occidente (Panamá) S.A. | | ( | — | — | ||||||||
Sociedad Portuaria El Cayao S.A. E.S.P. | | ( | — | — | ||||||||
Gases del Pacífico S.A.C. | | ( | — | | ||||||||
Gas Natural de Lima y Callao S.A.C. – Calidda | | ( | — | — | ||||||||
Promigas Perú S.A.C. | | ( | — | — | ||||||||
Gases del Norte del Perú S.A.C. | | ( | — | — | ||||||||
Promigas Panamá Corporation | | ( | — | — | ||||||||
Total |
| Ps. | ( |
| Ps. | |
| Ps. | |
| Ps. | ( |
(1) See note 1.1. “Discontinued operations of BAC Holding”
(2) This amount includes Ps. (
(3) This amount includes Ps.
(4) This amount includes Ps.
According to information described above, the following table contains details of hedging operations carried out to cover foreign denominated equity investments. The analysis shows current amount of OCI gross of taxes:
F-153
Grupo Aval Acciones y Valores S.A.
Notes to the Consolidated Financial Statements
For the years ended December 31, 2022, 2021 and 2020
(Amounts expressed in millions of Colombian pesos)
December 31, 2022
Thousands of US$ | Ps. millions |
| ||||||||||||||||
|---|---|---|---|---|---|---|---|---|---|---|---|---|---|---|---|---|---|---|
Hedge | ||||||||||||||||||
amount in | ||||||||||||||||||
foreign | Hedge |
| ||||||||||||||||
Hedged | currency in | amount in | Hedging | Hedging |
| |||||||||||||
investment | financial | forward | Hedged | non-derivative | derivative | Net OCI | ||||||||||||
Investment |
| amount |
| liabilities |
| contracts |
| Item | instrument | instrument |
| account | ||||||
Multi Financial Holding | | ( | — | Ps. | |
| Ps. | ( |
| Ps. | ( |
| Ps. | | ||||
Other subsidiaries and branches Banco de Bogotá (1) | | ( | ( | | ( | ( | | |||||||||||
Occidental Bank Barbados Ltd. | | ( | — | | ( | — | — | |||||||||||
Banco de Occidente (Panamá) S.A. | | ( | — | | ( | — | — | |||||||||||
Sociedad Portuaria El Cayao S.A. E.S.P. | | ( | — | | ( | — | — | |||||||||||
Gases del Pacífico S.A.C. | | ( | — | | ( | — | ( | |||||||||||
Gas Natural de Lima y Callao S.A.C. – Calidda | | ( | — | | ( | — | — | |||||||||||
Promigas Perú S.A.C. | | ( | — | | ( | — | — | |||||||||||
Gases del Norte del Perú S.A.C. | | ( | — | | ( | — | — | |||||||||||
Promigas Panamá Corporation | | ( | — | | ( | — | — | |||||||||||
Total | | ( | ( | Ps. | |
| Ps. | ( |
| Ps. | ( |
| Ps. | | ||||
(1) Includes Banco de Bogotá Panamá, Banco Bogotá Finance, Ficentro, Nassau and contributions of foreign branches in Miami and New York.
December 31, 2021
Thousands of US$ | Ps. millions |
| ||||||||||||||||
Hedge | ||||||||||||||||||
amount in | ||||||||||||||||||
foreign | Hedge |
| ||||||||||||||||
Hedged | currency in | amount in | Hedging | Hedging |
| |||||||||||||
investment | financial | forward | Hedged | non-derivative | derivative | Net OCI | ||||||||||||
Investment |
| amount |
| liabilities |
| contracts |
| Item | instrument | instrument |
| account | ||||||
Multi Financial Holding and BAC Holding (2) (4) | | ( | ( | Ps. | |
| Ps. | ( |
| Ps. | ( |
| Ps. | | ||||
Other subsidiaries and branches Banco de Bogotá (3) | | — | ( | | — | ( | | |||||||||||
Occidental Bank Barbados Ltd. | | ( | — | | ( | — | — | |||||||||||
Banco de Occidente (Panamá) S.A. | | ( | — | | ( | — | — | |||||||||||
Sociedad Portuaria El Cayao S.A. E.S.P. | | ( | — | | ( | — | — | |||||||||||
Gases del Pacífico S.A.C. | | ( | — | | ( | — | ( | |||||||||||
Gas Natural de Lima y Callao S.A.C. – Calidda | | ( | — | | ( | — | — | |||||||||||
Promigas Perú S.A.C. | | ( | — | | ( | — | — | |||||||||||
Gases del Norte del Perú S.A.C. | | ( | — | | ( | — | — | |||||||||||
Promigas Panamá Corporation | | ( | — | | ( | — | — | |||||||||||
Total | | ( | ( | Ps. | |
| Ps. | ( |
| Ps. | ( |
| Ps. | | ||||
| (1) | Includes only the portion of the hedged investments |
| (2) | Includes BAC Holding International Corp and Multi Financial Holding |
| (3) | Includes Banco de Bogotá Panamá, Banco Bogotá Finance, Ficentro, Nassau and contributions of foreign branches in Miami and New York. |
(4) Banco de Bogotá’s Board of Directors approved “uncovering” part of the value of the net investment abroad through the reduction in the size of the hedging with derivatives, likewise, it authorized to stop covering the monthly increases in the value of the investment through equity method. The amount of unhedged translation adjustment of the investments was of Ps.
F-154
Grupo Aval Acciones y Valores S.A.
Notes to the Consolidated Financial Statements
For the years ended December 31, 2022, 2021 and 2020
(Amounts expressed in millions of Colombian pesos)
Hedging with Forward Contracts
Forward contracts to sell U.S. dollars have been contracted to hedge part of the net foreign investment that Banco de Bogotá has in Leasing Bogotá Panamá and other foreign subsidiaries. The forward contracts were executed with counterparties from the financial sector and the hedge was documented as a "dynamic hedging strategy", where new forward contracts are signed simultaneously as the previous ones expire. According to IAS 39, changes in the fair value of derivatives exclusively due to exchange rate changes in the peso against the U.S. dollar are registered under “Other Comprehensive Income” in equity. The ineffective part of the hedge is recognized in the statement of income for the period.
Hedging with Debt in Foreign Currency in U.S. dollars
Debt financial instruments that are not derivatives can be designated as hedging instruments for changes in foreign currency exchange rates. According to this rule, Banco de Bogotá, Banco de Occidente and Promigas designed debt denominated in U.S. dollar as hedging instruments of their foreign subsidiaries as follows:
| (1) | Bonds issued by Banco de Bogotá in the international market were designated as hedging instruments of its investment in MFH and other subsidiaries and branches amounting U.S. dollar |
| (2) | Other financial liabilities in the amount of U.S. dollar |
Hedging of Future Transactions
In the ordinary course of its operations Promigas S.A. and its subsidiaries receive income in U.S. Dollars derived from the transportation of gas. Promigas and its subsidiaries hedge the exchange risk arising in future transactions of highly probable gas transportation income, entering into forward contracts for the sale of U.S. dollars with financial entities different from the ones consolidated into Grupo Aval.
The following is the summary of Promigas and its subsidiaries open cash flow hedges:
| December 31, 2022 |
| December 31, 2021 | ||
Income in Thousands of U.S. dollar forecasted |
| | |
| |
Notional amount contracts swap Thousands of U.S. dollar |
| | |
| |
% hedged |
| | % | | % |
Fair value in Colombian pesos |
| | | ||
# of contracts |
| | |
Hedging of exchange rate risk
Concesionaria Vial del Oriente S.A.S during the year ended December 31, 2021 hedged the foreign exchange risk of the interest flows of the debt in dollars with Grupo Aval Limited, the debt is eliminated in the Grupo Aval consolidated, but the foreign exchange is not eliminated. As of December 31, 2022, this hedge was no longer in effect.
| December 31, 2022 |
| December 31, 2021 | ||
Income in Thousands of U.S. dollar forecasted |
| — | |
| |
Notional amount contracts swap Thousands of U.S. dollar |
| — | |
| |
% hedged |
| — | % | | % |
Fair value in Colombian pesos |
| — | | ||
# of contracts |
| — | |
F-155
Grupo Aval Acciones y Valores S.A.
Notes to the Consolidated Financial Statements
For the years ended December 31, 2022, 2021 and 2020
(Amounts expressed in millions of Colombian pesos)
During the years ended December 31, 2022, 2021 and 2020, an exchange difference recognized under “Other Comprehensive Income” as a result of cash flow hedge accounting of income (loss) from these highly probable transactions, was reclassified to profit or loss in the amounts of Ps. (
The movement of the accumulated OCI account related to cash flow hedges in Colombian pesos during the years ended on December 31, 2022, 2021 and 2020 is as follows:
| December 31, 2022 |
| December 31, 2021 |
| December 31, 2020 | ||||
Balance at the beginning of the year | Ps. | | Ps. | ( | Ps. | ( | |||
Changes in the fair value of the hedge forward contracts |
| |
| ( |
| ( | |||
Reclassified to profit or loss |
| ( |
| |
| | |||
Balance at the end of the year |
| Ps. | |
| Ps. | |
| Ps. | ( |
Fair value hedges of interest rate risk
As of December 31, 2022 and 2021, the Multi Financial Holding uses interest rate swaps to reduce the risk of interest rates on financial assets and financial liabilities. Said contracts are recorded at fair value in the consolidated statement of financial position, under the line of derivatives for hedging assets or liabilities, as appropriate.
December 31, 2022
Carrying amount | Change in | |||||||||||
Fair value hedges | Notional amount | Assets | Liabilities | fair value | ||||||||
Hedging instruments | ||||||||||||
Interest rate Swap | Ps. | | Ps. | | Ps. | | Ps. | | ||||
Items designated hedged | ||||||||||||
Securities issued or secured by Government and Corporate issuers | | | — | ( | ||||||||
December 31, 2021
Carrying amount | Change in | |||||||||||
Fair value hedges | Notional amount | Assets | Liabilities | fair value | ||||||||
Hedging instruments | ||||||||||||
Interest rate Swap | Ps. | | Ps. | — | Ps. | | Ps. | | ||||
Items designated hedged | ||||||||||||
Securities issued or secured by Government and Corporate issuers | | | — | ( | ||||||||
Testing of Hedge Effectiveness
Grupo Aval considers hedging as highly effective if at the beginning and in subsequent periods, the hedging instrument highly offsets changes in fair value or in cash flows attributable to the risk hedged during the period for which the hedging has been designated. The hedging is considered as such if the effectiveness of the hedging is in a range between
Grupo Aval has documented the hedging effectiveness of its foreign currency denominated investments based on the portion of the net investment hedged at the beginning of the hedging relationship. Since the net balance of these investments fluctuates during the year, Grupo Aval evaluates the hedging relationship on a daily basis as well as the result of the testing of hedge effectiveness.
Hedge Effectiveness with Forward Contracts
Grupo Aval applies the method of the forward rate used in forward contracts to evaluate the hedge effectiveness; for such purpose, Grupo Aval measures the hedge ineffectiveness comparing the value of current forward contracts, which serve as hedge, with the change in the value of a hypothetical derivative with the same maturity.
F-156
Grupo Aval Acciones y Valores S.A.
Notes to the Consolidated Financial Statements
For the years ended December 31, 2022, 2021 and 2020
(Amounts expressed in millions of Colombian pesos)
Hedge Effectiveness with Debt Instruments in Foreign Currency
For debt instruments in foreign currency designated as a hedging instruments, the gain or loss arising from the conversion of the debt to Colombian Pesos is based on the current exchange rate between the U.S. dollar and the Colombian Peso, which is the functional currency of Grupo Aval. If the notional amount of the hedging instrument exactly matches with the portion of the hedged investment in foreign operations, no ineffectiveness is registered in the statement of income.
Derivative Financial Instruments for hedging purposes comprise the following:
According to information described above, the following table contains the fair value of derivative financial instruments used for hedging:
December 31, 2022 | December 31, 2021 | |||||||||||
Item |
| Assets |
| Liabilities |
| Assets |
| Liabilities | ||||
Forward contracts | ||||||||||||
Foreign currency to buy |
| Ps. | |
| Ps. | |
| Ps. | |
| Ps. | |
Foreign currency to sale | | | | | ||||||||
Subtotal |
| Ps. | |
| Ps. | |
| Ps. | |
| Ps. | |
Swap | ||||||||||||
Cross currency | — | — | | — | ||||||||
Interest rate | | | | | ||||||||
Subtotal | Ps. | |
| Ps. | |
| Ps. | |
| Ps. | | |
Total hedge derivatives | Ps. | | Ps. | | Ps. | | Ps. | | ||||
NOTE 11 – LOANS
11.1 Loan Portfolio by Product
The distribution of the loan portfolio of Grupo Aval by product is shown as follows:
| December 31, 2022 |
| December 31, 2021 | |||
General purpose loans |
| Ps. | |
| Ps. | |
Payroll loans | | | ||||
Mortgages | | | ||||
Credit Cards | | | ||||
Working capital loans | | | ||||
Personal loans | | | ||||
Commercial financial leases | | | ||||
Automobile and vehicle loans | | | ||||
Interbank & overnight funds | | | ||||
Loans funded by development banks | | | ||||
Housing leases | | | ||||
Overdrafts | | | ||||
Consumer financial leases | | | ||||
Microcredit | | | ||||
Gross balance of loan portfolio | Ps. | | Ps. | | ||
Loss allowance loan portfolio (1) | ( | ( | ||||
Net balance of loan portfolio |
| Ps. | |
| Ps. | |
(1) See loss allowance reconciliations from the opening to the closing balance in note 4.1.5.
F-157
Grupo Aval Acciones y Valores S.A.
Notes to the Consolidated Financial Statements
For the years ended December 31, 2022, 2021 and 2020
(Amounts expressed in millions of Colombian pesos)
11.2 Loan portfolio by maturity
The distribution of Grupo Aval´s loan portfolio by contractual maturity period is as follows:
December 31, 2022
Up to 1 | From 1 to | From 3 to | More than | ||||||||||||
| year |
| 3 years |
| 5 years |
| 5 years |
| Total | ||||||
Commercial – Client portfolio |
| Ps. | |
| Ps. | |
| Ps. | |
| Ps. | |
| Ps. | |
Consumer | | | | | | ||||||||||
Mortgage | | | | | | ||||||||||
Microcredit | | | | | | ||||||||||
Interbank and overnight funds | | — | — | — | | ||||||||||
Total gross loan portfolio |
| Ps. | |
| Ps. | |
| Ps. | |
| Ps. | |
| Ps. | |
December 31, 2021
Up to 1 | From 1 to | From 3 to | More than | ||||||||||||
| year |
| 3 years |
| 5 years |
| 5 years |
| Total | ||||||
Commercial – Client portfolio |
| Ps. | |
| Ps. | |
| Ps. | |
| Ps. | |
| Ps. | |
Consumer | | | | | | ||||||||||
Mortgage | | | | | | ||||||||||
Microcredit | | | | | | ||||||||||
Interbank and overnight funds | | — | — | — | | ||||||||||
Total gross loan portfolio |
| Ps. | |
| Ps. | |
| Ps. | |
| Ps. | |
| Ps. | |
11.3 Interest income by portfolio
The interest income of the loan portfolio of Grupo Aval by portfolio is shown as follows:
| December 31, 2022 |
| December 31, 2021(1) |
| December 31, 2020(1) | ||||
Commercial – Client portfolio | Ps. | | Ps. | | Ps. | | |||
Consumer |
| |
| |
| | |||
Mortgage |
| |
| |
| | |||
Microcredit |
| |
| |
| | |||
Repos, interbank loans portfolio | | | | ||||||
Total interest income | Ps. | | Ps. | | Ps. | | |||
| (1) | Comparative information has been re-presented due to a discontinued operation disclosed in Note 1.1. |
11.4 Financial Leasing portfolio
As of December 31, 2022, and 2021 the following table shows the reconciliation between gross investment in financial leasing and the present value of minimum payments to be received in these dates:
| December 31, 2022 |
| December 31, 2021 | |||
|---|---|---|---|---|---|---|
Total gross rent payments receivable |
| Ps. | |
| Ps. | |
Less amounts representing running costs (such as taxes, maintenance, insurances, etc.,) | ( | ( | ||||
Plus, estimated residual amount of assets given for rental (without guarantee) | | | ||||
Gross investment in contracts of financial leasing | | | ||||
Less unrealized financial income | ( | ( | ||||
Net investment in contracts of financial leasing | | | ||||
Loss allowance of net investment in financial leasing |
| Ps. | ( |
| Ps. | ( |
F-158
Grupo Aval Acciones y Valores S.A.
Notes to the Consolidated Financial Statements
For the years ended December 31, 2022, 2021 and 2020
(Amounts expressed in millions of Colombian pesos)
The detailed information of gross investment and net investment in financial leasing contracts receivable as of December 31, 2022 and 2021 in each period is as follows:
December 31, 2022 | ||||||
| Gross investment |
| Net investment | |||
Up to 1 year |
| Ps. | |
| Ps. | |
From 1 to 5 years | | | ||||
More than 5 years | | | ||||
Total |
| Ps. | |
| Ps. | |
December 31, 2021 | ||||||
| Gross investment |
| Net investment | |||
Up to 1 year |
| Ps. | |
| Ps. | |
From 1 to 5 years | | | ||||
More than 5 years | | | ||||
Total |
| Ps. | |
| Ps. | |
The banks of Grupo Aval grant loans through financial leasing mainly for acquisition of vehicles and computer equipment, generally with terms between
NOTE 12 – OTHER ACCOUNTS RECEIVABLE, NET
Balances of other accounts receivable, net of impairment losses, comprise the following as of December 31, 2022 and 2021:
|
| December 31, |
| December 31, | ||||
| Reference |
| 2022 |
| 2021 | |||
Contract assets |
| 12.1 |
| Ps. | |
| Ps. | |
Other accounts receivable |
| 12.2 | | | ||||
Total other accounts receivable |
|
|
| |
| | ||
Loss allowance |
| 4.1.5 | ( | ( | ||||
Total other accounts receivable, net |
|
|
| Ps. | |
| Ps. | |
12.1 Contract assets
The following table provides information about assets from contracts with customers as of December 31, 2022 and 2021:
Contract assets |
| December 31, 2022 |
| December 31, 2021 | ||
Financial assets in concession arrangements rights at fair value (1) |
| Ps. | |
| Ps. | |
Financial assets in concession arrangements rights at amortized cost (1) | | | ||||
Gross balance of other accounts receivable | Ps. | | Ps. | | ||
Loss allowance (2) | ( | ( | ||||
Total contract assets |
| Ps. | |
| Ps. | |
| (1) | See note 16 details regarding concession arrangements rights. |
| (2) | See reconciliations simplified approach and general approach loss allowance on note 4.1.5. |
F-159
Grupo Aval Acciones y Valores S.A.
Notes to the Consolidated Financial Statements
For the years ended December 31, 2022, 2021 and 2020
(Amounts expressed in millions of Colombian pesos)
12.2 Other accounts receivable
The detailed information of other accounts receivable measured at amortized cost, except for prepaid expenses, as of December 31, 2022 and 2021 is as follows:
Other accounts receivable | December 31, 2022 | December 31, 2021 | ||||
Accounts receivable for goods and services sales in Non-financial sector companies | Ps. | | Ps. | | ||
Debtors | | | ||||
Credit card compensations and network compensation | | | ||||
Payment in advance | | | ||||
Government | | | ||||
Conditional contributions | | | ||||
Taxes | | | ||||
Others | | | ||||
Gross balance of other accounts receivable | Ps. | | Ps. | | ||
Loss allowance | ( | ( | ||||
Other accounts receivable, net | Ps. | | Ps. | | ||
NOTE 13 – NON-CURRENT ASSETS HELD FOR SALE
The movement of the non-current assets held for sale during the years ended December 31, 2022, 2021 and 2020 is as follows:
| December 31, 2022 |
| December 31, 2021 |
| December 31, 2020 | ||||
Balance at the beginning of the year |
| Ps. | |
| Ps. | |
| Ps. | |
Additions | | | | ||||||
Business Combination (1) | — | — | | ||||||
Assets sold, net (2) | ( | ( | ( | ||||||
Increase / decrease by changes in fair value | ( | ( | ( | ||||||
Reclassifications (3) | ( | ( | | ||||||
Effect of movements in exchange rates | | ( | ( | ||||||
Reclassification BAC (4)(5) | — | | ( | ||||||
Loss of control in subsidiary (4) | ( | — | — | ||||||
Discontinued operations (4) | | ( | ( | ||||||
Balance at year end |
| Ps. | |
| Ps. | |
| Ps. | |
| (1) | Includes recognition of the business combination on Multi Financial Group, Inc., (see note 35). |
| (2) | From the leaseback operation of Banco de Occidente with the NEXUS Real Estate Capital Funds includes withdrawals for December 2022 by Ps. ( |
| (3) | Includes for December 31, 2022 reclassifications to i) Investment properties by Ps. ( |
| (4) | See note 1.1 “Discontinued operations of BAC Holding” |
| (5) | Correspond to reclassification for comparability of the movements of BAC Holding consider the deconsolidation of this entity during year 2022 |
F-160
Grupo Aval Acciones y Valores S.A.
Notes to the Consolidated Financial Statements
For the years ended December 31, 2022, 2021 and 2020
(Amounts expressed in millions of Colombian pesos)
The following is the detail of the non-current assets held for sale:
| December 31, 2022 |
| December 31, 2021 | |||
Foreclosed assets | ||||||
Movable property |
| Ps. | |
| Ps. | |
Residential real estate | | | ||||
Other real estate | | | ||||
| Ps. | |
| Ps. | | |
Assets received from leasing agreements | ||||||
Machinery and equipment | — | | ||||
Vehicles | | | ||||
Real estate | | | ||||
| Ps. | |
| Ps. | | |
Other non-current assets held for sale | ||||||
Land | | | ||||
Vehicles | — | | ||||
Real estate | | | ||||
Other | | | ||||
Ps. | | Ps. | | |||
Total non-current assets held for sale |
| Ps. | |
| Ps. | |
Following is the detail of the associated liabilities to assets held for sale:
| December 31, 2022 |
| December 31, 2021 | |||
Commercial accounts payable |
| Ps. | |
| Ps. | |
Total |
| Ps. | |
| Ps. | |
Non-current assets held for sale are primarily assets received through foreclosure of assets pledged as loan collateral. Accordingly, the banks of Grupo Aval has the intention to sell them immediately, our subsidiaries have departments, processes and special sales programs for this purpose. Foreclosed assets are either sold for cash or financing for their sale is provided to potential buyers under normal market conditions. These are expected to be sold within a period of 12 months subsequent to their classification as assets held for sale. There are option contracts in place for some of these assets. Note (4.1.8) on credit risk contains information on assets received through foreclosure and sold during the period.
NOTE 14 – INVESTMENTS IN ASSOCIATES AND JOINT VENTURES
The detail of the investments in associates and joint ventures for the years ended December 31, 2022, and 2021 is as follows:
| December 31, 2022 |
| December 31, 2021 | |||
Associates |
| Ps. | |
| Ps. | |
Joint ventures | | | ||||
Total |
| Ps. | |
| Ps. | |
F-161
Grupo Aval Acciones y Valores S.A.
Notes to the Consolidated Financial Statements
For the years ended December 31, 2022, 2021 and 2020
(Amounts expressed in millions of Colombian pesos)
The following table shows the balances of each investment in associates and joint ventures as of December 31, 2022 and 2021, and Grupo Aval’s ownership interest percentage in those entities:
December 31, 2022 | December 31, 2021 | |||||||||
| Ownership |
| Book |
| Ownership |
| Book | |||
interest | value | interest | value | |||||||
Associates | ||||||||||
Gas Natural de Lima y Callao S.A. - Cálidda |
| | % | Ps. | |
| | % | Ps. | |
Gases del Caribe S.A. E.S.P. |
| | % | |
| | % | | ||
Credibanco S.A. |
| | % | |
| | % | | ||
Redeban Multicolor S.A. |
| | % | |
| | % | | ||
A.C.H Colombia S.A. |
| | % | |
| | % | | ||
Aerocali S.A. |
| | % | |
| | % | | ||
Colombiana de Extrusión S.A. - Extrucol |
| | % | |
| | % | | ||
ADL Digital Lab S.A.S. | | % | | | % | | ||||
Servicios de Identidad Digital S.A.S. | | % | | | % | | ||||
Energía Eficiente S.A. |
| | % | |
| | % | | ||
Metrex S.A. |
| | % | |
| | % | | ||
Concentra Inteligencia en Energía S.A.S. |
| | % | |
| | % | | ||
| Ps. | |
| Ps. | | |||||
December 31, 2022 | December 31, 2021 | |||||||||
| Ownership |
| Book |
| Ownership |
| Book | |||
interest | value | interest | value | |||||||
Joint ventures | ||||||||||
Renting Automayor S.A.S. (1) |
| | % | |
| | % | | ||
| Ps. | |
| Ps. | | |||||
| (1) | Joint businesses executed by Grupo Aval’s subsidiaries with specific purposes wherein the joint business assumes no responsibilities for business results, not requiring significant equity resources from Grupo Aval. |
All of our associates and joint ventures are domiciled in Colombia, with the exception of Gas Natural de Lima y Callao S.A. – Cálidda which resides in Perú.
The main corporate purpose of Grupo Aval´s associates is described as follows:
| Associate |
| Corporate purpose | |
1 |
| Gas Natural de Lima y Callao S.A. - Cálidda |
| Gas distribution |
2 |
| Gases del Caribe S.A. E.S.P. |
| Gas distribution |
3 |
| Credibanco S.A. |
| Payment processing |
4 |
| Redeban Multicolor S.A. |
| Payment processing |
5 |
| A.C.H Colombia S.A. |
| Automated clearing house |
6 |
| Aerocali S.A. |
| Projects in airport infrastructure |
7 |
| Colombiana de Extrusión S.A. - Extrucol |
| Networks and infrastructure |
8 |
| ADL Digital Lab S.A.S. |
| Tecnology or digital services |
9 | Servicios de Identidad Digital S.A.S. | Digital services | ||
10 | Energía Eficiente S.A. | Gas distribution | ||
11 |
| Metrex S.A. |
| Manufacturing and commercialization of industrial equipment |
12 |
| Concentra Inteligencia en Energía S.A.S. |
| Gas distribution |
As of December 31, 2022, and 2021, Grupo Aval did not have contingent assets as income receivable that arose from any contractual difference with any concession, other than a tariff recognition. There were also no contingent liabilities for fines or sanctions imposed by the Government in the development of concession contracts for possible contractual breaches.
F-162
Grupo Aval Acciones y Valores S.A.
Notes to the Consolidated Financial Statements
For the years ended December 31, 2022, 2021 and 2020
(Amounts expressed in millions of Colombian pesos)
A roll-forward of investments in associates and joint ventures accounts is shown below for the years ended December 31, 2022, 2021 and 2020:
Associates
|
| December 31, |
| December 31, |
| December 31, | |||
2022 | 2021 | 2020 | |||||||
Balance at the beginning of the year |
| Ps. | |
| Ps. | |
| Ps. | |
Acquisitions | | | | ||||||
Participation in the profit or loss of the period | | | | ||||||
Participation in Other Comprehensive Income | | ( | | ||||||
Dividends declared | ( | ( | ( | ||||||
Reclassifications | — | — | ( | ||||||
Exchange difference | | | | ||||||
Realization of Other Comprehensive Income | — | | — | ||||||
Dilution effect | — | ( | — | ||||||
Year-end balance (1) |
| Ps. | |
| Ps. | |
| Ps. | |
(1) See note 1.1 B) “Sale of BAC Holding”
Joint ventures
| December 31, | December 31, | December 31, | ||||||
2022 | 2021 | 2020 | |||||||
Balance at the beginning of the year |
| Ps. | | Ps. | | Ps. | | ||
Participation in the period profit or loss | | | ( | ||||||
Dividends received | — | ( | ( | ||||||
Acquisitions | | — | — | ||||||
Exchange difference | — | | | ||||||
Year-end balance |
| Ps. | | Ps. | | Ps. | | ||
The condensed financial information of the associates and joint ventures accounted for under the equity method is as follows:
Associates
At the time calculating the equity method, the year-end financial information of associates was not available. Therefore, the financial information of the immediately preceding month for the years 2022 and 2021 was used, is presented below.
December 31, 2022
Assets | Liabilities |
| Equity |
| Income |
| Expenses |
| Net income LTM | |||||||||
Gas Natural de Lima y Callao S.A. - Cálidda | Ps. | | Ps. | |
| Ps. | |
| Ps. | |
| Ps. | |
| Ps. | | ||
Gases del Caribe S.A. E.S.P. | | | | | | | ||||||||||||
Credibanco S.A. | | | | | | | ||||||||||||
Redeban Multicolor S.A. | | | | | | | ||||||||||||
A.C.H Colombia S.A. | | | | | | | ||||||||||||
Aerocali S.A. | | | | | | | ||||||||||||
Colombiana de Extrusión S.A. - Extrucol | | | | | | | ||||||||||||
ADL Digital Lab S.A.S. | | | | | | | ||||||||||||
Servicios de Identidad Digital S.A.S. | | | | | | ( | ||||||||||||
Energía Eficiente S.A. | | | | | | | ||||||||||||
Metrex S.A. | | | | | | | ||||||||||||
Concentra Inteligencia en Energía S.A.S. | | | | | | ( | ||||||||||||
Ps. | | Ps. | | Ps. | | Ps. | | Ps. | | Ps. | | |||||||
F-163
Grupo Aval Acciones y Valores S.A.
Notes to the Consolidated Financial Statements
For the years ended December 31, 2022, 2021 and 2020
(Amounts expressed in millions of Colombian pesos)
December 31, 2021
Assets | Liabilities | Equity | Income | Expenses | Net income LTM | |||||||||||||
Gas Natural de Lima y Callao S.A. - Cálidda | Ps. | | Ps. | | Ps. | | Ps. | | Ps. | | Ps. | | ||||||
Gases del Caribe S.A. E.S.P. | | | | | | | ||||||||||||
Credibanco S.A. | | | | | | | ||||||||||||
Redeban Multicolor S.A. | | | | | | | ||||||||||||
A.C.H Colombia S.A. | | | | | | | ||||||||||||
Aerocali S.A. | | | | | | | ||||||||||||
Colombiana de Extrusión S.A. - Extrucol | | | | | | | ||||||||||||
ADL Digital Lab S.A.S. | | | | | | | ||||||||||||
Servicios de Identidad Digital S.A.S. | | | | | | ( | ||||||||||||
Energía Eficiente S.A. | | | | | | ( | ||||||||||||
Metrex S.A. | | | | | | | ||||||||||||
Concentra Inteligencia en Energía S.A.S. | | | | | | | ||||||||||||
Ps. | | Ps. | | Ps. | | Ps. | | Ps. | | Ps. | | |||||||
Joint Ventures
At the time calculating the equity method, the year-end financial information of joint ventures was not available. Therefore, the information of the immediately preceding month for the years 2022 and 2021 was used, is presented below.
December 31, 2022
| Assets |
| Liabilities |
| Equity |
| Income |
| Expenses |
| Net income LTM | |||||||
Renting Automayor S.A. | Ps. | | Ps. | | Ps. | | Ps. | | Ps. | | Ps. | | ||||||
| Ps. | |
| Ps. | |
| Ps. | |
| Ps. | |
| Ps. | |
| Ps | | |
December 31, 2021
| Assets |
| Liabilities |
| Equity |
| Income |
| Expenses |
| Net income LTM | |||||||
Renting Automayor S.A. | Ps. | | Ps. | | Ps. | | Ps. | | Ps. | | Ps. | | ||||||
| Ps. | |
| Ps. | |
| Ps. | |
| Ps. | |
| Ps. | |
| Ps | | |
NOTE 15 – TANGIBLE ASSETS
The movement of the carrying value amounts of tangible assets for the years ended on December 31, 2022, 2021 and 2020 is as follows:
Given in | |||||||||||||||||
|---|---|---|---|---|---|---|---|---|---|---|---|---|---|---|---|---|---|
Right-of-use | Investment | operating | Biological | ||||||||||||||
For own use (1) | assets | properties (2) | leases | assets | Total | ||||||||||||
Cost | |||||||||||||||||
Balance as of January 1, 2020 | Ps. | | Ps. | | Ps. | | Ps. | | Ps. | | Ps. | | |||||
Increase / (decrease) due to changes in the lease variables | — | | — | — | — | | |||||||||||
Business Combination (3) | | | | — | — | | |||||||||||
Purchases or capitalized expenses (4)(5) | | | | | | | |||||||||||
Withdrawals / Sales | ( | ( | ( | — | ( | ( | |||||||||||
Changes in fair value | — | — | ( | — | | ( | |||||||||||
Revaluation of investment properties | — | — | | — | — | | |||||||||||
Transfers to/from non-current assets held for sale | ( | — | | — | — | ( | |||||||||||
Reclassification BAC (6)(7) | | ( | — | — | — | | |||||||||||
Discontinued operations (6) | ( | — | — | — | — | ( |
F-164
Grupo Aval Acciones y Valores S.A.
Notes to the Consolidated Financial Statements
For the years ended December 31, 2022, 2021 and 2020
(Amounts expressed in millions of Colombian pesos)
Given in | |||||||||||||||||
|---|---|---|---|---|---|---|---|---|---|---|---|---|---|---|---|---|---|
Right-of-use | Investment | operating | Biological | ||||||||||||||
For own use (1) | assets | properties (2) | leases | assets | Total | ||||||||||||
Effect of movements in exchange rates | ( | ( | ( | — | — | ( | |||||||||||
Reclassifications | | — | | ( | — | | |||||||||||
Balance as of December 31, 2020 | Ps. | | Ps. | | Ps. | | Ps. | | Ps. | | Ps. | | |||||
Increase / (decrease) due to changes in the lease variables | — | | — | — | — | | |||||||||||
Purchases or capitalized expenses (4)(5) | | | | | | | |||||||||||
Withdrawals / Sales | ( | ( | ( | — | ( | ( | |||||||||||
Changes in fair value | — | — | | — | | | |||||||||||
Revaluation of investment properties | — | — | | — | — | | |||||||||||
Transfers to/from non-current assets held for sale | ( | — | | — | — | | |||||||||||
Reclassification BAC (6)(7) | | | — | — | — | | |||||||||||
Discontinued operations (6) | ( | — | — | — | — | ( | |||||||||||
Effect of movements in exchange rates | | | | — | — | | |||||||||||
Reclassifications | ( | | | ( | — | ( | |||||||||||
Balance as of December 31, 2021 | Ps. | | Ps. | | Ps. | | Ps. | | Ps. | | Ps. | | |||||
Increase / (decrease) due to changes in the lease variables | — | | — | — | — | | |||||||||||
Purchases or capitalized expenses (4)(5) | | | | | | | |||||||||||
Withdrawals / Sales (8) | ( | ( | ( | — | ( | ( | |||||||||||
Changes in fair value | — | — | | — | | | |||||||||||
Revaluation of investment properties | — | — | | — | — | | |||||||||||
Transfers to/from non-current assets held for sale | ( | — | | — | — | | |||||||||||
Loss of control in subsidiary (6) | ( | ( | — | — | — | ( | |||||||||||
Discontinued operations (6) | ( | — | — | — | — | ( | |||||||||||
Effect of movements in exchange rates | | | | — | — | | |||||||||||
Reclassifications | ( | | ( | ( | — | ( | |||||||||||
Balance as of December 31, 2022 | Ps. | | Ps. | | Ps. | | Ps. | | Ps. | | Ps. | |
Given in | |||||||||||||||||
Right-of-use | Investment | operating | Biological | ||||||||||||||
Accumulated Depreciation: | For own use (1) | assets | properties (2) | leases | assets | Total | |||||||||||
Balance January 1, 2020 | Ps. | ( | Ps. | ( | Ps. | — | Ps. | ( | Ps. | — | Ps. | ( | |||||
Depreciation of the year charged against profit or loss | ( | ( | — | ( | — | ( | |||||||||||
Withdrawals / Sales | | | — | — | — | | |||||||||||
Transfers to/from non-current assets held for sale | | — | — | — | — | | |||||||||||
Reclassification BAC (6)(7) | ( | | — | — | — | | |||||||||||
Discontinued operations (6) | ( | ( | — | — | — | ( | |||||||||||
Effect of movements in exchange rates | | | — | — | — | | |||||||||||
Reclassification | ( | ( | — | | — | ( | |||||||||||
Balance December 31, 2020 | Ps. | ( | Ps. | ( | Ps. | — | Ps. | ( | Ps. | — | ( | ||||||
Depreciation of the year charged against profit or loss | ( | ( | — | ( | — | ( | |||||||||||
Withdrawals / Sales | | | — | — | — | | |||||||||||
Transfers to/from non-current assets held for sale | | — | — | — | — | | |||||||||||
Reclassification BAC (6)(7) | ( | ( | — | — | — | ( | |||||||||||
Discontinued operations (6) | ( | ( | — | — | — | ( | |||||||||||
Effect of movements in exchange rates | ( | ( | — | — | — | ( | |||||||||||
Reclassification | ( | ( | — | | — | ( | |||||||||||
Balance December 31, 2021 | Ps. | ( | Ps. | ( | Ps. | — | Ps. | ( | Ps. | — | ( | ||||||
Depreciation of the year charged against profit or loss | ( | ( | — | ( | — | ( | |||||||||||
Withdrawals / Sales (8) | | | — | — | — | | |||||||||||
Transfers to/from non-current assets held for sale | | — | — | — | — | | |||||||||||
Loss of control in subsidiary (6) | | | — | — | — | | |||||||||||
Discontinued operations (6) | ( | ( | — | — | — | ( | |||||||||||
Effect of movements in exchange rates | ( | ( | — | — | — | ( | |||||||||||
Reclassification | ( | ( | — | | — | ( | |||||||||||
Balance December 31, 2022 | Ps. | ( | Ps. | ( | Ps. | — | Ps. | ( | Ps. | — | Ps. | ( |
Given in | |||||||||||||||||
Right-of-use | Investment | operating | Biological | ||||||||||||||
Impairment losses: | For own use (1) | assets | properties (2) | leases | assets | Total | |||||||||||
Balance as of January 1, 2020 | Ps. | ( | Ps. | — | Ps. | — | Ps. | ( | Ps. | — | Ps. | ( | |||||
Year impairment charge | ( | — | — | ( | — | ( | |||||||||||
Balance as of December 31, 2020 | Ps. | ( | Ps. | — | Ps. | — | Ps. | ( | Ps. | — | Ps. | ( | |||||
Year impairment charge | ( | — | — | ( | — | ( | |||||||||||
Transfers to/from non-current assets held for sale | | — | — | — | — | | |||||||||||
Reclassification | ( | — | — | — | — | ( | |||||||||||
Balance as of December 31, 2021 | Ps. | ( | Ps. | — | Ps. | — | Ps. | ( | Ps. | — | Ps. | ( | |||||
Year impairment charge | ( | — | — | ( | — | ( | |||||||||||
Withdrawals | | — | — | — | — | | |||||||||||
Balance as of December 31, 2022 | Ps. | ( | Ps. | — | Ps. | — | Ps. | ( | Ps. | — | Ps. | ( |
F-165
Grupo Aval Acciones y Valores S.A.
Notes to the Consolidated Financial Statements
For the years ended December 31, 2022, 2021 and 2020
(Amounts expressed in millions of Colombian pesos)
Given in | |||||||||||||||||
Right-of-use | Investment | operating | Biological | ||||||||||||||
Tangible assets, net: | For own use (1) | assets | properties (2) | leases | assets | Total | |||||||||||
Balance as of December 31, 2020 | Ps. | | Ps. | | Ps. | | Ps. | | Ps. | | Ps. | | |||||
Balance as of December 31, 2021 | Ps. | | Ps. | | Ps. | | Ps. | | Ps. | | Ps. | | |||||
Balance as of December 31, 2022 | Ps. | | Ps. | | Ps. | | Ps. | | Ps. | | Ps. | |
| (1) | Only assets for own use different than assets given in operating lease are included. See note 15.4. |
| (2) | Cost is included at fair value. The total of purchases of investment properties, includes assets received in total or partial settlement of the payment obligations of debtors, at December 31, 2022 Ps. |
| (3) | Includes the recognition of Multi Financial Group, Inc’s business combination. See note 35. |
| (4) | The amount of purchases for own use assets include: (i) at December 31, 2022 an amount transferred from concessions arrangements as a result of the change in the conditions of the contracts by the grantor for Ps. |
| (5) | Includes borrowing costs capitalized for Ps. |
| (6) | See note 1.1. "Discontinued operations of BAC Holding" for Ps. ( |
| (7) | Correspond to reclassification for comparability of the movements of BAC Holding consider the deconsolidation of this entity during year 2022. |
| (8) | Withdrawals or sales includes the de-recognition of the assets transferred to NEXUS Real Estate Capital Funds. For own use assets the net values of the most significant disposals are Banco de Bogotá Ps. |
F-166
Grupo Aval Acciones y Valores S.A.
Notes to the Consolidated Financial Statements
For the years ended December 31, 2022, 2021 and 2020
(Amounts expressed in millions of Colombian pesos)
15.1. Tangible assets for own use
The following tables shows the balance at December 31, 2022 and 2021, by type of asset:
Accumulated | Impairment | Carrying | |||||||||
December 31, 2022 | Cost | depreciation | loss | amount | |||||||
Land | Ps. | | Ps. | — | Ps. | ( | Ps. | | |||
Buildings | | ( | ( | | |||||||
Office equipment and accessories | | ( | ( | | |||||||
Information technology equipment | | ( | ( | | |||||||
Vehicles | | ( | — | | |||||||
Equipment and machinery | | ( | ( | | |||||||
Silos | | ( | — | | |||||||
Warehouses | | ( | — | | |||||||
Improvements in leaseholds properties | | ( | — | | |||||||
Construction in progress | | — | — | | |||||||
Bearer plants | | ( | — | | |||||||
Balance as of December 31, 2022 | Ps. | | Ps. | ( | Ps. | ( | Ps. | | |||
Accumulated | Impairment | Carrying | |||||||||
December 31, 2021 | Cost | depreciation | loss | amount | |||||||
Land | Ps. | | Ps. | — | Ps. | ( | Ps. | | |||
Buildings |
| | ( | ( |
| | |||||
Office equipment and accessories |
| | ( | ( |
| | |||||
Information technology equipment |
| | ( | ( |
| | |||||
Vehicles |
| | ( | ( |
| | |||||
Equipment and machinery |
| | ( | — |
| | |||||
Silos |
| | ( | — |
| | |||||
Warehouses |
| | ( | — |
| | |||||
Improvements in leaseholds properties |
| | ( | — |
| | |||||
Construction in progress |
| | — | — |
| | |||||
Bearer plants |
| | ( | — |
| | |||||
Balance as of December 31, 2021 | Ps. | | Ps. | ( | Ps. | ( | Ps. | | |||
15.2 Right-of-use assets:
The following tables shows the balance at December 31, 2022 and 2021, by type of asset:
Accumulated | Carrying | ||||||||
December 31, 2022 | Cost | depreciation | amount | ||||||
Land |
| Ps. | |
| Ps. | ( |
| Ps. | |
Buildings | | ( | | ||||||
Office equipment and accessories | | ( | | ||||||
Information technology equipment | | ( | | ||||||
Vehicles | | ( | | ||||||
Equipment and machinery | | ( | | ||||||
Warehouses | | ( | | ||||||
Balance as of December 31, 2022 |
| Ps. | |
| Ps. | ( |
| Ps. | |
Accumulated | Carrying | ||||||||
|---|---|---|---|---|---|---|---|---|---|
December 31, 2021 | Cost | depreciation | amount | ||||||
Land |
| Ps. | |
| Ps. | ( |
| Ps. | |
Buildings | | ( | | ||||||
Office equipment and accessories | | ( | | ||||||
Information technology equipment | | ( | | ||||||
Vehicles | | ( | | ||||||
Equipment and machinery | | ( | | ||||||
Warehouses | | ( | | ||||||
Balance as of December 31, 2021 |
| Ps. | |
| Ps. | ( |
| Ps. | |
F-167
Grupo Aval Acciones y Valores S.A.
Notes to the Consolidated Financial Statements
For the years ended December 31, 2022, 2021 and 2020
(Amounts expressed in millions of Colombian pesos)
15.3 Investment properties
The following table summarizes investment properties as of December 31, 2022 and 2021:
|
| Accumulated |
| ||||||
adjustments | Carrying | ||||||||
December 31, 2022 | Cost | to fair value | amount | ||||||
Land |
| Ps. | |
| Ps. | |
| Ps. | |
Buildings |
|
| |
| |
|
| | |
Balance as of December 31, 2022 |
| Ps. | |
| Ps. | |
| Ps. | |
|
| Accumulated |
| ||||||
adjustments | Carrying | ||||||||
December 31, 2021 | Cost | to fair value | amount | ||||||
Land |
| Ps. | |
| Ps. | |
| Ps. | |
Buildings |
|
| |
| |
|
| | |
Balance as of December 31, 2021 |
| Ps. | |
| Ps. | |
| Ps. | |
The following amounts have been recognized in the Consolidated Statement of Income during the years ended on December 31, 2022, 2021 and 2020 in relation to investments properties:
| December 31, |
| December 31, |
| December 31, | ||||
2022 | 2021 | 2020 | |||||||
Income from rents |
| Ps. | |
| Ps. | |
| Ps. | |
Direct operating expenses deriving from property investments which create income from rent |
|
| ( |
| ( |
|
| ( | |
Direct operating expenses deriving from property investments which do not create income from rent |
|
| ( |
| ( |
|
| ( | |
| Ps. | |
| Ps. | |
| Ps. | | |
15.4 Tangible assets given in operating leases:
The following tables shows the balance at December 31, 2022 and 2021, by type of asset:
| Accumulated |
| Impairment |
| Carrying | ||||||
December 31, 2022 | Cost | depreciation | loss | amount | |||||||
Computing equipment | Ps. | |
| Ps. | ( |
| Ps. | — |
| Ps. | |
Vehicles |
| |
| ( |
|
| — |
| | ||
Mobilization equipment and machinery |
| |
| ( |
|
| ( |
| | ||
Balance as of December 31, 2022 | Ps. | |
| Ps. | ( |
| Ps. | ( |
| Ps. | |
| Accumulated |
| Impairment |
| Carrying | ||||||
December 31, 2021 | Cost | depreciation | loss | amount | |||||||
Computing equipment | Ps. | |
| Ps. | ( |
| Ps. | — |
| Ps. | |
Vehicles |
| |
| ( |
|
| — |
|
| | |
Mobilization equipment and machinery |
| |
| ( |
|
| ( |
|
| | |
Balance as of December 31, 2021 | Ps. | |
| Ps. | ( |
| Ps. | ( |
| Ps. | |
F-168
Grupo Aval Acciones y Valores S.A.
Notes to the Consolidated Financial Statements
For the years ended December 31, 2022, 2021 and 2020
(Amounts expressed in millions of Colombian pesos)
NOTE 16 – CONCESSION ARRANGEMENTS RIGHTS
The following is the balance of the assets in concession arrangements registered in the Group as of December 31, 2022 and 2021:
| December 31, 2022 |
| December 31, 2021 | |||
Financial assets at fair value |
| Ps. | |
| Ps. | |
Financial asset at amortized cost net (1) |
|
| |
| | |
Total financial assets in concession arrangements rights (2) | Ps. | | Ps. | | ||
Intangible assets |
|
| |
| | |
Total assets in concession arrangements rights |
| Ps | |
| Ps. | |
| (1) | At December 31, 2022, 2021 and 2020, the balance of the financial asset at amortized cost includes an impairment expense of Ps. |
| (2) | See note 12.1, “Contract assets”. |
16.1 Financial Assets in Concession Arrangements
The following table shows the changes in financial assets in concession arrangements registered in Grupo Aval’s subsidiaries for the years ended on December 31, 2022, 2021 and 2020:
| Gas and Energy |
| Infrastructure |
| Total | ||||
Balance as of January 1, 2020 |
| Ps. | |
| Ps. | |
| Ps. | |
Additions or new concession arrangements | — |
|
| | | ||||
Collections during the year |
|
| — |
|
| ( |
| ( | |
Adjustment to fair value |
|
| |
|
| — |
| | |
Accrued interest |
|
| — |
|
| |
| | |
Impairment expense |
|
| — |
|
| ( |
| ( | |
Balance as of December 31, 2020 |
| Ps. | |
| Ps. | | Ps. | | |
Additions or new concession arrangements (1) | — |
|
| |
| | |||
Collections during the year |
|
| — |
|
| ( |
| ( | |
Adjustment to fair value |
|
| |
|
| — |
| | |
Accrued interest |
|
| — |
|
| |
| | |
Impairment expense | — |
|
| ( |
| ( | |||
Balance as of December 31, 2021 |
| Ps. | |
| Ps. | | Ps. | | |
Additions or new concession arrangements (1) |
|
| | |
| | |||
Collections during the year |
|
| — | ( |
| ( | |||
Adjustment to fair value |
|
| | — |
| | |||
Accrued interest |
|
| — | |
| | |||
Impairment expense | — | ( | ( | ||||||
Effect of movements in exchange rates |
|
| | — |
| | |||
Balance as of December 31, 2022 |
| Ps. | |
| Ps. | | Ps. | | |
| (1) | Includes work progress on the Covioriente and Covipacífico concessions; as of December 31, 2022 Ps. |
16.2 Intangible Assets in Concession Arrangements
The following table shows the movements of the main concession arrangements in Grupo Aval’s subsidiaries under intangible assets during years ended at December 31, 2022, 2021 and 2020:
Cost |
| Gas and energy | Infrastructure | Total | |||||
|---|---|---|---|---|---|---|---|---|---|
Balance as of January 1, 2020 |
| Ps. | |
| Ps. | |
| Ps. | |
Additions (1) |
|
| |
| |
|
| | |
Reclassification to / from PPE |
|
| |
| — |
|
| | |
Transfer to non-current assets held for sale | ( | — | ( | ||||||
Withdrawals |
|
| ( |
| ( |
|
| ( | |
Effect of movements in exchange rates | |
| — |
|
| | |||
Balance as of December 31, 2020 |
| Ps. | |
| Ps. | |
| Ps. | |
Additions (1) |
|
| |
| |
|
| | |
F-169
Grupo Aval Acciones y Valores S.A.
Notes to the Consolidated Financial Statements
For the years ended December 31, 2022, 2021 and 2020
(Amounts expressed in millions of Colombian pesos)
Cost |
| Gas and energy | Infrastructure | Total | |||||
|---|---|---|---|---|---|---|---|---|---|
Reclassification to / from PPE |
|
| |
| — |
|
| | |
Transfer to non-current assets held for sale | | — | | ||||||
Withdrawals |
|
| ( |
| — |
|
| ( | |
Effect of movements in exchange rates |
|
| |
| — |
|
| | |
Balance as of December 31, 2021 |
| Ps. | |
| Ps. | |
| Ps. | |
Additions (1) |
|
| | |
|
| | ||
Reclassification to / from PPE |
|
| | — |
|
| | ||
Transfer to non-current assets held for sale | — | — | — | ||||||
Withdrawals |
|
| ( | — |
|
| ( | ||
Effect of movements in exchange rates |
|
| | — |
|
| | ||
Balance as of December 31, 2022 |
| Ps. | |
| Ps. | |
| Ps. | |
Accumulated Amortization |
| Gas and energy | Infrastructure | Total | |||||
Balance as of January 1, 2020 |
| Ps. | ( |
| Ps. | ( |
| Ps. | ( |
Amortization of the year |
|
| ( |
| ( |
|
| ( | |
Transfer to non-current assets held for sale |
|
| |
| — |
|
| | |
Withdrawals |
|
| |
| |
|
| | |
Effect of movements in exchange rates |
|
| ( |
| — |
|
| ( | |
Balance as of December 31, 2020 |
| Ps. | ( |
| Ps. | ( |
| Ps. | ( |
Amortization of the year |
|
| ( |
| ( |
|
| ( | |
Reclassification to / from PPE | | — | | ||||||
Transfer to non-current assets held for sale |
|
| — | — |
|
| — | ||
Withdrawals |
|
| |
| — |
|
| | |
Effect of movements in exchange rates |
|
| ( |
| — |
|
| ( | |
Balance as of December 31, 2021 |
| Ps. | ( |
| Ps. | ( |
| Ps. | ( |
Amortization of the year |
|
| ( | ( |
|
| ( | ||
Reclassification to / from PPE | — | — | — | ||||||
Transfer to non-current assets held for sale | — | — | — | ||||||
Withdrawals |
|
| | — |
|
| | ||
Effect of movements in exchange rates |
|
| ( | — |
|
| ( | ||
Balance as of December 31, 2022 |
| Ps. | ( |
| Ps. | ( |
| Ps. | ( |
Impairment loss | Gas and energy | Infrastructure | Total | ||||||
Balance as of January 1, 2020 | Ps. | — | Ps. | ( | Ps. | ( | |||
Impairment charge | ( | ( | ( | ||||||
Balance as of December 31, 2020 | Ps. | ( | Ps. | ( | Ps. | ( | |||
Impairment charge | ( | ( | ( | ||||||
Balance as of December 31, 2021 | Ps. | ( | Ps. | ( | Ps. | ( | |||
Impairment charge | ( | ( | ( | ||||||
Balance as of December 31, 2022 | Ps. | ( | Ps. | ( | Ps. | ( | |||
Total Intangible Assets |
| Gas and energy | Infrastructure | Total | |||||
Balance as of January 1, 2020 |
| Ps. | |
| Ps. | |
| Ps. | |
Cost |
|
| |
| |
|
| | |
Amortization |
|
| ( |
| ( |
|
| ( | |
Impairment loss | ( | ( | ( | ||||||
Balance as of December 31, 2020 (2) |
| Ps. | |
| Ps. | |
| Ps. | |
Cost |
|
| |
| |
|
| | |
Amortization |
|
| ( |
| ( |
|
| ( | |
Impairment loss | ( | ( | ( | ||||||
Balance as of December 31, 2021 (2) |
| Ps. | |
| Ps. | |
| Ps. | |
Cost |
|
| |
| |
|
| | |
Amortization |
|
| ( |
| ( |
|
| ( | |
Impairment loss | ( | ( | ( | ||||||
Balance as of December 31, 2022 (2) |
| Ps. | |
| Ps. | |
| Ps. | |
| (1) | Gas and Energy, includes borrowing costs capitalized for Ps. |
| (2) | Includes intangible assets derived from concession contracts in construction phase for Infrastructure and Gas and Energy by Ps. |
F-170
Grupo Aval Acciones y Valores S.A.
Notes to the Consolidated Financial Statements
For the years ended December 31, 2022, 2021 and 2020
(Amounts expressed in millions of Colombian pesos)
The following is a summary of the main concession contracts granted to Grupo Aval’s subsidiaries as of December 31, 2022:
Year of | ||||||||||||||
Concession | Contract | construction | % progress | Concession | ||||||||||
Owner |
| Business and country |
| Objective |
| Current stage |
| date |
| start |
| of construction |
| end date |
Gas and Energy | ||||||||||||||
Surtigas S.A. E.S.P. | Gas and Energy Colombia | Purchase, storage, packaging and distribution of gases derived from hydrocarbons. | Operation | 03/1984 to 04/1994 | 1984 | | % | 2034 to 2045 | ||||||
Transmetano E.S.P. S.A. | Gas and Energy Colombia | Construction, operation and maintenance of gas transportation systems. | Operation | 08/1994 | 1996 | | % | 2044 | ||||||
Promigas S.A. E.S.P. | Gas and Energy Colombia | Purchase, sale, transportation, distribution, exploitation and exploration of natural gas, oil and hydrocarbons in general. | Operation | 05/1976 to 11/1994 | 1976 | | % | 2026 to 2044 | ||||||
Promioriente S.A. E.S.P. | Gas and Energy Colombia | Construction, operation and maintenance of gas pipelines. | Operation | 09/1995 | 1995 | | % | 2045 | ||||||
Gases de Occidente S.A. E.S.P. | Gas and Energy Colombia | Transportation and distribution of liquefied petroleum gas and natural gas. | Operation | 08/1998 | 1998 | | % | 2047 | ||||||
Compañía Energética de Occidente S.A. E.S.P. (1) | Gas and Energy Colombia | Administrative, operational, technical and commercial management for the provision of electrical energy. | Operation and maintenance | 01/2010 | 2010 | | % | 2035 | ||||||
Sociedad Portuaria El Cayao S.A. E.S.P. | Gas and Energy Colombia | Construction, maintenance and administration of ports. | Operation | 07/2015 | 2015 | | % | 2035 | ||||||
Gases del Pacífico S.A.C. | Gas and Energy Perú | Purchase, sale, production, commercialization of energy in any of its forms. | Operation | 10/2013 | 2015 | | % | 2034 | ||||||
Gases del Norte del Perú S.A.C. | Gas and Energy Perú | Construction and distribution service of natural gas. | Construction and Operation | 11/2019 | 2020 | | % | 2051 | ||||||
Infrastructure | ||||||||||||||
Proyectos de Infraestructura S.A. | Infrastructure Colombia | Design, construction, equipment, conservation, operation and maintenance of road infrastructure. | Operation | 12/1993 | 1994 | | % | 2033 | ||||||
Concesiones CCFC S.A.S. | Infrastructure Colombia | Design, construction, equipment, conservation, operation and maintenance of road infrastructure. | Operation | 06/1995 | 2001 | | % | 2024 | ||||||
Concesionaria Panamericana S.A.S. | Infrastructure Colombia | Design, construction, equipment, conservation, operation and maintenance of road infrastructure. | Operation | 12/1997 | 2009 | | % | 2035 | ||||||
Concesionaria Vial del Pacífico S.A.S. | Infrastructure Colombia | Design, construction, equipment, conservation, operation and maintenance of road infrastructure. | Construction | 09/2014 | 2018 | | % | 2043 | ||||||
Concesionaria Nueva Vía del Mar S.A.S. | Infrastructure Colombia | Design, construction, equipment, conservation, operation and maintenance of road infrastructure. | Preconstruction | 01/2015 | 2024 | | % | 2044 | ||||||
Concesionaria Vial Andina S.A.S. | Infrastructure Colombia | Design, construction, equipment, conservation, operation and maintenance of road infrastructure. | Operation and maintenance | 06/2015 | 2016 | | % | 2054 | ||||||
Concesionaria Vial Del Oriente S.A.S. | Infrastructure Colombia | Design, construction, equipment, conservation, operation and maintenance of road infrastructure. | Construction | 07/2015 | 2018 | | % | 2043 |
(1) The concession has an investment commitment for the expansion, replacement and improvement of the infrastructure which as of December 2022 has an advance of
F-171
Grupo Aval Acciones y Valores S.A.
Notes to the Consolidated Financial Statements
For the years ended December 31, 2022, 2021 and 2020
(Amounts expressed in millions of Colombian pesos)
NOTE 17 – GOODWILL
The following table shows the movement of the goodwill balance during the years ended December 31, 2022 and 2021:
| December 31, 2022 |
| December 31, 2021 | |||
Balance at the beginning of the year |
| Ps. | |
| Ps. | |
Impairment charge (1) | ( | ( | ||||
Loss of control in subsidiary (2) | ( | — | ||||
Effect of movements in exchange rates (3)(4) |
|
| ( |
| | |
Balance at the end of the year |
| Ps. | |
| Ps. | |
| (1) | See note 17.1. Goodwill impairment. |
| (2) | See note 1.1. (A), "Discontinued operations of BAC Holding". |
| (3) | The foreign exchange adjustment is attributable to Multifinancial Group Inc. in 2022 and BAC Holding International Corp. and Multifinancial Group Inc. in 2021. |
| (4) | Includes the effect of exchange rates for the discontinued operation of BAC Holding International Corp. for Ps. ( |
The following is the detail of goodwill assigned per Cash Generating Units (CGU), representing the smallest identifiable levels which are monitored by Grupo Aval’s management and which are not greater than the business’ segments:
Goodwill carrying amount | ||||||
| December 31, |
| December 31, | |||
CGU | 2022 | 2021 | ||||
BAC Holding International Corp. (1) |
| Ps. | — |
| Ps. | |
Sociedad Administradora de Pensiones y Cesantías Porvenir S.A. |
|
| |
| | |
Banco de Bogotá S.A. over Megabanco (2) |
|
| |
| | |
Banco Popular S.A. |
|
| |
| | |
Banco de Bogotá S.A. |
|
| |
| | |
Banco de Bogotá S.A. over Multi Financial Group Inc. (3) | | | ||||
Promigas S.A. and Subsidiaries |
|
| |
| | |
Banco de Occidente S.A. |
|
| |
| | |
Concesionaria Panamericana S.A.S. (4) |
|
| |
| | |
Banco de Occidente S.A. over Banco Unión (2) |
|
| |
| | |
Hoteles Estelar S.A. |
|
| |
| | |
Concesionaria Covipacífico S.A.S. (5) |
|
| — |
| | |
| Ps. | | Ps. | | ||
| (1) | See note 1.1. (A), "Discontinued operations of BAC Holding". |
| (2) | Goodwill recognized as a result of mergers between Banco de Bogotá and Megabanco, Banco de Occidente and Banco Unión. |
| (3) | The variation presented corresponds to the foreign exchange adjustment attributable to Multi Financial Group Inc. |
| (4) | Includes recognition of impairment Ps. |
| (5) | As of December 31, 2022, it was |
The recoverable amount of each cash generating unit was determined based on a valuation carried out by an appropriate expert.
Below is the detail of the most significant values that comprise Goodwill by 2022:
A. Sociedad Administradora de Fondos de Pensiones y Cesantías Porvenir S.A.
Porvenir absorbed AFP Horizonte Pensiones y Cesantías S.A. and the goodwill in question was allocated to the groups of cash-generating units that together made up Porvenir later that same year.
The latest valuation update for the business lines of the groups of cash-generating units to which this goodwill was allocated, was done by an external adviser and reviewed by management. This valuation was conducted in February, 2023 and is based on financial statements of Porvenir on September 30, 2022. The conclusion was that there are no situations that imply a possible impairment, given that the value in use of the groups of cash generating units associated with goodwill was Ps.
F-172
Grupo Aval Acciones y Valores S.A.
Notes to the Consolidated Financial Statements
For the years ended December 31, 2022, 2021 and 2020
(Amounts expressed in millions of Colombian pesos)
The following are the main assumptions used in the impairment test reports taken as the basis for impairment testing on the dates listed, even though the valuation exercise includes a
December 31, 2022 | |||||||||||
| 2023 |
| 2024 |
| 2025 |
| 2026 |
| 2027 | ||
Interest rate on investments |
| | % | | % | | % | | % | | % |
Borrowing rate |
| | % | | % | | % | | % | | % |
Growth in income from commissions |
| ( | % | | % | | % | | % | | % |
Growth in expenses |
| ( | % | | % | | % | | % | | % |
Inflation |
| | % | | % | | % | | % | | % |
Discount interest rate after taxes |
| | % | | % | | % | | % | | % |
Growth rate after twenty years |
| | % |
|
|
|
|
|
|
| |
A
| ● | Investments and borrowing rates were projected using historical data and data provided by the Company on the business. |
| ● | The estimated increases in commissions and expenses are based on business growth and other transactions estimated by the Company. |
| ● | The inflation rate used in the projections is based on reports from outside sources, such as Oxford Economist. |
| ● | The growth rate used for the terminal value was |
The after-tax discount interest rate that was used to discount dividend flows reflects the specific risks relative to each cash-generating unit. If the estimated discount rate had been
B. Cash-generating units inside Banco de Bogotá
Goodwill was generated in 2006 with the acquisition of
The latest valuation update for the business lines of the groups of cash-generating units to which this goodwill was allocated, was performed by an independent adviser and reviewed by management. This valuation was conducted in February 2023 and is based on Banco de Bogotá´s financial statements as of September 30, 2022. It was concluded that there are no situations that imply a possible impairment, given that the value in use of the groups of cash generating units associated with goodwill was Ps.
The following table shows the main assumptions used in the latest impairment tests of the groups of cash-generating units with allocated goodwill.
December 31, 2022 | |||||||||||
| 2023 |
| 2024 |
| 2025 |
| 2026 |
| 2027 | ||
Lending rate on the loan portfolio and investments |
| | % | | % | | % | | % | | % |
Borrowing rate |
| | % | | % | | % | | % | | % |
Growth in income from commissions |
| | % | | % | | % | | % | | % |
Growth in expenses |
| | % | | % | | % | | % | | % |
Inflation |
| | % | | % | | % | | % | | % |
Discount rate after taxes |
| | % | | % | | % | | % | | % |
Growth rate after five years |
| | % |
|
|
|
|
|
|
| |
A
F-173
Grupo Aval Acciones y Valores S.A.
Notes to the Consolidated Financial Statements
For the years ended December 31, 2022, 2021 and 2020
(Amounts expressed in millions of Colombian pesos)
| ● | The lending rates on loans and investments were projected based on the company and independent specialist expectations. |
| ● | The borrowing rates were projected based on the company and independent specialist expectations. |
| ● | Estimated growths for commissions are based on historical percentages. The commission income was estimated as a percentage of net portfolio and the commission expense was calculated as a percentage of deposits. |
| ● | Estimated growth for expenses are based on the growth expectations of the company to support the growth of assets and the development of its operation. |
| ● | The inflation used in the projections is based on reports from external sources such as Oxford Economics. |
| ● | The growth rate used for the terminal value was |
The discount rate after taxes used to discount dividend flows reflects the specific risks relative to each cash-generating unit. If the estimated discount rate had been
C. Banco Popular S.A.
The acquisition process of Grupo Aval's stake in Banco Popular S.A. began in December 2006 and ended in September 2011, where Grupo Aval closed with a direct participation of
The latest valuation update for the business lines of the groups of cash-generating units to which this goodwill was allocated, was performed by an independent adviser and reviewed by management. This valuation was conducted in March 2023 and is based on Banco Popular´s financial statements as of September 30, 2022. It was concluded that there are no situations that imply a possible impairment, given that the value in use of the groups of cash generating units associated with goodwill was Ps.
The following table shows the main assumptions used in the latest impairment tests of the groups of cash-generating units with allocated goodwill.
December 31, 2022 | |||||||||||
| 2023 |
| 2024 |
| 2025 |
| 2026 |
| 2027 | ||
Lending rate on the loan portfolio and investments |
| | % | | % | | % | | % | | % |
Borrowing rate |
| | % | | % | | % | | % | | % |
Growth in income from commissions |
| | % | | % | | % | | % | | % |
Growth in expenses |
| | % | | % | | % | | % | | % |
Inflation |
| | % | | % | | % | | % | | % |
Discount rate after taxes |
| | % | | % | | % | | % | | % |
Growth rate after five years |
| | % |
|
|
|
|
|
|
| |
A
| ● | The lending rates on loans and investments were projected based on the company and independent specialist expectations. |
| ● | The borrowing rates were projected based on the company and independent specialist expectations. |
| ● | Estimated growths for commissions are based on historical percentages. The commission income was estimated as a percentage of net portfolio and the commission expense was calculated as a percentage of deposits. |
| ● | Estimated growth for expenses are based on the growth expectations of the company to support the growth of assets and the development of its operation. |
| ● | The inflation used in the projections is based on reports from external sources such as Oxford Economics. |
| ● | The growth rate used for the terminal value was |
The discount rate after taxes used to discount dividend flows reflects the specific risks relative to each cash-generating unit. If the estimated discount rate had been
F-174
Grupo Aval Acciones y Valores S.A.
Notes to the Consolidated Financial Statements
For the years ended December 31, 2022, 2021 and 2020
(Amounts expressed in millions of Colombian pesos)
D. Banco de Bogotá S.A.
As of December 31, 2022, Grupo Aval has a direct participation in Banco de Bogotá of
The latest valuation update for the business lines of the groups of cash-generating units to which this goodwill was allocated, was performed by an independent adviser and reviewed by management. This valuation was conducted in March 2023 and is based on Banco de Bogotá´s financial statements as of September 30, 2022. It was concluded that there are no situations that imply a possible impairment, given that the value in use of the groups of cash generating units associated with goodwill was Ps.
The following table shows the main assumptions used in the latest impairment tests of the groups of cash-generating units with allocated goodwill.
December 31, 2022 | |||||||||||
| 2023 |
| 2024 |
| 2025 |
| 2026 |
| 2027 | ||
Lending rate on the loan portfolio and investments |
| | % | | % | | % | | % | | % |
Borrowing rate |
| | % | | % | | % | | % | | % |
Growth in income from commissions |
| | % | | % | | % | | % | | % |
Growth in expenses |
| | % | | % | | % | | % | | % |
Inflation |
| | % | | % | | % | | % | | % |
Discount rate after taxes |
| | % | | % | | % | | % | | % |
Growth rate after five years |
| | % |
|
|
|
|
|
|
| |
A
| ● | The lending rates on loans and investments were projected based on the company and independent specialist expectations. |
| ● | The borrowing rates were projected based on the company and independent specialist expectations. |
| ● | Estimated growths for commissions are based on historical percentages. The commission income was estimated as a percentage of net portfolio and the commission expense was calculated as a percentage of deposits. |
| ● | Estimated growth for expenses are based on the growth expectations of the company to support the growth of assets and the development of its operation. |
| ● | The inflation used in the projections is based on reports from external sources such as Oxford Economics. |
| ● | The growth rate used for the terminal value was |
The discount rate after taxes used to discount dividend flows reflects the specific risks relative to each cash-generating unit. If the estimated discount rate had been
E. Multi Financial Group Inc.
On May 22, 2020, Banco de Bogotá acquired
As of September 2021, Leasing Bogotá Panama changed its business name to BAC Holding International (BAC Holding) and spun-off Multi Financial Group. As a result, Banco de Bogotá took control of the company through Multi Financial Holding, therefore the goodwill of Bac Credomatic and its subsequent acquisitions belong to BAC Holding International, and the goodwill of Multi Financial Group belongs to Multi Financial Holding.
The latest valuation update for the business lines of the groups of cash-generating units to which this goodwill was allocated, was performed by an independent adviser and reviewed by management. This valuation was conducted in February 2023 and is based on
F-175
Grupo Aval Acciones y Valores S.A.
Notes to the Consolidated Financial Statements
For the years ended December 31, 2022, 2021 and 2020
(Amounts expressed in millions of Colombian pesos)
Multi Financial Group´s financial statements as of September 30, 2022. It was concluded that there are no situations that imply a possible impairment, given that the value in use of the groups of cash generating units associated with goodwill was Ps.
The following table shows the main assumptions used in the latest impairment tests of the groups of cash-generating units with allocated goodwill.
December 31, 2022 | |||||||||||
| 2023 |
| 2024 |
| 2025 |
| 2026 |
| 2027 | ||
Lending rate on the loan portfolio and investments |
| | % | | % | | % | | % | | % |
Borrowing rate |
| | % | | % | | % | | % | | % |
Growth in income from commissions |
| | % | | % | | % | | % | | % |
Growth in expenses |
| | % | | % | | % | | % | | % |
Discount rate after taxes |
| | % |
|
|
|
|
|
|
| |
Growth rate after ten years |
| | % |
|
|
|
|
|
|
| |
The averages of the main premises used are listed in the foregoing tables. The following is a description of that process.
| ● | Lending rates on loans and investments were projected based on historical data and on the management expectations, considering the competitiveness of the different services in their respective markets and the growth strategies for each segment. |
| ● | For its part, for the growth in commissions was projected considering the increase in loan portfolios; this allows promoting greater income collection through products and services such as insurance, memberships, exchange commissions, among others, as well as the implementation of new services. As well as more competitive markets over the projected timeline. |
| ● | The future flows of funds are denominated in US dollars and are discounted at a nominal rate in US dollars, estimated as "Ke". |
| ● | The discount rate has been estimated considering the risk profile of the market where MFG operates. |
| ● | To estimate the terminal value, a perpetuity has been projected based on the normalized cash flow, adjusted according to the expectations of stabilized long-term growth. This evolution is in line with the long-term average growth rate for the country's economy. In this case, an annual long-term average nominal growth rate in dollars of |
The discount rate after taxes used to discount dividend flows reflects the specific risks relative to each cash-generating unit. If the
As of December 31, 2021, the main values that made up the goodwill were the following:
A. BAC Holding International Corp.
On December 9, 2010, Banco de Bogotá S.A. acquired control of BAC Credomatic Inc. (BAC COM) through its subsidiary BAC Holding International Corp. (BAC Holding), which is the Panamanian company that executed the purchase agreement. BAC Credomatic Inc. (BAC COM), a company incorporated to do business under the laws of the British Virgin Islands, is the owner of Banco BAC International Bank, Inc. and the operations of BAC Credomatic Inc. (BAC) in Central America.
With the acquisition of BAC COM, through BAC Holding, BAC’s corporate structure now is controlled by Banco de Bogotá S.A., which is controlled, in turn, by Grupo Aval. Goodwill was generated and recognized as a result of that operation. Banco de Bogotá was authorized by the Superintendency of Finance to make this acquisition, through its subsidiary BAC Holding International Corp, as indicated in Official Notice 2010073017- 048 dated December 3, 2010.
Later,
In addition,
F-176
Grupo Aval Acciones y Valores S.A.
Notes to the Consolidated Financial Statements
For the years ended December 31, 2022, 2021 and 2020
(Amounts expressed in millions of Colombian pesos)
Finance authorized Banco de Bogotá to acquire these banks, through its subsidiaries Credomatic International Corporation and BAC Credomatic Inc., as per Official Notice 2013068082-062 dated December 3, 2013.
During 2015, Credomatic International Corporation, a subsidiary of the company, acquired
As of September 2021, Leasing Bogotá S.A Panama changed its corporate name to BAC Holding International Corp. and spun-off Multi Financial Group Inc. in favor of Banco de Bogotá through Multi Financial Holding (See note 1). In this sense, the goodwill of BAC Credomatic and its subsequent acquisitions were registered in BAC Holding International Corp. and the goodwill of Multi Financial Group Inc. in Multi Financial Holding.
The latest valuation update for the groups of cash generating units to which this goodwill was allocated was carried out by an independent adviser and reviewed by Management in January 2022, based on the financial statements of BAC Credomatic on September 30, 2021. The conclusion was that there are no circumstances that could indicate a possible impairment, given that the value in use of the groups of cash generating units associated with goodwill of Ps.
The following table shows the averages of the main assumptions used in the reports on impairment analysis of the cash-generating units with allocated goodwill, based on the impairment assessments carried out on the indicated dates. Although the valuation exercise includes a
December 31, 2021 | |||||||||||
| 2022 |
| 2023 |
| 2024 |
| 2025 |
| 2026 | ||
Lending rate on the loan portfolio and investments |
| | % | | % | | % | | % | | % |
Borrowing rate |
| | % | | % | | % | | % | | % |
Growth in income from commissions |
| | % | | % | | % | | % | | % |
Growth in expenses |
| | % | | % | | % | | % | | % |
Discount rate after taxes |
| | % | ||||||||
Growth rate after five years |
| | % |
|
|
|
|
|
|
| |
A
| ● | Lending rates on loans and investments were projected based on historical data and on the expectations of management in each of the countries where BAC Credomatic Inc. operates, considering the competitiveness of the different services in their respective markets and the growth strategies for each segment. The projection on US Federal Reserve rates was taken into account as well, since these rates serve as a basis for international banking rates. |
| ● | Growth in income from commissions was projected in line with the growth in BAC Credomatic´s active portfolio, which allows for greater income through products and services like insurance, memberships. commissions on foreign currency exchange and also the implementation of new services among others. Competitive markets were also considered in the projected time horizon elapsed. |
| ● | Although the functional or reporting currency of the business is that of each country in the region where BAC Credomatic Inc.´s. subsidiaries operate, the future flows of funds have been converted into nominal U.S. dollars in each projected period, discounted at a nominal rate in U.S. dollars, net of income tax, estimated as cost of equity ("Ke"). A discount rate in U.S. dollars is used, given that a consistent discount rate in the respective local currencies cannot be estimated due to of the lack of required data. |
| ● | The discount rate has been estimated considering of the risk profile of each of the markets where BAC Credomatic Inc. operates. |
F-177
Grupo Aval Acciones y Valores S.A.
Notes to the Consolidated Financial Statements
For the years ended December 31, 2022, 2021 and 2020
(Amounts expressed in millions of Colombian pesos)
| ● | To estimate the terminal value, the normalized flow of funds, adjusted according to growth expectations, was projected in perpetuity. This projection does not exceed the average long-term rate of growth for the economies in each of the countries where BAC operates. An annual growth rate of |
The after-tax discount rate used to discount the dividend flows reflects the specific risks relative to the CGU and the markets where BAC Credomatic operates, as mentioned earlier. Had the US dollar denominated estimated discount rate been
B. Sociedad Administradora de Fondos de Pensiones y Cesantías Porvenir S.A.
Porvenir absorbed AFP Horizonte Pensiones y Cesantías S.A. and the goodwill in question was allocated to the groups of cash-generating units that together made up Porvenir later that same year.
The latest valuation update for the business lines of the groups of cash-generating units to which this goodwill was allocated, was done by an external adviser and reviewed by management. This valuation was conducted in January 2022 and is based on financial statements of Porvenir on September 30, 2021. The conclusion was that there are no situations that imply a possible impairment, given that the value in use of the groups of cash generating units associated with goodwill was Ps.
The following are the main assumptions used in the impairment test reports taken as the basis for impairment testing on the dates listed, even though the valuation exercise includes a
December 31, 2021 | |||||||||||
| 2022 |
| 2023 |
| 2024 |
| 2025 |
| 2026 | ||
Interest rate on investments |
| | % | | % | | % | | % | | % |
Borrowing rate |
| | % | | % | | % | | % | | % |
Growth in income from commissions |
| ( | % | | % | | % | | % | | % |
Growth in expenses |
| ( | % | ( | % | | % | | % | | % |
Inflation |
| | % | | % | | % | | % | | % |
Discount interest rate after taxes |
| | % | | % | | % | | % | | % |
Growth rate after twenty years |
| | % |
|
|
|
|
|
|
| |
A
| ● | Investments and borrowing rates were projected using historical data and data provided by the Company on the business. |
| ● | The estimated increases in commissions and expenses are based on business growth and other transactions estimated by the Company. |
| ● | The inflation rate used in the projections is based on reports from outside sources, such as The Economist Intelligence Unit, and intra-group sources such as Corficolombiana´s research team. |
| ● | The growth rate used for the terminal value was |
The after-tax discount interest rate that was used to discount dividend flows reflects the specific risks relative to each cash-generating unit. If the estimated discount rate had been
C. Cash-generating units inside Banco de Bogotá
Goodwill was generated in 2006 with the acquisition of
The latest valuation update for the business lines of the groups of cash-generating units to which this goodwill was allocated, was performed by an independent adviser and reviewed by management. This valuation was conducted in January 2022 and is based on
F-178
Grupo Aval Acciones y Valores S.A.
Notes to the Consolidated Financial Statements
For the years ended December 31, 2022, 2021 and 2020
(Amounts expressed in millions of Colombian pesos)
Banco de Bogotá´s financial statements as of September 30, 2021. It was concluded that there are no situations that imply a possible impairment, given that the value in use of the groups of cash generating units associated with goodwill was Ps.
The following table shows the main assumptions used in the latest impairment tests of the groups of cash-generating units with allocated goodwill.
December 31, 2021 | |||||||||||
| 2022 |
| 2023 |
| 2024 |
| 2025 |
| 2026 | ||
Lending rate on the loan portfolio and investments |
| | % | | % | | % | | % | | % |
Borrowing rate |
| | % | | % | | % | | % | | % |
Growth in income from commissions |
| | % | | % | | % | | % | | % |
Growth in expenses |
| | % | | % | | % | | % | | % |
Inflation |
| | % | | % | | % | | % | | % |
Discount rate after taxes |
| | % | | % | | % | | % | | % |
Growth rate after five years |
| | % |
|
|
|
|
|
|
| |
A
The following is a description of that process.
| ● | The lending rates on loans and investments were projected based on the Company expected rates and lending rates from independent specialists (The Economist Intelligence Unit "EIU") |
| ● | The borrowing rates were projected based on the Company´s expected rates and the money market interest rate from EIU. |
| ● | Estimated growth of commissions is based on its historical ratio to the gross loan portfolio. |
| ● | Estimated growth in expenses is based on the inflation’s growth and/or its historical percentage over revenues. |
| ● | The inflation rate used in the projections is based on reports from outside sources, such as The Economist Intelligence Unit, and intra-group sources such as Corficolombiana´s research team. |
| ● | The growth rate used for the terminal value was |
The discount rate after taxes used to discount dividend flows reflects the specific risks relative to each cash-generating unit. If the estimated discount rate had been
17.1. Goodwill Impairment
Below is the detail of the most significant values that comprise impairment charge of Goodwill:
| A) | Concesionaria Panamericana S.A.S. |
The recoverable amount for Concesionaria Panamericana S.A.S., has been calculated based on its value in use, determined by discounting the future free cash flows expected for the reminder of the concession term, using the estimated discount rate WACC
Under the following assumptions, the recoverable amount as of Ps.
| • | The valuation horizon of the model is given by the remaining validity period of the concession, which ends in May, 2035. |
F-179
Grupo Aval Acciones y Valores S.A.
Notes to the Consolidated Financial Statements
For the years ended December 31, 2022, 2021 and 2020
(Amounts expressed in millions of Colombian pesos)
| • | Given that the concession has a determined period of execution, the goodwill has a “determined useful life” and in this sense it was expected that in the last years of administration and operation of the concession the goodwill paid would begin its process of deterioration. |
| • | Panamericana´s income is made up of income from tolls, as well as future periods for additional works carried out. Toll revenues are updated by verifying the traffic study (actual validation of traffic), considering the category of vehicles and incorporating the percentage of growth expected for each year of the concession. Additionally, travel fares are updated based on the variation observed in the CPI (in some cases additional growth is incorporated). Revenues for future terms, agreed in constant pesos in the concession contract, are updated with the CPI variation corresponding to the period in which they are received by the concessionaire. |
| • | Internal projections of costs and expenses to be incurred for Administration, Operation and Maintenance are used, considering compliance with contractual obligations, as well as service level indicators. |
NOTE 18 – OTHER INTANGIBLE ASSETS
The following table shows the movements of the other intangible assets during years ended on December 31, 2022, 2021 and 2020:
| Internally generated |
| Separate | |||||||||
Developing | In use | acquisition | Total | |||||||||
Balance as of January 1, 2020 |
| Ps. | | Ps. | | Ps. | | Ps. | | |||
Business combination (1) | — | — | | | ||||||||
Capitalizations / Acquisitions / Purchases | | — | | | ||||||||
Amortization | — | ( | ( | ( | ||||||||
Transfers | ( | | | — | ||||||||
Withdrawals | ( | ( | ( | ( | ||||||||
Discontinued operations (2) | — | — | ( | ( | ||||||||
Reclassification BAC (2)(3) | — | — | | | ||||||||
Effect of movements in exchange rates | ( | — | ( | ( | ||||||||
Balance as of December 31, 2020 | Ps. | | Ps. | | Ps. | | Ps. | | ||||
Capitalizations / Acquisitions / Purchases | | — | | | ||||||||
Amortization | — | ( | ( | ( | ||||||||
Impairment loss | — | — | ( | ( | ||||||||
Transfers | ( | | | — | ||||||||
Withdrawals | ( | ( | ( | ( | ||||||||
Discontinued operations (2) | | — | ( | ( | ||||||||
Reclassification BAC (2)(3) | — | — | | | ||||||||
Effect of movements in exchange rates | | — | | | ||||||||
Balance as of December 31, 2021 | Ps. | | Ps. | | Ps. | | Ps. | | ||||
Capitalizations / Acquisitions / Purchases | | — | | | ||||||||
Amortization | — | ( | ( | ( | ||||||||
Impairment loss | — | — | — | — | ||||||||
Transfers | ( | | | — | ||||||||
Withdrawals | ( | ( | ( | ( | ||||||||
Discontinued operations (2) | — | — | ( | ( | ||||||||
Loss of control in subsidiary (2) | ( | — | ( | ( | ||||||||
Effect of movements in exchange rates | | — | | | ||||||||
Balance as of December 31, 2022 | Ps. | | Ps. | | Ps. | | Ps. | | ||||
| (1) | Includes recognition of the business combination on Multi Financial Group, Inc., (see note 35). Licenses, software and information technology applications Ps. |
| (2) | See note 1.1 “Discontinued operations of BAC Holding”. |
| (3) | Correspond to reclassification for comparability of the movements of BAC Holding consider the deconsolidation of this entity during year 2022. |
F-180
Grupo Aval Acciones y Valores S.A.
Notes to the Consolidated Financial Statements
For the years ended December 31, 2022, 2021 and 2020
(Amounts expressed in millions of Colombian pesos)
NOTE 19 – INCOME TAX
19.1 Components of the income tax expense:
The income tax expense for the years ended on December 31, 2022, 2021 and 2020 comprises the following:
|
| December 31, |
| December 31, |
| December 31, | |||
2022 | 2021 | 2020 | |||||||
Current period income tax |
| Ps. | |
| Ps. | |
| Ps. | |
Income tax surcharge (1) |
|
| |
| |
| | ||
Subtotal current period taxes |
| Ps. | |
| Ps. | |
| Ps. | |
Prior years adjustments (2) |
|
| ( |
| ( |
| ( | ||
Adjustment due to settlement of uncertain tax positions from prior years |
|
| ( |
| ( |
| | ||
Deferred taxes | |||||||||
Deferred taxes current period |
|
| |
| |
| | ||
Deferred taxes - Prior years adjustments (3) | | | | ||||||
Subtotal deferred taxes |
| Ps. | |
| Ps. | |
| Ps. | |
Total continuing operations |
| Ps. | |
| Ps. | |
| Ps. | |
Discontinued operations (4) |
| Ps. | | Ps. | | Ps. | | ||
Total |
| Ps. | |
| Ps. | |
| Ps. | |
| (1) | Financial institutions in Colombia whose net annual tax income is greater than |
| (2) | In 2022, a current tax was recovery were recorded in Banco AV Villas for Ps. |
| (3) | In 2022, the adjustment from prior periods is comprised by Ps. |
| (4) | See note 1.1 “Discontinued operations of BAC Holding”. |
19.2 Reconciliation of the Nominal Tax Rate and the Effective tax Rate:
The following are the existing legal provisions related to income tax:
In Colombia
The tax rules in relation to the income tax applicable during the years 2022, 2021 and 2020, among other things, establish the following:
| ● | The income tax rate to be |
| ● | Gains on the sale or disposal of non-current assets held for more than two years is taxed at |
| ● | Gains of the entities that belong to the special free zone regime in Colombia is taxed at |
| ● | The tax rate on presumptive income is calculated to |
F-181
Grupo Aval Acciones y Valores S.A.
Notes to the Consolidated Financial Statements
For the years ended December 31, 2022, 2021 and 2020
(Amounts expressed in millions of Colombian pesos)
| ● | In 2022, 2021 and 2019, an income tax discount of |
| ● | Tax loss carry-forwards incurred since 2017 may be offset against company taxable income over the following twelve years. Tax loss-carry forwards incurred prior to 2017 may be offset on the same terms applicable for 2016, but they may not be fiscally readjusted. |
| ● | The “presumptive income” incurred since 2017 may be offset by taxable income over the following five years. Considering that presumptive income only existed in Colombia until 2020, the excess presumptive income generated in 2020 will be the last subject to compensation in subsequent years. |
| ● | Social Investment Law extended the audit benefit for the years 2022 and 2023 for taxpayers who increase the net income tax for the taxable year in relation to the net income tax of the prior year by at least |
| ● | The term of finality of the tax return taxpayers who determine or compensate for tax losses or are subject to the transfer pricing regime will be 5 years since Law 2010 of 2019. |
In December 2022, the National Government sanctioned Law 2277 of 2022 through which it adopts a new tax reform that will apply as of fiscal year 2023. This Law includes, among other things, the following:
| ● | On Income a tax rate applicable to companies as of 2023 continues to be |
| ● | Tax rate of gains on the sale or disposal of non-current assets goes from |
| ● | Sale of shares listed on a Colombian Stock Exchange owned by the same real beneficiary is considered nontaxable income, provided that the sale does not exceed |
| ● | Repealed the norm that blocked the distribution of profits in shares as an income that was not taxable income. |
| ● | Created a minimum tax rate of |
| ● | It included a limit on some income that does not constitute income, special deductions, exempt income and tax discounts that may not exceed |
| ● | Repealed article 158-1, eliminating the possibility of deducting the costs and expenses associated with investments in Science Technology and Innovation (CTeI), that is, these investments will only give the right to a tax discount. The possibility of taking |
| ● | Eliminates the possibility of taking as a tax discount |
| ● | Modifies the |
F-182
Grupo Aval Acciones y Valores S.A.
Notes to the Consolidated Financial Statements
For the years ended December 31, 2022, 2021 and 2020
(Amounts expressed in millions of Colombian pesos)
| ● | Dividends declared charged to profits from 2016 and prior years will retain the current treatment for that moment, and those corresponding to profits obtained from 2017 that are decreed from 2023, will be governed by the rates set forth in the Law 2277 of December 2022. |
Above rate changes, although they apply for the determination of income taxes for the years 2023 and following, since December 2022 affect the calculation of the deferred tax and therefore affect the effective tax rate for the year 2022.
In other countries
After the spin-off of BAC Holding, the international presence of Grupo Aval includes participation in jurisdictions such as Panama, Peru and Barbados. Subsidiaries with a local license in Panama are taxed at a rate of
Previously, BAC Holding through its subsidiaries had a presence in Central America as well: BAC Holding had an international license in Panamá it is subject to a tax rate of
Below is the detailed reconciliation between total expenses of the income tax of Grupo Aval calculated at the applicable enacted tax rate and the tax expense recognized in the statement of income for the years ended on December 31, 2022, 2021 and 2020:
Years ended on: |
| |||||||||
| December 31, |
| December 31, |
| December 31, |
| ||||
2022 | 2021 | 2020 |
| |||||||
Profit before income tax |
| Ps. | |
| Ps. | |
| Ps. | | |
Enacted tax rate in Colombia |
|
| | % | | % | | % | ||
Theoretical income tax expense |
|
| |
| |
| | |||
Nondeductible expenses |
|
| |
| |
| | |||
Tax losses considered non recoverable for income tax purpose (1) |
|
| |
| |
| | |||
Presumptive income considered non recoverable for income tax purpose |
|
| ( |
| ( |
| ( | |||
Nontaxable dividends |
|
| ( |
| ( |
| ( | |||
Nontaxable income under equity method in associates |
|
| ( |
| ( |
| ( | |||
Profit (loss) on sales or appraisal of investment |
|
| ( |
| ( |
| | |||
Nontaxable interest income and other income |
|
| ( |
| ( |
| ( | |||
Other nontaxable income | ( |
| ( | ( | ||||||
Non-accountable tax revenues in Sale of BHI |
|
| |
| — |
| — | |||
Revenues taxable at different tax rate |
|
| |
| |
| | |||
Tax benefits in the acquisition of property and equipment |
|
| ( |
| ( |
| ( | |||
Tax Discounts (2) | ( | ( | ( | |||||||
Profits (losses) in Subsidiaries in tax free countries or with different tax rate |
|
| ( |
| ( |
| ( | |||
Effect on the deferred income tax due to changes in tax rates (3) |
|
| |
| |
| ( | |||
Prior year adjustments |
|
| ( |
| ( |
| ( | |||
Adjustments due to uncertain tax positions in previous year |
|
| ( |
| ( |
| | |||
Deferred taxes - Prior years adjustments | | | | |||||||
With holding tax | | | | |||||||
Other |
|
| |
| |
| | |||
Total tax expense of the year |
| Ps. | |
| Ps. | |
| Ps. | | |
Effective income tax rate |
|
| | % | | % | | % |
| (1) | In 2022 Corficolombiana and its subsidiaries recorded tax losses on which no deferred tax asset was recorded for Ps. |
| (2) | Corresponds to the Industry and Commerce Tax (ICA for this acronym in Spanish) wich could be used as a tax discount under during 2019 Law 1943 of 2018 with continues with Law 2155 of 2021. |
| (3) | Corresponds to the effect of the difference in rate applied by entities with respect to the statutory rate of |
F-183
Grupo Aval Acciones y Valores S.A.
Notes to the Consolidated Financial Statements
For the years ended December 31, 2022, 2021 and 2020
(Amounts expressed in millions of Colombian pesos)
19.3 Tax Losses and excess of Presumptive Income:
The following table shows the detail of the tax loss carry forward and excess of presumptive income over taxable income of the entities of Grupo Aval which are not recognized as deferred tax assets, as of December 31, 2022 and 2021.
| December 31, |
| December 31, | |||
2022 | 2021 | |||||
Tax loss carry forwards expiring on: |
|
|
|
| ||
December 31, 2023 |
| Ps. | |
| Ps. | — |
December 31, 2024 | | | ||||
December 31, 2025 |
|
| |
| — | |
December 31, 2026 |
|
| |
| — | |
December 31, 2029 |
|
| |
| | |
December 31, 2030 | | | ||||
December 31, 2031 | | | ||||
December 31, 2032 |
|
| |
| | |
December 31, 2033 | | | ||||
December 31, 2034 | | | ||||
December 31, 2035 | | | ||||
December 31, 2036 | — | | ||||
Without expiration date |
|
| |
| | |
Subtotal |
| Ps. | |
| Ps. | |
Excess of presumptive income expiring on: |
|
|
| |||
December 31, 2022 |
| Ps. | — |
| Ps. | |
December 31, 2023 |
|
| |
| | |
December 31, 2024 |
|
| |
| | |
December 31, 2025 |
|
| |
| | |
Subtotal |
| Ps. | |
| Ps. | |
Total |
| Ps. | |
| Ps. | |
19.4 Deferred Taxes from Investments in Subsidiaries:
Grupo Aval did not record income tax liabilities related to temporary differences on investment subsidiaries of Ps.
F-184
Grupo Aval Acciones y Valores S.A.
Notes to the Consolidated Financial Statements
For the years ended December 31, 2022, 2021 and 2020
(Amounts expressed in millions of Colombian pesos)
19.5 Deferred taxes by Type of Temporary Difference:
The differences between the carrying value of the assets and liabilities and their tax bases give rise to the following temporary differences which result in deferred taxes, calculated and recorded in the years ended on December 31, 2022, 2021 and 2020, based on current tax regulations as references for the years wherein such temporary differences will be reverted:
Year ended on December 31, 2022
|
| Balance as of |
| Credited |
| Credited |
| Foreign exchange |
| Balance as of | |||||||||||
January 1, | Loss of control | Discontinued | (charged) to | (charged) to | adjustments and | December 31, | |||||||||||||||
2022 | in a Subsidiary (1) | operations (1) | profit or loss | OCI | reclassifications | 2022 | |||||||||||||||
Deferred tax assets |
|
|
|
|
|
|
|
|
|
|
|
| |||||||||
Debt securities at fair value |
| Ps. | | Ps. | ( | Ps. | | Ps. | | Ps. | | Ps. | ( | Ps. | | ||||||
Equity securities at fair value |
| |
| — | — | ( |
| |
| — |
| | |||||||||
Derivative instruments |
| |
| | — | ( |
| ( |
| ( |
| | |||||||||
Allowance of investments securities |
| |
| — | — | |
| — |
| — |
| | |||||||||
Accounts receivable | | — | — | | — | | | ||||||||||||||
Allowance for accounts receivable |
| |
| — | — | |
| — |
| |
| | |||||||||
Loans and receivables |
| |
| — | — | ( |
| — |
| — |
| | |||||||||
Allowance for impairment on loans and receivables |
| |
| ( | | ( |
| |
| |
| | |||||||||
Allowance for foreclosed assets |
| |
| ( | | ( |
| — |
| |
| | |||||||||
Property, plant and equipment costs |
| |
| — | — | ( |
| — |
| |
| | |||||||||
Depreciation of property, plant and equipment |
| |
| — | — | ( |
| — |
| ( |
| | |||||||||
Investment property |
| |
| — | — | |
| ( |
| — |
| | |||||||||
Deferred charges and of intangible assets |
| |
| — | — | ( |
| — |
| — |
| | |||||||||
Tax losses carry forward |
| |
| — | — | |
| — |
| |
| | |||||||||
Surplus of presumptive income |
| |
| — | — | |
| — |
| |
| | |||||||||
Provisions |
| |
| ( | ( | |
| — |
| |
| | |||||||||
Employee benefits |
| |
| ( | ( | |
| ( |
| ( |
| | |||||||||
Financial assets in concession contracts | | — | — | | — | — | | ||||||||||||||
Biological assets | | — | — | | — | — | | ||||||||||||||
Lease agreements | | ( | ( | | — | ( | | ||||||||||||||
Foreign currency bonds | | | — | | ( | — | | ||||||||||||||
Other |
| |
| — | — | |
| | |
| | ||||||||||
Subtotal |
| Ps. | |
| Ps. | | Ps. | | Ps. | |
| Ps. | ( |
| Ps. | |
| Ps. | | ||
|
|
|
|
| |||||||||||||||||
Deferred tax liabilities | |||||||||||||||||||||
Debt securities at fair value |
| Ps. | ( |
| Ps. | | Ps. | ( | Ps. | ( | Ps. | | Ps. | ( |
| Ps. | ( | ||||
Equity securities at fair value |
| ( | | | ( | ( | | ( | |||||||||||||
Derivative instruments |
| ( |
| — | — | ( | | ( |
| ( | |||||||||||
Accounts receivable | ( | — | — | ( | — | | ( | ||||||||||||||
Allowance of investments securities |
| ( |
| — | ( | | — | — |
| ( | |||||||||||
Loans and receivables | ( | — | — | ( | — | — | ( | ||||||||||||||
Allowance for impairment on loans and receivables |
| ( |
| | — | ( | — | — |
| ( | |||||||||||
Foreclosed assets |
| ( |
| — | — | ( | — | — |
| ( | |||||||||||
Provision for foreclosed assets |
| ( |
| | | | — | |
| — | |||||||||||
Property plant and equipment costs |
| ( |
| | | ( | — | ( |
| ( | |||||||||||
Depreciation of property, plant and equipment |
| ( |
| — | — | ( | — | ( |
| ( | |||||||||||
Investment property |
| ( |
| — | — | ( | ( | ( |
| ( | |||||||||||
Right-of-use |
| ( |
| | | ( | — | |
| ( | |||||||||||
Deferred charges and of intangible assets |
| ( |
| | ( | ( | — | ( |
| ( | |||||||||||
Provisions |
| ( |
| | | | — | ( |
| ( | |||||||||||
Employee benefits | ( | | ( | ( | ( | | ( | ||||||||||||||
Goodwill | ( | — | — | | — | — | ( | ||||||||||||||
Deferred Income | ( | — | — | ( | — | — | ( | ||||||||||||||
Financial assets in concession arrangements | ( | — | — | | — | ( | ( | ||||||||||||||
Intangible assets in concession arrangements | ( |
| — | — | ( | — | ( | ( | |||||||||||||
Biological assets |
| ( |
| — | — | ( | — | — |
| ( | |||||||||||
Lease agreements | ( | — | — | ( | — | ( | ( | ||||||||||||||
Other |
| ( |
| ( | ( | ( | ( | |
| ( | |||||||||||
Subtotal |
| Ps. | ( |
| Ps. | | Ps. | ( | Ps. | ( |
| Ps. | ( |
| Ps. | ( |
| Ps. | ( | ||
Total |
| Ps. | ( |
| Ps. | | Ps. | ( | Ps. | ( |
| Ps. | ( |
| Ps. | ( |
| Ps. | ( | ||
(1) See note 1.1 “Discontinued operations of BAC Holding”.
F-185
Grupo Aval Acciones y Valores S.A.
Notes to the Consolidated Financial Statements
For the years ended December 31, 2022, 2021 and 2020
(Amounts expressed in millions of Colombian pesos)
Year ended on December 31, 2021
|
| Balance as of |
| Credited |
| Credited |
| Foreign |
| Balance as of | ||||||||
January 1, | Discontinued | (charged) to | (charged) to | exchange |
| December 31, | ||||||||||||
2021 | operations (1) | profit or loss | OCI | adjustments |
| 2021 | ||||||||||||
Deferred tax assets |
|
|
|
|
|
| ||||||||||||
Debt securities at fair value | Ps. | | Ps. | ( | Ps. | | Ps. | | Ps. | ( | Ps. | | ||||||
Equity securities at fair value | | — |
| |
| — |
| — |
| | ||||||||
Derivative instruments | | — |
| ( |
| |
| ( |
| | ||||||||
Allowance of investments securities | | — |
| |
| — |
| — |
| | ||||||||
Accounts receivable | | — | | — | ( | | ||||||||||||
Allowance for accounts receivable | | — |
| |
| — |
| — |
| | ||||||||
Loans and receivables | | — |
| ( |
| — |
| ( |
| | ||||||||
Allowance for impairment on loans and receivables | | ( |
| |
| — |
| |
| | ||||||||
Allowance for foreclosed assets | | |
| ( |
| — |
| |
| | ||||||||
Property, plant and equipment costs | | — |
| |
| — |
| — |
| | ||||||||
Depreciation of property, plant and equipment | | — |
| |
| — |
| |
| | ||||||||
Investment property | | — |
| |
| |
| — |
| | ||||||||
Deferred charges and of intangible assets | | — |
| |
| — |
| — |
| | ||||||||
Tax losses carry forward | | ( |
| |
| — |
| ( |
| | ||||||||
Surplus of presumptive income | | — |
| ( |
| — |
| — |
| | ||||||||
Provisions | | |
| |
| — |
| |
| | ||||||||
Employee benefits | | |
| ( |
| ( |
| |
| | ||||||||
Goodwill | | — |
| ( |
| — |
| — |
| — | ||||||||
Financial assets in concession contracts | | — | | — | — | | ||||||||||||
Biological assets | | — | ( | — | — | | ||||||||||||
Lease agreements | | ( | | — | | | ||||||||||||
Foreign currency bonds | | — | | | — | | ||||||||||||
Other | | ( | | | ( | | ||||||||||||
Subtotal | Ps. | | Ps. | ( |
| Ps. | |
| Ps. | |
| Ps. | |
| Ps. | | ||
Deferred tax liabilities |
|
|
|
|
|
| ||||||||||||
Debt securities at fair value | Ps. | ( | Ps. | | Ps. | ( | Ps. | ( | Ps. | |
| Ps. | ( | |||||
Equity securities at fair value | ( | ( | | ( | ( | ( | ||||||||||||
Derivative instruments | ( | — | ( | ( | ( |
| ( | |||||||||||
Accounts receivable | ( | — | ( | — | — | ( | ||||||||||||
Allowance of investments securities | ( | — | | — | — |
| ( | |||||||||||
Loans and receivables | ( | — | ( | — | — | ( | ||||||||||||
Allowance for impairment on loans and receivables | ( | | ( | — | ( |
| ( | |||||||||||
Foreclosed assets | ( | — | ( | — | — |
| ( | |||||||||||
Provision for foreclosed assets | ( | ( | — | — | ( |
| ( | |||||||||||
Property plant and equipment costs | ( | | ( | — | ( |
| ( | |||||||||||
Depreciation of property, plant and equipment | ( | — | ( | — | — |
| ( | |||||||||||
Investment property | ( | — | ( | — | ( |
| ( | |||||||||||
Right-of-use | ( | | ( | — | ( |
| ( | |||||||||||
Deferred charges and of intangible assets | ( | ( | ( | — | ( |
| ( | |||||||||||
Provisions | ( | | | — | ( |
| ( | |||||||||||
Employee benefits | ( | ( | | | ( | ( | ||||||||||||
Goodwill | ( | — | ( | — | — | ( | ||||||||||||
Deferred Income | ( | — | ( | — | — | ( | ||||||||||||
Financial assets in concession arrangements | ( | — | ( | — | — | ( | ||||||||||||
Intangible assets in concession arrangements | ( | — | ( | — | ( | ( | ||||||||||||
Biological assets | ( | — | ( | — | — |
| ( | |||||||||||
Lease agreements | ( | — | ( | — | ( | ( | ||||||||||||
Other | ( | — | | ( | |
| ( | |||||||||||
Subtotal | Ps. | ( | Ps. | | Ps. | ( | Ps. | ( | Ps. | ( | Ps. | ( | ||||||
Total | Ps. | ( | Ps. | ( | Ps. | ( | Ps. | | Ps. | | Ps. | ( |
(1) See note 1.1 “Discontinued operations of BAC Holding”
F-186
Grupo Aval Acciones y Valores S.A.
Notes to the Consolidated Financial Statements
For the years ended December 31, 2022, 2021 and 2020
(Amounts expressed in millions of Colombian pesos)
Year ended on December 31, 2020
|
| Balance as of |
| Credited |
| Credited |
| Balance as of | ||||||||||||
January 1, | Discontinued | Business | (charged) to | (charged) to | Foreign exchange | December 31, | ||||||||||||||
2020 | operations (1) | combination | profit or loss | OCI | adjustments | 2020 | ||||||||||||||
Deferred tax assets |
|
|
|
|
|
|
|
|
|
|
| |||||||||
Debt securities at fair value |
| Ps. | | Ps. | | Ps. | | Ps. | ( | Ps. | ( | Ps. | ( | Ps. | | |||||
Equity securities at fair value |
| |
| — | — |
| ( |
| |
| — |
| | |||||||
Derivative instruments |
| |
| — | — |
| |
| |
| |
| | |||||||
Allowance of investments securities |
| |
| — | — |
| |
| — |
| — |
| | |||||||
Accounts receivable |
| | — | — | | — | ( | | ||||||||||||
Allowance for accounts receivable |
| |
| — | — |
| ( |
| — |
| — |
| | |||||||
Loans and receivables |
| |
| — | |
| ( |
| — |
| |
| | |||||||
Allowance for impairment on loans and receivables |
| |
| | |
| |
| — |
| |
| | |||||||
Allowance for foreclosed assets |
| |
| | — |
| |
| — |
| ( |
| | |||||||
Property, plant and equipment costs |
| |
| | ( |
| |
| — |
| |
| | |||||||
Depreciation of property, plant and equipment | |
| — | — |
| ( |
| — |
| ( |
| | ||||||||
Investment property |
| |
| — | — |
| |
| — |
| — |
| | |||||||
Deferred charges and of intangible assets |
| |
| ( | ( |
| |
| — |
| |
| | |||||||
Tax losses carry forward |
| |
| ( | |
| |
| — |
| |
| | |||||||
Surplus of presumptive income |
| |
| — | — |
| |
| — |
| — |
| | |||||||
Provisions |
| |
| ( | |
| ( |
| — |
| |
| | |||||||
Employee benefits |
| |
| | ( |
| |
| |
| |
| | |||||||
Goodwill |
| |
| — | — |
| ( |
| — |
| — |
| | |||||||
Financial assets in concession contracts |
| | — | — | | — | — | | ||||||||||||
Biological assets | | — | — | ( | ( | — | | |||||||||||||
Lease agreements | | ( | | | — | | | |||||||||||||
Foreign currency bonds | | — | — | — | | — | | |||||||||||||
Other |
| |
| — | — |
| |
| |
| ( |
| | |||||||
Subtotal |
| Ps. | | Ps. | | Ps. | | Ps. | | Ps. | | Ps. | | Ps. | | |||||
| ||||||||||||||||||||
Deferred tax liabilities |
|
|
|
|
|
|
|
| ||||||||||||
Debt securities at fair value |
| Ps. | ( |
| Ps. | ( | Ps. | — | Ps. | ( | Ps. | ( | Ps. | |
| Ps. | ( | |||
Equity securities at fair value |
| ( | ( | — | ( | ( | | ( | ||||||||||||
Derivative instruments | ( |
| — | — | ( | | |
| ( | |||||||||||
Accounts receivable |
| ( | — | — | ( | — | — | ( | ||||||||||||
Allowance of investments securities |
| ( |
| — | — | | — | — |
| ( | ||||||||||
Loans and receivables | ( | — | — | | — | | ( | |||||||||||||
Allowance for impairment on loans and receivables |
| ( |
| | ( | | — | ( |
| ( | ||||||||||
Foreclosed assets |
| ( |
| — | — | | — | — |
| ( | ||||||||||
Provision for foreclosed assets |
| ( |
| ( | — | — | — | ( |
| ( | ||||||||||
Property plant and equipment costs |
| ( |
| ( | ( | | — | ( |
| ( | ||||||||||
Depreciation of property, plant and equipment |
| ( |
| — | — | ( | — | ( |
| ( | ||||||||||
Investment property |
| ( |
| ( | ( | ( | ( | ( |
| ( | ||||||||||
Right-of-use |
| ( |
| | ( | | — | ( |
| ( | ||||||||||
Deferred charges and of intangible assets |
| ( |
| | — | ( | — | ( |
| ( | ||||||||||
Provisions |
| ( |
| | — | ( | — | ( |
| ( | ||||||||||
Employee benefits |
| ( | ( | — | | | ( | ( | ||||||||||||
Goodwill |
| ( | — | — | ( | — | — | ( | ||||||||||||
Deferred Income | ( | — | — | ( | — | — | ( | |||||||||||||
Financial assets in concession arrangements | ( | — | — | | — | — | ( | |||||||||||||
Intangible assets in concession arrangements | ( | — | — | ( | — | — | ( | |||||||||||||
Biological assets | ( |
| — | — | ( | — | — |
| ( | |||||||||||
Lease agreements | ( | — | — | ( | — | — | ( | |||||||||||||
Other |
| ( |
| ( | — | ( | | |
| ( | ||||||||||
Subtotal |
| Ps. | ( |
| Ps. | ( | Ps. | ( | Ps. | ( |
| Ps. | ( |
| Ps. | ( | Ps. | ( | ||
Total |
| Ps. | ( |
| Ps. | | Ps. | | Ps. | ( |
| Ps. | |
| Ps. | | Ps. | ( |
(1) See note 1.1 “Discontinued operations of BAC Holding”
F-187
Grupo Aval Acciones y Valores S.A.
Notes to the Consolidated Financial Statements
For the years ended December 31, 2022, 2021 and 2020
(Amounts expressed in millions of Colombian pesos)
Grupo Aval offsets deferred tax assets and liabilities by entity and tax authority, considering the application of the tax provisions in Colombia and other countries in which the legal right to offset tax assets and liabilities and other requirements in IAS 12, according to the following breakdown:
| Gross Deferred tax |
|
| Balances on Statement | |||||
December 31, 2022 | amounts | Offset | of financial position | ||||||
Deferred tax asset |
| Ps. | |
| Ps. | ( |
| Ps. | |
Deferred tax liability |
|
| ( |
| |
| ( | ||
Net |
| Ps. | ( |
| Ps. | — |
| Ps. | ( |
| Gross Deferred tax |
|
| Balances on Statement | |||||
December 31, 2021 | amounts | Offset | of financial position | ||||||
Deferred tax asset |
| Ps. | |
| Ps. | ( |
| Ps. | |
Deferred tax liability |
|
| ( |
| |
| ( | ||
Net |
| Ps. | ( |
| Ps. | — |
| Ps. | ( |
Grupo Aval estimates to recover its income tax assets and settle its income tax liabilities as shown below:
Deferred tax | December 31, 2022 | December 31, 2021 | ||||
Deferred tax asset recoverable before 12 months | Ps. | Ps. | ||||
Deferred tax asset recoverable after 12 months | ||||||
Total Deferred tax asset | Ps. | Ps. | ||||
Deferred tax liability to settle before 12 months | Ps. | ( | Ps. | ( | ||
Deferred tax liability to settle after 12 months | ( | ( | ||||
Total Deferred tax liability | Ps. | ( | Ps. | ( |
Current tax | December 31, 2022 | December 31, 2021 | ||||
Current tax asset recoverable before 12 months | Ps. | Ps. | ||||
Current tax asset recoverable after 12 months | ||||||
Total Current tax asset | Ps. | Ps. | ||||
Current tax liability to settle before 12 months | Ps. | ( | Ps. | ( | ||
Current tax liability to settle after 12 months | ( | ( | ||||
Total Current tax liability | Ps. | ( | Ps. | ( |
19.6 Effect of the current and deferred taxes in each component of other comprehensive income in equity:
The effects of the current and deferred taxes in each component of other comprehensive income are detailed below during the years ended on December 31, 2022, 2021 and 2020:
December 31, 2022 | ||||||||||||
Current | Deferred | |||||||||||
tax | tax | |||||||||||
Amount | (expense) | (expense) | ||||||||||
Items that will be reclassified to profit or loss |
| before taxes |
| Income | income |
| Net (1) | |||||
Hedged Items (2) | Ps. | ( |
| Ps. | — | Ps. | ( |
| Ps. | ( | ||
Hedging derivatives in foreign currency |
| |
|
| ( |
| ( |
|
| | ||
Hedging financial liabilities in foreign currency |
| |
|
| ( |
| ( |
|
| | ||
Cash Flow hedging |
|
| ( |
|
| — |
| |
|
| | |
Foreign currency translation differences for foreign operations |
|
| |
|
| — |
| ( |
|
| | |
Investment in associates and join ventures |
|
| |
|
| — |
| ( |
|
| | |
Debt financial instruments |
|
| ( |
|
| — |
| |
|
| ( | |
Subtotal Items that will be reclassified to profit or loss | Ps. | ( |
| Ps. | ( | Ps. | ( |
| Ps. | ( | ||
Items that will not be reclassified to profit or loss | ||||||||||||
Effect of moving investment properties for own use | Ps. | | Ps. | — | Ps. | ( | Ps. | ( | ||||
Equity financial instruments |
| ( |
| — |
| ( |
|
| ( | |||
Actuarial gains (losses) from defined benefit pension plans |
|
| |
|
| — |
| ( |
|
| | |
Subtotal Items that will not be reclassified to profit or loss | Ps. | ( | Ps. | — | Ps. | ( | Ps. | ( | ||||
Total “other comprehensive income” during the period |
| Ps. | ( |
| Ps. | ( | Ps. | ( |
| Ps. | ( | |
(1) See Note 25.5 "Consolidated Other Comprehensive Income (OCI)"
(2) The tax effect only includes deferred tax on those investments where there is no control of the reversal of the temporary difference
F-188
Grupo Aval Acciones y Valores S.A.
Notes to the Consolidated Financial Statements
For the years ended December 31, 2022, 2021 and 2020
(Amounts expressed in millions of Colombian pesos)
December 31, 2021 | ||||||||||||
Current | Deferred | |||||||||||
tax | tax | |||||||||||
Amount | (expense) | (expense) | ||||||||||
Items that will be reclassified to profit or loss |
| before taxes |
| Income |
| income |
| Net (1) | ||||
Hedged Items (2) | Ps. | |
| Ps. | — | Ps. | ( | Ps. | | |||
Hedging derivatives in foreign currency |
| ( |
|
| — |
| |
| ( | |||
Hedging financial liabilities in foreign currency |
| ( |
|
| — |
| |
| ( | |||
Cash Flow hedging |
|
| |
|
| — |
| ( |
| | ||
Foreign currency translation differences for foreign operations |
|
| ( |
|
| — |
| ( |
| ( | ||
Investment in associates and joint ventures |
|
| ( |
|
| — |
| ( |
| ( | ||
Debt financial instruments |
|
| ( |
|
| — |
| |
| ( | ||
Subtotal Items that will be reclassified to profit or loss | Ps. | ( |
| Ps. | — | Ps. | | Ps. | | |||
Items that will not be reclassified to profit or loss | ||||||||||||
Effect of moving investment properties for own use | Ps. | | Ps. | — | Ps. | | Ps. | | ||||
Equity financial instruments |
| ( |
| — |
| ( |
| ( | ||||
Actuarial gains (losses) from defined benefit pension plans |
|
| |
|
| — |
| ( |
| | ||
Subtotal Items that will not be reclassified to profit or loss | Ps. | ( | Ps. | — | Ps. | ( | Ps. | ( | ||||
Total “other comprehensive income” during the period |
| Ps. | ( |
| Ps. | — | Ps. | | Ps. | | ||
(1) See Note 25.5 "Consolidated Other Comprehensive Income (OCI)"
(2) The tax effect only includes deferred tax on those investments where there is no control of the reversal of the temporary difference
December 31, 2020 | ||||||||||||
|
| Current |
| Deferred |
| |||||||
tax | tax | |||||||||||
Amount | (expense) | (expense) | ||||||||||
Items that will be reclassified to profit or loss | before taxes | Income | income | Net (1) | ||||||||
Hedged Items (2) |
| Ps. | |
| Ps. | — |
| Ps. | ( | Ps. | | |
Hedging derivatives in foreign currency |
|
| ( |
|
| — |
| |
| ( | ||
Hedging financial liabilities in foreign currency |
|
| ( |
|
| — |
| |
| ( | ||
Cash Flow hedging |
|
| |
|
| — |
| |
| | ||
Foreign currency translation differences for foreign operations |
|
| ( |
|
| — |
| |
| ( | ||
Investment in associates and joint ventures |
|
| |
|
| |
| ( |
| | ||
Debt financial instruments |
|
| |
|
| — |
| ( |
| | ||
Subtotal Items that will be reclassified to profit or loss | Ps. | ( | Ps. | | Ps. | | Ps. | ( | ||||
Items that will not be reclassified to profit or loss | ||||||||||||
Effect of moving investment properties for own use | Ps. | | Ps. | — | Ps. | ( | Ps. | | ||||
Equity financial instruments |
| |
| — |
| | | |||||
Actuarial gains (losses) from defined benefit pension plans |
|
| ( |
|
| — |
| |
| ( | ||
Subtotal Items that will not be reclassified to profit or loss | Ps. | | Ps. | — | Ps. | | Ps. | | ||||
Total “other comprehensive income” during the period |
| Ps. | ( |
| Ps. | |
| Ps. | | Ps. | ( | |
(1) See Note 25.5 "Consolidated Other Comprehensive Income (OCI)"
(2) The tax effect only includes deferred tax on those investments where there is no control of the reversal of the temporary difference
19.7 Uncertainties in Open Tax Positions
As of December 31, 2022, and 2021, Grupo Aval recognized tax uncertainty liabilities for Ps.
F-189
Grupo Aval Acciones y Valores S.A.
Notes to the Consolidated Financial Statements
For the years ended December 31, 2022, 2021 and 2020
(Amounts expressed in millions of Colombian pesos)
19.8 Withholdings tax on dividends paid between entities
Decree 2457 of November 12, 2020, regulates the articles 242, 242-1, 245, 26-1 y 895 of Colombian Tax Code. This Decree specifies the rules for the application of the special rate for dividends and participations, together with the procedures for the application of withholding tax (¨WHT"). This WHT at the source is paid by the withholding agent in the period in which it is applied. The WHT on distributions made to entities, which is treated as a tax credit deducted at source when a subsequent distribution is made by the entity to an individual. In essence, the tax credit resulting from the WHT is awarded to the ultimate beneficiary, not to the entity receiving the dividend in the first place. When the entity first receives the distribution, it accounts for the WHT in equity, as a reduction in dividends payable to individuals in accordance with paragraph 65A of IAS 12. Grupo Aval recorded WHT for Ps.
NOTE 20 – CUSTOMER DEPOSITS
20.1 Detail of the composition of the deposits
The following is the detail of the balances of the deposits received from Grupo Aval´s customer and subsidiaries in development of their deposit collection operations as of December 31, 2022 and 2021:
Detail |
| December 31, 2022 |
| December 31, 2021 | ||
Demand |
|
|
|
| ||
Checking accounts |
| Ps. | |
| Ps. | |
Savings accounts |
|
| |
| | |
Other funds on demand |
|
| |
| | |
| | |||||
Term deposits |
|
|
|
| ||
Fixed term deposit certificates (1) |
|
| |
| | |
Total deposits |
| Ps. | |
| Ps. | |
Per currency |
|
|
|
| ||
In Colombian Pesos |
| Ps. | |
| Ps. | |
In foreign currency |
|
| |
| | |
Total per currency |
| Ps. | |
| Ps. | |
| (1) | The amount of term deposits due over 12 months as December 31, 2022 is Ps. |
20.2 Detail of the effective interest rates
The following is a summary of the effective interest rates which are accrued on customer deposits is as follows:
December 31, 2022 |
| ||||||||
Deposits |
| ||||||||
In Colombian Pesos | In foreign currency |
| |||||||
Rate | Rate |
| |||||||
| Minimum |
| Maximum |
| Minimum |
| Maximum |
| |
| % |
| % |
| % |
| % | ||
Interest-bearing checking accounts |
| | % | | % | | % | | % |
Saving accounts |
| | % | | % | | % | | % |
Fixed term deposit certificates |
| | % | | % | | % | | % |
December 31, 2021 |
| ||||||||
Deposits |
| ||||||||
In Colombian Pesos | In foreign currency |
| |||||||
Rate | Rate |
| |||||||
| Minimum |
| Maximum |
| Minimum |
| Maximum |
| |
| % |
| % |
| % |
| % | ||
Interest-bearing checking accounts |
| | % | | % | | % | | % |
Saving accounts |
| | % | | % | | % | | % |
Fixed term deposit certificates |
| | % | | % | | % | | % |
F-190
Grupo Aval Acciones y Valores S.A.
Notes to the Consolidated Financial Statements
For the years ended December 31, 2022, 2021 and 2020
(Amounts expressed in millions of Colombian pesos)
20.3 Detail of the concentration of deposits received from customers per economic sector
December 31, 2022 | December 31, 2021 |
| |||||||||
Amount |
| % |
| Amount |
| % |
| ||||
Individuals | Ps. | | % | Ps. | | | % | ||||
Financial |
| | % | | | % | |||||
Government and Colombian Government entities |
| | % | | | % | |||||
Services | | % | | | % | ||||||
Insurance |
| | % | | | % | |||||
Commerce | | % | | | % | ||||||
Manufacturing |
| | % | | | % | |||||
Real Estate |
| | % | | | % | |||||
Agriculture and livestock |
| | % | | | % | |||||
Transport |
| | % | | | % | |||||
Exploitation of mines and quarries | | % | | | % | ||||||
Education |
| | % | | | % | |||||
Artistic, entertainment and recreation activities | | % | | | % | ||||||
Telecommunications |
| | % | | | % | |||||
Colombian Municipalities |
| | % | | | % | |||||
Foreign Governments |
| | % | | | % | |||||
Tourism | | % | | | % | ||||||
Other | | % | | | % | ||||||
Total | Ps. | | | % | Ps. | |
| | % | ||
NOTE 21 – FINANCIAL OBLIGATIONS
21.1 Financial obligations other than issued bonds
| a) | Interbank borrowings, overnight funds and borrowings from banks and others |
The following is a summary of the financial obligations of Grupo Aval as of December 31, 2022 and 2021:
December | December | |||||
|---|---|---|---|---|---|---|
|
| 31, 2022 |
| 31, 2021 | ||
| ||||||
Local Currency |
|
|
|
| ||
Interbank funds |
|
|
|
| ||
Overnight funds |
| Ps. | |
| Ps. | |
Interbank funds purchased |
|
| |
| | |
Commitments to transfer open and closed repo operations |
|
| |
| | |
Commitments to transfer simultaneous operations |
|
| |
| | |
Commitments originated in short positions simultaneous operations |
|
| |
| | |
Total interbank funds |
| Ps. | |
| Ps. | |
Borrowings from banks and others | ||||||
Borrowings |
|
| |
| | |
Leases contracts | | | ||||
Overdrafts in bank checking account | | — | ||||
Other financial obligations |
|
| |
| | |
Total borrowings from banks and others |
| Ps. | |
| Ps. | |
Foreign currency |
|
|
|
| ||
Interbank funds |
|
|
|
| ||
Overnight funds |
|
| |
| | |
Interbank funds purchased |
|
| |
| | |
Commitments to transfer open and closed repo operations |
|
| |
| | |
F-191
Grupo Aval Acciones y Valores S.A.
Notes to the Consolidated Financial Statements
For the years ended December 31, 2022, 2021 and 2020
(Amounts expressed in millions of Colombian pesos)
December | December | |||||
|---|---|---|---|---|---|---|
|
| 31, 2022 |
| 31, 2021 | ||
Commitments to transfer simultaneous operations | | | ||||
Total interbank funds |
| Ps. | |
| Ps. | |
Borrowings from banks and others | ||||||
Borrowings |
|
| |
| | |
Leases contracts | | | ||||
Andean Development Corporation (Corporación Andina de Fomento) |
|
| — |
| | |
Letters of credit |
|
| |
| | |
Bankers acceptances |
|
| |
| | |
Overdrafts in bank checking account |
|
| — |
| | |
Other financial obligations |
|
| — |
| | |
Total borrowings from banks and others |
| Ps. | |
| Ps. | |
Total interbank borrowings, overnight funds and borrowings from banks and others |
| Ps. | |
| Ps. | |
The amount of interbank borrowings, overnight funds and borrowings from banks and others due over 12 months as of December 31, 2022 was Ps.
Short-term obligations associated with simultaneous and repo operations as of December 31, 2022 amounted to Ps.
Borrowings from development entities
The Colombian Government has established certain credit programs for promoting the development of specific sectors of the economy, including foreign trade, agriculture, tourism, housing construction and other industries. The programs are managed by many entities of the Government such as Banco de Comercio Exterior (“Bancoldex”), Fondo para el Financiamiento del Sector Agropecuario (“Finagro”) and Financiera de Desarrollo Territorial (“Findeter”).
The details of the borrowings from these entities as of December 31, 2022, and 2021 and are as follows:
| Interest rates in force at cut off |
| December 31, 2022 |
| December 31, 2021 | |||
Banco de Comercio Exterior - “BANCOLDEX” | Fix between | Ps. | |
| Ps. | | ||
Fondo para el Financiamiento del Sector Agropecuario - “FINAGRO” |
| Fix between |
|
| |
| | |
Financiera de Desarrollo Territorial “FINDETER” |
| Fix between |
|
| |
| | |
Total |
|
|
| Ps. | |
| Ps. | |
The amount of borrowings from development entities due over 12 months as of December 31, 2022 was Ps.
The amount of financial obligations with development entities in Colombian pesos as of December 31, 2022 is Ps.
21.2. Financial obligations from issued bonds
Grupo Aval and some of its subsidiaries have been authorized by the Superintendency of Finance and by the applicable regulatory entities in other jurisdictions to issue either bonds or general guarantee bonds. The bonds issued by Grupo Aval and subsidiaries are non-guaranteed and represent exclusively the obligations of each of the issuers.
F-192
Grupo Aval Acciones y Valores S.A.
Notes to the Consolidated Financial Statements
For the years ended December 31, 2022, 2021 and 2020
(Amounts expressed in millions of Colombian pesos)
The detail of issued bonds as of December 31, 2022 and 2021, by issuance date and maturity date was as follows:
|
| December |
| December |
|
| ||||||
Issuer | Issue Date (*) | 31, 2022 | 31, 2021 | Maturity Date (*) | Interest Rate (*) | |||||||
Local Currency | ||||||||||||
Banco Av. Villas S.A. | Ps. | | Ps. | | CPI + | |||||||
Banco de Bogotá S.A. |
|
| |
| |
| CPI + | |||||
Banco de Occidente S.A |
|
|
| |
| |
| CPI + | ||||
Corporación Financiera Colombiana S.A. |
|
|
| |
| |
| CPI + | ||||
Banco Popular S.A |
|
|
| |
| |
| CPI + | ||||
Grupo Aval Acciones y Valores S.A. |
|
| |
| |
| CPI + | |||||
Peso denominated Total |
| Ps. | | Ps. | | |||||||
Foreign Currency |
|
|
| |||||||||
Banco de Bogotá S.A. Under rule 144A. |
|
| Ps. | | Ps. | |
| Fix Between | ||||
BAC Credomatic and MFH |
|
| ||||||||||
El Salvador |
|
|
| — | |
| ||||||
Honduras |
|
|
| — | |
| ||||||
MFH |
|
|
| | |
| Fix Between | |||||
BAC Credomatic and MFH Total |
| Ps. | | Ps. | | |||||||
Banco Bogotá, BAC and MFH Total |
| Ps. | | Ps. | | |||||||
Grupo Aval Limited |
|
|
| | |
| Fix | |||||
Promigas S.A. and Gases del Pacífico S.A.C. Under rule 144A. | | | Fix | |||||||||
Foreign Currency Total |
|
|
| Ps. | | Ps. | |
|
|
|
| |
Total of Bonds |
|
|
| Ps. | | Ps. | |
|
|
|
| |
(*) This information as of December 31, 2022
The amount of issued bonds due over 12 months as of December 31, 2022 was Ps.
Grupo Aval had no defaults on principal or interest payments or other breaches with respect to its liabilities during the years ended December 31, 2022 and 2021, and Grupo Aval is complying with the related covenants agreed with investors and debtors.
F-193
Grupo Aval Acciones y Valores S.A.
Notes to the Consolidated Financial Statements
For the years ended December 31, 2022, 2021 and 2020
(Amounts expressed in millions of Colombian pesos)
21.3 Analysis of changes in financing during the year
Reconciliation of movements of liabilities to cash flows arising from financing activities:
Reconciliation of movements of liabilities to cash flows arising from financing activities | |||||||||||||||||
Liabilities | Equity | Total | |||||||||||||||
Notes | Dividends payable | Bonds issued | Leases contracts | Subscribed and paid-in capital | Additional paid-in capital | Appropriated retained earnings | Non-controlling interest | ||||||||||
Balance at December 31, 2019 | Ps. | | Ps. | | Ps. | | Ps. | | Ps. | | Ps. | | Ps. | | Ps. | | |
Cash flows from financing activities: | |||||||||||||||||
Dividends paid to shareholders | ( | — | — | — | — | — | — | ( | |||||||||
Dividends paid to non-controlling interest | 26 | ( | — | — | — | — | — | — | ( | ||||||||
Issuance of debt securities | — | | — | — | — | — | — | | |||||||||
Interest issuance of debt securities | — | ( | — | — | — | — | — | ( | |||||||||
Payment of outstanding debt securities | — | ( | — | — | — | — | — | ( | |||||||||
Leases contracts | — | — | ( | — | — | — | — | ( | |||||||||
Redemption of preferred shares | — | — | — | — | — | — | ( | ( | |||||||||
Equity transaction | — | — | — | — | ( | — | ( | ( | |||||||||
Net cash used in financing activities | ( | | ( | — | ( | — | ( | | |||||||||
Cash flows from operating activities: | |||||||||||||||||
Accrued interest | — | | | — | — | — | — | | |||||||||
Interest paid | — | ( | ( | — | — | — | — | ( | |||||||||
Other Changes | | | | — | — | ( | ( | | |||||||||
Total liabilities related to other changes | | | | — | — | ( | ( | | |||||||||
Total equity related to other changes | — | — | — | — | | | | | |||||||||
Balance at December 31, 2020 | Ps. | | Ps. | | Ps. | | Ps. | | Ps. | | Ps. | | Ps. | | Ps. | | |
Cash flows from financing activities: | |||||||||||||||||
Dividends paid to shareholders | ( | — | — | — | — | — | — | ( | |||||||||
Dividends paid to non-controlling interest | 26 | ( | — | — | — | — | — | — | ( | ||||||||
Issuance of debt securities | — | | — | — | — | — | — | | |||||||||
Interest issuance of debt securities | — | ( | — | — | — | — | — | ( | |||||||||
Payment of outstanding debt securities | — | ( | — | — | — | — | — | ( | |||||||||
Leases contracts | — | — | ( | — | — | — | — | ( | |||||||||
Redemption of preferred shares | — | — | — | — | — | — | ( | ( | |||||||||
Equity transaction | — | — | — | — | — | — | | | |||||||||
Net cash used in financing activities | ( | | ( | — | — | — | ( | ( | |||||||||
Cash flows from operating activities: | |||||||||||||||||
Accrued interest | — | | | — | — | — | — | | |||||||||
Interest paid | — | ( | ( | — | — | — | — | ( | |||||||||
Other Changes | | | | — | — | ( | ( | | |||||||||
Total liabilities related to other changes | | | | — | — | ( | ( | | |||||||||
Total equity related to other changes | — | — | — | — | | | | | |||||||||
Balance at December 31, 2021 | Ps. | | Ps. | | Ps. | | Ps. | | Ps. | | Ps. | | Ps. | | Ps. | | |
Cash flows from financing activities: | |||||||||||||||||
Dividends paid to shareholders | ( | — | — | — | — | — | — | ( | |||||||||
Dividends paid to non-controlling interest | ( | — | — | — | — | — | — | ( | |||||||||
Issuance of debt securities | — | | — | — | — | — | — | | |||||||||
Payment of outstanding debt securities | — | ( | — | — | — | — | — | ( | |||||||||
Leases contracts | — | — | ( | — | — | — | — | ( | |||||||||
Equity transaction | — | — | — | — | | — | ( | ( | |||||||||
Net cash used in financing activities | ( | ( | ( | — | | — | ( | ( | |||||||||
Cash flows from operating activities: | |||||||||||||||||
Accrued interest | — | | | — | — | — | — | | |||||||||
Interest paid | — | ( | ( | — | — | — | — | ( | |||||||||
Other Changes | | | ( | | | ( | ( | | |||||||||
Total liabilities related to other changes | | | ( | | | ( | ( | | |||||||||
Total equity related to other changes | — | — | — | — | ( | ( | ( | ( | |||||||||
Balance at December 31, 2022 | Ps. | | Ps. | | Ps. | | Ps. | | Ps. | | Ps. | | Ps. | | Ps. | | |
F-194
Grupo Aval Acciones y Valores S.A.
Notes to the Consolidated Financial Statements
For the years ended December 31, 2022, 2021 and 2020
(Amounts expressed in millions of Colombian pesos)
NOTE 22 – EMPLOYEE BENEFITS
In accordance with labor legislation in the countries in which Grupo Aval operates, and based on labor conventions and collective bargaining agreements signed between Grupo Aval’s subsidiaries and their employees, employees have short term benefits (including but not limited to salaries, holidays, legal and extralegal premiums, interests on severances and defined contribution plans such as severances), long-term benefits (including but not limited to seniority bonuses), post-employment benefits (including but not limited to medical aids) and retirement benefits (including but not limited to severance payments to employees in Colombia who continue with labor regime before Law 50 of 1990 and legal and extralegal retirement pensions). Compensation of key management personnel (see note 34) includes salaries.
Through personnel benefits plans, Grupo Aval is exposed to several risks (interest rates), which are intended to be minimized by applying the risk management policies and procedures defined under Note 4.
The detail of the balance of liabilities for employee benefits as of December 31, 2022, and 2021 is as follows:
|
| December 31, 2022 |
| December 31, 2021 | ||
Short term |
| Ps. | |
| Ps. | |
Post-employment |
|
| |
| | |
Long term |
|
| |
| | |
Total | Ps. | | Ps. | | ||
Plan Asset | Ps. | ( | Ps. | ( | ||
Net employee benefits |
| Ps. | |
| Ps. | |
22.1 Post-employment benefits
In Colombia, when employees retire after completing certain thresholds of years and time of service, retirement pensions are assumed by public or private pension funds based on defined contribution plans. Entities and employees contribute monthly defined amounts by law to gain entitlement to a pension at the time of retirement.
Unlike in Central America, in Colombia according to prior labor regimes, post-employment benefits for employees hired before (i) 1968 require pensions to be directly assumed the company for those employees that have fulfilled the requirements of age and years of service and (ii) 1990 entitle employees to receive a compensation equivalent to the last month of salary multiplied by each year of service.
Some subsidiaries have labor conventions or pay extra-legal premiums to employees retiring in compliance with the required age and time of service, when they start enjoying the pension granted by the pension funds.
Some retirees of Grupo Aval and its subsidiaries receive benefits including coverage of medical treatments.
As of December 31, 2022 and 2021, the post-employment benefit expense is composed of:
December 31, 2022 | December 31, 2021 | |||||
Defined contribution plan | Ps. | | Ps. | | ||
Defined benefit plan | | | ||||
Total | Ps. | | Ps. | | ||
F-195
Grupo Aval Acciones y Valores S.A.
Notes to the Consolidated Financial Statements
For the years ended December 31, 2022, 2021 and 2020
(Amounts expressed in millions of Colombian pesos)
22.2 Long Term Employee Benefits
Some Grupo Aval subsidiaries grant their employees extra-legal long-term premiums during their working lives per every five years of service that they complete, calculated as days of salary per year of work.
Grupo Aval has recognized the liabilities corresponding to these benefits, based on the same actuarial calculations and using the same parameters as in retirement benefits.
The following table shows the Post-employment and long-term benefits movements during the years ended on December 31, 2022, 2021 and 2020 are as follows:
Post-employment benefits | Long-term benefits | |||||||||||||||||
|
| December |
| December |
| December |
| December |
| December |
| December | ||||||
31, 2022 | 31, 2021 | 31, 2020 | 31, 2022 | 31, 2021 | 31, 2020 | |||||||||||||
Balance at the beginning of the year |
| Ps. | |
| Ps. | |
| Ps. | |
| Ps. | |
| Ps. | |
| Ps. | |
Business combination (1) | — | — | | — |
|
| — |
|
| — | ||||||||
Service costs |
|
| | | | |
|
| |
|
| | ||||||
Interests cost |
|
| | | | |
|
| |
|
| | ||||||
Gain on settlements |
|
| — | | — | — |
|
| — |
|
| — | ||||||
Past Service Costs (2) |
|
| — | — | — | — |
|
| ( |
|
| ( | ||||||
| Ps. | | Ps. | | Ps. | | Ps. | |
| Ps. | |
| Ps. | | ||||
Changes in actuarial assumptions from changes in demographic assumptions |
|
| — | ( | — | — |
|
| ( |
|
| — | ||||||
Changes in actuarial assumptions from changes in financial assumptions |
| ( | ( | ( | ( |
|
| ( |
|
| | |||||||
Changes in actuarial assumptions from changes in the experience | | ( | | | ( | | ||||||||||||
| Ps. | ( | Ps. | ( | Ps. | | Ps. | ( |
| Ps. | ( |
| Ps. | | ||||
Payments to employees | ( | ( | ( | ( | ( | ( | ||||||||||||
Liquidation of entities | ( | — | — | — | — | — | ||||||||||||
Reclassification BAC (3)(4) | — | ( | | — | — | — | ||||||||||||
Loss of control in subsidiary (3) | ( | — | — | — | — | — | ||||||||||||
Discontinued operations (3) | | | | — | — | — | ||||||||||||
Effect of movements in exchange rates |
|
| | | | — |
|
| — |
|
| — | ||||||
Liability balance at the end of the year |
| Ps. | |
| Ps. | |
| Ps. | |
| Ps. | |
| Ps. | |
| Ps. | |
Plan Assets | ||||||||||||||||||
Balance at the beginning of the year plan assets | Ps. | ( | Ps. | ( | Ps. | ( | Ps. | — | Ps. | — | Ps. | — | ||||||
Business combination (1) | — | — | ( | — | — | — | ||||||||||||
Recognition of the active plan | — | — | ( | — | — | — | ||||||||||||
Interests income | ( | ( | ( | — | — | — | ||||||||||||
Remeasurements on plan assets | | ( | | — | — | — | ||||||||||||
Reclassification BAC (3)(4) | — | ( | | — | — | — | ||||||||||||
Loss of control in subsidiary (3) | | — | — | — | — | — | ||||||||||||
Discontinued operations (3) | — | ( | ( | — | — | — | ||||||||||||
Effect of movements in exchange rates | ( | ( | ( | — | — | — | ||||||||||||
Balance at the end of the year plan assets | Ps. | ( | Ps. | ( | Ps. | ( | Ps. | — | Ps. | — | Ps. | — | ||||||
Net Balance at the end of the year |
| Ps. | |
| Ps. | |
| Ps. | |
| Ps. | |
| Ps. | |
| Ps. | |
| (1) | See note 35, recognition of the business combination on Multi Financial Group, Inc. |
| (2) | The variation includes the effect of a change in a long-term institutional benefit plan for the year 2021 at Banco de Occidente and Fiduciaria de Occidente, and for the year 2020 at Porvenir and Fiduciaria Bogota which went from being a defined benefit plan to a defined contribution plan, through which the bank makes monthly contributions into a fund created for each employee. |
| (3) | See note 1.1., "Discontinued operation of BAC Holding". |
| (4) | Correspond to reclassification for comparability of the movements of BAC Holding consider the deconsolidation of this entity during year 2022. |
F-196
Grupo Aval Acciones y Valores S.A.
Notes to the Consolidated Financial Statements
For the years ended December 31, 2022, 2021 and 2020
(Amounts expressed in millions of Colombian pesos)
The assumptions used to calculate the obligation projected for different post-employment benefits employees are as follows:
December 31, | December 31, | ||||
Post-employment benefits * |
| 2022 |
| 2021 |
|
Discount interest rate |
| | % | | % |
Inflation rate |
| | % | | % |
Salary growth rate |
| | % | | % |
Pension growth rate |
| | % | | % |
* Entities in Colombia and subsidiaries abroad participate.
December 31, | December 31, | ||||
Long-term benefits * |
| 2022 |
| 2021 |
|
Discount interest rate |
| | % | | % |
Inflation rate |
| | % | | % |
Salary growth rate |
| | % | | % |
* Only entities from Colombia participate.
Employee turnover is calculated based on the experience of each entity. For those entities where a sufficiently long statistic history is not yet available to support the actuarial bases, the SoA2003 table is used as a reference. With this table, the probability of permanence of personnel in the entity is established, modified according to the population factor of each benefit. Employee´s life expectancy is calculated based on the mortality tables RV08 (Colombia) and GA83 (Central America).
The sensitivity analysis for post-employment and long-term benefits liabilities due to defined benefits plans to different actuarial and financial variables is shown below, maintaining other variables at constant values (increase or decrease
| -0.50 basic points | +0.50 basic points | ||||||||||
At December 31, 2022 |
| Post-employment |
| Long-term | Post-employment |
| Long-term | |||||
Discount interest rate |
| Ps. | |
| Ps. | | Ps. | ( |
| Ps. | ( | |
Salaries growth rate |
| ( | ( | | | |||||||
Retirement growth rate |
| ( | N/A | | N/A | |||||||
| -0.50 basic points | +0.50 basic points | ||||||||||
At December 31, 2021 | Post-employment |
| Long-term | Post-employment |
| Long-term | ||||||
Discount interest rate |
| Ps. | |
| Ps. | | Ps. | ( |
| Ps. | ( | |
Salaries growth rate |
| ( | ( | | | |||||||
Retirement growth rate |
| ( | N/A | | N/A | |||||||
Future benefit payments projected, reflecting services, as the case may be, are expected to be paid as follows:
| Payments for post- |
| Payments for long- | |||
Year | employment | term benefits | ||||
2023 |
| Ps. | |
| Ps. | |
2024 |
| |
| | ||
2025 |
| |
| | ||
2026 |
| |
| | ||
2027 |
| |
| | ||
Years 2028 – 2032 |
| |
| | ||
Total | Ps. | | Ps. | |
F-197
Grupo Aval Acciones y Valores S.A.
Notes to the Consolidated Financial Statements
For the years ended December 31, 2022, 2021 and 2020
(Amounts expressed in millions of Colombian pesos)
NOTE 23 – LEGAL RELATED AND NON-LEGAL RELATED PROVISIONS
The movement and balances of legal and non-legal related provisions during the periods ended on December 31, 2022, 2021 and 2020 are described below:
| For legal |
| Non-legal |
| Total provisions | ||||
Balance as of January 1, 2020 | Ps. | |
| Ps. | |
| Ps. | | |
Business combination (1) | | |
|
| | ||||
Provisions increase during the year |
|
| | |
|
| | ||
Use of provisions |
|
| ( | ( |
|
| ( | ||
Reversed provisions not utilized |
|
| ( | ( |
|
| ( | ||
Effect of movements in exchange rates |
|
| ( | |
|
| | ||
Reclassification BAC (2) (3) | — | | | ||||||
Discontinued operations (2) | ( | | ( | ||||||
Balance as of December 31, 2020 |
| Ps. | |
| Ps. | |
| Ps. | |
Provisions increase during the year |
|
| | |
|
| | ||
Use of provisions |
|
| ( | ( |
|
| ( | ||
Reversed provisions not utilized |
|
| ( | ( |
|
| ( | ||
Effect of movements in exchange rates |
|
| | |
|
| | ||
Reclassification BAC (2) (3) | ( | | ( | ||||||
Discontinued operations (2) | | | | ||||||
Balance as of December 31, 2021 |
| Ps. | |
| Ps. | |
| Ps. | |
Provisions increase during the year |
|
| | |
|
| | ||
Use of provisions |
|
| ( | ( |
|
| ( | ||
Reversed provisions not utilized (4) |
|
| ( | ( |
|
| ( | ||
Effect of movements in exchange rates |
|
| | |
|
| | ||
Loss of control in subsidiary (2) | ( | ( | ( | ||||||
Discontinued operations (2) | | | | ||||||
Balance as of December 31, 2022 |
| Ps. | |
| Ps. | |
| Ps. | |
(1) Includes recognition of the business combination on Multi Financial Group, Inc., (see note 35).
(2) See note 1.1 “ Discontinued operations of BAC Holding”.
(3) Correspond to reclassification for comparability of the movements of BAC Holding consider the deconsolidation of this entity during year 2022.
(4) For legal related, recovery of provisions by Porvenir for December of 2022 by Ps.
Estimated period to be canceled | Legal provisions | Non-legal | Total provisions | ||||||
Within twelve months | Ps. | | Ps. | | Ps. | | |||
After twelve months | | | | ||||||
Balance as of December 31, 2022 | Ps. | | Ps. | | Ps. | | |||
Estimated period to be canceled | Legal provisions | Non-legal | Total provisions | ||||||
Within twelve months | Ps. | Ps. | | Ps. | |||||
After twelve months | | | |||||||
Balance as of December 31, 2021 | Ps. | | Ps. | | Ps. | | |||
Legal related:
Administrative proceedings
At December 31, 2022 and 2021, the outstanding balance of provisions recorded for administrative proceedings were Ps.
Labor proceedings
At December 31, 2022 and 2021, the outstanding balance of provisions recorded for labor proceedings were Ps.
F-198
Grupo Aval Acciones y Valores S.A.
Notes to the Consolidated Financial Statements
For the years ended December 31, 2022, 2021 and 2020
(Amounts expressed in millions of Colombian pesos)
Other proceedings
At December 31, 2022 and 2021, the outstanding balance of other legal provisions recorded were Ps.
| ● | Provisions made to cover claims for nullity of affiliations to Porvenir, old age disability and survival pensions which amounted to Ps. |
Non-legal related:
At December 31, 2022 and 2021 the outstanding balance of non-legal related provisions recorded amounting were Ps.
| ● | Provisions in Corficolombiana´s affiliates as of December 31, 2022 and 2021, associated with the maintenance, restoration and rehabilitation of constructions and buildings, professional fees relating to development of concession contracts of Ps. |
| ● | Provision in Proinvipacífico, a Corficolombiana´s subsidiary as of December 31, 2022 and 2021 for the recognition of additional costs on the Pacífico 1 project of Ps. |
| ● | Provisions in Porvenir´s subsidiary as of December 31, 2022, and 2021, where the main balance corresponds to undercapitalized accounts, these are individual pension accounts called "Fondo de Pensiones Obligatorias Especial Porvenir de Retiro Programado", which according to actuarial projections do not have the required balance to achieve minimum pension payment, and thus have to be provisioned for the expected difference of Ps. |
| ● | Provisions of several subsidiaries of Grupo Aval as of December 31,2022 and 2021, corresponding to the dismantling of ATMs and offices of Ps. |
| ● | Provisions for losses on loan commitments as of December 31 2022 and 2021, of Ps. |
NOTE 24 – OTHER LIABILITIES
Other liabilities of December 31, 2022 and 2021 comprise the following:
Other liabilities |
| December 31, 2022 |
| December 31, 2021 | ||
Income received for third parties |
| Ps. | |
| Ps. | |
Suppliers and services payable | |
| | |||
Transactions ATH and ACH (1) | |
| | |||
Cashier checks | |
| | |||
Withholdings taxes and labor contributions | |
| | |||
Contract liability related to concessions | |
| | |||
Commissions and fees | |
| | |||
Collection on behalf of third parties | |
| | |||
Dividends payable | | | ||||
Insurance payables | | | ||||
Collection service | |
| | |||
Checks drawn and not paid | | | ||||
Cash surplus | | | ||||
Value added tax - VAT | | | ||||
Financial transactions tax | |
| | |||
Canceled accounts | |
| | |||
Anticipated income | |
| | |||
Customer loyalty programs | |
| | |||
Other liabilities | |
| | |||
Total other liabilities |
| Ps. | |
| Ps. | |
| (1) | A Toda Hora S.A. – ATH y ACH Colombia S.A. are entities that administer low-value payment systems that are in charge of supporting entities for clearing transactions that are carried out through electronic channels. |
Other liabilities | December 31, 2022 |
| December 31, 2021 | |||
Liabilities to be canceled within twelve months | |
| | |||
Liabilities to be canceled after twelve months | |
| | |||
Total |
| Ps. | |
| Ps. | |
F-199
Grupo Aval Acciones y Valores S.A.
Notes to the Consolidated Financial Statements
For the years ended December 31, 2022, 2021 and 2020
(Amounts expressed in millions of Colombian pesos)
NOTE 25 – EQUITY ATTRIBUTABLE TO OWNERS OF THE PARENT
Authorized, issued and outstanding shares as of December 31, 2022 and 2021 consisted of the following:
| December 31, 2022 |
| December 31, 2021 | |
Authorized shares |
| |
| |
Subscribed fully paid shares |
| |
| |
Total outstanding shares |
| |
| |
Issuance of shares (1) | - | |||
Total outstanding shares | ||||
Issuance of shares | | |||
Subscribed and paid-in capital | Ps. | | ||
Additional paid-in capital | | |||
Issuance of shares (2) | Ps. | | ||
The outstanding shares are as follows: |
| December 31, 2022 |
| December 31, 2021 |
Common voting shares (3) |
| |
| |
Preferred non-voting shares (4) |
| |
| |
| (1) | Issuance of shares for dividend distribution. |
| (2) | These shares were issued at Ps. |
| (3) | Common Voting shares with a nominal value of (Ps. |
| (4) | Since 2011, Grupo Aval allows its shareholders to convert their common shares into preferred shares. For the years ended December 31, 2022 and 2021, |
25.1 Appropriated retained earnings
As of December 31, 2022, and 2021 the appropriation of retained earnings is as follows:
| December 31, 2022 |
| December 31, 2021 | |||
Retained earnings (1) |
| Ps. | ( |
| Ps. | |
Withholding tax over dividends | ( | ( | ||||
Legal reserve |
|
| |
| | |
Statutory and voluntary reserves |
|
| |
| | |
| Ps. | | Ps. | | ||
| (1) | See note 1.1., "Discontinued operation of BAC Holding". |
25.1.1 Legal Reserve
In accordance with current legal regulations, Grupo Aval and its subsidiaries in Colombia shall create a legal reserve through the appropriation of (
25.1.2 Statutory and Voluntary Reserves
The statutory and voluntary reserves are determined during the Shareholders Meetings.
F-200
Grupo Aval Acciones y Valores S.A.
Notes to the Consolidated Financial Statements
For the years ended December 31, 2022, 2021 and 2020
(Amounts expressed in millions of Colombian pesos)
25.2 Declared Dividends
The dividends are declared and paid to shareholders based on unconsolidated net income under Colombian IFRS (NCIF), the dividends declared were as follows:
| December 31, 2021 |
| December 31, 2020 | December 31, 2019 | |||||
Net income for the periods ended in | Ps. | | Ps. | | Ps. | | |||
Cash dividends declared |
|
|
| ||||||
Total outstanding shares |
|
| |
|
| |
| | |
Total dividends declared |
| Ps. | |
| Ps. | | Ps. | | |
(*) See Consolidated Statement of Changes in Equity for dividends distribution.
25.3 Earnings per share
| ● | Basic earnings per share |
Grupo Aval calculates basic earnings per share by dividing net income for the year attributable to controlling interest of Grupo Aval parent company by the weighted average number of shares outstanding during the year (including common and preferred shares).
The following table summarizes the earnings per share for the year ended as of December 31, 2022, 2021 and 2020:
| |||||||
December 31, 2022 | December 31, 2021 | December 31, 2020 | |||||
Net income for the year |
| Ps. | | Ps. | | Ps. | |
Less: participation of non- controlling interests | ( | ( | ( | ||||
Net income attributable to owners of the parent | | | | ||||
Less: preferred dividends declared | — | — | — | ||||
Less: Allocation of undistributed earnings to preferred stockholders (1)(2) | ( | ( | ( | ||||
Net Income allocated to common shareholders for basic and diluted EPS |
| Ps. | | Ps. | | Ps. | |
Weighted average number of common shares outstanding used in basic EPS calculation (2) | | | | ||||
Basic and Diluted earnings per share to common shareholders (in Colombian pesos ) | | | | ||||
Basic and Diluted earnings per ADS (3) (in Colombian pesos ) | | | | ||||
Weighted average of the common and preferred shares used in the calculation of earnings per basic share (common and preferred) | | | | ||||
Basic earnings of the owners of the parent per share in Colombian pesos | | | | ||||
| (1) | Based on a weighted average of preferred shares. |
| (2) | Averages based on an end of month number of preferred or common shares. |
| (3) | Each ADS represents |
F-201
Grupo Aval Acciones y Valores S.A.
Notes to the Consolidated Financial Statements
For the years ended December 31, 2022, 2021 and 2020
(Amounts expressed in millions of Colombian pesos)
The following table summarizes earnings per share over net income from continuing operations for the years ended December 31, 2022, 2021 and 2020.
December 31, 2022 | December 31, 2021 | December 31, 2020 | |||||
Net income from continuing operations |
| Ps. | | Ps. | | Ps. | |
Less: participation of non- controlling interests | ( | ( | ( | ||||
Net income attributable to owners of the parent | | | | ||||
Less: preferred dividends declared | — | — | — | ||||
Less: Allocation of undistributed earnings to preferred stockholders (1)(2) | ( | ( | ( | ||||
Net Income allocated to common shareholders for basic and diluted EPS |
| Ps. | | Ps. | | Ps. | |
Weighted average number of common shares outstanding used in basic EPS calculation (2) | | | | ||||
Basic and Diluted earnings per share to common shareholders (in Colombian pesos) | | | | ||||
Basic and Diluted earnings per ADS (3) (in Colombian pesos ) | | | | ||||
Weighted average of the common and preferred shares used in the calculation of earnings per basic share (common and preferred) | | | | ||||
Basic earnings of the owners of the parent per share in Colombian pesos | | | |
| (1) | Based on a weighted average of preferred shares. |
| (2) | Averages based on an end of month number of preferred or common shares. |
| (3) | Each ADS represents 20 preferred shares. |
The following table summarizes earnings per share over net income from discontinued operations for the years ended December 31, 2022, 2021 and 2020.
December 31, 2022 | December 31, 2021 | December 31, 2020 | |||||
Net income from discontinued operations, net of tax |
| Ps. | | Ps. | | Ps. | |
Less: participation of non- controlling interests | ( | ( | ( | ||||
Net income attributable to owners of the parent | | | | ||||
Less: preferred dividends declared | — | — | — | ||||
Less: Allocation of undistributed earnings to preferred stockholders (1)(2) | ( | ( | ( | ||||
Net Income allocated to common shareholders for basic and diluted EPS |
| Ps. | | Ps. | | Ps. | |
Weighted average number of common shares outstanding used in basic EPS calculation (2) | | | | ||||
Basic and Diluted earnings per share to common shareholders (in Colombian pesos) | | | | ||||
Basic and Diluted earnings per ADS (3) (in Colombian pesos ) | | | | ||||
Weighted average of the common and preferred shares used in the calculation of earnings per basic share (common and preferred) | | | | ||||
Basic earnings of the owners of the parent per share in Colombian pesos | | | |
| (1) | Based on a weighted average of preferred shares. |
| (2) | Averages based on an end of month number of preferred or common shares. |
| (3) | Each ADS represents |
| ● | Diluted earnings per share |
On December 31, 2022, 2021 and 2020, Grupo Aval did not have any dilutive instruments.
F-202
Grupo Aval Acciones y Valores S.A.
Notes to the Consolidated Financial Statements
For the years ended December 31, 2022, 2021 and 2020
(Amounts expressed in millions of Colombian pesos)
25.4 Equity transactions
On December 31, 2022 some transactions took place which resulted in changes to the ownership interests of Grupo Aval and its subsidiaries, below is the detail of the most significant equity transactions:
The equity effect for Ps.
On December 31, 2021 some transactions took place that resulted in changes to the interests of Grupo Aval and its subsidiaries, below is the detail of the most significant equity transactions:
• Corporación Financiera Colombiana S.A. - Corficolombiana S.A.
In Corficolombiana, Grupo Aval and its subsidiaries chose to receive dividends in shares, unlike some minority shareholders who opted to be paid dividends in cash, generating a dilution effect for Ps.
• Preference shares
There was payment of dividends Ps.
On December 31, 2020, some transactions took place that resulted in changes to the interests of Grupo Aval and its subsidiaries, below is the detail of the most significant equity transactions:
Corporación Financiera Colombiana S.A. - Corficolombiana S.A.
In Corficolombiana, Grupo Aval and its subsidiaries chose to receive dividends in shares, unlike some minority shareholders who opted to be payed dividends in cash, generating a dilution effect for Ps.
Multi Financial Group, Inc. (MFG)
In June Leasing Bogotá S.A. Panamá acquired
• Preference shares
There was payment of dividends Ps.
Concesionaria Vial Del Pacifico S.A.S.
Corficolombiana S.A acquired the remaining (
F-203
Grupo Aval Acciones y Valores S.A.
Notes to the Consolidated Financial Statements
For the years ended December 31, 2022, 2021 and 2020
(Amounts expressed in millions of Colombian pesos)
25.5 Consolidated Other Comprehensive Income (OCI):
Components of accumulated Other Comprehensive Income for the years ended December 31, 2022, 2021 and 2020 are as follows:
Net gain (loss) on hedges of net investment in foreign operations | Cash flow hedges | Foreign currency translation differences from unhedged foreign operations | Effect of moving investment properties for own use | Unrealized gains (losses) debt securities | Unrealized gains (losses) Equity securities | Investments in associates and join ventures | Actuarial gains(losses) | Income tax | Total comprehensive income, net of taxes | ||||||||||||
Ending balance 2019 |
| Ps. | ( | Ps. | ( | Ps. | ( | Ps. | | Ps. | | Ps. | | Ps. | | Ps. | ( | Ps. | | Ps. | |
Current-period change |
|
| ( | |
| ( |
| | | |
| | ( |
| |
| ( | ||||
Ending balance 2020 |
| Ps. | ( | Ps. | ( | Ps. | ( | Ps. | | Ps. | | Ps. | | Ps. | | Ps. | ( | Ps. | | Ps. | |
Current-period change |
|
| | |
| ( |
| | ( | ( |
| ( | |
| |
| | ||||
Ending balance 2021 |
| Ps. | | Ps. | | Ps. | ( | Ps. | | Ps. | ( | Ps. | | Ps. | | Ps. | ( | Ps. | | Ps. | |
Current-period change |
|
| ( | ( | | | ( | ( | | | | ( | |||||||||
Realization of OCI to PYG of discontinued operation (1) | | — | | — | ( | — | | — | ( | ( | |||||||||||
Ending balance 2022 |
| Ps. | | Ps. | | Ps. | | Ps. | | Ps. | ( | Ps. | | Ps. | | Ps. | ( | Ps. | | Ps. | ( |
Non -controlling interest | Owners of the parent | Total comprehensive income, net of taxes | |||||||
Beginning balance 2019 |
| Ps. | |
| Ps. | |
| Ps. | |
Current-period change |
|
| |
| ( |
|
| ( | |
Ending balance 2020 |
| Ps. | |
| Ps. | |
| Ps. | |
Current-period change |
|
| |
| |
|
| | |
Ending balance 2021 |
| Ps. | |
| Ps. | |
| Ps. | |
Current-period change |
|
| ( |
| ( |
|
| ( | |
Realization of OCI to PYG of discontinued operation (1) | ( | ( | ( | ||||||
Ending balance 2022 |
| Ps. | |
| Ps. | ( |
| Ps. | ( |
(1) See note 1.1., "Discontinued operation of BAC Holding".
F-204
Grupo Aval Acciones y Valores S.A.
Notes to the Consolidated Financial Statements
For the years ended December 31, 2022, 2021 and 2020
(Amounts expressed in millions of Colombian pesos)
.
NOTE 26 - NON- CONTROLLING INTEREST
The following table includes information regarding the non-controlling interest of each direct subsidiary of Grupo Aval at December 31, 2022 and 2021:
December 31, 2022 | |||||||||||||
|
|
| Non-controlling |
| Non-controlling |
| Dividends paid to non- | ||||||
Non-controlling | Interest share of | interest share of | controlling interest in | ||||||||||
Entity | Country | Interest | equity | net income | the year | ||||||||
Corporación Financiera Colombiana S.A. |
|
| Ps. | |
| Ps. | |
| Ps. | ( | |||
Banco de Bogotá S.A. (*) |
|
|
| |
| |
|
| ( | ||||
Banco de Occidente S.A. |
|
|
| |
| |
|
| ( | ||||
Sociedad Administradora de Fondos de Pensiones y Cesantías Porvenir S.A. | | | ( | ||||||||||
Banco Comercial AV Villas S.A. |
|
|
| |
| |
|
| ( | ||||
Banco Popular S.A. |
|
|
| |
| ( |
|
| ( | ||||
| Total |
| Ps. | |
| Ps. | |
| Ps. | ( | |||
(*) See note 1.1., "Discontinued operation of BAC Holding”
December 31, 2021 | |||||||||||||
|
|
| Non-controlling |
| Non-controlling |
| Dividends paid to non- | ||||||
Non-controlling | Interest share of | interest share of | controlling interest in | ||||||||||
Entity | Country | Interest | equity | net income | the year | ||||||||
Corporación Financiera Colombiana S.A. |
|
| Ps. | |
| Ps. | |
| Ps. | ( | |||
Banco de Bogotá S.A. |
|
|
| |
| |
|
| ( | ||||
Banco de Occidente S.A. |
|
|
| |
| |
|
| ( | ||||
Sociedad Administradora de Fondos de Pensiones y Cesantías Porvenir S.A. |
|
|
| |
| |
|
| ( | ||||
Banco Comercial AV Villas S.A. | | | ( | ||||||||||
Banco Popular S.A. |
|
|
| |
| |
|
| ( | ||||
| Total | Ps. | |
| Ps. | |
| Ps. | ( | ||||
The following table includes information regarding each direct subsidiary of Grupo Aval that has significant non-controlling interests to December 31, 2022, and 2021(before eliminations):
December 31, 2022 | |||||||||||||
|
|
|
|
| Cash Flow from | ||||||||
Entity | Assets | Liabilities | Total Income | Net Income | OCI - Controlling | operating activities | |||||||
Corporación Financiera Colombiana S.A. |
| Ps. | | Ps. | | Ps. | | Ps. | | Ps. | | Ps. | |
Banco de Bogotá S.A. |
| | | | | ( | ( | ||||||
Banco de Occidente S.A. |
| | | | | ( | ( | ||||||
Sociedad Administradora de Fondos de Pensiones y Cesantías Porvenir S.A. | | | | | ( | | |||||||
Banco Comercial AV Villas S.A. |
| | | | | ( | | ||||||
Banco Popular S.A. |
| Ps. | | Ps. | | Ps. | | Ps. | | Ps. | ( | Ps. | ( |
z | |||||||||||||
|---|---|---|---|---|---|---|---|---|---|---|---|---|---|
December 31, 2021 | |||||||||||||
|
|
|
|
| Cash Flow from | ||||||||
Entity | Assets | Liabilities | Total Income | Net Income | OCI - Controlling | operating activities | |||||||
Corporación Financiera Colombiana S.A. |
| Ps. | | Ps. | | Ps. | | Ps. | | Ps. | | Ps. | |
Banco de Bogotá S.A. |
| | | | | | ( | ||||||
Banco de Occidente S.A. |
| | | | | ( | | ||||||
F-205
Grupo Aval Acciones y Valores S.A.
Notes to the Consolidated Financial Statements
For the years ended December 31, 2022, 2021 and 2020
(Amounts expressed in millions of Colombian pesos)
z | |||||||||||||
|---|---|---|---|---|---|---|---|---|---|---|---|---|---|
December 31, 2021 | |||||||||||||
|
|
|
|
| Cash Flow from | ||||||||
Entity | Assets | Liabilities | Total Income | Net Income | OCI - Controlling | operating activities | |||||||
Sociedad Administradora de Fondos de Pensiones y Cesantías Porvenir S.A. | | | | | ( | | |||||||
Banco Comercial AV Villas S.A. |
| | | | | ( | | ||||||
Banco Popular S.A. |
| Ps. | | Ps. | | Ps. | | Ps. | | Ps. | | Ps. | |
NOTE 27 – COMMITMENTS AND CONTINGENCIES
Capital expenses commitments
As of December 31, 2022, and 2021, Grupo Aval and its subsidiaries had contractual disbursement commitments of capital expenditures, for tangible assets for Ps.
Contingencies
As of December 31, 2022, and 2021, Grupo Aval and its subsidiaries were part of administrative and legal proceedings as defendants; the claims of proceedings were assessed based on analyses and opinions of seasoned lawyers for Ps.
Labor Proceedings
As of December 31, 2022, and 2021, the outstanding balances recognized for labor complaints amounted to Ps.
Civil Proceedings
As of December 31, 2022, and 2021, the result of the assessment of claims for civil suits, not including those with remote probability, reached outstanding balances recognized of Ps.
Administrative, Tax Proceedings and Other Proceedings
Claims derived from administrative and judicial processes include those of fiscal responsibility over concession contracts, tax proceedings and other, filed by national and local tax authorities. These authorities may establish, in some cases, sanctions in which Grupo Aval and its subsidiaries may incur as a result of: (i) the performance of their duty as a withholder or collector of national and local taxes, and/or (ii) the obligation to pay a higher tax amount in their condition of taxpayers. As of December 31, 2022, the outstanding balances recognized for these claims amounted to Ps.
Other matters
The outcomes of the following legal processes cannot be necessarily classified as “possible” in accordance with IAS 37, however, they are being disclosed herein in consideration of their relevance.
Class Action before the Administrative Tribune of Cundinamarca in connection with the Ruta del Sol Sector 2 Project
On January 26, 2017, the Inspector-General’s Office (Procuraduría General de la Nación or “PGN”) filed a class action against CRDS, (a company formed by Constructora Norberto Odebrecht S.A., Odebrecht Investimentos em Infraestructura Ltda., CSS Constructores S.A. and Episol), the National Infrastructure Agency ("ANI") and its members, for allegedly violating the collective rights of administrative morality, defense of public patrimony, and access to public services in connection with the Ruta del Sol Sector 2 project. On December 6, 2018, the Administrative Tribunal of Cundinamarca (“TAC”), the body presiding over the class
F-206
Grupo Aval Acciones y Valores S.A.
Notes to the Consolidated Financial Statements
For the years ended December 31, 2022, 2021 and 2020
(Amounts expressed in millions of Colombian pesos)
action, issued a first instance ruling against CRDS, and all its shareholders, including Episol, and other individuals and entities. The TAC found the defendants jointly and severally liable for the damages caused to the collective interests and ordered the payment of Ps.
The aforementioned ruling is not final and appeals were filed by Episol and the other defendants, which were granted by the TAC on February 25, 2019 and will be heard by the Consejo de Estado (Colombia’s Supreme Court on administrative matters). On February 14, 2020, the Consejo de Estado issued a ruling regarding the effects of the appeal, specifying that the provisions of the first instance ruling regarding the delivery of money or other goods as well as the debarment from government contracting would only become enforceable in the event of a final second instance ruling by the Consejo del Estado confirming the decision under appeal.
In the case of Episol, its appeal filing seeks revocation of the TAC’s first instance ruling against it on the basis of multiple substantive and procedural defects.
It is not possible to establish how much time it will take for the Consejo de Estado to make a decision in relation to this case. In the event that the decision of the TAC is confirmed and Episol is compelled to assume the entire amount of the penalty, the maximum impact to the net attributable profit of Grupo Aval would be Ps.
Investigations by United States authorities
In late 2018, the Department of Justice of the United States ("DOJ") and the United States Securities and Exchange Commission ("SEC") informed Grupo Aval that they had opened an investigation on matters related to the Ruta del Sol Sector 2 project. Grupo Aval is cooperating with the DOJ and the SEC in these investigations and is in discussions regarding potential resolutions. However, we are currently unable to predict the outcome of the investigations or our discussions with the regulators, the amount of any penalties we may be required to pay or whether the outcome of these investigations will result in additional obligations.
NOTE 28 – NET INCOME FROM CONTRACTS WITH CUSTOMERS
Below is the detail of the income and expenses for commissions and fees of the continuing operations for the years ended as of December 31, 2022, 2021 and 2020:
December 31, | December 31, | December 31, | ||||
Income from commissions and fees | 2022 | 2021 (1) | 2020 (1) | |||
Banking service fees | Ps. | | Ps. | | Ps. | |
Pension and severance fund management |
| | |
| | |
Debit and credit card fees |
| | |
| | |
Trust activities and portfolio management services |
| | |
| | |
Bonded warehouse services |
| | |
| | |
Commissions on transfers, checks and checkbooks |
| | |
| | |
Office network services |
| | |
| | |
Other commissions and fees |
| | |
| | |
Total income from commissions and fees | Ps. | | Ps. | | Ps. | |
December 31, | December 31, | December 31, | ||||
Expenses from commissions and fees | 2022 | 2021 (1) | 2020 (1) | |||
Banking services | Ps. | ( | Ps. | ( | Ps. | ( |
Sales and services commissions |
| ( | ( |
| ( | |
Fees paid to pension funds sales force |
| ( | ( |
| ( | |
Information processing services of operators |
| ( | ( |
| ( | |
Offices network services |
| ( | ( |
| ( | |
Other |
| ( | ( |
| ( | |
Total expenses from commissions and fees | Ps. | ( | ( |
| ( | |
Net income from commissions and fees | Ps. | | Ps. | Ps. | ||
(1) Comparative information has been re-presented due to a discontinued operation disclosed in Note 1.1.
F-207
Grupo Aval Acciones y Valores S.A.
Notes to the Consolidated Financial Statements
For the years ended December 31, 2022, 2021 and 2020
(Amounts expressed in millions of Colombian pesos)
Below is the detail of the income and cost from goods and services for the years ended as of December 31, 2022, 2021 and 2020:
| December 31, |
| December 31, |
| December 31, | ||||
|---|---|---|---|---|---|---|---|---|---|
Income from sales of goods and services | 2022 | 2021 | 2020 | ||||||
Energy and Gas |
| Ps. | |
| Ps. | |
| Ps. | |
Infrastructure | | | | ||||||
Hotels | | | | ||||||
Agribusiness | | | | ||||||
Other services | | | | ||||||
Total income from sales of goods and services (*) |
| Ps. | |
| Ps. | |
| Ps. | |
(*) See note 31.6, to see income by country.
| December 31, |
| December 31, |
| December 31, | ||||
Costs and expenses of sales goods and services | 2022 | 2021 | 2020 | ||||||
Cost of sales from companies from non-financial sector |
| Ps. | ( |
| Ps. | ( |
| Ps. | ( |
Allowance for impairment of loans and receivables |
|
| ( |
| ( |
|
| ( | |
General and administrative expenses |
|
| ( |
| ( |
|
| ( | |
Personnel expenses |
|
| ( |
| ( |
|
| ( | |
Amortization |
|
| ( |
| ( |
|
| ( | |
Depreciation |
|
| ( |
| ( |
|
| ( | |
Depreciation of right of use assets | ( | ( | ( | ||||||
Employee bonuses |
|
| ( |
| ( |
|
| ( | |
Commissions and fees expenses |
|
| ( |
| ( |
|
| ( | |
Donations expenses |
|
| ( |
| ( |
|
| ( | |
Labor severances |
|
| ( |
| ( |
|
| ( | |
Total costs and expenses of sales goods and services |
| Ps. | ( |
| Ps. | ( |
| Ps. | ( |
Gross profit from sales of goods and services |
| Ps. | |
| Ps. | |
| Ps. | |
NOTE 29 – NET TRADING INCOME
Net trading income includes income from client driven trading activities primarily conducted in markets, including foreign exchange, credit, rates and equities trading, as follows:
| December 31, |
| December 31, |
| December 31, | ||||
2022 | 2021 (4) | 2020 (4) | |||||||
Trading investment income (1) |
|
|
|
|
|
| |||
Fixed income securities |
| Ps. | ( |
| Ps. | ( |
| Ps. | |
Equities |
|
| |
| |
|
| | |
Total trading investment income |
| Ps. | |
| Ps. | |
| Ps. | |
Derivatives income |
|
|
|
|
|
| |||
Net income on financial derivatives (2) |
| Ps. | |
| Ps. | |
| Ps. | |
Other trading income (3) |
|
| |
| |
|
| | |
Total derivatives income |
| Ps. | |
| Ps. | |
| Ps. | |
Total net trading income |
| Ps. | |
| Ps. | |
| Ps. | |
| (1) | Includes net trading income from investment securities held for trading, that reflects the interest from investment in debt securities, gains/losses from mark-to-market valuation from investment in equity and debt securities and net income from trading activities. |
| (2) | Includes net trading income from derivatives, which reflects the gains/losses from mark-to-market valuation on trading derivatives. |
| (3) | Includes gains/losses from: (i) Net changes in the valuation of hedging derivatives from mark-to-market valuations from unhedged, (ii) the ineffective portion of the hedge, (iii) Transfers of due hedging derivatives from OCI to the statement of income. |
| (4) | Comparative information has been re-presented due to a discontinued operation disclosed in Note 1.1. |
F-208
Grupo Aval Acciones y Valores S.A.
Notes to the Consolidated Financial Statements
For the years ended December 31, 2022, 2021 and 2020
(Amounts expressed in millions of Colombian pesos)
NOTE 30 – OTHER INCOME AND EXPENSE
Below is the detail of the other income and expense in the years ended on December 31, 2022, 2021 and 2020:
| December 31, |
| December 31, |
| December 31, | ||||
|---|---|---|---|---|---|---|---|---|---|
Other Income | 2022 | 2021 (1) | 2020 (1) | ||||||
Share of profit of equity accounted investees, net of tax | Ps. | | Ps. | Ps. | |||||
Gain on sale of assets properties, plant and equipment | | ||||||||
Dividends | | | |||||||
Net gain (loss) on asset valuation | | | ( | ||||||
Gain on the sale of non-current assets held for sale | | ||||||||
Net gain (loss) on sale of debt securities | ( | ||||||||
Foreign exchange loss, net | ( | ( | ( | ||||||
Other income (2) | | ||||||||
Total other income | Ps. | ( | Ps. | Ps. | |||||
(1) Comparative information has been re-presented due to a discontinued operation disclosed in Note 1.1.
(2) Includes valuation effect of Bac Holding for Ps.
| December 31, |
| December 31, |
| December 31, | ||||
Other Expense | 2022 | 2021 (1) | 2020 (1) | ||||||
Personnel expenses |
| Ps. | ( |
| Ps. | ( | Ps. | ( | |
Taxes and fees |
|
| ( |
| ( |
| ( | ||
Insurance |
|
| ( |
| ( |
| ( | ||
Consultancy, audit and other fees |
|
| ( |
| ( |
| ( | ||
Maintenance and repairs |
|
| ( |
| ( |
| ( | ||
Affiliation contributions and transfers |
|
| ( |
| ( | ( | |||
Amortization of intangible assets |
|
| ( |
| ( |
| ( | ||
Depreciation of tangible assets |
|
| ( |
| ( |
| ( | ||
Marketing |
|
| ( |
| ( |
| ( | ||
Depreciation right of use assets | ( | ( | ( | ||||||
Warehouse services | ( | ( | ( | ||||||
Leases (Rent) | ( |
| ( | ( | |||||
Transportation services | ( | ( | ( | ||||||
Data processing |
|
| ( |
| ( |
| ( | ||
Cleaning and security services | ( | ( | ( | ||||||
Outsourcing services |
|
| ( |
| ( |
| ( | ||
Supplies and stationary |
|
| ( |
| ( |
| ( | ||
Losses due to claims |
|
| ( |
| ( |
| ( | ||
Donations expenses |
|
| ( |
| ( |
| ( | ||
Adaptation and installation | ( | ( | ( | ||||||
Loss from sale of property and equipment | ( | ( | ( | ||||||
Travel expenses |
|
| ( |
| ( |
| ( | ||
Impairment losses other assets | ( | ( | ( | ||||||
Loss from sale of non-current assets held for sale |
|
| ( |
| ( |
| ( | ||
Other |
|
| ( |
| ( |
| ( | ||
Total other expense |
| Ps. | ( |
| Ps. | ( | Ps. | ( | |
(1) Comparative information has been re-presented due to a discontinued operation disclosed in Note 1.1.
F-209
Grupo Aval Acciones y Valores S.A.
Notes to the Consolidated Financial Statements
For the years ended December 31, 2022, 2021 and 2020
(Amounts expressed in millions of Colombian pesos)
NOTE 31 – ANALYSIS OF OPERATING SEGMENTS
Operating segments are components of Grupo Aval responsible for developing commercial activities that can generate revenue or incur expenses and whose operating profit or loss are regularly reviewed by the chief operating decision maker (“CODM”) of Grupo Aval, and for which financial information is available. Operating segment information is consistent with the internal reports provided to the CODM.
31.1 Description of products and services from which each reportable segment derives its income
Grupo Aval is organized into
Banco de Bogotá S.A., Banco de Occidente S.A., Banco Popular S.A. and Banco AV Villas S.A.: these operating segments provide financial services to companies, individuals and Government organizations mainly in Colombia such as wholesale and retail lending, financial leasing, treasury operations, proprietary trading, trust, logistics and bonded warehouse services, among others.
Sociedad Administradora de Fondos de Pensiones y Cesantías Porvenir S.A. (“Porvenir”): Is the leading private pension fund manager in Colombia in terms of assets under management and has the largest share of earnings in the private pension and severance fund management market in Colombia.
Corficolombiana S.A.: This operating segment consolidates all of Corficolombiana’s subsidiaries. It provides both financial and non-financial services to companies, individuals and Government organizations, mainly in Colombia and Peru. It derives its income from financial services such as: retail lending, treasury operations, proprietary trading, brokerage and trust services, among other. It derives its income from non-financial services from 5 main sectors: Energy & gas (transportation and distribution of natural gas and energy), infrastructure (concession arrangements, mainly in road infrastructure), hotels (hospitality services) and agribusiness (mainly palm oil and rubber).
31.2 Factors used by management to identify reportable segments
Operating segments identified above are based on the relevance of factors such as (i) the nature of the products and services provided and (ii) the geographical locations. Information regarding the performance of operating segments is reviewed by the CODM on a quarterly basis.
With respect to the previous period and as required by IFRS 8 "Operating Segments", the reported figures have been modified to be consistent with 2022 (see note 1.1).
31.3 Measurement of net income, assets and liabilities of operating segments
Grupo Aval’s CODM reviews the financial information of each of its operating segments and assesses the performance of each segment based on Statements of Financial Position and the Statement of Income of each of them, and on certain credit risk indicators, as described in note 2.4.
.
F-210
Grupo Aval Acciones y Valores S.A.
Notes to the Consolidated Financial Statements
For the years ended December 31, 2022, 2021 and 2020
(Amounts expressed in millions of Colombian pesos)
31.4 Information on net income, assets and liabilities of reportable operating segments
The following is the detail of the reportable financial information summarized for each segment as of December 31, 2022, 2021 and 2020:
Statement of Financial Position
December 31, 2022
Banco de | BAC Holding | Banco de | Banco | Banco AV | Porvenir | Corficolombiana | Other | |||||||||||||
Bogotá S.A. | International Corp (1) | Occidente S.A. | Popular S.A. | Villas S.A. | S.A. | S.A. | segments (2) | Eliminations | Total | |||||||||||
Assets |
|
|
|
|
|
|
|
|
|
|
|
|
|
|
|
| ||||
Trading assets | Ps. | | Ps. | — | Ps. | | Ps. | | Ps. | | Ps. | | Ps. | | Ps. | | Ps. | ( | Ps. | |
Investment securities (3) |
| |
| — |
| |
| |
| |
| |
| |
| |
| ( |
| |
Hedging derivatives assets |
| |
| — |
| — |
| — |
| — |
| — |
| |
| — |
| — |
| |
Investments in associates and joint ventures |
| |
| — |
| |
| |
| |
| — |
| |
| |
| ( |
| |
Loans, net (4) |
| |
| — |
| |
| |
| |
| — |
| |
| |
| ( |
| |
Other assets (5) |
| |
| — |
| |
| |
| |
| |
| |
| |
| ( |
| |
Total assets | Ps. | | Ps. | — | Ps. | | Ps. | | Ps. | | Ps. | | Ps. | | Ps. | | Ps. | ( | Ps. | |
Liabilities |
|
|
|
|
|
|
|
|
|
| ||||||||||
Customer deposits |
| | — | | | | | | — | ( |
| | ||||||||
Financial obligations |
| | — | | | | | | | ( |
| | ||||||||
Other liabilities (6) |
| | — | | | | | | | ( |
| | ||||||||
Total liabilities | Ps. | | Ps. | — | Ps. | | Ps. | | Ps. | | Ps. | | Ps. | | Ps. | | Ps. | ( | Ps. | |
| (1) | See note 1.1 “Discontinued operations of BAC Holding”. |
| (2) | Includes Grupo Aval (Separate Financial Statement), Grupo Aval Limited, ATH Joint Ventures and Aval Soluciones Digitales S.A. Joint Ventures. |
| (3) | The balance in other segments corresponds to a bond issued by BAC International Bank Incorporated to Grupo Aval Limited. |
| (4) | The balance in other segments corresponds to others accounts receivable of Grupo Aval (Separate Financial Statement). |
| (5) | Includes cash and cash equivalents for Ps. |
| (6) | Includes trading liabilities Ps. |
F-211
Grupo Aval Acciones y Valores S.A.
Notes to the Consolidated Financial Statements
For the years ended December 31, 2022, 2021 and 2020
(Amounts expressed in millions of Colombian pesos)
Statement of income for 2022
Banco de | BAC Holding | Banco de | Banco Popular | Banco AV | Porvenir | Corficolombiana | Other | |||||||||||||
Bogotá S.A. | International Corp (1) | Occidente S.A. | S.A. | Villas S.A. | S.A. | S.A. | segments (2) | Eliminations | Total | |||||||||||
External income |
|
|
|
|
|
|
|
|
|
|
|
|
|
|
|
| ||||
Interest income | Ps. | | Ps. | — | Ps. | | Ps. | | Ps. | | Ps. | | Ps. | | Ps. | | Ps. | — | Ps. | |
Income from commissions and fees (3) |
| |
| — |
| |
| |
| |
| |
| |
| |
| — |
| |
Income from sales of goods and services (3) | | — | | — | — | | | — | — | | ||||||||||
Share of profit of equity accounted investees, net of tax |
| |
| — |
| |
| |
| |
| — |
| |
| |
| — |
| |
Dividends |
| |
| — |
| |
| |
| |
| — |
| |
| — |
| — |
| |
Net income from other financial instruments mandatory at fair value through profit or loss | — | — | — | — | — | — | | — | — | | ||||||||||
Net trading income | | — | | | | ( | | | — | | ||||||||||
Other income (4) |
| ( |
| — |
| |
| |
| |
| ( |
| ( |
| |
| — |
| ( |
Net income from discontinued operations (5) | | | — | — | — | — | — | ( | — | | ||||||||||
Total external income | Ps. | | Ps. | | Ps. | | Ps. | | Ps. | | Ps. | | Ps. | | Ps. | | Ps. | — | Ps. | |
Banco de | BAC Holding | Banco de | Banco Popular | Banco AV | Porvenir | Corficolombiana | Other | |||||||||||||
Bogotá S.A. | International Corp (1) | Occidente S.A. | S.A. | Villas S.A. | S.A. | S.A. | segments (2) | Eliminations | Total | |||||||||||
Intersegment income |
|
|
|
|
|
|
|
|
|
|
|
|
|
|
|
| ||||
Interest income | Ps. | | Ps. | — | Ps. | | Ps. | | Ps. | | Ps. | | Ps. | | Ps. | | Ps. | ( | Ps. | — |
Income from commissions and fees (3) |
| |
| — |
| |
| |
| |
| |
| |
| |
| ( |
| — |
Income from sales of goods and services (3) | — | — | | — | — | | | — | ( | — | ||||||||||
Share of profit of equity accounted investees, net of tax |
| |
| — |
| |
| |
| ( |
| — |
| |
| — |
| ( |
| — |
Dividends |
| |
| — |
| |
| |
| |
| — |
| |
| — |
| ( |
| — |
Net trading income | — | — | — | — | — | ( | ( | — | | — | ||||||||||
Other income (4) |
| |
| — |
| |
| |
| |
| |
| |
| |
| ( |
| — |
Total intersegment income |
| |
| — |
| |
| |
| |
| |
| |
| |
| ( |
| — |
Total income | Ps. | | Ps. | | Ps. | | Ps. | | Ps. | | Ps. | | Ps. | | Ps. | | Ps. | ( | Ps. | |
Expenses |
|
|
|
|
|
|
|
|
|
|
|
|
|
|
|
| ||||
Interest expense | Ps. | ( | Ps. | — | Ps. | ( | Ps. | ( | Ps. | ( | Ps. | ( | Ps. | ( | Ps. | ( | Ps. | | Ps. | ( |
Net impairment loss on financial assets |
| ( |
| — |
| ( |
| ( |
| ( |
| ( |
| ( |
| ( |
| ( |
| ( |
Depreciation and amortization |
| ( |
| — |
| ( |
| ( |
| ( |
| ( |
| ( |
| ( |
| |
| ( |
Expenses from commissions and fees |
| ( |
| — |
| ( |
| ( |
| ( |
| ( |
| ( |
| ( |
| |
| ( |
Costs and expenses of sales goods and services | ( | — | ( | — | — | ( | ( | | ( | ( | ||||||||||
Administrative expenses |
| ( |
| — |
| ( |
| ( |
| ( |
| ( |
| ( |
| ( |
| |
| ( |
Income tax expense |
| ( |
| — |
| ( |
| |
| ( |
| ( |
| ( |
| ( |
| ( |
| ( |
Other expense (6) |
| ( |
| — |
| ( |
| ( |
| ( |
| ( |
| ( |
| |
| ( |
| ( |
Total expenses |
| ( |
| — |
| ( |
| ( |
| ( |
| ( |
| ( |
| ( |
| |
| ( |
Net income for the year | Ps. | | Ps. | | Ps. | | Ps. | | Ps. | | Ps. | | Ps. | | Ps. | ( | Ps. | ( | Ps. | |
| (1) | See note 1.1. “Discontinued operations of BAC Holding”. |
| (2) | Includes Grupo Aval (Separate Financial Statement), Grupo Aval Limited, ATH Joint Ventures and Aval Soluciones Digitales S.A. Joint Ventures. |
F-212
Grupo Aval Acciones y Valores S.A.
Notes to the Consolidated Financial Statements
For the years ended December 31, 2022, 2021 and 2020
(Amounts expressed in millions of Colombian pesos)
| (3) | See note 28, income from contracts with customers. |
| (4) | Includes Net gain on sale of debt and equity securities for Ps. ( |
| (5) | See note 1.1. “Discontinued operations of BAC Holding”. |
| (6) | Includes personnel expenses of Ps. ( |
Revenue from contracts with customers at December, 2022
| Banco de | BAC Holding | Banco de | Banco | Banco AV | Porvenir | Corficolombiana | Other |
| ||||||||||||
Bogotá S.A. | International Corp (1) | Occidente S.A. | Popular S.A. | Villas S.A. | S.A. | S.A. | segments (2) | Eliminations | Total | ||||||||||||
|
|
|
|
|
|
|
|
|
| ||||||||||||
Revenue from contracts with customers (3) |
| Ps. | | Ps. | — | Ps. | | Ps. | | Ps. | | Ps. | | Ps. | | Ps. | | Ps. | ( | Ps. | |
Timing of revenue recognition |
|
|
|
|
|
|
|
|
|
| |||||||||||
At a point in time |
|
| | — | | | | | | | ( |
| | ||||||||
Over time |
|
| | — | | | | | | | ( |
| |
| (1) | See note 1.1. (A), “Discontinued operations of BAC Holding”. |
| (2) | Includes Grupo Aval (Separate Financial Statement), Grupo Aval Limited, ATH Joint Ventures and Aval Soluciones Digitales S.A. Joint Ventures. |
| (3) | See note, includes Income from contracts with customers. |
Statement of Financial Position December 31, 2021
Banco de | BAC Holding | Banco de | Banco | Banco AV | Porvenir | Corficolombiana | Other | |||||||||||||
Bogotá S.A. | International Corp (1) | Occidente S.A. | Popular S.A. | Villas S.A. | S.A. | S.A. | segments (2) | Eliminations | Total | |||||||||||
Assets |
|
|
|
|
|
|
|
| ||||||||||||
Trading assets | Ps. | | Ps. | | Ps. | | Ps. | | Ps. | | Ps. | | Ps. | | Ps. | | Ps. | ( | Ps. | |
Investment securities |
| |
| |
| |
| |
| |
| |
| |
| — |
| ( | | |
Hedging derivatives assets |
| |
| — |
| — |
| — |
| — |
| — |
| |
| — |
| — | | |
Investments in associates and joint ventures |
| |
| — |
| |
| |
| |
| — |
| |
| |
| ( | | |
Investments in subsidiary companies (3) | | — | — | — | — | — | — | — | ( | — | ||||||||||
Loans, net |
| |
| |
| |
| |
| |
| — |
| |
| — |
| ( | | |
Other assets (4) |
| |
| |
| |
| |
| |
| |
| |
| |
| ( | | |
Total assets | Ps. | | Ps. | | Ps. | | Ps. | | Ps. | | Ps. | | Ps. | | Ps. | | Ps. | ( | Ps. | |
Liabilities |
|
|
|
|
|
|
|
|
|
| ||||||||||
Customer deposits | Ps. | | | | | | | | — | ( |
| | ||||||||
Financial obligations |
| | | | | | | | | ( |
| | ||||||||
Other liabilities (5) |
| | | | | | | | | ( |
| | ||||||||
Total liabilities | Ps. | | Ps. | | Ps. | | Ps. | | Ps. | | Ps. | | Ps. | | Ps. | | Ps. | ( | Ps. | |
| (1) | See note 1.1. “Discontinued operations of BAC Holding”. |
| (2) | Includes Grupo Aval (Separate Financial Statement), Grupo Aval Limited, ATH Joint Ventures and Aval Soluciones Digitales S.A. Joint Ventures. |
| (3) | Includes measurement of subsidiary BAC Holding International Corp. |
| (4) | Includes cash and cash equivalents for Ps. |
| (5) | Includes trading liabilities Ps. |
F-213
Grupo Aval Acciones y Valores S.A.
Notes to the Consolidated Financial Statements
For the years ended December 31, 2022, 2021 and 2020
(Amounts expressed in millions of Colombian pesos)
Statement of Income for the year 2021
| Banco de | BAC Holding | Banco de | Banco Popular | Banco AV | Porvenir | Corficolombiana | Other | |||||||||||||
|---|---|---|---|---|---|---|---|---|---|---|---|---|---|---|---|---|---|---|---|---|---|
Bogotá S.A. | International Corp (1) | Occidente S.A. | S.A. | Villas S.A. | S.A. | S.A. | segments (2) | Eliminations | Total | ||||||||||||
External income |
|
|
|
|
|
|
|
|
|
|
|
|
|
|
|
|
| ||||
Interest income |
| Ps. | | Ps. | — | Ps. | | Ps. | | Ps. | | Ps. | | Ps. | | Ps. | | Ps. | — | Ps. | |
Income from commissions and fees (3) |
|
| |
| — |
| |
| |
| |
| |
| |
| |
| — |
| |
Income from sales of goods and services (3) | | — | | — | — | | | — | — | | |||||||||||
Share of profit of equity accounted investees, net of tax |
|
| |
| — |
| |
| |
| |
| — |
| |
| |
| — |
| |
Dividends |
|
| |
| — |
| |
| |
| |
| — |
| |
| — |
| — |
| |
Net income from other financial instruments mandatory at fair value through profit or loss | — | — | — | — | — | — | | — | — | | |||||||||||
Net trading income | | — | ( | | ( | | | | — | | |||||||||||
Other income (4) |
|
| ( |
| — |
| |
| |
| |
| ( |
| ( |
| |
| — |
| ( |
Discontinued operations (5) | — | | — | — | — | — | — | — | — | | |||||||||||
Total external income |
| Ps. | | Ps. | | Ps. | | Ps. | | Ps. | | Ps. | | Ps. | | Ps. | | Ps. | — | Ps. | |
Banco de | BAC Holding | Banco de | Banco Popular | Banco AV | Porvenir | Corficolombiana | Other | ||||||||||||||
Bogotá S.A. | International Corp (1) | Occidente S.A. | S.A. | Villas S.A. | S.A. | S.A. | segments (2) | Eliminations | Total | ||||||||||||
Intersegment income |
|
|
|
|
|
|
|
|
|
|
|
|
|
|
|
|
| ||||
Interest income |
| Ps. | | Ps. | — | Ps. | | Ps. | | Ps. | | Ps. | | Ps. | | Ps. | | Ps. | ( | Ps. | — |
Income from commissions and fees (3) |
|
| |
| — |
| |
| |
| |
| |
| |
| |
| ( |
| — |
Income from sales of goods and services (3) | | — | | — | — | | | — | ( | — | |||||||||||
Share of profit of equity accounted investees, net of tax |
|
| |
| — |
| |
| |
| ( |
| — |
| |
| — |
| ( |
| — |
Dividends |
|
| |
| — |
| |
| |
| |
| — |
| |
| — |
| ( |
| — |
Net trading income | ( | — | | ( | | ( | ( | — | | — | |||||||||||
Gain on deconsolidation (loss of control) of subsidiaries (6) |
|
| |
| — |
| — |
| — |
| — |
| — |
| — |
| — |
| ( |
| — |
Other income (4) | | — | | | | | ( | | ( | — | |||||||||||
Discontinued operations (5) | | | — | — | — | — | — | — | ( | — | |||||||||||
Total intersegment income |
|
| |
| |
| |
| |
| |
| |
| |
| |
| ( |
| — |
Total income |
| Ps. | | Ps. | | Ps. | | Ps. | | Ps. | | Ps. | | Ps. | | Ps. | | Ps. | ( | Ps. | |
Expenses |
|
|
|
|
|
|
|
|
|
|
|
|
|
|
|
|
| ||||
Interest expense |
| Ps. | ( | Ps. | — | Ps. | ( | Ps. | ( | Ps. | ( | Ps. | ( | Ps. | ( | Ps. | ( | Ps. | | Ps. | ( |
Net impairment loss on financial assets |
|
| ( |
| — |
| ( |
| ( |
| ( |
| ( |
| ( |
| — |
| |
| ( |
Depreciation and amortization |
|
| ( |
| — |
| ( |
| ( |
| ( |
| ( |
| ( |
| ( |
| |
| ( |
F-214
Grupo Aval Acciones y Valores S.A.
Notes to the Consolidated Financial Statements
For the years ended December 31, 2022, 2021 and 2020
(Amounts expressed in millions of Colombian pesos)
| Banco de | BAC Holding | Banco de | Banco Popular | Banco AV | Porvenir | Corficolombiana | Other | |||||||||||||
|---|---|---|---|---|---|---|---|---|---|---|---|---|---|---|---|---|---|---|---|---|---|
Bogotá S.A. | International Corp (1) | Occidente S.A. | S.A. | Villas S.A. | S.A. | S.A. | segments (2) | Eliminations | Total | ||||||||||||
Expenses from commissions and fees |
|
| ( |
| — |
| ( |
| ( |
| ( |
| ( |
| ( |
| ( |
| |
| ( |
Costs and expenses of sales goods and services | ( | — | ( | — | — | ( | ( | | ( | ( | |||||||||||
Administrative expenses |
|
| ( |
| — |
| ( |
| ( |
| ( |
| ( |
| ( |
| ( |
| |
| ( |
Income tax expense |
|
| ( |
| — |
| ( |
| ( |
| ( |
| ( |
| ( |
| ( |
| ( |
| ( |
Other expense (7) |
|
| ( |
| — |
| ( |
| ( |
| ( |
| ( |
| ( |
| |
| ( |
| ( |
Discontinued operations (5) | — | ( | — | — | — | — | — | — | — | ( | |||||||||||
Total expenses |
|
| ( |
| ( |
| ( |
| ( |
| ( |
| ( |
| ( |
| ( |
| |
| ( |
Net income for the year |
| Ps. | | Ps. | | Ps. | | Ps. | | Ps. | | Ps. | | Ps. | | Ps. | | Ps. | ( | Ps. | |
| (1) | See note 1.1. “Discontinued operations of BAC Holding”. |
| (2) | Includes Grupo Aval (Separate Financial Statement), Grupo Aval Limited, Grupo Aval International Limited and ATH Joint Ventures. |
| (3) | See note 28, income from contracts with customers. |
| (4) | Includes Net gain on sale of debt and equity securities for Ps. |
| (5) | Correspond to reclassification for comparability of the movements of BAC Holding consider the deconsolidation of this entity during year 2022. Includes recognition of the spin-off of MFG from the BAC Holding segment to the Banco de Bogotá segment. |
| (6) | Corresponds to deconsolidation of Porvenir from the Banco de Bogotá segment. |
| (7) | Includes personnel expenses of Ps. ( |
Revenue from contracts with customers at December, 2021
| Banco de | BAC Holding | Banco de | Banco | Banco AV | Porvenir | Corficolombiana | Other |
| ||||||||||||
Bogotá S.A. | International Corp (1) | Occidente S.A. | Popular S.A. | Villas S.A. | S.A. | S.A. | segments (2) | Eliminations | Total | ||||||||||||
|
|
|
|
|
|
|
|
|
| ||||||||||||
Revenue from contracts with customers (3) |
| Ps. | | Ps. | — | Ps. | | Ps. | | Ps. | | Ps. | | Ps. | | Ps. | | Ps. | ( | Ps. | |
Timing of revenue recognition |
|
|
|
|
|
|
|
|
|
| |||||||||||
At a point in time |
|
| | — | | | | | | | ( |
| | ||||||||
Over time |
|
| | — | | | | | | | ( |
| |
| (1) | See note 1.1. “Discontinued operations of BAC Holding”. |
| (2) | Includes Grupo Aval (Separate Financial Statement), Grupo Aval Limited and ATH Joint Ventures. |
| (3) | See note 28, includes Income from contracts with customers. |
F-215
Grupo Aval Acciones y Valores S.A.
Notes to the Consolidated Financial Statements
For the years ended December 31, 2022, 2021 and 2020
(Amounts expressed in millions of Colombian pesos)
Statement of Income of the year 2020
Banco de | BAC Holding | Banco de | Banco | Banco AV | Porvenir | Corficolombiana | Other | |||||||||||||
|---|---|---|---|---|---|---|---|---|---|---|---|---|---|---|---|---|---|---|---|---|
Bogotá S.A. | International Corp (1) | Occidente S.A. | Popular S.A. | Villas S.A. | S.A. | S.A. | segments (2) | Eliminations | Total | |||||||||||
External income |
|
|
|
|
|
|
|
|
|
|
|
|
|
|
| |||||
Interest income | Ps. | | Ps. | — | Ps. | | Ps. | | Ps. | | Ps. | | Ps. | | Ps. | | Ps. | — | Ps. | |
Income from commissions and fees (3) |
| |
| — |
| |
| |
| |
| |
| |
| |
| — |
| |
Income from sales of goods and services (3) | | — | | — | — | | | — | — | | ||||||||||
Share of profit of equity accounted investees, net of tax |
| |
| — |
| |
| |
| |
| — |
| |
| |
| — |
| |
Dividends |
| |
| — |
| |
| |
| |
| — |
| |
| — |
| — |
| |
Net income from other financial instruments mandatory at fair value through profit or loss | — | — | — | — | — | — | | — | — | | ||||||||||
Net trading income | | — | | | | | | | — | | ||||||||||
Other income (4) |
| |
| — |
| ( |
| |
| |
| ( |
| |
| |
| — |
| |
Discontinued operations (5) | — | | — | — | — | — | — | — | — | | ||||||||||
Total external income | Ps. | | Ps. | | Ps. | | Ps. | | Ps. | | Ps. | | Ps. | | Ps. | | Ps. | — | Ps. | |
Banco de | BAC Holding | Banco de | Banco | Banco AV | Porvenir | Corficolombiana | Other | |||||||||||||
Bogotá S.A. | International Corp (1) | Occidente S.A. | Popular S.A. | Villas S.A. | S.A. | S.A. | segments (2) | Eliminations | Total | |||||||||||
Intersegment income |
|
|
|
|
|
|
|
|
|
|
| |||||||||
Interest income | Ps. | | Ps. | — | Ps. | | Ps. | | Ps. | | Ps. | | Ps. | | Ps. | | Ps. | ( | Ps. | — |
Income from commissions and fees (3) |
| |
| — |
| |
| |
| |
| |
| |
| |
| ( |
| — |
Income from sales of goods and services (3) | | — | | — | — | | | — | ( | — | ||||||||||
Share of profit of equity accounted investees, net of tax |
| |
| — |
| |
| |
| ( |
| — |
| |
| — |
| ( |
| — |
Dividends |
| |
| — |
| |
| |
| |
| — |
| |
| — |
| ( |
| — |
Net trading income | | — | | ( | ( | — | | — | ( | — | ||||||||||
Other income (4) |
| |
| — |
| |
| |
| |
| |
| ( |
| |
| ( |
| — |
Discontinued operations (5) | | | — | — | — | — | — | — | ( | — | ||||||||||
Total intersegment income | | | | | | | | | ( | — | ||||||||||
Total income | Ps. | | Ps. | | Ps. | | Ps. | | Ps. | | Ps. | | Ps. | | Ps. | | Ps. | ( | Ps. | |
Expenses |
|
|
|
|
|
|
|
|
|
|
| |||||||||
Interest expense | Ps. | ( | Ps. | — | Ps. | ( | Ps. | ( | Ps. | ( | Ps. | ( | Ps. | ( | Ps. | ( | Ps. | | Ps. | ( |
Net impairment loss on financial assets |
| ( |
| — |
| ( |
| ( |
| ( |
| ( |
| ( |
| — |
| |
| ( |
Depreciation and amortization |
| ( |
| — |
| ( |
| ( |
| ( |
| ( |
| ( |
| ( |
| |
| ( |
Expenses from commissions and fees |
| ( |
| — |
| ( |
| ( |
| ( |
| ( |
| ( |
| ( |
| |
| ( |
Costs and expenses of sales goods and services | ( | — | ( | — | — | ( | ( | | ( | ( | ||||||||||
Administrative expenses |
| ( |
| — |
| ( |
| ( |
| ( |
| ( |
| ( |
| ( |
| |
| ( |
Income tax expense |
| ( |
| — |
| |
| ( |
| ( |
| ( |
| ( |
| ( |
| ( |
| ( |
Other expense (6) |
| ( |
| — |
| ( |
| ( |
| ( |
| ( |
| ( |
| |
| ( |
| ( |
F-216
Grupo Aval Acciones y Valores S.A.
Notes to the Consolidated Financial Statements
For the years ended December 31, 2022, 2021 and 2020
(Amounts expressed in millions of Colombian pesos)
Banco de | BAC Holding | Banco de | Banco | Banco AV | Porvenir | Corficolombiana | Other | |||||||||||||
|---|---|---|---|---|---|---|---|---|---|---|---|---|---|---|---|---|---|---|---|---|
Bogotá S.A. | International Corp (1) | Occidente S.A. | Popular S.A. | Villas S.A. | S.A. | S.A. | segments (2) | Eliminations | Total | |||||||||||
Discontinued operations (5) | — | ( | — | — | — | — | — | — | — | ( | ||||||||||
Total expenses |
| ( |
| ( |
| ( |
| ( |
| ( |
| ( |
| ( |
| ( |
| |
| ( |
Net income for the year | Ps. | | Ps. | | Ps. | | Ps. | | Ps. | | Ps. | | Ps. | | Ps. | ( | Ps. | ( | Ps. | |
Revenue from contracts with customers at December, 2020
| Banco de | BAC Holding | Banco de | Banco | Banco AV | Porvenir | Corficolombiana | Other |
| ||||||||||||
Bogotá S.A. | International Corp (1) | Occidente S.A. | Popular S.A. | Villas S.A. | S.A. | S.A. | segments (2) | Eliminations | Total | ||||||||||||
|
|
|
|
|
|
|
|
|
| ||||||||||||
Revenue from contracts with customers (3) |
| Ps. | | Ps. | — | Ps. | | Ps. | | Ps. | | Ps. | | Ps. | | Ps. | | Ps. | ( | Ps. | |
Timing of revenue recognition |
|
|
|
|
|
|
|
|
|
| |||||||||||
At a point in time |
|
| | — | | | | | | | ( |
| | ||||||||
Over time |
|
| | — | | | | | | | ( |
| |
| (1) | See note 1.1. “Discontinued operations of BAC Holding”. |
| (2) | Includes Grupo Aval (Separate Financial Statement), Grupo Aval Limited and ATH Joint Ventures. |
| (3) | Includes Income from contracts with customers, see note 28. |
Reconciliation of net income, assets and liabilities of the reportable operating segments
Main eliminations of total income, expenses, assets and liabilities between segments with the corresponding consolidated entries at the level of Grupo Aval are:
| ● | Loans and financial obligations of entities mainly from non-financial sector. |
| ● | Investments in term deposits and outstanding bonds of in other segments. |
| ● | Investments in subordinates elimination and record of non- controlling interests. |
| ● | Leases and commissions pay between entities of Grupo Aval. |
| ● | Expenses and incomes from commissions |
31.5 Analysis of Revenues by Products and Services
Grupo Aval’s revenues are analyzed by products and services, in the statement of income.
F-217
Grupo Aval Acciones y Valores S.A.
Notes to the Consolidated Financial Statements
For the years ended December 31, 2022, 2021 and 2020
(Amounts expressed in millions of Colombian pesos)
31.6 Income by Country
Grupo Aval’s revenues for each individual country for which revenues are significant, are the following during the years ended December 31, 2022, 2021 and 2020:
December 31, 2022 | ||||||||||||
Country | ||||||||||||
Colombia | Panamá | Barbados | Perú | Other countries (1) | Total income | |||||||
Interest income | Ps. | | Ps. | | Ps. | | Ps. | | Ps. | | Ps. | |
Income from commissions and fees | | | | | | | ||||||
Bonded warehouse services | | — | — | — | — | | ||||||
Trust activities and portfolio management services | | — | — | — | — | | ||||||
Pension and severance fund management | | — | — | — | — | | ||||||
Debit and credit card fees | | | — | — | — | | ||||||
Office network services | | — | — | — | — | | ||||||
Commissions on transfers, checks and checkbooks | | | — | — | — | | ||||||
Other commissions and fees | | — | — | — | — | | ||||||
Banking service fees | | | | | | | ||||||
Share of profit of equity accounted investees, net of tax | | — | — | — | — | | ||||||
Dividends | | | — | — | — | | ||||||
Income from sales of goods and services | | — | — | | — | | ||||||
Energy and Gas E&G | | — | — | | — | | ||||||
Infrastructure | | — | — | — | — | | ||||||
Hotels | | — | — | | — | | ||||||
Agribusiness | | — | — | — | — | | ||||||
Other services | | — | — | — | — | | ||||||
Other income | | | ( | | | | ||||||
Total income from continuing operations | | | | | | | ||||||
Discontinued operations (2) | | — | — | — | — | | ||||||
Total income | Ps. | | Ps. | | Ps. | | Ps. | | Ps. | | Ps. | |
| (1) | Costa Rica and Grand Cayman. |
| (2) | See note 1.1. “Discontinued operations of BAC Holding”. |
F-218
Grupo Aval Acciones y Valores S.A.
Notes to the Consolidated Financial Statements
For the years ended December 31, 2022, 2021 and 2020
(Amounts expressed in millions of Colombian pesos)
December 31, 2021 | ||||||||||||
Country | ||||||||||||
Colombia | Panamá | Barbados | Perú | Other countries (1) | Total income | |||||||
Interest income | Ps. | | Ps. | | Ps. | | Ps. | | Ps. | | Ps. | |
Income from commissions and fees | | | | | | | ||||||
Bonded warehouse services | | — | — | — | — | | ||||||
Trust activities and portfolio management services | | — | — | — | — | | ||||||
Pension and severance fund management | | — | — | — | — | | ||||||
Debit and credit card fees | | | — | — | — | | ||||||
Office network services | | — | — | — | — | | ||||||
Commissions on transfers, checks and checkbooks | | | — | — | — | | ||||||
Other commissions and fees | | — | — | — | — | | ||||||
Banking service fees | | | | | | | ||||||
Share of profit of equity accounted investees, net of tax | | — | — | — | — | | ||||||
Dividends | | | — | — | — | | ||||||
Income from sales of goods and services | | — | — | | — | | ||||||
Energy and gas E&G | | — | — | | — | | ||||||
Infrastructure | | — | — | — | — | | ||||||
Hotels | | — | — | | — | | ||||||
Agribusiness | | — | — | — | — | | ||||||
Other services | | — | — | — | — | | ||||||
Other income | | | | | | | ||||||
Total income from continuing operations | Ps. | | Ps. | | Ps. | | Ps. | | Ps. | | Ps. | |
Discontinued operations (2) | | — | — | — | — | | ||||||
Total income | | | | | | | ||||||
(1) Costa Rica and Grand Cayman.
(2) Correspond to reclassification for comparability of the movements of BAC Holding consider the deconsolidation of this entity during year 2022.
F-219
Grupo Aval Acciones y Valores S.A.
Notes to the Consolidated Financial Statements
For the years ended December 31, 2022, 2021 and 2020
(Amounts expressed in millions of Colombian pesos)
December 31, 2020 | ||||||||||||
Country | ||||||||||||
Colombia | Panamá | Barbados | Perú | Other countries (1) | Total income | |||||||
Interest income | Ps. | | Ps. | | Ps. | | Ps. | | Ps. | | Ps. | |
Income from commissions and fees | | | | | | | ||||||
Bonded warehouse services | | — | — | — | — | | ||||||
Trust activities and portfolio management services | | — | — | — | — | | ||||||
Pension and severance fund management | | — | — | — | — | | ||||||
Debit and credit card fees | | | — | — | — | | ||||||
Office network services | | — | — | — | — | | ||||||
Commissions on transfers, checks and checkbooks | | | — | — | — | | ||||||
Other commissions and fees | | — | — | — | — | | ||||||
Banking service fees | | | | | | | ||||||
Share of profit of equity accounted investees, net of tax | | ( | — | — | — | | ||||||
Dividends | | | — | — | — | | ||||||
Income from sales of goods and services | | | — | | — | | ||||||
Energy and gas E&G | | — | — | | — | | ||||||
Infrastructure | | — | — | — | — | | ||||||
Hotels | | | — | | — | | ||||||
Agribusiness | | — | — | — | — | | ||||||
Other services | | — | — | — | — | | ||||||
Other income | | | | | | | ||||||
Total income from continuing operations | Ps. | | Ps. | | Ps. | | Ps. | | Ps. | | Ps. | |
Discontinued operations (2) | | — | — | — | — | | ||||||
Total income | | | | | | | ||||||
______________________________
| (1) | Costa Rica and Grand Cayman. |
| (2) | Correspond to reclassification for comparability of the movements of BAC Holding consider the deconsolidation of this entity during year 2022. |
F-220
Grupo Aval Acciones y Valores S.A.
Notes to the Consolidated Financial Statements
For the years ended December 31, 2022, 2021 and 2020
(Amounts expressed in millions of Colombian pesos)
During the years ended December 31, 2022, 2021 and 2020, Grupo Aval reported no concentration of revenue in customers with more than a 10% share of revenue from ordinary activities.
The foregoing analysis is based on the customer's domicile. Income from off- shore entities of Colombian customers are reported as income from Colombia. The revenues include income from interest, fees, commissions and other operating income.
31.7 Non-current assets by Country
Grupo Aval’s non-current assets for each individual country for which non-current assets are significant, are as follows as of December 31, 2022 and 2021:
|
|
| ||||
December 31, 2022 | (1) Own – use Property, plant and equipment, net | (2) Intangible assets | ||||
Colombia |
| Ps. | |
| Ps. | |
Panamá |
|
| |
| | |
Peru | | | ||||
Other countries |
|
| |
| | |
Total |
| Ps. | |
| Ps. | |
|
|
| ||||
December 31, 2021 | (1) Own – use Property, plant and equipment, net | (2) Intangible assets | ||||
Colombia |
| Ps. | |
| Ps. | |
Panamá |
|
| |
| | |
Costa Rica |
|
| |
| | |
Guatemala |
|
| |
| | |
Peru | | | ||||
Other countries |
|
| |
| | |
Total |
| Ps. | |
| Ps. | |
(1) see note 15.1
(2) see notes 16 to 18.
NOTE 32 – UNCONSOLIDATED STRUCTURED ENTITIES
The term "unconsolidated structured entities" refers to all structured entities that are not controlled by Grupo Aval. Grupo Aval enters into transactions with unconsolidated structured entities in the normal course of business to facilitate customer transactions and for specific investment opportunities.
The table below shows the total assets of unconsolidated structured entities in which Grupo Aval had an interest at the reporting date and its maximum exposure to loss in relation to those interests:
Nature and risks associated with Grupo Aval’s interests in unconsolidated structured entities
Grupo |
| Investment funds |
| ||||||
Aval’s managed | managed by |
| |||||||
December 31, 2022 | Investment funds | other entities (Nexus) | Total | ||||||
Grupo Aval’s interest-assets |
|
|
|
| |||||
Investments at fair value through profit or loss | Ps. | |
| Ps. | | Ps. | | ||
Other account receivables | |
| — |
| | ||||
Total assets in relation to Grupo Aval’s interests in the unconsolidated structured entities | |
| |
| | ||||
Grupo Aval’s maximum exposure (*) | Ps. | |
| Ps. | | Ps. | | ||
(*) Represent
F-221
Grupo Aval Acciones y Valores S.A.
Notes to the Consolidated Financial Statements
For the years ended December 31, 2022, 2021 and 2020
(Amounts expressed in millions of Colombian pesos)
Grupo |
| Investment funds |
| ||||||
|---|---|---|---|---|---|---|---|---|---|
Aval’s managed | managed by |
| |||||||
December 31, 2021 | Investment funds | other entities (Nexus) | Total | ||||||
Grupo Aval’s interest-assets |
|
|
|
| |||||
Investments at fair value through profit or loss | Ps. | |
| Ps. | | Ps. | | ||
Other account receivables | |
| — |
| | ||||
Total assets in relation to Grupo Aval’s interests in the unconsolidated structured entities | |
| |
| | ||||
Grupo Aval’s maximum exposure (*) | Ps. | |
| Ps. | | Ps. | | ||
(*) Represent
In the normal course of operations, Grupo Aval has trust companies that manage collective investment funds and assets of third parties where the managing trustees receive commissions. Additionally, Grupo Aval’s subsidiary Fondo de Pensiones y Cesantias Porvenir manages mandatory pension funds and defined contribution plans. For management services provided by Porvenir, commissions received vary according to the performance of each fund or asset managed.
The obligations of these entities in the administration of these assets are obligations of means and do not guarantee the results. The maximum exposure risk of loss is determined by the possible failures in the administration of the funds by the amount of the returns that manages and the return of the results of assets the clients.
NOTE 33 - TRANSFERS OF FINANCIAL ASSETS
Grupo Aval enters into transactions in its normal course of business by which it transfers financial assets to third parties. Depending on the circumstances, these transfers may either result in these financial assets being derecognized or continuing to be recognized in Grupo Aval´s financial statements.
| A. | Transferred financial assets not qualifying for full derecognition |
| i. | Sale and repurchase agreements |
Sales and repurchase agreements are transactions in which Grupo Aval sells securities and simultaneously agrees to repurchase them (or assets that are substantially the same) at a fixed price on a future date. Grupo Aval continues to recognize the securities in their entirety in the statement of financial position because it retains substantially all of the risks and rewards of ownership. The cash consideration received is recognized as a financial asset and a financial liability is recognized for the obligation to pay the repurchase price. Because Grupo Aval sells the contractual rights to the cash flows of the securities, it does not have the ability to use the transferred assets during the term of the arrangement. As of December 31, 2022, the financial assets held for trading that are being used as collateral under repurchase agreements amounted to Ps.
| ii. | Securities lending |
As of December 31, 2022, and 2021 Grupo Aval has not recorded securities lending.
| B. | Transfer of financial assets that are derecognized in their entirety. |
i. Securitizations
As of December 31, 2022, and 2021 Grupo Aval has not recorded securitizations.
F-222
Grupo Aval Acciones y Valores S.A.
Notes to the Consolidated Financial Statements
For the years ended December 31, 2022, 2021 and 2020
(Amounts expressed in millions of Colombian pesos)
NOTE 34 – RELATED PARTIES
To verify the correct identification of relationships and transaction with related parties, Grupo Aval has established a specific formal Procedure for the Identification and Disclosure of Balances and Transactions with Related Parties. In application of this procedure, our members of the Board of Directors and our key management personnel are periodically required to identify close family members and entities over which such persons have significant influence. Such process is conducted by a written request containing the criteria that such person must consider in order to provide information on close family members and entities that must be disclosed as their related parties.
In addition, Grupo Aval Vice-Presidency of Accounting Consolidation periodically performs an evaluation of its controlling and non-controlling investments in other entities to identify if such entities should be treated as a related entity.
The following are some of the guidelines included in the abovementioned corporate framework:
| ● | Grupo Aval and its subsidiaries shall permanently carry out the registration of the operations performed with related parties, identifying the type of operation, its purpose, economic conditions and authorizations received when applicable. |
| ● | Grupo Aval and its subsidiaries shall establish limits of indebtedness or exposure and perform constant monitoring of the intragroup operations, complying for such purpose with the restrictions set forth under applicable regulations. |
| ● | All intragroup operations shall be fully identified by accounting areas of the respective entities. |
| ● | Authorization levels are defined within the governance and control structure, assigned as may be deemed adequate as a function of the magnitude and type of transaction, keeping the evidence of such authorizations. |
| ● | It should be verified that related party transactions are carried out for a good and valuable consideration, at market conditions, maintaining a financial equilibrium in the relationships between the entities participating in the operation. |
This Reference Framework for Institutional Relations was also submitted to the consideration and approval of the Board of Directors of our subsidiaries and has been made available in the web sites of Grupo Aval and its subsidiaries.
Balances as of the year ended December 31, 2022 and 2021, with related parties, are detailed in the following tables:
Individuals | Entities | ||||||||||||||
|
|
|
|
| Entities | ||||||||||
Individuals | with | ||||||||||||||
with | Entities | significant | |||||||||||||
control | Key | Associates | controlled | influence | |||||||||||
over Grupo | management | and joint | by | by | |||||||||||
December 31, 2022 | Aval (*) | personnel (*) | ventures | individuals |
| individuals | |||||||||
Assets | |||||||||||||||
Cash and equivalents | Ps. | - | Ps. | - | Ps. | - | Ps. | | Ps. | - | |||||
Investments | - |
| - |
| | |
| - | |||||||
Financial assets in credit operations | |
| |
|
| | (**) | |
| | |||||
Accounts receivable | |
| |
|
| |
| |
| | |||||
Other assets | - |
| - |
|
| |
| |
| | |||||
|
|
|
|
|
|
| |||||||||
Liabilities |
|
|
|
|
|
|
| ||||||||
Deposits |
| Ps. | |
| Ps. | |
| Ps. | | Ps. | |
| Ps. | | |
Accounts payable | |
| |
|
| |
| |
| | |||||
Financial obligations | |
| |
|
| - |
| |
| - | |||||
Other liabilities | - |
| - |
|
| |
| |
| - | |||||
(*) Include family members
(**) Includes two loans for Ps.
F-223
Grupo Aval Acciones y Valores S.A.
Notes to the Consolidated Financial Statements
For the years ended December 31, 2022, 2021 and 2020
(Amounts expressed in millions of Colombian pesos)
Individuals | Entities | ||||||||||||||
|
|
|
|
| Entities | ||||||||||
Individuals | with | ||||||||||||||
with | Entities | significant | |||||||||||||
control | Key | Associates | controlled | influence | |||||||||||
over Grupo | management | and joint | by | by | |||||||||||
December 31, 2021 | Aval (*) | personnel (*) | ventures | individuals | individuals | ||||||||||
Assets |
|
|
|
|
|
|
|
|
| ||||||
Investments |
| Ps. | — |
| Ps. | — |
| Ps. | | Ps. | — |
| Ps. | — | |
Financial assets in credit operations |
|
| |
| |
|
| |
| |
| | |||
Accounts receivable |
|
| |
| |
|
| |
| |
| | |||
Other assets |
|
| — |
| — |
|
| |
| |
| — | |||
|
|
|
|
|
|
|
|
| |||||||
Liabilities |
|
|
|
|
|
|
|
|
| ||||||
Deposits |
| Ps. | |
| Ps. | |
| Ps. | | Ps. | |
| Ps. | | |
Accounts payable |
|
| |
| |
|
| |
| |
| | |||
Financial obligations |
|
| |
| |
|
| — |
| — |
| — | |||
Other liabilities |
|
| — |
| — |
|
| |
| |
| — | |||
(*) Include family members
Transactions during the years ended as of December 31, 2022, 2021 and 2020, with related parties are as follows:
| a. | Profit or loss |
Individuals | Entities | ||||||||||
| Individuals with |
|
|
|
| Entities with | |||||
control | Key | Associates | Entities | significant | |||||||
over Grupo | management | and joint | controlled by | influence by | |||||||
December 31, 2022 | Aval (*) | personnel (*) | ventures | individuals | individuals | ||||||
| |||||||||||
Income |
|
|
|
| |||||||
Interest income |
| Ps. | | Ps. | Ps. | Ps. | Ps. | ||||
Fee income and commissions |
|
| |
|
|
|
| ||||
Leases |
|
| — |
| — |
|
| — |
| — | |
Other income |
|
| |
|
|
|
| ||||
Expenses |
|
|
|
| |||||||
Financial expenses |
| Ps. | ( | Ps. | ( | Ps. | ( | Ps. | ( | Ps. | ( |
Fee expenses and commissions |
|
| ( |
| ( |
| ( |
| ( |
| ( |
Operating expenses |
|
| ( |
| ( |
| ( |
| ( |
| — |
Other expenses |
|
| ( |
| ( |
| ( |
| ( |
| ( |
(*) Include family members
Individuals | Entities | ||||||||||
|
|
|
|
| Entities | ||||||
with | |||||||||||
Individuals with | Entities | significant | |||||||||
control | Key | Associates | controlled | influence | |||||||
over Grupo | management | and joint | by | by | |||||||
December 31, 2021 | Aval (*) | personnel (*) | ventures | individuals | individuals | ||||||
Income |
|
|
|
|
|
| |||||
Interest income |
| Ps. | | Ps. | | Ps. | | Ps. | | Ps. | |
Fee income and commissions |
|
| |
| |
| |
| |
| |
Leases |
|
| — |
| — |
| |
| |
| — |
Other income |
|
| |
| |
| |
| |
| |
Expenses |
|
|
|
|
|
| |||||
Financial expenses |
| Ps. | ( | Ps. | ( | Ps. | ( | Ps. | ( | Ps. | ( |
Fee expenses and commissions |
|
| ( |
| ( |
| ( |
| ( |
| ( |
Operating expenses |
|
| ( |
| ( |
| ( |
| ( |
| — |
Other expenses |
|
| ( |
| ( |
| ( |
| ( |
| — |
(*) Include family members
F-224
Grupo Aval Acciones y Valores S.A.
Notes to the Consolidated Financial Statements
For the years ended December 31, 2022, 2021 and 2020
(Amounts expressed in millions of Colombian pesos)
Individuals | Entities | ||||||||||
|
|
|
|
| Entities | ||||||
with | |||||||||||
Individuals with | Entities | significant | |||||||||
control | Key | Associates | controlled | influence | |||||||
over Grupo | management | and joint | by | by | |||||||
December 31, 2020 | Aval (*) | personnel (*) | ventures | individuals | individuals | ||||||
Income |
|
|
|
|
|
| |||||
Interest income |
| Ps. | | Ps. | | Ps. | | Ps. | | Ps. | |
Fee income and commissions |
|
| |
| |
| |
| |
| |
Leases |
|
| — |
| — | |
| |
| — | |
Other income |
|
| |
| |
| |
| |
| |
Expenses |
|
|
|
|
|
| |||||
Financial expenses |
| Ps. | ( | Ps. | ( | Ps. | ( | Ps. | ( | Ps. | ( |
Fee expenses and commissions |
|
| ( |
| ( |
| ( |
| ( |
| ( |
Operating expenses |
|
| — |
| ( |
| ( |
| ( |
| — |
Other expenses |
|
| |
| ( |
| ( |
| ( |
| — |
(*) Include family members
| b. | Compensation of Key Management Personnel |
The compensation received by the key personnel of the management comprises the following:
Year ended as of | |||||||||
| December 31, |
| December 31, |
| December 31, | ||||
Items | 2022 | 2021 | 2020 | ||||||
Salaries |
| Ps. | |
| Ps. | |
| Ps. | |
Short term benefits for employees |
|
| |
| |
|
| | |
Long term benefits for employees | — | | | ||||||
Fee | | | | ||||||
Total |
| Ps. | |
| Ps. | |
| Ps. | |
Transactions with our related parties correspond primarily to the normal course of banking business activities carried out under market conditions. Such transactions include demand and saving deposits, time deposits, commercial, consumer and mortgage loans, financial leases, payment of dividends and or interest.
NOTE 35 – BUSINESS COMBINATION
On May 22, 2020, BAC Holding International Corp. (BAC Holding) (before, Leasing Bogotá S.A. Panamá), a subsidiary of Banco de Bogotá, acquired Multi Financial Group Inc. (MFG). The acquired Group was comprised mainly of Multibank Inc. and subsidiaries. MFG provides a wide variety of financial services, mainly corporate banking, investment, mortgage and consumer banking, as well as insurance, securities brokerage, factoring, leasing and real estate services. The purchase price was Ps.
In September 2020, BAC Holding received a refund for an amount of Ps.
MFG’s consolidated results have been recognized in Grupo Aval´s consolidated financial statements from the date BAC Holding obtained control. The acquisition was mainly carried out in order to increase BAC Holding´s operation through future business potential, strengthening the leadership position in Panamá, the synergies and economies of scale expected from operations and of
F-225
Grupo Aval Acciones y Valores S.A.
Notes to the Consolidated Financial Statements
For the years ended December 31, 2022, 2021 and 2020
(Amounts expressed in millions of Colombian pesos)
MFG with this transaction being complementary to the lines of business in which the BAC Holding already participates in Panamá. The goodwill has been allocated to MFG as a single operating segment. The recognized goodwill is not deductible for tax purposes.
For the period between the acquisition date and December 31, 2020, MFG contributed revenues of Ps.
The Company incurred costs related to the acquisition of Ps.
Fair value in (US$) | Equivalent to millions of Colombian pesos | |||
Purchase price | | | ||
Assets acquired and liabilities assumed | ||||
Assets | ||||
Cash and cash equivalents | US$ | | Ps. | |
Investments | | | ||
Loans | | | ||
Other accounts receivable | | | ||
Non-current assets held for sale | | | ||
Properties and equipment | | | ||
Right-of-use-assets | | | ||
Investment properties | | | ||
Income tax assets | | | ||
Intangible assets | | | ||
Other Assets | | | ||
Total Assets Acquired | US$ | | Ps. | |
Liabilities | ||||
Hedging derivative liabilities | | | ||
Customer deposits | | | ||
Financial obligations | | | ||
Bonds issued | | | ||
Suppliers and services payable | | | ||
Provisions | | | ||
Employee benefits | | | ||
Income tax liabilities | | | ||
Total Liabilities Assumed | US$ | | Ps. | |
Non-controlling interests | US$ | | Ps. | |
Identifiable assets acquired and liabilities assumed in Multi Financial Group | US$ | | Ps. | |
Goodwill | US$ | | Ps. | |
Grupo Aval has completed the evaluation and allocation of the purchase price based on the acquisition accounting method. Grupo Aval identified that intangible assets correspond mainly to Relationship with Depositors, Relationships with Clients, Brands and Trade Names.
F-226
Grupo Aval Acciones y Valores S.A.
Notes to the Consolidated Financial Statements
For the years ended December 31, 2022, 2021 and 2020
(Amounts expressed in millions of Colombian pesos)
NOTE 36 – SUBSEQUENT EVENTS
| 1. | The General Meeting of Shareholders that took place on March 30, 2023, approved the following: |
Net income for period ended December 31, 2022, included in the unconsolidated financial statements of Grupo Aval | |||
Occasional reserve release at the disposal of the General Meeting of Shareholders | |||
Total Income available for disposal of the General Meeting of Shareholders | |||
Cash dividends | |||
Total dividends declared | |||
To Occasional reserve at the disposal of General Meeting of Shareholders |
| 2. | On March 17, Banco de Bogotá sold |
| 3. | In a meeting held on March 6, 2023, Grupo Aval’s Board of Directors approved the presentation of the consolidated financial statements under Colombian IFRS and the accompanying notes for the period ended December 31, 2022, for consideration of the General Meeting of Shareholders. |
NOTE 37 – PARENT COMPANY INFORMATION
Condensed Separate statement of financial position
The following are the condensed separate Statements of Financial Position of Grupo Aval Acciones y Valores S.A., as of December 31, 2022, and 2021 and Condensed Separate Statements of Income and Statement of Cash Flows for the fiscal year ended on December 31, 2022, 2021 and 2020.
Condensed Separate Statement of Financial Position
December 31, | ||||||
|---|---|---|---|---|---|---|
| 2022 |
| 2021 | |||
Current Assets |
|
|
|
| ||
Cash and cash equivalents |
| Ps. | |
| Ps. | |
Held for trading securities |
|
| |
| | |
Accounts receivable from related parties |
|
| |
| | |
Other assets |
|
| |
| | |
Total current assets |
| |
| | ||
Non current Assets |
|
|
| |||
Investments in subsidiaries and associates |
|
| |
| | |
Accounts receivable from related parties |
|
| |
| — | |
Property plant and equipment | | | ||||
Deferred tax |
|
| |
| | |
Total non current assets |
| Ps. | |
| Ps. | |
F-227
Grupo Aval Acciones y Valores S.A.
Notes to the Consolidated Financial Statements
For the years ended December 31, 2022, 2021 and 2020
(Amounts expressed in millions of Colombian pesos)
December 31, | ||||||
|---|---|---|---|---|---|---|
| 2022 |
| 2021 | |||
Total assets |
| Ps. | |
| Ps. | |
Current liabilities |
|
|
| |||
Borrowings at amortized cost |
|
| |
| | |
Outstanding bonds at amortized cost |
|
| |
| | |
Accounts payable |
|
| |
| | |
Other non-financial liabilities |
|
| |
| | |
Total current liabilities |
| Ps. | |
| Ps. | |
Long-term liabilities |
|
|
| |||
Borrowings at amortized cost |
|
| |
| | |
Outstanding bonds |
|
| |
| | |
Total non current liabilities |
| Ps. | |
| Ps. | |
Total liabilities |
| Ps. | |
| Ps. | |
Equity |
|
|
| |||
Shareholders’ equity |
|
| |
| | |
Total liabilities and shareholders’ equity |
| Ps. | |
| Ps. | |
| December 31, |
| December 31, |
| December 31, | ||||
Condensed separate Statement of Income | 2022 | 2021 | 2020 | ||||||
Operating revenue |
|
|
|
|
|
| |||
Equity method income, net |
| Ps. | |
| Ps. | |
| Ps. | |
Other revenue from ordinary activities |
|
| |
|
| |
| | |
Total operating revenue |
| Ps. | |
| Ps. | |
| Ps. | |
Expenses, net |
|
|
|
|
| ||||
Administrative expenses |
|
| ( |
|
| ( |
| ( | |
Other expenses |
|
| ( |
|
| ( |
| ( | |
(Losses) gains from exchange differences |
|
| ( |
|
| ( |
| ( | |
Operating income |
| Ps. | |
| Ps. | |
| Ps. | |
Financial expenses |
|
| ( |
|
| ( |
| ( | |
|
|
| |||||||
Net income before tax expense |
|
| |
|
| |
| | |
Income tax expense |
|
| ( |
|
| ( |
| ( | |
Net income from continuing operations |
| Ps. | |
| Ps. | |
| Ps. | |
Net income from discontinued operations, net of tax | |
|
| |
| | |||
Net income for the year | Ps. | |
| Ps. | |
| Ps. | | |
F-228
Grupo Aval Acciones y Valores S.A.
Notes to the Consolidated Financial Statements
For the years ended December 31, 2022, 2021 and 2020
(Amounts expressed in millions of Colombian pesos)
| December 31, |
| December 31, |
| December 31, | ||||
|---|---|---|---|---|---|---|---|---|---|
Condensed separate Cash Flow | 2022 | 2021 | 2020 | ||||||
Net income |
| Ps. | |
| Ps. | |
| Ps. | |
Adjustments to reconcile net income to net cash used by operating activities |
|
| ( |
|
| ( |
| ( | |
Net cash provided by operating activities |
| Ps. | ( |
| Ps. | |
| Ps. | |
Net cash used in investing activities |
|
| ( |
|
| ( |
|
| ( |
Net cash used in financing activities |
|
| |
|
| ( |
|
| ( |
Increase in cash and cash equivalents |
| Ps. | ( |
| Ps. | |
| Ps. | |
Effect of foreign currency changes on cash and cash equivalents | — | — | — | ||||||
Cash and cash equivalents at beginning of year |
|
| |
|
| |
| | |
Cash and cash equivalents at end of year |
| Ps. | |
| Ps. | |
| Ps. | |
Basis for presenting and summary of significant accounting policies
The attached Condensed Separated Financial Statement of Grupo Aval has been prepared in accordance with the International Financial Reporting Standards (IFRS) issued by the International Accounting Standards Board (IASB), and their interpretations from the International Financial Reporting Standards Committee (IFRIC), currently in force and on the basis of historic cost, except for financial assets at fair value through profit or loss.
Certain information and footnote disclosures normally included in financial statements prepared in accordance with IFRS have been condensed or omitted for immaterial.
The Condensed Separated Financial Statements of Grupo Aval have been prepared using the same IFRS basis and principles that Grupo Aval used to prepare it consolidated financial statements described in Note 2.
Commitments and contingencies
In the normal course of business, certain subsidiaries of Grupo Aval are defendants in various tax and legal proceedings. Grupo Aval is not aware of any pending legal proceedings which could have a significant effect on its financial position or the results of its operations.
Investment in subsidiaries and associates companies
Based on the IAS 27, when an entity prepares separate financial statements it shall account for investments in subsidiaries either: a) at cost or b) at fair value, in accordance with IFRS 9 or c) using the equity method. Accordingly Grupo Aval accounts for its investments in subsidiaries using the equity method.
The equity method is an accounting method according to which the investment is initially recognizes at cost, and they are periodically adjusted due to changes in the interest of the parent company over the net assets of the subsidiaries. Grupo Aval records on the result of the period its participation in the profit or loss of the subsidiaries, and in OCI its participation in the “Other comprehensive income account” of the subsidiary. In applying equity method Grupo Aval uses the subsidiaries consolidated financial statements at the end of the period prepared under IFRS.
F-229
Grupo Aval Acciones y Valores S.A.
Notes to the Consolidated Financial Statements
For the years ended December 31, 2022, 2021 and 2020
(Amounts expressed in millions of Colombian pesos)
Investment in Subsidiaries and Associates
Investment in subsidiaries and associates as of December 31, 2022 and 2021 comprise the following:
December 31, 2022 | December 31, 2021 | |||||||||
|---|---|---|---|---|---|---|---|---|---|---|
| Direct ownership |
|
| Direct ownership |
|
| ||||
interest held | interest held |
| ||||||||
by Grupo | Book | by Grupo | Book | |||||||
Subsidiary | Aval | Value | Aval | Value | ||||||
Banco de Bogotá S.A. |
|
| Ps. | |
| | % | Ps. | | |
Banco de Occidente S.A. |
|
| |
| | % |
| | ||
Banco Comercial AV Villas S.A. |
|
|
| |
| | % |
| | |
Banco Popular S.A. |
|
|
| |
| | % |
| | |
Corporación Financiera Colombiana S.A. |
|
|
| |
| | % |
| | |
Sociedad Administradora de Fondos de Pensiones y Cesantías Porvenir S.A. |
|
| |
| | % |
| | ||
Grupo Aval Limited |
|
|
| ( |
| | % |
| ( | |
Total subsidiaries |
| Ps. | |
| Ps. | | ||||
Associates | ||||||||||
ADL Digital Lab S.A.S | | % | | % | ||||||
Total associates | ||||||||||
Total investment in subsidiaries and associates | Ps. | Ps. | ||||||||
Outstanding bonds
Outstanding bonds at December 31, 2022 and 2021 comprise the following:
Amounts outstanding | |||||||||||||
|---|---|---|---|---|---|---|---|---|---|---|---|---|---|
Issuance date |
| Tranches |
| Maturity |
| Coupon rate |
| 2022 |
| 2021 | |||
November, 2019 |
| Ps. | |
|
| | % | Ps. | |
| Ps. | | |
November, 2019 |
|
| |
|
| IPC + | % |
| |
|
| | |
June, 2017 | | IPC + | % | | | ||||||||
November, 2016 |
|
| |
|
| IPC + | % |
| |
|
| | |
November, 2016 |
|
| |
|
| IPC + | % | |
|
| | ||
December, 2009 |
|
| |
|
| IPC + | % | |
|
| | ||
Total Bonds |
| Ps. | |
|
|
| Ps. | |
| Ps. | | ||
The scheduled maturities of bonds as of December 31, 2022 are as follows:
Period |
| Amount | |
2023 |
|
| |
2024 |
|
| |
2025 and thereafter |
|
| |
Total |
| Ps. | |
F-230
SIGNATURES
The registrant hereby certifies that it meets all of the requirements for filing on Form 20-F and that it has duly caused and authorized the undersigned to sign this annual report on its behalf.
| Grupo Aval Acciones y Valores S.A. | ||
|
| ||
| By: | /s/ Luis Carlos Sarmiento Gutiérrez | |
|
| Name: | Luis Carlos Sarmiento Gutiérrez |
|
| Title: | President |
Date: April 13, 2023
208