UNITED STATES SECURITIES AND EXCHANGE COMMISSION
Washington, D.C. 20549
Form 10-K
ANNUAL REPORT PURSUANT TO SECTION 13 OR 15(d) OF THE SECURITIES EXCHANGE ACT OF 1934 | |||||
or
TRANSITION REPORT PURSUANT TO SECTION 13 OR 15(d) OF THE SECURITIES EXCHANGE ACT OF 1934 | |||||
For the fiscal year ended December 31, 2023
Commission File No. 001-35522
(Exact name of registrant as specified in its charter)
| (State or other jurisdiction of incorporation or organization) | (I.R.S. Employer Identification No.) | |||||||
(Address of Principal Executive Offices, Including Zip Code)
(855 ) 361-2262
(Registrant's Telephone Number, Including Area Code)
Securities registered pursuant to Section 12(b) of the Act:
| Depositary Shares, each representing a 1/40th interest | ||||||||
| in a share of 7.75% fixed rate reset non-cumulative | ||||||||
| perpetual preferred stock, Series F | BANC/PF | New York Stock Exchange | ||||||
| (Title of Each Class) | (Trading Symbol) | (Name of Exchange on Which Registered) | ||||||
Securities Registered Pursuant to Section 12(g) of the Act: None
Indicate by check mark if the registrant is a well-known seasoned issuer, as defined in Rule 405 of the Securities Act. þ Yes o No
Indicate by check mark if the registrant is not required to file reports pursuant to Section 13 or Section 15(d) of the Act. o Yes þ No
Indicate by check mark whether the registrant (1) has filed all reports required to be filed by Section 13 or 15(d) of the Securities Exchange Act of 1934 during the preceding 12 months (or for such shorter period that the registrant was required to file such reports), and (2) has been subject to such filing requirements for the past 90 days. þ Yes o No
Indicate by check mark whether the registrant has submitted electronically every Interactive Data File required to be submitted pursuant to Rule 405 of Regulation S-T (§ 232.405 of this chapter) during the preceding 12 months (or for such shorter period that the registrant was required to submit such files). þ Yes o No
Indicate by check mark whether the registrant is a large accelerated filer, an accelerated filer, a non-accelerated filer, a smaller reporting company, or an emerging growth company. See the definitions of “large accelerated filer,” “accelerated filer,” “smaller reporting company,” and "emerging growth company" in Rule 12b-2 of the Exchange Act. (Check one):
| ☑ | ☐ | Accelerated filer | ☐ | Non-accelerated filer | |||||||||||||
| Smaller reporting company | Emerging growth company | ||||||||||||||||
| ☐ | If an emerging growth company, indicate by check mark if the registrant has elected not to use the extended transition period for complying with any new or revised financial accounting standards provided pursuant to Section 13(a) of the Exchange Act. | ||||||||||||||||
Indicate by check mark whether the registrant has filed a report on and attestation to its management’s assessment of the effectiveness of its internal control over financial reporting under Section 404(b) of the Sarbanes-Oxley Act (15 U.S.C. 7262(b)) by the registered public accounting firm that prepared or issued its audit report. ☑
Indicate by check mark whether the registrant is a shell company (as defined in Rule 12b-2 of the Act). ☐ Yes þ No
Indicate by check mark whether the financial statements of the registrant included in the filing reflect the correction of an error to previously issued financial statements): o
Indicate by check mark whether any of those error corrections are restatements that required a recovery analysis of incentive-based compensation received by any of the registrant’s executive officers during the relevant recovery period pursuant to §240.10D-1(b): o
1
As of June 30, 2023, the aggregate market value of the voting common stock held by non-affiliates of the registrant, computed by reference to the average high and low sales prices on The New York Stock Exchange as of the close of business on June 30, 2023, was $614.8 million.
As of February 20, 2024, there were 156,794,260 shares of registrant's voting common stock outstanding, excluding 835,133 shares of unvested restricted stock, and the registrant had 477,321 shares of class B non-voting common stock outstanding.
DOCUMENTS INCORPORATED BY REFERENCE
The information required by Items 10, 11, 12, 13 and 14 of Part III of this Annual Report on Form 10-K will be found in the Company's definitive proxy statement for its 2024 Annual Meeting of Stockholders, to be filed pursuant to Regulation 14A under the Securities Exchange Act of 1934, as amended, and such information is incorporated herein by this reference.
2
BANC OF CALIFORNIA, INC.
2023 ANNUAL REPORT ON FORM 10-K
TABLE OF CONTENTS
| PART I | ||||||||
| Forward‑Looking Information | ||||||||
| Available Information | ||||||||
| Glossary of Acronyms, Abbreviations, and Terms | ||||||||
| Item 1. | Business | |||||||
| Item 1A. | Risk Factors | |||||||
| Item 1B. | Unresolved Staff Comments | |||||||
| Item 1C. | Cybersecurity | |||||||
| Item 2. | Properties | |||||||
| Item 3. | Legal Proceedings | |||||||
| Item 4. | Mine Safety Disclosure | |||||||
| PART II | ||||||||
| ITEM 5. | Market For Registrant’s Common Equity, Related Shareholder Matters and Issuer Purchases of Equity Securities | |||||||
| ITEM 6. | Reserved | |||||||
| ITEM 7. | Management’s Discussion and Analysis of Financial Condition and Results of Operations | |||||||
| ITEM 7A. | Quantitative and Qualitative Disclosures About Market Risk | |||||||
| ITEM 8. | Financial Statements and Supplementary Data | |||||||
| ITEM 9. | Changes in and Disagreements with Accountants on Accounting and Financial Disclosure | |||||||
| ITEM 9A. | Controls and Procedures | |||||||
| ITEM 9B. | Other Information | |||||||
| ITEM 9C. | Disclosure Regarding Foreign Jurisdictions that Prevent Inspections | |||||||
| PART III | ||||||||
| ITEM 10. | Directors, Executive Officers and Corporate Governance | |||||||
| ITEM 11. | Executive Compensation | |||||||
| ITEM 12. | Security Ownership of Certain Beneficial Owners and Management and Related Stockholder Matters | |||||||
| ITEM 13. | Certain Relationships and Related Transactions, and Director Independence | |||||||
| ITEM 14. | Principal Accountant Fees and Services | |||||||
| PART IV | ||||||||
| ITEM 15. | Exhibits and Financial Statement Schedules | |||||||
| ITEM 16. | Form 10-K Summary | |||||||
| SIGNATURES | ||||||||
3
PART I
Forward-Looking Information
This Annual Report on Form 10-K contains certain “forward-looking statements” about the Company and its subsidiaries within the meaning of the Private Securities Litigation Reform Act of 1995, including certain plans, strategies, goals, and projections and including statements about our expectations regarding our operating expenses, profitability, allowance for credit losses, net interest margin, net interest income, deposit growth, loan and lease portfolio growth and production, acquisitions and related integrations, maintaining capital adequacy, liquidity, goodwill, and interest rate risk management. All statements contained in this Form 10-K that are not clearly historical in nature are forward-looking, and the words “anticipate,” “assume,” “intend,” “believe,” “forecast,” “expect,” “estimate,” “plan,” “continue,” “will,” “should,” “look forward” and similar expressions are generally intended to identify forward-looking statements. You should not place undue reliance on these statements as they involve risks, uncertainties and contingencies, many of which are beyond our control, which may cause actual results, performance, or achievements to differ materially from those expressed in them as a result of risks and uncertainties more fully described under “Item 1A. Risk Factors.” All forward-looking statements included in this Form 10-K are based on information available at the time the statement is made. We are under no obligation to (and expressly disclaim any such obligation to) update or alter our forward-looking statements, whether as a result of new information, future events or otherwise except as required by law.
Available Information
We maintain a website for Banc of California at http://bancofcal.com. Via the “Financials and Filings” link at http://investors.bancofcal.com, our Annual Report on Form 10‑K, quarterly reports on Form 10‑Q, current reports on Form 8‑K, including any exhibits attached to such filings, and amendments to such reports filed or furnished pursuant to Section 13(a) or 15(d) of the Securities Exchange Act of 1934, as amended, are available, free of charge, as soon as reasonably practicable after such forms are electronically filed with, or furnished to, the SEC. The SEC maintains an Internet website at http://www.sec.gov that contains reports, proxy and information statements, and other information regarding issuers that file electronically with the SEC. You may obtain copies of Banc of California’s filings and PacWest Bancorp's historical filings on the SEC website. These documents may also be obtained in print upon request by our stockholders to our Investor Relations Department.
We have adopted a written Code of Business Conduct and Ethics that applies to all directors, officers and employees, including our principal executive officer and senior financial officers, in accordance with Section 406 of the Sarbanes‑Oxley Act of 2002 and the rules of the SEC promulgated thereunder and it is available via the “Corporate Overview” link at http://investors.bancofcal.com. Any changes in, or waivers from, the provisions of this code of ethics that the SEC requires us to disclose are posted on our website in such section. In the Corporate Governance section of our website, we have also posted the charters for our Audit Committee, Finance Committee, Compensation, Nominating and Corporate Governance Committee, and Enterprise Risk Committee, as well as our Corporate Governance Guidelines. In addition, information concerning purchases and sales of our equity securities by our executive officers and directors is posted on Banc of California, Inc.’s website.
Documents available on Banc of California’s website are available in print to any stockholder who requests them in writing to our Investor Relations Department at Banc of California, Inc., 3 MacArthur Place, Santa Ana, CA 92707, Attention: Investor Relations, or via e‑mail to IR@bancofcal.com.
All website addresses given in this document are for information only and are not intended to be an active link or to incorporate any website information into this document.
4
Presentation of Results – PacWest Bancorp Merger
On November 30, 2023, PacWest Bancorp merged with and into Banc of California, Inc. (the “Merger” or “PACW Merger”), with Banc of California, Inc. continuing as the surviving legal corporation and Banc of California, Inc. concurrently closed a $400 million equity capital raise. The Merger was accounted for as a reverse merger using the acquisition method of accounting, therefore, PacWest Bancorp was deemed the acquirer for financial reporting purposes, even though Banc of California, Inc. was the legal acquirer. The Merger was an all-stock transaction and has been accounted for as a business combination. Banc of California, Inc.'s financial results for all periods ended prior to November 30, 2023 reflect PacWest Bancorp results only on a standalone basis. In addition, Banc of California, Inc.'s reported financial results for the year ended December 31, 2023 reflect PacWest Bancorp financial results only on a standalone basis until the closing of the Merger on November 30, 2023, and results of the combined company for the month of December 2023. The number of shares issued and outstanding, earnings per share, and all references to share quantities or metrics of Banc of California, Inc. have been retrospectively restated to reflect the equivalent number of shares issued in the Merger as the Merger was accounted for as a reverse merger. Under the reverse merger method of accounting, the assets and liabilities of legacy Banc of California, Inc. as of November 30, 2023 were recorded at their respective fair values.
5
Glossary of Acronyms, Abbreviations, and Terms
The acronyms, abbreviations, and terms listed below are used in various sections of this Form 10-K, including "Item 7. Management's Discussion and Analysis of Financial Condition and Results of Operations" and "Item 8. Financial Statements and Supplementary Data."
| ACL | Allowance for Credit Losses | HOA Business | Homeowners Association Services Division (a business acquired from MUFG Union Bank, N.A. on October 8, 2021) | |||||||||||
| AFS | Available-for-Sale | HTM | Held-to Maturity | |||||||||||
| AFX | American Financial Exchange | IRR | Interest Rate Risk | |||||||||||
| ALLL | Allowance for Loan and Lease Losses | LIBOR | London Inter-bank Offering Rate | |||||||||||
| ALM | Asset Liability Management | LIHTC | Low Income Housing Tax Credit | |||||||||||
| ASC | Accounting Standards Codification | MBS | Mortgage-Backed Securities | |||||||||||
| ASU | Accounting Standards Update | MVE | Market Value of Equity | |||||||||||
| ATM | Automated Teller Machine | NAV | Net Asset Value | |||||||||||
| BAM | BofCal Asset Management Inc. | NII | Net Interest Income | |||||||||||
| Basel III | A comprehensive capital framework and rules for U.S. banking organizations approved by the FRB and the FDIC in 2013 | NIM | Net Interest Margin | |||||||||||
| BHCA | Bank Holding Company Act of 1956, as amended | Non-PCD | Non-Purchased Credit Deteriorated | |||||||||||
| BOLI | Bank Owned Life Insurance | NVCE | Non-Voting Common Stock Equivalents | |||||||||||
| CARES Act | Coronavirus Aid, Relief, and Economic Security Act | OCC | Office of the Comptroller of the Currency | |||||||||||
| CDI | Core Deposit Intangible Assets | OFAC | U.S. Treasury Department's Office of Foreign Assets Control | |||||||||||
| CECL | Current Expected Credit Loss | OREO | Other Real Estate Owned | |||||||||||
| CET1 | Common Equity Tier 1 | PCD | Purchased Credit Deteriorated | |||||||||||
| CFPB | Consumer Financial Protection Bureau | PPP | Paycheck Protection Program | |||||||||||
| Civic | Civic Financial Services, LLC (a company acquired on February 1, 2021) | PRSUs | Performance-Based Restricted Stock Units | |||||||||||
| CMBS | Commercial Mortgage-Backed Securities | S&P | Standard & Poor's | |||||||||||
| CMOs | Collateralized Mortgage Obligations | ROU | Right-of-use | |||||||||||
| COVID-19 | Coronavirus Disease | SBA | Small Business Administration | |||||||||||
| CPI | Consumer Price Index | SBIC | Small Business Investment Company | |||||||||||
| CRA | Community Reinvestment Act of 1977, as amended | SEC | Securities and Exchange Commission | |||||||||||
| CRI | Customer Relationship Intangible Assets | SNCs | Shared National Credits | |||||||||||
| DFPI | California Department of Financial Protection and Innovation | SOFR | Secured Overnight Financing Rate | |||||||||||
| Dodd-Frank Act | Dodd-Frank Wall Street Reform and Consumer Protection Act | Tax Equivalent Net Interest Income | Net interest income reflecting adjustments related to tax-exempt interest on certain loans and investment securities | |||||||||||
| DTAs | Deferred Tax Assets | Tax Equivalent NIM | NIM reflecting adjustments related to tax-exempt interest on certain loans and investment securities | |||||||||||
| FASB | Financial Accounting Standards Board | TDRs | Troubled Debt Restructurings | |||||||||||
| FDIC | Federal Deposit Insurance Corporation | TRSAs | Time-Based Restricted Stock Awards | |||||||||||
| FHLB | Federal Home Loan Bank of San Francisco | TruPS | Trust Preferred Securities | |||||||||||
| FRB | Board of Governors of the Federal Reserve System | U.S. GAAP | U.S. Generally Accepted Accounting Principles | |||||||||||
| FRBSF | Federal Reserve Bank of San Francisco | VIE | Variable Interest Entity | |||||||||||
| HLBV | Hypothetical Liquidation at Book Value | |||||||||||||
6
ITEM 1. BUSINESS
General
Banc of California, Inc., a Maryland corporation, was incorporated in March 2002 and serves as the holding company for its wholly owned subsidiary, Banc of California (the “Bank”), a California state-chartered bank and a member of the Board of Governors of the Federal Reserve System (the “FRB”). When we refer to the “parent” or the “holding company”, we are referring to Banc of California, Inc., the parent company, on a stand-alone basis. When we refer to “we,” “us,” “our,” or the “Company”, we are referring to Banc of California, Inc. and its consolidated subsidiaries including the Bank, collectively. As a bank holding company, the holding company is subject to ongoing and comprehensive supervision, regulation examination, and enforcement by the FRB. As a California state-chartered bank that is a member of the FRB, the Bank is subject to ongoing and comprehensive supervision, regulation, examination, and enforcement by the California Department of Financial Protection and Innovation (the “DFPI”) and the FRB.
On November 30, 2023, Banc of California, Inc. completed its transformational merger with PacWest Bancorp ( “PacWest”), pursuant to which PacWest merged into Banc of California, Inc., with Banc of California, Inc. continuing as the surviving legal corporation, and, as of December 1, 2023, Banc of California, N.A. merged into Pacific Western Bank, with Pacific Western Bank continuing under the Banc of California name and brand as the Bank. See Note 2. Business Combinations of the Notes to Consolidated Financial Statements contained in “Item 8. Financial Statements and Supplementary Data” for additional information.
Our principal executive office is currently located at 11611 San Vicente Boulevard, Suite 500, Los Angeles, California, and our telephone number is (855) 361-2262. Our common stock trades on the New York Stock Exchange under the trading symbol “BANC” and our Series F preferred depositary shares trade on the New York Stock Exchange under the trading symbol “BANC/ PF.”
The Bank is one of the nation’s premier relationship-based business banks focused on providing banking and treasury management services to small-, middle-market, and venture-backed businesses. The Bank provides a broad range of loan and deposit products and services through more than 90 full-service branches throughout California and in Denver, Colorado, and Durham, North Carolina, as well as full-stack payment processing solutions through its subsidiary, Deepstack Technologies, LLC (“Deepstack”). Banc of California also serves the Community Association Management Industry nationwide with its technology-forward platform SmartStreet™. The Bank is committed to its local communities by supporting organizations that provide financial literacy and job training, small business support, affordable housing, and more.
The Bank is organized into four business groups – Community Banking, Specialty Banking, Deposit Services, and Payment Solutions. Community Banking provides in-market relationship lending and deposit gathering through regional offices and over 90 branch locations throughout California, in Denver, Colorado and in Durham, North Carolina. Specialty Banking is focused on serving clients in niche verticals by industry, including HOA (or homeowner associations), venture banking, SBA lending, mortgage warehouse lending, media and entertainment and equipment finance. Our Deposit Services provide valuable services to clients in the Community and Specialty Banking groups through tailored cash management and treasury management solutions along with corporate asset management services through our subsidiary BofCal Asset Management, Inc. Our Payment Solutions includes proprietary merchant processing through our subsidiary, Deepstack, the issuance of credit cards and purchasing cards to our business clients, and transaction processing services.
As of December 31, 2023, the Bank had total assets of $38.5 billion, total loans and leases, net of deferred fees, of $25.5 billion, total deposits of $30.4 billion, and stockholders’ equity of $3.4 billion.
Our Business Strategy
Our strategic objective is to be one of the nation's premier relationship-based business banks by delivering outstanding service to our banking clients through our team's ability to collaborate, execute and perform at a level superior to our competition. This involves listening to our clients to understand their needs so that we can actively develop and deliver customized solutions to meet their business objectives. It also involves executing promptly and holding ourselves accountable to the promises we make our clients. We are focused on fostering relationships with businesses in our markets and verticals to establish this understanding and provide an exceptional level of service.
7
We offer a wide variety of deposit, loan and other financial services to small and middle-market businesses, venture capital firms, non-profit organizations, business owners, entrepreneurs, professionals and high-net worth individuals. Our deposit products include checking, savings, money market, certificates of deposit, retirement accounts and safe deposit boxes. Additional products and services leverage other technology and include automated bill payments, cash and treasury management, master demand accounts, foreign exchange, interest rate swaps, card payment services, remote and mobile deposit capture, automated clearing house origination, wire transfer and direct deposit. Our lending activities are focused on providing thoughtful financing solutions to our clients. We consistently invest in automated solutions and our technology infrastructure to gain operating efficiencies and to improve the client experience as we deliver our high standard of service.
We merged with PacWest Bancorp in 2023, and we acquired Deepstack in 2022 (the “Deepstack Acquisition”) and Pacific Mercantile Bancorp in 2021. We will continue to consider acquisitions that are consistent with our business strategy and financial model as opportunities arise.
Depository Products and Services
Deposits are our primary source of funds to support our interest-earning assets and provide a source of stable low-cost funds and deposit-related fee income. We offer traditional deposit products to businesses and other customers with a variety of rates and terms, including demand, money market, and time deposits. We primarily rely on our relationships from our lending activities, competitive pricing policies, marketing and exceptional client service to attract and retain deposits. We also provide international banking services, multi-state deposit services, and asset management services. The Bank’s deposits are insured by the Deposit Insurance Fund (the “DIF”) of the FDIC up to applicable legal limits.
Our branch network allows us to gather deposits, expand our brand presence and service our customers’ banking and cash management needs. We also serve our customers through a wide range of non-branch channels, including online, mobile, remote deposit, and telephone banking platforms, all of which allows us to expand our service area to attract new depositors without a commensurate increase in branch locations or branch traffic.
At December 31, 2023, we had ATMs at 76 of our branches located in California and one ATM at our branch in Denver, Colorado. We provide access to customer accounts via a 24 hour seven-day-a-week, toll-free, automated telephone customer service and secure online banking services.
At December 31, 2023, our total deposits were $30.4 billion and consisted of $7.8 billion in noninterest-bearing deposits, $7.8 billion in interest-bearing checking accounts, $6.2 billion in money market accounts, $2.0 billion in savings accounts, and $6.6 billion in time deposits. Our deposits are diversified and are a mix of deposits from small, middle-market and venture-backed businesses, HOA management companies and many are related to lending relationships to a diversified client base. The Company is not dependent upon any single or limited number of customers, the loss of which would have a material adverse effect on the Company. As of December 31, 2023, there were no customer relationships that individually represented more than 10% of our total deposits or our revenues. The Bank is a participant in the IntraFi Network, a product that offers deposit placement services such as ICS and CDARS, and other reciprocal deposit networks which offer products that qualify large deposits for FDIC insurance. These products spread a customer's large deposit account among other banks in the network to increase the amount of FDIC insurance for that customer and to help us retain the customer's entire banking relationship.
We face strong competition in gathering deposits from nationwide, regional, and community banks, credit unions, money market funds, brokerage firms and other non-bank financial services companies that target the same customers as we do. We actively compete for deposits and emphasize solicitation of noninterest-bearing deposits. We seek to provide a higher level of personal service than our larger competitors, many of whom have more assets, capital and resources than we do and who may be able to conduct more intensive and broader based promotional efforts to reach potential customers. Our cost of funds fluctuates with market interest rates and may be affected by higher rates being offered by other financial institutions. In certain interest rate environments, additional significant competition for deposits may be expected to arise from corporate and government debt securities and money market mutual funds. Competition for deposits is also affected by the ease with which customers can transfer deposits from one institution to another.
8
Client Investment Funds
In addition to deposit products, we also offer select clients non-depository cash investment options through BofCal Asset Management, Inc. (“BAM”), our SEC registered investment adviser subsidiary, and third-party money market sweep products. BAM provides customized investment advisory and asset management solutions. At December 31, 2023, total off-balance sheet client investment funds were $0.6 billion, of which $0.2 billion was managed by BAM. At December 31, 2022, total off-balance sheet client investment funds were $1.4 billion, of which $0.9 billion was managed by BAM.
Payment Processing
We acquired Deepstack to advance our goal to be the hub of the financial services ecosystem for clients while creating another driver of profitable long-term growth and franchise value. Deepstack is a proprietary payments solution that allows us to offer payment processing services to our current business customers as well as integrated software vendors, e-commerce marketplaces, fintechs and other merchants. As of January 2023, we completed the integration of Deepstack's technology into our internal platform and have begun processing payments for select, small clients. We continue to build out the infrastructure and ramp up our business development efforts to continue to increase the scale of our payment processing business.
Lending Activities
At December 31, 2023 and 2022, total loans and leases held for investment, net of deferred fees, were $25.5 billion and $28.6 billion. Our lending activities include real estate mortgage loans, real estate construction loans, commercial loans and leases, purchased single-family residential mortgage loans, and a small amount of consumer loans. Our commercial real estate loans and real estate construction loans are secured by a variety of property types. Included in our commercial real estate loans and real estate construction loans are business-purpose loans secured by non-owner-occupied residential investment properties provided by Civic, a wholly-owned subsidiary. Our commercial loans and leases portfolio is diverse and includes various asset-secured loans, equipment-secured loans and leases, venture capital loans to support venture capital firms’ operations and the operations of entrepreneurial and venture-backed companies, warehouse loans, and business loans originated through our Community Banking group.
In the fourth quarter of 2022, we decided to cease originating new loans to finance life insurance premiums and will allow these loans to repay upon maturities. At December 31, 2023, there were $732.2 million of premium finance loans outstanding.
In the second quarter of 2023, we divested non-core loan portfolios which included selling:
•National Construction portfolio, including $2.6 billion of loans and $2.3 billion of unfunded commitments
•Lender Finance portfolio, including $2.1 billion of loans and $0.2 billion of unfunded commitments
•A portion of the Civic portfolio, including $521 million of loans and $24 million of unfunded commitments
We price loans to preserve our interest spread and maintain our net interest margin. Loan interest rates may be floating, fixed, or a combination thereof (“hybrid”) throughout the loan term. The rates on hybrid loans typically are fixed until a “reset” date when the rates then become floating. While we do not actively solicit direct consumer loans, we hold consumer loans, consisting primarily of purchased single-family residential mortgage loans and purchased private student loans for which the servicing is outsourced.
Some of our loans are participations in larger loans, and these participations may be considered shared national credits. A SNC is any loan or commitment to extend credit aggregating $100 million or more at origination, committed under a formal lending arrangement, and shared by three or more unaffiliated supervised institutions. The SNC program is governed by an inter-agency agreement among the FRB, the FDIC, and the OCC. These agencies review a selection of SNCs periodically, with such review conducted at the lead or agent bank, and deliver a credit risk rating to the participants holding the loans. At December 31, 2023 and 2022, we had SNC loans held for investment to 16 borrowers that totaled $187 million and to 20 borrowers that totaled $530 million. At December 31, 2023 and 2022, SNC loans held for investment comprised 0.07% and 1.9% of total loans and leases held for investment, net of deferred fees.
9
Real Estate Mortgage Loans and Real Estate Construction and Land Loans
Our real estate lending activities focus primarily on loans to professional developers and real estate investors for the acquisition, construction, refinancing, renovation, and on-going operation of commercial real estate. We also provide commercial real estate loans to borrowers operating businesses at these sites (owner occupied commercial real estate loans), including loans to municipalities, schools and school districts, and non-profit borrowers as part of our tax-exempt lending business line.
Our real estate secured loans include the following specific lending products:
•Commercial real estate mortgage. Our commercial real estate mortgage loans generally are collateralized by first deeds of trust on specific commercial properties. The most prevalent types of properties securing our commercial real estate loans are office properties, hotels, retail properties, and industrial properties. The properties are typically located in major metropolitan areas across the United States with a significant concentration of collateral properties located in California within our branch footprint. Our commercial real estate loans typically either have interest and principal payments due on an amortization schedule ranging from 25 to 30 years with a lump sum balloon payment due in one to ten years or may have an initial interest-only period followed by an amortization schedule with a lump sum balloon payment due in one to ten years. We also provide commercial real estate secured loans under the SBA's 7(a) Program and 504 Program. Compliant SBA 7(a) loans have an SBA guaranty for 75% of the principal balance. SBA 504 loans are first deed of trust mortgage loans on owner occupied commercial real estate which are 50% loan-to-value at origination where a second deed of trust is also provided by a non-profit certified development company. The SBA 7(a) and 504 mortgage loans repay on a twenty-five year amortization schedule.
•Residential real estate mortgage. Our residential real estate mortgage loans generally are collateralized by first deeds of trust on multi-family and other residential properties. Multi-family properties comprised 54% of our residential real estate mortgage loans at December 31, 2023. Other types of properties securing these loans include non-owner occupied for-rent residential properties, owner-occupied single-family properties, and mobile home parks. During 2022 and prior years, we directly originated and purchased from other banks multi-family secured real estate mortgage loans. During December 2022, we decided to curtail the amount of multi-family secured real estate mortgage loans we originate and no longer purchase these loans. Multi-family loans either repay on a 30-year amortization schedule or may have an initial interest-only period (up to two years) and then repay on a 30-year amortization schedule. During 2022 and prior years, we purchased single-family residential mortgage loans that met our established lending criteria from multiple third-party lenders. Civic, a lending subsidiary, up until the second quarter of 2023 originated business-purpose loans to real estate investors for short-term bridge loans, longer-term loans secured by for-rent residential properties, and, to a lesser extent, loans on multi-family properties.
•Real estate construction and land. Our real estate construction and land loans generally are collateralized by first deeds of trust on specific residential and commercial properties. The most prevalent types of properties securing our construction and land loans are multi-family, residential properties undergoing a substantial renovation, and office properties (primarily medical office and life science space). Construction loans typically finance from 60% to 65% of the cost to construct residential and commercial properties. The terms are generally one to three years with short-term, performance-based extension options. Civic, a lending subsidiary, up until the second quarter of 2023 originated business-purpose loans secured by non-owner-occupied residential properties undergoing renovation.
10
Our real estate portfolio is subject to certain risks including, but not limited to, the following:
•increased competition in pricing and loan structure;
•the economic conditions of the United States and in the markets where we lend;
•decreased demand or decreased values as a result of legislative changes such as new rent control laws, and permanent shifts in corporate work environment such as remote working and consumer behavior such as online retail;
•interest rate increases;
•decreased commercial and residential real estate values in the markets where we lend;
•the borrower's inability to repay our loan due to decreased cash flow or operating losses;
•the borrower’s inability to refinance or payoff our loan upon maturity;
•loss of our loan principal stemming from a collateral foreclosure; and
•various environmental risks, including natural disasters.
In addition to the points above, real estate construction loans are also subject to project-specific risks including, but not limited to, the following:
•construction costs being more than anticipated;
•construction taking longer than anticipated;
•failure by developers and contractors to meet project specifications or timelines;
•disagreement between contractors, subcontractors and developers;
•estimated value and/or demand for completed projects being less than anticipated, particularly in a weaker economy or recession; and
•buyers of the completed projects not being able to secure permanent financing.
11
Many of the risks outlined above result from market conditions and are not controllable by us. When considering the markets in which to pursue real estate loans, we consider the market conditions, our current loan portfolio concentrations by property type and by market, and our past experiences with the borrower, within the specific market, and with the property type.
When underwriting real estate loans, we seek to mitigate risk by using the following framework:
•requiring borrowers to invest and maintain a meaningful cash equity interest in the properties securing our loans;
•reviewing each loan request and renewal individually;
•using a credit committee approval process for the approval of loan requests (or aggregated credit exposures) over a certain dollar amount;
•adhering to written loan acceptance standards, including among other factors, maximum loan to acquisition or construction cost ratios, maximum loan to as-is or stabilized value ratios, and minimum operating cash flow requirements;
•considering market rental and occupancy rates relative to our underwritten or projected rental and occupancy rates;
•considering the experience of our borrowers and our borrowers’ abilities to operate and manage the properties securing our loans;
•evaluating the supply of comparable real estate and new supply under construction in the collateral's market area;
•obtaining independent third-party appraisals that are reviewed by our appraisal department;
•obtaining environmental risk assessments; and
•obtaining seismic studies where appropriate.
With respect to real estate construction loans, in addition to the points above, we attempt to mitigate project-specific risks by:
•considering the experience of our borrowers and our borrowers’ abilities to manage the properties during construction and into the stabilization periods;
•obtaining project completion guaranties from our borrowers;
•including covenants in our construction loan agreements that require the borrowers to fund costs that exceed the initial construction budgets;
•implementing a controlled disbursement process for loan proceeds in accordance with an agreed upon schedule, which usually results in the borrowers' equity being invested before loan advances commence and which ensures the costs to complete the projects are in balance with our remaining unfunded loan commitments;
•conducting project site visits and using construction consultants who review the progress of the project; and
•monitoring the construction costs compared to the budgeted costs and the remaining costs to complete.
SBA 7(a) and 504 program loans are subject to the risks outlined above and the risk that an SBA 7(a) guaranty may be invalid if specific SBA procedures are not followed. We mitigate this risk by adhering to SBA requirements.
12
Commercial Loans and Leases
Our commercial loans and leases portfolio is diverse and includes various asset-secured loans, equipment-secured loans and leases, venture capital loans to support venture capital firms’ operations and the operations of entrepreneurial and venture-backed companies, warehouse loans, and business loans originated through our Community Banking group. Commercial loan and lease growth also assists in the growth of our deposits because many commercial loan borrowers establish deposit accounts and utilize treasury management services. Those deposit accounts help us to reduce the overall cost of funds and those banking service relationships provide a source of noninterest fee income.
Our commercial loans and leases include the following specific lending products:
•Equipment finance. These are loans and leases used to purchase equipment essential to the operations of our borrowers or lessees. Equipment finance loans are secured by the equipment financed, and we own and lease the equipment to the lessees. The primary source of repayment is the operating income of the borrower or lessee. The loan and lease terms are two to ten years and generally amortize to either a full repayment or residual balance or investment that is expected to be collected through a sale of the equipment to the lessee or a third party.
•Other asset-based. These are loans used for working capital and are secured by trade accounts receivable and/or inventories. The primary sources of repayment are the operating incomes of the borrowers, the collection of the receivables securing the loans, and/or the sale of the inventories securing the loans. The loans are typically revolving lines of credit with terms of one to three years with contractual borrowing availability as a percentage of eligible collateral.
•Venture capital. These are loans directly to venture capital firms or loans to venture-backed companies and are composed of two areas: Fund Finance and Portfolio Company lending. Fund Finance loans are loans made directly to venture capital firms, private equity funds, venture capital funds, and venture capital management companies to provide a bridge to the receipt of capital calls and to support the borrowers’ working capital needs, such as the cost of raising a new venture fund or leasehold improvements for new office space. The primary sources of repayment are receipt of capital calls, proceeds from sales of portfolio company investments, and management fees. The loan terms are generally one to four years, and the loans are typically secured by a first position lien on the assets of the business, an assignment of capital call rights and/or an assignment of management fees. Portfolio company lending involves loans made to venture-backed companies to support the borrowers’ operations, including operating losses, working capital requirements, and fixed asset and other acquisitions. The borrowers are at various stages in their development (early, expansion, or late), and are, generally, reporting operating losses. We typically lend to portfolio companies in two areas: technology, where the portfolio companies are involved in the creation or development of technology or product that has a sizeable market opportunity; and life sciences, where the portfolio companies are involved in the creation and/or development of new medical technology or pharmaceuticals. In each case, the portfolio company has received significant investment from venture capital firms well known to the Bank and lending is customarily a bridge between funding rounds. The primary sources of repayment are future additional venture capital equity investments or the sale of the company or its assets. The loan terms are generally one to four years, and the loans are typically secured by a first priority, secured blanket lien on all corporate assets and/or a lien on intellectual property.
•Secured business. These are secured business loans originated through the Community Banking group. The primary source of repayment is the cash flow of the borrowers. The loans can be up to five years and are secured by a specific asset or assets of the borrower.
•Warehouse loans. Warehouse lending is a line of credit given to a loan originator, the funds from which are used to originate or purchase mortgage loans. The loans have one year terms and generally renew annually. The primary sources of repayment are the sale in the secondary market, either directly or through securitization, of the mortgage loans funded on the warehouse line.
•Other lending. Loans aggregated into the category of “Other lending” are various commercial loan types including Community Banking group business loans, loans to homeowner associations, loans to municipalities and non-profit borrowers, and SBA 7(a) loans for small business expansion. The primary sources of repayments for the Community Banking group business loans, non-profit borrowers, and SBA 7(a) business expansion loans are the operations of the borrowers. The primary sources of repayment for loans to municipalities are tax collections from their tax jurisdictions.
13
Our portfolio of commercial loans and leases is subject to certain risks including, but not limited to, the following:
•the economic conditions of the United States;
•interest rate increases;
•deterioration of the value of the underlying collateral;
•increased competition in pricing and loan structure;
•the deterioration of a borrower’s or guarantor’s financial capabilities; and
•various environmental risks, including natural disasters, which can negatively affect a borrower’s business.
When underwriting commercial loans and leases, we seek to mitigate risk by using the following framework:
•considering the prospects for the borrower's industry and competition;
•considering our past experience with the borrower and with the collateral type;
•considering our current loan and lease portfolio concentration by loan type and collateral type;
•reviewing each loan request and renewal individually;
•using our credit committee approval process for the approval of each loan request (or aggregate credit exposure) over a certain dollar amount; and
•adhering to written loan underwriting policies and procedures including, among other factors, loan structures and covenants.
We actively manage real estate and commercial loans and seek to mitigate credit risk on most loans by using the following framework:
•monitoring the economic conditions in the regions or areas in which our borrowers are operating;
•measuring operating performance of our borrower or collateral and comparing it to our underwriting expectations;
•assessing compliance with financial and operating covenants as set forth in our loan agreements and considering the effects of incidences of noncompliance and taking corrective actions;
•assigning a credit risk rating to each loan and ensuring the accuracy of our credit risk ratings by using an independent credit review function to assess the appropriateness of the credit risk ratings assigned to loans;
•conducting loan portfolio review meetings where senior management and members of credit administration discuss the credit status and related action plans on loans with unfavorable credit risk ratings; and
•subjecting loan modifications and loan renewal requests to underwriting and assessment standards similar to the underwriting and assessment standards applied before closing the loans.
Consumer Loans
Consumer loans are primarily purchased private student loans originated and serviced by third-parties and not guaranteed by any program of the U.S. Government. These loans refinanced the outstanding student loan debt of borrowers who met certain underwriting criteria, with terms that fully amortize the debt over terms ranging from five to twenty years. Consumer loans internally originated may also include personal loans, auto loans, home equity lines of credit, revolving lines of credit, and other loans typically made by banks to individual borrowers.
Our consumer loan portfolio is subject to certain risks, including, but not limited to, the following:
•the economic conditions of the United States and the levels of unemployment;
•the amount of credit offered to consumers in the market;
•interest rate increases;
•consumer bankruptcy laws which allow consumers to discharge certain debts (excluding student loans);
•compliance with consumer lending regulations;
•additional regulations and oversight by the CFPB; and
•the ability of the sub-servicers of the Bank’s student loans to service the loans in accordance with the terms of the loan purchase agreements.
14
We seek to mitigate the exposure to such risks through the direct approval of all internally originated consumer loans by reviewing each new loan request and each renewal individually and adhering to written credit policies. Each purchased pool of loans must meet thresholds we have established for weighted average credit scores, weighted average borrower annual income, and weighted average borrower monthly free cash flow. For all purchased student loans, we monitor the performance of the originator and the enforcement of our rights under the loan purchase agreement.
Loan Concentrations
The following table presents the composition of our loans and leases held for investment, net of deferred fees, by loan portfolio segment and class as of the dates indicated:
| December 31, | |||||||||||||||||||||||||||||||||||
| 2023 | 2022 | 2021 | |||||||||||||||||||||||||||||||||
% of | % of | % of | |||||||||||||||||||||||||||||||||
| Balance | Total | Balance | Total | Balance | Total | ||||||||||||||||||||||||||||||
| (Dollars in thousands) | |||||||||||||||||||||||||||||||||||
| Real estate mortgage: | |||||||||||||||||||||||||||||||||||
| Commercial | $ | 5,026,497 | 20 | % | $ | 3,846,831 | 13 | % | $ | 3,762,299 | 17 | % | |||||||||||||||||||||||
| Multi-family | 6,025,179 | 23 | % | 5,607,865 | 20 | % | 3,916,317 | 17 | % | ||||||||||||||||||||||||||
| Other residential | 5,060,309 | 20 | % | 6,275,628 | 22 | % | 3,922,549 | 17 | % | ||||||||||||||||||||||||||
| Total real estate mortgage | 16,111,985 | 63 | % | 15,730,324 | 55 | % | 11,601,165 | 51 | % | ||||||||||||||||||||||||||
| Real estate construction and land: | |||||||||||||||||||||||||||||||||||
| Commercial | 759,585 | 3 | % | 898,592 | 3 | % | 832,591 | 4 | % | ||||||||||||||||||||||||||
| Residential | 2,399,684 | 9 | % | 3,253,580 | 11 | % | 2,182,091 | 9 | % | ||||||||||||||||||||||||||
Total real estate construction and land (1) | 3,159,269 | 12 | % | 4,152,172 | 14 | % | 3,014,682 | 13 | % | ||||||||||||||||||||||||||
| Total real estate | 19,271,254 | 75 | % | 19,882,496 | 69 | % | 14,615,847 | 64 | % | ||||||||||||||||||||||||||
| Commercial: | |||||||||||||||||||||||||||||||||||
| Asset-based | 2,189,085 | 9 | % | 5,140,209 | 18 | % | 4,075,477 | 18 | % | ||||||||||||||||||||||||||
| Venture capital | 1,446,362 | 6 | % | 2,033,302 | 7 | % | 2,320,593 | 10 | % | ||||||||||||||||||||||||||
| Other commercial | 2,129,860 | 8 | % | 1,108,451 | 4 | % | 1,471,981 | 6 | % | ||||||||||||||||||||||||||
| Total commercial | 5,765,307 | 23 | % | 8,281,962 | 29 | % | 7,868,051 | 34 | % | ||||||||||||||||||||||||||
| Consumer | 453,126 | 2 | % | 444,671 | 2 | % | 457,650 | 2 | % | ||||||||||||||||||||||||||
| Total loans and leases held for | |||||||||||||||||||||||||||||||||||
| investment, net of deferred fees | $ | 25,489,687 | 100 | % | $ | 28,609,129 | 100 | % | $ | 22,941,548 | 100 | % | |||||||||||||||||||||||
_______________________________________
(1) Includes land and acquisition and development loans of $228.9 million at December 31, 2023, $153.5 million at December 31, 2022, and $151.8 million at December 31, 2021.
The real estate mortgage loan portfolio is diversified among various property types. At December 31, 2023, the three largest property types securing real estate mortgage loans were multi-family properties, single-family residential properties, and office properties, which comprised 37%, 31%, and 7% of our real estate mortgage loans, respectively. At December 31, 2022, the three largest property types securing real estate mortgage loans were multi-family properties, single-family residential properties, and office properties, which comprised 36%, 40% and 6% of our real estate mortgage loans, respectively.
At December 31, 2023 and 2022, 40%, and 7% of the total commercial real estate mortgage loans were owner occupied (where our borrowers were operating businesses on the premises that collateralize our loans).
The real estate construction and land loan portfolio is diversified among various property types. At December 31, 2023, the three largest property types for real estate construction and land loans were multi-family properties, industrial/warehouse properties, and commercial land, which comprised 72%, 6% and 5% of our real estate construction and land loans, respectively. At December 31, 2022, the three largest property types for real estate construction and land loans were multi-family properties, industrial/warehouse properties, and hotel properties, which comprised 71%, 5%, and 5% of our real estate construction and land loans, respectively.
15
Financing
We depend on deposits, including brokered deposits, and external financing sources to fund our operations. We employ a variety of financing arrangements, including term debt, subordinated debt, and equity. As a member of the FHLB, the Bank had secured financing capacity with the FHLB as of December 31, 2023 of $5.3 billion, collateralized by a blanket lien on $9.5 billion of qualifying loans and $20.3 million of securities. The Bank also had secured financing capacity with the FRBSF of $6.9 billion as of December 31, 2023 collateralized by liens on $7.7 billion of qualifying loans and $1.3 billion of securities. The Bank also borrowed under the Bank Term Funding Program in 2023.
Information Technology Systems
We devote significant financial and management resources to maintain stable, reliable, efficient, secure and scalable information technology systems. Where possible, we utilize third-party software systems that are hosted and supported by nationally recognized vendors. We work with our third-party vendors to monitor and maximize the efficiency of our use of their applications. We use integrated systems to originate and process loans and deposit accounts, which reduces processing time, automates numerous internal controls, improves customer experiences and reduces costs. Most customer records are maintained digitally. We also provide online, mobile, and telephone banking services to further improve the overall client experience.
We use an enterprise data warehouse system in order to aggregate, analyze, and report key metrics associated with our customers and products. Data is collected across multiple systems so that standard and ad hoc reports are available to assist with managing our business.
We maintain an information technology strategic plan. This plan defines the overall innovation and technology agenda and vision, tracks information technology and information security trends and priorities, and provides details on information technology initiatives over the next several years. Through our annual information technology budgeting process, we analyze our infrastructure for capacity planning, detail migration plans to replace aging hardware and software, and resource plan for internal and external information technology staffing needs against planned initiatives.
Protecting our systems to ensure the safety of customer information is critical to our business. We use multiple layers of protection to control access, detect unusual activity and reduce risk. We regularly conduct a variety of audits and vulnerability and penetration tests on our platforms, systems and applications and maintain comprehensive incident response plans to minimize potential risks, including cyber-attacks. To protect our business operations against disasters, we have a backup off-site core processing system and comprehensive recovery plans.
Risk Oversight and Management
We believe risk management is another core competency of our business. We have a comprehensive risk management process that measures, monitors, evaluates, and manages the risks we assume in conducting our activities. Our oversight of this risk management process is conducted by the Company’s Board of Directors (the “Board”) and its standing committees. The committees each report to the Board and the Board has overall oversight responsibility for risk management.
Our risk framework is structured to guide decisions regarding the appropriate balance between risk and return considerations in our business. Our risk framework is based upon our business strategy, risk appetite, and financial plans approved by our Board. Our risk framework is supported by an enterprise risk management program. Our enterprise risk management program integrates all risk efforts under one common framework. This framework includes risk policies, procedures, measured and reported limits and targets, and reporting. Our Board approves our risk appetite statement, which sets forth the amount and type of risks we are willing to accept in pursuit of achieving our strategic, business, and financial objectives. Our risk appetite statement provides the context for our risk management tools, including, among others, risk policies, limits, portfolio composition, underwriting standards, and operational processes.
16
Competition
The banking business is highly competitive. We compete nationwide with other commercial banks and financial services institutions for loans and leases, deposits, and employees. Some of these competitors are larger in total assets and capitalization, with more offices over a wider geographic area and offer a broader range of financial services than our operations. Our most direct competition for loans comes from larger regional and national banks, diversified finance companies, venture debt funds, and community banks that target the same customers as we do. In recent years, competition has increased from institutions not subject to the same regulatory restrictions as domestic banks and bank holding companies. Those competitors include non-bank specialty lenders, insurance companies, private investment funds, investment banks, financial technology companies, and other financial and non-financial institutions.
Competition is based on a number of factors, including interest rates charged on loans and leases and paid on deposits, underwriting standards, loan covenants, required guarantees, the scope and type of banking and financial services offered, convenience of our branch locations, customer service, technological changes, and regulatory constraints. Many of our competitors are large companies that have substantial capital, technological, and marketing resources. Some of our competitors have substantial market positions and have access to a lower cost of capital or a less expensive source of funds. Because of economies of scale, our larger, nationwide competitors may offer loan pricing that is more attractive than what we are willing to offer.
Economic factors, along with legislative and technological changes, will have an ongoing impact on the competitive environment within the financial services industry. We work to anticipate and adapt to dynamic competitive conditions whether it is by developing and marketing innovative products and services, adopting or developing new technologies that differentiate our products and services, cross marketing, or providing highly personalized banking services. We strive to distinguish ourselves from other banks and financial services providers in our marketplace by providing an extremely high level of service to enhance customer loyalty and to attract and retain business.
We differentiate ourselves in the marketplace through the quality of service we provide to borrowers while maintaining competitive interest rates, loan fees and other loan terms. We emphasize personalized relationship banking services and the efficient decision-making of our lending business units. We compete effectively based on our in-depth knowledge of our borrowers' industries and their business needs based upon information received from our borrowers' key decision-makers, analysis by our experienced professionals, and interaction between these two groups; our breadth of loan product offerings and flexible and creative approach to structuring products that meet our borrowers' business and timing needs; and our dedication to superior client service. However, we can provide no assurance as to the effectiveness of these efforts on our future business or results of operations, as to our continued ability to anticipate and adapt to changing conditions, and as to sufficiently improving our services and banking products in order to successfully compete in the marketplace.
Human Capital Management
Our human capital strategy empowers people to build a high-performing culture. Among our core business objectives are talent development and creating an environment where everyone has an opportunity to succeed. Our business strategy is to operate a client-focused, well-capitalized and profitable nationwide bank dedicated to providing personal service to our business and individual customers. Our employees are our most important assets and they set the foundation for our ability to achieve our strategic objectives. We believe that we have a competitive advantage in the markets we serve because of our long-standing reputation for providing superior, relationship-based customer service. In order to continue to provide the expertise and customer service for which we are known, it is crucial that we continue to attract, retain, and develop top talent. To facilitate talent attraction and retention, we strive to make the Bank a diverse, inclusive, and safe workplace, with opportunities for our employees to grow and advance in their careers, supported by strong compensation, benefits, and health and wellness programs.
17
Oversight and Management
We strive to attract, develop, and retain highly qualified employees for each role in the organization. Working under this principle, our Human Resources Department is tasked with managing employment-related matters, including recruiting and hiring, onboarding and training, compensation planning, performance management, and professional development. Our Board of Directors and Compensation, Nominating and Corporate Governance Committee provide oversight on certain human capital matters, including our compensation and benefit programs. As noted in its charter, our Compensation, Nominating and Corporate Governance Committee is responsible for periodically reviewing employee compensation programs and initiatives to ensure they are competitive and aligned with our stockholders’ long-term interests, including incentives and benefits, as well as our succession planning and strategies. Our Compensation, Nominating and Corporate Governance Committee also works closely with the Enterprise Risk Committee to monitor current and emerging human capital management risks and to mitigate exposure to those risks.
Demographics
At December 31, 2023, we had 2,304 full-time, part-time, and temporary employees, the overwhelming majority of which were full-time employees. None of the Company’s employees are represented by a labor union or by collective bargaining agreements. During 2023, the number of employees increased by approximately 260% due primarily to the Merger.
Human Capital Management Objectives
Our key human capital management objectives are to attract, retain, and develop the highest quality talent. To support these objectives, our human resources programs are designed to develop talent to prepare them for critical roles and leadership positions for the future, reward and support employees through competitive pay, benefit, and perquisite programs, enhance the Company’s culture through efforts aimed at making the workplace more engaging and inclusive, acquire talent, and facilitate internal talent mobility to create a high-performing, diverse workforce, and evolve and invest in technology, tools and resources to enable employees to effectively and efficiently perform their responsibilities and achieve their full potential.
Some examples of key programs and initiatives that are focused to attract, develop and retain our workforce include:
Compensation and Benefits. The philosophy and objectives underlying our compensation programs are to employ and retain talented employees to ensure we execute on our business goals, drive short- and long-term profitable growth of the Company, and create long-term stockholder value. In allocating total compensation, we seek to provide competitive levels of fixed compensation (base salary) and, through annual and long-term incentives, provide for increased total compensation when performance objectives are exceeded and appropriately lower total compensation if performance objectives are not met. Specifically:
•We provide employee wages that are competitive and consistent with employee positions, skill levels, experience, knowledge and geographic location. As of December 31, 2023, our minimum starting wage is $18 per hour.
•We engage nationally recognized outside compensation and benefits consulting firms to independently evaluate the effectiveness of our compensation and benefit programs and to provide benchmarking against our peers within the industry. These reviews have resulted in our reducing the employee cost of our health insurance for our plans and providing best in class 401(k) match to be more in-line with our peers and making the match fully vested immediately.
•We align our executives’ long-term equity compensation with our stockholders’ interests by linking realizable pay with Company performance.
•Annual increases and incentive compensation are based on merit, which is communicated to employees at the time of hiring and documented through our talent management process as part of our annual review procedures and upon internal transfer and/or promotion.
•All full-time employees are eligible for health insurance (medical, dental, and vision), paid and unpaid leaves, 401(k) benefits, life and disability/accident coverage, enhanced mental health offerings, and employee assistance programs. We also offer a variety of voluntary benefits that allow employees to select the options that meet their personal and family needs, including health savings and flexible spending accounts, paid parental leave, public transportation reimbursement, personalized wellness programs and a tuition reimbursement program.
18
Health, Safety and Wellness. The health, safety, and wellness of our employees is fundamentally connected to the success of our business. We provide our employees and their families with access to a variety of flexible, convenient and innovative health and wellness programs to help them improve or maintain their physical and mental well-being. The safety of our employees and customers is paramount. We strive to ensure that all employees feel safe in their respective work environment. We closely monitor external developments and governmental regulations regarding workplace safety and employee health and adjust our policies and procedures accordingly.
Talent Development. We believe that creating an environment which encourages continual learning and development is essential for us to maintain a high level of service and to achieve our goal to have every employee feel that they are a valued member of a successful company. This is why we have implemented a variety of learning and development resources for all levels of employees across the bank. Employees have access to more than 700 training resources online to foster personal and professional development with enhanced training centered on building strong relationships and always striving to be client focused. We also offer team members career development resources, including individual development plans, a mentor program and tuition reimbursement. Through our talent management processes of goal setting, performance reviews, succession planning, career development and encouraging internal mobility we strive to continually develop our people and meet the dynamic needs of our customers.
Diversity and Inclusion. We are committed to creating a culture of inclusion – where differences are both appreciated and respected. We take pride in providing equal employment opportunities and building a workplace culture where all employees feel supported and respected, and have equal access to career and development opportunities without regard to race, religion/creed, color, national origin, age, marital status, ancestry, sex, gender, gender identity/expression, sexual orientation, veteran status, physical or mental disability, medical condition, military status, or any other characteristic protected by federal, state or local laws. To help accomplish this, our Human Resources Department is supported by an employee-led Inclusion, Diversity, Engagement and Awareness (IDEA) Committee to bring together voices and ideas to help fuel and foster a culture of openness and inclusion in all that we do. Our IDEA Committee works closely with our Human Resources team to ensure our recruitment and talent development efforts promote an environment that builds teams and grows talent that reflects the diversity of the clients and communities we serve and fosters an inclusive and equitable culture/workplace.
Financial and Statistical Disclosure
Certain of our statistical information is presented within “Item 7. Management’s Discussion and Analysis of Financial Condition and Results of Operations” and “Item 7A. Quantitative and Qualitative Disclosure About Market Risk.” This information should be read in conjunction with the consolidated financial statements contained in “Item 8. Financial Statements and Supplementary Data.”
19
Supervision and Regulation
General
We are extensively regulated under federal and state laws. As a bank holding company, Banc of California, Inc. (the “Company”) is subject to the BHCA and is subject to ongoing and comprehensive supervision, regulation, examination and enforcement by the FRB. The FRB’s jurisdiction also extends to any company that is directly or indirectly controlled by a bank holding company. The Company has also elected to be a financial holding company under the BHCA. As a California state-chartered bank that is a member of the FRB, the Bank is subject to ongoing and comprehensive supervision, regulation, examination and enforcement by the DFPI and the FRB. In addition, as an FDIC-insured depository institution, the Bank is also subject to regulation by the FDIC.
Federal and state laws and regulations generally applicable to financial institutions regulate the Company’s and the Bank’s scope of business, investments, reserves against deposits, capital levels, the nature and amount of collateral for loans, the establishment of branches, mergers, acquisitions, dividends, and other matters. This regulation and supervision by the banking agencies is intended primarily for the protection of clients and depositors, the public, the stability of the U.S. financial system, and the Deposit Insurance Fund administered by the FDIC and not for the benefit of stockholders or debt holders. Statutes, regulations and policies govern, among other things, the scope of activities that we may conduct and the manner in which we may conduct them; our business plan and growth; our board, management, and risk management infrastructure; the type, terms, and pricing of our products and services; our loan and investment portfolio; our capital and liquidity levels; our reserves against deposits; our ability to pay dividends, buy-back stock or distribute capital; and our ability to engage in mergers, acquisitions and other strategic initiatives. The legal and regulatory framework is continually under review by legislatures, regulators and other governmental bodies, and changes regularly occur through the enactment or amendment of laws and regulations or through shifts in policy, implementation or enforcement.
The material regulatory requirements that are applicable to us and our subsidiaries are summarized below. The description below, as well as other descriptions of laws and regulations in this Form 10-K, is not complete and is qualified in its entirety by reference to applicable laws and regulations and is not intended to summarize all laws and regulations applicable to us and our subsidiaries, and is based upon the statutes, regulations, policies, interpretive letters and other written guidance that are in effect as of the date of this Annual Report on Form 10-K.
Banc of California, Inc.
Permissible Activities. In general, the BHCA limits the activities permissible for bank holding companies to the business of banking, managing or controlling banks and such other activities as the FRB has determined to be so closely related to banking as to be properly incidental thereto.
As a bank holding company that has elected to be a financial holding company pursuant to the BHCA, the Company may affiliate with securities firms and insurance companies and engage, directly or indirectly, in other activities that are (i) financial in nature or incidental or (ii) complementary to activities that are financial in nature and that do not pose a substantial risk to the safety and soundness of depository institutions or the financial system generally. “Financial in nature” activities include securities underwriting, dealing and market making; sponsoring mutual funds and investment companies; insurance underwriting and agency; and merchant banking.
For a bank holding company to be and remain eligible for financial holding company status, the bank holding company and each of its subsidiary U.S. depository institutions must be “well capitalized” and “well managed,” and each of its subsidiary U.S. depository institutions must have received at least a “satisfactory” rating on its most recent assessment under the CRA. If the bank holding company fails to meet applicable standards for financial holding company status, it may be restricted from engaging in new types of financial activities or making certain types of acquisitions or investments in reliance on its status as a financial holding company or other restrictions. If restrictions are imposed on the activities of a financial holding company, such information may not necessarily be available to the public.
The bank regulatory framework requires that we obtain prior approval of one or more regulators for various initiatives or corporate actions, including certain acquisitions or investments and the establishment of branches. Regulators take into account a range of factors in determining whether to grant a requested approval, including the supervisory status of the applicant and its affiliates. Thus, there is no guarantee that a particular proposal by us would receive the required regulatory approvals.
20
Acquisitions. The BHCA and regulations thereunder require every bank holding company to obtain the prior approval of the FRB before it: (i) may acquire direct or indirect ownership or control of any voting shares of any bank or savings and loan association, if after such acquisition, the bank holding company will directly or indirectly own or control 5% or more of the voting shares of the institution; (ii) or any of its subsidiaries, other than a bank, may acquire all or substantially all of the assets of any bank or savings and loan association; or (iii) may merge or consolidate with any other bank holding company. In reviewing applications seeking approval of merger and acquisition transactions, the bank regulatory authorities will consider, among other things, the competitive effect and public benefits of the transactions, the capital position of the combined organization, the risks to the stability of the U.S. banking or financial system, the applicant’s managerial and financial resources, the applicant’s performance record under the CRA, fair housing laws and other consumer compliance laws, and the effectiveness of the banks in combating money laundering activities.
Capital Requirements. As a bank holding company, the Company is subject to the regulations of the FRB imposing capital requirements for a bank holding company, which establish a capital framework as described in “Capital Requirements and Prompt Corrective Action” below. As of December 31, 2023, the Company had capital ratios in excess of the minimums required to be considered “well capitalized.”
Repurchases/Redemptions; Dividends. The ability of the Company to buy back stock and make other capital distributions is limited by regulatory capital rules and other aspects of the regulatory framework. The Federal Reserve Board's Regulation Y, for example, generally requires a bank holding company to give the FRB prior notice of any purchase or redemption of its equity securities if the consideration for the purchase or redemption, when combined with the consideration for all such purchases or redemptions in the preceding 12 months, is equal to 10% or more of its consolidated net worth. Notice to the FRB would include, but may not be limited to, background information on a redemption, pro-forma financial statements that reflect the planned transaction including impact to a bank holding company and stress testing that incorporates the transaction. The FRB may disapprove such a purchase or redemption if it determines that the proposal would be an unsafe or unsound practice or would violate any law, regulation, FRB order, or condition imposed in writing by the FRB. This notification requirement does not apply to a bank holding company that qualifies as well-capitalized, received a composite rating and a rating for management of satisfactory or better in its last examination and is not subject to any unresolved supervisory issue.
In addition, Federal bank regulators are authorized to determine under certain circumstances relating to the financial condition of a bank holding company that the payment of dividends would be an unsafe or unsound practice and to prohibit payment thereof. It is the policy of the Federal Reserve Board that bank holding companies should pay cash dividends on common stock only out of income available over the past year and only if prospective earnings retention is consistent with the organization's expected future capital needs, asset quality, and overall financial condition. Under the FRB’s policy statement on the payment of cash dividends, a bank holding company generally should not maintain a level of cash dividends that undermines the bank holding company's ability to serve as a source of strength to its banking subsidiaries. FRB policy also provides that a bank holding company should inform the FRB reasonably in advance of declaring or paying a dividend that exceeds earnings for the period for which the dividend is being paid or that could result in a material adverse change to the bank holding company’s capital structure. Regarding dividends, see “Capital Requirements and Prompt Corrective Action” below.
Source of Strength. Under FRB regulations, which were codified by the Dodd-Frank Wall Street Reform and Consumer Protection Act, a bank holding company, such as the Company, must serve as a source of financial and managerial strength for any FDIC-insured depository institution that it controls, such as the Bank. Thus, if the Bank were to be in financial distress or to otherwise be viewed by the regulators as in unsatisfactory condition, then the regulators could require the Company to provide additional capital or liquidity support, or take other action, in support of the Bank—even if doing so is not otherwise in the best interest of the Company.
The Bank
Liquidity. The Bank is subject to a variety of requirements under federal law. The Bank is required to maintain sufficient liquidity to ensure safe and sound operations. For additional information, see Liquidity included in “Item 7. Management’s Discussion and Analysis of Financial Condition and Results of Operations” of this Annual Report on Form 10-K.
Safety and Soundness. A principal objective of the U.S. bank regulatory system is to ensure the safety and soundness of banking organizations. Safety and soundness is a broad concept that includes financial, operational, compliance, and reputational considerations, including matters such as capital, asset quality, quality of board and management oversight, earnings, liquidity, and sensitivity to market and interest rate risk.
21
The banking and financial regulators have broad examination and enforcement authority. The regulators require banking organizations to file detailed periodic reports and regularly examine the operations of banking organizations. Banking organizations that do not meet the regulators’ supervisory expectations can be subjected to increased scrutiny and supervisory criticism. The regulators have various remedies available, which may be public or of a confidential supervisory nature, if they determine that an institution’s condition, management, operations or risk profile are unsatisfactory. The regulators may also take action if they determine that the banking organization or its management is violating or has violated any applicable law or regulation. The regulators have the power to, among other things:
•require affirmative actions to correct any violation or practice;
•issue administrative orders that can be judicially enforced;
•direct increases in capital;
•direct the sale of subsidiaries or other assets;
•limit dividends and distributions;
•restrict growth and activities;
•assess civil monetary penalties;
•remove officers and directors; and
•terminate deposit insurance.
Engaging in unsafe or unsound practices or failing to comply with applicable laws, regulations and supervisory agreements could subject us and our subsidiaries or their officers, directors and institution-affiliated parties to the remedies described above and other sanctions.
Acquisitions. The FRB and the DFPI must approve an acquisition of the Bank and the Bank’s acquisition of other financial institutions and certain other acquisitions. For a discussion of the factors considered by the FRB and DFPI in connection with such acquisitions, see “—Banc of California, Inc.—Acquisitions” above.
Lending Limits. Our lending activities are subject to a variety of lending limits imposed by law and regulation. In general, the Bank is subject to a legal lending limit on loans to a single borrower based on the Bank’s capital level. The dollar amounts of the Bank’s lending limit increases or decreases as the Bank’s capital increases or decreases. If necessary, the Bank is able to sell participations in its larger loans to other financial institutions, which allows it to manage the risk involved in these loans and to meet the lending needs of its customers requiring extensions of credit in excess of these limits. As of December 31, 2023, the Bank has no loans in excess of its loans-to-one borrower limit.
Dividends. The Company’s primary source of liquidity is dividend payments from the Bank. The regulatory regime imposes various restrictions on the ability of the Bank to make capital distributions, which include dividends, stock redemptions or repurchases, and certain other items. For example, taking into account the financial condition of the Bank and other factors, the DFPI may object and therefore prevent the Bank from paying dividends to the Company. Generally, the Bank may declare a dividend without the approval of the DFPI as long as the total dividends declared in a calendar year do not exceed either the retained earnings of the Bank or the total of net earnings of the Bank for three previous fiscal years less any dividend paid during such period. Because substantially all of our business activities, income and cash flow are expected to be generated by the Bank, an inability of the Bank to pay dividends or distribute capital to the Company would adversely affect the Company’s liquidity. Dividends can also be restricted if the capital conservation buffer requirement is not met. In general, the Bank may declare a dividend without the approval of the FRB as long as the total of all dividends declared by the Bank during the calendar year, including the proposed dividend, does not exceed the sum of the Bank’s net income during the current calendar year and the retained net income of the prior two calendar years. Regarding dividends, see “Capital Requirements” below.
22
FDIC Insurance
The Bank’s deposits are insured by the Deposit Insurance Fund (the “DIF”) of the FDIC up to applicable legal limits. As an FDIC-insured depository institution, the Bank is subject under certain circumstances to regulation by the FDIC. The FDIC charges deposit insurance assessments to FDIC-insured institutions, including the Bank, to fund and support the DIF. The rate of these deposit insurance assessments is based on, among other things, the risk characteristics of the Bank. The FDIC has the power to terminate the Bank’s deposit insurance if it determines the Bank is engaging in unsafe or unsound practices. Federal banking laws provide for the appointment of the FDIC as receiver in the event the Bank were to fail, such as in connection with undercapitalization, insolvency, unsafe or unsound condition or other financial distress. In a receivership, the claims of the Bank’s depositors (and those of the FDIC as subrogee of the Bank) would have priority over other general unsecured claims against the Bank.
In October 2022, the FDIC finalized a rule to increase the initial base deposit insurance assessment rate schedules for all insured depository institutions by 2.0 basis points, beginning with the first quarterly assessment period of 2023. The increased assessment rate is intended to improve the likelihood that the Deposit Insurance Fund reserve ratio will reach the required minimum of 1.35% by the statutory deadline of September 30, 2028.
Further, on November 16, 2023, the FDIC issued a final rule to implement a special assessment to recover the loss to the DIF associated with protecting uninsured depositors following the closure of several large banks. Under the final rule, the assessment base for an insured institution will be equal to the institution's estimated uninsured deposits as of December 31, 2022, adjusted to exclude the first $5 billion in estimated uninsured deposits. Additionally, the FDIC will collect the special assessment at an annual rate of 13.4 basis points beginning with the first quarterly assessment period of 2024 and will continue to collect special assessments for an anticipated total of eight quarterly assessment periods. As a result of this final rule, we accrued $32.7 million related to this assessment in the fourth quarter of 2023.
Capital Requirements and Prompt Corrective Action
The bank regulators view capital levels as important indicators of an institution’s financial soundness. As a general matter, FDIC-insured depository institutions and their holding companies are required to maintain a specified level of capital relative to the amount and types of assets they hold. While capital can serve as an important cushion against losses, higher capital requirements can also adversely affect an institution’s ability to grow and/or increase leverage through deposit-gathering or other sources of funding.
The Company and the Bank are each subject to generally similar capital regulations adopted by the FRB. These regulations establish required minimum ratios for common equity Tier 1 (the “CET1”) capital, Tier 1 capital and total capital and a leverage ratio; set risk-weighting for assets and certain other items for purposes of the risk-based capital ratios; require an additional capital conservation buffer over the minimum required capital ratios in order to avoid certain limitations on paying dividends, engaging in share repurchases, and paying discretionary bonuses; and define what qualifies as capital for purposes of meeting the capital requirements.
In 2020, the federal bank regulatory authorities approved a rule that delays the estimated impact on regulatory capital resulting from the adoption of CECL. The rule provides banking organizations that implemented CECL before the end of 2020 the option to delay for two years the estimated impact of CECL on regulatory capital relative to regulatory capital determined under the prior incurred loss methodology, followed by a three-year transition period to phase out the aggregate amount of capital benefit provided during the initial two-year delay. We adopted this phase in option and elected to phase in the full effect of CECL on regulatory capital over the five-year transition period. The add-back as of December 31, 2023 ranged from 0 basis points to 5 basis points on our various capital ratios.
As of December 31, 2023, we were in compliance with the minimum CET1, Tier 1, total capital and leverage ratios and the minimum capital conservation buffer set forth in these generally applicable regulations. These capital requirements are the minimum ratios generally applicable to banking organizations. The regulators assess any particular institution’s capital adequacy based on numerous factors. The regulators may require a particular banking organization to maintain capital at levels higher than the generally applicable minimums.
23
The Federal Deposit Insurance Act provides for a system of “prompt corrective action” (the “PCA”). The PCA guidelines provide for capitalization categories ranging from “well capitalized” to “critically undercapitalized.” An institution’s PCA category is determined primarily by its regulatory capital ratios. The PCA requires remedial actions and imposes limitations that become increasingly stringent as an institution’s condition deteriorates and its PCA capitalization category declines. Among other things, institutions that are less than well capitalized become subject to increasingly stringent restrictions on their ability to accept and/or rollover brokered deposits. As of December 31, 2023, the Bank was considered “well capitalized” for purposes of the PCA.
In addition to capital requirements, depository institutions are required to maintain noninterest bearing reserves at specified levels against their transaction accounts and certain non-personal time deposits.
Anti-Money Laundering and Suspicious Activity
We are subject to several federal laws related to anti-money laundering (“AML”), economic sanctions and prevention of financial crime, including the Bank Secrecy Act, the Money Laundering Control Act, the Uniting and Strengthening America by Providing Appropriate Tools Required to Intercept and Obstruct Terrorism Act of 2001 (“Patriot Act”) and economic sanctions programs. We are required to, among other things, maintain an effective AML and counter-terrorist compliance program, identify and file suspicious activity and currency transaction reports, and block transactions with sanctioned persons or jurisdictions. Compliance with these laws requires significant investment of management attention and resources. These laws are enforced by a number of regulatory authorities, including the FRB, OFAC, the Financial Crimes Enforcement Network, the U.S. Department of Justice, Drug Enforcement Administration, and Internal Revenue Service. Failure to comply with these laws, or to meet our regulators’ supervisory expectations in connection with these laws, could subject us to supervisory or enforcement action, significant financial penalties, criminal liability and/or reputational harm.
The Bank is also subject to regulation under economic or financial sanctions imposed, administered, or enforced from time to time by the U.S. government, including as administered by OFAC (such regulations, “Sanctions Laws”). The Sanctions Laws are intended to restrict transactions with persons, companies or foreign governments sanctioned by U.S. authorities. An institution that fails to meet these standards may be subject to civil or criminal enforcement actions. The Bank has established compliance programs designed to comply with the Bank Secrecy Act, the Patriot Act and applicable Sanctions Laws.
Community Reinvestment Act
The Bank is subject to the provisions of the CRA. The CRA requires federal banking regulators, in their review of certain applications by banking organizations, to take into account the applicant’s record in helping meet the credit needs of its community, including low- and moderate-income neighborhoods. The CRA does not establish specific lending requirements or programs for financial institutions, and does not limit an institution’s discretion to develop the types of products and services that it believes are best suited to its particular community in a manner consistent with the CRA. The Bank is subject to periodic examination under the CRA by the FRB, which will assign ratings based on the methodologies set forth in its regulations and guidance. Less favorable CRA ratings, or concerns raised under the CRA, may adversely affect the Bank’s ability to obtain approval for certain types of applications.
The FRB regularly assesses the Bank on its record in meeting the credit needs of the communities it serves, including low-income and moderate-income neighborhoods. Performance under the CRA also is considered when the FRB reviews applications to acquire, merge or consolidate with another banking institution or its holding company. Also, in the case of a bank holding company applying for approval to acquire a bank, the FRB will assess the records of each subsidiary depository institution of the applicant bank holding company, and that record may be the basis for denying the application.
On October 23, 2023, the FRB, FDIC and the OCC issued a final rule revising the agencies’ CRA regulations, including with respect to the delineation of assessment areas, the overall evaluation framework and performance standards and metrics, the definition of community development activities, and data collection and reporting. Most of the final rule’s new requirements become effective on January 1, 2026, and the others on January 1, 2027. The final rule would adjust CRA evaluations based on bank size and type, with many of the proposed changes applying only to banks with over $2 billion in assets and several applying only to banks with over $10 billion in assets, such as the Company.
24
Financial Privacy Under the Requirements of the Gramm-Leach-Bliley Act
We are subject to various laws related to the privacy of consumer information. The Company and its subsidiaries are required under federal law to periodically disclose to their retail clients the Company’s policies and practices with respect to the sharing of nonpublic client information with its affiliates and others, and the confidentiality and security of that information. Under the Gramm‑Leach‑Bliley Act of 1999 (the “GLBA”), in some cases, the Bank must obtain a consumer’s consent before sharing information with an unaffiliated third party, and the Bank must give a consumer the opportunity to “opt out” of the Bank’s sharing of information with its affiliates for marketing and certain other purposes. In some cases, the Bank must obtain a consumer’s consent before sharing information with an unaffiliated third party, and the Bank must allow a consumer to opt out of the Bank’s sharing of information with its affiliates for marketing and certain other purposes.
Limitations on Transactions with Affiliates and Loans to Insiders
Banks are subject to restrictions on their ability to conduct transactions with affiliates and other related parties under federal banking laws. For example, federal banking laws impose quantitative limits, qualitative requirements, and collateral standards on certain extensions of credit and other transactions by an insured depository institution with, or for the benefit of, its affiliates. In addition, most types of transactions by an insured depository institution with, or for the benefit of, an affiliate be on terms substantially the same or at least as favorable to the insured depository institution as if the transaction were conducted with an unaffiliated third party.
In addition, subject to certain exceptions, the Federal Reserve Act and related regulations place quantitative and other restrictions on the extension of credit to executive officers, directors and principal stockholders (including the Company) and their related interests of the Bank and its affiliates, including a requirement that loans to directors, executive officers and principal stockholders be made on terms substantially the same as those offered in comparable transactions to other persons, and not involve more than the normal risk of repayment or present other unfavorable features. In addition, purchases and sales of assets between an insured depository institution and its executive officers, directors, and principal stockholders may also be limited under such laws. The Sarbanes-Oxley Act generally prohibits loans by public companies to their executive officers and directors. However, there is a specific exception for loans by financial institutions, such as the Bank, to its executive officers and directors that are made in compliance with federal banking laws.
The Company and its affiliates, including the Bank, maintain programs to comply with the limitations on transactions with affiliates and restrictions on loans to insiders and the Company believes it and the Bank are currently in compliance with these requirements.
Acquisition of a Significant Interest in the Company
Banking laws impose various regulatory requirements on parties that may seek to acquire a significant interest in the Company. For example, the Change in Bank Control Act of 1978 would generally require that any party file a formal notice with, and obtain non-objection of, the FRB prior to acquiring (directly or indirectly, whether alone or acting in concert with any other party) 10% or more of any class of voting securities of the Company. Further approval requirements and significant ongoing regulatory consequences would apply to any company that (directly or indirectly, whether alone or as part of an association with another company) seeks to acquire “control” of the Company or the Bank for purposes of the BHCA. The determination whether a party “controls” a depository institution or its holding company for purposes of these laws is based on applicable regulations and all of the facts and circumstances surrounding the investment.
Identity Theft
Under the Fair and Accurate Credit Transactions Act (the “FACT Act”), the Bank is required to develop and implement a written Identity Theft Prevention Program (the “Program”) to detect, prevent and mitigate identity theft “red flags” in connection with the opening of certain accounts or certain existing accounts. Under the FACT Act, the Bank is required to adopt reasonable policies and procedures to: (i) identify relevant red flags for covered accounts and incorporate those red flags into the Program; (ii) detect red flags that have been incorporated into the Program; (iii) respond appropriately to any red flags that are detected to prevent and mitigate identity theft; and (iv) ensure the Program is updated periodically, to reflect changes in risks to clients or to the safety and soundness of the financial institution or creditor from identity theft.
The Bank maintains a Program to meet the requirements of the FACT Act and the Bank believes it is currently in compliance with these requirements.
25
Consumer Protection Laws and Regulations
We are subject to a broad array of federal, state and local consumer protection laws and regulations that govern almost every aspect of our business relationships with consumers, including but not limited to the Truth-in-Lending Act, the Truth in Savings Act, the Electronic Funds Transfer Act, the Expedited Funds Availability Act, the Equal Credit Opportunity Act, the Fair Housing Act, the Secure and Fair Enforcement in Mortgage Licensing Act, the Real Estate Settlement Procedures Act, the Home Mortgage Disclosure Act, the Fair Credit Reporting Act, the Fair Debt Collection Practices Act, the Service Members Civil Relief Act, the Right to Financial Privacy Act, the Home Ownership and Equity Protection Act, the Consumer Leasing Act, the Fair Credit Billing Act, the Homeowners Protection Act, the Check Clearing for the 21st Century Act, laws governing flood insurance, federal and state laws prohibiting unfair and deceptive business practices, foreclosure laws and various regulations that implement the foregoing. Among other things, these laws and regulations relate to the content and adequacy of disclosures, pricing and fees, fair lending, anti-discrimination, privacy, cybersecurity, usury, mortgages and housing finance, lending to service members, escheatment, debt collection, loan servicing, collateral secured lending, and unfair, deceptive or abusive acts or practice, and regulate the manner in which financial institutions must deal with clients when taking deposits, making loans, servicing loans and providing other services. If the Bank fails to comply with these laws and regulations, it may be subject to significant penalties, judgments, other monetary or injunctive remedies, lawsuits (including putative class action lawsuits and actions by state and local attorney generals), customer recession rights, supervisory or enforcement actions, and civil or criminal liability.
The CFPB is generally responsible for rulemaking with respect to certain federal laws related to the provision of financial products and services to consumers. In addition, the CFPB has supervision, examination and primary enforcement authority with respect to federal consumer financial protection laws with respect to banking organizations with assets of $10 billion or more. The Bank has assets in excess of $10 billion; therefore, we are subject to the supervision, examination and primary enforcement jurisdiction of the CFPB with respect to federal consumer financial protection laws.
Information Technology and Cybersecurity
We are subject to laws and regulatory requirements related to information technology and cybersecurity. For example, the Federal Financial Institutions Examination Council (the “FFIEC”), which is a council comprised of the primary federal banking regulators, has issued guidance and supervisory expectations for banking organizations with respect to information technology and cybersecurity. In addition, state regulators have also been increasingly active in implementing privacy and cybersecurity standards and regulations. Recently, several states have adopted regulations requiring certain financial institutions to implement cybersecurity programs and providing detailed requirements with respect to these programs, including data encryption requirements. Many states have also recently implemented or modified their data breach notification and data privacy requirements. For example, the California Consumer Privacy Act became effective on January 1, 2020, and key provisions of an additional law strengthening the protection, the California Privacy Rights Act of 2020, became effective on January 1, 2023. We expect this trend of state-level activity and consumer expectations in those areas to continue to heighten, and we are continually monitoring for developments in the states in which our clients are located. Our regulators regularly examine us for compliance with applicable laws, and adherence to industry best practices, with respect to these topics. For example, they will evaluate our security of user and customer credentials, business continuity planning, and the ability to identify and thwart cyber-attacks.
On November 18, 2021, the federal banking agencies announced the adoption of a final rule providing for new notification requirements for banking organizations and their service providers for significant cybersecurity incidents. Specifically, the new rule requires a banking organization to notify its primary federal regulator as soon as possible, and no later than 36 hours after, the banking organization determines that a “computer-security incident” rising to the level of a “notification incident” has occurred. Notification is required for incidents that have materially affected or are reasonably likely to materially affect the viability of a banking organization’s operations, its ability to deliver banking products and services, or the stability of the financial sector. Service providers are required under the rule to notify affected banking organization customers as soon as possible when the provider determines that it has experienced a computer-security incident that has materially affected or is reasonably likely to materially affect the banking organization’s customers for four or more hours. Compliance with the new rule was required by May 1, 2022. The Company believes it and the Bank are currently in compliance with these requirements.
26
Other Regulations
On October 26, 2022, the SEC adopted a final rule under the Dodd-Frank Act directing national securities exchanges and associations, including the NYSE, to establish listing standards requiring listed companies to adopt policies providing for the recovery (or “clawback”) of erroneously awarded incentive-based compensation received by current or former executive officers in connection with a required accounting restatement. The NYSE proposed listing standards implementing the Dodd-Frank rule which were approved by the SEC and became effective with respect to compensation received by such executive officers on or after October 2, 2023. NYSE-listed issuers had until December 1, 2023 to adopt a compliant recovery policy. On November 9, 2023, the Company adopted a Dodd-Frank compliant recovery policy.
The Bank is a member of the FHLB, which makes loans or advances to members. All advances are required to be fully secured by sufficient collateral as determined by the FHLB. To be a FHLB member, financial institutions must demonstrate that they originate and/or purchase long-term home mortgage loans or mortgage-backed securities. The Bank is required to purchase and maintain stock in the FHLB. At December 31, 2023, the Bank had $17.3 million in FHLB stock, which was in compliance with this requirement.
Volcker Rule
The so-called “Volcker Rule” issued under the Dodd-Frank Act, which became effective in July 2015, imposes certain restrictions on the ability of the Company and its subsidiaries, including the Bank, to sponsor, invest in, or conduct certain other activities with private funds or to engage in certain types of short-term proprietary trading. Under the regulations, FDIC-insured depository institutions, their holding companies, subsidiaries and affiliates (collectively, banking entities), are generally prohibited, subject to certain exemptions, from short-term proprietary trading of securities and other financial instruments and from acquiring or retaining an ownership interest in, or conducting certain other activities with, a “covered fund.” These requirements do not currently have a material impact and are not expected to have a future material impact on the Company’s investing and trading activities.
Trading in certain government obligations is not prohibited. These include, among others, obligations of or guaranteed by the United States or an agency or GSE of the United States, obligations of a State of the United States or a political subdivision thereof, and municipal securities. Proprietary trading generally does not include transactions under repurchase and reverse repurchase agreements, securities lending transactions and purchases and sales for the purpose of liquidity management if the liquidity management plan meets specified criteria; nor does it generally include transactions undertaken in a fiduciary capacity.
Effect on Economic Environment
The policies of regulatory authorities, including the monetary policy of the FRB, have a significant effect on the operating results of bank holding companies and their subsidiaries. Among the means available to the FRB to affect the money supply are open market operations in U.S. government securities, changes in the discount rate on borrowings and changes in reserve requirements with respect to deposits. These means are used in varying combinations to influence overall growth and distribution of bank loans, investments and deposits, and their use may affect interest rates charged on loans or paid for deposits. The FRB monetary policies have materially affected the operating results of commercial banks in the past and are expected to continue to do so in the future. We cannot predict the nature of future monetary policies and the effect of such policies on our business and earnings.
Regulation of Certain Subsidiaries
BofCal Asset Management Inc. (“BAM”) is registered with the SEC under the Investment Advisers Act of 1940, as amended, and is subject to its rules and regulations. Following the completion of various studies on investment advisers and broker-dealers required by the Dodd-Frank Act, the SEC has, among other things, recommended to Congress that it consider various means to enhance the SEC’s examination authority over investment advisers, which may have an impact on BAM that we cannot currently assess.
27
Future Legislation or Regulation
In light of recent conditions in the United States economy and the financial services industry, the current administration, Congress, the regulators and various states continue to focus attention on the financial services industry. Federal, state and local legislators and regulators regularly introduce measures or take actions that would modify the regulatory requirements applicable to banks, their holding companies and other financial institutions. Changes in laws, regulations or regulatory policies could adversely affect the operating environment for us in substantial and unpredictable ways, increase our cost of doing business, impose new restrictions on the way in which we conduct our operations or add significant operational constraints that might impair our profitability. We cannot predict whether new legislation will be enacted or adopted and, if enacted or adopted, the effect that it, or any implementing regulations, would have on us and our subsidiaries’ business, financial condition or results of operations. The majority of these changes will be implemented over time by various regulatory agencies. The full effect that these changes will have on us and our subsidiaries remains uncertain at this time and may have a material adverse effect on our business, our operations or financial condition.
For more information on how the regulatory environment, enforcement actions, findings and ratings could also have an impact on our strategies, the value of our assets, or otherwise adversely affect our business see Item 1A. – Risk Factors of this Annual Report on Form 10-K.
28
ITEM 1A. RISK FACTORS
An investment in our securities is subject to certain risks. These risk factors should be considered by prospective and current investors in our securities when evaluating the disclosures in this Annual Report on Form 10-K. The risks and uncertainties not presently known to us or that we currently deem immaterial also may impair our business operations. If any of the following risks actually occur, our business, results of operations, and financial condition could suffer. In that event, the value of our securities could decline, and you may lose all or part of your investment.
Risk Factors Summary
The following is a summary of the principal risks that could adversely affect our business, operations and financial results.
Risks Relating to Our Operations
•New lines of business, new products and services, or strategic project initiatives, or new partnerships may subject us to additional risks.
•We are subject to certain risks in connection with our use of technology.
•To the extent we acquire other banks, bank branches, other assets or other businesses, we may be negatively impacted by certain risks inherent with such acquisitions.
•If we fail to comply with the applicable requirements of the payment card networks or NACHA, we could be fined, suspended or have our registrations terminated.
•Fraud by merchants or others could adversely affect our business, and our merchants may be unable to satisfy obligations, including chargebacks, for which we may also be liable.
•We face operational risks, including fraud and loss due to execution errors, data processing and technology errors.
•Our enterprise risk management framework may not be effective in mitigating risk and losses.
•Managing reputational risk is important to attracting and maintaining clients, investors and employees.
•We depend on key management personnel.
•We rely on numerous external vendors.
•We have a net deferred tax asset that may not be fully realized.
•Our level of indebtedness could adversely affect our ability to raise capital and meet our debt obligations.
Risks Related to Credit and Interest Rate
•If actual losses on our loans exceed our estimates used to establish our allowance for credit losses, our business, financial condition, and profitability may suffer.
•There are risks associated with our lending activities, and our allowance for credit losses may be insufficient.
•Our business and operating results could be adversely affected by the political environment and governmental fiscal and monetary policies.
•Our business may be adversely affected by difficult economic conditions.
•Our business may be adversely affected by credit risk associated with residential property and declining property values.
•Our loan portfolio possesses increased risk due to our level of adjustable rate loans.
•Our underwriting practices may not protect us against losses in our loan portfolio.
•Repayment of our commercial and industrial loans is often dependent on the cash flows of the borrower, which may be unpredictable, and the collateral securing these loans may not be sufficient to repay the loan.
•Secondary mortgage market conditions could have a material adverse impact on our business.
•Any breach of representations and warranties made by us to our residential mortgage loan purchasers or credit default on our loan sales may require us to repurchase such loans.
•Credit impairment in our investment securities portfolio could adversely affect our continuing operations.
•Our income property loans involve higher principal amounts than other loans and repayments of these loans may be dependent on factors outside our control or the control of our borrowers.
29
•Our business is subject to interest rate risk and variations in interest rates may hurt our profits.
•A reduction in our credit ratings could adversely affect our access to capital and could increase our cost of funds.
•We have a number of large credit relationships and individual commitments.
Funding and Liquidity Risks
•We may not be able to develop and maintain a strong core deposit base or other low cost funding sources.
•Liquidity risk could impair our ability to fund operations and jeopardize our financial condition.
•Problems encountered by, or adverse news concerning, other financial institutions may adversely affect financial and capital markets generally as well as the Bank.
•We are subject to regulatory capital requirements, which could be made more stringent by our regulators.
•The FRB may require us to commit capital resources or take other action to support the Bank.
•We may elect or be compelled to seek additional capital in the future, but that capital may not be available when it is needed or on acceptable terms.
•Our holding company relies on dividends from the Bank for substantially all of its income.
•There can be no assurance as to the level of dividends we may pay on our common stock.
Legal and Compliance Risks
•We operate in a highly regulated environment and our business, operations and income may be adversely affected by changes in laws, rules and regulations governing our operations.
•We are a party to a variety of litigation and other actions.
•Changes in federal, state or local tax laws, or audits from tax authorities, could negatively affect our financial condition and results of operations.
•Failure to comply with applicable laws or regulations, or to satisfy our regulators’ supervisory expectations, could subject us to supervisory or enforcement action.
•Non-compliance with laws and regulations could result in fines or sanctions or operating restrictions.
•We are subject to federal and state fair lending laws, and failure to comply with these laws could lead to material penalties.
•We are subject to a wide range of laws related to anti-money laundering, economic sanctions, and prevention of financial crime, which could increase our costs or subject us to significant penalties.
Risks Relating to External Factors and Markets
•There is uncertainty surrounding potential legal, regulatory and policy changes by new presidential administrations in the United States that may directly affect financial institutions and the global economy.
•Our financial condition and results of operations are dependent on the national and local economy and a worsening in economic conditions in the market areas we serve may impact our earnings adversely.
•We are subject to risk arising from the soundness of other financial institutions and counterparties.
•Strong competition within our market areas may limit our growth and profitability.
The foregoing summary of risks should be read in conjunction with the more detailed Risk Factors below and is not an exhaustive summary of all risks facing our business.
30
Risks Relating to Our Operations
New lines of business, new products and services, or strategic project initiatives, or new partnerships may subject us to additional risks.
From time to time, we may seek to implement new lines of business or offer new products and services within existing lines of business. There are substantial risks and uncertainties associated with these efforts, particularly in instances where the markets are not fully developed. In developing and marketing new lines of business and/or new products and services, we may invest significant time and resources. Initial timetables for the introduction and development of new lines of business and/or new products or services may not be achieved, and price and profitability targets may not prove feasible, which could in turn have a material negative effect on our operating results. New lines of business and/or new products or services also could subject us to additional regulatory requirements, increased scrutiny by our regulators and other legal risks.
Additionally, from time to time we undertake strategic project initiatives, including but not limited to, payment processing, investment in technology, process improvement, client experience and fintech partnerships or acquisitions, such as our Deepstack Acquisition. Significant effort and resources are necessary to manage and oversee the successful completion of these initiatives. These initiatives often place significant demands on a limited number of employees with subject matter expertise and management and may involve significant costs to implement as well as increase operational risk as employees learn to process transactions under new systems. The failure to properly execute on these strategic initiatives could adversely impact our business and results of operations.
Increasingly, community banks, including the Bank, are partnering with fintech providers to distribute or market their products and services. Bank regulators have, and may in the future, hold banks responsible for the activities of these fintech companies, including in respect of bank secrecy act or anti-money laundering matters, or may take the view that these relationships present safety and soundness issues.
We are subject to certain risks in connection with our use of technology.
Our cybersecurity measures may not be sufficient to mitigate losses or exposure to cyber-attack or cyber theft.
Communications and information systems are essential to the conduct of our business, as we use such systems to manage our client relationships, our general ledger and virtually all other aspects of our business as well as process customer and merchant payments via the Deepstack platform. Our operations rely on the secure processing, storage, and transmission of confidential and other information in our computer systems and networks. Although we take protective measures and endeavor to modify them as circumstances warrant, the security of our computer systems, software, and networks are vulnerable to breaches, unauthorized access either directly or indirectly through our vendors, misuse, computer viruses, or other malicious code and other types of cyber-attacks. If one or more of these events occur, this could jeopardize our clients' confidential and other information that we process and store, or otherwise cause interruptions in our operations or the operations of our clients or counterparties. In addition, the U.S. banking regulatory agencies recently adopted a rule requiring us to notify the FRB within 36 hours of any significant computer security incident, and in July 2023, the SEC adopted new rules that require reporting on Form 8-K of material cybersecurity incidents. Several states and their governmental agencies also have adopted or proposed cybersecurity laws. Privacy laws in the State of California and the State of Colorado, for example, require regulated entities to establish measures to identify, manage, secure, track, produce, and delete personal information. The occurrence of cyber-attacks may require us to expend significant additional resources to modify our protective measures or to investigate and remediate vulnerabilities or other exposures, and we may be subject to litigation and financial losses that are either not insured against or not fully covered through our current insurance policies. If a cyber-attack succeeds in disrupting our operations or disclosing confidential data, we could also suffer significant reputational damage in addition to possible regulatory fines or client lawsuits.
We provide internet banking services to our clients which have additional cyber risks related to our client’s personal electronic devices and electronic communication. Any compromise of personal electronic device security could jeopardize the confidential information of our clients (including user names and passwords) and expose our clients to account take-overs and the possibility for financial crimes such as fraud or identity theft and deter clients from using our internet banking services. We rely on and employ industry-standard tools and processes to safeguard data. These precautions may not protect our systems from future vulnerabilities, data breaches or other cyber threats. Losses due to unauthorized account activity could harm our reputation and may have a material adverse effect on our business, financial condition, results of operations, and prospects.
31
Our security measures may not protect us from systems failures or interruptions.
While we have established policies and technical controls to prevent or limit the impact of systems failures and interruptions, there are no absolute assurances that such events will not occur or that the resulting damages will be adequately mitigated.
We rely on communications, information, operating and financial control systems technology from third party service providers, and we may suffer an interruption in those systems.
We outsource certain aspects of our data processing and operational functions to third party service providers. If our third party service providers encounter difficulties, or if we have difficulty in communicating with them, our ability to adequately process and account for transactions could be affected, and our business operations could be adversely impacted.
The occurrence of any systems failure or interruption could damage our reputation and result in a loss of clients and business, could subject us to additional regulatory scrutiny, or could expose us to legal liability. Any of these occurrences could have a material adverse effect on our financial condition and results of operations.
We rely heavily on third party service providers for much of our communications, information, operating and financial control systems technology, including our online banking services and data processing systems.
We rely on third party service providers to help ensure the confidentiality of our client information and acknowledge the additional risks these third parties expose us to. Third party service providers may experience unauthorized access to and disclosure of our consumer or client information or result in the destruction or corruption of Company information. In addition, we are exposed indirectly through our third party service providers who may experience their own cyber breach and as a result compromise our data and/or lead to service interruptions. Any failure or interruption, or breaches in security, of these systems could result in failures or interruptions in our client relationship management, general ledger, deposit, loan origination and servicing systems, thereby harming our business reputation, operating results, and financial condition. Additionally, interruptions in service and security breaches could lead existing clients to terminate their banking relationships with us and could make it more difficult for us to attract new banking clients in the future.
To the extent we acquire other banks, bank branches, other assets or other businesses, such as the Merger and the Deepstack Acquisition, we may be negatively impacted by certain risks inherent with such acquisitions.
Acquiring other banks, bank branches, other assets or other businesses involves various risks, including the risks of incorrectly assessing the credit quality of acquired assets, encountering greater than expected costs of integrating acquired banks, branches or businesses, or in the development of technology platforms, the risk of loss of clients and/or employees of the acquired bank, branch or business, executing cost savings measures, not achieving revenue enhancements and otherwise not realizing the transaction’s anticipated benefits. We continue to face these risks in connection with the recently completed Merger. Our ability to address these matters successfully cannot be assured. There are also regulatory risks in connection with acquisitions, including remaining in good standing with existing regulatory bodies or receiving any necessary pre-closing or post-closing approvals, as well as being subject to new regulators with oversight over an acquired business. In addition, pursuing an acquisition may divert resources or management’s attention from ongoing business operations, may require investment in integration and in development and enhancement of additional operational and reporting processes and controls, and may subject us to additional regulatory scrutiny. To finance an acquisition, we may borrow funds, thereby increasing our leverage and diminishing our liquidity, or raise additional capital, which could dilute the interests of our existing stockholders.
Acquiring other banks, bank branches, other assets or other businesses, such as the Merger, also involves risks associated with integration, which may cause us to not fully realize the benefits of an acquisition.
The success of any such transaction will depend on, among other things, our ability to combine and integrate the acquired assets or business into our business. If we are not able to successfully achieve this objective, the anticipated benefits of the transaction may not be realized fully, or at all, or may take longer to realize than expected. The integration process for an acquisition will likely result in the diversion of management’s time on integration-related issues and could result in the disruption of our business. These transition matters could have an adverse effect on us for an undetermined amount of time after the completion of any acquisition.
32
If we fail to comply with the applicable requirements of the payment card networks or NACHA, they could seek to fine us, suspend us or terminate our registrations.
Our subsidiary, Deepstack, offers payment processing solutions to clients. In order to provide our payment processing services, we are registered with Visa and Mastercard and other networks as members or service providers for purposes of conducting merchant acquiring and interacting with the applicable payment networks. As such, we are subject to these payment card and other network rules.
If we fail to comply with these rules, we could be fined, and our membership registrations or certifications could be suspended or terminated. The termination of our registrations or our membership or our status as a service provider or a merchant processor, could limit our ability to provide merchant acquiring or transaction processing services to clients and could have a material adverse effect on our business, financial condition, and results of operations.
If a merchant or client fails to comply with these rules, it could be subject to a variety of fines or penalties levied by the payment card associations or other networks. If we cannot collect the amounts from the applicable client or merchant, we may have to bear the cost of the fines or penalties, resulting in lower earnings for us.
In addition, changes to the networks' rules or how they are interpreted, including those that increase the cost of doing business or that would impair our registrations or otherwise limit our ability to provide transaction processing services to merchants, could have a significant impact on our business, financial condition, and results of operations.
We maintain business relationships with certain independent sales organizations that act as intermediaries in providing our merchant acquiring services that may expose us to losses. These independent sales organizations may engage in activities such as merchant acquiring, soliciting merchants and other clients and client service, among other activities. We face risks related to our oversight and supervision of these independent sales organizations, as well as to the reputation and financial viability of the independent sales organizations with which we do business. Any failure by us to appropriately oversee and supervise our independent sales organizations could damage our reputation, result in regulatory or compliance issues, result in third party litigation, and cause financial losses to us.
Fraud by merchants or others could adversely affect our business, and our merchants may be unable to satisfy obligations, including chargebacks, for which we may also be liable.
In connection with our merchant acquiring and payment processing business, we face potential chargeback liability for fraudulent payment transactions initiated by merchants or others. In the event a transaction dispute between a cardholder and a merchant is not resolved in favor of the merchant, the transaction is normally charged back to the merchant and the purchase price is refunded to the cardholder.
If we are unable to collect such amounts from the merchant, either due to their refusal, closure, bankruptcy, or otherwise, we are responsible to the card issuing bank for the amount of the refund paid to the cardholder. Failure to effectively manage these risks and prevent fraud could increase our chargeback liability or other liabilities due to merchant failures. Increases in chargebacks or other liabilities not paid by our merchants could have a material adverse effect on our business, financial condition, and results of operations.
We face significant operational risks, including fraud and loss due to execution errors, data processing and technology errors.
We operate many different financial service functions and rely on the ability of our employees, third party vendors and systems to process a significant number of transactions. Operational risk is the risk of loss from operations, including fraud by employees or outside persons, employees’ execution of incorrect or unauthorized transactions, data processing and technology errors or hacking and breaches of internal control systems.
33
Our enterprise risk management framework may not be effective in mitigating risk and reducing the potential for losses.
Our enterprise risk management framework seeks to mitigate risk and loss to us. We have established comprehensive policies and procedures and an internal control framework designed to provide a sound operational environment for the types of risk to which we are subject, including credit risk, market risk (interest rate and price risks), liquidity risk, operational risk, compliance risk, strategic risk, and reputational risk. However, as with any risk management framework, there are inherent limitations to our current and future risk management strategies, including risks that we have not appropriately anticipated or identified. In certain instances, we rely on models to measure, monitor and predict risks. However, these models are inherently limited because they involve techniques, including the use of historical data in some circumstances, and judgments that cannot anticipate every economic and financial outcome in the markets in which we operate, nor can they anticipate the specifics and timing of such outcomes. There is no assurance that these models will appropriately capture all relevant risks or accurately predict future events or exposures. Accurate and timely enterprise-wide risk information is necessary to enhance management’s decision-making in times of crisis. In addition, our businesses and the markets in which we operate are continuously evolving. We may fail to fully understand the implications of changes in our businesses or the financial markets or fail to adequately or timely enhance our enterprise risk framework to address those changes. If our enterprise risk framework is ineffective, either because it fails to keep pace with changes in the financial markets, regulatory requirements, our businesses, our counterparties, clients or service providers or for other reasons, we could incur losses, suffer reputational damage or find ourselves out of compliance with applicable regulatory or contractual mandates.
Managing reputational risk is important to attracting and maintaining clients, investors and employees.
Threats to our reputation can come from many sources, including adverse sentiment about financial institutions generally, unethical practices, employee misconduct, failure to deliver minimum standards of service or quality, compliance deficiencies, regulatory investigations, marketplace rumors and questionable or fraudulent activities of our clients. We have policies and procedures in place to promote ethical conduct and protect our reputation. However, these policies and procedures may not be fully effective and cannot adequately protect against all threats to our reputation. Negative publicity regarding our business, employees, or clients, with or without merit, may result in the loss of clients, investors and employees, costly litigation, a decline in revenues and/or increased governmental oversight.
If the public perception of financial institutions remains negative, then our reputation and business may be adversely affected by negative publicity or information regarding our business and personnel, whether or not accurate or true. Such information has in the past and may in the future be posted on social media or other Internet forums or published by news organizations and the speed and pervasiveness with which information can be disseminated through these channels, in particular social media, may magnify risks relating to negative publicity.
We depend on key management personnel.
Our success will, to a large extent, depend on the continued employment of our key management personnel. The unexpected loss of the services of any of these individuals could have a detrimental effect on our business. Although we have entered into employment agreements with our Chief Executive Officer and our Chief Financial Officer, no assurance can be given that these individuals, or any of our key management personnel, will continue to be employed by us. The loss of any of these individuals could negatively affect our ability to achieve our business plan and could have a material adverse effect on our results of operations and financial condition. In addition, if we are not able to successfully combine and integrate the senior management teams of the Company and legacy PacWest following the Merger, our business, operations and financial results may be adversely affected.
We rely on numerous external vendors.
We rely on numerous external vendors to provide us with products and services necessary to maintain our day-to-day operations. Accordingly, our operations are exposed to risk that these vendors will not perform in accordance with the contracted arrangements under service level agreements. The failure of an external vendor to perform in accordance with the contracted arrangements under service level agreements because of changes in the vendor's organizational structure, financial condition, support for existing products and services or strategic focus or for any other reason, could be disruptive to our operations, which in turn could have a material negative impact on our financial condition and results of operations. We also could be adversely affected to the extent such an agreement is not renewed by the third party vendor or is renewed on terms less favorable to us.
34
In addition, our use of third party vendors is subject to increasingly demanding regulatory requirements and attention by our regulators. Regulations require us to perform due diligence, ongoing monitoring and control over our third party vendors and other ongoing third party business relationships. We expect that our regulators will hold us responsible for deficiencies in our oversight and control of our third party relationships and in the performance of the parties with which we have these relationships. As a result, if our regulators conclude that we have not exercised adequate oversight and control over our third party vendors or other ongoing third party business relationships or that such third parties have not performed appropriately, we could be subject to enforcement actions, including civil money penalties or other administrative or judicial penalties or fines as well as requirements for customer remediation, any of which could have a material adverse effect our business, financial condition, or results of operations.
We have a net deferred tax asset that may not be fully realized.
We have a net DTA and cannot assure that it will be fully realized. Deferred tax assets and liabilities are the expected future tax amounts for the temporary differences between the carrying amounts and the tax basis of assets and liabilities computed using enacted tax rates. If we determine that we will not achieve sufficient future taxable income to realize our net deferred tax asset, we are required under GAAP to establish a full or partial valuation allowance. If we determine that a valuation allowance is necessary, we are required to incur a charge to operations. We regularly assess available positive and negative evidence to determine whether it is more likely than not that our net deferred tax asset will be realized. Realization of a deferred tax asset requires us to apply significant judgment and is inherently speculative because it requires estimates that cannot be made with certainty. As of December 31, 2023, we had a net DTA of $739.1 million. For additional information, see Note 16. Income Taxes of the Notes to Consolidated Financial Statements included in Item 8.
We have suffered significant losses from the balance sheet repositioning and may suffer significant losses from future asset sales.
In connection with the Merger, legacy Banc of California, legacy Pacific Western Bank and the combined company sold approximately $6.1 billion in assets as part of the balance sheet repositioning strategy, comprised of (i) $2.7 billion of Pacific Western Bank’s securities portfolio, which included agency commercial mortgage-backed securities, agency collateralized mortgage obligations (“CMO”), treasury bonds, municipal bonds, and corporate bonds, (ii) $1.3 billion of Banc of California’s securities portfolio, which included agency mortgage-backed securities, CMOs, and bonds, (iii) the forward sale of $1.5 billion book value of Banc of California’s single-family residential ("SFR") mortgage portfolio and (iv) $673 million book value of Banc of California’s multi-family residential mortgage portfolio. Some of these assets were sold at significant losses. In a short period of time, we were able to complete our planned asset sales effecting our initial balance sheet repositioning strategy. We will continue to evaluate all available options as we seek to optimize our balance sheet. Depending on the existence of various potential buyers and competitive prices, we may sell assets at a significant loss, which could affect our financial condition and results of operations.
In connection with the Merger the Company's outstanding debt obligations increased, and the combined company's level of indebtedness following the completion of the Merger could adversely affect the combined company's ability to raise additional capital and to meet its debt obligations.
After the closing of the Merger, at December 31, 2023, the Company had outstanding indebtedness in the amount of approximately $3.8 billion. Our existing indebtedness, together with any future incurrence of additional indebtedness, could have important consequences for our creditors and stockholders. For example, it could:
•limit our ability to obtain additional financing for working capital, capital expenditures, debt service requirements, acquisitions and general corporate or other purposes;
•restrict us from making strategic acquisitions or cause us to make non-strategic divestitures;
•restrict us from paying dividends to our stockholders;
•increase our vulnerability to general economic and industry conditions; and
•require a substantial portion of cash flow from operations to be dedicated to the payment of principal and interest on our indebtedness, thereby reducing our ability to use cash flows to fund our operations, capital expenditures and future business opportunities.
35
Risks Related to Credit and Interest Rate
If actual losses on our loans exceed our estimates used to establish our allowance for credit losses, our business, financial condition and profitability may suffer.
The determination of the appropriate level of the allowance for credit losses inherently involves a high degree of subjectivity and requires us to make various assumptions and judgments about the collectability of our loan portfolio, including the creditworthiness of our borrowers and the value of the real estate and other assets serving as collateral for the repayment of many of our loans. In determining the amount of the allowance for credit losses, we review our loans and the loss and delinquency experience, and evaluate economic conditions and make significant estimates of current credit risks and future trends, all of which may undergo material changes. If our estimates are incorrect, the allowance for credit losses may not be sufficient to cover losses inherent in our loan portfolio, resulting in the need for additions to our allowance through an increase in the provision for loan losses. Deterioration in economic conditions affecting borrowers, new information regarding existing loans, identification of additional problem loans, fraud and other factors, both within and outside of our control, may require an increase in the allowance for loan losses. Our allowance for credit losses was 1.22% of loans and leases held for investment and 497.80% of nonaccrual loans and leases as of December 31, 2023. In addition, bank regulatory agencies periodically review our allowance for credit losses and may require an increase in the provision for credit losses or the recognition of further charge-offs (which may in turn also require an increase in the provision for credit losses), based on judgments different than that of management. Any increases in the provision for credit losses will result in a decrease in net income and may have a material adverse effect on our financial condition and results of operations.
ASU 2016-13, Measurement of Credit Losses on Financial Instruments, which we adopted on January 1, 2020, substantially changed the accounting for credit losses on loans and other financial assets held by banks, financial institutions and other organizations. The standard changed the previous incurred loss impairment methodology in GAAP with a methodology that reflects lifetime expected credit losses and requires consideration of a broader range of reasonable and supportable information for credit loss estimates. The CECL model materially impacts how we determine our allowance for credit losses and required us to increase our allowance for credit losses. Furthermore, we may experience more fluctuations in our allowance for credit losses, which may be significant.
Additionally, loans to venture-backed borrowers support the borrowers’ operations, including operating losses, working capital requirements and fixed asset acquisitions. Venture-backed borrowers are at various stages in their development and are, generally, reporting operating losses. The primary sources of repayment are future additional venture capital equity investments or the sale of the company or its assets. Our venture-backed borrowers’ business plans may fail, increasing the likelihood for credit losses related to loans to venture-backed borrowers. See also Risks Relating to Funding and Liquidity Risks – A slowdown in venture capital investment levels has reduced the market for venture capital investment for our venture banking clients, which has, and could continue to, adversely affect our deposit balances, business, results of operations, and financial condition included in this section of this Annual Report on Form 10-K.
In accordance with GAAP, we maintain an allowance for loan and lease losses to provide for loan defaults and non-performance. Our allowance for loan and lease losses allocable to loans to venture-backed borrowers may not be adequate to absorb actual credit losses arising from these loans, and future provisions for credit losses could materially and adversely affect our operating results.
There are risks associated with our lending activities and our allowance for credit losses may prove to be insufficient to absorb actual losses in our loan portfolio.
Lending money is a substantial part of our business. Every loan carries a certain risk that it will not be repaid in accordance with its terms or that any underlying collateral will not be sufficient to assure repayment. This risk is affected by, among other things:
•Cash flow of the borrower and/or the project being financed;
•In the case of a collateralized loan, the changes and uncertainties as to the future value of the collateral;
•The credit history of a particular borrower;
•Changes in interest rates;
•Changes in economic and industry conditions; and
•The duration of the loan.
36
We maintain an allowance for credit losses which we believe is appropriate to provide for probable losses inherent in our loan portfolio. The amount of this allowance is determined by our management through a periodic review and consideration of several factors, including, but not limited to:
•An ongoing review of the quality, size and diversity of the loan portfolio;
•Evaluation of nonaccrual loans;
•Historical default and loss experience;
•Historical recovery experience;
•Existing and forecasted economic conditions;
•Risk characteristics of the various classifications of loans; and
•The amount and quality of collateral, including guarantees, securing the loans.
Our business and operating results could be adversely affected by the political environment and governmental fiscal and monetary policies.
An unpredictable or volatile political environment in the United States, including any related social unrest and uncertainty as a result of the upcoming U.S. presidential election, could negatively impact business and market conditions, economic growth, financial stability, and business, consumer, investor, and regulatory sentiments, any one or more of which in turn could cause our business and financial results to suffer.
Our business and financial results are also significantly affected by the fiscal and monetary policies of the U.S. government and its agencies. We are particularly affected by the policies of the FRB, which regulates the supply of money and credit in the United States in pursuit of maximum employment, stable prices, and moderate long-term interest rates. The FRB and its policies influence the availability and demand for loans and deposits, the rates and other terms for loans and deposits, the conditions in equity, fixed-income, currency, and other markets, and the value of securities and other financial instruments. Additionally, tax and other fiscal policies, moreover, impact not only general economic and market conditions but also give rise to incentives or disincentives that affect how we and our customers prioritize objectives, deploy resources, and run households or operate businesses. Both the timing and the nature of any changes in monetary or fiscal policies, as well as their consequences for the economy and the markets in which we operate, are beyond our control and difficult to predict but could adversely affect our business and operating results.
Also, the FRB regulates the supply of money and credit in the United States. Its fiscal and monetary policies determine in a large part our cost of funds for lending and investing and the return that can be earned on those loans and investments, both of which affect our net interest margin. FRB policies can also materially affect the value of financial instruments that we hold, such as debt securities, certain mortgage loans held-for-sale and MSRs. Its policies also can affect our borrowers, potentially increasing the risk that they may fail to repay their loans or satisfy their obligations to us. Changes in policies of the FRB are beyond our control and the impact of changes in those policies on our activities and results of operations can be difficult to predict.
Our business may be adversely affected by difficult economic conditions, including inflationary pressures or volatility in the financial markets, which may impact our business, financial position, and results of operations.
Robust demand, labor shortages, and supply chain constraints have led to persistent inflationary pressures throughout the economy. In response to these inflationary pressures, the FRB has raised benchmark interest rates in the past two years and may continue raising interest rates in response to economic conditions, particularly a continued high rate of inflation. However, in the final three policy meetings of 2023, the FRB left rates unchanged, and in January 2024, the FRB signaled that it could begin cutting interest rates in the year 2024 if there is continuing evidence that inflation has been stabilized on a sustained basis. Amidst these uncertainties, including potential recessionary economic conditions, financial markets have continued to experience volatility. Changes in interest rates can affect numerous aspects of our business and may impact our future performance.
37
Prolonged periods of inflation have impacted, and may continue to impact, our profitability by negatively impacting our costs and expenses, including increasing funding costs and expense related to talent acquisition and retention, and negatively impacting the demand for our products and services. Additionally, inflation has led to, and may continue to lead to, a decrease in consumer and clients purchasing power and negatively affect the need or demand for our products and services. If significant inflation continues, our business could be negatively affected by, among other things, increased default rates leading to credit losses which could decrease our appetite for new credit extensions.
If financial markets remain volatile, this may impact the future performance of various segments of our business, including the value of our investment securities portfolio. We continue to closely monitor economic conditions and the pace of inflation and the impacts of inflation on the larger market, including labor and supply chain impacts.
Any of the effects of these adverse economic conditions would likely have an adverse impact on our earnings, with the significance of the impact generally depending on the nature and severity of such adverse economic conditions.
Our business may be adversely affected by credit risk associated with residential property and declining property values.
As of December 31, 2023, $5.1 billion, or 19.9% of our total loans held for investment, was secured by SFR mortgage loans and HELOCs, as compared with $6.3 billion, or 21.9% of our total loans held for investment, as of December 31, 2022. This type of lending is particularly sensitive to regional and local economic conditions that significantly impact the ability of borrowers to meet their loan payment obligations, making loss levels difficult to predict. A decline in residential real estate values as a result of a downturn in the California housing markets has reduced in some areas, and may continue to reduce, the value of the real estate collateral securing these types of loans and increase the risk that we would incur losses if borrowers default on their loans. As a result, these loans may experience higher rates of delinquencies, defaults and losses, which will in turn adversely affect our financial condition and results of operations.
Our loan portfolio possesses increased risk due to our level of adjustable rate loans.
Approximately 31% of our loans held for investment are adjustable rate loans. Any rise in prevailing market interest rates may result in increased payments for some borrowers who have adjustable rate loans, increasing the possibility of defaults.
Our underwriting practices may not protect us against losses in our loan portfolio.
We seek to mitigate the risks inherent in our loan portfolio by adhering to specific underwriting practices, including: analyzing a borrower’s credit history, financial statements, tax returns and cash flow projections; valuing collateral based on reports of independent appraisers; and verifying liquid assets. Notwithstanding these practices, we have incurred losses on loans that have met these criteria, and may continue to experience higher than expected losses depending on economic factors and borrower behavior. In addition, our ability to assess the creditworthiness of our clients may be impaired if the models and approaches we use to select, manage, and underwrite our clients become less predictive of future behaviors, or in the case of borrower fraud. Finally, we may have higher credit risk, or experience higher credit losses, to the extent our loans are concentrated by loan type, industry segment, borrower type, or location of the borrower or collateral. Deterioration in real estate values and underlying economic conditions in Southern California could result in significantly higher credit losses to our portfolio.
Repayment of our commercial and industrial loans is often dependent on the cash flows of the borrower, which may be unpredictable, and the collateral securing these loans may not be sufficient to repay the loan in the event of default.
We make our commercial and industrial loans primarily based on the identified cash flow of the borrower and secondarily on the underlying collateral provided by the borrower. Collateral securing commercial and industrial loans may depreciate over time, be difficult to appraise and fluctuate in value and in the event we are required to assume direct responsibility for the collateral, including but not limited to residential mortgage loans in the case of warehouse credit facilities that we provide to non-bank financial institutions, our allowance for credit losses may increase, which may, in turn, adversely affect our financial condition and results of operations. In the case of loans secured by accounts receivable, the availability of funds for the repayment of these loans may be substantially dependent on the ability of the borrower to collect the amounts due from its clients. As of December 31, 2023, our commercial and industrial loans totaled $5.8 billion, or 23% of our total loans held for investment.
38
We are exposed to risk of environmental liabilities with respect to real properties acquired.
In prior years, due to weakness of the U.S. economy and, more specifically, the California economy, including higher levels of unemployment than the nationwide average and declines in real estate values, certain borrowers have been unable to meet their loan repayment obligations and, as a result, we have had to initiate foreclosure proceedings with respect to and take title to a number of real properties that had collateralized their loans. As an owner of such properties, we could become subject to environmental liabilities and incur substantial costs for any property damage, personal injury, investigation and clean-up that may be required due to any environmental contamination that may be found to exist at any of those properties, even though we did not engage in the activities that led to such contamination. In addition, if we are the owner or former owner of a contaminated site, we may be subject to common law claims by third parties seeking damages for environmental contamination emanating from the site. If we were to become subject to significant environmental liabilities or costs, our business, financial condition, results of operations, and prospects could be adversely affected.
Secondary mortgage market conditions could have a material adverse impact on our business, results of operations, financial condition, or liquidity.
In addition to being affected by interest rates, the secondary mortgage markets are subject to investor demand for mortgage loans and mortgage-backed securities and investor yield requirements for those loans and securities. These conditions may fluctuate or even worsen in the future.
From time to time, as part of our balance sheet management process, we may also sell SFR loans and other types of mortgage loans from our portfolio, including multi-family loans. We may use the proceeds of loan sales for generating new loans or for other purposes. If secondary mortgage market conditions were to deteriorate in the future and we cannot sell loans at our desired levels, our balance sheet management objectives might not be met. As a result, our business, results of operations, financial condition, or liquidity may be adversely affected.
Any breach of representations and warranties made by us to our loan purchasers or credit default on our loan sales may require us to repurchase loans we have sold.
We have sold or securitized loans we originated into the secondary market pursuant to agreements that generally require us to repurchase loans in the event of a breach of a representation or warranty made by us to the loan purchaser. Any fraud or misrepresentation during the loan origination process, whether by us, the borrower, or other party in the transaction, or, in some cases, upon any early payment default on such loans, may require us to repurchase such loans.
We believe that, as a result of the increased defaults and foreclosures during the 2007 to 2009 recession resulting in increased demand for repurchases and indemnification in the secondary market, many purchasers of loans are particularly sensitive to obtaining indemnification or the requirement of originators to repurchase loans, and would benefit from enforcing any repurchase remedies they may have. Our exposure to repurchases under our representations and warranties could include the current unpaid balance of all loans we have sold. During the years ended December 31, 2023, 2022, and 2021, we sold multi-family and SFR mortgage loans aggregating $3.0 billion, $33.5 million, and $11.8 million, respectively. To recognize the potential loan repurchase or indemnification losses on all SFR mortgage and multi-family loans sold, we maintained a total reserve of $2.1 million as of December 31, 2023. Increases to this reserve as a result of the sale of loans are a reduction in our gain on the sale of loans. Increases and decreases to this reserve subsequent to the sale are included as a component of noninterest expense. The determination of the appropriate level of the reserve inherently involves a high degree of subjectivity and requires us to make estimates of repurchase and indemnification risks and expected losses. The estimates used could be inaccurate, resulting in a level of reserve that is less than actual losses.
Deterioration in the economy, an increase in interest rates or a decrease in home and collateral values could increase client defaults on loans that were sold and increase demand for repurchases and indemnification and increase our losses from loan repurchases and indemnification. If we are required to indemnify loan purchasers or repurchase loans and incur losses that exceed our reserve, this could adversely affect our business, financial condition, and results of operations. In addition, any claims asserted against us in the future by loan purchasers may result in liabilities or legal expenses that could have a material adverse effect on our results of operations and financial condition.
39
Credit impairment in our investment securities portfolio could result in losses and adversely affect our continuing operations.
As of December 31, 2023, we had $2.3 billion of securities available-for-sale, as compared with $4.8 billion of securities available-for-sale as of December 31, 2022.
As of December 31, 2023, securities available-for-sale that were in an unrealized loss position had a total fair value of $2.3 billion with aggregate unrealized losses of $352.5 million. These unrealized losses related primarily to changes in overall interest rates and the resulting impact on valuations of mortgage-backed securities, collateralized mortgage obligations, municipal securities and corporate debt securities.
As of December 31, 2022, securities available-for-sale that were in an unrealized loss position had a total fair value of $4.8 billion with aggregate unrealized losses of $811.1 million These unrealized losses related primarily to changes in overall interest rates and the resulting impact on valuations of mortgage-backed securities, U.S. Treasury securities, collateralized mortgage obligations and municipal securities.
As of December 31, 2023, we had $2.3 billion of securities held-to-maturity, which had a total fair value of $2.2 billion. As of December 31, 2022, we had $2.3 billion of securities held-to-maturity, which had a total fair value of $2.1 billion.
The Company monitors to ensure it has adequate credit support and, as of December 31, 2023 we believed there was no credit losses and did not have the intent to sell any of our securities in an unrealized loss position and it is likely that we will not be required to sell such securities before their anticipated recovery. Debt securities held-to-maturity and available-for-sale are analyzed for credit losses under ASC 326, Financial Instruments - Credit Losses. For debt securities held-to-maturity and available-for-sale, the Company estimates current expected credit losses. An allowance for credit losses is established for losses on debt securities held-to-maturity and available-for-sale due to credit losses and is reported as a component of provision for credit losses. Accrued interest is excluded from our expected credit loss estimates. For more information about ASC Topic 326, see Note 1. Nature of Operations and Significant Accounting Policies of the Notes to Consolidated Financial Statements included in Item 8.
We closely monitor our investment securities for changes in credit risk. The valuation of our investment securities also is influenced by external market and other factors, including implementation of SEC and FASB guidance on fair value accounting. Accordingly, if market conditions deteriorate further and we determine our holdings of other investment securities have experienced credit losses, our future earnings, stockholders’ equity, regulatory capital and continuing operations could be materially adversely affected.
Our income property loans, consisting of commercial real estate and multi-family loans, involve higher principal amounts than other loans and repayment of these loans may be dependent on factors outside our control or the control of our borrowers.
We originate commercial real estate and multi-family loans for individuals and businesses for various purposes, which are secured by commercial properties. These loans typically involve higher principal amounts than other types of loans, and repayment is dependent upon income generated, or expected to be generated, by the property securing the loan in amounts sufficient to cover operating expenses and debt service, which may be adversely affected by changes in the economy or local market conditions. For example, if the cash flow from the borrower’s project is reduced as a result of leases not being obtained or renewed in a timely manner or at all, the borrower’s ability to repay the loan may be impaired.
Commercial real estate and multi-family loans also expose us to credit risk because the collateral securing these loans often cannot be sold easily. In addition, many of our commercial real estate and multi-family loans are not fully amortizing and contain large balloon payments upon maturity. Such balloon payments may require the borrower to either sell or refinance the underlying property in order to make the payment, which may increase the risk of default or non-payment.
The COVID-19 pandemic has had a potentially long-term negative impact on some commercial real estate portfolios. We continue to monitor our real estate loans secured by office properties because of the risk that tenants may continue to reduce the office space they lease as some portion of the workforce continues to work remotely on a hybrid or permanent basis and that we may not collect all amounts contractually owed to us.
40
If we foreclose on a commercial real estate or multi-family loan, our holding period for the collateral typically is longer than for residential mortgage loans because there are fewer potential purchasers of the collateral. Additionally, commercial real estate and multi-family loans generally have relatively large balances to single borrowers or groups of related borrowers. Accordingly, if we make any errors in judgment in the collectability of our commercial real estate and multi-family loans, any resulting charge-offs may be larger on a per loan basis than those incurred with our residential or consumer loan portfolios. Our commercial real estate and multi-family loans increased during the year ended December 31, 2023, to $11.1 billion, or 43% of our total loans held for investment from $9.5 billion, or 33% of our total loans held for investment, as of December 31, 2022.
In recent years, commercial real estate markets have been experiencing substantial growth, and increased competitive pressures have contributed significantly to historically low capitalization rates and rising property values. However, commercial real estate markets have been facing downward pressure since 2022 due in large part to increasing interest rates and declining property values. Accordingly, the federal banking agencies have expressed concerns about weaknesses in the current commercial real estate market and have applied increased regulatory scrutiny to institutions with commercial real estate loan portfolios that are fast growing or large relative to the institutions’ total capital. To address supervisory expectations with respect to financial institutions’ handling of commercial real estate borrowers who are experiencing financial difficulty, in June of 2023, the federal banking agencies, issued an interagency policy statement addressing prudent commercial real estate loan accommodations and workouts. Our failure to adequately implement enhanced risk management policies, procedures and controls could adversely affect our ability to increase this portfolio going forward and could result in an increased rate of delinquencies in, and increased losses from, this portfolio.
Our business is subject to interest rate risk and variations in interest rates may hurt our profits.
To be profitable, we have to earn more money in interest that we receive on loans and investments than we pay to our depositors and lenders in interest. If interest rates rise, our net interest income and the value of our assets could be reduced if interest paid on interest-bearing liabilities, such as deposits and borrowings, increases more quickly than interest received on interest-earning assets, such as loans, and investment securities. This is most likely to occur if short-term interest rates increase at a faster rate than long-term interest rates, which would cause our net interest income to go down. In addition, rising interest rates may hurt our income, because that may reduce the demand for loans and the value of our securities. In a rapidly changing interest rate environment, we may not be able to manage our interest rate risk effectively, which would adversely impact our financial condition and results of operations.
A reduction in our credit ratings could adversely affect our access to capital and could increase our cost of funds.
The credit rating agencies regularly evaluate the Company and the Bank, and credit ratings are based on a number of factors, including our financial strength and ability to generate earnings, as well as factors not entirely within our control, including conditions affecting the financial services industry, the economy, and changes in rating methodologies. In December 2023 in connection with the closing of the Merger, Kroll Bond Rating Agency, LLC affirmed its ratings for the Company (senior unsecured debt rating of ‘BBB’, subordinated debt rating of ‘BBB-’, and short-term debt rating of ‘K3’) and the Bank (deposit and senior unsecured debt rating of ‘BBB+’, subordinated debt rating of ‘BBB’, and the short-term deposit and debt ratings of ‘K2’) and assigned a preferred stock rating of ‘BB’ with a stable outlook assigned to all long-term ratings. There can be no assurance that we will maintain our current credit ratings. A downgrade of the credit ratings of the Company or the Bank could adversely affect our access to liquidity and capital and could significantly increase our cost of funds, trigger additional collateral or funding requirements, and decrease the number of investors and counterparties willing to lend to us or purchase our securities, reducing our ability to generate earnings.
41
We have a number of large credit relationships and individual commitments.
At December 31, 2023, there were two individual real estate construction and land commitments greater than or equal to $100 million with the largest commitment being $135 million. At December 31, 2023, these two individual commitments totaled $240 million and had an aggregate outstanding balance of $140 million. The projects financed by these commitments are two multifamily projects.
At December 31, 2023, we had four individual loan commitments greater than or equal to $150 million that ranged in size from $150 million to $500 million and totaled $1.0 billion and had an aggregate outstanding balance of $465 million. Two of these commitments totaling $695 million were equity fund loans, one of these commitments totaling $175 million was a loan secured by a multifamily property, and one of these commitments totaling $150 million was a loan secured by timeshare receivables.
Funding and Liquidity Risks
We may not be able to develop and maintain a strong core deposit base or other low cost funding sources.
We depend on checking, savings and money market deposit account balances and other forms of deposits as the primary source of funding for our lending activities. Our future growth will largely depend on our ability to expand core deposits, to provide a less costly and stable source of funding. The deposit markets are competitive, and therefore it may prove difficult to grow our core deposit base. Changes we make to the rates offered on our deposit products may affect our finances and liquidity. In addition, our ability to maintain existing or obtain additional deposits may be impacted by factors beyond our control, including perceptions about our reputation, financial strength or the banking industry generally, which could reduce the number of consumers choosing to place deposits with us.
Our ability to obtain deposit funding and offer competitive interest rates on deposits is also dependent on capital levels of our bank subsidiary. While the Bank met the FDIC’s definition of “well-capitalized” as of December 31, 2023, there can be no assurance that it will continue to meet this definition. Our regulators can adjust the requirements to be “well-capitalized” at any time and have authority to place limitations on our deposit businesses, including the interest rate we pay on deposits. An inability to develop and maintain a strong deposit base could have a material adverse impact on our business, financial condition, and results of operations.
2020 saw a competitive landscape for deposits, which competition continued through 2021 and was exacerbated in 2022 and 2023 by the rising interest rate environment. In a competitive market, depositors have many choices as to where to place their deposit accounts. As the Bank continues to grow its core deposit base and seeks to reduce its exposure to high rate/high volatility accounts, it may experience a net deposit outflow, which could negatively impact our business, financial condition, and results of operations.
Liquidity risk could impair our ability to fund operations and jeopardize our financial condition.
Liquidity is essential to our business. An inability to raise funds through deposits, borrowings, the sale of loans, and other sources has had, and could continue to have, a substantial negative effect on our liquidity. Our access to funding sources in amounts adequate to finance our activities or on terms that are acceptable to us has been, and could continue to be, impaired by factors that affect us specifically or the financial services industry or economy in general.
Factors that could detrimentally impact our access to liquidity sources include a decrease in the level of our business activity as a result of a downturn in the markets in which our loans are concentrated or adverse regulatory action against us. Our ability to borrow has also been, and could continue to be, impaired by factors that are not specific to us, such as a disruption in the financial markets or negative views and expectations about the prospects for the financial services industry.
As we and other regional banking organizations experienced in 2023, the failure of other financial institutions may cause deposit outflows as customers spread deposits among several different banks so as to maximize their amount of FDIC insurance, move deposits to banks deemed “too big to fail” or remove deposits from the banking system entirely. As of December 31, 2023, approximately 23% of our deposits were uninsured and uncollateralized and we rely on these deposits for liquidity. A failure to maintain adequate liquidity could have a material adverse effect on our business, financial condition, and results of operations.
42
Problems encountered by, or adverse news concerning, other financial institutions may adversely affect financial and capital markets generally as well as the Bank.
The soundness and stability of financial institutions are closely interrelated as a result of credit, trading, clearing, and other relationships between institutions. As a result, concerns about, or a default or threatened default by, or failure or threatened failure of, one or more institutions could lead to significant market-wide liquidity problems, losses or defaults by us or other institutions, or credit risk in the event of default of our counterparty or customer. Even rumors or adverse news developments concerning other financial institutions or the Bank may result in rapid deterioration in investor and customer confidence. This interconnectedness of financial institutions has been starkly evidenced by the recent events affecting the banking industry, as banks including the Bank have been impacted by concerns regarding the soundness or creditworthiness of other financial institutions, which has caused substantial and cascading disruption within the financial markets and increased expenses.
In addition to the disruption of financial, credit and capital markets, the recent banking industry events may have other adverse impacts on the Bank. For example, these developments may result in increased regulatory requirements and scrutiny, increasing our costs and adversely affecting our profitability. In addition, the premiums of the FDIC’s deposit insurance program have increased and are expected to further increase as a result of the March 2023 bank failures, and we are no longer eligible to utilize credits to reduce our FDIC insurance premiums as a result of us exceeding $10 billion in assets. These increased premiums would have an adverse effect on our net income and results of operations. Changes resulting from these events could include increased regulatory oversight, higher capital requirements or changes in the way regulatory capital is calculated, and impositions of additional restrictions through regulatory changes or supervisory or enforcement activities, and, as a result, our operating margins, financial condition, and results of operations may be materially adversely affected.
We are subject to regulatory capital requirements, which could be made more stringent in the discretion of our regulators.
We are subject to capital and other regulatory requirements specifying minimum amounts and types of capital that we must maintain. From time to time, the regulators may change these regulatory capital and related requirements. If we fail to meet these minimum capital and related requirements, we or our subsidiaries may be restricted in the types of activities we may conduct and we may be prohibited from taking certain capital actions, such as paying dividends and repurchasing or redeeming capital securities. In addition, the failure to meet such requirements could result in one or more of our regulators placing limitations or conditions on our activities, including our growth initiatives, or restricting the commencement of new activities, and could affect customer and investor confidence, our costs of funds and level of required deposit insurance assessments to the FDIC, our ability to pay dividends on our capital stock, our ability to make acquisitions, and our business, results of operations, and financial condition, generally.
The FRB may require us to commit capital resources or take other action to support the Bank.
A bank holding company is required to act as a source of financial and managerial strength to its subsidiary banks and to commit resources to support its subsidiary banks. The FRB may require a bank holding company to make capital injections into, or take other action in support of, a troubled subsidiary bank at times when the bank holding company may not be inclined to do so and may charge the bank holding company with engaging in unsafe and unsound practices for failing to commit resources to such a subsidiary bank. Accordingly, we could be required to provide financial assistance to the Bank if it experiences financial distress—even if doing so is not otherwise in the best interest of the Company.
Such a capital injection or other support may be required at a time when our resources are limited and we may be required to borrow the funds to make the required capital injection. In the event of a bank holding company’s bankruptcy, the bankruptcy trustee will assume any commitment by the holding company to a federal bank regulatory agency to maintain the capital of a subsidiary bank. Moreover, bankruptcy law provides that claims based on any such commitment will be entitled to a priority of payment over the claims of the holding company’s general unsecured creditors, including the holders of any note obligations.
43
We may elect or be compelled to seek additional capital in the future, but that capital may not be available when it is needed or on acceptable terms.
We face significant capital and other regulatory requirements as a financial institution. We may need to raise additional capital in the future to provide sufficient capital resources and liquidity to meet our commitments and business needs, which could include the possibility of financing acquisitions. In addition, we, on a consolidated basis, and the Bank, on a standalone basis, must meet certain regulatory capital requirements and maintain sufficient liquidity. Importantly, regulatory capital requirements could increase from current levels, which could require us to raise additional capital or reduce our operations.
Our ability to raise additional capital depends on conditions in the capital markets, economic conditions, and a number of other factors, including investor perceptions regarding the financial services and banking industry, market conditions and governmental activities, and on our financial condition and performance. Accordingly, we may be unable to raise additional capital if needed or on acceptable terms. If we fail to maintain capital to meet regulatory requirements, our liquidity, business, financial condition, and results of operations could be adversely affected.
Our holding company relies on dividends from the Bank for substantially all of its income and as the primary source of funds for cash dividends to our preferred, common, and NVCE stockholders.
The Company is the parent company of, and a separate and distinct legal entity from, the Bank. Legal entity liquidity is an important consideration as there are legal, regulatory, contractual and other limitations on our ability to utilize liquidity from one legal entity to satisfy the liquidity requirements of another, which could result in adverse liquidity events at either the Company and/or the Bank. In particular, the Bank is subject to laws that restrict dividend payments, or authorize federal bank regulators to block or reduce the flow of funds from those subsidiaries to the parent company or other subsidiaries. Applicable laws and regulations, including capital and liquidity requirements, could restrict the Bank’s ability to pay dividends or distribute capital to the Company, which could adversely affect our cash flow and financial condition.
There can be no assurance as to the level of dividends we may pay on our common stock and NVCE stock.
Holders of our common stock and NVCE stock are only entitled to receive such dividends as our Board of Directors declares out of funds legally available for such payments. Although we have historically declared cash dividends on our common stock, we are not required to do so and there may be circumstances under which we would reduce, suspend, or eliminate our common stock dividend in the future. This could adversely affect the market price of our common stock.
As a bank holding company, our ability to pay dividends is affected by the policies and enforcement powers of the FRB and any future payment of dividends will depend on the Bank’s ability to make distributions and payments to the Company as our principal source of funds to pay such dividends. The Bank is also subject to various legal, regulatory and other restrictions on its ability to make distributions and payments to the Company. There are numerous laws and banking regulations that restrict the Bank’s ability to pay dividends or make capital distributions to the Company. These statutes and regulations require, among other things, that the Bank maintain certain levels of capital in order to pay a dividend. Further, our banking authorities have the ability to restrict the Bank’s payment of dividends through supervisory action. In addition, in the future, we may enter into borrowing or other contractual arrangements that restrict its ability to pay dividends. As a consequence of these various limitations and restrictions, we may not be able to make the payment of dividends on our common stock and NVCE stock. See also "Item 1. Business - Supervision and Regulation - Banc of California, Inc.- Repurchases/Redemptions; Dividends" and "Item 1. Business - Supervision and Regulation - The Bank - Dividends," each included in this Annual Report on Form 10-K.
Legal and Compliance Risks
We operate in a highly regulated environment and our business, operations, and income may be adversely affected by changes in laws, rules, and regulations governing our operations.
We are subject to extensive regulation, supervision and legal requirements that affect virtually all aspects of our business and operations. The regulatory agencies governing banking organizations are focused on protecting customers, depositors, the Deposit Insurance Fund, and the overall financial stability of the United States—not our stockholders or creditors. See Item 1 —Supervision and Regulation included in this Annual Report on Form 10-K for information on the regulation and supervision framework which governs our Company and its activities.
44
We are regularly examined and inspected by our regulators, including the FRB and DFPI. Our regulators have extensive authority and discretion in their interpretation, implementation, supervision and enforcement of their regulatory agenda, including on matters related to:
•dividends or capital distributions by the Bank or the Company;
•capital and liquidity requirements applicable to us, including the imposition of requirements more stringent than those required under generally applicable laws;
•the types and terms of products we offer, activities we may conduct, our operations, or investments we may make;
•the composition, risk characteristics, potential adverse classification, allowance and risk reserves in connection with our loans or other assets, including reclassifying assets;
•level of our deposit insurance premiums;
•our deposit-gathering and other funding sources;
•the quality of our board and management oversight;
•the effectiveness of our risk management and compliance program, including with respect to consumer protection, information technology, cybersecurity, third-party risk management, anti-money laundering and sanctions;
•the Bank’s commitment to helping meet the credit needs of low- and moderate-income neighborhoods under the CRA;
•their willingness to approve applications, such as the establishment of new branches, the commencement of new activities, or the conduct of mergers and acquisitions; and
•our rate of growth and other expansionary or strategic initiatives.
Also, failure by the Company to meet the applicable eligibility requirements for financial holding company status (including capital and management requirements and that the Bank maintain at least a “Satisfactory” CRA rating) may result in restrictions on certain activities of the Company, including the commencement of new activities and mergers with or acquisitions of other financial institutions and could ultimately result in the loss of financial holding company status. We must devote substantial time and resources to compliance and meeting our regulators’ supervisory expectations, which may adversely affect our ability to operate profitably or to pursue advantageous business opportunities.
Congress, state legislatures and federal and state agencies continually review banking, lending and other laws, regulations and policies for possible changes. We face the risk of becoming subject to new or more stringent requirements in connection with the introduction of new regulations or modifications of existing regulations, which could require us to hold more capital or liquidity or have other adverse effects on our businesses or profitability. Any change in such regulation and oversight, whether in the form of regulatory policy, new regulations or legislation, that applies to us or additional deposit insurance premiums could have a material adverse impact on our operations. Because our business is highly regulated, the laws and applicable regulations are subject to frequent change. Any new laws, rules and regulations such as the California Consumer Privacy Act (the “CCPA”) and the Colorado Privacy Act could make compliance more difficult, expensive, costly to implement or may otherwise adversely affect our business, financial condition or growth prospects. Such changes could subject us to additional costs, limit the types of financial services and products we may offer and/or increase the ability of non-banks to offer competing financial services and products, among other things.
Also, the FRB regulates the supply of money and credit in the United States. Its fiscal and monetary policies determine in a large part our cost of funds for lending and investing and the return that can be earned on those loans and investments, both of which affect our net interest margin. FRB policies can also materially affect the value of financial instruments that we hold, such as debt securities, certain mortgage loans held-for-sale and MSRs. Its policies also can affect our borrowers, potentially increasing the risk that they may fail to repay their loans or satisfy their obligations to us. Changes in policies of the FRB are beyond our control and the impact of changes in those policies on our activities and results of operations can be difficult to predict.
45
We are a party to a variety of litigation and other actions in the ordinary course of business and in connection with the Merger.
We are subject to a variety of litigation pertaining to fiduciary and other claims and legal proceedings in the ordinary course of business and in connection with the Merger. Currently, there are certain legal proceedings pending against us in the ordinary course of business and in connection with the Merger. Such legal proceedings have caused us to incur costs and diverted the time and attention of our board and management, and may continue to do so in the future. While the outcome of any legal proceeding is inherently uncertain, we believe that any liabilities arising from pending legal matters would be immaterial based on information currently available. However, if actual results differ from our expectations, it could have a material adverse effect on the Company’s financial condition, results of operations, or cash flows. For a discussion on current legal proceedings, see "Item 3. Legal Proceedings," and Note 13. Commitments and Contingencies of the Notes to Consolidated Financial Statements included in Item 8.
Changes in federal, state or local tax laws, or audits from tax authorities, could negatively affect our financial condition and results of operations.
We are subject to changes in tax law that could increase our effective tax rates. These law changes may be retroactive to previous periods and as a result could negatively affect our current and future financial performance. In particular, the Tax Cuts and Jobs Act, which was signed into law in December 2017, includes a number of provisions impacting the banking industry and the borrowers and the market for residential and commercial real estate. Changes include a lower limit on the deductibility of interest on residential mortgage loans and home equity loans; a limitation on the deductibility of business interest expense; a limitation on the deductibility of property taxes and state and local income taxes, etc. The law's limitation on the mortgage interest deduction and state and local tax deduction for individual taxpayers has increased the after-tax cost of owning a home for many of our existing clients. The value of the properties securing loans in our loan portfolio may be adversely impacted as a result of the changing economics of home ownership, which could require an increase in our provision for loan losses, which would reduce our profitability and could materially adversely affect our business, financial condition, and results of operations. Further, these changes implemented by this tax law could make some businesses and industries less inclined to borrow, potentially reducing demand for our commercial loan products. Finally, we may be negatively impacted more than our competitors because our business strategy focuses on California, which has a higher cost real estate market compared to other states.
We are also subject to potential tax audits in various jurisdictions and in such event, tax authorities may disagree with certain positions we have taken and assess penalties or additional taxes. While we assess regularly the likely outcomes of these potential audits, there can be no assurance that we will accurately predict the outcome of a potential audit, and an audit could have a material adverse impact on our business, results of operations, and financial condition.
Failure to comply with applicable laws or regulations, or to satisfy our regulators' supervisory expectations, could subject us to supervisory or enforcement action, which could adversely affect our business, financial condition, and results of operations.
If we do not comply with applicable laws or regulations, if we are deemed to have engaged in unsafe or unsound conduct, or if we do not satisfy our regulators’ supervisory expectations, then we may be subject to increased scrutiny, supervisory criticism, governmental or private litigation and/or a wide range of potential monetary penalties or enforcement actions. Such actions could arise even if we are acting in good faith or operating under a reasonable interpretation of the law. Such actions may be public or of a confidential supervisory nature. Such actions could include, for example, monetary penalties, payment of damages, restitution or disgorgement of profits, directives to take remedial action or to cease or modify practices, restrictions on growth or expansionary proposals, denial or refusal to accept applications, removal of officers or directors, prohibition on dividends or capital distributions, increases in capital or liquidity requirements and/or termination of the Bank’s deposit insurance. Such actions could have an adverse effect on our business, financial condition and results of operations, including as a result of reputational harm.
46
Non-compliance with laws and regulations could result in fines or sanctions or operating restrictions.
Our federal regulators have extensive discretion in connection with their supervisory and enforcement activities over our operations and compliance laws and regulations. Any new laws and regulations could make compliance more difficult or expensive or otherwise adversely affect our business. One aspect of our business that we believe presents risks in this particular area is the conflict between federal and state law, including but not limited to cannabis and cannabis related businesses, which are legal in the State of California and the State of Colorado and prohibited by federal law. If our risk management and compliance programs prove to be ineffective, incomplete or inaccurate, we could suffer unexpected losses and/or incur fines, penalties or restrictions to operations, which could materially adversely affect our results of operations or financial condition. As part of our federal regulators’ enforcement authority, significant civil or criminal monetary penalties, consent orders, or other regulatory actions can be assessed against the Bank. Such actions could require us to make changes to our operations, including the clients that we serve, and may have an adverse impact on our operating results.
We are subject to federal and state fair lending laws, and failure to comply with these laws could lead to material penalties.
The provision of financial services to consumers is governed by a wide range of laws and regulations, including the Equal Credit Opportunity Act, the Fair Housing Act, the GLBA, and the Dodd-Frank Wall Street Reform and Consumer Protection Act of 2010. The CFPB, the Justice Department and other federal agencies are generally responsible for enforcing these laws and regulations. Failure to comply with these laws could result in a wide variety of sanctions, including the required payment of damages and civil money penalties, injunctive relief, imposition of restrictions on mergers and acquisitions activity, and restrictions on expansion activity. Private parties may also have the ability to challenge an institution’s performance under certain of these in private or class action litigation.
In addition, the CFPB has broad rulemaking, supervisory and enforcement powers under various federal consumer financial protection laws with respect to banking organizations with assets of $10 billion or more. The examination, supervision and enforcement of those laws and implementing regulations by the CFPB have created a more intense and complex environment for consumer finance regulation. The Bank has assets of at least $10 billion; therefore, we are subject to the supervision, examination, and primary enforcement jurisdiction of the CFPB with respect to federal consumer financial protection laws. Compliance with the rules and policies adopted by the CFPB has limited the products we may offer to some or all of our clients, or limited the terms on which those products may be issued, or may adversely affect our ability to conduct our business as previously conducted. We may also be required to add compliance personnel or incur other significant compliance-related expenses. Our business, financial condition, results of operations and/or competitive position may be adversely affected as a result.
We are subject to a wide range of laws related to anti-money laundering, economic sanctions, and prevention of financial crime, which could increase our costs or subject us to significant penalties.
We are subject to a wide range of laws related to anti-money laundering, economic sanctions and prevention of financial crime, including but not limited to the BSA, the USA PATRIOT Act and economic sanctions programs. We are required to, among other things, maintain an effective anti-money laundering and counter-terrorist compliance program, identify and file suspicious activity and currency transaction reports, and block transactions with sanctioned persons or jurisdictions. Compliance with these laws requires significant investment of management attention and resources. These laws are enforced by a number of regulatory authorities, including the FRB, OFAC, the Financial Crimes Enforcement Network, the U.S. Department of Justice, Drug Enforcement Administration, and Internal Revenue Service. Failure to comply with these laws, or to meet our regulators’ supervisory expectations in connection with these laws, could subject us to supervisory or enforcement action, significant financial penalties, criminal liability and/or reputational harm. Several banking institutions have received large fines, or suffered limitations on their operations, for non-compliance with these laws and regulations. Although we have developed policies, procedures and processes designed to assist in compliance with these laws and regulations, no assurance can be given that these policies and procedures will be effective in detecting violations of these laws and regulations.
47
Risks Relating to External Factors and Markets
Severe weather, natural disasters, pandemics, acts of war or terrorism and other external events could significantly impact our business.
Severe weather, natural disasters such as earthquakes and wildfires, acts of war or terrorism (and any responses thereto), pandemics (including the ongoing COVID-19 pandemic), epidemics and other health-related crises, and other adverse external events have had and could have a significant impact on our ability to conduct business. Such events could affect the stability of our deposit base, impair the ability of our borrowers to repay their outstanding loans, cause significant property damage or otherwise impair the value of collateral securing our loans, and result in loss of revenue and/or cause us to incur additional expenses. Although we have established disaster recovery and business continuity plans and procedures, and we monitor the effects of any such events on our loans, properties and investments, the occurrence of any such event could have a material adverse effect on us or our results of operations and our financial condition.
Ongoing geopolitical instability, including as a result of Russia’s invasion of Ukraine and the recent Middle East conflict, has negatively impacted, and could in the future negatively impact, the global and U.S. economies, including by causing supply chain disruptions, rising prices for oil and other commodities, volatility in capital markets and foreign currency exchange rates, rising interest rates and heightened cybersecurity risks. The extent to which such geopolitical instability adversely affects our business, financial condition and results of operations, as well as our liquidity and capital profile, will depend on future developments, which are highly uncertain and unpredictable, including with respect to Russia’s invasion of Ukraine and the Middle East conflict, and the extent and duration of the conflict in Ukraine and in the Middle East, and the humanitarian toll inflicted by such conflicts. The upcoming U.S. presidential election may also create additional domestic and global economic uncertainty. If geopolitical instability adversely affects us, it may also have the effect of heightening other risks related to our business.
There is uncertainty surrounding potential legal, regulatory, and policy changes by new presidential administrations in the United States that may directly affect financial institutions and the global economy.
2024 is a presidential election year in the United States. At this time, it is difficult to predict the legislative and regulatory changes that will result due to the upcoming election. A new administration, or a change in the make-up of either the Senate and/or House of Representatives may cause broader economic changes due to changes in governing ideology and governing style. New appointments to the Board of Governors of the Federal Reserve could affect monetary policy and interest rates, and changes in fiscal policy could affect broader patterns of trade and economic growth. Future legislation, regulation, and government policy could affect the banking industry as a whole, including our business and results of operations, in ways that are difficult to predict. In addition, our results of operations also could be adversely affected by changes in the way in which existing statutes and regulations are interpreted or applied by courts and government agencies.
Our financial condition and results of operations are dependent on the national and local economy, particularly in the Bank’s market areas. A worsening in economic conditions in the market areas we serve may impact our earnings adversely and could increase the credit risk of our loan portfolio.
We cannot accurately predict the possibility of the national or local economy’s return to recessionary conditions or to a period of economic weakness, which would adversely impact the markets we serve. Our primary market area is concentrated in the greater Los Angeles, Orange, San Diego, San Bernardino, Riverside and Ventura counties of California, with full-service branches also located in Denver, Colorado and Durham, North Carolina. Adverse economic conditions in any of these areas can reduce our rate of growth, affect our clients’ ability to repay loans and adversely impact our financial condition and earnings. General economic conditions, including inflation, unemployment and money supply fluctuations, also may affect our profitability adversely.
48
A deterioration in economic conditions could result in a number of consequences, including but not limited to the following, any of which could have a material adverse effect on our business, financial condition, and results of operations:
•Demand for our products and services may decline;
•Loan delinquencies, problem assets and foreclosures may increase;
•Collateral for our loans may decline in value; and
•The amount of our low cost or noninterest-bearing deposits may decrease.
We are subject to risk arising from the soundness of other financial institutions and counterparties.
Financial services institutions are interrelated as a result of trading, clearing, counterparty, or other relationships. We have exposure to many different industries and counterparties, and routinely execute transactions with counterparties in the financial services industry, including commercial banks, brokers and dealers, investment banks, and other institutional clients. Many of these transactions expose us to credit risk in the event of a default by a counterparty or client. In addition, our credit risk may be exacerbated when the collateral held by us cannot be realized upon or is liquidated at prices not sufficient to recover the full amount of the credit or derivative exposure due to us. Any such losses could have a material adverse effect on our business, financial condition, and results of operations.
Strong competition within our market areas may limit our growth and profitability.
Competition in the banking and financial services industry is intense. In our market areas, we compete with commercial banks, savings institutions, mortgage brokerage firms, credit unions, finance companies, non-bank lenders, mutual funds, insurance companies, and brokerage and investment banking firms operating locally and elsewhere. Many of these competitors have substantially greater name recognition, resources and lending limits than we do and may offer certain services or prices for services that we do not or cannot provide. Our profitability depends upon our continued ability to successfully compete in our markets.
Continued technological advances, including cryptocurrencies and blockchain and other distributed ledger technologies, and the growth of e-commerce have made it possible for non-depository institutions to offer products and services that traditionally were banking products, and for financial institutions and other companies to provide electronic and internet-based financial solutions, including electronic securities trading, lending and payment solutions. In addition, technological advances, including digital currencies and alternative payment methods, may diminish the importance of depository institutions and other financial intermediaries in the transfer of funds between parties.
In addition, our future success will depend, in part, upon our ability to address the needs of our clients by using technology to provide products and services that will satisfy client demands for convenience, as well as to create additional efficiencies in our operations. Many of our competitors have substantially greater resources to invest in technological improvements. We may not be able to effectively implement new technology-driven products and services or be successful in marketing these products and services to our clients.
49
ITEM 1B. UNRESOLVED STAFF COMMENTS
None.
ITEM 1C. CYBERSECURITY
Risk Management and Strategy
Our enterprise risk management program is designed to identify, measure, monitor and control all significant risks across various aspects of our company. Cybersecurity risk management processes are integrated into this program, given the increasing reliance on technology and potential of cyber threats. Our Chief Information Security Officer (“CISO”) is primarily responsible for our cybersecurity program and is a key member of the risk management function, reporting directly to the Chief Risk Officer (“CRO”) and to the Enterprise Risk Committee of our Board of Directors.
Our objective for managing cybersecurity risk is to maintain appropriate layers of safeguards to protect information systems from possible threats and to avoid or minimize the impacts of external threat events or other efforts to penetrate, disrupt or misuse our systems or information. Our information security program is designed in accordance with industry frameworks, such as the National Institute of Standards and Technology (“NIST”) Cybersecurity Framework, and is periodically reviewed and updated at least annually and upon significant changes to our operating environment. Our program includes the following key elements:
•Systems Safeguards. We adopt the “trust by design” framework when designing new products, services and technology. We employ a variety of preventative and detective tools designed to monitor, detect, block, and provide alerts regarding suspicious and unauthorized activity and to report on suspected advanced persistent threats.
•Incident Response. We maintain an Incident Response Plan (“IRP”) that provides a documented framework for responding to actual or potential cybersecurity incidents. The IRP is coordinated through the CISO and key members of management and addresses roles, responsibilities, and communication and contract strategies in the event of a compromise, including analysis of reportable events in accordance with applicable legal and compliance requirements.
•Collaboration. We engage cybersecurity experts and third-party specialists to perform regular assessments of our infrastructure, software systems and network architecture. We also leverage internal and external auditors and independent external partners to periodically review our processes, systems and controls, including with respect to our information security program, to assess their design and operating effectiveness.
•Education and Training. We have regular and ongoing security education and training for employees, practical exercises that simulate actual cyber attacks, and recovery and resilience tests.
•Third-Party Risk Management. We maintain a third-party risk management program designed to identify, assess and manage cybersecurity risks associated with external service providers, contractors and vendors.
To our knowledge, cybersecurity threats, including as a result of any previous cybersecurity incidents, have not materially affected the Company, including its business strategy, results of operations, or financial conditions. Our internal systems, processes, and controls are designed to mitigate and minimize potential losses resulting from cyber attacks, however, there can be no assurance that our cybersecurity risk management program will be fully effective in protecting the confidentiality, integrity and availability of our information systems and our solutions. For further discussion of risks from cybersecurity threats, see Item 1A. Risk Factors in the section titled “We are subject to certain risks in connection with our use of technology.”
50
Governance
Our Board of Directors considers cybersecurity risk as part of its risk management function and has delegated to the Enterprise Risk Committee oversight and governance of the technology program and the information security program, including management’s actions to identify, assess, mitigate, and remediate or prevent material cybersecurity issues and risks. The Enterprise Risk Committee reviews our cybersecurity risk profile on a quarterly basis. Additionally, our CISO and our Chief Information Officer provide quarterly reports to the Enterprise Risk Committee regarding the information security program and the technology program, key enterprise cybersecurity initiatives, and other matters relating to cybersecurity processes.
The Information Technology and Information Security sub-committee is a working group of the management level Enterprise Risk Management Committee and represented by managers within various departments and includes the CISO and Chief Information Officer as well as their direct reports and other key departmental managers from throughout the entire company. This sub-committee meets quarterly to provide oversight of the technology management strategy, standards, policies, practices, controls, and mitigation and prevention efforts employed to manage security risks. Meetings with key team leaders occur as required and in accordance with the IRP in order to facilitate timely informing and monitoring efforts. The Company's Executive Leadership Team meets monthly with the CISO and Deputy CISO and reports summaries of key issues, including significant cybersecurity and/or privacy incidents, discussed at various meetings and responses to any actions taken to/from the Enterprise Risk Committee on a quarterly basis or more frequently as may be required by the IRP.
Our CISO has substantial relevant expertise and formal training in the areas of information security and cybersecurity risk management and is accountable for managing our enterprise information security department and developing and implementing our information security program. The responsibilities of this department include cybersecurity risk assessment, defense operations, incident response, vulnerability assessment, threat intelligence, identity access governance, third-party risk management, client, vendor and employee education and awareness, and business continuity and disaster recovery. The department, as a whole, consists of information security professionals with varying degrees of professional education, certifications and experience.
ITEM 2. PROPERTIES
As of January 31, 2024, we had a total of 155 properties consisting of 95 full-service branch offices and 60 other offices. We own six locations and the remaining properties are leased. Our properties are located throughout the United States, however, approximately 86% are located in California. We lease our principal office, which is located at 11611 San Vicente Blvd., Suite 500, Los Angeles, CA 90049.
For additional information regarding properties of the Company and Pacific Western, see Note 6. Premises and Equipment, Net of the Notes to Consolidated Financial Statements contained in “Item 8. Financial Statements and Supplementary Data.”
ITEM 3. LEGAL PROCEEDINGS
See Note 13. Commitments and Contingencies of the Notes to Consolidated Financial Statements contained in “Item 8. Financial Statements and Supplementary Data.” That information is incorporated into this item by reference.
ITEM 4. MINE SAFETY DISCLOSURE
Not applicable.
51
PART II
ITEM 5. MARKET FOR REGISTRANT’S COMMON EQUITY, RELATED SHAREHOLDER MATTERS AND ISSUER PURCHASES OF EQUITY SECURITIES
Marketplace Designation and Holders
Our voting common stock is listed on the NYSE and is traded under the symbol “BANC.” As of February 20, 2024, and based on the records of our transfer agent, there were approximately 2,144 record holders of our voting common stock. Certain shares are held in “nominee” or “street” name and accordingly, the number of beneficial owners of such shares is not known or included in the foregoing number.
Our Class B non-voting common stock is not listed or traded on any national securities exchange or automated quotation system, and there currently is no established trading market for such stock. As of December 31, 2023, we had 477,321 shares of Class B non-voting common stock outstanding and held by three holders of record.
Our NVCE stock is not listed or traded on any national securities exchange or automated quotation system, and there currently is no established trading market for such stock. As of December 31, 2023, we had 10,829,990 shares of NVCE stock outstanding and held by two holders of record.
As of December 31, 2023, we had 513,250 shares of preferred stock outstanding, all of which were shares of our 7.75% fixed rate reset non-cumulative perpetual preferred stock, Series F, liquidation amount $1,000 per share (“Series F Preferred Stock”). Depositary shares each representing 1/40th of a share of the Series F Preferred Stock are listed on the NYSE and traded under the symbol “BANC/PF.” The Series F Preferred Stock ranks senior to our common stock and NVCE stock in the payment of dividends and in the distribution of assets on any liquidation, dissolution or winding up of Banc of California, Inc.
Dividends
The timing and amount of cash dividends paid to our preferred and common stockholders depends on our earnings, capital requirements, financial condition, regulatory approval and other relevant factors, including the discretion of the Board of Directors with respect to common stockholder dividends. Our primary source of revenue at the holding company level is dividends from the Bank, and to a lesser extent our ability to raise capital or debt. To the extent we are unable to access dividends from the Bank or are limited in our ability to raise capital in the future, our ability to pay cash dividends to our stockholders would likely be limited. See “Item 1A. - Risk Factors” for a discussion regarding the holding company’s reliance on dividends from the Bank for substantially all of its income and as a result the primary source of funds for cash dividends to our preferred and common stockholders. During the year ended December 31, 2023 and prior to the completion of the Merger, PacWest Bancorp paid dividends in the amount of $48.9 million to its common stockholders and $39.8 million to its preferred stockholders. Legacy Pacific Western Bank paid dividends of $46.0 million to PacWest Bancorp during the year ended December 31, 2023, all of which were paid prior to the completion of the Merger. For a discussion of dividend restrictions on the Company's common stock, or of dividends from the Company's subsidiaries to the Company, see “Item 1. Business - Supervision and Regulation - Dividends and Share Repurchases” and Note 22. Dividend Availability and Regulatory Matters of the Notes to Consolidated Financial Statements contained in “Item 8. Financial Statements and Supplementary Data.”
52
Securities Authorized for Issuance Under Equity Compensation Plans
The following table provides information as of December 31, 2023 regarding securities issued and to be issued under our equity compensation plan in effect during fiscal year 2023:
| Number of Securities | Weighted | Number of Securities | ||||||||||||||||||||||||||||||
| to be Issued Upon | Average Exercise | Remaining Available | ||||||||||||||||||||||||||||||
| Exercise of | Price of | for Future Issuance | ||||||||||||||||||||||||||||||
| Outstanding | Outstanding | Under Equity | ||||||||||||||||||||||||||||||
| Options, | Options, | Compensation Plans | ||||||||||||||||||||||||||||||
| Warrants, and | Warrants, and | (Excluding Securities | ||||||||||||||||||||||||||||||
| Rights | Rights | Reflected in Column (a)) | ||||||||||||||||||||||||||||||
| Plan Category | Plan Name | (a) | (b) | (c) | ||||||||||||||||||||||||||||
| Amended and Restated | ||||||||||||||||||||||||||||||||
| Equity compensation | Banc of California, | |||||||||||||||||||||||||||||||
| plans approved by | Inc. 2018 Stock | |||||||||||||||||||||||||||||||
| security holders | Incentive Plan (1) | 13,068 | (2) | $ | — | 8,756,260 | (3) | |||||||||||||||||||||||||
| Equity compensation | ||||||||||||||||||||||||||||||||
| plans not approved by | ||||||||||||||||||||||||||||||||
| security holders | None | — | — | — | ||||||||||||||||||||||||||||
| Total | 13,068 | $ | — | 8,756,260 | ||||||||||||||||||||||||||||
__________________________________
(1) The Amended and Restated Banc of California, Inc. 2018 Stock Incentive Plan (the “Amended and Restated 2018 Plan”) was approved by our stockholders at our November 22, 2023 Special Meeting of Stockholders, authorizing 8,789,197 shares for issuance, representing 2,489,197 shares available for new awards under the existing 2018 Stock Incentive Plan as of the merger close date, plus 6,300,000 shares added as a result of the approval of the Amended and Restated 2018 Plan.
(2) Amount does not include 501,050 shares of unvested time-based restricted stock units ("RSUs") granted under the Amended and Restated 2018 Plan and 861,403 unvested time-based restricted shares outstanding under the Amended and Restated PacWest Bancorp 2017 Stock Incentive Plan as of December 31, 2023.
(3) The Amended and Restated 2018 Plan permits these remaining shares to be issued in the form of options, PRSUs, RSUs, restricted stock, or stock appreciation rights.
53
Recent Sales of Unregistered Securities
Concurrently with the Merger on November 30, 2023 (the “Closing Date”), Banc of California, Inc. (a) issued and sold to affiliates of funds managed by Warburg Pincus LLC (the “Warburg Investors”) and certain investment vehicles sponsored, managed or advised by Centerbridge Partners, L.P. and its affiliates (the “Centerbridge Investor” and, together with the Warburg Investors, the “Investors”), for $12.30 per share and an aggregate purchase price of $400 million, approximately (i) 21.7 million shares of Banc of California, Inc.’s common stock and (ii) 10.8 million shares of Banc of California, Inc.’s NVCE stock and (b) issued to the (i) Warburg Investors warrants to purchase approximately 15.9 million shares of Banc of California, Inc.’s NVCE stock and (ii) Centerbridge Investor warrants to purchase approximately 3.0 million shares of Banc of California, Inc.’s common stock, in each case, with such warrants having an exercise price of $15.375 (a 25% premium to the price paid on our common stock and NVCE stock) per share (the “Warrants”). The Warrants carry a term of seven years but are subject to mandatory exercise when the market price of Banc of California, Inc.’s common stock reaches or exceeds $24.60 (a 100% premium to the price paid by the Warburg Investors and the Centerbridge Investor for Banc of California, Inc.’s common stock and NVCE stock) for 20 or more trading days during any 30-consecutive trading day period. The Warrants may be settled on a “net share” basis by applying shares otherwise issuable under the Warrants in satisfaction of the exercise price. The issuance and sale were made pursuant to the investment agreements, each dated as of July 25, 2023, entered into by Banc of California, Inc. with the Warburg Investors (such agreement, the “Warburg Investment Agreement”) and the Centerbridge Investor (together with the Warburg Investment Agreement, the “Investment Agreements”), respectively.
Subject to certain exceptions, the Investors are prohibited from transferring any securities acquired pursuant to the Investment Agreements for 90 days following the Closing Date (the “Lock-Up Period”). Following the Lock-Up Period, until the 180-day anniversary of the Closing Date, subject to certain exceptions, the Warburg Investors are prohibited from transferring 25% of the securities acquired pursuant to the Warburg Investment Agreement. The Warburg Investors are subject to certain additional transfer restrictions following the expiration of such 180-day period.
The offering and sale of shares of Banc of California, Inc.’s common stock, NVCE stock, and the Warrants were made in reliance on an exemption from registration under Section 4(a)(2) of the Securities Act of 1933 (the “Securities Act”).
On the Closing Date, Banc of California, Inc. entered into a Registration Rights Agreement (the “Registration Rights Agreement”) with each Investor, pursuant to which Banc of California, Inc. agreed to provide customary registration rights to the Investors and their affiliates and certain permitted transferees with respect to the shares of our common stock purchased under the Investment Agreements and the shares of Banc of California, Inc.’s common stock issued upon the conversion of shares of our NVCE stock purchased under the Warburg Investment Agreement or issued upon the exercise of the Warrants. Under the Registration Rights Agreement, the Investors will, following the Lock-Up Period, be entitled to S-3 shelf registration rights (or S-1 demand registration rights, if applicable), rights to request a certain number of underwritten shelf takedowns, as well as piggyback registration rights, in each case, subject to certain limitations as set forth in the Registration Rights Agreement.
The foregoing description of the Investment Agreements, the Registration Rights Agreement, the Warrants, and the transactions contemplated thereby are not complete and are qualified in their entirety by reference to the full text of the Investment Agreements, which are filed as Exhibits 10.1 and 10.2 to this Annual Report on Form 10-K, the Registration Rights Agreement, which is filed as Exhibit 10.3 to this Annual Report on Form 10-K, and the Warrants, which are filed as Exhibits 4.4 and 4.5 to this Annual Report on Form 10-K, and in each case incorporated by reference herein.
54
Repurchases of Common Stock
The following table presents stock repurchases we made during the fourth quarter of 2023:
| Total Number of | Maximum Dollar | ||||||||||||||||||||||
| Shares Purchased | Value of Shares | ||||||||||||||||||||||
| Total | as Part of | That May Yet | |||||||||||||||||||||
| Number of | Average | Publicly | Be Purchased | ||||||||||||||||||||
| Shares | Price Paid | Announced | Under the | ||||||||||||||||||||
| Purchase Dates | Purchased (1) | Per Share | Program (2) | Program (2) | |||||||||||||||||||
| (Dollars in thousands, except per share amounts) | |||||||||||||||||||||||
October 1 - October 31, 2023 | — | $ | — | — | $ | 13,852,812 | |||||||||||||||||
November 1 - November 30, 2023 | 2,971 | $ | 11.40 | — | $ | 13,852,812 | |||||||||||||||||
December 1 - December 31, 2023 | 9,445 | $ | 12.77 | — | $ | 13,852,812 | |||||||||||||||||
| Total | 12,416 | $ | 12.44 | — | |||||||||||||||||||
___________________________________
(1) Includes shares repurchased pursuant to net settlement by employees in satisfaction of income tax withholding obligations incurred through the vesting of Company stock awards.
(2) On February 9, 2023, the Company's Board of Directors approved a stock repurchase program to buy back shares of its common stock for an aggregate purchase price not to exceed $35 million, which expired on February 9, 2024.
Five-Year Stock Performance Graph
The following chart and related discussion are being furnished solely to accompany this Annual Report on Form 10-K pursuant to Item 201(e) of Regulation S-K and shall not be deemed to be “soliciting materials” or “filed” with the SEC (other than as provided in Item 201) nor shall this information be incorporated by reference into any future filing under the Securities Act or the Exchange Act, whether made before or after the date hereof and irrespective of any general incorporation language contained therein, except to the extent that we specifically incorporate it by reference into a filing.
The chart compares the yearly percentage change in the cumulative stockholder return on our common stock based on the closing price during the five years ended December 31, 2023, with (1) the Total Return Index for U.S. companies traded on The New York Stock Exchange (the “NYSE Composite Index”), (2) the Total Return Index for KBW NASDAQ Regional Bank Stocks (the “KBW NASDAQ Regional Banking Index”) and (3) the Total Return Index for bank constituents of the S&P United States Board Market Index that fall within the Western region of the U.S. (the "S&P U.S. BMI Banks - West Regional Index"). This comparison assumes $100 was invested on December 31, 2018, in our common stock and the comparison groups and assumes the reinvestment of all cash dividends prior to any tax effect and retention of all stock dividends. The Company's total cumulative return was 11.45% over the five year period ending December 31, 2023 compared to returns of 67.12%, 43.17% and 8.54% for the NYSE Composite Index, KBW NASDAQ Regional Banking Index and S&P U.S. BMI Banks - Western Region Index. The chart is historical only and may not be indicative of possible future performance.
55
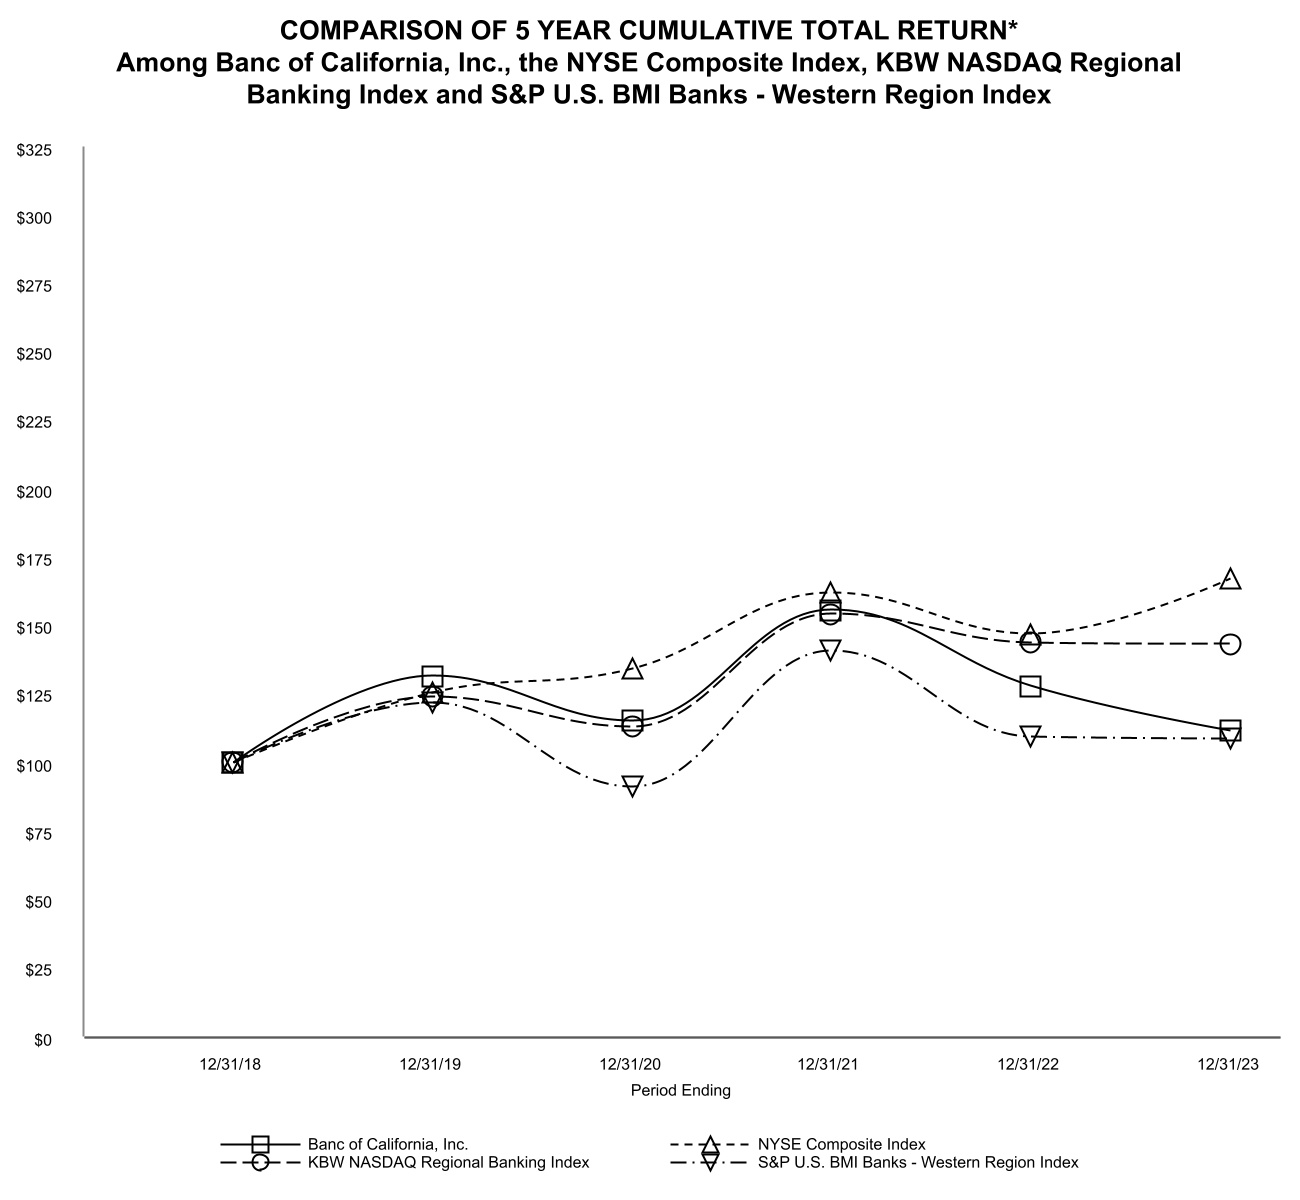
___________________________________
* $100 invested on December 31, 2018 in stock or index, including reinvestment of dividends.
| Year Ended December 31, | |||||||||||||||||||||||||||||||||||
| Index | 2018 | 2019 | 2020 | 2021 | 2022 | 2023 | |||||||||||||||||||||||||||||
| Banc of California, Inc. | $ | 100.00 | $ | 131.81 | $ | 115.24 | $ | 155.66 | $ | 128.16 | $ | 111.45 | |||||||||||||||||||||||
| NYSE Composite Index | 100.00 | 125.51 | 134.28 | 162.04 | 146.89 | 167.12 | |||||||||||||||||||||||||||||
| KBW NASDAQ Regional Banking Index | 100.00 | 123.81 | 113.03 | 154.45 | 143.75 | 143.17 | |||||||||||||||||||||||||||||
| S&P U.S. BMI Banks - Western Region Index | 100.00 | 121.94 | 91.26 | 140.71 | 109.19 | 108.54 | |||||||||||||||||||||||||||||
ITEM 6.
Reserved.
56
ITEM 7. MANAGEMENT'S DISCUSSION AND ANALYSIS OF FINANCIAL CONDITION AND RESULTS OF OPERATIONS
Overview
Banc of California, Inc., a Maryland corporation, was incorporated in March 2002 and serves as the holding company for its wholly owned subsidiary, Banc of California (the “Bank”), a California state-chartered bank and member of the FRB. When we refer to the “parent” or the “holding company", we are referring to Banc of California, Inc., the parent company, on a stand-alone basis. When we refer to “we,” “us,” “our,” or the “Company”, we are referring to Banc of California, Inc. and its consolidated subsidiaries including the Bank, collectively.
The Bank is a relationship-based community bank focused on providing business banking and treasury management services to small, middle-market, and venture-backed businesses. The Bank offers a broad range of loan and lease and deposit products and services through full-service branches throughout California and in Durham, North Carolina and Denver, Colorado, and loan production offices around the country.
Presentation of Results – PacWest Bancorp Merger
On November 30, 2023, PacWest Bancorp merged with and into Banc of California, Inc. (the “Merger” or "PACW Merger"), with Banc of California, Inc. continuing as the surviving legal corporation and Banc of California, Inc. concurrently closed a $400 million equity capital raise. The Merger was accounted for as a reverse merger using the acquisition method of accounting, therefore, PacWest Bancorp was deemed the acquirer for financial reporting purposes, even though Banc of California, Inc. was the legal acquirer. The Merger was an all-stock transaction and has been accounted for as a business combination. Banc of California, Inc.'s financial results for all periods ended prior to November 30, 2023 reflect PacWest Bancorp results only on a standalone basis. In addition, Banc of California, Inc.'s reported financial results for the year ended December 31, 2023 reflect PacWest Bancorp financial results only on a standalone basis until the closing of the Merger on November 30, 2023, and results of the combined company for the month of December 2023. The number of shares issued and outstanding, earnings per share, and all references to share quantities or metrics of Banc of California, Inc. have been retrospectively restated to reflect the equivalent number of shares issued in the Merger as the Merger was accounted for as a reverse merger. Under the reverse merger method of accounting, the assets and liabilities of legacy Banc of California, Inc. as of November 30, 2023 were recorded at their respective fair values.
The following table presents balance sheet data as of the dates indicated:
| December 31, | |||||||||||||||||
| 2023 | 2022 | 2021 | |||||||||||||||
| (In thousands) | |||||||||||||||||
| Balance Sheet Data: | |||||||||||||||||
| Total assets | $ | 38,534,064 | $ | 41,228,936 | $ | 40,443,344 | |||||||||||
| Interest-earning deposits in financial institutions | 5,175,149 | 2,027,949 | 3,944,686 | ||||||||||||||
| Securities available-for-sale | 2,346,864 | 4,843,487 | 10,694,458 | ||||||||||||||
| Securities held-to-maturity | 2,287,291 | 2,269,135 | — | ||||||||||||||
| Loans and leases held for investment, net of deferred fees | 25,612,444 | 28,674,205 | 22,941,548 | ||||||||||||||
| Goodwill | 198,627 | 1,376,736 | 1,405,736 | ||||||||||||||
| Core deposit and customer relationship intangibles | 165,477 | 31,381 | 44,957 | ||||||||||||||
| Total liabilities | 35,143,299 | 37,278,405 | 36,443,714 | ||||||||||||||
| Noninterest-bearing deposits | 7,774,254 | 11,212,357 | 14,543,133 | ||||||||||||||
| Interest-bearing deposits | 22,627,515 | 22,723,977 | 20,454,624 | ||||||||||||||
| Total deposits | 30,401,769 | 33,936,334 | 34,997,757 | ||||||||||||||
| Borrowings | 2,911,322 | 1,764,030 | — | ||||||||||||||
| Subordinated debt | 936,599 | 867,087 | 863,283 | ||||||||||||||
| Stockholders’ equity | 3,390,765 | 3,950,531 | 3,999,630 | ||||||||||||||
57
At December 31, 2023, the Company had total assets of $38.5 billion, including $25.6 billion of total loans and leases, net of deferred fees, and $2.3 billion of securities available-for-sale, $2.3 billion of securities held-to-maturity, and $5.2 billion of interest-earning deposits in financial institutions, compared to $41.2 billion of total assets, including $28.7 billion of total loans and leases, net of deferred fees, $4.8 billion of securities available-for-sale, $2.3 billion securities held-to-maturity, and $2.0 billion of interest-earning deposits in financial institutions at December 31, 2022. The $2.7 billion decrease in total assets since year-end 2022 was due primarily to a $3.1 billion decrease in loans and leases, net of deferred fees, and a $2.5 billion decrease in securities available-for-sale, offset partially by a $3.1 billion increase in interest-earning deposits in financial institutions. The decrease in loans and leases is mainly due to $5.2 billion of loan sales in the second quarter of 2023, partially offset by the loans acquired in the Company's merger with PacWest Bancorp (the "Merger"). The decrease in securities available-for-sale was due mainly to a $2.7 billion sale of securities in the fourth quarter of 2023 as part of our balance sheet repositioning strategy. Contributing to the increase in interest-earning deposits at financial institutions was the Company's desire to have more on-balance sheet liquidity in response to the deposit volatility caused by the failures of three regional banks in the first and second quarters of 2023.
At December 31, 2023, the Company had total liabilities of $35.1 billion, including total deposits of $30.4 billion and borrowings of $2.9 billion, compared to $37.3 billion of total liabilities, including $33.9 billion of total deposits and $1.8 billion borrowings at December 31, 2022. The $2.1 billion decrease in total liabilities since year-end 2022 was due mainly to decreases of $3.5 billion in total deposits, offset partially by an increase of $1.1 billion in borrowings. The decrease in total deposits was due to the loss of deposits during the period of volatility after the failures of three regional banks in 2023. The increase in borrowings was due to the Company's desire to have more on-balance sheet liquidity in response to the deposit volatility caused by the failures of three regional banks in the first and second quarters of 2023.
At December 31, 2023, the Company had total stockholders' equity of $3.39 billion compared to $3.95 billion at December 31, 2022. The $559.8 million decrease in stockholders' equity since year-end 2022 was due mainly to the net loss of $1.9 billion in 2023 attributable primarily to a $1.38 billion goodwill impairment charge in the first quarter of 2023, partially offset by an increase in accumulated other comprehensive income (loss) of $358.8 million attributable to an increase in the fair value of the investment securities portfolio and the shares issued as consideration for the Merger and the related $400 million capital raise.
Recent Events
PacWest Bancorp Merger
On November 30, 2023, Banc of California, Inc. completed the Merger, pursuant to which PacWest Bancorp merged with and into Banc of California, Inc., with Banc of California, Inc. continuing as the surviving legal corporation and, as of December 1, 2023, Banc of California, N.A. merged into Pacific Western Bank with Pacific Western Bank continuing under the Banc of California name and brand as the Bank. Concurrent with the completion of the Merger, Banc of California, Inc. also completed its $400 million equity raise from affiliates of funds managed by Warburg Pincus LLC and certain investment vehicles sponsored, managed, or advised by Centerbridge Partners, L.P. and its affiliates. The stock issued by Banc of California, Inc. as consideration in the Merger totaled approximately $663 million.
The Merger was accounted for as a reverse merger using the acquisition method of accounting, therefore, PacWest Bancorp was deemed the accounting acquirer, even though Banc of California, Inc. was the legal acquirer. We recorded the legacy Banc of California, Inc. acquired assets and assumed liabilities, both tangible and intangible, at their estimated fair values as of the acquisition date. The application of the acquisition method of accounting resulted in goodwill of $198.6 million. The Bank is headquartered in Los Angeles, California, and operates more than 90 branches in California, as well as branches in North Carolina and Colorado. We completed the Merger to, among other things, enhance our scale and presence in California and augment and diversify our sources of revenue. For further information, see Note 2. Business Combinations.
58
Balance Sheet Repositioning
In connection with the Merger, we also implemented our previously announced balance sheet repositioning strategy. From the announcement of the Merger on July 25, 2023, through the end of the year, the combined company, legacy PacWest Bancorp and legacy Banc of California, Inc., sold assets totaling $6.1 billion and completed the paydown of $8.6 billion of high-cost liabilities, which improved the mix of earning assets and reduced the amount of higher-cost funding. The sold assets included $3.9 billion of securities from both the legacy Banc of California, Inc. and PacWest Bancorp portfolios, and $1.5 billion of single-family loans and $0.7 billion of multi-family loans from the legacy Banc of California, Inc. portfolios. The liabilities that were paid down included $4.7 billion of borrowings and $3.9 billion of brokered deposits from both legacy entities.
Key Performance Indicators
Among other factors, our operating results generally depend on the following key performance indicators:
The Level of Net Interest Income
Net interest income is the excess of interest earned on our interest-earning assets over the interest paid on our interest-bearing liabilities. Net interest margin is net interest income (annualized if related to a quarterly period) expressed as a percentage of average interest-earning assets. Tax equivalent net interest income is net interest income increased by an adjustment for tax-exempt interest on certain loans and investment securities based on a 21% federal statutory tax rate. Tax equivalent net interest margin is calculated as tax equivalent net interest income divided by average interest-earning assets.
Net interest income is affected by changes in both interest rates and the volume of average interest-earning assets and interest-bearing liabilities. Our primary interest-earning assets are loans and investment securities, and our primary interest-bearing liabilities are deposits and borrowings. Contributing to our positive net interest margin is our healthy yield on loans and leases in excess of our core deposit costs. While our deposit balances will fluctuate depending on our customers’ liquidity and cash flow, market conditions, and competitive pressures, we seek to minimize the impact of these variances by attracting a high percentage of noninterest-bearing deposits. During 2023, our net interest margin was negatively impacted because we accessed the wholesale funding market to replace outflows of core deposits.
Loan and Lease Growth
We actively seek new lending opportunities under an array of lending products. Our lending activities include real estate mortgage loans, real estate construction and land loans, commercial loans and leases, and a small amount of consumer lending. Our commercial real estate loans and real estate construction loans are secured by a range of property types. Our commercial loans and leases portfolio is diverse and generally includes various asset-secured loans, equipment-secured loans and leases, venture capital loans to support venture capital firms’ operations and the operations of entrepreneurial and venture-backed companies during the various phases of their early life cycles, warehouse loans and secured business loans. During 2023, loan production slowed significantly compared to the prior year mainly due to the negative impact from the three regional bank failures and the need to accelerate the Company’s execution of its strategy to increase on-balance sheet liquidity and preserve capital.
Our loan origination process emphasizes credit quality. Historically, to augment our internal loan production, we have purchased loans such as multi-family loans from other banks, private student loans from third-party lenders, and in recent years , single-family residential mortgage loans. Prior to our acquisition of Civic in February 2021, we also purchased loans from Civic. These loan purchases help us manage the concentrations in our portfolio as they diversify the geographic risk, interest-rate risk, credit risk, and product composition of our loan portfolio. Achieving net loan growth is subject to many factors, including maintaining strict credit standards, competition from other lenders, and borrowers that opt to prepay loans.
59
The Magnitude of Credit Losses
We emphasize credit quality in originating and monitoring our loans and leases, and we measure our success by the levels of our classified loans and leases, nonaccrual loans and leases, and net charge-offs. We maintain an allowance for credit losses on loans and leases, which is the sum of the allowance for loan and lease losses and the reserve for unfunded loan commitments. Provisions for credit losses are charged to operations as and when needed for both on and off-balance sheet credit exposures. Loans and leases that are deemed uncollectable are charged off and deducted from the allowance for loan and lease losses. Recoveries on loans and leases previously charged off are added to the allowance for loan and lease losses. The provision for credit losses on the loan and lease portfolio is based on our allowance methodology, which considers the impact of assumptions and is reflective of historical experience, economic forecasts viewed to be reasonable and supportable by management, the current loan and lease composition, and relative credit risks known as of the balance sheet date. For originated and acquired credit-deteriorated loans, a provision for credit losses may be recorded to reflect credit deterioration after the origination date or after the acquisition date, respectively.
We regularly review loans and leases to determine whether there has been any deterioration in credit quality resulting from borrower operations or changes in collateral value or other factors which may affect collectability of our loans and leases. Changes in economic conditions, such as the rate of economic growth, the unemployment rate, rate of inflation, increases in the general level of interest rates, declines in real estate values, changes in commodity prices, and adverse conditions in borrowers’ businesses, could negatively impact our borrowers and cause us to adversely classify loans and leases. An increase in classified loans and leases generally results in increased provisions for credit losses and an increased allowance for credit losses. Any deterioration in the real estate market may lead to increased provisions for credit losses because our loans are concentrated in real estate loans.
The Level of Noninterest Expense
Our noninterest expense includes fixed and controllable overhead, and typically the largest components of which are compensation and occupancy expense. It also includes costs that tend to vary based on the volume of activity, such as loan and lease production and the number and complexity of foreclosed assets. We measure success in controlling both fixed and variable costs through monitoring of the efficiency ratio, which is calculated by dividing noninterest expense (less intangible asset amortization, net foreclosed assets expense (income), goodwill impairment, and acquisition, integration and reorganization costs) by net revenues (the sum of net interest income plus noninterest income, less gain (loss) on sale of securities and gain (loss) on sales of assets other than loans and leases).
The following table presents the calculation of our efficiency ratio for the years indicated:
| Year Ended December 31, | ||||||||||||||||||||
| Efficiency Ratio | 2023 | 2022 | 2021 | |||||||||||||||||
| (Dollars in thousands) | ||||||||||||||||||||
| Noninterest expense | $ | 2,458,181 | $ | 773,521 | $ | 637,417 | ||||||||||||||
| Less: | Intangible asset amortization | 11,419 | 13,576 | 12,734 | ||||||||||||||||
| Foreclosed assets expense (income), net | 1,520 | (3,737) | (213) | |||||||||||||||||
| Goodwill impairment | 1,376,736 | 29,000 | — | |||||||||||||||||
| Acquisition, integration and reorganization costs | 142,633 | 5,703 | 9,415 | |||||||||||||||||
| Noninterest expense used for efficiency ratio | $ | 925,873 | $ | 728,979 | $ | 615,481 | ||||||||||||||
| Net interest income | $ | 747,128 | $ | 1,290,762 | $ | 1,103,824 | ||||||||||||||
| Noninterest (loss) income | (448,285) | 74,827 | 193,927 | |||||||||||||||||
| Total revenue | 298,843 | 1,365,589 | 1,297,751 | |||||||||||||||||
| Less: | (Loss) gain on sale of securities | (442,413) | (50,321) | 1,615 | ||||||||||||||||
| Total revenue used for efficiency ratio | $ | 741,256 | $ | 1,415,910 | $ | 1,296,136 | ||||||||||||||
| Efficiency ratio | 124.91 | % | 51.48 | % | 47.49 | % | ||||||||||||||
60
Critical Accounting Policies and Estimates
The following discussion and analysis of financial condition and results of operations are based upon our consolidated financial statements and the notes thereto, which have been prepared in accordance with U.S. GAAP. The preparation of the consolidated financial statements requires us to make a number of estimates and assumptions that affect the reported amounts and disclosures in the consolidated financial statements. On an ongoing basis, we evaluate our estimates and assumptions based upon historical experience and various other factors and circumstances. We believe that our estimates and assumptions are reasonable; however, actual results may ultimately differ significantly from these estimates and assumptions, which could have a material adverse effect on the carrying value of assets and liabilities at the balance sheet dates and on our results of operations for the reporting periods.
Our significant accounting policies and practices are described in Note 1. Nature of Operations and Summary of Significant Accounting Policies of the Notes to Consolidated Financial Statements contained in "Item 8. Financial Statements and Supplementary Data." We have identified four policies and estimates as being critical because they require management to make particularly difficult, subjective, and/or complex judgments about matters that are inherently uncertain and because of the likelihood that materially different amounts would be reported under different conditions or using different assumptions. These policies relate to the allowance for credit losses on loans and leases held for investment, business combinations, the carrying value of goodwill and other intangible assets, and the realization of deferred tax assets and liabilities.
Allowance for Credit Losses on Loans and Leases Held for Investment
The ACL is estimated on a quarterly basis and represents management's estimate of current expected credit losses over the remaining expected life of the Company's financial assets measured at amortized cost, including loans and leases and certain lending-related commitments. The allowance for credit losses involves significant judgment on a number of matters including assessment of key credit risk characteristics, assignment of risk ratings, valuation of collateral, the determination of remaining expected life, incorporation of historical loss experience, and development and weighting of macroeconomic forecasts. For information regarding the calculation and policies of the ACL on loans and leases held for investment, see " - Balance Sheet Analysis - Allowance for Credit Losses on Loans and Leases Held for Investment" and Note 1(j). Nature of Operations and Summary of Significant Accounting Policies - Allowance for Credit Losses on Loans and Leases Held for Investment, of the Notes to Consolidated Financial Statements contained in "Item 8. Financial Statements and Supplementary Data."
A critical judgment in the process is estimating the Company's ACL related to macroeconomic forecasts that are incorporated into quantitative methods. As any one economic outlook is inherently uncertain, the Company utilizes a baseline and upside or downside scenarios which are applied based on a probability weighting, to better reflect management's expectation of expected credit losses given changes in the economic environment and existing market conditions. Changes in the Company's assumptions and economic forecasts could significantly affect its estimate of expected credit losses, which could potentially lead to significant changes in the estimate from one reporting period to the next. The ACL is also sensitive to changes in macroeconomic forecast assumptions. Given the dynamic relationship between macroeconomic variables within the Company's models, it is difficult to estimate the impact of a change in any one factor or input on the ACL. Management performs sensitivity analysis on the ACL quarterly both in terms of individual inputs being changed and the weighting of macroeconomic forecast scenarios being changed. This assists management with better understanding changes in the calculated ACL from period to period and helps us to conclude that the estimated ACL is reasonable and appropriate at each reporting date.
Business Combinations
Business combinations are accounted for using the acquisition method of accounting under ASC Topic 805, Business Combinations. Under the acquisition method, we measure the identifiable assets acquired, including identifiable intangible assets, and liabilities assumed in a business combination at their estimated fair values on the acquisition date. Goodwill is generally determined as the excess of the fair value of the consideration transferred, over the fair value of the net assets acquired and liabilities assumed as of the acquisition date. The fair value of other intangibles are determined utilizing information available near the acquisition date based on expectations and assumptions that are deemed reasonable by management. The estimates and assumptions used to determine the fair values of assets and liabilities acquired or assumed in a business combination can be complex and require judgment, as such, we typically engage third-party valuation specialists for significant items. Acquisition-related costs including severance, conversion and other restructuring charges, such as contract termination charges and abandoned space accruals, are expensed as period costs.
61
Goodwill and Other Intangible Assets
Goodwill and other intangible assets arise from the acquisition method of accounting for business combinations. For acquisitions, we are required to record the assets acquired, including identified intangible assets such as goodwill, and the liabilities assumed at their estimated fair value. These fair values often involve estimates based on third party valuations, such as appraisals, based on discounted cash flow analyses or other valuation techniques that may include estimates of attrition, discount rates, future growth rates, multiples of earnings or other relevant factors. Goodwill and other intangible assets generated from business combinations and deemed to have indefinite lives are not subject to amortization and instead are tested for impairment annually unless a triggering event occurs thereby requiring an updated assessment. Our regular annual impairment assessment occurs in the fourth quarter. Impairment exists when the carrying value of the goodwill exceeds its fair value. The determination of whether impairment has occurred is based on an assessment of several factors including operating results, business plans, economic projections, anticipated future cash flows, and current market data. Analyzing goodwill for impairment also includes consideration of various factors that continue to evolve and for which significant uncertainty remains, including estimates of the profitability of the Company's reporting units, long-term growth rates and the estimated market cost of equity, such as the discount rate and price multiples of comparable companies. Imprecision in estimating these factors can affect the estimated fair value of the reporting units. Certain events and circumstances could have a negative effect on the estimated fair value of the reporting units, including declines in business performance, increases in credit losses, as well as deterioration in economic or market conditions and adverse regulatory or legislative changes, which could result in a material impairment charge to earnings in a future period.
Deferred Tax Assets and Liabilities
We are subject to the income tax laws of the U.S., its states, and the municipalities in which we operate. These tax laws are complex and subject to different interpretations by the taxpayer and the relevant governing taxing authorities. Our tax returns are subject to audit by taxing authorities, which may result in the taxing authority disputing a tax position taken by the Company. Significant judgment is required in determining the tax accruals and in evaluating the tax positions, including evaluating uncertain tax positions. Changes in the estimate of accrued taxes occur periodically due to changes in tax rates, tax credits, interpretations of tax laws, the status of examinations by the taxing authorities, and newly enacted statutory, judicial, and regulatory guidance that could impact the relative merits and risks of tax positions. These changes, when they occur, impact tax expense and can materially affect our operating results and financial condition. We review income tax expense and the carrying value of deferred tax assets and liabilities quarterly, and as new information becomes available, the balances are adjusted as appropriate. In establishing a provision for income tax expense, we must make judgments and interpretations about the application of these inherently complex tax laws. We must also make estimates about when in the future certain tax items will affect taxable income in the various tax jurisdictions.
Our deferred tax assets and liabilities arise from differences between the financial statement carrying amounts of existing assets and liabilities and their respective tax bases and operating loss and tax credit carryforwards. Deferred tax assets and liabilities are measured using enacted tax rates expected to apply to taxable income in the years in which those temporary differences are expected to be recovered or settled. We determine whether a deferred tax asset is realizable based on facts and circumstances, including our current and projected future tax position, the historical level of our taxable income, and estimates of our future taxable income. In most cases, the realization of deferred tax assets is based on our future profitability. If we were to experience either reduced profitability or operating losses in a future period, the realization of our deferred tax assets may no longer be considered more likely than not and, accordingly, we could be required to record a valuation allowance on our deferred tax assets by charging earnings.
62
Non-GAAP Financial Measures
We use certain non‑GAAP financial measures to provide meaningful supplemental information regarding the Company’s operational performance and to enhance investors’ overall understanding of such financial performance. The methodology for determining these non-GAAP measures may differ among companies. We use the following non-GAAP measures in this Form 10-K:
•Return on average tangible common equity, tangible common equity to tangible assets ratio, and tangible book value per common share: Given that the use of these measures is prevalent among banking regulators, investors and analysts, we disclose them in addition to the related GAAP measures of return on average equity, equity to assets ratio, and book value per share, respectively. The reconciliations of these non-GAAP measures to the GAAP measures are presented in the following tables for and as of the years presented. Such disclosures should not be viewed as substitutes for results determined in accordance with GAAP, nor are they necessarily comparable to non-GAAP performance measures that may be presented by other companies.
| Year Ended December 31, | ||||||||||||||||||||
Return on Average Tangible Common Equity | 2023 | 2022 | 2021 | |||||||||||||||||
| (Dollars in thousands) | ||||||||||||||||||||
| Net (loss) earnings | $ | (1,899,137) | $ | 423,613 | $ | 606,959 | ||||||||||||||
| (Loss) earnings before income taxes | $ | (2,211,338) | $ | 567,568 | $ | 822,334 | ||||||||||||||
| Add: | Goodwill impairment | 1,376,736 | 29,000 | — | ||||||||||||||||
| Add: | Intangible asset amortization | 11,419 | 13,576 | 12,734 | ||||||||||||||||
| Adjusted (loss) earnings before income taxes | (823,183) | 610,144 | 835,068 | |||||||||||||||||
Adjusted income tax (benefit) expense (1) | (214,028) | 154,977 | 218,788 | |||||||||||||||||
| Adjusted net (loss) earnings | (609,155) | 455,167 | 616,280 | |||||||||||||||||
| Less: | Preferred stock dividends | 39,788 | 19,339 | — | ||||||||||||||||
| Adjusted net (loss) earnings available to | ||||||||||||||||||||
| common and equivalent stockholders | $ | (648,943) | $ | 435,828 | $ | 616,280 | ||||||||||||||
| Average stockholders' equity | $ | 2,994,428 | $ | 3,853,033 | $ | 3,808,019 | ||||||||||||||
| Less: | Average intangible assets | 379,005 | 1,443,528 | 1,269,546 | ||||||||||||||||
| Less: | Average preferred stock | 498,516 | 285,488 | — | ||||||||||||||||
| Average tangible common equity | $ | 2,116,907 | $ | 2,124,017 | $ | 2,538,473 | ||||||||||||||
Return on average equity (2) | (63.42) | % | 10.99 | % | 15.94 | % | ||||||||||||||
Return on average tangible common equity (3) | (30.66) | % | 20.52 | % | 24.48 | % | ||||||||||||||
____________________________________________________
(1) Adjusted estimated effective tax rate of 26.0% used to normalize the effect of goodwill impairment for the year ended December 31, 2023;
effective tax rate of 25.4% and 26.2% for the year ended December 31, 2022 and December 31, 2021.
(2) Adjusted net (loss) earnings divided by average stockholders' equity.
(3) Annualized adjusted net (loss) earnings available to common and equivalent stockholders divided by average tangible common equity.
63
| Tangible Common Equity to Tangible Assets and | December 31, | ||||||||||||||||
| Tangible Book Value Per Common Share | 2023 | 2022 | 2021 | ||||||||||||||
| (Dollars in thousands, except per share data) | |||||||||||||||||
| Stockholders’ equity | $ | 3,390,765 | $ | 3,950,531 | $ | 3,999,630 | |||||||||||
| Less: Preferred stock | 498,516 | 498,516 | — | ||||||||||||||
| Total common equity | 2,892,249 | 3,452,015 | 3,999,630 | ||||||||||||||
| Less: Intangible assets | 364,104 | 1,408,117 | 1,450,693 | ||||||||||||||
| Tangible common equity | $ | 2,528,145 | $ | 2,043,898 | $ | 2,548,937 | |||||||||||
| Total assets | $ | 38,534,064 | $ | 41,228,936 | $ | 40,443,344 | |||||||||||
| Less: Intangible assets | 364,104 | 1,408,117 | 1,450,693 | ||||||||||||||
| Tangible assets | $ | 38,169,960 | $ | 39,820,819 | $ | 38,992,651 | |||||||||||
| Total stockholders' equity to total assets ratio | 8.80 | % | 9.58 | % | 9.89 | % | |||||||||||
| Tangible common equity to tangible assets ratio | 6.62 | % | 5.13 | % | 6.54 | % | |||||||||||
Book value per common share (1)(4) | $ | 17.12 | $ | 43.71 | $ | 50.91 | |||||||||||
Tangible book value per common share (2)(4) | $ | 14.96 | $ | 25.88 | $ | 32.45 | |||||||||||
Common and equivalent shares outstanding (3)(4) | 168,959,063 | 78,973,869 | 78,555,291 | ||||||||||||||
_________________________________________________________________
(1) Total common equity divided by common and equivalent shares outstanding.
(2) Tangible common equity divided by common and equivalent shares outstanding.
(3) Common and equivalent shares outstanding include non-voting common stock equivalents that are participating securities.
(4) Common and equivalent shares outstanding in prior periods have been restated by multiplying the historical amounts by the Merger exchange ratio of 0.6569.
64
Adjusted Noninterest Income to Adjusted Total Revenue | Year Ended December 31, | |||||||||||||||||||
and Adjusted Noninterest Expense to Average Assets | 2023 | 2022 | 2021 | |||||||||||||||||
| (Dollars in thousands) | ||||||||||||||||||||
| Net interest income | $ | 747,128 | $ | 1,290,762 | $ | 1,103,824 | ||||||||||||||
| Noninterest (loss) income | (448,285) | 74,827 | 193,927 | |||||||||||||||||
| Total revenue | $ | 298,843 | $ | 1,365,589 | $ | 1,297,751 | ||||||||||||||
| Noninterest (loss) income | $ | (448,285) | $ | 74,827 | $ | 193,927 | ||||||||||||||
| Add: | Loss (gain) on sale of securities | 442,413 | 50,321 | (1,615) | ||||||||||||||||
| Less: | Legal recoveries | (22,087) | — | — | ||||||||||||||||
| Add: | Loan fair value loss adjustments | 170,971 | — | — | ||||||||||||||||
| Adjusted noninterest income | 143,012 | 125,148 | 192,312 | |||||||||||||||||
| Net interest income | 747,128 | 1,290,762 | 1,103,824 | |||||||||||||||||
| Adjusted total revenue | $ | 890,140 | $ | 1,415,910 | $ | 1,296,136 | ||||||||||||||
| Noninterest expense | $ | 2,458,181 | $ | 773,521 | $ | 637,417 | ||||||||||||||
| Less: | Goodwill impairment | (1,376,736) | (29,000) | — | ||||||||||||||||
| Less: | Acquisition, integration, and | |||||||||||||||||||
| reorganization costs | (142,633) | (5,703) | (9,415) | |||||||||||||||||
| Less: | Unfunded commitments fair value | |||||||||||||||||||
| loss adjustments | (106,767) | — | — | |||||||||||||||||
| Adjusted noninterest expense | $ | 832,045 | $ | 738,818 | $ | 628,002 | ||||||||||||||
| Average total assets | $ | 40,293,380 | $ | 40,481,581 | $ | 35,518,488 | ||||||||||||||
| Noninterest (loss) income to total revenue | (150.01) | % | 5.48 | % | 14.94 | % | ||||||||||||||
| Adjusted noninterest income to adjusted total | ||||||||||||||||||||
| revenue | 16.07 | % | 8.84 | % | 14.84 | % | ||||||||||||||
| Noninterest expense to average total assets | 6.10 | % | 1.91 | % | 1.79 | % | ||||||||||||||
| Adjusted noninterest expense to average | ||||||||||||||||||||
| total assets | 2.06 | % | 1.83 | % | 1.77 | % | ||||||||||||||
65
Results of Operations
Earnings Performance
The following table presents performance metrics for the years indicated:
| Year Ended December 31, | |||||||||||||||||
| 2023 | 2022 | 2021 | |||||||||||||||
| Earnings Summary: | |||||||||||||||||
| Interest income | $ | 1,971,000 | $ | 1,556,489 | $ | 1,158,729 | |||||||||||
| Interest expense | (1,223,872) | (265,727) | (54,905) | ||||||||||||||
| Net interest income | 747,128 | 1,290,762 | 1,103,824 | ||||||||||||||
| Provision for credit losses | (52,000) | (24,500) | 162,000 | ||||||||||||||
| Noninterest (loss) income | (448,285) | 74,827 | 193,927 | ||||||||||||||
| Operating expense | (938,812) | (738,818) | (628,002) | ||||||||||||||
| Acquisition, integration and reorganization costs | (142,633) | (5,703) | (9,415) | ||||||||||||||
| Goodwill impairment | (1,376,736) | (29,000) | — | ||||||||||||||
| (Loss) earnings before income taxes | (2,211,338) | 567,568 | 822,334 | ||||||||||||||
| Income tax benefit (expense) | 312,201 | (143,955) | (215,375) | ||||||||||||||
| Net (loss) earnings | (1,899,137) | 423,613 | 606,959 | ||||||||||||||
| Preferred stock dividends | (39,788) | (19,339) | — | ||||||||||||||
| Net (loss) earnings available to common and equivalent stockholders | $ | (1,938,925) | $ | 404,274 | $ | 606,959 | |||||||||||
| Per Common Share Data: | |||||||||||||||||
Diluted (loss) earnings per share (1) | $ | (22.71) | $ | 5.14 | $ | 7.76 | |||||||||||
Book value per share (1) | $ | 17.12 | $ | 43.71 | $ | 50.91 | |||||||||||
Tangible book value per share (2) | $ | 14.96 | $ | 25.88 | $ | 32.45 | |||||||||||
| Performance Ratios: | |||||||||||||||||
| Return on average assets | (4.71) | % | 1.05 | % | 1.71 | % | |||||||||||
Return on average tangible common equity (2) | (30.66) | % | 20.52 | % | 24.48 | % | |||||||||||
| Net interest margin (tax equivalent) | 1.98 | % | 3.49 | % | 3.40 | % | |||||||||||
| Yield on average loans and leases (tax equivalent) | 5.92 | % | 5.07 | % | 5.08 | % | |||||||||||
| Cost of average total deposits | 2.61 | % | 0.59 | % | 0.09 | % | |||||||||||
| Efficiency ratio | 124.91 | % | 51.48 | % | 47.49 | % | |||||||||||
| Capital Ratios (consolidated): | |||||||||||||||||
| Common equity tier 1 capital ratio | 10.14 | % | 8.70 | % | 8.86 | % | |||||||||||
| Tier 1 capital ratio | 12.44 | % | 10.61 | % | 9.32 | % | |||||||||||
| Total capital ratio | 16.43 | % | 13.61 | % | 12.69 | % | |||||||||||
| Tier 1 leverage capital ratio | 9.00 | % | 8.61 | % | 6.84 | % | |||||||||||
| Risk-weighted assets | $ | 27,338,852 | $ | 33,030,960 | $ | 28,508,808 | |||||||||||
_____________________________
(1) Shares include non-voting common stock equivalents that are participating securities.
(2) See "- Non-GAAP Financial Measures."
66
2023 Compared to 2022
Net loss available to common and equivalent stockholders for the year ended December 31, 2023 was $1.9 billion, or $22.71 per diluted share, compared to net earnings available to common stockholders for the year ended December 31, 2022 of $404.3 million, or $5.14 per diluted share. The $2.3 billion decrease in net earnings available to common and equivalent stockholders was due mainly to a goodwill impairment charge of $1.38 billion in the first quarter of 2023, lower net interest income of $543.6 million attributable to a lower NIM, lower noninterest income of $523.1 million, higher operating expense of $200.0 million, a higher provision for credit losses of $27.5 million, and higher preferred stock dividends of $20.4 million, offset partially by lower income tax expense of $456.2 million. The goodwill impairment charge was due to a decline in our stock price as a result of the market volatility caused by three bank failures in the first half of 2023. Net interest income decreased due mainly to higher interest expense on deposits and borrowings attributable primarily to higher market interest rates, offset partially by higher interest income on interest-earning assets due mostly to higher market rates. Noninterest income decreased due primarily to an increase of $392.1 million in loss on sale of securities and a $161.9 million increase in the loss on sale of loans and leases. The decrease in gain on sales of securities was due mainly to sales of $2.7 billion in the fourth quarter of 2023 for a net loss of $442.4 million. Such sales were done strategically with proceeds used to pay down FHLB borrowings and other high-cost fundings to improve the mix of interest-earning assets and interest-bearing liabilities of the Bank going forward. Operating expense increased due primarily to an increase of $110.2 million in insurance and assessments expense due to higher FDIC assessments, an increase of $68.8 million in customer related expense attributable mainly to higher customer analysis expenses related to higher earnings credit rates due to higher market interest rates, and a $136.9 million increase in acquisition and reorganization expense due to costs related to the Merger. The increase in the provision for credit losses was due to a $52.0 million provision for 2023 compared to a provision of $24.5 million for 2022. The increase in the provision for credit losses in 2023 was due primarily to the growth in loans and leases resulting from the Merger, an increase in net charge-offs, and management's expectation of a less favorable economic forecast. The increase in preferred stock dividends was due to a full year of dividends in 2023 compared to a partial year in 2022 following the legacy PacWest Bancorp preferred stock issuance on June 6, 2022. The decrease in income tax expense was due primarily to pre-tax losses incurred in 2023 compared to pre-tax earnings in 2022.
2022 Compared to 2021
Net earnings available for common stockholders for the year ended December 31, 2022 was $404.3 million, or $5.14 per diluted share, compared to net earnings available to common stockholders for the year ended December 31, 2021 of $607.0 million, or $7.76 per diluted share. The $202.7 million decrease in net earnings available to common stockholders was due mainly to a higher provision for credit losses of $186.5 million, lower noninterest income of $119.1 million, higher operating expense of $110.8 million, a goodwill impairment charge of $29.0 million in the fourth quarter of 2022, and higher preferred stock dividends of $19.3 million, offset partially by higher net interest income of $186.9 million and lower income tax expense of $71.4 million. The increase in the provision for credit losses was due to a $24.5 million provision for 2022 compared to a provision benefit of $162.0 million for 2021. The increase in the provision for credit losses in 2022 was due primarily to the growth in loans and leases and unfunded loan commitments and a less favorable economic forecast, offset partially by a decrease in qualitative reserves. The provision benefit in 2021 was due mainly to improvement in both macroeconomic forecast variables and loan portfolio credit quality metrics. Noninterest income decreased due primarily to reductions of $51.9 million in gain on sale of securities, $46.9 million in warrant income, and $26.5 million in dividends and gains (losses) on equity investments, with the latter two attributable mostly to a decrease in capital markets activity in 2022. The decrease in gain on sale of securities was due mainly to sales of $1.0 billion in the fourth quarter of 2022 for a net loss of $49.3 million. Such sales were done strategically with proceeds used to pay down FHLB borrowings and to improve the capital and liquidity position of the Bank going forward. Operating expense increased due primarily to an increase of $38.4 million in compensation expense and an increase of $34.8 million in customer related expense attributable mainly to higher customer analysis expenses. The increase in compensation expense was due mostly to the incremental expense of the higher headcount in 2022 from the acquired operations of Civic and the HOA Business in 2021, incremental additions to staff in certain business lines, and staff added to support our digital and innovation initiatives. The goodwill impairment charge related to Civic was the result of a strategy to restructure this lending subsidiary. The increase in preferred stock dividends was due to the legacy PacWest Bancorp preferred stock issuance on June 6, 2022. Net interest income increased due mainly to higher interest income on loans and leases and investment securities attributable primarily to higher average balances, offset partially by higher interest expense on interest-bearing liabilities due to higher rates and average balances. The decrease in income tax expense was due primarily to lower pre-tax earnings in 2022 compared to 2021.
67
Net Interest Income
The following table summarizes the distribution of average assets, liabilities, and stockholders’ equity, as well as interest income and yields earned on average interest‑earning assets and interest expense and rates paid on average interest‑bearing liabilities, presented on a tax equivalent basis, for the years indicated:
| Year Ended December 31, | |||||||||||||||||||||||||||||||||||||||||||||||||||||
| 2023 | 2022 | 2021 | |||||||||||||||||||||||||||||||||||||||||||||||||||
Interest | Yields | Interest | Yields | Interest | Yields | ||||||||||||||||||||||||||||||||||||||||||||||||
Average | Income/ | and | Average | Income/ | and | Average | Income/ | and | |||||||||||||||||||||||||||||||||||||||||||||
Balance | Expense | Rates | Balance | Expense | Rates | Balance | Expense | Rates | |||||||||||||||||||||||||||||||||||||||||||||
| (Dollars in thousands) | |||||||||||||||||||||||||||||||||||||||||||||||||||||
| ASSETS: | |||||||||||||||||||||||||||||||||||||||||||||||||||||
Loans and leases (1)(2)(3) | $ | 25,330,351 | $ | 1,498,701 | 5.92 | % | $ | 26,044,463 | $ | 1,320,449 | 5.07 | % | $ | 19,762,220 | $ | 1,003,027 | 5.08 | % | |||||||||||||||||||||||||||||||||||
Investment securities (3) | 6,827,059 | 174,996 | 2.56 | % | 9,120,717 | 215,624 | 2.36 | % | 7,486,009 | 162,102 | 2.17 | % | |||||||||||||||||||||||||||||||||||||||||
| Deposits in financial institutions | 5,746,858 | 299,647 | 5.21 | % | 2,185,585 | 34,158 | 1.56 | % | 5,692,338 | 8,804 | 0.15 | % | |||||||||||||||||||||||||||||||||||||||||
Total interest‑earning assets (1) | 37,904,268 | 1,973,344 | 5.21 | % | 37,350,765 | 1,570,231 | 4.20 | % | 32,940,567 | 1,173,933 | 3.56 | % | |||||||||||||||||||||||||||||||||||||||||
| Other assets | 2,389,112 | 3,130,816 | 2,577,921 | ||||||||||||||||||||||||||||||||||||||||||||||||||
| Total assets | $ | 40,293,380 | $ | 40,481,581 | $ | 35,518,488 | |||||||||||||||||||||||||||||||||||||||||||||||
| LIABILITIES AND | |||||||||||||||||||||||||||||||||||||||||||||||||||||
| STOCKHOLDERS’ EQUITY: | |||||||||||||||||||||||||||||||||||||||||||||||||||||
| Interest checking | $ | 6,992,888 | 220,735 | 3.16 | % | $ | 6,851,831 | 66,494 | 0.97 | % | $ | 7,198,646 | 8,709 | 0.12 | % | ||||||||||||||||||||||||||||||||||||||
| Money market | 6,724,296 | 190,027 | 2.83 | % | 10,601,028 | 95,376 | 0.90 | % | 8,843,122 | 12,993 | 0.15 | % | |||||||||||||||||||||||||||||||||||||||||
| Savings | 1,051,117 | 30,978 | 2.95 | % | 639,720 | 188 | 0.03 | % | 606,741 | 148 | 0.02 | % | |||||||||||||||||||||||||||||||||||||||||
| Time | 6,840,920 | 306,683 | 4.48 | % | 2,540,426 | 38,391 | 1.51 | % | 1,471,963 | 5,958 | 0.40 | % | |||||||||||||||||||||||||||||||||||||||||
| Total interest-bearing deposits | 21,609,221 | 748,423 | 3.46 | % | 20,633,005 | 200,449 | 0.97 | % | 18,120,472 | 27,808 | 0.15 | % | |||||||||||||||||||||||||||||||||||||||||
| Borrowings | 7,068,826 | 416,744 | 5.90 | % | 961,601 | 25,645 | 2.67 | % | 231,099 | 623 | 0.27 | % | |||||||||||||||||||||||||||||||||||||||||
| Subordinated debt | 875,621 | 58,705 | 6.70 | % | 863,883 | 39,633 | 4.59 | % | 733,163 | 26,474 | 3.61 | % | |||||||||||||||||||||||||||||||||||||||||
| Total interest‑bearing liabilities | 29,553,668 | 1,223,872 | 4.14 | % | 22,458,489 | 265,727 | 1.18 | % | 19,084,734 | 54,905 | 0.29 | % | |||||||||||||||||||||||||||||||||||||||||
Noninterest‑bearing demand | |||||||||||||||||||||||||||||||||||||||||||||||||||||
deposits | 7,072,334 | 13,601,766 | 12,110,193 | ||||||||||||||||||||||||||||||||||||||||||||||||||
| Other liabilities | 672,950 | 568,293 | 515,542 | ||||||||||||||||||||||||||||||||||||||||||||||||||
| Total liabilities | 37,298,952 | 36,628,548 | 31,710,469 | ||||||||||||||||||||||||||||||||||||||||||||||||||
| Stockholders’ equity | 2,994,428 | 3,853,033 | 3,808,019 | ||||||||||||||||||||||||||||||||||||||||||||||||||
| Total liabilities and | |||||||||||||||||||||||||||||||||||||||||||||||||||||
| stockholders' equity | $ | 40,293,380 | $ | 40,481,581 | $ | 35,518,488 | |||||||||||||||||||||||||||||||||||||||||||||||
Net interest income (1) | $ | 749,472 | $ | 1,304,504 | $ | 1,119,028 | |||||||||||||||||||||||||||||||||||||||||||||||
Net interest rate spread (1) | 1.07 | % | 3.02 | % | 3.27 | % | |||||||||||||||||||||||||||||||||||||||||||||||
Net interest margin (1) | 1.98 | % | 3.49 | % | 3.40 | % | |||||||||||||||||||||||||||||||||||||||||||||||
Total deposits (4) | $ | 28,681,555 | $ | 748,423 | 2.61 | % | $ | 34,234,771 | $ | 200,449 | 0.59 | % | $ | 30,230,665 | $ | 27,808 | 0.09 | % | |||||||||||||||||||||||||||||||||||
Total funds (5) | $ | 36,626,002 | $ | 1,223,872 | 3.34 | % | $ | 36,060,255 | $ | 265,727 | 0.74 | % | $ | 31,194,927 | $ | 54,905 | 0.18 | % | |||||||||||||||||||||||||||||||||||
_____________________
(1) Tax equivalent.
(2) Includes net loan discount accretion of $9.7 million for 2023 and net loan premium amortization of $17.9 million and $11.4 million for 2022 and 2021, respectively.
(3) Includes tax-equivalent adjustments of $2.3 million, $7.9 million, $6.6 million for the years ended 2023, 2022, and 2021, respectively, related to tax-exempt income on loans. Includes tax-equivalent adjustments of $0.0 million, $5.9 million, and $8.6 million for 2023, 2022, and 2021, respectively, related to tax-exempt income on investment securities. The federal statutory rate utilized was 21%.
(4) Total deposits is the sum of total interest-bearing deposits and noninterest-bearing demand deposits. The cost of total deposits is calculated as annualized interest expense on total deposits divided by average total deposits.
(5) Total funds is the sum of total interest-bearing liabilities and noninterest-bearing demand deposits. The cost of total funds is calculated as annualized total interest expense divided by average total funds.
68
Net interest income is affected by changes in both interest rates and the amounts of average interest‑earning assets and interest‑bearing liabilities. The changes in the yields earned on average interest‑earning assets and rates paid on average interest‑bearing liabilities are referred to as changes in “rate.” The changes in the amounts of average interest‑earning assets and interest‑bearing liabilities are referred to as changes in “volume.” The change in interest income/expense attributable to rate reflects the change in rate multiplied by the prior year’s volume. The change in interest income/expense attributable to volume reflects the change in volume multiplied by the prior year’s rate. The change in interest income/expense not attributable specifically to either rate or volume is allocated ratably between the two categories.
The following table presents changes in interest income (tax equivalent) and interest expense and related changes in rate and volume for the years indicated:
2023 Compared to 2022 | 2022 Compared to 2021 | ||||||||||||||||||||||||||||||||||
| Total | Increase (Decrease) | Total | Increase (Decrease) | ||||||||||||||||||||||||||||||||
| Increase | Due to | Increase | Due to | ||||||||||||||||||||||||||||||||
| (Decrease) | Rate | Volume | (Decrease) | Rate | Volume | ||||||||||||||||||||||||||||||
| (In thousands) | |||||||||||||||||||||||||||||||||||
| Interest Income: | |||||||||||||||||||||||||||||||||||
Loans and leases (1) | $ | 178,252 | $ | 215,431 | $ | (37,179) | $ | 317,422 | $ | (1,975) | $ | 319,397 | |||||||||||||||||||||||
Investment securities (1) | (40,628) | 17,047 | (57,675) | 53,522 | 15,318 | 38,204 | |||||||||||||||||||||||||||||
| Deposits in financial institutions | 265,489 | 156,500 | 108,989 | 25,354 | 33,668 | (8,314) | |||||||||||||||||||||||||||||
Total interest income (1) | 403,113 | 388,978 | 14,135 | 396,298 | 47,011 | 349,287 | |||||||||||||||||||||||||||||
| Interest Expense: | |||||||||||||||||||||||||||||||||||
| Interest checking deposits | 154,241 | 152,848 | 1,393 | 57,785 | 58,222 | (437) | |||||||||||||||||||||||||||||
| Money market deposits | 94,651 | 140,477 | (45,826) | 82,383 | 79,233 | 3,150 | |||||||||||||||||||||||||||||
| Savings deposits | 30,790 | 30,588 | 202 | 40 | 36 | 4 | |||||||||||||||||||||||||||||
| Time deposits | 268,292 | 144,192 | 124,100 | 32,433 | 25,708 | 6,725 | |||||||||||||||||||||||||||||
| Total interest-bearing deposits | 547,974 | 468,105 | 79,869 | 172,641 | 163,199 | 9,442 | |||||||||||||||||||||||||||||
| Borrowings | 391,099 | 62,576 | 328,523 | 25,022 | 18,458 | 6,564 | |||||||||||||||||||||||||||||
| Subordinated debt | 19,072 | 18,524 | 548 | 13,159 | 7,942 | 5,217 | |||||||||||||||||||||||||||||
| Total interest expense | 958,145 | 549,205 | 408,940 | 210,822 | 189,599 | 21,223 | |||||||||||||||||||||||||||||
Net interest income (1) | $ | (555,032) | $ | (160,227) | $ | (394,805) | $ | 185,476 | $ | (142,588) | $ | 328,064 | |||||||||||||||||||||||
_____________________
(1) Tax equivalent.
2023 Compared to 2022
Net interest income decreased by $543.6 million to $747.1 million for the year ended December 31, 2023 compared to $1.3 billion for the year ended December 31, 2022 due mainly to higher funding costs from higher market interest rates, changes in the balance sheet mix, and the enhanced liquidity management strategies in the first half of 2023 due to the operating environment. The net interest margin decreased by 151 basis points to 1.98% as the cost of average total funds increased by 260 basis points, while the yield on average interest-earning assets increased by 101 basis points. The yield on average interest-earning assets increased by 101 basis points to 5.21% for the year ended December 31, 2023 from 4.20% for the same period in 2022 due mainly to higher market interest rates, partially offset by the changes in the mix of average interest-earning assets. The yield on average loans and leases increased by 85 basis points to 5.92% for 2023 from 5.07% for 2022. The yield on average investment securities increased by 20 basis points to 2.56% for the same period. Average loans and leases represented 67% of average interest-earning assets for the year ended December 31, 2023 compared to 70% for the year ended December 31, 2022. Average loans and leases decreased by $714.1 million due mainly to loan sales during the year to increase liquidity to fund potential deposit outflows.
69
The cost of average total funds increased by 260 basis points to 3.34% for the year ended December 31, 2023 from 0.74% for year ended December 31, 2022 due mainly to higher market rates and changes in the balance sheet mix. The cost of average total deposits increased by 202 basis points to 2.61% for the year ended December 31, 2023 compared to the same period in 2022. The cost of average interest-bearing liabilities increased by 296 basis points to 4.14% for the year ended December 31, 2023 compared to 1.18% for the same period in 2022, driven primarily by a 249 basis point increase in the cost of average interest-bearing deposits to 3.46% from 0.97% for the same period in 2022. The increase in the cost of these funding sources was due mainly to the impact of higher market interest rates. Average noninterest-bearing deposits decreased by $6.5 billion for the year ended December 31, 2023 compared to the same period in 2022 and average total deposits decreased by $5.6 billion. Average noninterest-bearing deposits represented 25% of total average deposits for the year ended December 31, 2023 compared to 40% for the same period in 2022.
2022 Compared to 2021
Net interest income increased by $186.9 million to $1.3 billion for the year ended December 31, 2022 compared to $1.1 billion for the year ended December 31, 2021 due mainly to higher interest income on loans and leases and investment securities, offset partially by higher interest expense. The increase in interest income on loans and leases was attributable to a higher average balance, offset partially by a lower yield on average loans and leases. The tax equivalent yield on average loans and leases decreased slightly to 5.07% for 2022 from 5.08% for 2021 due mainly to higher amortized fees in 2021 resulting from the significant fees from PPP loans in 2021, offset partially by higher market rates in 2022. Amortized fees added approximately 21 basis points to loan yields in 2022 and 38 basis points to loan yields in 2021. The increase in interest income on investment securities was due to a higher average balance and higher yield on average investment securities. The increase in interest expense was due to a higher cost and balance of average interest-bearing liabilities.
The tax equivalent NIM for the year ended December 31, 2022 was 3.49% compared to 3.40% for the year ended December 31, 2021. The increase in the tax equivalent NIM was due mostly to the change in the mix of average interest-earning assets. The change in the mix of average interest-earning assets was due to the increase in the balance of average loans and leases as a percentage of average interest-earning assets from 60% to 70%, the increase in the balance of average investment securities as a percentage of average interest-earning assets from 23% to 24%, and the decrease in the balance of average deposits in financial institutions as a percentage of average interest-earning assets from 17% to 6%. The balance of average loans and leases increased by $6.3 billion, the balance of average investment securities increased by $1.6 billion, and the balance of average deposits in financial institutions declined by $3.5 billion.
The cost of average total deposits increased to 0.59% for the year ended December 31, 2022 from 0.09% for the year ended December 31, 2021 due mainly to higher market rates on our deposit products and higher average balances and rates on higher-cost wholesale and brokered time deposits. Average wholesale and brokered time deposits increased by $1.5 billion to $2.8 billion for 2022 from $1.3 billion for 2021.
70
Provision for Credit Losses
The following table sets forth the details of the provision for credit losses on loans and leases held for investment and held-to-maturity debt securities as well as information regarding credit quality metrics for the years indicated:
| Year Ended December 31, | |||||||||||||||||||||||||||||
| Increase | Increase | ||||||||||||||||||||||||||||
| 2023 | (Decrease) | 2022 | (Decrease) | 2021 | |||||||||||||||||||||||||
| (Dollars in thousands) | |||||||||||||||||||||||||||||
| Provision For Credit Losses: | |||||||||||||||||||||||||||||
| Addition to (reduction in) allowance for | |||||||||||||||||||||||||||||
| loan and lease losses | $ | 113,500 | $ | 108,500 | $ | 5,000 | $ | 154,500 | $ | (149,500) | |||||||||||||||||||
| Addition to (reduction in) reserve for | |||||||||||||||||||||||||||||
| unfunded loan commitments | (61,500) | (79,500) | 18,000 | 30,500 | (12,500) | ||||||||||||||||||||||||
| Total loan-related provision | 52,000 | 29,000 | 23,000 | 185,000 | (162,000) | ||||||||||||||||||||||||
| Addition to allowance for held-to-maturity securities | — | (1,500) | 1,500 | 1,500 | — | ||||||||||||||||||||||||
| Total provision for credit losses | $ | 52,000 | $ | 27,500 | $ | 24,500 | $ | 186,500 | $ | (162,000) | |||||||||||||||||||
| Credit Quality Metrics: | |||||||||||||||||||||||||||||
| Net charge-offs (recoveries) on loans and leases | |||||||||||||||||||||||||||||
held for investment (1) | $ | 58,168 | $ | 53,336 | $ | 4,832 | $ | 6,715 | $ | (1,883) | |||||||||||||||||||
| Net charge-offs (recoveries) to average | |||||||||||||||||||||||||||||
| loans and leases | 0.23 | % | 0.02 | % | (0.01) | % | |||||||||||||||||||||||
| At year-end: | |||||||||||||||||||||||||||||
| Allowance for credit losses | $ | 311,258 | $ | 19,455 | $ | 291,803 | $ | 18,168 | $ | 273,635 | |||||||||||||||||||
| Allowance for credit losses to loans and leases | |||||||||||||||||||||||||||||
| held for investment | 1.22 | % | 1.02 | % | 1.19 | % | |||||||||||||||||||||||
| Allowance for credit losses to nonaccrual loans | |||||||||||||||||||||||||||||
| and leases held for investment | 497.80 | % | 281.18 | % | 447.31 | % | |||||||||||||||||||||||
| Nonaccrual loans and leases held for investment | $ | 62,527 | $ | (41,251) | $ | 103,778 | $ | 42,604 | $ | 61,174 | |||||||||||||||||||
| Nonaccrual loans and leases held for investment | |||||||||||||||||||||||||||||
| to loans and leases held for investment | 0.25 | % | 0.36 | % | 0.27 | % | |||||||||||||||||||||||
______________________
(1) See "- Balance Sheet Analysis - Allowance for Credit Losses on Loans and Leases Held for Investment" for detail of charge-offs and recoveries by loan portfolio segment, class, and subclass for the years presented.
Provisions for credit losses are charged to earnings for both on and off‑balance sheet credit exposures. The provisions for credit losses on our loans and leases held for investment and held-to-maturity debt securities are based on our allowance methodologies and are expenses that, in our judgment, are required to maintain an adequate allowance for credit losses for both assets held at amortized cost.
2023 Compared to 2022
The provision for credit losses increased by $27.5 million to a provision of $52.0 million for the year ended December 31, 2023 compared to a provision of $24.5 million for the year ended December 31, 2022. During 2023, the $52.0 million loan-related provision included a $113.5 million provision for loan losses due primarily to the growth in loans and leases resulting from the Merger, an increase in net charge-offs, and management's expectation of a less favorable economic forecast, offset partially by a $61.5 million reversal of the provision for credit losses related to lower unfunded loan commitments. The provision for loan losses in 2023 included an initial provision of $22.2 million for acquired legacy Banc of California non-PCD loans. The provision for credit losses on loans was $23.0 million during the year ended December 31, 2022, and included a $5.0 million provision for loan losses due primarily to the growth in loans and leases and a less favorable economic forecast, offset partially by a decrease in qualitative reserves, and an $18.0 million provision related to higher unfunded loan commitments.
71
2022 Compared to 2021
The provision for credit losses increased by $186.5 million to a provision of $24.5 million for the year ended December 31, 2022 compared to a provision benefit of $162.0 million for the year ended December 31, 2021. During 2022, the $23.0 million loan-related provision was due primarily to the growth in loans and leases and unfunded loan commitments and a less favorable economic forecast, offset partially by a decrease in qualitative reserves. We also recorded a $1.5 million provision on held-to-maturity securities related to the $2.3 billion transfer from available-for-sale securities during the second quarter of 2022 and the estimated current expected credit loss on those held-to-maturity securities. During 2021, a provision benefit was recorded as a result of improvement in both macro-economic forecast variables and loan portfolio credit quality metrics offset partially by increased provisions for unfunded loan commitments and loan growth.
Certain circumstances may lead to increased provisions for credit losses on loans and leases in the future. Examples of such circumstances are an increased amount of classified and/or nonaccrual loans and leases, net loan and lease and unfunded commitment growth, and changes in economic conditions and forecasts. Changes in economic conditions and forecasts include the rate of economic growth, the unemployment rate, the rate of inflation, changes in the general level of interest rates, changes in real estate values, and adverse conditions in borrowers’ businesses.
For information regarding the allowance for credit losses on loans and leases held for investment, see - “Balance Sheet Analysis - Allowance for Credit Losses on Loans and Leases Held for Investment,” Note 1(j). Nature of Operations and Summary of Significant Accounting Policies - Allowance for Credit Losses on Loans and Leases Held for Investment, and Note 5. Loans and Leases of the Notes to Consolidated Financial Statements contained in “Item 8. Financial Statements and Supplementary Data.”
For information regarding the allowance for credit losses on held-to-maturity debt securities, see Note 1(g). Nature of Operations and Summary of Significant Accounting Policies - Allowance for Credit Losses on Held-to-Maturity Debt Securities, and Note 4. Investment Securities of the Notes to Consolidated Financial Statements contained in “Item 8. Financial Statements and Supplementary Data.”
Noninterest (Loss) Income
The following table summarizes noninterest (loss) income by category for the years indicated:
| Year Ended December 31, | |||||||||||||||||||||||||||||
| Increase | Increase | ||||||||||||||||||||||||||||
| Noninterest (Loss) Income | 2023 | (Decrease) | 2022 | (Decrease) | 2021 | ||||||||||||||||||||||||
| (In thousands) | |||||||||||||||||||||||||||||
| Leased equipment income | $ | 63,167 | $ | 12,581 | $ | 50,586 | $ | 4,840 | $ | 45,746 | |||||||||||||||||||
| Other commissions and fees | 38,086 | (5,549) | 43,635 | 1,348 | 42,287 | ||||||||||||||||||||||||
| Service charges on deposit accounts | 16,468 | 2,477 | 13,991 | 722 | 13,269 | ||||||||||||||||||||||||
| (Loss) gain on sale of loans and leases | (161,346) | (161,864) | 518 | (1,215) | 1,733 | ||||||||||||||||||||||||
| (Loss) gain on sale of securities | (442,413) | (392,092) | (50,321) | (51,936) | 1,615 | ||||||||||||||||||||||||
| Dividends and gains (losses) on equity investments | 15,731 | 19,120 | (3,389) | (26,504) | 23,115 | ||||||||||||||||||||||||
| Warrant (loss) income | (718) | (3,208) | 2,490 | (46,851) | 49,341 | ||||||||||||||||||||||||
| LOCOM HFS adjustment | (8,461) | (8,461) | — | — | — | ||||||||||||||||||||||||
| Other income | 31,201 | 13,884 | 17,317 | 496 | 16,821 | ||||||||||||||||||||||||
| Total noninterest (loss) income | $ | (448,285) | $ | (523,112) | $ | 74,827 | $ | (119,100) | $ | 193,927 | |||||||||||||||||||
2023 Compared to 2022
Noninterest income decreased by $523.1 million to a loss of $448.3 million for the year ended December 31, 2023 compared to $74.8 million for the year ended December 31, 2022 due mainly to a $392.1 million increase in the loss on the sale of securities and a $161.9 million increase in the loss on the sale of loans, offset partially by higher dividends and gains from equity investments, higher leased equipment income, and higher other income primarily from legal settlements totaling $22.1 million.
72
2022 Compared to 2021
Noninterest income decreased by $119.1 million to $74.8 million for the year ended December 31, 2022 compared to $193.9 million for the year ended December 31, 2021 due mainly to decreases of $51.9 million in gain on sale of securities, $46.9 million in warrant income, and $26.5 million in dividends and gains on equity investments, with the declines in the latter two items due to decreased capital market activity in 2022 and volatility in equity markets resulting from geopolitical tensions and inflationary pressures. The decrease in gain on sale of securities was due mainly to sales of $1.0 billion in the fourth quarter of 2022 for a net loss of $49.3 million. Such sales were done strategically with proceeds used to pay down FHLB borrowings and to improve the capital and liquidity position of the Bank going forward. The decrease in dividends and gains on equity investments was due primarily to lower gains on sales of equity investments, offset partially by higher fair value gains on equity investments still held. Warrant income decreased due principally to fewer gains from exercised warrants, driven by less capital market activity in 2022.
Noninterest Expense
The following table summarizes noninterest expense by category for the years indicated:
| Year Ended December 31, | |||||||||||||||||||||||||||||
| Increase | Increase | ||||||||||||||||||||||||||||
| Noninterest Expense | 2023 | (Decrease) | 2022 | (Decrease) | 2021 | ||||||||||||||||||||||||
| (In thousands) | |||||||||||||||||||||||||||||
| Compensation | $ | 332,353 | $ | (74,486) | $ | 406,839 | $ | 38,389 | $ | 368,450 | |||||||||||||||||||
| Insurance and assessments | 135,666 | 110,180 | 25,486 | 8,121 | 17,365 | ||||||||||||||||||||||||
| Customer related expense | 124,104 | 68,831 | 55,273 | 34,769 | 20,504 | ||||||||||||||||||||||||
| Occupancy | 61,668 | 704 | 60,964 | 2,542 | 58,422 | ||||||||||||||||||||||||
| Data processing | 44,252 | 6,075 | 38,177 | 7,900 | 30,277 | ||||||||||||||||||||||||
| Leased equipment depreciation | 34,243 | (1,415) | 35,658 | (97) | 35,755 | ||||||||||||||||||||||||
| Other professional services | 24,623 | (5,655) | 30,278 | 8,786 | 21,492 | ||||||||||||||||||||||||
| Loan expense | 20,458 | (4,114) | 24,572 | 7,541 | 17,031 | ||||||||||||||||||||||||
| Intangible asset amortization | 11,419 | (2,157) | 13,576 | 842 | 12,734 | ||||||||||||||||||||||||
| Other | 150,026 | 102,031 | 47,995 | 2,023 | 45,972 | ||||||||||||||||||||||||
| Total operating expense | 938,812 | 199,994 | 738,818 | 110,816 | 628,002 | ||||||||||||||||||||||||
| Acquisition, integration and reorganization costs | 142,633 | 136,930 | 5,703 | (3,712) | 9,415 | ||||||||||||||||||||||||
| Goodwill impairment | 1,376,736 | 1,347,736 | 29,000 | 29,000 | — | ||||||||||||||||||||||||
| Total noninterest expense | $ | 2,458,181 | $ | 1,684,660 | $ | 773,521 | $ | 136,104 | $ | 637,417 | |||||||||||||||||||
2023 Compared to 2022
Noninterest expense increased by $1.7 billion to $2.5 billion for the year ended December 31, 2023 compared to $773.5 million for the year ended December 31, 2022. The increase was due mainly to higher (i) goodwill impairment of $1.35 billion, (ii) acquisition, integration and reorganization costs of $136.9 million, (iii) regulatory assessments of $110.2 million due to the special FDIC assessment of $32.7 million and the generally-applicable FDIC increased assessment rates in 2023, (iv) customer related expense of $68.8 million, and (v) other expenses of $102.0 million, including $106.8 million of unfunded commitments fair value loss adjustments related to loan sales, offset partially by lower compensation expense of $74.5 million.
73
2022 Compared to 2021
Noninterest expense increased by $136.1 million to $773.5 million for the year ended December 31, 2022 compared to $637.4 million for the year ended December 31, 2021 due in part to a goodwill impairment charge of $29.0 million incurred in the fourth quarter of 2022 related to Civic. Excluding the goodwill impairment charge and acquisition, integration and reorganization costs, noninterest expense increased by $110.8 million to $738.8 million in 2022. This increase was due mainly to increases of $38.4 million in compensation expense, $34.8 million in customer related expense, $8.8 million in other professional services, and $8.1 million in insurance and assessments. The increase in compensation was due mostly to the incremental expense of the higher headcount in 2022 from the acquired operations of Civic and the HOA Business in 2021, incremental additions to staff in certain business lines, and staff added to support our digital and innovation initiatives. The increase in customer related expense was attributable mainly to higher customer analysis expenses. The increase in other professional services was due mainly to issuance costs of the credit-linked notes transaction in September 2022. The increase in insurance and assessments expense was due to higher FDIC assessment expense attributable to downward trends in core deposits and capital levels in the first half of 2022 resulting in a higher assessment rate.
Income Taxes
The effective tax rates were 14.1%, 25.4%, and 26.2% for the years ended December 31, 2023, 2022, and 2021. Excluding non-deductible goodwill impairment, the effective income tax rate was 26.2% for the year ended December 31, 2023. The lower effective tax rate in 2023 was due mainly to the effect of the non-deductible goodwill impairment. The decrease in the effective tax rate for 2022 compared to the 26.2% rate for 2021 was due mainly to a change in the apportionment of taxable income for state taxes in 2022. The Company's 2023 blended statutory tax rate for federal and state was 28.1%. For further information on income taxes, see Note 16. Income Taxes of the Notes to Consolidated Financial Statements contained in “Item 8. Financial Statements and Supplementary Data.”
74
Balance Sheet Analysis
Securities Available-for-Sale
The following table presents the composition and durations of our securities available-for-sale as of the dates indicated:
| December 31, | |||||||||||||||||||||||||||||||||||||||||||||||||||||
| 2023 | 2022 | 2021 | |||||||||||||||||||||||||||||||||||||||||||||||||||
| Fair | % of | Duration | Fair | % of | Duration | Fair | % of | Duration | |||||||||||||||||||||||||||||||||||||||||||||
| Security Type | Value | Total | (in years) | Value | Total | (in years) | Value | Total | (in years) | ||||||||||||||||||||||||||||||||||||||||||||
| (Dollars in thousands) | |||||||||||||||||||||||||||||||||||||||||||||||||||||
| Agency residential MBS | $ | 1,187,609 | 51 | % | 8.2 | $ | 2,242,042 | 46 | % | 7.6 | $ | 2,898,210 | 27 | % | 2.9 | ||||||||||||||||||||||||||||||||||||||
| Agency residential CMOs | 284,334 | 12 | % | 4.4 | 457,063 | 9 | % | 4.4 | 1,038,134 | 10 | % | 3.2 | |||||||||||||||||||||||||||||||||||||||||
| Corporate debt securities | 267,232 | 11 | % | 1.9 | 311,905 | 7 | % | 2.7 | 527,094 | 5 | % | 4.2 | |||||||||||||||||||||||||||||||||||||||||
| Agency commercial MBS | 253,306 | 11 | % | 3.4 | 487,606 | 10 | % | 4.7 | 1,688,967 | 16 | % | 5.2 | |||||||||||||||||||||||||||||||||||||||||
| Private label residential CMOs | 158,412 | 7 | % | 7.7 | 166,724 | 4 | % | 5.6 | 264,417 | 2 | % | 3.9 | |||||||||||||||||||||||||||||||||||||||||
| Collateralized loan obligations | 108,416 | 5 | % | 0.1 | 102,261 | 2 | % | — | 385,362 | 4 | % | 0.1 | |||||||||||||||||||||||||||||||||||||||||
| Municipal securities | 28,083 | 1 | % | 4.5 | 339,326 | 7 | % | 5.6 | 2,315,968 | 22 | % | 7.7 | |||||||||||||||||||||||||||||||||||||||||
| Private label commercial MBS | 20,813 | 1 | % | 2.1 | 26,827 | 1 | % | 2.3 | 450,217 | 4 | % | 7.5 | |||||||||||||||||||||||||||||||||||||||||
| Asset-backed securities | 19,952 | 1 | % | — | 22,413 | — | % | — | 129,547 | 1 | % | 0.1 | |||||||||||||||||||||||||||||||||||||||||
| SBA securities | 13,739 | — | % | 3.2 | 17,250 | — | % | 2.5 | 29,644 | — | % | 3.7 | |||||||||||||||||||||||||||||||||||||||||
| U.S. Treasury securities | 4,968 | — | % | 0.1 | 670,070 | 14 | % | 4.9 | 966,898 | 9 | % | 6.6 | |||||||||||||||||||||||||||||||||||||||||
| Total securities | |||||||||||||||||||||||||||||||||||||||||||||||||||||
| available-for-sale | $ | 2,346,864 | 100 | % | 5.9 | $ | 4,843,487 | 100 | % | 5.9 | $ | 10,694,458 | 100 | % | 4.8 | ||||||||||||||||||||||||||||||||||||||
Effective June 1, 2022, the Company transferred $2.3 billion in fair value of municipal securities, agency commercial MBS, private label commercial MBS, U.S. Treasury securities, and corporate debt securities from available-for-sale to held-to-maturity. The unrealized losses on the transferred securities are being amortized over the expected remaining life of the securities in a manner consistent with the amortization of a premium or discount.
75
The following table presents a summary of contractual rates and contractual maturities of our securities available‑for‑sale as of the date indicated:
| Due After | Due After | ||||||||||||||||||||||||||||||||||||||||||||||||||||||||||
| Due | One Year | Five Years | |||||||||||||||||||||||||||||||||||||||||||||||||||||||||
| Within | Through | Through | Due After | ||||||||||||||||||||||||||||||||||||||||||||||||||||||||
| One Year | Five Years | Ten Years | Ten Years | Total | |||||||||||||||||||||||||||||||||||||||||||||||||||||||
| Fair | Fair | Fair | Fair | Fair | |||||||||||||||||||||||||||||||||||||||||||||||||||||||
| December 31, 2023 | Value | Rate(1) | Value | Rate(1) | Value | Rate(1) | Value | Rate(1) | Value | Rate(1) | |||||||||||||||||||||||||||||||||||||||||||||||||
| (Dollars in thousands) | |||||||||||||||||||||||||||||||||||||||||||||||||||||||||||
| Agency residential MBS | $ | — | — | % | $ | — | — | % | $ | — | — | % | $ | 1,187,609 | 3.35 | % | $ | 1,187,609 | 3.35 | % | |||||||||||||||||||||||||||||||||||||||
| Agency residential CMOs | — | — | % | — | — | % | 33,480 | 3.75 | % | 250,854 | 3.93 | % | 284,334 | 3.91 | % | ||||||||||||||||||||||||||||||||||||||||||||
| Corporate debt securities | — | — | % | 4,850 | 7.22 | % | 262,382 | 5.73 | % | — | — | % | 267,232 | 5.76 | % | ||||||||||||||||||||||||||||||||||||||||||||
| Agency commercial MBS | — | — | % | 157,087 | 3.15 | % | 79,600 | 3.30 | % | 16,619 | 3.69 | % | 253,306 | 3.24 | % | ||||||||||||||||||||||||||||||||||||||||||||
| Private label residential CMOs | — | — | % | — | — | % | — | — | % | 158,412 | 3.13 | % | 158,412 | 3.13 | % | ||||||||||||||||||||||||||||||||||||||||||||
| Collateralized loan obligations | — | — | % | — | — | % | 79,867 | 7.68 | % | 28,549 | 7.65 | % | 108,416 | 7.67 | % | ||||||||||||||||||||||||||||||||||||||||||||
| Municipal securities | — | — | % | 6,991 | 3.62 | % | 21,092 | 3.45 | % | — | — | % | 28,083 | 3.49 | % | ||||||||||||||||||||||||||||||||||||||||||||
| Private label commercial MBS | — | — | % | — | — | % | 1,283 | 4.24 | % | 19,530 | 2.98 | % | 20,813 | 3.06 | % | ||||||||||||||||||||||||||||||||||||||||||||
| Asset-backed securities | — | — | % | — | — | % | — | — | % | 19,952 | 6.59 | % | 19,952 | 6.59 | % | ||||||||||||||||||||||||||||||||||||||||||||
| SBA securities | — | — | % | 2,534 | 2.95 | % | — | — | % | 11,205 | 3.17 | % | 13,739 | 3.13 | % | ||||||||||||||||||||||||||||||||||||||||||||
| U.S. Treasury securities | 4,968 | — | % | — | — | % | — | — | % | — | — | % | 4,968 | — | % | ||||||||||||||||||||||||||||||||||||||||||||
| Total securities | |||||||||||||||||||||||||||||||||||||||||||||||||||||||||||
| available-for-sale | $ | 4,968 | — | % | $ | 171,462 | 3.28 | % | $ | 477,704 | 5.41 | % | $ | 1,692,730 | 3.53 | % | $ | 2,346,864 | 3.88 | % | |||||||||||||||||||||||||||||||||||||||
_______________________________________
(1) Rates presented are weighted average rates. Rates on tax-exempt securities are contractual rates and are not presented on a tax-equivalent basis.
Securities Held-to-Maturity
The following table presents the composition and durations of our securities held-to-maturity as of the dates indicated:
| December 31, 2023 | December 31, 2022 | ||||||||||||||||||||||||||||||||||
| Amortized | % of | Duration | Amortized | % of | Duration | ||||||||||||||||||||||||||||||
| Security Type | Cost | Total | (in years) | Cost | Total | (in years) | |||||||||||||||||||||||||||||
| (Dollars in thousands) | |||||||||||||||||||||||||||||||||||
| Municipal securities | $ | 1,247,310 | 55 | % | 8.1 | 1,243,443 | 55 | % | 9.0 | ||||||||||||||||||||||||||
| Agency commercial MBS | 433,827 | 19 | % | 6.8 | 427,411 | 19 | % | 7.5 | |||||||||||||||||||||||||||
| Private label commercial MBS | 350,493 | 15 | % | 6.3 | 345,825 | 15 | % | 7.1 | |||||||||||||||||||||||||||
| U.S. Treasury securities | 187,033 | 8 | % | 6.7 | 184,162 | 8 | % | 7.5 | |||||||||||||||||||||||||||
| Corporate debt securities | 70,128 | 3 | % | 4.4 | 69,794 | 3 | % | 5.8 | |||||||||||||||||||||||||||
| Total securities held-to-maturity | $ | 2,288,791 | 100 | % | 7.4 | $ | 2,270,635 | 100 | % | 8.2 | |||||||||||||||||||||||||
76
The following table shows the geographic composition of the majority of our held-to-maturity municipal securities portfolio as of the date indicated:
| December 31, 2023 | |||||||||||
| Amortized | % of | ||||||||||
| Municipal Securities by State | Cost | Total | |||||||||
| (Dollars in thousands) | |||||||||||
| California | $ | 310,539 | 25 | % | |||||||
| Texas | 276,349 | 22 | % | ||||||||
| Washington | 189,466 | 15 | % | ||||||||
| Oregon | 78,937 | 6 | % | ||||||||
| Maryland | 64,660 | 5 | % | ||||||||
| Georgia | 55,362 | 4 | % | ||||||||
| Colorado | 48,946 | 4 | % | ||||||||
| Minnesota | 35,017 | 3 | % | ||||||||
| Tennessee | 30,939 | 3 | % | ||||||||
| Florida | 21,967 | 2 | % | ||||||||
| Total of ten largest states | 1,112,182 | 89 | % | ||||||||
| All other states | 135,128 | 11 | % | ||||||||
| Total municipal securities held-to-maturity | $ | 1,247,310 | 100 | % | |||||||
The following table presents a summary of contractual rates and contractual maturities of our securities held-to-maturity as of the date indicated:
| Due After | Due After | ||||||||||||||||||||||||||||||||||||||||||||||||||||||||||
| Due | One Year | Five Years | |||||||||||||||||||||||||||||||||||||||||||||||||||||||||
| Within | Through | Through | Due After | ||||||||||||||||||||||||||||||||||||||||||||||||||||||||
| One Year | Five Years | Ten Years | Ten Years | Total | |||||||||||||||||||||||||||||||||||||||||||||||||||||||
| Amortized | Amortized | Amortized | Amortized | Amortized | |||||||||||||||||||||||||||||||||||||||||||||||||||||||
| December 31, 2023 | Cost | Rate(1) | Cost | Rate(1) | Cost | Rate(1) | Cost | Rate(1) | Cost | Rate(1) | |||||||||||||||||||||||||||||||||||||||||||||||||
| (Dollars in thousands) | |||||||||||||||||||||||||||||||||||||||||||||||||||||||||||
| Municipal securities | $ | — | — | % | $ | — | — | % | $ | 390,724 | 2.14 | % | $ | 856,586 | 3.53 | % | $ | 1,247,310 | 3.10 | % | |||||||||||||||||||||||||||||||||||||||
| Agency commercial MBS | — | — | % | — | — | % | 433,827 | 2.04 | % | — | — | % | 433,827 | 2.04 | % | ||||||||||||||||||||||||||||||||||||||||||||
| Private label commercial MBS | — | — | % | — | — | % | 36,407 | 3.00 | % | 314,086 | 2.78 | % | 350,493 | 2.80 | % | ||||||||||||||||||||||||||||||||||||||||||||
| U.S. Treasury securities | — | — | % | — | — | % | 187,033 | 1.26 | % | — | — | % | 187,033 | 1.26 | % | ||||||||||||||||||||||||||||||||||||||||||||
| Corporate debt securities | — | — | % | — | — | % | 10,191 | 6.28 | % | 59,937 | 4.89 | % | 70,128 | 5.10 | % | ||||||||||||||||||||||||||||||||||||||||||||
| Total securities | |||||||||||||||||||||||||||||||||||||||||||||||||||||||||||
| held-to-maturity | $ | — | — | % | $ | — | — | % | $ | 1,058,182 | 2.02 | % | $ | 1,230,609 | 3.41 | % | $ | 2,288,791 | 2.76 | % | |||||||||||||||||||||||||||||||||||||||
_______________________________________
(1) Rates presented are weighted average rates. Rates on tax-exempt securities are contractual rates and are not presented on a tax-equivalent basis.
77
Loans and Leases Held for Investment
The following table presents the composition of our total loans and leases held for investment, net of deferred fees, by loan portfolio segment, class, and subclass as of the dates indicated:
| December 31, | |||||||||||||||||||||||||||||||||||
| 2023 | 2022 | 2021 | |||||||||||||||||||||||||||||||||
% of | % of | % of | |||||||||||||||||||||||||||||||||
| Balance | Total | Balance | Total | Balance | Total | ||||||||||||||||||||||||||||||
| (Dollars in thousands) | |||||||||||||||||||||||||||||||||||
| Real Estate Mortgage: | |||||||||||||||||||||||||||||||||||
| Commercial real estate | $ | 3,874,804 | 15 | % | $ | 2,537,629 | 9 | % | $ | 2,545,517 | 11 | % | |||||||||||||||||||||||
| SBA program | 632,110 | 3 | % | 621,187 | 2 | % | 623,579 | 3 | % | ||||||||||||||||||||||||||
| Hotel | 519,583 | 2 | % | 688,015 | 2 | % | 593,203 | 3 | % | ||||||||||||||||||||||||||
| Total commercial real estate mortgage | 5,026,497 | 20 | % | 3,846,831 | 13 | % | 3,762,299 | 17 | % | ||||||||||||||||||||||||||
| Multi-family | 6,025,179 | 23 | % | 5,607,865 | 20 | % | 3,916,317 | 17 | % | ||||||||||||||||||||||||||
| Residential mortgage | 2,754,176 | 11 | % | 2,902,088 | 10 | % | 2,449,693 | 11 | % | ||||||||||||||||||||||||||
| Investor-owned residential | 2,234,531 | 9 | % | 2,886,828 | 10 | % | 1,050,411 | 4 | % | ||||||||||||||||||||||||||
| Residential renovation | 71,602 | — | % | 486,712 | 2 | % | 422,445 | 2 | % | ||||||||||||||||||||||||||
| Total other residential real estate | 5,060,309 | 20 | % | 6,275,628 | 22 | % | 3,922,549 | 17 | % | ||||||||||||||||||||||||||
| Total real estate mortgage | 16,111,985 | 63 | % | 15,730,324 | 55 | % | 11,601,165 | 51 | % | ||||||||||||||||||||||||||
| Real Estate Construction and Land: | |||||||||||||||||||||||||||||||||||
| Commercial | 759,585 | 3 | % | 898,592 | 3 | % | 832,591 | 4 | % | ||||||||||||||||||||||||||
| Residential | 2,399,684 | 9 | % | 3,253,580 | 11 | % | 2,182,091 | 9 | % | ||||||||||||||||||||||||||
Total real estate construction and land (1) | 3,159,269 | 12 | % | 4,152,172 | 14 | % | 3,014,682 | 13 | % | ||||||||||||||||||||||||||
| Total real estate | 19,271,254 | 75 | % | 19,882,496 | 69 | % | 14,615,847 | 64 | % | ||||||||||||||||||||||||||
| Commercial: | |||||||||||||||||||||||||||||||||||
| Lender finance | 486,966 | 2 | % | 3,172,814 | 11 | % | 2,617,712 | 11 | % | ||||||||||||||||||||||||||
| Equipment finance | 736,275 | 3 | % | 908,141 | 3 | % | 681,266 | 3 | % | ||||||||||||||||||||||||||
| Premium finance | 732,162 | 3 | % | 861,006 | 3 | % | 586,267 | 3 | % | ||||||||||||||||||||||||||
| Other asset-based | 233,682 | 1 | % | 198,248 | 1 | % | 190,232 | 1 | % | ||||||||||||||||||||||||||
| Total asset-based | 2,189,085 | 9 | % | 5,140,209 | 18 | % | 4,075,477 | 18 | % | ||||||||||||||||||||||||||
| Equity fund loans | 662,732 | 3 | % | 1,356,428 | 5 | % | 1,707,143 | 7 | % | ||||||||||||||||||||||||||
| Venture lending | 783,630 | 3 | % | 676,874 | 2 | % | 613,450 | 3 | % | ||||||||||||||||||||||||||
| Total venture capital | 1,446,362 | 6 | % | 2,033,302 | 7 | % | 2,320,593 | 10 | % | ||||||||||||||||||||||||||
| Secured business loans | 614,120 | 2 | % | 347,660 | 1 | % | 486,088 | 2 | % | ||||||||||||||||||||||||||
| Warehouse lending | 554,940 | 2 | % | — | — | % | — | — | % | ||||||||||||||||||||||||||
| Paycheck Protection Program | 8,183 | — | % | 10,192 | — | % | 156,699 | 1 | % | ||||||||||||||||||||||||||
| Other lending | 952,617 | 4 | % | 750,599 | 3 | % | 829,194 | 3 | % | ||||||||||||||||||||||||||
| Total other commercial | 2,129,860 | 8 | % | 1,108,451 | 4 | % | 1,471,981 | 6 | % | ||||||||||||||||||||||||||
| Total commercial | 5,765,307 | 23 | % | 8,281,962 | 29 | % | 7,868,051 | 34 | % | ||||||||||||||||||||||||||
| Consumer | 453,126 | 2 | % | 444,671 | 2 | % | 457,650 | 2 | % | ||||||||||||||||||||||||||
| Total loans and leases held for investment, | |||||||||||||||||||||||||||||||||||
| net of deferred fees | $ | 25,489,687 | 100 | % | $ | 28,609,129 | 100 | % | $ | 22,941,548 | 100 | % | |||||||||||||||||||||||
| Total unfunded loan commitments | $ | 5,578,907 | $ | 11,110,264 | $ | 9,006,350 | |||||||||||||||||||||||||||||
________________________________
(1) Includes $228.9 million, $153.5 million, and $151.8 million, at December 31, 2023, 2022, and 2021 of land acquisition and development loans.
78
Our loan portfolio segments of real estate mortgage loans, real estate construction and land loans, and commercial loans comprised 63%, 12%, and 23% of our total loans and leases held for investment at December 31, 2023, compared to 55%, 14%, and 29% at December 31, 2022, respectively.
The changes during 2023 in the portfolio classes comprising these portfolio segments reflected the following:
•Commercial real estate mortgage loans increased by 31% to $5.0 billion or 20% of total loans and leases held for investment at December 31, 2023 from $3.8 billion or 13% at December 31, 2022. The higher balance was attributable primarily to the balances acquired in the Merger.
•Multi-family real estate mortgage loans increased by 7% to $6.0 billion or 23% of total loans and leases held for investment at December 31, 2023 from $5.6 billion or 20% at December 31, 2022. The higher balance was attributable primarily to the balances acquired in the Merger.
•Other residential real estate mortgage loans decreased by 19% to $5.1 billion or 20% of total loans and leases held for investment at December 31, 2023 from $6.3 billion or 22% at December 31, 2022. The decrease was attributable primarily to investor-owned residential loans (Civic) decreasing by $652.3 million or 23% and residential renovation loans (Civic) decreasing by $415.1 million or 85% due to loan sales and runoff during 2023.
•Commercial real estate construction and land loans decreased by 15% to $759.6 million or 3% of total loans and leases held for investment at December 31, 2023 from $898.6 million or 3% at December 31, 2022 due to the construction loan sale in June 2023.
•Residential real estate construction and land loans decreased by 26% to $2.4 billion or 9% of total loans and leases held for investment at December 31, 2023 from $3.3 billion or 11% at December 31, 2022 due to the construction loan sale in June 2023.
•Asset-based loans and leases decreased by 57% to $2.2 billion or 9% of total loans and leases held for investment at December 31, 2023 from $5.1 billion or 18% at December 31, 2022. The lower balance was attributable primarily to the balance of lender finance loans decreasing by 85% to $487.0 million at December 31, 2023 from $3.2 billion at December 31, 2022. This decrease was due mainly to sales in connection with the Company's strategic plan to divest this non-core loan portfolio.
•Venture capital loans decreased by 29% to $1.4 billion or 6% of total loans and leases held for investment at December 31, 2023 from $2.0 billion or 7% at December 31, 2022. The lower balance was attributable primarily to lower equity fund loans, which decreased by $693.7 million to $662.7 million at December 31, 2023 from $1.4 billion at December 31, 2022 attributable to less venture capital activity during 2023 than 2022.
•Other commercial loans increased by 92% to $2.1 billion or 8% of total loans and leases held for investment at December 31, 2023 from $1.1 billion or 4% at December 31, 2022. The higher balance was attributable primarily to the warehouse lending portfolio added in connection with the Merger with a balance of $554.9 million at December 31, 2023, as well as other lending increasing by 27% to $1.0 billion at December 31, 2023 from $750.6 million at December 31, 2022, and secured business loans increasing by 77% to $614.1 million at December 31, 2023 from $347.7 million at December 31, 2022.
79
The following table presents the geographic composition of our real estate loans held for investment, net of deferred fees, by the top ten states and all other states combined (in the order presented for the current year-end) as of the dates indicated:
| December 31, | |||||||||||||||||||||||
| 2023 | 2022 | ||||||||||||||||||||||
% of | % of | ||||||||||||||||||||||
| Real Estate Loans by State | Balance | Total | Balance | Total | |||||||||||||||||||
| (Dollars in thousands) | |||||||||||||||||||||||
| California | $ | 12,262,311 | 64 | % | $ | 10,832,550 | 55 | % | |||||||||||||||
| Colorado | 1,167,659 | 6 | % | 1,029,284 | 5 | % | |||||||||||||||||
| Texas | 878,538 | 5 | % | 933,280 | 5 | % | |||||||||||||||||
| Florida | 837,467 | 4 | % | 1,360,163 | 7 | % | |||||||||||||||||
| Arizona | 719,299 | 4 | % | 572,951 | 3 | % | |||||||||||||||||
| Washington | 533,931 | 3 | % | 689,873 | 3 | % | |||||||||||||||||
| Nevada | 411,020 | 2 | % | 511,485 | 3 | % | |||||||||||||||||
| Oregon | 348,166 | 2 | % | 442,353 | 2 | % | |||||||||||||||||
| Georgia | 257,763 | 1 | % | 361,577 | 2 | % | |||||||||||||||||
| Tennessee | 225,166 | 1 | % | 247,926 | — | % | |||||||||||||||||
| Total of 10 largest states | 17,641,320 | 92 | % | 16,981,442 | 85 | % | |||||||||||||||||
| All other states | 1,629,934 | 8 | % | 2,901,054 | 15 | % | |||||||||||||||||
| Total real estate loans held for investment, net of deferred fees | $ | 19,271,254 | 100 | % | $ | 19,882,496 | 100 | % | |||||||||||||||
At December 31, 2023 and 2022, 64% and 55% of our real estate loans were collateralized by property located in California because our full-service branches and our community banking activities are primarily located in California.
The following table presents a roll forward of loans and leases held for investment, net of deferred fees, for the years indicated:
| Roll Forward of Loans and Leases Held for Investment, | Year Ended December 31, | ||||||||||||||||
Net of Deferred Fees (1) | 2023 | 2022 | 2021 | ||||||||||||||
| (Dollars in thousands) | |||||||||||||||||
| Balance, beginning of year | $ | 28,609,129 | $ | 22,941,548 | $ | 19,083,377 | |||||||||||
| Additions: | |||||||||||||||||
| Production | 951,465 | 8,435,396 | 9,054,767 | ||||||||||||||
| Disbursements | 5,485,138 | 7,058,553 | 5,952,158 | ||||||||||||||
| Total production and disbursements | 6,436,603 | 15,493,949 | 15,006,925 | ||||||||||||||
| Reductions: | |||||||||||||||||
| Payoffs | (4,490,009) | (4,909,797) | (7,337,296) | ||||||||||||||
| Paydowns | (2,998,257) | (4,755,033) | (3,728,950) | ||||||||||||||
| Total payoffs and paydowns | (7,488,266) | (9,664,830) | (11,066,246) | ||||||||||||||
Sales | (3,299,857) | (63,263) | (117,263) | ||||||||||||||
| Transfers to foreclosed assets | (20,915) | (7,985) | (1,062) | ||||||||||||||
| Charge-offs | (63,428) | (14,037) | (10,715) | ||||||||||||||
| Transfers to loans held for sale | (3,162,615) | (76,253) | (25,554) | ||||||||||||||
| Total reductions | (14,035,081) | (9,826,368) | (11,220,840) | ||||||||||||||
| Transfers from loans held for sale | 513,914 | — | — | ||||||||||||||
| Loans acquired through merger and acquisition | 3,965,122 | — | 72,086 | ||||||||||||||
| Net (decrease) increase | (3,119,442) | 5,667,581 | 3,858,171 | ||||||||||||||
| Balance, end of year | $ | 25,489,687 | $ | 28,609,129 | $ | 22,941,548 | |||||||||||
80
Loan and Lease Interest Rate Sensitivity
The following table presents contractual maturity information for loans and leases held for investment, net of deferred fees, as of the date indicated:
| Due After | |||||||||||||||||||||||||||||
| Due | One Year | Due After | |||||||||||||||||||||||||||
| Within | Through | Five to | Due After | ||||||||||||||||||||||||||
| December 31, 2023 | One Year | Five Years | 15 Years | 15 Years | Total | ||||||||||||||||||||||||
| (In thousands) | |||||||||||||||||||||||||||||
| Real estate mortgage | $ | 1,428,103 | $ | 2,527,795 | $ | 3,842,822 | $ | 8,313,265 | $ | 16,111,985 | |||||||||||||||||||
| Real estate construction and land | 1,402,663 | 1,352,843 | 8,459 | 395,304 | 3,159,269 | ||||||||||||||||||||||||
| Commercial | 2,415,675 | 2,301,464 | 814,438 | 233,730 | 5,765,307 | ||||||||||||||||||||||||
| Consumer | 11,748 | 53,622 | 227,205 | 160,551 | 453,126 | ||||||||||||||||||||||||
| Total loans and leases held for | |||||||||||||||||||||||||||||
| investment, net of deferred fees | $ | 5,258,189 | $ | 6,235,724 | $ | 4,892,924 | $ | 9,102,850 | $ | 25,489,687 | |||||||||||||||||||
At December 31, 2023, we had $5.3 billion of loans and leases held for investment due to mature over the next twelve months. For any loan modifications made to these borrowers, an assessment of whether the borrower is experiencing financial difficulty is made on the date of the modification. Loans are assessed to determine whether the modification constitutes a new loan or a continuation of the existing loan. Depending on the terms of the modification and nature of the borrower, this may result in a downgrade or placing the loan on nonaccrual status, which in turn would impact the loan’s classification within the ALLL. Because the effect of most modifications made to borrowers experiencing financial difficulty is already included in the ALLL because of the measurement methodologies used to estimate the allowance, a change to the ALLL is generally not recorded upon modification.
The following table presents the interest rate profile of loans and leases held for investment, net of deferred fees, due after one year as of the date indicated:
| Due After One Year | |||||||||||||||||
| Fixed | Variable | ||||||||||||||||
| December 31, 2023 | Rate | Rate | Total | ||||||||||||||
| (In thousands) | |||||||||||||||||
| Real estate mortgage | $ | 6,290,552 | $ | 8,393,330 | $ | 14,683,882 | |||||||||||
| Real estate construction and land | 872,241 | 884,365 | 1,756,606 | ||||||||||||||
| Commercial | 1,751,985 | 1,597,647 | 3,349,632 | ||||||||||||||
| Consumer | 432,279 | 9,099 | 441,378 | ||||||||||||||
| Total | $ | 9,347,057 | $ | 10,884,441 | $ | 20,231,498 | |||||||||||
For information regarding our variable-rate loans subject to interest rate floors, see "Item 7A. Quantitative and Qualitative Disclosures About Market Risk."
81
Non-Core Loan Portfolios
The following table presents non-core loan portfolio information at December 31, 2023, where we have ceased making new originations and will allow these loans to repay upon maturity:
| December 31, 2023 | |||||||||||||||||||||||
| Weighted | |||||||||||||||||||||||
| Average | |||||||||||||||||||||||
| % of | Weighted | Remaining | |||||||||||||||||||||
| Total | Average | Life | |||||||||||||||||||||
| Non-Core Loan Portfolio | Balance | Loans | Rate (1) | (In Years) | |||||||||||||||||||
| (Dollars in millions) | |||||||||||||||||||||||
| Civic | $ | 2,306 | 9.0 | % | 6.2 | % | 27.6 | ||||||||||||||||
| Premium Finance | 732 | 2.9 | % | 3.4 | % | 6.1 | |||||||||||||||||
| Lender Finance | 447 | 1.8 | % | 9.3 | % | 2.0 | |||||||||||||||||
| Student | 367 | 1.4 | % | 6.1 | % | 27.7 | |||||||||||||||||
| National Lending | 25 | 0.1 | % | 9.0 | % | 3.3 | |||||||||||||||||
| Total | $ | 3,877 | 15.2 | % | 6.0 | % | 20.4 | ||||||||||||||||
________________________________
(1) Weighted average rate excludes loan fees and accretion.
Allowance for Credit Losses on Loans and Leases Held for Investment
The allowance for credit losses on loans and leases held for investment is the combination of the allowance for loan and lease losses and the reserve for unfunded loan commitments. The allowance for loan and lease losses is reported as a reduction of the amortized cost basis of loans and leases, while the reserve for unfunded loan commitments is included within "Accrued interest payable and other liabilities" on the consolidated balance sheets. The amortized cost basis of loans and leases does not include accrued interest receivable, which is included in "Other assets" on the consolidated balance sheets. The "Provision for credit losses" on the consolidated statements of earnings (loss) is a combination of the provision for loan and lease losses, the provision for unfunded loan commitments, and the provision for held-to-maturity debt securities.
Under the CECL methodology, expected credit losses reflect losses over the remaining contractual life of an asset, considering the effect of prepayments and available information about the collectability of cash flows, including information about relevant historical experience, current conditions, and reasonable and supportable forecasts of future events and circumstances. Thus, the CECL methodology incorporates a broad range of information in developing credit loss estimates.
For further information regarding the calculation of the allowance for credit losses on loans and leases held for investment using the CECL methodology, see Note 1(j). Nature of Operations and Summary of Significant Accounting Policies - Allowance for Credit Losses on Loans and Leases Held for Investment of the Notes to Consolidated Financial Statements contained in "Item 8. Financial Statements and Supplementary Data."
In calculating our allowance for credit losses, we continued to consider: (a) inflation rates, higher interest rates, the risk of a recession, technical or otherwise, and global conflicts as well as any trailing impact of the COVID-19 pandemic in our process for estimating expected credit losses given the changes in economic forecasts and assumptions along with (b) the uncertainty related to the severity and duration of the economic consequences resulting from such events. Our methodology and framework along with the 4-quarter reasonable and supportable forecast period and 2-quarter reversion period have remained consistent since the implementation of CECL on January 1, 2020. Certain management assumptions are reassessed every quarter based on current expectations for credit losses, while other assumptions are assessed and updated on at least an annual basis.
82
During the second half of 2022, we switched from using the Moody’s Consensus Forecast scenario to using a multiple scenario approach primarily to better address the inherent forecast uncertainty in calculating quantitative reserves. In the fourth quarter of 2023, we used the Moody’s December 2023 Baseline, S2 Downside 75th Percentile, and S7 Next-Cycle Recession forecast scenarios for the calculation of our quantitative component. The weightings of the scenarios were based on management’s current expectation for a mild near-term recession, while acknowledging inherent uncertainty. Additionally, in order to consider the impact of higher interest rates, the prepayment rates applied in the quantitative calculation were reduced based on the slowing trend of loan payoffs and paydowns since the Federal Reserve began increasing interest rates in March 2022. The increased weighting on recessionary scenarios and lower prepayment rates compared to the prior quarters resulted in an increase to the allowance for credit losses.
As part of our allowance for credit losses methodology, we consistently incorporate the use of qualitative factors in determining the overall allowance for credit losses to capture risks that may not be adequately reflected in our quantitative models. During the first quarter of 2021, we added qualitative components that were based on management’s assessment of various qualitative factors such as economic conditions and collateral dependency. These qualitative components were primarily related to certain loan portfolios including hotels, retail, and office properties that were more directly affected by the COVID-19 pandemic and may react more slowly to the improvements in the general economic conditions. Business operations and collateral valuations in these industries have stabilized in 2022 and 2023 with the exception of office properties for which there is continued uncertainty regarding the longer-term impact of remote working and flexible/hybrid work environments. During the fourth quarter of 2023, we updated our qualitative adjustments for loans secured by office properties to assess incremental credit risk based on forecasted changes in collateral value.
The increases in the quantitative reserve were primarily due to the Merger, increased net charge-offs, and management’s expectation for a less favorable economic forecast resulted in a $52.0 million loan-related provision for credit losses in 2023.
The use of different economic forecasts, whether based on different scenarios, the use of multiple or single scenarios, or updated economic forecasts and scenarios, can change the outcome of the calculations. In addition to the economic forecasts, there are numerous components and assumptions that are integral to the overall estimation of allowance for credit losses. As part of our allowance for credit losses process, sensitivity analyses are performed to assess the impact of how changing certain assumptions could impact the estimated allowance for credit losses. At times, these analyses can provide information to further assist management in making decisions on certain assumptions. We calculated alternative values for our December 31, 2023 allowance for credit losses using various alternative forecast scenario weightings and the calculated amounts for the quantitative component differed from the management’s probability-weighted multiple scenario forecast ranging from decreases in the dollar amount of the quantitative component of the ACL of 0.87% to 3.19%. However, changing one assumption and not reassessing other assumptions used in the quantitative or qualitative process could yield results that are not reasonable or appropriate, hence all assumptions and information must be considered. From a sensitivity analysis perspective, changing key assumptions such as the macro-economic variable inputs from the economic forecasts, the reasonable and supportable forecast period, prepayment rates, loan segmentation, historical loss factors and/or periods, among others, would all change the outcome of the quantitative components of the allowance for credit losses. Those results would then need to be assessed from a qualitative perspective potentially requiring further adjustments to the qualitative component to arrive at a reasonable and appropriate allowance for credit losses.
The determination of the allowance for credit losses is complex and highly dependent on numerous models, assumptions, and judgments made by management. Management's current expectation for credit losses on loans and leases held for investment as quantified in the allowance for credit losses considers the impact of assumptions and is reflective of historical credit experience, economic forecasts viewed to be reasonable and supportable, current loan and lease composition, and relative credit risks known as of the balance sheet date.
Management believes the allowance for credit losses is appropriate for the current expected credit losses in our loan and lease portfolio and associated unfunded loan commitments, and the credit risk ratings and inherent loss rates currently assigned are reasonable and appropriate as of the reporting date. It is possible that others, given the same information, may at any point in time reach different conclusions that could result in a significant impact to the Company's financial statements.
83
The following table presents information regarding the allowance for credit losses on loans and leases held for investment as of the dates indicated:
| December 31, | |||||||||||||||||
| Allowance for Credit Losses Data | 2023 | 2022 | 2021 | ||||||||||||||
| (Dollars in thousands) | |||||||||||||||||
| Allowance for loan and lease losses | $ | 281,687 | $ | 200,732 | $ | 200,564 | |||||||||||
| Reserve for unfunded loan commitments | 29,571 | 91,071 | 73,071 | ||||||||||||||
| Total allowance for credit losses | $ | 311,258 | $ | 291,803 | $ | 273,635 | |||||||||||
Allowance for credit losses to loans and leases held for investment | 1.22 | % | 1.02 | % | 1.19 | % | |||||||||||
| Allowance for credit losses to nonaccrual loans and leases held for investment | 497.8 | % | 281.2 | % | 447.3 | % | |||||||||||
The following table presents the changes in our allowance for credit losses on loans and leases held for investment for the years indicated:
| Year Ended December 31, | |||||||||||||||||
| Allowance for Credit Losses Roll Forward | 2023 | 2022 | 2021 | ||||||||||||||
| (Dollars in thousands) | |||||||||||||||||
| Balance, beginning of year | $ | 291,803 | $ | 273,635 | $ | 433,752 | |||||||||||
| Initial allowance on acquired PCD loans | 25,623 | — | — | ||||||||||||||
| Provision for credit losses: | |||||||||||||||||
| Addition to (reduction in) allowance for loan and lease losses | 113,500 | 5,000 | (149,500) | ||||||||||||||
| Addition to (reduction in) addition to reserve for unfunded loan commitments | (61,500) | 18,000 | (12,500) | ||||||||||||||
| Total provision for credit losses | 52,000 | 23,000 | (162,000) | ||||||||||||||
| Loans and leases charged off: | |||||||||||||||||
| Real estate mortgage | (47,370) | (5,056) | (1,135) | ||||||||||||||
| Real estate construction and land | — | — | (775) | ||||||||||||||
| Commercial | (13,661) | (6,817) | (7,298) | ||||||||||||||
| Consumer | (2,397) | (2,164) | (1,507) | ||||||||||||||
| Total loans and leases charged off | (63,428) | (14,037) | (10,715) | ||||||||||||||
| Recoveries on loans charged off: | |||||||||||||||||
| Real estate mortgage | 885 | 1,748 | 6,767 | ||||||||||||||
| Real estate construction and land | — | 178 | — | ||||||||||||||
| Commercial | 4,125 | 7,163 | 5,711 | ||||||||||||||
| Consumer | 250 | 116 | 120 | ||||||||||||||
| Total recoveries on loans charged off | 5,260 | 9,205 | 12,598 | ||||||||||||||
| Net (charge-offs) recoveries | (58,168) | (4,832) | 1,883 | ||||||||||||||
| Balance, end of year | $ | 311,258 | $ | 291,803 | $ | 273,635 | |||||||||||
| Net charge-offs (recoveries) to average loans and leases | 0.23 | % | 0.02 | % | (0.01) | % | |||||||||||
84
The following table presents net charge-offs, average loan balance, and ratio of net charge-offs to average loans by loan portfolio segment for the years indicated:
| Year Ended December 31, | |||||||||||||||||
| Ratio of Net Charge-offs to Average Loans | 2023 | 2022 | 2021 | ||||||||||||||
| (Dollars in thousands) | |||||||||||||||||
| Real Estate Mortgage: | |||||||||||||||||
| Net charge-offs (recoveries) | $ | 46,485 | $ | 3,308 | $ | (5,632) | |||||||||||
| Average loan balance | $ | 14,723,618 | $ | 13,811,880 | $ | 9,119,963 | |||||||||||
| Ratio of net charge-offs (recoveries) to average loans | 0.32 | % | 0.02 | % | (0.06) | % | |||||||||||
| Real Estate Construction and Land: | |||||||||||||||||
| Net charge-offs (recoveries) | $ | — | $ | (178) | $ | 775 | |||||||||||
| Average loan balance | $ | 3,677,785 | $ | 3,527,334 | $ | 3,396,145 | |||||||||||
| Ratio of net charge-offs to average loans | — | % | (0.01) | % | 0.02 | % | |||||||||||
| Commercial: | |||||||||||||||||
| Net (recoveries) charge-offs | $ | 9,536 | $ | (346) | $ | 1,587 | |||||||||||
| Average loan balance | $ | 5,717,669 | $ | 8,202,539 | $ | 7,310,253 | |||||||||||
| Ratio of net charge-offs to average loans | 0.17 | % | — | % | 0.02 | % | |||||||||||
| Consumer: | |||||||||||||||||
| Net charge-offs | $ | 2,147 | $ | 2,048 | $ | 1,387 | |||||||||||
| Average loan balance | $ | 416,797 | $ | 471,032 | $ | 377,927 | |||||||||||
| Ratio of net charge-offs to average loans | 0.52 | % | 0.43 | % | 0.37 | % | |||||||||||
Net charge-offs in 2023 were $58.2 million compared to net charge-offs of $4.8 million in 2022. This change was due primarily to the real estate mortgage portfolio segment going from net charge-offs of $3.3 million in 2022 to net charge-offs of $46.5 million in 2023.
Net charge-offs in 2022 were $4.8 million compared to net recoveries of $1.9 million in 2021. This change was due primarily to the real estate mortgage portfolio segment going from net recoveries of $5.6 million in 2021 to net charge-offs of $3.3 million in 2022.
85
The following table presents charge-offs by loan portfolio segment, class, and subclass for the years indicated:
| Year Ended December 31, | |||||||||||||||||
| Allowance for Credit Losses Charge-offs | 2023 | 2022 | 2021 | ||||||||||||||
| (In thousands) | |||||||||||||||||
| Real Estate Mortgage: | |||||||||||||||||
| Commercial real estate | $ | 13,956 | $ | 2,258 | $ | — | |||||||||||
| SBA program | 339 | 417 | 622 | ||||||||||||||
| Hotel | — | 55 | 343 | ||||||||||||||
| Total commercial real estate mortgage | 14,295 | 2,730 | 965 | ||||||||||||||
| Multi-family | — | — | 56 | ||||||||||||||
| Residential mortgage | — | 81 | — | ||||||||||||||
| Investor-owned residential | 21,844 | 814 | 114 | ||||||||||||||
| Residential renovation | 11,231 | 1,431 | — | ||||||||||||||
| Total other residential real estate | 33,075 | 2,326 | 114 | ||||||||||||||
| Total real estate mortgage | 47,370 | 5,056 | 1,135 | ||||||||||||||
| Real Estate Construction and Land: | |||||||||||||||||
| Commercial | — | — | 775 | ||||||||||||||
| Residential | — | — | — | ||||||||||||||
| Total real estate construction and land | — | — | 775 | ||||||||||||||
| Total real estate | 47,370 | 5,056 | 1,910 | ||||||||||||||
| Commercial: | |||||||||||||||||
| Lender finance | 150 | — | 232 | ||||||||||||||
| Equipment finance | — | — | — | ||||||||||||||
| Other asset-based | — | 750 | — | ||||||||||||||
| Premium finance | 60 | — | — | ||||||||||||||
| Total asset-based | 210 | 750 | 232 | ||||||||||||||
| Equity fund loans | — | — | — | ||||||||||||||
| Venture lending | 5,013 | 940 | 620 | ||||||||||||||
| Total venture capital | 5,013 | 940 | 620 | ||||||||||||||
| Secured business loans | 658 | 479 | 210 | ||||||||||||||
| Warehouse lending | — | — | — | ||||||||||||||
| Paycheck Protection Program | — | — | — | ||||||||||||||
| Other lending | 7,780 | 4,648 | 6,236 | ||||||||||||||
| Total other commercial | 8,438 | 5,127 | 6,446 | ||||||||||||||
| Total commercial | 13,661 | 6,817 | 7,298 | ||||||||||||||
| Consumer | 2,397 | 2,164 | 1,507 | ||||||||||||||
| Total charge-offs | $ | 63,428 | $ | 14,037 | $ | 10,715 | |||||||||||
Commercial real estate gross charge-offs increased due to charge-offs related to loans secured by office buildings and investor-owned residential and residential renovation gross charge-offs increased in 2023 due to charge-offs related to Civic loans as this portfolio becomes more seasoned and a portion of the current year charge-offs relate to the transfer of nonaccrual loans to held for sale.
86
The following table presents recoveries by loan portfolio segment, class, and subclass for the years indicated:
| Year Ended December 31, | |||||||||||||||||
| Allowance for Credit Losses Recoveries | 2023 | 2022 | 2021 | ||||||||||||||
| (In thousands) | |||||||||||||||||
| Real Estate Mortgage: | |||||||||||||||||
| Commercial real estate | $ | — | $ | 1,204 | $ | 5,384 | |||||||||||
| SBA program | 281 | 281 | 697 | ||||||||||||||
| Hotel | — | — | — | ||||||||||||||
| Total commercial real estate mortgage | 281 | 1,485 | 6,081 | ||||||||||||||
| Multi-family | — | 4 | — | ||||||||||||||
| Residential mortgage | 20 | 234 | 658 | ||||||||||||||
| Investor-owned residential | 175 | 25 | 28 | ||||||||||||||
| Residential renovation | 409 | — | — | ||||||||||||||
| Total other residential real estate | 604 | 259 | 686 | ||||||||||||||
| Total real estate mortgage | 885 | 1,748 | 6,767 | ||||||||||||||
| Real Estate Construction and Land: | |||||||||||||||||
| Commercial | — | 178 | — | ||||||||||||||
| Residential | — | — | — | ||||||||||||||
| Total real estate construction and land | — | 178 | — | ||||||||||||||
| Total real estate | 885 | 1,926 | 6,767 | ||||||||||||||
| Commercial: | |||||||||||||||||
| Lender finance | 324 | — | 3 | ||||||||||||||
| Equipment finance | — | 163 | 263 | ||||||||||||||
| Other asset-based | 279 | 539 | 453 | ||||||||||||||
| Premium finance | 1 | — | — | ||||||||||||||
| Total asset-based | 604 | 702 | 719 | ||||||||||||||
| Equity fund loans | — | — | — | ||||||||||||||
| Venture lending | 2,073 | 923 | 404 | ||||||||||||||
| Total venture capital | 2,073 | 923 | 404 | ||||||||||||||
| Secured business loans | 30 | 178 | 2,402 | ||||||||||||||
| Warehouse lending | — | — | — | ||||||||||||||
| Paycheck Protection Program | — | — | — | ||||||||||||||
| Other lending | 1,418 | 5,360 | 2,186 | ||||||||||||||
| Total other commercial | 1,448 | 5,538 | 4,588 | ||||||||||||||
| Total commercial | 4,125 | 7,163 | 5,711 | ||||||||||||||
| Consumer | 250 | 116 | 120 | ||||||||||||||
| Total recoveries | $ | 5,260 | $ | 9,205 | $ | 12,598 | |||||||||||
87
The following table presents the allowance for loan and lease losses on loans and leases held for investment by loan portfolio segment as of the dates indicated:
| Allocation of the Allowance for Loan and Lease Losses by Portfolio Segment | |||||||||||||||||||||||||||||
| Real Estate | |||||||||||||||||||||||||||||
| Real Estate | Construction | ||||||||||||||||||||||||||||
| Mortgage | and Land | Commercial | Consumer | Total | |||||||||||||||||||||||||
| (Dollars in thousands) | |||||||||||||||||||||||||||||
| December 31, 2023 | |||||||||||||||||||||||||||||
| Allowance for loan and lease losses | $ | 186,827 | $ | 33,830 | $ | 45,156 | $ | 15,874 | $ | 281,687 | |||||||||||||||||||
| % of loans to total loans | 63 | % | 12 | % | 23 | % | 2 | % | 100 | % | |||||||||||||||||||
| December 31, 2022 | |||||||||||||||||||||||||||||
| Allowance for loan and lease losses | $ | 87,309 | $ | 52,320 | $ | 52,849 | $ | 8,254 | $ | 200,732 | |||||||||||||||||||
| % of loans to total loans | 55 | % | 14 | % | 29 | % | 2 | % | 100 | % | |||||||||||||||||||
| December 31, 2021 | |||||||||||||||||||||||||||||
| Allowance for loan and lease losses | $ | 98,053 | $ | 45,079 | $ | 48,718 | $ | 8,714 | $ | 200,564 | |||||||||||||||||||
| % of loans to total loans | 51 | % | 13 | % | 34 | % | 2 | % | 100 | % | |||||||||||||||||||
The allowance for loan and lease losses attributable to real estate mortgage loans was $186.8 million and $87.3 million at December 31, 2023 and 2022. As ratios to real estate mortgage loans at those dates, these percentages were 1.16% and 0.56%. The ratio increase was primarily due to a less favorable economic forecast, lower expected prepayment rates, and an increase in qualitative reserves for loans secured by office properties.
The allowance for loan and lease losses attributable to real estate construction and land loans was $33.8 million and $52.3 million at December 31, 2023 and 2022. As ratios to real estate construction and land loans at those dates, these percentages were 1.07% and 1.26%. The ratio decrease was primarily due to a decrease in loan balances with higher credit risks.
The allowance for loan and lease losses attributable to commercial loans and leases was $45.2 million and $52.8 million at December 31, 2023 and 2022. As ratios to commercial loans and leases at those dates, these percentages were 0.78% and 0.64%. The ratio increase was due to a higher allowance for loan losses as a result of less favorable economic forecasts and lower expected prepayment rates.
88
Deposits
The following table presents a summary of our average deposit amounts and average rates paid during the years indicated:
| Year Ended December 31, | |||||||||||||||||||||||||||||||||||
| 2023 | 2022 | 2021 | |||||||||||||||||||||||||||||||||
Weighted | Weighted | Weighted | |||||||||||||||||||||||||||||||||
| Average | Average | Average | Average | Average | Average | ||||||||||||||||||||||||||||||
| Deposit Composition | Balance | Rate | Balance | Rate | Balance | Rate | |||||||||||||||||||||||||||||
| (Dollars in thousands) | |||||||||||||||||||||||||||||||||||
| Interest checking | $ | 6,992,888 | 3.16 | % | $ | 6,851,831 | 0.97 | % | $ | 7,198,646 | 0.12 | % | |||||||||||||||||||||||
| Money market | 6,724,296 | 2.83 | % | 10,601,028 | 0.90 | % | 8,843,122 | 0.15 | % | ||||||||||||||||||||||||||
| Savings | 1,051,117 | 2.95 | % | 639,720 | 0.03 | % | 606,741 | 0.02 | % | ||||||||||||||||||||||||||
| Time | 6,840,920 | 4.48 | % | 2,540,426 | 1.51 | % | 1,471,963 | 0.40 | % | ||||||||||||||||||||||||||
| Total interest-bearing deposits | 21,609,221 | 3.46 | % | 20,633,005 | 0.97 | % | 18,120,472 | 0.15 | % | ||||||||||||||||||||||||||
| Noninterest-bearing checking | 7,072,334 | — | 13,601,766 | — | 12,110,193 | — | |||||||||||||||||||||||||||||
| Total deposits | $ | 28,681,555 | 2.61 | % | $ | 34,234,771 | 0.59 | % | $ | 30,230,665 | 0.09 | % | |||||||||||||||||||||||
The following table presents the composition of our deposit portfolio by account type as of the dates indicated:
| December 31, | |||||||||||||||||||||||||||||||||||
| 2023 | 2022 | 2021 | |||||||||||||||||||||||||||||||||
% of | % of | % of | |||||||||||||||||||||||||||||||||
| Deposit Composition | Balance | Total | Balance | Total | Balance | Total | |||||||||||||||||||||||||||||
| (Dollars in thousands) | |||||||||||||||||||||||||||||||||||
| Noninterest-bearing checking | $ | 7,774,254 | 26 | % | $ | 11,212,357 | 33 | % | $ | 14,543,133 | 41 | % | |||||||||||||||||||||||
| Interest-bearing: | |||||||||||||||||||||||||||||||||||
| Checking | 7,808,764 | 26 | % | 7,938,911 | 23 | % | 7,386,269 | 21 | % | ||||||||||||||||||||||||||
| Money market | 6,187,889 | 20 | % | 9,469,586 | 28 | % | 11,064,870 | 32 | % | ||||||||||||||||||||||||||
| Savings | 1,997,989 | 6 | % | 577,637 | 2 | % | 630,653 | 2 | % | ||||||||||||||||||||||||||
| Time: | |||||||||||||||||||||||||||||||||||
| Non-brokered | 3,139,270 | 10 | % | 2,434,414 | 7 | % | 1,177,147 | 3 | % | ||||||||||||||||||||||||||
| Brokered | 3,493,603 | 12 | % | 2,303,429 | 7 | % | 195,685 | 1 | % | ||||||||||||||||||||||||||
| Total time deposits | 6,632,873 | 22 | % | 4,737,843 | 14 | % | 1,372,832 | 4 | % | ||||||||||||||||||||||||||
| Total interest-bearing | 22,627,515 | 74 | % | 22,723,977 | 67 | % | 20,454,624 | 59 | % | ||||||||||||||||||||||||||
| Total deposits | $ | 30,401,769 | 100 | % | $ | 33,936,334 | 100 | % | $ | 34,997,757 | 100 | % | |||||||||||||||||||||||
The following table presents time deposits based on the $250,000 FDIC insured limit as of the dates indicated:
| December 31, | |||||||||||||||||||||||||||||||||||
| 2023 | 2022 | 2021 | |||||||||||||||||||||||||||||||||
% of | % of | % of | |||||||||||||||||||||||||||||||||
Total | Total | Total | |||||||||||||||||||||||||||||||||
| Time Deposits | Balance | Deposits | Balance | Deposits | Balance | Deposits | |||||||||||||||||||||||||||||
| (Dollars in thousands) | |||||||||||||||||||||||||||||||||||
| Time deposits $250,000 and under | $ | 5,526,396 | 18 | % | $ | 3,198,434 | 9 | % | $ | 885,938 | 3 | % | |||||||||||||||||||||||
| Time deposits over $250,000 | 1,106,477 | 4 | % | 1,539,409 | 5 | % | 486,894 | 1 | % | ||||||||||||||||||||||||||
| Total time deposits | $ | 6,632,873 | 22 | % | $ | 4,737,843 | 14 | % | $ | 1,372,832 | 4 | % | |||||||||||||||||||||||
89
During 2023, total deposits decreased by $3.5 billion, or 10.4%, to $30.4 billion at December 31, 2023, due primarily to a decrease of $3.4 billion in noninterest-bearing deposits. At December 31, 2023, noninterest-bearing deposits totaled $7.8 billion, or 26% of total deposits and interest-bearing deposits totaled $22.6 billion, or 74% of total deposits. Our deposit base is also diversified by client type. As of December 31, 2023, no individual deposit relationship represented more than 10% of our total deposits.
As of December 31, 2023, FDIC-insured deposits represented approximately 76% of total deposits, up from 48% as of December 31, 2022. The Bank’s spot deposit rates were 2.69% at December 31, 2023, up from 1.71% at December 31, 2022.
The following table summarizes the maturities of time deposits as of the date indicated:
Time Deposits | |||||||||||||||||
$250,000 | Over | ||||||||||||||||
| December 31, 2023 | and Under | $250,000 | Total | ||||||||||||||
| (In thousands) | |||||||||||||||||
| Maturities: | |||||||||||||||||
| Due in three months or less | $ | 2,010,849 | $ | 421,757 | $ | 2,432,606 | |||||||||||
| Due in over three months through six months | 1,853,905 | 265,711 | 2,119,616 | ||||||||||||||
| Due in over six months through 12 months | 1,521,748 | 378,432 | 1,900,180 | ||||||||||||||
| Total due within 12 months | 5,386,502 | 1,065,900 | 6,452,402 | ||||||||||||||
| Due in over 12 months through 24 months | 131,601 | 34,807 | 166,408 | ||||||||||||||
| Due in over 24 months | 8,293 | 5,770 | 14,063 | ||||||||||||||
| Total due over 12 months | 139,894 | 40,577 | 180,471 | ||||||||||||||
| Total | $ | 5,526,396 | $ | 1,106,477 | $ | 6,632,873 | |||||||||||
The following table summarizes the maturities of estimated uninsured time deposits as of the date indicated:
| Uninsured | |||||
| Time | |||||
| December 31, 2023 | Deposits | ||||
| (In thousands) | |||||
| Maturities: | |||||
| Due in three months or less | $ | 164,019 | |||
| Due in over three months through six months | 145,949 | ||||
| Due in over six months through 12 months | 188,714 | ||||
| Total due within 12 months | 498,682 | ||||
| Total due over 12 months | 35,509 | ||||
| Total | $ | 534,191 | |||
Client Investment Funds
In addition to deposit products, we also offer select clients non-depository cash investment options through BAM, our SEC registered investment adviser subsidiary, and third-party money market sweep products. BAM provides customized investment advisory and asset management solutions. At December 31, 2023, total off-balance sheet client investment funds were $0.6 billion of which $0.2 billion was managed by BAM. At December 31, 2022, total off-balance sheet client investment funds were $1.4 billion, of which $0.9 billion was managed by BAM.
90
Borrowings and Subordinated Debt
The Bank has various available lines of credit. These include the ability to borrow funds from time to time on a long‑term, short‑term, or overnight basis from the FHLB, the FRBSF, or other financial institutions. The maximum amount that the Bank could borrow under its secured credit line with the FHLB at December 31, 2023 was $5.3 billion, of which $5.1 billion was available on that date. The maximum amount that the Bank could borrow under its secured credit line with the FRBSF at December 31, 2023 was $6.9 billion, all of which was available on that date. The FHLB secured credit line was collateralized by a blanket lien on $9.5 billion of certain qualifying loans and $20.3 million of securities. The FRBSF secured credit line was collateralized by liens on $7.7 billion of qualifying loans $1.3 billion of securities. In addition to its secured lines of credit, the Bank also maintains unsecured lines of credit for the borrowing of overnight funds, subject to availability of $290.0 million in the aggregate with several correspondent banks. As of December 31, 2023, there was no balance outstanding related to these unsecured lines of credit. The Bank is a member of the AFX, through which it may either borrow or lend funds on an overnight or short-term basis with a group of pre-approved commercial banks. The availability of funds changes daily. As of December 31, 2023, the Bank had no of overnight borrowings through the AFX.
On September 29, 2022, legacy Pacific Western Bank completed a credit-linked notes transaction. The notes were issued and sold at par and had an aggregate principal amount of $132.8 million with net proceeds of approximately $128.7 million and are due June 27, 2052. The notes are linked to the credit risk of an approximately $2.48 billion reference pool of previously purchased single-family residential mortgage loans. The notes were issued in five classes with a blended rate on the notes of SOFR plus 11%. The transaction results in a lower risk-weighting on the reference pool of loans for regulatory capital purposes. The credit-linked notes are reported at fair value and had a balance of $123.1 million at December 31, 2023. See Note 14. Fair Value Option for more information regarding the credit-linked notes.
The following table presents information on our borrowings as of the dates indicated:
| December 31, | |||||||||||||||||||||||||||||||||||
| 2023 | 2022 | 2021 | |||||||||||||||||||||||||||||||||
| Weighted | Weighted | Weighted | |||||||||||||||||||||||||||||||||
| Average | Average | Average | |||||||||||||||||||||||||||||||||
| Borrowings | Balance | Rate | Balance | Rate | Balance | Rate | |||||||||||||||||||||||||||||
| (Dollars in thousands) | |||||||||||||||||||||||||||||||||||
| Bank Term Funding Program | $ | 2,618,300 | 4.37 | % | $ | — | — | % | $ | — | — | % | |||||||||||||||||||||||
| Senior Notes | 174,000 | 5.25 | % | — | — | % | — | — | % | ||||||||||||||||||||||||||
| Credit-linked notes | 123,116 | 16.02 | % | 132,030 | 14.56 | % | — | — | % | ||||||||||||||||||||||||||
| FHLB secured short-term advances | — | — | % | 1,270,000 | 4.62 | % | — | — | % | ||||||||||||||||||||||||||
| AFX short-term borrowings | — | — | % | 250,000 | 4.68 | % | — | — | % | ||||||||||||||||||||||||||
| FHLB unsecured overnight advance | — | — | % | 112,000 | 4.37 | % | — | — | % | ||||||||||||||||||||||||||
| Total borrowings | $ | 2,915,416 | 4.92 | % | $ | 1,764,030 | 5.36 | % | $ | — | — | % | |||||||||||||||||||||||
| Averages for the year: | |||||||||||||||||||||||||||||||||||
| Total borrowings | $ | 7,068,826 | 5.90 | % | $ | 961,601 | 2.67 | % | $ | 231,099 | 0.27 | % | |||||||||||||||||||||||
91
The following table presents summary information on our subordinated debt as of the dates indicated:
| December 31, | |||||||||||||||||||||||||||||||||||
| 2023 | 2022 | 2021 | |||||||||||||||||||||||||||||||||
| Weighted | Weighted | Weighted | |||||||||||||||||||||||||||||||||
| Average | Average | Average | |||||||||||||||||||||||||||||||||
| Subordinated Debt | Balance | Rate | Balance | Rate | Balance | Rate | |||||||||||||||||||||||||||||
| (Dollars in thousands) | |||||||||||||||||||||||||||||||||||
| Gross subordinated debt: | |||||||||||||||||||||||||||||||||||
| With no unamortized acquisition discount | |||||||||||||||||||||||||||||||||||
| or unamortized issuance costs | $ | 152,582 | 8.08 | % | $ | 135,055 | 7.01 | % | $ | 135,055 | 2.58 | % | |||||||||||||||||||||||
With unamortized acquisition discount | |||||||||||||||||||||||||||||||||||
| or unamortized issuance costs | 865,186 | 5.56 | % | 804,325 | 4.76 | % | 806,039 | 2.65 | % | ||||||||||||||||||||||||||
| Total gross subordinated debt | 1,017,768 | 5.93 | % | 939,380 | 5.08 | % | 941,094 | 2.65 | % | ||||||||||||||||||||||||||
| Unamortized issuance costs | (4,349) | (4,866) | — | ||||||||||||||||||||||||||||||||
| Unamortized acquisition discount | (76,820) | (67,427) | (72,445) | ||||||||||||||||||||||||||||||||
| Net subordinated debt | $ | 936,599 | $ | 867,087 | $ | 868,649 | |||||||||||||||||||||||||||||
| Averages for the year: | |||||||||||||||||||||||||||||||||||
| Net subordinated debt | $ | 875,621 | 6.70 | % | $ | 863,883 | 4.59 | % | $ | 733,163 | 3.61 | % | |||||||||||||||||||||||
The subordinated debt is variable rate and based on 3-month Term SOFR or Prime plus a margin, except for: (a) one which is based on 3-month EURIBOR plus a margin, (b) $400 million of subordinated notes issued on April 30, 2021 that is fixed rate at 3.25% until May 1, 2026 when it changes to floating rate and resets quarterly at a benchmark rate plus 252 basis points, and (c) $75 million of subordinated notes from legacy Banc of California, Inc. Inc. that is fixed rate at 4.375% until October 30, 2025 when it changes to a floating rate equal to a benchmark rate, which is expected to be 3-month Term SOFR plus 419.5 basis points. The margins on the 3-month term SOFR and Prime debentures range from 1.55% to 3.40%, while the margin on the 3-month EURIBOR debenture is 2.05%. On July 1, 2023, interest rates transitioned from LIBOR to Term SOFR or Prime plus the relevant spread amount as the applicable benchmark upon the cessation of LIBOR on June 30, 2023. The subordinated debt is all long-term, with maturities ranging from October 2030 to July 2037.
92
Credit Quality
Nonperforming Assets, Classified Loans and Leases, and Special Mention Loans and Leases
The following table presents information on our nonperforming assets, classified loans and leases, and special mention loans and leases as of the dates indicated:
December 31, | |||||||||||||||||
| 2023 | 2022 | 2021 | |||||||||||||||
| (Dollars in thousands) | |||||||||||||||||
| Nonaccrual loans and leases held for investment | $ | 62,527 | $ | 103,778 | $ | 61,174 | |||||||||||
| Accruing loans contractually past due 90 days or more | 11,750 | — | — | ||||||||||||||
| Foreclosed assets, net | 7,394 | 5,022 | 12,843 | ||||||||||||||
| Total nonperforming assets | $ | 81,671 | $ | 108,800 | $ | 74,017 | |||||||||||
| Classified loans and leases held for investment | $ | 228,417 | $ | 118,271 | $ | 116,104 | |||||||||||
| Special mention loans and leases held for investment | $ | 513,312 | $ | 566,259 | $ | 391,611 | |||||||||||
| Nonaccrual loans and leases held for investment to | |||||||||||||||||
| loans and leases held for investment | 0.29 | % | 0.36 | % | 0.27 | % | |||||||||||
| Nonperforming assets to loans and leases held for investment | |||||||||||||||||
| and foreclosed assets, net | 0.32 | % | 0.38 | % | 0.32 | % | |||||||||||
| Allowance for credit losses to nonaccrual loans and leases | |||||||||||||||||
| held for investment | 497.80 | % | 281.18 | % | 447.31 | % | |||||||||||
| Classified loans and leases held for investment to | |||||||||||||||||
| loans and leases held for investment | 0.90 | % | 0.41 | % | 0.51 | % | |||||||||||
| Special mention loans and leases held for investment to | |||||||||||||||||
| loans and leases held for investment | 2.01 | % | 1.98 | % | 1.71 | % | |||||||||||
Nonaccrual Loans and Leases Held for Investment
During 2023, nonaccrual loans and leases held for investment decreased by $41.3 million to $62.5 million at December 31, 2023 due mainly to transfers to loans held for sale of $44.0 million, principal payments and other reductions of $98.2 million, charge-offs of $25.6 million, and transfers to accrual status of $5.0 million, offset partially by $131.6 million in additions. As of December 31, 2023, the Company's three largest loan relationships on nonaccrual status had an aggregate carrying value of $7.1 million and represented 11% of total nonaccrual loans and leases.
93
The following table presents our nonaccrual loans and leases held for investment and accruing loans and leases past due between 30 and 89 days by loan portfolio segment and class as of the dates indicated:
| December 31, 2023 | December 31, 2022 | Increase (Decrease) | |||||||||||||||||||||||||||||||||
| Accruing | Accruing | Accruing | |||||||||||||||||||||||||||||||||
| and 30-89 | and 30-89 | and 30-89 | |||||||||||||||||||||||||||||||||
| Days Past | Days Past | Days Past | |||||||||||||||||||||||||||||||||
| Nonaccrual | Due | Nonaccrual | Due | Nonaccrual | Due | ||||||||||||||||||||||||||||||
| (In thousands) | |||||||||||||||||||||||||||||||||||
| Real estate mortgage: | |||||||||||||||||||||||||||||||||||
| Commercial | $ | 15,669 | $ | 10,577 | $ | 42,509 | $ | 1,047 | $ | (26,840) | $ | 9,530 | |||||||||||||||||||||||
| Multi-family | 1,020 | 2,302 | — | — | 1,020 | 2,302 | |||||||||||||||||||||||||||||
| Other residential | 31,041 | 83,747 | 55,893 | 95,654 | (24,852) | (11,907) | |||||||||||||||||||||||||||||
| Total real estate mortgage | 47,730 | 96,626 | 98,402 | 96,701 | (50,672) | (75) | |||||||||||||||||||||||||||||
| Real estate construction and land: | |||||||||||||||||||||||||||||||||||
| Commercial | — | — | — | — | — | — | |||||||||||||||||||||||||||||
| Residential | — | — | — | — | — | — | |||||||||||||||||||||||||||||
| Total real estate construction and land | — | — | — | — | — | — | |||||||||||||||||||||||||||||
| Commercial: | |||||||||||||||||||||||||||||||||||
| Asset-based | 2,689 | 608 | 865 | — | 1,824 | 608 | |||||||||||||||||||||||||||||
| Venture capital | 325 | — | — | — | 325 | — | |||||||||||||||||||||||||||||
| Other commercial | 10,972 | 1,187 | 4,345 | 385 | 6,627 | 802 | |||||||||||||||||||||||||||||
| Total commercial | 13,986 | 1,795 | 5,210 | 385 | 8,776 | 1,410 | |||||||||||||||||||||||||||||
| Consumer | 811 | 3,461 | 166 | 1,935 | 645 | 1,526 | |||||||||||||||||||||||||||||
| Total held for investment | $ | 62,527 | $ | 101,882 | $ | 103,778 | $ | 99,021 | $ | (41,251) | $ | 2,861 | |||||||||||||||||||||||
During 2023, loans accruing and 30-89 days past due increased by $2.9 million to $101.9 million at December 31, 2023 due primarily to increases in past due loans of $9.5 million in commercial real estate mortgage loan portfolio class, $2.3 million in the multi-family real estate mortgage loan portfolio class, and $1.5 million in the consumer portfolio class, offset partially by a decrease of $11.9 million in the other residential real estate mortgage loan portfolio class.
Foreclosed Assets
The following table presents foreclosed assets (primarily OREO) by property type as of the dates indicated:
December 31, | |||||||||||||||||
| Property Type | 2023 | 2022 | 2021 | ||||||||||||||
| (In thousands) | |||||||||||||||||
| Commercial real estate | $ | — | $ | — | $ | 12,594 | |||||||||||
| Single-family residential | 7,394 | 5,022 | — | ||||||||||||||
| Total OREO, net | 7,394 | 5,022 | 12,594 | ||||||||||||||
| Other foreclosed assets | — | — | 249 | ||||||||||||||
| Total foreclosed assets | $ | 7,394 | $ | 5,022 | $ | 12,843 | |||||||||||
During 2023, foreclosed assets increased by $2.4 million to $7.4 million at December 31, 2023 due to sales of $16.6 million, offset partially by additions of $20.9 million.
94
Classified and Special Mention Loans and Leases Held for Investment
The following table presents the credit risk ratings of our loans and leases held for investment, net of deferred fees, as of the dates indicated:
December 31, | |||||||||||||||||
Loan and Lease Credit Risk Ratings | 2023 | 2022 | 2021 | ||||||||||||||
| (In thousands) | |||||||||||||||||
| Pass | $ | 24,747,958 | $ | 27,924,599 | $ | 22,433,833 | |||||||||||
| Special mention | 513,312 | 566,259 | 391,611 | ||||||||||||||
| Classified | 228,417 | 118,271 | 116,104 | ||||||||||||||
| Total loans and leases held for investment, net of deferred fees | $ | 25,489,687 | $ | 28,609,129 | $ | 22,941,548 | |||||||||||
Classified and special mention loans and leases fluctuate from period to period as a result of loan repayments and downgrades or upgrades from our ongoing active portfolio management.
The following table presents the classified and special mention credit risk rating categories for loans and leases held for investment, net of deferred fees, by loan portfolio segment and class and the related net changes as of the dates indicated:
| December 31, 2023 | December 31, 2022 | Increase (Decrease) | |||||||||||||||||||||||||||||||||
| Special | Special | Special | |||||||||||||||||||||||||||||||||
| Classified | Mention | Classified | Mention | Classified | Mention | ||||||||||||||||||||||||||||||
| (In thousands) | |||||||||||||||||||||||||||||||||||
| Real estate mortgage: | |||||||||||||||||||||||||||||||||||
| Commercial | $ | 75,739 | $ | 219,687 | $ | 43,737 | $ | 106,493 | $ | 32,002 | $ | 113,194 | |||||||||||||||||||||||
| Multi-family | 74,954 | 108,356 | 3,611 | 60,330 | 71,343 | 48,026 | |||||||||||||||||||||||||||||
| Other residential | 38,155 | 54,197 | 60,557 | 58,063 | (22,402) | (3,866) | |||||||||||||||||||||||||||||
| Total real estate mortgage | 188,848 | 382,240 | 107,905 | 224,886 | 80,943 | 157,354 | |||||||||||||||||||||||||||||
| Real estate construction and land: | |||||||||||||||||||||||||||||||||||
| Commercial | — | — | — | 91,334 | — | (91,334) | |||||||||||||||||||||||||||||
| Residential | — | 2,757 | — | 45,155 | — | (42,398) | |||||||||||||||||||||||||||||
| Total real estate construction and land | — | 2,757 | — | 136,489 | — | (133,732) | |||||||||||||||||||||||||||||
| Commercial: | |||||||||||||||||||||||||||||||||||
| Asset-based | 4,561 | 12,506 | 865 | 56,836 | 3,696 | (44,330) | |||||||||||||||||||||||||||||
| Venture capital | 7,805 | 98,633 | 2,753 | 127,907 | 5,052 | (29,274) | |||||||||||||||||||||||||||||
| Other commercial | 26,044 | 9,984 | 6,473 | 13,233 | 19,571 | (3,249) | |||||||||||||||||||||||||||||
| Total commercial | 38,410 | 121,123 | 10,091 | 197,976 | 28,319 | (76,853) | |||||||||||||||||||||||||||||
| Consumer | 1,159 | 7,192 | 275 | 6,908 | 884 | 284 | |||||||||||||||||||||||||||||
| Total | $ | 228,417 | $ | 513,312 | $ | 118,271 | $ | 566,259 | $ | 110,146 | $ | (52,947) | |||||||||||||||||||||||
During 2023, classified loans and leases increased by $110.1 million to $228.4 million at December 31, 2023 due mainly to increases of $71.3 million in multi-family real estate mortgage classified loans, $32.0 million in commercial real estate mortgage classified loans, and $19.6 million in other commercial classified loans, offset partially by a decrease of $22.4 million in other residential real estate mortgage classified loans.
During 2023, special mention loans and leases decreased by $52.9 million to $513.3 million at December 31, 2023 due primarily to decreases of $91.3 million in commercial real estate construction and land special mention loans, $44.3 million in asset-based commercial special mention loans, and $42.4 million in residential real estate construction and land special mention loans, offset partially by an increase of $113.2 million in commercial real estate mortgage special mention loans.
95
Regulatory Matters
Capital
Bank regulatory agencies measure capital adequacy through standardized risk-based capital guidelines that compare different levels of capital (as defined by such guidelines) to risk-weighted assets and off-balance sheet obligations. At December 31, 2023, banks considered to be “well capitalized” must maintain a minimum Tier 1 leverage ratio of 5.00%, a minimum common equity Tier 1 risk-based capital ratio of 6.50%, a minimum Tier 1 risk-based capital ratio of 8.00%, and a minimum total risk-based capital ratio of 10.00%.
Basel III currently requires all banking organizations to maintain a 2.50% capital conservation buffer above the minimum risk-based capital requirements to avoid certain limitations on capital distributions, stock repurchases and discretionary bonus payments to executive officers. The capital conservation buffer is exclusively comprised of common equity Tier 1 capital, and it applies to each of the three risk-based capital ratios but not to the leverage ratio. Effective January 1, 2019, the common equity Tier 1, Tier 1, and total capital ratio minimums inclusive of the capital conservation buffer were 7.00%, 8.50%, and 10.50%. At December 31, 2023, the Company and Bank were in compliance with the capital conservation buffer requirements.
The Company and Bank elected the CECL 5-year regulatory transition guidance for calculating regulatory capital ratios and the December 31, 2023 ratios include this election. This regulatory guidance allows an entity to add back to capital 100% of the capital impact from the day one CECL transition adjustment and 25% of subsequent increases to the allowance for credit losses through December 31, 2021. This cumulative amount will then be phased out of regulatory capital over the next three years from 2022 to 2024. The add-back as of December 31, 2023 ranged from 0 basis points to 5 basis points for the capital ratios below.
The following tables present a comparison of our actual capital ratios to the minimum required ratios and well capitalized ratios as of the dates indicated:
| Minimum Required | |||||||||||||||||||||||
| For Capital | For Capital | For Well | |||||||||||||||||||||
| Adequacy | Conservation | Capitalized | |||||||||||||||||||||
| December 31, 2023 | Actual | Purposes | Buffer | Classification | |||||||||||||||||||
| Banc of California, Inc.: | |||||||||||||||||||||||
| Tier 1 leverage capital ratio | 4.00% | N/A | N/A | ||||||||||||||||||||
| CET1 capital ratio | 4.50% | N/A | |||||||||||||||||||||
| Tier 1 capital ratio | 6.00% | N/A | |||||||||||||||||||||
| Total capital ratio | 8.00% | N/A | |||||||||||||||||||||
| Banc of California: | |||||||||||||||||||||||
| Tier 1 leverage capital ratio | N/A | ||||||||||||||||||||||
| CET1 capital ratio | |||||||||||||||||||||||
| Tier 1 capital ratio | |||||||||||||||||||||||
| Total capital ratio | |||||||||||||||||||||||
96
| Minimum Required | |||||||||||||||||||||||
| For Capital | For Capital | For Well | |||||||||||||||||||||
| Adequacy | Conservation | Capitalized | |||||||||||||||||||||
| Actual | Purposes | Buffer | Classification | ||||||||||||||||||||
| December 31, 2022 | |||||||||||||||||||||||
| Banc of California, Inc.: | |||||||||||||||||||||||
| Tier 1 leverage capital ratio | 4.00% | N/A | N/A | ||||||||||||||||||||
| CET1 capital ratio | 4.50% | N/A | |||||||||||||||||||||
| Tier 1 capital ratio | 6.00% | N/A | |||||||||||||||||||||
| Total capital ratio | 8.00% | N/A | |||||||||||||||||||||
| Banc of California: | |||||||||||||||||||||||
| Tier 1 leverage capital ratio | 4.00% | N/A | 5.00% | ||||||||||||||||||||
| CET1 capital ratio | 4.50% | 6.50% | |||||||||||||||||||||
| Tier 1 capital ratio | 6.00% | 8.00% | |||||||||||||||||||||
| Total capital ratio | 8.00% | 10.00% | |||||||||||||||||||||
The Company's consolidated Tier 1 leverage and Tier 1 capital ratios increased during the year ended December 31, 2023 due mainly to an increase in capital due to Banc of California, Inc. shares issued in exchange for PacWest Bancorp shares as Merger consideration, shares issued in connection with the $400 million capital raise, and lower risk-weighted assets due to securities and loan sales in 2023, partially offset by a net loss of $1.9 billion in 2023, dividends declared and paid, and higher disallowed deferred tax assets.
Subordinated Debt
We issued or assumed through mergers subordinated debt to trusts that were established by us or entities we acquired, which, in turn, issued trust preferred securities. As of December 31, 2023, the carrying value of subordinated debt totaled $936.6 million. At December 31, 2023, $131.0 million of the trust preferred securities were included in the Company's Tier I capital and $790.8 million were included in Tier II capital. For a more detailed discussion of our subordinated debt, see "Item 1. Business - Supervision and Regulation - Capital Requirements."
Dividends on Common Stock and Interest on Subordinated Debt
See "Item 1. Business - Supervision and Regulation - Dividends and Share Repurchases" and Note 22. Dividend Availability and Regulatory Matters of the Notes to Consolidated Financial Statements contained in "Item 8. Financial Statements and Supplementary Data" for discussions of factors affecting the availability of dividends and limitations on the ability to declare dividends. Interest payments made on subordinated debt are considered dividend payments under FRB regulations.
Dividends on Preferred Stock
The Company's ability to pay dividends on the Series F preferred stock depends on the ability of the Bank to pay dividends to the holding company. The ability of the Company and the Bank to pay dividends in the future is subject to bank regulatory requirements, including capital regulations and policies established by the FRB and the DFPI, as applicable. Dividends on the Series F preferred stock will not be declared, paid, or set aside for payment to the extent such act would cause us to fail to comply with applicable laws and regulations, including applicable FRB capital adequacy regulations and policies.
Stock Repurchase Program
On February 9, 2023, the legacy Banc of California, Inc. Board of Directors authorized a Stock Repurchase Program to repurchase shares of its common stock for an aggregate purchase price not to exceed $35 million which expired on the program maturity date of February 9, 2024. At December 31, 2023, the dollar value of shares that could still be purchased under the program was $13.9 million.
97
Liquidity
Liquidity Management
Liquidity is the ongoing ability to accommodate liability maturities and deposit withdrawals, fund asset growth and business operations, and meet contractual obligations through unconstrained access to funding at reasonable market rates. Liquidity management involves forecasting funding requirements and maintaining sufficient capacity to meet the needs and accommodate fluctuations in asset and liability levels due to changes in the Company’s business operations or unanticipated events.
We have a management Asset/Liability Management Committee ("MALCO") that is comprised of members of senior management and is responsible for managing commitments to meet the needs of customers while achieving our financial objectives. MALCO meets regularly to review funding capacities, current and forecasted loan demand, and investment opportunities.
We manage our liquidity by maintaining pools of liquid assets on-balance sheet, consisting of cash and receivables due from banks, interest-earning deposits in other financial institutions, and unpledged securities, which we refer to as our primary liquidity. We also maintain available borrowing capacity under secured credit lines with the FHLB and the FRBSF, which we refer to as our secondary liquidity.
As a member of the FHLB, the Bank had secured borrowing capacity with the FHLB of $5.3 billion at December 31, 2023, and $243.8 million was pledged for letters of credit but nothing was borrowed as of that date. The FHLB secured credit line was collateralized by a blanket lien on $9.5 billion of certain qualifying loans and $20.3 million of securities. The Bank also had secured borrowing capacity with the FRBSF under the Discount Window program totaling $6.9 billion at December 31, 2023, all of which was available, and $2.6 billion under the Bank Term Funding Program, which was fully borrowed as of that date. The FRBSF Discount Window secured credit line was collateralized by liens on $7.7 billion of qualifying loans and $1.3 billion of pledged securities, and the Bank Term Funding Program credit line was collateralized by pledged securities with a market value of $2.3 billion and a par value of $2.6 billion. The Bank Term Funding Program provides borrowing capacity on qualifying government and government agency guaranteed securities based on the collateral par value.
In addition to its secured lines of credit with the FHLB and FRBSF, the Bank also maintains unsecured lines of credit for the purpose of borrowing overnight funds, subject to availability, of $290.0 million in the aggregate with several correspondent banks. As of December 31, 2023, there was no balance outstanding related to these unsecured lines of credit. The Bank is a member of the AFX, through which it may either borrow or lend funds on an overnight or short-term basis with a group of pre-approved commercial banks. The availability of funds changes daily. As of December 31, 2023, there was no outstanding balance through the AFX.
The following tables provide a summary of the Bank’s primary and secondary liquidity levels at the dates indicated:
| December 31, | December 31, | ||||||||||
| Primary Liquidity - On-Balance Sheet | 2023 | 2022 | |||||||||
| (Dollars in thousands) | |||||||||||
| Cash and due from banks | $ | 202,427 | $ | 212,273 | |||||||
| Interest-earning deposits in financial institutions | 5,175,149 | 2,027,949 | |||||||||
| Securities available-for-sale, at fair value | 2,346,864 | 4,843,487 | |||||||||
| Securities held-to-maturity, at fair value | 2,168,316 | 2,110,472 | |||||||||
| Less: pledged securities, available-for-sale, at fair value | (2,063,754) | (1,178,642) | |||||||||
| Less: pledged securities, held-to-maturity, at fair value | (2,117,110) | (1,694,118) | |||||||||
| Total primary liquidity | $ | 5,711,892 | $ | 6,321,421 | |||||||
| Ratio of primary liquidity to total deposits | 18.8 | % | 18.6 | % | |||||||
98
| Secondary Liquidity - Off-Balance Sheet | December 31, | December 31, | |||||||||
| Available Secured Borrowing Capacity | 2023 | 2022 | |||||||||
| (In thousands) | |||||||||||
| Total secured borrowing capacity with the FHLB | $ | 5,302,210 | $ | 5,772,682 | |||||||
| Less: secured advances outstanding | — | (1,270,000) | |||||||||
| Less: letters of credit | (243,801) | — | |||||||||
| Available secured borrowing capacity with the FHLB | 5,058,409 | 4,502,682 | |||||||||
| Available secured borrowing capacity with the FRBSF | 6,916,235 | 2,456,905 | |||||||||
| Total secondary liquidity | $ | 11,974,644 | $ | 6,959,587 | |||||||
During the year ended December 31, 2023, the Company's primary liquidity decreased by $609.5 million to $5.7 billion at December 31, 2023 due mainly to decreases of $2.5 billion in securities available-for-sale, at fair value, $885.1 million in pledged AFS securities and $423.0 million in pledged HTM securities, offset partially by an increase of $3.1 billion increase in interest-earning deposits in financial institutions. During the year ended December 31, 2023, the Company's secondary liquidity increased by $5.0 billion to $12.0 billion at December 31, 2023 due mainly to an increase in available secured borrowing capacity with the FRBSF of $4.5 billion and an increase in available secured borrowing capacity with the FHLB of $555.7 million.
During the first six months of 2023, legacy PacWest was subject to multiple liquidity stress events that resulted in significant changes in liquidity levels and funding structure. The stress stemmed from the deposit outflow after the failure of two regional banks, which caused ripple effects in the banking industry and adversely affected legacy PacWest due to the perceived similar business profile between it and the two regional banks that failed. Legacy PacWest experienced deposit outflows of $6.5 billion or 19% of deposits over the period March 10 to March 17, 2023. Legacy PacWest experienced a second round of significant deposit outflows over the period May 1 to May 5, 2023, with an additional $2.5 billion of total deposits lost after the failure of another regional bank.
In light of these developments, legacy PacWest management activated the contingency funding plan on March 10, 2023 and took actions to stem the deposit outflows and bolster liquidity. Eventually, all available assets were pledged to borrowing lines at the FHLB and FRBSF. In addition, legacy PacWest management executed a $1.4 billion repurchase agreement collateralized by previously unpledged loans to further increase liquidity. Furthermore, legacy PacWest management utilized brokered deposits as a funding source to fill deposit gaps. Although legacy PacWest management realized the more expensive brokered deposits and borrowings would result in lower net interest income, management prioritized increasing liquidity to address deposit outflows and the potential for further deposit outflows.
In addition to the above, legacy PacWest management took other actions including: (1) announcing on May 5, 2023 the reduction in the quarterly dividend on PacWest common stock from $0.25 per share to $0.01 per share, (2) increasing the number of customers enrolled in reciprocal deposit programs, which increases the amount of FDIC insurance coverage on their account(s), to help retain these customers, (3) offering competitive promotional rates on deposit products to attract new customer deposits, and (4) beginning to reposition legacy PacWest's balance sheet and asset/liability maturity profile by selling the $2.6 billion National Construction loan portfolio, selling the $2.1 billion Lender Finance loan portfolio and selling $521 million of the Civic loan portfolio.
All of the aforementioned actions taken by legacy PacWest management helped to increase customer deposits in the later part of the second quarter and in the third quarter. Immediately available liquidity was $16.7 billion at September 30, 2023, which exceeded uninsured deposits of $5.0 billion, with a coverage ratio of 332%. Immediately available liquidity also represented 63% of total deposits at September 30, 2023. However, at September 30, 2023, despite the progress made, legacy PacWest was still not in compliance with all of its funding concentration liquidity guidelines.
Legacy PacWest's net interest margin and overall profitability were reduced as a result of the loan sales, and continued to be affected by elevated levels of higher-cost brokered deposits and borrowings. Obtaining new customer deposits, or having existing customers increase their deposit balances with us, are the primary sources of funding for our operations and is one the highest priorities of the Company. See "- Balance Sheet Analysis - Deposits" for additional information and detail of our deposits. Additionally, we fund our operations with cash flows from our loan and securities portfolios.
99
Our deposit balances may decrease if customers withdraw funds from the Bank. In order to address the Bank’s liquidity risk from fluctuating deposit balances, the Bank maintains adequate levels of available liquidity on and off the balance sheet.
We use brokered deposits, the availability of which is uncertain and subject to competitive market forces and regulation, for liquidity management purposes. At December 31, 2023, brokered deposits totaled $4.6 billion, consisting of $1.1 billion of non-maturity brokered accounts and $3.5 billion of brokered time deposits. At December 31, 2022, brokered deposits totaled $4.9 billion, consisting of $2.6 billion of non-maturity brokered accounts and $2.3 billion of brokered time deposits.
Our liquidity policy includes guidelines, which are governed by the Company's Risk Appetite Statement, include the following metrics: Balance Sheet Liquidity Ratio (unencumbered liquid assets divided by the sum of deposits and borrowings), Brokered Deposits to Total Funding Ratio (wholesale deposits to total deposits plus borrowings), Total Borrowings to Total Funding Ratio (borrowings to total deposits and borrowings), Short-Term Non-Core Funding Ratio (retail time deposits of $250,000 or more that mature within one year, brokered deposits that mature within one year, listing service deposits that mature within one year, official checks, escrow and title company deposits, 1031 exchange accommodator deposits, Federal Funds purchased, and borrowings that mature within one year as a percentage of total assets) and the Wholesale Funding Ratio (wholesale deposits to total deposits and borrowings). At December 31, 2023, after completion of the Merger and balance sheet repositioning strategy, the Bank was in compliance with all of its funding concentration liquidity guidelines.
Holding Company Liquidity
Banc of California, Inc. acts as a source of financial strength for the Bank which can also include being a source of liquidity. The primary sources of liquidity for the holding company include dividends from the Bank, intercompany tax payments from the Bank, and Banc of California, Inc.'s ability to raise capital, issue subordinated debt, and secure outside borrowings. Banc of California, Inc.'s ability to obtain funds for the payment of dividends to our stockholders, the repurchase of shares of common stock, and other cash requirements is largely dependent upon the Bank’s earnings. The Bank is subject to restrictions under certain federal and state laws and regulations that limit its ability to transfer funds to the holding company through intercompany loans, advances, or cash dividends. Banc of California, Inc.'s ability to pay dividends is also subject to the restrictions set forth by the FRB, and by certain covenants contained in our subordinated debt. See “Item 1. Business - Supervision and Regulation - Banc of California, Inc. - Repurchases/Redemptions; Dividends.” and Note 22. Dividend Availability and Regulatory Matters of the Notes to Consolidated Financial Statements contained in “Item 8. Financial Statements and Supplementary Data” for discussions of factors affecting the availability of dividends and limitations on the ability to declare dividends.
Dividends on the Series F preferred stock are not cumulative or mandatory. If the Company's Board of Directors does not declare a dividend on the Series F preferred stock in respect of a dividend period, then no dividend shall be deemed to be payable for such dividend period or be cumulative, and the Company will have no obligation to pay any dividend for that dividend period, whether or not the Board of Directors declares a dividend on the Series F preferred stock or any other class or series of its capital stock for any future dividend period. However, if dividends on the Series F preferred stock have not been declared or paid for the equivalent of six dividend payments, whether or not for consecutive dividend periods, holders of the outstanding shares of Series F preferred stock, together with holders of any other series of the Company's preferred stock ranking equal with the Series F preferred stock with similar voting rights, will generally be entitled to vote for the election of two additional directors. Additionally, so long as any share of Series F preferred stock remains outstanding, unless dividends on all outstanding shares of Series F preferred stock for the most recently completed dividend period have been paid in full or declared and a sum sufficient for the payment thereof has been set aside for payment, no dividend shall be declared or paid or set aside for payment and no distribution shall be declared or made or set aside for payment on the Company's common stock.
At December 31, 2023, Banc of California, Inc. had $285.8 million in cash and cash equivalents, of which a portion is on deposit at the Bank. We believe this amount of cash, along with anticipated future dividends from the Bank, will be sufficient to fund the holding company’s cash flow needs over the next 12 months.
100
Material Cash Requirements
Our material contractual obligations are primarily for time deposits, subordinated debt, commitments to contribute capital to investments in LIHTC partnerships, SBICs and CRA-related loan pools, and operating lease obligations. At December 31, 2023, time deposits totaled $6.6 billion, of which $6.5 billion was due within one year. Gross subordinated debt totaled $1.0 billion, all of which was due after five years. Our liability to contribute capital to LIHTC partnerships was $161.1 million and our commitment to contribute capital to SBICs and CRA-related loan pools was $94.5 million for a combined total of $255.6 million, of which $146.6 million was due within one year. Our operating lease obligation for leased facilities totaled $180.4 million, of which $39.8 million was due within one year. For further information regarding these items, see Note 10. Deposits, Note 11. Borrowings and Subordinated Debt, Note 8. Other Assets, Note 13. Commitments and Contingencies, and Note 9. Leases of the Notes to Consolidated Financial Statements contained in “Item 8. Financial Statements and Supplementary Data.”
We believe that we will be able to meet our contractual obligations as they come due through the maintenance of adequate liquidity levels. We expect to maintain adequate liquidity levels through profitability, loan and lease payoffs, securities repayments and maturities, and continued deposit gathering activities. We also have in place various borrowing mechanisms for both short-term and long-term liquidity needs.
Our obligations also include off-balance sheet arrangements consisting of loan commitments, of which only a portion is expected to be funded, and standby letters of credit. At December 31, 2023, our loan commitments and standby letters of credit were $5.6 billion and $252.6 million, respectively. The loan commitments, a portion of which will eventually result in funded loans, increase our profitability through net interest income when drawn and unused commitment fees prior to being drawn. We manage our overall liquidity taking into consideration funded and unfunded commitments as a percentage of our liquidity sources. Our liquidity sources, as described in “- Liquidity - Liquidity Management,” have been and are expected to be sufficient to meet the cash requirements of our lending activities. For further information on loan commitments, see Note 13. Commitments and Contingencies of the Notes to Consolidated Financial Statements contained in “Item 8. Financial Statements and Supplementary Data.”
Recent Accounting Pronouncements
See Note 1. Nature of Operations and Summary of Significant Accounting Policies of the Notes to Consolidated Financial Statements contained in “Item 8. Financial Statements and Supplementary Data” for information on recent accounting pronouncements and their expected impact, if any, on our consolidated financial statements.
101
ITEM 7A. QUANTITATIVE AND QUALITATIVE DISCLOSURES ABOUT MARKET RISK
Market Risk - Foreign Currency Exchange
We enter into foreign exchange contracts with our clients and counterparty banks primarily for the purpose of offsetting or hedging clients' foreign currency exposures arising out of commercial transactions, and we enter into cross currency swaps and foreign exchange forward contracts to hedge exposures to loans and debt instruments denominated in foreign currencies. We have experienced and will continue to experience fluctuations in our net earnings as a result of transaction gains or losses related to revaluing certain asset and liability balances that are denominated in currencies other than the U.S. Dollar and the derivatives that hedge those exposures. As of December 31, 2023, the U.S. Dollar notional amounts of loans receivable and subordinated debt payable denominated in a foreign currency were $8.8 million and $28.5 million, and the U.S. Dollar notional amounts of derivatives outstanding to hedge this foreign currency exposures were $8.8 million and $28.5 million. We recognized a foreign currency translation net loss of $0.3 million for the year ended December 31, 2023 and net gains of $2.0 million, and $0.3 million for the years ended December 31, 2022 and 2021, respectively.
Asset/Liability Management and Interest Rate Sensitivity
Interest Rate Risk - Company Governance. On a monthly basis, we measure our IRR position using two methods: (i) Net Interest Income ("NII") simulation analysis and (ii) Market Value of Equity ("MVE") modeling. MALCO and the Finance Committee of the Company's Board of Directors review the results of these analyses at least quarterly. As discussed in more detail below, if projected changes to interest rates cause changes to our simulated net present value of equity and/or net interest income to be outside our pre-established IRR limits, we may adjust our asset and liability mix in an effort to bring our interest rate risk exposure within our established limits.
The pre-established IRR Limits are recommended by management, determined based on analytical review and available peer data published by regulatory agencies about the IRR Limits utilized by other regional banks, and documented in the Company's ALCO Policy. The ALCO Policy is approved by MALCO and the Finance Committee of the Board of Directors annually. We believe our ALCO Policy IRR Limits are consistent with prevailing practice in the regional banking industry.
We use a balance sheet simulation model (the "IRR Model") to estimate changes in NII and MVE that would result from immediate and sustained changes in interest rates as of the measurement date. This IRR Model assesses the changes in NII and MVE that would occur in response to an instantaneous and sustained increase and decrease in market interest rates of +-100, +-200, +-300, and +400 basis points. This model is an IRR management tool, and the results are not necessarily an indication of our future net interest income. The IRR Model has inherent limitations and the model's results are based on a given set of rate changes and assumptions at a single point in time.
The IRR Model is updated monthly and the IRR Model results are reported to MALCO and the Finance Committee of the Company's Board of Directors at each monthly or quarterly meeting, as applicable.
During the banking stress event from March through May 2023, legacy PacWest management kept the legacy PacWest Executive ALM Committee and Finance Committee informed of the IRR and liquidity stresses legacy PacWest was facing. As previously discussed in the "Liquidity Management" section, legacy PacWest management formulated a strategic plan to retain customers and attract new customer deposits and, consistent with its previously disclosed strategy, legacy PacWest began to reposition the balance sheet by selling certain large loan pools. These actions were designed to improve liquidity and the IRR profile of legacy PacWest over time. The Merger has resulted in reduced interest rate risk of the Company by increasing capital, reducing the volume of fixed-rate assets, and paying down borrowings and brokered deposits.
Our Risk When Interest Rates Change. The rates of interest we earn on assets and pay on liabilities generally are established contractually for a period of time. Market interest rates change over time. Accordingly, our results of operations, like those of other financial institutions, are impacted by changes in interest rates and the interest rate sensitivity of our assets and liabilities. The risk associated with changes in interest rates and our ability to adapt to these changes is known as interest rate risk and is our most significant market risk.
102
How We Measure Our Risk of Interest Rate Changes. As part of our attempt to manage our exposure to changes in interest rates and comply with applicable regulations, we have established asset/liability committees to monitor our interest rate risk. In monitoring interest rate risk we continually analyze and manage assets and liabilities based on their payment streams and interest rates, the timing of their maturities and/or prepayments, and their sensitivity to actual or potential changes in market interest rates.
MALCO is comprised of select members of senior management. The Company also has a Finance Committee of the Boards of Directors of the Company and the Bank (together with MALCO, the “ALCOs”). In order to manage the risk of potential adverse effects of material and prolonged or volatile changes in interest rates on our results of operations, we have adopted asset/liability management policies to align maturities and repricing terms of interest-earning assets to interest-bearing liabilities. The asset/liability management policies establish guidelines for the volume and mix of assets and funding sources taking into account relative costs and spreads, interest rate sensitivity and liquidity needs, while management monitors adherence to those guidelines with oversight by the ALCOs. The objectives are to manage assets and funding sources to produce results that are consistent with liquidity, capital adequacy, growth, risk, and profitability goals. The ALCOs meet no less than quarterly to review, among other things, economic conditions and interest rate outlook, current and projected liquidity needs and capital position, anticipated changes in the volume and mix of assets and liabilities and interest rate risk exposure limits versus current projections pursuant to our economic value of equity analysis.
In order to manage our assets and liabilities and achieve the desired liquidity, credit quality, interest rate risk, profitability and capital targets, we evaluate various strategies including:
•Complementing our current loan origination platform through strategic acquisitions of whole loans,
•Strategically managing multiple warehouse relationships,
•Originating shorter-term consumer loans,
•Managing the level of investments and duration of investment securities,
•Managing our deposits to establish stable deposit relationships, and
•Using FHLB advances and/or certain derivatives such as swaps as hedges to align maturities and repricing terms.
At times, depending on the level of general interest rates, the relationship between long- and short-term interest rates, market conditions and competitive factors, the ALCOs may decide to increase our interest rate risk position within the asset/liability tolerance set forth by our Board of Directors. As part of its procedures, the ALCOs regularly review interest rate risk by forecasting the impact of alternative interest rate environments on net interest income and our economic value of equity.
Interest Rate Sensitivity of Economic Value of Equity and Net Interest Income
Interest rate risk results from our banking activities and is the primary market risk for us. Interest rate risk is caused by the following factors:
•Repricing risk - timing differences in the repricing and maturity of interest-earning assets and interest-bearing liabilities;
•Option risk - changes in the expected maturities of assets and liabilities, such as borrowers’ ability to prepay loans and depositors’ ability to redeem certificates of deposit before maturity;
•Yield curve risk - changes in the yield curve where interest rates increase or decrease in a nonparallel fashion; and
•Basis risk - changes in spread relationships between different yield curves, such as U.S. Treasuries, U.S. Prime Rate, SOFR, and LIBOR.
Since our earnings are primarily dependent on our ability to generate net interest income, we focus on actively monitoring and managing the effects of adverse changes in interest rates on our net interest income. Management of our interest rate risk is overseen by the Finance Committee of the Board, which delegates the day to day management of interest rate risk to the MALCO. MALCO ensures that the Bank is following the appropriate and current regulatory guidance in the formulation and implementation of our interest rate risk program. The Finance Committee of the Board reviews the results of our interest rate risk modeling quarterly to ensure that we have appropriately measured our interest rate risk, mitigated our exposures appropriately and any residual risk is acceptable. In addition to our annual review of our asset liability management policy, our Board of Directors periodically reviews the interest rate risk policy limits.
103
Interest rate risk management is an active process that encompasses monitoring loan and deposit flows complemented by investment and funding activities. Effective management of interest rate risk begins with understanding the dynamic repricing characteristics of our assets and liabilities and determining the appropriate interest rate risk posture given business forecasts, management objectives, market expectations, and policy constraints.
Our interest rate risk exposure is measured and monitored through various risk management tools, including a simulation model that performs interest rate sensitivity analysis under multiple scenarios. The simulation model is based on the actual maturities and re-pricing characteristics of the Bank’s interest-rate sensitive assets and liabilities. The simulated interest rate scenarios include an instantaneous parallel shift in the yield curve (“Rate Shock”). We then evaluate the simulation results using two approaches: Net Interest Income at Risk (“NII at Risk”), and Economic Value of Equity (“EVE”). Under NII at Risk, the impact on net interest income from changes in interest rates on interest-earning assets and interest-bearing liabilities is modeled utilizing various assumptions for assets, liabilities, and derivatives.
EVE measures the period end present value of assets minus the present value of liabilities. Asset liability management uses this value to measure the changes in the economic value of the Company under various interest rate scenarios. In some ways, the economic value approach provides a broader scope than net income volatility approach since it captures all anticipated cash flows.
The balance sheet is considered “asset sensitive” when an increase in short-term interest rates is expected to expand our net interest income, as rates earned on our interest-earning assets reprice higher at a pace faster than rates paid on our interest-bearing liabilities. Conversely, the balance sheet is considered “liability sensitive” when an increase in short-term interest rates is expected to compress our net interest income, as rates paid on our interest-bearing liabilities reprice higher at a pace faster than rates earned on our interest-earning assets.
At December 31, 2023, our interest rate risk profile is slightly “liability sensitive”, as compared to a “neutral” interest rate risk profile position as of December 31, 2022. This shift is primarily due to the change in the mix of assets and funding sources during 2023 due to the Merger and the balance sheet repositioning completed in the fourth quarter of 2023. Given the uncertainty of the magnitude, timing and direction of future interest rate movements, as well as the shape of the yield curve, actual results may vary materially from those predicted by our model.
The following table presents the projected change in the Company’s economic value of equity at December 31, 2023 and net interest income over the next twelve months, that would occur upon an immediate change in interest rates, but without giving effect to any steps that management might take to counteract that change:
Change in Interest Rates in Basis Points (bps) (1) | |||||||||||||||||||||||||||||||||||
| Economic Value of Equity | Net Interest Income | ||||||||||||||||||||||||||||||||||
| Amount | Percentage | Amount | Percentage | ||||||||||||||||||||||||||||||||
| December 31, 2023 | Amount | Change | Change | Amount | Change | Change | |||||||||||||||||||||||||||||
| (Dollars in millions) | |||||||||||||||||||||||||||||||||||
| +200 bps | $ | 5,588 | $ | (468) | (7.7) | % | $ | 991 | $ | (47) | (4.5) | % | |||||||||||||||||||||||
| +100 bps | $ | 5,826 | $ | (230) | (3.8) | % | $ | 1,009 | $ | (29) | (2.8) | % | |||||||||||||||||||||||
| 0 bps | $ | 6,056 | $ | 1,038 | |||||||||||||||||||||||||||||||
| -100 bps | $ | 6,281 | $ | 225 | 3.7 | % | $ | 1,064 | $ | 26 | 2.5 | % | |||||||||||||||||||||||
| -200 bps | $ | 6,491 | $ | 435 | 7.2 | % | $ | 1,099 | $ | 61 | 5.9 | % | |||||||||||||||||||||||
(1)Assumes an instantaneous uniform change in interest rates at all maturities and no rate shock has a rate lower than zero percent.
104
ITEM 8. FINANCIAL STATEMENTS AND SUPPLEMENTARY DATA
Contents
| Management’s Report on Internal Control Over Financial Reporting | |||||
| Report of Independent Registered Public Accounting Firm | |||||
Consolidated Balance Sheets as of December 31, 2023 and 2022 | |||||
Consolidated Statements of Earnings (Loss) for the Years Ended December 31, 2023, 2022, and 2021 | |||||
Consolidated Statements of Comprehensive Income (Loss) for the Years Ended December 31, 2023, 2022, and 2021 | |||||
Consolidated Statements of Changes in Stockholders’ Equity for the Years Ended December 31, 2023, 2022, and 2021 | |||||
Consolidated Statements of Cash Flows for the Years Ended December 31, 2023, 2022, and 2021 | |||||
| Notes to Consolidated Financial Statements | |||||
105
MANAGEMENT’S REPORT ON INTERNAL CONTROL OVER FINANCIAL REPORTING
The management of Banc of California, Inc., including its consolidated subsidiaries, is responsible for establishing and maintaining adequate internal control over financial reporting. The Company’s internal control system was designed to provide reasonable assurance to the Company’s management and Board of Directors regarding the preparation and fair presentation of published financial statements in accordance with U.S. generally accepted accounting principles. All internal control systems, no matter how well designed, have inherent limitations. Therefore, even those systems determined to be effective can provide only reasonable assurance with respect to financial statement preparation and presentation.
Management maintains a comprehensive system of controls intended to ensure that transactions are executed in accordance with management’s authorization, assets are safeguarded, and financial records are reliable. Management also takes steps to see that information and communication flows are effective and to monitor performance, including performance of internal control procedures.
As of December 31, 2023, Banc of California, Inc. management assessed the effectiveness of the Company’s internal control over financial reporting based on the framework established in Internal Control-Integrated Framework (2013) issued by the Committee of Sponsoring Organizations of the Treadway Commission. Based on this assessment, management has determined that the Company’s internal control over financial reporting as of December 31, 2023, is effective.
Because of its inherent limitations, internal control over financial reporting may not prevent or detect misstatements should they occur. Also, projections of any evaluation of effectiveness to future periods are subject to the risk that controls may become inadequate because of changes in conditions, or that the degree of compliance with the control procedures may deteriorate.
KPMG LLP, the independent registered public accounting firm that audited the Company’s consolidated financial statements included in this Annual Report on Form 10‑K, has issued a report on the effectiveness of the Company’s internal control over financial reporting as of December 31, 2023. The report, which expresses an unqualified opinion on the effectiveness of the Company’s internal control over financial reporting as of December 31, 2023, is included in this Item under the heading “Report of Independent Registered Public Accounting Firm.”
106
Report of Independent Registered Public Accounting Firm
To the Stockholders and Board of Directors
Banc of California, Inc.:
Opinions on the Consolidated Financial Statements and Internal Control Over Financial Reporting
We have audited the accompanying consolidated balance sheets of Banc of California, Inc. and subsidiaries (the Company) as of December 31, 2023 and 2022, the related consolidated statements of earnings (loss), comprehensive income (loss), changes in stockholders’ equity, and cash flows for each of the years in the three‑year period ended December 31, 2023, and the related notes (collectively, the consolidated financial statements). We also have audited the Company's internal control over financial reporting as of December 31, 2023, based on criteria established in Internal Control - Integrated Framework (2013) issued by the Committee of Sponsoring Organizations of the Treadway Commission.
In our opinion, the consolidated financial statements referred to above present fairly, in all material respects, the financial position of the Company as of December 31, 2023 and 2022, and the results of its operations and its cash flows for each of the years in the three‑year period ended December 31, 2023, in conformity with U.S. generally accepted accounting principles. Also in our opinion, the Company maintained, in all material respects, effective internal control over financial reporting as of December 31, 2023 based on criteria established in Internal Control - Integrated Framework (2013) issued by the Committee of Sponsoring Organizations of the Treadway Commission.
Basis for Opinions
The Company’s management is responsible for these consolidated financial statements, for maintaining effective internal control over financial reporting, and for its assessment of the effectiveness of internal control over financial reporting, included in the accompanying Management's Report on Internal Control Over Financial Reporting. Our responsibility is to express an opinion on the Company’s consolidated financial statements and an opinion on the Company’s internal control over financial reporting based on our audits. We are a public accounting firm registered with the Public Company Accounting Oversight Board (United States) (PCAOB) and are required to be independent with respect to the Company in accordance with the U.S. federal securities laws and the applicable rules and regulations of the Securities and Exchange Commission and the PCAOB.
We conducted our audits in accordance with the standards of the PCAOB. Those standards require that we plan and perform the audits to obtain reasonable assurance about whether the consolidated financial statements are free of material misstatement, whether due to error or fraud, and whether effective internal control over financial reporting was maintained in all material respects.
Our audits of the consolidated financial statements included performing procedures to assess the risks of material misstatement of the consolidated financial statements, whether due to error or fraud, and performing procedures that respond to those risks. Such procedures included examining, on a test basis, evidence regarding the amounts and disclosures in the consolidated financial statements. Our audits also included evaluating the accounting principles used and significant estimates made by management, as well as evaluating the overall presentation of the consolidated financial statements. Our audit of internal control over financial reporting included obtaining an understanding of internal control over financial reporting, assessing the risk that a material weakness exists, and testing and evaluating the design and operating effectiveness of internal control based on the assessed risk. Our audits also included performing such other procedures as we considered necessary in the circumstances. We believe that our audits provide a reasonable basis for our opinions.
107
Definition and Limitations of Internal Control Over Financial Reporting
A company’s internal control over financial reporting is a process designed to provide reasonable assurance regarding the reliability of financial reporting and the preparation of financial statements for external purposes in accordance with generally accepted accounting principles. A company’s internal control over financial reporting includes those policies and procedures that (1) pertain to the maintenance of records that, in reasonable detail, accurately and fairly reflect the transactions and dispositions of the assets of the company; (2) provide reasonable assurance that transactions are recorded as necessary to permit preparation of financial statements in accordance with generally accepted accounting principles, and that receipts and expenditures of the company are being made only in accordance with authorizations of management and directors of the company; and (3) provide reasonable assurance regarding prevention or timely detection of unauthorized acquisition, use, or disposition of the company’s assets that could have a material effect on the financial statements.
Because of its inherent limitations, internal control over financial reporting may not prevent or detect misstatements. Also, projections of any evaluation of effectiveness to future periods are subject to the risk that controls may become inadequate because of changes in conditions, or that the degree of compliance with the policies or procedures may deteriorate.
Critical Audit Matters
The critical audit matters communicated below are matters arising from the current period audit of the consolidated financial statements that were communicated or required to be communicated to the audit committee and that: (1) relate to accounts or disclosures that are material to the consolidated financial statements and (2) involved our especially challenging, subjective, or complex judgments. The communication of critical audit matters does not alter in any way our opinion on the consolidated financial statements, taken as a whole, and we are not, by communicating the critical audit matters below, providing separate opinions on the critical audit matters or on the accounts or disclosures to which they relate.
Allowance for credit losses for loans and leases collectively evaluated
As discussed in Note 1 to the consolidated financial statements, the Company’s allowance for credit losses for loans and leases collectively evaluated is the combination of an allowance for loan and lease losses collectively evaluated (reserve on pooled loans and leases) and the reserve for unfunded loan commitments (collective ACL). As discussed in Note 5 to the consolidated financial statements, the Company’s total allowance for credit losses as of December 31, 2023 was $311.3 million, of which $311.3 million is related to the collective ACL. The collective ACL is measured with the current expected credit loss (CECL) approach for financial instruments measured at amortized cost and other commitments to extend credit which share similar risk characteristics and reflects losses over the remaining contractual life of an asset, considering the effect of prepayments and available information about the collectability of cash flows, including information about relevant historical loss experience, current conditions, and reasonable and supportable forecasts of future events and circumstances. The Company’s CECL methodology for the reserve on pooled loans and leases component includes both quantitative and qualitative loss factors which are applied to the population of loans and leases and assessed at a pool level. The Company estimates the probability of default (PD) during the reasonable and supportable period using econometric regression models developed to correlate macroeconomic variables to historical credit performance for pooled loans, excluding pools that have insignificant current balances and/or insignificant historical losses and purchased single-family residential mortgage loans. The loans and unfunded commitments are grouped into loss given default (LGD) pools based on portfolio classes that share similar collateral risk characteristics. LGD rates are computed based on the net charge-offs recognized divided by the exposure at default (EAD) of defaulted loans. The Company estimates the reserve for unfunded loan commitments using the same PD, LGD, and prepayment rates as used for the reserve on pooled loans and leases. The reserve for unfunded loan commitments is computed using expected future utilization rates of the unfunded commitments during the contractual life of the commitments based on historical usage of unfunded commitments by loan pool. For the reasonable and supportable forecast period, future macroeconomic events and circumstances are estimated using a single economic forecast scenario or weighting of multiple scenarios that is consistent with the Company’s current expectations for the loan pools. The EAD is multiplied by the PD and LGD rates to calculate expected losses through the end of the forecast period. The Company then reverts on a straight-line basis from the PD, LGD, and prepayment rates used during the reasonable and supportable period to the Company’s historical PD, LGD, and prepayment experience. For the purchased single-family residential mortgage loans, a third-party model for estimating prepayment, PD, and LGD based on forecasted economic conditions and historical residential mortgage loan performance is applied. The qualitative portion of the reserve on pooled loans and leases represents the Company’s judgment of additional considerations to account for internal and external risk factors that are not adequately measured in the quantitative reserve, including consideration of idiosyncratic risk factors, conditions that may not be reflected in
108
quantitatively derived results, or other relevant factors to ensure the collective ACL reflects the Company’s best estimate of current expected credit losses.
We identified the collective ACL as a critical audit matter. A high degree of audit effort, including specialized skills and knowledge, and subjective and complex auditor judgment was involved. Specifically, this included an evaluation of the collective ACL methodology, including the methods and models used to estimate the PD, LGD, prepayments and their significant assumptions, including the pooling of loans and leases which share similar risk characteristics, the selection and weighting of economic forecasts and macroeconomic events and circumstances, the reasonable and supportable forecast period, the reversion to the Company’s historical PD, LGD, and prepayment experience for the remaining contractual life of the loans and leases, internal risk ratings for commercial loans, and the qualitative loss factors and their significant assumptions, including the idiosyncratic risk factors. An evaluation of the conceptual soundness of the PD, LGD, and prepayment models was included. Also included was an evaluation of the determination of expected future utilization rates on unfunded loan commitments utilized in the reserve for unfunded loan commitments. In addition, auditor judgment was required to evaluate the sufficiency of audit evidence obtained.
The following are the primary procedures we performed to address this critical audit matter. We evaluated the design and tested the operating effectiveness of certain internal controls related to the Company’s measurement of the collective ACL estimate, including controls over the:
•development and approval of the collective ACL methodology
•development of the PD, LGD, and prepayment models
•identification and determination of the significant assumptions used in the PD, LGD, and prepayment models used to calculate the collective ACL
•development of the qualitative loss factors, including the significant assumptions used in the measurement of the qualitative factors
•development of the expected future utilization rates of unfunded loan commitments
•analysis of the collective ACL results, trends, and ratios.
We evaluated the Company’s process to develop the collective ACL estimate by testing certain sources of data, factors, and assumptions that the Company used, and considered the relevance and reliability of such data, factors, and assumptions. In addition, we involved credit risk professionals with specialized skills and knowledge, who assisted in the following:
•evaluating the collective ACL methodology for compliance with U.S. generally accepted accounting principles
•evaluating judgments made by the Company relative to the development and performance testing of the PD, LGD, and prepayment models by comparing them to relevant Company-specific metrics and trends and the applicable industry and regulatory practices
•assessing the conceptual soundness and performance of the PD, LGD, and prepayment models by inspecting the model documentation to determine whether the models are suitable for their intended use
•evaluating the selection and weightings of the economic forecasts and underlying assumptions by comparing them to relevant Company-specific metrics and trends and the applicable industry and regulatory practices
•evaluating the economic forecasts and macroeconomic events and circumstances through comparison to publicly available forecasts
•evaluating the length of the historical observation period, reasonable and supportable forecast period, and reversion period by comparing them to specific portfolio risk characteristics and trends
•determining whether the loan and lease portfolio is pooled by similar risk characteristics by comparing to the Company’s business environment and relevant industry practices
•evaluating individual internal risk ratings for a selection of commercial loans by evaluating the financial performance of the borrower, sources of repayment, and any relevant guarantees or underlying collateral
•evaluating the methodology used to develop the qualitative loss factors and their significant assumptions, and the effect of those factors on the collective ACL compared with relevant credit risk factors and consistency with credit trends and identified limitations of the underlying quantitative models
•evaluating the methodology of the expected future utilization rates of unfunded loan commitments by comparing them to relevant Company-specific metrics and trends.
109
We also assessed the sufficiency of the audit evidence obtained related to the Company’s collective ACL by evaluating the:
•cumulative results of the audit procedures
•qualitative aspects of the Company’s accounting practices
•potential bias in the accounting estimate.
Valuation of Goodwill
As discussed in Notes 1 and 7 to the consolidated financial statements, the Company performs goodwill impairment testing on an annual basis in the fourth quarter and whenever events or changes in circumstances indicate that the carrying value of a reporting unit more likely than not exceeds its fair value. Impairment exists when the carrying value of the reporting unit exceeds its fair value, and an impairment loss is recognized in an amount equal to that excess. During the quarter ended March 31, 2023, the Company performed a quantitative goodwill impairment assessment because qualitative factors indicated it was more-likely-than-not that goodwill was impaired. The Company impaired its existing goodwill balance at March 31, 2023, which is reflected as an impairment loss of $1.4 billion during the year ended December 31, 2023. The Company applied the market approach using an average share price of the Company’s stock and a control premium to determine the fair value of the reporting unit.
We identified the goodwill impairment as a critical audit matter. The evaluation of the methodology and significant assumptions used to estimate the fair value of the reporting unit involved a high degree of auditor judgment and specialized skills and knowledge. Specifically, the control premium assumption and the length of time used to determine the average share price of the Company’s stock involved subjective assessments of market and economic conditions.
The following are the primary procedures we performed to address this critical audit matter. We evaluated the design and tested the operating effectiveness of certain internal controls related to the goodwill impairment process, specifically controls over the estimated fair value of the reporting unit used in the valuation of goodwill, including controls over the determination of (1) the length of time used to determine the average share price of the Company’s stock and (2) the control premium assumption. We evaluated the length of time used to determine the average share price of the Company’s stock by comparing the average share price to historical stock price information, taking into account economic and market data. In addition, we involved valuation professionals with specialized skills and knowledge, who assisted in evaluating the control premium assumption by comparing it to a control premium range that was independently developed using publicly available market data for comparable entities.
Determination of the accounting acquirer
As discussed in Notes 1 and 2 to the consolidated financial statements, on November 30, 2023, PacWest Bancorp merged with and into Banc of California, Inc. (the Merger), with Banc of California, Inc. continuing as the surviving legal corporation pursuant to the Agreement and Plan of Merger (the merger agreement). The Merger was accounted for as a reverse merger using the acquisition method of accounting. PacWest Bancorp was deemed the accounting acquirer for financial reporting purposes.
We identified the Company’s determination of the accounting acquirer as a critical audit matter. A high degree of auditor judgment was required in evaluating the relative importance of the indicative factors, individually and in the aggregate, including the post combination voting rights, composition of the board of directors and management, the terms of the exchange, the relative size of the entities, minority voting rights, and the entity initiating the business combination. A different conclusion would result in a material difference in the accounting for the Merger.
The following are the primary procedures we performed to address this critical audit matter. We evaluated the design and tested the operating effectiveness of the internal control over the Company’s process to determine the accounting acquirer, including assessment of the indicative factors described above. We tested the Company’s conclusion about the accounting acquirer by:
110
•reviewing management’s accounting memorandum that documented the factors the Company considered in determining the accounting acquirer and evaluating management’s assessment of the post combination voting rights, composition of the board of directors and management, the terms of the exchange, the relative size of the entities, minority voting interests, and the entity initiating the combination by comparing them to the (a) audited financial statements and other financial information of Banc of California, Inc. and PacWest Bancorp, respectively, (b) the relevant organizational documents, (c) certain regulatory filings related to the Merger, and (d) the merger agreement
•corroborating our understanding with internal legal counsel and the audit committee
•inquiring of both Banc of California, Inc. and PacWest Bancorp management and inspection of board minutes regarding the business purpose of the transaction and decisions regarding the appointment of board members.
Valuation of loans and leases and the core deposit intangible assets in connection with the reverse merger accounting
As discussed in Notes 1 and 2 to the consolidated financial statements, on November 30, 2023, PacWest Bancorp merged with and into the Company. The merger was accounted for as a reverse merger using the acquisition method of accounting and accounted for as a business combination. The assets acquired and liabilities assumed are required to be measured at their respective fair values at the date of merger. At the merger date, the Company recorded acquired loans and leases held for investment with a fair value of $4.0 billion and a core deposit intangible (CDI) asset with a fair value of $145.2 million. The Company estimated the fair value of most of the acquired loans and leases held for investment using a discounted cash flow methodology (DCF loans and leases). The DCF loans and leases were segmented into three groups, including performing purchased credit deteriorated (PCD) loans, non-performing PCD loans and non-PCD loans and further pooled based on loan type and internal risk rating bands. The methodology included projecting cash flows based on the contractual terms of the loans and the cash flows were adjusted to reflect credit loss expectations along with prepayments. Discount rates were developed based on the relative risk of the cash flows, taking into consideration the loan type, market rates as of the valuation date, recent originations in the portfolio, credit loss expectations, and liquidity expectations. Lastly, cash flows adjusted for credit loss expectations were discounted to present value and summed to arrive at the fair value of the loans. The fair value of the CDI asset was estimated based on a discounted cash flow methodology that gave consideration to expected customer attrition rates, net maintenance cost of the deposit base, interest costs associated with customer deposits, and the alternative cost of funds. The cash flows from estimated net cost savings derived from the acquired core deposits were discounted to present value and summed to arrive at the fair value of the CDI asset.
We identified the valuation of the portion of the acquired loans and leases held for investment based on a discounted cash flow methodology (DCF loans and leases) and the CDI asset as a critical audit matter. Specifically, a high degree of auditor judgment and specialized skills and knowledge was required to evaluate the valuation methodologies and to assess certain assumptions used to estimate the fair values of the DCF loans and leases and the CDI asset. Specifically, the key assumptions used to estimate the fair value of the DCF loans and leases include expected credit losses, discount rates, internal risk ratings, and expected prepayments, and the key assumptions used to estimate the fair value of the CDI asset include the discount rate and alternative cost of funds. These key assumptions required subjective auditor judgment as minor changes could have had a significant impact on the estimated fair value of the respective assets.
The following are the primary procedures we performed to address this critical audit matter. We evaluated the design and tested the operating effectiveness of certain internal controls over the processes to estimate the fair values of the DCF loans and leases and the CDI asset. This included controls over the (a) determination of the valuation methodologies, (b) development of the expected credit losses, discount rates, internal risk ratings, and expected prepayment assumptions for the DCF loans and leases, and (c) development of the discount rate and alternative cost of funds assumptions for the CDI asset. We evaluated the Company’s process to determine the fair values of the DCF loans and leases and the CDI asset by testing certain sources of data and assumptions that the Company used and considered the relevance and reliability of such data and assumptions. In addition, we involved valuation professionals with specialized skills and knowledge, who assisted in:
•evaluating the valuation methodologies used by the Company for compliance with U.S. generally accepted accounting principles
•developing independent ranges of fair value for the DCF loans and leases, including developing independent assumptions utilizing market data for expected credit losses, discount rates and expected prepayment assumptions, and comparing them to the Company’s estimate of fair value
111
•evaluating individual internal risk ratings for a selection of commercial loans by evaluating the financial performance of the borrower, sources of repayment, and any relevant guarantees or underlying collateral
•evaluating the Company’s discount rate and alternative cost of funds assumptions used to estimate the fair value of the CDI asset by comparing to peer and market information from third-party sources.
/s/ KPMG LLP
We have served as the Company's auditor since 1982.
Irvine, California
February 29, 2024
112
BANC OF CALIFORNIA, INC. AND SUBSIDIARIES
CONSOLIDATED BALANCE SHEETS
| December 31, | |||||||||||
| 2023 | 2022 | ||||||||||
| (Dollars in thousands, except par value amounts) | |||||||||||
| ASSETS: | |||||||||||
| Cash and due from banks | $ | $ | |||||||||
| Interest-earning deposits in financial institutions | |||||||||||
| Total cash and cash equivalents | |||||||||||
| Securities available-for-sale, at fair value, net of allowance for credit losses | |||||||||||
(amortized cost of $ | |||||||||||
| Securities held-to-maturity, at amortized cost, net of allowance for credit losses | |||||||||||
(fair value of $ | |||||||||||
| FRB and FHLB stock, at cost | |||||||||||
| Total investment securities | |||||||||||
| Loans held for sale | |||||||||||
| Gross loans and leases held for investment | |||||||||||
| Deferred fees, net | ( | ( | |||||||||
| Allowance for loan and lease losses | ( | ( | |||||||||
| Total loans and leases held for investment, net | |||||||||||
| Equipment leased to others under operating leases | |||||||||||
| Premises and equipment, net | |||||||||||
| Bank owned life insurance | |||||||||||
| Deferred tax asset, net | |||||||||||
| Goodwill | |||||||||||
| Core deposit and customer relationship intangibles, net | |||||||||||
| Other assets | |||||||||||
| Total assets | $ | $ | |||||||||
| LIABILITIES: | |||||||||||
| Noninterest-bearing deposits | $ | $ | |||||||||
| Interest-bearing deposits | |||||||||||
| Total deposits | |||||||||||
Borrowings (including $ | |||||||||||
| Subordinated debt | |||||||||||
| Accrued interest payable and other liabilities | |||||||||||
| Total liabilities | |||||||||||
| Commitments and contingencies | |||||||||||
| STOCKHOLDERS' EQUITY: | |||||||||||
| Preferred stock | |||||||||||
Common stock ($ | |||||||||||
at December 31, 2023; | |||||||||||
December 31, 2022) | |||||||||||
Class B non-voting common stock ($ | |||||||||||
and | |||||||||||
Non-voting common stock equivalents ($ | |||||||||||
December 31, 2023 and | |||||||||||
| Additional paid-in capital | |||||||||||
| Retained (deficit) earnings | ( | ||||||||||
| Accumulated other comprehensive loss, net | ( | ( | |||||||||
| Total stockholders' equity | |||||||||||
| Total liabilities and stockholders' equity | $ | $ | |||||||||
See accompanying Notes to Consolidated Financial Statements.
113
BANC OF CALIFORNIA, INC. AND SUBSIDIARIES
CONSOLIDATED STATEMENTS OF EARNINGS (LOSS)
| Year Ended December 31, | |||||||||||||||||
| 2023 | 2022 | 2021 | |||||||||||||||
| (In thousands, except per share amounts) | |||||||||||||||||
| Interest income: | |||||||||||||||||
| Loans and leases | $ | $ | $ | ||||||||||||||
| Investment securities | |||||||||||||||||
| Deposits in financial institutions | |||||||||||||||||
| Total interest income | |||||||||||||||||
| Interest expense: | |||||||||||||||||
| Deposits | |||||||||||||||||
| Borrowings | |||||||||||||||||
| Subordinated debt | |||||||||||||||||
| Total interest expense | |||||||||||||||||
| Net interest income | |||||||||||||||||
| Provision for credit losses | ( | ||||||||||||||||
| Net interest income after provision for credit losses | |||||||||||||||||
| Noninterest income: | |||||||||||||||||
| Other commissions and fees | |||||||||||||||||
| Leased equipment income | |||||||||||||||||
| Service charges on deposit accounts | |||||||||||||||||
| (Loss) gain on sale of loans and leases | ( | ||||||||||||||||
| (Loss) gain on sale of securities | ( | ( | |||||||||||||||
| Dividends and gains (losses) on equity investments | ( | ||||||||||||||||
| Warrant (loss) income | ( | ||||||||||||||||
| LOCOM HFS adjustment | ( | ||||||||||||||||
| Other income | |||||||||||||||||
| Total noninterest income | ( | ||||||||||||||||
| Noninterest expense: | |||||||||||||||||
| Compensation | |||||||||||||||||
| Occupancy | |||||||||||||||||
| Leased equipment depreciation | |||||||||||||||||
| Data processing | |||||||||||||||||
| Insurance and assessments | |||||||||||||||||
| Other professional services | |||||||||||||||||
| Customer related expense | |||||||||||||||||
| Intangible asset amortization | |||||||||||||||||
| Loan expense | |||||||||||||||||
| Acquisition, integration and reorganization costs | |||||||||||||||||
| Goodwill impairment | |||||||||||||||||
| Other expense | |||||||||||||||||
| Total noninterest expense | |||||||||||||||||
| (Loss) earnings before income taxes | ( | ||||||||||||||||
| Income tax (benefit) expense | ( | ||||||||||||||||
| Net (loss) earnings | ( | ||||||||||||||||
| Preferred stock dividends | |||||||||||||||||
| Net (loss) earnings available to common and equivalent stockholders | $ | ( | $ | $ | |||||||||||||
| (Loss) earnings per share: | |||||||||||||||||
| Basic | $ | ( | $ | $ | |||||||||||||
| Diluted | $ | ( | $ | $ | |||||||||||||
See accompanying Notes to Consolidated Financial Statements.
114
BANC OF CALIFORNIA, INC. AND SUBSIDIARIES
CONSOLIDATED STATEMENTS OF COMPREHENSIVE INCOME (LOSS)
| Year Ended December 31, | |||||||||||||||||
| 2023 | 2022 | 2021 | |||||||||||||||
| (In thousands) | |||||||||||||||||
| Net (loss) earnings | $ | ( | $ | $ | |||||||||||||
| Other comprehensive income (loss), net of tax: | |||||||||||||||||
| Unrealized net holding gains (losses) on securities available-for-sale | |||||||||||||||||
| arising during the year | ( | ( | |||||||||||||||
| Income tax (expense) benefit related to net unrealized holding gains | |||||||||||||||||
| (losses) arising during the year | ( | ||||||||||||||||
| Unrealized net holding gains (losses) on securities available-for-sale, | |||||||||||||||||
| net of tax | ( | ( | |||||||||||||||
Reclassification adjustment for net losses (gains) included in net earnings (1) | ( | ||||||||||||||||
| Income tax (benefit) expense related to reclassification adjustment | ( | ( | |||||||||||||||
| Reclassification adjustment for net losses (gains) included in | |||||||||||||||||
| net earnings, net of tax | ( | ||||||||||||||||
| Unrealized net loss on securities transferred from | |||||||||||||||||
| available-for-sale to held-to-maturity | ( | ||||||||||||||||
| Amortization of unrealized net loss on securities transferred | |||||||||||||||||
| from available-for-sale to held-to-maturity | |||||||||||||||||
| Income tax benefit related to amortization of unrealized net loss on | |||||||||||||||||
| securities transferred from available-for-sale to held-to-maturity | ( | ( | |||||||||||||||
| Amortization of unrealized net loss on securities transferred | |||||||||||||||||
| from available-for-sale to held-to-maturity, net of tax | |||||||||||||||||
| Change in fair value of credit-linked notes | |||||||||||||||||
| Income tax expense related to change in fair value of | |||||||||||||||||
| credit-linked notes | ( | ||||||||||||||||
| Change in fair value of credit-linked notes, | |||||||||||||||||
| net of tax | |||||||||||||||||
| Unrealized (loss) gain on cash flow hedges arising during the year | ( | ||||||||||||||||
| Income tax benefit (expense) related to unrealized (loss) gain on | |||||||||||||||||
| cash flow hedges arising during the year | |||||||||||||||||
| Unrealized (loss) gain on cash flow hedges, net of tax | ( | ||||||||||||||||
| Other comprehensive income (loss), net of tax | ( | ( | |||||||||||||||
| Comprehensive (loss) income | $ | ( | $ | ( | $ | ||||||||||||
__________________________________
(1) Entire amount recognized in "(Loss) gain on sale of securities" on the Consolidated Statements of Earnings (Loss).
See accompanying Notes to Consolidated Financial Statements.
115
BANC OF CALIFORNIA, INC. AND SUBSIDIARIES
CONSOLIDATED STATEMENTS OF CHANGES IN STOCKHOLDERS' EQUITY
| Non- | |||||||||||||||||||||||||||||||||||||||||||||||
| Common Stock | Voting | Accumulated | |||||||||||||||||||||||||||||||||||||||||||||
| Class B | Common | Additional | Other | ||||||||||||||||||||||||||||||||||||||||||||
| Preferred | Non- | Stock | Paid-in | Retained | Comprehensive | ||||||||||||||||||||||||||||||||||||||||||
| Stock | Voting | Voting | Equivalents | Capital | Earnings | (Loss) Income | Total | ||||||||||||||||||||||||||||||||||||||||
| (In thousands, except per share amount) | |||||||||||||||||||||||||||||||||||||||||||||||
| Balance, December 31, 2020 | $ | — | $ | $ | — | $ | — | $ | $ | $ | $ | ||||||||||||||||||||||||||||||||||||
| Net earnings | — | — | — | — | — | — | |||||||||||||||||||||||||||||||||||||||||
| Other comprehensive loss, | |||||||||||||||||||||||||||||||||||||||||||||||
| net of tax | — | — | — | — | — | — | ( | ( | |||||||||||||||||||||||||||||||||||||||
| Restricted stock awarded and | |||||||||||||||||||||||||||||||||||||||||||||||
| earned stock compensation, | |||||||||||||||||||||||||||||||||||||||||||||||
| net of shares forfeited | — | — | — | — | — | ||||||||||||||||||||||||||||||||||||||||||
| Restricted stock surrendered | — | — | — | — | ( | — | — | ( | |||||||||||||||||||||||||||||||||||||||
| Cash dividends paid: | |||||||||||||||||||||||||||||||||||||||||||||||
Common stock, $ | — | — | — | — | ( | — | — | ( | |||||||||||||||||||||||||||||||||||||||
| Balance, December 31, 2021 | — | — | — | ||||||||||||||||||||||||||||||||||||||||||||
| Net earnings | — | — | — | — | — | — | |||||||||||||||||||||||||||||||||||||||||
| Other comprehensive loss, | |||||||||||||||||||||||||||||||||||||||||||||||
| net of tax | — | — | — | — | — | — | ( | ( | |||||||||||||||||||||||||||||||||||||||
| Issuance of preferred stock, | |||||||||||||||||||||||||||||||||||||||||||||||
| net of offering costs | — | — | — | — | — | — | |||||||||||||||||||||||||||||||||||||||||
| Restricted stock awarded and | |||||||||||||||||||||||||||||||||||||||||||||||
| earned stock compensation, | |||||||||||||||||||||||||||||||||||||||||||||||
| net of shares forfeited | — | — | — | — | — | ||||||||||||||||||||||||||||||||||||||||||
| Restricted stock surrendered | — | — | — | — | ( | — | — | ( | |||||||||||||||||||||||||||||||||||||||
| Cash dividends paid: | |||||||||||||||||||||||||||||||||||||||||||||||
Preferred stock, $ | — | — | — | — | — | ( | — | ( | |||||||||||||||||||||||||||||||||||||||
Common stock, $ | — | — | — | — | ( | — | — | ( | |||||||||||||||||||||||||||||||||||||||
| Balance, December 31, 2022 | — | — | ( | ||||||||||||||||||||||||||||||||||||||||||||
| Net loss | — | — | — | — | — | ( | — | ( | |||||||||||||||||||||||||||||||||||||||
| Other comprehensive income, | |||||||||||||||||||||||||||||||||||||||||||||||
| net of tax | — | — | — | — | — | — | |||||||||||||||||||||||||||||||||||||||||
| Issuance of common stock for | |||||||||||||||||||||||||||||||||||||||||||||||
| merger with PacWest Bancorp | — | — | — | — | |||||||||||||||||||||||||||||||||||||||||||
| Proceeds from capital raise | — | — | — | — | |||||||||||||||||||||||||||||||||||||||||||
| Restricted stock awarded and | |||||||||||||||||||||||||||||||||||||||||||||||
| earned stock compensation, | |||||||||||||||||||||||||||||||||||||||||||||||
| net of shares forfeited | — | — | — | — | — | ||||||||||||||||||||||||||||||||||||||||||
| Restricted stock surrendered | — | — | — | — | ( | — | — | ( | |||||||||||||||||||||||||||||||||||||||
| Shares purchased under the | |||||||||||||||||||||||||||||||||||||||||||||||
| Dividend Reinvestment Plan | — | — | — | — | — | — | |||||||||||||||||||||||||||||||||||||||||
| Cash dividends paid: | |||||||||||||||||||||||||||||||||||||||||||||||
Preferred stock, $ | — | — | — | — | — | ( | — | ( | |||||||||||||||||||||||||||||||||||||||
Common stock, $ | — | — | — | — | ( | — | — | ( | |||||||||||||||||||||||||||||||||||||||
| Balance, December 31, 2023 | $ | $ | $ | $ | $ | $ | ( | $ | ( | $ | |||||||||||||||||||||||||||||||||||||
(1) Dividends per share amounts prior to November 30, 2023 have been restated as a result of the restatement of common stock outstanding being multiplied by the exchange ratio of 0.6569.
See accompanying Notes to Consolidated Financial Statements.
116
BANC OF CALIFORNIA, INC. AND SUBSIDIARIES
CONSOLIDATED STATEMENTS OF CHANGES IN STOCKHOLDERS' EQUITY
| Non-Voting | |||||||||||||||||||||||
| Common Stock | Common | ||||||||||||||||||||||
| Preferred | Class B | Stock | |||||||||||||||||||||
| Stock | Voting | Non-Voting | Equivalents | ||||||||||||||||||||
| (In ones) | |||||||||||||||||||||||
| Number of shares, December 31, 2020 | — | — | — | ||||||||||||||||||||
| Restricted stock awarded and earned stock | |||||||||||||||||||||||
| compensation, net of shares forfeited | — | — | — | ||||||||||||||||||||
| Restricted stock surrendered | — | ( | — | — | |||||||||||||||||||
| Number of shares, December 31, 2021 | — | — | — | ||||||||||||||||||||
| Restricted stock awarded and earned stock | |||||||||||||||||||||||
| compensation, net of shares forfeited | — | — | — | ||||||||||||||||||||
| Restricted stock surrendered | — | ( | — | — | |||||||||||||||||||
| Issuance of preferred stock | — | — | — | ||||||||||||||||||||
| Number of shares, December 31, 2022 | — | — | |||||||||||||||||||||
| Restricted stock awarded and earned stock | |||||||||||||||||||||||
| compensation, net of shares forfeited | — | — | — | ||||||||||||||||||||
| Restricted stock surrendered | — | ( | — | — | |||||||||||||||||||
| Issuance of stock for merger with | |||||||||||||||||||||||
| PacWest Bancorp | — | — | |||||||||||||||||||||
| Shares issued in capital raise | — | — | |||||||||||||||||||||
| Shares purchased under Dividend Reinvestment | |||||||||||||||||||||||
| Plan | — | — | — | ||||||||||||||||||||
| Number of shares, December 31, 2023 | |||||||||||||||||||||||
See accompanying Notes to Consolidated Financial Statements.
117
BANC OF CALIFORNIA, INC. AND SUBSIDIARIES
CONSOLIDATED STATEMENTS OF CASH FLOWS
| Year Ended December 31, | |||||||||||||||||
| 2023 | 2022 | 2021 | |||||||||||||||
| (In thousands) | |||||||||||||||||
| Cash flows from operating activities: | |||||||||||||||||
| Net (loss) earnings | $ | ( | $ | $ | |||||||||||||
| Adjustments to reconcile net (loss) earnings to net cash provided by operating activities: | |||||||||||||||||
| Goodwill impairment | |||||||||||||||||
| Depreciation and amortization | |||||||||||||||||
| Amortization of net premiums on investment securities | |||||||||||||||||
| Amortization of intangible assets | |||||||||||||||||
| Amortization of operating lease ROU assets | |||||||||||||||||
| Provision for credit losses | ( | ||||||||||||||||
| Gain on sale of foreclosed assets, net | ( | ( | ( | ||||||||||||||
| Provision for losses on foreclosed assets | |||||||||||||||||
| Loss (gain) on sale of loans and leases, net | ( | ( | |||||||||||||||
| (Gain) loss on disposal of premises and equipment | ( | ||||||||||||||||
| Loss (gain) on sale of securities, net | ( | ||||||||||||||||
| Gain on BOLI death benefits | ( | ( | |||||||||||||||
| Unrealized loss (gain) on derivatives, foreign currencies, and | |||||||||||||||||
| credit-linked notes, net | ( | ( | |||||||||||||||
| LOCOM HFS adjustment | |||||||||||||||||
| Earned stock compensation | |||||||||||||||||
| Increase in other assets | ( | ( | ( | ||||||||||||||
| Increase (decrease) in accrued interest payable and other liabilities | ( | ||||||||||||||||
| Net cash provided by operating activities | |||||||||||||||||
| Cash flows from investing activities: | |||||||||||||||||
| Cash acquired in acquisitions, net of cash consideration paid | |||||||||||||||||
| Net decrease (increase) in loans and leases | ( | ( | |||||||||||||||
| Proceeds from sales of loans and leases | |||||||||||||||||
| Proceeds from maturities and paydowns of securities available-for-sale | |||||||||||||||||
| Proceeds from sales of securities available-for-sale | |||||||||||||||||
| Purchases of securities available-for-sale | ( | ( | ( | ||||||||||||||
| Proceeds from maturities and paydowns of securities held-to-maturity | |||||||||||||||||
| Net (purchases) redemptions of Federal Home Loan Bank stock | ( | ( | |||||||||||||||
| Proceeds from sales of foreclosed assets | |||||||||||||||||
| Purchases of premises and equipment, net | ( | ( | ( | ||||||||||||||
| Proceeds from sales of premises and equipment | |||||||||||||||||
| Proceeds from BOLI death benefits | |||||||||||||||||
| Net decrease (increase) in equipment leased to others under operating leases | ( | ( | |||||||||||||||
| Net cash provided by (used in) investing activities | ( | ( | |||||||||||||||
See accompanying Notes to Consolidated Financial Statements.
118
BANC OF CALIFORNIA, INC. AND SUBSIDIARIES
CONSOLIDATED STATEMENTS OF CASH FLOWS
| Year Ended December 31, | |||||||||||||||||
| 2023 | 2022 | 2021 | |||||||||||||||
| (In thousands) | |||||||||||||||||
| Cash flows from financing activities: | |||||||||||||||||
| Net (decrease) increase in noninterest-bearing deposits | ( | ( | |||||||||||||||
| Net (decrease) increase in interest-bearing deposits | ( | ||||||||||||||||
| Net increase (decrease) in borrowings | ( | ||||||||||||||||
| Net proceeds from subordinated notes offering | |||||||||||||||||
| Net proceeds from stock issuance | |||||||||||||||||
| Net proceeds from preferred stock offering | |||||||||||||||||
| Shares purchased under the Dividend Reinvestment Plan | |||||||||||||||||
| Restricted stock surrendered | ( | ( | ( | ||||||||||||||
| Preferred stock dividends paid | ( | ( | |||||||||||||||
| Common stock dividends paid | ( | ( | ( | ||||||||||||||
| Net cash (used in) provided by financing activities | ( | ||||||||||||||||
| Net increase (decrease) in cash and cash equivalents | ( | ||||||||||||||||
| Cash and cash equivalents, beginning of year | |||||||||||||||||
| Cash and cash equivalents, end of year | $ | $ | $ | ||||||||||||||
| Supplemental disclosures of cash flow information: | |||||||||||||||||
| Cash paid for interest | $ | $ | $ | ||||||||||||||
| Cash (received) paid for income taxes | ( | ||||||||||||||||
| Loans transferred to foreclosed assets | |||||||||||||||||
| Transfers from loans held for investment to loans held for sale | |||||||||||||||||
| Transfers to loans held for investment from loans held for sale | |||||||||||||||||
| Transfer of securities available-for-sale to held-to-maturity | |||||||||||||||||
Effective November 30, 2023, the Company merged with PacWest Bancorp | |||||||||||||||||
| in a transaction summarized as follows: | |||||||||||||||||
| Fair value of assets acquired | $ | ||||||||||||||||
| Stock consideration | ( | ||||||||||||||||
| Liabilities assumed | $ | ||||||||||||||||
Effective February 1, 2021, the Company acquired Civic | |||||||||||||||||
| in a transaction summarized as follows: | |||||||||||||||||
| Fair value of assets acquired | $ | ||||||||||||||||
| Cash paid | ( | ||||||||||||||||
| Liabilities assumed | $ | ||||||||||||||||
Effective October 8, 2021, the Company acquired the HOA Business | |||||||||||||||||
| in a transaction summarized as follows: | |||||||||||||||||
| Fair value of assets acquired | $ | ||||||||||||||||
| Cash paid | ( | ||||||||||||||||
| Liabilities assumed | $ | ||||||||||||||||
See accompanying Notes to Consolidated Financial Statements.
119
BANC OF CALIFORNIA, INC. AND SUBSIDIARIES
Notes to Consolidated Financial Statements
NOTE 1. NATURE OF OPERATIONS AND SUMMARY OF SIGNIFICANT ACCOUNTING POLICIES
Banc of California, Inc., a Maryland corporation, was incorporated in March 2002 and serves as the holding company for its wholly owned subsidiary, Banc of California (the “Bank”), a California state-chartered bank and member of the FRB. When we refer to the “parent” or the “holding company", we are referring to Banc of California, Inc., the parent company, on a stand-alone basis. When we refer to “we,” “us,” “our,” or the “Company”, we are referring to Banc of California, Inc. and its consolidated subsidiaries including the Bank, collectively. As a bank holding company, Banc of California, Inc. is subject to ongoing and comprehensive supervision, regulation, examination, and enforcement by the FRB. As a California state-chartered bank and a member of the FRB, the Bank is subject to ongoing and comprehensive supervision, regulation, examination and enforcement by the DFPI and the FRB. The Bank is also a member of the FHLB system, and its deposit accounts are insured by the DIF of the FDIC.
Banc of California is one of the nation's premier relationship-based business banks focused on providing banking and treasury management services to small-, middle-market, and venture-backed businesses. The Bank offers a broad range of loan and deposit products and services to meet the banking and financial needs of the communities it serves through full-service branches throughout California and in Durham, North Carolina and Denver, Colorado, and loan production offices around the country.
(a) Basis of Presentation
The accounting and reporting policies of the Company are in accordance with U.S. generally accepted accounting principles, which we may refer to as U.S. GAAP. In the opinion of management, all significant intercompany accounts and transactions have been eliminated and adjustments, consisting solely of normal recurring accruals and considered necessary for the fair presentation of financial statements have been included.
On November 30, 2023, PacWest Bancorp merged with and into Banc of California, Inc. (the “Merger”), with Banc of California, Inc. continuing as the surviving legal corporation and Banc of California, Inc. concurrently closed a $400 million equity capital raise. The Merger was accounted for as a reverse merger using the acquisition method of accounting, therefore, PacWest Bancorp was deemed the acquirer for financial reporting purposes, even though Banc of California, Inc. was the legal acquirer. The Merger was an all-stock transaction and has been accounted for as a business combination. Banc of California Inc.'s financial results for all periods ended prior to November 30, 2023 reflect PacWest Bancorp results only on a standalone basis. In addition, Banc of California Inc.'s reported financial results for the year ended December 31, 2023 reflect PacWest Bancorp financial results only on a standalone basis until the closing of the Merger on November 30, 2023, and results of the combined company for the month of December 2023. The number of shares issued and outstanding, earnings per share, and all references to share quantities or metrics of Banc of California, Inc. have been retrospectively restated to reflect the equivalent number of shares issued in the Merger as the Merger was accounted for as a reverse merger. Under the reverse merger method of accounting, the assets and liabilities of legacy Banc of California, Inc. as of November 30, 2023 were recorded at their respective fair values. Refer to Note 2. Business Combinations for additional information on this merger.
(b) Accounting Standards Adopted in 2023
120
BANC OF CALIFORNIA, INC. AND SUBSIDIARIES
Notes to Consolidated Financial Statements
(c) Use of Estimates
The Company has made a number of estimates and assumptions relating to the reporting of assets and liabilities and the disclosure of contingent assets and liabilities at the date of the consolidated financial statements and the reported amounts of revenue and expenses during the reporting period to prepare these consolidated financial statements in conformity with U.S. GAAP. Actual results could differ from those estimates. Material estimates subject to change in the near term include, among other items, the allowance for credit losses (the combination of the allowance for loan and lease losses and the reserve for unfunded loan commitments), the carrying value of goodwill and other intangible assets, the fair value of assets and liabilities acquired in business combinations and the related purchase price allocation, and the realization of deferred tax assets. These estimates may be adjusted as more current information becomes available, and any adjustment may be significant.
(d) Reclassifications
Certain items on the consolidated financial statements and notes for the prior years have been reclassified to conform to the 2023 presentation.
(e) Cash and Cash Equivalents
For purposes of the consolidated statements of cash flows, cash and cash equivalents consist of: (1) cash on hand and cash due from banks, (2) interest‑earning deposits in financial institutions, and (3) federal funds sold with original maturities less than 90 days. Interest‑earning deposits in financial institutions represent mostly cash held at the FRBSF, the majority of which is immediately available. Restricted cash, if any, is disclosed in our financial statements.
(f) Investment in Debt Securities
We determine the classification of securities at the time of purchase. If we have the intent and the ability at the time of purchase to hold securities until maturity, they are classified as held‑to‑maturity and stated at amortized cost. Securities to be held for indefinite periods of time, but not necessarily to be held‑to‑maturity or on a long‑term basis, are classified as available‑for‑sale and carried at estimated fair value, with unrealized gains or losses reported as a separate component of stockholders’ equity in accumulated other comprehensive loss, net of applicable income taxes. Securities available‑for‑sale include securities that management intends to use as part of its asset/liability management strategy and that may be sold in response to changes in interest rates, prepayment risk, and other related factors. Securities are individually evaluated for appropriate classification when acquired. As a result, similar types of securities may be classified differently depending on factors existing at the time of purchase.
The carrying values of all securities are adjusted for amortization of premiums and accretion of discounts using the interest method. Premiums on callable securities are amortized to the earliest call date. Realized gains or losses on the sale of securities, if any, are determined using the amortized cost of the specific securities sold. Such gains or losses are included in "(Loss) gain on sale of securities" on the consolidated statements of earnings (loss).
Available-for-sale debt securities. Debt securities available-for-sale are carried at fair value and are subject to impairment testing. Premiums and discounts are amortized or accreted over the life of the security as an adjustment to its yield using the interest method. Realized gains or losses from the sale of securities are calculated using the specific identification method. A security is impaired if the fair value of the security is less than its amortized cost basis. When an available-for-sale debt security is considered impaired, the Company must determine if the decline in fair value has resulted from a credit-related loss or other factors and then, (1) recognize an allowance for credit losses by a charge to earnings for the credit-related component (if any) of the decline in fair value, and (2) recognize in other comprehensive income (loss) any non-credit related components (if any) of the fair value decline. If the amount of the amortized cost basis expected to be recovered increases in a future period, the valuation allowance would be reduced, but not more than the amount of the current existing allowance for that security.
121
BANC OF CALIFORNIA, INC. AND SUBSIDIARIES
Notes to Consolidated Financial Statements
Transfer between categories of debt securities. Upon transfer of a debt security from the available-for-sale category to the held-to-maturity category, the security's new amortized cost is reset to fair value, reduced by any previous write-offs but excluding any allowance for credit losses. Any associated unrealized gains or losses on such investments as of the date of transfer become part of the security's amortized cost and are subsequently amortized or accreted into interest income over the remaining life of the securities as effective yield adjustments using the interest method. In addition, the related unrealized gains and losses included in accumulated other comprehensive income on the date of transfer are also subsequently amortized or accreted into interest income over the remaining life of the securities as effective yield adjustments using the interest method. For transfers of securities from the available-for-sale category to the held-to-maturity category, any allowance for credit losses that was previously recorded under the available-for-sale model is reversed and an allowance for credit losses is subsequently recorded under the held-to-maturity debt security model. The reversal and re-establishment of the allowance for credit losses are recorded in the "Provisions for credit losses" on the Company's consolidated statements of earnings (loss).
Held-to-maturity debt securities. Debt securities that the Company has the intent and ability to hold until maturity are classified as held-to-maturity and are carried at amortized cost, net of the allowance for credit losses. Premiums and discounts are amortized or accreted over the life of the security as an adjustment to its yield using the interest method. Realized gains or losses from the sale of securities are calculated using the specific identification method. Held-to-maturity debt securities are generally placed on nonaccrual status using factors similar to those described for loans. The amortized cost of the Company's held-to-maturity debt securities excludes accrued interest receivable, which is included in "Other assets" on the Company's consolidated balance sheets. The Company has made an accounting policy election not to recognize an allowance for credit losses for accrued interest receivable on held-to-maturity debt securities, as the Company reverses any accrued interest against interest income if a debt security is placed on nonaccrual status. Any cash collected on nonaccrual held-to-maturity securities is applied to reduce the security's amortized cost basis and not as interest income. Generally, the Company returns a held-to-maturity security to accrual status when all delinquent interest and principal become current under the contractual terms of the security, and the collectability of remaining principal and interest is no longer doubtful.
(g) Allowance for Credit Losses on Held-to-Maturity Debt Securities
(h) Equity and Other Investments
Investments in equity securities are classified into one of the following two categories and accounted as follows:
•Securities with a readily determinable fair value are reported at fair value, with changes in fair value recorded in earnings.
•Securities without a readily determinable fair value for which we have elected the "measurement alternative" are reported at cost less impairment (if any) plus or minus adjustments resulting from observable price changes in orderly transactions for the identical or similar investment of the same issuer.
122
BANC OF CALIFORNIA, INC. AND SUBSIDIARIES
Notes to Consolidated Financial Statements
Investments in common or preferred stock that are not publicly traded and certain investments in limited partnerships are considered equity investments that do not have a readily determinable fair value. On a quarterly basis, we review our equity investments without readily determinable fair values for impairment. We consider a number of qualitative factors such as whether there is a significant deterioration in earnings performance, credit rating, asset quality, or business prospects of the investee in determining if impairment exists. If the investment is considered impaired, an impairment loss equal to the amount by which the carrying value exceeds its fair value is recorded through a charge to earnings. The impairment loss may be reversed in a subsequent period if there are observable transactions for the identical or similar investment of the same issuer at a higher amount than the carrying amount that was established when the impairment was recognized. Impairment as well as upward or downward adjustments resulting from observable price changes in orderly transactions for identical or similar investments are included in “Noninterest income - other.”
Included in our equity investments that do not have a readily determinable fair value are our investments in non-public Small Business Investment Companies (“SBICs”). All of our SBIC investments meet the definition of investment companies, as defined in ASC 946, Financial Services - Investment Companies. We elected the practical expedient available in Topic 820, Fair Value Measurements, which permits the use of net asset value (“NAV”) per share or equivalent to value investments in entities that are or are similar to investment companies. SBICs are required to value and report their investments at estimated fair value. We record the unrealized gains and losses resulting from changes in the fair value of our SBIC investments as gains or losses on equity investments in our consolidated statements of earnings (loss). The carrying value of our SBIC investments is equal to the capital account balance per each SBIC entities' quarterly financial statements.
Realized gains or losses resulting from the sale of equity investments are calculated using the specific identification method and are included in “Noninterest income.”
If we have the ability to significantly influence the operating and financial policies of the investee, the investment is accounted for pursuant to the equity method of accounting. This is generally presumed to exist when we own between 20 % and 50 % of a corporation, or when we own greater than 5 % of a limited partnership or similarly structured entity. Our equity investment carrying values are included in other assets and our share of earnings and losses in equity method investees is included in “Noninterest income” on the consolidated statements of earnings (loss).
The Bank is a member of the FHLB and the FRB system. Members are required to own a certain amount of FHLB and FRB stock based on the level of borrowings and other factors. Investments in FHLB and FRB stock are carried at cost and evaluated regularly for impairment based on the ultimate recovery of par value. FHLB and FRB stock are expected to be redeemed at par.
(i) Loans and Leases
Originated loans. Loans are originated by the Company with the intent to hold them for investment and are stated at the principal amount outstanding, net of unearned income. Unearned income includes deferred unamortized nonrefundable loan fees and direct loan origination costs. Net deferred fees or costs are recognized as an adjustment to interest income over the contractual life of the loans primarily using the effective interest method or taken into income when the related loans are paid off or sold. The amortization of loan fees or costs is discontinued when a loan is placed on nonaccrual status. Interest income is recorded on an accrual basis in accordance with the terms of the respective loan.
Purchased loans. All loans purchased or acquired in our acquisitions are initially measured and recorded at their fair value on the acquisition date. A component of the initial fair value measurement is an estimate of the credit losses over the life of the purchased loans. Purchased loans are also evaluated to determine if they have experienced a more-than-insignificant deterioration in credit quality since origination or issuance as of the acquisition date and are classified as either (i) loans purchased without evidence of deteriorated credit quality (“non-PCD loans”), or (ii) loans purchased that have experienced a more-than-insignificant deterioration in credit quality, referred to as purchased credit deteriorated loans (“PCD loans”).
Acquired non‑PCD loans. Acquired non‑PCD loans are those loans for which there was no evidence of a more-than-insignificant credit deterioration at their acquisition date and it was probable that we would be able to collect all contractually required payments. Acquired non‑PCD loans, together with originated loans, are referred to as Non‑PCD loans. Non-PCD loans are recorded at fair value at the acquisition date, with the resulting credit and non-credit discount or premium being amortized or accreted into interest income using the interest method. Purchase discounts or premiums on acquired non‑PCD loans are recognized as an adjustment to interest income over the contractual life of such loans using the effective interest method or taken into income when the related loans are paid off or sold.
123
BANC OF CALIFORNIA, INC. AND SUBSIDIARIES
Notes to Consolidated Financial Statements
Purchased/Acquired loans with credit deterioration. All purchased financial assets with credit deterioration (“PCD assets”) are recorded at the purchase price plus the allowance for credit losses expected at the time of acquisition. Acquired PCD loans are initially recorded at fair value, with the resulting non-credit discount or premium being amortized or accreted into interest income using the interest method. The credit allowance is recognized through a gross-up that increases the amortized cost basis of the asset with no effect on net income. Subsequent to the acquisition date, the allowance for credit losses for both PCD and non-PCD loans is estimated using the same methodology to determine current expected credit losses that is applied to all other loans.
Leases to customers. We provide equipment financing to our customers primarily with direct financing and operating leases. For direct financing leases, lease receivables are recorded on the balance sheet under "Gross loans and leases held for investment," but the leased property is not, although we generally retain legal title to the leased property until the end of each lease. Direct financing leases are stated at the net amount of minimum lease payments receivable, plus any unguaranteed residual value, less the amount of unearned income and net acquisition discount at the reporting date. Direct lease origination costs are amortized using the effective interest method over the life of the leases. Leases acquired in an acquisition are initially measured and recorded at their fair value on the acquisition date. Purchase discount or premium on acquired leases is recognized as an adjustment to interest income over the contractual life of the leases using the effective interest method or taken into income when the related leases are paid off. Direct financing leases are subject to our accounting for allowance for loans and leases.
We provide equipment financing through operating leases where we facilitate the purchase of equipment leased to customers. The equipment is shown on our consolidated balance sheets as "Equipment leased to others under operating leases" and is depreciated to its estimated residual value at the end of the lease term, shown as "Leased equipment depreciation" in the consolidated statements of earnings (loss), according to our fixed asset accounting policy. We receive periodic rental income payments under the leases, which are recorded as "Noninterest income" in the consolidated statements of earnings (loss).
Loans and leases held for sale. As part of our management of the loans and leases held in our portfolio, on occasion we will transfer loans from held for investment to held for sale. Upon transfer, any associated allowance for loan and lease loss is reversed and the carrying value of the loan is adjusted to the lower of cost or estimated fair value. The unamortized balance of net deferred fees and costs associated with loans held for sale is not accreted or amortized to interest income until the related loans are sold. Gains or losses on the sale of these loans are recorded as "Noninterest income" in the consolidated statements of earnings (loss).
Delinquent or past due loans and leases. Loans and leases are considered delinquent when principal or interest payments are past due 30 days or more. Delinquent loans generally remain on accrual status between 30 days and 89 days past due.
Nonaccrual loans and leases. When we discontinue the accrual of interest on a loan or lease it is designated as nonaccrual. We discontinue the accrual of interest on a loan or lease generally when a borrower's principal or interest payments or a lessee's payments are past due 90 days or when, in the opinion of management, there is a reasonable doubt as to collectability in the normal course of business. Loans with interest or principal payments past due 90 days or leases with payments past due 90 days may be accruing if the loans or leases are concluded to be well-secured and in the process of collection; however, these loans or leases are still reported as nonperforming. When loans or leases are placed on nonaccrual status, all interest previously accrued but not collected is reversed against current period interest income. Interest on nonaccrual loans or leases is subsequently recognized only to the extent that cash is received and the loan principal balance or lease balance is deemed collectable. Loans or leases are restored to accrual status when the loans or leases become both well‑secured and are in the process of collection.
Individually Evaluated Loans and Leases. Loans and leases that do not share similar risk characteristics with other financial assets are individually evaluated for impairment and excluded from loan pools used within the collective evaluation of estimated credit losses. We defined the following criteria for what constitutes a “default,” which results in a loan no longer sharing similar risk characteristics with other loans, and therefore requires an individual evaluation for expected credit losses. The criteria for default may include any one of the following:
•On nonaccrual status,
•Payment delinquency of 90 days or more,
•Partial credit-related charge-off recognized,
•Risk rated doubtful or loss.
124
BANC OF CALIFORNIA, INC. AND SUBSIDIARIES
Notes to Consolidated Financial Statements
Defaulted loans and leases with outstanding balances over $250,000 are reviewed individually for expected credit loss. Individually evaluated loans are measured at the present value of the expected future cash flows discounted at the loan's initial effective interest rate, unless the loans are collateral dependent, in which case loan impairment is based on the estimated fair value of the underlying collateral. A loan is considered collateral-dependent when the borrower is experiencing financial difficulty and repayment is expected to be provided substantially through the operation or sale of the collateral. The fair value of each loan’s collateral is generally based on estimated market prices from an independently prepared appraisal, which is then adjusted for the cost related to liquidating such collateral. An individually evaluated reserve and/or charge-off would be recognized when the present value of expected future cash flows or the fair value of the underlying collateral is below the amortized cost of the loan. If the measured amount of any individually reviewed loan exceeds its amortized cost, further review is required to determine whether a positive allowance should be added (but only up to amounts previously written off) to its amortized cost basis in order to reflect the net amount expected to be collected.
Loan Modifications to Borrowers Experiencing Financial Difficulty. Loan modifications made to borrowers experiencing financial difficulty constitute modifications of receivables in the form of principal forgiveness, an interest rate reduction, an other than-insignificant payment delay, or a term extension. ASU 2022-02 eliminated the concept of troubled debt restructurings and introduced broader modification reporting requirements. Previously, troubled debt restructurings included any type of modification that included a below market concession which was granted both to a borrower in financial difficulty and as a result of financial difficulty. Loan modifications made to borrowers experiencing financial difficulty no longer consider whether a market concession has been granted, as was required with troubled debt restructurings, but rather includes as modifications within the four listed reportable modification types to a borrower deemed to be experiencing financial difficulty. An assessment of whether a borrower is experiencing financial difficulty is made on the date of the modification. Loans reported in this classification have a rating of substandard or worse, and may include both accruing and nonaccruing loans. Loans are assessed to determine whether the modification constitutes a new loan or a continuation of the existing loan. Depending on the terms of the modification and nature of the borrower, this may result in a downgrade or placing a loan on nonaccrual status, which in turn would impact the loan's classification within the ALLL. Because the effect of most modifications made to borrowers experiencing financial difficulty is already included in the allowance for credit losses because of the measurement methodologies used to estimate the allowance, a change to the allowance for credit losses is generally not recorded upon modification.
Troubled debt restructurings. A loan is classified as a troubled debt restructuring when we grant a concession to a borrower experiencing financial difficulties that we otherwise would not consider under our normal lending policies. These concessions may include a reduction of the interest rate, principal or accrued interest, extension of the maturity date or other actions intended to minimize potential losses. All modifications of criticized loans are evaluated to determine whether such modifications are troubled debt restructurings as outlined under ASC Subtopic 310‑40, “Troubled Debt Restructurings by Creditors.” Loans restructured with an interest rate equal to or greater than that of a new loan with comparable market risk at the time the loan is modified may be excluded from certain restructured loan disclosures in years subsequent to the restructuring if the loans are in compliance with their modified terms.
A loan that has been placed on nonaccrual status that is subsequently restructured will usually remain on nonaccrual status until the borrower is able to demonstrate repayment performance in compliance with the restructured terms for a sustained period of time, typically for six months. A restructured loan may return to accrual status sooner based on other significant events or circumstances. A loan that has not been placed on nonaccrual status may be restructured and such loan may remain on accrual status after such restructuring. In these circumstances, the borrower has made payments before and after the restructuring. Generally, this restructuring involves maturity extensions, a reduction in the loan interest rate and/or a change to interest‑only payments for a period of time. Loan modifications that qualify as troubled debt restructurings are individually evaluated for expected credit losses based on the present value of expected cash flows discounted at the loan’s original effective interest rate or based on the fair value of the collateral if the loan is collateral-dependent.
(j) Allowance for Credit Losses on Loans and Leases Held for Investment
The allowance for loan and lease losses is measured using the current expected credit loss ("CECL") approach for financial instruments measured at amortized cost and other commitments to extend credit. CECL requires the immediate recognition of estimated credit losses expected to occur over the estimated remaining life of the asset. The forward-looking concept of CECL requires loss estimates to consider historical experience, current conditions and reasonable and supportable forecasts.
125
BANC OF CALIFORNIA, INC. AND SUBSIDIARIES
Notes to Consolidated Financial Statements
The allowance for credit losses on loans and leases held for investment is the combination of the allowance for loan and lease losses and the reserve for unfunded loan commitments. The allowance for loan and lease losses is reported as a reduction of the amortized cost basis of loans and leases, while the reserve for unfunded loan commitments is included within "Accrued interest payable and other liabilities" on the consolidated balance sheets. The amortized cost basis of loans and leases does not include accrued interest receivable, which is included in "Other assets" on the consolidated balance sheets. The "Provision for credit losses" on the consolidated statements of earnings (loss) is a combination of the provision for loan and lease losses, the provision for unfunded loan commitments, and the provision for held-to-maturity debt securities.
Under the CECL methodology, expected credit losses reflect losses over the remaining contractual life of an asset, considering the effect of prepayments and available information about the collectability of cash flows, including information about relevant historical experience, current conditions, and reasonable and supportable forecasts of future events and circumstances. Thus, the CECL methodology incorporates a broad range of information in developing credit loss estimates. The resulting allowance for loan and lease losses is deducted from the associated amortized cost basis to reflect the net amount expected to be collected. Subsequent changes in this estimate are recorded through the provision for credit losses and the allowance. The CECL methodology could result in significant changes to both the timing and amounts of provision for credit losses and the allowance as compared to historical periods. Loans and leases that are deemed to be uncollectable are charged off and deducted from the allowance. The provision for credit losses and recoveries on loans and leases previously charged off are added to the allowance.
The allowance for loan and lease losses is comprised of an individually evaluated component for loans and leases that no longer share similar risk characteristics with other loans and leases and a pooled loans component for loans and leases that share similar risk characteristics.
A loan or lease with an outstanding balance greater than $250,000 is individually evaluated for expected credit loss when it is probable that we will be unable to collect all amounts due according to the original contractual terms of the agreement. We select loans and leases for individual assessment on an ongoing basis using certain criteria such as payment performance, borrower reported and forecasted financial results, and other external factors when appropriate. We measure the current expected credit loss of an individually evaluated loan or lease based upon the fair value of the underlying collateral if the loan or lease is collateral-dependent or the present value of cash flows, discounted at the effective interest rate, if the loan or lease is not collateral-dependent. To the extent a loan or lease balance exceeds the estimated collectable value, a reserve or charge-off is recorded depending upon either the certainty of the estimate of loss or the fair value of the loan’s collateral if the loan is collateral-dependent.
Our CECL methodology for the pooled loans component includes both quantitative and qualitative loss factors which are applied to our population of loans and leases and assessed at a pool level. The quantitative CECL model estimates credit losses by applying pool-specific probability of default ("PD") and loss given default ("LGD") rates to the expected exposure at default ("EAD") over the contractual life of loans and leases. The qualitative component considers internal and external risk factors that may not be adequately assessed in the quantitative model.
The loan portfolio is segmented into four loan segments, nine loan classes, and 20 loan pools (excluding Paycheck Protection Program loans, which are fully government guaranteed) based upon loan type that share similar default risk characteristics to calculate quantitative loss factors for each pool. Five of these loan pools have insignificant current balances, insignificant historical losses and/or historical losses that do not correlate with economic conditions, thus, estimated losses are calculated using historical loss rates from the first quarter of 2009 to the current period rather than econometric regression modeling. For the purchased single-family residential mortgage loans, a third-party model for estimating prepayment, PD, and LGD based on forecasted economic conditions and historical residential mortgage loan performance from 2004 to June 2020 is applied. For the remaining 15 loan pools, we estimate the PD during the reasonable and supportable forecast period using seven econometric regression models developed to correlate macroeconomic variables to historical credit performance (based on quarterly transition matrices for the economic cycle from 2009 to the first quarter of 2022, which include risk rating upgrades/downgrades and defaults).
126
BANC OF CALIFORNIA, INC. AND SUBSIDIARIES
Notes to Consolidated Financial Statements
The loans and unfunded commitments are grouped into ten LGD pools based on portfolio classes that share similar collateral risk characteristics. LGD rates are computed based on the net charge-offs recognized divided by the EAD of defaulted loans starting with the first quarter of 2009 to the current period. The PD and LGD rates are applied to the EAD at the loan or lease level based on contractual scheduled payments and estimated prepayments. We use our actual historical loan prepayment experience from 2009 to the third quarter of 2023, adjusted for forecasted economic conditions, to estimate future prepayments by loan pool. Loans and leases with outstanding balances less than or equal to $250,000 , where it is probable that we will be unable to collect all amounts due according to the contractual terms of the agreement, remain in their respective pools and are assigned a 100% probability of default.
For the reasonable and supportable forecast period, future macroeconomic events and circumstances are estimated over a 4-quarter time horizon using an economic forecast that is consistent with management's current expectations for the 15 loan pools. We use economic forecasts from Moody's Analytics in this process. The economic forecast is updated monthly; therefore, the forecast used for each quarter-end calculation is generally released a few weeks prior to quarter-end. If economic conditions as of the balance sheet date change materially, management would consider a qualitative adjustment. The key macroeconomic assumptions used in each of the seven PD regression models include two or three of the following economic indicators: Real gross domestic product, unemployment rates, CRE Price Index, the BBB corporate spread, and CPI.
The quantitative CECL model applies the projected rates based on the economic forecasts for the 4-quarter reasonable and supportable forecast horizon to EAD to estimate defaulted loans. During this forecast horizon, prepayment rates during a historical period that exhibits economic conditions most similar to the economic forecast are used to estimate EAD. If no historical period exhibits economic conditions that are similar to the economic forecast, management uses its best estimate of prepayments expected over the reasonable and supportable forecast period which may, in some circumstances, be the average of all historical prepayment experience. Historical LGD rates are applied to estimated defaulted loans to determine estimated credit losses. We then use a 2-quarter reversion period to revert on a straight-line basis from the PD, LGD, and prepayment rates used during the reasonable and supportable forecast period to the Company’s historical PD, LGD, and prepayment experience. Subsequent to the reversion period for the remaining contractual life of loans and leases, the PD, LGD, and prepayment rates are based on historical experience during a full economic cycle. PD regression models are updated at least every two years and reviewed for model performance annually. Prepayment rates are updated on at least an annual basis.
The PDs calculated by the quantitative models are highly correlated to our internal risk ratings assigned to each loan and lease. To ensure the accuracy of our credit risk ratings, an independent credit review function assesses the appropriateness of the credit risk ratings assigned to loans and leases on a regular basis. The credit risk ratings assigned to every loan and lease are as follows:
•High Pass: (Risk ratings 1-3) Loans and leases rated as "high pass" exhibit a favorable credit profile and have minimal risk characteristics. Repayment in full is expected, even in adverse economic conditions.
•Pass: (Risk ratings 4-6) Loans and leases rated as "pass" are not adversely classified and collection and repayment in full are expected.
•Special Mention: (Risk rating 7) Loans and leases rated as "special mention" have a potential weakness that requires management's attention. If not addressed, these potential weaknesses may result in further deterioration in the borrower's ability to repay the loan or lease.
•Substandard: (Risk rating 8) Loans and leases rated as "substandard" have a well-defined weakness or weaknesses that jeopardize the collection of the debt. They are characterized by the possibility that we will sustain some loss if the weaknesses are not corrected.
•Doubtful: (Risk rating 9) Loans and leases rated as "doubtful" have all the weaknesses of those rated as "substandard," with the additional trait that the weaknesses make collection or repayment in full highly questionable and improbable.
We may refer to the loans and leases with assigned credit risk ratings of "substandard" and "doubtful" together as "classified" loans and leases. For further information on classified loans and leases, see Note 5. Loans and Leases.
In addition to our internal risk rating process, our federal and state banking regulators, as an integral part of their examination process, periodically review the Company’s loan and lease risk rating classifications. Our regulators may require the Company to recognize rating downgrades based on information available to them at the time of their examinations. Risk rating downgrades generally result in increases in the provisions for credit losses and the allowance for credit losses.
127
BANC OF CALIFORNIA, INC. AND SUBSIDIARIES
Notes to Consolidated Financial Statements
The qualitative portion of the reserve on pooled loans and leases represents management’s judgment of additional considerations to account for internal and external risk factors that are not adequately measured in the quantitative reserve. The qualitative loss factors consider idiosyncratic risk factors, conditions that may not be reflected in quantitatively derived results, or other relevant factors to ensure the allowance for credit losses reflects our best estimate of current expected credit losses. Current and forecasted economic trends and underlying market values for collateral dependent loans are generally considered to be encompassed within the CECL quantitative reserve. An incremental qualitative adjustment may be considered when economic forecasts exhibit higher levels of volatility or uncertainty.
In addition to economic conditions and collateral dependency, the other qualitative criteria we consider when establishing the loss factors include the following:
•Legal and Regulatory - matters that could impact our borrowers’ ability to repay our loans and leases;
•Concentrations - loan and lease portfolio composition and any loan concentrations;
•Lending Policy - current lending policies and the effects of any new policies or policy amendments;
•Nature and Volume - loan and lease production volume and mix;
•Problem Loan Trends - loan and lease portfolio credit performance trends, including a borrower's financial condition, credit rating, and ability to meet loan payment requirements;
•Loan Review - results of independent credit review; and
•Management - changes in management related to credit administration functions.
We estimate the reserve for unfunded loan commitments using the same PD, LGD, and prepayment rates for the quantitative credit losses and qualitative loss factors as used for the allowance for loan and lease losses. The EAD for the reserve for unfunded loan commitments is computed using expected future utilization rates of the unfunded commitments during the contractual life of the commitments based on historical usage by loan pool from 2015 to the first quarter of 2023. The utilization rates are updated on an annual basis.
The CECL methodology requires a significant amount of management judgment in determining the appropriate allowance for credit losses. Most of the steps in the methodology involve judgment and are subjective in nature including, among other things: segmenting the loan and lease portfolio; determining the amount of loss history to consider; selecting predictive econometric regression models that use appropriate macroeconomic variables; determining the methodology to forecast prepayments; selecting the most appropriate economic forecast scenario or weighting of multiple scenarios; determining the length of the reasonable and supportable forecast and reversion periods; estimating expected utilization rates on unfunded loan commitments; and assessing relevant and appropriate qualitative factors. In addition, the CECL methodology is dependent on economic forecasts which are inherently imprecise and will change from period to period. Although the allowance for credit losses is considered appropriate, there can be no assurance that it will be sufficient to absorb future losses.
(k) Land, Premises and Equipment
Premises and equipment are stated at cost less accumulated depreciation and amortization. Land is carried at cost and not depreciated. Depreciation and amortization is charged to "Noninterest expense" in the consolidated statements of earnings (loss) using the straight‑line method over the estimated useful lives of the assets. The estimated useful lives of furniture, fixtures and equipment range from 3 years to 7 years and for buildings up to 40 years. Leasehold improvements are amortized over their estimated useful lives, or the life of the lease, whichever is shorter. Maintenance and repairs are expensed as incurred and improvements that extend the useful lives of assets are capitalized.
128
BANC OF CALIFORNIA, INC. AND SUBSIDIARIES
Notes to Consolidated Financial Statements
(l) Foreclosed Assets
Foreclosed assets include OREO and repossessed non-real estate assets. Foreclosed assets are initially recorded at the estimated fair value of the property, based on current independent appraisals obtained at the time of acquisition, less estimated costs to sell, including senior obligations such as delinquent property taxes. The excess of the recorded loan balance over the estimated fair value of the property at the time of acquisition less estimated costs to sell is charged to the allowance for loan and lease losses. Any subsequent write‑downs are charged to "Noninterest expense" in the consolidated statements of earnings (loss) and recognized through a foreclosed assets valuation allowance. Subsequent increases in the fair value of the asset less selling costs reduce the foreclosed assets valuation allowance, but not below zero, and are credited to "Noninterest expense." Gains and losses on the sale of foreclosed assets and operating expenses of such assets are included in "Noninterest expense."
(m) Bank Owned Life Insurance ("BOLI")
The Bank has purchased life insurance policies on certain key employees. BOLI is recorded at the amount that can be realized under the insurance contract, which is the cash surrender value.
(n) Mortgage Servicing Rights
Mortgage servicing rights ("MSRs") give us the contractual rights to receive service fees in exchange for performing loan servicing functions on behalf of investors who have an ownership interest in the loans being serviced. Purchased mortgage servicing rights are recorded at the purchase price at the time of acquisition, which approximates the fair vale of such assets. Subsequent to acquisition, MSRs are accounted for under the amortization method and amortized over the period of estimated net servicing income (level yield method) generated from servicing the loans. MSRs are evaluated quarterly for impairment by estimating the fair value of the MSRs and comparing that value to their amortized cost. Impairment, if any, is recognized with a valuation allowance to the extent the fair value is less than the carrying value of the MSRs. Subsequent increases in the fair value of impaired MSRs are recognized only up to the amount of the previously recognized valuation allowance. The estimated fair value of the MSRs is obtained through independent third party valuations based on an analysis of future cash flows, incorporating key assumptions including discount rates, prepayment speeds and interest rates.
Income taxes are accounted for under the asset and liability method. Deferred tax assets and liabilities are recognized for the future tax consequences attributable to differences between the financial statement carrying amounts of existing assets and liabilities and their respective tax bases and operating loss and tax credit carryforwards. Deferred tax assets and liabilities are measured using enacted tax rates expected to apply to taxable income in the years in which those temporary differences are expected to be recovered or settled. The effect of a change in tax rates on deferred tax assets and liabilities is recognized in earnings in the period that includes the enactment date. Any interest or penalties assessed by the taxing authorities is classified in the financial statements as income tax expense. We and our subsidiaries are subject to U.S. federal income tax as well as income tax in multiple state jurisdictions. Deferred tax assets and liabilities of the same jurisdiction, net of valuation allowances, are grouped together and reported net on the consolidated balance sheets.
129
BANC OF CALIFORNIA, INC. AND SUBSIDIARIES
Notes to Consolidated Financial Statements
(p) Goodwill and Other Intangible Assets
Goodwill and other intangible assets arise from the acquisition method of accounting for business combinations. Goodwill generated from business combinations is not subject to amortization and instead is tested for impairment annually at the reporting unit level unless a triggering event occurs thereby requiring an updated assessment. Impairment may be tested by first assessing qualitative factors. If qualitative factors do not indicate impairment, the test is complete. However, if the qualitative factors indicate it is more-likely-than-not that goodwill is impaired, a quantitative test is performed. In accordance with ASC Topic 350, Intangibles – Goodwill and Other, the Company has an unconditional option to bypass the qualitative assessment and proceed directly to the quantitative assessment. If the Company elects to perform a qualitative assessment, there is no requirement for the Company to perform it for every reporting unit and there is no requirement for the qualitative assessment to be performed every period. In each period and for each reporting unit, the Company decides whether it will reduce costs and complexity to perform the optional qualitative assessment or to proceed directly to the quantitative test.
Our regular annual impairment assessment occurs in the fourth quarter. Goodwill represents the excess of the purchase price over the fair value of the net assets and other identifiable intangible assets acquired. Impairment exists when the carrying value of the goodwill exceeds the fair value of the reporting unit. An impairment loss would be recognized in an amount equal to that excess as a charge to "Noninterest expense" in the consolidated statements of earnings (loss).
Intangible assets with estimable useful lives are amortized over such useful lives to their estimated residual values. CDI and CRI are recognized apart from goodwill at the time of acquisition based on market valuations. In preparing such valuations, variables considered included deposit servicing costs, alternative cost of funds, attrition rates, and market discount rates. CDI assets are amortized to expense over their useful lives, which we have estimated to range from 7 to 10 years. CRI assets are amortized to expense over their useful lives, which we have estimated to range from 4 to 7 years. The amortization expense represents the estimated decline in the value of the underlying deposits or customer relationships acquired.
Both CDI and CRI are reviewed for impairment quarterly or earlier if events or changes in circumstances indicate that their carrying values may not be recoverable. If the recoverable amount of either CDI or CRI is determined to be less than its carrying value, we would then measure the amount of impairment based on an estimate of the intangible asset’s fair value at that time. If the fair value is below the carrying value, then the intangible asset is reduced to such fair value; an impairment loss for such amount would be recognized as a charge to "Noninterest expense" in the consolidated statements of earnings (loss).
(q) Operating Leases
As of December 31, 2023, the Company only had operating leases related to our leased facilities. The Company determines if an arrangement is a lease at inception by assessing whether there is an identified asset and whether the contract conveys the right to control the use of the identified asset for a period of time in exchange for consideration. Operating leases with a term of more than one year are included in operating lease right-of-use ("ROU") assets and operating lease liabilities, which are reported in "Other assets" and "Accrued interest payable and other liabilities" on the Company's consolidated balance sheets. The Company made a policy election to apply the short-term lease exemption to any operating leases with an original term of less than 12 months, therefore no ROU asset or lease liability is recorded for these operating leases. The Company has agreements with lease and non-lease components, which are accounted for as a single lease component.
ROU assets represent the Company's right to use an underlying asset for the lease term and lease liabilities represent the obligation to make lease payments arising from the lease. Operating lease ROU assets and liabilities are recognized on the lease commencement date based on the present value of lease payments over the lease term. The Company uses the incremental borrowing rate commensurate with the lease term based on the information available at the lease commencement date in determining the present value of lease payments. ROU assets initially equal the lease liability, adjusted for any prepaid lease payments and initial direct costs incurred less any lease incentives received.
130
BANC OF CALIFORNIA, INC. AND SUBSIDIARIES
Notes to Consolidated Financial Statements
Certain of the Company's lease agreements include rental payments that adjust periodically based on changes in the CPI. We initially measure the present value of the lease payments using the index at the lease commencement date. Subsequent increases in the CPI are treated as variable lease payments and recognized in the period in which the obligation for those payments is incurred. The ROU assets and lease liabilities are not re-measured as a result of changes in the CPI. The Company's lease terms may include options to extend or terminate the lease. These options to extend or terminate are assessed on a lease-by-lease basis, and the ROU assets and lease liabilities are adjusted when it is reasonably certain that an option will be exercised. Rent expense for lease payments is recognized on a straight-line basis over the lease term and is included in "Occupancy expense" on the Company's consolidated statements of earnings (loss).
(r) Qualified Affordable Housing Partnership and Solar-Related Investments
The Company invests in qualified affordable housing partnerships and records these investments using the proportional amortization method. Under the proportional amortization method, the Company amortizes the initial cost of the investment in proportion to the tax credits and other tax benefits received, and recognizes the amortization in "Income tax expense" on the consolidated statements of earnings (loss). Investments accounted for under the proportional amortization method are required to be tested for impairment when events or changes in circumstances indicate that it is more likely than not that the carrying amount of the investment will not be realized.
We have provided lease financing for solar renewable electric generating facilities which provides us tax credits. The deferral method of accounting is used to record the tax credits related to these transactions. The investment tax credits are initially recorded as a reduction to the related investment, and then amortized over the life of the investment to interest income.
(s) Stock-Based Compensation
The Company issues stock-based compensation instruments consisting of restricted stock units ("RSUs"), time-based restricted stock awards ("TRSAs") and performance-based restricted stock units ("PRSUs"). Compensation expense related to RSUs and TRSAs is based on the fair value of the underlying stock on the award date and is recognized over the required service period using the straight‑line method. The market price of our voting common stock at the date of grant is used to determine the grant date fair value of restricted stock awards and units. For stock awards and units that contain a market condition, a Monte Carlo simulation valuation model is used to calculate the grant date fair value of such awards. Forfeitures of stock-based awards are recognized when they occur. Compensation expense related to PRSUs is based on the fair value of the underlying stock on the award date and is amortized over the vesting period using the straight-line method unless it is determined that: (1) attainment of the financial metrics is less than probable, in which case a portion of the amortization is suspended, or (2) attainment of the financial metrics is improbable, in which case a portion of the previously recognized amortization is reversed and also suspended. PRSU expense may vary during the performance period based upon changes in management's estimate of the number of shares that may ultimately vest. In the case where the performance target for the PRSU’s is based on a market condition (such as total shareholder return), the amortization is neither reversed nor suspended if it is subsequently determined that the attainment of the performance target is less than probable or improbable and the employee continues to meet the service requirement of the award.
131
BANC OF CALIFORNIA, INC. AND SUBSIDIARIES
Notes to Consolidated Financial Statements
(t) Derivative Instruments
The Company uses derivatives to manage exposure to market risk, primarily foreign currency risk and interest rate risk, and to assist customers with their risk management objectives. The Company uses foreign exchange contracts to manage the foreign exchange rate risk associated with certain foreign currency-denominated assets and liabilities. The objective is to manage the uncertainty of future foreign exchange rate fluctuations. These derivatives provide for a fixed exchange rate which has the effect of reducing or eliminating changes to anticipated cash flows to be received on assets and liabilities denominated in foreign currencies as the result of changes to exchange rates. Our foreign currency derivatives are not designated as accounting hedges and recorded at fair value in "Other assets" and "Accrued interest payable and other liabilities" in the consolidated balance sheet. The changes in fair value of our derivatives and the related interest are recognized in "Noninterest income - other" in the consolidated statements of earnings (loss).
The Bank offers interest rate swap products to certain loan customers to allow them to hedge the risk of rising interest rates on their variable-rate loans. When such products are issued, we also enter into an offsetting swap with institutional counterparties to eliminate the interest rate risk to us. These back-to-back swap agreements, which generate fee income for us, are intended to offset each other. We retain the credit risk of the original loan. The net cash flow for us is equal to the interest income received from a variable rate loan originated with the client plus a fee. These swaps are not designated as accounting hedges and are recorded at fair value in "Other assets" and "Accrued interest payable and other liabilities" in the consolidated balance sheets. The changes in fair value are recorded in "Noninterest income - other" in the consolidated statements of earnings (loss).
In connection with negotiated credit facilities and certain other services, we may obtain equity warrant assets giving us the right to acquire stock in primarily private, venture-backed companies. We account for equity warrant assets as derivatives when they contain net settlement terms and other qualifying criteria under ASC 815. These equity warrant assets are measured at estimated fair value on a monthly basis and are classified as "Other assets" in the consolidated balance sheets at the time they are obtained.
The Company applies hedge accounting for qualifying derivative instruments used to manage interest rate risk. A cash flow hedge is a derivative instrument used to manage the variability in future expected cash flows that would otherwise be impacted by movements in interest rates. To quality for hedge accounting, the cash flow hedge must be highly effective at reducing the risk associated with the hedged exposure. The effectiveness of the hedging relationship is documented at inception and is monitored at least quarterly through the life of the transaction. A cash flow hedge that is designated as highly effective is carried at fair value in "Other assets" or "Accrued interest payable and other liabilities" in the consolidated balance sheet with the change in fair value recorded in accumulated other comprehensive loss, net (“AOCI”) and subsequently recognized in earnings in the same period that the hedged forecasted transaction affects earnings. At that time, the amount reclassified from AOCI is presented in the same income statement line item in which the hedged transaction is reported (interest income or expense). If the cash flow hedge becomes ineffective, the change in fair value is reclassified from AOCI to earnings. Cash flows from cash flow hedges are classified as operating activities in the statement of cash flows. We classify both the earnings and cash flow impact from these derivatives consistent with the underlying hedged item.
Derivative instruments expose us to credit risk in the event of nonperformance by counterparties. This risk exposure consists primarily of the termination value of agreements where we are in a favorable position. We manage the credit risk associated with various derivative agreements through counterparty credit review and monitoring procedures.
132
BANC OF CALIFORNIA, INC. AND SUBSIDIARIES
Notes to Consolidated Financial Statements
(u) Comprehensive Income (Loss)
Comprehensive income (loss) consists of net earnings (loss); changes in the net unrealized gains (losses) on debt securities available‑for‑sale, net; changes in the net unrealized loss on securities transferred to held-to-maturity, net; changes in the fair value of credit-linked notes; and changes in the fair value of cash flow hedges, net, and is presented in the consolidated statements of comprehensive income (loss).
(v) Earnings (Loss) Per Common Share
Earnings (loss) per common share (“EPS”) is computed under the two-class method. Basic EPS is computed by dividing net income (loss) allocated to common stockholders by the weighted average number of shares outstanding. Net income (loss) allocated to common stockholders is computed by subtracting income (loss) allocated to participating securities, participating securities dividends, preferred stock dividends and preferred stock redemptions from net income. All unvested restricted stock awards and NVCE shares that contain rights to non-forfeitable dividends are considered participating securities. In the two-class method, the amount of our earnings (loss) available to common stockholders is divided by the weighted average shares outstanding, excluding any unvested restricted stock, for both the basic and diluted earnings (loss) per share. Diluted EPS is computed by dividing net income (loss) allocated to common stockholders by the weighted average number of shares outstanding, adjusted for the dilutive effect, if any, of unvested restricted stock and units and outstanding warrants.
(w) Business Combinations
Business combinations are accounted for under the acquisition method of accounting in accordance with ASC Topic 805, “Business Combinations.” Under the acquisition method, the acquiring entity in a business combination recognizes 100 percent of the acquired assets and assumed liabilities, regardless of the percentage owned, at their estimated fair values as of the date of acquisition. Any excess of the purchase price over the fair value of net assets and other identifiable intangible assets acquired is recorded as goodwill. To the extent the fair value of net assets acquired, including other identifiable assets, exceeds the purchase price, a bargain purchase gain is recognized. Assets acquired and liabilities assumed from contingencies must also be recognized at fair value, if the fair value can be determined during the measurement period. Results of operations of an acquired business are included in the consolidated statements of earnings (loss) from the date of acquisition. Acquisition‑related costs, including conversion and restructuring charges, are expensed as incurred.
(x) Business Segments
133
BANC OF CALIFORNIA, INC. AND SUBSIDIARIES
Notes to Consolidated Financial Statements
(y) Recently Issued Accounting Standards
| Effective | Effect on the Financial Statements | |||||||||||||||||||
| Standard | Description | Date | or Other Significant Matters | |||||||||||||||||
ASU 2022-03, Fair Value Measurement (Topic 820): Fair Value Measurement of Equity Securities Subject to Contractual Sale Restrictions | This standard clarifies that a contractual sale restriction is not considered in measuring an equity security at fair value. The standard also clarifies that an entity cannot recognize a contractual sale restriction as a separate unit of account, such as a contra-asset or liability. The standard requires new disclosures for all entities with equity securities subject to contractual sales restrictions. Additionally, early adoption is permitted. | January 1, 2024 | The Company does not take into account contractual sale restrictions in determining the fair value of its equity securities. The Company expects that this standard will not have a material impact on its consolidated financial statements. | |||||||||||||||||
| Effective | Effect on the Financial Statements | |||||||||||||||||||
| Standard | Description | Date | or Other Significant Matters | |||||||||||||||||
ASU 2023-02, Investments - Equity Method and Joint Ventures (Topic 323): Accounting for Investments in Tax Credit Structures Using the Proportional Amortization Method (a consensus of the Emerging Issues Task Force) | This standard expands the proportional amortization method to account for investments in all tax equity investments. That accounting method was previously allowed only for low-income housing tax credit ("LIHTC") investments, but now is available, by election, to all tax equity investments that meet five conditions. Under the new guidance, reporting entities can make accounting policy elections on a tax-credit-program-by-tax-credit-program basis, rather than for individual investments or at the reporting entity level. Additionally, early adoption is permitted. | January 1, 2024 | The Company expects that this standard will not have a material impact on its consolidated financial statements. | |||||||||||||||||
| Effective | Effect on the Financial Statements | |||||||||||||||||||
| Standard | Description | Date | or Other Significant Matters | |||||||||||||||||
ASU 2023-06, Disclosure Improvements - Codification Amendments in Response to the SEC's Disclosure Update and Simplification Initiative | This standard amends certain Subtopics of the ASC to incorporate certain disclosure requirements from SEC Release No. 33-10532, "Disclosure Update and Simplification" that was issued in 2018. The amendments in this standard should be applied prospectively. Early adoption is prohibited. | The effective date for each amendment will be the date on which the SEC's removal of the related disclosure from Regulation S-X or Regulation S-K becomes effective. | The Company is evaluating the impact of this standard on its consolidated financial statements. | |||||||||||||||||
134
BANC OF CALIFORNIA, INC. AND SUBSIDIARIES
Notes to Consolidated Financial Statements
| Effective | Effect on the Financial Statements | |||||||||||||||||||
| Standard | Description | Date | or Other Significant Matters | |||||||||||||||||
ASU 2023-07, Segment Reporting (Topic 280): Improvements to Reportable Segment Disclosures | The standard improves reportable segment disclosure requirements, primarily through enhanced disclosures about significant segment expenses. The enhanced segment disclosure requirements apply retrospectively to all prior periods presented in the financial statements. Additionally, early adoption is permitted. | December 31, 2024 | The Company is evaluating the impact of this standard on its consolidated financial statements. | |||||||||||||||||
| Effective | Effect on the Financial Statements | |||||||||||||||||||
| Standard | Description | Date | or Other Significant Matters | |||||||||||||||||
ASU 2023-09, Income Taxes (Topic 740): Improvements to Income Tax Disclosures | The standard, among other changes, improves annual income tax disclosures by requiring disaggregated information about a reporting entity’s effective tax rate reconciliation as well as information on income taxes paid. The enhanced income tax disclosure requirements apply on a prospective basis to annual financial statements for periods beginning after the effective date. However, retrospective application in all prior periods presented is permitted. Additionally, early adoption is permitted. | January 1, 2025 | The Company is evaluating the impact of this standard on its consolidated financial statements. | |||||||||||||||||
135
BANC OF CALIFORNIA, INC. AND SUBSIDIARIES
Notes to Consolidated Financial Statements
NOTE 2. BUSINESS COMBINATIONS
On November 30, 2023 (the “Merger Date”), PacWest Bancorp (“PACW”) merged with and into Banc of California, Inc. (“BANC”), with BANC continuing as the surviving legal corporation (the “Merger”). Promptly following the Merger, BANC’s wholly owned bank subsidiary, Banc of California, N.A., merged with and into PACW’s wholly owned bank subsidiary, Pacific Western Bank, with Pacific Western Bank surviving the merger. The name of the bank was then changed to Banc of California. Refer to Note 1. Nature of Operations and Summary of Significant Accounting Policies under the Basis of Financial Statement Presentation for more information pertaining to the completed Merger.
The Merger was accounted for as a reverse merger using the acquisition method of accounting; therefore, PACW was deemed the acquirer for financial reporting purposes, even though BANC was the legal acquirer. The Merger was an all-stock transaction and has been accounted for as a business combination. Pursuant to the merger agreement, on the Merger Date, each holder of PACW common stock received 0.6569 of a share (the “Exchange Ratio”) of BANC's common stock for each share of PACW common stock held. Each outstanding share of common stock of BANC remained outstanding and was unaffected by the Merger. As of the Merger Date, PACW had approximately 120.0 million and BANC had approximately 57.0 million shares of common stock outstanding. On the Merger Date, the shares of PACW common stock, which previously traded under the ticker symbol “PACW” on NASDAQ, ceased trading on, and were delisted from, NASDAQ. Following the Merger, BANC common stock continues to trade on NYSE, with the ticker symbol of “BANC.”
Each outstanding share of 7.75 % Fixed Rate Reset Non-Cumulative Perpetual Preferred Stock, Series A, of PACW was converted into the right to receive one share of a newly created series of BANC 7.75 % Fixed Rate Reset Non-Cumulative Perpetual Preferred Stock, Series F. Likewise, following the completion of the mergers, each outstanding PACW depositary share representing a 1/40th interest in a share of PACW preferred stock became a BANC depositary share representing a 1/40th interest in a share of new BANC preferred stock. The PACW depositary shares were listed prior to the merger on NASDAQ under the symbol “PACWP”. The BANC depositary shares representing a 1/40th interest in a share of new BANC preferred stock were listed on the NYSE upon completion of the mergers under the symbol “BANC/PF.”
Concurrently with its entry into the merger agreement, BANC entered into separate investment agreements (the “Investment Agreements”), with (i) affiliates of funds managed by Warburg Pincus LLC (the “Warburg Investors”) and (ii) certain investment vehicles sponsored, managed or advised by Centerbridge Partners, L.P. and its affiliates (the “Centerbridge Investor” and, together with the Warburg Investors, the “Investors”). On the terms and subject to the conditions set forth in the Investment Agreements, the Investors invested an aggregate of $400 million (before transaction costs) in exchange for the sale and issuance by BANC of approximately (a) 21.7 million shares of BANC common stock and (b) 10.8 million shares of a new class of non-voting, common-equivalent stock of BANC (“NVCE stock”), in each case, at a purchase price of $12.30 per share. In addition, the Warburg Investors received warrants to purchase approximately 15.9 million shares of NVCE stock, and the Centerbridge Investor received warrants to purchase approximately 3.0 million shares of BANC common stock, in each case, with such warrants having an initial exercise price of $15.375 per share (collectively the “Warrants” and together with the BANC common stock and the NVCE stock to be issued pursuant to the Investment Agreements, the “Investments”). The Warrants carry a term of seven years but are subject to mandatory exercise when the market price of BANC common stock reaches or exceeds $24.60 for 20 or more trading days during any 30-consecutive trading day period.
As the legal acquirer, BANC issued approximately 111.3 million shares of BANC common stock in connection with the Merger, which represented approximately 66 % of the voting interests in BANC upon completion of the Merger. The purchase price in a reverse acquisition is determined based on the number of equity interests the legal acquiree would have had to issue to give the owners of the legal acquirer the same percentage equity interest in the combined entity that results from the reverse acquisition. Therefore, the first step in calculating the purchase price in the Merger is to determine the ownership of the combined company following the Merger.
136
BANC OF CALIFORNIA, INC. AND SUBSIDIARIES
Notes to Consolidated Financial Statements
The table below summarizes the ownership of the combined company, BANC, following the Merger but prior to the Investments, as well as the market capitalization of the combined company prior to the Investments using shares of BANC and PACW common stock outstanding at November 30, 2023 and BANC’s closing price on November 30, 2023:
| BANC Ownership and Market Value Table | ||||||||||||||||||||
| (Pro Forma prior to Investments) | ||||||||||||||||||||
| Market Value at | ||||||||||||||||||||
| Number of | Percentage | $ | ||||||||||||||||||
| Outstanding Shares | Ownership | Price | ||||||||||||||||||
| (In thousands) | ||||||||||||||||||||
| BANC shareholders | % | $ | ||||||||||||||||||
| PACW shareholders | % | |||||||||||||||||||
| Total | % | $ | ||||||||||||||||||
Next, the hypothetical number of shares PACW would have to issue to give BANC shareholders the same percentage ownership in the combined company is calculated in the table below (based on shares of PACW common stock outstanding at November 30, 2023):
| Hypothetical PACW Ownership | ||||||||||||||
| Number of PACW | Percentage | |||||||||||||
| Outstanding Shares | Ownership | |||||||||||||
| (In thousands) | ||||||||||||||
| BANC shareholders | % | |||||||||||||
| PACW shareholders | % | |||||||||||||
| Total | % | |||||||||||||
Finally, the purchase price for purposes of the transaction accounting adjustments is calculated based on the number of hypothetical shares of PACW common stock issued to BANC shareholders, multiplied by the share price as demonstrated in the table below:
| (In thousands, except | ||||||||||||||||||||
| per share data) | ||||||||||||||||||||
| Number of hypothetical PACW common shares issued to BANC shareholders | ||||||||||||||||||||
| PACW market price per share as of November 30, 2023 | $ | |||||||||||||||||||
| Purchase price consideration | $ | |||||||||||||||||||
Upon the closing of the transaction, the ownership distribution of the combined company will be as follows, assuming consummation of the Investments, and excluding the potential dilutive effect of warrants or other equity awards:
| Number of | Percentage | |||||||||||||
| Outstanding Shares | Ownership | |||||||||||||
| (In thousands) | ||||||||||||||
| BANC common stockholders | % | |||||||||||||
| PACW stockholders | % | |||||||||||||
| Investors | % | |||||||||||||
| Total | % | |||||||||||||
137
BANC OF CALIFORNIA, INC. AND SUBSIDIARIES
Notes to Consolidated Financial Statements
The following table provides the preliminary purchase price allocation as of the Merger Date and the assets acquired and liabilities assumed at their estimated fair value as of the Merger Date as recorded by the Company. The estimates of fair value were recorded based on initial valuations available at the Merger Date, and these estimates, including initial accounting for deferred taxes and acquired loans, are considered preliminary as of December 31, 2023 and subject to adjustment for up to one year after the Merger Date. In many cases, the determination of fair value required management to make estimates about discount rates, expected future cash flows, market conditions and other future events that are highly subjective in nature and subject to change. While the Company believes that the information available on the Merger Date provided a reasonable basis for estimating fair value, additional information may be obtained during the measurement period that would result in changes to the estimated fair value amounts. The measurement period ends on the earlier of one year after the Merger Date or the date the Company concludes that all necessary information about the facts and circumstances that existed as of the Merger Date have been obtained. The fair value of acquired net tax assets may change once the final tax returns have been filed and the fair value of acquired loans may change due to additional information being obtained during the measurement period, including the determination of PCD loans as the Company further evaluates the information as of the acquisition date.
| November 30, 2023 | ||||||||||||||||||||
| Purchase Price Consideration: | ||||||||||||||||||||
| (In thousands) | ||||||||||||||||||||
| Total merger consideration | $ | |||||||||||||||||||
| Fair value of assets acquired: | ||||||||||||||||||||
| Cash and due from banks | $ | |||||||||||||||||||
| Investment securities available-for-sale | ||||||||||||||||||||
| Loans and leases held for sale | ||||||||||||||||||||
| Loans and leases held for investment, net of allowance for loan and lease losses | ||||||||||||||||||||
| Premises and equipment | ||||||||||||||||||||
| Other intangible assets | ||||||||||||||||||||
| Current and deferred tax assets, net | ||||||||||||||||||||
| Other assets | ||||||||||||||||||||
| Total assets acquired | $ | |||||||||||||||||||
| Fair value of liabilities assumed: | ||||||||||||||||||||
| Deposits | $ | |||||||||||||||||||
| FHLB advances | ||||||||||||||||||||
| Long-term debt | ||||||||||||||||||||
| Other liabilities | ||||||||||||||||||||
| Total liabilities assumed | $ | |||||||||||||||||||
| Net assets acquired | ||||||||||||||||||||
| Goodwill | $ | |||||||||||||||||||
In connection with the Merger, the Company recorded approximately $198.6 million of goodwill. Goodwill represents the excess of the purchase price over the fair value of the assets acquired, net of fair value of liabilities assumed. Information regarding the allocation of goodwill recorded as a result of the acquisition, as well as the carrying amounts and amortization of core deposit and other intangible assets, are provided in Note 7. Goodwill and Other Intangible Assets, Net of the Notes to Consolidated Financial Statements. None of the goodwill recognized is expected to be deductible for income tax purposes.
The following is a description of the methods used to determine the fair values of significant assets and liabilities presented above.
Cash and due from banks: The carrying amount of these assets is a reasonable estimate of fair value based on the short-term nature of these assets.
Investment Securities: Fair values for investment securities were the actual sales prices of the securities when they were sold in December 2023 as this was determined to be the best indicator of fair value.
138
BANC OF CALIFORNIA, INC. AND SUBSIDIARIES
Notes to Consolidated Financial Statements
Loans held for sale: The loans held for sale portfolio was recorded at fair value based on quotes or bids from third party investors and/or recent sale prices.
Loans and leases: A valuation of the loans held for investment portfolio was performed by a third party as of the Merger Date to assess the fair value. The loans held for investment portfolio was segmented into three groups, including performing PCD loans, non-performing PCD loans and non-PCD loans. The loans were further pooled based on loan type and risk rating bands. Most of the loans were valued at the loan level using a discounted cash flow methodology. The methodology included projecting cash flows based on the contractual terms of the loans and the cash flows were adjusted to reflect credit loss expectations along with prepayments. Discount rates were developed based on the relative risk of the cash flows, taking into consideration the loan type, market rates as of the valuation date, recent originations in the portfolio, credit loss expectations, and liquidity expectations. Lastly, cash flows adjusted for credit loss expectations were discounted to present value and summed to arrive at the fair value of the loans. Other loans were valued based on recent quotes, bids or recent sale prices of similar loans and for one loan portfolio it was concluded the fair value equaled the portfolio's par value due to the short-term nature of the loan product, combined with the low expected credit losses and the variable interest rates being at market.
The Company is required to record PCD assets, defined as a more-than-insignificant deterioration in credit quality since origination or issuance, at the purchase price plus the allowance for credit losses expected at the time of acquisition. Under this method, there is no credit loss expense affecting net income on acquisition of PCD assets. Changes in estimates of expected credit losses after acquisition are recognized in subsequent periods as provision for credit losses (or recapture of credit losses) arises. Any non-credit discount or premium resulting from acquiring a pool of purchased financial assets with credit deterioration is allocated to each individual asset. At the acquisition date, the initial allowance for credit losses determined on a collective basis is allocated to individual assets to appropriately allocate any non-credit discount or premium. The non-credit discount or premium, after the adjustment for the allowance for credit losses, is accreted to interest income using the interest method based on the effective interest rate determined at the merger date.
Of the $4.0 billion net loans held for investment acquired, $1.7 billion were identified as PCD loans on the Merger Date. The following table provides a summary of these PCD loans at acquisition:
| November 30, 2023 | ||||||||||||||
| (In thousands) | ||||||||||||||
| Principal of PCD loans acquired | $ | |||||||||||||
| PCD ACL at acquisition | ( | |||||||||||||
| Non-credit discount on PCD loans | ( | |||||||||||||
| Fair value of PCD loans | $ | |||||||||||||
Premises and equipment: The fair values of premises are based on a market approach, by obtaining third-party appraisals and broker opinions of value for land, office and branch space.
Core deposit intangible: Core deposit intangible represents the low cost of funding acquired core deposits provide relative to the Company’s marginal cost of funds. The fair value was estimated based on a discounted cash flow methodology that gave consideration to expected customer attrition rates, net maintenance cost of the deposit base, interest costs associated with customer deposits, and the alternative cost of funds. The cash flows from estimated net cost savings derived from the acquired core deposits were discounted to present value and summed to arrive at the fair value of the core deposit intangible. The intangible assets are being amortized over 10 years using the sum of years digits, based upon the period over which estimated economic benefits are estimated to be received.
Current and deferred tax assets, net: The fair values of the acquired net tax assets represent the estimated amount of tax benefits to be recognized on tax returns.
Deposits: The fair values used for the demand and savings deposits equal the amount payable on demand at the Merger Date. The fair values for time deposits are estimated using a discounted cash flow calculation that applies interest rates currently being offered to the contractual interest rates on such time deposits.
Borrowings: The fair values of FHLB advances and long-term debt instruments are estimated based on quoted market prices for the instrument if available, or for similar instruments if not available, or by using discounted cash flow analyses, based on current incremental borrowing rates for similar types of instruments.
139
BANC OF CALIFORNIA, INC. AND SUBSIDIARIES
Notes to Consolidated Financial Statements
The Company's operating results for year ended December 31, 2023 include the operating results of the acquired assets and assumed liabilities of historical BANC subsequent to the Merger Date.
The following table shows the amount of the expenses related to the Merger for the year ended December 31, 2023:
| Year Ended | ||||||||||||||
| December 31, 2023 | ||||||||||||||
| (In thousands) | ||||||||||||||
| Severance and employee-related | $ | |||||||||||||
| Legal and professional | ||||||||||||||
| Asset write-downs, lease terminations and other facilities-related | ||||||||||||||
| System conversion and integration | ||||||||||||||
| Other | ||||||||||||||
| Total merger-related expenses | $ | |||||||||||||
The following table presents unaudited pro forma information as if the Merger had occurred on January 1, 2022. The pro forma adjustments give effect to any change in interest income due to the accretion of the discount (premium) associated with the fair value adjustments to acquired loans and leases, any change in interest expense due to estimated premium amortization/discount accretion associated with the fair value adjustment to acquired interest-bearing deposits and long-term debt and the amortization of the core deposit intangible that would have resulted had the deposits been acquired as of January 1, 2022. The pro forma information is not indicative of what would have occurred had the Merger occurred as of the beginning of the year prior to the Merger Date. The pro forma amounts below do not reflect the Company's expectations as of the date of the pro forma information of further operating cost savings and other business synergies expected to be achieved, including revenue growth as a result of the Merger and the effects of the balance sheet repositioning completed subsequent to the Merger. As a result, actual amounts differed from the unaudited pro forma information presented.
| Unaudited Pro Forma for the | ||||||||||||||||||||
| Year Ended December 31, | ||||||||||||||||||||
| 2023 | 2022 | |||||||||||||||||||
| (In thousands) | ||||||||||||||||||||
| Net interest income | $ | $ | ||||||||||||||||||
| Noninterest (loss) income | $ | ( | $ | |||||||||||||||||
| Net (loss) earnings before income taxes (1) | $ | ( | $ | |||||||||||||||||
NOTE 3. RESTRICTED CASH
140
BANC OF CALIFORNIA, INC. AND SUBSIDIARIES
Notes to Consolidated Financial Statements
NOTE 4. INVESTMENT SECURITIES
Transfer of Securities Available-for-Sale to Held-to Maturity
Effective June 1, 2022, the Company transferred $2.3 billion in fair value of municipal securities, agency commercial MBS, private label commercial MBS, U.S. Treasury securities, and corporate debt securities from available-for-sale to held-to-maturity. At the time of transfer, $218.3 million of unrealized losses, net of tax, was retained in "Accumulated other comprehensive loss, net" on the consolidated balance sheets.
Securities Available-for-Sale
The following table presents amortized cost, gross unrealized gains and losses, and fair values of securities available-for-sale as of the dates indicated:
| December 31, 2023 | |||||||||||||||||||||||||||||||||||
| Allowance | Gross | Gross | |||||||||||||||||||||||||||||||||
| Amortized | for Credit | Net Carrying | Unrealized | Unrealized | Fair | ||||||||||||||||||||||||||||||
| Security Type | Cost | Losses | Amount | Gains | Losses | Value | |||||||||||||||||||||||||||||
| (In thousands) | |||||||||||||||||||||||||||||||||||
| Agency residential MBS | $ | $ | $ | $ | $ | ( | $ | ||||||||||||||||||||||||||||
| U.S. Treasury securities | |||||||||||||||||||||||||||||||||||
| Agency commercial MBS | ( | ||||||||||||||||||||||||||||||||||
| Agency residential CMOs | ( | ||||||||||||||||||||||||||||||||||
| Municipal securities | ( | ||||||||||||||||||||||||||||||||||
| Corporate debt securities | ( | ( | |||||||||||||||||||||||||||||||||
| Private label residential CMOs | ( | ||||||||||||||||||||||||||||||||||
| Collateralized loan obligations | ( | ||||||||||||||||||||||||||||||||||
| Private label commercial MBS | ( | ||||||||||||||||||||||||||||||||||
| Asset-backed securities | ( | ||||||||||||||||||||||||||||||||||
| SBA securities | ( | ||||||||||||||||||||||||||||||||||
| Total | $ | $ | ( | $ | $ | $ | ( | $ | |||||||||||||||||||||||||||
| December 31, 2022 | |||||||||||||||||||||||||||||||||||
| Allowance | Gross | Gross | |||||||||||||||||||||||||||||||||
| Amortized | for Credit | Net Carrying | Unrealized | Unrealized | Fair | ||||||||||||||||||||||||||||||
| Security Type | Cost | Losses | Amount | Gains | Losses | Value | |||||||||||||||||||||||||||||
| (In thousands) | |||||||||||||||||||||||||||||||||||
| Agency residential MBS | $ | $ | $ | $ | $ | ( | $ | ||||||||||||||||||||||||||||
| U.S. Treasury securities | ( | ||||||||||||||||||||||||||||||||||
| Agency commercial MBS | ( | ||||||||||||||||||||||||||||||||||
| Agency residential CMOs | ( | ||||||||||||||||||||||||||||||||||
| Municipal securities | ( | ||||||||||||||||||||||||||||||||||
| Corporate debt securities | ( | ||||||||||||||||||||||||||||||||||
| Private label residential CMOs | ( | ||||||||||||||||||||||||||||||||||
| Collateralized loan obligations | ( | ||||||||||||||||||||||||||||||||||
| Private label commercial MBS | ( | ||||||||||||||||||||||||||||||||||
| Asset-backed securities | ( | ||||||||||||||||||||||||||||||||||
| SBA securities | ( | ||||||||||||||||||||||||||||||||||
| Total | $ | $ | $ | $ | $ | ( | $ | ||||||||||||||||||||||||||||
See Note 15. Fair Value Measurements for information on fair value measurements and methodology.
141
BANC OF CALIFORNIA, INC. AND SUBSIDIARIES
Notes to Consolidated Financial Statements
As of December 31, 2023, the Company had an allowance for credit losses on securities available-for-sale of $199,000. The Company does not consider unrealized losses on such securities to be attributable to credit-related factors, as the unrealized losses have occurred as a result of changes in non-credit related factors such as interest rates, market spreads, and market conditions subsequent to purchase. We do not currently intend to sell any of the securities in an unrealized loss position and further believe it is more likely than not that we will not be required to sell these securities before their anticipated recovery.
As of December 31, 2023, securities available‑for‑sale with a fair value of $2.1 billion were pledged primarily as collateral for the Bank Term Funding Program borrowings.
Realized Gains and Losses on Securities Available-for-Sale
The following table presents the amortized cost of securities sold with related gross realized gains, gross realized losses, and net realized (losses) gains for the years indicated:
| Year Ended December 31, | |||||||||||||||||
| Sales of Securities Available-for-Sale | 2023 | 2022 | 2021 | ||||||||||||||
| (In thousands) | |||||||||||||||||
| Amortized cost of securities sold | $ | $ | $ | ||||||||||||||
| Gross realized gains | $ | $ | $ | ||||||||||||||
| Gross realized losses | ( | ( | ( | ||||||||||||||
| Net realized (losses) gains | $ | ( | $ | ( | $ | ||||||||||||
Unrealized Losses on Securities Available-for-Sale
The following tables present the gross unrealized losses and fair values of securities available-for-sale that were in unrealized loss positions as of the dates indicated:
| December 31, 2023 | |||||||||||||||||||||||||||||||||||
| Less Than 12 Months | 12 Months or More | Total | |||||||||||||||||||||||||||||||||
| Gross | Gross | Gross | |||||||||||||||||||||||||||||||||
| Fair | Unrealized | Fair | Unrealized | Fair | Unrealized | ||||||||||||||||||||||||||||||
| Security Type | Value | Losses | Value | Losses | Value | Losses | |||||||||||||||||||||||||||||
| (In thousands) | |||||||||||||||||||||||||||||||||||
| Agency residential MBS | $ | $ | $ | $ | ( | $ | $ | ( | |||||||||||||||||||||||||||
| U.S. Treasury securities | |||||||||||||||||||||||||||||||||||
| Agency commercial MBS | ( | ( | |||||||||||||||||||||||||||||||||
| Agency residential CMOs | ( | ( | |||||||||||||||||||||||||||||||||
| Municipal securities | ( | ( | |||||||||||||||||||||||||||||||||
| Corporate debt securities | ( | ( | |||||||||||||||||||||||||||||||||
| Private label residential CMOs | ( | ( | |||||||||||||||||||||||||||||||||
| Collateralized loan obligations | ( | ( | |||||||||||||||||||||||||||||||||
| Private label commercial MBS | ( | ( | |||||||||||||||||||||||||||||||||
| Asset-backed securities | ( | ( | |||||||||||||||||||||||||||||||||
| SBA securities | ( | ( | |||||||||||||||||||||||||||||||||
| Total | $ | $ | $ | $ | ( | $ | $ | ( | |||||||||||||||||||||||||||
142
BANC OF CALIFORNIA, INC. AND SUBSIDIARIES
Notes to Consolidated Financial Statements
| December 31, 2022 | |||||||||||||||||||||||||||||||||||
| Less Than 12 Months | 12 Months or More | Total | |||||||||||||||||||||||||||||||||
| Gross | Gross | Gross | |||||||||||||||||||||||||||||||||
| Fair | Unrealized | Fair | Unrealized | Fair | Unrealized | ||||||||||||||||||||||||||||||
| Security Type | Value | Losses | Value | Losses | Value | Losses | |||||||||||||||||||||||||||||
| (In thousands) | |||||||||||||||||||||||||||||||||||
| Agency residential MBS | $ | $ | ( | $ | $ | ( | $ | $ | ( | ||||||||||||||||||||||||||
| U.S. Treasury securities | ( | ( | ( | ||||||||||||||||||||||||||||||||
| Agency commercial MBS | ( | ( | ( | ||||||||||||||||||||||||||||||||
| Agency residential CMOs | ( | ( | ( | ||||||||||||||||||||||||||||||||
| Municipal securities | ( | ( | ( | ||||||||||||||||||||||||||||||||
| Corporate debt securities | ( | ( | ( | ||||||||||||||||||||||||||||||||
| Private label residential CMOs | ( | ( | ( | ||||||||||||||||||||||||||||||||
| Collateralized loan obligations | ( | ( | ( | ||||||||||||||||||||||||||||||||
| Private label commercial MBS | ( | ( | ( | ||||||||||||||||||||||||||||||||
| Asset-backed securities | ( | ( | |||||||||||||||||||||||||||||||||
| SBA securities | ( | ( | |||||||||||||||||||||||||||||||||
| Total | $ | $ | ( | $ | $ | ( | $ | $ | ( | ||||||||||||||||||||||||||
The securities that were in an unrealized loss position at December 31, 2023, were considered impaired and required further review to determine if the unrealized losses were credit-related. We concluded their unrealized losses were a result of the level of market interest rates relative to the types of securities and pricing changes caused by shifting supply and demand dynamics and not a result of downgraded credit ratings or other indicators of deterioration of the underlying issuers' ability to repay. We also considered the seniority of the tranches and U.S. government agency guarantees, if any, to assess whether an unrealized loss was credit-related. Accordingly, we determined the unrealized losses were not credit-related and recognized the unrealized losses in "Accumulated other comprehensive loss, net" of "Stockholders' equity" on the consolidated balance sheets. Although we periodically sell securities for portfolio management purposes, we do not foresee having to sell any impaired securities strictly for liquidity needs and believe that it is more likely than not we would not be required to sell any impaired securities before recovery of their amortized cost.
143
BANC OF CALIFORNIA, INC. AND SUBSIDIARIES
Notes to Consolidated Financial Statements
Contractual Maturities of Securities Available-for-Sale
The following tables present the contractual maturities of our available-for-sale securities portfolio based on amortized cost and fair value as of the date indicated:
| December 31, 2023 | |||||||||||||||||||||||||||||
| Due After | Due After | ||||||||||||||||||||||||||||
| Due | One Year | Five Years | Due | ||||||||||||||||||||||||||
| Within | Through | Through | After | ||||||||||||||||||||||||||
| Security Type | One Year | Five Years | Ten Years | Ten Years | Total | ||||||||||||||||||||||||
| (In thousands) | |||||||||||||||||||||||||||||
| Amortized Cost: | |||||||||||||||||||||||||||||
| Agency residential MBS | $ | $ | $ | $ | $ | ||||||||||||||||||||||||
| U.S. Treasury securities | |||||||||||||||||||||||||||||
| Agency commercial MBS | |||||||||||||||||||||||||||||
| Agency residential CMOs | |||||||||||||||||||||||||||||
| Municipal securities | |||||||||||||||||||||||||||||
| Corporate debt securities | |||||||||||||||||||||||||||||
| Private label residential CMOs | |||||||||||||||||||||||||||||
| Collateralized loan obligations | |||||||||||||||||||||||||||||
| Private label commercial MBS | |||||||||||||||||||||||||||||
| Asset-backed securities | |||||||||||||||||||||||||||||
| SBA securities | |||||||||||||||||||||||||||||
| Total | $ | $ | $ | $ | $ | ||||||||||||||||||||||||
| December 31, 2023 | |||||||||||||||||||||||||||||
| Due After | Due After | ||||||||||||||||||||||||||||
| Due | One Year | Five Years | Due | ||||||||||||||||||||||||||
| Within | Through | Through | After | ||||||||||||||||||||||||||
| Security Type | One Year | Five Years | Ten Years | Ten Years | Total | ||||||||||||||||||||||||
| (In thousands) | |||||||||||||||||||||||||||||
| Fair Value: | |||||||||||||||||||||||||||||
| Agency residential MBS | $ | $ | $ | $ | $ | ||||||||||||||||||||||||
| U.S. Treasury securities | |||||||||||||||||||||||||||||
| Agency commercial MBS | |||||||||||||||||||||||||||||
| Agency residential CMOs | |||||||||||||||||||||||||||||
| Municipal securities | |||||||||||||||||||||||||||||
| Corporate debt securities | |||||||||||||||||||||||||||||
| Private label residential CMOs | |||||||||||||||||||||||||||||
| Collateralized loan obligations | |||||||||||||||||||||||||||||
| Private label commercial MBS | |||||||||||||||||||||||||||||
| Asset-backed securities | |||||||||||||||||||||||||||||
| SBA securities | |||||||||||||||||||||||||||||
| Total | $ | $ | $ | $ | $ | ||||||||||||||||||||||||
CMBS, CMOs, and MBS have contractual maturity dates, but require periodic payments based upon scheduled amortization terms. Actual principal collections on these securities usually occur more rapidly than the scheduled amortization terms because of prepayments made by obligors of the underlying loan collateral.
144
BANC OF CALIFORNIA, INC. AND SUBSIDIARIES
Notes to Consolidated Financial Statements
Securities Held-to-Maturity
The following table presents amortized cost, allowance for credit losses, gross unrealized gains and losses, and fair values of securities held-to-maturity as of the dates indicated:
| December 31, 2023 | |||||||||||||||||||||||||||||||||||
| Allowance | |||||||||||||||||||||||||||||||||||
| for | Net | Gross | Gross | ||||||||||||||||||||||||||||||||
| Amortized | Credit | Carrying | Unrealized | Unrealized | Fair | ||||||||||||||||||||||||||||||
| Security Type | Cost | Losses | Amount | Gains | Losses | Value | |||||||||||||||||||||||||||||
| (In thousands) | |||||||||||||||||||||||||||||||||||
| Municipal securities | $ | $ | ( | $ | $ | $ | ( | $ | |||||||||||||||||||||||||||
| Agency commercial MBS | ( | ||||||||||||||||||||||||||||||||||
| Private label commercial MBS | ( | ||||||||||||||||||||||||||||||||||
| U.S. Treasury securities | ( | ||||||||||||||||||||||||||||||||||
| Corporate debt securities | ( | ( | |||||||||||||||||||||||||||||||||
Total (1) | $ | $ | ( | $ | $ | $ | ( | $ | |||||||||||||||||||||||||||
(1) Excludes accrued interest receivable of $13.4 million at December 31, 2023 which is recorded in "Other assets" on the consolidated balance shee ts.
| December 31, 2022 | |||||||||||||||||||||||||||||||||||
| Allowance | |||||||||||||||||||||||||||||||||||
| for | Net | Gross | Gross | ||||||||||||||||||||||||||||||||
| Amortized | Credit | Carrying | Unrealized | Unrealized | Fair | ||||||||||||||||||||||||||||||
| Security Type | Cost | Losses | Amount | Gains | Losses | Value | |||||||||||||||||||||||||||||
| (In thousands) | |||||||||||||||||||||||||||||||||||
| Municipal securities | $ | $ | ( | $ | $ | $ | ( | $ | |||||||||||||||||||||||||||
| Agency commercial MBS | ( | ||||||||||||||||||||||||||||||||||
| Private label commercial MBS | ( | ||||||||||||||||||||||||||||||||||
| U.S. Treasury securities | ( | ||||||||||||||||||||||||||||||||||
| Corporate debt securities | ( | ( | |||||||||||||||||||||||||||||||||
Total (1) | $ | $ | ( | $ | $ | $ | ( | $ | |||||||||||||||||||||||||||
(1) Excludes accrued interest receivable of $13.5 million at December 31, 2022 which is recorded in "Other assets" on the consolidated balance sheets.
As of December 31, 2023, securities held-to-maturity with an amortized cost of $2.2 billion and a fair value of $2.1 billion were pledged as collateral to the FHLB to increase borrowing capacity and for public deposits and letters of credit.
145
BANC OF CALIFORNIA, INC. AND SUBSIDIARIES
Notes to Consolidated Financial Statements
Allowance for Credit Losses on Securities Held-to-Maturity
The following table presents the changes by major security type in our allowance for credit losses on securities held-to-maturity for the years indicated:
| Year Ended December 31, 2023 | |||||||||||||||||||||||||||||
| Allowance for | Provision | Allowance for | |||||||||||||||||||||||||||
| Credit Losses, | for | Credit Losses, | |||||||||||||||||||||||||||
| Beginning | Credit | End of | |||||||||||||||||||||||||||
| Security Type | of Period | Losses | Charge-offs | Recoveries | Period | ||||||||||||||||||||||||
| (In thousands) | |||||||||||||||||||||||||||||
| Municipal securities | $ | $ | $ | $ | $ | ||||||||||||||||||||||||
| Corporate debt securities | |||||||||||||||||||||||||||||
| Total | $ | $ | $ | $ | $ | ||||||||||||||||||||||||
| Year Ended December 31, 2022 | |||||||||||||||||||||||||||||
| Allowance for | Provision | Allowance for | |||||||||||||||||||||||||||
| Credit Losses, | for | Credit Losses, | |||||||||||||||||||||||||||
| Beginning | Credit | End of | |||||||||||||||||||||||||||
| Security Type | of Period | Losses | Charge-offs | Recoveries | Period | ||||||||||||||||||||||||
| (In thousands) | |||||||||||||||||||||||||||||
| Municipal securities | $ | $ | $ | $ | $ | ||||||||||||||||||||||||
| Corporate debt securities | |||||||||||||||||||||||||||||
| Total | $ | $ | $ | $ | $ | ||||||||||||||||||||||||
Credit losses on HTM securities are recorded at the time of purchase, acquisition, or when the Company designates securities as held-to-maturity. The allowance for credit losses on HTM securities is representative of current expected credit losses that may be incurred over the life of the investment. Accrued interest receivable on HTM securities, which is included in other assets on the consolidated balance sheets, is excluded from the estimate of expected credit losses. HTM U.S. treasury securities and agency-backed MBS securities are considered to have no risk of loss as they are either explicitly or implicitly guaranteed by the U.S. government. The change in fair value in the HTM private label CMBS portfolio is solely driven by changes in interest rates. The Company has no knowledge of any underlying credit issues and the cash flows underlying the debt securities have not changed and are not expected to be impacted by changes in interest rates and, thus, there is no related ACL for this portfolio. The underlying bonds in the Company’s HTM municipal securities and HTM corporate debt securities portfolios are evaluated for credit losses in conjunction with management’s estimate of the allowance for credit losses based primarily on credit ratings.
146
BANC OF CALIFORNIA, INC. AND SUBSIDIARIES
Notes to Consolidated Financial Statements
Securities Held-to-Maturity by Credit Quality Indicator
The Company uses S&P, Moody's, Fitch, Kroll, and Egan Jones ratings as the credit quality indicators for its held-to-maturity securities. The following table presents our securities held-to-maturity portfolio by the lowest available credit rating as of the dates indicated:
| December 31, 2023 | |||||||||||||||||||||||||||||||||||||||||||||||
| Security Type | AAA | AA+ | AA | AA- | A | BBB | NR | Total | |||||||||||||||||||||||||||||||||||||||
| (In thousands) | |||||||||||||||||||||||||||||||||||||||||||||||
| Amortized Cost: | |||||||||||||||||||||||||||||||||||||||||||||||
| Municipal securities | $ | $ | $ | $ | $ | $ | $ | $ | |||||||||||||||||||||||||||||||||||||||
| Agency commercial MBS | |||||||||||||||||||||||||||||||||||||||||||||||
| Private label commercial MBS | |||||||||||||||||||||||||||||||||||||||||||||||
| U.S. Treasury securities | |||||||||||||||||||||||||||||||||||||||||||||||
| Corporate debt securities | |||||||||||||||||||||||||||||||||||||||||||||||
| Total | $ | $ | $ | $ | $ | $ | $ | $ | |||||||||||||||||||||||||||||||||||||||
| December 31, 2022 | |||||||||||||||||||||||||||||||||||||||||||||||||||||
| Security Type | AAA | AA+ | AA | AA- | A | A- | BBB | NR | Total | ||||||||||||||||||||||||||||||||||||||||||||
| (In thousands) | |||||||||||||||||||||||||||||||||||||||||||||||||||||
| Amortized Cost: | |||||||||||||||||||||||||||||||||||||||||||||||||||||
| Municipal securities | $ | $ | $ | $ | $ | $ | $ | $ | $ | ||||||||||||||||||||||||||||||||||||||||||||
| Agency commercial MBS | |||||||||||||||||||||||||||||||||||||||||||||||||||||
| Private label commercial MBS | |||||||||||||||||||||||||||||||||||||||||||||||||||||
| U.S. Treasury securities | |||||||||||||||||||||||||||||||||||||||||||||||||||||
| Corporate debt securities | |||||||||||||||||||||||||||||||||||||||||||||||||||||
| Total | $ | $ | $ | $ | $ | $ | $ | $ | $ | ||||||||||||||||||||||||||||||||||||||||||||
Contractual Maturities of Securities Held-to-Maturity
The following table presents the contractual maturities of our securities held-to-maturity portfolio based on amortized cost and fair value as of the date indicated:
| December 31, 2023 | |||||||||||||||||||||||||||||
| Due After | Due After | ||||||||||||||||||||||||||||
| Due | One Year | Five Years | Due | ||||||||||||||||||||||||||
| Within | Through | Through | After | ||||||||||||||||||||||||||
| Security Type | One Year | Five Years | Ten Years | Ten Years | Total | ||||||||||||||||||||||||
| (In thousands) | |||||||||||||||||||||||||||||
| Amortized Cost: | |||||||||||||||||||||||||||||
| Municipal securities | $ | $ | $ | $ | $ | ||||||||||||||||||||||||
| Agency commercial MBS | |||||||||||||||||||||||||||||
| Private label commercial MBS | |||||||||||||||||||||||||||||
| U.S. Treasury securities | |||||||||||||||||||||||||||||
| Corporate debt securities | |||||||||||||||||||||||||||||
| Total | $ | $ | $ | $ | $ | ||||||||||||||||||||||||
147
BANC OF CALIFORNIA, INC. AND SUBSIDIARIES
Notes to Consolidated Financial Statements
| December 31, 2023 | |||||||||||||||||||||||||||||
| Due After | Due After | ||||||||||||||||||||||||||||
| Due | One Year | Five Years | Due | ||||||||||||||||||||||||||
| Within | Through | Through | After | ||||||||||||||||||||||||||
| Security Type | One Year | Five Years | Ten Years | Ten Years | Total | ||||||||||||||||||||||||
| (In thousands) | |||||||||||||||||||||||||||||
| Fair Value: | |||||||||||||||||||||||||||||
| Municipal securities | $ | $ | $ | $ | $ | ||||||||||||||||||||||||
| Agency commercial MBS | |||||||||||||||||||||||||||||
| Private label commercial MBS | |||||||||||||||||||||||||||||
| U.S. Treasury securities | |||||||||||||||||||||||||||||
| Corporate debt securities | |||||||||||||||||||||||||||||
| Total | $ | $ | $ | $ | $ | ||||||||||||||||||||||||
CMBS have contractual maturity dates, but require periodic payments based upon scheduled amortization terms. Actual principal collections on these securities usually occur more rapidly than the scheduled amortization terms because of prepayments made by obligors of the underlying loan collateral.
FRB and FHLB Stock
In connection with borrowing facilities with the FRB and FHLB, the Bank owned FRB and FHLB stock carried at cost of $126.3 million and $34.3 million at December 31, 2023 and 2022. We evaluated the carrying value of our FRB and FHLB stock investment at December 31, 2023 and determined that it was not impaired. Our evaluation considered the long-term nature of the investment, the current financial and liquidity position of the FRB and FHLB, repurchase activity of excess stock by the FRB and FHLB at its carrying value, the return on the investment from recurring dividends, and our intent and ability to hold this investment for a period of time sufficient to recover our recorded investment.
Interest Income on Investment Securities
The following table presents the composition of our interest income on investment securities for the years indicated:
| Year Ended December 31, | |||||||||||||||||
| 2023 | 2022 | 2021 | |||||||||||||||
| (In thousands) | |||||||||||||||||
| Taxable interest | $ | $ | $ | ||||||||||||||
| Non-taxable interest | |||||||||||||||||
| Dividend income | |||||||||||||||||
| Total interest income on investment securities | $ | $ | $ | ||||||||||||||
148
BANC OF CALIFORNIA, INC. AND SUBSIDIARIES
Notes to Consolidated Financial Statements
NOTE 5. LOANS AND LEASES
Loans and Leases Held for Investment
The following table summarizes the composition of our loans and leases held for investment as of the dates indicated:
| December 31, | |||||||||||
| 2023 | 2022 | ||||||||||
| (In thousands) | |||||||||||
| Real estate mortgage | $ | $ | |||||||||
Real estate construction and land (1) | |||||||||||
| Commercial | |||||||||||
| Consumer | |||||||||||
| Total gross loans and leases held for investment | |||||||||||
| Deferred fees, net | ( | ( | |||||||||
| Total loans and leases held for investment, net of deferred fees | |||||||||||
| Allowance for loan and lease losses | ( | ( | |||||||||
Total loans and leases held for investment, net (2) | $ | $ | |||||||||
____________________
(1) Includes land and acquisition and development loans of $228.9 million and $153.5 million at December 31, 2023 and 2022.
(2) Excludes accrued interest receivable of $111.3 million and $124.3 million at December 31, 2023 and 2022, which is recorded in "Other assets" on the consolidated balance sheets.
The following tables present an aging analysis of our loans and leases held for investment, net of deferred fees, by loan portfolio segment and class as of the dates indicated:
| December 31, 2023 | |||||||||||||||||||||||||||||
| 30 - 89 | 90 or More | ||||||||||||||||||||||||||||
| Days | Days | Total | |||||||||||||||||||||||||||
| Past Due | Past Due | Past Due | Current | Total | |||||||||||||||||||||||||
| (In thousands) | |||||||||||||||||||||||||||||
| Real estate mortgage: | |||||||||||||||||||||||||||||
| Commercial | $ | $ | $ | $ | $ | ||||||||||||||||||||||||
| Residential | |||||||||||||||||||||||||||||
| Other residential | |||||||||||||||||||||||||||||
| Total real estate mortgage | |||||||||||||||||||||||||||||
| Real estate construction and land: | |||||||||||||||||||||||||||||
| Commercial | |||||||||||||||||||||||||||||
| Residential | |||||||||||||||||||||||||||||
| Total real estate construction and land | |||||||||||||||||||||||||||||
| Commercial: | |||||||||||||||||||||||||||||
| Asset-based | |||||||||||||||||||||||||||||
| Venture capital | |||||||||||||||||||||||||||||
| Other commercial | |||||||||||||||||||||||||||||
| Total commercial | |||||||||||||||||||||||||||||
| Consumer | |||||||||||||||||||||||||||||
| Total | $ | $ | $ | $ | $ | ||||||||||||||||||||||||
149
BANC OF CALIFORNIA, INC. AND SUBSIDIARIES
Notes to Consolidated Financial Statements
| December 31, 2022 | |||||||||||||||||||||||||||||
| 30 - 89 | 90 or More | ||||||||||||||||||||||||||||
| Days | Days | Total | |||||||||||||||||||||||||||
| Past Due | Past Due | Past Due | Current | Total | |||||||||||||||||||||||||
| (In thousands) | |||||||||||||||||||||||||||||
| Real estate mortgage: | |||||||||||||||||||||||||||||
| Commercial | $ | $ | $ | $ | $ | ||||||||||||||||||||||||
| Residential | |||||||||||||||||||||||||||||
| Other residential | |||||||||||||||||||||||||||||
| Total real estate mortgage | |||||||||||||||||||||||||||||
| Real estate construction and land: | |||||||||||||||||||||||||||||
| Commercial | |||||||||||||||||||||||||||||
| Residential | |||||||||||||||||||||||||||||
| Total real estate construction and land | |||||||||||||||||||||||||||||
| Commercial: | |||||||||||||||||||||||||||||
| Asset-based | |||||||||||||||||||||||||||||
| Venture capital | |||||||||||||||||||||||||||||
| Other commercial | |||||||||||||||||||||||||||||
| Total commercial | |||||||||||||||||||||||||||||
| Consumer | |||||||||||||||||||||||||||||
| Total | $ | $ | $ | $ | $ | ||||||||||||||||||||||||
The following table presents our nonaccrual and performing loans and leases held for investment, net of deferred fees, by loan portfolio segment and class as of the dates indicated:
| December 31, | |||||||||||||||||||||||||||||||||||
| 2023 | 2022 | ||||||||||||||||||||||||||||||||||
| Nonaccrual | Performing | Total | Nonaccrual | Performing | Total | ||||||||||||||||||||||||||||||
| (In thousands) | |||||||||||||||||||||||||||||||||||
| Real estate mortgage: | |||||||||||||||||||||||||||||||||||
| Commercial | $ | $ | $ | $ | $ | $ | |||||||||||||||||||||||||||||
| Residential | |||||||||||||||||||||||||||||||||||
| Other residential | |||||||||||||||||||||||||||||||||||
| Total real estate mortgage | |||||||||||||||||||||||||||||||||||
| Real estate construction and land: | |||||||||||||||||||||||||||||||||||
| Commercial | |||||||||||||||||||||||||||||||||||
| Residential | |||||||||||||||||||||||||||||||||||
| Total real estate construction and land | |||||||||||||||||||||||||||||||||||
| Commercial: | |||||||||||||||||||||||||||||||||||
| Asset-based | |||||||||||||||||||||||||||||||||||
| Venture capital | |||||||||||||||||||||||||||||||||||
| Other commercial | |||||||||||||||||||||||||||||||||||
| Total commercial | |||||||||||||||||||||||||||||||||||
| Consumer | |||||||||||||||||||||||||||||||||||
| Total | $ | $ | $ | $ | $ | $ | |||||||||||||||||||||||||||||
At December 31, 2023, there was one loan for $11.8 million that was 90 or more days past due and still accruing. At December 31, 2022, there were no such loans.
The amount of interest income that would have been recorded on nonaccrual loans and leases at December 31, 2023 and 2022 had such loans and leases been current in accordance with their original terms was $5.8 million and $6.3 million for 2023 and 2022.
150
BANC OF CALIFORNIA, INC. AND SUBSIDIARIES
Notes to Consolidated Financial Statements
At December 31, 2023, nonaccrual loans and leases included $19.1 million of loans and leases 90 or more days past due, $11.4 million of loans 30 to 89 days past due and $32.0 million of current loans that were placed on nonaccrual status based on management’s judgment regarding their collectability. At December 31, 2022, nonaccrual loans and leases included $70.9 million of loans and leases 90 or more days past due, $6.8 million of loans 30 to 89 days past due and $26.0 million of current loans that were placed on nonaccrual status based on management’s judgment regarding their collectability.
As of December 31, 2023, our three largest loan relationships on nonaccrual status had an aggregate carrying value of $7.1 million and represented 11 % of total nonaccrual loans and leases.
The following tables present the credit risk rating categories for loans and leases held for investment by loan portfolio segment and class as of the dates indicated. Classified loans and leases are those with a credit risk rating of either substandard or doubtful.
| December 31, 2023 | |||||||||||||||||||||||
| Classified | Special Mention | Pass | Total | ||||||||||||||||||||
| (In thousands) | |||||||||||||||||||||||
| Real estate mortgage: | |||||||||||||||||||||||
| Commercial | $ | $ | $ | $ | |||||||||||||||||||
| Residential | |||||||||||||||||||||||
| Other residential | |||||||||||||||||||||||
| Total real estate mortgage | |||||||||||||||||||||||
| Real estate construction and land: | |||||||||||||||||||||||
| Commercial | |||||||||||||||||||||||
| Residential | |||||||||||||||||||||||
| Total real estate construction and land | |||||||||||||||||||||||
| Commercial: | |||||||||||||||||||||||
| Asset-based | |||||||||||||||||||||||
| Venture capital | |||||||||||||||||||||||
| Other commercial | |||||||||||||||||||||||
| Total commercial | |||||||||||||||||||||||
| Consumer | |||||||||||||||||||||||
| Total | $ | $ | $ | $ | |||||||||||||||||||
| December 31, 2022 | |||||||||||||||||||||||
| Classified | Special Mention | Pass | Total | ||||||||||||||||||||
| (In thousands) | |||||||||||||||||||||||
| Real estate mortgage: | |||||||||||||||||||||||
| Commercial | $ | $ | $ | $ | |||||||||||||||||||
| Residential | |||||||||||||||||||||||
| Other residential | |||||||||||||||||||||||
| Total real estate mortgage | |||||||||||||||||||||||
| Real estate construction and land: | |||||||||||||||||||||||
| Commercial | |||||||||||||||||||||||
| Residential | |||||||||||||||||||||||
| Total real estate construction and land | |||||||||||||||||||||||
| Commercial: | |||||||||||||||||||||||
| Asset-based | |||||||||||||||||||||||
| Venture capital | |||||||||||||||||||||||
| Other commercial | |||||||||||||||||||||||
| Total commercial | |||||||||||||||||||||||
| Consumer | |||||||||||||||||||||||
| Total | $ | $ | $ | $ | |||||||||||||||||||
151
BANC OF CALIFORNIA, INC. AND SUBSIDIARIES
Notes to Consolidated Financial Statements
The following table presents our nonaccrual loans and leases by loan portfolio segment and class and by with and without an allowance recorded as of the date indicated and interest income recognized on nonaccrual loans and leases for the year indicated:
| At and For the Year Ended | |||||||||||||||||||||||
| December 31, 2023 | December 31, 2022 | ||||||||||||||||||||||
| Nonaccrual | Interest | Nonaccrual | Interest | ||||||||||||||||||||
| Recorded | Income | Recorded | Income | ||||||||||||||||||||
| Investment | Recognized | Investment | Recognized | ||||||||||||||||||||
| (In thousands) | |||||||||||||||||||||||
| With An Allowance Recorded: | |||||||||||||||||||||||
| Real estate mortgage: | |||||||||||||||||||||||
| Commercial | $ | $ | $ | $ | |||||||||||||||||||
| Residential | |||||||||||||||||||||||
| Other residential | |||||||||||||||||||||||
| Real estate construction and land: | |||||||||||||||||||||||
| Commercial | — | — | — | — | |||||||||||||||||||
| Residential | |||||||||||||||||||||||
| Commercial: | |||||||||||||||||||||||
| Asset based | |||||||||||||||||||||||
| Venture capital | |||||||||||||||||||||||
| Other commercial | |||||||||||||||||||||||
| Consumer | |||||||||||||||||||||||
| With No Related Allowance Recorded: | |||||||||||||||||||||||
| Real estate mortgage: | |||||||||||||||||||||||
| Commercial | $ | $ | $ | $ | |||||||||||||||||||
| Residential | |||||||||||||||||||||||
| Other residential | |||||||||||||||||||||||
| Real estate construction and land: | |||||||||||||||||||||||
| Commercial | |||||||||||||||||||||||
| Residential | |||||||||||||||||||||||
| Commercial: | |||||||||||||||||||||||
| Asset based | |||||||||||||||||||||||
| Venture capital | |||||||||||||||||||||||
| Other commercial | |||||||||||||||||||||||
| Consumer | |||||||||||||||||||||||
| Total Loans and Leases With and | |||||||||||||||||||||||
| Without an Allowance Recorded: | |||||||||||||||||||||||
| Real estate mortgage | $ | $ | $ | $ | |||||||||||||||||||
| Real estate construction and land | |||||||||||||||||||||||
| Commercial | |||||||||||||||||||||||
| Consumer | |||||||||||||||||||||||
| Total | $ | $ | $ | $ | |||||||||||||||||||
152
BANC OF CALIFORNIA, INC. AND SUBSIDIARIES
Notes to Consolidated Financial Statements
The following tables present our loans held for investment by loan portfolio segment and class, by credit quality indicator (internal risk ratings), and by year of origination (vintage year) as of the date indicated:
| Revolving | |||||||||||||||||||||||||||||||||||||||||||||||||||||
| Converted | |||||||||||||||||||||||||||||||||||||||||||||||||||||
Amortized Cost Basis (1) | Term Loans by Origination Year | Revolving | to Term | ||||||||||||||||||||||||||||||||||||||||||||||||||
| December 31, 2023 | 2023 | 2022 | 2021 | 2020 | 2019 | Prior | Loans | Loans | Total | ||||||||||||||||||||||||||||||||||||||||||||
| (In thousands) | |||||||||||||||||||||||||||||||||||||||||||||||||||||
| Real Estate Mortgage: | |||||||||||||||||||||||||||||||||||||||||||||||||||||
| Commercial | |||||||||||||||||||||||||||||||||||||||||||||||||||||
| Internal risk rating: | |||||||||||||||||||||||||||||||||||||||||||||||||||||
| 1-3 High pass | $ | $ | $ | $ | $ | $ | $ | $ | $ | ||||||||||||||||||||||||||||||||||||||||||||
| 4-6 Pass | |||||||||||||||||||||||||||||||||||||||||||||||||||||
| 7 Special mention | |||||||||||||||||||||||||||||||||||||||||||||||||||||
| 8-9 Classified | |||||||||||||||||||||||||||||||||||||||||||||||||||||
| Total | $ | $ | $ | $ | $ | $ | $ | $ | $ | ||||||||||||||||||||||||||||||||||||||||||||
| Current YTD period: | |||||||||||||||||||||||||||||||||||||||||||||||||||||
| Gross charge-offs | $ | $ | $ | $ | $ | $ | $ | $ | $ | ||||||||||||||||||||||||||||||||||||||||||||
| Real Estate Mortgage: | |||||||||||||||||||||||||||||||||||||||||||||||||||||
| Multi-family | |||||||||||||||||||||||||||||||||||||||||||||||||||||
| Internal risk rating: | |||||||||||||||||||||||||||||||||||||||||||||||||||||
| 1-3 High pass | $ | $ | $ | $ | $ | $ | $ | $ | $ | ||||||||||||||||||||||||||||||||||||||||||||
| 4-6 Pass | |||||||||||||||||||||||||||||||||||||||||||||||||||||
| 7 Special mention | |||||||||||||||||||||||||||||||||||||||||||||||||||||
| 8-9 Classified | |||||||||||||||||||||||||||||||||||||||||||||||||||||
| Total | $ | $ | $ | $ | $ | $ | $ | $ | $ | ||||||||||||||||||||||||||||||||||||||||||||
| Current YTD period: | |||||||||||||||||||||||||||||||||||||||||||||||||||||
| Gross charge-offs | $ | $ | $ | $ | $ | $ | $ | $ | $ | ||||||||||||||||||||||||||||||||||||||||||||
| Real Estate Mortgage: | |||||||||||||||||||||||||||||||||||||||||||||||||||||
| Other residential | |||||||||||||||||||||||||||||||||||||||||||||||||||||
| Internal risk rating: | |||||||||||||||||||||||||||||||||||||||||||||||||||||
| 1-3 High pass | $ | $ | $ | $ | $ | $ | $ | $ | $ | ||||||||||||||||||||||||||||||||||||||||||||
| 4-6 Pass | |||||||||||||||||||||||||||||||||||||||||||||||||||||
| 7 Special mention | |||||||||||||||||||||||||||||||||||||||||||||||||||||
| 8-9 Classified | |||||||||||||||||||||||||||||||||||||||||||||||||||||
| Total | $ | $ | $ | $ | $ | $ | $ | $ | $ | ||||||||||||||||||||||||||||||||||||||||||||
| Current YTD period: | |||||||||||||||||||||||||||||||||||||||||||||||||||||
| Gross charge-offs | $ | $ | $ | $ | $ | $ | $ | $ | $ | ||||||||||||||||||||||||||||||||||||||||||||
____________________
(1) Amounts with negative balances are loans with zero principal balances and deferred loan origination fees.
153
BANC OF CALIFORNIA, INC. AND SUBSIDIARIES
Notes to Consolidated Financial Statements
| Revolving | |||||||||||||||||||||||||||||||||||||||||||||||||||||
| Converted | |||||||||||||||||||||||||||||||||||||||||||||||||||||
Amortized Cost Basis (1) | Term Loans by Origination Year | Revolving | to Term | ||||||||||||||||||||||||||||||||||||||||||||||||||
| December 31, 2023 | 2023 | 2022 | 2021 | 2020 | 2019 | Prior | Loans | Loans | Total | ||||||||||||||||||||||||||||||||||||||||||||
| (In thousands) | |||||||||||||||||||||||||||||||||||||||||||||||||||||
| Real Estate Construction | |||||||||||||||||||||||||||||||||||||||||||||||||||||
| and Land: Commercial | |||||||||||||||||||||||||||||||||||||||||||||||||||||
| Internal risk rating: | |||||||||||||||||||||||||||||||||||||||||||||||||||||
| 1-3 High pass | $ | $ | $ | $ | $ | $ | $ | $ | $ | ||||||||||||||||||||||||||||||||||||||||||||
| 4-6 Pass | |||||||||||||||||||||||||||||||||||||||||||||||||||||
| 7 Special mention | |||||||||||||||||||||||||||||||||||||||||||||||||||||
| 8-9 Classified | |||||||||||||||||||||||||||||||||||||||||||||||||||||
| Total | $ | $ | $ | $ | $ | $ | $ | $ | $ | ||||||||||||||||||||||||||||||||||||||||||||
| Current YTD period: | |||||||||||||||||||||||||||||||||||||||||||||||||||||
| Gross charge-offs | $ | $ | $ | $ | $ | $ | $ | $ | $ | ||||||||||||||||||||||||||||||||||||||||||||
| Real Estate Construction | |||||||||||||||||||||||||||||||||||||||||||||||||||||
| and Land: Residential | |||||||||||||||||||||||||||||||||||||||||||||||||||||
| Internal risk rating: | |||||||||||||||||||||||||||||||||||||||||||||||||||||
| 1-3 High pass | $ | $ | $ | $ | $ | $ | $ | $ | $ | ||||||||||||||||||||||||||||||||||||||||||||
| 4-6 Pass | |||||||||||||||||||||||||||||||||||||||||||||||||||||
| 7 Special mention | |||||||||||||||||||||||||||||||||||||||||||||||||||||
| 8-9 Classified | |||||||||||||||||||||||||||||||||||||||||||||||||||||
| Total | $ | $ | $ | $ | $ | $ | $ | $ | $ | ||||||||||||||||||||||||||||||||||||||||||||
| Current YTD period: | |||||||||||||||||||||||||||||||||||||||||||||||||||||
| Gross charge-offs | $ | $ | $ | $ | $ | $ | $ | $ | $ | ||||||||||||||||||||||||||||||||||||||||||||
| Commercial: Asset-Based | |||||||||||||||||||||||||||||||||||||||||||||||||||||
| Internal risk rating: | |||||||||||||||||||||||||||||||||||||||||||||||||||||
| 1-3 High pass | $ | $ | $ | $ | $ | $ | $ | $ | $ | ||||||||||||||||||||||||||||||||||||||||||||
| 4-6 Pass | |||||||||||||||||||||||||||||||||||||||||||||||||||||
| 7 Special mention | |||||||||||||||||||||||||||||||||||||||||||||||||||||
| 8-9 Classified | |||||||||||||||||||||||||||||||||||||||||||||||||||||
| Total | $ | $ | $ | $ | $ | $ | $ | $ | $ | ||||||||||||||||||||||||||||||||||||||||||||
| Current YTD period: | |||||||||||||||||||||||||||||||||||||||||||||||||||||
| Gross charge-offs | $ | $ | $ | $ | $ | $ | $ | $ | $ | ||||||||||||||||||||||||||||||||||||||||||||
____________________
(1) Amounts with negative balances are loans with zero principal balances and deferred loan origination fees.
154
BANC OF CALIFORNIA, INC. AND SUBSIDIARIES
Notes to Consolidated Financial Statements
| Revolving | |||||||||||||||||||||||||||||||||||||||||||||||||||||
| Converted | |||||||||||||||||||||||||||||||||||||||||||||||||||||
Amortized Cost Basis (1) | Term Loans by Origination Year | Revolving | to Term | ||||||||||||||||||||||||||||||||||||||||||||||||||
| December 31, 2023 | 2023 | 2022 | 2021 | 2020 | 2019 | Prior | Loans | Loans | Total | ||||||||||||||||||||||||||||||||||||||||||||
| (In thousands) | |||||||||||||||||||||||||||||||||||||||||||||||||||||
| Commercial: Venture | |||||||||||||||||||||||||||||||||||||||||||||||||||||
| Capital | |||||||||||||||||||||||||||||||||||||||||||||||||||||
| Internal risk rating: | |||||||||||||||||||||||||||||||||||||||||||||||||||||
| 1-3 High pass | $ | ( | $ | ( | $ | $ | $ | $ | ( | $ | $ | ( | $ | ||||||||||||||||||||||||||||||||||||||||
| 4-6 Pass | |||||||||||||||||||||||||||||||||||||||||||||||||||||
| 7 Special mention | |||||||||||||||||||||||||||||||||||||||||||||||||||||
| 8-9 Classified | ( | ||||||||||||||||||||||||||||||||||||||||||||||||||||
| Total | $ | $ | $ | $ | $ | $ | $ | $ | $ | ||||||||||||||||||||||||||||||||||||||||||||
| Current YTD period: | |||||||||||||||||||||||||||||||||||||||||||||||||||||
| Gross charge-offs | $ | $ | $ | $ | $ | $ | $ | $ | $ | ||||||||||||||||||||||||||||||||||||||||||||
| Commercial: Other | |||||||||||||||||||||||||||||||||||||||||||||||||||||
| Commercial | |||||||||||||||||||||||||||||||||||||||||||||||||||||
| Internal risk rating: | |||||||||||||||||||||||||||||||||||||||||||||||||||||
| 1-3 High pass | $ | $ | $ | $ | $ | $ | $ | $ | $ | ||||||||||||||||||||||||||||||||||||||||||||
| 4-6 Pass | |||||||||||||||||||||||||||||||||||||||||||||||||||||
| 7 Special mention | |||||||||||||||||||||||||||||||||||||||||||||||||||||
| 8-9 Classified | |||||||||||||||||||||||||||||||||||||||||||||||||||||
| Total | $ | $ | $ | $ | $ | $ | $ | $ | $ | ||||||||||||||||||||||||||||||||||||||||||||
| Current YTD period: | |||||||||||||||||||||||||||||||||||||||||||||||||||||
| Gross charge-offs | $ | $ | $ | $ | $ | $ | $ | $ | $ | ||||||||||||||||||||||||||||||||||||||||||||
| Consumer | |||||||||||||||||||||||||||||||||||||||||||||||||||||
| Internal risk rating: | |||||||||||||||||||||||||||||||||||||||||||||||||||||
| 1-3 High pass | $ | $ | $ | $ | $ | $ | $ | $ | $ | ||||||||||||||||||||||||||||||||||||||||||||
| 4-6 Pass | |||||||||||||||||||||||||||||||||||||||||||||||||||||
| 7 Special mention | |||||||||||||||||||||||||||||||||||||||||||||||||||||
| 8-9 Classified | |||||||||||||||||||||||||||||||||||||||||||||||||||||
| Total | $ | $ | $ | $ | $ | $ | $ | $ | $ | ||||||||||||||||||||||||||||||||||||||||||||
| Current YTD period: | |||||||||||||||||||||||||||||||||||||||||||||||||||||
| Gross charge-offs | $ | $ | $ | $ | $ | $ | $ | $ | $ | ||||||||||||||||||||||||||||||||||||||||||||
| Total Loans and Leases | |||||||||||||||||||||||||||||||||||||||||||||||||||||
| Internal risk rating: | |||||||||||||||||||||||||||||||||||||||||||||||||||||
| 1-3 High pass | $ | $ | $ | $ | $ | $ | $ | $ | ( | $ | |||||||||||||||||||||||||||||||||||||||||||
| 4-6 Pass | |||||||||||||||||||||||||||||||||||||||||||||||||||||
| 7 Special mention | |||||||||||||||||||||||||||||||||||||||||||||||||||||
| 8-9 Classified | |||||||||||||||||||||||||||||||||||||||||||||||||||||
| Total | $ | $ | $ | $ | $ | $ | $ | $ | $ | ||||||||||||||||||||||||||||||||||||||||||||
| Current YTD period: | |||||||||||||||||||||||||||||||||||||||||||||||||||||
| Gross charge-offs | $ | $ | $ | $ | $ | $ | $ | $ | $ | ||||||||||||||||||||||||||||||||||||||||||||
____________________
(1) Amounts with negative balances are loans with zero principal balances and deferred loan origination fees.
155
BANC OF CALIFORNIA, INC. AND SUBSIDIARIES
Notes to Consolidated Financial Statements
| Revolving | |||||||||||||||||||||||||||||||||||||||||||||||||||||
| Converted | |||||||||||||||||||||||||||||||||||||||||||||||||||||
Amortized Cost Basis (1) | Term Loans by Origination Year | Revolving | to Term | ||||||||||||||||||||||||||||||||||||||||||||||||||
| December 31, 2022 | 2022 | 2021 | 2020 | 2019 | 2018 | Prior | Loans | Loans | Total | ||||||||||||||||||||||||||||||||||||||||||||
| (In thousands) | |||||||||||||||||||||||||||||||||||||||||||||||||||||
| Real Estate Mortgage: | |||||||||||||||||||||||||||||||||||||||||||||||||||||
| Commercial | |||||||||||||||||||||||||||||||||||||||||||||||||||||
| Internal risk rating: | |||||||||||||||||||||||||||||||||||||||||||||||||||||
| 1-3 High pass | $ | $ | $ | $ | $ | $ | $ | $ | $ | ||||||||||||||||||||||||||||||||||||||||||||
| 4-6 Pass | |||||||||||||||||||||||||||||||||||||||||||||||||||||
| 7 Special mention | |||||||||||||||||||||||||||||||||||||||||||||||||||||
| 8-9 Classified | |||||||||||||||||||||||||||||||||||||||||||||||||||||
| Total | $ | $ | $ | $ | $ | $ | $ | $ | $ | ||||||||||||||||||||||||||||||||||||||||||||
| Current YTD period: | |||||||||||||||||||||||||||||||||||||||||||||||||||||
| Gross charge-offs | $ | $ | $ | $ | $ | $ | $ | $ | $ | ||||||||||||||||||||||||||||||||||||||||||||
| Real Estate Mortgage: | |||||||||||||||||||||||||||||||||||||||||||||||||||||
| Multi-family | |||||||||||||||||||||||||||||||||||||||||||||||||||||
| Internal risk rating: | |||||||||||||||||||||||||||||||||||||||||||||||||||||
| 1-3 High pass | $ | $ | $ | $ | $ | $ | $ | $ | $ | ||||||||||||||||||||||||||||||||||||||||||||
| 4-6 Pass | |||||||||||||||||||||||||||||||||||||||||||||||||||||
| 7 Special mention | |||||||||||||||||||||||||||||||||||||||||||||||||||||
| 8-9 Classified | |||||||||||||||||||||||||||||||||||||||||||||||||||||
| Total | $ | $ | $ | $ | $ | $ | $ | $ | $ | ||||||||||||||||||||||||||||||||||||||||||||
| Current YTD period: | |||||||||||||||||||||||||||||||||||||||||||||||||||||
| Gross charge-offs | $ | $ | $ | $ | $ | $ | $ | $ | $ | ||||||||||||||||||||||||||||||||||||||||||||
| Real Estate Mortgage: | |||||||||||||||||||||||||||||||||||||||||||||||||||||
| Other residential | |||||||||||||||||||||||||||||||||||||||||||||||||||||
| Internal risk rating: | |||||||||||||||||||||||||||||||||||||||||||||||||||||
| 1-3 High pass | $ | $ | $ | $ | $ | $ | $ | $ | $ | ||||||||||||||||||||||||||||||||||||||||||||
| 4-6 Pass | |||||||||||||||||||||||||||||||||||||||||||||||||||||
| 7 Special mention | |||||||||||||||||||||||||||||||||||||||||||||||||||||
| 8-9 Classified | |||||||||||||||||||||||||||||||||||||||||||||||||||||
| Total | $ | $ | $ | $ | $ | $ | $ | $ | $ | ||||||||||||||||||||||||||||||||||||||||||||
| Current YTD period: | |||||||||||||||||||||||||||||||||||||||||||||||||||||
| Gross charge-offs | $ | $ | $ | $ | $ | $ | $ | $ | $ | ||||||||||||||||||||||||||||||||||||||||||||
____________________
(1) Amounts with negative balances are loans with zero principal balances and deferred loan origination fees.
156
BANC OF CALIFORNIA, INC. AND SUBSIDIARIES
Notes to Consolidated Financial Statements
| Revolving | |||||||||||||||||||||||||||||||||||||||||||||||||||||
| Converted | |||||||||||||||||||||||||||||||||||||||||||||||||||||
Amortized Cost Basis (1) | Term Loans by Origination Year | Revolving | to Term | ||||||||||||||||||||||||||||||||||||||||||||||||||
| December 31, 2022 | 2022 | 2021 | 2020 | 2019 | 2018 | Prior | Loans | Loans | Total | ||||||||||||||||||||||||||||||||||||||||||||
| (In thousands) | |||||||||||||||||||||||||||||||||||||||||||||||||||||
| Real Estate Construction | |||||||||||||||||||||||||||||||||||||||||||||||||||||
| and Land: Commercial | |||||||||||||||||||||||||||||||||||||||||||||||||||||
| Internal risk rating: | |||||||||||||||||||||||||||||||||||||||||||||||||||||
| 1-3 High pass | $ | $ | $ | $ | $ | $ | $ | $ | $ | ||||||||||||||||||||||||||||||||||||||||||||
| 4-6 Pass | |||||||||||||||||||||||||||||||||||||||||||||||||||||
| 7 Special mention | |||||||||||||||||||||||||||||||||||||||||||||||||||||
| 8-9 Classified | |||||||||||||||||||||||||||||||||||||||||||||||||||||
| Total | $ | $ | $ | $ | $ | $ | $ | $ | $ | ||||||||||||||||||||||||||||||||||||||||||||
| Current YTD period: | |||||||||||||||||||||||||||||||||||||||||||||||||||||
| Gross charge-offs | $ | $ | $ | $ | $ | $ | $ | $ | $ | ||||||||||||||||||||||||||||||||||||||||||||
| Real Estate Construction | |||||||||||||||||||||||||||||||||||||||||||||||||||||
| and Land: Residential | |||||||||||||||||||||||||||||||||||||||||||||||||||||
| Internal risk rating: | |||||||||||||||||||||||||||||||||||||||||||||||||||||
| 1-3 High pass | $ | $ | $ | $ | $ | $ | $ | $ | $ | ||||||||||||||||||||||||||||||||||||||||||||
| 4-6 Pass | |||||||||||||||||||||||||||||||||||||||||||||||||||||
| 7 Special mention | |||||||||||||||||||||||||||||||||||||||||||||||||||||
| 8-9 Classified | |||||||||||||||||||||||||||||||||||||||||||||||||||||
| Total | $ | $ | $ | $ | $ | $ | $ | $ | $ | ||||||||||||||||||||||||||||||||||||||||||||
| Current YTD period: | |||||||||||||||||||||||||||||||||||||||||||||||||||||
| Gross charge-offs | $ | $ | $ | $ | $ | $ | $ | $ | $ | ||||||||||||||||||||||||||||||||||||||||||||
| Commercial: Asset-Based | |||||||||||||||||||||||||||||||||||||||||||||||||||||
| Internal risk rating: | |||||||||||||||||||||||||||||||||||||||||||||||||||||
| 1-3 High pass | $ | $ | $ | $ | $ | $ | $ | $ | $ | ||||||||||||||||||||||||||||||||||||||||||||
| 4-6 Pass | |||||||||||||||||||||||||||||||||||||||||||||||||||||
| 7 Special mention | |||||||||||||||||||||||||||||||||||||||||||||||||||||
| 8-9 Classified | |||||||||||||||||||||||||||||||||||||||||||||||||||||
| Total | $ | $ | $ | $ | $ | $ | $ | $ | $ | ||||||||||||||||||||||||||||||||||||||||||||
| Current YTD period: | |||||||||||||||||||||||||||||||||||||||||||||||||||||
| Gross charge-offs | $ | $ | $ | $ | $ | $ | $ | $ | $ | ||||||||||||||||||||||||||||||||||||||||||||
____________________
(1) Amounts with negative balances are loans with zero principal balances and deferred loan origination fees.
157
BANC OF CALIFORNIA, INC. AND SUBSIDIARIES
Notes to Consolidated Financial Statements
| Revolving | |||||||||||||||||||||||||||||||||||||||||||||||||||||
| Converted | |||||||||||||||||||||||||||||||||||||||||||||||||||||
Amortized Cost Basis (1) | Term Loans by Origination Year | Revolving | to Term | ||||||||||||||||||||||||||||||||||||||||||||||||||
| December 31, 2022 | 2022 | 2021 | 2020 | 2019 | 2018 | Prior | Loans | Loans | Total | ||||||||||||||||||||||||||||||||||||||||||||
| (In thousands) | |||||||||||||||||||||||||||||||||||||||||||||||||||||
| Commercial: Venture | |||||||||||||||||||||||||||||||||||||||||||||||||||||
| Capital | |||||||||||||||||||||||||||||||||||||||||||||||||||||
| Internal risk rating: | |||||||||||||||||||||||||||||||||||||||||||||||||||||
| 1-3 High pass | $ | ( | $ | $ | $ | $ | $ | $ | $ | $ | |||||||||||||||||||||||||||||||||||||||||||
| 4-6 Pass | |||||||||||||||||||||||||||||||||||||||||||||||||||||
| 7 Special mention | |||||||||||||||||||||||||||||||||||||||||||||||||||||
| 8-9 Classified | |||||||||||||||||||||||||||||||||||||||||||||||||||||
| Total | $ | $ | $ | $ | $ | $ | $ | $ | $ | ||||||||||||||||||||||||||||||||||||||||||||
| Current YTD period: | |||||||||||||||||||||||||||||||||||||||||||||||||||||
| Gross charge-offs | $ | $ | $ | $ | $ | $ | $ | $ | $ | ||||||||||||||||||||||||||||||||||||||||||||
| Commercial: Other | |||||||||||||||||||||||||||||||||||||||||||||||||||||
| Commercial | |||||||||||||||||||||||||||||||||||||||||||||||||||||
| Internal risk rating: | |||||||||||||||||||||||||||||||||||||||||||||||||||||
| 1-3 High pass | $ | $ | $ | $ | $ | $ | $ | $ | $ | ||||||||||||||||||||||||||||||||||||||||||||
| 4-6 Pass | |||||||||||||||||||||||||||||||||||||||||||||||||||||
| 7 Special mention | |||||||||||||||||||||||||||||||||||||||||||||||||||||
| 8-9 Classified | ( | ||||||||||||||||||||||||||||||||||||||||||||||||||||
| Total | $ | $ | $ | $ | $ | $ | $ | $ | $ | ||||||||||||||||||||||||||||||||||||||||||||
| Current YTD period: | |||||||||||||||||||||||||||||||||||||||||||||||||||||
| Gross charge-offs | $ | $ | $ | $ | $ | $ | $ | $ | $ | ||||||||||||||||||||||||||||||||||||||||||||
| Consumer | |||||||||||||||||||||||||||||||||||||||||||||||||||||
| Internal risk rating: | |||||||||||||||||||||||||||||||||||||||||||||||||||||
| 1-3 High pass | $ | $ | $ | $ | $ | $ | $ | $ | $ | ||||||||||||||||||||||||||||||||||||||||||||
| 4-6 Pass | |||||||||||||||||||||||||||||||||||||||||||||||||||||
| 7 Special mention | |||||||||||||||||||||||||||||||||||||||||||||||||||||
| 8-9 Classified | |||||||||||||||||||||||||||||||||||||||||||||||||||||
| Total | $ | $ | $ | $ | $ | $ | $ | $ | $ | ||||||||||||||||||||||||||||||||||||||||||||
| Current YTD period: | |||||||||||||||||||||||||||||||||||||||||||||||||||||
| Gross charge-offs | $ | $ | $ | $ | $ | $ | $ | $ | $ | ||||||||||||||||||||||||||||||||||||||||||||
| Total Loans and Leases | |||||||||||||||||||||||||||||||||||||||||||||||||||||
| Internal risk rating: | |||||||||||||||||||||||||||||||||||||||||||||||||||||
| 1-3 High pass | $ | $ | $ | $ | $ | $ | $ | $ | $ | ||||||||||||||||||||||||||||||||||||||||||||
| 4-6 Pass | |||||||||||||||||||||||||||||||||||||||||||||||||||||
| 7 Special mention | |||||||||||||||||||||||||||||||||||||||||||||||||||||
| 8-9 Classified | |||||||||||||||||||||||||||||||||||||||||||||||||||||
| Total | $ | $ | $ | $ | $ | $ | $ | $ | $ | ||||||||||||||||||||||||||||||||||||||||||||
| Current YTD period: | |||||||||||||||||||||||||||||||||||||||||||||||||||||
| Gross charge-offs | $ | $ | $ | $ | $ | $ | $ | $ | $ | ||||||||||||||||||||||||||||||||||||||||||||
______________________
(1) Amounts with negative balances are loans with zero principal balances and deferred loan origination fees.
158
BANC OF CALIFORNIA, INC. AND SUBSIDIARIES
Notes to Consolidated Financial Statements
The following table presents our loan modifications made to borrowers experiencing financial difficulty by type of modification for the period indicated with balances as of the date indicated:
| Year Ended December 31, 2023 | |||||||||||||||||||||||||||||||||||||||||||||||||||||
| Loan Modifications | |||||||||||||||||||||||||||||||||||||||||||||||||||||
| Balances (Amortized Cost Basis) at | |||||||||||||||||||||||||||||||||||||||||||||||||||||
| December 31, 2023 | |||||||||||||||||||||||||||||||||||||||||||||||||||||
| Combination - Term | Combination - Term | ||||||||||||||||||||||||||||||||||||||||||||||||||||
| Extension and | Extension and | ||||||||||||||||||||||||||||||||||||||||||||||||||||
| Interest Rate | Payment | Total Loan | |||||||||||||||||||||||||||||||||||||||||||||||||||
| Term Extension | Payment Delay | Reduction | Delay | Modifications | |||||||||||||||||||||||||||||||||||||||||||||||||
| % of | % of | % of | % of | % of | |||||||||||||||||||||||||||||||||||||||||||||||||
| Loan | Loan | Loan | Loan | Loan | |||||||||||||||||||||||||||||||||||||||||||||||||
| Portfolio | Portfolio | Portfolio | Portfolio | Portfolio | |||||||||||||||||||||||||||||||||||||||||||||||||
| Balance | Class | Balance | Class | Balance | Class | Balance | Class | Balance | Class | ||||||||||||||||||||||||||||||||||||||||||||
| (Dollars in thousands) | |||||||||||||||||||||||||||||||||||||||||||||||||||||
| Real estate | |||||||||||||||||||||||||||||||||||||||||||||||||||||
| mortgage: | |||||||||||||||||||||||||||||||||||||||||||||||||||||
| Other residential | $ | % | $ | — | — | % | $ | — | — | % | $ | — | $ | — | $ | % | |||||||||||||||||||||||||||||||||||||
| Commercial: | |||||||||||||||||||||||||||||||||||||||||||||||||||||
| Venture capital | — | — | % | — | — | % | — | — | % | % | % | ||||||||||||||||||||||||||||||||||||||||||
| Other | |||||||||||||||||||||||||||||||||||||||||||||||||||||
| commercial | % | % | % | — | — | % | % | ||||||||||||||||||||||||||||||||||||||||||||||
| Consumer | % | — | — | % | % | — | — | % | % | ||||||||||||||||||||||||||||||||||||||||||||
| Total | $ | $ | $ | $ | $ | ||||||||||||||||||||||||||||||||||||||||||||||||
The following tables present the financial effect of our loan modifications made to borrowers experiencing financial difficulty by type of modification for the period indicated:
| Year Ended December 31, 2023 | ||||||||||||||||||||
| Term Extension - Financial Effect | ||||||||||||||||||||
| Real estate mortgage: | ||||||||||||||||||||
| Other residential | Extended maturity by a weighted average | |||||||||||||||||||
| Commercial: | ||||||||||||||||||||
| Other commercial | Extended maturity by a weighted average | |||||||||||||||||||
| Consumer | Extended maturity by a weighted average | |||||||||||||||||||
| Year Ended December 31, 2023 | ||||||||||||||||||||
| Payment Delay - Financial Effect | ||||||||||||||||||||
| Commercial: | ||||||||||||||||||||
| Other commercial | Provided | |||||||||||||||||||
159
BANC OF CALIFORNIA, INC. AND SUBSIDIARIES
Notes to Consolidated Financial Statements
| Year Ended December 31, 2023 | ||||||||||||||||||||
| Combination - Term Extension and Interest Rate Reduction | ||||||||||||||||||||
| Commercial: | ||||||||||||||||||||
| Other commercial | Extended maturity by a weighted average | |||||||||||||||||||
| Consumer | Extended maturity by a weighted average | |||||||||||||||||||
| Year Ended December 31, 2023 | ||||||||||||||||||||
| Combination - Term Extension and Payment Delay | ||||||||||||||||||||
| Commercial: | ||||||||||||||||||||
| Venture capital | Extended maturity and granted payment deferrals for a weighted average of | |||||||||||||||||||
The following table presents the payment status of our loan modifications made during the period indicated with balances as of the date indicated:
| Year Ended December 31, 2023 | |||||||||||||||||||||||
| Loan Modifications | |||||||||||||||||||||||
| Payment Status (Amortized Cost Basis) at | |||||||||||||||||||||||
| December 31, 2023 | |||||||||||||||||||||||
| 30-89 Days | 90 or More Days | ||||||||||||||||||||||
| Current | Past Due | Past Due | Total | ||||||||||||||||||||
| (In thousands) | |||||||||||||||||||||||
| Real estate mortgage: | |||||||||||||||||||||||
| Commercial | $ | $ | $ | $ | |||||||||||||||||||
| Other residential | |||||||||||||||||||||||
| Commercial: | |||||||||||||||||||||||
| Venture capital | |||||||||||||||||||||||
| Other commercial | |||||||||||||||||||||||
| Consumer | |||||||||||||||||||||||
| Total | $ | $ | $ | $ | |||||||||||||||||||
The following table presents loan modifications that subsequently defaulted by type of modification for the period indicated with balances as of the date indicated:
| Year Ended December 31, 2023 | |||||||||||
| Loan Modifications That Subsequently Defaulted | |||||||||||
| Amortized Cost Basis at | |||||||||||
| December 31, 2023 | |||||||||||
| Term | |||||||||||
| Extension | Total | ||||||||||
| (In thousands) | |||||||||||
| Real estate mortgage: | |||||||||||
| Other residential | $ | $ | |||||||||
160
BANC OF CALIFORNIA, INC. AND SUBSIDIARIES
Notes to Consolidated Financial Statements
TDRs are a result of rate reductions, term extensions, fee concessions, transfers to foreclosed assets, discounted loan payoffs, and debt forgiveness, or a combination thereof. Between March 2020 and December 2021, the Company granted various commercial and consumer loan modifications to provide borrowers relief from the economic impacts of COVID-19. In accordance with the CARES Act, the Company elected to not apply TDR classification to COVID-19 related loan modifications that met all of the requisite criteria as stipulated in the CARES Act. The following table presents our troubled debt restructurings of loans held for investment by loan portfolio segment and class for the years indicated:
| Troubled Debt Restructurings | |||||||||||||||||||||||||||||
| Troubled Debt Restructurings | That Subsequently Defaulted(1) | ||||||||||||||||||||||||||||
| Pre-Modification | Post-Modification | ||||||||||||||||||||||||||||
| Number | Outstanding | Outstanding | Number | ||||||||||||||||||||||||||
| of | Recorded | Recorded | of | Recorded | |||||||||||||||||||||||||
| Loans | Investment | Investment | Loans | Investment(1) | |||||||||||||||||||||||||
| (Dollars In thousands) | |||||||||||||||||||||||||||||
| Year Ended December 31, 2022 | |||||||||||||||||||||||||||||
| Real estate mortgage: | |||||||||||||||||||||||||||||
| Commercial | $ | $ | $ | ||||||||||||||||||||||||||
| Other residential | |||||||||||||||||||||||||||||
| Real estate construction and land: | |||||||||||||||||||||||||||||
| Residential | |||||||||||||||||||||||||||||
| Commercial: | |||||||||||||||||||||||||||||
| Venture capital | |||||||||||||||||||||||||||||
| Other commercial | |||||||||||||||||||||||||||||
| Consumer | |||||||||||||||||||||||||||||
| Total | $ | $ | $ | ||||||||||||||||||||||||||
| Year Ended December 31, 2021 | |||||||||||||||||||||||||||||
| Real estate mortgage: | |||||||||||||||||||||||||||||
| Commercial | $ | $ | $ | ||||||||||||||||||||||||||
| Multi-family | |||||||||||||||||||||||||||||
| Other residential | |||||||||||||||||||||||||||||
| Real estate construction and land: | |||||||||||||||||||||||||||||
| Residential | |||||||||||||||||||||||||||||
| Commercial: | |||||||||||||||||||||||||||||
| Asset-based | |||||||||||||||||||||||||||||
| Venture capital | |||||||||||||||||||||||||||||
| Other commercial | |||||||||||||||||||||||||||||
| Consumer | |||||||||||||||||||||||||||||
| Total | $ | $ | $ | ||||||||||||||||||||||||||
_________________________
At December 31, 2022 and 2021, we had unfunded commitments related to TDRs of $897,000 and $2.0 million.
161
BANC OF CALIFORNIA, INC. AND SUBSIDIARIES
Notes to Consolidated Financial Statements
Leases Receivable
We provide equipment financing to our customers primarily with operating and direct financing leases. For direct financing leases, lease receivables are recorded on the balance sheet but the leased equipment is not, although we generally retain legal title to the leased equipment until the end of each lease. Direct financing leases are stated at the net amount of minimum lease payments receivable, plus any unguaranteed residual value, less the amount of unearned income and net acquisition discount at the reporting date. Direct lease origination costs are amortized using the effective interest method over the life of the leases. Direct financing leases are subject to our accounting for allowance for loan and lease losses. See Note 9. Leases for information regarding operating leases where we are the lessor.
| Year Ended December 31, | |||||||||||||||||
| 2023 | 2022 | 2021 | |||||||||||||||
| (In thousands) | |||||||||||||||||
| Component of leases receivable income: | |||||||||||||||||
| Interest income on net investments in leases | $ | $ | $ | ||||||||||||||
The following table presents the components of leases receivable as of the date indicated:
| December 31, | |||||||||||
| 2023 | 2022 | ||||||||||
| (In thousands) | |||||||||||
| Net Investment in Direct Financing Leases: | |||||||||||
| Lease payments receivable | $ | $ | |||||||||
| Unguaranteed residual assets | |||||||||||
| Deferred costs and other | |||||||||||
| Aggregate net investment in leases | $ | $ | |||||||||
The following table presents maturities of leases receivable as of the date indicated:
| December 31, 2023 | |||||
| (In thousands) | |||||
| Year Ending December 31, | |||||
| 2024 | $ | ||||
| 2025 | |||||
| 2026 | |||||
| 2027 | |||||
| 2028 | |||||
| Thereafter | |||||
| Total undiscounted cash flows | |||||
| Less: Unearned income | ( | ||||
| Present value of lease payments | $ | ||||
162
BANC OF CALIFORNIA, INC. AND SUBSIDIARIES
Notes to Consolidated Financial Statements
Allowance for Loan and Lease Losses
The following tables present a summary of the activity in the allowance for loan and lease losses on loans and leases held for investment by loan portfolio segment for the years indicated:
| Year Ended December 31, 2023 | |||||||||||||||||||||||||||||
| Real Estate | |||||||||||||||||||||||||||||
| Real Estate | Construction | ||||||||||||||||||||||||||||
| Mortgage | and Land | Commercial | Consumer | Total | |||||||||||||||||||||||||
| (In thousands) | |||||||||||||||||||||||||||||
| Allowance for Loan and Lease Losses: | |||||||||||||||||||||||||||||
| Balance, beginning of year | $ | $ | $ | $ | $ | ||||||||||||||||||||||||
| Initial ALLL on acquired PCD loans | |||||||||||||||||||||||||||||
| Charge-offs | ( | ( | ( | ( | |||||||||||||||||||||||||
| Recoveries | |||||||||||||||||||||||||||||
| Net (charge-offs) recoveries | ( | ( | ( | ( | |||||||||||||||||||||||||
| Provision | ( | ( | |||||||||||||||||||||||||||
| Balance, end of year | $ | $ | $ | $ | $ | ||||||||||||||||||||||||
| Ending Allowance by | |||||||||||||||||||||||||||||
| Evaluation Methodology: | |||||||||||||||||||||||||||||
| Individually evaluated | $ | $ | $ | $ | $ | ||||||||||||||||||||||||
| Collectively evaluated | $ | $ | $ | $ | $ | ||||||||||||||||||||||||
Ending Loans and Leases by | |||||||||||||||||||||||||||||
Evaluation Methodology: | |||||||||||||||||||||||||||||
| Individually evaluated | $ | $ | $ | $ | $ | ||||||||||||||||||||||||
| Collectively evaluated | |||||||||||||||||||||||||||||
| Ending balance | $ | $ | $ | $ | $ | ||||||||||||||||||||||||
163
BANC OF CALIFORNIA, INC. AND SUBSIDIARIES
Notes to Consolidated Financial Statements
| Year Ended December 31, 2022 | |||||||||||||||||||||||||||||
| Real Estate | |||||||||||||||||||||||||||||
| Real Estate | Construction | ||||||||||||||||||||||||||||
| Mortgage | and Land | Commercial | Consumer | Total | |||||||||||||||||||||||||
| (In thousands) | |||||||||||||||||||||||||||||
| Allowance for Loan and Lease Losses: | |||||||||||||||||||||||||||||
| Balance, beginning of year | $ | $ | $ | $ | $ | ||||||||||||||||||||||||
| Charge-offs | ( | ( | ( | ( | |||||||||||||||||||||||||
| Recoveries | |||||||||||||||||||||||||||||
| Net recoveries (charge-offs) | ( | ( | ( | ||||||||||||||||||||||||||
| Provision | ( | ||||||||||||||||||||||||||||
| Balance, end of year | $ | $ | $ | $ | $ | ||||||||||||||||||||||||
| Ending Allowance by | |||||||||||||||||||||||||||||
| Evaluation Methodology: | |||||||||||||||||||||||||||||
| Individually evaluated | $ | $ | $ | $ | $ | ||||||||||||||||||||||||
| Collectively evaluated | $ | $ | $ | $ | $ | ||||||||||||||||||||||||
Ending Loans and Leases by | |||||||||||||||||||||||||||||
Evaluation Methodology: | |||||||||||||||||||||||||||||
| Individually evaluated | $ | $ | $ | $ | $ | ||||||||||||||||||||||||
| Collectively evaluated | |||||||||||||||||||||||||||||
| Ending balance | $ | $ | $ | $ | $ | ||||||||||||||||||||||||
The allowance for loan and lease losses increased by $81.0 million in 2023 due primarily to a provision for loan and lease losses of $113.5 million, which included a $22.2 million initial provision related to non-PCD loan balances acquired in the Merger, the addition of $25.6 million related to legacy Banc of California PCD loans and a less favorable economic forecast, offset partially by $58.2 million of net charge-offs. The provision for loan and lease losses in 2022 was driven by growth in loans and leases and a less favorable economic forecast offset partially by a decrease in qualitative reserves. For additional information regarding the calculation of the allowance for loan and lease losses using the CECL methodology, including discussion of forecasts used to estimate the allowance, please see Note 1(j). Nature of Operations and Summary of Significant Accounting Policies - Allowance for Credit Losses on Loans and Leases Held for Investment.
A loan is considered collateral-dependent, and is individually evaluated for reserve purposes, when the borrower is experiencing financial difficulty and repayment is expected to be provided substantially through the operation or sale of the collateral. The following table summarizes collateral-dependent loans held for investment by collateral type as of the following date:
| December 31, | |||||||||||||||||||||||||||||||||||
| 2023 | 2022 | ||||||||||||||||||||||||||||||||||
| Real | Business | Real | Business | ||||||||||||||||||||||||||||||||
| Property | Assets | Total | Property | Assets | Total | ||||||||||||||||||||||||||||||
| (In thousands) | |||||||||||||||||||||||||||||||||||
| Real estate mortgage | $ | $ | $ | $ | $ | $ | |||||||||||||||||||||||||||||
| Real estate construction and land | |||||||||||||||||||||||||||||||||||
| Commercial | |||||||||||||||||||||||||||||||||||
| Total | $ | $ | $ | $ | $ | $ | |||||||||||||||||||||||||||||
164
BANC OF CALIFORNIA, INC. AND SUBSIDIARIES
Notes to Consolidated Financial Statements
Allowance for Credit Losses
The allowance for credit losses is the combination of the allowance for loan and lease losses and the reserve for unfunded loan commitments. The reserve for unfunded loan commitments is included within "Accrued interest payable and other liabilities" on the consolidated balance sheets.
The following tables present a summary of the activity in the allowance for loan and lease losses and reserve for unfunded loan commitments for the years indicated:
| Year Ended December 31, 2023 | |||||||||||||||||
| Allowance for | Reserve for | Total | |||||||||||||||
| Loan and | Unfunded Loan | Allowance for | |||||||||||||||
| Lease Losses | Commitments | Credit Losses | |||||||||||||||
| (In thousands) | |||||||||||||||||
| Balance, beginning of year | $ | $ | $ | ||||||||||||||
| Initial allowance on acquired PCD loans | — | ||||||||||||||||
| Charge-offs | ( | ( | |||||||||||||||
| Recoveries | |||||||||||||||||
| Net charge-offs | ( | ( | |||||||||||||||
| Provision | ( | ||||||||||||||||
| Balance, end of year | $ | $ | $ | ||||||||||||||
| Year Ended December 31, 2022 | |||||||||||||||||
| Allowance for | Reserve for | Total | |||||||||||||||
| Loan and | Unfunded Loan | Allowance for | |||||||||||||||
| Lease Losses | Commitments | Credit Losses | |||||||||||||||
| (In thousands) | |||||||||||||||||
| Balance, beginning of year | $ | $ | $ | ||||||||||||||
| Charge-offs | ( | ( | |||||||||||||||
| Recoveries | |||||||||||||||||
| Net recoveries | ( | ( | |||||||||||||||
| Provision | |||||||||||||||||
| Balance, end of year | $ | $ | $ | ||||||||||||||
165
BANC OF CALIFORNIA, INC. AND SUBSIDIARIES
Notes to Consolidated Financial Statements
NOTE 6. PREMISES AND EQUIPMENT, NET
The following table presents the components of premises and equipment as of the dates indicated:
| December 31, | |||||||||||
| 2023 | 2022 | ||||||||||
| (In thousands) | |||||||||||
| Land | $ | $ | |||||||||
| Buildings | |||||||||||
| Furniture, fixtures and equipment | |||||||||||
| Leasehold improvements | |||||||||||
| Other assets | |||||||||||
| Premises and equipment, gross | |||||||||||
| Less: accumulated depreciation and amortization | ( | ( | |||||||||
| Premises and equipment, net | $ | $ | |||||||||
Depreciation and amortization expense was $12.6 million, $12.4 million, and $11.1 million for the years ended December 31, 2023, 2022, and 2021.
NOTE 7. GOODWILL AND OTHER INTANGIBLE ASSETS, NET
In performing our annual goodwill assessment in the fourth quarter of 2022 of our two reportable segments – Commercial Banking and Civic, we conducted a qualitative assessment of our Commercial Banking reporting unit and a quantitative assessment of our Civic reporting unit. In performing the qualitative assessment, we considered relevant events and circumstances that may affect the fair value or carrying amount of the Commercial Banking reporting unit. The events and circumstances we considered included current macroeconomic conditions, current industry conditions and the financial performance of the reporting unit and we concluded that it was not more-likely-than-not that goodwill is impaired at the Commercial Banking reporting unit level. Furthermore, in connection with our plans to restructure the Civic reporting unit, we elected to bypass the qualitative assessment and proceeded directly to a quantitative test. We measured the fair value of the Civic reporting unit consistent with the fair value measurement principle that it is the price that would be received to sell an asset or paid to transfer a liability in an orderly transaction between market participants at the measurement date. As a result of the quantitative assessment, we recorded a goodwill impairment of $29.0 million at the Civic reporting unit in the fourth quarter of 2022 as the estimated fair value of the reporting unit was less than the carrying value. This was a non-cash charge to earnings and had no impact on our regulatory capital ratios, cash flows, or liquidity position.
The unprecedented decline in economic conditions in the banking industry triggered by the failure of two large regional banks caused a significant decline in stock market valuations in March 2023, including our stock price. These triggering events indicated that goodwill related to our single reporting unit may be impaired and resulted in us performing a goodwill impairment assessment in the first quarter of 2023. We applied the market approach using an average share price of the Company's stock and a control premium to determine the fair value of the reporting unit. The control premium was based upon management's judgment using historical information of control premiums for completed bank acquisitions. As a result, we recorded a goodwill impairment of $1.4 billion in the first quarter of 2023 as the estimated fair value of equity was less than book value. This was a non-cash charge to earnings and had no impact on our regulatory capital ratios, cash flows or liquidity position.
In performing our annual goodwill impairment testing in the fourth quarter of 2023 we considered relevant events and circumstances that may affect the fair value or carrying amount of our reporting unit. The events and circumstances we considered included macroeconomic conditions, industry conditions, and our financial performance. Based on our qualitative assessment, we concluded that there were no conditions, changes in operations, or results that indicated a triggering event had occurred in the fourth quarter of 2023. Thus, a quantitative assessment was not required and we determined that it was more likely than not that the fair value of the reporting unit was greater than its carrying value and there was no evidence of impairment.
166
BANC OF CALIFORNIA, INC. AND SUBSIDIARIES
Notes to Consolidated Financial Statements
The following table presents the changes in the carrying amount of goodwill for the years indicated:
| Goodwill | |||||
| (In thousands) | |||||
| Balance, December 31, 2021 | $ | ||||
| Impairment - Civic | ( | ||||
| Balance, December 31, 2022 | |||||
| Impairment | ( | ||||
| Merger with PacWest Bancorp | |||||
| Balance, December 31, 2023 | $ | ||||
Our other intangible assets with definite lives are CDI and CRI. CDI and CRI are amortized over their respective estimated useful lives and reviewed for impairment at least quarterly. The amortization expense represents the estimated decline in the value of the underlying deposits or customer relationships acquired.
The following table presents the changes in CDI and CRI and the related accumulated amortization for the years indicated:
| Year Ended December 31, | |||||||||||||||||
| 2023 | 2022 | 2021 | |||||||||||||||
| (In thousands) | |||||||||||||||||
| Gross Amount of CDI and CRI: | |||||||||||||||||
| Balance, beginning of year | $ | $ | $ | ||||||||||||||
| Addition from the PacWest Bancorp merger | |||||||||||||||||
| Addition from the HOA Business acquisition | |||||||||||||||||
| Addition from the Civic acquisition | |||||||||||||||||
| Fully amortized portion | ( | ( | ( | ||||||||||||||
| Balance, end of year | |||||||||||||||||
| Accumulated Amortization: | |||||||||||||||||
| Balance, beginning of year | ( | ( | ( | ||||||||||||||
| Amortization expense | ( | ( | ( | ||||||||||||||
| Fully amortized portion | |||||||||||||||||
| Balance, end of year | ( | ( | ( | ||||||||||||||
| Net CDI and CRI, end of year | $ | $ | $ | ||||||||||||||
The following table presents the estimated aggregate future amortization expense for our current intangible assets as of the date indicated:
| December 31, 2023 | |||||
| (In thousands) | |||||
| Year Ending December 31, | |||||
| 2024 | $ | ||||
| 2025 | |||||
| 2026 | |||||
| 2027 | |||||
| 2028 | |||||
| Thereafter | |||||
| Net CDI and CRI | $ | ||||
167
BANC OF CALIFORNIA, INC. AND SUBSIDIARIES
Notes to Consolidated Financial Statements
NOTE 8. OTHER ASSETS
The following table presents the detail of our other assets as of the dates indicated:
| December 31, | |||||||||||
| Other Assets | 2023 | 2022 | |||||||||
| (In thousands) | |||||||||||
| LIHTC investments | $ | $ | |||||||||
| Interest receivable | |||||||||||
Operating lease ROU assets, net (1) | |||||||||||
| SBIC investments | |||||||||||
| Equity investments without readily determinable fair values | |||||||||||
| Prepaid expenses | |||||||||||
| Taxes receivable | |||||||||||
| HLBV investments | |||||||||||
| Foreclosed assets, net | |||||||||||
Equity warrants (2) | |||||||||||
| Equity investments with readily determinable fair values | |||||||||||
| Other receivables/assets | |||||||||||
| Total other assets | $ | $ | |||||||||
____________________
(1) See Note 9. Leases for further details regarding the operating lease ROU assets.
(2) See Note 12. Derivatives for information regarding equity warrants.
The Company invests as a limited partner in LIHTC partnerships that operate qualified affordable housing projects and generate tax benefits for investors, including federal low income housing tax credits. The partnerships are deemed to be VIEs because they do not have sufficient equity investment at risk and are structured with non-substantive voting rights; however, we are not the primary beneficiary of the VIEs and do not consolidate them. We amortize the investment in proportion to the allocated tax benefits using the proportional amortization method of accounting and record such benefits net of investment amortization in income tax expense.
The Company's equity investments without readily determinable fair values include investments in privately held companies, limited partnerships, entities from which we issued trust preferred securities, CRA-related loan pool investments, and CRA-related equity investments. The CRA-related loan pool and equity investments primarily consist of investments in partnerships which provide affordable housing and participations in loan pools which provide low-cost loans to low and moderate income applicants. We measure our equity investments without readily determinable fair values using the measurement alternative. Carrying values of these investments are adjusted to fair value upon observable transactions for identical or similar investments of the same issuer. Unrealized and realized gains and losses on equity investments without readily determinable fair values are recorded in "Noninterest income - other" on the consolidated statements of earnings (loss).
The Company's equity investments with readily determinable fair values include investments in public companies, often from the exercise of warrants, and publicly-traded mutual funds. Unrealized and realized gains and losses on equity investments with readily determinable fair values are recorded in "Noninterest income - other" on the consolidated statements of earnings (loss).
We invest in, and are a limited partner, in partnerships that were formed to invest in newly installed residential and commercial solar leases and power purchase agreements. As a result of our investments, we have the right to certain investment tax credits and tax depreciation benefits, and to a lesser extent, cash flows generated from the installed solar systems leased to consumers for a fixed period of time. We account for these investments using the HLBV method, where an investor determines its share of an investee's net earnings by comparing its claim on the investee's book value at the beginning and end of the period, assuming the investee were to liquidate all assets at their U.S. GAAP amounts and distribute the resulting cash to creditors and investors under their respective priorities.
168
BANC OF CALIFORNIA, INC. AND SUBSIDIARIES
Notes to Consolidated Financial Statements
Foreclosed assets include OREO and repossessed non-real estate assets. Foreclosed assets are initially recorded at the estimated fair value of the asset, based on current independent appraisals obtained at the time of acquisition, less estimated costs to sell, including senior obligations such as delinquent property taxes. The excess of the recorded loan balance over the estimated fair value of the asset at the time of acquisition less estimated costs to sell is charged to the allowance for loan and lease losses.
NOTE 9. LEASES
We determine if an arrangement is a lease at inception by assessing whether there is an identified asset, and whether the contract conveys the right to control the use of the identified asset for a period of time in exchange for consideration. ASC Topic 842 also requires a lessee to classify a lease as either finance or operating.
ROU assets represent a lessee's right to use an underlying asset for the lease term and lease liabilities represent a lessee's obligation to make lease payments arising from the lease. We amortize the operating lease ROU assets and record interest expense on the operating lease liabilities over the lease terms.
Operating leases with a term of more than one year are included in operating lease ROU assets and operating lease liabilities, which are reported in "Other assets" and "Accrued interest payable and other liabilities" on the Company's consolidated balance sheets. Short-term leases (initial term of less than 12 months) are not recorded on the balance sheet and lease expense is recognized on a straight-line basis over the lease term. We have lease agreements with lease and non-lease components, which are accounted for as a single lease component. Most leases include one or more options to renew, with renewal terms that can extend the lease from to ten years . The exercise of lease renewal options is at our sole discretion. Some of our leases also include termination options. We have determined that we do not meet the reasonably certain threshold to exercise any renewal or termination options, therefore our lease terms do not reflect any optional periods. We rent or sublease certain office space to third parties. Our subleases consist of operating leases for offices that we have fully or partially vacated.
Certain of our lease agreements also include rental payments that adjust periodically based on changes in the CPI. We initially measured our lease payments using the index at the lease commencement date. Subsequent increases in the CPI are treated as variable lease payments and recognized in the period in which the obligation for those payments is incurred. The ROU assets and lease liabilities are not re-measured as a result of changes in the CPI. Our lease agreements do not contain any purchase options, residual value guarantees, or restrictive covenants.
Operating Leases as a Lessee
Our lease expense is a component of "Occupancy expense" on our consolidated statements of earnings (loss). The following table presents the components of lease expense for the years indicated:
| Year Ended December 31, | |||||||||||||||||
| 2023 | 2022 | 2021 | |||||||||||||||
| (In thousands) | |||||||||||||||||
| Operating lease expense: | |||||||||||||||||
| Fixed costs | $ | $ | $ | ||||||||||||||
| Variable costs | |||||||||||||||||
| Short-term lease costs | |||||||||||||||||
| Sublease income | ( | ( | ( | ||||||||||||||
| Net lease expense | $ | $ | $ | ||||||||||||||
169
BANC OF CALIFORNIA, INC. AND SUBSIDIARIES
Notes to Consolidated Financial Statements
The following table presents supplemental cash flow information related to leases for the years indicated:
| Year Ended December 31, | |||||||||||||||||
| 2023 | 2022 | 2021 | |||||||||||||||
| (In thousands) | |||||||||||||||||
| Cash paid for amounts included in the measurement of lease liabilities: | |||||||||||||||||
| Operating cash flows from operating leases | $ | $ | $ | ||||||||||||||
| ROU assets obtained in exchange for lease obligations: | |||||||||||||||||
| Operating leases | $ | $ | $ | ||||||||||||||
The following table presents supplemental balance sheet and other information related to operating leases as of the date indicated:
| December 31, | |||||||||||
| 2023 | 2022 | ||||||||||
| (Dollars in thousands) | |||||||||||
| Operating leases: | |||||||||||
| $ | $ | ||||||||||
| $ | $ | ||||||||||
| Weighted average remaining lease term (in years) | |||||||||||
| Weighted average discount rate | % | % | |||||||||
The following table presents the maturities of operating lease liabilities as of the date indicated:
| December 31, 2023 | |||||
| (In thousands) | |||||
| Year Ending December 31, | |||||
| 2024 | $ | ||||
| 2025 | |||||
| 2026 | |||||
| 2027 | |||||
| 2028 | |||||
| Thereafter | |||||
| Total operating lease liabilities | |||||
| Less: Imputed interest | ( | ||||
| Present value of operating lease liabilities | $ | ||||
Operating Leases as a Lessor
We provide equipment financing to our customers through operating leases where we facilitate the purchase of equipment leased to our customers. The equipment is shown on our consolidated balance sheets as "Equipment leased to others under operating leases" and is depreciated to its estimated residual value at the end of the lease term, shown as "Leased equipment depreciation" in the consolidated statements of earnings (loss), according to our fixed asset accounting policy. We receive periodic rental income payments under the leases, which are recorded as "Leased equipment income" in the consolidated statements of earnings (loss). The equipment is tested periodically for impairment. No
170
BANC OF CALIFORNIA, INC. AND SUBSIDIARIES
Notes to Consolidated Financial Statements
The following table presents the contractual rental payments to be received on operating leases as of the date indicated:
| December 31, 2023 | |||||
| (In thousands) | |||||
| Year Ending December 31, | |||||
| 2024 | $ | ||||
| 2025 | |||||
| 2026 | |||||
| 2027 | |||||
| 2028 | |||||
| Thereafter | |||||
| Total undiscounted cash flows | $ | ||||
NOTE 10. DEPOSITS
The following table presents the components of interest‑bearing deposits as of the dates indicated:
| December 31, | |||||||||||
| Deposit Composition | 2023 | 2022 | |||||||||
| (In thousands) | |||||||||||
| Interest checking | $ | $ | |||||||||
| Money market | |||||||||||
| Savings | |||||||||||
| Time deposits $250,000 and under | |||||||||||
| Time deposits over $250,000 | |||||||||||
| Total interest-bearing deposits | $ | $ | |||||||||
Brokered time deposits totaled $3.5 billion and $2.3 billion at December 31, 2023 and 2022. Brokered non-maturity deposits totaled $1.1 billion and $2.6 billion at December 31, 2023 and 2022.
The following table summarizes the maturities of time deposits as of the date indicated:
Time Deposits | |||||||||||||||||
$250,000 | Over | ||||||||||||||||
| December 31, 2023 | and Under | $250,000 | Total | ||||||||||||||
| (In thousands) | |||||||||||||||||
| Year of Maturity: | |||||||||||||||||
| 2024 | $ | $ | $ | ||||||||||||||
| 2025 | |||||||||||||||||
| 2026 | |||||||||||||||||
| 2027 | |||||||||||||||||
| 2028 | |||||||||||||||||
| Thereafter | |||||||||||||||||
| Total | $ | $ | $ | ||||||||||||||
171
BANC OF CALIFORNIA, INC. AND SUBSIDIARIES
Notes to Consolidated Financial Statements
Borrowings
The following table summarizes our borrowings as of the dates indicated:
| December 31, | |||||||||||||||||||||||
| 2023 | 2022 | ||||||||||||||||||||||
| Weighted | Weighted | ||||||||||||||||||||||
| Average | Average | ||||||||||||||||||||||
| Borrowing Type | Balance | Rate | Balance | Rate | |||||||||||||||||||
| (Dollars in thousands) | |||||||||||||||||||||||
| Bank Term Funding Program | $ | % | $ | % | |||||||||||||||||||
| Senior notes | % | % | |||||||||||||||||||||
| Credit-linked notes | % | % | |||||||||||||||||||||
| FHLB secured advances | % | % | |||||||||||||||||||||
| AFX borrowings | % | % | |||||||||||||||||||||
| FHLB unsecured overnight advance | % | % | |||||||||||||||||||||
| Total borrowings | % | % | |||||||||||||||||||||
| Acquisition discount on senior notes | ( | ||||||||||||||||||||||
| Total borrowings, net | $ | $ | |||||||||||||||||||||
The Bank has established secured and unsecured lines of credit under which it may borrow funds from time to time on a term or overnight basis from the FHLB, the FRBSF, and other financial institutions.
FHLB Secured Line of Credit. The Bank had secured financing capacity with the FHLB of $5.3 billion as of December 31, 2023, collateralized by a blanket lien on $9.5 billion of qualifying loans and $20.3 million of securities. As of December 31, 2023, there were $243.8 million in letters of credit pledged but no balances outstanding. As of December 31, 2022, the balance outstanding was $1.3 billion, which consisted of an overnight advance and two term advances with maturity dates of January 2023 and February 2023.
FRBSF Secured Line of Credit. The Bank has a secured line of credit with the FRBSF. As of December 31, 2023, the Bank had secured borrowing capacity of $6.9 billion collateralized by liens covering $7.7 billion of qualifying loans and $1.3 billion of securities. As of December 31, 2023 and December 31, 2022, there were no
FRBSF Bank Term Funding Program. In March of 2023, the Bank participated in the FRBSF Bank Term Funding Program. As of December 31, 2023, the Bank had secured borrowing capacity of $2.6 billion collateralized by the par value of pledged securities totaling $2.6 billion. As of December 31, 2023, the balance outstanding was $2.6 billion consisting of two term advances maturing in March 2024.
Federal Funds Arrangements with Commercial Banks. As of December 31, 2023, the Bank had unsecured lines of credit of $290.0 million in the aggregate with several correspondent banks for the purchase of overnight funds, subject to availability of funds. These lines are renewable annually and have no unused commitment fees. As of December 31, 2023 and December 31, 2022, there were no balances outstanding. The Bank is a member of the AFX, through which it may either borrow or lend funds on an overnight or short-term basis with a group of pre-approved commercial banks. The availability of funds changes daily. As of December 31, 2023, the were no balances outstanding. As of December 31, 2022, there was a $250.0 million balance outstanding.
Senior Notes. The Senior Notes are unsecured debt obligations and rank equally with our other present and future unsecured unsubordinated obligations. We make interest payments on the Senior Notes semi-annually in arrears. We have the option to redeem the Senior Notes either in whole or in part on or after January 15, 2025 (i.e., 90 days prior to the maturity date). Notification of no less than 30 nor more than 60 days is required for redemption. The Senior Notes will be redeemable at a price equal to 100% of the principal amount of the Senior Notes to be redeemed plus accrued and unpaid interest to the date of redemption.
172
BANC OF CALIFORNIA, INC. AND SUBSIDIARIES
Notes to Consolidated Financial Statements
Credit-Linked Notes. On September 29, 2022, legacy Pacific Western Bank completed a credit-linked notes transaction. The notes were issued and sold at par and had an aggregate principal amount of $132.8 million with net proceeds of approximately $128.7 million and are due June 27, 2052. The notes are linked to the credit risk of an approximately $2.48 billion reference pool of previously purchased single-family residential mortgage loans. Principal payments on the notes are based only on scheduled and unscheduled principal that is actually collected on these loans. The notes were issued in five classes with a blended rate on the notes of SOFR plus 11 %. The transaction results in a lower risk-weighting on the reference pool of loans for regulatory capital purposes. The credit-linked notes are reported at fair value of $123.1 million at December 31, 2023. See Note 3. Restricted Cash for information regarding the collateral for the notes and Note 14. Fair Value Option for additional information.
Repurchase Agreement. In March of 2023, the Bank entered into a repurchase agreement through which it borrowed $1.4 billion that was collateralized by loans with a principal balance of $2.1 billion. The repurchase agreement was to be repaid with collections on the underlying loans. The repurchase agreement had a term of 18 months, under which the interest rate was 8.50 % for amounts outstanding during the first nine months and 8.75 % for amounts outstanding during the last nine months. The Bank exercised its option to pay off the repurchase agreement after the first nine months and paid off the entire balance in December 2023.
Subordinated Debt
The following table summarizes the terms of each issuance of subordinated debt outstanding as of the dates indicated:
December 31, | |||||||||||||||||||||||||||||||||||||||||
| 2023 | 2022 | Issue | Maturity | Rate Index | |||||||||||||||||||||||||||||||||||||
| Series | Balance | Rate (1) | Balance | Rate (1) | Date | Date | (Quarterly Reset) (6) | ||||||||||||||||||||||||||||||||||
| (Dollars in thousands) | |||||||||||||||||||||||||||||||||||||||||
Subordinated notes, net (2) | $ | % | $ | % | 4/30/2021 | 5/1/2031 | Fixed rate (3) | ||||||||||||||||||||||||||||||||||
| Subordinated notes | % | % | 10/30/2020 | 10/30/2030 | Fixed rate (7) | ||||||||||||||||||||||||||||||||||||
| Trust V | % | % | 8/15/2003 | 9/17/2033 | 3-month Term SOFR + | ||||||||||||||||||||||||||||||||||||
| Trust VI | % | % | 9/3/2003 | 9/15/2033 | 3-month Term SOFR + | ||||||||||||||||||||||||||||||||||||
| Trust CII | % | % | 9/17/2003 | 9/17/2033 | 3-month Term SOFR + | ||||||||||||||||||||||||||||||||||||
| Trust VII | % | % | 2/5/2004 | 4/23/2034 | 3-month Term SOFR + | ||||||||||||||||||||||||||||||||||||
| Trust CIII | % | % | 8/15/2005 | 9/15/2035 | 3-month Term SOFR + | ||||||||||||||||||||||||||||||||||||
| Trust FCCI | % | % | 1/25/2007 | 3/15/2037 | 3-month Term SOFR + | ||||||||||||||||||||||||||||||||||||
| Trust FCBI | % | % | 9/30/2005 | 12/15/2035 | 3-month Term SOFR + | ||||||||||||||||||||||||||||||||||||
| Trust CS 2005-1 | % | % | 11/21/2005 | 12/15/2035 | 3-month Term SOFR + | ||||||||||||||||||||||||||||||||||||
| Trust CS 2005-2 | % | % | 12/14/2005 | 1/30/2036 | 3-month Term SOFR + | ||||||||||||||||||||||||||||||||||||
| Trust CS 2006-1 | % | % | 2/22/2006 | 4/30/2036 | Prime + | ||||||||||||||||||||||||||||||||||||
| Trust CS 2006-2 | % | % | 9/27/2006 | 10/30/2036 | 3-month Term SOFR + | ||||||||||||||||||||||||||||||||||||
Trust CS 2006-3 (4) | % | % | 9/29/2006 | 10/30/2036 | 3-month EURIBOR + | ||||||||||||||||||||||||||||||||||||
| Trust CS 2006-4 | % | % | 12/5/2006 | 1/30/2037 | Prime + | ||||||||||||||||||||||||||||||||||||
| Trust CS 2006-5 | % | % | 12/19/2006 | 1/30/2037 | 3-month Term SOFR + | ||||||||||||||||||||||||||||||||||||
| Trust CS 2007-2 | % | % | 6/13/2007 | 7/30/2037 | 3-month Term SOFR + | ||||||||||||||||||||||||||||||||||||
| PMB Statutory Trust III | % | % | 9/16/2002 | 9/26/2032 | 3-month Term SOFR + | ||||||||||||||||||||||||||||||||||||
| PMB Capital Trust III | % | % | 10/4/2004 | 10/8/2034 | 3-month Term SOFR + | ||||||||||||||||||||||||||||||||||||
| Total subordinated debt | % | % | |||||||||||||||||||||||||||||||||||||||
Acquisition discount (5) | ( | ( | |||||||||||||||||||||||||||||||||||||||
| Net subordinated debt | $ | $ | |||||||||||||||||||||||||||||||||||||||
___________________
(1) Rates do not include the effects of discounts and issuance costs.
(2) Net of unamortized issuance costs of $4.3 million.
(3) Interest rate is fixed until May 1, 2026, when it changes to a floating rate and resets quarterly at a benchmark rate plus 252 basis points.
(4) Denomination is in Euros with a value of €25.8 million.
(5) Amount represents the fair value adjustment on trust preferred securities assumed in acquisitions.
(6) On July 1, 2023, interest rates transitioned to Term SOFR or Prime plus the relevant spread adjustment as the applicable benchmark upon the cessation of LIBOR on June 30, 2023.
173
BANC OF CALIFORNIA, INC. AND SUBSIDIARIES
Notes to Consolidated Financial Statements
NOTE 12. DERIVATIVES
To a limited extent, the Company utilizes interest rate swaps contracts with clients and counterparty banks for the purpose of offsetting or hedging exposures arising out of lending and borrowing transactions. The Company offers borrowers interest rate swaps under a "back-to-back" loan hedging program and offsets these "pay floating/receive fixed" contracts with borrowers with "receive fixed/pay floating" swaps with counterparty banks. The total notional balance of these offsetting hedging contracts was $168.9 million at December 31, 2023. The Company has also hedged the interest rate risk and foreign currency risk on €25.8 million of subordinated debt utilizing a combined cross currency swap/interest rate swap, which has had the effect of hedging the foreign currency risk and fixing the Euribor-based floating rate instrument at a fixed rate of 2.76 % through July 2025. The outputs from the Company's NII simulation analysis and MVE modeling reflect the impact of these interest rate/currency swaps, however, the impact is not material. Our derivatives are carried at fair value and recorded in "Other assets" or "Accrued interest payable and other liabilities," as appropriate, in the consolidated balance sheets. For derivatives not designated as hedging instruments, the changes in fair value of our derivatives and the related fees are recognized in "Noninterest income - other" in the consolidated statements of earnings (loss). For the year ended December 31, 2023, changes in fair value and fees recorded to noninterest income in the consolidated statements of earnings (loss) were immaterial. See Note 8. Other Assets for additional information regarding equity warrant assets.
Included in the interest rate contracts in the table below are pay-fixed, receivable-variable interest rate swap contracts classified as cash flow hedges with notional amounts aggregating $300.0 million, five year terms, and varying maturity dates throughout 2028. These swap contracts were entered into with institutional counterparties to hedge against variability in cash flow attributable to interest rate risk on a portion of the Company's variable rate deposits and borrowings. The cash flow hedges were deemed highly effective at inception and thereafter. For derivatives designated as cash flow hedges, the portion of changes in fair value considered to be highly effective are reported as a component of "Accumulated other comprehensive loss, net" on the consolidated balance sheets until the related cash flows from the hedged items are recognized in earnings. As of December 31, 2023, the fair value of the cash flow hedges represent a liability of $5.7 million, of which $4.1 million (net of tax) was included in accumulated other comprehensive loss, net.
The following table presents the U.S. dollar notional amounts and fair values of our derivative instruments included in the consolidated balance sheets as of the dates indicated:
| December 31, 2023 | December 31, 2022 | ||||||||||||||||||||||
| Notional | Fair | Notional | Fair | ||||||||||||||||||||
| Amount | Value | Amount | Value | ||||||||||||||||||||
| (In thousands) | |||||||||||||||||||||||
| Derivative Assets: | |||||||||||||||||||||||
| Interest rate contracts | $ | $ | $ | $ | |||||||||||||||||||
| Foreign exchange contracts | |||||||||||||||||||||||
| Interest rate and economic contracts | |||||||||||||||||||||||
| Equity warrant assets | |||||||||||||||||||||||
| $ | $ | $ | $ | ||||||||||||||||||||
| Derivative Liabilities: | |||||||||||||||||||||||
| Interest rate contracts | $ | $ | $ | $ | |||||||||||||||||||
| Foreign exchange contracts | |||||||||||||||||||||||
| $ | $ | $ | $ | ||||||||||||||||||||
For further information regarding our derivatives, see Note 1. Nature of Operations and Summary of Significant
Accounting Policies.
174
BANC OF CALIFORNIA, INC. AND SUBSIDIARIES
Notes to Consolidated Financial Statements
NOTE 13. COMMITMENTS AND CONTINGENCIES
The following table presents a summary of commitments described below as of the dates indicated:
| December 31, | |||||||||||
| 2023 | 2022 | ||||||||||
| (In thousands) | |||||||||||
| Loan commitments to extend credit | $ | $ | |||||||||
| Standby letters of credit | |||||||||||
| Total | $ | $ | |||||||||
The Company is a party to financial instruments with off-balance sheet risk in the normal course of business to meet the financing needs of its customers. These financial instruments include commitments to extend credit and standby letters of credit. Those instruments involve, to varying degrees, elements of credit risk in excess of the amount recognized in the consolidated balance sheets. The contract or notional amounts of those instruments reflect the extent of involvement that the Company has in particular classes of financial instruments.
Commitments to extend credit are contractual agreements to lend to our customers when customers are in compliance with their contractual credit agreements and when customers have contractual availability to borrow under such agreements. Commitments generally have fixed expiration dates or other termination clauses and may require payment of a fee. Since many of the commitments are expected to expire without being drawn upon, the total commitment amounts do not necessarily represent future cash requirements. The estimated exposure to loss from these commitments is included in the reserve for unfunded loan commitments, which amounted to $29.6 million at December 31, 2023 and $91.1 million at December 31, 2022.
Standby letters of credit are conditional commitments issued by the Company to guarantee the performance of a customer to a third party. We provide standby letters of credit in conjunction with several of our lending arrangements and property lease obligations. Most guarantees expire within one year from the date of issuance. If a borrower defaults on its commitments subject to any letter of credit issued under these arrangements, we would be required to meet the borrower's financial obligation but would seek repayment of that financial obligation from the borrower. In some cases, borrowers have pledged cash and investment securities as collateral under these arrangements.
Additionally, we have commitments to invest in SBICs that call for capital contributions up to an amount specified in the partnership agreements, and in CRA-related loan pools. As of December 31, 2023 and 2022, such commitments totaled $94.5 million and $76.9 million.
The following table presents the years in which commitments are expected to be paid for our commitments to contribute capital to SBICs and CRA-related loan pools as of the date indicated:
| December 31, 2023 | |||||
| (In thousands) | |||||
| Year Ending December 31, | |||||
| 2024 | $ | ||||
| 2025 | |||||
| Total | $ | ||||
Legal Matters
In the ordinary course of our business, we are party to various legal actions, which we believe are incidental to the operation of our business. The outcome of such legal actions and the timing of ultimate resolution are inherently difficult to predict. In the opinion of management, based upon information currently available to us, any resulting liability, in addition to amounts already accrued, and taking into consideration insurance which may be applicable, would not have a material adverse effect on the Company’s financial statements or operations. The range of any reasonably possible liabilities is also not significant.
175
BANC OF CALIFORNIA, INC. AND SUBSIDIARIES
Notes to Consolidated Financial Statements
NOTE 14. FAIR VALUE OPTION
The Company may elect to report financial instruments and certain other items at fair value on an instrument-by-instrument basis with changes in fair value reported in earnings. The election is made upon the initial recognition of an eligible financial asset, financial liability, or firm commitment or when certain specified reconsideration events occur. The fair value election may not otherwise be revoked once an election is made. The changes in fair value are recorded in "Noninterest income" on the consolidated statements of earnings. However, movements in debt valuation adjustments are reported as a component of "Accumulated other comprehensive loss, net" on the consolidated balance sheets. Debt valuation adjustments represent the portion of the total change in the fair value of a liability resulting from a change in the instrument-specific credit risk.
Fair Value Option for Certain Debt Liabilities
The Company has elected the fair value option for the credit-linked notes issued in September 2022. The Company elected the fair value option because these exposures are considered to be structured notes, which are financial instruments that contain embedded derivatives. The notes are linked to the credit risk of an approximately $2.48 billion reference pool of previously purchased single-family residential mortgage loans. The principal balance of the credit-linked notes was $124.6 million at December 31, 2023. The carrying value of the credit-linked notes at December 31, 2023 was $123.1 million, which approximated the fair value. The changes in fair value are reported in "Noninterest income" in the consolidated statements of earnings.
The following table presents the changes in fair value of the credit-linked notes for the which the fair value option has been elected for the years indicated:
| Year Ended December 31, | |||||||||||
| Credit-Linked Notes | 2023 | 2022 | |||||||||
| (In thousands) | |||||||||||
| Changes in fair value - (losses) gains included in earnings | $ | ( | $ | ( | |||||||
| Changes in fair value - other comprehensive income (loss) | $ | $ | |||||||||
The following table provides information about the credit-linked notes carried at fair value as of the dates indicated:
| December 31, | |||||||||||
| Credit-Linked Notes | 2023 | 2022 | |||||||||
| (In thousands) | |||||||||||
| Carrying value reported on the consolidated balance sheets | $ | $ | |||||||||
| Aggregate unpaid principal balance in excess of (less than) fair value | $ | $ | ( | ||||||||
176
BANC OF CALIFORNIA, INC. AND SUBSIDIARIES
Notes to Consolidated Financial Statements
NOTE 15. FAIR VALUE MEASUREMENTS
ASC Topic 820, “Fair Value Measurement,” defines fair value, establishes a framework for measuring fair value including a three‑level valuation hierarchy, and expands disclosures about fair value measurements. Fair value is defined as the exchange price that would be received to sell an asset or paid to transfer a liability in an orderly transaction between market participants at the measurement date reflecting assumptions that a market participant would use when pricing an asset or liability. The hierarchy uses three levels of inputs to measure the fair value of assets and liabilities as follows:
•Level 1: Quoted prices (unadjusted) for identical assets or liabilities in active markets.
•Level 2: Observable inputs other than Level 1, including quoted prices for similar assets and liabilities in active markets, quoted prices in less active markets, or other observable inputs that can be corroborated by observable market data, either directly or indirectly, for substantially the full term of the financial instrument. This category generally includes agency residential CMOs, agency commercial and residential MBS, municipal securities, collateralized loan obligations, registered publicly rated private label CMOs, corporate debt securities, SBA securities, and asset-backed securitizations.
•Level 3: Inputs to a valuation methodology that are unobservable, supported by little or no market activity, and significant to the fair value measurement. These valuation methodologies generally include pricing models, discounted cash flow models, or a determination of fair value that requires significant management judgment or estimation. This category also includes observable inputs from a pricing service not corroborated by observable market data, and includes some of our corporate debt securities, and our equity warrants and credit-linked notes.
We use fair value to measure certain assets and liabilities on a recurring basis, primarily securities available‑for‑sale and derivatives. For assets measured at the lower of cost or fair value, the fair value measurement criteria may or may not be met during a reporting period and such measurements are therefore considered “nonrecurring” for purposes of disclosing our fair value measurements. Fair value is used on a nonrecurring basis to adjust carrying values for individually evaluated loans and leases and other real estate owned and also to record impairment on certain assets, such as goodwill, CDI, and other long-lived assets.
The Company also holds SBIC investments measured at fair value using the NAV per share practical expedient that are not required to be classified in the fair value hierarchy. At December 31, 2023, the fair value of these investments was $105.4 million.
177
BANC OF CALIFORNIA, INC. AND SUBSIDIARIES
Notes to Consolidated Financial Statements
The following tables present information on the assets and liabilities measured and recorded at fair value on a recurring basis as of the dates indicated:
| Fair Value Measurements as of | |||||||||||||||||||||||
| December 31, 2023 | |||||||||||||||||||||||
| Measured on a Recurring Basis | Total | Level 1 | Level 2 | Level 3 | |||||||||||||||||||
| (In thousands) | |||||||||||||||||||||||
| Securities available‑for‑sale: | |||||||||||||||||||||||
| Agency residential MBS | $ | $ | $ | $ | |||||||||||||||||||
| U.S. Treasury securities | |||||||||||||||||||||||
| Agency commercial MBS | |||||||||||||||||||||||
| Agency residential CMOs | |||||||||||||||||||||||
| Municipal securities | |||||||||||||||||||||||
| Corporate debt securities | |||||||||||||||||||||||
| Private label residential CMOs | |||||||||||||||||||||||
| Collateralized loan obligations | |||||||||||||||||||||||
| Private label commercial MBS | |||||||||||||||||||||||
| Asset-backed securities | |||||||||||||||||||||||
| SBA securities | |||||||||||||||||||||||
| Total securities available-for-sale | $ | $ | $ | $ | |||||||||||||||||||
| Equity investments with readily determinable fair values | $ | $ | $ | $ | |||||||||||||||||||
Derivatives (1): | |||||||||||||||||||||||
| Equity warrants | |||||||||||||||||||||||
| Interest rate and economic contracts | |||||||||||||||||||||||
| Derivative liabilities | |||||||||||||||||||||||
| Credit-linked notes | |||||||||||||||||||||||
178
BANC OF CALIFORNIA, INC. AND SUBSIDIARIES
Notes to Consolidated Financial Statements
| Fair Value Measurements as of | |||||||||||||||||||||||
| December 31, 2022 | |||||||||||||||||||||||
| Measured on a Recurring Basis | Total | Level 1 | Level 2 | Level 3 | |||||||||||||||||||
| (In thousands) | |||||||||||||||||||||||
| Securities available‑for‑sale: | |||||||||||||||||||||||
| Agency residential MBS | $ | $ | $ | $ | |||||||||||||||||||
| Municipal securities | |||||||||||||||||||||||
| Agency commercial MBS | |||||||||||||||||||||||
| Agency residential CMOs | |||||||||||||||||||||||
| U.S. Treasury securities | |||||||||||||||||||||||
| Corporate debt securities | |||||||||||||||||||||||
| Private label commercial MBS | |||||||||||||||||||||||
| Collateralized loan obligations | |||||||||||||||||||||||
| Private label residential CMOs | |||||||||||||||||||||||
| Asset-backed securities | |||||||||||||||||||||||
| SBA securities | |||||||||||||||||||||||
| Total securities available-for-sale | $ | $ | $ | $ | |||||||||||||||||||
| Equity investments with readily determinable fair values | $ | $ | $ | $ | |||||||||||||||||||
Derivatives (1): | |||||||||||||||||||||||
| Equity warrants | |||||||||||||||||||||||
| Interest rate and economic contracts | |||||||||||||||||||||||
| Derivative liabilities | |||||||||||||||||||||||
| Credit-linked notes | |||||||||||||||||||||||
____________________
(1) For information regarding derivative instruments, see Note 12. Derivatives.
During the year ended December 31, 2023, there was a $36,000 transfer from Level 3 equity warrants to Level 1 equity investments with readily determinable fair values measured on a recurring basis. There was also an $51.8 million transfer of corporate debt securities from Level 2 to Level 3 during the year ended December 31, 2023.
The following table presents information about quantitative inputs and assumptions used to determine the fair values provided by our third-party pricing service for our Level 3 corporate debt securities available-for-sale measured at fair value on a recurring basis as of the date indicated:
| December 31, 2023 | |||||||||||
| Corporate Debt Securities | |||||||||||
Input or | Weighted | ||||||||||
| Range | Average | ||||||||||
| Unobservable Inputs | of Inputs | Input (1) | |||||||||
| Spread to 10 Year Treasury | |||||||||||
| Discount rates | |||||||||||
(1) Unobservable inputs for corporate debt securities were weighted by the relative fair values of the instruments.
179
BANC OF CALIFORNIA, INC. AND SUBSIDIARIES
Notes to Consolidated Financial Statements
The following table presents information about the quantitative inputs and assumptions used in the modified Black-Scholes option pricing model to determine the fair value for our Level 3 equity warrants measured at fair value on a recurring basis as of the date indicated:
| December 31, 2023 | |||||||||||
| Equity Warrants | |||||||||||
| Weighted | |||||||||||
| Range | Average | ||||||||||
| Unobservable Inputs | of Inputs | Input (1) | |||||||||
| Volatility | |||||||||||
| Risk-free interest rate | |||||||||||
| Remaining life assumption (in years) | |||||||||||
(1) Unobservable inputs for equity warrants were weighted by the relative fair values of the instruments.
The following table summarizes activity for our Level 3 corporate debt securities measured at fair value on a recurring basis for the years indicated:
| Year Ended | |||||
| Level 3 Corporate Debt Securities | December 31, 2023 | ||||
| (In thousands) | |||||
| Balance, December 31, 2022 | $ | ||||
| ( | |||||
| Transfer from Level 2 | |||||
| Balance, December 31, 2023 | $ | ||||
| comprehensive income for securities held at quarter-end | $ | ( | |||
The following table summarizes activity for our Level 3 equity warrants measured at fair value on a recurring basis for the years indicated:
| Year Ended December 31, | |||||||||||
| Level 3 Equity Warrants | 2023 | 2022 | |||||||||
| (In thousands) | |||||||||||
| Balance, beginning of year | $ | $ | |||||||||
| Total included in earnings | ( | ||||||||||
Exercises and settlements (1) | ( | ( | |||||||||
| Issuances | |||||||||||
| Transfers to Level 1 (equity investments with readily | |||||||||||
| determinable fair values) | ( | ( | |||||||||
| Balance, end of year | $ | $ | |||||||||
______________________
180
BANC OF CALIFORNIA, INC. AND SUBSIDIARIES
Notes to Consolidated Financial Statements
The following table summarizes activity for our Level 3 credit-linked notes measured at fair value on a recurring basis for the year indicated:
| Year Ended December 31, | |||||||||||
| Level 3 Credit-Linked Notes | 2023 | 2022 | |||||||||
| (In thousands) | |||||||||||
| Balance, beginning of year | $ | $ | |||||||||
| Total included in earnings | |||||||||||
| Total included in other comprehensive income | ( | ||||||||||
| Issuances | |||||||||||
| Principal payments | ( | ( | |||||||||
| Balance, end of period | $ | $ | |||||||||
The following tables present assets measured at fair value on a non‑recurring basis as of the dates indicated:
| Fair Value Measurement as of | |||||||||||||||||||||||
| December 31, 2023 | |||||||||||||||||||||||
| Measured on a Non‑Recurring Basis | Total | Level 1 | Level 2 | Level 3 | |||||||||||||||||||
| (In thousands) | |||||||||||||||||||||||
| Individually evaluated loans and leases | $ | $ | $ | $ | |||||||||||||||||||
| OREO | |||||||||||||||||||||||
| Total non-recurring | $ | $ | $ | $ | |||||||||||||||||||
| Fair Value Measurement as of | |||||||||||||||||||||||
| December 31, 2022 | |||||||||||||||||||||||
| Measured on a Non‑Recurring Basis | Total | Level 1 | Level 2 | Level 3 | |||||||||||||||||||
| (In thousands) | |||||||||||||||||||||||
| Individually evaluated loans and leases | $ | $ | $ | $ | |||||||||||||||||||
| OREO | |||||||||||||||||||||||
| Total non-recurring | $ | $ | $ | $ | |||||||||||||||||||
The following table presents losses recognized on assets measured on a nonrecurring basis for the years indicated:
| Year Ended December 31, | |||||||||||||||||
| Loss on Assets Measured on a Non‑Recurring Basis | 2023 | 2022 | 2021 | ||||||||||||||
| (In thousands) | |||||||||||||||||
| Individually evaluated loans and leases | $ | $ | $ | ||||||||||||||
| OREO | |||||||||||||||||
| Total net loss | $ | $ | $ | ||||||||||||||
181
BANC OF CALIFORNIA, INC. AND SUBSIDIARIES
Notes to Consolidated Financial Statements
The following table presents the valuation methodology and unobservable inputs for Level 3 assets measured at fair value on a nonrecurring basis as of the date indicated:
| December 31, 2023 | |||||||||||||||||||||||||||||
| Valuation | Unobservable | Input or | Weighted | ||||||||||||||||||||||||||
| Asset | Fair Value | Technique | Inputs | Range | Average | ||||||||||||||||||||||||
(Dollars in thousands) | |||||||||||||||||||||||||||||
| Individually evaluated | |||||||||||||||||||||||||||||
loans and leases (1) | $ | Discounted cash flows | Discount rates | ||||||||||||||||||||||||||
| Individually evaluated | |||||||||||||||||||||||||||||
| loans and leases | Third-party appraisals | No discounts | |||||||||||||||||||||||||||
| Total non-recurring Level 3 | $ | ||||||||||||||||||||||||||||
__________________
(1) Relates to one loan at December 31, 2023.
ASC Topic 825, “Financial Instruments,” requires disclosure of the estimated fair value of certain financial instruments and the methods and significant assumptions used to estimate such fair values. Additionally, certain financial instruments and all nonfinancial instruments are excluded from the applicable disclosure requirements.
The following tables present carrying amounts and estimated fair values of certain financial instruments as of the dates indicated:
| December 31, 2023 | |||||||||||||||||||||||||||||
Carrying | Estimated Fair Value | ||||||||||||||||||||||||||||
| Amount | Total | Level 1 | Level 2 | Level 3 | |||||||||||||||||||||||||
(In thousands) | |||||||||||||||||||||||||||||
| Financial Assets: | |||||||||||||||||||||||||||||
| Cash and due from banks | $ | $ | $ | $ | $ | ||||||||||||||||||||||||
| Interest‑earning deposits in financial institutions | |||||||||||||||||||||||||||||
| Securities available‑for‑sale | |||||||||||||||||||||||||||||
| Securities held-to-maturity | |||||||||||||||||||||||||||||
| Investment in FRB and FHLB stock | |||||||||||||||||||||||||||||
| Loans held for sale | |||||||||||||||||||||||||||||
| Loans and leases held for investment, net | |||||||||||||||||||||||||||||
| Equity investments with readily determinable fair values | |||||||||||||||||||||||||||||
| Equity warrants | |||||||||||||||||||||||||||||
| Interest rate and economic contracts | |||||||||||||||||||||||||||||
| Servicing rights | |||||||||||||||||||||||||||||
| Financial Liabilities: | |||||||||||||||||||||||||||||
| Demand, checking, savings and money market deposits | |||||||||||||||||||||||||||||
| Time deposits | |||||||||||||||||||||||||||||
| Borrowings | |||||||||||||||||||||||||||||
| Subordinated debt | |||||||||||||||||||||||||||||
| Derivative liabilities | |||||||||||||||||||||||||||||
182
BANC OF CALIFORNIA, INC. AND SUBSIDIARIES
Notes to Consolidated Financial Statements
| December 31, 2022 | |||||||||||||||||||||||||||||
Carrying | Estimated Fair Value | ||||||||||||||||||||||||||||
| Amount | Total | Level 1 | Level 2 | Level 3 | |||||||||||||||||||||||||
(In thousands) | |||||||||||||||||||||||||||||
| Financial Assets: | |||||||||||||||||||||||||||||
| Cash and due from banks | $ | $ | $ | $ | $ | ||||||||||||||||||||||||
| Interest‑earning deposits in financial institutions | |||||||||||||||||||||||||||||
| Securities available‑for‑sale | |||||||||||||||||||||||||||||
| Securities held-to-maturity | |||||||||||||||||||||||||||||
| Investment in FHLB stock | |||||||||||||||||||||||||||||
| Loans held for sale | |||||||||||||||||||||||||||||
| Loans and leases held for investment, net | |||||||||||||||||||||||||||||
| Equity investments with readily determinable fair values | |||||||||||||||||||||||||||||
| Equity warrants | |||||||||||||||||||||||||||||
| Interest rate and economic contracts | |||||||||||||||||||||||||||||
| Servicing rights | |||||||||||||||||||||||||||||
| Financial Liabilities: | |||||||||||||||||||||||||||||
| Demand, checking, savings and money market deposits | |||||||||||||||||||||||||||||
| Time deposits | |||||||||||||||||||||||||||||
| Borrowings | |||||||||||||||||||||||||||||
| Subordinated debt | |||||||||||||||||||||||||||||
| Derivative liabilities | |||||||||||||||||||||||||||||
The following is a description of the valuation methodologies used to measure our assets recorded at fair value (under ASC Topic 820, “Fair Value Measurement”) and for estimating fair value for financial instruments not recorded at fair value (under ASC Topic 825).
Cash and due from banks. The carrying amount is assumed to be the fair value because of the liquidity of these instruments.
Interest‑earning deposits in financial institutions. The carrying amount is assumed to be the fair value given the short‑term nature of these deposits.
Securities available‑for‑sale. Securities available‑for‑sale are measured and carried at fair value on a recurring basis, net of the allowance for credit losses. Unrealized gains and losses on available‑for‑sale securities are reported as a component of “Accumulated other comprehensive loss, net” in the consolidated balance sheets. See Note 4. Investment Securities for further information on unrealized gains and losses on securities available‑for‑sale.
Fair value for securities categorized as Level 1, which are publicly traded securities, are based on readily available quoted prices. In determining the fair value of the securities categorized as Level 2, we obtain a report from a nationally recognized broker‑dealer detailing the fair value of each investment security we hold as of each reporting date. The broker‑dealer uses observable market information to value our securities, with the primary source being a nationally recognized pricing service. We review the market prices provided by the broker‑dealer for our securities for reasonableness based on our understanding of the marketplace and we consider any credit issues related to the securities. As we have not made any adjustments to the market quotes provided to us and they are based on observable market data, they have been categorized as Level 2 within the fair value hierarchy.
183
BANC OF CALIFORNIA, INC. AND SUBSIDIARIES
Notes to Consolidated Financial Statements
Our corporate debt securities (“the Level 3 AFS Securities”) were categorized as Level 3 due in part to the inactive market for such securities. There is a wide range of prices quoted for our Level 3 AFS Securities among independent third party pricing services, and this range reflects the significant judgment being exercised over the assumptions and variables that determine the pricing of such securities. We consider this subjectivity relating to our Level 3 AFS Securities to be a significant unobservable input. Had significant changes in default expectations, loss severity factors, or discount rates occurred all together or in isolation, it would have resulted in different fair value measurements at December 31, 2023.
Securities held-to-maturity. Securities held-to-maturity are carried at amortized cost, net of the allowance for credit losses. Fair value for securities categorized as Level 1, which are publicly traded securities, are based on readily available quoted prices. In determining the fair value of the securities categorized as Level 2, we obtain a report from a nationally recognized broker‑dealer detailing the fair value of each investment security we hold as of each reporting date. The broker‑dealer uses observable market information to value our securities, with the primary source being a nationally recognized pricing service. We review the market prices provided by the broker‑dealer for our securities for reasonableness based on our understanding of the marketplace and we consider any credit issues related to the securities. As we have not made any adjustments to the market quotes provided to us and they are based on observable market data, they have been categorized as Level 2 within the fair value hierarchy.
FRB and FHLB stock. Investments in FRB and FHLB stock are recorded at cost and measured for impairment quarterly. Ownership of FRB and FHLB stock is restricted to member banks and the securities do not have a readily determinable market value. Purchases and sales of these securities are at par value with the issuer. The fair value of investments in FRB and FHLB stock is equal to the carrying amount.
Loans and leases. As loans and leases are not measured at fair value, the following discussion relates to estimating the fair value disclosures under ASC Topic 825. Fair values are measured using the exit price and are estimated for portfolios of loans and leases with similar characteristics. Loans are segregated by type and further segmented into fixed and adjustable rate interest buckets by credit risk categories and by maturity dates. To determine the exit price of a loan or lease, the cash flows are estimated using a model which utilizes credit spreads and illiquidity premiums. The credit spread for a loan is determined by mapping loans' credit risk ratings to an equivalent corporate bond rating. Once the corporate bond rating is assigned, the credit spread is determined using corporate credit curves for corporate bonds that have a similar corporate bond rating and remaining term as the loan being valued. Illiquidity premiums are assigned to individual loans in a similar manner as an illiquidity premium amount is determined for each corporate bond rating. The credit spread above the appropriate rate curve and the illiquidity premium are considered to arrive at the discount rate curve applied to loan cash flows. For similar, homogeneous loans, management may make adjustments to the discount rate arrived at using the previously described methodology based upon the pricing for recent loan pool purchases and/or rates on recent originations.
Individually evaluated loans and leases. Defaulted loans and leases with outstanding balances over $250,000 are reviewed individually for expected credit loss, if any, and are recorded at fair value on a non-recurring basis. These defaulted loans and leases are excluded from the loan pools used within the collective evaluation of estimated credit losses. The criteria for default may include any one of the following: (1) on nonaccrual status, (2) payment delinquency of 90 days or more, (3) partial charge-off recognized, or (4) risk rated doubtful or loss.
To the extent a defaulted loan or lease is collateral dependent, we measure expected credit loss based on the estimated fair value of the underlying collateral. The fair value of each loan’s collateral is generally based on estimated market prices from an independently prepared appraisal, which is then adjusted for the cost related to liquidating such collateral; such valuation inputs result in a nonrecurring fair value measurement that is categorized as a Level 2 measurement. The Level 2 measurement is based on appraisals obtained within the last 12 months and for which a charge‑off was recognized or a change in the specific valuation allowance was made during the year ended December 31, 2023.
When adjustments are made to an appraised value to reflect various factors such as the age of the appraisal or known changes in the market or the collateral, such valuation inputs are considered unobservable and the fair value measurement is categorized as a Level 3 measurement. The individually evaluated loans and leases categorized as Level 3 also include unsecured loans and other secured loans whose fair values are based significantly on unobservable inputs such as the strength of a guarantor, including an SBA government guarantee, cash flows discounted at the effective loan rate, and management’s judgment.
184
BANC OF CALIFORNIA, INC. AND SUBSIDIARIES
Notes to Consolidated Financial Statements
The individually evaluated loan and lease balances shown above as measured on a non-recurring basis represent those defaulted loans and leases for which expected credit loss was recognized during the year ended December 31, 2023. The amounts shown as net losses include the expected credit loss recognized during the year ended December 31, 2023, for the loan and lease balances shown.
OREO. The fair value of OREO is generally based on the lower of estimated market prices from independently prepared current appraisals or negotiated sales prices with potential buyers, less estimated costs to sell; such valuation inputs result in a fair value measurement that is categorized as a Level 2 measurement on a nonrecurring basis. As a matter of policy, appraisals are required annually and may be updated more frequently as circumstances require in the opinion of management. The Level 2 measurement for OREO is based on appraisals obtained within the last 12 months and for which a write‑down was recognized during the year ended December 31, 2023.
When a current appraised value is not available or management determines the fair value of the collateral is further impaired below the appraised value as a result of known changes in the market or the collateral and there is no observable market price, such valuation inputs result in a fair value measurement that is categorized as a Level 3 measurement. To the extent a negotiated sales price or reduced listing price represents a significant discount to an observable market price, such valuation input would result in a fair value measurement that is also considered a Level 3 measurement. The OREO losses disclosed are write‑downs based on either a recent appraisal obtained after foreclosure or an accepted purchase offer by an independent third party received after foreclosure.
Equity warrants. Equity warrants with net settlement terms are received in connection with extending loan commitments to certain of our customers. We estimate the fair value of equity warrants using a Black-Scholes option pricing model to approximate fair market value. We typically classify our equity warrant derivatives in Level 3 of the fair value hierarchy.
Equity investments with readily determinable fair values. Our equity investments with readily determinable fair values include investments in public companies and publicly-traded mutual funds. Equity investments with readily determinable fair values are recorded at fair value with changes in fair value recorded in “Noninterest income - other.” Fair value measurements related to these investments are typically classified within Level 1 of the fair value hierarchy.
Deposits. Deposits are carried at historical cost. The fair values of deposits with no stated maturity, such as core deposits (defined as noninterest‑bearing demand, interest checking, money market, and savings accounts) and wholesale non-maturity deposits, are equal to the amount payable on demand as of the balance sheet date and considered Level 2. The fair value of time deposits is based on the discounted value of contractual cash flows and considered Level 2. The discount rate is estimated using the rates currently offered for deposits of similar remaining maturities. No value has been separately assigned to the Company’s long‑term relationships with its deposit customers, such as a core deposit intangible.
Borrowings. Borrowings include the Bank Term Funding Program and other fixed‑rate term borrowings. Borrowings are carried at amortized cost. The fair value of fixed‑rate borrowings is estimated by discounting scheduled cash flows through the maturity dates or call dates, if applicable, using estimated market discount rates that reflect current rates offered for borrowings with similar remaining maturities and characteristics and are considered Level 2. Borrowings also include variable-rate credit-linked notes which are carried at fair value. Fair value is estimated by discounting the future expected cash flows by a rate which represents the interest rate spread at issuance adjusted to account for market movement between the issuance date and the valuation date. Since the future expected cash flows are determined based on the unique collateral and waterfall characteristics of our credit-linked notes, they are considered Level 3.
Subordinated debt. Subordinated debt is carried at amortized cost. The fair value of subordinated debt is determined using a market discount rate on the expected cash flows and is considered Level 2.
Derivative assets and liabilities. Derivatives are carried at fair value on a recurring basis and primarily relate to forward exchange contracts which we enter into to manage foreign exchange risk. Our derivatives are principally traded in over-the-counter markets where quoted market prices are not readily available. Instead, the fair value of derivatives is estimated using market observable inputs such as foreign exchange forward rates, interest rate yield curves, volatilities and basis spreads. We also consider counter-party credit risk in valuing our derivatives. We typically classify our foreign exchange derivatives in Level 2 of the fair value hierarchy.
185
BANC OF CALIFORNIA, INC. AND SUBSIDIARIES
Notes to Consolidated Financial Statements
Commitments to extend credit. The majority of our commitments to extend credit carry current market interest rates if converted to loans. Because these commitments are generally not assignable by either the borrower or us, they only have value to the borrower and us. The estimated fair value approximates the recorded deferred fee amounts and is excluded from the table above because it is not material.
Limitations
Fair value estimates are made at a specific point in time and are based on relevant market information and information about the financial instrument. These estimates do not reflect income taxes or any premium or discount that could result from offering for sale at one time the Company’s entire holdings of a particular financial instrument. Because no market exists for a portion of the Company’s financial instruments, fair value estimates are based on what management believes to be reasonable judgments regarding expected future cash flows, current economic conditions, risk characteristics of various financial instruments, and other factors. These estimated fair values are subjective in nature and involve uncertainties and matters of significant judgment and therefore cannot be determined with precision. Changes in assumptions could significantly affect the estimates. Since the fair values have been estimated as of December 31, 2023, the amounts that will actually be realized or paid at settlement or maturity of the instruments could be significantly different.
NOTE 16. INCOME TAXES
The following table presents the components of income tax expense for the years indicated:
| Year Ended December 31, | |||||||||||||||||
| 2023 | 2022 | 2021 | |||||||||||||||
| (In thousands) | |||||||||||||||||
| Current Tax Expense: | |||||||||||||||||
| Federal | $ | $ | $ | ||||||||||||||
| State | |||||||||||||||||
| Total current tax expense | |||||||||||||||||
| Deferred Tax (Benefit) Expense: | |||||||||||||||||
| Federal | ( | ||||||||||||||||
| State | ( | ( | |||||||||||||||
| Total deferred tax (benefit) expense | ( | ||||||||||||||||
| Total income tax (benefit) expense | $ | ( | $ | $ | |||||||||||||
186
BANC OF CALIFORNIA, INC. AND SUBSIDIARIES
Notes to Consolidated Financial Statements
The following table presents a reconciliation of the recorded income tax expense to the amount of taxes computed by applying the applicable federal statutory income tax rates of 21
| Year Ended December 31, | |||||||||||||||||
| 2023 | 2022 | 2021 | |||||||||||||||
| (In thousands) | |||||||||||||||||
| Computed expected income tax (benefit) expense at federal statutory rate | $ | ( | $ | $ | |||||||||||||
| State tax (benefit) expense, net of federal tax benefit | ( | ||||||||||||||||
| Goodwill impairment | |||||||||||||||||
| Tax‑exempt interest benefit | ( | ( | ( | ||||||||||||||
| Increase in cash surrender value of life insurance | ( | ( | ( | ||||||||||||||
| Low income housing tax credits, net of amortization | ( | ( | ( | ||||||||||||||
| Nondeductible employee compensation | |||||||||||||||||
| Nondeductible acquisition‑related expense | |||||||||||||||||
| Nondeductible FDIC premiums | |||||||||||||||||
| Change in unrecognized tax benefits | ( | ( | |||||||||||||||
| Valuation allowance change | ( | ( | |||||||||||||||
| Disallowed interest | |||||||||||||||||
| Equity compensation shortfall (windfall) | ( | ( | |||||||||||||||
| State rate and apportionment changes | ( | ||||||||||||||||
| Other, net | ( | ||||||||||||||||
| Recorded income tax (benefit) expense | $ | ( | $ | $ | |||||||||||||
The Company recognized $42.7 million, $34.4 million, and $33.6 million of tax credits and other tax benefits associated with its investments in LIHTC partnerships for the years ended December 31, 2023, 2022, and 2021. The amount of amortization of such investments reported in income tax expense under the proportional amortization method of accounting was $34.1 million for 2023, $28.0 million for 2022, and $27.1 million for 2021.
As of December 31, 2023, for federal tax purposes, the Company had $75.7 million of LIHTC and solar tax credit carryforwards available to apply against future tax liability, expiring from 2042 to 2043. The Company had $6.0 million state LIHTC carryforwards, which can be carried forward indefinitely.
At December 31, 2023, we had $908.1 million of federal net operating loss carryforwards, almost all of which can be carried forward indefinitely, and approximately $1.29 billion of state net operating loss carryforwards available to be applied against future taxable income. A majority of the state net operating loss carryforwards will expire in varying amounts from 2024 through 2043. A portion of the state net operating loss carryforwards generated after December 31, 2017 can be carried forward indefinitely due to the state conformity to the federal net operating loss carryforward provisions as modified by the Tax Cuts and Jobs Act.
187
BANC OF CALIFORNIA, INC. AND SUBSIDIARIES
Notes to Consolidated Financial Statements
The following table presents the tax effects of temporary differences that give rise to significant portions of deferred tax assets and deferred tax liabilities as of the dates indicated:
| December 31, | |||||||||||
| 2023 | 2022 | ||||||||||
| (In thousands) | |||||||||||
| Deferred Tax Assets: | |||||||||||
| Book allowance for loan losses in excess of tax specific charge-offs | $ | $ | |||||||||
| Fair value mark on acquired loans | |||||||||||
| Interest on nonaccrual loans | |||||||||||
| Deferred compensation | |||||||||||
| Foreclosed assets valuation allowance | |||||||||||
| State tax benefit | |||||||||||
| Net operating losses | |||||||||||
| Accrued liabilities | |||||||||||
| Unrealized loss from FDIC‑assisted acquisitions | |||||||||||
| Unrealized loss on securities available-for-sale | |||||||||||
| Unrealized loss on securities held-to-maturity | |||||||||||
| Equity investments | |||||||||||
| Goodwill | |||||||||||
| Tax credits | |||||||||||
| Lease liability | |||||||||||
| FDIC indemnification asset | |||||||||||
| Core deposit and customer relationship intangibles | |||||||||||
| Other | |||||||||||
| Gross deferred tax assets | |||||||||||
| Valuation allowance | ( | ( | |||||||||
| Deferred tax assets, net of valuation allowance | |||||||||||
| Deferred Tax Liabilities: | |||||||||||
| Core deposit and customer relationship intangibles | |||||||||||
| Deferred loan fees and costs | |||||||||||
| Unrealized gain on credit-linked notes | |||||||||||
| Premises and equipment, principally due to differences in depreciation | |||||||||||
| FHLB stock | |||||||||||
| Tax mark-to-market on loans | |||||||||||
| Subordinated debt | |||||||||||
| Equity investments | |||||||||||
| Goodwill | |||||||||||
| Operating leases | |||||||||||
| ROU assets | |||||||||||
| Gross deferred tax liabilities | |||||||||||
| Total net deferred tax assets | $ | $ | |||||||||
188
BANC OF CALIFORNIA, INC. AND SUBSIDIARIES
Notes to Consolidated Financial Statements
Based upon our taxpaying history and estimates of taxable income over the years in which the items giving rise to the deferred tax assets are deductible, management believes it is more likely than not the Company will realize the benefits of these deferred tax assets. The Company's net deferred tax assets increased at December 31, 2023, compared to December 31, 2022 primarily due to goodwill impairment, net operating losses generated in 2023, and deferred tax assets recorded as a result of the Merger transaction.
The Company had net income taxes receivable of $34.5 million and $90.2 million at December 31, 2023 and December 31, 2022.
As of December 31, 2023 and 2022, the Company had a valuation allowance of $21.1 million and $26.7 million against DTAs. Periodic reviews of the carrying amount of DTAs are made to determine if a valuation allowance is necessary. A valuation allowance is required, based on available evidence, when it is more likely than not that all or a portion of a DTA will not be realized due to the inability to generate sufficient taxable income in the period and/or of the character necessary to utilize the benefit of the DTA. All available evidence, both positive and negative, that may affect the realizability of the DTA is identified and considered in determining the appropriate amount of the valuation allowance. It is more likely than not that these deferred tax assets subject to a valuation allowance will not be realized primarily due to their character and/or the expiration of the carryforward periods.
The net decrease of $5.6 million in the total valuation allowance during the year ended December 31, 2023 was primarily related to adjustments to the DTA for amounts that were fully reserved.
The following table summarizes the activity related to the Company's unrecognized tax benefits for the years indicated:
| Year Ended December 31, | |||||||||||
| Unrecognized Tax Benefits | 2023 | 2022 | |||||||||
| (In thousands) | |||||||||||
| Balance, beginning of year | $ | $ | |||||||||
| Increase based on tax positions related to prior years | |||||||||||
| Reductions for tax positions related to prior years | ( | ||||||||||
| Reductions for tax positions as a result of a lapse of the applicable statute of limitations | ( | ||||||||||
| Balance, end of year | $ | $ | |||||||||
| Unrecognized tax benefits that would affect the effective tax rate if recognized | $ | $ | |||||||||
Our gross unrecognized tax benefits are not expected to decrease within the next 12 months.
We recognize interest and penalties related to unrecognized tax benefits as a component of income tax expense. For the year ended December 31, 2023, we increased our accrual for interest expense and penalties, and recognized tax expense of $0.3 million. For the years ended December 31, 2022 and 2021, we reduced our accrual for interest expense and penalties, and recognized tax benefits of $0.7 million for 2022 and $0.2 million for 2021. We had $0.6 million and $0.3 million accrued for the payment of interest and penalties as of December 31, 2023 and 2022.
We file federal and state income tax returns with the Internal Revenue Service (“IRS”) and various state and local jurisdictions and generally remain subject to examinations by these tax jurisdictions for tax years 2019 through 2022. We are currently under examination by certain state jurisdictions for tax years 2014 through 2020.
189
BANC OF CALIFORNIA, INC. AND SUBSIDIARIES
Notes to Consolidated Financial Statements
NOTE 17. EARNINGS (LOSS) PER SHARE
The following table presents the computation of basic and diluted net earnings (loss) per share for the years indicated:
| Year Ended | |||||||||||||||||||||||||||||||||||
| December 31, | |||||||||||||||||||||||||||||||||||
| Year Ended December 31, 2023 | 2022 | 2021 | |||||||||||||||||||||||||||||||||
| (In thousands, except per share amounts) | |||||||||||||||||||||||||||||||||||
| Non-Voting | |||||||||||||||||||||||||||||||||||
| Class B | Common | ||||||||||||||||||||||||||||||||||
| Voting | Non-Voting | Stock | Total | Total | |||||||||||||||||||||||||||||||
| Common | Common | Equivalents | Total | Common (2) | Common (2) | ||||||||||||||||||||||||||||||
| Basic (Loss) Earnings Per Share: | |||||||||||||||||||||||||||||||||||
| Net (loss) earnings available to common | |||||||||||||||||||||||||||||||||||
| and equivalent stockholders | $ | ( | $ | ( | $ | ( | $ | ( | $ | $ | |||||||||||||||||||||||||
| Less: Earnings allocated to | |||||||||||||||||||||||||||||||||||
| unvested restricted stock (1) | — | — | — | — | ( | ( | |||||||||||||||||||||||||||||
| Net (loss) earnings allocated to common | |||||||||||||||||||||||||||||||||||
| and equivalent shares | $ | ( | $ | ( | $ | ( | $ | ( | $ | $ | |||||||||||||||||||||||||
| Weighted average basic shares | |||||||||||||||||||||||||||||||||||
| and unvested restricted stock | |||||||||||||||||||||||||||||||||||
| outstanding | |||||||||||||||||||||||||||||||||||
| Less: weighted average unvested | |||||||||||||||||||||||||||||||||||
| restricted stock outstanding | ( | ( | ( | ( | |||||||||||||||||||||||||||||||
| Weighted average basic shares | |||||||||||||||||||||||||||||||||||
| outstanding | |||||||||||||||||||||||||||||||||||
| Basic (loss) earnings per share | $ | ( | $ | ( | $ | ( | $ | ( | $ | $ | |||||||||||||||||||||||||
| Diluted (Loss) Earnings Per Share: | |||||||||||||||||||||||||||||||||||
| Net (loss) earnings allocated to common | |||||||||||||||||||||||||||||||||||
| and equivalent shares | $ | ( | $ | ( | $ | ( | $ | ( | $ | $ | |||||||||||||||||||||||||
| Weighted average diluted shares | |||||||||||||||||||||||||||||||||||
| outstanding | |||||||||||||||||||||||||||||||||||
| Diluted (loss) earnings per share | $ | ( | $ | ( | $ | ( | $ | ( | $ | $ | |||||||||||||||||||||||||
______________________________
(1) Represents cash dividends paid to holders of unvested restricted stock, net of forfeitures, plus undistributed earnings amounts available to holders of unvested restricted stock, if any.
(2) Share amounts for 2022 and 2021 have been restated by multiplying historical amounts by the Merger exchange ratio of 0.6569 .
The following table presents the weighted average outstanding restricted shares and warrants that were not included in the computation of diluted (loss) earnings per share because their effect would be anti-dilutive for the years ended December 31, 2023, 2022, and 2021:
| Year Ended December 31, | |||||||||||||||||
| 2023 | 2022 | 2021 | |||||||||||||||
Restricted stock awards and units (1) | |||||||||||||||||
| Warrants | — | — | |||||||||||||||
(1) Share amounts for 2022 and 2021 have been restated by multiplying historical amounts by the Merger exchange ratio of 0.6569 .
190
BANC OF CALIFORNIA, INC. AND SUBSIDIARIES
Notes to Consolidated Financial Statements
NOTE 18. REVENUE FROM CONTRACTS WITH CUSTOMERS
Revenue from contracts with customers is measured based on the consideration specified in the contract with a customer, and excludes amounts collected on behalf of third parties. The Company recognizes revenue from contracts with customers when it satisfies its performance obligations. Such performance obligations are typically satisfied as services are rendered and payment is generally collected at the time services are rendered, or on a monthly, quarterly, or annual basis. The Company had no material unsatisfied performance obligations as of December 31, 2023.
In certain cases, other parties are involved with providing products and services to our customers. If the Company is a principal in the transaction (providing goods or services itself), revenues are reported based on the gross consideration received from the customer and any related expenses are reported gross in noninterest expense. If the Company is an agent in the transaction (arranging for another party to provide goods or services), the Company reports its net fee or commission retained as revenue. Rebates, waivers, and reversals are recorded as a reduction of revenue either when the revenue is recognized by the Company or at the time the rebate, waiver, or reversal is earned by the customer.
The Company has elected the following practical expedients: (1) we do not disclose information about remaining performance obligations that have original expected durations of one year or less; and (2) we do not adjust the consideration from customers for the effects of a significant financing component if at contract inception the period between when the Company transfers the goods or services and when the customer pays for that good or service will be one year or less.
Nature of Goods and Services
Substantially all of the Company's revenue, such as interest income on loans, investment securities, and interest-earning deposits in financial institutions, is specifically out-of-scope of ASC Topic 606. For the revenue that is in-scope, the following is a description of principal activities, separated by the timing of revenue recognition, from which the Company generates its revenue from contracts with customers:
•Revenue earned at a point in time. Examples of revenue earned at a point in time are ATM transaction fees, wire transfer fees, NSF fees, and credit and debit card interchange fees. Revenue is generally derived from transactional information accumulated by our systems and is recognized as revenue immediately as the transactions occur or upon providing the service to complete the customer's transaction. The Company is the principal in each of these contracts with the exception of credit and debit card interchange fees, in which case the Company is acting as the agent and records revenue net of expenses paid to the principal.
•Revenue earned over time. The Company earns certain revenue from contracts with customers monthly. Examples of this type of revenue are deposit account service fees, investment management fees, merchant referral services, MasterCard marketing incentives, and safe deposit box fees. Account service charges, management fees, and referral fees are recognized on a monthly basis while any transaction-based revenue is recorded as the activity occurs. Revenue is primarily based on the number and type of transactions and is generally derived from transactional information accumulated by our systems. Revenue is recorded in the same period as the related transactions occur or services are rendered to the customer.
191
BANC OF CALIFORNIA, INC. AND SUBSIDIARIES
Notes to Consolidated Financial Statements
Disaggregation of Revenue
The following table presents interest income and noninterest income, the components of total revenue, as disclosed in the consolidated statements of earnings (loss) and the related amounts which are from contracts with customers within the scope of ASC Topic 606. As illustrated here, substantially all of our revenue is specifically excluded from the scope of ASC Topic 606.
| Year Ended December 31, | |||||||||||||||||||||||||||||||||||
| 2023 | 2022 | 2021 | |||||||||||||||||||||||||||||||||
| Total | Revenue from | Total | Revenue from | Total | Revenue from | ||||||||||||||||||||||||||||||
| Recorded | Contracts with | Recorded | Contracts with | Recorded | Contracts with | ||||||||||||||||||||||||||||||
| Revenue | Customers | Revenue | Customers | Revenue | Customers | ||||||||||||||||||||||||||||||
| (In thousands) | |||||||||||||||||||||||||||||||||||
| Total Interest Income | $ | $ | $ | $ | $ | $ | |||||||||||||||||||||||||||||
| Noninterest Income: | |||||||||||||||||||||||||||||||||||
| Other commissions and fees | |||||||||||||||||||||||||||||||||||
| Leased equipment income | |||||||||||||||||||||||||||||||||||
| Service charges on deposit accounts | |||||||||||||||||||||||||||||||||||
| (Loss) gain on sale of loans | ( | ||||||||||||||||||||||||||||||||||
| (Loss) gain on sale of securities | ( | ( | |||||||||||||||||||||||||||||||||
| Dividends and (losses) gains on | |||||||||||||||||||||||||||||||||||
| equity investments | ( | ||||||||||||||||||||||||||||||||||
| Warrant (loss) income | ( | ||||||||||||||||||||||||||||||||||
| LOCOM HFS adjustment | ( | ||||||||||||||||||||||||||||||||||
| Other income | |||||||||||||||||||||||||||||||||||
| Total noninterest income | ( | ||||||||||||||||||||||||||||||||||
| Total Revenue | $ | $ | $ | $ | $ | $ | |||||||||||||||||||||||||||||
The following table presents revenue from contracts with customers based on the timing of revenue recognition for the year indicated:
| Year Ended December 31, | |||||||||||||||||
| 2023 | 2022 | 2021 | |||||||||||||||
| (In thousands) | |||||||||||||||||
| Products and services transferred at a point in time | $ | $ | $ | ||||||||||||||
| Products and services transferred over time | |||||||||||||||||
| Total revenue from contracts with customers | $ | $ | $ | ||||||||||||||
Contract Balances
The following table provides information about receivables, contract assets and contract liabilities from contracts with customers as of the dates indicated:
| December 31, | |||||||||||
| 2023 | 2022 | ||||||||||
| (In thousands) | |||||||||||
| Receivables, which are included in "Other assets" | $ | $ | |||||||||
| Contract assets, which are included in "Other assets" | $ | $ | |||||||||
| Contract liabilities, which are included in "Accrued interest payable and other liabilities" | $ | $ | |||||||||
192
BANC OF CALIFORNIA, INC. AND SUBSIDIARIES
Notes to Consolidated Financial Statements
NOTE 19. STOCK-BASED COMPENSATION
At the special meeting of stockholders held on November 22, 2023, the Company's stockholders approved the Amended and Restated Banc of California, Inc. 2018 Stock Incentive Plan (the “Amended and Restated 2018 Plan”). The Company’s Amended and Restated 2018 Plan permits stock-based compensation awards to officers, directors, employees, and consultants and will remain in effect until November 30, 2033. The Amended and Restated 2018 Plan authorizes grants of stock-based compensation instruments to purchase or issue up to 8,789,197 shares. As of December 31, 2023, there were 8,769,328 shares available for grant under the Amended and Restated 2018 Plan. In addition to the Amended and Restated 2018 Plan, in connection with the Merger, the Company assumed the Amended and Restated PacWest Bancorp 2017 Stock Incentive Plan (the "PacWest 2017 Plan") with respect to PacWest's outstanding stock-based awards.
Restricted Stock
Restricted stock amortization totaled $27.4 million, $33.9 million, and $31.4 million for the years ended December 31, 2023, 2022, and 2021. Such amounts are included in compensation expense on the accompanying consolidated statements of earnings (loss) and exclude $1,305,000 , $845,000 , and $859,000 of stock-based compensation expense for the years ended December 31, 2023, 2022, and 2021 related to our directors, which is included in other expense on the accompanying consolidated statements of earnings (loss). The income tax benefit recognized in the consolidated statements of earnings (loss) related to this expense was $3.9 million, $6.6 million, and $6.0 million for the years ended December 31, 2023, 2022, and 2021. The amount of unrecognized compensation expense related to all unvested restricted stock units (“RSUs”), TRSAs and PRSUs as of December 31, 2023 totaled $27.4 million. Such expense is expected to be recognized over a weighted average period of 11 months.
The following table presents a summary of restricted stock transactions during the year ended December 31, 2023:
RSUs | TRSAs | PRSUs | |||||||||||||||||||||||||||||||||
Weighted | Weighted | Weighted | |||||||||||||||||||||||||||||||||
Average | Average | Average | |||||||||||||||||||||||||||||||||
Number | Grant Date | Number | Grant Date | Number | Grant Date | ||||||||||||||||||||||||||||||
of | Fair Value | of | Fair Value | of | Fair Value | ||||||||||||||||||||||||||||||
| Year Ended December 31, 2023 | Units | (Per Unit) | Shares | (Per Share) | Units | (Per Unit) | |||||||||||||||||||||||||||||
| Unvested restricted stock, | |||||||||||||||||||||||||||||||||||
| beginning of year (1) | $ | $ | $ | ||||||||||||||||||||||||||||||||
| Granted | $ | $ | $ | ||||||||||||||||||||||||||||||||
| Vested | $ | $ | $ | ||||||||||||||||||||||||||||||||
| Forfeited | $ | $ | $ | ||||||||||||||||||||||||||||||||
| Unvested restricted stock, | |||||||||||||||||||||||||||||||||||
| end of year | $ | $ | $ | ||||||||||||||||||||||||||||||||
____________________________
(1) For RSUs, the unvested restricted stock beginning of year amounts represent acquired amounts from the Merger.
The table above excludes 119,017 of immediately vested and time-based shares awarded to legacy PacWest directors at a weighted average price of $10.29 .
Time-Based Restricted Stock Awards
At December 31, 2023, there were 501,050 shares of unvested RSUs outstanding pursuant to the Amended and Restated 2018 Plan. At December 31, 2023, there were 861,403 shares of unvested TRSAs outstanding pursuant to the PacWest 2017 Plan. The RSUs and TRSAs generally vest over a service period of or four years from the date of the grant or immediately upon death of an employee. Compensation expense related to RSUs and TRSAs is based on the fair value of the underlying stock on the award date and is recognized over the vesting period using the straight‑line method. TRSAs were assumed by the Company in connection with the Merger and continue to vest in accordance with the original vesting schedule of the awards.
193
BANC OF CALIFORNIA, INC. AND SUBSIDIARIES
Notes to Consolidated Financial Statements
TRSA grants are subject to “double-trigger” vesting in the event of a change in control of the Company, as defined in the PacWest 2017 Plan, and in the event an employee's employment is terminated within 24 months after the change in control by the Company without Cause or by the employee for Good Reason, as defined in the PacWest 2017 Stock Plan, such awards will vest.
The weighted average grant date fair value per share of TRSAs granted during 2023, 2022, and 2021 were $41.49 , $48.15 , and $57.32 . The vesting date fair value of TRSAs that vested during 2023, 2022, and 2021 was $14.0 million, $26.4 million, and $26.7 million.
Performance-Based Restricted Stock Units
At December 31, 2023, there were no units of PRSUs that have been granted. PRSUs granted by legacy PacWest Bancorp were automatically cancelled pursuant to the terms of the Merger Agreement as actual performance as of the latest practicable date prior to closing of the Merger was deemed to be below threshold levels. Compensation expense related to PRSUs is based on the fair value of the underlying stock on the award date and is amortized over the vesting period using the straight-line method unless it is determined that: (1) attainment of the financial metrics is less than probable, in which case a portion of the amortization is suspended, or (2) attainment of the financial metrics is improbable, in which case a portion of the previously recognized amortization is reversed and also suspended. Annual PRSU expense may vary during the performance period based upon changes in management's estimate of the number of shares that may ultimately vest. In the case where the performance target for the PRSU’s is based on a market condition (such as total shareholder return), the amortization is neither reversed nor suspended if it is subsequently determined that the attainment of the performance target is less than probable or improbable and the employee continues to meet the service requirement of the award.
NOTE 20. BENEFIT PLANS
401(k) Plans
The Company sponsors a defined contribution plan whereby all employees may participate. After closing of the Merger, effective at midnight December 31, 2023, the PacWest Bancorp 401(k) plan was merged into the Banc of California, Inc. 401(k) plan, so as to constitute a single plan as of January 1, 2024. Employees may contribute up to 100% of their annual compensation, subject to certain limits imposed by the Internal Revenue Code. Employer contributions are determined annually by the Board of Directors in accordance with plan requirements and applicable tax code. Plan participants are immediately vested in matching contributions received from the Company. The Company matches 100% of the first 4 4 7.7 million, $8.1 million and $5.7 million for the years ended December 31, 2023, 2022, and 2021.
194
BANC OF CALIFORNIA, INC. AND SUBSIDIARIES
Notes to Consolidated Financial Statements
NOTE 21. STOCKHOLDERS' EQUITY
Stockholders' equity was $3.4 billion at December 31, 2023, a decrease of $559.8 million compared to December 31, 2022. The decrease was primarily due to a net loss of $1.9 billion in 2023, partially offset by an increase of $1.0 billion from the issuance of stock in the Merger and the concurrent $400 million capital raise and a decrease in negative AOCI of $358.8 million. The components of stockholders' equity changed considerably during 2023 primarily due to new shares and new classes of stock issued in conjunction with the Merger. At December 31, 2022, our stockholders' equity consisted of approximately 79 million shares of issued common stock and 513,250
In conjunction with the Merger, each outstanding share of PacWest Bancorp 7.75 % Fixed Rate Reset Non-Cumulative Perpetual Preferred Stock, Series A, was converted into the right to receive one share of a newly created series of BANC 7.75 % Fixed Rate Reset Non-Cumulative Perpetual Preferred Stock, Series F (“Series F Preferred Stock”). The Series F Preferred Stock is listed on the NYSE under the symbol “BANC/PF.” The Series F Preferred Stock ranks senior to our common stock and common stock equivalents in the payment of dividends and in the distribution of assets on any liquidation, dissolution or winding up of the Company. There are 50,000,000 total preferred shares authorized, of which 27,000,000 were authorized for the non-voting common stock equivalents (“NVCE”) and 513,250
Our voting common stock is listed on the NYSE under the symbol “BANC” and there were 446,863,844 shares authorized and 156,790,349 shares outstanding at December 31, 2023.
Our Class B non-voting common stock is not listed or traded on any national securities exchange or automated quotation system, and there currently is no established trading market for such stock. There were 3,136,156 shares authorized and 477,321 shares outstanding at December 31, 2023.
In conjunction with the Merger, the Company issued a new class of NVCE from authorized preferred stock, which were issued under the Investment Agreements. Our NVCE stock is not listed or traded on any national securities exchange or automated quotation system, and there currently is no established trading market for such stock. The NVCE do not have voting rights and rank equally with, and have identical rights, preferences and privileges as the voting common stock with respect to dividends or distributions (including regular quarterly dividends) declared by the Board and rights upon any liquidation, dissolution, winding up or similar proceeding of the Company. There were 27,000,000 shares authorized and 10,829,990 shares outstanding at December 31, 2023.
In conjunction with the Merger and per the terms of the Investment Agreements, the Warburg Investors received warrants to purchase 15,853,659 shares of NVCE stock, and the Centerbridge Investor received warrants to purchase 3,040,780 shares of voting common stock (the “Centerbridge Warrants”), each with an initial exercise price of $15.375 per share, subject to customary anti-dilution adjustments provided for under the warrant agreements. The warrants carry a term of seven years but are subject to mandatory exercise when the market price of the voting common stock reaches or exceeds $24.60 for 20 or more trading days during any 30-consecutive trading day period. These warrants are being accounted for as equity. The exercise price of the Centerbridge Warrants will be adjusted downward, per the terms of the agreement, for cash distributions to stockholders of the Company's voting common stock, including the Company's quarterly cash dividend.
Common Stock Repurchased
The Company's common stock repurchased consisted of shares surrendered to the Company resulting from the statutory payroll tax obligations arising from the vesting of stock awards. The following table shows the dollar amount of shares surrendered, shares surrendered, and weighted average price per share for stock surrendered for the years indicated:
| Year Ended December 31, | |||||||||||||||||
| Restricted Stock Surrendered | 2023 | 2022 | 2021 | ||||||||||||||
Dollar amount of shares surrendered (in thousands) | $ | $ | $ | ||||||||||||||
| Number of shares surrendered | |||||||||||||||||
| Weighted average price per share | $ | $ | $ | ||||||||||||||
195
BANC OF CALIFORNIA, INC. AND SUBSIDIARIES
Notes to Consolidated Financial Statements
Stock Repurchase Program
The Stock Repurchase Program was initially authorized by the Banc of California, Inc. Board of Directors on February 9, 2023 to purchase shares of its common stock for an aggregate purchase price not to exceed $35 million. There were no shares repurchased by the combined company in December 2023. The repurchase authorization expired on February 9, 2024.
Preferred Stock Issuance
On June 6, 2022, PacWest Bancorp issued and sold 20,530,000 depositary shares (the “Depositary Shares”), each representing a 1/40th ownership interest in a share of the Company’s 7.75 % fixed rate reset non-cumulative, non-convertible, perpetual preferred stock, Series A, par value $0.01 1,000 per share of Series A preferred stock (equivalent to $25.00 per Depositary Share). The gross proceeds were $513.3 million while net proceeds from the issuance of the Series A preferred stock, after deducting $14.7 million of offering costs including the underwriting discount and other expenses, were $498.5 million. In conjunction with the Merger, each share of Series A preferred stock was exchanged for a new share of Banc of California, Inc. 7.75% fixed rate reset non-cumulative, non-convertible, perpetual preferred stock, Series F, par value $0.01 per share (the “Series F preferred stock”). The Series F preferred stock qualifies as Tier 1 capital for purposes of regulatory capital calculations.
Holders of the Depositary Shares will be entitled to all proportional rights and preferences of the Series F preferred stock (including dividend, voting, redemption, and liquidation rights).
Dividends on the Series F preferred stock are not cumulative or mandatory. If the Company’s Board of Directors does not declare a dividend on the Series F preferred stock in respect of a dividend period, then no dividend shall be deemed to be payable for such dividend period or be cumulative, and the Company will have no obligation to pay any dividend for that dividend period, whether or not the Board of Directors declares a dividend on the Series F preferred stock or any other class or series of its capital stock for any future dividend period. Additionally, so long as any share of Series F preferred stock remains outstanding, unless dividends on all outstanding shares of Series F preferred stock for the most recently completed dividend period have been paid in full or declared and a sum sufficient for the payment thereof has been set aside for payment, no dividend shall be declared or paid or set aside for payment and no distribution shall be declared or made or set aside for payment on the Company’s common stock.
The Series F preferred stock is perpetual and has no maturity date. The Series F preferred stock is not subject to any mandatory redemption, sinking fund, or other similar provisions. The Company, at its option and subject to prior regulatory approval, may redeem the Series F preferred stock (i) in whole or in part, from time to time, on any dividend payment date on or after September 1, 2027 or (ii) in whole but not in part at any time within 90 days following a regulatory capital treatment event, in each case, at a redemption price equal to $1,000 per share of Series F preferred stock (equivalent to $25 per Depositary Share), plus any declared and unpaid dividends, without regard to any undeclared dividends, to but excluding the redemption date. Neither the holders of the Series F preferred stock nor holders of the Depositary Shares have the right to require the redemption or repurchase of the Series F preferred stock.
196
BANC OF CALIFORNIA, INC. AND SUBSIDIARIES
Notes to Consolidated Financial Statements
NOTE 22. DIVIDEND AVAILABILITY AND REGULATORY MATTERS
Holders of Company common stock may receive dividends declared by the Board out of funds legally available under Maryland General Corporation Law (“MGCL”) and certain federal laws and regulations governing the banking and financial services business. Our ability to pay dividends to our stockholders is subject to the restrictions set forth in MGCL and certain covenants contained in our subordinated debt and borrowing agreements. In addition, federal bank regulators are authorized to determine under certain circumstances relating to the financial condition of a bank holding company that the payment of dividends would be an unsafe or unsound practice and to prohibit payment thereof. Under the FRB’s policy statement on the payment of cash dividends, a bank holding company generally should not pay dividends if its net income for the past year is not sufficient to cover both the cash dividends and a rate of earnings retention that is consistent with the company’s capital needs, asset quality, and overall financial condition. FRB policy also provides that a bank holding company should inform the FRB reasonably in advance of declaring or paying a dividend that exceeds earnings for the period for which the dividend is being paid or that could result in a material adverse change to the bank holding company’s capital structure.
The regulatory framework also imposes various restrictions on the ability of the Bank to make capital distributions, which include dividends, stock redemptions or repurchases, and certain other items. For example, taking into account the financial condition of the Bank and other factors, the DFPI may object and therefore prevent the Bank from paying dividends to the Company. Generally, the Bank may declare a dividend without the approval of the DFPI as long as the total dividends declared in a calendar year do not exceed either the retained earnings of the Bank or the total of net earnings of the Bank for three previous fiscal years less any dividend paid during such period. Because substantially all of our business activities, income and cash flow are expected to be generated by the Bank, an inability of the Bank to pay dividends or distribute capital to the Company would adversely affect the Company’s liquidity. Dividends can also be restricted if the capital conservation buffer requirement is not met. In general, the Bank may declare a dividend without the approval of the FRB as long as the total of all dividends declared by the Bank during the calendar year, including the proposed dividend, does not exceed the sum of the Bank’s net income during the current calendar year and the retained net income of the prior two calendar years. The Bank had a cumulative net loss of $0.8 billion during the three fiscal years of 2023, 2022, and 2021, compared to dividends of $357.0 million paid by the Bank during that same period. During 2023, Banc of California, Inc. received $46.0 million in dividends from the Bank. Since the Bank had an accumulated deficit of $3.1 billion at December 31, 2023, for the foreseeable future, dividends from the Bank to Banc of California, Inc. will require DFPI and FRB approval.
Banc of California, Inc., as a bank holding company, is subject to regulation by the FRB under the BHCA. The Federal Deposit Insurance Improvement Act required that the federal regulatory agencies adopt regulations defining capital tiers for banks: well capitalized, adequately capitalized, undercapitalized, significantly undercapitalized and critically undercapitalized. Failure to meet minimum capital requirements can initiate certain mandatory and possibly additional discretionary actions by regulators that, if undertaken, could have a direct material effect on the Company’s consolidated financial statements. Under capital adequacy guidelines and the regulatory framework for prompt corrective action, the Company and the Bank must meet specific capital guidelines that involve quantitative measures of the Company’s and the Bank’s assets, liabilities and certain off‑balance sheet items as calculated under regulatory accounting practices. The capital amounts and classification are also subject to qualitative judgments by the regulators about components, risk weightings and other factors.
Quantitative measures established by regulation to ensure capital adequacy require the Company and the Bank to maintain minimum amounts and ratios of common equity Tier 1, Tier 1, and total capital to risk‑weighted assets (“total capital ratio”), and of Tier I capital to average assets, adjusted for goodwill and other non-qualifying intangible assets and other assets (“leverage ratio”). Common equity Tier 1 capital includes common stockholders’ equity less goodwill and certain other deductions (including a portion of servicing assets and the after‑tax unrealized net gains and losses on securities available‑for‑sale). Tier 1 capital includes common equity Tier 1 plus additional Tier 1 capital instruments meeting certain requirements. Total capital includes Tier 1 capital and other items such as subordinated debt and the allowance for credit losses. All three measures are stated as a percentage of risk‑weighted assets, which are measured based on their perceived credit risk and include certain off‑balance sheet exposures, such as unfunded loan commitments and letters of credit.
197
BANC OF CALIFORNIA, INC. AND SUBSIDIARIES
Notes to Consolidated Financial Statements
Banks considered to be “adequately capitalized” are required to maintain a minimum total capital ratio of 8.0 %, a minimum Tier 1 capital ratio of 6.0 %, a minimum common equity Tier 1 capital ratio of 4.5 %, and a minimum leverage ratio of 4.0 %. Banks considered to be “well capitalized” must maintain a minimum total capital ratio of 10.0 %, a minimum Tier 1 capital ratio of 8.0 %, a minimum common equity Tier 1 capital ratio of 6.5 %, and a minimum leverage ratio of 5.0 %. As of December 31, 2023, the most recent notification date to the regulatory agencies, the Company and the Bank are each “well capitalized” under the regulatory framework for prompt corrective action. There are no conditions or events since that notification that management believes have changed the Company’s or any of the Bank’s categories.
Management believes, as of December 31, 2023, that the Company and the Bank met all capital adequacy requirements to which we are subject.
Basel III, the comprehensive regulatory capital rules for U.S. banking organizations, requires all banking organizations to maintain a capital conservation buffer above the minimum risk-based capital requirements in order to avoid certain limitations on capital distributions, stock repurchases and discretionary bonus payments to executive officers. The capital conservation buffer is exclusively comprised of common equity Tier 1 capital, and it applies to each of the three risk-based capital ratios but not to the leverage ratio. Effective January 1, 2019, the capital conservation buffer is fully phased-in at 2.5%, such that the common equity Tier 1, Tier 1 and total capital ratio minimums inclusive of the capital conservation buffers were 7 %, 8.5 %, and 10.5 %. At December 31, 2023, the Company and Bank were in compliance with the capital conservation buffer requirements.
The Company and Bank elected the CECL five-year regulatory transition guidance for calculating regulatory capital ratios and the December 31, 2023 ratios include this election. This guidance allows an entity to add back to capital 100% of the capital impact from the day one CECL transition adjustment and 25% of subsequent increases to the allowance for credit losses through December 31, 2021. This cumulative amount is now being phased out of regulatory capital evenly over the three years from 2022 to 2024.
The following tables present actual capital amounts and ratios for the Company and the Bank as of the dates indicated:
Well Capitalized | Capital | ||||||||||||||||||||||||||||
Minimum | Conservation | ||||||||||||||||||||||||||||
| Actual | Requirement | Buffer | |||||||||||||||||||||||||||
| Balance | Ratio | Balance | Ratio | Requirement | |||||||||||||||||||||||||
| (Dollars in thousands) | |||||||||||||||||||||||||||||
| December 31, 2023 | |||||||||||||||||||||||||||||
| Tier I leverage capital (to average assets): | |||||||||||||||||||||||||||||
| Banc of California, Inc. | $ | $ | N/A | ||||||||||||||||||||||||||
| Banc of California | $ | $ | N/A | ||||||||||||||||||||||||||
| CET1 capital (to risk-weighted assets): | |||||||||||||||||||||||||||||
| Banc of California, Inc. | $ | $ | |||||||||||||||||||||||||||
| Banc of California | $ | $ | |||||||||||||||||||||||||||
| Tier I capital (to risk-weighted assets) | |||||||||||||||||||||||||||||
| Banc of California, Inc. | $ | $ | |||||||||||||||||||||||||||
| Banc of California | $ | $ | |||||||||||||||||||||||||||
| Total capital (to risk-weighted assets): | |||||||||||||||||||||||||||||
| Banc of California, Inc. | $ | $ | |||||||||||||||||||||||||||
| Banc of California | $ | $ | |||||||||||||||||||||||||||
198
BANC OF CALIFORNIA, INC. AND SUBSIDIARIES
Notes to Consolidated Financial Statements
Well Capitalized | Capital | ||||||||||||||||||||||||||||
Minimum | Conservation | ||||||||||||||||||||||||||||
| Actual | Requirement | Buffer | |||||||||||||||||||||||||||
| Balance | Ratio | Balance | Ratio | Requirement | |||||||||||||||||||||||||
| (Dollars in thousands) | |||||||||||||||||||||||||||||
| December 31, 2022 | |||||||||||||||||||||||||||||
| Tier I leverage capital (to average assets): | |||||||||||||||||||||||||||||
| Banc of California, Inc. | $ | $ | N/A | ||||||||||||||||||||||||||
| Banc of California | $ | $ | N/A | ||||||||||||||||||||||||||
| CET1 capital (to risk-weighted assets): | |||||||||||||||||||||||||||||
| Banc of California, Inc. | $ | $ | |||||||||||||||||||||||||||
| Banc of California | $ | $ | |||||||||||||||||||||||||||
| Tier I capital (to risk-weighted assets) | |||||||||||||||||||||||||||||
| Banc of California, Inc. | $ | $ | |||||||||||||||||||||||||||
| Banc of California | $ | $ | |||||||||||||||||||||||||||
| Total capital (to risk-weighted assets): | |||||||||||||||||||||||||||||
| Banc of California, Inc. | $ | $ | |||||||||||||||||||||||||||
| Banc of California | $ | $ | |||||||||||||||||||||||||||
We issued or assumed through mergers subordinated debt to trusts that were established by us or entities we acquired, which, in turn, issued trust preferred securities. On April 30, 2021, the Bank completed the sale of $400 million aggregate principal amount of 3.25 % Fixed-to-Floating Rate Subordinated Notes due May 1, 2031.
The carrying value of subordinated debt totaled $936.6 million at December 31, 2023. At December 31, 2023, $131.0 million of the trust preferred securities were included in the Company's Tier I capital under the phase-out limitations of Basel III, and $790.8 million was included in Tier II capital.
Interest payments on subordinated debt are considered dividend payments under the FRB regulations and subject to the same notification requirements for declaring and paying dividends on common stock.
199
BANC OF CALIFORNIA, INC. AND SUBSIDIARIES
Notes to Consolidated Financial Statements
NOTE 23. CONDENSED FINANCIAL INFORMATION OF PARENT COMPANY
The following tables present the parent company only condensed balance sheets and the related condensed statements of earnings (loss) and condensed statements of cash flows as of and for the years indicated:
| Parent Company Only | December 31, | ||||||||||
| Condensed Balance Sheets | 2023 | 2022 | |||||||||
| (In thousands) | |||||||||||
| Assets: | |||||||||||
| Cash and cash equivalents | $ | $ | |||||||||
| Investments in subsidiaries | |||||||||||
| Other assets | |||||||||||
| Total assets | $ | $ | |||||||||
| Liabilities: | |||||||||||
| Borrowings | $ | $ | |||||||||
| Subordinated debt | |||||||||||
| Other liabilities | |||||||||||
| Total liabilities | |||||||||||
| Stockholders’ equity | |||||||||||
| Total liabilities and stockholders’ equity | $ | $ | |||||||||
| Parent Company Only | Year Ended December 31, | ||||||||||||||||
| Condensed Statements of (Loss) Earnings | 2023 | 2022 | 2021 | ||||||||||||||
| (In thousands) | |||||||||||||||||
| Miscellaneous income (loss) | $ | $ | ( | $ | |||||||||||||
| Dividends from Bank subsidiary | |||||||||||||||||
| Total income | |||||||||||||||||
| Interest expense | |||||||||||||||||
| Operating expenses | |||||||||||||||||
| Total expenses | |||||||||||||||||
| Earnings before income taxes and equity in undistributed earnings of | |||||||||||||||||
| subsidiaries | |||||||||||||||||
| Income tax benefit (expense) | ( | ||||||||||||||||
| Earnings before equity in undistributed earnings of subsidiaries | |||||||||||||||||
| Equity in undistributed (loss) or earnings | |||||||||||||||||
| of subsidiaries | ( | ||||||||||||||||
| Net (loss) earnings | ( | ||||||||||||||||
| Preferred stock dividends | |||||||||||||||||
| Net (loss) earnings available to | |||||||||||||||||
| common and equivalent stockholders | $ | ( | $ | $ | |||||||||||||
200
BANC OF CALIFORNIA, INC. AND SUBSIDIARIES
Notes to Consolidated Financial Statements
| Parent Company Only | Year Ended December 31, | ||||||||||||||||
| Condensed Statements of Cash Flows | 2023 | 2022 | 2021 | ||||||||||||||
| (In thousands) | |||||||||||||||||
| Cash flows from operating activities: | |||||||||||||||||
| Net (loss) earnings | $ | ( | $ | $ | |||||||||||||
| Adjustments to reconcile net (loss) earnings to net cash | |||||||||||||||||
| (used in) provided by operating activities: | |||||||||||||||||
| Depreciation and amortization | |||||||||||||||||
| Change in other assets | ( | ( | ( | ||||||||||||||
| Change in liabilities | ( | ||||||||||||||||
| Earned stock compensation | |||||||||||||||||
| Distributions (equity in) excess of undistributed earnings | |||||||||||||||||
| or loss of subsidiaries | ( | ( | |||||||||||||||
| Net cash (used in) provided by operating activities | ( | ( | |||||||||||||||
| Cash flows from investing activities: | |||||||||||||||||
| Cash acquired in acquisitions, net of consideration paid | |||||||||||||||||
| Net cash provided by investing activities | |||||||||||||||||
| Cash flows from financing activities: | |||||||||||||||||
| Common stock repurchased and restricted stock surrendered | ( | ( | ( | ||||||||||||||
| Net proceeds from stock issuance | |||||||||||||||||
| Net proceeds from preferred stock offering | |||||||||||||||||
| Shares purchased under the Dividend Reinvestment Plan | |||||||||||||||||
| Preferred stock dividends paid | ( | ( | |||||||||||||||
| Common stock dividends paid | ( | ( | ( | ||||||||||||||
| Net cash provided by (used in) financing activities | ( | ||||||||||||||||
| Net (decrease) increase in cash and cash equivalents | ( | ||||||||||||||||
| Cash and cash equivalents, beginning of year | |||||||||||||||||
| Cash and cash equivalents, end of year | $ | $ | $ | ||||||||||||||
NOTE 24. RELATED PARTY TRANSACTIONS
Certain of our executive officers and directors, and their related interests, are customers of, or have had transactions with, the Bank in the ordinary course of business, including deposits, loans and other financial services-related transactions. From time to time, the Bank may make loans to executive officers and directors, and their related interests, in the ordinary course of businesses and on substantially the same terms and conditions, including interest rates and collateral, as those of comparable transactions with non-insiders prevailing at the time, in accordance with the Bank's underwriting guidelines, and do not involve more than the normal risk of collectability or present other unfavorable features. As of December 31, 2023, no related party loans were categorized as nonaccrual, past due, restructured or potential problem loans.
Transactions with Related Parties
The Company and the Bank have engaged in transaction described below with the Company's current or former directors, executive officers, and beneficial owners of more than five percent of the outstanding shares of the Company's voting common stock and certain persons related to them.
201
BANC OF CALIFORNIA, INC. AND SUBSIDIARIES
Notes to Consolidated Financial Statements
The Company is a party to a services agreement with IntraFi Network LLC (“IntraFi”) whereby IntraFi provides the Bank with certain insured cash sweep services from time to time. Affiliates of funds managed by Warburg Pincus LLC hold a material investment interest in IntraFi. Additionally, one of Warburg Pincus LLC’s principals, Todd Schell, who currently serves as a member of the Board, is a member of the board of directors of IntraFi. Affiliates of funds managed by Warburg Pincus LLC beneficially owned approximately 9.9 % of the Company’s outstanding voting common stock as of December 1, 2023, based on information reported on a Schedule 13D filed with the SEC on December 1, 2023. For the years ended December 31, 2023, 2022 and 2021, the amount paid to IntraFi for certain insured cash sweep services was $9.2 million, $4.7 million, and $5.4 million, respectively.
NOTE 25. SUBSEQUENT EVENTS
Common Stock Dividend
On February 8, 2024, the Company announced that the Board of Directors had declared a quarterly cash dividend of $0.10 per common share. The cash dividend is payable on April 1, 2024, to stockholders of record at the close of business on March 15, 2024.
Preferred Stock Dividend
On February 8, 2024, the Company announced that the Board of Directors had declared a quarterly cash dividend of $0.4845 per Depositary Share. The cash dividend is payable on March 1, 2024 to stockholders of record at the close of business on February 20, 2024.
We have evaluated events that have occurred subsequent to December 31, 2023 and have concluded there are no subsequent events that would require recognition in the accompanying consolidated financial statements.
202
ITEM 9. CHANGES IN AND DISAGREEMENTS WITH ACCOUNTANTS ON ACCOUNTING AND FINANCIAL DISCLOSURE
None.
ITEM 9A. CONTROLS AND PROCEDURES
(a) Evaluation of disclosure controls and procedures. Our Chief Executive Officer and Chief Financial Officer have evaluated our disclosure controls and procedures as of December 31, 2023 and have concluded that these disclosure controls and procedures are effective to ensure that information required to be disclosed by us in the reports that we file or submit under the Securities Exchange Act of 1934 is recorded, processed, summarized and reported within the time periods specified in the SEC’s rules and forms. These disclosure controls and procedures include, without limitation, controls and procedures designed to ensure that information required to be disclosed by us in the reports we file or submit is accumulated and communicated to management, including the Chief Executive Officer and Chief Financial Officer, as appropriate to allow timely decisions regarding required disclosure.
(b) Management’s Report on Internal Control over Financial Reporting. Our management is responsible for establishing and maintaining adequate internal control over financial reporting, as such term is defined in the Securities Exchange Act of 1934 Rules 13a‑15(f). Our management conducted an evaluation of the effectiveness of our internal control over financial reporting based on the framework in Internal Control-Integrated Framework (2013) issued by the Committee of Sponsoring Organizations of the Treadway Commission. Based on this evaluation under the framework in Internal Control-Integrated Framework (2013), our management concluded that our internal control over financial reporting was effective as of December 31, 2023. See "Management's Report on Internal Control Over Financial Reporting" set forth in Part II, Item 8 for additional information regarding management's evaluation.
(c) Report of the Independent Registered Public Accounting Firm. KPMG LLP, an independent registered public accounting firm, has audited the consolidated financial statements included in this Annual Report on Form 10‑K and, as part of their audit, has issued their report, included herein, on the effectiveness of our internal control over financial reporting.
(d) Changes in Internal Control Over Financial Reporting. There were no changes in our internal control over financial reporting that occurred during the fourth quarter of 2023 that have materially affected, or are reasonably likely to materially affect, our internal control over financial reporting.
ITEM 9B. OTHER INFORMATION
None.
ITEM 9C. DISCLOSURE REGARDING FOREIGN JURISDICTIONS THAT PREVENT INSPECTIONS
Not applicable.
203
PART III
ITEM 10. DIRECTORS, EXECUTIVE OFFICERS AND CORPORATE GOVERNANCE
Information required by this Item regarding the Company’s directors and executive officers, and corporate governance, including information with respect to Section 16(a) reporting compliance, will appear in the Proxy Statement we will deliver to our stockholders in connection with our 2024 Annual Meeting of Stockholders. Such information is incorporated herein by reference. Information relating to the registrant’s Code of Business Conduct and Ethics that applies to its employees, including its senior financial officers, is included in Part I of this Annual Report on Form 10‑K under “Available Information.” Such information is incorporated herein by reference.
ITEM 11. EXECUTIVE COMPENSATION
The information required by this Item will appear in the Proxy Statement we will deliver to our stockholders in connection with our 2024 Annual Meeting of Stockholders. Such information is incorporated herein by reference.
ITEM 12. SECURITY OWNERSHIP OF CERTAIN BENEFICIAL OWNERS AND MANAGEMENT AND RELATED STOCKHOLDER MATTERS
The information required by this Item regarding security ownership of certain beneficial owners and management will appear in the Proxy Statement we will deliver to our stockholders in connection with our 2024 Annual Meeting of Stockholders. Such information is incorporated herein by reference. Information relating to securities authorized for issuance under the Company’s equity compensation plans is included in Part II of this Annual Report on Form 10‑K under “Item 5. Market for Registrant’s Common Equity, Related Shareholder Matters and Issuer Purchases of Equity Securities.” Such information is incorporated herein by reference.
ITEM 13. CERTAIN RELATIONSHIPS AND RELATED TRANSACTIONS, AND DIRECTOR INDEPENDENCE
The information required by this Item will appear in the Proxy Statement we will deliver to our stockholders in connection with our 2024 Annual Meeting of Stockholders. Such information is incorporated herein by reference.
ITEM 14. PRINCIPAL ACCOUNTANT FEES AND SERVICES
Our independent registered public accounting firm is KPMG LLP , Irvine, CA , Auditor Firm ID: 185 .
The information required by this Item will appear in the Proxy Statement we will deliver to our stockholders in connection with our 2024 Annual Meeting of Stockholders. Such information is incorporated herein by reference.
204
PART IV
ITEM 15. EXHIBITS AND FINANCIAL STATEMENT SCHEDULES
(a) 1. Financial Statements
The consolidated financial statements of Banc of California, Inc. and its subsidiaries and independent auditors’ report are included in Item 8 under Part II of this Form 10‑K.
2. Financial Statement Schedules
All financial statement schedules have been omitted, as they are either inapplicable or included in the Notes to Consolidated Financial Statements.
3. Exhibits
The following documents are included or incorporated by reference in this Annual Report on Form 10‑K:
| 2.1 | |||||
| 3.1 | |||||
| 3.2 | |||||
| 4.1 | Other long-term borrowing instruments are omitted pursuant to Item 601(b)(4)(iii) of Regulation S-K. The Registrant undertakes to furnish upon request to the Commission a copy of each instrument defining rights of holders of senior and subordinated debt of the Registrant. | ||||
| 4.2 | |||||
| 4.3 | |||||
| 4.4 | |||||
| 4.5 | Warrant, dated as of November 30, 2023, issued by Banc of California, Inc. to certain investment vehicles sponsored, managed or advised by Centerbridge Partners, L.P. and its affiliates (incorporated by reference to Exhibit 4.4 of the Registrant’s Current Report on Form 8-K filed with the SEC on December 1, 2023). | ||||
| 10.1 | |||||
| 10.2 | Investment Agreement, dated as of July 25, 2023, by and between Banc of California, Inc. and certain investment vehicles sponsored, managed or advised by Centerbridge Partners, L.P. and its affiliates (incorporated by reference to Exhibit 10.3 of the Registrant’s Form 8-K filed with the SEC on July 28, 2023). | ||||
205
| 10.3 | Registration Rights Agreement, dated as of November 30, 2023, by and among Banc of California, Inc., affiliates of funds managed by Warburg Pincus LLC, and certain investment vehicles sponsored, managed or advised by Centerbridge Partners, L.P. and its affiliates (incorporated by reference to Exhibit 10.3 of the Registrant’s Form 8-K filed with the SEC on December 1, 2023). | ||||
| 10.4* | |||||
| 10.5* | |||||
| 10.6* | |||||
| 10.7* | |||||
| 10.8* | |||||
| 10.9* | |||||
| 10.10* | |||||
| 10.11* | |||||
| 10.12* | |||||
| 10.13* | |||||
| 10.14* | |||||
| 10.15* | |||||
| 10.16* | |||||
| 10.17* | |||||
| 10.18* | |||||
| 10.19* | |||||
| 10.20* | |||||
| 10.21* | |||||
| 10.22* | |||||
206
| 10.23 | |||||
| 10.24 | |||||
_________________________
* Management contract or compensatory plan or arrangement.
** Pursuant to Item 601(a)(5) of Regulation S-K, certain schedules and similar attachments have been omitted.
The registrant hereby agrees to furnish a copy of any omitted schedule or similar attachment to the SEC upon request.
(b) Exhibits
The exhibits listed in Item 15(a)3 are incorporated by reference or attached hereto.
(c) Excluded Financial Statements
Not Applicable
ITEM 16. FORM 10-K SUMMARY
None
207
SIGNATURES
Pursuant to the requirements of Section 13 or 15(d) of the Securities Exchange Act of 1934, the registrant has duly caused this report to be signed on its behalf by the undersigned, thereunto duly authorized.
| BANC OF CALIFORNIA, INC. | |||||||||||
| Dated: | February 29, 2024 | By: | /s/ JARED M. WOLFF Jared M. Wolff President and Chief Executive Officer (Duly Authorized Representative) | ||||||||
POWERS OF ATTORNEY
KNOW ALL PERSONS BY THESE PRESENTS, that each person whose signature appears below constitutes and appoints Jared Wolff, Joseph Kauder, and Monica Sparks, and each of them severally, his or her true and lawful attorney‑in‑fact with power of substitution and resubstitution to sign in his or her name, place and stead, in any and all capacities, to do any and all things and execute any and all instruments that such attorney may deem necessary or advisable under the Securities Exchange Act of 1934 and any rules, regulations and requirements of the U.S. Securities and Exchange Commission in connection with this Annual Report on Form 10‑K and any and all amendments hereto, as fully for all intents and purposes as he or she might or could do in person, and hereby ratifies and confirms all said attorneys‑in‑fact and agents, each acting alone, and his or her substitute or substitutes, may lawfully do or cause to be done by virtue hereof.
208
Pursuant to the requirements of the Securities Exchange Act of 1934, this report has been signed by the following persons on behalf of the registrant and in the capacities and on the dates indicated.
| Signature | Title | Date | ||||||
/s/ JOHN M. EGGEMEYER, III John M. Eggemeyer, III | Chairman of the Board of Directors | February 29, 2024 | ||||||
/s/ JARED M. WOLFF Jared M. Wolff | Vice Chairman of the Board of Directors, President and Chief Executive Officer (Principal Executive Officer) | February 29, 2024 | ||||||
/s/ JOSEPH KAUDER Joseph Kauder | Executive Vice President, Chief Financial Officer (Principal Financial Officer) | February 29, 2024 | ||||||
/s/ MONICA L. SPARKS Monica L. Sparks | Executive Vice President, Chief Accounting Officer (Principal Accounting Officer) | February 29, 2024 | ||||||
/s/ JAMES A. "CONAN" BARKER James A. "Conan" Barker | Director | February 29, 2024 | ||||||
/s/ PAUL R. BURKE Paul R. Burke | Director | February 29, 2024 | ||||||
/s/ MARY A. CURRAN Mary A. Curran | Director | February 29, 2024 | ||||||
/s/ SHANNON F. EUSEY Shannon F. Eusey | Director | February 29, 2024 | ||||||
/s/ RICHARD J. LASHLEY Richard J. Lashley | Director | February 29, 2024 | ||||||
/s/ SUSAN E. LESTER Susan E. Lester | Director | February 29, 2024 | ||||||
/s/ JOSEPH J. RICE Joseph J. Rice | Director | February 29, 2024 | ||||||
/s/ TODD SCHELL Todd Schell | Director | February 29, 2024 | ||||||
/s/ VANIA E. SCHLOGEL Vania E. Schlogel | Director | February 29, 2024 | ||||||
/s/ANDREW THAU Andrew Thau | Director | February 29, 2024 | ||||||
209